Attached files
| file | filename |
|---|---|
| EX-10.34 - EXHIBIT 10.34 - DST SYSTEMS INC | dstex103412312017.htm |
| EX-32.0 - EXHIBIT 32.0 - DST SYSTEMS INC | dstex32123117.htm |
| EX-31.2 - EXHIBIT 31.2 - DST SYSTEMS INC | dstex312123117.htm |
| EX-31.1 - EXHIBIT 31.1 - DST SYSTEMS INC | dstex311123117.htm |
| EX-23 - EXHIBIT 23 - DST SYSTEMS INC | dstex23123117.htm |
| EX-21 - EXHIBIT 21 - DST SYSTEMS INC | dstex21123117.htm |
| EX-12 - EXHIBIT 12 - DST SYSTEMS INC | dstex12123117.htm |
| EX-10.35 - EXHIBIT 10.35 - DST SYSTEMS INC | dstex103512312017.htm |
| EX-10.22 - EXHIBIT 10.22 - DST SYSTEMS INC | dstex102212312017.htm |
| EX-10.21 - EXHIBIT 10.21 - DST SYSTEMS INC | dstex102112312017.htm |
Use these links to rapidly review the document
United States
Securities and Exchange Commission
Washington, D.C. 20549
FORM 10-K
x ANNUAL REPORT PURSUANT TO SECTION 13 OR 15(d) OF THE SECURITIES EXCHANGE ACT OF 1934
For the fiscal year ended December 31, 2017 | |
or | |
¨ TRANSITION REPORT PURSUANT TO SECTION 13 OR 15(d) OF THE SECURITIES EXCHANGE ACT OF 1934
For the transition period from | to |
Commission file number 1-14036

DST Systems, Inc.
(Exact name of Registrant as specified in its charter)
Delaware (State or other jurisdiction of incorporation or organization) | 43-1581814 (I.R.S. Employer identification no.) | |
333 West 11th Street, Kansas City, Missouri (Address of principal executive offices) | 64105 (Zip code) | |
(816) 435-1000
Registrant’s telephone number, including area code
Securities registered pursuant to Section 12(b) of the Act:
Title of each class | Name of each Exchange on which registered | |
Common Stock, $0.01 Per Share Par Value | New York Stock Exchange | |
Securities registered pursuant to Section 12(g) of the Act: None
Indicate by check mark if the registrant is a well-known seasoned issuer, as defined in Rule 405 of the Securities Act. YES x NO ¨
Indicate by check mark if the registrant is not required to file reports pursuant to Section 13 or Section 15(d) of the Act. YES ¨ NO x
Indicate by check mark whether the registrant: (1) has filed all reports required to be filed by Section 13 or 15(d) of the Securities Exchange Act of 1934 during the preceding 12 months (or for such shorter period that the registrant was required to file such reports), and (2) has been subject to such filing requirements for the past 90 days. YES x NO ¨
Indicate by check mark whether the registrant has submitted electronically and posted on its corporate Web-site, if any, every Interactive Data File required to be submitted and posted pursuant to Rule 405 of Regulation S-T (§232.405 of this chapter) during the preceding 12 months (or for such shorter period that the registrant was required to submit and post such files). YES x NO ¨
Indicate by check mark if disclosure of delinquent filers pursuant to Item 405 of Regulation S-K (§229.405 of this chapter) is not contained herein, and will not be contained, to the best of registrant’s knowledge, in definitive proxy or information statements incorporated by reference in Part III of this Form 10-K or any amendment to this Form 10-K. ¨
Indicate by check mark whether the registrant is a large accelerated filer, an accelerated filer, a non-accelerated filer, a smaller reporting company or an emerging growth company. See definitions of “large accelerated filer,” “accelerated filer,” “smaller reporting company,” and “emerging growth company” in Rule 12b-2 of the Exchange Act.
Large accelerated filer x | Accelerated filer ¨ | Non-accelerated filer ¨ (Do not check if a smaller reporting company) | Smaller reporting company ¨ | Emerging growth company¨ | ||||
If an emerging growth company, indicate by check mark if the registrant has elected not to use the extended transition period for complying with any new or revised financial accounting standards provided pursuant to Section 13(a) of the Exchange Act. ¨
Indicate by check mark whether the registrant is a shell company (as defined in Rule 12b-2 of the Exchange Act). YES ¨ NO x
Aggregate market value of the voting and non-voting stock held by non-affiliates of the Registrant as of June 30, 2017:
Common Stock, $0.01 par value—$3,746,186,932
Number of shares outstanding of the Registrant’s common stock as of January 31, 2018:
Common Stock, $0.01 par value—59,313,526
Documents incorporated by reference: None.
DST Systems, Inc. 2017 Form 10-K Annual Report Table of Contents | ||
The brand, service or product names or marks referred to in this Annual Report are trademarks or services marks, registered or otherwise, of DST Systems, Inc., our consolidated subsidiaries or our joint ventures.
2
PART I
Item 1. Business
DST Systems, Inc. is a global provider of technology-based information processing and servicing solutions. References below to “DST,” “the Company,” “we,” “us” and “our” may refer to DST Systems, Inc. exclusively or to one or more of our consolidated subsidiaries. We provide business solutions through a unique blend of industry knowledge and experience, technological expertise and service excellence to clients in the asset management, brokerage, retirement, healthcare and other markets. The Company was formed in 1969. Through a reorganization in August 1995, we are a corporation organized in the State of Delaware.
NARRATIVE DESCRIPTION OF BUSINESS
DST uses our proprietary software applications to provide sophisticated information processing and servicing solutions through strategically unified data management and business process solutions to clients globally within the asset management, brokerage, retirement, healthcare and other markets. Our wholly-owned data centers provide the secure technology infrastructure necessary to support our solutions.
On January 11, 2018, we entered into an Agreement and Plan of Merger (the “Merger Agreement”) with SS&C Technologies Holdings, Inc. (“SS&C”) and Diamond Merger Sub, Inc., a Delaware corporation and an indirect wholly owned subsidiary of SS&C (“Merger Sub”), pursuant to which, among other things, Merger Sub will merge with and into DST, with DST surviving as a wholly owned subsidiary of SS&C (the “Merger”).
At the effective time of the Merger (the “Effective Time”), each share of common stock, par value $0.01 per share, of DST issued and outstanding immediately prior to the Effective Time (subject to certain exceptions as provided in the Merger Agreement) shall be converted into the right to receive $84.00 in cash, without interest, for a total enterprise value of approximately $5.4 billion, including assumption of debt. The transaction is currently expected to close before the end of the second quarter of 2018 and is subject to the satisfaction of certain customary conditions as set forth in the Merger Agreement; however, there can be no assurances as to the actual closing or the timing of the closing.
In March 2017, we acquired State Street Corporation’s (“State Street”) ownership interest in our joint ventures Boston Financial Data Services, Inc. (“BFDS”) and International Financial Data Services, U.K. (“IFDS U.K.”), as well as other investments and real estate held by International Financial Data Services, L.P. (“IFDS L.P.”). BFDS and IFDS U.K. were consolidated in our financial results from the date control of these entities was obtained.
We sold our North American Customer Communications business on July 1, 2016 and sold our United Kingdom (“U.K.”) Customer Communications business on May 4, 2017. We have classified the results of the Customer Communications businesses sold as discontinued operations in our consolidated financial statements for all periods presented.
Beginning in 2017, DST established a new reportable segment structure that reflects how management is now operating the business and making resource allocations following the acquisitions of the remaining interests in IFDS U.K. and BFDS, as well as the recent reductions in non-core investment assets. The Company’s operating business units are now reported as three operating segments (Domestic Financial Services, International Financial Services and Healthcare Services). Prior periods have been revised to reflect the new reportable operating segments.
For the year ended December 31, 2017, DST’s operating revenues were $2,086.7 million. Segment operating revenues, as a percentage of consolidated operating revenues (excluding intersegment revenues), were 54.2%, 25.8%, and 20.0% contributed from the Domestic Financial Services, International Financial Services, and Healthcare Services segments, respectively.
DOMESTIC FINANCIAL SERVICES SEGMENT
Through the Domestic Financial Services segment, we provide investor, investment, advisor/intermediary and asset distribution services to companies within the United States (“U.S.”) financial services industry. Utilizing our proprietary software applications, we offer our clients information processing solutions to support direct and intermediary sales of mutual funds, alternative investments, securities brokerage accounts and retirement plans. This includes transaction processing; account opening and maintenance; reconciliation of trades, positions and cash; corporate actions; regulatory reporting and compliance functions; and tax reporting. We also support full reporting to investors for confirmations, statements and tax forms, web access, and electronic delivery of documents.
Services are provided either on a remote processing (“Remote”) or business process outsourcing (“BPO”) basis utilizing our proprietary software applications, including our TA 2000® and TRAC® systems. Our BPO service offerings are enhanced by
3
AWD®, our proprietary workflow software, which is also licensed separately to third parties. In the U.S., we provide services to mutual funds, brokerage firms, retirement plans and alternative investment funds (such as real estate investment trusts “REITs”).
Accounts serviced under shareowner recordkeeping arrangements with the mutual fund and alternative investment sponsors are referred to as “registered accounts.” Registered accounts include both tax-advantaged and non tax-advantaged accounts on the books of the transfer agent. We also contract directly with broker/dealers to manage brokerage subaccounts.
Additionally, we deliver a comprehensive suite of asset servicing, distribution solutions and asset management for open-end mutual funds, closed-end funds, exchange-traded funds and alternative investment funds. Focusing on the needs of small- to medium-sized funds that require a broad set of customizable services, we provide compliance, creative services, medallion distribution, fund administration, fund accounting, legal, tax administration, transfer agency and asset management services.
Our distribution services range from consulting to active wholesaling and marketing, including closed-end funds IPO launch platform services. We also offer products designed to assist clients in meeting the expanding needs associated with distributing U.S. investment products through financial intermediaries.
We serve as the asset manager to proprietary open-end mutual funds, closed-end funds and exchange-traded funds through active management and through the utilization of sub-advisors and index providers. Additionally, we offer data analytics and consulting services in the U.S. to help our clients gain actionable insights into the needs and preferences of their customers.
We typically have multi-year agreements with our clients. Domestic Financial Services segment fees are primarily charged to the client based on the number of accounts, participants or transactions processed. For subaccounts, broker/dealers provide a portion of the services directly. As a result, our revenue per account is generally higher for registered accounts than for subaccounts. On a more limited basis, we also generate revenue through asset-based fee arrangements, subscriptions and/or seat licensing and from investment earnings related to cash balances maintained in our full service transfer agency bank accounts.
The Domestic Financial Services segment’s largest client accounted for 10.0% of the segment’s operating revenues in 2017 and the five largest Domestic Financial Services clients collectively accounted for 18.8% of the segment’s operating revenues in 2017.
Sources of new business for the Domestic Financial Services segment include: (i) existing clients, particularly with respect to complementary and new products and services, (ii) companies relying on their own in-house capabilities and not using outside vendors, (iii) companies using competitors’ systems, and (iv) new entrants into the markets we serve. We believe that competition in the markets in which the Domestic Financial Services segment operates is based largely on price, quality of service, features offered, the ability to handle rapidly changing volumes, response to security and compliance needs, product innovation, and responsiveness. Our competitors are primarily financial institutions and in-house systems. Our financial institution competitors may have an advantage because they may take into consideration the value of their clients’ funds on deposit or under management when pricing their services. We believe there is significant competition in our markets and our ability to compete effectively is dependent in part on access to capital.
INTERNATIONAL FINANCIAL SERVICES SEGMENT
We offer investor and policyholder administration and technology services on a Remote and BPO basis in the U.K. and, through our joint venture IFDS L.P., in Canada, Ireland and Luxembourg, utilizing our proprietary FAST platform and IFDS L.P.’s iFAST platform. Additionally, in Australia and the U.K., we provide solutions related to participant accounting and recordkeeping for wealth management, “wrap platforms” and retirement savings (“superannuation”) industries/markets through use of our wealth management platform (Bluedoor) and our life and pension administration system (Percana).
Our primary clients are mutual fund managers, insurers, and platform providers. International Financial Services fees are primarily charged to the client based on the number of accounts or transactions processed. We also realize revenues from fixed-fee license agreements that include provisions for ongoing support and maintenance and for additional license payments in the event that usage or members increase. Additionally, we derive professional service revenues from the fees for implementation services, custom programming and data center operations. We typically have multi-year agreements with our clients.
The International Financial Services segment’s largest client accounted for 24.4% of the segment’s operating revenues in 2017 and the five largest International Financial Services clients collectively accounted for 55.7% of the segment’s operating revenues in 2017.
Sources of new business for International Financial Services segment include: (i) existing clients, particularly with respect to complementary and new products and services, (ii) companies relying on their own in-house capabilities and not using outside vendors, (iii) companies using competitors’ systems, and (iv) new entrants into the markets we serve. We believe that
4
competition in the markets in which the International Financial Services segment operates is based largely on price, quality of service, features offered, the ability to handle rapidly changing volumes, response to security and compliance needs, product innovation, and responsiveness. We believe there is significant competition in our markets and our ability to compete effectively is dependent in part on access to capital.
HEALTHCARE SERVICES SEGMENT
The Healthcare Services segment uses our proprietary software applications to provide healthcare organizations with pharmacy, healthcare administration, and health outcomes optimization solutions to satisfy their information processing, quality of care, cost management and payment integrity needs. Our healthcare solutions include claims adjudication, benefit management, care management, business intelligence and other ancillary services. The Healthcare Services segment’s five largest clients accounted for 48.7% of segment operating revenues in 2017, including 18.6% from its largest client.
Our healthcare services are marketed to health insurance companies, health plans and benefits administrators. Clients primarily consist of managed care organizations, preferred provider organizations, third-party administrators, dental, vision, and behavioral health organizations operating commercial and government sponsored programs such as the Health Insurance Exchanges that operate under the Patient Protection and Affordable Care Act, Medicare Advantage, Medicare Part D and Medicaid.
We compete with other third-party providers and companies that perform their services in-house with licensed or internally developed systems and processes. We believe that we compete effectively in the market due to our ongoing investment in our products and the development of new products to meet the evolving business requirements of our clients.
Our competitors’ healthcare administration and health outcomes optimization solutions are primarily based on complete replacement of a payer’s core system. We believe that a component application approach shifts the focus away from core application replacement to one in which clients have more alternatives for modernization of the business operation. With a component approach, health payer clients can still choose core application replacement if warranted, or adopt component applications that address only those areas of the business that offer the most opportunity of improvement for the client, resulting in protection of the client’s current IT investment and less disruption to its business operation.
Pharmacy Solutions
We use our proprietary software applications, supporting technology and enhanced clinical expertise to provide pharmacy health management solutions supporting commercial, Medicaid and Medicare Part D plans. These services include pharmacy claims administration, pharmacy network solutions, government programs administration, formulary and rebate management, trend control and quality compliance programs, member services, and discount drug card programs. RxNova, our proprietary claims processing system, is a highly scalable and comprehensive system for the administration of pharmacy benefits, prescription claims adjudication, eligibility, pharmacy management, and related activities. This benefit management solution provides substantial flexibility to accommodate varying provider requirements, allows point-of-sale monitoring, and provides control of pharmacy plan benefits with online benefit authorization.
We generally derive revenue from our pharmacy-solutions business on a transactional fee basis. Fees are earned on pharmacy claims processing and payments services, pharmacy and member call center services, formulary and rebate administration, administration or management of clinical programs, pharmacy network management, member and plan web services and management information and reporting. We also receive investment earnings on cash balances maintained in our bank accounts related to funds held to satisfy our client’s pharmacy claim obligations.
Healthcare Administration
We use our proprietary software applications to provide medical claim administration services and health plan compliance and revenue integrity services for payers and providers in the domestic healthcare industry. Healthcare administration services are offered on a software license, Remote and BPO basis. Our solutions, combined with our health outcomes optimization solutions described below, are offered as stand-alone component solutions to complement health plans, existing operations or systems, or as an integrated core administration package of solutions.
Claims administration services include claims processing, benefit plan management, eligibility and enrollment management, provider contract administration, mail receipt and processing, imaging/data capture and retention, fulfillment, utilization management, and customer service. Health plan compliance and revenue integrity services include a retrospective review of medical records to accurately capture members’ health status through proper hierarchical condition categories.
Healthcare administration revenues are generally derived from fees charged on a per member/per month basis or transactional basis. We also realize revenue from fixed-fee license agreements that include provisions for ongoing support and maintenance and for additional license payments in the event that usage or members increase.
5
Health Outcomes Optimization
We provide health outcomes optimization solutions through the use of our integrated care management and population health analytics applications and professional services for health plans and providers in the domestic healthcare industry. Our Integrated Care Management solution is a real-time, intuitive, workflow-driven solution suite that assists clients to improve member outcomes and manage costs. Our population health technology provides organizations with the ability to measure and manage federal and state required quality management initiatives, provider network quality and efficiency, member health programs, and risk adjustment on an integrated system. In addition to our proprietary systems, we are the exclusive distributor of Johns Hopkins’ Adjusted Clinical Groups (“ACG”), a patient classification system developed by Johns Hopkins University. The ACG System is a software tool that provides health plans the ability to easily identify their at-risk population and stratify them into the optimal care management program.
Professional services include business and industry consulting, risk adjustment, compliance and regulatory consulting, behaviorally based interventions, healthcare quality incentive management, medical management (disease, care, and utilization), HEDIS, managed information technology, software engineering, operations process engineering and management consulting.
Health outcomes optimization revenues are generally derived from fees charged based on a per member/per month basis. We also realize revenue from fixed-fee license agreements that include provisions for ongoing support and maintenance and for additional license payments in the event that usage or members increase. Additionally, we derive professional service revenues from fees for implementation services, custom programming and data center operations.
SOFTWARE DEVELOPMENT AND MAINTENANCE
DST’s software development and maintenance efforts are focused on introducing new products and services, as well as enhancing our existing products and services. The software development, maintenance and enhancement costs, including capitalized software development costs, were $243.0 million, $217.3 million and $205.5 million for the years ended December 31, 2017, 2016 and 2015, respectively.
INTELLECTUAL PROPERTY
We hold U.S. patents, U.S. copyrights and trademarks covering various aspects of the information processing and computer software services and products provided by the Domestic Financial Services, International Financial Services and Healthcare Services segments. The duration of the patent term is generally 20 years from its earliest application filing date. The patent term is not renewable. The durations of the copyrights depend on a number of factors, such as who created the work and whether he or she was employed by us at the time. The trademark rights generally will continue for as long as we maintain usage of the trademarks. We believe our copyrights are adequate to protect our original works of authorship. We believe that although the patents, trademarks and copyrights related to the segments are valuable, our success primarily depends upon our product and service quality, marketing and service skills. Despite patent, trademark and copyright protection, we may be vulnerable to competitors who attempt to imitate our systems or processes. In addition, other companies and inventors may receive patents that contain claims applicable to our systems and processes.
EMPLOYEES
We had approximately 14,200 total employees at December 31, 2017, of which approximately 7,500 employees were located in the U.S. and approximately 6,700 employees were located internationally. Additionally, our joint ventures had approximately 1,500 employees in Canada, Ireland, Luxembourg and the U.S. at December 31, 2017. None of our employees are represented by a labor union or covered by a collective bargaining agreement, and we consider our employee relations to be good.
SEGMENT, GEOGRAPHIC AREA AND OTHER FINANCIAL INFORMATION
This discussion of the business of DST Systems, Inc. should be read in conjunction with, and is qualified by reference to, Management’s Discussion and Analysis of Financial Condition and Results of Operations (“MD&A”) under Item 7 herein. In addition, the information set forth under the headings “Forward Looking Statements,” “Introduction” and “Seasonality” in the MD&A and the segment and geographic information included in Item 8, Financial Statements and Supplementary Data - Note 17, “Segment and Geographic Information” are incorporated herein by reference in partial response to this Item 1.
6
AVAILABLE INFORMATION
Our Annual Report on Form 10-K, Quarterly Reports on Form 10-Q, Current Reports on Form 8-K and all amendments to those reports will be made available free of charge on or through our Internet website (www.dstsystems.com) as soon as reasonably practicable after such material is electronically filed with, or furnished to, the Securities and Exchange Commission (“SEC”). In addition, our corporate governance guidelines and the charters of the Audit Committee, the Corporate Governance/Nominating Committee, and Compensation Committee of the DST Board of Directors are available at investors.dstsystems.com/govdocs. These guidelines and charters are available in print to any stockholder who requests them. Written requests may be made to the DST Corporate Secretary, 333 West 11th Street, Kansas City, Missouri 64105, and oral requests may be made by calling the DST Corporate Secretary’s Office at (816) 435-8655. We do not intend for information contained on our website to be part of this Annual Report on Form 10-K. An individual may read and copy any materials we file with the SEC at the SEC’s Public Reference Room at 100 F Street, N.E. Washington, D.C. 20549. The public may obtain information on the operation of the Public Reference Room by calling the SEC at 1-800-SEC-0330. The SEC maintains an internet site (http://www.sec.gov) that contains reports, proxy and information statements, and other information regarding issuers that file electronically with the SEC.
Item 1A. Risk Factors
In addition to the other information set forth in this report, you should carefully consider the following factors, which could materially affect our business, financial condition, results of operations or cash flows in future periods. While we believe we have identified and discussed below the key risk factors affecting our business, there may be additional risks and uncertainties not currently known to us or that we currently deem to be immaterial that may adversely affect our business, financial condition, results of operations, cash flows or share price in the future.
Risks Related to Our Business
Trends or events affecting our clients or their industries could decrease the demand for our products and services and the loss of, reduction of business with, or less favorable terms with any of our significant clients could materially harm our business and results of operations.
We derive our revenues from the delivery of products and services to clients primarily in the mutual fund, brokerage, investment management, other financial service (e.g., insurance, banking and financial planning), healthcare and pharmacy industries. Demand for our products and services among companies in those industries could decline for many reasons. If demand for our products or services decreases or any of the industries we serve decline or fail or consolidate, reducing the number of potential clients, our business and our operating results could be adversely affected.
On a consolidated basis, for the year ended December 31, 2017, our five largest clients accounted for approximately 23.7% of our consolidated operating revenues. For the same period, the Healthcare Services segment’s five largest clients accounted for approximately 48.7% of our revenues in that segment, including 18.6% from its largest clients. Because of our significant client concentration, particularly in the Healthcare Services segment, our revenues could fluctuate significantly due to changes in economic conditions, the use of competitive products, or the loss of, reduction of business with, or less favorable terms with any of our significant clients, and a delay or default in payment by any significant client could materially harm our business and results of operations.
Events that adversely affect our clients’ businesses, rates of growth or numbers of clients they serve could decrease demand for our products and services and the number of transactions we process. Events that could adversely affect our clients’ businesses include decreased demand for our clients’ products and services, adverse conditions in our clients’ markets or adverse economic conditions generally. We may be unsuccessful in predicting the needs of changing industries and whether potential clients will accept our products or services. We also may invest in technology or infrastructure for specific clients and not realize additional revenue from such investments. If trends or events do not occur as we expect, our business could be negatively impacted.
7
We depend on information technology, and any failures of or damage to, attack on or unauthorized access to our information technology systems or those of third parties on which we rely could result in significant costs and reputational damage.
We have developed and maintained, and our businesses depend on, information technology, including elements both internal and external, to record and process a large volume of complex transactions and other data, including personally identifiable information regarding financial and health matters. In certain circumstances, vendors have access to such data in order to assist us with responsibilities, such as producing benefit plan identification cards, maintaining software we license on our own behalf or for resell to others, or helping clients comply with anti-money laundering regulations. Any interruptions, delays, breakdowns, or breach, including as a result of cybersecurity breaches or breaches of our environments and procedures or those of our vendors, could result in significant data losses or theft of our or our clients’ intellectual property, proprietary business information or personally identifiable information. Several health care and financial services firms have been victims of computer systems hacking attacks, resulting in the disruption of services to clients, loss or misappropriation of sensitive or private data, and reputational harm. Rapid advances in technology, and the limits and costs of technology, skills and manpower, may prevent us from anticipating, identifying, preventing or addressing all potential security threats and breaches. A cybersecurity breach involving our systems or those of third parties on which we rely could negatively affect our reputation as a trusted product and service provider by adversely affecting the market’s perception of the security or reliability of our products or services. In addition, a system breach could result in other negative consequences, including remediation costs, disruption of internal operations, increased cybersecurity protection costs, lost revenues, regulatory penalties, and litigation.
The demand for our products and services could decrease if we do not continually address our clients’ technology and capacity requirements.
Our clients use technology-based products and services in the complex and rapidly changing markets in which they operate. Our processes to support the design, set-up, quality assurance, and maintenance activities for the timely implementation of new client services, migration of existing clients onto new or different platforms, and ongoing servicing may not meet the needs of our business and clients. We must substantially invest in technology and systems to meet client requirements for technology and capacity. If we do not meet clients’ technology and capacity requirements in advance of our competitors or if the investments we make are not cost-effective or do not result in successful products or services, our business could be adversely affected.
The success of our information technology transformation initiative will depend on the timing, extent and cost of implementation; performance of third-parties; upgrade requirements; and availability and reliability of the various technologies required to provide such transformation.
We must continually invest in our information technology in order to continually meet our clients’ needs. We are implementing a multi-year information technology transformation initiative intended to reduce operating costs, increase information security, upgrade infrastructure, expand automation, provide access to emerging technologies and position us to take advantage of market opportunities. If we fail to provide an enhanced client experience with this initiative, our ability to retain and attract clients and to maintain and grow revenues could be adversely affected. Using new and sophisticated technology on a very large scale entails risks. For example, deployment of new software may adversely affect the performance of existing services on our existing platforms and decrease the client experience. If implementation of our information technology transformation initiative results in delayed services or costs of the initiative exceed expected amounts, our margins could be adversely affected and such effects could be material. If the delivery of services expected to be deployed on modernized architecture were delayed due to technological constraints, performance of third-party suppliers, or other reasons, the cost of providing such services could become higher than expected, which could result in higher costs to clients, potentially resulting in decisions to purchase services from our competitors, which would adversely affect our revenues, profitability and cash flow from operations.
We have made and may continue to make acquisitions and divestitures that involve numerous risks and uncertainties.
Our business strategy anticipates that we will supplement internal growth by pursuing acquisitions of complementary businesses. We may be unable to identify suitable businesses to acquire. We compete with other potential buyers for the acquisition of other complementary businesses. Information we obtain about an acquisition target may be limited and there can be no assurance that an acquisition will perform as expected or positively impact our financial performance. Potential acquisitions involve risk, including the risk we would be unable to effectively integrate the acquired technologies, operations and personnel into our business, and the risk that management’s attention and our capital would be diverted from other areas of our business. The anticipated benefits of our acquisitions may not materialize. Future acquisitions or dispositions could result in the issuance of capital stock, incurrence or assumption of debt, contingent liabilities or expenses, or write-offs of goodwill and other intangible assets, any of which could harm our financial condition. If we cannot complete acquisitions, our growth may be limited and our financial condition may be adversely affected.
8
In addition, we have divested, and may in the future divest, businesses that are no longer a part of our ongoing strategic plan. These divestitures similarly require a significant investment of time and resources, may disrupt our business, distract management from other responsibilities and may result in continued responsibility for the divested business, including through indemnification, for a period of time following the transaction, which could adversely affect our financial results.
If our new investments and business initiatives are not successful, our financial condition and prospects could be adversely affected.
We have invested, and continue to invest heavily in our technology to improve existing products and services and add new products and services to address the needs of existing or new clients. Our investments may not lead to successful deployment or increases in the number of accounts or transactions. If we are not successful in creating value from our investments by increasing sales or reducing expenses, our financial condition and prospects could be harmed.
An increase in subaccounting services performed by brokerage firms has and will continue to adversely impact our revenues.
We service open-end and closed-end funds registered under the Investment Company Act of 1940, including mutual funds, exchange-traded funds, interval funds and exchange-listed closed-end funds, as well as private funds, collective investment trusts and other accounts under shareowner recordkeeping arrangements which we refer to as registered accounts. These arrangements are distinguished from broker subaccounts, which are serviced under contract with a broker/dealer. Our clients may adopt the broker subaccount structure. We offer subaccounting services to brokerage firms that perform shareowner subaccounting. As the recordkeeping functions in connection with subaccounting are more limited than traditional shareowner accounting, the fees charged are generally lower on a per unit basis. Brokerage firms that obtain agreements from our clients to use a broker subaccount structure cause accounts currently on our traditional recordkeeping system to convert to our subaccounting system, or to the subaccounting systems of other service providers, which generally results in lower revenues. While subaccounting conversions have generally been limited to our non tax-advantaged mutual fund accounts, such conversions have begun to extend to the tax-advantaged accounts (such as retirement and Section 529 accounts) we service, which could adversely affect our business and operating results.
Consolidation in or among our clients and potential clients could result in a reduction of clients or reduction in use of our products or services.
Mergers or acquisitions of or consolidations among our clients or between our clients and other entities could reduce the number of our clients and potential clients and result in the discontinuation or reduction in use of our products or services. This could adversely affect our revenues even if these events do not reduce the aggregate number of clients or the activities of the consolidated entities. Any of these developments could materially and adversely affect our business, financial condition, operating results and cash flows.
Our businesses are subject to substantial competition.
We are subject to intense competition from other established service providers in all industries we serve. Some of our competitors are able to bundle service offerings and offer more appealing pricing structures. Some of our clients, or the clients they serve, may develop, have developed or are developing the in-house capacity to perform the transaction processing and recordkeeping services they have paid us to perform. Additionally, some of our competitors and clients have greater financial and human resources and access to capital than we do.
In the financial and healthcare markets we serve, we compete based on a variety of factors, including investment performance, the range of products or services offered, brand recognition, business reputation, financial strength, stability and continuity of client and other intermediary relationships, quality of service, and level of fees charged for products and services. We continue to face market pressures regarding fee levels in certain products and services offered.
Our failure to successfully compete in any of our material operating businesses could have a material adverse effect on results of operations. Competition could also affect the revenue mix of products or services we provide, resulting in decreased revenues in lines of business with higher profit margins.
9
We may not be able to sustain critical operations and provide essential products and services during system failures or catastrophic events.
Damage to our systems or facilities or those of third parties on which we rely could impact our operations or financial condition. The performance of our services also depends upon facilities that house central computer operations or operating centers, including facilities provided by third parties on which we rely. Significant damage to any of our operating facilities or those of third parties on which we rely could interrupt the operations at those facilities and interfere with our ability to serve clients. Moreover, in the event of a catastrophic event we may not be able to execute our business resumption strategies for data processing and capabilities, and we may not have the ability to recover critical data, programs, applications, and data processing capabilities in a timely manner; any of these could impact our ability to serve our clients. In addition, it is possible that hardware failures or errors or technical deficiencies in our systems or those of third parties on which we rely could similarly result in data loss or corruption. Any failure of our systems or facilities or those of third parties on which we rely could expose us to liability and damages relating to such failure, which could have a material adverse effect on our business and results of operations.
We operate internationally and are thus exposed to currency fluctuations and foreign political, economic and other conditions that could adversely affect our revenues from or support by foreign operations.
Inherent risks in our international business activities could decrease our international sales and also could adversely affect our ability to receive important support from our international operations, which could have a material adverse effect on our overall financial condition, operating results, and cash flow. These risks include potentially unfavorable foreign economic conditions, political conditions or national priorities, foreign government regulation, potential expropriation of assets by foreign governments, changes in intellectual property legal protections and remedies, the failure to bridge cultural differences, and limited or prohibited access to our foreign operations and the support they provide. We may also have difficulty repatriating any profits or be adversely affected by currency fluctuations in our international business.
As a result of the December 2016 referendum in the U.K. to exit the European Union (commonly referred to as “Brexit”), the value of the British pound has fluctuated greatly as compared to the US dollar. The relative strengthening of the dollar relative to the British pound may adversely affect our revenues and operating results. Any withdrawal of the U.K. from the European Union could significantly disrupt the movement of goods, services and people between the U.K. and the European Union; the financial services industry could be particularly sensitive to Brexit and it could result in increased legal and regulatory complexities for our operations. There can be no assurance that these disruptions and regulatory changes would not have a material adverse effect on our business, financial condition, or operating results.
Various events may cause our financial results to fluctuate from quarter-to-quarter or year-to-year. The nature of these events might inhibit our ability to anticipate and act in advance to counter them.
We may be unsuccessful in determining or controlling when and whether events occur that could cause varying financial results. Unfavorable results may occur that we did not anticipate or take advance action to address. We incur significant costs to develop products and services used to service our existing and potential client operations. The timing of these expenses may fluctuate as new client contracts are signed or existing client contracts are renewed or terminated, causing our results to vary accordingly. Factors contributing to the variability of our results include increased costs of supplies, increased costs relating to existing and potential client operations, and hiring staff to develop new and existing products. The timing of our fees associated with new and existing client contracts, including changes in recognition as a result of changes in accounting principles, may also cause results to vary from period to period.
Our revenues may decrease due to declines in the levels of participation and activity in the securities markets.
We generate significant revenues from the transaction processing fees we earn for our products and services. These revenue sources are substantially dependent on the levels of participation and activity in the securities markets. The number of unique securities positions held by investors through our clients and our clients’ customer trading volumes reflect the levels of participation and activity in the markets, which are impacted by market prices and the liquidity of the securities markets, among other factors. We could continue to be negatively impacted by the volatile markets as certain of our fees are tied to the asset bases of our clients. The occurrence of significant market volatility or decreased levels of participation would likely result in reduced revenues and decreased profitability from our business operations. Additionally, we may be exposed to operational or other risks in connection with any systematic failures in the markets, or the default due to market-related failures of one or more counterparties with whom we transact.
We also derive significant revenues from asset management, administration and distribution contracts with clients. Under these contracts, the fees paid to us are based on a variety of factors, including the market value of assets under management (“AUM”), assets under administration (“AUA”) and number of transactions processed. AUM, AUA or the number of transactions processed may decline for various reasons, causing results to vary. Factors that could decrease AUM and AUA
10
(and therefore revenues) include declines in the market value of the assets in the funds (and accounts as applicable) managed, administered and distributed, redemptions and other withdrawals from, or shifts among, the funds (and accounts as applicable) managed, administered and distributed, as well as market conditions generally.
Our revenues may decrease due to changes in asset management, administration and distribution fees and industry trends.
The asset management, administration and distribution business is highly competitive and we compete for investors and clients on the basis of factors such as performance, reputation, service, and cost. Underperformance of any of our proprietary and client products and services, damage to our reputation, or service-related issues could lead to redemptions or terminations. Additionally, the asset management industry has generally been subject to fee compression and asset flows to lower cost products or services. Such a trend may result in fee compression in asset management, administration and distribution related contracts. The asset management, administration and distribution contracts may be terminated by the parties thereto, and the board of directors or trustees of certain funds may terminate investment management, administration and distribution agreements for any reason and without penalty. The factors and trends described above could have a material adverse effect on revenues.
Investment decisions with respect to cash balances, market returns or losses on investments, and limits on insurance applicable to cash balances held in bank and brokerage accounts, including those held by us and as agent on behalf of our clients, could expose us to losses of such cash balances and adversely affect revenues attributable to cash balance deposit investments.
As part of our transaction processing and other services, we maintain and manage large bank and investment accounts containing client funds, which we hold as agent, as well as operational funds. Our revenues include investment earnings related to client fund cash balances. Our choices in selecting investments, or market conditions that affect the rate of return on or the availability of investments, could have an adverse effect on the level of such revenues. The amounts held in our operational and client deposit accounts could exceed the limits of government insurance programs of organizations such as the Federal Deposit Insurance Corporation and the Securities Investors Protection Corporation, exposing us to the risk of loss. Any substantial loss would have an adverse impact on our business and our financial condition.
Operational errors in the performance of our services or contractual obligations, as well as unknown or undetected defects, could lead to liability for claims, client loss and result in reputational damage.
The failure to properly perform our services or contractual obligations could result in our clients and/or certain of our subsidiaries being subjected to losses including censures, fines, or other sanctions by applicable regulatory authorities, and we could be liable to parties who are financially harmed by those errors. Despite testing, defects or errors may occur in our existing or new services, which could cause us to compromise client data, lose revenues, lose clients, divert development resources, or damage our reputation, any of which could harm our business.
Our revenues could decrease if client contracts are terminated or fail to renew or if clients renegotiate contracts or utilize our services at lower than anticipated levels.
We derive most of our revenue by selling products and services under multi-year contracts, many of which contain terms and conditions based on anticipated levels of utilization of our services. We cannot unilaterally extend the terms of our client contracts when they expire. Contracts can terminate during the term of agreement for various reasons, including through “termination for convenience” clauses in some contracts that enable clients to cancel by written notice. Our revenues could decrease as a result of terminations or non-renewals of client contracts; extensions of client contracts under, or contract re-negotiations resulting in, less favorable terms; or utilization of services at less than anticipated levels.
We are substantially dependent on our intellectual property rights, and a claim for infringement or a requirement to indemnify a client for infringement could adversely affect us.
We have made substantial investments in software and other intellectual property on which our business is highly dependent. Businesses we acquire also often depend on intellectual property portfolios, which increase the challenges we face in protecting our strategic advantage. Any disclosure, loss, invalidity of, or failure to protect our intellectual property could negatively impact our competitive position and, ultimately, our business. Our protection of our intellectual property rights in the U.S. or abroad may not be adequate and others, including our competitors, may use our proprietary technology without our consent. Furthermore, litigation may be necessary to enforce our intellectual property rights, to protect our trade secrets, or to determine the validity and scope of the proprietary rights of others. Such litigation could result in substantial costs and diversion of resources and could harm our business, financial condition, results of operations and cash flows.
11
To the extent available, we rely on patent, trade secret and copyright laws; however, significant portions of our proprietary intellectual property are not protected by patents. We also utilize nondisclosure and other contractual agreements and security measures to protect our proprietary technology. We cannot guarantee these measures will be effective. Our products and services rely on technology developed by others, including open source software, and we have no control over possible infringement of someone else’s intellectual property rights by the provider of this technology. The owner of the rights could seek damages from us rather than or in addition to the persons who provide the technology to us. We could be subject at any time to intellectual property infringement claims that are costly to evaluate and defend. Our clients may also face infringement claims, allege that such claims relate to our products and services, and seek indemnification from us. Any loss of our intellectual property rights, or any significant claim of infringement or indemnity for violation of the intellectual property rights, or any significant claim of infringement or indemnity for violation of the intellectual property rights of others, could have a material adverse effect on our financial condition, operating results, and cash flows.
Our investments in funds and our joint ventures could decline in value.
From time to time we add new investment strategies to our investment product offerings by providing the initial cash investments as “seed capital.” The seed capital investments may decline in value. A significant decline in their value could have a material adverse effect on our financial condition or operating results.
We are a limited partner in various private equity funds and have future capital commitments related to certain private equity fund investments. These investments are illiquid. Generally, private equity fund securities are non-transferable or are subject to long holding periods, and withdrawals from the private equity firm partnerships are typically not permitted. Even when transfer restrictions do not apply, there is generally no public market for the securities. Therefore, we may not be able to sell the securities at a time when we desire to do so. We may not always be able to sell those investments at the same or higher prices than we paid for them. We also participate in joint ventures with other companies. These joint venture investments could require further capital contributions.
We have restrictive covenants in our debt agreements, which may restrict our flexibility to operate our business. If we do not comply with these restrictive covenants, our failure could result in material and adverse effects on our operating results and our financial condition.
Our debt agreements contain customary restrictive covenants, including limitations on consolidated indebtedness, liens, investments, subsidiary investments, and asset dispositions, and require us to maintain certain leverage and interest coverage ratios. Failure to comply with these covenants could result in an event of default that, if not cured or waived, could result in reduced liquidity for the Company and could have a material adverse effect on our operating results and financial condition. In addition, an event of default or declaration of acceleration under one of our debt agreements could result in a cross default under one or more of our other debt agreements, including our financing agreements. This would have a material adverse impact on our liquidity, financial position and results of operation.
Regulatory and Litigation Risks
We and our unconsolidated affiliates are subject to regulation. Any regulatory violations, changes or uncertainties could adversely affect our business.
A number of our businesses are subject to U.S. or foreign regulation, including privacy, licensing, processing, recordkeeping, investment adviser, broker/dealer, retirement, data protection, reporting and related regulations. New products and services we plan to offer may also be subject to regulation, either directly or as a downstream provider to customers or clients. Such regulations cover all aspects of our businesses including, but not limited to, sales and trading methods, trade practices among broker/dealers, use and safekeeping of clients’ funds and securities, use of client and employee data, capital structure of securities firms, net capital, anti-money laundering efforts, healthcare, recordkeeping and the conduct of directors, officers and employees. Any violation of applicable regulations could expose us or those businesses to civil or criminal liability, significant fines or sanctions, damage our reputation, the revocation of licenses, censures, or a temporary suspension or permanent bar from conducting business, which could adversely affect our business or our financial results. Governmental changes, changing interpretation of regulations, and uncertainties surrounding services we provide could increase our costs of business, result in penalties, or diminish business, which could materially and adversely affect our financial results.
The SEC or other regulatory agencies may issue regulations impacting mutual fund service providers, which could adversely affect our business. The Department of Labor (“DOL”) issued fiduciary regulations in 2016 that, if not delayed, repealed or substantially altered in the near future, are likely to impact our business.
The SEC or other regulatory agencies may issue regulations impacting third-party service providers of mutual funds and other fund-types products, such as distributors, administrators, or custodians, (collectively referred to as “mutual funds”), which
12
could adversely affect our business. The SEC may issue additional regulations under the Dodd-Frank Wall Street Reform and Consumer Protection Act of 2010 (“Dodd-Frank Act”) or other legislative authority that would require brokers and financial intermediaries that distribute mutual funds to make more detailed fee disclosures at the point-of-sale. Additionally, many brokers and financial intermediaries have become subject to a new DOL-imposed fiduciary standard-of-care that is causing them to review, and may impact, their methods of distribution, share class structures, and/or wholesaling activities. Although the DOL rule is fully effective, the current administration has delayed implementation of the best interest contract exemption, providing an extended transition period for distributors to address their new fiduciary status. It remains unclear whether the regulations will be replaced by an SEC standard, repealed or substantially altered within the near future. We cannot predict all of the requirements the SEC or FINRA may impose. Additionally, we cannot predict whether the SEC or FINRA proposal will provide a unified standard with the DOL rule, or whether it will provide a patchwork of standards that depend on the type of account in which the retirement assets are invested. Additionally, while the industry would prefer a united federal fiduciary standard, individual states such as Nevada, New York and Maryland have recently begun to explore their own legislative options to provide a fiduciary standard for investment advice. Regulations that cause current distribution channels or interest in mutual fund investing to change could decrease the number of accounts on our systems as a result of changes in client offerings or the attractiveness of offerings to customers of our clients. The fiduciary regulations are expected to primarily impact brokers and registered investment advisers who give individualized non-discretionary advice in the “retail” marketplace, but discretionary investment managers in the “institutional” space are also expected to be affected, primarily in connection with the sale of investment products and services. To the extent that our business units, clients, unaffiliated intermediary partners and retirement plan service providers fit into these categories, this could adversely affect our business and operating results. Additionally, to the extent the Dodd-Frank Act and/or DOL regulations impact the operations, financial condition, liquidity and capital requirements of unaffiliated financial institutions with whom we transact business, those institutions may seek to pass through increased costs to us or they may reduce their transactional volume which is a primary source of our revenues.
Our clients are subject to regulation that could affect our business.
Our clients are subject to extensive regulation, including investment adviser, broker/dealer and privacy regulations applicable to products and services we provide to the financial services industry and insurance, privacy and other regulations applicable to services we provide to the healthcare industry. Changes in, and any violation by our clients of, applicable laws and regulations (whether related to the products and services we provide or otherwise) could diminish their business or financial condition and thus their demand for our products and services or could increase our cost of continuing to provide our products and services to such industries. Demand could also decrease if we do not continue to offer products and services that help our clients comply with regulations. For example, our accounts in our Healthcare Services segment are impacted by the Affordable Care Act, including the Health Insurance Marketplace. Changes to the Affordable Care Act may be enacted by Congress in response to the current administration’s stated agenda, and we cannot predict the impact that will have on our clients and their demand for our products and services.
Our businesses expose us to risks of claims and losses that could be significant and damage our reputation and business prospects.
Our proprietary applications and related consulting and other services include the processing or clearing of financial and healthcare transactions for our clients and their customers and the design of benefit plans and compliance programs. The dollar amount of transactions processed or cleared is vastly higher than the revenues we derive from providing these services. In the event we make transaction processing or operational errors, or mismanage any process, we could be exposed to claims for any resulting processing delays, disclosure of protected information, miscalculations, mishandling of pass-through disbursements or other processes, and failure to follow a client’s instructions or meet specifications. Additionally, we may be subject to claims or liability resulting from a failure of third parties (including regulatory authorities) to recognize the limitations of our role as our clients’ agent or consultant, and we may be subject to claims or liability resulting from fraud committed by third parties. We may be exposed to the risk of counterparty breaches or failure to perform. We may be subject to claims, including class actions, for reimbursements, losses or damages arising from any transaction processing or operational error, or from process mismanagement. Because of the sensitive nature of the financial and healthcare transactions we process, our liability and any alleged damages may significantly exceed the fees we receive for performing the service at issue. Litigation could include class action claims based upon, among other theories, various regulatory requirements and consumer protection and privacy laws that class action plaintiffs may attempt to use to assert private rights of action. Any of these claims and related settlements or judgments could affect our operating results, damage our reputation, decrease demand for our products and services, or cause us to make costly operating changes.
13
Changes in tax laws, including the recently enacted federal tax legislation commonly referred to as the Tax Cuts and Jobs Act of 2017 (“Tax Act”), as well as other factors, could cause us to experience fluctuations in our tax obligations and effective tax rate in 2018 and thereafter.
We are subject to income taxes as well as non-income based taxes in federal and various state jurisdictions. We are currently evaluating the Tax Act with our professional advisers. We have recognized the provisional tax impacts, based on reasonable estimates, related to the one-time deemed mandatory repatriation of undistributed accumulated foreign earnings and the revaluation of deferred tax assets and liabilities and have included these amounts in our consolidated financial statements for the year ended December 31, 2017. The ultimate impact may differ from these provisional amounts, possibly materially, due to among other things, additional analysis, changes in interpretations and assumptions we have made, additional regulatory guidance that may be issued, and actions we may take as a result of the Tax Act. In addition, because of the uncertainties relating to the future application of the Tax Act and actions we may take in the future, the effect of the Tax Act on us in 2018 and future years may change significantly and cannot be predicted.
We are subject to audits by tax authorities from time to time in federal and state jurisdictions. Tax authorities may disagree with certain positions we have taken and assess additional taxes and penalties. We regularly assess the likely outcomes of these audits in order to determine the appropriateness of our tax provision. However, there can be no assurance that we will accurately predict the outcomes of these audits, and the actual outcomes of these audits could have a material impact on our results of operations.
Risks Related to Corporate Governance or our Equity Securities
We do not control certain businesses in which we have significant ownership.
We invest in joint ventures and other unconsolidated affiliates as part of our business strategy, and part of our net income is derived from our pro rata share of the earnings of those businesses. Despite owning significant equity interests in those companies and having directors on their boards, we do not control their operations, strategies or financial decisions. The other owners may have economic, business or legal interests or goals that are inconsistent with our goals or the goals of the businesses we co-own. Our pro rata share of any losses due to unfavorable performance of those companies could negatively impact our financial results.
Some of our joint venture investments are subject to buy-sell agreements, which could, among other things, restrict us from selling our interests even if we were to determine it would be prudent to do so.
We own interests in unconsolidated entities and various real estate joint ventures. Our interests in such unconsolidated entities are subject to buy/sell arrangements, which could restrict our ability to sell our interests even if we were to determine it would be prudent to do so. These arrangements could also allow us to purchase the other owners’ interests to prevent someone else from acquiring them and we cannot control the timing of occasions to do so. The businesses or other owners may encourage us to increase our investment in or make contributions to the businesses at an inopportune time.
In addition, some of the agreements governing our joint venture arrangements include buy/sell provisions that provide a party to the arrangement with the option to purchase the other party’s interests upon such other party’s change of control at a purchase price that may be less than fair market value. For instance, consummation of the proposed Merger would constitute a change of control of the Company under the partnership agreement of IFDS L.P. and, as a result, the other partner would have the option to purchase our interests in IFDS L.P. at a price equal to book value, unless another purchase provision in the partnership agreement was triggered prior to the change of control. Book value may be substantially less than fair market value at the time of any sale of our interests upon a change of control.
Provisions in our Certificate of Incorporation, Bylaws, certain plans and agreements, and applicable laws could discourage, delay or prevent a change in control of us that a stockholder may consider favorable.
The provisions include:
• | super-majority stockholder approval required for certain actions; |
• | specific procedures for stockholders to nominate new directors; |
• | the Board’s authority to issue and set the terms of preferred stock; |
• | various rights of joint venture co-owners and contractual counterparties, including rights of lenders and certain clients and executives in the event of a change in control; |
• | public reporting of ownership and of changes in ownership by stockholders with at least a 5% interest in us; and |
• | legal restrictions on business combinations with certain stockholders. |
14
Because of contractual commitments, a change in control could affect our operating results and weaken our management retention and incentive tools.
A change in control of the Company could trigger various rights and obligations in service agreements with certain clients and other agreements. A change in control could also allow some clients to terminate their agreements with us or to obtain rights to use our processing software. Under certain executive equity-based and other incentive compensation awards, benefit programs and employment agreements with our management, a change in control by itself, or an individual’s termination of employment without “cause” or resignation for “good reason” (each as defined in applicable agreements) after a change in control could accelerate funding, payment or vesting of equity grants, as applicable, under such agreements and programs. This accelerated funding, vesting or payment may decrease an employee’s incentive to continue employment with us. We have adopted an executive severance plan which, among other things, provides benefits to participating senior officers and executives who are terminated in connection with a change of control. Certain other executive officers have agreements with us that require us to continue to employ them for three years after a change in control or to pay certain amounts if we terminate their employment without cause or they resign for good reason following a change in control. The executives might not be incented to achieve desired results for the new owners of our business, and the cost of keeping the executives on the payroll might deter potential new owners from acquiring us or hinder new owners from hiring replacement management.
We may not pay cash dividends on our common stock in the future.
Future cash dividends will depend upon our financial condition, earnings and other factors deemed relevant by our Board of Directors. Payment of dividends is subject to applicable laws and to restrictions in applicable debt agreements. We are currently precluded from declaring dividends pursuant to the definitive Merger Agreement with SS&C, as further described in Item 8, Financial Statements and Supplementary Data - Note 1, “Description of Business.”
Risks Related to our Proposed Merger Transaction with SS&C
The consummation of the Merger is subject to many conditions and if these conditions are not satisfied or waived, the Merger will not be completed.
We cannot provide any assurance that the Merger will be completed or that there will not be a delay in the completion of the Merger. Our ability to consummate the Merger is subject to risks and uncertainties, including, but not limited to, the risks that the conditions to the Merger are not satisfied, or if possible, waived, including, among others, (a) receipt of the approval by the affirmative vote of the holders of a majority of the outstanding shares of Company common stock entitled to vote (the “Company Stockholder Approval”); (b) receipt of certain regulatory approvals; and (c) the absence of governmental restraints or prohibitions preventing the consummation of the Merger. The process to obtain the requisite approvals could prevent, or substantially delay, the consummation of the Merger.
The closing of the Merger is also dependent on the accuracy of representations and warranties made by the parties to the Merger Agreement (subject to customary materiality qualifiers and other customary exceptions), the performance in all material respects by the parties of obligations imposed under the Merger Agreement and the receipt of officer certificates by the other party certifying the satisfaction of the preceding conditions. We cannot provide any assurance as to whether or when the conditions to the closing of the Merger will be satisfied or waived or as to whether or when the Merger will be consummated.
Regulatory approvals may not be received, may take longer than expected or may impose conditions that are not presently anticipated or that cannot be met.
Before the Merger may be completed, various approvals, authorizations and declarations of non-objection must be obtained from certain regulatory and governmental authorities. Subject to the terms and conditions of the Merger Agreement, each party has agreed to use their reasonable best efforts to cooperate with each other party in taking any and all actions, and to do all things reasonably necessary, appropriate or desirable, to consummate and make effective the Merger and the other transactions contemplated by the Merger Agreement, including obtaining any requisite approvals. These approvals include approval of, or under, the Hart-Scott-Rodino Antitrust Improvements Act of 1976, approval under the competition law of Ireland and approvals of the Financial Industry Regulatory Authority, the United Kingdom’s Financial Conduct Authority, the Central Bank of Ireland and Luxembourg’s Commission de Surveillance du Secteur Financier.
These regulatory and governmental entities may impose conditions on the granting of such approvals and if such regulatory and governmental entities seek to impose such conditions, lengthy negotiations may ensue among such regulatory or governmental entities, SS&C and DST. Such conditions and the process of obtaining regulatory approvals could have the effect of delaying completion of the Merger and such conditions may not be satisfied for an extended period of time.
We cannot assure you that these regulatory clearances and approvals will be timely obtained or obtained at all, or that the granting of these regulatory clearances and approvals will not involve the imposition of regulatory remedies on the completion
15
of the Merger, including requiring changes to the terms of the Merger agreement. These conditions or changes could result in the conditions to the closing of the Merger not being satisfied.
The special meeting of our stockholders at which the adoption and approval of the Merger Agreement will be considered may take place before all of the required regulatory approvals have been obtained and before regulatory remedies, if any, are known. In this event, if the Company Stockholder Approval is obtained, we and SS&C may subsequently agree to regulatory remedies without further seeking stockholder approval, even if such regulatory remedies could have an adverse effect on us, SS&C or the combined company, except as required by applicable law.
The Merger Agreement contains restrictions on our ability to pursue other alternatives to the Merger and, in specified circumstances, could require us to pay SS&C a termination fee of $165.0 million.
The Merger Agreement contains non-solicitation provisions that, subject to limited exceptions, restrict our ability to solicit, initiate or knowingly facilitate or knowingly encourage any inquiry, discussion, offer or request that constitutes, or would reasonably be expected to lead to, an alternative proposal. Further, subject to limited exceptions, consistent with applicable law, the Merger Agreement provides that our Board of Directors will not fail to make, withdraw, qualify or modify, in a manner adverse to SS&C, its recommendation that our stockholders vote in favor of approving the Merger. Although our Board of Directors is permitted to take certain actions in response to a superior proposal or an intervening event if it determines that the failure to do so would reasonably be expected to be inconsistent with its fiduciary duties, doing so in specified situations could require us to pay SS&C a termination fee. There also is a risk that the requirement to pay the termination fee to SS&C in certain circumstances may result in a potential acquiror proposing to pay a lower per share price to acquire us than it might otherwise have proposed to pay.
The Merger Agreement may be terminated in accordance with its terms and the Merger will not be completed.
The Merger Agreement may be terminated if the Merger is not consummated on or before July 11, 2018 (subject to extension to November 11, 2018 by either party if all conditions are satisfied other than regulatory approvals) or if the Company Stockholder Approval has not been obtained. In addition, SS&C and DST may elect to terminate the Merger Agreement in certain other circumstances, including by SS&C if DST’s Board of Directors shall have changed its recommendation to stockholders and by DST in order to enter into an agreement providing for a superior proposal.
Upon a termination of the Merger Agreement due to entry into an agreement with respect to a superior proposal, and as a result of DST’s Board of Directors making a change of recommendation prior to the receipt of the Company Stockholder Approval, we will be required to pay SS&C a termination fee of $165.0 million.
Failure to consummate the Merger could negatively impact DST and our future operations.
If the Merger Agreement is terminated in accordance with its terms and the Merger is not consummated, our ongoing business may be adversely affected by a variety of factors. Our business may be adversely impacted by (i) the failure to pursue other beneficial opportunities during the pendency of the Merger, (ii) payment of certain significant transaction costs relating to the Merger without receiving the anticipated benefits and (iii) the focus of our management on the Merger for an extended period of time rather than on other management opportunities or other beneficial opportunities for our Company. The market price of Company common stock may also decline as a result of any such failures to the extent that the current market prices reflect a market assumption that the Merger will be completed.
We may be negatively impacted if the Merger Agreement is terminated and DST seeks but is unable to find another business combination or strategic transaction offering equivalent or more attractive consideration than the consideration to be provided in the Merger, or if we become subject to litigation related to entering into or failing to consummate the Merger, including direct actions by our stockholders against the directors and/or officers for breaches of fiduciary duty or derivative actions brought by our stockholders. Furthermore, we may experience negative reactions from our stockholders, clients and employees in the event the Merger is not consummated.
We will be subject to business uncertainties and contractual restrictions until the Merger is consummated.
Uncertainty about the effect of the Merger on clients, counterparties to contracts, employees and other parties may have an adverse effect on us. These uncertainties could disrupt our business and cause clients, suppliers, vendors, partners and others that deal with us to defer entering into contracts with us or making other decisions concerning us or seek to change or cancel existing business relationships with us. These uncertainties may also impair our ability to attract, retain and motivate key personnel until the Merger is completed and for a period of time thereafter. Employee retention and recruitment may be particularly challenging prior to completion of the Merger, as employees and prospective employees may experience uncertainty about their future roles following the Merger.
16
The Merger Agreement restricts us, without the consent of SS&C, from making certain acquisitions and divestitures, entering into certain contracts, incurring certain indebtedness and expenditures, paying dividends, and taking other specified actions until the earlier of the completion of the Merger or the termination of the Merger Agreement. These restrictions may prevent us from pursuing attractive business opportunities that may arise prior to the completion of the Merger. Furthermore, the preparation for the integration of the two companies may place a significant burden on management and internal resources. Any significant diversion of management attention away from ongoing business and any difficulties encountered in the transition and integration process could affect our financial results prior to and/or following the completion of the Merger and could limit us from pursuing attractive business opportunities and making other changes to our business prior to completion of the Merger or termination of the Merger Agreement.
Completion of the Merger may trigger change in control or other provisions in certain agreements to which DST is a party.
The completion of the transactions may trigger change in control or other provisions in certain agreements to which DST is a party. If SS&C and DST are unable to negotiate waivers of those provisions, the counterparties may exercise their rights and remedies under the agreements, potentially terminating the agreements or seeking monetary damages. Even if SS&C and DST are able to negotiate waivers, the counterparties may require a fee for such waivers or seek to renegotiate the agreements on terms less favorable to DST.
For example, consummation of the proposed Merger would constitute a change of control of the Company under the partnership agreement of IFDS L.P. and, as a result, the other partner would have the option to purchase our interests in IFDS L.P. at a price equal to book value, which may be substantially less than fair market value, unless another purchase provision in the partnership agreement was triggered prior to the change of control.
We will incur substantial transaction fees and costs in connection with the Merger.
We expect to incur significant costs, expenses and fees for professional services and other transaction costs in connection with the Merger. A material portion of these expenses are payable by us whether or not the Merger is completed.
Further, while we have assumed that a certain amount of transaction expenses will be incurred, factors beyond our control could affect the total amount or the timing of these expenses. Many of the expenses that will be incurred, by their nature, are difficult to estimate accurately. These expenses may exceed the costs historically borne by DST. These costs could adversely affect the financial condition and results of our operations prior to the Merger.
Any legal proceedings in connection with the Merger could delay or prevent the completion of the Merger.
Transactions such as the Merger often give rise to lawsuits by stockholders or other third parties. One of the conditions to the closing of the Merger is that no judgment, order, injunction, ruling or decree, preliminary, temporary or permanent, or other legal restraint or prohibition and no action, proceeding, binding order or determination by any governmental entity, will be in effect preventing or otherwise making illegal the consummation of the Merger. In connection with the Merger, plaintiffs may file lawsuits against us and/or our directors and officers in connection with the Merger. Such legal proceedings could also prevent or delay the completion of the Merger and result in additional costs. In addition, if any lawsuit is successful in obtaining an injunction prohibiting us or SS&C from consummating the Merger on the agreed upon terms, the injunction may prevent the Merger from being completed within the expected timeframe, or at all. If the Merger is prevented or delayed, the lawsuits could result in substantial costs, including any costs associated with the indemnification of directors. The defense or settlement of any lawsuit or claim that remains unresolved at the time the Merger is completed may adversely affect our business, financial condition or results of operations.
We may waive one or more of the conditions to the Merger without resoliciting the Company Stockholder Approval.
We may determine to waive, in whole or in part, one or more of the conditions to our obligations to complete the Merger, to the extent permitted by applicable laws. We will evaluate the materiality of any such waiver and its effect on our stockholders in light of the facts and circumstances at the time to determine whether any amendment of this proxy statement and resolicitation of proxies is required or warranted. In some cases, if our Board determines that such a waiver is warranted but that such waiver or its effect on our stockholders is not sufficiently material to warrant resolicitation of proxies, we have the discretion to complete the Merger without seeking further stockholder approval. Any determination whether to waive any condition to the Merger or as to resoliciting stockholder approval or amending this proxy statement as a result of a waiver will be made by us at the time of such waiver based on the facts and circumstances as they exist at that time.
17
The opinion of our financial advisor will not reflect changes in circumstances between the signing of the Merger Agreement and the completion of the Merger.
We have not obtained an updated opinion in connection with the Merger from our financial advisor, Merrill Lynch, Pierce, Fenner & Smith Incorporated (“BofA Merrill Lynch”), as of the date of this Form 10-K and do not expect to receive an updated opinion prior to the completion of the Merger. Changes in our operations and prospects, general market and economic conditions and other factors that may be beyond our control, and on which the opinion of BofA Merrill Lynch was based, may significantly alter the value of our Company or the price of our common stock by the time the Merger is completed. The opinion does not speak as of the time the Merger will be completed or as of any date other than the date of the opinion. Because BofA Merrill Lynch will not be updating its opinion, which was issued in connection with the execution of the Merger Agreement on January 11, 2018, the opinion will not address the fairness of the Merger consideration from a financial point of view at the time the Merger is completed.
Item 1B. Unresolved Staff Comments
None.
Item 2. Properties
Our main operating facilities, including our corporate headquarters, are located in Kansas City, Missouri and consist of 1.1 million square feet of office space, of which 69% is owned and 31% is leased, and 160,000 square feet of owned data center space. Additionally, we own an aggregate 524,000 square feet of space consisting primarily of a back-up data center in St. Louis, Missouri and office space in Massachusetts, California and the United Kingdom. We lease an aggregate of 1.2 million square feet of other office space and production space in North America, United Kingdom, India, Ireland, Thailand, Australia and Canada. Of the 3.0 million square feet of space identified above, the Company leases and subleases approximately 54,000 square feet to third-parties. Approximately 65%, 24% and 11% of the remaining square footage is utilized by the Domestic Financial Services, International Financial Services and Healthcare Services segments, respectively. We also own undeveloped land in Kansas City, Missouri and California and an underground facility with approximately 538,000 square feet in Kansas City, Missouri, of which 497,000 square feet is leased to third parties. Our real estate joint ventures own 2.5 million square feet of real estate, of which 2.2 million square feet is occupied by third parties or is vacant. We believe our facilities are currently adequate for their intended purposes and are adequately maintained.
Item 3. Legal Proceedings
The information set forth under the heading “Legal Proceedings” in Item 8. Financial Statement and Supplementary Data - Note 16, “Commitments and Contingencies” is incorporated herein by reference.
We are involved in various other legal proceedings arising in the normal course of our businesses. At this time, we do not believe any material losses under these claims to be probable. While the ultimate outcome of such legal proceedings cannot be predicted with certainty, it is in the opinion of management, after consultation with legal counsel, that the final outcome in such proceedings, in the aggregate, would not have a material adverse effect on our consolidated financial condition, results of operations or cash flows.
Item 4. Mine Safety Disclosures
None.
PART II
Item 5. Market for the Registrant’s Common Equity, Related Stockholder Matters and Issuer Purchases of Equity Securities
The Company’s common stock trades under the symbol “DST” on the New York Stock Exchange (“NYSE”). As of February 22, 2018, there were approximately 7,798 registered holders of our common stock. In May 2017, our Board of Directors declared a two-for-one stock split of DST’s outstanding common stock effected in the form of a stock dividend, which was paid on June 8, 2017. All share and per share data, excluding treasury shares, have been retroactively adjusted for all periods presented to reflect the stock split as if the stock split had occurred at the beginning of the earliest period presented.
18
The following table provides the quarterly high and low prices of, and quarterly cash dividends paid on, the Company’s common stock for the two-year period ended December 31, 2017. We are currently precluded from declaring dividends pursuant to the Merger Agreement with SS&C, as further described in Item 8, Financial Statements and Supplementary Data - Note 1, “Description of Business.”
Dividend | High | Low | |||||||||
2016 | |||||||||||
1st Quarter | $ | 0.16 | $ | 54.40 | $ | 47.50 | |||||
2nd Quarter | 0.17 | 58.91 | 51.80 | ||||||||
3rd Quarter | 0.17 | 61.03 | 56.47 | ||||||||
4th Quarter | 0.16 | 57.28 | 46.30 | ||||||||
2017 | |||||||||||
1st Quarter | $ | 0.18 | $ | 60.48 | $ | 53.36 | |||||
2nd Quarter | 0.18 | 61.81 | 58.14 | ||||||||
3rd Quarter | 0.18 | 61.67 | 50.27 | ||||||||
4th Quarter | 0.18 | 62.63 | 54.50 | ||||||||
The prices set forth above do not include commissions and do not necessarily represent actual transactions. The closing price of our common stock on the NYSE on December 31, 2017 was $62.07.
Stock Repurchases
The following table sets forth information with respect to shares of our common stock purchased by us during the quarter ended December 31, 2017.
_______________________________________________________________________
Period | Total Number of Shares Purchased | Average Price Paid Per Share | Total $ Amount of Shares Purchased as Part of Publicly Announced Plans or Programs | Approximate Dollar Value of Shares That May Yet Be Purchased Under the Plans or Programs | ||||||||||||
October 1 - October 31 | 309,054 | (1) | $ | 57.92 | $ | 17,668,473 | $ | 207,331,540 | ||||||||
November 1 - November 30 | 762,037 | (1) | 59.68 | 45,478,375 | 161,853,165 | |||||||||||
December 1 - December 31 | 192,116 | (1) | 61.82 | 11,853,122 | 150,000,043 | |||||||||||
Total | 1,263,207 | $ | 59.57 | $ | 74,999,970 | $ | 150,000,043 | (2) | ||||||||
(1) | For the three months ended December 31, 2017, we purchased, in accordance with the 2015 Equity and Incentive Plan, 4,445 shares of our common stock for participant income tax withholding in conjunction with stock option exercises or from the vesting of restricted shares, as requested by the participants or from shares surrendered in satisfaction of the option exercise price. These purchases were not made under the publicly-announced repurchase plans or programs, but were allowed by the rules of the Compensation Committee of our Board of Directors. Of these shares, 4,054 shares were purchased in October 2017 and 391 shares were purchased in December 2017. |
(2) | On May 9, 2017 our Board of Directors authorized a new $300.0 million share repurchase plan. The plan allows, but does not require, the repurchase of common stock in open market and private transactions. The plan does not have an expiration date. During 2017, we entered into one or more plans with our brokers or banks for pre-authorized purchases within defined limits pursuant to Rule 10b5-1 to affect all or a portion of such share repurchases. We are currently precluded from executing additional stock repurchases pursuant to the Merger Agreement with SS&C, as further described in Item 8, Financial Statements and Supplementary Data - Note 1, “Description of Business.” |
19
Stock Performance Graph
The following graph shows the changes in value since December 31, 2012 of an assumed investment of $100 in: (i) DST Common Stock; (ii) the stocks that comprise the S&P MidCap 400 Index(1); and (iii) the stocks that comprise the S&P MidCap 400 Index - Information Technology Sector(1) (“S&P MidCap IT Index”). The table following the graph shows the dollar value of those assumed investments as of December 31, 2017 and as of December 31 for each of the five preceding years. The value for the assumed investments depicted on the graph and in the table has been calculated assuming that cash dividends, if any, are reinvested at the end of each quarter in which they are paid.
Comparison of Cumulative Five Year Total Return
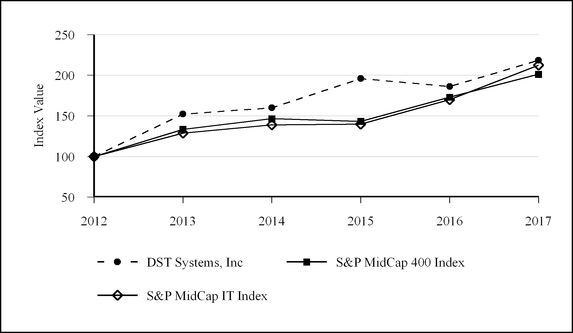
As of December 31, | |||||||||||||||||||||||
2012 | 2013 | 2014 | 2015 | 2016 | 2017 | ||||||||||||||||||
DST Systems, Inc | $ | 100.00 | $ | 152.21 | $ | 159.95 | $ | 195.87 | $ | 186.18 | $ | 218.36 | |||||||||||
S&P MidCap 400 Index | 100.00 | 133.50 | 146.54 | 143.35 | 173.08 | 201.20 | |||||||||||||||||
S&P MidCap IT Index | 100.00 | 128.80 | 138.99 | 139.85 | 169.87 | 212.46 | |||||||||||||||||
_______________________________________________________________________
(1) | Standard & Poor’s Corporation, an independent company, prepares the S&P MidCap 400 Index and the S&P Midcap IT Index. |
The performance graph and related text are being furnished to and not filed with the SEC, and will not be deemed to be “soliciting material” or subject to Regulation 14A or 14C under the Securities Exchange Act of 1934 or to the liabilities of Section 18 of the Securities Exchange Act of 1934, and will not be deemed to be incorporated by reference into any filing under the Securities Act of 1933 or the Securities Exchange Act of 1934, except to the extent we specifically incorporate such information by reference into such a filing.
20
Item 6. Selected Financial Data
The following table sets forth selected consolidated financial data of the Company. The selected consolidated financial data should be read in conjunction with and are qualified by reference to “Management’s Discussion and Analysis of Financial Condition and Results of Operations” included in Item 7 of this Form 10-K and our audited consolidated financial statements, including the notes thereto, and the report of the independent registered public accounting firm thereon and the other financial information included in Item 8 of this Form 10-K.
Year Ended December 31, | |||||||||||||||||||
2017 (1) | 2016 (2) | 2015 (3) | 2014 (4) | 2013 (5) | |||||||||||||||
Income Statement Data: | (dollars in millions, except per share amounts) | ||||||||||||||||||
Operating revenues (excluding out-of-pockets) | $ | 2,086.7 | $ | 1,474.4 | $ | 1,405.0 | $ | 1,445.5 | $ | 1,368.2 | |||||||||
Operating income | 285.2 | 247.3 | 232.7 | 262.7 | 271.8 | ||||||||||||||
Other income, net | 219.0 | 22.7 | 204.5 | 373.1 | 242.8 | ||||||||||||||
Income from continuing operations before income taxes and non-controlling interest | 531.9 | 279.2 | 458.8 | 744.7 | 503.1 | ||||||||||||||
Income from continuing operations attributable to DST Systems, Inc. | 447.0 | 179.0 | 309.7 | 560.8 | 324.7 | ||||||||||||||
Basic earnings per share - continuing operations attributable to DST Systems, Inc. (6) | 7.28 | 2.71 | 4.30 | 7.00 | 3.75 | ||||||||||||||
Diluted earnings per share - continuing operations attributable to DST Systems, Inc. (6) | 7.20 | 2.68 | 4.25 | 6.93 | 3.69 | ||||||||||||||
Non-GAAP diluted earnings per share - continuing operations attributable to DST Systems, Inc. (6) (7) | 3.36 | 2.87 | 2.47 | 2.49 | 2.11 | ||||||||||||||
Cash dividends per share of common stock | 0.72 | 0.66 | 0.60 | 0.60 | 0.60 | ||||||||||||||
December 31, | |||||||||||||||||||
2017 (1) | 2016 (2) | 2015 (3) | 2014 (4) | 2013 (5) | |||||||||||||||
Balance Sheet Data: | (dollars in millions) | ||||||||||||||||||
Total assets | $ | 2,938.2 | $ | 2,771.8 | $ | 2,813.2 | $ | 2,942.9 | $ | 3,090.5 | |||||||||
Total debt | 620.8 | 508.2 | 562.1 | 546.8 | 675.6 | ||||||||||||||
Stockholders’ equity | 1,241.2 | 1,115.2 | 1,046.0 | 1,236.4 | 1,183.8 | ||||||||||||||
_______________________________________________________________________
(1) | In 2017, we recorded a $43.8 million net gain on previously held equity interests and $159.8 million of net gains on securities and other investments, which are included in Other income, net, in the Consolidated Statement of Income primarily as a result of the acquisition of State Street’s ownership in both BFDS and IFDS U.K. Additionally, as a result of a termination agreement reached with a wealth management platform client, operating revenues of $93.2 million related to previously deferred revenues and contractual termination payments received were recognized and bad debt expense, severance and other costs and expenses of $38.9 million were recorded in Costs and expenses within the Consolidated Statement of Income. |
(2) | In 2016, we acquired Kaufman Rossin Fund Services LLC. Additionally, we recorded net gains on securities and other investments of $16.3 million, which is included in Other income, net, in the Consolidated Statement of Income. |
(3) | In 2015, we acquired the following businesses: kasina LLC, Red Rocks Capital LLC and Wealth Management Systems Inc. Additionally, we recorded net gains on securities and other investments of $199.3 million, which is included in Other income, net, in the Consolidated Statement of Income. |
(4) | In 2014, we recorded a pretax gain of $100.5 million on the sale of our wholly-owned subsidiary, DST Global Solutions, Ltd., which is included in Gain on sale of business in the Consolidated Statement of Income. In addition, we recorded net gains on securities and other investments of $343.5 million, which were included in Other income, net in the Consolidated Statement of Income. |
(5) | In 2013, we recorded net gains on securities and other investments of $222.8 million, which were included in Other income, net in the Consolidated Statement of Income |
(6) | During the years ended December 31, 2017, 2016, 2015, 2014, and 2013, we repurchased 5.1 million, 5.4 million, 7.2 million, 9.4 million and 7.6 million shares of our common stock, respectively, on a post stock split basis. |
(7) | The reconciliation of reported diluted earnings per share to non-GAAP diluted earnings per share is presented below under the heading “Use of Non-GAAP Financial Information.” |
21
Use of Non-GAAP Financial Information
In addition to reporting financial information in accordance with accounting principles generally accepted in the United States of America (“GAAP”), we have disclosed non-GAAP financial information which has been reconciled to the corresponding GAAP measures in the following financial schedules titled “Reconciliation of Reported Diluted Earnings per Share to Non-GAAP Diluted Earnings per Share - Continuing Operations Attributable to DST Systems, Inc.” In making these adjustments to determine the non-GAAP results, we take into account the impact of items that are not necessarily ongoing in nature, that do not have a high level of predictability associated with them or that are non-operational in nature. Generally, these items include net gains on dispositions of businesses, net gains (losses) associated with securities and other investments, acquired intangible asset amortization, restructuring and impairment costs, and other similar items. Our non-GAAP diluted earnings per share is also adjusted for the income tax impact of the above items, as applicable. The income tax impact of each item is calculated by applying the statutory rate and local tax regulations in the jurisdiction in which the item was incurred. Additionally, income tax is adjusted to remove the impacts of large discrete or unusual items. Management believes the exclusion of these items provides a useful basis for evaluating underlying business unit performance, but should not be considered in isolation and is not in accordance with, or a substitute for, evaluating business unit performance utilizing GAAP financial information. Management uses non-GAAP measures in its budgeting and forecasting processes and to further analyze our financial trends and “operational run-rate,” as well as in making financial comparisons to prior periods presented on a similar basis. We believe that providing such adjusted results allows investors and other users of our financial statements to better understand our comparative operating performance for the periods presented.
Our management uses this non-GAAP financial measure in its own evaluation of the Company’s performance, particularly when comparing performance to past periods. Our non-GAAP measures may differ from similar measures by other companies, even if similar terms are used to identify such measures. Although our management believes non-GAAP measures are useful in evaluating the performance of its business, we acknowledge that items excluded from such measures may have a material impact on our financial information calculated in accordance with GAAP. Therefore, management typically uses non-GAAP measures in conjunction with GAAP results. These factors should be considered when evaluating our results.
Reconciliation of Reported Diluted Earnings per Share to Non-GAAP Diluted Earnings per Share - Continuing Operations Attributable to DST Systems, Inc.
Year Ended December 31, | |||||||||||||||||||
2017 | 2016 | 2015 | 2014 | 2013 | |||||||||||||||
Reported GAAP Diluted Earnings per Share | $ | 7.20 | $ | 2.68 | $ | 4.25 | $ | 6.93 | $ | 3.69 | |||||||||
Adjusted to remove: | |||||||||||||||||||
Net gains on securities and other investments | (2.57 | ) | (0.26 | ) | (2.74 | ) | (4.24 | ) | (2.53 | ) | |||||||||
Amortization of intangible assets | 0.57 | 0.35 | 0.26 | 0.22 | 0.21 | ||||||||||||||
Restructuring charges | 0.38 | 0.23 | 0.05 | 0.16 | 0.04 | ||||||||||||||
Income tax items | (0.49 | ) | 0.06 | (0.22 | ) | (0.46 | ) | (0.13 | ) | ||||||||||
Business development/advisory expenses | 0.30 | — | 0.02 | 0.07 | — | ||||||||||||||
Equity in earnings of unconsolidated affiliates items | (0.54 | ) | — | (0.05 | ) | (0.07 | ) | (0.08 | ) | ||||||||||
Charitable contribution of securities | 0.02 | — | — | 0.01 | — | ||||||||||||||
Contract termination payments received, net | (0.86 | ) | — | — | — | (0.07 | ) | ||||||||||||
Gain on previously held equity interest | (0.70 | ) | — | — | — | — | |||||||||||||
Loss accruals (loss accrual reversal) | 0.05 | — | — | (0.05 | ) | 0.03 | |||||||||||||
Net gain on sale of business | — | (0.07 | ) | — | (1.24 | ) | — | ||||||||||||
Software impairment | — | 0.09 | — | — | — | ||||||||||||||
Reversal of accrued contingent consideration | — | (0.10 | ) | — | — | — | |||||||||||||
Net (gains) losses on real estate assets | — | — | (0.05 | ) | — | 0.04 | |||||||||||||
Gain on contract to repurchase common stock | — | — | — | (0.22 | ) | — | |||||||||||||
Income tax effect of adjustments | — | (0.11 | ) | 0.95 | 1.38 | 0.91 | |||||||||||||
Adjusted Non-GAAP Diluted Earnings per Share | $ | 3.36 | $ | 2.87 | $ | 2.47 | $ | 2.49 | $ | 2.11 | |||||||||
22
Item 7. Management’s Discussion and Analysis of Financial Condition and Results of Operations
FORWARD LOOKING STATEMENTS
This report contains “forward-looking statements” - that is, statements related to future, not past, events. In this context, forward-looking statements often address our expected future business and financial performance and financial condition, and often contain words such as “expect,” “anticipate,” “intend,” “plan,” “believe,” “seek,” “see,” “will,” “would,” or “target.” Forward-looking statements by their nature address matters that are, to different degrees, uncertain.
For us, particular risks and uncertainties that could cause our actual results to be materially different than those expressed in our forward-looking statements include:
• | the effects of competition in the businesses in which we operate; |
• | changes in client demand and our ability to provide products and services on terms that are favorable to us; |
• | changes in law, economic and financial conditions; |
• | the impacts of breaches or potential breaches of network, information technology or data security, natural disasters, terrorist attacks or acts of war or significant litigation and any resulting financial impact not covered by insurance; |
• | the effectiveness of our risk management framework; |
• | the impact of regulation and regulatory, investigative and legal proceedings and legal compliance risks, including the impact of financial services regulation and litigation and potential SEC or DOL regulations impacting third-party distributors of mutual funds; |
• | our investments in funds and other companies may decline; |
• | our ability to successfully complete acquisitions or integrate acquired businesses; |
• | the risk that the proposed Merger with SS&C will not be consummated within the expected time period or at all, including the risk that the Company may be unable to obtain stockholder approval as required for the Merger and conditions to the closing of the Merger may not be satisfied or waived on a timely basis or otherwise; |
• | the risk that a governmental entity or a regulatory body may prohibit, delay or refuse to grant approval for the consummation of the Merger and may require conditions, limitations or restrictions in connection with such approvals that can adversely affect the anticipated benefits of the proposed Merger or cause the parties to abandon the proposed Merger; |
• | the risk that the business of the Company may suffer as a result of uncertainty surrounding the Merger or the potential adverse changes to business relationships resulting from the proposed Merger; |
• | the risk that the Merger may involve unexpected costs, liabilities or delays; |
• | the risk that legal proceedings may be initiated related to the Merger and the outcome of any legal proceedings related to the Merger may be adverse to the Company; and |
• | the other factors that are described in Item 1A, “Risk Factors” of this Form 10-K. |
These or other uncertainties may cause our actual future results to be materially different than those expressed in our forward-looking statements. This document includes certain forward-looking projected financial information that is based on current estimates and forecasts. Actual results could differ materially.
Future economic and industry trends that could potentially impact our financial statements or results of operations are difficult to predict. These forward-looking statements are based on information as of the date of this report. We assume no obligation to publicly update or revise our forward-looking statements even if experience or future changes make it clear that any projected results expressed or implied therein will not be realized, except as may be required by law.
Introduction
DST Systems, Inc. and our consolidated subsidiaries use proprietary software applications to provide sophisticated information processing and servicing solutions through strategically unified data management and business process solutions to clients globally within the asset management, brokerage, retirement, healthcare and other markets. Our wholly-owned data centers provide the secure technology infrastructure necessary to support our solutions. In order to position the Company to take advantage of new and emerging technologies, we are embarking on an information technology transformation effort which will increase our operating expenses for the near term. We expect these investments will result in lower centralized infrastructure costs and a more agile platform on which to deliver future capabilities.
On January 11, 2018, we entered into a Merger Agreement wherein SS&C will acquire DST. Under the terms of the agreement, SS&C will purchase DST in an all-cash transaction for $84.00 per share plus the assumption of debt, equating to an enterprise value of approximately $5.4 billion. We have agreed to customary covenants in the Merger Agreement, including with respect to the operation of our business prior to the closing of the transaction or termination of the agreement, such as
23
restrictions on making certain acquisitions and divestitures, entering into certain contracts, incurring certain indebtedness and expenditures, paying dividends, repurchasing stock and taking other specified actions. The transaction is subject to DST stockholder approval, clearances by the relevant regulatory authorities and other customary closing conditions and is currently expected to close by the end of the second quarter 2018; however, there can be no assurances as to the actual closing or the timing of the closing. Consummation of the proposed Merger would constitute a change of control of DST under the partnership agreement of IFDS L.P. and, as a result, the other partner would have the option to purchase our interests in IFDS L.P. at a price equal to book value, unless another purchase provision in the partnership agreement was triggered prior to the change of control.
In March 2017, we acquired State Street’s ownership interests in our joint ventures BFDS and IFDS U.K., as well as other investments and real estate held by IFDS L.P. The BFDS acquisition was effectuated through a non-taxable exchange of our State Street common stock with a fair value of $163.4 million for State Street’s ownership interest in BFDS. We also acquired State Street’s ownership interest in IFDS U.K., and IFDS L.P.’s ownership in IFDS Percana and IFDS Realty U.K. for total cash consideration of $234.9 million.
In May 2017, we completed the sale of our U.K. Customer Communications business for cash consideration of $43.6 million. We recorded a pretax gain of $2.6 million on the sale during 2017. We sold our North American Customer Communications business for cash consideration of $410.7 million on July 1, 2016 and we recorded a pretax gain of $341.5 million on the sale in 2016. We have classified the results of the businesses sold as discontinued operations in our Consolidated Statements of Income for all periods presented. The net after-tax proceeds from these sales are being used in accordance with the Company’s capital plan, including investments in the business, share repurchases, strategic acquisitions, debt repayments and other corporate purposes, subject to the restrictions set forth in the Merger Agreement with SS&C.
Beginning in 2017, DST established a new reportable segment structure that reflects how management is now operating the business and making resource allocations following the acquisitions of IFDS U.K. and BFDS, as well as the recent reductions in non-core investment assets. The Company’s operating business units are now reported as three operating segments (Domestic Financial Services, International Financial Services and Healthcare Services). Prior periods have been revised to reflect the new reportable operating segments.
Domestic Financial Services Segment
Through the Domestic Financial Services segment, we provide investor, investment, advisor/intermediary and asset distribution services to companies within the U.S. financial services industry. Utilizing our proprietary software applications, we offer our clients information processing solutions that enable them to capture, analyze and report their investors’ transactions including direct and intermediary sales of mutual funds, alternative investments, securities brokerage accounts and retirement plans. Examples of the services we provide include tracking of purchases, redemptions, exchanges and transfers of shares; maintaining investor identification and ownership records; reconciling cash and share activity; processing dividends; reporting sales; and performing tax and other compliance functions. We also support full reporting to investors for confirmations, statements and tax forms, web access, and electronic delivery of documents.
Services are provided either on a Remote or BPO basis utilizing our proprietary software applications. Our BPO service offerings are enhanced by our proprietary workflow software, which is also licensed separately to third parties.
Domestic Financial Services fees are primarily charged to the client based on the number of accounts, participants or transactions processed. For subaccounts, a portion of the services we provide for registered accounts are provided directly by the broker/dealer. As a result, our revenue per account is generally higher for registered accounts than for subaccounts. On a more limited basis, we also generate revenue through asset-based fee arrangements and from investment earnings related to cash balances maintained in our full service transfer agency bank accounts. We typically have multi-year agreements with our clients. We are continuing to monitor changes in the financial services industry, including the shift from direct products to fee-based platforms which could reduce the number of direct mutual fund registered accounts we service.
In December 2017, we entered into a ten year contract with a new client to provide both mutual fund and retirement servicing solutions. Based on current volumes, the client is expected to convert approximately 2.0 million registered accounts and 0.3 million retirement accounts onto our platforms during mid to late 2019. This new client currently performs their processing in-house and in order to assist the new client with covering the costs to transition to our platforms we have agreed to pay them $13.0 million in transition assistance during the conversion, of which $2.0 million was paid in December 2017. The total amounts will be amortized as a reduction to revenue over the course of the ten year contractual term.
Additionally in December 2017, we renewed our largest Domestic Financial Services client to a new seven year contract. Based upon our new rate structure, we expect our operating revenue in 2018 associated with this client to be relatively consistent with the 2017 revenue.
24
As part of the continuing strategic review of our operations, we decided not to renew a long-term surety bond insurance agreement which expired in December 2017 as the proposed revised terms were no longer economically advantageous. This agreement historically generated approximately $14.0 million of annual revenue.
On February 24, 2016, we acquired all of the membership interests of Kaufman Rossin Fund Services LLC (“KRFS”), an independent, full-service provider of specialized hedge fund administration services to the global financial community. KRFS’ hedge fund services include accounting and valuation, back-office outsourcing, investor services, treasury services, and customized reporting.
During 2015, we acquired all of the membership interests of kasina LLC, a strategic advisory firm to the asset management industry, and Red Rocks Capital LLC, an asset manager which focuses on listed private equity and other private asset investments. In 2015, we also acquired all of the outstanding common stock of Wealth Management Systems Inc., a provider of technology-based rollover services in the retirement marketplace.
In December 2015, we entered into a ten year contract with a new client to provide both subaccounting and mutual fund servicing solutions. The client converted approximately 10.0 million subaccounts onto our platform during 2016 and converted approximately 2.6 million registered accounts onto our platform during the third quarter of 2017.
International Financial Services Segment
We offer investor and policyholder administration and technology services on a Remote and BPO basis in the U.K. and, through our joint venture IFDS L.P., in Canada, Ireland, and Luxembourg. Additionally, in Australia and in the U.K., we provide solutions related to participant accounting and recordkeeping for wealth management, “wrap platforms” and retirement savings (“superannuation”) industries/markets through use of our wealth management platform and our life and pension administration system.
Our primary clients are mutual fund managers, insurers and platform providers. International Financial Services fees are primarily charged to the client based on the number of accounts or transactions processed. We also realize revenues from fixed-fee license agreements that include provisions for ongoing support and maintenance and for additional license payments in the event that usage increases. Additionally, we derive professional service revenues from fees for implementation services, custom programming and data center operations. We typically have multi-year agreements with our clients.
In November 2016, we sold a wholly-owned foreign subsidiary that provides water billing software and services solutions for cash consideration of approximately $6.1 million. This business had approximately $5.4 million of operating revenue and $1.2 million of operating income on an annual basis. As these decisions were the result of a tactical review of our products and services, and not the result of a significant shift in strategic direction, the revenue and operating income from these products and services are included within our continuing operations.
During 2017, we reached a termination agreement with a wealth management platform client who had engaged us for a multi-year development and implementation effort as well as post-implementation services. The termination agreement resulted in incremental operating revenues of $93.2 million for the year ended December 31, 2017 as we accelerated recognition of previously deferred revenue and recognized termination payments received. Additionally, our International Financial Services segment has been notified that two of our clients, which have collectively contributed approximately $33.0 million of annual revenue, will be migrating off our FAST platform in stages through the end of 2018.
Healthcare Services Segment
The Healthcare Services segment uses our proprietary software applications to provide healthcare organizations a variety of medical and pharmacy benefit solutions to satisfy their information processing, quality of care, cost management concerns and payment integrity programs, while achieving compliance and improving operational efficiencies. Our healthcare solutions include claims adjudication, benefit management, care management, business intelligence and other ancillary services. We also continue to expand and enhance our Healthcare Services’ offerings to ensure we are able to address the changing needs of our clients within the complex and highly regulated health industries which we serve. For example, our pharmacy management business continues to make investments to expand our clinical, network, and analytic capabilities to help our clients and prospective clients achieve the best possible outcomes for their members and to allow us to more effectively compete in the broader competitive pharmacy benefit manager (“PBM”) market. Historically, we have acted as an agent within our pharmacy-solutions business and, accordingly, recognized revenue on a net basis. As our enhanced products evolve and we expand our pharmacy-solutions service offerings, we will evaluate the provisions within our new pharmacy network and client contracts to determine whether we are acting as a principal or an agent in the transactions. If we determine that we are acting as a principal in the transactions, we will report the transactions on a gross basis, resulting in significantly higher revenues and costs reflected within our consolidated financial statements.
25
We generally derive revenue from our pharmacy-solutions business on a transactional fee basis. Fees are earned on pharmacy claims processing and payments services, pharmacy and member call center services, pharmaceutical rebate administration, administration or management of clinical programs, pharmacy network management, member and plan web services and management information and reporting. Further, revenues include investment earnings related to client cash balances maintained in our bank accounts. Medical claim processing revenues are generally derived from fees charged on a per member/per month basis or transactional basis. We also realize revenue from fixed-fee license agreements that include provisions for ongoing support and maintenance and for additional license payments in the event that usage or members increase. Additionally, we derive professional service revenues from fees for implementation services, custom programming and data center operations.
During 2017, we renewed our pharmacy services contract with our Healthcare Services segment’s third largest client extending the term of the contract through December 31, 2020. As previously announced, two of our Healthcare Services clients transitioned their services off our systems during 2017. Additionally, we have been notified that one of our largest Healthcare Services clients, which contributed approximately $50.0 million of annual revenue, will be migrating off our medical claims processing platform in stages through the end of 2019.
Seasonality
Generally, we do not have significant seasonal fluctuations in our business operations. Processing volumes for mutual fund clients within our Domestic and International Financial Services segment are usually highest during the quarter ended March 31 due primarily to processing year-end transactions during January. We have historically added operating equipment in the last half of the year in preparation for processing year-end transactions, which has the effect of increasing costs for the second half of the year. Revenues and operating results from individual license sales vary depending on the timing and size of the contracts.
New Authoritative Accounting Guidance
See Item 8, Financial Statements and Supplementary Data - Note 2, “Significant Accounting Policies - New authoritative accounting guidance.”
Critical Accounting Policies and Estimates
The following discussion and analysis of our financial condition, results of operations and cash flows are based upon our consolidated financial statements, which have been prepared in accordance with GAAP. The preparation of these consolidated financial statements requires us to make estimates and judgments that affect the reported amounts of assets, liabilities, revenues and expenses and related disclosures of contingent assets and liabilities. We base our estimates on historical experience and on various other assumptions that are believed to be reasonable under the circumstances, the results of which form the basis for making judgments about the carrying values of assets and liabilities that are not readily apparent from other sources. Actual results may differ from these estimates under different assumptions or conditions.
We believe the following critical accounting policies affect our more significant judgments and estimates used in the preparation of our consolidated financial statements: revenue recognition; software capitalization and amortization; depreciation of fixed assets; valuation of long-lived and intangible assets and goodwill; accounting for investments; and accounting for income taxes.
Revenue recognition
We recognize revenue when it is realized or realizable and it is earned. The majority of our revenues are derived from computer processing and services and are recognized upon completion of the services provided. Software license fees, maintenance fees and other ancillary fees are recognized as services are provided or delivered and all client obligations have been met. We generally do not have payment terms from clients that extend beyond one year. Billing for services in advance of performance is recorded as deferred revenue.
We recognize revenue when the following criteria are met: 1) persuasive evidence of an arrangement exists; 2) delivery has occurred or services have been rendered; 3) the sales price is fixed or determinable; and 4) collectability is reasonably assured. If there is a client-specific acceptance provision in a contract or if there is uncertainty about client acceptance, the associated revenue is deferred until we have evidence of client acceptance.
Revenue arrangements with multiple deliverables are evaluated to determine if the deliverables (items) can be divided into more than one unit of accounting. An item can generally be considered a separate unit of accounting if both of the following criteria are met: 1) the delivered item(s) has value to the client on a standalone basis and 2) if the arrangement includes a general right of return relative to the delivered item(s), delivery or performance of the undelivered item(s) is considered probable and substantially in our control. Once separate units of accounting are determined, the arrangement consideration
26
should be allocated at the inception of the arrangement to all deliverables using the relative selling price method. Relative selling price is obtained from sources such as vendor-specific objective evidence, which is based on the separate selling price for that or a similar item or from third-party evidence such as how competitors have priced similar items. If such evidence is unavailable, we use our best estimate of the selling price, which includes various internal factors such as our pricing strategy and market factors.
We derive over 90% of our revenues as a result of providing processing and services under contracts. The majority of our fees are billed on a monthly basis, generally with thirty-day collection terms. Revenues are recognized for monthly processing and services upon performance of the services.
Our standard business practice is to bill monthly for development, consulting and training services on a time and materials basis. In some cases we bill a fixed fee for development and consulting services. For fixed fee arrangements, we recognize revenue on a “proportionate performance” basis. We periodically provide upfront cash payments to our clients to assist with the significant upfront costs associated with converting to new systems. Such payments are treated as a reduction of revenue over the term of the related contract.
We derive less than 10% of our revenues from licensing products. We license our wealth management products, life and pension administration system, AWD products and healthcare administration processing software solutions. Perpetual software license revenues are recognized at the time the contract is signed, the software is delivered and no future software obligations exist. Deferral of software license revenue billed results from delayed payment provisions, disproportionate discounts between the license and other services or the inability to unbundle certain services. Term software license revenues are recognized ratably over the term of the license agreement. While license fee revenues are not a significant percentage of our total operations, they can significantly impact earnings in the period in which they are recognized. Revenues from individual license sales depend heavily on the timing, size and nature of the contract. We recognize revenues for maintenance services ratably over the contract term, after collectability has been reasonably assured.
We may enter into arrangements with broker/dealers or other third parties to sell or market closed-end fund shares. Depending on the arrangement, we may earn distribution fees for marketing and selling the underlying fund shares. Conversely, we may incur distribution expenses, including structuring fees, finders’ fees and referral fees paid to unaffiliated broker/dealers or introducing parties for marketing and selling underlying fund shares of a closed-end fund we sponsor. While distribution revenues and expenses are not significant percentages of our operating revenues or costs and expenses, they can significantly impact operations and earnings in the period in which they are recognized.
We have entered into various agreements with related parties, principally unconsolidated affiliates, under which we have historically provided data processing and software services. We believe that the terms of our contracts with related parties are fair to us and are no less favorable than those obtained from unaffiliated parties.
We assess collection based on a variety of factors, including past collection history with the client and the credit-worthiness of the client. We generally do not request collateral from our client. If we determine that collection of revenues is not reasonably assured, revenue is deferred and is recognized at the time it becomes reasonably assured, which is generally upon receipt of cash. Allowances for billing adjustments and bad debt expense are estimated as revenues are recognized. Allowances for billing adjustments are recorded as reductions in revenues and bad debt expense is recorded within Costs and expenses. The annual amounts for these items are generally immaterial to our consolidated financial statements.
Software capitalization and amortization
We make substantial investments in software to enhance the functionality and facilitate the delivery of our processing services as well as our sale of licensed products. Purchased software is recorded at cost and is amortized on a straight-line basis over the estimated economic life, which is generally three to five years. We develop a large portion of our software internally. We capitalize software development costs for computer software developed or obtained for internal use after the preliminary project phase has been completed and management has committed to funding the project. For computer software to be sold, leased or otherwise marketed to third parties, we capitalize software development costs which are incurred after the products reach technological feasibility but prior to the general release of the product to clients. The capitalized software development costs are generally amortized on a straight-line basis over the estimated economic life, which is generally three to five years.
Significant management judgment is required in determining what projects and costs associated with software development will be capitalized and in assigning estimated economic lives to the completed projects. Management specifically evaluates software development projects and analyzes the percentage of completion as compared to the initial plan and subsequent forecasts, milestones achieved and the commitment to continue funding the projects. Significant changes in any of these items may result in discontinuing capitalization of development costs, as well as immediately expensing previously capitalized costs. We review, on a quarterly basis, our capitalized software for possible impairment.
27
Depreciation of fixed assets
For personal property, we generally prefer to own rather than lease the property when practicable. We believe this approach provides us with better flexibility for disposing or redeploying the asset as it nears the completion of its economic life. We depreciate technology equipment using accelerated depreciation methods over the following lives: (1) non-mainframe equipment—three years; (2) mainframe central processing unit—four years; and (3) mainframe direct access storage devices—five years. We depreciate furniture and fixtures over estimated useful lives, principally three to five years, using accelerated depreciation methods. We depreciate leasehold improvements using the straight-line method over the lesser of the term of the lease or life of the improvements. Management judgment is required in assigning economic lives to fixed assets. Management specifically analyzes fixed asset additions, remaining net book values and gain/loss upon disposition of fixed assets to determine the appropriateness of assigned economic lives. Significant changes in any of these items may result in changes in the economic life assigned and the resulting depreciation expense.
Valuation of long-lived and intangible assets and goodwill
Goodwill and indefinite-lived intangible assets are not amortized but are evaluated for impairment. We evaluate the impairment of goodwill at least annually (as of October 1) and evaluate identifiable intangibles, long-lived assets and related assets whenever events or changes in circumstances indicate that the carrying value may not be recoverable. Factors that could trigger an impairment review include the following: significant under-performance relative to expected historical or projected future operating results; significant changes in the manner of our use of the acquired assets or our strategy for the overall business; and significant negative industry or economic trends. When it is determined that the carrying value of intangibles, long-lived assets or goodwill may not be recoverable based upon the existence of one or more of the above indicators of impairment, we assess actual impairment based on cash flows.
Our assessment of goodwill for impairment may first include a qualitative assessment that considers various factors, including those described above as well as growth in operating revenues and income from operations of our reporting units since our last quantitative assessment. A quantitative assessment is performed if the qualitative assessment indicates that it is more likely than not that the fair value of a reporting unit is less than its carrying amount or if a qualitative assessment is not performed.
Our quantitative assessment of goodwill for impairment includes comparing the fair value of a reporting unit with its net book value, including goodwill. We estimate fair value using a combination of discounted cash flow models and market approaches. If the fair value of a reporting unit exceeds its net book value, goodwill of the reporting unit is considered not impaired. If the net book value of a reporting unit exceeds its fair value, we recognize an impairment loss equal to the excess, limited to the total amount of goodwill allocated to that reporting unit. After a goodwill impairment loss is recognized, the adjusted carrying amount of goodwill becomes its new accounting basis.
Our 2017, 2016 and 2015 annual goodwill impairment tests determined that goodwill was not impaired, except during 2016 for the goodwill held at the Customer Communications U.K. reporting unit, which is included as a component of discontinued operations, as further described in Item 8, Financial Statements and Supplemental Data - Note 4, “Discontinued Operations.”
Accounting for investments
We have four significant types of investments: 1) investments in available-for-sale securities; 2) investments in unconsolidated affiliates, which are comprised principally of IFDS L.P. and certain real estate joint ventures; 3) investments in private equity funds and other investments accounted for under the cost method; and 4) seed capital investments accounted for at fair value.
We account for investments in entities in which we own less than 20% and do not have significant influence in accordance with authoritative guidance related to accounting for certain investments in debt and equity securities, which requires us to designate our investments as trading or available-for-sale. Available-for-sale securities are reported at fair value with unrealized gains and losses excluded from earnings and recorded net of deferred taxes directly to Accumulated other comprehensive income within Stockholders’ equity.
We regularly review investment securities for impairment based on both quantitative and qualitative criteria that include the extent to which cost exceeds fair value, the duration of any market decline, and the financial health of and specific prospects for the issuer. We record an investment impairment charge for an investment with a gross unrealized holding loss resulting from a decline in value that is other than temporary. Future adverse changes in market conditions or poor operating results of underlying investments could result in losses or an inability to recover the carrying value of the investments that may not be reflected in an investment’s current carrying value, thereby possibly requiring an impairment charge in the future, which could have a material effect on our financial position.
The equity method of accounting is used for investments in entities, partnerships and similar interests (including investments in private equity funds where we are the limited partner) in which we have significant influence but do not control. We classify
28
these investments as unconsolidated affiliates. Under the equity method, we recognize income or losses from our pro-rata share of these unconsolidated affiliates’ net income or loss, which changes the carrying value of the investment of the unconsolidated affiliate. In certain cases, pro-rata losses are recognized only to the extent of our investment and advances to the unconsolidated affiliate.
The cost method of accounting is used for these investments when we have a de minimis ownership percentage and do not have significant influence. Our cost method investments are held at the lower of cost or market.
Accounting for income taxes
We account for income taxes payable or refundable for the current year and deferred tax liabilities and assets for the future tax consequences of events that have been recognized in an entity’s financial statements or tax returns. Judgment is required in addressing the future tax consequences of events that have been recognized in our consolidated financial statements or tax returns (e.g., realization of deferred tax assets, changes in tax laws or interpretations thereof).
On December 22, 2017, the United States enacted tax reform legislation commonly known as the Tax Cuts and Jobs Act (the “Tax Act”), resulting in significant modifications to existing U.S. tax law, including but not limited to, (1) lowering the corporate federal income tax rate from 35% to 21% effective January 1, 2018; (2) eliminating the domestic production activity deduction; (3) implementing a territorial tax system; and (4) imposing a one-time repatriation tax on deemed repatriated earnings of foreign subsidiaries. The SEC staff issued Staff Accounting Bulletin 118 (“SAB 118”) which provides additional clarification in situations where we do not have the necessary information available, prepared, or analyzed in reasonable detail to complete the accounting for certain income tax effects of the Tax Act for the reporting period in which the Tax Act was enacted. We have recognized the provisional tax impacts, based on reasonable estimates, related to the one-time deemed mandatory repatriation of post-1986 undistributed foreign subsidiary earnings and profits through the year ended December 31, 2017 (“Transition Tax”) and the revaluation of deferred tax assets and liabilities and has included these amounts in its consolidated financial statements for the year ended December 31, 2017. The ultimate impact may differ from these provisional amounts, possibly materially, due to among other things, additional analysis, changes in interpretations and assumptions we have made, additional regulatory guidance that may be issued, and actions we may take as a result of the Tax Act. We intend to complete our accounting under the Tax Act within the measurement period set forth in SAB 118.
In addition, we are subject to examination of our income tax returns by the Internal Revenue Service (“IRS”) and other tax authorities. A change in the assessment of the outcomes of such matters could materially impact our consolidated financial statements. The calculation of tax liabilities involves dealing with uncertainties in the application of complex tax regulations. We recognize liabilities for potential tax exposures based on our estimate of whether, and the extent to which, additional taxes may be required. If we ultimately determine that payment of these amounts is unnecessary, then we reverse the liability and recognize a tax benefit during the period in which we determine that the liability is no longer necessary. We also recognize tax benefits to the extent that it is more likely than not that our positions will be sustained if challenged by the taxing authorities. To the extent we prevail in matters for which liabilities have been established, or are required to pay amounts in excess of our liabilities, our effective tax rate in a given period may be materially affected. An unfavorable tax settlement would require cash payments and may result in an increase in our effective tax rate in the year of resolution. A favorable tax settlement would be recognized as a reduction in our effective tax rate in the year of resolution. We report interest and penalties related to uncertain income tax positions within income tax expense.
29
Results of Operations
The following table summarizes our consolidated operating results (in millions). Additional information regarding our segments is included below under the caption, “Year to Year Business Segment Comparisons.”
Change | |||||||||||||||||||||||||
Year Ended December 31, | 2017 vs 2016 | 2016 vs 2015 | |||||||||||||||||||||||
2017 | 2016 | 2015 | $ | % | $ | % | |||||||||||||||||||
Operating revenues | $ | 2,086.7 | $ | 1,474.4 | $ | 1,405.0 | $ | 612.3 | 41.5 | % | $ | 69.4 | 4.9 | % | |||||||||||
Out-of-pocket reimbursements | 131.5 | 82.3 | 69.0 | 49.2 | 59.8 | % | 13.3 | 19.3 | % | ||||||||||||||||
Total revenues | 2,218.2 | 1,556.7 | 1,474.0 | 661.5 | 42.5 | % | 82.7 | 5.6 | % | ||||||||||||||||
Costs and expenses | 1,805.0 | 1,213.4 | 1,150.2 | 591.6 | 48.8 | % | 63.2 | 5.5 | % | ||||||||||||||||
Depreciation and amortization | 128.0 | 96.0 | 91.1 | 32.0 | 33.3 | % | 4.9 | 5.4 | % | ||||||||||||||||
Operating income | 285.2 | 247.3 | 232.7 | 37.9 | 15.3 | % | 14.6 | 6.3 | % | ||||||||||||||||
Interest expense | (26.8 | ) | (23.5 | ) | (23.8 | ) | (3.3 | ) | (14.0 | )% | (0.3 | ) | (1.3 | )% | |||||||||||
Gain on sale of business | — | 5.5 | — | (5.5 | ) | (100.0 | )% | 5.5 | 100.0 | % | |||||||||||||||
Other income, net | 219.0 | 22.7 | 204.5 | 196.3 | 864.8 | % | (181.8 | ) | (88.9 | )% | |||||||||||||||
Equity in earnings of unconsolidated affiliates | 54.5 | 27.2 | 45.4 | 27.3 | 100.4 | % | (18.2 | ) | (40.1 | )% | |||||||||||||||
Income from continuing operations before income taxes and non-controlling interest | 531.9 | 279.2 | 458.8 | 252.7 | 90.5 | % | (179.6 | ) | (39.1 | )% | |||||||||||||||
Income taxes | 84.3 | 101.1 | 149.2 | (16.8 | ) | (16.6 | )% | (48.1 | ) | (32.2 | )% | ||||||||||||||
Net income from continuing operations before non-controlling interest | 447.6 | 178.1 | 309.6 | 269.5 | 151.3 | % | (131.5 | ) | (42.5 | )% | |||||||||||||||
Income from discontinued operations, net of tax | 4.5 | 248.3 | 48.5 | (243.8 | ) | (98.2 | )% | 199.8 | 412.0 | % | |||||||||||||||
Net income | 452.1 | 426.4 | 358.1 | 25.7 | 6.0 | % | 68.3 | 19.1 | % | ||||||||||||||||
Net (income) loss attributable to non-controlling interest | (0.6 | ) | 0.9 | 0.1 | (1.5 | ) | (166.7 | )% | 0.8 | 800.0 | % | ||||||||||||||
Net income attributable to DST Systems, Inc. | $ | 451.5 | $ | 427.3 | $ | 358.2 | $ | 24.2 | 5.7 | % | $ | 69.1 | 19.3 | % | |||||||||||
Revenues
Consolidated total revenues (including out-of-pocket (“OOP”) reimbursements) increased $661.5 million or 42.5% during the year ended December 31, 2017 as compared to the year ended December 31, 2016 and increased $82.7 million or 5.6% during the year ended December 31, 2016 as compared to the year ended December 31, 2015. Consolidated operating revenues increased $612.3 million or 41.5% in 2017 as compared to 2016 primarily due to the acquisition of the remaining interests in BFDS and IFDS U.K. in 2017 which collectively contributed $601.8 million of incremental operating revenue during 2017. Consolidated operating revenues increased $69.4 million or 4.9% in 2016 as compared to 2015 primarily as a result of the acquisitions of KRFS in February 2016, Red Rocks Capital LLC in July 2015 and Wealth Management Systems Inc. in August 2015.
Prior to the acquisitions of BFDS and IFDS U.K., we received revenues for processing services and products provided under agreements with these entities. Our operating revenues derived from sales to these entities were $138.5 million and $134.9 million for the years ended December 31, 2016, and 2015, respectively, and $35.2 million in the first quarter of 2017. The operating results of BFDS and IFDS U.K. were consolidated within our operating results subsequent to the acquisition dates.
Consolidated OOP reimbursements increased $49.2 million or 59.8% in 2017 as compared to 2016 and increased $13.3 million or 19.3% in 2016 as compared to 2015. The increase in consolidated OOP reimbursements in 2017 is primarily attributable to the acquisition of the remaining interests in BFDS and IFDS U.K. The increase in consolidated OOP reimbursements in 2016 is primarily attributable to increased client volumes in the Domestic Financial Services segment.
30
Costs and expenses
Consolidated costs and expenses (including OOP reimbursements) increased $591.6 million or 48.8% in 2017 as compared to 2016 and increased $63.2 million or 5.5% in 2016 as compared to 2015. Costs and expenses are primarily comprised of compensation and benefit costs, reimbursable operating expenses, information technology spend and professional fees. Reimbursable operating expenses included in costs and expenses were $131.5 million, $82.3 million and $69.0 million in 2017, 2016 and 2015, respectively. Excluding reimbursable operating expenses, costs and expenses increased $542.4 million in 2017 as compared to 2016 and increased $49.9 million in 2016 as compared to 2015.
The increase in costs and expenses in 2017, exclusive of reimbursable expenses, is primarily attributable to the consolidation of BFDS and IFDS U.K. following the acquisitions of the remaining interests in these entities during 2017. Share-based compensation expense increased $31.4 million during the year ended December 31, 2017 primarily driven by the prior year reversal of accrued performance-related share-based compensation expense as 2015 PSUs were not expected to achieve the required performance criteria combined with increased share-based compensation expense in 2017 related to 2016 and 2017 PSUs that are currently expected to vest at a higher conversion rate than target. In addition, we recorded increased bad debt expense and a significant charitable contribution transaction in 2017.
As a result of changes in our business environment, including the transition of certain Health Services clients off of our systems, the termination of a wealth management client in the International Financial Services segment, and the acquisitions of the remaining interests in BFDS and IFDS U.K., we have implemented restructuring initiatives to right-size our organization and enhance operational efficiencies, as well as achieve synergies from our recent acquisitions. During the year ended December 31, 2017, we incurred pretax restructuring charges primarily related to employee terminations and related costs of $23.4 million in Costs and expenses. Annualized savings achieved from the actions taken from March 2017 through October 2017 are currently expected to be approximately $22.0 million within the Domestic Financial Services segment, approximately $7.0 million within the International Financial Services segment and approximately $13.0 million within the Healthcare Services segment.
During the years ended December 31, 2016 and 2015, we incurred $10.4 million and $3.4 million of pretax restructuring charges, respectively.
Depreciation and amortization
Consolidated depreciation and amortization increased $32.0 million or 33.3% during the year ended December 31, 2017 as compared to the year ended December 31, 2016 primarily as a result of the acquisitions of the remaining interests in BFDS and IFDS U.K. and increased $4.9 million or 5.4% during the year ended December 31, 2016 as compared to the year ended December 31, 2015 primarily as a result of the acquisition of KRFS.
Operating income
Consolidated operating income increased $37.9 million or 15.3% to $285.2 million during the year ended December 31, 2017 as compared to 2016 and increased $14.6 million or 6.3% to $247.3 million during the year ended December 31, 2016 as compared to 2015.
Interest expense
Interest expense was $26.8 million, $23.5 million and $23.8 million during the years ended December 31, 2017, 2016 and 2015, respectively. Interest expense increased 14.0% during 2017 as compared to 2016 primarily due to higher borrowings as a result of the acquisition of IFDS U.K. and higher borrowing rates on the $350.0 million of debt issued in the fourth quarter of 2017. Interest expense decreased 1.3% during 2016 as compared to 2015 primarily from lower weighted average debt balances outstanding.
Gain on sale of business
On November 1, 2016, we sold DST Billing Solutions Limited (“Billing Solutions”) for cash consideration of approximately $6.1 million. Operating revenue and income generated for the Billing Solutions business sold was approximately $4.0 million and $0.7 million, respectively, for the year ended December 31, 2016. We recorded a pretax gain of $5.5 million on the sale of the business during 2016.
31
Other income, net
The components of other income, net are as follows (in millions):
Year Ended December 31, | |||||||||||
2017 | 2016 | 2015 | |||||||||
Net realized gains from the disposition of available-for-sale securities | $ | 155.9 | $ | 2.3 | $ | 168.4 | |||||
Net gain on previously held equity interests | 43.8 | — | — | ||||||||
Net gain on private equity funds and other investments | 15.4 | 16.5 | 35.7 | ||||||||
Dividend income | 3.5 | 5.8 | 8.3 | ||||||||
Miscellaneous items | 0.4 | (1.9 | ) | (7.9 | ) | ||||||
Other income, net | $ | 219.0 | $ | 22.7 | $ | 204.5 | |||||
Included in the net realized gains from the disposition of available-for-sale securities during 2015 were gains of $157.3 million from the sale of approximately 2.3 million shares of State Street common stock as compared to no sales of State Street shares during 2016. We recognized a realized gain of $145.1 million from the exchange of State Street common stock for the remaining interests in BFDS in 2017. We also recognized a realized gain of $10.4 million from the charitable contribution of our remaining State Street shares in 2017. Additionally, as a result of the 2017 acquisitions, we recorded a net pretax gain of $43.8 million on the step-up of our previous 50% ownership interests in BFDS and IFDS U.K. during the year ended December 31, 2017.
We recorded a net gain on private equity funds and other investments of $15.4 million, $16.5 million and $35.7 million during the years ended December 31, 2017, 2016 and 2015, respectively, primarily due to distributions received from certain of our private equity fund investments resulting in realized gains. Future adverse changes in market conditions or poor operating results of underlying investments could result in losses or an inability to recover the carrying value of the investments and may require an impairment charge in the future, which could have a material effect on our net income.
We receive dividend income from certain investments held. The decline in dividend income for the year ended December 31, 2017 was primarily driven by our reduction of our investment in State Street common stock in March 2017. Dividends received from State Street common stock were $0.1 million, $3.1 million and $3.2 million for the years ended December 31, 2017, 2016 and 2015, respectively.
Equity in earnings of unconsolidated affiliates
Equity in earnings of unconsolidated affiliates is as follows (in millions):
Year Ended December 31, | |||||||||||
2017 | 2016 | 2015 | |||||||||
International Financial Data Services U.K. | $ | 1.0 | $ | 10.0 | $ | 22.5 | |||||
International Financial Data Services L.P. | 18.3 | 2.2 | 7.4 | ||||||||
Boston Financial Data Services, Inc. | 3.6 | 8.3 | 5.3 | ||||||||
Other unconsolidated affiliates | 31.6 | 6.7 | 10.2 | ||||||||
Total | $ | 54.5 | $ | 27.2 | $ | 45.4 | |||||
Equity in earnings of IFDS U.K. decreased $9.0 million during the year ended December 31, 2017, as compared to 2016, primarily as a result of the discontinuation of equity method accounting subsequent to our acquisition of the remaining interests in IFDS U.K. Equity in earnings of IFDS U.K. decreased $12.5 million during the year ended December 31, 2016, as compared to 2015, primarily attributable to lower revenues recognized related to client conversion activities and higher operating costs as IFDS U.K. expanded its infrastructure to address increasing regulatory, compliance and security needs.
Equity in earnings of IFDS L.P. increased $16.1 million during the year ended December 31, 2017, as compared to 2016, primarily as a result of $10.2 million of realized gains on the step-up of certain investments and real estate assets that were distributed from the joint venture to DST and State Street immediately prior to the acquisitions by DST of the remaining interests in IFDS U.K. and BFDS. Equity in earnings of IFDS L.P. decreased $5.2 million during the year ended December 31, 2016, as compared to 2015.
Equity in earnings of BFDS decreased $4.7 million during the year ended December 31, 2017 as compared to 2016. The decrease was primarily as a result of the discontinuation of equity method accounting subsequent to the acquisition of the remaining interests in BFDS in March 2017. Equity in earnings of BFDS increased $3.0 million during the year ended
32
December 31, 2016 as compared to 2015. The increase was primarily attributable to higher ancillary and non-operating revenues as well as a reduction in operating costs.
Our equity in earnings of other unconsolidated affiliates was $31.6 million during the year ended December 31, 2017, an increase of $24.9 million as compared to 2016. The increase was primarily due to a $23.0 million increase resulting from a gain on the step-up of real estate distributed from Broadway Square Partners, LLP (“Broadway Square Partners”), an unconsolidated affiliate, during 2017. Our equity in earnings of other unconsolidated affiliates was $6.7 million during the year ended December 31, 2016, a decrease of $3.5 million as compared to 2015. The decrease was primarily due to a $3.6 million gain resulting from the sale of real estate by an unconsolidated affiliate during 2015.
As of December 31, 2017, approximately $40.8 million of our consolidated retained earnings represents undistributed earnings in our unconsolidated affiliates accounted for by the equity method of accounting.
Income taxes
Our effective tax rate was 15.8%, 36.2% and 32.5% for the years ended December 31, 2017, 2016 and 2015, respectively. Our income tax rate for 2017 was lower than the statutory federal income tax rate of 35% primarily due to the non-taxable nature of the BFDS exchange transaction, the impacts of the Tax Act, the adoption of new accounting guidance issued for tax benefits on employee share-based compensation transactions, benefits realized from the settlement of uncertain tax positions, and a change in the proportional mix of domestic and international transactions. The 2017 impact of the Tax Act was a $13.7 million tax benefit, primarily from the net impact of the revaluation of our deferred tax assets and liabilities utilizing the enacted tax rate at the time they are anticipated to be realized less the estimated tax associated with the deemed mandatory repatriation of undistributed accumulated foreign earnings. This reflects our current estimate of the U.S. income tax effects of the Tax Act, however these are provisional amounts subject to adjustment during the one year measurement period provided pursuant to guidance in SAB 118.
Our effective income tax rate for 2016 was higher than the statutory federal income tax rate of 35% primarily attributable to state income taxes, transaction related taxes, and a change in the proportional mix of domestic and international income, partially offset by federal income tax credits for foreign income taxes and research and development costs.
Our effective income tax rate for 2015 was favorably impacted by an $11.9 million benefit from the completion of the IRS examination of previously filed federal income tax refund claims for Domestic Manufacturing Deductions, research and experimentation credits and capital losses for 2010 as well as other remeasurements during the period.
Excluding the effect of discrete period items, we currently expect our effective tax rate to be approximately 26.5% in 2018. The 2018 tax rate can be affected as a result of variances among the estimates and amounts of 2018 sources of taxable income (e.g., domestic consolidated, joint venture and/or international), the realization of tax credits, adjustments which may arise from the resolution of tax matters under review, our assessment of our liability for uncertain tax positions, changes in interpretations and assumptions we have made, federal tax regulations and guidance that may be issued by the U.S. Department of the Treasury and actions we may take as a result of the Tax Act.
Income from discontinued operations, net of tax
Income from discontinued operations, net of tax decreased $243.8 million during the year ended December 31, 2017 as compared to 2016 and increased $199.8 million during the year ended December 31, 2016 as compared to 2015. The decrease during the year ended December 31, 2017 was primarily due to the sale of our North American Customer Communications business in July 2016, partially offset by the sale of our U.K. Customer Communications business in May 2017. The increase during the year ended December 31, 2016 was primarily attributable to the $234.7 million gain, net of tax, on the sale of our North American Customer Communications business partially offset by $17.0 million of goodwill and asset impairments in our U.K. Customer Communications business.
33
YEAR TO YEAR BUSINESS SEGMENT COMPARISONS
DOMESTIC FINANCIAL SERVICES SEGMENT
The following table presents the financial results of the Domestic Financial Services segment (in millions):
Change | |||||||||||||||||||||||||
Year Ended December 31, | 2017 vs 2016 | 2016 vs 2015 | |||||||||||||||||||||||
2017 | 2016 | 2015 | $ | % | $ | % | |||||||||||||||||||
Operating revenues | $ | 1,187.2 | $ | 995.8 | $ | 983.1 | $ | 191.4 | 19.2 | % | $ | 12.7 | 1.3 | % | |||||||||||
Out-of-pocket reimbursements | 111.8 | 73.0 | 60.7 | 38.8 | 53.2 | % | 12.3 | 20.3 | % | ||||||||||||||||
Total revenues | 1,299.0 | 1,068.8 | 1,043.8 | 230.2 | 21.5 | % | 25.0 | 2.4 | % | ||||||||||||||||
Costs and expenses | 1,072.2 | 829.0 | 792.3 | 243.2 | 29.3 | % | 36.7 | 4.6 | % | ||||||||||||||||
Depreciation and amortization | 86.8 | 77.3 | 67.7 | 9.5 | 12.3 | % | 9.6 | 14.2 | % | ||||||||||||||||
Operating income | $ | 140.0 | $ | 162.5 | $ | 183.8 | $ | (22.5 | ) | (13.8 | )% | $ | (21.3 | ) | (11.6 | )% | |||||||||
Operating margin | 11.8 | % | 16.3 | % | 18.7 | % | |||||||||||||||||||
The following table summarizes the Domestic Financial Services segment’s statistical metrics (in millions, except as noted):
December 31, | ||||||||||||
2017 | 2016 | 2015 | ||||||||||
Domestic mutual fund shareowner accounts processed: | ||||||||||||
Registered accounts - non tax-advantaged | 24.2 | 25.3 | 27.0 | |||||||||
IRA mutual fund accounts | 20.5 | 21.1 | 21.8 | |||||||||
Other retirement accounts | 7.8 | 8.0 | 8.2 | |||||||||
Section 529 and Educational IRAs | 7.8 | 7.5 | 8.4 | |||||||||
Registered accounts - tax-advantaged | 36.1 | 36.6 | 38.4 | |||||||||
Total registered accounts | 60.3 | 61.9 | 65.4 | |||||||||
Subaccounts | 46.2 | 42.1 | 31.3 | |||||||||
Total domestic mutual fund shareowner accounts processed | 106.5 | 104.0 | 96.7 | |||||||||
Defined contribution participant accounts | 7.2 | 6.8 | 7.0 | |||||||||
ALPS (in billions of U.S. dollars): | ||||||||||||
Assets Under Management | $ | 18.4 | $ | 17.2 | $ | 14.7 | ||||||
Assets Under Administration | $ | 225.9 | $ | 179.1 | $ | 140.4 | ||||||
34
Year Ended December 31, | |||||||||
2017 | 2016 | 2015 | |||||||
Changes in registered accounts: | |||||||||
Beginning balance | 61.9 | 65.4 | 68.8 | ||||||
New client conversions | 3.0 | 0.1 | — | ||||||
Subaccounting conversions to DST platforms | (0.9 | ) | (0.9 | ) | (1.8 | ) | |||
Subaccounting conversions to non-DST platforms | (1.0 | ) | (0.5 | ) | (1.1 | ) | |||
Conversions to non-DST platforms | (0.3 | ) | (0.7 | ) | (0.3 | ) | |||
Organic decline | (2.4 | ) | (1.5 | ) | (0.2 | ) | |||
Ending balance | 60.3 | 61.9 | 65.4 | ||||||
Changes in subaccounts: | |||||||||
Beginning balance | 42.1 | 31.3 | 28.6 | ||||||
New client conversions | 0.3 | 10.7 | — | ||||||
Conversions from non-DST registered platforms | 1.6 | — | 1.1 | ||||||
Conversions from DST’s registered accounts | 0.9 | 0.9 | 1.8 | ||||||
Conversions to non-DST platforms | (0.4 | ) | — | — | |||||
Organic growth (decline) | 1.7 | (0.8 | ) | (0.2 | ) | ||||
Ending balance | 46.2 | 42.1 | 31.3 | ||||||
Changes in defined contribution participant accounts: | |||||||||
Beginning balance | 6.8 | 7.0 | 7.2 | ||||||
New client conversions | 0.5 | — | 0.1 | ||||||
Organic decline | (0.1 | ) | (0.2 | ) | (0.3 | ) | |||
Ending balance | 7.2 | 6.8 | 7.0 | ||||||
Comparison of 2017 versus 2016 results
Operating revenues
Domestic Financial Services segment operating revenues of $1,187.2 million reflect an increase of $191.4 million or 19.2% in 2017 as compared to 2016. The increase in operating revenues during the year ended December 31, 2017 was primarily attributable to the acquisition of the remaining interest in BFDS, which contributed $176.6 million of incremental operating revenues. Excluding the BFDS operating revenues in 2017, operating revenues for the Domestic Financial Services segment for the year ended December 31, 2017 increased $14.8 million or 1.5%. This increase in operating revenues for the year ended December 31, 2017 was partially due to a $5.0 million increase in revenue at ALPS resulting from an insurance claim reimbursement of $2.0 million received in fourth quarter 2017 as compared to a reduction to ALPS revenue of $3.0 million during 2016 for the processing error that generated the insurance claim. In addition, operating revenues were higher as a result of increased fund flows and higher market performance at ALPS, partially offset by decreased revenues resulting from the exit of certain product offerings and lower subaccounting and mutual fund registered shareowner account processing revenues. Additionally, software license revenues were $17.7 million for the year ended December 31, 2017, a decrease of $3.9 million as compared to 2016.
Costs and expenses
Domestic Financial Services segment costs and expenses for the year ended December 31, 2017 were $1,072.2 million, an increase of $243.2 million as compared to 2016. Reimbursable operating expenses included in costs and expenses were $111.8 million in 2017, an increase of $38.8 million as compared to 2016.
Excluding reimbursable operating expenses, Domestic Financial Services costs and expenses increased $204.4 million or 27.0% for the year ended December 31, 2017 as compared to 2016. This increase was primarily attributable to $176.3 million of incremental costs and expenses from the consolidation of BFDS following the acquisition of the remaining interest in that entity in 2017 and higher share-based compensation expense which increased $25.2 million during the year ended December 31, 2017 as compared to the prior year.
35
In addition, costs and expenses increased from higher integration and restructuring costs related to our BFDS acquisition and higher information technology transformation spend partially offset by the non-recurrence of a software impairment recorded in 2016. We recorded restructuring charges of $16.3 million and $10.4 million during the years ended December 31, 2017 and 2016, respectively. During the year ended December 31, 2017, we also recognized $11.6 million of expense related to a charitable contribution of our remaining State Street stock.
Depreciation and amortization
Domestic Financial Services segment depreciation and amortization costs for the year ended December 31, 2017 were $86.8 million, an increase of $9.5 million or 12.3% as compared to 2016. The increase in 2017 was primarily attributable to incremental amortization associated with acquired intangibles from the recent acquisitions as well as increased depreciation from capitalized costs incurred to enhance our network infrastructure, security and regulatory compliance.
Operating income
Domestic Financial Services segment operating income for 2017 was $140.0 million, a decrease of $22.5 million or 13.8% as compared to 2016. The decrease in Domestic Financial Services operating income was primarily due to higher share-based compensation expense, higher advisory and restructuring costs due to the integration activities for the recently acquired BFDS business and increased depreciation and amortization expense. Operating income also decreased due to an increase in information technology transformation spend, partially offset by higher revenues.
Comparison of 2016 versus 2015 results
Operating revenues
Domestic Financial Services segment operating revenues of $995.8 million increased $12.7 million or 1.3% in 2016 as compared to 2015. The increase in operating revenues during the year ended December 31, 2016 as compared to the year ended December 31, 2015 was primarily driven from businesses acquired during 2015 and 2016, which contributed $31.8 million of incremental operating revenues. During 2016, we also completed the conversion of approximately 10.0 million subaccounts associated with a previously announced new client, which resulted in incremental revenues. These increases were partly offset by a decline in mutual fund registered shareowner account processing revenue due to lower registered accounts, primarily as a result of subaccounting conversions, and lower revenue due to extending certain long-term contracts with lower pricing. Additionally, software license revenues were $21.6 million for the year ended December 31, 2016, a decrease of $0.9 million as compared to 2015.
Costs and expenses
Domestic Financial Services segment costs and expenses for the year ended December 31, 2016 were $829.0 million, an increase of $36.7 million as compared to 2015. Reimbursable operating expenses included in costs and expenses were $73.0 million for the year ended December 31, 2016, an increase of $12.3 million as compared to 2015.
Excluding reimbursable operating expenses, Domestic Financial Services costs and expenses increased $24.4 million or 3.3% for the year ended December 31, 2016 as compared to 2015. On this basis, the increase in costs and expenses during 2016 was primarily from acquisitions completed during 2015 and 2016, which included approximately $33.7 million of incremental expenses. Also, contributing to the increase in costs and expenses were the restructuring activities, which resulted in $10.4 million of employee and lease termination costs during the year ended December 31, 2016 to enhance operational efficiency within the Domestic Financial Services segment. We also incurred increased costs to enhance the network infrastructure utilized across all of our operating businesses and incremental costs to service new and existing clients. During the year ended December 31, 2016, we also recognized a $6.0 million software impairment. These costs and expenses were partially offset by the reversal of accrued performance-related share-based compensation expense as 2015 PSUs were not expected to achieve the required performance criteria required for vesting and further savings realized from cost containment initiatives.
Depreciation and amortization
Domestic Financial Services segment depreciation and amortization costs for the year ended December 31, 2016 were $77.3 million, an increase of $9.6 million or 14.2% as compared to 2015. The increase in 2016 was primarily attributable to incremental amortization associated with acquired intangibles from the acquisitions completed in 2015 and 2016 as well as increased depreciation from capitalized costs incurred to enhance our network infrastructure and increase security and regulatory compliance. The increase in 2016 was also attributable to the acceleration of depreciation on certain capitalized software during 2016.
36
Operating income
Domestic Financial Services segment operating income for 2016 was $162.5 million, a decrease of $21.3 million or 11.6% as compared to 2015. The decrease in Domestic Financial Services operating income was primarily due to restructuring costs incurred during 2016, a software impairment charge, and increased costs incurred to enhance our network infrastructure, maintain security and regulatory compliance. These decreases were partially offset by the reversal of accrued performance-related share-based compensation expense, higher operating revenues and cost containment efforts during 2016.
INTERNATIONAL FINANCIAL SERVICES SEGMENT
The following table presents the financial results of the International Financial Services segment (in millions):
Change | |||||||||||||||||||||||||
Year Ended December 31, | 2017 vs 2016 | 2016 vs 2015 | |||||||||||||||||||||||
2017 | 2016 | 2015 | $ | % | $ | % | |||||||||||||||||||
Operating revenues | $ | 538.4 | $ | 110.9 | $ | 93.4 | $ | 427.5 | 385.5 | % | $ | 17.5 | 18.7 | % | |||||||||||
Out-of-pocket reimbursements | 12.2 | 1.2 | 1.7 | 11.0 | 916.7 | % | (0.5 | ) | (29.4 | )% | |||||||||||||||
Total revenues | 550.6 | 112.1 | 95.1 | 438.5 | 391.2 | % | 17.0 | 17.9 | % | ||||||||||||||||
Costs and expenses | 449.3 | 98.2 | 86.1 | 351.1 | 357.5 | % | 12.1 | 14.1 | % | ||||||||||||||||
Depreciation and amortization | 30.7 | 3.1 | 4.8 | 27.6 | 890.3 | % | (1.7 | ) | (35.4 | )% | |||||||||||||||
Operating income | $ | 70.6 | $ | 10.8 | $ | 4.2 | $ | 59.8 | 553.7 | % | $ | 6.6 | 157.1 | % | |||||||||||
Operating margin | 13.1 | % | 9.7 | % | 4.5 | % | |||||||||||||||||||
The following table summarizes the International Financial Services segment’s statistical metrics (in millions, except as noted):
December 31, | |||||||||
2017 | 2016 | 2015 | |||||||
International mutual fund shareowner accounts processed: | |||||||||
IFDS U.K. | 8.6 | 8.9 | 8.8 | ||||||
IFDS L.P. (Unconsolidated affiliate principally based in Canada) | 14.5 | 13.7 | 13.3 | ||||||
Total international mutual fund shareowner accounts processed | 23.1 | 22.6 | 22.1 | ||||||
Comparison of 2017 versus 2016 results
Operating revenues
International Financial Services segment operating revenues of $538.4 million reflect an increase of $427.5 million or 385.5% in 2017 as compared to 2016. The increase in operating revenues during the year ended December 31, 2017 was primarily driven by the acquisition of the remaining interest in IFDS U.K., which contributed $425.2 million of incremental operating revenues, including the financial impacts resulting from the termination of a wealth management client agreement. The termination agreement resulted in incremental operating revenues of $93.2 million for the year ended December 31, 2017 as DST accelerated recognition of previously deferred revenue and recognized termination payments received. Additionally, software license revenues were $12.5 million for the year ended December 31, 2017, an increase of $2.6 million as compared to 2016. These increases were partly offset by lower revenues as a result of the previously discussed client termination in mid-2017 as well as the sale of DST Billing Solutions during 2016.
Costs and expenses
International Financial Services segment costs and expenses for the year ended December 31, 2017 were $449.3 million, an increase of $351.1 million as compared to 2016. Costs and expenses in the International Financial Services segment are primarily comprised of compensation and benefit costs as well as technology-related expenditures. Reimbursable operating expenses included in costs and expenses were $12.2 million in 2017, an increase of $11.0 million as compared to 2016.
37
Excluding reimbursable operating expenses, International Financial Services costs and expenses increased $340.1 million for the year ended December 31, 2017 as compared to 2016 primarily due to the acquisition of the remaining interests in IFDS U.K. Additionally, in connection with the termination agreement described above, we incurred bad debt expense of $34.5 million for previously invoiced services performed prior to the termination and $5.2 million of other termination-related charges.
Depreciation and amortization
International Financial Services segment depreciation and amortization costs for the year ended December 31, 2017 were $30.7 million, an increase of $27.6 million as compared to 2016. The increase in 2017 was primarily attributable to incremental amortization of intangible assets and depreciation of fixed assets from the acquisition of the remaining interests in IFDS U.K.
Operating income
International Financial Services segment operating income for 2017 was $70.6 million, an increase of $59.8 million or 553.7% as compared to 2016. The increase in International Financial Services operating income was primarily due to the impact of the termination of the wealth management client agreement of $53.5 million, including the recognition of previously deferred revenue and termination payments received as described above. The increase in operating income was also due to the higher revenues resulting from the acquisition of the remaining interest in IFDS U.K., partially offset by higher costs and expenses due to on-going development and implementation efforts for wealth management platform clients, share-based compensation expense, and restructuring charges.
Comparison of 2016 versus 2015 results
Operating revenues
International Financial Services segment operating revenues of $110.9 million increased $17.5 million or 18.7% in 2016 as compared to 2015. The increase in operating revenues during the year ended December 31, 2016 as compared to the year ended December 31, 2015 was primarily due to the increased professional services revenues associated with our international wealth management platform business. Software license revenues were $9.9 million for the year ended December 31, 2016, a decrease of $1.1 million as compared to 2015.
Costs and expenses
International Financial Services segment costs and expenses for the year ended December 31, 2016 were $98.2 million, an increase of $12.1 million as compared to 2015. Reimbursable operating expenses included in costs and expenses were $1.2 million for the year ended December 31, 2016, a decrease of $0.5 million as compared to 2015.
Excluding reimbursable operating expenses, International Financial Services costs and expenses increased $12.6 million or 14.9% for the year ended December 31, 2016 as compared to 2015. On this basis, the increase in costs and expenses during 2016 was primarily from higher staffing costs to support the increase in professional services revenues.
Depreciation and amortization
International Financial Services segment depreciation and amortization costs for the year ended December 31, 2016 were $3.1 million, a decrease of $1.7 million or 35.4% as compared to 2015. The decrease in 2016 was primarily attributable to lower depreciation from lower capital expenditures.
Operating income
International Financial Services segment operating income for 2016 was $10.8 million, an increase of $6.6 million or 157.1% as compared to 2015. The increase in International Financial Services operating income was primarily due to the increased professional services revenues associated with our international wealth management platform business.
38
HEALTHCARE SERVICES SEGMENT
The following table presents the financial results of the Healthcare Services segment (in millions):
Change | |||||||||||||||||||||||||
Year Ended December 31, | 2017 vs 2016 | 2016 vs 2015 | |||||||||||||||||||||||
2017 | 2016 | 2015 | $ | % | $ | % | |||||||||||||||||||
Operating revenues | $ | 418.5 | $ | 426.2 | $ | 376.4 | $ | (7.7 | ) | (1.8 | )% | $ | 49.8 | 13.2 | % | ||||||||||
Out-of-pocket reimbursements | 7.5 | 8.5 | 8.2 | (1.0 | ) | (11.8 | )% | 0.3 | 3.7 | % | |||||||||||||||
Total revenues | 426.0 | 434.7 | 384.6 | (8.7 | ) | (2.0 | )% | 50.1 | 13.0 | % | |||||||||||||||
Costs and expenses | 340.9 | 345.1 | 321.3 | (4.2 | ) | (1.2 | )% | 23.8 | 7.4 | % | |||||||||||||||
Depreciation and amortization | 10.5 | 15.6 | 18.6 | (5.1 | ) | (32.7 | )% | (3.0 | ) | (16.1 | )% | ||||||||||||||
Operating income | $ | 74.6 | $ | 74.0 | $ | 44.7 | $ | 0.6 | 0.8 | % | $ | 29.3 | 65.5 | % | |||||||||||
Operating margin | 17.8 | % | 17.4 | % | 11.9 | % | |||||||||||||||||||
The following tables summarize the Healthcare Services segment’s statistical metrics (in millions):
December 31, | |||||||||
2017 | 2016 | 2015 | |||||||
DST Health Solutions covered lives | 21.8 | 22.8 | 26.0 | ||||||
Year Ended December 31, | |||||||||
2017 | 2016 | 2015 | |||||||
Argus pharmacy paid claims | 500.0 | 507.0 | 494.4 | ||||||
Comparison of 2017 versus 2016 results
Operating revenues
Healthcare Services segment operating revenues of $418.5 million decreased $7.7 million or 1.8% in 2017 compared to 2016. The decrease in operating revenue during the year ended December 31, 2017 was primarily due to the previously announced client transitions off of our systems, which resulted in approximately $46.5 million of lower revenues. Excluding client migrations, Healthcare Services operating revenues increased by $38.8 million or 10.2%. On this basis, the increase in operating revenues primarily resulted from organic growth and the expansion of the high-value services that we are offering to existing clients in both the medical and pharmacy businesses. These increases were partially offset by reductions in membership related to exchanges and lower consulting and development revenues which we believe is the result of a decline in healthcare technology spending due to the ongoing uncertainty around government policy changes. Additionally, operating revenues included approximately $9.8 million of software license fee revenues for the year ended December 31, 2017, an increase of $1.8 million as compared to 2016.
Costs and expenses
Healthcare Services segment costs and expenses for the year ended December 31, 2017 were $340.9 million, a decrease of $4.2 million as compared to 2016. Reimbursable operating expenses included in costs and expenses were $7.5 million in 2017, a decrease of $1.0 million as compared to 2016. Excluding reimbursable operating expenses, costs and expenses were $333.4 million for 2017, a decrease of $3.2 million as compared to 2016. On this basis, the decrease in costs and expenses during 2017 was primarily due to lower staffing needs resulting from the previously announced client migrations, partially offset by increased restructuring charges and increased share-based compensation expense. We recorded $4.4 million of restructing charges in 2017, as compared to none in 2016.
Depreciation and amortization
Healthcare Services segment depreciation and amortization costs for the year ended December 31, 2017 were $10.5 million, a decrease of $5.1 million or 32.7% as compared to 2016. The decrease is attributable to lower capital expenditures and an intangible asset becoming fully amortized during 2017.
39
Operating income
Healthcare Services segment operating income for 2017 was $74.6 million, an increase of $0.6 million or 0.8% as compared to 2016. The slight increase in operating income was primarily attributable to organic growth and the expansion of the high-value services that we are offering to existing clients in both the medical and pharmacy businesses and decreases in depreciation and amortization. These increases were partially offset by the negative impact of client migrations, restructuring charges, and increased share-based compensation expenses.
Comparison of 2016 versus 2015 results
Operating revenues
Healthcare Services segment operating revenues of $426.2 million increased $49.8 million or 13.2% in 2016 as compared to 2015. The increase in operating revenues for the year ended December 31, 2016 was primarily from new medical claims processing clients implemented during 2016, organic growth and the expansion of high-value services we are offering to existing clients in both the medical and pharmacy businesses. Operating revenues included approximately $8.0 million of software license fee revenues for the year ended December 31, 2016, a decrease of $1.1 million as compared to 2015.
Costs and expenses
Healthcare Services segment costs and expenses for the year ended December 31, 2016 were $345.1 million, an increase of $23.8 million as compared to 2015. Reimbursable operating expenses included in costs and expenses were $8.5 million in 2016, an increase of $0.3 million as compared to 2015. Excluding reimbursable operating expenses, costs and expenses were $336.6 million for 2016, an increase of $23.5 million as compared to 2015. On this basis, the increase in costs and expenses during 2016 was primarily attributable to increased staffing costs incurred to support the higher medical transaction volumes due to the growth in BPO services. These costs and expenses were partially offset by restructuring costs that occurred during 2015 that did not recur during 2016 and a $2.4 million reduction of share-based compensation expense as certain PSUs were no longer expected to vest.
Depreciation and amortization
Healthcare Services segment depreciation and amortization costs for the year ended December 31, 2016 were $15.6 million, a decrease of $3.0 million or 16.1% as compared to 2015 primarily due to lower capital expenditures.
Operating income
Healthcare Services segment operating income for 2016 was $74.0 million, an increase of $29.3 million or 65.5% as compared to 2015. The increase in operating income was primarily attributable to higher revenues from organic growth and new medical claims processing clients implemented in 2016, resulting in enhanced economies of scale as clients were converted as well as a reduction of share-based compensation expense as certain PSUs were no longer expected to vest. These increases were partially offset by increased staffing costs incurred to support the higher medical transaction volumes due to the growth in BPO services.
LIQUIDITY AND CAPITAL RESOURCES
Company’s Assessment of Short-term and Long-term Liquidity
We believe that our existing cash balances and other current assets, together with cash provided by operating activities and, as necessary, our revolving credit facilities, are sufficient to meet our operating and debt service requirements and other current liabilities for at least the next 12 months. Further, we believe that our longer term liquidity and capital requirements will also be met through cash provided by operating activities, bank credit facilities and other investments.
At December 31, 2017, total cash and cash equivalents were $80.5 million, of which $46.0 million was held outside of the U.S. Although the amounts held outside the U.S. have been taxed through the Transition Tax, these amounts could be subject to other taxes such as withholding taxes and local taxes. We have accrued for withholding taxes and local taxes on the earnings of our international subsidiaries except when the earnings are considered indefinitely reinvested outside of the U.S. The repatriation of these earnings could result in additional withholding and local tax payments in future years. We utilize a variety of funding strategies in an effort to ensure that our worldwide cash is available in the locations in which it is needed.
At December 31, 2017, we had approximately $990.7 million of availability under our domestic revolving credit facilities, including our accounts receivable securitization program. Debt obligations, classified as long-term when originally issued, existing as of December 31, 2017 that are scheduled to mature in 2018 include $65.0 million of Series C 2010 Senior Notes that are scheduled to mature in August 2018 and $3.7 million of payments related to outstanding mortgages. We are scheduled
40
to issue $65.0 million of Series C 2017 Senior Notes in August 2018 which are expected to be utilized to repay the Series C 2010 Senior Notes.
We may need to access debt and equity markets in the future if unforeseen costs or opportunities arise, to fund acquisitions or investments or to repay indebtedness. If we need to obtain new debt or equity financing in the future, the terms and availability of such financing may be impacted by economic and financial market conditions as well as our financial condition and results of operations at the time we seek additional financing. We currently have $585.0 million of additional capacity pursuant to the master note purchase agreement dated November 14, 2017 that could be utilized for future debt issuances.
Sources and Uses of Cash
We had $80.5 million, $195.5 million and $79.5 million of cash and cash equivalents at December 31, 2017, 2016 and 2015, respectively. Our primary source of liquidity has historically been cash provided by operations. In addition, we have used proceeds from the sale of investments to fund other investing and financing activities. Principal uses of cash are operations, reinvestment in our proprietary technologies, capital expenditures, investment purchases, business acquisitions, payments on debt, stock repurchases and dividend payments. Additionally, we expect to incur significant transaction costs associated with the completion of the Merger. Information on our consolidated cash flows for the years ended December 31, 2017, 2016 and 2015 is presented in the Consolidated Statement of Cash Flows, categorized by operating activities, investing activities, and financing activities.
The sale of our North American Customer Communications business on July 1, 2016 and our U.K. Customer Communications business on May 4, 2017 resulted in cash consideration of approximately $410.7 million and $43.6 million, respectively, net of tax. The after-tax proceeds from the sales were used in accordance with the Company’s capital plan, including investments in the business, share repurchases, strategic acquisitions, debt repayments and other corporate purposes.
Operating Activities
Cash flows provided from continuing operating activities were $164.0 million during the year ended December 31, 2017. Operating cash flows from continuing operating activities during 2017 resulted principally from income from continuing operations of $447.6 million, adjusted for non-cash or non-operating items of $108.2 million including depreciation and amortization, equity in earnings of unconsolidated affiliates, net gains on investments and gains recognized on the step up of the carrying value of our previously held equity interests in unconsolidated affiliates as a result of the acquisitions of the remaining interests in BFDS and IFDS U.K., and a use of cash due to changes in operating assets and liabilities of $175.4 million. Significant changes in operating assets and liabilities include a $127.9 million use of cash related to other assets primarily due to up-front payments made to clients which are expected to be recovered over the clients’ contractual arrangements and higher prepaid software costs, a $39.9 million use of cash for accounts payable and accrued liabilities, and a $29.6 million use of cash related to deferred revenue and gains primarily as a result of the wealth management platform client termination.
Cash flows provided from continuing operating activities were $162.7 million for the year ended December 31, 2016. Operating cash flows from continuing operations during 2016 resulted principally from income from continuing operations of $178.1 million, adjusted for non-cash or non-operating items of $90.4 million including depreciation and amortization and equity in earnings from unconsolidated affiliates, and a use of cash due to changes in operating assets and liabilities of $105.8 million. Significant changes in operating assets and liabilities include a $26.9 million use of cash related to accrued compensation and benefits, a $16.6 million source of cash resulting from accounts payable and accrued liabilities, a $16.0 million use of cash related to accounts receivable, and a $67.9 million use of cash related to timing of income tax payments.
Cash flows provided from continuing operating activities were $135.7 million for the year ended December 31, 2015. Operating cash flows from continuing operating activities during 2015 resulted principally from income from continuing operations of $309.6 million, adjusted for non-cash or non-operating items of $110.3 million including depreciation and amortization, equity in earnings of unconsolidated affiliates and net gains on investments, and a use of cash due to changes in operating assets and liabilities of $63.6 million. Significant changes in operating assets and liabilities include a $10.6 million use of cash related to accounts receivable, and a $31.6 million use of cash related to timing of income tax payments.
Investing Activities
Cash flows used in continuing investing activities were $0.7 million for the year ended December 31, 2017. Sources of our cash inflows were net investment activities (proceeds from investment sales, net of investments in securities) of $39.8 million, fluctuations in funds held on behalf of clients of $43.3 million and distributions received from unconsolidated affiliates of $32.7 million, primarily from IFDS L.P in connection with the acquisition of the remaining interests in BFDS and IFDS U.K., offset by cash used to acquire IFDS U.K. (net of cash acquired) of $38.9 million and capital expenditures of $78.8 million.
41
Cash flows used in continuing investing activities during 2016 of $117.3 million were primarily attributable to net investment activities (proceeds from investment sales, net of investments in securities) of $59.5 million, offset by cash used to acquire KRFS of $93.5 million, capital expenditures of $60.4 million, fluctuations in funds held on behalf of clients of $20.3 million, as well as approximately $28.0 million of cash loaned to IFDS U.K. during 2016.
Cash flows used in continuing investing activities were $102.4 million for the year ended December 31, 2015, primarily attributable to net investment activities (proceeds from investment sales, net of investments in securities) of $192.2 million, which includes $176.1 million of pretax proceeds from the sale of State Street stock. These sources of cash were offset by $117.4 million of cash used to acquire kasina LLC, Red Rocks Capital LLC and Wealth Management Systems, Inc. during 2015, $88.9 million used to purchase capital assets, as well as $113.5 million due to fluctuations in funds held on behalf of clients.
Capital Expenditures
The following table summarizes capital expenditures by segment (in millions):
Year Ended December 31, | |||||||||||
2017 | 2016 | 2015 | |||||||||
Domestic Financial Services segment | $ | 63.3 | $ | 52.4 | $ | 79.0 | |||||
International Financial Services segment | 8.8 | 2.6 | 3.8 | ||||||||
Healthcare Services segment | 6.7 | 5.4 | 6.1 | ||||||||
$ | 78.8 | $ | 60.4 | $ | 88.9 | ||||||
During 2017, 2016 and 2015, we capitalized software development costs of $24.1 million, $21.5 million and $23.3 million, respectively, which are included within the capital expenditures listed above. Capital expenditures using debt are treated as non-cash transactions and are not included in the annual capital expenditure amounts above.
Financing Activities
Cash flows used in continuing financing activities totaled $317.4 million, $374.8 million and $278.7 million during the years ended December 31, 2017, 2016 and 2015, respectively.
Common Stock Issuances and Repurchases
We received cash proceeds of $2.8 million, $5.3 million and $11.8 million from the issuance of common stock from the exercise of employee stock options during the years ended December 31, 2017, 2016 and 2015, respectively. The value of shares received in exchange for satisfaction of the exercise price and for tax-withholding obligations arising from the exercise of options to purchase our stock or from the vesting of restricted shares are included in Common stock repurchased in the Consolidated Statement of Cash Flows.
As of December 31, 2016, we had $150.0 million of capacity remaining under our share repurchase plan authorized in 2016. On May 9, 2017, our Board of Directors authorized a new $300.0 million share repurchase plan, which allows, but does not require, the repurchase of common stock in open market and private transactions. We repurchased the equivalent of 5.0 million shares of our common stock on a post stock split basis for $300.0 million during the year ended December 31, 2017, which left approximately $150.0 million remaining under our share repurchase plan authorized in 2017. The 2017 share repurchase plan does not have an expiration date, however we are currently precluded from executing additional stock repurchases pursuant to the Merger Agreement with SS&C. Under previous share repurchase plans, we expended $300.0 million for approximately 5.4 million shares on a post stock split basis and $400.0 million for approximately 7.2 million shares on a post stock split basis during the years ended December 31, 2016 and 2015, respectively.
Dividends
We paid cash dividends of $0.72, $0.66 and $0.60 per common share in 2017, 2016 and 2015, respectively. The total cash paid for dividends in 2017, 2016 and 2015 was $43.7 million, $43.4 million and $43.1 million, respectively. We are currently precluded from declaring dividends pursuant to the Merger Agreement with SS&C.
42
Client Funds Obligations
Client funds obligations represent our contractual obligations to remit funds to satisfy client pharmacy claim obligations and are recorded on the balance sheet when incurred, generally after a claim has been processed by us. In addition, client funds obligations include transfer agency client balances invested overnight. Our contractual obligations to remit funds to satisfy client obligations are primarily sourced by funds held on behalf of clients. We had $504.2 million, $564.6 million and $533.4 million of client funds obligations at December 31, 2017, 2016 and 2015, respectively.
Debt Activity
During 2017, we had the following primary sources of debt financing: our syndicated revolving credit facility; accounts receivable securitization program; and privately placed senior notes (the “2010 Senior Notes” and “2017 Senior Notes”). We had $620.8 million, $508.2 million and $562.1 million of debt outstanding at December 31, 2017, 2016 and 2015, respectively, an increase of $112.6 million during 2017 and a decrease of $53.9 million during 2016.
The increase in debt outstanding during 2017 resulted primarily from issuing $350.0 million of 2017 Senior Notes in November 2017, the assumption of a mortgage as a result of the acquisition of the remaining interests in IFDS U.K. and the assumption of a mortgage associated with a real estate distribution from Broadway Square Partners, partially offset by a reduction in amounts outstanding under our accounts receivable securitization program and revolving credit facilities. Proceeds from the 2017 Senior Notes were primarily used to pay down our revolving credit facilities. The decrease in debt outstanding during 2016 resulted primarily from the utilization of the proceeds from the sale of our North American Customer Communications business to pay down outstanding balances, partially offset by borrowings to fund the KRFS business acquisition, share repurchases and working capital uses.
Our debt agreements contain customary restrictive covenants, including limitations on consolidated indebtedness, liens, investments, subsidiary indebtedness, asset dispositions and require certain consolidated leverage and interest coverage ratios to be maintained. We are currently in compliance with these covenants. A default under certain of our borrowings could trigger defaults under certain of our other debt obligations, which in turn could result in their maturities being accelerated. Our debt arrangements are further described in Item 8, Financial Statements and Supplementary Data - Note 10, “Debt.”
Contractual Obligations and Commercial Commitments
The following table sets forth our contractual obligations and commercial commitments as of December 31, 2017 (in millions):
Payment Due by Period | |||||||||||||||||||
Total | Less than 1 Year | 1 - 3 Years | 3 - 5 Years | More than 5 Years | |||||||||||||||
Debt obligations | $ | 623.3 | $ | 83.7 | $ | 187.3 | $ | 1.5 | $ | 350.8 | |||||||||
Operating lease obligations | 104.0 | 23.8 | 35.5 | 27.2 | 17.5 | ||||||||||||||
Software license agreements | 135.0 | 34.9 | 63.6 | 36.5 | — | ||||||||||||||
Other | 39.2 | 18.9 | 15.8 | 4.5 | — | ||||||||||||||
$ | 901.5 | $ | 161.3 | $ | 302.2 | $ | 69.7 | $ | 368.3 | ||||||||||
Interest obligations on our outstanding debt are not included in the table above. The syndicated revolving credit facility contains grid schedules that adjust borrowing costs up or down based upon our consolidated leverage ratio. The grid schedules may result in fluctuations in borrowing costs ranging from 1.00% to 1.70% over Eurodollar and 0.00% to 0.70% over base rate, as defined. The 2010 Senior Notes outstanding have fixed interest rates and are comprised of $65.0 million of 5.06% Series C Senior Notes and $160.0 million of 5.42% Series D Senior Notes. The $350.0 million of 2017 Senior Notes outstanding have an average fixed interest rate of approximately 4.0%. In addition to the financial instruments listed above, the program fees incurred on proceeds from the sale of receivables under our accounts receivable securitization program are determined based on variable interest rates associated with LIBOR plus an applicable margin.
We have liabilities for income tax uncertainties of $67.7 million at December 31, 2017. These obligations are classified as non-current on our Consolidated Balance Sheet as resolution of these matters is expected to take more than a year; however, the ultimate timing of resolution is uncertain. As we are unable to make a reasonably reliable estimate as to when payments may occur for our unrecognized tax benefits, our liability for income tax uncertainties is not included in the table above.
Due to the enactment of the Tax Act, we recorded a provisional income tax payable related to the Transition Tax of $8.4 million, of which $7.3 million is reported as noncurrent as it is not expected to be paid within one year. As permitted by the Tax Act, the Transition Tax will be paid over an eight-year period, beginning in 2018, and will not accrue interest. This
43
provisional amount, as well as the current estimated timing of payments, is subject to change based on additional guidance from and interpretations by U.S. regulatory and standard-setting bodies and changes in assumptions.
Other Commercial Commitments
In the normal course of business, to facilitate transactions of services and products and other business assets, we have agreed to indemnify certain parties with respect to certain matters. We have agreed to hold certain parties harmless against losses arising from a breach of representations or covenants, or out of intellectual property infringement or other claims made by third parties. These agreements may limit the time within which an indemnification claim can be made and the amount of the claim. At December 31, 2017, except for certain immaterial items, there were no liabilities for guarantees or indemnifications as it is not possible to determine either the maximum potential amount under these indemnification agreements or the timing of any such payments due to the limited history of prior indemnification claims and the unique facts and circumstances involved in each particular agreement. Historically, payments made under these agreements have not had a material impact on our consolidated financial position, results of operations or cash flows.
SS&C Merger Agreement
Under certain circumstances, we would be required to pay a termination fee of $165.0 million to SS&C in the event the Merger Agreement with SS&C is terminated.
Off-Balance Sheet Arrangements
An off-balance sheet arrangement is any transaction, agreement or other contractual arrangement involving an unconsolidated entity under which a company has (1) made guarantees, (2) a retained or a contingent interest in transferred assets, (3) an obligation under derivative instruments classified as equity, or (4) any obligation arising out of a material variable interest in an unconsolidated entity that provides financing, liquidity, market risk or credit risk support to the company, or that engages in leasing, hedging or research and development arrangements with the company.
We believe that our guarantee arrangements will not have a material current or future effect on our financial condition, changes in financial condition, revenues or expenses, capital expenditures, capital resources, liquidity or results of operations. These arrangements are described above and in Item 8, Financial Statements and Supplementary Data - Note 16, “Commitments and Contingencies.”
Item 7A. Quantitative and Qualitative Disclosures About Market Risk
The operation of our businesses and our financial results can be affected by changes in interest rates and currency exchange rates. Changes in interest rates and exchange rates have not materially impacted our consolidated financial position, results of operations or cash flows.
Interest rate risk
We derive service revenues from investment earnings related to cash balances maintained in bank accounts on which we are the agent for clients. The balances maintained in the bank accounts will fluctuate. For the year ended December 31, 2017, DST had average daily cash balances of approximately $2.0 billion maintained in such accounts. We estimate that a 100 basis point change in the short-term interest earnings rate would equal approximately $8.6 million of net income (loss).
At December 31, 2017, we had $620.8 million of debt, of which $14.9 million was subject to variable interest rates (LIBOR rates). We estimate that a 10% increase in interest rates would not have a significant impact to our consolidated pretax earnings or to the fair value of our debt.
The effect of changes in interest rates on our variable rate debt is mitigated by changes in interest rates attributable to balance earnings.
Foreign currency exchange rate risk
The operation of our subsidiaries in international markets results in our exposure to movements in currency exchange rates. The principal currencies involved are the British pound, Canadian dollar, Australian dollar, Thai baht and Indian rupee. Our international subsidiaries use the local currency as the functional currency. We translate our assets and liabilities at year-end exchange rates and translate income and expense accounts at average rates during the year. Currency exchange rate fluctuations have not historically significantly affected our consolidated financial results.
44
At December 31, 2017, our international subsidiaries for our continuing operations had approximately $758.1 million in total assets and for the year ended December 31, 2017, these international subsidiaries recorded net income of approximately $70.4 million. We estimate that a 10% change in exchange rates would have changed total consolidated assets by approximately $75.8 million. Furthermore, a 10% change in exchange rates based upon historical earnings in international operations would have changed consolidated net income for 2017 by approximately $7.0 million.
We have entered into foreign currency cash flow and economic hedging programs to mitigate the impact of movements in foreign currency (principally British pound, Australian dollar, Thai baht and Indian rupee) on our operations. The total notional value of our foreign currency derivatives was $101.1 million at December 31, 2017. The fair value of the contracts that qualify for hedge accounting resulted in an asset of $0.2 million at December 31, 2017. We estimate that a 10% change in exchange rates would result in a $0.9 million change in other comprehensive income. The fair value of the contracts that do not qualify for hedge accounting resulted in a liability of $0.3 million at December 31, 2017. We estimate a 10% change in exchange rates on these contracts would result in a $4.8 million change to consolidated net income. Gains and losses on the derivative instruments are largely offset by changes in the underlying hedged items, resulting in a minimal impact on earnings.
45
Item 8. Financial Statements and Supplementary Data
Report of Independent Registered Public Accounting Firm
To the Board of Directors and Stockholders of DST Systems, Inc.:
Opinions on the Financial Statements and Internal Control over Financial Reporting
We have audited the accompanying consolidated balance sheets of DST Systems, Inc. and its subsidiaries as of December 31, 2017 and December 31, 2016, and the related consolidated statements of income, of comprehensive income, of changes in stockholders’ equity and cash flows for each of the three years in the period ended December 31, 2017, including the related notes (collectively referred to as the “consolidated financial statements”). We also have audited the Company’s internal control over financial reporting as of December 31, 2017, based on criteria established in Internal Control - Integrated Framework (2013) issued by the Committee of Sponsoring Organizations of the Treadway Commission (COSO).
In our opinion, the consolidated financial statements referred to above present fairly, in all material respects, the financial position of the Company as of December 31, 2017 and December 31, 2016, and the results of their operations and their cash flows for each of the three years in the period ended December 31, 2017 in conformity with accounting principles generally accepted in the United States of America. Also in our opinion, the Company maintained, in all material respects, effective internal control over financial reporting as of December 31, 2017, based on criteria established in Internal Control - Integrated Framework (2013) issued by the COSO.
Basis for Opinions
The Company’s management is responsible for these consolidated financial statements, for maintaining effective internal control over financial reporting, and for its assessment of the effectiveness of internal control over financial reporting, included in the accompanying Report of Management on Internal Control over Financial Reporting appearing under Item 9A. Our responsibility is to express opinions on the Company’s consolidated financial statements and on the Company’s internal control over financial reporting based on our audits. We are a public accounting firm registered with the Public Company Accounting Oversight Board (United States) (“PCAOB”) and are required to be independent with respect to the Company in accordance with the U.S. federal securities laws and the applicable rules and regulations of the Securities and Exchange Commission and the PCAOB.
We conducted our audits in accordance with the standards of the PCAOB. Those standards require that we plan and perform the audits to obtain reasonable assurance about whether the consolidated financial statements are free of material misstatement, whether due to error or fraud, and whether effective internal control over financial reporting was maintained in all material respects.
Our audits of the consolidated financial statements included performing procedures to assess the risks of material misstatement of the consolidated financial statements, whether due to error or fraud, and performing procedures that respond to those risks. Such procedures included examining, on a test basis, evidence regarding the amounts and disclosures in the consolidated financial statements. Our audits also included evaluating the accounting principles used and significant estimates made by management, as well as evaluating the overall presentation of the consolidated financial statements. Our audit of internal control over financial reporting included obtaining an understanding of internal control over financial reporting, assessing the risk that a material weakness exists, and testing and evaluating the design and operating effectiveness of internal control based on the assessed risk. Our audits also included performing such other procedures as we considered necessary in the circumstances. We believe that our audits provide a reasonable basis for our opinions.
As described in the Report of Management on Internal Control over Financial Reporting, management has excluded Boston Financial Data Services, Inc. (“BFDS”) and International Financial Data Services Limited (“IFDS UK”) from its assessment of internal control over financial reporting as of December 31, 2017 because the entities were acquired by the Company in a purchase business combination during 2017. We have also excluded BFDS and IFDS UK from our audit of internal control over financial reporting. BFDS is a wholly-owned subsidiary whose total assets and total revenues excluded from management’s assessment and our audit of internal control over financial reporting represent 15% and 13%, respectively, of the related consolidated financial statement amounts as of and for the year ended December 31, 2017. IFDS UK is a wholly-owned subsidiary whose total assets and total revenues excluded from management’s assessment and our audit of internal control over financial reporting represent 25% and 22%, respectively, of the related consolidated financial statement amounts as of and for the year ended December 31, 2017.
46
Definition and Limitations of Internal Control over Financial Reporting
A company’s internal control over financial reporting is a process designed to provide reasonable assurance regarding the reliability of financial reporting and the preparation of financial statements for external purposes in accordance with generally accepted accounting principles. A company’s internal control over financial reporting includes those policies and procedures that (i) pertain to the maintenance of records that, in reasonable detail, accurately and fairly reflect the transactions and dispositions of the assets of the company; (ii) provide reasonable assurance that transactions are recorded as necessary to permit preparation of financial statements in accordance with generally accepted accounting principles, and that receipts and expenditures of the company are being made only in accordance with authorizations of management and directors of the company; and (iii) provide reasonable assurance regarding prevention or timely detection of unauthorized acquisition, use, or disposition of the company’s assets that could have a material effect on the financial statements.
Because of its inherent limitations, internal control over financial reporting may not prevent or detect misstatements. Also, projections of any evaluation of effectiveness to future periods are subject to the risk that controls may become inadequate because of changes in conditions, or that the degree of compliance with the policies or procedures may deteriorate.

Kansas City, Missouri
February 28, 2018
We have served as the Company’s auditor since 1969.
47
DST Systems, Inc. Consolidated Balance Sheet (dollars in millions, except per share amounts) | |||||||
December 31, | |||||||
2017 | 2016 | ||||||
Assets | |||||||
Current assets | |||||||
Cash and cash equivalents | $ | 80.5 | $ | 195.5 | |||
Funds held on behalf of clients | 454.5 | 500.5 | |||||
Client funding receivable | 47.0 | 64.1 | |||||
Accounts receivable (includes related party receivables of $6.7 and $19.7) | 363.8 | 215.5 | |||||
Other assets | 91.9 | 70.0 | |||||
Current assets held for sale | — | 72.6 | |||||
1,037.7 | 1,118.2 | ||||||
Investments | 199.7 | 377.4 | |||||
Unconsolidated affiliates | 94.0 | 331.2 | |||||
Properties, net | 349.8 | 235.7 | |||||
Intangible assets, net | 283.1 | 142.6 | |||||
Goodwill | 799.1 | 516.4 | |||||
Other assets | 174.8 | 50.3 | |||||
Total assets | $ | 2,938.2 | $ | 2,771.8 | |||
Liabilities | |||||||
Current liabilities | |||||||
Current portion of debt | $ | 83.7 | $ | 208.5 | |||
Client funds obligations | 504.2 | 564.6 | |||||
Accounts payable | 101.2 | 62.9 | |||||
Accrued compensation and benefits | 137.9 | 101.7 | |||||
Deferred revenues and gains | 28.3 | 23.5 | |||||
Income taxes payable | 5.0 | 22.0 | |||||
Other liabilities | 111.0 | 78.1 | |||||
Current liabilities held for sale | — | 30.1 | |||||
971.3 | 1,091.4 | ||||||
Long-term debt | 537.1 | 299.7 | |||||
Income taxes payable | 75.0 | 69.8 | |||||
Deferred income taxes | 62.0 | 151.5 | |||||
Other liabilities | 51.6 | 22.9 | |||||
Total liabilities | 1,697.0 | 1,635.3 | |||||
Commitments and contingencies (Note 16) | |||||||
Redeemable Non-controlling Interest | — | 21.3 | |||||
Stockholders’ Equity | |||||||
Preferred stock, $0.01 par, 10 million shares authorized and unissued | — | — | |||||
Common stock, $0.01 par, 400 million shares authorized, and 64.4 million and 82.0 million shares issued, respectively | 0.6 | 0.8 | |||||
Additional paid-in capital | 112.7 | 129.2 | |||||
Retained earnings | 1,489.3 | 2,379.2 | |||||
Treasury stock, at cost | (362.8 | ) | (1,410.6 | ) | |||
Accumulated other comprehensive income | 1.4 | 16.6 | |||||
Total stockholders’ equity | 1,241.2 | 1,115.2 | |||||
Total liabilities, redeemable non-controlling interest and stockholders’ equity | $ | 2,938.2 | $ | 2,771.8 | |||
The accompanying notes are an integral part of these financial statements.
48
DST Systems, Inc. Consolidated Statement of Income (in millions, except per share amounts) | |||||||||||
Year Ended December 31, | |||||||||||
2017 | 2016 | 2015 | |||||||||
Operating revenues | $ | 2,086.7 | $ | 1,474.4 | $ | 1,405.0 | |||||
Out-of-pocket reimbursements | 131.5 | 82.3 | 69.0 | ||||||||
Total revenues (includes related party revenues of $58.5, $150.7 and $150.3) | 2,218.2 | 1,556.7 | 1,474.0 | ||||||||
Costs and expenses | 1,805.0 | 1,213.4 | 1,150.2 | ||||||||
Depreciation and amortization | 128.0 | 96.0 | 91.1 | ||||||||
Operating income | 285.2 | 247.3 | 232.7 | ||||||||
Interest expense | (26.8 | ) | (23.5 | ) | (23.8 | ) | |||||
Gain on sale of business | — | 5.5 | — | ||||||||
Other income, net | 219.0 | 22.7 | 204.5 | ||||||||
Equity in earnings of unconsolidated affiliates | 54.5 | 27.2 | 45.4 | ||||||||
Income from continuing operations before income taxes and non-controlling interest | 531.9 | 279.2 | 458.8 | ||||||||
Income taxes | 84.3 | 101.1 | 149.2 | ||||||||
Income from continuing operations before non-controlling interest | 447.6 | 178.1 | 309.6 | ||||||||
Income from discontinued operations, net of tax | 4.5 | 248.3 | 48.5 | ||||||||
Net income | 452.1 | 426.4 | 358.1 | ||||||||
Net (income) loss attributable to non-controlling interest | (0.6 | ) | 0.9 | 0.1 | |||||||
Net income attributable to DST Systems, Inc. | $ | 451.5 | $ | 427.3 | $ | 358.2 | |||||
Weighted average common shares outstanding | 61.4 | 66.0 | 72.0 | ||||||||
Weighted average diluted shares outstanding | 62.1 | 66.6 | 72.9 | ||||||||
Basic earnings per share: | |||||||||||
Continuing operations attributable to DST Systems, Inc. | $ | 7.28 | $ | 2.71 | $ | 4.30 | |||||
Discontinued operations | 0.07 | 3.76 | 0.67 | ||||||||
Basic earnings per share | $ | 7.35 | $ | 6.47 | $ | 4.97 | |||||
Diluted earnings per share: | |||||||||||
Continuing operations attributable to DST Systems, Inc. | $ | 7.20 | $ | 2.68 | $ | 4.25 | |||||
Discontinued operations | 0.07 | 3.73 | 0.67 | ||||||||
Diluted earnings per share | $ | 7.27 | $ | 6.41 | $ | 4.92 | |||||
Cash dividends per share of common stock | $ | 0.72 | $ | 0.66 | $ | 0.60 | |||||
The accompanying notes are an integral part of these financial statements.
49
DST Systems, Inc. Consolidated Statement of Comprehensive Income (in millions) | |||||||||||
Year Ended December 31, | |||||||||||
2017 | 2016 | 2015 | |||||||||
Net income attributable to DST Systems, Inc. | $ | 451.5 | $ | 427.3 | $ | 358.2 | |||||
Other comprehensive loss, net of tax (Note 13): | |||||||||||
Available-for-sale securities | (93.2 | ) | 10.1 | (123.2 | ) | ||||||
Cash flow hedges | 0.2 | — | 0.2 | ||||||||
Defined benefit pension | 4.1 | — | — | ||||||||
Foreign currency translation | 73.7 | (35.4 | ) | (22.0 | ) | ||||||
Other comprehensive loss, net of tax | (15.2 | ) | (25.3 | ) | (145.0 | ) | |||||
Comprehensive income | $ | 436.3 | $ | 402.0 | $ | 213.2 | |||||
The accompanying notes are an integral part of these financial statements.
50
DST Systems, Inc. Consolidated Statement of Changes in Stockholders’ Equity (in millions) | ||||||||||||||||||||||||||
Common Stock | Accumulated Other Comprehensive Income | |||||||||||||||||||||||||
Shares Outstanding | Par Value | Additional Paid-in Capital | Retained Earnings | Treasury Stock | Total Stockholders’ Equity | |||||||||||||||||||||
December 31, 2014 | 75.2 | $ | 0.8 | $ | 114.1 | $ | 1,682.9 | $ | (748.3 | ) | $ | 186.9 | $ | 1,236.4 | ||||||||||||
Comprehensive income: | ||||||||||||||||||||||||||
Net income attributable to DST Systems, Inc. | — | — | — | 358.2 | — | — | 358.2 | |||||||||||||||||||
Other comprehensive loss | — | — | — | — | — | (145.0 | ) | (145.0 | ) | |||||||||||||||||
Dividends | — | — | 1.4 | (44.5 | ) | — | — | (43.1 | ) | |||||||||||||||||
Amortization of share-based compensation | — | — | 27.9 | — | — | — | 27.9 | |||||||||||||||||||
Issuance of common stock | 0.6 | — | (5.2 | ) | — | 23.9 | — | 18.7 | ||||||||||||||||||
Repurchase of common stock | (7.2 | ) | — | — | — | (405.3 | ) | — | (405.3 | ) | ||||||||||||||||
Other | — | — | (1.8 | ) | — | — | — | (1.8 | ) | |||||||||||||||||
December 31, 2015 | 68.6 | 0.8 | 136.4 | 1,996.6 | (1,129.7 | ) | 41.9 | 1,046.0 | ||||||||||||||||||
Comprehensive income: | ||||||||||||||||||||||||||
Net income attributable to DST Systems, Inc. | — | — | — | 427.3 | — | — | 427.3 | |||||||||||||||||||
Other comprehensive loss | — | — | — | — | — | (25.3 | ) | (25.3 | ) | |||||||||||||||||
Dividends | — | — | 1.3 | (44.7 | ) | — | — | (43.4 | ) | |||||||||||||||||
Amortization of share-based compensation | — | — | 16.3 | — | — | — | 16.3 | |||||||||||||||||||
Issuance of common stock | 0.8 | — | (24.5 | ) | — | 34.9 | — | 10.4 | ||||||||||||||||||
Repurchase of common stock | (5.4 | ) | — | — | — | (315.8 | ) | — | (315.8 | ) | ||||||||||||||||
Other | — | — | (0.3 | ) | — | — | — | (0.3 | ) | |||||||||||||||||
December 31, 2016 | 64.0 | 0.8 | 129.2 | 2,379.2 | (1,410.6 | ) | 16.6 | 1,115.2 | ||||||||||||||||||
Comprehensive income: | ||||||||||||||||||||||||||
Net income attributable to DST Systems, Inc. | — | — | — | 451.5 | — | — | 451.5 | |||||||||||||||||||
Other comprehensive loss | — | — | — | — | — | (15.2 | ) | (15.2 | ) | |||||||||||||||||
Dividends | — | — | 1.0 | (44.7 | ) | — | — | (43.7 | ) | |||||||||||||||||
Amortization of share-based compensation | — | — | 44.2 | — | — | — | 44.2 | |||||||||||||||||||
Issuance of common stock | 0.4 | — | (21.2 | ) | — | 24.2 | — | 3.0 | ||||||||||||||||||
Repurchase of common stock | (5.1 | ) | — | — | — | (314.3 | ) | — | (314.3 | ) | ||||||||||||||||
Distribution of treasury stock for stock split | — | (0.2 | ) | (40.5 | ) | (1,297.2 | ) | 1,337.9 | — | — | ||||||||||||||||
Other | — | — | — | 0.5 | — | — | 0.5 | |||||||||||||||||||
December 31, 2017 | 59.3 | $ | 0.6 | $ | 112.7 | $ | 1,489.3 | $ | (362.8 | ) | $ | 1.4 | $ | 1,241.2 | ||||||||||||
The accompanying notes are an integral part of these financial statements.
51
DST Systems, Inc. Consolidated Statement of Cash Flows (in millions) | |||||||||||
Year Ended December 31, | |||||||||||
2017 | 2016 | 2015 | |||||||||
Cash flows—operating activities: | |||||||||||
Net income | $ | 452.1 | $ | 426.4 | $ | 358.1 | |||||
Less: income from discontinued operations | 4.5 | 248.3 | 48.5 | ||||||||
Income from continuing operations | 447.6 | 178.1 | 309.6 | ||||||||
Depreciation and amortization | 128.0 | 96.0 | 91.1 | ||||||||
Net gains on investments | (153.8 | ) | (2.4 | ) | (163.6 | ) | |||||
Gain recognized on step-up of unconsolidated affiliates | (43.8 | ) | — | — | |||||||
Gains on sale of properties and businesses | (0.6 | ) | (5.6 | ) | (4.5 | ) | |||||
Amortization of share-based compensation | 43.6 | 12.2 | 24.1 | ||||||||
Equity in earnings of unconsolidated affiliates | (54.5 | ) | (27.2 | ) | (45.4 | ) | |||||
Cash dividends from unconsolidated affiliates | — | 0.4 | 3.5 | ||||||||
Deferred income taxes | (27.1 | ) | 17.0 | (15.5 | ) | ||||||
Changes in accounts receivable | 13.9 | (16.0 | ) | (10.6 | ) | ||||||
Changes in other assets | (127.9 | ) | (0.8 | ) | (9.4 | ) | |||||
Changes in client funds obligations | (17.1 | ) | 10.9 | 9.9 | |||||||
Changes in client funding receivable | 17.1 | (10.9 | ) | (9.9 | ) | ||||||
Changes in accounts payable and accrued liabilities | (39.9 | ) | 16.6 | (1.8 | ) | ||||||
Changes in income taxes payable | 12.1 | (67.9 | ) | (31.6 | ) | ||||||
Changes in deferred revenues and gains | (29.6 | ) | (4.6 | ) | (2.1 | ) | |||||
Changes in accrued compensation and benefits | (10.2 | ) | (26.9 | ) | (7.7 | ) | |||||
Other, net | 6.2 | (6.2 | ) | (0.4 | ) | ||||||
Net cash provided from continuing operating activities | 164.0 | 162.7 | 135.7 | ||||||||
Net cash provided from (used in) discontinued operating activities | (12.1 | ) | 26.4 | 84.5 | |||||||
Net cash provided from operating activities | 151.9 | 189.1 | 220.2 | ||||||||
Cash flows—investing activities: | |||||||||||
Cash paid for capital expenditures | (78.8 | ) | (60.4 | ) | (88.9 | ) | |||||
Investments in securities | (62.8 | ) | (258.3 | ) | (166.4 | ) | |||||
Proceeds from (investments in and advances to) unconsolidated affiliates, net | 32.7 | (23.8 | ) | 11.1 | |||||||
Proceeds from sale / maturities of investments | 102.6 | 317.8 | 358.6 | ||||||||
Net increase (decrease) in restricted cash and cash equivalents held to satisfy client funds obligations | 43.3 | (20.3 | ) | (113.5 | ) | ||||||
Proceeds from sale of properties | — | 5.7 | 6.1 | ||||||||
Acquisition of businesses, net of cash and cash equivalents acquired | (38.9 | ) | (93.5 | ) | (117.4 | ) | |||||
Proceeds from sale of businesses, net of cash and cash equivalents sold | 1.2 | 14.5 | 7.9 | ||||||||
Other, net | — | 1.0 | 0.1 | ||||||||
Net cash used in continuing investing activities | (0.7 | ) | (117.3 | ) | (102.4 | ) | |||||
Net cash provided from discontinued investing activities | 40.6 | 412.9 | 104.9 | ||||||||
Net cash provided from investing activities | 39.9 | 295.6 | 2.5 | ||||||||
Cash flows—financing activities: | |||||||||||
Proceeds from issuance of common stock | 2.8 | 5.3 | 11.8 | ||||||||
Principal payments on debt | (108.2 | ) | (5.1 | ) | (46.4 | ) | |||||
Proceeds from issuance of senior notes | 350.0 | — | — | ||||||||
Net proceeds (repayments) on accounts receivable securitization program | (88.3 | ) | 103.2 | (120.0 | ) | ||||||
Net borrowings (repayments) on revolving credit facilities | (75.0 | ) | (151.1 | ) | 181.8 | ||||||
Net increase (decrease) in client funds obligations | (43.3 | ) | 20.3 | 124.0 | |||||||
Receipt of third party capital in investment fund | 0.8 | 7.1 | 15.0 | ||||||||
Common stock repurchased | (310.6 | ) | (315.8 | ) | (405.3 | ) | |||||
Payment of cash dividends | (43.7 | ) | (43.4 | ) | (43.1 | ) | |||||
The accompanying notes are an integral part of these financial statements. | |||||||||||
52
DST Systems, Inc. Consolidated Statement of Cash Flows, continued (in millions) | |||||||||||
December 31, | |||||||||||
2017 | 2016 | 2015 | |||||||||
Excess tax benefits from share-based compensation | — | 4.7 | 5.6 | ||||||||
Other, net | (1.9 | ) | — | (2.1 | ) | ||||||
Net cash used for continuing financing activities | (317.4 | ) | (374.8 | ) | (278.7 | ) | |||||
Net cash used for discontinued financing activities | (0.2 | ) | — | (6.1 | ) | ||||||
Net cash used for financing activities | (317.6 | ) | (374.8 | ) | (284.8 | ) | |||||
Effect of exchange rates on cash and cash equivalents | 6.8 | — | — | ||||||||
Net increase (decrease) in cash and cash equivalents, including cash within assets held for sale | (119.0 | ) | 109.9 | (62.1 | ) | ||||||
Cash and cash equivalents, beginning of year | 199.5 | 89.6 | 151.7 | ||||||||
Cash and cash equivalents, end of year | 80.5 | 199.5 | 89.6 | ||||||||
Less: cash and cash equivalents held for sale | — | 4.0 | 10.1 | ||||||||
Cash and cash equivalents of continuing operations, end of year | $ | 80.5 | $ | 195.5 | $ | 79.5 | |||||
The accompanying notes are an integral part of these financial statements.
53
1. Description of Business
DST Systems, Inc. and consolidated subsidiaries (“we,” “our,” “us,” the “Company” or “DST”) use proprietary software applications to provide sophisticated information processing and servicing solutions, through strategically unified business processing and data management, to clients globally within the asset management, brokerage, retirement, healthcare and other markets. Our wholly-owned data centers provide the secure technology infrastructure necessary to support our solutions.
On January 11, 2018, we entered into an Agreement and Plan of Merger (the “Merger Agreement”) wherein SS&C Technologies Holdings, Inc. (“SS&C”) will acquire DST (the “Merger”). Under the terms of the agreement, SS&C will purchase DST in an all-cash transaction for $84.00 per share plus the assumption of debt, equating to an enterprise value of approximately $5.4 billion. The Company has agreed to customary covenants in the Merger Agreement, including with respect to the Company’s operation of its business prior to the closing of the transaction or termination of the agreement, such as restrictions on making certain acquisitions and divestitures, entering into certain contracts, incurring certain indebtedness and expenditures, paying dividends, repurchasing stock and taking other specified actions. The transaction is subject to DST stockholder approval, clearances by the relevant regulatory authorities and other customary closing conditions and is currently expected to close by the end of the second quarter 2018; however, there can be no assurances as to the actual closing or the timing of the closing. Under certain circumstances, we would be required to pay a termination fee of $165.0 million to SS&C in the event the Merger Agreement with SS&C is terminated.
In March 2017, we acquired State Street Corporation’s (“State Street”) ownership interest in our joint ventures Boston Financial Data Services, Inc. (“BFDS”) and International Financial Data Services U.K. Limited (“IFDS U.K.”), as well as other investments and real estate held by International Financial Data Services, L.P. (“IFDS L.P.”). BFDS and IFDS U.K. were consolidated in our financial results from the date control of these entities was obtained. See Note 3, “Significant Business Transactions,” for additional information.
Beginning in 2017, DST established a new reportable segment structure that separates the previously reported Financial Services segment into two new segments, Domestic Financial Services and International Financial Services, based upon the geographical location of the revenue-generating business. The activity within the previously reported Investments and Other segment has now been included in either the Domestic or International Financial Services segments based on the business supported. The Healthcare Services segment remains unchanged. The new segment presentation is reflective of how management is now operating the business and making resource allocations following the acquisitions of the remaining interests in BFDS and IFDS U.K., as well as the recent reductions in non-core investment assets. The Company’s operating business units are now reported as three operating segments (Domestic Financial Services, International Financial Services and Healthcare Services). Prior periods have been revised to reflect the new reportable operating segments.
In May 2017, our Board of Directors declared a two-for-one stock split of DST’s outstanding common stock effected in the form of a stock dividend, which was paid on June 8, 2017 to shareholders of record at the close of business on May 26, 2017. In connection with the stock split, 16.5 million treasury shares were used to settle a portion of the distribution. All share and per share data, excluding treasury shares, have been retroactively adjusted for all periods presented to reflect the stock split, as if the stock split had occurred at the beginning of the earliest period presented.
We sold our North American Customer Communications business on July 1, 2016 and sold our United Kingdom (“U.K.”) Customer Communications business on May 4, 2017. We have classified the results of the Customer Communications businesses sold as discontinued operations in our consolidated financial statements for all periods presented. See Note 4, “Discontinued Operations,” for additional information.
2. Significant Accounting Policies
Principles of consolidation
The consolidated financial statements include all majority-owned subsidiaries of the Company. Intercompany balances and transactions have been eliminated. Certain amounts in the 2016 and 2015 consolidated financial statements have been reclassified to conform to the 2017 presentation. The adjustments to prior years relate to the 2017 stock split and segment realignment.
We consolidate any entity in which we have a controlling financial interest. Under the voting interest model, generally the investor that has voting control (usually more than 50% of an entity’s voting interests) consolidates the entity. Under the variable interest entity (“VIE”) model, the party that has the power to direct the entity’s most significant economic activities
54
and the ability to participate in the entity’s economics consolidates the entity. An entity is considered a VIE if it possesses one of the following characteristics: 1) the entity is thinly capitalized; 2) residual equity holders do not control the entity; 3) equity holders are shielded from economic losses; 4) equity holders do not participate fully in an entity’s residual economics; and 5) the entity was established with non-substantive voting interests.
For consolidated subsidiaries that are less than wholly owned, the third-party holdings of equity interests are referred to as non-controlling interests. Non-controlling interests that are redeemable or convertible for cash or other assets at the option of the holder are classified separate from stockholders’ equity on the Consolidated Balance Sheet. The portion of net income (loss) attributable to the non-controlling interest for such subsidiaries is presented as net income (loss) attributable to non-controlling interest in the Consolidated Statement of Income.
We had the following significant operating joint ventures prior to March 2017: BFDS; IFDS U.K.; and IFDS L.P. We did not have a controlling financial interest in these entities and therefore accounted for the financial results of these operating joint ventures using the equity method of accounting. In March 2017, we acquired State Street’s ownership in both BFDS and IFDS U.K., which resulted in control of the entities. As such, they were consolidated in our financial results from the date control was obtained. We continue to account for IFDS L.P. as an equity method investment.
We are the lessee in a series of operating leases covering a large portion of our Kansas City, Missouri-based leased office facilities. The lessors are generally joint ventures (in which we have a 50% ownership) that have been established specifically to purchase, finance and engage in leasing activities with the joint venture partners and unrelated third parties. Our analysis of our real estate joint ventures for all periods presented indicate that none qualified as a VIE and, accordingly, they have not been consolidated.
We provide investment management services to, and have transactions with, various exchange traded funds, mutual funds and other investment products sponsored by the Company in the normal course of business. We generally are considered to have a controlling financial interest in a fund when we own a majority of the outstanding controlling shares, which may arise as a result of seed capital investments in newly launched investment products from the time of initial launch to the time that the fund becomes majority-held by third-party investors.
Use of estimates
The preparation of financial statements in conformity with accounting principles generally accepted in the United States of America requires management to make estimates and assumptions that affect the reported amounts of assets and liabilities, disclosure of contingent assets and liabilities and the reported amounts of revenues and expenses. Actual results could differ from those estimates.
Revenue recognition
We recognize revenue when it is realized or realizable and it is earned. The majority of our revenues are derived from computer processing and services and are recognized upon completion of the services provided. Software license fees, maintenance fees and other ancillary fees are recognized as services are provided or delivered and all client obligations have been met. We periodically provide upfront cash payments to our clients to assist with the significant upfront costs associated with converting to new systems. Such payments are initially recorded within Other assets on the Consolidated Balance Sheet and treated as a reduction of revenue over the term of the related contract. We generally do not have payment terms from clients that extend beyond one year. Revenue from operating leases is recognized monthly as the rent accrues. Billing for services in which cash is collected in advance of performance is recorded as deferred revenue. Allowances for billing adjustments and bad debt expense are estimated as revenues are recognized. Allowances for billing adjustments are recorded as reductions in revenues and bad debt expense is recorded within Costs and expenses. The annual amounts for these items are generally immaterial to our consolidated financial statements, however in 2017 we had $37.5 million of bad debt expense, which is reflected in Costs and expenses, primarily as a result of a client termination agreement.
We recognize revenue when the following criteria are met: 1) persuasive evidence of an arrangement exists; 2) delivery has occurred or services have been rendered; 3) the sales price is fixed or determinable; and 4) collectability is reasonably assured. If there is a client-specific acceptance provision in a contract or if there is uncertainty about client acceptance, the associated revenue is deferred until we have evidence of client acceptance.
Revenue arrangements with multiple deliverables are evaluated to determine if the deliverables (items) can be divided into more than one unit of accounting. An item can generally be considered a separate unit of accounting if both of the following criteria are met: 1) the delivered item(s) has value to the client on a standalone basis and 2) if the arrangement includes a general right of return relative to the delivered item(s), delivery or performance of the undelivered item(s) is considered
55
probable and substantially in our control. Once separate units of accounting are determined, the arrangement consideration is allocated at the inception of the arrangement to all deliverables using the relative selling price method. Relative selling price is obtained from sources such as vendor-specific objective evidence, which is based on the separate selling price for that or a similar item or from third-party evidence such as how competitors have priced similar items. If such evidence is unavailable, we use our best estimate of the selling price, which includes various internal factors such as our pricing strategy and market factors.
Software license revenues are recognized at the time the contract is signed, the software is delivered and no future software obligations exist. Deferral of software license revenue results from delayed payment provisions, disproportionate discounts between the license and other services or the inability to unbundle certain services. We recognize revenues for maintenance services ratably over the contract term, after collectability has been reasonably assured.
Reimbursements received for “out-of-pocket” (“OOP”) expenses, such as postage and telecommunications charges, are recorded as revenue on an accrual basis. Because these additional revenues are offset by the reimbursable expenses incurred, there is minimal impact on income from operations and net income. For each segment, total revenues are reported in two categories, operating revenues and OOP reimbursements. OOP expenses are included in costs and expenses.
Costs and expenses
Costs and expenses include all costs, excluding depreciation and amortization, incurred to produce revenues. We believe that the nature of our business as well as our organizational structure, in which virtually all officers and associates have operational responsibilities, does not allow for a meaningful segregation of selling, general and administrative costs. These costs, which we believe to be immaterial, are also included in costs and expenses. Substantially all depreciation and amortization is directly associated with the production of revenues.
Cash equivalents
Short-term liquid investments with original maturities of 90 days or less are considered cash equivalents. Due to the short-term nature of these investments, carrying value approximates market value.
Client funds/obligations
Funds held on behalf of clients
In connection with providing data processing services for our clients, we may hold client funds on behalf of transfer agency clients and pharmacy processing clients. End-of-day available client bank balances for full service mutual fund transfer agency clients are invested overnight. Invested balances are returned to the full service mutual fund transfer agency client accounts the following business day. Funds received from clients for the payment of pharmacy claims incurred by its members are invested until the claim payments are presented to the bank. These amounts are included in funds held on behalf of clients in the Consolidated Balance Sheet and represent assets that are restricted for use.
Client funding receivable
Client funding receivables represent amounts due to us for pharmacy claims paid in advance of receiving client funding and for pharmacy claims processed for which client funding requests have not been made.
Client funds obligations
Client funds obligations represent our contractual obligations to remit funds to satisfy client pharmacy claim obligations and are recorded on the balance sheet when incurred, generally after a claim has been processed by us. In addition, client funds obligations include transfer agency client balances invested overnight.
We have reported the cash flows related to the purchases of investment funds (available-for-sale securities) held on behalf of clients and the cash flows related to the proceeds from the sales/maturities of investment funds held on behalf of clients on a gross basis in the investing section of the Consolidated Statement of Cash Flows. We have reported the cash inflows and outflows related to client fund investments on a net basis within net (increase) decrease in restricted cash and cash equivalents held to satisfy client funds obligations in the investing section of the Consolidated Statement of Cash Flows. We have reported the cash flows related to client funds used in investing activities on a net basis within net increase (decrease) in client funds obligations in the financing section of the Consolidated Statement of Cash Flows.
56
Investments
The equity method of accounting is used for investments in entities, partnerships and similar interests (including investments in private equity funds where we are the limited partner) in which we have significant influence but do not control. Under the equity method, we recognize income or losses from our pro-rata share of these unconsolidated affiliates’ net income or loss, which changes the carrying value of the investment of the unconsolidated affiliate. In certain cases, pro-rata losses are recognized only to the extent of our investment in and advances to the unconsolidated affiliate.
The cost method of accounting is used for these investments when we have a de minimis ownership percentage and do not have significant influence. Our cost method investments are held at the lower of cost or market. These investments do not have readily determinable fair values and the fair value of a cost-method investment is not required to be estimated unless there are identifiable events or changes in circumstances that may have a significant adverse effect on the fair value of the investment.
Investments classified as available-for-sale securities are reported at fair value with unrealized gains and losses excluded from earnings and recorded net of deferred taxes directly to stockholders’ equity as accumulated other comprehensive income. Investments in trading securities are reported at fair value with unrealized gains and losses included in earnings. Investments classified as held-to-maturity securities are recorded at amortized cost, which approximates fair value. Fair value adjustments and realized gains and losses are determined on a specific identification basis.
We regularly review investment securities for impairment based on both quantitative and qualitative criteria that include the extent to which cost exceeds fair value, the duration of any market decline, and the financial health of and specific prospects for the issuer. We record an investment impairment charge for an investment with a gross unrealized holding loss resulting from a decline in value that is other than temporary.
Investment funds which are consolidated as a result of our seed capital investment are considered investment companies and therefore we retain the specialized industry accounting principles of these investment products in our consolidated financial statements. Upon consolidation of a fund, the underlying securities of the fund are reflected at fair value with gains and losses included in Other income, net in the Consolidated Statement of Income.
Security transactions and investment income
Security transactions are accounted for on the trade date. Security gains and losses are calculated on the specific identification method. Dividend income is recorded on the ex-dividend date. Interest income, adjusted for discounts and premiums, is recorded on the accrual basis.
Property and equipment
Property and equipment are recorded at cost with major additions and improvements capitalized. Cost includes the amount of interest cost associated with significant capital additions. Depreciation of buildings is recorded using the straight-line method over 30 to 40 years. Technology equipment, furniture, fixtures and other equipment are depreciated using accelerated methods over the estimated useful lives, principally three to five years. Software is depreciated using the straight-line method over the estimated useful lives, generally three to five years. Leasehold improvements are depreciated using the straight-line method over the lesser of the term of the lease or life of the improvements. We review, on a quarterly basis, our property and equipment for possible impairment.
Purchased software is recorded at cost and is amortized over the estimated economic life, which is generally three to five years. We capitalize costs for the development of internal use software, including coding and software configuration costs and costs of upgrades and enhancements, after the preliminary project phase has been completed and management has committed to funding the project. These costs are amortized on a straight-line basis, depending on the nature of the project, generally over a three to five year period. We review, on a quarterly basis, our capitalized software for possible impairment.
Development costs for software that will be sold or licensed to third parties, prior to the achievement of technological feasibility, are expensed as incurred. We capitalize software development costs for software that will be sold or licensed to third parties which are incurred after the products reach technological feasibility but prior to the general release of the product to clients. These capitalized development costs are amortized on a product-by-product basis using the greater of the amount computed by taking the ratio of current year’s gross revenues to current and anticipated future gross revenues or the amount computed by the straight-line method over the estimated useful life of the product, which is generally three to five years. We evaluate the net realizable value of capitalized software development costs on a product-by-product basis.
57
Goodwill and intangible assets
We have recorded goodwill and intangible assets in connection with various acquisitions of businesses. Intangible assets at December 31, 2017 and 2016 primarily represent client relationships and other definite lived intangible assets (trade names, non-compete agreements, etc.) acquired. The estimated useful life on these intangible assets ranges from 3 to 19 years. The weighted average amortization period at December 31, 2017 for client relationships and other intangible assets is 13.0 and 8.7 years, respectively.
We assess the impairment of goodwill at least annually (as of October 1) and assess identifiable intangibles, long-lived assets and related assets whenever events or changes in circumstances indicate that the carrying value may not be recoverable. Intangible assets that have finite lives will continue to be amortized over their useful lives.
Our assessments of goodwill for impairment for 2017 and 2016 included a quantitative assessment that compared the fair value to the net book value of our reporting units. The fair value of the reporting units was estimated using the present value of expected future cash flows. For 2015, we performed a qualitative assessment that considered various factors, including growth in operating revenues and income from operations of our reporting units since our last quantitative assessment in 2014. Our 2017, 2016 and 2015 annual goodwill impairment tests determined that goodwill was not impaired, except during 2016 for the goodwill held at the Customer Communications U.K. reporting unit, which was included as a component of discontinued operations as of December 31, 2016, as further described in Note 4, “Discontinued Operations.”
Income taxes
We recognize the amount of income taxes payable or refundable for the current year and deferred tax liabilities and assets for the future tax consequences of events that have been recognized in our financial statements or tax returns. Deferred income tax effects of transactions reported in different periods for financial reporting and income tax return purposes are recorded by the liability method. This method gives consideration to the future tax consequences of deferred income or expense items and differences between the income tax and financial accounting statement bases of assets and liabilities and immediately recognizes changes in income tax laws upon enactment. The income statement effect is generally derived from changes in deferred income taxes on the balance sheet.
From time to time, we enter into transactions for which the tax treatment under the Internal Revenue Code or applicable state tax laws is uncertain. We provide federal and/or state income taxes on such transactions, together with related interest, net of income tax benefit, and any applicable penalties in accordance with accounting guidance for income tax uncertainties. We record income tax uncertainties that are estimated to take more than 12 months to resolve as non-current. Interest and penalties related to unrecognized tax benefits, if any, are recorded in income tax expense.
Foreign currency translation
Our international subsidiaries use the local currency as the functional currency. We translate our assets and liabilities at period-end exchange rates. Income and expense accounts are translated at average rates during the period.
Earnings per share
Basic earnings per share are determined by dividing net income by the weighted average number of common shares outstanding during the year. Diluted earnings per share are determined by including the dilutive effect of all potential common shares outstanding during the year. See Note 13, “Equity,” for additional details regarding our earnings per share computation.
Derivative and hedging activities
We recognize all derivatives as either assets or liabilities in the balance sheet and measure those instruments at fair value and the changes in the fair value of derivatives are recorded each period in current earnings or other comprehensive income, depending on whether a derivative is designated as part of a hedge transaction and, if it is, the type of hedge transaction. From time to time, we utilize derivatives to manage interest rate and foreign currency risks. We do not enter into derivative arrangements for speculative purposes. At December 31, 2017 and 2016, we had derivative instruments outstanding as described in Note 11, “Hedging Transactions and Derivative Financial Instruments.” We include cash flows related to derivative instruments qualifying for hedge accounting and economic hedges in the same category as the item being hedged in the Consolidated Statement of Cash Flows.
58
Comprehensive income
Our comprehensive income consists of net income and unrealized gains or losses on available-for-sale securities, our proportional share of unconsolidated affiliates’ other comprehensive income (limited by the carrying value of the investment), unrealized gains or losses on our cash flow hedges, changes in defined benefit pension items and foreign currency translation adjustments, which are presented in the Consolidated Statement of Comprehensive Income, net of tax and reclassifications to earnings.
Share-based compensation
We have share-based compensation plans covering our employees and our non-employee directors and have outstanding share awards (primarily in the form of stock options, restricted stock units and performance stock units) under each of these plans. We recognize the cost of employee services received in exchange for awards of equity instruments based on the grant date fair value of those awards. For share-based awards that contain a service feature, we expense the grant date fair value of these awards using the straight-line method over the service period. For share-based awards containing both service and performance features, amortization of expense depends on our judgments whether the performance conditions will be achieved and is incurred over the expected period to achieve the required performance criteria. We account for forfeitures as they occur rather than using an estimated forfeiture rate.
Contingencies
Loss contingencies from legal proceedings and claims may occur from government investigations, shareholder lawsuits, contractual claims, tax and other matters. Accruals are recognized when it is probable that a liability will be incurred and the amount of loss can be reasonably estimated. Gain contingencies (including contingent proceeds related to business divestitures) are not recognized until realized. Legal fees are expensed as incurred.
New authoritative accounting guidance
Recently Adopted Accounting Pronouncements
In January 2017, the Financial Accounting Standards Board (“FASB”) issued guidance which simplifies goodwill impairment testing including eliminating the requirement to calculate the implied fair value of goodwill in determining the existence and value of a goodwill impairment. The guidance was adopted by us on January 1, 2017 and effective for our annual goodwill impairment assessment for 2017.
In March 2016, the FASB issued guidance which simplifies several aspects of the accounting for employee share-based payment transactions, including the accounting for income taxes, forfeitures, and statutory tax withholding requirements, as well as classification of related amounts within the statement of cash flows. The guidance was adopted by us on January 1, 2017 and resulted in approximately $3.0 million of excess tax benefits being recognized in Income taxes in the Consolidated Statement of Income for the year ended December 31, 2017. We also elected to account for forfeitures as they occur rather than using an estimated forfeiture rate. The impact to our consolidated financial statements was not material.
Accounting Pronouncements Pending Adoption
In August 2017, the FASB issued guidance which simplifies the hedge accounting model and includes new permitted methodologies for measuring changes in the fair value of hedged risks and new presentation and disclosure requirements. The guidance is effective January 1, 2019 and requires a modified retrospective application for existing hedges on the date of adoption. Early adoption is permitted. We are currently evaluating the standard and the impact it will have on our consolidated financial statements, however we do not expect it to have a material impact on our consolidated financial statements.
In November 2016, the FASB issued guidance which requires the statement of cash flows to explain changes during the period in the total of cash, cash equivalents, and amounts generally described as restricted cash or restricted cash equivalents. The guidance is effective January 1, 2018 and requires retrospective application. Early adoption is permitted. Beginning January 1, 2018, we will include restricted cash and restricted cash equivalents associated with funds held on behalf of clients, as a component of cash, cash equivalents, restricted cash and restricted cash equivalents in the Consolidated Statement of Cash Flows. The impact on our consolidated financial statements will be limited to cash flows from investing activities.
In October 2016, the FASB issued guidance which requires the recognition of income tax consequences for intra-entity transfers of assets other than inventory. The guidance is effective January 1, 2018 and requires modified retrospective application. Early adoption is permitted. We have evaluated the standard and concluded it will not impact our consolidated financial statements and related disclosures.
59
In February 2016, the FASB issued guidance which requires lessees to reflect most leases on their balance sheet as assets and obligations. The guidance is effective January 1, 2019 with early adoption permitted. The standard will be applied under the modified retrospective method, with elective reliefs, which requires application of the new guidance for all periods presented. We are currently evaluating the standard and the impact it will have on our consolidated financial statements and related disclosures, however we currently expect that the most significant changes will be related to the recognition of right-of-use assets and lease liabilities in our Consolidated Balance Sheet, with no material impact to our Consolidated Statement of Income.
In January 2016, the FASB issued guidance which updates the reporting model for certain financial instruments, including the requirement for equity investments (except those accounted for under the equity method of accounting or those that result in consolidation of the investee) to be measured at fair value with changes in fair value recognized in net income. The guidance is effective January 1, 2018 and requires a cumulative-effective adjustment as of the beginning of the fiscal year of adoption. Beginning January 1, 2018, our private equity funds and other investments currently accounted for under the cost method, as well as our available-for-sale securities, will be measured at fair value each reporting period resulting in increased volatility in our Consolidated Statement of Income. We expect to record a $34.7 million pre-tax increase to Investments and Stockholders’ Equity upon adoption of this guidance.
In May 2014, the FASB issued guidance which requires companies to recognize revenue to depict the transfer of promised goods or services to clients in an amount that reflects the consideration it expects to be entitled in exchange for those goods or services. The new standard and subsequently issued amendments is effective January 1, 2018. We will adopt the guidance using the modified retrospective transition approach. We continue to evaluate the impacts of the application of the new standard to our client contracts and expect the adoption of the standard will change the timing of when revenue is recognized for certain revenue streams. We currently anticipate that the majority of our contracts with clients that include account- and/or transaction-based processing fees will be accounted for under the series deliverable guidance in the new standard which will likely result in minimal changes as compared to our historical revenue recognition. These revenues will continue to be recognized over time as a single stand-ready performance obligation. As such, we do not currently anticipate significant changes in current systems or processes and do not believe there will be a material impact of adopting the new revenue standard on our consolidated financial statements.
3. Significant Business Transactions and Events
Significant Business Acquisitions
Acquisition of the remaining interest in BFDS
On March 27, 2017, we entered into a series of definitive agreements to acquire State Street’s equity interest in our BFDS joint venture, which provides shareholder recordkeeping, intermediary and investor services, and regulatory compliance solutions to financial services clients in the United States. We also acquired an investment in a privately-held company and the equity interest in IFDS Realty, LLC, which holds the real estate assets used in BFDS’ operations, through a distribution from IFDS L.P., our 50/50 joint venture with State Street. As a result of these transactions, we expect to enhance the strategic value we can provide to our clients through full service capabilities while also realizing internal synergies through increased scale and operational efficiencies.
The BFDS transaction, which closed on March 30, 2017, was structured as a non–taxable exchange under Section 355 of the Internal Revenue Code. At closing, DST delivered to State Street approximately 2.0 million shares of State Street common stock with a closing date fair value of $163.4 million (with a cost basis for tax purposes of approximately $1.1 million and a cost basis for book purposes of approximately $16.8 million) in exchange for State Street’s equity interest in BFDS. The number of shares delivered at closing was calculated using the negotiated fair value of $157.6 million and the closing price of State Street’s stock at signing. BFDS is included within the Domestic Financial Services segment.
The acquisition of State Street’s 50% equity interest in BFDS was accounted for as a step-acquisition. Accordingly, we remeasured our previously held non-controlling equity interest in BFDS to the estimated fair value of $151.1 million, resulting in a gain of $56.0 million recorded at the acquisition date, within Other income, net in the Consolidated Statement of Income. The fair value of the previously held equity interest in BFDS was determined using various valuation techniques, including market comparable transactions and discounted cash flow analysis adjusted for a control premium. These fair value measurements are based on significant inputs, such as forecasted cash flows and discount rates, that are not observable in the market (Level 3). In addition, we recognized a $146.6 million gain in Other income, net in the Consolidated Statement of Income related to the State Street shares exchanged in the transaction.
60
The factors described above, combined with the synergies expected from combining our operations with the acquired entity and the resulting enhanced clarity in the service offerings available to our clients, are the basis for the acquisition price paid resulting in $68.7 million of goodwill included in total assets of the Domestic Financial Services segment, none of which is expected to be deductible for tax purposes.
The transaction was accounted for using the acquisition method of accounting, and as such, assets acquired, liabilities assumed, and consideration transferred were recorded at their estimated fair values on the acquisition date. Subsequent to the acquisition date, our initial purchase price allocation and estimate of fair value for certain intangible assets and related income tax effects were adjusted based on facts and circumstances existing at the acquisition date. Future adjustments to the purchase price allocation could be significant as valuations for tangible, intangible assets and contingent liabilities are finalized and the associated income tax impacts are determined.
The following table summarizes the aggregate acquisition-date fair value of the consideration transferred for the acquisition of BFDS and the amounts recognized as of the acquisition date for the assets acquired and liabilities assumed (in millions):
Consideration | |||
Fair value of common stock used to acquire the remaining equity interests in BFDS, certain investments and real estate | $ | 163.4 | |
Estimated fair value of DST’s previously-held equity interests (1) | 151.1 | ||
Effective settlement of pre-existing relationships | (5.9 | ) | |
Total consideration transferred | $ | 308.6 | |
Recognized amounts of identifiable assets acquired and liabilities assumed | |||
Cash and cash equivalents | $ | 96.8 | |
Accounts receivable | 81.6 | ||
Other current assets | 3.6 | ||
Investments (2) | 35.8 | ||
Properties (3) | 22.6 | ||
Intangible assets | 57.2 | ||
Goodwill | 68.7 | ||
Deferred income taxes | 2.2 | ||
Other assets | 3.2 | ||
Total assets | 371.7 | ||
Accounts payable | 5.2 | ||
Accrued compensation and benefits | 15.4 | ||
Deferred revenue | 2.1 | ||
Other current liabilities | 7.4 | ||
Other liabilities | 33.0 | ||
Total liabilities | 63.1 | ||
Net assets acquired | $ | 308.6 | |
(1) | Equals the estimated fair value of DST’s previously-held equity interest in BFDS valued at $151.1 million, which represents an approximate 7.5% discount to the acquisition price for State Street’s equity interests in BFDS prior to the acquisition date. The difference between the fair value of State Street common stock transferred of $163.4 million and the $151.1 million represents an estimate of a control premium, which has not been included in the valuation of DST’s previous non-controlling interest. |
(2) | As a result of the acquisition of the remaining interests in BFDS, we acquired certain investments associated with active deferred compensation plans for senior management and certain highly compensated employees. Approximately $3.7 million of the underlying investments were in DST common stock. As a result, the common stock was considered effectively repurchased at the acquisition date and reclassified to Treasury stock in the Consolidated Balance Sheet. |
(3) Includes $2.0 million of acquired software with a weighted-average useful life of 5 years.
61
The following table summarizes the intangible assets acquired and estimated weighted-average useful lives as of the acquisition date (in millions):
Fair Value | Weighted-Average Useful Life | ||||
Client relationships | $ | 57.2 | 13 years | ||
The operating results of BFDS were combined with our operating results subsequent to the acquisition date. Approximately $206.9 million of total revenues, net of intercompany eliminations, and $28.8 million of pretax income of the acquired business is included in the Consolidated Statement of Income for the year ended December 31, 2017.
Acquisition of the remaining interests in IFDS U.K.
On March 27, 2017, we acquired State Street’s ownership of our IFDS U.K. joint venture, an investor and policy holder administrative services and technology provider to the collective funds, insurance, and retirement industries, for $141.0 million. Additionally, we acquired from our IFDS L.P. joint venture both the equity interest in IFDS Realty U.K. LLC (“IFDS Realty U.K.”), which holds certain real estate utilized by the U.K. business, and the equity interest in IFDS Percana Group Ltd. (“IFDS Percana”) for total cash consideration of $68.0 million. As a result of DST’s 50% ownership in IFDS L.P., approximately half of the cash consideration DST paid to IFDS L.P. was distributed to DST in the form of a distribution, resulting in net cash paid for the acquisition, after cash distributions of approximately $175.0 million. The acquisition was funded through cash on hand and our existing debt facilities. In addition, concurrent with the acquisition of the remaining interests in IFDS U.K., we also purchased State Street’s notes receivable from IFDS U.K. for cash consideration of $25.9 million, which approximated the fair value of the note at the acquisition date. We will continue to service offshore and cross-border markets in Canada, Ireland and Luxembourg through IFDS L.P., our 50/50 joint venture with State Street. IFDS U.K., IFDS Realty U.K. and IFDS Percana are included within the International Financial Services segment. As a result of these transactions, we expect to enhance the strategic value we can provide to our clients through full service capabilities while also realizing internal synergies through increased scale and operational efficiencies.
The acquisition of State Street’s 50% equity interest in IFDS U.K. was accounted for as a step-acquisition. Accordingly, we remeasured our previously held non-controlling equity interest in IFDS U.K. to the estimated fair value of $136.8 million, resulting in a loss of $12.2 million at the acquisition date, which is included in Other income, net in the Consolidated Statement of Income. The fair value of the previously held equity interest in IFDS U.K. was determined using various valuation techniques, including market comparable transactions and discounted cash flow analysis adjusted for a control premium. These fair value measurements are based on significant inputs, such as forecasted cash flows and discount rates, that are not observable in the market (Level 3).
The factors described above, combined with the benefits expected from the opportunities for enhanced efficiencies in our delivery model, are the basis for the acquisition price paid resulting in $196.7 million of goodwill included in total assets of the International Financial Services segment, of which $18.9 million is expected to be deductible for tax purposes.
The transaction was accounted for using the acquisition method of accounting, and as such, assets acquired, liabilities assumed, and consideration transferred were recorded at their estimated fair values on the acquisition date. Subsequent to the acquisition date, our initial purchase price allocation and estimate of fair value for certain intangible assets and related income tax effects were adjusted based on facts and circumstances existing at the acquisition date. Future adjustments to the purchase price allocation could be significant as valuations for certain tangible assets, intangible assets and contingent liabilities are finalized and associated income tax impacts are determined.
62
The following table summarizes the aggregate acquisition-date fair value of the consideration transferred for the acquisition of the remaining interests in IFDS U.K., IFDS Realty U.K. and IFDS Percana and the amounts recognized as of the acquisition date for the assets acquired and liabilities assumed (in millions):
Consideration | |||
Cash paid to acquire the remaining equity interests in IFDS U.K. and other related interests (1) | $ | 234.9 | |
Estimated fair value of previously-held equity interests (2) | 136.8 | ||
Effective net settlement of pre-existing relationships | 54.5 | ||
Total consideration transferred | $ | 426.2 | |
Recognized amounts of identifiable assets acquired and liabilities assumed | |||
Cash and cash equivalents | $ | 99.2 | |
Accounts receivable | 101.7 | ||
Other current assets | 14.4 | ||
Properties (3) | 94.7 | ||
Intangible assets | 104.0 | ||
Goodwill | 196.7 | ||
Deferred income taxes | 11.6 | ||
Other assets | 2.1 | ||
Total assets | 624.4 | ||
Current portion of long-term debt | 2.8 | ||
Accounts payable | 29.1 | ||
Accrued compensation and benefits | 23.6 | ||
Deferred revenue | 31.1 | ||
Other current liabilities | 61.7 | ||
Long-term debt | 26.3 | ||
Other liabilities | 23.6 | ||
Total liabilities | 198.2 | ||
Net assets acquired | $ | 426.2 | |
(1) | Cash paid is comprised of cash payments to acquire State Street’s equity interest in IFDS U.K. and a note receivable from IFDS U.K., as well as IFDS L.P.’s equity interests in IFDS Percana and IFDS Realty U.K. |
(2) | Equals the estimated fair value of DST’s previously-held equity interest in IFDS U.K. valued at $136.8 million, which represents an approximate 3.0% discount to the acquisition price for State Street’s equity interests in IFDS U.K. prior to the acquisition date. The difference between the $141.0 million of cash paid to acquire State Street’s equity interests in IFDS U.K. and the $136.8 million represents an estimate of a control premium, which has not been included in the valuation of DST’s previous non-controlling interest. |
(3) Includes $21.0 million of acquired software with a weighted-average useful life of 6 years.
The following table summarizes the intangible assets acquired and estimated weighted-average useful lives as of the acquisition date (in millions):
Fair Value | Weighted-Average Useful Life | ||||
Client relationships | $ | 104.0 | 10 years | ||
The operating results of IFDS U.K. were combined with our operating results subsequent to the acquisition date. Approximately $436.7 million of total revenues, net of intercompany eliminations, and $79.0 million of pretax income of the acquired business is included in the Consolidated Statement of Income for the year ended December 31, 2017. These amounts include the financial impact of a formal termination agreement that was reached with a wealth management platform client for whom we were completing multi-year development and implementation efforts. As a result of this agreement, during 2017, DST recognized previously deferred revenue and termination payments received totaling $93.2 million as incremental operating
63
revenue. DST also incurred bad debt expense of $34.5 million for previously invoiced services for which payment will now not be collected and $5.2 million of other termination-related charges.
In April 2017, we signed an amendment to an existing servicing agreement, which extends in excess of ten years, with a U.K. wealth management platform client. As part of this amendment, we made up-front payments totaling £60.0 million to the client during 2017 which have been classified within Other assets on the Consolidated Balance Sheet. These payments are expected to be recovered over the term of the revised contractual arrangement.
The following table summarizes the unaudited pro forma results of operations for the years ended December 31, 2017 and 2016 as if the BFDS and IFDS U.K. acquisitions had occurred on January 1, 2016 (in millions, except per share amounts):
Year Ended December 31, | |||||||
2017 | 2016 | ||||||
Total revenues | $ | 2,366.3 | $ | 2,327.0 | |||
Net income attributable to DST Systems, Inc. | 273.0 | 386.3 | |||||
Diluted earnings per share | 4.40 | 5.79 | |||||
The pro forma financial information adjusts the actual combined results for items that are recurring in nature and directly attributable to the acquisitions of the remaining interests in BFDS and IFDS U.K., including intangible asset amortization and fair value adjustments for property, plant and equipment, deferred revenue and other transaction related items. The year ended December 31, 2017 pro forma information was reduced by the net gains resulting from the transaction of $188.6 million. The unaudited pro forma amounts have been prepared based on estimates and assumptions, which we believe are reasonable, and are not indicative of what actual consolidated results of operations might have been if the acquisitions had been effective at the beginning of 2016, nor is it reflective of our expected actual results of operations for any future period.
We incurred approximately $5.1 million of pretax costs from 2015 through the year ended December 31, 2017 in connection with our acquisitions of the remaining interests in BFDS and IFDS U.K., which are included in Costs and expenses in our Consolidated Statement of Income.
Acquisition of Kaufman Rossin Fund Services LLC
On February 24, 2016, we acquired all of the membership interests of Kaufman Rossin Fund Services LLC (“KRFS”), for $94.7 million in cash. DST financed the acquisition through cash-on-hand and available lines of credit. KRFS is an independent, full-service provider of specialized hedge fund administration services to the global financial community. KRFS’ hedge fund services include accounting and valuation, back-office outsourcing, investor services, treasury services, and customized reporting. We expect the acquisition to provide us with additional opportunities within the alternative investment marketplace and expand our asset administration service offerings.
The factors described above, combined with the synergies expected from combining our operations with the acquired entity and the resulting expansion of the service offerings available to our clients, are the basis for the acquisition price paid resulting in $61.0 million of goodwill recorded, all of which is expected to be deductible for tax purposes. KRFS is included within the Domestic Financial Services segment. The transaction was accounted for using the acquisition method of accounting, and as such, assets acquired, liabilities assumed, and consideration transferred were recorded at their estimated fair values on the acquisition date.
64
The following table summarizes the aggregate acquisition-date fair value of the consideration transferred for the acquisition of KRFS and the amounts recognized as of the acquisition date for the assets acquired and liabilities assumed (in millions):
Consideration | |||
Cash paid | $ | 94.7 | |
Recognized amounts of identifiable assets acquired and liabilities assumed | |||
Cash and cash equivalents | $ | 1.0 | |
Accounts receivable | 2.9 | ||
Other current assets | 0.1 | ||
Investments | 0.5 | ||
Properties (1) | 6.8 | ||
Intangible assets | 23.4 | ||
Goodwill | 61.0 | ||
Total assets | 95.7 | ||
Deferred revenue | 0.6 | ||
Other current liabilities | 0.4 | ||
Total liabilities | 1.0 | ||
Net assets acquired | $ | 94.7 | |
______________________________________________
(1) Includes $6.5 million of acquired software with a weighted-average useful life of 6 years.
The following table summarizes the intangible assets acquired and estimated weighted-average useful lives as of the acquisition date (in millions):
Fair Value | Weighted-Average Useful Life | ||||
Client relationships | $ | 22.5 | 10 years | ||
Other | 0.9 | 3 years | |||
$ | 23.4 | ||||
The operating results of KRFS were combined with our operating results subsequent to the acquisition date. Approximately $20.9 million of revenues and $1.1 million of pretax income of the acquired business are included in the Consolidated Statement of Income for the year ended December 31, 2016. Pro-forma results of operations, assuming this acquisition was made at the beginning of the earliest period presented, have not been presented as the effect of this acquisition is not material to our results.
The following acquisitions during 2015 are included within the Domestic Financial Services segment:
Acquisition of kasina LLC
On January 1, 2015, we acquired all of the membership interests of kasina LLC, a strategic advisory firm to the asset management industry for $9.0 million of upfront cash consideration and up to $2.1 million of performance-related contingent consideration, based on the terms of the agreement, which were amended during 2016. The contingent consideration requires, subject to certain exceptions, future employment over the course of the performance period. The acquisition provides us with additional opportunities to provide a combination of advisory, research, technology and analytics to asset managers.
65
Acquisition of Red Rocks Capital LLC
On July 31, 2015, we acquired all of the membership interests of asset manager Red Rocks Capital LLC, which focuses on listed private equity and other private asset investments, for $45.0 million of upfront cash consideration and up to $20.0 million of performance-related contingent consideration. The performance-related contingent consideration is based on the achievement of certain annual revenue targets of the acquired business over an approximate four year period from the closing date and requires, subject to certain exceptions, future employment over the course of the performance period. As of December 31, 2017, the annual revenue targets for the first two performance periods and the continuing employment conditions for certain individuals were not achieved resulting in $1.0 million of remaining contingent consideration available to be earned. We expect the acquisition to provide us with additional opportunities within the alternative investment marketplace to enhance our ongoing asset management strategy.
Acquisition of Wealth Management Systems Inc.
On August 21, 2015, we acquired all of the outstanding common stock of Wealth Management Systems Inc., a provider of technology-based rollover services, for cash consideration of $65.1 million, which includes a $1.1 million adjustment agreed upon in December 2015 to settle working capital under the provisions of the purchase agreement. A post-closing settlement amount of $0.2 million was received in January 2016. Wealth Management Systems Inc. automates the migration of assets from retirement plans to investment management platforms. We expect the acquisition to provide us with additional opportunities to expand rollover service options to new and existing clients and enhance our ongoing retirement and asset management strategies.
The factors described above, combined with the synergies expected from combining our operations with each of the acquired entities and the resulting expansion of the service offerings available to our clients, are the basis for the acquisition prices paid resulting in $75.8 million of goodwill recorded, of which approximately $40.0 million is expected to be deductible for tax purposes. The transactions were accounted for using the acquisition method of accounting, with assets acquired, liabilities assumed, and consideration transferred recorded at their estimated fair values on the acquisition dates.
The following table summarizes the aggregate acquisition-date fair value of the consideration transferred for the acquisitions of kasina LLC, Red Rocks Capital LLC, and Wealth Management Systems Inc. and the amounts recognized as of the acquisition date for the assets acquired and liabilities assumed (in millions):
Consideration | |||
Cash paid | $ | 118.8 | |
Fair value of contingent consideration | 0.8 | ||
Fair value of total consideration transferred | $ | 119.6 | |
Recognized amounts of identifiable assets acquired and liabilities assumed | |||
Cash and cash equivalents | $ | 1.6 | |
Accounts receivable | 4.2 | ||
Other current assets | 0.2 | ||
Properties (1) | 3.3 | ||
Intangible assets | 49.5 | ||
Goodwill | 75.8 | ||
Total assets | 134.6 | ||
Accounts payable | 0.2 | ||
Accrued compensation and benefits | 0.4 | ||
Deferred revenue | 5.5 | ||
Other current liabilities | 0.7 | ||
Deferred income tax liabilities | 8.2 | ||
Total liabilities | 15.0 | ||
Net assets acquired | $ | 119.6 | |
_____________________________________________
(1) Includes $3.0 million of acquired software.
66
The following table summarizes the intangible assets acquired and estimated weighted average useful lives as of the acquisition dates (in millions):
Fair Value | Weighted Average Useful Life | ||||
Client relationships | $ | 48.0 | 17 years | ||
Other | 1.5 | 7 years | |||
$ | 49.5 | ||||
The operating results of kasina LLC, Red Rocks Capital LLC, and Wealth Management Systems Inc. were combined with our operating results subsequent to the acquisition dates. Approximately $10.4 million of revenues and $9.3 million of pretax losses of the acquired businesses are included in the Consolidated Statement of Income for the year ended December 31, 2015. Pro-forma results of operations, assuming these acquisitions were made at the beginning of the earliest period presented, have not been presented as the effect of these acquisitions are not material to our results.
Restructuring Initiatives
As a result of changes in our business environment, from time to time we will restructure one or more of our businesses to enhance operational efficiency.
During the year ended December 31, 2017, we incurred pretax restructuring charges related to employee terminations of $16.3 million within the Domestic Financial Services segment, $2.7 million in International Financial Services and $4.4 million within the Healthcare Services segment.
During the year ended December 31, 2016, we incurred pretax restructuring charges related to employee termination costs of $9.9 million and lease termination costs of $0.5 million within the Domestic Financial Services segment.
During the year ended December 31, 2015, we incurred $3.4 million of pretax charges related to employee termination costs as a result of a restructuring initiative within the Healthcare Services segment which includes the closure of an operating location at the end of the existing lease term in mid-2016.
As of December 31, 2017, 2016 and 2015, we had a remaining liability of $2.8 million, $0.6 million and $4.1 million, respectively, associated with these restructuring activities.
4. Discontinued Operations
On July 1, 2016, we completed the sale of our North American Customer Communications business for cash consideration of $410.7 million, after giving effect to a $0.7 million adjustment agreed upon in December 2016 to settle working capital and other matters under the terms of the agreement. We recorded an estimated pretax gain of $341.5 million on the sale during 2016. In 2015, we entered into a sale and leaseback of our four North American Customer Communications’ production facilities which had resulted in a deferred gain. This remaining lease obligation was included in the sale of North American Customer Communications and the unamortizaed deferred gain was included within the pretax gain recorded on the sale.
In April 2016, we completed the sale of our U.K. Customer Communications’ Bristol production facilities for pretax proceeds totaling approximately $16.0 million. Concurrent with this sale, we leased back approximately two-thirds of the facilities under a 12-year lease. The rent payments and associated rent expense of the Bristol production facilities are approximately $0.7 million per year over the 12-year lease term.
In February 2017, we updated our impairment analysis utilizing new information received (level 3 in the fair value hierarchy) regarding our U.K. Customer Communications business which indicated the carrying value exceeded the fair value of the business. As a result, we recorded an impairment charge of $17.0 million, which is included as a component of discontinued operations for the year ended December 31, 2016. The impairment resulted in the write-down of goodwill and long-lived assets of the business based on the estimated fair value. There was no tax benefit recognized for this impairment charge as it is not expected to be deductible for tax purposes.
On May 4, 2017, we completed the sale of our U.K. Customer Communications business for cash consideration of approximately $43.6 million, after giving effect to a $0.3 million adjustment agreed upon in October 2017 to settle working capital and other matters under the terms of the agreement. We recorded a pretax gain of $2.6 million on the sale. The
67
remaining lease obligation related to the sale and leaseback of the Bristol production facilities was included in the sale of U.K. Customer Communications.
We have classified the results of the two businesses sold as well as the gain realized upon sale as discontinued operations in our Consolidated Statement of Income and Consolidated Statement of Cash Flows for all periods presented. Additionally, the related assets and liabilities associated with our U.K. Customer Communications discontinued operations were classified as held for sale in our Consolidated Balance Sheet at December 31, 2016.
Pursuant to the terms of the North American transaction, we have provided certain information technology and operations processing activities to the North American Customer Communications business post-transaction and we expect to continue providing limited services for the next 3 years. Additionally, we will continue to incur costs for certain print-related services provided by the disposed business for an estimated period of 3 to 5 years following the transaction. The information technology and operations processing activities we performed after the sale of the business resulted in approximately $28.1 million of continuing cash inflows from the business sold and the costs incurred for certain print-related services provided by the business sold resulted in continuing cash outflows of approximately $50.3 million for the year ended December 31, 2017.
The revenues previously eliminated in consolidation that have continued post-transaction were approximately $25.9 million, $19.3 million and $13.8 million for the years ended December 31, 2017, 2016 and 2015, respectively. The expenses previously eliminated in consolidation that have continued post-transaction were approximately $51.3 million, $34.8 million and $19.3 million for the years ended December 31, 2017, 2016 and 2015, respectively. The revenues and expenses associated with these continued activities have been classified within continuing operations for all periods presented. The offsetting costs and revenues previously recorded within Customer Communications and eliminated in consolidation have been reclassified to discontinued operations for all periods presented.
As of December 31, 2017, all assets and liabilities previously classified as held for sale in our Consolidated Balance Sheet had been sold. The following table summarizes the assets and liabilities classified as held for sale in our Consolidated Balance Sheet as of December 31, 2016 (in millions):
December 31, | |||
2016 | |||
Assets | |||
Cash and cash equivalents | $ | 4.0 | |
Accounts receivable | 38.9 | ||
Unconsolidated affiliates | 0.2 | ||
Properties, net | 9.9 | ||
Intangible assets, net | 11.2 | ||
Other assets | 8.4 | ||
Total assets held for sale | $ | 72.6 | |
Liabilities | |||
Current portion of debt | $ | 0.4 | |
Accounts payable | 13.2 | ||
Accrued compensation and benefits | 3.8 | ||
Deferred revenues and gains | 0.8 | ||
Long-term debt | 1.7 | ||
Income taxes payable | 1.0 | ||
Other liabilities | 9.2 | ||
Total liabilities held for sale | $ | 30.1 | |
68
The following table summarizes the comparative financial results of discontinued operations which are presented as Income from discontinued operations, net of tax on our Consolidated Statement of Income (in millions):
Year Ended December 31, | |||||||||||
2017 | 2016 | 2015 | |||||||||
Operating revenues | $ | 53.4 | $ | 389.0 | $ | 608.0 | |||||
Out-of-pocket reimbursements | 12.8 | 409.0 | 743.1 | ||||||||
Total revenues | 66.2 | 798.0 | 1,351.1 | ||||||||
Costs and expenses | 63.8 | 747.6 | 1,247.3 | ||||||||
Depreciation and amortization (including goodwill impairment) | — | 28.9 | 30.9 | ||||||||
Operating income | 2.4 | 21.5 | 72.9 | ||||||||
Interest expense | — | — | (0.3 | ) | |||||||
Equity in earnings of unconsolidated affiliates | 0.2 | 0.3 | 0.4 | ||||||||
Net gain on business disposition | 2.6 | 341.5 | — | ||||||||
Income before income taxes | 5.2 | 363.3 | 73.0 | ||||||||
Income taxes | 0.7 | 115.0 | 24.5 | ||||||||
Income from discontinued operations, net of tax | $ | 4.5 | $ | 248.3 | $ | 48.5 | |||||
5. Investments
Investments are as follows (in millions):
Carrying Value | |||||||
December 31, 2017 | December 31, 2016 | ||||||
Available-for-sale securities: | |||||||
State Street Corporation | $ | — | $ | 169.6 | |||
Other available-for-sale securities | 11.8 | 10.9 | |||||
11.8 | 180.5 | ||||||
Other: | |||||||
Trading securities | 33.6 | 7.9 | |||||
Seed capital investments, at fair value | 12.1 | 61.0 | |||||
Cost method, private equity and other investments | 142.2 | 128.0 | |||||
187.9 | 196.9 | ||||||
Total investments | $ | 199.7 | $ | 377.4 | |||
Certain information related to our available-for-sale securities is as follows (in millions):
December 31, | |||||||
2017 | 2016 | ||||||
Book cost basis | $ | 8.6 | $ | 28.4 | |||
Gross unrealized gains | 3.2 | 152.1 | |||||
Market value | $ | 11.8 | $ | 180.5 | |||
69
At December 31, 2017 and 2016, our carrying value of available-for-sale investments was $11.8 million and $180.5 million, respectively, based on the closing price on the New York Stock Exchange at the respective year end. The balance as of December 31, 2016 primarily consisted of the ownership of 2.2 million shares of State Street. In 2017, we transferred approximately 2.0 million shares of State Street common stock as part of the non-taxable exchange transaction to acquire State Street’s 50% interest in BFDS. Our remaining shares of State Street were transferred in a non-monetary charitable contribution recognized at market value. The majority of the $62.2 million of the deferred tax liabilities associated with the available-for-sale investments as of December 31, 2016 were derecognized during the year ended December 31, 2017 as a result of the non-taxable exchange of the State Street shares for State Street’s ownership interest in BFDS.
During the years ended December 31, 2017, 2016 and 2015, we received $4.2 million, $61.2 million and $303.5 million, respectively, from the sale of investments in available-for-sale securities. Gross realized gains of $170.2 million, $6.1 million and $175.1 million and gross realized losses of $14.3 million, $3.8 million and $6.7 million, were recorded in 2017, 2016 and 2015, respectively, from the disposal of available-for-sale securities. Gross realized gains in 2017 included a net gain of $145.1 million from the exchange of State Street shares for State Street’s 50% interest in BFDS and a gain of $10.4 million from the charitable contribution of our remaining shares in State Street. We recorded no losses on available-for-sale securities related to other-than-temporary investments impairments for the year ended December 31, 2017. We recorded losses on available-for-sale securities of $0.2 million and $4.8 million related to other-than-temporary investment impairments for the years ended December 31, 2016 and 2015, respectively. These gains and losses are included as a component of Other income, net in the Consolidated Statement of Income. We had no securities in an unrealized loss position as of December 31, 2017. The fair value and gross unrealized losses of securities in a continuous loss position at December 31, 2016 were not significant.
We consolidate the investments of open-end funds in which we own a controlling interest as a result of our seed capital investments. At December 31, 2016, we had a controlling interest in seed capital investments of $53.6 million which is comprised primarily of equity securities as well as $8.4 million of cash collateral deposited with a broker for securities sold short. In March 2017, we reduced our ownership interest in a substantial portion of our seed capital investments, resulting in the deconsolidation of the respective fund. We held non-controlling interests in certain seed capital investments of $12.1 million and $7.4 million at December 31, 2017 and 2016, respectively.
We are a limited partner in various private equity funds. Our involvement in the financing operations of the private equity fund investments is generally limited to our investments in the entities. At December 31, 2017 and 2016, our carrying value of these private equity fund investments was approximately $91.3 million and $111.2 million, respectively. At December 31, 2017, we had future capital commitments related to these private equity fund investments of approximately $3.0 million. Additionally, we have other investments with a carrying value of $50.9 million and $16.8 million at December 31, 2017 and 2016, respectively. We account for private equity funds and other investments primarily under the cost method as we do not have a controlling interest or the ability to exercise significant influence over these companies and these investments do not have readily determinable fair values, except for certain other investments which are measured using net asset value as a practical expedient for fair value. At December 31, 2017 and 2016, we held approximately $7.6 million and $11.5 million, respectively, of pooled funds measured using net asset value within our other investments.
We record lower of cost or market valuation adjustments on cost method and other investments when impairment conditions, such as adverse market conditions or poor performance of the underlying investments, are present. During the years ended December 31, 2017 and 2015, we recorded $4.5 million and $0.2 million, respectively, of impairments on cost method investments. During the year ended December 31, 2016, we recorded no impairments on cost method investments.
Our investments in private equity funds meet the definition of a variable interest entity (“VIE”); however, the private equity fund investments were not consolidated as we do not have the power to direct the entities’ most significant economic activities. The maximum risk of loss related to our private equity fund investments is limited to the carrying value of our investments in the entities plus any future capital commitments. At December 31, 2017 and 2016, our maximum risk of loss associated with these VIE’s, which is comprised of our investment and required future capital commitments, was $94.3 million and $115.0 million, respectively.
70
6. Unconsolidated Affiliates
Unconsolidated affiliates are as follows (in millions):
Carrying Value | |||||||||
Ownership Percentage (1) | December 31, 2017 | December 31, 2016 | |||||||
Unconsolidated affiliates: | |||||||||
International Financial Data Services U.K. | — | $ | — | $ | 133.3 | ||||
Boston Financial Data Services, Inc. | — | — | 91.2 | ||||||
International Financial Data Services L.P. | 50% | 45.7 | 73.2 | ||||||
Other unconsolidated affiliates | 48.3 | 33.5 | |||||||
Total | $ | 94.0 | $ | 331.2 | |||||
(1) | DST’s ownership percentage in IFDS U.K. and BFDS was 50% prior to the respective acquisitions in March 2017, at which time the businesses became wholly-owned subsidiaries. |
In March 2017, we acquired State Street’s 50% ownership interests in BFDS and IFDS U.K., which resulted in control and consolidation of the entities. Our investment balances in these joint ventures were eliminated through the acquisition method of accounting on the date of acquisition, which resulted in a gain of $56.0 million related to BFDS and a loss of $12.2 million related to IFDS U.K, which are included in Other income, net in the Consolidated Statement of Income.
Immediately prior to our acquisitions of the remaining interests in IFDS U.K. and BFDS, IFDS L.P. made cash and asset distributions to both DST and State Street, which resulted in realized gains on the step-up of certain investments and real estate assets. Our proportionate share of the realized gains was $10.2 million and is included in Equity in earnings of unconsolidated affiliates in the Consolidated Statement of Income. Through such distributions, we acquired an investment in a privately-held company and 100% of the equity interest in IFDS Realty, LLC, which holds the real estate assets used in BFDS’ operations.
Our investments in other unconsolidated affiliates are primarily comprised of various joint ventures which own and lease real estate to our operating businesses as well as other third parties. One of these investments is a 50% ownership of Pershing Road Development Company, LLC, a limited special purpose real estate joint venture which leases approximately 1.1 million square feet of office space to the U.S. government. This investment has a zero carrying value at December 31, 2017 and 2016 as a result of losses incurred on an interest rate swap which is held by the joint venture. We received a $0.8 million cash distribution from Pershing Road Development Company, LLC for each of the years ended December 31, 2017, 2016, and 2015.
In December 2017, we received a distribution of real estate and the related debt from Broadway Square Partners, LLP (“Broadway Square Partners”), a 50% owned real estate joint venture included within other unconsolidated affiliates. Broadway Square Partners recognized a gain of $46.0 million on the step-up to fair value of the distributed real estate and debt, of which $23.0 million is included in our equity in earnings of unconsolidated affiliates. We recorded $19.2 million of real estate and $4.4 million of debt with a corresponding $14.8 million net reduction to our investment in Broadway Square Partners based on the assessed fair values on the date of distribution.
Equity in earnings of unconsolidated affiliates, is as follows (in millions):
_______________________________________________________________________
Year Ended December 31, | |||||||||||
2017 | 2016 | 2015 | |||||||||
International Financial Data Services U.K. (1) | $ | 1.0 | $ | 10.0 | $ | 22.5 | |||||
Boston Financial Data Services, Inc. (1) | 3.6 | 8.3 | 5.3 | ||||||||
International Financial Data Services L.P. | 18.3 | 2.2 | 7.4 | ||||||||
Other unconsolidated affiliates | 31.6 | 6.7 | 10.2 | ||||||||
Total | $ | 54.5 | $ | 27.2 | $ | 45.4 | |||||
(1) | Equity in earnings related to BFDS and IFDS U.K. represent earnings prior to our acquisition of the remaining interests of these entities in March 2017, at which time the businesses became wholly-owned subsidiaries. |
71
Certain condensed financial information of our unconsolidated affiliates is presented below (in millions):
Year Ended December 31, | |||||||||||
Income Statement Data: (1) | 2017 | 2016 | 2015 | ||||||||
Revenues | $ | 590.1 | $ | 1,248.6 | $ | 1,225.7 | |||||
Costs and expenses | 477.1 | 1,192.4 | 1,132.7 | ||||||||
Net income | 113.0 | 56.2 | 93.0 | ||||||||
(1) | Income Statement data for the year ended December 31, 2017 includes BFDS and IFDS U.K. activity for the period prior to our acquisition of the remaining interests of these entities in March 2017, at which time the businesses became wholly-owned subsidiaries. |
December 31, | |||||||
Balance Sheet Data: (1) | 2017 | 2016 | |||||
Current assets | $ | 156.2 | $ | 570.2 | |||
Noncurrent assets | 358.6 | 823.8 | |||||
Current liabilities | 98.7 | 423.0 | |||||
Noncurrent liabilities | 286.3 | 396.6 | |||||
Partners’ and stockholders’ equity | 129.8 | 574.4 | |||||
(1) Balance Sheet data as of December 31, 2017 excludes BFDS and IFDS U.K.
The following tables summarize related party transactions and balances outstanding with our related parties, primarily comprised of transactions with our unconsolidated affiliates (in millions):
Year Ended December 31, | |||||||||||
2017 | 2016 | 2015 | |||||||||
Operating revenues from related parties | $ | 55.4 | $ | 138.5 | $ | 134.9 | |||||
Amounts paid to related parties (1) | 42.7 | 36.8 | 27.3 | ||||||||
Distributions received from related parties | 18.6 | 3.5 | 15.3 | ||||||||
December 31, | |||||||
2017 | 2016 | ||||||
Outstanding advances/loans to related parties | $ | 6.1 | $ | 31.4 | |||
Trade accounts receivable from related parties | 6.7 | 19.7 | |||||
Total amounts receivable from related parties | $ | 12.8 | $ | 51.1 | |||
Amounts payable to related parties | $ | 0.6 | $ | 3.4 | |||
(1) | Excludes amounts paid to our unconsolidated joint ventures related to loans, advancements, and other capital investments. In addition, this excludes amounts paid on the BFDS installment loan which had an outstanding balance of $1.5 million at December 31, 2015 and was fully repaid in 2016. |
Operating revenues from related parties were primarily generated from services provided to BFDS for the use of our proprietary software and software development services provided to IFDS U.K., which have been eliminated from consolidated operating revenues subsequent to the date of acquisition. Payments to our related parties primarily included payments for rent and other facility and maintenance costs pursuant to the properties we lease from our unconsolidated real estate joint ventures and staffing services. Distributions received from related parties were primarily related to distributions from our real estate joint ventures.
72
During 2016, we and State Street each provided subordinate loans of approximately $28.0 million to IFDS U.K. In February 2017, DST provided an additional subordinate loan of approximately $12.5 million to IFDS U.K. In connection with the acquisitions, DST effectively settled all of IFDS U.K.’s outstanding note payables, including those owed to State Street, which were considered part of the total cash paid to acquire State Street’s interests in IFDS U.K.
In December 2017, we made an additional $1.2 million investment in Broadway Square Partners prior to the real estate distribution discussed above.
7. Fair Value Measurements
Authoritative accounting guidance on fair value measurements establishes a three-tier fair value hierarchy, which prioritizes the inputs used in measuring fair value. These tiers include: Level 1, defined as observable inputs such as quoted prices in active markets; Level 2, defined as inputs other than quoted prices in active markets that are either directly or indirectly observable; and Level 3, defined as unobservable inputs for which little or no market data exists, therefore requiring an entity to develop its own assumptions.
As of December 31, 2017 and 2016, we held certain investment assets and liabilities that are required to be measured at fair value on a recurring basis. These investments include money market funds, available-for-sale equity securities, trading securities, seed capital investments and securities sold short whereby fair value is determined using quoted prices in active markets. Accordingly, the fair value measurements of these investments have been classified as Level 1 in the tables below. Fair value for deferred compensation liabilities that are credited with deemed gains or losses of the underlying hypothetical investments, primarily equity securities, has been classified as Level 1 in the tables below. In addition, we have foreign currency derivative instruments that are required to be reported at fair value. Fair value for the derivative instruments was determined using inputs from quoted prices for similar assets and liabilities in active markets that are directly or indirectly observable. Accordingly, our derivative instruments have been classified as Level 2 in the tables below.
The following tables present assets and liabilities measured at fair value on a recurring basis (in millions):
Fair Value Measurements at Reporting Date Using | |||||||||||||||
December 31, 2017 | Quoted prices in Active Markets for Identical Assets (Level 1) | Significant Other Observable Inputs (Level 2) | Significant Unobservable Inputs (Level 3) | ||||||||||||
Money market funds (1) | $ | 180.0 | $ | 180.0 | $ | — | $ | — | |||||||
Equity securities (2) | 45.4 | 45.4 | — | — | |||||||||||
Seed capital investments (2) | 12.1 | 12.1 | — | — | |||||||||||
Deferred compensation liabilities (3) | (33.6 | ) | (33.6 | ) | — | — | |||||||||
Derivative instruments (3) | (0.1 | ) | — | (0.1 | ) | — | |||||||||
Total | $ | 203.8 | $ | 203.9 | $ | (0.1 | ) | $ | — | ||||||
73
Fair Value Measurements at Reporting Date Using | |||||||||||||||
December 31, 2016 | Quoted prices in Active Markets for Identical Assets (Level 1) | Significant Other Observable Inputs (Level 2) | Significant Unobservable Inputs (Level 3) | ||||||||||||
Money market funds (1) | $ | 437.0 | $ | 437.0 | $ | — | $ | — | |||||||
Equity securities (2) | 188.4 | 188.4 | — | — | |||||||||||
Seed capital investments (2) | 61.0 | 61.0 | — | — | |||||||||||
Deferred compensation liabilities (3) | (7.9 | ) | (7.9 | ) | — | — | |||||||||
Securities sold short (3) | (8.2 | ) | (8.2 | ) | — | — | |||||||||
Derivative instruments (3) | (0.4 | ) | — | (0.4 | ) | — | |||||||||
Total | $ | 669.9 | $ | 670.3 | $ | (0.4 | ) | $ | — | ||||||
(1) Included in Cash and cash equivalents, Funds held on behalf of clients, and Other current assets on our Consolidated Balance Sheet.
(2) Included in Investments on our Consolidated Balance Sheet.
(3) Included in Other current assets and Other liabilities on our Consolidated Balance Sheet.
At December 31, 2017 and 2016, we held approximately $7.6 million and $11.5 million, respectively, of investments in pooled funds, which are measured using net asset value as a practical expedient for fair value and therefore excluded from the table above. The investments in pooled funds are included within the $142.2 million and $128.0 million of cost method and other investments at December 31, 2017 and 2016, respectively, disclosed within Note 5, “Investments.”
8. Property and Equipment
Property and equipment and related accumulated depreciation are as follows (in millions):
December 31, | |||||||
2017 | 2016 | ||||||
Land | $ | 52.9 | $ | 34.2 | |||
Buildings | 198.0 | 160.3 | |||||
Technology equipment | 248.4 | 213.0 | |||||
Software | 591.4 | 508.2 | |||||
Furniture, fixtures and other equipment | 151.6 | 122.1 | |||||
Leasehold improvements | 91.6 | 76.4 | |||||
Construction-in-progress | 12.1 | 18.3 | |||||
1,346.0 | 1,132.5 | ||||||
Less accumulated depreciation and amortization | 996.2 | 896.8 | |||||
Properties, net | $ | 349.8 | $ | 235.7 | |||
At December 31, 2016, there was approximately $2.5 million of assets under capital lease, net of accumulated depreciation of $2.2 million, included in the above table. We had minimal assets under capital lease as of December 31, 2017.
Software assets are comprised of the following (in millions):
December 31, 2017 | December 31, 2016 | ||||||||||||||
Carrying Amount | Accumulated Amortization | Carrying Amount | Accumulated Amortization | ||||||||||||
Internally developed software | $ | 324.0 | $ | 287.9 | $ | 296.4 | $ | 266.0 | |||||||
Purchased software | 183.8 | 159.5 | 155.3 | 143.0 | |||||||||||
Software from business acquisitions | 83.6 | 52.8 | 56.5 | 44.5 | |||||||||||
Total | $ | 591.4 | $ | 500.2 | $ | 508.2 | $ | 453.5 | |||||||
74
During the years ended December 31, 2017, 2016 and 2015, we capitalized software costs of $24.1 million, $21.5 million and $23.3 million, respectively. Construction-in-progress as of December 31, 2017 and 2016 includes internally developed software costs of $11.5 million and $14.9 million, respectively, which have not yet been put into service.
Depreciation expense for the years ended December 31, 2017, 2016 and 2015, was $99.8 million, $78.2 million and $77.6 million, respectively.
In December 2014, we entered into a transaction under which Industrial Revenue Bonds (“IRBs”) were issued by a municipality to finance the purchase and/or construction of certain real and personal property. Pursuant to the terms of the IRBs, we transferred title of certain fixed assets to the municipality. Tax benefits associated with the IRBs include a provision for a 10-year property tax abatement and sales tax exemption on the property financed with the proceeds of the IRBs. The municipality holds legal title to the bond financed assets and leases them to us subject to an option to purchase for nominal consideration, which we may exercise at any time. We are the bondholder as well as the lessee of the property purchased with the IRBs proceeds. We record the property on our Consolidated Balance Sheet as all risks and benefits remain with us, along with a capital lease obligation to repay the proceeds of the IRBs. Moreover, as holder of the bonds, we have the right to offset the amounts due under the leases with the amounts due to us from the bonds. Accordingly, no net debt associated with the IRBs is reflected in our Consolidated Balance Sheet. Upon maturity or redemption of the bonds, which is within our sole control, title to the leased property reverts back to us. At December 31, 2017 and 2016, we held IRBs with an aggregate principal amount of $103.9 million and $87.6 million, respectively.
9. Intangible Assets and Goodwill
Intangible Assets
The following table summarizes intangible assets (in millions):
December 31, 2017 | December 31, 2016 | ||||||||||||||
Carrying Amount | Accumulated Amortization | Carrying Amount | Accumulated Amortization | ||||||||||||
Amortizable intangible assets | |||||||||||||||
Client relationships | $ | 373.3 | $ | 97.3 | $ | 203.6 | $ | 71.0 | |||||||
Other | 28.3 | 21.2 | 28.5 | 18.5 | |||||||||||
Total | $ | 401.6 | $ | 118.5 | $ | 232.1 | $ | 89.5 | |||||||
Amortization expense of intangible assets for the years ended December 31, 2017, 2016 and 2015 was $28.2 million, $16.6 million and $12.5 million, respectively. Annual amortization for intangible assets recorded as of December 31, 2017 is estimated to be (in millions):
2018 | $ | 32.3 | |
2019 | 31.2 | ||
2020 | 28.8 | ||
2021 | 28.4 | ||
2022 | 27.3 | ||
Thereafter | 135.1 | ||
Total | $ | 283.1 | |
75
Goodwill
The following tables summarize the changes in the carrying amount of goodwill for the years ended December 31, 2017 and 2016, by segment (in millions):
December 31, 2016 | Acquisitions | Impairments | Other (1) | December 31, 2017 | |||||||||||||||
Domestic Financial Services | $ | 345.8 | $ | 68.7 | $ | — | $ | 0.9 | $ | 415.4 | |||||||||
International Financial Services | 15.6 | 196.7 | — | 16.4 | 228.7 | ||||||||||||||
Healthcare Services | 155.0 | — | — | — | 155.0 | ||||||||||||||
Total | $ | 516.4 | $ | 265.4 | $ | — | $ | 17.3 | $ | 799.1 | |||||||||
December 31, 2015 | Acquisitions | Impairments | Other (1) | December 31, 2016 | |||||||||||||||
Domestic Financial Services | $ | 286.5 | $ | 61.0 | $ | — | $ | (1.7 | ) | $ | 345.8 | ||||||||
International Financial Services | 16.8 | — | — | (1.2 | ) | 15.6 | |||||||||||||
Healthcare Services | 155.0 | — | — | — | 155.0 | ||||||||||||||
Total | $ | 458.3 | $ | 61.0 | $ | — | $ | (2.9 | ) | $ | 516.4 | ||||||||
(1) | Other changes primarily consists of the impacts of foreign currency translation |
We test goodwill for impairment on an annual basis as of October 1 and at other times if a significant change in circumstances indicates it is more likely than not that the fair value of these assets has been reduced. The valuation of goodwill requires assumptions and estimates of many critical factors, including revenue and market growth, operating cash flows, market multiples and discount rates. Our 2017 annual goodwill impairment test determined that the estimated fair value of each of our reporting units substantially exceeds the carrying value of the reporting units.
10. Debt
The Company is obligated under notes and other indebtedness as follows (in millions):
December 31, | |||||||
2017 | 2016 | ||||||
Accounts receivable securitization program | $ | 14.9 | $ | 103.2 | |||
Revolving credit facilities | — | 75.0 | |||||
Senior notes | 575.0 | 330.0 | |||||
Other indebtedness, net of unamortized debt issuance costs | 30.9 | — | |||||
620.8 | 508.2 | ||||||
Less current portion of debt | 83.7 | 208.5 | |||||
Long-term debt | $ | 537.1 | $ | 299.7 | |||
Accounts receivable securitization program
We securitize certain of our domestic accounts receivable through an accounts receivable securitization program with a third-party bank. The maximum amount that can be outstanding under this program is $150.0 million. In November 2017, we renewed and modified the accounts receivable securitization program resulting in an extended maturity date of November 14, 2020 and the addition of the BFDS receivables to the program.
Under the terms of the accounts receivable securitization program, (a) we periodically acquire accounts receivable originated by certain of our domestic subsidiaries, including, but not limited to, DST Health Solutions, DST Technologies, BFDS, and DST Pharmacy Solutions (the “Subsidiary Originators”), (b) we transfer receivables originated by us and receivables acquired from the Subsidiary Originators, on a periodic basis, to a wholly-owned bankruptcy remote special purpose subsidiary of DST (the “SPE”), and (c) the SPE then sells undivided interests in the receivables to the bank. We retain servicing responsibility over the receivables. The program contains customary restrictive covenants as well as customary events of default.
76
We have continuing involvement with the transferred assets because we maintain servicing responsibilities for the accounts receivable assets included in the accounts receivable securitization program. Accounts receivable assets transferred from us to our wholly-owned, bankruptcy remote special purpose subsidiary contain restrictions because they are not available to satisfy the creditors of any other person, including DST or any of our subsidiaries or affiliates. Further, neither we nor the SPE guarantees collectability of the receivables or the creditworthiness of obligors. The SPE retains an interest in the receivables in excess of the amount transferred to the conduit, and such receivables continue to be recognized on the Consolidated Balance Sheet. The carrying value of the retained interest approximates its estimated fair value at the balance sheet date. We believe increases in the level of assumed interest rates and/or credit losses compared to assumptions in effect at the balance sheet date by 10% or 20% would not materially affect the fair value of the retained interest at the reporting date.
The outstanding amount under the program was $14.9 million and $103.2 million at December 31, 2017 and 2016, respectively. During the years ended December 31, 2017, 2016 and 2015 total proceeds from the accounts receivable securitization program were approximately $555.9 million, $895.5 million and $1,037.7 million, respectively, and total repayments were approximately $644.2 million, $792.3 million and $1,157.7 million, respectively, which comprise the net cash flow in the financing section of the Consolidated Statement of Cash Flows.
Aggregate transfers of undivided interests in the receivables from the SPE to the bank were $1,171.2 million and $1,459.9 million for the years ended December 31, 2017 and 2016, respectively. The impact on net income stemming from these transfers was not material. Costs associated with the accounts receivable securitization program are included in interest expense in the Consolidated Statement of Income. The program costs applicable to the outstanding amount of undivided interests in the receivables are generally based on LIBOR plus an applicable margin.
Revolving credit facilities
On October 1, 2014, we entered into a syndicated credit facility (“Credit Facility”). The Credit Facility provides for a revolving unsecured line in an aggregate principal amount of up to $850.0 million. The interest rates applicable to loans under the Credit Facility are generally based on Eurodollar, Federal Funds or prime rates plus applicable margins as defined in the agreement. The Credit Facility contains grid schedules that adjust borrowing costs up or down based upon our consolidated leverage ratio. The grid schedules may result in fluctuations in borrowing costs ranging from 1.00% to 1.70% over Eurodollar and 0.00% to 0.70% over base rate, as defined. Additionally, we pay an annual facility fee of 0.125% to 0.30%. Among other provisions, the Credit Facility requires certain leverage and interest coverage ratios to be maintained. If any event of default occurs and is continuing, all amounts payable under the credit agreement may be declared immediately due and payable. The Credit Facility also contains customary restrictive covenants and cross-default provisions. The maturity date for the Credit Facility is October 1, 2019. At December 31, 2017, there were no borrowings under the Credit Facility. Amounts borrowed on the Credit Facility were $75.0 million at December 31, 2016.
We also have an unsecured revolving line of credit to support our subsidiaries’ operations that provides total borrowings of up to $10.0 million. Borrowings on this line of credit are available at the bank’s Prime rate and mature during 2018. At December 31, 2017 and 2016, there were no borrowings under this line of credit.
During the years ended December 31, 2017, 2016 and 2015, total proceeds from our revolving credit facilities were approximately $1,194.1 million, $977.1 million and $1,053.6 million, respectively, and total repayments were approximately $1,269.1 million, $1,128.2 million and $871.8 million respectively, which comprise the net cash flows presented within the financing section of the Consolidated Statement of Cash Flows.
Senior notes
During 2010, we issued $370.0 million of aggregate principal of privately placed senior notes (collectively, the “2010 Senior Notes”) pursuant to a note purchase agreement dated August 9, 2010. The 2010 Senior Notes were comprised of $40.0 million of 4.19% Series A Senior Notes due August 9, 2015, $105.0 million of 4.86% Series B Senior Notes due August 9, 2017, $65.0 million of 5.06% Series C Senior Notes due August 9, 2018 and $160.0 million of 5.42% Series D Senior Notes due August 9, 2020. We repaid the Series A Senior Notes and Series B Senior Notes at maturity during 2015 and 2017, respectively.
77
During 2017, we agreed to issue $415.0 million of privately placed senior notes (collectively, the “2017 Senior Notes”) pursuant to a note purchase agreement dated November 14, 2017. The 2017 Senior Notes are comprised of $35.0 million of 3.55% Series A Senior Notes due January 9, 2023, $105.0 million of 3.82% Series B Senior Notes due January 9, 2025, $65.0 million of 4.02% Series C Senior Notes due August 6, 2025, $105.0 million of 4.04% Series D Senior Notes due January 9, 2028, $50.0 million of 4.14% Series E Senior Notes due January 9, 2030, and $55.0 million of 4.29% Series F Senior Notes due January 9, 2033. The 2017 Senior Notes were issued in November 2017, with the exception of the Series C Senior Notes which are scheduled to be issued on August 6, 2018. The November 2017 proceeds were primarily used to pay down our revolving credit facility.
Interest on our 2010 Senior Notes is payable semi-annually in February and August of each year. Interest on our outstanding 2017 Senior Notes is payable semi-annually in January and July of each year, beginning in July 2018. We may prepay the senior notes at any time, in an amount not less than 10% of the aggregate principal amount of such notes then outstanding, at a price equal to 100% of the principal amount being prepaid, plus accrued and unpaid interest and a “make-whole” prepayment premium.
Pursuant to terms of our senior note agreements, any Company subsidiary required to become a party to or otherwise guarantee the syndicated line of credit facility or other indebtedness in excess of $100.0 million, or in the case of the 2017 Senior Notes, certain other indebtedness in excess of $150.0 million, must also guarantee our obligations under the senior notes. The senior note agreements contain customary restrictive covenants, as well as certain customary events of default, including cross-default provisions. Among other provisions, the agreements limit our ability to incur or create liens, sell assets, issue priority indebtedness and change lines of business. The agreements also require certain leverage and interest coverage ratios to be maintained. We were in compliance with all debt covenants as of December 31, 2017.
Other indebtedness
In connection with the acquisition of the remaining interests in IFDS U.K. during 2017, we assumed a mortgage with a principal amount of £23.0 million which matures in October 2020 (“U.K. mortgage”). The outstanding amount under the mortgage was $28.4 million at December 31, 2017 with a fixed interest rate of 3.1%. Principal payments of £1.0 million are payable semi-annually in April and October of each year and accrued interest is payable quarterly, with the outstanding balance due at maturity.
Other indebtedness as of December 31, 2017 also included a $4.4 million mortgage acquired through a distribution of real estate and the related debt from Broadway Square Partners in December 2017 and $0.6 million of capital leases, offset by $2.5 million of unamortized debt issuance costs.
Future principal payments of indebtedness at December 31, 2017 are as follows (in millions):
2018 | $ | 83.7 | |
2019 | 3.6 | ||
2020 | 183.7 | ||
2021 | 0.7 | ||
2022 | 0.8 | ||
Thereafter | 350.8 | ||
Total | $ | 623.3 | |
The weighted average interest rates on our short-term borrowings were 2.72% and 2.36% for the years ended December 31, 2017 and 2016, respectively. Based upon the borrowing rates currently available to us for indebtedness with similar terms and average maturities, the carrying value of long-term debt, with the exception of the senior notes and U.K. mortgage, is considered to approximate fair value at December 31, 2017 and 2016. The estimated fair values of the senior notes and U.K. mortgage were derived principally from quoted prices (level 2 in the fair value hierarchy).
78
The carrying and estimated fair values of our fixed rate debt were as follows (in millions):
December 31, | |||||||||||||||
2017 | 2016 | ||||||||||||||
Carrying Value | Estimated Fair Value | Carrying Value | Estimated Fair Value | ||||||||||||
2010 Senior notes—Series B | $ | — | $ | — | $ | 105.0 | $ | 106.7 | |||||||
2010 Senior notes—Series C | 65.0 | 65.7 | 65.0 | 67.5 | |||||||||||
2010 Senior notes—Series D | 160.0 | 167.4 | 160.0 | 172.1 | |||||||||||
2017 Senior notes—Series A | 35.0 | 34.6 | — | — | |||||||||||
2017 Senior notes—Series B | 105.0 | 104.0 | — | — | |||||||||||
2017 Senior notes—Series D | 105.0 | 104.5 | — | — | |||||||||||
2017 Senior notes—Series E | 50.0 | 49.6 | — | — | |||||||||||
2017 Senior notes—Series F | 55.0 | 54.1 | — | — | |||||||||||
U.K. mortgage | 28.4 | 28.8 | — | — | |||||||||||
U.S. mortgage | 4.4 | 4.4 | — | — | |||||||||||
Total | $ | 607.8 | $ | 613.1 | $ | 330.0 | $ | 346.3 | |||||||
11. Hedging Transactions and Derivative Financial Instruments
We are directly and indirectly affected by changes in certain market conditions. When determined appropriate, we use derivative instruments as a risk management tool to mitigate the potential impact of certain market risks. The primary market risks managed by us through the use of derivative instruments are foreign currency exchange rate risk and interest rate risk. We may use various types of derivative instruments including, but not limited to, forward contracts, option contracts and swaps. We do not enter into derivative arrangements for speculative purposes.
We determine the fair values of our derivatives based on quoted market prices that are directly or indirectly observable as further described within Note 7, “Fair Value Measurements.” The fair value of our derivative instruments is reflected on a gross, rather than net, basis and is not significant to the consolidated financial statements as of December 31, 2017 or 2016.
Cash flow hedging strategy
We use cash flow hedges to minimize the variability in cash flows of assets or liabilities or forecasted transactions caused by fluctuations in foreign currency exchange rates or interest rates. The changes in the fair values of derivatives designated as cash flow hedges are recorded in Accumulated Other Comprehensive Income (“AOCI”) and are reclassified into the line item in the Consolidated Statement of Income in which the hedged items are recorded in the same period the hedged items affect earnings. The changes in fair values of hedges that are determined to be ineffective are immediately reclassified from AOCI into earnings. The length of time for which we hedge our exposure to future cash flows is typically one year.
We have entered into a foreign currency cash flow hedging program to reduce the risk that our net cash outflows from intercompany purchases of services from our international subsidiaries could be adversely affected by fluctuations in foreign currency exchange rates. We entered into forward foreign currency contracts (Thai baht and India rupee) to hedge certain portions of forecasted cash flows denominated in foreign currencies. The total notional values of derivatives that were designated and qualified for our foreign currency cash flow hedging program were $40.7 million and $14.3 million as of December 31, 2017 and 2016, respectively.
We monitor the mix of short-term debt and long-term debt regularly. From time to time, we manage our risk to interest rate fluctuations through the use of derivative financial instruments. We did not enter into interest rate swap agreements during the years ended December 31, 2017 and 2016.
The pretax impact that changes in the fair values of derivatives designated as cash flow hedges had on AOCI and earnings was not significant during the years ended December 31, 2017, 2016, and 2015. There were no gains or losses recognized into income as a result of hedge ineffectiveness during the years ended December 31, 2017, 2016 or 2015. As of December 31, 2017, we estimate that amounts to be reclassified into earnings during the next 12 months are $0.2 million.
79
Economic (nondesignated) hedging strategy
In addition to derivative instruments that are designated and qualify for hedge accounting, we also use certain derivatives as economic hedges of foreign currency exposure. Although these derivatives were not designated for hedge accounting, they are effective economic hedges. The changes in fair values of economic hedges are immediately recognized into earnings.
We use foreign currency economic hedges to offset the earnings impact that fluctuations in foreign currency exchange rates have on certain intercompany loans and other payables denominated in nonfunctional currencies, primarily the British pound and Australian dollar. The foreign currency economic hedging program consists of rolling, monthly forward foreign currency contracts which generally settle on the last day of each month. As a result, there are minimal unrealized gains or losses at the end of the period related to these contracts. The total notional values of derivatives related to our foreign currency economic hedges were $60.4 million and $91.6 million as of December 31, 2017 and 2016, respectively.
12. Income Taxes
On December 22, 2017, the United States enacted tax reform legislation commonly known as the Tax Cuts and Jobs Act (the “Tax Act”), resulting in significant modifications to existing U.S. tax law, including but not limited to, (1) lowering the corporate federal income tax rate from 35% to 21% effective January 1, 2018; (2) eliminating the domestic production activity deduction; (3) implementing a territorial tax system; and (4) imposing a one-time repatriation tax on deemed repatriated earnings of foreign subsidiaries.
Deferred tax assets and liabilities are determined based on the differences between the financial statement carrying amounts and tax bases of assets and liabilities as measured by the enacted tax rates that are expected to be in effect when these differences reverse. Deferred tax expense (benefit) is generally the result of changes in the assets or liabilities for deferred taxes. As a result of the reduction in the U.S. corporate income tax rate from 35% to 21% under the Tax Act, we revalued our ending net deferred tax liabilities at December 31, 2017 and recognized a provisional $22.1 million tax benefit in the Consolidated Statement of Income for the year ended December 31, 2017.
The Tax Act provides for a one-time deemed mandatory repatriation of post-1986 undistributed foreign subsidiary earnings and profits through the year ended December 31, 2017 (“Transition Tax”). We have estimated a provisional Transition Tax of $8.4 million, recorded to income tax expense in the Consolidated Statement of Income for the year ended December 31, 2017. The Transition Tax is payable over eight years and thus $7.3 million of the Transition Tax is reported as noncurrent on the Consolidated Balance Sheet.
The Tax Act provides for a new requirement, beginning in 2018, that certain income earned by controlled foreign corporations in excess of an allowable return on foreign subsidiary’s tangible assets is subject to U.S. income tax (the global intangible low-taxed income or “GILTI” provision). Also beginning in 2018, the Tax Act provides for a new base erosion and anti-abuse tax provision (“BEAT”) which eliminates the deduction of certain base-erosion payments made to related foreign corporations and imposes a minimum tax if greater than regular tax. We do not expect the GILTI or BEAT provisions to have a material impact to our financial statements and therefore, have not provided any tax impacts in our consolidated financial statements for the year ended December 31, 2017.
The SEC staff issued Staff Accounting Bulletin 118 (“SAB 118”) which provides additional clarification regarding situations where the Company does not have the necessary information available, prepared, or analyzed in reasonable detail to complete the accounting for certain income tax effects of the Tax Act for the reporting period in which the Tax Act was enacted. We have recognized the provisional tax impacts, based on reasonable estimates, related to the Transition Tax and the revaluation of deferred tax assets and liabilities and have included these amounts in our consolidated financial statements for the year ended December 31, 2017. The ultimate impact may differ from these provisional amounts, possibly materially, due to among other things, additional analysis, changes in interpretations and assumptions we have made, additional regulatory guidance that may be issued, and actions we may take as a result of the Tax Act. We intend to complete our accounting under the Tax Act within the measurement period set forth in SAB 118.
80
The following summarizes pretax income from continuing operations (in millions):
Year Ended December 31, | |||||||||||
2017 | 2016 | 2015 | |||||||||
U.S. | $ | 451.8 | $ | 248.2 | $ | 451.9 | |||||
International | 80.1 | 31.0 | 6.9 | ||||||||
Total | $ | 531.9 | $ | 279.2 | $ | 458.8 | |||||
Provision for income taxes (benefits) from continuing operations consists of the following components (in millions):
Year Ended December 31, | |||||||||||
2017 | 2016 | 2015 | |||||||||
Current | |||||||||||
Federal | $ | 93.7 | $ | 57.7 | $ | 147.4 | |||||
State and local | 4.0 | 11.4 | 10.2 | ||||||||
International | 13.7 | 15.0 | 7.1 | ||||||||
Total current | 111.4 | 84.1 | 164.7 | ||||||||
Deferred | |||||||||||
Federal | (34.2 | ) | 19.9 | (13.5 | ) | ||||||
State and local | 2.4 | (1.9 | ) | 0.5 | |||||||
International | 4.7 | (1.0 | ) | (2.5 | ) | ||||||
Total deferred | (27.1 | ) | 17.0 | (15.5 | ) | ||||||
Total provision for income taxes | $ | 84.3 | $ | 101.1 | $ | 149.2 | |||||
Following are the reconciliations of our effective income tax rates and the U.S. federal income tax statutory rate (in millions):
Year Ended December 31, | |||||||||||
2017 | 2016 | 2015 | |||||||||
Provision for income taxes using the statutory rate in effect | $ | 186.2 | $ | 97.7 | $ | 160.6 | |||||
Tax effect of: | |||||||||||
State and local income taxes, net | 4.5 | 5.9 | 4.3 | ||||||||
International income taxes, net | (9.5 | ) | 2.5 | (1.0 | ) | ||||||
Earnings of U.S. unconsolidated affiliates | (1.0 | ) | (2.3 | ) | (1.5 | ) | |||||
Valuation allowance (reversal), net | (1.3 | ) | (0.9 | ) | 1.2 | ||||||
Tax credits | (1.0 | ) | (5.0 | ) | (7.7 | ) | |||||
Uncertain tax positions (reversal), net | (2.8 | ) | 1.7 | (7.9 | ) | ||||||
Dividend received deduction | (0.1 | ) | (0.8 | ) | (1.2 | ) | |||||
Domestic production activities deduction | (2.5 | ) | (1.7 | ) | (0.1 | ) | |||||
Repatriation | 1.0 | 1.0 | 1.9 | ||||||||
Tax Cuts and Jobs Act impact | (13.7 | ) | — | — | |||||||
Tax impact of transactions | (71.4 | ) | — | — | |||||||
Other | (4.1 | ) | 3.0 | 0.6 | |||||||
Total provision for income taxes | $ | 84.3 | $ | 101.1 | $ | 149.2 | |||||
Effective tax rate | 15.8 | % | 36.2 | % | 32.5 | % | |||||
Statutory federal tax rate | 35.0 | % | 35.0 | % | 35.0 | % | |||||
81
The federal and state deferred tax assets (liabilities) recorded on the Consolidated Balance Sheet are as follows (in millions):
December 31, | |||||||
2017 | 2016 | ||||||
Liabilities: | |||||||
Deferred cancellation of debt income | $ | (11.7 | ) | $ | (36.4 | ) | |
Investments in available-for-sale securities | (0.6 | ) | (62.2 | ) | |||
Unconsolidated affiliates and investments | (19.7 | ) | (27.9 | ) | |||
Accumulated depreciation and amortization | (62.8 | ) | (65.3 | ) | |||
Prepaid expenses | — | (5.5 | ) | ||||
Other | (3.5 | ) | — | ||||
Total deferred tax liabilities | (98.3 | ) | (197.3 | ) | |||
Assets: | |||||||
Deferred compensation and other employee benefits | 24.4 | 23.2 | |||||
Net operating loss | 14.9 | 8.5 | |||||
Accrued liabilities | 16.2 | 26.9 | |||||
Prepaid expenses | 4.4 | — | |||||
Other | — | 1.4 | |||||
Total deferred tax assets | 59.9 | 60.0 | |||||
Valuation allowance | (7.1 | ) | (6.0 | ) | |||
Net deferred tax liability | $ | (45.5 | ) | $ | (143.3 | ) | |
We have approximately $4.1 million of federal net operating losses as of December 31, 2017 as a result of prior year business combinations. These net operating losses begin to expire in 2034 and are available to reduce future income taxes. Since these net operating losses were generated by an entity prior to its acquisition by DST, our utilization is subject to certain limitations imposed by the Internal Revenue Code. We do not anticipate that such limitations will prohibit the utilization of the federal net operating loss carryforwards prior to their expiration. We have approximately $48.4 million of state net operating losses as of December 31, 2017. These net operating losses begin to expire in 2023.
We have approximately $53.9 million of net operating loss carryforwards in foreign jurisdictions as of December 31, 2017. The carryforwards of $23.4 million in the U.K. do not expire but their utilization may be limited to offset only income with certain characteristics. The carryforwards of $13.1 million and $13.0 million in Ireland and Australia, respectively, do not expire. The carryforwards of $4.4 million in Canada begin to expire in 2032.
A valuation allowance is recorded against deferred tax assets if, based on the weight of available evidence, it is more likely than not that some or all of the deferred tax assets will not be realized. In evaluating the realizability of certain international net deferred tax assets, we also anticipate that limitations may result in the benefit of these amounts not being realized and have established corresponding valuation allowances as of December 31, 2017 and 2016 of $6.9 million and $5.7 million, respectively. In evaluating certain state net operating losses, we anticipate that limitations may result in the benefit of these amounts not being realized and have established a corresponding valuation allowance as of December 31, 2017 and 2016 of $0.2 million and $0.3 million, respectively.
We provide deferred taxes for unremitted earnings of U.S. unconsolidated affiliates net of the 80% dividends received deduction provided for under current tax law. In connection with the acquisition of the remaining interest in BFDS during March 2017, the corresponding deferred tax balance related to unremitted earnings of U.S. unconsolidated affiliates was reduced and no balance remains as of December 31, 2017. Deferred taxes provided on unremitted earnings through December 31, 2016 were $6.5 million.
We record U.S. tax on the undistributed earnings of foreign subsidiaries unless the subsidiaries’ earnings are considered indefinitely reinvested outside the U.S. Distributions in 2017, 2016, and 2015 resulted in incremental taxes of $1.0 million, $1.0 million and $1.9 million, respectively. We recorded approximately $2.3 million and $2.6 million of related income tax liability, net of credits, on unremitted earnings in 2017 and 2016, respectively.
We intend to indefinitely reinvest the earnings in the businesses of our other foreign subsidiaries. As of December 31, 2017, accumulated undistributed earnings considered indefinitely reinvested were $186.2 million. The Tax Act generally eliminates U.S. federal income taxes on dividends from foreign subsidiaries after December 31, 2017. As a result, the accumulated
82
undistributed earnings would only be subject to other taxes, such as withholding taxes and local taxes, on distribution of such earnings. Due to the uncertainty of the manner in which the undistributed earnings would be brought back to the U.S. and the withholding and local tax laws in effect at that time, it is not practicable for us to determine the income tax we would incur, if any, if such earnings were distributed.
A reconciliation of the beginning and ending amount of gross unrecognized tax benefits is as follows (in millions):
Year Ended December 31, | |||||||||||
2017 | 2016 | 2015 | |||||||||
Balance at beginning of year | $ | 57.6 | $ | 60.3 | $ | 69.8 | |||||
Additions based on tax positions related to the current year | 3.0 | 3.5 | 9.0 | ||||||||
Additions for tax positions of prior years | 8.0 | 2.7 | 2.2 | ||||||||
Reductions for tax positions of prior years | (5.3 | ) | (7.7 | ) | (19.5 | ) | |||||
Settlements | (0.2 | ) | (1.2 | ) | (0.4 | ) | |||||
Statute expirations | (10.7 | ) | — | (0.8 | ) | ||||||
Balance at end of year | $ | 52.4 | $ | 57.6 | $ | 60.3 | |||||
Included in the net unrecognized tax benefit at December 31, 2017, 2016 and 2015 were $43.6 million, $40.9 million and $42.0 million, respectively, of tax positions which, if recognized, would affect the effective tax rate. We recognize interest and penalties accrued related to unrecognized tax benefits in income taxes, which is consistent with the recognition of these items in prior reporting periods. The liability for interest and penalties associated with unrecognized tax benefits increased $2.7 million during the year ended December 31, 2017 to $13.1 million. The liability for interest and penalties decreased $1.1 million during the year ended December 31, 2016.
Although it is difficult to predict when all uncertain tax positions will reverse due to the unknown timing of the completion of examination periods, it is possible that aggregate income tax amounts of approximately $5.0 million to $7.0 million may reverse during 2017.
We file income tax returns in the U.S. federal jurisdiction, and various state and foreign jurisdictions. An IRS examination for the tax year ended December 31, 2010 was completed in September 2015. Federal tax years 2012 through 2017 are subject to examination while various years from 2007 through 2017 are under or are subject to various state, local, and foreign income tax examinations by taxing authorities. We do not believe that the outcome of any examination will have a material impact on our financial statements.
During 2015, the IRS completed its examination of the previously filed federal income tax refund claims for Domestic Manufacturing Deductions, research and experimentation credits and capital losses for the period 2010. As a result, during 2015 we recognized income tax benefits of $11.9 million, resulting from the reversal of previously reserved tax positions related to these matters as well as other remeasurements during the period.
An IRS examination for the tax year ended December 31, 2014 began during 2017. An IRS examination of BFDS for the tax year ended December 31, 2015 (when BFDS was an unconsolidated affiliate) began during 2017.
13. Equity
On May 9, 2017, our Board of Directors declared a two-for-one stock split of DST’s outstanding common stock effected in the form of a stock dividend, which was paid on June 8, 2017 to shareholders of record at the close of business on May 26, 2017. In connection with the stock split, 16.5 million treasury shares were used to settle a portion of the distribution. The distribution of treasury shares during the year ended December 31, 2017 reduced Additional paid in capital by $40.5 million, Retained earnings by $1,297.2 million and Treasury stock by $1,337.9 million. All share and per share data, excluding treasury shares, have been retroactively adjusted for all periods presented to reflect the stock split as if the stock split had occurred at the beginning of the earliest period presented.
83
Earnings per share
The computation of basic and diluted earnings per share is as follows (in millions, except per share amounts):
Year Ended December 31, | |||||||||||
2017 | 2016 | 2015 | |||||||||
Income from continuing operations attributable to DST Systems, Inc. | $ | 447.0 | $ | 179.0 | $ | 309.7 | |||||
Income from discontinued operations, net of tax | 4.5 | 248.3 | 48.5 | ||||||||
Net income attributable to DST Systems, Inc. | $ | 451.5 | $ | 427.3 | $ | 358.2 | |||||
Weighted average common shares outstanding | 61.4 | 66.0 | 72.0 | ||||||||
Incremental shares from restricted stock units and stock options | 0.7 | 0.6 | 0.9 | ||||||||
Weighted average diluted shares outstanding | 62.1 | 66.6 | 72.9 | ||||||||
Basic earnings per share | |||||||||||
Continuing operations attributable to DST Systems, Inc. | $ | 7.28 | $ | 2.71 | $ | 4.30 | |||||
Discontinued operations | 0.07 | 3.76 | 0.67 | ||||||||
Basic earnings per share | $ | 7.35 | $ | 6.47 | $ | 4.97 | |||||
Diluted earnings per share | |||||||||||
Continuing operations attributable to DST Systems, Inc. | $ | 7.20 | $ | 2.68 | $ | 4.25 | |||||
Discontinued operations | 0.07 | 3.73 | 0.67 | ||||||||
Diluted earnings per share | $ | 7.27 | $ | 6.41 | $ | 4.92 | |||||
We had approximately 59.3 million and 64.0 million shares outstanding at December 31, 2017 and 2016, respectively. There were no shares from options to purchase common stock excluded from the diluted earnings per share calculation because they were anti-dilutive for the years ended December 31, 2017 and 2016.
We have authorized 10.0 million shares of preferred stock, of which no shares are currently issued or outstanding.
Other comprehensive income (loss)
AOCI balances, net of tax, consist of the following (in millions):
Available-for-Sale Securities | Cash Flow Hedges | Defined Benefit Pension | Foreign Currency Translation | Accumulated Other Comprehensive Income | |||||||||||||||
Balance, December 31, 2015 | $ | 84.0 | $ | (0.1 | ) | $ | — | $ | (42.0 | ) | $ | 41.9 | |||||||
Net current period other comprehensive income (loss) | 10.1 | — | — | (35.4 | ) | (25.3 | ) | ||||||||||||
Balance, December 31, 2016 | 94.1 | (0.1 | ) | — | (77.4 | ) | 16.6 | ||||||||||||
Net current period other comprehensive income (loss) | (93.2 | ) | 0.2 | 4.1 | 73.7 | (15.2 | ) | ||||||||||||
Balance, December 31, 2017 | $ | 0.9 | $ | 0.1 | $ | 4.1 | $ | (3.7 | ) | $ | 1.4 | ||||||||
84
Additions to and reclassifications out of AOCI (in millions):
Year Ended December 31, | |||||||||||||||||||||||
2017 | 2016 | 2015 | |||||||||||||||||||||
Pretax | Net of Tax | Pretax | Net of Tax | Pretax | Net of Tax | ||||||||||||||||||
Available-for-sale securities: | |||||||||||||||||||||||
Unrealized gains (losses) on available-for-sale securities | $ | 7.0 | $ | 4.5 | $ | 18.1 | $ | 11.4 | $ | (35.6 | ) | $ | (21.8 | ) | |||||||||
Reclassification of (gains) losses into net earnings on available-for-sale securities (1) | (155.9 | ) | (97.7 | ) | (2.1 | ) | (1.3 | ) | (163.5 | ) | (101.4 | ) | |||||||||||
Net change in available-for-sale securities | (148.9 | ) | (93.2 | ) | 16.0 | 10.1 | (199.1 | ) | (123.2 | ) | |||||||||||||
Cash flow hedges: | |||||||||||||||||||||||
Unrealized gains (losses) on cash flow hedges | (0.2 | ) | (0.1 | ) | 0.1 | — | 0.4 | 0.4 | |||||||||||||||
Reclassification of losses (gains) into net earnings on foreign currency cash flow hedges (2) | 0.6 | 0.3 | — | — | (0.5 | ) | (0.3 | ) | |||||||||||||||
Reclassification of losses (gains) into net earnings on interest rate cash flow hedges (3) | — | — | — | — | 0.2 | 0.1 | |||||||||||||||||
Net change in cash flow hedges | 0.4 | 0.2 | 0.1 | — | 0.1 | 0.2 | |||||||||||||||||
Defined benefit pension: | |||||||||||||||||||||||
Unrealized net gains (losses) on defined benefit pension plan | 5.2 | 4.1 | — | — | — | — | |||||||||||||||||
Net change in defined benefit pension | 5.2 | 4.1 | — | — | — | — | |||||||||||||||||
Foreign currency translation (4): | |||||||||||||||||||||||
Current period translation adjustments | 36.0 | 36.0 | (34.9 | ) | (34.9 | ) | (22.0 | ) | (22.0 | ) | |||||||||||||
Reclassification into net earnings upon liquidation of foreign entities (5) | (3.3 | ) | (3.3 | ) | (0.5 | ) | (0.5 | ) | — | — | |||||||||||||
Reclassification into net earnings upon step-up acquisition of foreign entities (6) | 41.0 | 41.0 | — | — | — | — | |||||||||||||||||
Net change in foreign currency translation | 73.7 | 73.7 | (35.4 | ) | (35.4 | ) | (22.0 | ) | (22.0 | ) | |||||||||||||
Total other comprehensive loss | $ | (69.6 | ) | $ | (15.2 | ) | $ | (19.3 | ) | $ | (25.3 | ) | $ | (221.0 | ) | $ | (145.0 | ) | |||||
(1) | Realized (gains)/losses on available-for-sale securities are recognized in Other income, net in the Consolidated Statement of Income. See Note 5, “Investments,” for additional information. |
(2) | Reclassification to net earnings of derivatives qualifying as effective foreign currency cash flow hedges are recognized in Costs and expenses in the Consolidated Statement of Income. |
(3) | Reclassification to net earnings of derivatives qualifying as effective interest rate cash flow hedges are recognized in Interest expense in the Consolidated Statement of Income. |
(4) | Cumulative translation adjustments are inclusive of amounts derived from assets and liabilities held for sale. |
(5) | Reclassification to net earnings upon disposition of net assets classified as held for sale are recognized in Income from discontinued operations, net of tax in the Consolidated Statement of Income. See Note 4, “Discontinued Operations,” for additional information. |
(6) | Reclassification to net earnings upon step-acquisition of previously-held equity interests in foreign entities are recognized in Other income, net in the Consolidated Statement of Income. See Note 3, “Significant Business Transactions,” for additional information. |
One of our unconsolidated affiliates has an interest rate swap liability with a fair market value of $25.5 million, $33.1 million and $44.7 million at December 31, 2017, 2016 and 2015, respectively. The unconsolidated affiliate used inputs from quoted prices for similar assets and liabilities in active markets that are directly or indirectly observable relating to the measurement of the interest rate swap. Our 50% proportionate share of this interest rate swap liability was $12.8 million, $16.5 million and $22.4 million at December 31, 2017, 2016 and 2015, respectively. We record in investments and AOCI our proportionate share of this liability in an amount not to exceed the carrying value of our investment in this unconsolidated affiliate. Because the carrying value of this unconsolidated affiliate investment balance was zero at December 31, 2017, 2016, and 2015, no interest rate swap liability or change in AOCI was recorded for these periods.
85
Stock repurchases and retirements
As of December 31, 2016, we had $150.0 million of capacity remaining under our share repurchase plan authorized in 2016. On May 9, 2017, our Board of Directors authorized a new $300.0 million share repurchase plan, which allows, but does not require, the repurchase of common stock in open market and private transactions. We repurchased the equivalent of 5.0 million shares of our common stock on a post stock split basis for $300.0 million during the year ended December 31, 2017, which left approximately $150.0 million remaining under our share repurchase plan authorized in 2017. The 2017 share repurchase plan does not have an expiration date, however we are currently precluded from executing additional stock repurchases pursuant to the Merger Agreement with SS&C, as further described in Note 1, “Description of Business.” Under previous share repurchase plans, we expended $300.0 million for approximately 5.4 million shares on a post stock split basis and $400.0 million for approximately 7.2 million shares on a post stock split basis during the years ended December 31, 2016 and 2015, respectively.
Shares received in exchange for tax withholding obligations and payment of the exercise price arising from the exercise of options to purchase our stock or from the vesting of equity awards are included in common stock repurchased in the Consolidated Statement of Cash Flows. The amounts of such share withholdings and exchanges were $10.6 million, $15.8 million and $5.3 million during the years ended December 31, 2017, 2016 and 2015, respectively. In addition, in connection with the non-cash acquisition of the remaining interest in BFDS, DST acquired $3.7 million of DST common stock that was held by BFDS.
We had 5.1 million and 18.0 million shares of common stock held in treasury at December 31, 2017 and 2016, respectively.
Dividends
In 2017, 2016 and 2015, we paid cash dividends per common share of $0.72, $0.66 and $0.60, respectively. The total dividends paid for the years ended December 31, 2017, 2016 and 2015 were $44.7 million, $44.7 million and $44.5 million, respectively. The cash paid for dividends in 2017, 2016 and 2015 was $43.7 million, $43.4 million, and $43.1 million, respectively. The remaining amount of the dividends represent dividend equivalent shares of restricted stock units (“RSUs”) in lieu of the cash dividend. We are currently precluded from declaring dividends pursuant to the Merger Agreement with SS&C, as further described in Note 1, “Description of Business.”
Share-based compensation
The DST Systems, Inc. 2015 Equity and Incentive Plan (the “Employee Plan”) became effective on May 12, 2015. The Employee Plan amends, restates, and renames the DST Systems, Inc. 2005 Equity Incentive Plan in order to, among other things, combine (for all future grants) the DST Systems, Inc. 2005 Non-Employee Directors’ Award Plan (the “Directors’ Plan”) with the Employee Plan. The term of the Employee Plan, subject to the right of the Board of Directors to amend or terminate the Employee Plan at any time, is from May 12, 2015 until the earlier of May 11, 2025 or the date on which all shares subject to the Employee Plan have been delivered and the restrictions on all awards granted under the plan have lapsed, according to the Employee Plan’s provisions. All awards granted pursuant to the Directors’ Plan before May 9, 2015 remain subject to the terms and conditions of the Directors’ Plan. We have outstanding share awards (primarily in the form of stock options and non-vested restricted stock awards) under each of the plans. The Employee Plan has been approved by our Board of Directors and shareholders.
The number of shares of common stock reserved for delivery under the Employee Plan, subject to certain limitations and adjustments, is the sum of (a) 5.2 million shares, on a post stock-split basis, plus (b) any shares required to satisfy substitute awards, as defined by the Employee Plan. If any shares subject to an award granted after May 12, 2015 are forfeited or such awards terminate or lapse without the delivery of such shares, those shares shall become available for grant under the Employee Plan. As of December 31, 2017, approximately 3.5 million shares were available under the Employee Plan. The Employee Plan provides for the availability of shares of our common stock for the grant of awards to employees, consultants and non-employee directors, its consolidated subsidiaries, and its unconsolidated affiliates and joint ventures. Awards under the Employee Plan may take the form of shares, dividend equivalents, options, stock appreciation rights, performance units, restricted stock, restricted stock units, annual incentive awards, service awards and substitute awards (each as defined in the plan).
Stock Options
Options under the Employee Plan vest and generally become fully exercisable over three years of continued employment, depending upon the grant type. Options generally have a 10-year contractual term. The fair value of each option grant is estimated on the date of grant using a Black-Scholes option pricing model. There were no stock options granted or canceled during 2017, 2016 or 2015. All outstanding options were fully vested at December 31, 2017 and 2016. The total aggregate
86
intrinsic values of stock options exercised for all plans during the years ended December 31, 2017, 2016 and 2015 were $3.3 million, $5.8 million and $15.4 million, respectively.
A summary of stock option activity is presented in the table below (shares in millions):
Options | Shares | Weighted Average Exercise Price | Weighted Average Remaining Contractual Term (in years) | Aggregate Intrinsic Value (in millions) | |||||||||
Outstanding at December 31, 2016 | 0.7 | $ | 22.71 | ||||||||||
Exercised | (0.1 | ) | 22.72 | $ | 3.3 | ||||||||
Outstanding at December 31, 2017 | 0.6 | 22.71 | 2.8 | 23.4 | |||||||||
Exercisable at December 31, 2017 | 0.6 | $ | 22.71 | 2.8 | $ | 23.4 | |||||||
Non-vested Restricted Stock Unit Awards
Non-vested restricted stock awards, consisting of RSUs and performance-based stock units (“PSUs”), are valued based on the value of DST’s common stock at the date of grant. RSUs contain service features and convert to DST shares on a one to one basis upon vesting. RSUs do not confer full stockholder rights such as voting rights and cash dividends, but provide for additional dividend equivalent RSU awards in lieu of cash dividends.
PSUs contain service and performance features in which the number of restricted shares to be awarded depends on the attainment of defined company-wide performance goals. PSUs are granted at a target number of shares and generally vest at the end of a 3-year requisite service and performance period. The number of shares ultimately earned will range from zero to 200% of the target award based on actual attainment.
Non-vested shares of restricted stock awards may be forfeited upon termination of employment from DST depending on the circumstances of the termination, or become forfeited upon failure to achieve the required performance condition, if applicable. Forfeitures are recognized as they occur rather than using an estimated forfeiture rate.
A summary of non-vested restricted stock award activity is presented in the table below (units in millions):
Non-vested Restricted Stock Unit Awards | RSUs | Weighted Average Grant Date Fair Value | Weighted Average Conversion Ratio | PSUs | Weighted Average Grant Date Fair Value | Weighted Average Conversion Ratio | ||||||||||
Non-vested at December 31, 2016 | 0.5 | $ | 52.79 | 1.0 | 0.7 | $ | 51.11 | 0.6 | ||||||||
Granted | 0.3 | 59.27 | 0.3 | 58.90 | ||||||||||||
Vested | (0.3 | ) | 52.39 | (0.2 | ) | 46.54 | ||||||||||
Forfeited | — | 56.45 | (0.3 | ) | 54.13 | |||||||||||
Non-vested at December 31, 2017 | 0.5 | $ | 56.76 | 1.0 | 0.5 | $ | 54.79 | 1.6 | ||||||||
Forfeitures during the year ended December 31, 2017 include all remaining PSUs granted in 2015 as the performance criteria was not achieved as of December 31, 2017.
The weighted-average grant-date fair value of non-vested restricted stock awards units granted during the years ended December 31, 2017, 2016 and 2015 was $59.10, $53.75, and $54.42. The fair value of restricted stock which vested during the years ended December 31, 2017, 2016 and 2015 was $22.6 million, $30.2 million and $9.6 million, respectively.
At December 31, 2017, we had $22.7 million of total unrecognized compensation expense (included in Additional paid-in capital on the Consolidated Balance Sheet) related to share-based compensation arrangements. Based on awards currently outstanding, we estimate that compensation expense attributable to the restricted stock grants will be approximately $15.7 million for 2018, $6.0 million for 2019, and $1.0 million for 2020.
The Consolidated Statement of Income for the years ended December 31, 2017, 2016 and 2015 reflects share-based compensation expense of $44.2 million, $16.3 million and $27.9 million, respectively, within Costs and expenses and Discontinued operations. The total tax benefit recognized in earnings from share-based compensation arrangements for the years ended December 31, 2017, 2016 and 2015, were approximately $17.2 million, $6.4 million and $10.9 million, respectively. Excess tax benefits of $3.0 million were classified as operating cash inflows during the year ended December 31,
87
2017. Excess tax benefits of $4.7 million and $5.6 million were classified as financing cash inflows during the years ended December 31, 2016 and 2015, respectively. Cash proceeds from options exercised for the years ended December 31, 2017, 2016 and 2015 were $2.8 million, $5.3 million and $11.8 million, respectively, and were classified as financing cash inflows. We generally issue shares out of treasury to satisfy stock option exercises.
Stock purchase plan
The 2000 DST Systems, Inc. Employee Stock Purchase Plan (“ESPP”), which provided employees the right to purchase DST shares at a discount, was suspended effective January 1, 2006.
Redeemable non-controlling interest
As a result of our seed capital investment during 2015, there is a non-controlling investor group which owned approximately 47% of a consolidated open-end fund as of December 31, 2016. The amount included on the Consolidated Balance Sheet at December 31, 2016 associated with the redeemable non-controlling interest was $21.3 million. In March 2017, we reduced our ownership interest in a substantial portion of our seed capital investments, resulting in the deconsolidation of the respective fund. The net income attributable to the non-controlling interest was $0.6 million during the year ended December 31, 2017 and the net loss attributable to the non-controlling interest was $0.9 million and $0.1 million during the years ended December 31, 2016 and 2015, respectively.
14. Benefit Plans
We sponsor defined contribution plans that cover domestic and non-domestic employees following the completion of an eligibility period. Employer contribution expenses from continuing operations under these plans totaled $46.0 million, $35.0 million and $33.9 million during the years ended December 31, 2017, 2016 and 2015, respectively. Additionally, through the acquisition of IFDS U.K., we now sponsor a defined benefit pension plan which has a net benefit asset as of December 31, 2017 of $0.9 million.
We have active and non-active non-qualified deferred compensation plans for senior management, certain highly compensated employees and directors. Certain of the active plans permit existing participants to defer a portion of their compensation until termination of their employment, at which time payment of amounts deferred is made in a lump sum or annual installments. Deferred amounts earn interest at a rate determined by the Board of Directors or are credited with deemed gains or losses of the underlying hypothetical investments. Amounts deferred under these plans were approximately $39.9 million and $12.7 million at December 31, 2017 and 2016, respectively. Changes in the liability are recorded as adjustments to compensation expense. The underlying investments, which are classified as trading securities, are recorded at fair market value with changes recorded as adjustments to Other income, net.
15. Supplemental Cash Flow Information
Supplemental disclosure of cash flow information is shown in the following table (in millions):
Year Ended December 31, | |||||||||||
2017 | 2016 | 2015 | |||||||||
Cash payments: | |||||||||||
Interest paid during the year | $ | 26.3 | $ | 22.9 | $ | 24.3 | |||||
Income taxes paid during the year | 115.3 | 164.5 | 217.4 | ||||||||
Non cash investing and financing activities: | |||||||||||
Changes in accrued capital expenditures | 1.6 | 2.0 | 4.0 | ||||||||
Charitable contribution of marketable securities | 13.6 | 2.0 | — | ||||||||
Deposits with broker for securities sold short | 6.9 | 8.4 | 10.8 | ||||||||
Securities sold short | 5.3 | 8.2 | 10.7 | ||||||||
88
16. Commitments and Contingencies
The following table sets forth our contractual cash obligations for our continuing operations including debt obligations, minimum rentals for the non-cancelable term of all operating leases and obligations under software license and other agreements (in millions):
Debt | Operating Leases | Software License Agreements | Other | Total | |||||||||||||||
2018 | $ | 83.7 | $ | 23.8 | $ | 34.9 | $ | 18.9 | $ | 161.3 | |||||||||
2019 | 3.6 | 19.1 | 33.6 | 12.1 | 68.4 | ||||||||||||||
2020 | 183.7 | 16.4 | 30.0 | 3.7 | 233.8 | ||||||||||||||
2021 | 0.7 | 14.7 | 28.9 | 2.4 | 46.7 | ||||||||||||||
2022 | 0.8 | 12.5 | 7.6 | 2.1 | 23.0 | ||||||||||||||
Thereafter | 350.8 | 17.5 | — | — | 368.3 | ||||||||||||||
Total | $ | 623.3 | $ | 104.0 | $ | 135.0 | $ | 39.2 | $ | 901.5 | |||||||||
Debt includes the accounts receivable securitization program, 2010 Senior Notes, 2017 Senior Notes, revolving credit facilities and other indebtedness as described in Note 10, “Debt.” We also have letters of credit of $5.3 million and $5.9 million outstanding for December 31, 2017 and 2016, respectively. Letters of credit are provided by our debt facility.
We have future obligations under certain operating leases. The operating leases, which include facilities, data processing and other equipment, have remaining lease terms ranging from 1 to 10 years excluding options to extend the leases for various lengths of time. Certain leases have clauses that call for the annual rents to be increased during the term of the lease. Such lease payments are expensed on a straight-line basis. We also lease certain facilities from unconsolidated real estate affiliates.
The following rental costs were incurred (in millions):
Year Ended December 31, | |||||||||||
2017 | 2016 | 2015 | |||||||||
Rent expense | $ | 28.6 | $ | 22.2 | $ | 23.6 | |||||
Occupancy expenses included in above amounts that were charged by unconsolidated real estate affiliates | 6.0 | 5.9 | 6.8 | ||||||||
Obligations under software license agreements generally relate to purchase obligations under maintenance agreements that support the software license.
We have entered into agreements with certain officers whereby upon defined circumstances constituting a change in control of the Company, certain benefit entitlements are automatically funded and such officers are entitled to specific cash payments upon termination of employment. Additionally, we have adopted the DST Systems, Inc. Executive Severance Plan which provides certain benefits to participants in the event of a qualifying termination under the plan.
Other contractual commitments
In the normal course of business, to facilitate transactions of services and products and other business assets, we have agreed to indemnify certain parties with respect to certain matters. We have agreed to hold certain parties harmless against losses arising from a breach of representations or covenants, data and confidentiality obligations, or out of intellectual property infringement or other claims made by third parties. These agreements may limit the time within which an indemnification claim can be made and the amount of the claim. At December 31, 2017, except for certain immaterial items, there were no liabilities for guarantees or indemnifications as it is not possible to determine either the maximum potential amount under these indemnification agreements or the timing of any such payments due to the limited history of prior indemnification claims and the unique facts and circumstances involved in each particular agreement. Historically, payments made under these agreements have not had a material impact on our consolidated financial position, results of operations or cash flows.
Legal Proceedings
A putative class action suit was filed against the Company, the Compensation Committee of our Board of Directors, the Advisory Committee of our 401(k) Profit Sharing Plan (the “Plan”) and certain of our present and/or former officers and directors, alleging breach of fiduciary duties and other violations of the Employee Retirement Income Security Act. On
89
September 1, 2017, a complaint was filed purportedly on behalf of the Plan in the Southern District of New York, captioned Ferguson, et al v. Ruane Cunniff & Goldfarb Inc, et al., naming as defendants the Company, the Compensation Committee of our Board of Directors, the Advisory Committee of the Plan and certain of our present and/or former officers and directors. We intend to defend this case vigorously, and, because it is still in its preliminary stages, we have not yet determined what effect this lawsuit will have, if any, on our financial position or results of operations.
In connection with an investigation of the Plan and the activities of its fiduciaries, the U.S. Department of Labor through its Employee Benefits Security Administration issued a letter dated February 23, 2018 stating that, based on facts gathered, it appeared that certain fiduciaries of the Plan may have breached their fiduciary obligations and violated certain provisions of the Employee Retirement Income Security Act in connection with the administration of the Plan. The letter stated that if the fiduciaries fail to take corrective action, the matter may be referred to the Office of the Solicitor of Labor for possible legal action. The letter further stated that if the fiduciaries take proper corrective action based on a settlement agreement with the Department of Labor, it will not bring a lawsuit with regard to these issues, and close its investigation without further action. We have not yet determined what effect this letter will have, if any, on our financial position or results of operations.
On February 20, 2018, a putative class action complaint was filed against DST and the members of our board of directors in the United States District Court for the District of Delaware under the caption Scott v. DST Systems, Inc., et al. The complaint alleges that the preliminary proxy statement issued in connection with the Merger omitted material information in violation of Sections 14(a) and 20(a) of the Securities Exchange Act of 1934, as amended (the “Exchange Act”). Specifically, the complaint alleges that the preliminary proxy statement does not disclose the line items used to calculate certain measures that do not comply with Generally Accepted Accounting Principles (“non-GAAP”) or a reconciliation of such non-GAAP measures to our most comparable GAAP measures, and also does not disclose actual projected values of unlevered free cash flow (“UFCF”) or the values of the line items utilized to calculate UFCF, rendering the preliminary proxy statement false and misleading. The complaint seeks an order (1) declaring that the action is properly maintainable as a class action and certifying the plaintiff as class representative and his counsel as class counsel; (2) enjoining us from proceeding with the shareholder vote on the Merger or consummating the Merger, unless and until we issue additional disclosures; (3) awarding damages; (4) awarding costs and disbursements of this action, including reasonable attorneys’ and expert fees and expenses; and (5) granting such other and further relief as the Court may deem just and proper. We believe the lawsuit is without merit and intend to defend vigorously against these allegations, and, because it is still in its preliminary stages, we have not yet determined what effect this lawsuit will have, if any, on our financial position or results of operations.
On February 21, 2018, a putative class action complaint was filed against DST and the members of our board of directors in the United States District Court for the Western District of Missouri under the caption Pratt v. DST Systems, Inc., et al. The complaint alleges that the preliminary proxy statement issued in connection with the Merger omitted material information in violation of Sections 14(a) and 20(a) of the Exchange Act. Specifically, the complaint alleges that the preliminary proxy statement does not disclose the line items used to calculate certain non-GAAP measures or a reconciliation of such non-GAAP measures to our most comparable GAAP measures; does not disclose actual projected values of unlevered free cash flow (“UFCF”), the values of the line items utilized to calculate UFCF, the terminal values for DST, or the inputs for the perpetuity growth rates and discount rates; does not disclose the multiples and metrics for the Publicly Traded Companies Analyses; and does not disclose the multiples and metrics for the Selected Precedent Transactions Analyses, rendering the preliminary proxy statement false and misleading. The complaint seeks an order (1) declaring that the action is properly maintainable as a class action and certifying the plaintiff as class representative and his counsel as class counsel; (2) enjoining us from proceeding with the shareholder vote on the Merger or consummating the Merger, unless and until we issue additional disclosures; (3) directing us to disseminate a materially complete and accurate proxy statement; (4) awarding damages; (5) awarding costs and disbursements of this action, including reasonable attorneys’ and expert fees and expenses; (6) declaring that we violated Sections 14(a) and/or 20(a) of the Exchange Act, as well as Rule 14a-9; and (7) granting such other and further relief as the Court may deem just and proper. We believe the lawsuit is without merit and intend to defend vigorously against these allegations, and, because it is still in its preliminary stages, we have not yet determined what effect this lawsuit will have, if any, on our financial position or results of operations.
On February 27, 2018, a complaint was filed against DST and the members of its board of directors in the United States District Court for the District of Delaware under the caption Williams v. DST Systems, Inc., et al., (D. Del.). The complaint alleges that the preliminary proxy statement issued in connection with the Merger omitted material information in violation of Sections 14(a) and 20(a) of the Exchange Act. Specifically, the complaint alleges that the preliminary proxy statement does not disclose DST's unlevered free cash flows, the individual metrics that the financial advisor calculated for the Selected Publicly Traded Companies Analysis and Selected Precedent Transactions Analysis, and, with respect to the Discounted Cash Flow Analysis, the inputs and assumptions used in calculating the selection of the discount rates and terminal multiple range. The complaint seeks an order (1) declaring that the "Registration Statement" is materially misleading and contains omissions of fact in violation of
90
Section 14(a); (2) enjoining DST from proceeding with the shareholder vote on the Merger or consummating the Merger, unless and until DST issues additional disclosures; (3) awarding damages; (4) awarding costs, including reasonable attorneys’ and expert fees and expenses; and (5) granting such other and further relief as the Court may deem just and proper. The defendants believe the lawsuit is without merit and intend to defend vigorously against these allegations, and, because it is still in its preliminary stages, we have not yet determined what effect this lawsuit will have, if any, on our financial position or results of operations.
We are involved in various other legal proceedings arising in the normal course of our business. At this time, we do not believe any material losses under these claims to be probable. While the ultimate outcome of these legal proceedings cannot be predicted with certainty, it is the opinion of management, after consultation with legal counsel, that the final outcome in such proceedings, in the aggregate, would not have a material adverse effect on our consolidated financial condition, results of operations and cash flows.
17. Segment and Geographic Information
Our operating business units offer sophisticated information processing and software services and products. As discussed in Note 1, “Description of Business,” we established a new reportable segment structure during first quarter 2017. We now present our businesses as three operating segments, Domestic Financial Services, International Financial Services and Healthcare Services. Prior periods have been adjusted to be consistent with the current presentation.
Domestic Financial Services
Our Domestic Financial Services segment provides investor, investment, advisor/intermediary and asset distribution products and services to clients within the U.S. to support direct and intermediary sales of mutual funds, alternative investments, securities brokerage accounts and retirement plans on a remote processing or business process outsourcing basis utilizing our proprietary software applications. This includes transaction processing, account opening and maintenance, reconciliation of trades, positions and cash, corporate actions, regulatory reporting and compliance functions and tax reporting.
International Financial Services
Our International Financial Services segment provides investor and policyholder administration and technology products and services to mutual fund managers, insurers, and platform providers within the U.K., Canada, Ireland and Luxembourg on a remote processing or business process outsourcing basis. In Australia and the U.K., we also provide solutions related to participant accounting and recordkeeping for clients in the wealth management and retirement savings industries/markets.
Healthcare Services
Our Healthcare Services segment uses our proprietary software applications to provide healthcare organizations with pharmacy, healthcare administration, and health outcomes optimization solutions to satisfy their information processing, quality of care, cost management and payment integrity needs. Our healthcare solutions include claims adjudication, benefit management, care management, business intelligence and other ancillary services.
We evaluate the performance of our segments based on income before interest expense, income taxes, and non-controlling interest. Intersegment revenues are reflected at rates prescribed by us and may not be reflective of market rates.
91
Summarized financial information concerning our segments is shown in the following tables (in millions):
Year Ended December 31, 2017 | |||||||||||||||||||
Domestic Financial Services | International Financial Services | Healthcare Services | Elimination Adjustments | Consolidated Total | |||||||||||||||
Operating revenues | $ | 1,130.3 | $ | 537.9 | $ | 418.5 | $ | — | $ | 2,086.7 | |||||||||
Intersegment operating revenues | 56.9 | 0.5 | — | (57.4 | ) | — | |||||||||||||
Out-of-pocket reimbursements | 111.8 | 12.2 | 7.5 | — | 131.5 | ||||||||||||||
Total revenues | 1,299.0 | 550.6 | 426.0 | (57.4 | ) | 2,218.2 | |||||||||||||
Costs and expenses | 1,072.2 | 449.3 | 340.9 | (57.4 | ) | 1,805.0 | |||||||||||||
Depreciation and amortization | 86.8 | 30.7 | 10.5 | — | 128.0 | ||||||||||||||
Operating income | 140.0 | 70.6 | 74.6 | — | 285.2 | ||||||||||||||
Other income (loss), net | 234.2 | (15.5 | ) | 0.3 | — | 219.0 | |||||||||||||
Equity in earnings of unconsolidated affiliates | 34.7 | 19.3 | 0.5 | — | 54.5 | ||||||||||||||
Earnings from continuing operations before interest, income taxes and non-controlling interest | $ | 408.9 | $ | 74.4 | $ | 75.4 | $ | — | $ | 558.7 | |||||||||
Year Ended December 31, 2016 | |||||||||||||||||||
Domestic Financial Services | International Financial Services | Healthcare Services | Elimination Adjustments | Consolidated Total | |||||||||||||||
Operating revenues | $ | 937.7 | $ | 110.5 | $ | 426.2 | $ | — | $ | 1,474.4 | |||||||||
Intersegment operating revenues | 58.1 | 0.4 | — | (58.5 | ) | — | |||||||||||||
Out-of-pocket reimbursements | 73.0 | 1.2 | 8.5 | (0.4 | ) | 82.3 | |||||||||||||
Total revenues | 1,068.8 | 112.1 | 434.7 | (58.9 | ) | 1,556.7 | |||||||||||||
Costs and expenses | 829.0 | 98.2 | 345.1 | (58.9 | ) | 1,213.4 | |||||||||||||
Depreciation and amortization | 77.3 | 3.1 | 15.6 | — | 96.0 | ||||||||||||||
Operating income | 162.5 | 10.8 | 74.0 | — | 247.3 | ||||||||||||||
Other income, net | 13.9 | 8.7 | 0.1 | — | 22.7 | ||||||||||||||
Gain on sale of business | — | 5.5 | — | — | 5.5 | ||||||||||||||
Equity in earnings of unconsolidated affiliates | 14.3 | 12.4 | 0.5 | — | 27.2 | ||||||||||||||
Earnings from continuing operations before interest, income taxes and non-controlling interest | $ | 190.7 | $ | 37.4 | $ | 74.6 | $ | — | $ | 302.7 | |||||||||
Year Ended December 31, 2015 | |||||||||||||||||||
Domestic Financial Services | International Financial Services | Healthcare Services | Elimination Adjustments | Consolidated Total | |||||||||||||||
Operating revenues | $ | 936.8 | $ | 91.8 | $ | 376.4 | $ | — | $ | 1,405.0 | |||||||||
Intersegment operating revenues | 46.3 | 1.6 | — | (47.9 | ) | — | |||||||||||||
Out-of-pocket reimbursements | 60.7 | 1.7 | 8.2 | (1.6 | ) | 69.0 | |||||||||||||
Total revenues | 1,043.8 | 95.1 | 384.6 | (49.5 | ) | 1,474.0 | |||||||||||||
Costs and expenses | 792.3 | 86.1 | 321.3 | (49.5 | ) | 1,150.2 | |||||||||||||
Depreciation and amortization | 67.7 | 4.8 | 18.6 | — | 91.1 | ||||||||||||||
Operating income | 183.8 | 4.2 | 44.7 | — | 232.7 | ||||||||||||||
Other income (loss), net | 207.2 | (2.6 | ) | (0.1 | ) | — | 204.5 | ||||||||||||
Equity in earnings of unconsolidated affiliates | 23.8 | 21.3 | 0.3 | — | 45.4 | ||||||||||||||
Earnings from continuing operations before interest, income taxes and non-controlling interest | $ | 414.8 | $ | 22.9 | $ | 44.9 | $ | — | $ | 482.6 | |||||||||
Earnings from continuing operations before interest, income taxes and non-controlling interest in the segment reporting information above less interest expense of $26.8 million, $23.5 million and $23.8 million for the years ended December 31,
92
2017, 2016 and 2015, respectively, are equal to income from continuing operations before income taxes and non-controlling interest on a consolidated basis for the corresponding year.
Information concerning the revenues of principal geographic areas is as follows (in millions):
Year Ended December 31, | |||||||||||
2017 | 2016 | 2015 | |||||||||
Revenues:(1) | |||||||||||
U.S. | $ | 1,641.1 | $ | 1,417.2 | $ | 1,350.6 | |||||
International | |||||||||||
U.K. | 504.6 | 78.1 | 65.6 | ||||||||
Canada | 19.4 | 19.3 | 21.7 | ||||||||
Australia | 28.4 | 25.4 | 20.5 | ||||||||
Others | 24.7 | 16.7 | 15.6 | ||||||||
Total international | 577.1 | 139.5 | 123.4 | ||||||||
Total revenues | $ | 2,218.2 | $ | 1,556.7 | $ | 1,474.0 | |||||
(1) | Revenues are attributed to countries based on location of the client. |
Information concerning total assets by reporting segment is as follows (in millions):
December 31, | |||||||||||
2017 | 2016 | 2015 | |||||||||
Domestic Financial Services | $ | 2,212.2 | $ | 2,234.9 | $ | 2,438.6 | |||||
International Financial Services | 756.1 | 430.0 | 217.6 | ||||||||
Healthcare Services | 524.5 | 552.2 | 405.3 | ||||||||
Assets held for sale | — | 72.6 | 295.2 | ||||||||
Elimination Adjustments | (554.6 | ) | (517.9 | ) | (543.5 | ) | |||||
Total assets | $ | 2,938.2 | $ | 2,771.8 | $ | 2,813.2 | |||||
Information concerning the long-lived assets (properties and other non-current assets) of principal geographic areas is as follows (in millions):
December 31, | |||||||||||
2017 | 2016 | 2015 | |||||||||
Long-lived assets: | |||||||||||
U.S. | $ | 318.1 | $ | 249.9 | $ | 274.7 | |||||
International | |||||||||||
U.K. | 192.8 | 25.9 | 29.1 | ||||||||
Australia | 8.6 | 8.0 | 2.6 | ||||||||
Others | 5.1 | 2.2 | 7.3 | ||||||||
Total international | 206.5 | 36.1 | 39.0 | ||||||||
Total long-lived assets | $ | 524.6 | $ | 286.0 | $ | 313.7 | |||||
93
18. Quarterly Financial Data (Unaudited)
(in millions, except per share amounts):
________________________________________________________________
Year Ended December 31, 2017 | ||||||||||||||||||||
First Quarter | Second Quarter | Third Quarter | Fourth Quarter | Total | ||||||||||||||||
Operating revenues | $ | 379.8 | $ | 629.4 | $ | 524.8 | $ | 552.7 | $ | 2,086.7 | ||||||||||
Out-of-pocket reimbursements | 25.7 | 26.8 | 37.8 | 41.2 | 131.5 | |||||||||||||||
Total revenues | 405.5 | 656.2 | 562.6 | 593.9 | 2,218.2 | |||||||||||||||
Costs and expenses | 326.4 | 525.2 | 472.1 | 481.3 | 1,805.0 | |||||||||||||||
Depreciation and amortization | 23.2 | 34.8 | 34.7 | 35.3 | 128.0 | |||||||||||||||
Operating income | 55.9 | 96.2 | 55.8 | 77.3 | 285.2 | |||||||||||||||
Interest expense | (5.9 | ) | (6.9 | ) | (6.9 | ) | (7.1 | ) | (26.8 | ) | ||||||||||
Other income, net | 193.0 | 15.5 | 8.7 | 1.8 | 219.0 | |||||||||||||||
Equity in earnings of unconsolidated affiliates | 19.2 | 3.9 | 4.2 | 27.2 | 54.5 | |||||||||||||||
Income from continuing operations before income taxes and non-controlling interest | 262.2 | 108.7 | 61.8 | 99.2 | 531.9 | |||||||||||||||
Income taxes | 18.1 | 35.2 | 13.0 | 18.0 | 84.3 | |||||||||||||||
Income from continuing operations before non-controlling interest | 244.1 | 73.5 | 48.8 | 81.2 | 447.6 | |||||||||||||||
Income (loss) from discontinued operations, net of tax | 2.9 | 1.9 | (0.3 | ) | — | 4.5 | ||||||||||||||
Net income | 247.0 | 75.4 | 48.5 | 81.2 | 452.1 | |||||||||||||||
Net (income) loss attributable to non-controlling interest | (0.6 | ) | — | — | — | (0.6 | ) | |||||||||||||
Net income attributable to DST Systems, Inc. | $ | 246.4 | $ | 75.4 | $ | 48.5 | $ | 81.2 | $ | 451.5 | ||||||||||
Weighted average common shares outstanding | 63.1 | 61.9 | 60.7 | 59.9 | 61.4 | |||||||||||||||
Weighted average diluted shares outstanding | 63.9 | 62.5 | 61.6 | 60.6 | 62.1 | |||||||||||||||
Basic earnings per share: | ||||||||||||||||||||
Continuing operations attributable to DST Systems, Inc. | $ | 3.86 | $ | 1.19 | $ | 0.81 | $ | 1.36 | $ | 7.28 | (1) | |||||||||
Discontinued operations | 0.05 | 0.03 | (0.01 | ) | — | 0.07 | (1) | |||||||||||||
Basic earnings per share | $ | 3.91 | $ | 1.22 | $ | 0.80 | $ | 1.36 | $ | 7.35 | (1) | |||||||||
Diluted earnings per share: | ||||||||||||||||||||
Continuing operations attributable to DST Systems, Inc. | $ | 3.81 | $ | 1.18 | $ | 0.79 | $ | 1.34 | $ | 7.20 | (1) | |||||||||
Discontinued operations | 0.04 | 0.03 | — | — | 0.07 | (1) | ||||||||||||||
Diluted earnings per share | $ | 3.85 | $ | 1.21 | $ | 0.79 | $ | 1.34 | $ | 7.27 | (1) | |||||||||
Cash dividends per share of common stock | $ | 0.18 | $ | 0.18 | $ | 0.18 | $ | 0.18 | $ | 0.72 | ||||||||||
(1) | Earnings per share are computed independently for each of the quarters presented. Accordingly, the accumulation of quarterly earnings per share may not equal the total computed for the year. |
94
Year Ended December 31, 2016 | ||||||||||||||||||||
First Quarter | Second Quarter | Third Quarter | Fourth Quarter | Total | ||||||||||||||||
Operating revenues | $ | 361.3 | $ | 373.9 | $ | 365.5 | $ | 373.7 | $ | 1,474.4 | ||||||||||
Out-of-pocket reimbursements | 19.4 | 16.6 | 21.2 | 25.1 | 82.3 | |||||||||||||||
Total revenues | 380.7 | 390.5 | 386.7 | 398.8 | 1,556.7 | |||||||||||||||
Costs and expenses | 306.9 | 320.4 | 289.6 | 296.5 | 1,213.4 | |||||||||||||||
Depreciation and amortization | 22.1 | 24.2 | 22.8 | 26.9 | 96.0 | |||||||||||||||
Operating income | 51.7 | 45.9 | 74.3 | 75.4 | 247.3 | |||||||||||||||
Interest expense | (6.1 | ) | (6.5 | ) | (5.4 | ) | (5.5 | ) | (23.5 | ) | ||||||||||
Gain on sale of business | — | — | — | 5.5 | 5.5 | |||||||||||||||
Other income, net | 6.3 | 7.0 | 6.7 | 2.7 | 22.7 | |||||||||||||||
Equity in earnings of unconsolidated affiliates | 6.7 | 10.2 | 7.0 | 3.3 | 27.2 | |||||||||||||||
Income from continuing operations before income taxes and non-controlling interest | 58.6 | 56.6 | 82.6 | 81.4 | 279.2 | |||||||||||||||
Income taxes | 20.1 | 22.1 | 31.6 | 27.3 | 101.1 | |||||||||||||||
Income from continuing operations before non-controlling interest | 38.5 | 34.5 | 51.0 | 54.1 | 178.1 | |||||||||||||||
Income (loss) from discontinued operations, net of tax | 18.5 | 18.7 | 222.8 | (11.7 | ) | 248.3 | ||||||||||||||
Net income | 57.0 | 53.2 | 273.8 | 42.4 | 426.4 | |||||||||||||||
Net (income) loss attributable to non-controlling interest | 1.1 | (0.2 | ) | (0.5 | ) | 0.5 | 0.9 | |||||||||||||
Net income attributable to DST Systems, Inc. | $ | 58.1 | $ | 53.0 | $ | 273.3 | $ | 42.9 | $ | 427.3 | ||||||||||
Weighted average common shares outstanding | 67.6 | 66.6 | 65.4 | 64.2 | 66.0 | |||||||||||||||
Weighted average diluted shares outstanding | 68.5 | 67.2 | 66.1 | 65.0 | 66.6 | |||||||||||||||
Basic earnings per share: | ||||||||||||||||||||
Continuing operations attributable to DST Systems, Inc. | $ | 0.59 | $ | 0.52 | $ | 0.77 | $ | 0.85 | $ | 2.71 | (1) | |||||||||
Discontinued operations | 0.27 | 0.28 | 3.41 | (0.18 | ) | 3.76 | (1) | |||||||||||||
Basic earnings per share | $ | 0.86 | $ | 0.80 | $ | 4.18 | $ | 0.67 | $ | 6.47 | (1) | |||||||||
Diluted earnings per share: | ||||||||||||||||||||
Continuing operations attributable to DST Systems, Inc. | $ | 0.59 | $ | 0.51 | $ | 0.76 | $ | 0.84 | $ | 2.68 | (1) | |||||||||
Discontinued operations | 0.26 | 0.28 | 3.37 | (0.18 | ) | 3.73 | (1) | |||||||||||||
Diluted earnings per share | $ | 0.85 | $ | 0.79 | $ | 4.13 | $ | 0.66 | $ | 6.41 | (1) | |||||||||
Cash dividends per share of common stock | $ | 0.16 | $ | 0.17 | $ | 0.17 | $ | 0.16 | $ | 0.66 | ||||||||||
(1) | Earnings per share are computed independently for each of the quarters presented. Accordingly, the accumulation of quarterly earnings per share may not equal the total computed for the year. |
95
Item 9. Changes in and Disagreements with Accountants on Accounting and Financial Disclosure
None.
Item 9A. Controls and Procedures
Evaluation of Disclosure Controls and Procedures and Changes in Internal Control Over Financial Reporting
As of the end of the fiscal year for which this Annual Report on Form 10-K is filed, the Company’s Chief Executive Officer and Chief Financial Officer evaluated the effectiveness of the Company’s disclosure controls and procedures. Based upon that evaluation, the Chief Executive Officer and Chief Financial Officer have concluded that the Company’s disclosure controls and procedures (i) are effective for recording, processing, summarizing and reporting, within the time periods specified in the Securities and Exchange Commission’s rules and forms, the information required to be disclosed by the Company in reports that it files or submits under the Securities Exchange Act of 1934 (the “Exchange Act”), and (ii) include controls and procedures designed to ensure that information required to be disclosed by the Company in such reports is accumulated and communicated to the Company’s management, including the Chief Executive Officer and Chief Financial Officer, as appropriate to allow timely decisions regarding required disclosure. There has been no change in the Company’s internal control over financial reporting that occurred during the last fiscal quarter of the fiscal year for which this Annual Report on Form 10-K is filed that has materially affected, or is reasonably likely to materially affect, the Company’s internal control over financial reporting. Management has excluded BFDS and IFDS U.K. from our assessment of disclosure controls and procedures that are subsumed by internal control over financial reporting as of December 31, 2017 because the entities were acquired by the Company in a purchase business combination during 2017. BFDS is a wholly-owned subsidiary whose total assets and total revenues excluded from management's assessment of internal control over financial reporting represent 15% and 13%, respectively, of the related consolidated financial statement amounts as of and for the year ended December 31, 2017. IFDS U.K. is a wholly-owned subsidiary whose total assets and total revenues excluded from management's assessment of internal control over financial reporting represent 25% and 22%, respectively, of the related consolidated financial statement amounts as of and for the year ended December 31, 2017.
Report of Management on Internal Control over Financial Reporting
The Company’s management is responsible for establishing and maintaining adequate internal control over financial reporting, as such term is defined in Exchange Act Rule 13a-15(f). Under the supervision and with the participation of management, including the Chief Executive Officer and Chief Financial Officer, the Company conducted an evaluation of the effectiveness of our internal control over financial reporting based on the 2013 framework in Internal Control—Integrated Framework issued by the Committee of Sponsoring Organizations of the Treadway Commission. Based on our evaluation under the framework in Internal Control—Integrated Framework, management concluded that our internal control over financial reporting was effective as of December 31, 2017. Management has excluded BFDS and IFDS U.K. from our assessment of internal control over financial reporting as of December 31, 2017 because the entities were acquired by the Company in a purchase business combination during 2017. BFDS is a wholly-owned subsidiary whose total assets and total revenues excluded from management’s assessment of internal control over financial reporting represent 15% and 13%, respectively, of the related consolidated financial statement amounts as of and for the year ended December 31, 2017. IFDS U.K. is a wholly-owned subsidiary whose total assets and total revenues excluded from management’s assessment of internal control over financial reporting represent 25% and 22%, respectively, of the related consolidated financial statement amounts as of and for the year ended December 31, 2017.
The effectiveness of the Company’s internal control over financial reporting as of December 31, 2017 has been audited by PricewaterhouseCoopers LLP, an independent registered public accounting firm, as stated in their report which appears herein.
Item 9B. Other Information
Hooley and Young Separation Agreements.
On February 26, 2018, we entered into a separation agreement with each of Stephen Hooley, our Chief Executive Officer, and Randall Young, our General Counsel (the "executive separation agreements"), pursuant to which, upon the Effective Time of the Merger, each of Messrs. Hooley and Young's employment with us will be terminated for "good reason" pursuant to the employment agreement with Mr. Hooley dated June 30, 2009 and the employment agreement with Mr. Young dated December 31, 2008, respectively (collectively, the "executive employment agreements").
In satisfaction of all obligations of DST under the executive employment agreements, Messrs. Hooley and Young will receive the cash severance and benefits as described in their respective executive employment agreement on the closing date. In addition, in lieu of conversion of any of Messrs. Hooley and Young's outstanding RSUs and PSUs into SS&C equity awards,
96
such awards shall be converted into cash (based upon a cash price of $84.00 per share) and paid in a cash lump sum on the closing date, provided, that to the extent that any such cash award constitutes nonqualified deferred compensation under Section 409A, the cash payment will be paid subject to any six month delay required by Section 409A.
The above description of the executive separation agreements does not purport to be complete and is qualified in its entirety by the full text of the separation agreements set forth in Exhibits 10.34 and 10.35 to the Form 10-K.
97
PART III
Item 10. Directors, Executive Officers and Corporate Governance
Name | Age | Director Since | ||
Joseph C. Antonellis | 63 | 2015 | ||
Jerome H. Bailey | 65 | 2015 | ||
Lynn Dorsey Bleil | 54 | 2014 | ||
Lowell L. Bryan | 72 | 2012 | ||
Gary D. Forsee | 67 | 2015 | ||
Charles E. Haldeman, Jr. | 69 | 2014 | ||
Stephen C. Hooley | 54 | 2012 | ||
Samuel G. Liss | 61 | 2012 | ||
Board of Directors
Joseph C. Antonellis. Mr. Antonellis served in a variety of positions of increasing responsibility at State Street from November 1991 through July 2015. Since March 2010, he served as Vice Chairman and head of all Europe and Asia/Pacific Global Services and Global Markets businesses. In 2006, he was appointed Vice Chairman with additional responsibility as head of Investor Services in North America and Global Investment Manager Outsourcing Services. Prior to this, in 2003, he was named head of Information Technology and Global Securities Services. Before joining State Street, Mr. Antonellis held a number of positions with Bank of Boston over a 15-year period, including Mutual Fund Custody division head and deputy corporate auditor. Until October 2015, he served as a director of Princeton Financial Systems Inc., a State Street company. Mr. Antonellis brings to our Board extensive leadership experience as well as global financial services and technological expertise gained from his tenure at State Street.
Jerome H. Bailey. Most recently, Mr. Bailey served as CFO of the Institutional Clients Group at Citigroup Inc., from August 2011 until his retirement in October 2014. Previously, he was CFO and Chief Information Officer of Equiniti Ltd., a United Kingdom-based provider of administrative, processing, and payment solutions. He has also served as Chief Operating Officer and CFO of NYMEX (New York Mercantile Exchange), and as CFO of Marsh, Inc., an insurance brokerage and risk management firm. Mr. Bailey also served as Executive Vice President and CFO at Dow Jones, and as CFO at Salomon Inc. and Salomon Brothers. While at Marsh and Dow Jones, along with managing the financial functions, he had responsibility for the technology and operations, process change, and strategic development. He also served as Managing Director and Controller of Morgan Stanley and as a Partner at PricewaterhouseCoopers LLP. Mr. Bailey has more than 35 years of experience in financial services, operations, and accounting. In addition, his financial knowledge, management experience, and accounting background make him a valuable asset to the Board and Audit Committee.
Lynn Dorsey Bleil. Ms. Bleil was the leader of McKinsey & Company's West Coast Healthcare Practice, and a leader of McKinsey’s worldwide Healthcare Practice. She retired in November 2013 as a Senior Partner (i.e., Director) in the Southern California Office of McKinsey. During her 25+ years with McKinsey, she worked exclusively within the healthcare sector, advising senior management and boards of leading companies on corporate and business unit strategy, mergers and acquisitions/ integration, marketing & sales, public policy, and organization - across all segments of the healthcare value chain. She also serves on the boards of Stericycle, Inc. and Sonova Holdings AG. In addition to public company board service in the healthcare field, Ms. Bleil is a trustee of Intermountain's Park City Medical Center Governing Board. Ms. Bleil is a valuable asset to our Board. Her significant expertise in the healthcare industry helps advance our strategic business plan.
Lowell L. Bryan. Lead Independent Director. Mr. Bryan is a former Senior Adviser at McKinsey & Company, a global company in the business of management consulting to companies in numerous industries. He retired in mid‑January 2012 from his 27 year role as a Senior Partner (i.e., Director) at McKinsey, where he was a co‑founder of the company’s financial institutions and strategy practices. Upon retirement from his 36 years of full‑time service at McKinsey, he founded L L Bryan Advisory, LLC, which advises management and boards on corporate strategy and organizational issues. Mr. Bryan brings an independent perspective to our Board as a result of his knowledge of the operation of the global capital markets and the global economy, as well as strategic, organizational, and operations issues faced by our financial and healthcare clients. He is the author of several books on banking, capital markets, strategy, and organizational topics. He has advised the boards of directors and top management of dozens of financial institutions, healthcare, and industrial clients primarily on issues of strategy and organization. His knowledge and vast experience contribute to his effectiveness as our Lead Independent Director.
98
Gary D. Forsee. Mr. Forsee was President of the University of Missouri System, a state university system, from December 2007 through January 2011. From 2005 through 2007, he served as Chief Executive Officer of Sprint Nextel Corporation, a telecommunications company. From 2003 to 2005, he was Chairman of the Board and Chief Executive Officer at Sprint Corporation, prior to its merger with Nextel Communications. Prior to that time, Mr. Forsee served as Vice Chairman and Chief Operations Officer at the Bell South Corporation, as President of Bell South International, and as Chief Executive Officer of Global One Communications in Brussels, Belgium, a joint venture of France Telecom, Deutsche TeleKom, and Sprint. He began his career in 1972 with Southwestern Bell Telephone Company. Mr. Forsee serves on the boards of Great Plains Energy Incorporated and Ingersoll-Rand Public Limited Partnership. Mr. Forsee brings to our Board his background as a chief executive of large, technologically complex enterprises. He brings his experience in strategic development and overseeing compensation programs.
Charles E. Haldeman, Jr. From July 2009 through May 2012, Mr. Haldeman was Chief Executive Officer and Director of Federal Home Loan Mortgage Corporation (“Freddie Mac”), a government‑sponsored enterprise that provides mortgage liquidity to the housing market. From 2003 through mid‑2009, he held key leadership positions at Putnam Investment Management, LLC, including CEO and President through June 2008 as well as Chairman of the Board in his final year. Mr. Haldeman has held several executive positions in the asset management industry, including as Chairman and CEO of Delaware Investments and as President and Chief Operating Officer of United Asset Management Corporation. Mr. Haldeman is a Chartered Financial Analyst with a Juris Doctorate and M.B.A. from Harvard. He also serves on the boards of S&P Global Inc. and JBG Smith Properties. He previously served on the board of KCG Holdings, Inc. Mr. Haldeman is an effective addition to our Board with his extensive financial services, capital markets, asset management, finance, and financial regulation knowledge gained through more than 40 years of financial services experience. Through his mutual fund leadership experience, he has insight into the strategic challenges faced by our financial services clients.
Stephen C. Hooley. Chairman of the Board, Chief Executive Officer and President. Mr. Hooley became our Chief Executive Officer and President in September 2012, after joining the Company in July 2009 as our President and Chief Operating Officer. He became Chairman of the Board in July 2014. He was the President and Chief Executive Officer of BFDS from mid‑2004 until joining DST. He served from 2009 through April 2013 as non-executive Chairman of BFDS. From 2007 through March 2013, he served as Chief Executive Officer of IFDS L.P. Mr. Hooley’s deep financial services industry experience; his extensive knowledge of DST and the interrelationship of our domestic and international diversified business ventures; and his well‑established relationships with our customers, associates, and partners are valuable assets to the Board as it works to enhance value for stockholders. Mr. Hooley has developed a productive relationship with the Board, collaborating on DST’s most important strategic issues.
Samuel G. Liss. Mr. Liss has been the managing principal since July 2010 of WhiteGate Partners LLC, an advisory firm focused on the financial and business services sectors. He has also served since April 2014 as an Adjunct Professor of Finance at New York University Stern School of Business and since September as an Adjunct Professor at Columbia Law School. From April 2004 through June 2010, Mr. Liss was Executive Vice President, Travelers Companies, Inc., a provider of property and casualty insurance, and continues to serve as an advisor. He was responsible for corporate strategy, divestitures and acquisitions, and had direct management responsibility for one of Travelers’ three operating divisions - Financial, Professional, and International Insurance. From February 2003 through March 2004, Mr. Liss was Executive Vice President of The St. Paul Companies. From 1994 through 2001, he served as Managing Director of Financial Institutions Banking Group and Managing Director of Equity Research at Credit Suisse First Boston, Inc. He began his career at Salomon Brothers. He also serves on the board of Verisk Analytics, Inc. Mr. Liss’ strong background in financial services, management, and capital markets plus other public and private board experience contribute to his service on our Board and effectiveness as the Chair of our Nominating Committee.
Executive officers of the registrant (other than Mr. Hooley, whose information is provided above)
The following list presents certain information with respect to each of our executive officers.
Jonathan J. Boehm, age 57, is our Executive Vice President and Head of Healthcare Businesses. He re‑joined the Company in 1997 after prior service in the early 1980s. Prior to becoming an Executive Vice President managing our Healthcare businesses in 2009, he served as Group Vice President - Mutual Funds Full Service. He is responsible for our Healthcare Services segment, including DST HealthCare Holdings, Inc. and its subsidiaries DST Health Solutions and DST Pharmacy Solutions.
Edmund J. Burke, age 57, is our Executive Vice President and President of ALPS. ALPS includes the Corporation’s investment management and asset servicing businesses. ALPS Holdings, Inc. became a wholly‑owned subsidiary of the Company during 2011. Mr. Burke joined ALPS in 1991 and has served as President since 2000. As part of his responsibilities for the ALPS group of companies, Mr. Burke is President and Trustee of Clough Global Long/Short Fund, Clough Global Allocation Fund, Clough Global Equity Fund and Clough Global Opportunities Fund, Trustee of Liberty All‑Star Equity Fund,
99
Director of Liberty All‑Star Growth Fund, Inc., and President and Trustee of Financial Investors Trust. Each of these funds operates as a registered investment company pursuant to the Investment Company Act of 1940.
Gregg Wm. Givens, age 57, is our Senior Vice President, Chief Financial Officer and Treasurer. He assumed the roles of Chief Financial Officer and Treasurer in January of 2014. He joined the Company in 1996 as an officer and served as Vice President and Chief Accounting Officer from 1999 through 2013.
Vercie L. Lark, age 55, is our Executive Vice President and Head of our Financial Services businesses. He joined the Company as Vice President and Chief Information Officer in June 2010 and assumed his current title in April 2016. Mr. Lark previously served since July 2009 as Vice President and Chief Information Officer of CenturyLink, Inc., a provider of voice, broadband and video services. He had served since 2008 as the Chief Information Officer of Embarq Corporation, which was acquired in 2009 by CenturyLink.
Maria Mann, age 55, is Senior Vice President and Chief Information Officer. She joined the Company in April 2016. From 2011 through April 2016, she served as Chief Technology Officer at a division of JP Morgan Chase and Co., a multinational banking and financial services holding company. She is responsible for our global information technology infrastructure and architecture functions, global information privacy and security, and global information technology sourcing as well as risk and corporate applications.
William Slattery, age 62, is Chief Executive Officer of DSTi Holdings Limited and Chairman of DST Financial Services Europe, Ltd. He joined the Company in January 2017. Prior to joining DST, Mr. Slattery was Head of the Investment Servicing business for State Street Europe and held various executive positions at State Street since 2003. Before joining State Street, Mr. Slattery was Managing Director and Head of Global Risk Management at Deutsche Asset Management and Member of the Group Risk Board of Deutsche Bank AG. His earlier career included 23 years at the Central Bank of Ireland, including senior leadership roles with responsibility for Ireland’s International Financial Services Centre and as Deputy Head of Banking Supervision. Mr. Slattery, who has over 20 years in the financial services industry, was a former Chairman of Financial Services Ireland and was a member of the Public Expenditure Review Group, established by the Irish government in 2007.
Mary E. Sweetman, age 54, is Senior Vice President and Chief Human Resources Officer. She joined the Company in June 2013 as a Vice President and assumed her current title in March 2014. Prior to joining the Company, she had served since 2007 as Senior Vice President, Human Resources for Furniture Brands International, a home furnishings designer and manufacturer that, following her departure from that company, filed for bankruptcy in September 2013.
Randall D. Young, age 61, became Senior Vice President, General Counsel and Secretary in mid‑2013. Since 2002, he had served as Vice President, General Counsel and Secretary. He joined the Company as a Vice President in 1994.
Code of ethics
We have adopted the Code of Business Conduct, which applies to all of our directors, officers and employees. The Code of Business Conduct is publicly available on our website at www.dstsystems.com. If we make any amendment to our Code of Business Conduct, other than a technical, administrative or non-substantive amendment, or if we grant any waiver, including any implicit waiver, from a provision of the Code of Business Conduct that applies to our principal executive officer, principal financial officer, principal accounting officer or controller, we will disclose the nature of the amendment or waiver on our website at the same location. Also, we may elect to disclose the amendment or waiver in a current report on Form 8-K filed with the SEC.
Audit Committee disclosure
Our independent audit committee is responsible for:
• | appointing, approving the services and overseeing the work of, and receiving reports directly from the independent registered public accounting firm |
• | reviewing audited financial statements and various other public disclosures |
• | assisting the Board in overseeing material financial risk exposures |
• | assisting the Board in overseeing our internal audit function and legal and regulatory compliance, as well as the integrity of our financial statements and certain internal controls |
Mr. Bailey chairs the Audit Committee. Other members include: Messrs. Antonellis, Bryan, Forsee, Haldeman, Liss and Ms. Bleil. Our Board has determined that Messrs. Antonellis, Bailey, Bryan, Forsee, Haldeman, and Liss are each an “audit committee financial expert.” Each member of the Audit Committee is “financially literate” as defined by NYSE rules. Each member of the Audit Committee is “independent” as defined by applicable law and NYSE Listing Standards. No Committee member serves on more than two other public company audit committees.
100
Section 16(A) beneficial ownership reporting compliance
The securities regulations require our non-employee directors, certain of our officers, and each person who owns more than 10% of DST stock to file ownership reports with the Securities and Exchange Commission. Based on our review of the reports, and our officers’ and directors’ written representations to us, we believe all required reports were timely filed during the relevant period, except as follows: DST filed a late Form 4 on behalf of William Slattery, because of an administrative oversight.
Item 11. Executive Compensation
On January 11, 2018, we entered into a Merger Agreement wherein SS&C will acquire DST. Under the terms of the agreement, SS&C will purchase DST in an all-cash transaction for $84.00 per share plus the assumption of debt, equating to an enterprise value of approximately $5.4 billion. The transaction is subject to DST stockholder approval, clearances by the relevant regulatory authorities and other customary closing conditions. See Item 8, Financial Statements and Supplementary Data - Note 1, “Description of the Business” for more information regarding this transaction. The effects of the Merger on the Company’s equity awards and other executive compensation plans and agreements are described in greater detail in the definitive proxy statement filed by the Company with the SEC on February 27, 2018 in connection with the Merger, and any description of such effects of the Merger Agreement in this Form 10-K are qualified in their entirety by the definitive transaction documents, including the Merger Agreement set forth in Exhibit 2.8 to this Form 10-K as the same may be amended from time to time, and the associated definitive proxy statement filed with the SEC.
Compensation Discussion and Analysis
The purpose of this Compensation Discussion and Analysis (“CD&A”) is to provide information about DST’s compensation policies for our NEOs. Our NEOs for 2017 are:
Name | Title | |
Stephen C. Hooley | Chairman of the Board, Chief Executive Officer, and President | |
Gregg Wm. Givens | Senior Vice President, Chief Financial Officer, and Treasurer | |
Jonathan J. Boehm | Executive Vice President and Head of Healthcare Businesses | |
Edmund J. Burke | Executive Vice President and President of ALPS | |
Vercie L. Lark | Executive Vice President and Head of Domestic Financial Services | |
The discussion below relates to DST’s compensation policies prior to the Company’s entry into the Merger Agreement with SS&C in January 2018. The entry into the Merger Agreement did not affect the Compensation Committee’s compensation policies with respect to 2017 compensation. All references to the “Committee” in this CD&A refer to the Compensation Committee of our Board of Directors.
Executive pay philosophy
The Company’s business strategy for creating growth has been to leverage the capabilities of its employees to execute its growth strategy while remaining committed to maintaining a strong financial position with appropriate flexibility and liquidity. Our compensation philosophy has supported this strategy by stressing the importance of pay for corporate and individual performance in meeting strategic and business goals for growth, value creation and financial strength, while maintaining flexibility to meet the changing employee, business and market conditions. Our executive compensation program is designed to attract and retain a talented team of executives who are expected to provide leadership for the Company’s success in a challenging business environment. The Company has accomplished this by motivating executives with an appropriate mix of compensation elements described below.
Objectives of our Executive Compensation Program
We have used the following principles to determine our Executive Compensation Program:
• | Attract, Retain, and Motivate High‑Performing Executives: Our executive base salaries and target incentive compensation opportunities are designed to be market competitive so that we can attract, retain, and motivate individuals who will drive superior business performance. |
• | Pay-for-Performance: We seek to build and support a performance‑driven culture by incorporating an at‑risk component into a significant portion of each executive’s pay. The at‑risk component varies based on individual responsibility levels as well as organizational and, as applicable, business unit performance results. |
101
• | Align with Stockholder Interests: The majority of NEO compensation is tied to organizational performance and is, therefore, at risk. We have historically incorporated into our program two performance based compensation vehicles that align executive compensation with creation of stockholder value. |
▪ | Annual Short‑Term Cash Incentive: This annual opportunity rewards performance as measured by achievement against pre‑set annual financial goals. |
▪ | Long‑Term Equity Incentive: Our equity grants have aligned executive and stockholder interests in long‑term stock appreciation. |
• | Integrate with Our Corporate Values: Our compensation is designed to motivate and inspire behavior that fosters a high-performance culture while upholding our corporate governance standards and avoiding unreasonable risk. |
Since talent is critical to our long‑term success, we seek to pay executives at levels that are competitive with other employers with whom we compete for talent. Our goal has been to target executive compensation, on average, to be at the median of this market, with the opportunity to earn above‑market compensation for superior performance within any given year or performance period. Our program incorporates several features that seek to drive business performance over both the short‑ and long‑term. A higher percentage of total compensation is at‑risk for the most senior levels in order to reflect the additional responsibilities associated with these positions.
Components of 2017 Compensation
Type | Objectives | Key Features | ||
Base Salaries | Fixed compensation component. Help attract and retain high-caliber executive talent. | The Committee targets NEO base salaries at the median of the industry peer group benchmark data, but also takes into account each NEO’s responsibilities, leadership, tenure, and retention risk. Base salaries for the NEOs are reviewed annually for potential adjustments. | ||
Annual Cash Incentives | An at‑risk, performance based compensation component. Align the interests of executives and stockholders by providing compensation based on the achievement of pre‑determined annual financial goals. | For 2017, for each of our NEOs other than Mr. Burke, 60% of annual incentive performance was based on Adjusted EPS performance, with the remaining 40% tied to Adjusted Operating Revenue. Threshold, target, and maximum goals were established in early 2017, with payout opportunities ranging from 0% to 150% of target for each of our NEOs other than Mr. Burke. Mr. Burke participated in a separate ALPS annual cash incentive plan (discussed below), which was designed to reward achievement based upon ALPS and Company financial performance. | ||
Long‑Term Equity Incentives | Align NEO and stockholder interests through the appreciation of stock price over the long-term. | The Company uses a combination of at‑risk Performance Stock Units (“PSUs”) and time-vesting Restricted Stock Units (“Time-Based RSUs”) to provide NEOs with a performance and retention incentive opportunity. In keeping with our pay for performance philosophy, we apportioned the aggregate grant date fair value of long-term incentives to each NEO so that two‑thirds is in the form of PSUs and one‑third is in the form of Time-Based RSUs. PSUs vest based on performance against a pre‑determined three‑year cumulative Adjusted EBITDA goal. Threshold, target, and maximum goals were established in early 2017 for the 2017-2019 performance period, with payout opportunities ranging from 0% to 200% of target for PSUs granted in 2017. Time-Based RSUs vest annually in equal one‑third increments. | ||
Benefits & Perquisites | Deliver limited benefits and perquisites to executives. | Because we provide limited perquisites, we do not believe that they are material to our overall compensation program. We do not provide gross-ups for NEO perquisites. | ||
Pay-for-Performance
Our philosophy has been to link pay to performance so that the interests of our executives and stockholders are aligned.
A significant portion of our NEOs’ total compensation reflects both upside and downside risk. The portion of the compensation of the CEO and other NEOs that is considered at-risk, (i.e., tied to Company performance over the short‑ and/or long‑term) has historically exceeded the fixed portion. We have historically provided that a greater percentage of the CEO’s compensation is at-risk than the other NEOs. We have set goals based on growth objectives, our mix of businesses, projections, and competitive outlooks.
102
We believe the additional emphasis on at-risk compensation for the CEO (when compared to the other NEOs) reflects his additional responsibility and overall contribution to Company performance. 65% of our CEO’s compensation and 61% of our other NEO’s compensation is considered at-risk.
Risk Taking
Our compensation program is designed to put pay at-risk for performance while at the same time discouraging unnecessary risk-taking. The Committee evaluates the potential for unacceptable risk-taking when designing the compensation program. We believe that the design of our executive compensation program does not encourage excessive risk-taking or incent our NEOs to take actions that may conflict with our risk-based decision making. Material risk in our compensation design is mitigated in several ways:
• | Earnings goals and award opportunities in our annual cash incentive program are at levels intended to be challenging without the need to take inappropriate risks; |
• | Our long-term incentives consist of Time-Based RSUs that vest over a multi-year period and PSUs that are earned at the end of a three-year period, both of which provide upside potential and downside risk; |
• | Our use of RSUs versus stock options mitigates the likelihood of risk-taking because RSUs, unlike stock options, retain some value even in a down market; |
• | Payouts under our long-term incentive plans were capped at 150% of target for grants prior to 2016, and for grants made after 2016 have been capped at 200% of target; |
• | Payouts under our annual incentive plan have been capped at 150% of target, other than Mr. Burke who participated in the ALPS annual cash incentive plan; |
• | Adjusted EBITDA has been used as a performance metric in our long-term PSUs while award opportunities under our annual cash incentive program are based on adjusted earnings per share (“EPS”) and adjusted operating revenue, thereby minimizing the opportunity to manipulate results; and |
• | We have adopted a clawback policy. |
In addition, we have policies in place that prohibit our NEOs from pledging or hedging shares of Company securities owned by them.
Named Executive Officer Compensation Practices
The processes and procedures for determining executive officer compensation are written and were approved by the Committee. The Committee is responsible for and has the authority under its charter to determine the components of executive officer compensation.
In support of its pay-for-performance philosophy, the Committee has tied a significant portion of executive officer compensation to the creation of stockholder value over the long term, structured executive officer compensation so that a significant portion of total compensation is at-risk rather than fixed, and used balanced performance goals that incent both short-term and long-term business results.
The Committee reviews executive officer compensation annually. For each review, the Committee may consider, and decide the weight it will give to, among other things, any combination of the following:
• | market competitive data; |
• | individual responsibilities; |
• | individual results against established goals; |
• | Company or business unit performance and objectives and other Company financial and strategic information; |
• | tax and accounting impact of proposed compensation; |
• | retention; |
• | internal pay equity among the executives; and |
• | effects of a potential severance, change in control or other transaction. |
The Committee has historically utilized the services of an independent compensation consultant. As described below, the independent compensation consultant has provided various data, analyses, and advice to the Committee on executive compensation matters. In addition, the Committee may request our Chief Executive Officer or Chief Human Resources Officer recommend compensation package components. Such officers communicate executive hiring and retention concerns to the Committee. The Committee may ask the Chief Executive Officer, Chief Human Resources Officer, Chief Financial Officer or General Counsel to provide the Committee with:
• | market analysis data; |
• | proposed benefit plan terms and conditions; |
103
• | financial, accounting, and tax information; |
• | legal requirements for benefit plan and award structures; |
• | valuation information regarding outstanding awards and undistributed account balances and other historical Company compensation data; and |
• | Company performance data and individual performance evaluations. |
The Committee develops the criteria for evaluating Chief Executive Officer performance and annually reviews his performance against such criteria. The Chief Executive Officer periodically discusses with the Committee his view of the performance of the other executive officers.
The 2015 Equity and Incentive Plan permits the Committee to delegate certain administrative matters, and the Committee has made administrative delegations to the Chief Executive Officer, Chief Human Resources Officer, and Chief Financial Officer.
The Committee and the Board rely on the Chief Human Resources Officer to implement compensation decisions and adopt appropriate compensation policies, procedures, and internal controls.
2017 Compensation Details
Annual base salaries
The following table shows the base salaries of each NEO and summarizes their 2017 base salary increases. Increases shown below were based on considerations including: the relative position of the individual to the market competitive benchmarks, individual performance, and retention considerations.
2016 Base Salary | 2017 Base Salary | % Increase | |||
Stephen C. Hooley | $825,000 | $850,000 | 3.03% | ||
Gregg Wm. Givens | $460,000 | $475,000 | 3.26% | ||
Jonathan J. Boehm | $490,000 | $490,000 | 0% | ||
Edmund J. Burke | $400,000 | $415,000 | 3.75% | ||
Vercie L. Lark | $460,000 | $460,000 | 0% | ||
Annual cash incentives
The following table summarizes the 2017 annual cash incentive opportunity levels for the CEO and other NEOs as a percentage of base salary (other than Mr. Burke who participated in the ALPS annual cash incentive plan discussed below).
2017 Target Bonus (% of Base Salary) | |
CEO | 150% |
Other NEOs | 100% |
The following table summarizes the 2017 annual incentive payout ‘curve’ as a percentage of target goal achievement and states the corresponding weighted financial goals.
Weighting | Threshold 50% | Target 100% | Maximum 150% | ||||
Adjusted EPS Goals (1) | 60% | $2.72 | $2.90 | $3.09 | |||
Adjusted Operating Revenue Goals (2) | 40% | $1,827mm | $1,922mm | $2,002mm | |||
(1) | Adjusted EPS is defined as diluted EPS for the reporting period as reflected in the audited financial statements, adjusted for the effect of certain predetermined adjustments, as described below. |
(2) | Adjusted Operating Revenue is defined as consolidated operating revenue for the reporting period as reflected in the audited financial statements, adjusted for certain predetermined adjustments, as described below. |
104
For the 2017 performance year, the annual incentive goal result was as follows:
Actual Performance | Performance as a % of Target | Weighting | Weighted Payout | ||||
Adjusted EPS Goals (1) | $3.75 | 150% | 60% | 90% | |||
Adjusted Operating Revenue Goals (2) | $2.014 billion | 150% | 40% | 60% | |||
Total | 150% | ||||||
(1) | The following pre‑determined adjustments affected the level of achievement relating to EPS Goals: effect of repurchased shares, sale or impairment of non‑operating assets, expense recognized related to restructuring charges for non-GAAP results, the impact of strategic transactions, including results of operations and related transactional costs, the impact of changes in GAAP, and an additional adjustment for loss of a client. |
(2) | The following pre‑determined adjustments affected the level of achievement relating to Operating Revenue Goals: the impact of strategic transactions and an additional adjustment for loss of a client. |
The following table summarizes the annual cash incentives awarded for the 2017 performance period for our NEOs (other than Mr. Burke who participated in the ALPS annual cash incentive plan discussed below):
2017 Target Bonus | Actual Performance Level | Actual Bonus Total | |||
Stephen C. Hooley | $1,275,000 | 150% | $1,912,500 | ||
Gregg Wm. Givens | $475,000 | 150% | $712,500 | ||
Jonathan J. Boehm | $490,000 | 150% | $735,000 | ||
Vercie L. Lark | $460,000 | 150% | $690,000 | ||
Mr. Burke serves as President of ALPS and, therefore, participated in the ALPS annual cash incentive plan. The ALPS annual cash incentive plan is an at-risk performance-based program designed to reward achievement based upon ALPS and DST financial performance. The size of the annual ALPS bonus pool is determined based upon several financial measures, and participants are granted the right to receive a specified percentage of the pool. For 2017, the incentive bonus pool initially equaled 17.5% of ALPS pre-bonus Adjusted EBITDA, subject to three adjustments: (i) 20% of the pool amount was subject to increase or decrease based upon achievement of the Adjusted EPS Goals under the 2017 DST cash incentive plan (disclosed above), (ii) the amount of the bonus pool was reduced by the increase in matching payments under the 401(k) plan to ALPS employees due to an increase in the percentage of contributions matched in 2017, and (iii) the bonus pool was subject to increase based upon achieving 30% year-over-year ALPS pre-bonus Adjusted EBITDA growth, which was not achieved for 2017. Mr. Burke’s annual incentive for 2017 equaled 10% of the adjusted bonus pool, by agreement established at date of hire. For 2017, Mr. Burke's annual cash incentive award under the plan was $894,795, which reflects his percentage of the bonus pool as increased based upon achievement of the maximum Adjusted EPS Goals for DST.
Long‑term equity incentives - PSUs and Time-Based RSUs
DST is committed to pay-for-performance and ensuring the alignment of our executives’ and our stockholders’ interests. Equity awards have historically been made at the first regularly scheduled Committee meeting of the year. Any subsequent awards for onboarding, promotions, or special rewards are generally made at regularly scheduled Committee meetings.
Performance stock units
Two‑thirds of 2017 equity awards were in the form of PSUs and are subject to the following terms, including a challenging performance metric that prevents awards from vesting if Adjusted EBITDA targets are not met:
• | Vesting of PSUs is based on performance against pre‑determined cumulative Adjusted EBITDA goals at the end of a three year performance period. |
• | If the threshold goal is not achieved, no vesting occurs, no shares are issued, and all PSUs are forfeited. |
• | If the threshold goal is achieved, the number of shares to be issued is 50% for awards granted before 2016, and 25% for awards granted in 2016 and in subsequent years, of the target number of units, and the remaining PSUs are forfeited. |
• | If the target goal is achieved, the number of shares to be issued equals the target number of units granted. |
• | If the maximum goal is achieved, the number of shares to be issued equals 150% for awards granted before 2016 and 200% for awards granted in 2016 and in subsequent years, of the target number of units granted. |
• | Linear interpolation is used to determine the number of shares to be issued between goal levels (so that, for instance, there could be 54%, or 123%, of the target number vesting). |
105
Time-based restricted stock units
One-third of the 2017 equity awards were granted to our NEOs in the form of Time-Based RSUs that vest annually in one-third increments.
Grants awarded in 2017
This table shows the aggregate grant date fair value of the 2017 long-term incentive grants and the allocation of the awards between PSUs and Time-Based RSUs for each NEO.
Aggregate Grant Date Fair Value (1) | Aggregate Annual Units (#) | Time-Based RSUs (#) | PSUs (at Target Number Granted) (#) | ||||
Stephen C. Hooley | $4,556,770 | 77,018 | 25,416 | 51,602 | |||
Gregg Wm. Givens | $1,012,550 | 17,114 | 5,648 | 11,466 | |||
Jonathan J. Boehm | $1,215,131 | 20,538 | 6,778 | 13,760 | |||
Edmund Burke | $759,442 | 12,836 | 4,236 | 8,600 | |||
Vercie L. Lark | $1,113,840 | 18,826 | 6,212 | 12,614 | |||
(1) | The grant date fair value shown for each individual was calculated by dividing by the average of the highest and lowest reported sale price of DST stock on February 24, 2017, which was $59.165. |
Vesting of 2015-2017 PSUs
The following table summarizes the vesting as a percentage of the target number of units for all NEOs as well as the corresponding financial goals for the 2015-2017 performance cycle:
Threshold | Target | Maximum | |||
2015-2017 PSU Vesting as a Percentage of Target | 50% | 100% | 150% | ||
Range of Performance Targets | ||||||||||||||
Performance Share Plan | Metric (1) | Threshold | Target | Maximum | Payout Range | Actual Adjusted EBITDA | Payout | |||||||
2015-2017 | Adjusted EBITDA | $1.630B | $1.790B | $1.950B | 0-150% | $1.533B | 0% | |||||||
(1) | EBITDA is defined as cumulative earnings before interest, taxes, depreciation, and amortization, as reflected in the audited financial statements for the three year performance period ended December 31, 2017. EBITDA as defined for the equity grants excludes the cost of equity compensation. |
Adjusted EBITDA for purposes of the 2015-2017 plan reflects pre‑determined adjustments that are to be made to the level of EBITDA goal achievement. These adjustments include: the sale or impairment of non-operating assets (investment or real estate); the sale of a subsidiary to a third party; and the acquisition of the remaining interests in a joint venture.
As shown above, the threshold performance level was not obtained for the 2015-2017 performance cycle and, therefore, the awards were forfeited for this performance period.
106
Peer group
Benchmarking data is gathered and presented to the Committee by its independent compensation consultant, Deloitte Consulting LLP (“Deloitte”). Deloitte supplements peer group data with published survey data from general industry and computer and data processing companies of a similar financial size. The Committee has developed an industry peer group of similarly-sized companies in the data processing and software services industries in order to assess competitive market compensation levels for the NEOs. The following fifteen companies comprised the industry peer group used to benchmark compensation awarded for 2017:
Alliance Data Systems Corporation | Broadridge Financial Solutions, Inc. |
Convergys Corporation | Corelogic, Inc. |
CSG Systems International, Inc. | Euronet Worldwide, Inc. |
Fidelity National Information Services, Inc. | Fiserv, Inc. |
Global Payments Inc. | NCR Corporation |
Jack Henry & Associates, Inc. | Teletech Holdings Inc. |
MoneyGram International, Inc. | Verifone Systems, Inc. |
Total System Services, Inc. | |
The 2017 peer group was the same peer group used for 2016, except that Heartland Payment Systems, Inc. was removed from the 2017 peer group as it was acquired in 2016.
Role of the compensation consultant and management
Deloitte provided various data, analyses, and advice to the Committee on executive compensation matters during 2017. Deloitte reports directly to the Committee and attends Committee meetings as requested. In 2017, such services included benchmarking executive compensation, providing competitive information on incentive plan practices, reviewing the 2017 Compensation Discussion and Analysis, and reviewing peer group compensation practices.
The Committee welcomes the CEO’s input as it designs NEO compensation programs and sets the compensation of the other NEOs. However, the CEO is not present during discussions at Committee meetings or between the Committee and Deloitte regarding his compensation.
The Committee alone makes decisions about the amounts and forms of NEO compensation, and its decisions may reflect factors and considerations other than information and advice from the CEO, Deloitte, and members of management.
Flexibility in determining compensation
The Committee considers market benchmark compensation data for individual positions, considers additional information from management when setting pay levels, and has also considered:
• | the responsibilities of each individual NEO position; |
• | internal equity among the executives; |
• | the compensation levels we believe are necessary to incent and retain individual NEOs; and |
• | the performance of individual NEOs, including, but not limited to, the ability to meet business challenges strategically, plan long-range, achieve short-term and long-term financial results, lead and develop a team for which the officer is responsible, prudently steward our business and operational resources, and promote legal and ethical compliance. |
The Committee does not follow precise formulas when determining NEO compensation levels. Rather, it considers whether the various components of our compensation programs justify the cost to the Company and provide value to our stockholders.
107
Benefits and perquisites
Severance Benefits | NEOs without an employment agreement (Messrs. Givens, Boehm, Burke, and Lark) participate in our Executive Severance Plan, which provides severance benefits for terminations of employment by DST for reasons other than cause, death or disability (as those are defined in the Executive Severance Plan). DST’s obligation to provide payments and benefits under the Executive Severance Plan is conditioned upon the executive providing and not revoking a release of claims and complying with the applicable non‑competition, non‑solicitation, and non‑disclosure covenants. Mr. Hooley is party to an employment agreement with the Company that provides for severance benefits that are different than those contained in the Executive Severance Plan. For additional detail on the Executive Severance Plan and the severance benefits payable under Mr. Hooley’s employment agreements, see “Termination Payments and Potential Termination Payments.” |
Perquisites | We provide NEOs with a modest level of perquisites to promote convenience in the performance of duties for the Company. In 2017, we allowed Mr. Hooley limited personal use of aircraft in which we own fractional interests. Generally when his family accompanies him on such flights there is no incremental cost. The Committee monitors personal use through receipt of reports from our CFO at least four times per year. NEOs may also receive estate planning services, tax return services, excess liability insurance, long-term disability insurance and paid parking. We reimburse spouse or guest travel to and from, and family entertainment at, off-site planning meetings at which NEOs and their spouses or guests interact with each other and with members of the Board and their spouses or guests. We do not gross-up NEO perquisites for tax liabilities. |
Accelerated Award Vesting Benefits | We allow full or partial accelerated vesting of equity awards upon death, disability, retirement and in other limited termination of employment circumstances as described under “Termination Payments and Potential Termination Payments.” These benefits aid NEOs in the event of health crises, aid their families in the event of their deaths, help NEOs plan for retirement, and balance the Board’s flexibility in making management changes or effecting transactions which could result in an NEOs involuntary termination of employment. |
Insurance Benefits | NEOs participate in group health, vision, and dental insurance plans on the same basis as other employees. We offer NEOs the opportunity to apply for individual variable life insurance policies in lieu of participation in our employee group life policy. The policies are portable and allow NEOs to accrue cash value. We provide NEOs with a long‑term disability policy on the same basis as other employees. Some NEOs also have an individual long-term disability policy that is portable. This is a closed class of individuals and is a benefit no longer offered to new NEOs. We also provide a closed class of NEOs with coverage under a group excess liability insurance policy. These benefits aid NEOs in the event of a personal liability lawsuit to preserve assets such as auto and home. |
Double trigger change in control protections
Our award agreements provide generally for full vesting of unvested deferred cash and equity awards upon a “double trigger” ( i.e., a change in control followed by a qualifying termination of employment). We believe these protections promote stability during a change in control by encouraging our executives to cooperate with and achieve a change in control approved by the Board without being distracted by the possibility of termination or demotion following the transaction. All NEOs are entitled to severance benefits for certain terminations within a limited period of time following a change in control, either as a result of their employment agreement (Mr. Hooley) or their participation in the Executive Severance Plan (Messrs. Givens, Boehm, Burke and Lark), as further described under “Termination Payments and Potential Termination Payments.” Consummation of the Merger pursuant to the Merger Agreement entered into with SS&C would result in a change of control for purposes of the Executive Severance Plan, Mr. Hooley's employment agreement and award agreements with our NEOs.
Say‑on‑Pay
At the 2017 Annual Meeting, the percentage of the votes cast in favor of the Say‑on‑Pay proposal was 94.87%, indicating stockholder confidence in our pay-for-performance philosophy. The Committee considered the strong support of our stockholders in evaluating the design of the executive compensation program and making subsequent compensation determinations.
Clawback policy
To mitigate the risk that incentives would be based on erroneous financial results, executive officers that receive incentive compensation, including our NEOs, are subject to our clawback policy. The policy mandates Company recoupment of various award amounts in the event of certain accounting restatements. Such a restatement would trigger the return (or clawback) of incentive compensation for 2017 performance resulting from the Company’s material noncompliance with financial reporting requirements under the securities laws. The amount to be returned would equal the portion of a covered annual and/or long‑term incentive award in excess of what would have been paid if the results as stated in the restated financials had applied to the award determination. If a clawback is triggered, NEOs would be required to return the value of their covered awards, or a portion thereof, regardless of whether their individual conduct contributed to the financial restatement. The policy also allows the Compensation Committee, in its discretion, to clawback incentive compensation in the event of either a significant ethics policy violation or of non‑compliance with a restrictive covenant such as a non‑disclosure, non‑competition, or non‑solicitation obligation, or an obligation to protect and take other actions with respect to Company intellectual property.
108
Tax deductibility/Section 162(m)
The annual and long‑term incentive plans are both governed by our 2015 Equity and Incentive Plan. We obtained approval of the Plan by our stockholders, in order to facilitate the potential deductibility of performance‑based compensation under Section 162(m) of the Internal Revenue Code. Our primary focus has been applying our executive compensation philosophy in order to attract, retain, and incent our NEOs, and we have reserved the right to determine whether to utilize the performance‑based compensation exemption in Section 162(m) in making compensation determinations.
To facilitate the potential deductibility under the performance-based compensation exemption, the Committee has historically determined NEO participation in the annual short‑term cash incentive program, made PSU grants to NEOs, and set performance goals for NEO awards within the first ninety days of a performance year. It has also determined prior to the end of a performance year whether to make adjustments to performance goals or award payouts if a non‑recurring or unexpected event occurs during a performance period.
The Tax Act enacted in December 2017 made a number of changes to Section 162(m), including eliminating the
performance-based compensation exemption effective for taxable years beginning after December 31, 2017, except with respect to compensation that qualifies for transition relief applicable to certain arrangements in place as of November 2, 2017. Because of the uncertainties associated with the application and interpretation of Section 162(m) and the regulations issued thereunder, including the uncertain scope of the transition relief under the Tax Act, it is uncertain whether compensation intended to satisfy the requirements for deductibility under Section 162(m) will in fact be deductible.
Chief Executive Officer matters
Employment agreement
Mr. Hooley’s legacy employment agreement, governed by the laws of Missouri, was entered into June 30, 2009 and does not provide for employment through a set date. Prior to approving the agreement, we reviewed leading market and industry practice regarding appropriate and common provisions for executives in senior leadership positions. The agreement entitles him to a base salary of at least $550,000 and provides that he is to receive an incentive program opportunity as determined by the Compensation Committee.
Under the employment agreement, during the three years after a change in control, which we refer to as the Three-year Period, if Mr. Hooley’s employment is terminated by DST without cause or if he resigns for good reason, then Mr. Hooley is entitled to receive the following amounts:
• | Benefits: The employment agreement contemplates continued employment during the Three-Year Period and continued participation in DST’s benefit plans, which we refer to as the Specified Benefits, on the basis of Mr. Hooley’s participation on the date of the change in control; or, in the alternative, other plans which are at least equivalent to those in effect on the change in control. |
• | Termination following Change in Control: Under his employment agreement, after a change in control, if Mr. Hooley’s employment is terminated by DST without cause or if the executive resigns for Good Reason (as defined below), then Mr. Hooley is entitled to receive a lump sum payment (payable within five days following the termination date) equal to the salary he would have received for the remainder of the Three-Year Period (but in no event less than one year) and continued benefits for such length of time; provided that: (a) if any plan pursuant to which Specified Benefits are provided immediately prior to termination would not permit continued participation, then DST will pay a lump sum equal (within five days following the termination date) to the amount of Specified Benefits that Mr. Hooley would have received if he was fully vested and a continuing participant in such plan until the end of the severance period; (b) if Mr. Hooley obtains new employment following termination, then after any waiting period applicable to participation in any plan of the new employer, he will continue to be entitled to receive benefits only to the extent such benefits would exceed those available under comparable plans of the new employer; and (c) Mr. Hooley is entitled a lump sum equal to the aggregate amount of the annual incentives he would have received if target goals had been met for each year of the Three-Year Period (prorated for the final performance year if the Three-Year Period ends partially through a performance year). |
• | Certain 280G Gross-ups: Mr. Hooley’s employment agreement provides for payment of a gross-up relating to the parachute payment tax imposed by Section 4999 of the Internal Revenue Code. For Mr. Hooley, the parachute payment is generally subject to a scaleback equal to the largest amount that can be paid without triggering the parachute tax. If the payment is scaled back, there would be no parachute tax and no gross-up payment. However, if Mr. Hooley would retain, after tax, more than 120% of the amount he would retain if the potential parachute payments were scaled back, the cap does not apply and he is entitled to a gross-up payment, not to exceed five times the parachute tax. |
109
• | Separation Agreement: Mr. Hooley has entered into a separation agreement, pursuant to which, upon the Effective Time of the Merger, Mr. Hooley's employment with DST will be terminated for "good reason" (pursuant to his employment agreement as described above). In satisfaction of all obligations of DST under his employment agreement (as described above), Mr. Hooley will receive the cash severance and benefits described above on the closing date. In addition, in lieu of conversion of any of Mr. Hooley's outstanding RSUs and PSUs into SS&C equity awards in the Merger (as described in "Treatment of Equity Awards and Long-Term Cash Awards Under Merger Agreement") such awards shall be converted into cash (based upon a cash price of $84.00 per share) and paid in a cash lump sum on the closing date, provided, that to the extent that any such cash award constitutes nonqualified deferred compensation under Section 409A, the cash payment will be paid subject to any six month delay required by Section 409A. |
The employment agreement and the separation agreement are further addressed in “Termination Payments and Potential Termination Payments.”
Stock ownership guidelines
To further align CEO and stockholder interests, we have guidelines that the CEO must maintain stock ownership of at least six times his base salary. Mr. Hooley has reached the ownership threshold.
Merger Agreement and 2018 Compensation
As a result of the Merger Agreement entered into with SS&C, DST’s compensation policies for our NEOs have been adjusted with respect to compensation awarded or paid for 2018. These adjustments have been made so that 2018 compensation will comply with the Merger Agreement and will achieve the relevant objectives of our compensation program prior to consummation of the Merger as determined by the Committee. The Merger Agreement with SS&C prohibits, among other things, base salary increases for our NEOs. See “Treatment of Equity Awards and Long-Term Cash Awards Under Merger Agreement” for information regarding the treatment of equity awards in the Merger.
Employee Compensation Risk
The Committee determines whether employee compensation policies and practices create risks that are reasonably likely to have a material adverse effect on the Company. The Committee obtains information from the Chief Human Resources Officer regarding corporate, business unit, domestic, international, incentive, equity, sales commission, and other programs and considers controls such as benchmarking, setting goals and award limits, and receiving assistance from independent compensation consultants. In December 2017, the Committee determined that our employee compensation practices and policies do not create risks that are reasonably likely to have a material adverse effect on the Company.
Compensation Committee Report
We reviewed and discussed with management the “Compensation Discussion and Analysis” section of this Form 10-K. Based on such review and discussion, we recommended to the Board that this Form 10-K include the “Compensation Discussion and Analysis.”
THE COMPENSATION COMMITTEE
Gary D. Forsee, Chair
Joseph C. Antonellis
Jerome H. Bailey
Lynn Dorsey Bleil
Lowell L. Bryan
Charles E. Haldeman, Jr.
Samuel G. Liss
The information contained in the Compensation Committee Report shall not be deemed to be “soliciting material” or to be “filed” with the Securities and Exchange Commission, nor shall such information be incorporated by reference into any future filing under the Securities Act of 1933, as amended, or the Securities Exchange Act of 1934, as amended, except to the extent that we specifically incorporate it by reference in such filing.
110
Summary Compensation Table for 2017
Name and Principal Position | Year | Salary | Stock Awards (1) | Non‑Equity Incentive Plan Compensation(2) | All Other Compensation(3) | Total | ||||||
Stephen C. Hooley Chairman of the Board, CEO, and President | 2017 | $850,000 | $4,556,770 | $1,912,500 | $133,220 | $7,452,490 | ||||||
2016 | $825,000 | $4,119,599 | $1,569,220 | $147,556 | $6,661,375 | |||||||
2015 | $825,000 | $3,849,993 | $1,442,561 | $249,973 | $6,367,527 | |||||||
Gregg Wm. Givens Senior Vice President, CFO, and Treasurer | 2017 | $475,000 | $1,012,550 | $712,500 | $34,790 | $2,234,840 | ||||||
2016 | $460,000 | $1,000,096 | $575,521 | $120,642 | $2,156,259 | |||||||
2015 | $433,000 | $799,975 | $538,251 | $39,210 | $1,810,436 | |||||||
Jonathan J. Boehm Executive Vice President and Head of Healthcare Businesses | 2017 | $490,000 | $1,215,131 | $764,821 | $41,754 | $2,511,706 | ||||||
2016 | $490,000 | $1,100,084 | $601,263 | $177,686 | $2,369,033 | |||||||
2015 | $480,000 | $1,050,028 | $553,379 | $41,684 | $2,125,091 | |||||||
Edmund Burke Executive Vice President and President of ALPS | 2017 | $415,000 | $759,442 | $894,795 | $21,855 | $2,091,092 | ||||||
Vercie L. Lark Executive Vice President and Head of Financial Services | 2017 | $460,000 | $1,113,840 | $690,000 | $29,000 | $2,292,840 | ||||||
2016 | $460,000 | $949,932 | $577,159 | $39,481 | $2,026,572 | |||||||
(1) | The amounts in the Stock Awards column reflect the aggregate grant date fair value for each respective fiscal year related to both Time-Based RSUs and PSUs granted in 2017, 2016, and 2015. All fair values were computed in accordance with the applicable Accounting Standards Codification (ASC) Stock Compensation topic. Assumptions used in the calculation of these amounts are described in the Consolidated Financial Statements in Item 8, Financial Statements and Supplementary Data. Amounts reported include the value of PSUs based on the probable outcome of performance conditions at 100% on the grant date. |
If PSUs had been valued at maximum level of performance, the aggregate grant date fair value for all 2017 awards would have been $7,609,802 for Mr. Hooley; $1,690,936 for Mr. Givens; $2,029,241 for Mr. Boehm; $1,268,261 for Mr. Burke; and $1,860,148 for Mr. Lark. The Time-Based RSU and PSU vesting terms and conditions are described under “Compensation Discussion and Analysis - 2017 Compensation Details - Long Term Equity Incentives - PSUs and Time-Based RSUs” and “Termination Payments and Potential Termination Payments.”
(2) | Shows the sum of the annual incentive award for 2017 and aggregate earnings during 2017 on deferred cash balances of annual incentive awards for performance years prior to 2014. The deferred cash vesting terms and conditions are described under “Termination Payments and Potential Termination Payments” and are subject to earnings and losses based on hypothetical investment choices as explained following the Nonqualified Deferred Compensation Table. We no longer defer any portion of the annual incentive award. |
(3) | All Other Compensation includes amounts for various types of compensation, denominated in dollars, as shown below. |
All Other Compensation | Stephen C. Hooley | Gregg Wm. Givens | Jonathan J. Boehm | Vercie L. Lark | Edmund Burke | ||||
Matching Contribution to 401(k)‑ 2017 plan year | $16,200 | $16,200 | $16,200 | $16,200 | $15,333 | ||||
Life Insurance Premiums | $6,552 | $7,670 | $9,470 | $6,636 | ____ | ||||
Perquisites and Personal Benefits(1) | $110,468 | $10,920 | $16,084 | ___ | ____ | ||||
(1) | The perquisites and personal benefits in the last row of the above table are comprised of the following: |
111
All Other Compensation | Stephen C. Hooley | Gregg Wm. Givens | Jonathan J. Boehm | Vercie L. Lark | Edmund Burke | ||||
Personal Use of Aircraft in which the Company has a Fractional Interest* | X | — | — | — | — | ||||
Excess Liability Insurance Premiums | X | X | X | X | — | ||||
Long‑Term Disability Premiums | X | X | X | — | — | ||||
Non-Business Events at Off-site Planning Meetings | X | X | X | X | X | ||||
Tax Return Preparation Services | X | X | — | — | — | ||||
Paid Parking | X | X | X | X | X | ||||
* | Mr. Hooley was allowed personal use of the aircraft, as explained in “Compensation Discussion and Analysis.” The amount shown for his perquisites includes the incremental cost of aircraft personal use during 2017 of $89,425 (calculated based on the hourly charge for the flight, the fuel charge for the flight, and the ground transportation charge). We did not include in the incremental cost any portion of our monthly aircraft management fee, which we would have paid regardless of the personal use, or depreciation on the plane, which does not vary based on use. Mr. Hooley incurred taxable income as a result of the use, which was not grossed-up for taxes. |
The NEOs also participated in 2017 in a program in which the Company, through a donor-advised fund at a community charitable foundation, will match contributions by the NEOs to qualified not-for-profit organizations in an amount equal to two times the contribution, with a $30,000 maximum for the Chief Executive Officer under the director match program and a $20,000 maximum for the other NEOs. Contributions were made on behalf of all associates who chose to participate, and we do not believe the contribution directly or indirectly benefited the NEO personally. Matching amounts from the foundation were: $30,000 for Mr. Hooley; $20,000 for Mr. Givens; $20,000 for Mr. Boehm; and $16,384 for Mr. Lark.
Non-Qualified Deferred Compensation
Deferral activity and balances
The following table provides information regarding NEOs’ non-qualified deferred compensation accounts. We describe the various forms of non-qualified deferral programs following the table:
Annual Incentive Program Deferred Cash
Named Executive Officer | Aggregate Earnings in 2017 (1) | Aggregate Withdrawals/Distributions in 2017 (2) | Aggregate Balance at December 31, 2017 (3) | ||
Stephen C. Hooley | — | — | — | ||
Gregg Wm. Givens | — | — | — | ||
Jonathan J. Boehm | $29,821 | — | $190,073 | ||
Edmund Burke | — | — | — | ||
Vercie L. Lark | — | — | — | ||
(1) | Shows for each NEO the aggregate earnings during 2017. Participants may direct the investment of their deferral accounts into one or more funds chosen by the administrator. The deferral account is credited with investment returns based on the funds selected. |
(2) | Shows the distribution during 2017 of an annual incentive deferred cash award for performance years prior to 2014. |
(3) | All amounts shown were vested as of December 31, 2017. Mr. Boehm elected to receive his account balance for the 2013 performance year in a lump sum upon retirement rather than on the vesting date. |
Non-qualified deferral programs.
Arrangements for Incentive and Equity Awards.
For performance years prior to 2014, we mandated deferral of a portion of each year’s annual incentive award. Earnings and losses are credited or debited at least annually. Prior to 2014, NEOs could, by making an election by June 30 of the performance year, extend the future payout of vested deferred cash awards. The elected periods could either be a number of years or until separation from service. Beginning with awards for 2014 compensation, we discontinued deferral elections.
112
Currently, Mr. Boehm is the only NEO who made a deferral election. Upon retirement, he will receive his balance in a lump sum.
Grants of Plan Based Equity Awards For 2017
The following table and notes show annual incentive opportunity levels that existed at the beginning of 2017 for, and equity grants during 2017 to, each of the NEOs:
Estimated Possible Payouts Under Non‑Equity Incentive Plan Awards (1) ($) | Estimated Possible Payouts Under Equity Incentive Plan Awards (2)(4) (#) | All Other Stock Awards; No. of Shares of Stock (3)(4) (#) | Grant Date Fair Value of Stock Awards ($) | |||||||||||
Named Executive Officer | Grant Date | Threshold ($) | Target ($) | Maximum ($) | Threshold (#) | Target (#) | Maximum (#) | |||||||
Stephen C. Hooley | ||||||||||||||
Annual Incentive | 02/24/17 | $637,500 | $1,275,000 | $1,912,500 | — | — | — | — | — | |||||
PSUs | 02/24/17 | — | — | — | 12,901 | 51,602 | 103,204 | — | $3,053,032 | |||||
Time-Based RSUs | 02/24/17 | — | — | — | — | — | — | 25,416 | $1,503,738 | |||||
Gregg Wm. Givens | ||||||||||||||
Annual Incentive | 02/24/17 | $237,500 | $475,000 | $712,500 | — | — | — | — | — | |||||
PSUs | 02/24/17 | — | — | — | 2,867 | 11,466 | 22,932 | — | $678,386 | |||||
Time-Based RSUs | 02/24/17 | — | — | — | — | — | — | 5,648 | $334,164 | |||||
Jonathan J. Boehm | ||||||||||||||
Annual Incentive | 02/24/17 | $245,000 | $490,000 | $735,000 | — | — | — | — | — | |||||
PSUs | 02/24/17 | — | — | — | 3,440 | 13,760 | 27,520 | — | $814,110 | |||||
Time-Based RSUs | 02/24/17 | — | — | — | — | — | — | 6,778 | $401,020 | |||||
Edmund Burke | ||||||||||||||
Annual Incentive | 02/24/17 | — | $894,795 | — | — | — | — | — | — | |||||
PSUs | 02/24/17 | — | — | — | 2,150 | 8,600 | 17,200 | — | $508,819 | |||||
Time-Based RSUs | 02/24/17 | — | — | — | — | — | — | 4,236 | $250,623 | |||||
Vercie L. Lark | ||||||||||||||
Annual Incentive | 02/24/17 | $230,000 | $460,000 | $690,000 | — | — | — | — | — | |||||
PSUs | 02/24/17 | — | — | — | 3,154 | 12,614 | 25,228 | — | $746,307 | |||||
Time-Based RSUs | 02/24/17 | — | — | — | — | — | — | 6,212 | $367,533 | |||||
(1) | The range of annual incentive awards that could have been earned for 2017 performance depended on the level of achievement of performance goals. The amounts shown represent percentages of base salary that were each NEOs threshold, target, and maximum opportunity levels, except that amounts shown for Mr. Burke, for whom no threshold or maximum performance levels were applicable, is the actual amount earned, as further described in “Compensation Discussion and Analysis - Annual Cash Incentive.” |
Goal achievement for 2017 has already been determined. The NEOs actual earned annual incentive awards for 2017 are shown in “Compensation Discussion and Analysis-Annual Cash Incentive.”
113
(2) | The target number is the number of PSUs granted in 2017. They have the potential to vest at a percentage of target based on the achievement of target, threshold, and maximum Adjusted EBITDA goals, as further described under “Compensation Discussion and Analysis-Long-Term Equity Incentives-PSUs and Time-Based RSUs.” |
(3) | Shows the Time-Based RSUs granted in 2017. They vest annually in one‑third increments. |
(4) | The allocation of the aggregate grant date fair value between the number of Time-Based RSUs and the number of PSUs (at the target grant level) is explained in “Compensation Discussion and Analysis-Long-Term Equity Incentives-PSUs and Time-Based RSUs-Performance Stock Units.” Vesting terms and conditions for these awards are described under “Termination Payments and Potential Termination Payments.” When the Company pays a dividend, equivalents accrue on unvested PSUs and Time-Based RSUs in the form of additional unvested units. During 2017, additional units received as dividend equivalents were as follows: |
Additional Dividend Equivalent Units Granted During 2017 | |||
Named Executive Officer | PSUs* | Time-Based RSUs | |
Stephen C. Hooley | 2,038 | 699 | |
Gregg Wm. Givens | 454 | 170 | |
Jonathan J. Boehm | 523 | 197 | |
Edmund Burke | 340 | 118 | |
Vercie L. Lark | 453 | 160 | |
* | The dividend equivalents for PSUs are shown at target level of performance, if performance is achieved after the three-year performance period. |
Option Exercises And Stock Vested In 2017
Option Awards | Stock Awards* | ||||||
Named Executive Officer | Number of Shares Acquired on Exercise (#) | Value Realized on Exercise ($) (1) | Number of Shares Acquired on Vesting (#) | Value Realized on Vesting ($) (1) | |||
Stephen C. Hooley | 20,000 | $814,046 | 72,658 | $4,275,923 | |||
Gregg Wm. Givens | — | — | 17,037 | $991,568 | |||
Jonathan J. Boehm | — | — | 19,532 | $1,149,458 | |||
Edmund J. Burke | — | — | 10,822 | $636,875 | |||
Vercie L. Lark | — | — | 15,534 | $914,848 | |||
* | These columns show the gross number of units vesting, including dividend equivalents. Shares were withheld from this gross amount for satisfaction of tax withholding obligations. |
(1) | The “value realized” on exercise of an award is calculated based on the difference between the per share closing market price for our common stock and the exercise price on the date of exercise multiplied by the number of options exercised, and the “value realized” on vesting of an award is calculated based on the per share closing market price for our common stock on the vesting date of the award multiplied by the number of shares vested. |
114
Outstanding Equity Awards At Fiscal Year‑End
(December 31, 2017)
Option Awards (1) | Stock Awards (2) | |||||||||||||||
Named Executive Officer | Number of Securities Underlying Unexercised Options Exercisable (#) | Option Exercise Price ($) | Option Expiration Date | Number of Shares or Units of Stock that Have Not Vested (#) | Market Value of Shares or Units of Stock That Have Not Vested(3) ($) | Equity Incentive Plan Awards: Number of Unearned Shares, Units or Other Rights That Have Not Vested (#) | Equity Incentive Plan Awards: Market or Payout Value of Unearned Shares, Units or Other Rights That Have Not Vested (3) ($) | |||||||||
Stephen C. Hooley | 80,000 | $21.9125 | 12/14/19 | 8,074 | $501,153 | — | — | |||||||||
77,280 | $23.7550 | 12/01/21 | 17,364 | $1,077,784 | 65,636 | $4,074,027 | ||||||||||
— | — | — | 25,730 | $1,597,061 | 104,480 | $6,485,074 | ||||||||||
Gregg Wm. Givens | 8,098 | $23.7550 | 12/01/21 | 1,679 | $104,216 | — | — | |||||||||
— | — | — | 4,216 | $261,687 | 15,933 | $988,961 | ||||||||||
— | — | — | 5,718 | $354,916 | 23,216 | $1,441,017 | ||||||||||
Jonathan J. Boehm | 14,174 | $23.7550 | 12/01/21 | 2,841 | $176,341 | — | — | |||||||||
— | — | — | 4,638 | $287,881 | 17,525 | $1,087,777 | ||||||||||
— | — | — | 6,862 | $425,924 | 27,860 | $1,729,270 | ||||||||||
Edmund Burke | — | — | — | 1,259 | $78,146 | — | — | |||||||||
— | — | — | 3,163 | $196,328 | 11,950 | $741,737 | ||||||||||
— | — | — | 4,288 | $266,156 | 17,412 | $1,080,763 | ||||||||||
Vercie L. Lark | 45,400 | $19.5350 | 06/18/20 | 1,574 | $97,698 | — | — | |||||||||
— | — | — | 3,583 | $222,397 | 13,542 | $840,552 | ||||||||||
— | — | — | 6,289 | $390,358 | 25,540 | $1,585,268 | ||||||||||
— | — | — | 372 | $23,090 | 1,403 | $87,084 | ||||||||||
(1) | Shows vested non‑qualified stock options. |
(2) | Shows unvested Time-Based RSUs and PSUs, including dividend equivalents through December 31, 2017. Each row pertains to a different grant, as follows: |
Row | Type of Award | |||
First | PSU/Time-Based RSU | 2/23/2015 | All NEOs | |
Second | PSU/Time-Based RSU | 2/26/2016 | All NEOs | |
Third | PSU/Time-Based RSU | 2/24/2017 | All NEOs | |
Fourth | PSU/Time-Based RSU | 5/10/2016 | Vercie L. Lark | |
The Time-Based RSUs granted in 2015, 2016, and 2017 vest annually in one‑third increments. The unvested Time-Based RSUs are subject to forfeiture for termination of employment prior to vesting except for the special vesting events described under “Termination Payments and Potential Termination Payments.”
For a further discussion of our PSUs, see “Compensation Discussion and Analysis - Long-Term Equity Incentives - PSUs and Time-Based RSUs.”
(3) | Based on a December 31, 2017 closing price of $62.07. |
Termination Payments and Potential Termination Payments
On January 11, 2018, we entered into a Merger Agreement wherein SS&C will acquire DST. Under the terms of the agreement, SS&C will purchase DST in an all-cash transaction for $84.00 per share plus the assumption of debt, equating to an enterprise value of approximately $5.4 billion. The transaction is subject to DST stockholder approval, clearances by the relevant regulatory authorities and other customary closing conditions. See Item 8, Financial Statements and Supplementary Data - Note 1, “Description of the Business” for more information regarding this transaction. The effects of the Merger on the Company’s executive compensation plans and agreements are described in the definitive proxy statement filed by the Company with the SEC on February 27, 2018 in connection with the Merger.
115
The Compensation Committee has incorporated accelerated vesting terms and conditions into its awards for certain termination of employment events. In the following table, we show the vesting and payout valuations for hypothetical terminations of employment as if they had occurred at December 31, 2017. Shown in the table are termination events* other than the following:
• | a voluntary termination of employment that is not a “retirement” |
• | a termination for “cause” |
* each event as defined in the applicable award agreement or plan
These two types of terminations would not have caused accelerated award vesting or separation benefits. Following the table, we give details regarding the valuations as well as the reasons for termination benefits.
At December 31, 2017- Hypothetical Event and Award or Other Benefit to be Valued | Stephen C. Hooley | Gregg Wm. Givens | Jonathan J. Boehm | Edmund J. Burke | Vercie L. Lark | ||||||||||||||
Death or Disability A | |||||||||||||||||||
Time-Based RSUs | $ | 1,578,937 | $ | 365,903 | $ | 464,222 | $ | 274,474 | $ | 343,185 | |||||||||
PSUs | 4,074,027 | 988,961 | 1,087,777 | 741,737 | 927,636 | ||||||||||||||
Total | $ | 5,652,964 | $ | 1,354,864 | $ | 1,551,999 | $ | 1,016,211 | $ | 1,270,821 | |||||||||
At December 31, 2017- Hypothetical Event and Award or Other Benefit to be Valued | Stephen C. Hooley | Gregg Wm. Givens | Jonathan J. Boehm | Edmund J. Burke | Vercie L. Lark | ||||||||||||||
Retirement B | |||||||||||||||||||
Time-Based RSUs | N/A | $ | 365,903 | $ | 464,222 | $ | 274,474 | N/A | |||||||||||
PSUs | N/A | 988,961 | 1,087,777 | 741,737 | N/A | ||||||||||||||
Total | N/A | $ | 1,354,864 | $ | 1,551,999 | $ | 1,016,211 | N/A | |||||||||||
At December 31, 2017- Hypothetical Event and Award or Other Benefit to be Valued | Stephen C. Hooley | Gregg Wm. Givens | Jonathan J. Boehm | Edmund J. Burke | Vercie L. Lark | ||||||||||||||
Termination without cause in connection with a reduction in force C,F,G,I | |||||||||||||||||||
Time-Based RSUs | $ | 1,578,937 | $ | 365,903 | $ | 464,222 | $ | 274,474 | $ | 343,185 | |||||||||
PSUs | 4,074,027 | 988,961 | 1,087,777 | 741,737 | 927,636 | ||||||||||||||
Severance Base Salary | 1,700,000 | 475,000 | 490,000 | 415,000 | 460,000 | ||||||||||||||
Severance Incentive Award | N/A | 475,000 | 490,000 | 762,581 | 460,000 | ||||||||||||||
Health and Life Insurance Premiums | 99,125 | 21,550 | 23,133 | 21,550 | 23,133 | ||||||||||||||
Premium Gross‑Up | 92,051 | N/A | N/A | N/A | N/A | ||||||||||||||
Outplacement Benefits | N/A | 25,000 | 25,000 | 25,000 | 25,000 | ||||||||||||||
Total | $ | 7,544,140 | $ | 2,351,414 | $ | 2,580,132 | $ | 2,240,342 | $ | 2,238,954 | |||||||||
At December 31, 2017- Hypothetical Event and Award or Other Benefit to be Valued | Stephen C. Hooley | Gregg Wm. Givens | Jonathan J. Boehm | Edmund J. Burke | Vercie L. Lark | ||||||||||||||
Termination without cause in connection with a business unit divestiture D,F,G,I | |||||||||||||||||||
Time-Based RSUs | $ | 1,578,937 | $ | 365,903 | $ | 464,222 | $ | 274,474 | $ | 343,185 | |||||||||
PSUs | 4,074,027 | 988,961 | 1,087,777 | 741,737 | 927,636 | ||||||||||||||
Severance Base Salary | 1,700,000 | 475,000 | 490,000 | 415,000 | 460,000 | ||||||||||||||
Severance Incentive Award | N/A | 475,000 | 490,000 | 762,581 | 460,000 | ||||||||||||||
Health and Life Insurance Premiums | 99,125 | 21,550 | 23,133 | 21,550 | 23,133 | ||||||||||||||
Premium Gross‑Up | 92,051 | N/A | N/A | N/A | N/A | ||||||||||||||
Outplacement Benefits | N/A | 25,000 | 25,000 | 25,000 | 25,000 | ||||||||||||||
Total | $ | 7,544,140 | $ | 2,351,414 | $ | 2,580,132 | $ | 2,240,342 | $ | 2,238,954 | |||||||||
116
At December 31, 2017- Hypothetical Event and Award or Other Benefit to be Valued | Stephen C. Hooley | Gregg Wm. Givens | Jonathan J. Boehm | Edmund J. Burke | Vercie L. Lark | ||||||||||||||
Change in control followed by termination without cause or resignation for good reason E,H,J | |||||||||||||||||||
Time-Based RSUs | $ | 3,175,998 | $ | 720,819 | $ | 890,146 | $ | 540,630 | $ | 733,543 | |||||||||
PSUs | 9,583,111 | 2,152,774 | 2,456,048 | 1,614,627 | 2,135,953 | ||||||||||||||
Severance Base Salary | 2,550,000 | 950,000 | 980,000 | 830,000 | 920,000 | ||||||||||||||
Severance Incentive Award | 3,825,000 | 950,000 | 980,000 | 1,525,162 | 920,000 | ||||||||||||||
Health and Life Insurance Premiums | 100,087 | 43,100 | 46,265 | 43,100 | 46,265 | ||||||||||||||
401(k) Profit Sharing Contributions | 48,600 | N/A | N/A | N/A | N/A | ||||||||||||||
Income or Excise Tax Gross‑Up | — | N/A | N/A | N/A | N/A | ||||||||||||||
Change of Control Benefit Reduction | N/A | N/A | N/A | (158,959 | ) | (391,603 | ) | ||||||||||||
Outplacement Benefits | N/A | 25,000 | 25,000 | 25,000 | 25,000 | ||||||||||||||
Total | $ | 19,282,796 | $ | 4,841,693 | $ | 5,377,459 | $ | 4,419,560 | $ | 4,389,158 | |||||||||
At December 31, 2017- Hypothetical Event and Award or Other Benefit to be Valued | Stephen C. Hooley | Gregg Wm. Givens | Jonathan J. Boehm | Edmund J. Burke | Vercie L. Lark | ||||||||||||||
Other termination without cause F,G,I | |||||||||||||||||||
Severance Base Salary | $ | 1,700,000 | $ | 475,000 | $ | 490,000 | $ | 415,000 | $ | 460,000 | |||||||||
Severance Incentive Award | N/A | 475,000 | 490,000 | 762,581 | 460,000 | ||||||||||||||
Health and Life Insurance Premiums | 99,125 | 21,550 | 23,133 | 21,550 | 23,133 | ||||||||||||||
Premium Gross‑Up | 92,051 | N/A | N/A | N/A | N/A | ||||||||||||||
Outplacement Benefits | N/A | 25,000 | 25,000 | 25,000 | 25,000 | ||||||||||||||
Total | $ | 1,891,176 | $ | 996,550 | $ | 1,028,133 | $ | 1,224,131 | $ | 968,133 | |||||||||
Notes Regarding Effect of Various Events:
A. | Death or Disability: |
Time-Based RSUs granted in 2015 and 2016 would have accelerated. The performance period for the PSUs granted in 2015 expired on December 31, 2017. These shares will vest on the regularly scheduled vesting date at certification of goal achievement by the Compensation Committee of the Board of Directors. PSUs granted in 2016 would vest on the regularly scheduled vesting date at certification of goal achievement by the Compensation Committee of the Board of Directors. No equity granted in 2017 would have vested because a one-year holding period would not have been satisfied.
No benefits would have been paid under employment agreements or the Executive Severance Plan (“ESP”).
Prorated annual incentive awards for the year of the death or disability are to be paid at a target level of performance (which by year-end was already earned by the NEOs and therefore is not shown in the table).
B. | Retirement: |
Messrs. Givens, Boehm, and Burke were retirement‑eligible at year-end for purposes of the Time-Based RSUs. The unvested portion of the 2015 and 2016 Time-Based RSUs would have vested at the time of the event. The performance period for the PSUs granted in 2015 expired on December 31, 2017. Vesting of PSUs granted in 2016 would occur in 2019, based on actual goal achievement for 2016-2018, which has been projected (actual results may differ). No equity granted in 2017 would have vested because a one-year holding period would not have been satisfied.
No benefits would have been paid under employment agreements or the ESP.
Prorated annual incentive awards for the year of the retirement are to be paid to retiring executives at the actual level of performance (which by year-end was already earned by Messrs. Givens, Boehm, and Burke and therefore is not shown in the table).
117
C. | Reduction in Force: |
The unvested portion of the 2015 and 2016 Time-Based RSUs would have vested at the time of the event. The performance period for the PSUs granted in 2015 expired on December 31, 2017. Vesting of PSUs granted in 2016 would occur in 2019, based on actual goal achievement for 2016‑2018, which has been projected (actual results may differ). No equity granted in 2017 would have vested because a one-year holding period would not have been satisfied.
Employment agreement benefits to Mr. Hooley would have been paid as described in note (F).
ESP benefits would have been paid to Messrs. Givens, Boehm, Burke, and Lark as described in note (I).
D. | Business Unit Divestiture: |
The unvested portion of the 2015 and 2016 Time-Based RSUs would have vested at the time of the event. The performance period for the PSUs granted in 2015 expired on December 31, 2017. Vesting of PSUs granted in 2016 would occur in 2019, based on actual goal achievement for 2016-2018, which has been projected (actual results may differ). No equity granted in 2017 would have vested because a one-year holding period would not have been satisfied.
Employment agreement benefits to Mr. Hooley would have been paid as described in note (F).
Under certain circumstances, ESP benefits would have been paid to Messrs. Givens, Boehm, Burke, and Lark as described in note (I).
E. | Change in Control Followed within a Limited Period by a Termination without Cause or Resignation for Good Reason: |
Vesting of Time-Based RSUs would have accelerated. The performance period for the PSUs granted in 2015 expired on December 31, 2017. Vesting of PSUs granted in 2016 and 2017 as if the target performance level had been achieved.
Employment agreement benefits to Mr. Hooley would have been paid as described in note (H).
ESP benefits would have been paid to Messrs. Givens, Boehm, Burke, and Lark as described in note (J).
Pursuant to the ESP, Cause is defined as termination of employment as a result of: (i) dishonesty involving the Company; (ii) gross negligence or willful misconduct; (iii) the willful failure to diligently follow reasonable instructions of the Board or any officer to whom the Eligible Executive reports concerning performance of the Eligible Executive's duties for the Company or the operations or business of the Company; (iv) fraud or criminal activity which, in either case, is alleged to have resulted in gain or personal enrichment of the Eligible Executive at the expense of the Company, or which is reasonably expected to have an adverse effect on the business, reputation or financial situation of the Company; or (v) embezzlement or material misappropriation by the Eligible Executive.
Resignation for Good Reason, defined as Constructive Termination in the ESP, is a voluntary termination of employment as a result of (i) a material diminution in authority, duties or responsibilities, or a change in the supervisory reporting relationship within the Company that materially and negatively alters the Eligible Executive’s ability to perform his or her duties and responsibilities; (ii) a change, caused by the Company, in geographic location of greater than fifty (50) miles of the location at which the Eligible Executive primarily performs services for the Company; or (iii) a material reduction in the Eligible Executive’s Base Compensation, exclusive of any across the board reduction similarly affecting all or substantially all similarly-situated employees.
F. | Employment Agreement Separation Provisions: |
Mr. Hooley’s employment agreement provides for separation benefits (base salary, life/health premium reimbursements) based on a 24‑month period for Mr. Hooley. Mr. Hooley is also entitled to a prorated annual incentive award for the year of termination at the actual level of performance (which by year‑end was already earned and therefore not shown in the table as an additional benefit).
For purposes of this table, we calculated health insurance premiums using current COBRA continuation rates and life insurance premiums using current rates.
The agreement entitles Mr. Hooley to premium gross-ups as described in note (G).
G. | Employment Agreement Health and Life Insurance Premium Gross-Ups: |
The estimate for Mr. Hooley is based on our monthly cost of health, disability, and life insurance premiums as explained in note (F). To determine the aggregate value of the insurance coverage continuation, we multiplied the
118
monthly health, disability, and life insurance premiums by the number of months of taxable insurance coverage continuation to which the executive is entitled under his employment agreement. We then calculated the additional tax gross-up payment we would have been obligated to make in order to put the executive in an after-tax position as if he had never received the taxable insurance coverage continuation.
H. | Employment Agreement Change in Control Separation Provisions; Parachute Taxes: |
Under Mr. Hooley’s employment agreement, the following benefits are provided upon a termination without cause or resignation for good reason that occurs within the three‑year period following the change in control, which we refer to as the Three-Year Period. For purposes of this table, December 31, 2017 is treated as both the date of termination and the change in control. The agreement provides for:
• | Benefits: The employment agreement contemplates continued employment during the Three-Year Period and continued participation in DST's benefit plans, which we refer to as the Specified Benefits, on the basis of Mr. Hooley's participation on the date of the change in control; or, in the alternative, other plans which are at least equivalent to those in effect on the change in control. |
• | Termination following Change in Control: Under his employment agreement, after a change in control, if Mr. Hooley’s employment is terminated by DST without cause or if the executive resigns for Good Reason (as defined below), then Mr. Hooley is entitled to receive a lump sum payment (payable within five days following the termination date) equal to the salary he would have received for the remainder of the Three-Year Period (but in no event less than one year) and continued benefits for such length of time; provided that: (a) if any plan pursuant to which Specified Benefits are provided immediately prior to termination would not permit continued participation, then DST will pay a lump sum equal (within five days following the termination date) to the amount of Specified Benefits that Mr. Hooley would have received if he was fully vested and a continuing participant in such plan until the end of the severance period; (b) if Mr. Hooley obtains new employment following termination, then after any waiting period applicable to participation in any plan of the new employer, he will continue to be entitled to receive benefits only to the extent such benefits would exceed those available under comparable plans of the new employer; and (c) Mr. Hooley is entitled a lump sum equal to the aggregate amount of the annual incentives he would have received if target goals had been met for each year of the Three-Year Period (prorated for the final performance year if the Three-Year Period ends partially through a performance year). |
• | Certain 280G Gross-ups: Mr. Hooley’s employment agreement provides for a payment of a gross-up relating to the parachute payment tax imposed by Section 4999 of the Internal Revenue Code. For Mr. Hooley, the parachute payment is generally subject to a scaleback equal to the largest amount that can be paid without triggering the parachute tax. If the payment is scaled back, there would be no parachute tax and no gross-up payment. However, if Mr. Hooley would retain, after tax, more than 120% of the amount he would retain if the potential parachute payments were scaled back, the cap does not apply and he is entitled to a gross-up payment, not to exceed five times the parachute tax. |
• | Good Reason: “Good Reason” will exist if Mr. Hooley resigns after a change in control and following: (i) a material reduction in duties or in level of work responsibility or conditions; (ii) a material reduction in base salary; (iii) the material relocation of the executive offices of DST or its successor to a location outside the metropolitan area of Kansas City, Missouri or requiring Mr. Hooley to be based anywhere other than DST’s executive office, except for required business travel to an extent substantially consistent with his obligations immediately prior to the change in control date; or (iv) a material breach by DST in providing the Specified Benefits during the Three-Year Period, except for removal of benefits that are immaterial or reduction in benefits by 10% or less in the aggregate. To terminate with good reason following a change in control, (i) Mr. Hooley must provide written notice to the secretary of DST within ninety (90) days after the initial occurrence of a good reason event describing in detail the event and stating that Mr. Hooley’s employment will terminate upon a specified date in such notice (which may be no earlier than 30 days and no later than 90 days after the date such notice is provided), and (ii) DST does not remedy the event prior to the specified termination date in such notice. |
• | Restrictive Covenants: Mr. Hooley is bound under his employment agreement by restrictive covenants against competition and against solicitation of employees, customers and vendors during his employment and for a minimum of three years following termination of his employment (and also including any period following termination of employment during which any unvested equity continues to vest), as well as a standard confidentiality provision. |
119
Mr. Hooley has entered into a separation agreement, pursuant to which, upon the Effective Time of the Merger, Mr. Hooley's employment with DST will be terminated for "good reason" (pursuant to his employment agreement as described above). In satisfaction of all obligations of DST under his employment agreement (as described above), Mr. Hooley will receive the cash severance and benefits described above on the closing date. In addition, in lieu of conversion of any of Mr. Hooley's outstanding RSUs and PSUs into SS&C equity awards, such awards shall be converted into cash (based upon a cash price of $84.00 per share) and paid in a cash lump sum on the closing date, provided, that to the extent that any such cash award constitutes nonqualified deferred compensation under Section 409A, the cash payment will be paid subject to any six month delay required by Section 409A. The above description of Mr. Hooley's separation agreement does not purport to be complete and is qualified in its entirety by the full text of the separation agreement set forth in Exhibit 10.34 to this Form 10-K. The effects of the Separation Agreement are not reflected in the table above.
I. | Executive Severance Plan Separation Provisions: |
Messrs. Givens, Boehm, Burke, and Lark participate in our ESP and receive benefits for qualifying terminations of employment, which are terminations for reasons other than death, disability, or by the Company for cause. Upon a qualifying termination, the NEOs will receive the following ESP benefits:
• | The amount of his annual base salary; |
• | Health plan continuation premiums for 12 months (calculated for purposes of the table using the current COBRA continuation rates); |
• | A severance incentive award equal to the annual incentive award at a target level of performance, as well as a prorated annual incentive award at the actual level of performance (which by year-end was already earned by the NEOs and therefore not shown in the table as an additional benefit); and Mr. Burke’s Severance Incentive Award is based on his two-year average bonus; and |
• | Reimbursement for outplacement consulting fees of up to $25,000. |
J. | Executive Severance Plan Change in Control Separation Provisions: |
The ESP also provides benefits for a qualifying termination of employment during a two‑year protection period that begins on the earlier of a potential change in control or actual change in control, each as addressed in the plan. The qualifying terminations include terminations for reasons other than death, disability, or by the Company for cause, as well as terminations by the NEOs for good reason. For purposes of this table, December 31, 2017 is treated as the date of both the qualifying termination and the change in control. Upon a qualifying termination, the NEO will receive:
• | Twice the amount of his annual base salary; |
• | Health plan continuation premiums for 24 months (calculated for purposes of the table using the current COBRA continuation rates); |
• | A severance incentive award equal to twice the annual incentive award at a target level of performance, plus an additional annual incentive award at a target level of performance (which by year‑end was already earned by the NEOs and therefore not shown in the table as an additional benefit); and |
• | Reimbursement for outplacement consulting fees of up to $25,000. |
The ESP contains a “best-net cutback” provision such that if the payment of any of these amounts would subject the Company and the executive to the excise tax gross-up provisions of Section 280G of the Internal Revenue Code, the payments would be reduced to an amount below the threshold at which such penalty tax provisions apply if such a reduction (and the avoidance of such penalty taxes) would be more favorable to the executive on an after-tax basis. Messrs. Burke and Lark’s estimated payments would be reduced so that he would not be subject to an excise tax.
120
Valuation Methods for the Table
Type of Incentive or Equity Award | Valuation Method |
Time-Based RSUs | The Time-Based RSUs valued in the table are described under “Compensation Discussion and Analysis.” The amount shown for Time-Based RSUs is the number of units that would vest multiplied by the December 31, 2017 closing price of $62.07 (“Closing Price”) and includes dividend equivalents through 2017. |
PSUs | The PSUs valued in the table have a three‑year performance period and are further described under “Compensation Discussion and Analysis.” For purposes of this section, we used the actual goal achievement of the PSUs granted in 2015 (with a 2015-2017 performance period) of 0% and estimated PSUs granted in 2016 (with a 2016‑2018 performance period) to be 124% of the target goal level, using the accounting assumptions described in the Consolidated Financial Statements in this Form 10‑K. The amount shown for PSUs is the number of units that would vest based on the estimated achievement, multiplied by the Closing Price. We have included in our calculations the PSUs granted as dividend equivalents through 2017. Actual goal achievement for PSUs may differ. |
Treatment of Equity Awards and Long-Term Cash Awards Under Merger Agreement
On January 11, 2018, we entered into a Merger Agreement wherein SS&C will acquire DST. Under the terms of the agreement, SS&C will purchase DST in an all-cash transaction for $84.00 per share plus the assumption of debt, equating to an enterprise value of approximately $5.4 billion. The transaction is subject to DST stockholder approval, clearances by the relevant regulatory authorities and other customary closing conditions. See Item 8, Financial Statements and Supplementary Data - Note 1, “Description of Business” for more information regarding this transaction. The effects of the Merger on the Company’s equity awards and other executive compensation plans and agreements are described in greater detail in the definitive proxy statement filed by the Company with the SEC on February 27, 2018 in connection with the Merger, and any description of such effects of the Merger Agreement in this Form 10-K are qualified in their entirety by the definitive transaction documents, including the Merger Agreement set forth in Exhibit 2.8 to this Form 10-K as the same may be amended from time to time, and the associated definitive proxy statement to be filed with the SEC.
Treatment of Options
Upon completion of the Merger, each option with respect to shares of DST common stock, that is outstanding, vested and unexercised as of immediately prior to the closing will be cancelled and the holder will be entitled to receive a cash payment payable as soon as reasonably practicable following the closing (but in any event no later than three (3) business days after the closing) equal to the product (x) the excess, if any, of the merger consideration as defined in the Merger Agreement (without interest) (“Merger Consideration”) over the exercise price per share of DST common stock of such vested option, multiplied by (y) the number of shares of DST common stock subject to such vested option less applicable withholding taxes. Each vested option with an exercise price equal to or greater than the Merger Consideration will be cancelled immediately prior to the effective time of the Merger without payment of any consideration.
Upon completion of the Merger, each unvested Option that is outstanding as of immediately prior to the closing will be converted automatically into an option to purchase the number of shares of SS&C common stock (“Rollover Option”), equal to the product obtained by multiplying (x) the total number of shares of DST common stock subject to such unvested option immediately prior to the closing by (y) the Equity Award Exchange Ratio, which is the quotient obtained by dividing (a) the Merger Consideration by (b) the average, rounded to the nearest one ten thousandth, of the closing-sale prices of SS&C common stock on Nasdaq as reported by The Wall Street Journal for the ten full trading days ending on (and including) the trading day preceding the closing, rounded to the nearest one ten thousandth, with any fractional shares rounded down to the next lower whole number of shares. Each Rollover Option will have an exercise price per share of SS&C common stock (rounded up to the nearest whole cent) equal to (1) the per share exercise price for the shares of DST common stock subject to such unvested Option divided by (2) the Equity Award Exchange Ratio. Each Rollover Option will otherwise be subject to the same terms and conditions applicable to the unvested Option under the applicable DST stock plan and award agreement.
Treatment of Performance Stock Units
Upon completion of the Merger, each vested performance stock unit that is outstanding immediately prior to the closing will be cancelled and the holder will be entitled to receive a cash payment payable as soon as practicable following the closing (but in any event no later than three (3) business days after the closing) equal to the product (x) the Merger Consideration and (y) the number of shares of DST common stock that would be delivered in respect of such vested performance stock unit based on
121
actual performance through to the effective date of the Merger, subject to any required tax withholding); provided, that to the extent that any such vested performance stock unit constitutes nonqualified deferred compensation under Section 409A of the Internal Revenue Code, which we refer to as Section 409A, the cash payment will be paid in accordance with the applicable award’s terms and at the earliest time permitted under the terms of the award that will not result in the application of a tax or penalty under Section 409A.
Upon completion of the Merger, each unvested performance stock unit that is outstanding immediately prior to the closing will be converted automatically into a restricted stock unit with respect to a number of shares of SS&C common stock (“Rollover PSU”), equal to the product obtained by multiplying (x) the number of shares of DST common stock that would be delivered in respect of such unvested performance stock unit based on actual projected performance through to the effective date of the Merger (equal to 124% of target for performance stock units granted in 2016, and 200% of target for performance stock units granted in 2017) by (y) the Equity Award Exchange Ratio, with any fractional shares rounded down to the next lower whole number of shares. Each Rollover PSU will otherwise be subject to the same terms and conditions applicable to the unvested performance stock unit under the applicable DST stock plan and award agreement, including time-vesting requirements, but excluding any performance-vesting requirements.
Treatment of Restricted Stock Units
Upon completion of the Merger, each vested restricted stock unit outstanding immediately prior to the closing will be canceled and the holder will be entitled to receive a cash payment payable as soon as practicable following the closing (but in any event no later than three (3) business days after the closing) equal to the product (x) the Merger Consideration and (y) the number of shares of DST common stock subject to the vested restricted stock unit (subject to any required tax withholding); provided, that to the extent that any such vested restricted stock unit constitutes nonqualified deferred compensation under Section 409A, the cash payment will be paid in accordance with the applicable award’s terms and at the earliest time permitted under the terms of the award that will not result in the application of a tax or penalty under Section 409A.
Upon completion of the Merger, each unvested restricted stock unit that is outstanding immediately prior to the closing (including restricted stock units that will comprise the annual equity awards to be granted by DST in February 2018) will be converted automatically into a restricted stock unit with respect to a number of shares of SS&C common stock (“Rollover RSU”), equal to the product obtained by multiplying (x) the total number of shares of DST common stock subject to the unvested restricted stock unit immediately prior to the closing by (y) the Equity Award Exchange Ratio, with any fractional shares rounded down to the next lower whole number of shares. Each Rollover RSU will otherwise be subject to the same terms and conditions applicable to the unvested restricted stock unit under the applicable DST stock plan and award agreement.
Treatment of Cash Awards
Each vested long-term cash award that is outstanding as of immediately prior to the closing will be canceled at the closing and the holder thereof shall be entitled to receive a cash payment payable as soon as practicable following the closing (but in any event no later than three (3) business days after the closing) in the amount set forth in the applicable notice of grant and award agreement; provided, that to the extent that any such vested long-term cash award constitutes nonqualified deferred compensation under Section 409A, the cash payment will be paid in accordance with the applicable award’s terms and at the earliest time permitted under the terms of the award that will not result in the application of a tax or penalty under Section 409A. Each unvested long-term cash award that is outstanding as of immediately prior to the closing will remain outstanding and subject to the same terms and conditions as in effect immediately prior to the closing.
REASONS FOR TERMINATION OF EMPLOYMENT PROTECTIONS
The Compensation Committee believes these limited termination of employment protections:
• | promote NEO retention by generally protecting NEOs against forfeiture of awards for termination of employment outside of their control; |
• | further each NEO’s commitment to the Company by accelerating the vesting date of certain awards and accounts if the NEO terminates employment after eligibility for retirement; and |
• | provide stability in the event of a possible change in control. |
In consideration of these protections, NEOs accept award agreements in which they commit not to solicit Company employees and clients for one year after termination of employment.
122
PAY RATIO DISCLOSURE
Pursuant to a mandate of the Dodd-Frank Wall Street Reform and Consumer Protection Act, the SEC adopted a rule requiring annual disclosure of the ratio of the total annual compensation of the Company’s Chief Executive Officer to the median employee’s annual total compensation. Set forth below for 2017 is a comparison of (i) the median of the annual total compensation of all employees of the Company and its consolidated subsidiaries (except the Chief Executive Officer of the Company) and (ii) the annual total compensation of the Chief Executive Officer. The median of the annual total compensation and the pay ratio described below are reasonable estimates calculated by the Company in a manner consistent with Item 402(u) of Regulation S-K.
We estimate that the median of the annual total compensation of all employees of the Company and its consolidated subsidiaries (except our Chief Executive Officer), as adjusted to include the Company provided benefit contribution, was approximately $77,550 for 2017. The annual total compensation of Stephen C. Hooley, our Chief Executive Officer, as reported in the Summary Compensation Table included in this Item 11, was $7,452,490 for 2017, and we added the Company provided benefits contribution, available to all employees generally, to Mr. Hooleys compensation for a total of $7,471,342. The Company provided benefit contribution comprises a large percentage of our employee compensation package and has therefore been included in this Pay Ratio comparison for both our median employee and Mr. Hooley. Given that this is a broad-based benefit for employees, this value is generally not included as part of the Summary Compensation Table disclosure.
Based on this information, we estimate that the ratio of the annual total compensation of our Chief Executive Officer to the median of the annual total compensation of all employees was 96 to 1 for 2017.
To identify the median of the annual total compensation of all our employees, as well as to determine the annual total compensation of our median employee and our Chief Executive Officer, we used the following methodology and made the following material assumptions, adjustments, and estimates:
1. | We determined that, as of October 1, 2017, the employee population of the Company and its consolidated subsidiaries consisted of approximately 14,400 individuals, with approximately 7,700 U.S. employees and approximately 6,700 non-U.S. employees. |
2. | We adjusted the employee population used for purposes of determining the median employee to approximately 7,900 individuals as permitted by the SEC rules, as follows: |
a. | We excluded all of the employees on such date in the following countries, constituting in the aggregate less than 5% of the total number of employees, as follows: (i) approximately 244 employees in Australia, (ii) approximately 13 employees in Canada, (iii) approximately 1 employee in China, (iv) approximately 12 employees in Hong Kong and (v) approximately 2 employees in South Africa. |
b. | We excluded all of the employees of BFDS and IFDS U.K. who became employees of the Company and its consolidated subsidiaries as a result of the acquisition of the remaining interests in those entities in 2017, as follows: (i) approximately 2,000 employees of BFDS, and (ii) approximately 4,200 employees of IFDS U.K. |
3. | To identify the “median employee” from the adjusted employee population, we compared the amount of salary and wages of such employees for the full twelve months of 2017. We “annualized” the compensation of employees hired during the measurement period and active employees who left the Company after October 1 to reflect compensation for the entire measurement period. |
4. | We did not make any cost-of-living adjustments in identifying the “median employee.” We only utilized the corporate foreign currency exchange rates to convert all international compensation data to the U.S. dollar for purposes of comparison. |
5. | Once we identified our median employee, we included the elements of such employee’s compensation for 2017 determined in accordance with the requirements of Item 402(c)(2)(x) of Regulation S-K, together with the Company provided benefit contribution value. With respect to the annual total compensation of our Chief Executive Officer, we added the Company provided benefit contribution value to the amount reported in the “Total” column of our 2017 Summary Compensation Table included in this Item 11, which was calculated in accordance with the same requirements of Item 402(c)(2)(x) of Regulation S-K. |
123
Non‑Employee Director Compensation Practices
The Committee reviews non-employee director compensation annually. This review includes an analysis by Deloitte of peer company director compensation and other public company director compensation practices and trends. After such review, the Committee recommends components of non‑employee director compensation to the Board. The Board is responsible for and has the authority to determine the components of non‑employee director compensation.
Compensable Event/Position | 2017 Compensation | 2018 Compensation (after May 8, 2018) | |
Annual Cash Retainer | $90,000 | $100,000 | |
Retainer for Lead Independent Director | $30,000 | unchanged | |
Committee Chairperson Retainer | $20,000 Audit | $30,000 Audit | |
$15,000 Compensation | $20,000 Compensation | ||
$15,000 Nominating | $20,000 Nominating | ||
Board Meeting Fee | No per meeting fee (1) | unchanged | |
Committee Meeting Fee | No per meeting fee (1) | unchanged | |
Annual Equity Award | $140,000 (fair market value of DST stock) (2) | $155,000 (fair market value of DST stock) (2) | |
(1) | Board and Committee meeting fees were eliminated (unless the number of Board or Committee meetings exceeds seven in a one-year measurement period, in which case a per-meeting fee of $2,000 would be paid for “excess meeting” fees). |
(2) | Grants of DST stock were made pursuant to the 2015 Equity and Incentive Plan and were paid as soon as practicable following the date of the annual meeting to continuing directors. The number of shares was based on the fair market value (as determined under rules of the Compensation Committee) on the date of grant. |
Directors Deferred Fee Plan - Deferred DST Shares Only
In 2015, the Board adopted a voluntary Directors’ Deferred Fee Plan (the “Directors’ Deferred Fee Plan”) that permits electing directors to receive deferred shares of DST common stock in lieu of: (i) cash directors’ fees and (ii) stock directors’ fees. The payment of the deferred shares received under the Directors’ Deferred Fee Plan are deferred for tax purposes until a director’s service from the Board ends. Before any deferred shares are delivered to a participating director, the director does not have any right to vote any of his or her deferred shares nor to receive any cash dividends on the deferred shares to the extent dividends are payable on shares of DST common stock. If and when DST pays a cash dividend on its shares, additional deferred shares are credited to a participating director’s account. The additional shares credited have a value equal to the dividends that otherwise would have been payable to a plan account if the hypothetical shares then credited were actual shares of DST common stock. All credited whole deferred shares will be settled in actual shares of DST common stock and such shares will be issued to a director upon the director’s termination from Board service. Any fractional deferred share will be rounded up to a whole share. Most directors were initially eligible to participate in the Directors’ Deferred Fee Plan as of May 2015, and the plan applies only to eligible director compensation earned after that date.
Other Perquisites
We purchase term life insurance for non-employee directors. The directors name the policy beneficiaries. We provide spousal travel to and from occasional off-site planning meetings and reimburse family entertainment at such meetings. If we do not incur an incremental cost for an additional passenger, the spouse or significant other of a director may accompany the director for travel associated with meetings of the Board or its committees by traveling on aircraft in which we have an interest.
124
2017 Non-Employee Director Compensation
Fees Earned or Paid in Cash | Stock Awards(1) | All Other Compensation(2) | Total | ||||
Joseph C. Antonellis(3) | $6,000 | $230,000 | $65 | $236,065 | |||
Jerome H. Bailey(3) | $114,000 | $140,000 | $65 | $254,065 | |||
Lynn Dorsey Bleil(3) | $2,000 | $234,000 | $65 | $236,065 | |||
Lowell L. Bryan(3) | $126,000 | $140,000 | $65 | $266,065 | |||
Gary D. Forsee(3) | $2,000 | $249,000 | $65 | $251,065 | |||
Charles E. Haldeman, Jr.(3) | $2,000 | $234,000 | $65 | $236,065 | |||
Samuel G. Liss(3) | $111,000 | $140,000 | $42 | $251,042 | |||
(1) | All non-employee directors with continuing service after the 2017 Annual Meeting received shares of DST stock as of the date of the 2017 Annual Meeting. The number of shares granted was determined by using $62.50 (post split number), the average of the highest and lowest reported sale price of DST stock on May 9, 2017, the date of the 2017 Annual Meeting. The amount reflected in the column reflects the aggregate grant date fair value of this grant. Messrs. Antonellis, Forsee, and Haldeman and Ms. Bleil deferred their shares under the Directors’ Deferred Fee Plan and elected to receive any compensation that would be paid in cash in stock. Messrs. Antonellis, Bailey, Bryan, Forsee, and Haldeman and Ms. Bleil received cash compensation for additional meeting fees. |
(2) | For all directors, amounts include term life insurance premiums. |
(3) | Deferred shares of DST stock credited to non-employee directors at December 31, 2017 include: (i) Mr. Antonellis: 3,715; (ii) Mr. Bailey: 0; (iii) Ms. Bleil: 7,672; (iv) Mr. Bryan: 0; (v) Mr. Forsee:12,606; (vi) Mr. Haldeman: 11,815; and (vii) Mr. Liss: 0. |
Directors may participate in our charitable match program. Under the program, the Company, through a donor-advised fund at a community charitable foundation, will match contributions by the director to qualified not-for-profit organizations in an annual amount equal to three times the contribution but not to exceed $30,000. Matching amounts from the foundation were: $30,000 for Mr. Antonellis, $30,000 for Ms.Bleil, $30,000 for Mr. Bryan, $30,000 for Mr. Forsee, $30,000 for Mr. Haldeman, and $30,000 for Mr. Liss. We have not included matching amounts in compensation as we do not believe the contribution directly or indirectly affects the director personally.
Under the Board’s Education Policy, directors may receive reimbursement for participation in director education programs and activities as they deem appropriate to stay abreast of developments in corporate governance, Board duties, and other topics relevant to their service on the Board and their respective Board committees. Reimbursement is limited as provided in the policy and requires approval of the Lead Independent Director.
Item 12. Security Ownership of Certain Beneficial Owners and Management and Related Stockholder Matters
The following table provides information as of December 31, 2017 about DST stock that may be issued under the 2005 Equity Incentive Plan and 2015 Equity and Incentive Plan upon the exercise of options, warrants and rights, as well as other year-end information about our equity compensation plans.
Equity Compensation Plan Information
A | B | C | ||||||||
Plan Category | Number of securities to be issued upon exercise of options, warrants and rights outstanding as of December 31, 2017(#) | Weighted average exercise price of outstanding options, warrants and rights shown in column A ($) | Number of securities remaining available for issuance as of December 31, 2017 under equity compensation plans (excluding securities reflected in column A)(#) | |||||||
Equity compensation plans approved by stockholders | 2,169,893 | (1) | (4) | $8.13 | 3,483,316 | (2) | ||||
DST Systems, Inc. 2000 Employee Stock Purchase Plan (“ESPP”) | None | None | 589,844 | (3) | ||||||
Equity compensation plans not approved by stockholders | None | None | None | |||||||
125
_______________________________________________________________________
(1) | This column includes securities that have been granted and may be issued at a future date in connection with stock option grants, restricted stock units, and performance stock units (assuming the maximum number of PSUs will be earned for units granted in 2016 and 2017) under the 2005 Equity Incentive Plan and the Employee Plan. 677,517 shares were granted prior to May 2015 under the 2005 Equity Incentive Plan and 1,492,376 shares were granted under the 2015 Equity and Incentive Plan, which was adopted and effective May 12, 2015. PSUs have been included at the maximum performance attainment of 2.0 shares per unit, however we currently expect a weighted average conversion ratio of 1.6 for PSUs outstanding as of December 31, 2017. The calculation of the weighted average exercise price of outstanding options, warrants and rights includes PSUs at the target conversion rate of 1.0 when awards were granted. |
Column A does not include:
• | Service awards of 15,160 shares of DST stock that were earned under the Employee Plan in recognition of years of service (five shares for five years of employment, ten shares for ten years, and so forth in five year increments) during the year ended December 31, 2017. The average grant date fair value of those shares granted as service awards during 2017 was $63.52. |
(2) | These are the shares available for issuance in connection with the granting of annual incentive awards, stock options, stock appreciation rights, restricted stock, stock awards, restricted stock units, performance stock units, deferred stock, dividend equivalents, service awards, substitute awards, or any other right, interest or option relating to shares of DST stock granted pursuant to the Employee Plan. |
(3) | The ESPP was suspended beginning with plan year 2006 and no shares have been issued for the 2006 through 2017 plan years. The suspension will continue until otherwise determined by the Committee. The number shown is the number available for issuance should the Committee lift the suspension. |
(4) | The Merger Agreement with SS&C provides that each unvested PSU that is outstanding will be converted automatically into a restricted stock unit with respect to a number of shares of SS&C common stock, equal to the product obtained by multiplying (x) the number of shares of DST common stock that would be delivered in respect of such unvested performance stock unit based on actual projected performance through to the effective date of the Merger (equal to 124% of target for performance stock units granted in 2016, and 200% of target for performance stock units granted in 2017) by (y) the Equity Award Exchange Ratio (as defined in the Merger Agreement), with any fractional shares rounded down to the next lower whole number of shares. For a further discussion of the treatment of PSUs see “Termination payments and potential termination payments- Treatment of Equity Awards and Long-Term Cash Awards Under Merger Agreement” in Item 10. |
126
As of February 21, 2018, we had 59,319,166 shares of DST common stock outstanding. The following table shows share ownership as of such date based upon available information.
Name and Address | Shares of our Common Stock (1) (#) | Percent of Class(1) | |
BlackRock, Inc. (2) | 5,107,149 | 8.61% | |
The Vanguard Group (3) | 5,242,165 | 8.84% | |
Joseph C. Antonellis (4) Director | 7,055 | * | |
Jerome H. Bailey (4) Director | 6,992 | * | |
Lynn Dorsey Bleil (4) Director | 15,988 | * | |
Lowell L. Bryan (4) Director | 49,154 | * | |
Gary D. Forsee (4) Director | 12,606 | * | |
Charles E. Haldeman, Jr. (4) Director | 33,191 | * | |
Stephen C. Hooley (4) Chairman, CEO, President, and Director | 286,904 | * | |
Samuel G. Liss (4) Director | 18,492 | * | |
Jonathan J. Boehm (4) Executive Vice President and Head of Healthcare Businesses | 89,730 | * | |
Edmund J. Burke (4) Executive Vice President and President of ALPS | 32,119 | ||
Gregg Wm. Givens (4) Senior Vice President, Chief Financial Officer, and Treasurer | 63,059 | * | |
Vercie L. Lark (4) Executive Vice President and Head of Financial Services | 101,607 | * | |
Current Executive Officers and Directors as a Group (16 Persons) | 793,907 | 1.33% | |
_______________________________________________________________________
* | Less than 1% of the aggregate as of February 21, 2018 of DST stock and the Beneficially Owned Equity Awards described in note (1). |
(1) | The percentage for each person or group is based on the number of shares outstanding as of February 21, 2018 and includes shares for which beneficial ownership is disclaimed, as described in the notes to this table. Except as otherwise stated in these notes, the holders have sole power to vote or direct the vote and dispose or direct the disposition of the shares. |
(2) | A Schedule 13G/A was filed on January 29, 2018 by BlackRock, Inc. 55 East 52nd Street, New York, NY 10022. BlackRock is a parent holding company with the following subsidiaries that are also beneficial owners: BlackRock Life Limited; BlackRock Advisors, LLC; BlackRock (Netherlands) B.V.; BlackRock Institutional Trust Company, National Association; BlackRock Asset Management Ireland Limited; BlackRock Financial Management, Inc.; BlackRock Asset Management Schweiz AG; BlackRock Investment Management, LLC; FutureAdvisor, Inc.; BlackRock Investment Management (UK) Limited; BlackRock Asset Management Canada Limited; BlackRock Investment Management (Australia) Limited; BlackRock Advisors (UK) Limited; BlackRock Fund Advisors; BlackRock Asset Management North Asia Limited; and BlackRock Fund Managers Ltd. This Schedule 13G/A reports that Blackrock has sole voting power with respect to 4,828,400 shares and sole dispositive power with respect to 5,107,149 shares. |
(3) | A Schedule 13G/A was filed on February 9, 2018 by The Vanguard Group (“Vanguard”), 100 Vanguard Blvd., Malvern, PA 19355. Vanguard is a parent holding company with the following subsidiaries that are also beneficial owners: Vanguard Fiduciary Trust Company and Vanguard Investments Australia, Ltd. The Schedule 13G/A reports that Vanguard has (i) sole voting power with respect to 32,230 shares of common stock, (ii) shared voting power with respect to 7,568 shares of common stock (iii) sole |
127
dispositive power with respect to 5,206,165 shares of common stock, and (iv) shared dispositive power with respect to 36,000 shares of common stock.
(4) | The total number of shares shown consists of the following: |
Directly Held Shares (#) | Miscellaneous Indirect Holdings (a) (#) | Other Beneficially Owned Equity Awards (b) (#) | |||
Joseph C. Antonellis | 3,340 | — | 3,715 | ||
Jerome H. Bailey | 6,992 | — | — | ||
Lynn Dorsey Bleil | 8,316 | — | 7,672 | ||
Lowell L. Bryan | 49,154 | — | — | ||
Gary D. Forsee | — | — | 12,606 | ||
Charles E. Haldeman, Jr. | 21,376 | — | 11,815 | ||
Stephen C. Hooley | 129,624 | — | 157,280 | ||
Samuel G. Liss | 18,492 | — | — | ||
Jonathan J. Boehm | 75,556 | — | 21,653 | ||
Edmund J. Burke | 32,119 | — | 4,422 | ||
Gregg Wm. Givens | 54,961 | — | 13,993 | ||
Vercie L. Lark | 56,207 | — | 45,400 | ||
Current Executive Officers and Directors as a Group (16 Persons) | 491,953 | 41,194 | 282,662 | ||
_______________________________________________________________________
(a) | The indirectly held shares are held in individual retirement accounts, trusts, through spouses or otherwise. |
(b) | Includes exercisable options, time-based restricted stock units that a retirement-eligible person would acquire if they terminated employment, and deferred shares earned by directors under the Directors’ Deferred Fee Plan, which we refer to, collectively, as “Beneficially Owned Equity Awards.” Includes time-based restricted stock units that a retirement-eligible person would acquire if such person was terminated employment. |
The consummation of the transactions contemplated under the Merger Agreement with SS&C dated January 11, 2018 would result in a change of control of the Company. The transaction is subject to DST stockholder approval, clearances by the relevant regulatory authorities and other customary closing conditions. See Item 8, Financial Statements and Supplementary Data - Note 1, “Description of Business” for more information regarding this transaction.
Item 13. Certain Relationships and Related Transactions, and Director Independence
CEO Relationship. On July 31, 2012, our Board elected Stephen C. Hooley as a director. Mr. Hooley became Chief Executive Officer and President of the Company on September 13, 2012, and was appointed Chairman on July 29, 2014. He had served as the Company’s President and Chief Operating Officer since mid‑2009. Mr. Hooley served from 2004 through mid‑2009 as President and Chief Executive Officer of BFDS, DST’s former joint venture with State Street. He served from mid‑2009 through April 2013 as non‑executive Chairman of BFDS. He served as a member of the board of BFDS until March 27, 2017. Mr. Hooley served in various executive officer and board positions between 2006 and 2013 with IFDS, L.P., a joint venture with State Street, and IFDS U.K., a former joint venture with State Street.
Mr. Hooley’s brother, Joseph L. Hooley, is the Chief Executive Officer of State Street. The Boston Financial joint venture was entered into between DST and State Street in 1974 predating the brothers’ relationship with any of State Street, BFDS, or DST.
Unconsolidated Affiliates. For 2017, the Company had equity in earnings of unconsolidated affiliates, net of income taxes provided by the unconsolidated affiliates, of $18.3 million from IFDS, L.P.
For the period in 2017 prior to completion of the transactions described below, the Company had equity in earnings of unconsolidated affiliates, net of income taxes provided by the unconsolidated affiliates, of $1.0 million from IFDS U.K. During the same period, we had consolidated operating revenues of $13.1 million from IFDS U.K. and its subsidiaries.
For the period in 2017 prior to completion of the transactions described below, the Company had equity in earnings of unconsolidated affiliates, net of income taxes provided by the unconsolidated affiliates, of $3.6 million from BFDS. BFDS used our mutual fund shareowner accounting and recordkeeping system and services as a remote services client. Certain of our
128
subsidiaries provided other services and license software to Boston Financial and its subsidiaries. During the same period, we had consolidated operating revenues of $23.7 million from BFDS and its subsidiaries.
2017 Transactions. On March 27, 2017, the Company and/or certain of its subsidiaries entered into a series of definitive agreements pursuant to which, among other things, BFDS and IFDS would become wholly-owned indirect subsidiaries of DST.
On March 27, 2017, DST entered into a definitive agreement (the “BFDS Reorganization Agreement”), pursuant to which, among other things, State Street will contribute all of its interest in IFDS Realty, LLC, a Massachusetts limited liability company, and shares of stock in Vestmark, Inc., a Delaware corporation (“Vestmark”), to BFDS, in exchange for shares of BFDS (the “Reorganization”). The Reorganization transaction closed on March 30, 2017.
On March 27, 2017, West Side Investment Management, Inc., a Nevada corporation and wholly-owned subsidiary of DST (“West Side”) entered into a definitive agreement (the “Exchange Agreement”) pursuant to which West Side, following the Reorganization, acquired, in a non-taxable transaction for U.S. federal income tax purposes, State Street’s interest in BFDS in exchange for 2,041,187 shares of State Street common stock owned by West Side valued at $157.6 million (the “Exchange”), based on the closing share price for State Street common stock as of March 24, 2017. Upon the closing of this transaction, BFDS became a wholly-owned subsidiary of DST (directly and through DST’s ownership interest in West Side).
On March 27, 2017, DST entered into a definitive agreement (the “IFDS UK Purchase Agreement”) pursuant to which, among other things, DST indirectly purchased (i) all of the issued and outstanding stock of IFDS Percana Group Limited, a company organized under the laws of Ireland (“Percana”) indirectly held by International Financial Data Services Limited Partnership, a Massachusetts limited partnership (“IFDS LP”), which is jointly owned by DST and State Street, (ii) State Street’s 50% interest in IFDS UK (the “SST- IFDS UK Interest”), from State Street and (iii) all of the membership interests of IFDS Realty UK, LLC, a Delaware limited liability company, directly held by IFDS LP, for a combined $175.0 million in cash. Prior to the sale of State Street’s SST-IFDS UK Interest, DST owned a 50% interest in, and State Street owned a 50% interest in, IFDS UK. Percana, IFDS UK, and IFDS Realty UK, LLC became wholly-owned subsidiaries (directly and indirectly) of DST following the closing of the transactions contemplated by the IFDS UK Purchase Agreement.
On March 27, 2017, DST entered into a definitive agreement (the “Joint Marketing Agreement”) pursuant to which State Street Bank and Trust Company, a Massachusetts trust company (“SSB”), and a subsidiary of State Street, may refer to BFDS certain opportunities to provide transfer agency services, and DST may refer to SSB certain opportunities to provide custody, mutual fund accounting and fund administration services. In addition, subject to certain exceptions, neither DST nor its affiliates will (1) provide transfer agency services in the U.S. bundled with any custody, mutual fund accounting and fund administration services provided by certain third parties; or (2) permit DST’s TA2000 system to be used by those third parties to provide transfer agency services. The term of the Joint Marketing Agreement is five years.
On March 27, 2017, DST also entered into a certain termination agreement (the “Termination Agreement”) and other ancillary agreements. The Termination Agreement terminates the following material definitive agreements:
• | Amended and Restated Joint Venture Agreement, by and between DST and State Street, dated as of October 31, 2006, as amended, pursuant to which DST and State Street jointly governed BFDS. Such termination will be effective as of, and automatically upon, the closing of the Reorganization; |
• | Share Transfer Restriction and Option Agreement, by and between DST and State Street, dated as of December 23, 1992, relating to restrictions on the transfer of shares of International Financial Data Services Limited prior to 1995 and a mutual right of first refusal on transfers of such shares after 1995. Such termination will be effective as of March 27, 2017; and |
• | Agreement, by and among State Street (f/k/a State Street Boston Corporation), DST Systems International B.V., a Netherlands corporation, and International Financial Data Services Limited (f/k/a. Clarke & Tilley Limited), dated December 23, 1992, pursuant to which DST and State Street jointly governed International Financial Data Services Limited. Such termination will be effective as of March 27, 2017. |
No penalties for early termination were incurred by the termination of any of the above agreements.
In connection with the acquisition by the Company of the remaining interests in BFDS, Joseph L. Hooley experienced a “Separation From Service” from BFDS which entitled him to receive a lump sum distribution of approximately $2,930,000 from his retirement account balance in the BFDS 2005 Deferred Compensation Plan, which was paid to him within 90 days after completion of the acquisition.
Related Person Transaction Procedures. Written policies and procedures (the “Procedures”) adopted by the Nominating Committee address its review of transactions of $120,000 or more in which the Company participates and a “related person”
129
has a direct or indirect material interest. A “related person” is a director, executive officer, 5% or more stockholder, or immediate family member of any such person.
The Procedures obligate our directors and executive officers to notify our general counsel if they become aware of a transaction that is subject to the Procedures.
For each potential or actual transaction that is or would be a related party transaction, the Nominating Committee considers, where applicable:
• | whether the transaction is in the best interest of the stockholders; |
• | the significance of the transaction to the Company; |
• | the requirements of the Code of Business Conduct; |
• | the materiality of the transaction and whether the transaction is significantly likely to impair any judgments an executive officer or director would make on our behalf; |
• | the impact on a non-employee director’s independence; |
• | the effect on Compensation Committee independence; |
• | availability of other sources for comparable products or services; and |
• | the terms available to or from unrelated third-parties. |
The Procedures prohibit interested Nominating Committee members from reviewing, considering, or approving a related party transaction. If the Nominating Committee does not approve or ratify a transaction, it discusses with management a strategy for terminating the transaction, modifying the structure of the transaction, or not approving the transaction.
As appropriate, the Nominating Committee may review an approved related person transaction on a periodic basis throughout the duration of the transaction to ensure that the transaction remains in the best interest of the Company. In addition, the Nominating Committee may request that the full Board consider the approval or ratification of related person transactions if it deems it advisable.
The Nominating Committee has approved or ratified the transactions referenced above.
Independence. Our Board has determined that seven of our eight directors are “independent” as defined by applicable law, NYSE Listing Standards, and our Corporate Governance Guidelines. Based on such standards, Mr. Hooley is not an independent director because he is an executive officer of the Company. Each of our committees is comprised solely of independent directors.
Item 14. Principal Accountant Fees and Services
Engagement. PricewaterhouseCoopers LLP (“PWC”) served as our independent registered public accounting firm as of and for the year ended December 31, 2017. PWC performed professional services in connection with the audit of our consolidated financial statements and internal control over financial reporting and the review of reports we filed with the Securities and Exchange Commission. It also reviewed control procedures of our transaction processing services and provided us certain other accounting, auditing, and tax services.
PWC’s fees for services related to 2017 and 2016 were as follows:
Type of Fees | 2017 | 2016 | |||||
Audit Fees | $ | 5,023,453 | $ | 4,415,460 | |||
Audit‑Related Fees (1)(2) | $ | 3,893,623 | $ | 2,553,770 | |||
Tax Fees (1)(3) | $ | 2,543,548 | $ | 3,587,114 | |||
(1) | The Audit Committee has determined that the provision of these services is compatible with maintaining the independence of PWC(1). |
(2) | $3,655,914 of the 2017 amount and $2,497,200 of the 2016 amount was for attestation services relating to SSAE 16 reports and other control reviews; $58,590 of the 2017 and $19,000 of the 2016 amount was for financial statement audits of employee benefit plans; and $179,119 of the 2017 and $37,570 of the 2016 amount was for projects related to agreed upon procedures, due diligence, and other services. |
(3) | $1,135,322 of the 2017 amount and $1,223,652 of the 2016 amount was for U.S. federal, state and local tax, and international compliance; and $1,408,226 of the 2017 amount and $2,363,462 of the 2016 amount was for other tax services. |
130
Engagement Procedures. Audit Committee procedures prohibit the Committee from engaging an independent registered public accounting firm to perform any service it may not perform under the securities laws. The Audit Committee must pre‑approve the independent registered public accounting firm’s annual audit of our consolidated financial statements. The procedures require the Committee or its Chairperson to pre‑approve or reject any other audit or non‑audit services the independent registered public accounting firm is to perform. The Committee has directed that its Chairperson, with the assistance of our Chief Financial Officer, present and describe at regularly scheduled Audit Committee meetings all pre‑approved services. The Committee has required management to present services for pre‑approval within a specified period in advance of the date the services are to commence. The Committee regularly examines whether the fees for audit services exceed estimates. Securities regulations waive pre‑approval requirements for certain non‑audit services if their aggregate amount does not exceed specified amounts we pay to the independent registered public accounting firm. The procedures require the Committee or its Chairperson to approve, prior to completion of the audit, any services subject to this waiver. The Committee has not applied the waiver to a non‑audit service. The Audit Committee pre‑approved all services PWC rendered to us and our subsidiaries for 2017.
131
PART IV
Item 15. Exhibits and Financial Statement Schedules
(a) | List of documents filed as part of this report |
(1) | Consolidated Financial Statements |
The consolidated financial statements and related notes, together with the report of PricewaterhouseCoopers LLP, appear in Part II, Item 8, Financial Statements and Supplementary Data, of this Form 10-K.
The consolidated financial statements consist of the following:
1.Consolidated Balance Sheet as of December 31, 2017 and 2016;
2.Consolidated Statement of Income for the three years ended December 31, 2017;
3.Consolidated Statement of Comprehensive Income for the three years ended December 31, 2017;
4.Consolidated Statement of Changes in Stockholders’ Equity for the three years ended December 31, 2017;
5.Consolidated Statement of Cash Flows for the three years ended December 31, 2017; and
6.Notes to Consolidated Financial Statements.
(2) | Consolidated Financial Statement Schedules |
All schedules have been omitted because they are not applicable, are insignificant or the required information is shown in the consolidated financial statements or notes thereto.
(3) | List of Exhibits |
The exhibits filed as part of this report are listed in the Exhibit Index.
132
DST Systems, Inc.
Form 10-K Annual Report
for the Period Ended
December 31, 2017
Exhibit Index
Incorporated by Reference | Filed/Furnished Herewith | |||||||||||
Exhibit no. | Exhibit Description | Form | SEC File No. | Exhibit | Filing Date | |||||||
(2) Plan of acquisition, reorganization, arrangement, liquidation or succession | ||||||||||||
2.1 | 10-K | 1-14036 | 2.1 | 2/28/2011 | ||||||||
2.2 | 10-K | 1-14036 | 2.2 | 2/28/2011 | ||||||||
2.3 | 10-K | 1-14036 | 2.3 | 2/28/2011 | ||||||||
2.4 | 8-K | 1-14036 | 2.1 | 7/21/2011 | ||||||||
2.5 | 8-K | 1-14036 | 2.1 | 6/14/2016 | ||||||||
2.6 | 10-Q | 1-14036 | 2.1 | 11/3/2017 | ||||||||
2.7 | 10-Q | 1-14036 | 2.2 | 11/3/2017 | ||||||||
2.8 | 8-K | 1-14036 | 2.1 | 1/11/2018 | ||||||||
(3) Articles of Incorporation and Bylaws | ||||||||||||
3.1 | 8-K | 1-14036 | 3.3 | 5/14/2015 | ||||||||
133
Incorporated by Reference | Filed/Furnished Herewith | |||||||||||
Exhibit no. | Exhibit Description | Form | SEC File No. | Exhibit | Filing Date | |||||||
3.2 | 8-K | 1-14036 | 3.1 | 2/29/2016 | ||||||||
(4) Instruments defining the rights of security holders, including indentures | ||||||||||||
4.1 | 1-14036 | |||||||||||
4.2 | 1-14036 | |||||||||||
4.3.1 | 8-K | 1-14036 | 4.1 | 8/11/2010 | ||||||||
4.3.2 | 8-K | 1-14036 | 10.2 | 4/23/2014 | ||||||||
4.3.3 | 8-K | 1-14036 | 10.1 | 11/14/2017 | ||||||||
4.3.4 | 8-K | 1-14036 | 10.2 | 11/14/2017 | ||||||||
4.4 | 8-K | 1-14036 | 4.1 | 11/14/2017 | ||||||||
The Company agrees to furnish to the Commission a copy of any long-term debt agreements that do not exceed 10 percent of the total assets of the Company upon request. | ||||||||||||
(10) Material Contracts | ||||||||||||
10.1 | 10-Q | 1-14036 | 10.1 | 11/9/2006 | ||||||||
10.2.1 | 8-K | 1-14036 | 10.1 | 10/2/2014 | ||||||||
10.2.2 | 10-Q | 1-14036 | 10.4 | 8/4/2015 | ||||||||
10.2.3 | 8-K | 1-14036 | 10.3 | 11/14/2017 | ||||||||
10.3 | 8-K | 1-14036 | 99.2 | 1/23/2013 | ||||||||
134
Incorporated by Reference | Filed/Furnished Herewith | |||||||||||
Exhibit no. | Exhibit Description | Form | SEC File No. | Exhibit | Filing Date | |||||||
10.4 | 8-K | 1-14036 | 99.2 | 3/24/2014 | ||||||||
10.5 | 8-K | 1-14036 | 99.1 | 5/5/2014 | ||||||||
10.6 | 8-K | 1-14036 | 99.2 | 5/5/2014 | ||||||||
10.7 | 8-K | 1-14036 | 99.3 | 5/5/2014 | ||||||||
10.8.1 | 8-K | 1-14036 | 10.1 | 5/21/2014 | ||||||||
10.8.2 | 8-K | 1-14036 | 10.1 | 5/15/2015 | ||||||||
10.8.3 | 10-Q | 1-14036 | 10.1 | 11/3/2017 | ||||||||
10.8.4 | 10-Q | 1-14036 | 10.2 | 11/3/2017 | ||||||||
10.8.5 | 8-K | 1-14036 | 10.4 | 11/14/2017 | ||||||||
10.9.1 | 8-K | 1-14036 | 10.2 | 5/21/2014 | ||||||||
10.9.2 | 8-K | 1-14036 | 10.3 | 5/21/2014 | ||||||||
10.9.3 | 8-K | 1-14036 | 10.4 | 5/21/2014 | ||||||||
10.9.4 | 8-K | 1-14036 | 10.5 | 5/21/2014 | ||||||||
10.9.5 | 10-K | 1-14036 | 10.2 | 2/26/2015 | ||||||||
10.9.6 | 10-Q | 1-14036 | 10.3 | 11/3/2017 | ||||||||
10.9.7 | 8-K | 1-14036 | 10.5 | 11/14/2017 | ||||||||
135
Incorporated by Reference | Filed/Furnished Herewith | |||||||||||
Exhibit no. | Exhibit Description | Form | SEC File No. | Exhibit | Filing Date | |||||||
10.10.1 | 8-K | 1-14036 | 10.6 | 5/21/2014 | ||||||||
10.10.2 | 10-Q | 1-14036 | 10.4 | 11/3/2017 | ||||||||
10.11 | 8-K | 1-14036 | 10.7 | 5/21/2014 | ||||||||
10.12 | 10-K | 1-14036 | 10.3 | 2/26/2015 | ||||||||
10.13 | 8-K | 1-14036 | 10.1 | 7/7/2016 | ||||||||
10.14 | 8-K | 1-14036 | 10.1 | 3/27/2017 | ||||||||
10.15 | 8-K | 1-14036 | 10.2 | 3/27/2017 | ||||||||
10.16 | 8-K | 1-14036 | 10.3 | 3/27/2017 | ||||||||
10.17 | 8-K | 1-14036 | 10.4 | 3/27/2017 | ||||||||
10.18 | 8-K | 1-14036 | 10.5 | 3/27/2017 | ||||||||
Executive Compensation Plans or Arrangements | ||||||||||||
10.19 | 8-K | 1-14036 | 10.1 | 7/2/2009 | ||||||||
10.20 | 10-K | 1-14036 | 10.1 | 2/26/2015 | ||||||||
10.21 | * | |||||||||||
10.22 | * | |||||||||||
136
Incorporated by Reference | Filed/Furnished Herewith | |||||||||||
Exhibit no. | Exhibit Description | Form | SEC File No. | Exhibit | Filing Date | |||||||
10.22.1 | 10-K | 1-14036 | 10.17.1 | 2/28/2017 | ||||||||
10.22.2 | 10-K | 1-14036 | 10.17.2 | 2/28/2017 | ||||||||
10.23 | 8-K | 1-14036 | 99.4 | 5/5/2014 | ||||||||
10.24 | 10-K | 1-14036 | 10.2 | 2/27/2014 | ||||||||
10.25 | 8-K | 1-14036 | 10.1 | 5/14/2015 | ||||||||
10.26 | 10-Q | 1-14036 | 10.2 | 8/4/2015 | ||||||||
10.27 | 10-K | 1-14036 | 10.4 | 2/27/2014 | ||||||||
10.28 | 10-K | 1-14036 | 10.2 | 2/29/2012 | ||||||||
10.29 | 10-K | 1-14036 | 10.5 | 2/27/2014 | ||||||||
10.30 | 10-Q | 1-14036 | 10.2 | 5/5/2015 | ||||||||
10.31 | 10-K | 1-14036 | 10.6 | 2/27/2014 | ||||||||
10.32 | 10-Q | 1-14036 | 10.1 | 5/5/2015 | ||||||||
10.33 | 8-K | 1-14036 | 10.1 | 2/29/2016 | ||||||||
10.34 | * | |||||||||||
10.35 | * | |||||||||||
(12) Statement re: Computation of Ratios | ||||||||||||
12 | * | |||||||||||
(21) Subsidiaries of the Company | ||||||||||||
21 | * | |||||||||||
(23) Consents of experts and counsel | ||||||||||||
23 | * | |||||||||||
(31) and (32) Officer Certifications | ||||||||||||
137
31.1 | * | |||||||||||
31.2 | * | |||||||||||
32.0 | * | |||||||||||
(101) Formatted in XBRL (Extensible Business Reporting Language) | ||||||||||||
The following financial information from DST’s Annual Report on Form 10-K for the period ended December 31, 2017, filed with the SEC on February 28, 2018, formatted in Extensible Business Reporting Language (“XBRL”): (i) the Consolidated Statement of Income for the years ended December 31, 2017, 2016 and 2015, (ii) the Consolidated Balance Sheet at December 31, 2017 and 2016, (iii) the Consolidated Statement of Other Comprehensive Income for the years ended December 31, 2017, 2016 and 2015, (iv) the Consolidated Statement of Changes in Stockholders’ Equity for the years ended December 31, 2017, 2016 and 2015, (v) the Consolidated Statement of Cash Flows for the years ended December 31, 2017, 2016 and 2015, and (vi) Notes to Consolidated Financial Statements. | ||||||||||||
Note: The exhibits set forth above include agreements to which the Company is a party or has a beneficial interest. The agreements have been filed to provide investors with information regarding their respective terms. The agreements are not intended to provide any other actual information about the Company or its business or operations. In particular, the assertions embodied in any representations, warranties, and covenants contained in the agreements may be subject to qualifications with respect to knowledge and materiality different from those applicable to investors and may be qualified by information in confidential disclosure schedules not included with the exhibits. These disclosure schedules may contain information that modifies, qualifies and creates exceptions to the representations, warranties and covenants set forth in the agreements. Moreover, certain representations, warranties, and covenants in the agreements may have been used for the purpose of allocating risk between parties, rather than establishing matters as facts. In addition, information concerning the subject matter of the representations, warranties and covenants may have changed after the date of the respective agreement, which subsequent information may or may not be fully reflected in the Company’s public disclosures. Accordingly, investors should not rely on the representations, warranties and covenants in the agreements as characterizations of the actual state of facts about the Company or its business or operations on the date hereof.
Item 16. Form 10-K Summary
None.
138
SIGNATURES
Pursuant to the requirements of Section 13 or 15(d) of the Securities Exchange Act of 1934, the Company has duly caused this report to be signed on its behalf by the undersigned, thereunto duly authorized.
DST SYSTEMS, INC. | |||
By: | /s/ STEPHEN C. HOOLEY | ||
Stephen C. Hooley Chairman, Chief Executive Officer, and President | |||
Dated: February 28, 2018
Pursuant to the requirements of the Securities Exchange Act of 1934, this report has been signed below by the following persons on behalf of the Company and in the capacities indicated on February 28, 2018.
/s/ JOSEPH C. ANTONELLIS | /s/ CHARLES E. HALDEMAN, JR. | |
Joseph C. Antonellis Director | Charles E. Haldeman, Jr. Director | |
/s/ JEROME H. BAILEY | ||
Jerome H. Bailey Director | Samuel G. Liss Director | |
/s/ LYNN DORSEY BLEIL | /s/ STEPHEN C. HOOLEY | |
Lynn Dorsey Bleil Director | Stephen C. Hooley Chairman, Chief Executive Officer, and President (Principal Executive Officer) | |
/s/ LOWELL L. BRYAN | /s/ GREGG WM. GIVENS | |
Lowell L. Bryan Director | Gregg Wm. Givens Senior Vice President, Chief Financial Officer and Treasurer (Principal Financial Officer) | |
/s/ GARY D. FORSEE | /s/ DOUGLAS W. FLEMING | |
Gary D. Forsee Director | Douglas W. Fleming Vice President, Chief Accounting Officer (Principal Accounting Officer) | |
139