Attached files
| file | filename |
|---|---|
| EX-32 - EXHIBIT 32 - DST SYSTEMS INC | a2196877zex-32.htm |
| EX-3.1 - EXHIBIT 3.1 - DST SYSTEMS INC | a2196877zex-3_1.htm |
| EX-99.1 - EXHIBIT 99.1 - DST SYSTEMS INC | a2196877zex-99_1.htm |
| EX-12.1 - EXHIBIT 12.1 - DST SYSTEMS INC | a2196877zex-12_1.htm |
| EX-31.2 - EXHIBIT 31.2 - DST SYSTEMS INC | a2196877zex-31_2.htm |
| EX-10.4 - EXHIBIT 10.4 - DST SYSTEMS INC | a2196877zex-10_4.htm |
| EX-10.3 - EXHIBIT 10.3 - DST SYSTEMS INC | a2196877zex-10_3.htm |
| EX-10.1 - EXHIBIT 10.1 - DST SYSTEMS INC | a2196877zex-10_1.htm |
| EX-31.1 - EXHIBIT 31.1 - DST SYSTEMS INC | a2196877zex-31_1.htm |
| EX-10.2 - EXHIBIT 10.2 - DST SYSTEMS INC | a2196877zex-10_2.htm |
| EX-21.1 - EXHIBIT 21.1 - DST SYSTEMS INC | a2196877zex-21_1.htm |
| EX-23.1 - EXHIBIT 23.1 - DST SYSTEMS INC | a2196877zex-23_1.htm |
Use these links to rapidly review the document
Table of Contents
United States
Securities and Exchange Commission
Washington, D.C. 20549
FORM 10-K
| ý | ANNUAL REPORT PURSUANT TO SECTION 13 OR 15(d) OF THE SECURITIES EXCHANGE ACT OF 1934 | |
For the fiscal year ended December 31, 2009 |
||
or |
||
o |
TRANSITION REPORT PURSUANT TO SECTION 13 OR 15(d) OF THE SECURITIES EXCHANGE ACT OF 1934 |
|
For the transition period from to |
||
Commission file number 1-14036
(Exact name of Registrant as specified in its charter)
| Delaware (State or other jurisdiction of incorporation or organization) |
43-1581814 (I.R.S. Employer identification no.) |
|
333 West 11th Street, Kansas City, Missouri (Address of principal executive offices) |
64105 (Zip code) |
(816) 435-1000
Registrant's telephone number, including area code
Securities registered pursuant to Section 12(b) of the Act:
| Title of each class | Name of each Exchange on which registered | |
|---|---|---|
| Common Stock, $0.01 Per Share Par Value | New York Stock Exchange | |
| Preferred Stock Purchase Rights | New York Stock Exchange |
Securities registered pursuant to Section 12(g) of the Act: None
Indicate by check mark if the registrant is a well-known seasoned issuer, as defined in Rule 405 of the Securities Act. YES ý NO o
Indicate by check mark if the registrant is not required to file reports pursuant to Section 13 or Section 15(d) of the Act. YES o NO ý
Indicate by check mark whether the registrant: (1) has filed all reports required to be filed by Section 13 or 15(d) of the Securities Exchange Act of 1934 during the preceding 12 months (or for such shorter period that the registrant was required to file such reports), and (2) has been subject to such filing requirements for the past 90 days. YES ý NO o
Indicate by check mark whether the registrant has submitted electronically and posted on its corporate Web site, if any, every Interactive Data File required to be submitted and posted pursuant to Rule 405 of Regulation S-T (§232.405 of this chapter) during the preceding 12 months (or for such shorter period that the registrant was required to submit and post such files). YES o NO o
Indicate by check mark if disclosure of delinquent filers pursuant to Item 405 of Regulation S-K (§229.405 of this chapter) is not contained herein, and will not be contained, to the best of registrant's knowledge, in definitive proxy or information statements incorporated by reference in Part III of this Form 10-K or any amendment to this Form 10-K. o
Indicate by check mark whether the registrant is a large accelerated filer, an accelerated filer, a non-accelerated filer, or a smaller reporting company. See definitions of "large accelerated filer," "accelerated filer," and "smaller reporting company" in Rule 12b-2 of the Exchange Act.
| Large accelerated filer ý | Accelerated filer o | Non-accelerated filer o (Do not check if a smaller reporting company) |
Smaller reporting company o |
Indicate by check mark whether the registrant is a shell company (as defined in Rule 12b-2 of the Exchange Act). YES o NO ý
Aggregate market value of the voting and non-voting stock held by non-affiliates of the Registrant as of June 30, 2009:
Common Stock, $0.01 par value—$1,418,297,335
Number
of shares outstanding of the Registrant's common stock as of January 31, 2010:
Common Stock, $0.01 par value—48,855,424
Documents incorporated by reference: Proxy Statement for the annual meeting of stockholders on May 11, 2010 (Part III)
The brand, service or product names or marks referred to in this Report are trademarks or services marks, registered or otherwise, of DST Systems, Inc. or its subsidiaries or affiliates or of vendors to the Company.
2
CAUTIONARY STATEMENT WITH RESPECT TO FORWARD-LOOKING COMMENTS
The discussions set forth in this annual report on Form 10-K contain statements concerning potential future events. Such forward-looking statements are based upon assumptions by the Company's management, as of the date of this Annual Report, including assumptions about risks and uncertainties faced by the Company. In addition, management may make forward-looking statements orally or in other writings, including, but not limited to, in press releases, in the annual report and in the Company's other filings with the Securities and Exchange Commission (the "SEC"). Readers can identify these forward-looking statements by the use of such verbs as expects, anticipates, believes or similar verbs or conjugations of such verbs. If any of management's assumptions prove incorrect or should unanticipated circumstances arise, the Company's actual results could materially differ from those anticipated by such forward-looking statements. The differences could be caused by a number of factors or combination of factors including, but not limited to, those factors identified in Item 1A., "Risk Factors" of this Form 10-K. Readers are strongly encouraged to consider those factors when evaluating any forward-looking statements concerning the Company. The Company undertakes no obligation to update any forward-looking statement in this annual report to reflect future events or developments.
This discussion of the business of DST Systems, Inc. ("DST" or the "Company") should be read in conjunction with, and is qualified by reference to, Management's Discussion and Analysis of Financial Condition and Results of Operations ("MD&A") under Item 7 herein. In addition, pursuant to Rule 12b-23 under the Securities Exchange Act of 1934, as amended, the information set forth in the first paragraph and under the headings "Introduction" and "Seasonality" in the MD&A and the segment and geographic information included in Item 8, Note 16 are incorporated herein by reference in partial response to this Item 1.
The Company was originally established in 1969. Through a reorganization in August 1995, the Company is now a corporation organized in the State of Delaware.
The Company's annual report on Form 10-K, quarterly reports on Form 10-Q, current reports on Form 8-K and all amendments to those reports will be made available free of charge on or through the Company's Internet website (www.dstsystems.com) as soon as reasonably practicable after such material is electronically filed with, or furnished to, the SEC. In addition, the Company's corporate governance guidelines and the charters of the Audit Committee, the Corporate Governance/Nominating Committee and the Compensation Committee of the DST Board of Directors are available on the Company's Internet website. These guidelines and charters are available in print to any stockholder who requests them. Written requests may be made to the DST Corporate Secretary, 333 West 11th Street, Kansas City, Missouri 64105, and oral requests may be made by calling the DST Corporate Secretary's Office at (816) 435-8655. An individual may read and copy any materials the Company files with the SEC at the SEC's Public Reference Room at 100 F Street, N.E. Washington, D.C. 20549. The public may obtain information on the operation of the Public Reference Room by calling the SEC at 1-800-SEC-0330. The SEC maintains an internet site (http://www.sec.gov) that contains reports, proxy and information statements, and other information regarding issuers that file electronically with the SEC.
3
NARRATIVE DESCRIPTION OF BUSINESS
The Company's business units offer sophisticated information processing and software services and products. These business units are reported as two operating segments, Financial Services and Output Solutions. In addition, investments in the Company's real estate subsidiaries and affiliates, equity securities, private equity funds and certain financial interests have been aggregated into the Investments and Other Segment.
A summary of each of the Company's segments follows:
Financial Services
The Company's Financial Services Segment provides sophisticated information processing and computer software services and products using proprietary software systems primarily to mutual funds, investment managers, insurance companies, healthcare providers, banks, brokers, financial planners, healthcare payers, real estate partnerships, third party administrators and medical practice groups. The Company's proprietary software systems include mutual fund shareowner, subaccount and unit trust recordkeeping systems for U.S. and international mutual fund companies; a defined-contribution participant recordkeeping system for the U.S. retirement plan market; investment management systems offered to U.S. and international investment managers and fund accountants; a business process management and customer contact system offered to mutual funds, insurance companies, brokerage firms, banks, healthcare payers, healthcare providers, cable television operators and mortgage servicing organizations; healthcare claims administration processing systems and services offered to providers of healthcare plans, third party administrators and medical practice groups; pharmacy claims processing systems offered to healthcare plans, insurance companies, third party administrators and pharmacy benefit managers; and an electronic file system offered to mutual fund companies, insurance companies and professional service (legal, accounting and others) firms.
As described in Part II, Item 7 "Significant Events" the following changes have occurred in the composition of the Financial Services Segment during the three years ended December 31, 2009:
Acquisitions
- •
- On March 31, 2009, DST purchased the remaining 50% equity interest of Argus Health Systems, Inc. ("Argus")
for $57.0 million in cash. As a result, Argus is no longer an unconsolidated affiliate of DST, but rather is a wholly owned subsidiary resulting in DST consolidating the results of Argus after
March 31, 2009.
- •
- BlueDoor Technologies Pty Ltd ("BlueDoor") was acquired by DST Systems, Inc. on November 14, 2008 for
an aggregate amount of $13.4 million consisting of approximately $10.3 million of cash and 85,006 shares of DST common stock at an approximate value of $3.1 million.
- •
- TASS, LLC was acquired by DST Systems, Inc. on July 31, 2007 and Mosiki, LLC was acquired by DST Global Solutions North America, Inc. on August 9, 2007, for an aggregate amount of $14.9 million.
Argus is principally engaged in the business of providing pharmacy claims processing and other related services to help clients manage pharmacy benefit programs. The Company believes that the acquisition of Argus complements its existing DST Health Solutions business, expands the size of its healthcare processing capabilities and will enable the Company to provide broader product offerings to new and existing customers.
4
BlueDoor, based in Melbourne, Australia, provides software solutions to retirement fund management companies that perform participant accounting and funds management services for the retirement savings ("superannuation") markets in Australia.
TASS, LLC is a full service mutual fund shareowner subaccounting services provider and markets its services to broker/dealers. Mosiki, LLC is a professional consulting services and solutions provider.
Dispositions
- •
- The majority of DST's interest in Asurion Corporation (equity method investment) was sold on July 3, 2007 for $986.3 million of cash and approximately $39.2 million of receivables which were collected in June 2008.
The Financial Services Segment distributes its services and products on a direct basis and through subsidiaries and joint venture affiliates in the U.S., United Kingdom ("U.K."), Canada, Europe, Australia, South Africa, Asia-Pacific and the Middle East and, to a lesser degree, distributes such services and products through various strategic alliances.
Output Solutions
The Company's Output Solutions Segment provides single source, integrated print and electronic statement and billing output solutions. The Output Solutions Segment also provides customized statement and bill production, marketing and personalization services, postal optimization, and electronic presentment, payment and distribution solutions. These capabilities enable the Output Solutions Segment to provide services to industries that place a premium on customer communications that require high quality, accurate and timely statement and billing output processing.
The Output Solutions Segment conducts its operations from five operating facilities located throughout North America and the U.K. DST Output is among the largest users of continuous, high-speed, full-color inkjet printing systems and among the largest First-Class mailers in the United States.
The Output Solutions Segment's research and development efforts have resulted in two mail and postal processing initiatives, Smart Commingling and Intelligent Mail barcode, in compliance with United States Postal Services requirements. In addition, the Digital Press Technology ("DPT") high-speed color printing and inserting platform enables the Output Solutions Segment to produce high-speed transactional printing combined with dynamic color printing. DST Output believes DPT is a technologically-differentiated service offering that enables them to provide better and more efficient products and services to clients.
The Output Solutions Segment distributes its product directly to customers and through relationships in which its services are combined with or offered concurrently through providers of data processing services. The Output Solutions Segment's products are also distributed or bundled with product offerings to customers of the Financial Services Segment.
Investments and Other
The Investments and Other Segment is comprised of the Company's real estate subsidiaries and affiliates, investments in equity securities, private equity funds and other financial interests. The assets held by the Investments and Other Segment are primarily passive in nature. The Company owns and operates real estate mostly in the U.S. and U.K., which is held primarily for lease to the Company's other business segments. The Company is a partner in certain real estate joint ventures that lease office space to the Company, certain of its unconsolidated affiliates and unrelated third parties. The Company is a 50% partner in a limited purpose real estate joint venture formed to develop and lease approximately 1.1 million square feet of office space to the U.S. government. The Investments and Other Segment holds investments in available-for-sale equity securities with a market value of
5
approximately $851.9 million at December 31, 2009, including approximately 10.6 million shares of State Street Corporation ("State Street"), 22.3 million shares of Computershare Ltd. ("Computershare") and 1.9 million shares of Euronet Worldwide, Inc., with a market value of $460.7 million, $228.8 million and $41.4 million, respectively, based on closing exchange values at December 31, 2009.
Source of Revenue
The Company's sources of revenue are presented below. The sources listed may be served by more than one of the Company's business segments.
| |
Year Ended December 31, | |||||||||||||||||||
|---|---|---|---|---|---|---|---|---|---|---|---|---|---|---|---|---|---|---|---|---|
| |
2009 | 2008 | 2007 | |||||||||||||||||
| |
(dollars in millions) |
|||||||||||||||||||
U.S. operating revenues |
||||||||||||||||||||
Mutual fund / investment management |
$ | 766.8 | 48.1 | % | $ | 804.8 | 48.0 | % | $ | 775.3 | 45.7 | % | ||||||||
Healthcare related services(1) |
275.2 | 17.2 | % | 212.1 | 12.7 | % | 220.7 | 13.0 | % | |||||||||||
Telecommunications, video and utilities |
200.6 | 12.5 | % | 219.2 | 13.1 | % | 232.1 | 13.7 | % | |||||||||||
Other financial services |
98.4 | 6.2 | % | 128.6 | 7.7 | % | 123.9 | 7.3 | % | |||||||||||
Other |
82.2 | 5.2 | % | 94.5 | 5.6 | % | 96.6 | 5.7 | % | |||||||||||
Total U.S. operating revenues |
1,423.2 | 89.2 | % | 1,459.2 | 87.1 | % | 1,448.6 | 85.4 | % | |||||||||||
International operating revenues |
||||||||||||||||||||
Investment management and other financial services |
133.3 | 8.4 | % | 170.0 | 10.1 | % | 189.3 | 11.2 | % | |||||||||||
Telecommunications, video and utilities |
34.0 | 2.1 | % | 30.9 | 1.8 | % | 37.3 | 2.2 | % | |||||||||||
Other |
4.9 | 0.3 | % | 15.4 | 1.0 | % | 20.2 | 1.2 | % | |||||||||||
Total international operating revenues |
172.2 | 10.8 | % | 216.3 | 12.9 | % | 246.8 | 14.6 | % | |||||||||||
Total operating revenues |
1,595.4 | 100.0 | % | 1,675.5 | 100.0 | % | 1,695.4 | 100.0 | % | |||||||||||
Out-of-pocket reimbursements(2) |
622.5 | 609.9 | 607.1 | |||||||||||||||||
Total revenues |
$ | 2,217.9 | $ | 2,285.4 | $ | 2,302.5 | ||||||||||||||
- (1)
- Includes
operating revenues of Argus from the acquisition date of March 31, 2009.
- (2)
- Principally postage and telecommunication expenditures, which are reimbursed by the customer.
6
The Financial Services Segment is the largest operating segment of the Company, providing the following products and services: shareowner recordkeeping, broker subaccounting, retirement plan/participant recordkeeping, distribution support solutions, business process management, investment management software and services, healthcare administration processing solutions and services, pharmacy claims processing and electronic file storage services.
The following table provides key operating data for the Financial Services Segment:
| |
Year Ended December 31, | |||||||||||||
|---|---|---|---|---|---|---|---|---|---|---|---|---|---|---|
Financial Services Operating Data
|
2009 | 2008 | 2007 | |||||||||||
| |
(dollars in millions) |
|||||||||||||
Revenues |
||||||||||||||
U.S. operating revenues |
||||||||||||||
Mutual fund/investment management |
$ | 658.7 | $ | 688.3 | $ | 664.4 | ||||||||
Healthcare related services(1) |
254.0 | 190.8 | 202.3 | |||||||||||
Telecommunications, video and utilities |
7.1 | 10.5 | 6.3 | |||||||||||
Other financial services |
49.1 | 63.3 | 52.3 | |||||||||||
Other |
45.1 | 47.8 | 43.4 | |||||||||||
Telecommunications, video and utilities |
1,014.0 | 1,000.7 | 968.7 | |||||||||||
International operating revenues |
||||||||||||||
Investment management and other financial services |
96.5 | 131.7 | 157.6 | |||||||||||
Telecommunications, video and utilities |
4.6 | 4.4 | 5.0 | |||||||||||
Other |
0.1 | 5.9 | 3.3 | |||||||||||
|
101.2 | 142.0 | 165.9 | |||||||||||
Total operating revenues |
1,115.2 | 1,142.7 | 1,134.6 | |||||||||||
Out-of-pocket reimbursements(2) |
54.3 | 72.6 | 65.0 | |||||||||||
Total revenues |
$ | 1,169.5 | $ | 1,215.3 | $ | 1,199.6 | ||||||||
Mutual fund shareowner accounts processed (in millions) |
||||||||||||||
U.S. |
||||||||||||||
Registered accounts: |
||||||||||||||
Non tax-advantaged |
63.6 | 65.4 | 71.0 | |||||||||||
Tax-advantaged: |
||||||||||||||
IRA mutual fund accounts |
26.8 | 27.0 | 27.5 | |||||||||||
Other retirement accounts |
10.0 | 9.9 | 10.0 | |||||||||||
Section 529 and Educational IRAs |
9.5 | 8.9 | 8.7 | |||||||||||
|
46.3 | 45.8 | 46.2 | |||||||||||
Total registered accounts |
109.9 | 111.2 | 117.2 | |||||||||||
Subaccounts |
11.2 | 8.9 | 1.9 | |||||||||||
Total accounts serviced |
121.1 | 120.1 | 119.1 | |||||||||||
International |
||||||||||||||
United Kingdom(3) |
6.6 | 5.9 | 5.8 | |||||||||||
Canada(4) |
10.2 | 10.6 | 7.5 | |||||||||||
TRAC participants (millions) |
4.2 |
3.7 |
4.8 |
|||||||||||
Automated Work Distributor workstations (thousands) |
193.5 | 195.2 | 127.7 | |||||||||||
DST Health Solutions covered lives (millions) |
23.5 | 23.4 | 24.5 | |||||||||||
Pharmacy claims paid by Argus (millions) |
380.0 | 433.0 | 440.2 | |||||||||||
- (1)
- Includes
operating revenues of Argus from the acquisition date of March 31, 2009.
- (2)
- Principally
postage and telecommunication expenditures, which are reimbursed by the customer.
- (3)
- Processed
by International Financial Data Services (U.K.) Limited, an unconsolidated affiliate of the Company.
- (4)
- Processed by International Financial Data Services L.P., an unconsolidated affiliate of the Company comprised of businesses in Canada, Ireland and Luxembourg.
7
U.S. Investment Recordkeeping Solutions
DST's U.S. Investment Recordkeeping Solutions comprises the following four product offerings:
- •
- Shareowner Recordkeeping
- •
- Broker Subaccounting
- •
- Retirement Plan & Participant Recordkeeping
- •
- Distribution Support Solutions
Shareowner Recordkeeping
The shareowner recordkeeping systems and services support open and closed-end mutual funds, Real Estate Investment Trusts ("REITs"), and various forms of tax advantaged savings vehicles. Included in tax-advantaged accounts are Individual Retirement Accounts ("IRAs"), and Educational Savings Plan Accounts, which encompass both Coverdell and Section 529 college savings plan accounts.
Most of the Company's clients who utilize the shareowner recordkeeping platform are "open-end" mutual fund companies, which obtain funds for investment by making a continuous offering of their shares. The proprietary system application for shareowner recordkeeping is TA2000. TA2000 performs functions including processing purchases, redemptions, exchanges and transfers of shares; maintaining shareowner identification and share ownership records; reconciling cash and share activity; calculating and disbursing commissions to brokers and other distributors; processing dividends; reporting sales; and providing information for printing of shareowner trade confirmations, statements and year-end tax forms. The system processes multiple classes of equity, fixed income and money market funds.
Shareowner recordkeeping services are offered on a full, remote and shared service basis. Selection by a client of the type of service is influenced by a number of factors, including cost and level of desired control over interaction with fund shareowners or distributors. "Full" service processing or "BPO" (Business Process Outsourcing) includes all necessary administrative and clerical support to process and maintain shareowner records, reconciling cash and share activity, answering inquiries from shareowners, brokers and others, and handling the TA2000 processing functions described above. In addition, full service mutual fund transfer agency clients may elect to have their end of day available client bank balances invested overnight by and in the name of the Company into credit-quality money market funds. "Remote" service processing, or "ASP" (Application Service Provider), is designed to enable mutual fund companies acting as their own transfer agent, and third party transfer agents that have their own administrative and clerical staff access to TA2000 at the Company's data processing facilities, using the Company's telecommunications network. "Shared" service processing enables clients to select the administrative functions to be handled by both client personnel and the Company. This service is facilitated by the implementation of "AWD" (Automated Work Distributor), which creates electronic images of transactions and makes such images, together with the status of the related transactions, available to the personnel processing the transaction and/or handling the inquiries in separate geographic locations.
The Company derives revenues from its shareowner recordkeeping services through use of the Company's proprietary software systems to provide such services, clerical processing services and other related products. Fees are generally charged based on a per account and number of funds basis for system processing services and on a per account, number of funds and transaction basis for clerical services. In limited instances, the Company has asset based fee arrangements. The Company's policy is not to license TA2000. The Company also derives revenues from investment earnings related to cash balances maintained in the Company's full service, transfer agency bank accounts.
Investor attraction to a wide array of mutual fund investment products with increasingly specialized features has increased the number of mutual fund shareowner accounts, the volume of transactions and
8
the complexity of recordkeeping. In addition, new technologies have changed the service requirements and distribution channels of the mutual fund market. The Company has made significant investments in computer capacities and systems functionality to handle the increasing marketplace demands in order to maintain its market position and to improve quality and productivity. A majority of the shareowner accounts serviced by the Company are at organizations that have been clients of the Company for more than five years.
Accounts serviced under shareowner recordkeeping arrangements with the fund sponsor (mutual fund company) are referred to as "registered accounts." This distinguishes these accounts from broker subaccounts, which are serviced under contract with a broker/dealer. Registered accounts include both tax-advantaged and non tax-advantaged accounts on the books of the transfer agent.
At December 31, 2009, the Company provided shareowner recordkeeping services for approximately 121.1 million shareowner accounts (registered and subaccounts), an increase of 1.0 million accounts or 0.8% since December 31, 2008. Registered accounts (both tax advantaged and non tax advantaged accounts) serviced were 109.9 million at December 31, 2009, a decrease of 1.3 million or 1.2% as compared to December 31, 2008.
At December 31, 2009, a subset of the registered accounts (46.3 million) were tax advantaged. DST serviced 26.8 million IRAs invested in mutual funds and 10.0 million accounts in an assortment of retirement accounts (SAR-SEP, Keogh and SIMPLEs). In addition, DST supported 9.5 million educational savings accounts, of which 8.7 million are Section 529 plan accounts.
Broker Subaccounting
The Company provides mutual fund shareowner recordkeeping services to brokerage firms who perform subaccounting for mutual fund accounts that have been sold by the broker/dealer's financial advisors. The Company offers subaccounting services to broker/dealers on both a remote (ASP) and full service (BPO) basis. A broker/dealer providing subaccounting services may provide these services to multiple fund companies. In 2002, the Company enhanced TA2000 to meet the complex reconciliation and system interfaces required by broker/dealers. The Company believes using the same core processing functionality for both transfer agency shareowner recordkeeping (registered accounts) and subaccounting should further the clients' objectives of consistent accounting for shareowner positions, since the recordkeeping is done by one system—TA2000.
On July 31, 2007, DST acquired TASS. TASS provides subaccounting services on a full service basis to the broker/dealer industry. TASS uses the TA2000 subaccounting platform ("TA2000 Subaccounting") to perform these services for its customers. The acquisition of TASS has expanded DST's presence in the subaccounting marketplace.
Revenues for subaccounting services are generally based on the number of subaccounts serviced, and, because of the level of services provided directly by the broker/dealer, fewer of TA2000's features are required. This results in per account revenue for subaccounts being less than what the Company derives from its mutual fund shareowner processing services for registered accounts.
Subaccounts serviced by the Company were 11.2 million at December 31, 2009, an increase of 2.3 million from December 31, 2008.
Retirement Plan & Participant Recordkeeping
The Company's TRAC system provides participant recordkeeping and administration for defined contribution plans, including 401(k), 403(b), 457, money purchase and profit sharing plans that invest in mutual funds, company stock, guaranteed investment contracts, annuities and other investment products. The Company offers TRAC on a full-service (BPO) and remote (ASP) basis. The Company believes the defined contribution market is a significant growth opportunity for its services and products
9
because (i) that market continues to experience significant expansion as more employers shift away from defined benefit programs, (ii) the government and the retirement industry have a strong desire to expand coverage to include the 78 million Americans not participating in a retirement savings program today, and (iii) potential participation is likely to increase as retirement plan sponsors adopt auto enrollment and guaranteed income features for new employees.
In October 2008, DST announced the formation of DST Retirement Solutions LLC ("DSTRS"), a wholly-owned subsidiary of DST, to help meet the needs of defined contribution service providers. The new entity combines the Company's TRAC technology solution with Boston Financial Data Services, Inc.'s ("BFDS") defined contribution full service plan administration and recordkeeping unit. From application service provider ("ASP") to business process outsourcing ("BPO"), DSTRS offers a variety of selective outsourcing options, including front- and back-office technology solutions for financial service organizations offering retirement plan recordkeeping for plans of any size. As of December 31, 2009, DSTRS serviced a total of 4.2 million plan participants on the TRAC platform. Revenues from these services are primarily based on the number of participants in the defined contribution plans.
Distribution Support Solutions
The Company offers products designed to assist clients in meeting the expanding needs associated with distributing U.S. investment products through financial intermediaries. The array of solutions supporting distribution of investment products is expanding to address regulatory, service and information needs of the financial service industry.
DST Vision
DST Vision is an aggregating Web site designed exclusively for financial advisors and broker/dealer back-office operations. The site enables mutual fund companies, Real Estate Investment Trusts, and variable annuity companies to reduce operational expense by replacing costly support phone calls from intermediaries with Web-based self-servicing. Providing over 120,000 financial advisors access to more than 300 participating investment product manufacturers, Vision is an industry leading source of customer information. Having access to consolidated account information across all of an investor's product relationships provides significant customer support efficiencies to the financial intermediaries' operations. Advisors can also utilize portfolio management tools, access electronic shareholder statements and initiate transaction processing. All Vision charges are paid by the product companies through a combination of ID charges and activity related fees. Beginning in 2010, the Company intends to provide additional services to advisors affiliated with independent broker/dealers. Through a new offering called Vision Professional, advisors will have access to presentation ready, automated and consolidated quarter-end shareholder reporting with supplemental product and holdings analytics. The fees will be paid by the advisors under a subscription service.
FAN Mail
FAN Mail (Financial Advisor Network) is a centralized data delivery source for investor account detail from mutual fund, variable annuity, and Real Estate Investment Trusts companies. FAN Mail provides advisors and broker/dealer back-offices the transactional and position information necessary to populate proprietary data bases and software applications. Daily automated downloads streamline back-office administrative tasks, reporting, and compliance oversight. FAN Mail is compatible with the industries' most popular portfolio management and compliance software applications. With participation from more than 180 product manufacturers, FAN Mail is one of the industries' most comprehensive sources of investor account detail and transactional information. All FAN Mail charges are paid by the product companies based on the volume of account and transaction records delivered to the underlying intermediary.
10
While Vision and FAN Mail largely service the same audience, there are distinct reasons an intermediary would use one or both products. Vision, as a web site, is designed to provide a real-time view of the underlying recordkeeping detail and is frequently used to resolve operations based servicing issues. FAN Mail is used by intermediaries that need to take possession of the data to source proprietary software applications. Consequently, almost all FAN Mail users also use Vision.
Omnibus Transparency
Omnibus Transparency offers a solution that provides mutual fund companies the ability to request and receive supplemental trade data from intermediaries for compliance with Rule 22c-2 of the Investment Company Act of 1940. Clients use these tools to perform their oversight obligations relative to accounts not held on the Funds' recordkeeping platform. Features include data storage structure, and analytics/reporting for market timing and best pricing of trades. Revenues from Omnibus Transparency are based generally on the number of transactions, positions, or account inquiries processed.
SalesConnect
SalesConnect assists fund companies with identifying and servicing the financial intermediaries that distribute the client's investment products. SalesConnect combines sales reporting and client relationship management software with a trade resolution and data management service. The data management service leverages a continuously updated universal database to provide clients with timely branch and representative updates and reconciled trading activity for use within their transfer agent and distributor organizations. Revenues from SalesConnect are based generally on the number of transactions, positions, or account inquiries processed.
Boston Financial Data Services, Inc. ("BFDS")
BFDS, a 50% owned joint venture with State Street, is an important distribution channel for the Company's services and products. BFDS combines use of the Company's proprietary applications and output solutions capabilities with the marketing capabilities and custodial services of State Street to provide full-service and shared-service shareowner recordkeeping to approximately 114 U.S. mutual fund companies. BFDS also offers settlement administration services, full service proxy solutions, teleservicing and full-service support for defined contribution plans using the Company's TRAC system, and provides REIT participant accounting services. BFDS's revenues are primarily derived on a per account, number of fund and transaction basis. BFDS also derives revenues from maintaining and managing, as agent for its clients, such bank accounts as necessary for the performance of its services.
BFDS is the Financial Services Segment's largest customer, accounting for approximately 11.4% of the Segment's operating revenues in 2009, and 9.7% of the Company's total operating revenues in 2009.
International Mutual Fund / Unit Trust Shareowner Processing
The Company provides international shareholder processing through joint venture companies of the Company and State Street, which are as follows:
International Financial Data Services, U.K. ("IFDS U.K.")
IFDS U.K. offers full, remote and shared service processing for Open Ended Investment Companies ("OEIC") unit trusts and related products serving 6.6 million OEIC unit holdings at December 31, 2009. It is the largest third party provider of such services in the U.K. IFDS U.K. has developed FAST, an OEIC and unit trust recordkeeping system. The largest remote client of IFDS U.K., representing approximately 1.9 million or 28.8% of the total unitholder accounts at December 31, 2009, is Cofunds, Ltd. ("Cofunds"), a mutual fund supermarket. Cofunds, which is the U.K.'s largest independent investment platform has approximately $36.7 billion of assets under administration at
11
December 31, 2009. IFDS U.K. and one of its affiliates also own equity investments in Cofunds, which in the aggregate are non-controlling interests.
IFDS U.K. derives revenues from its shareowner accounting services through use of its proprietary software systems, clerical processing services and other related products. Fees are generally charged on a per unitholder account and per transaction basis although certain revenue is also derived from fixed fees and, in part, by the level of funds under management of certain client companies.
International Financial Data Services, L.P. ("IFDS L.P.")
IFDS, L.P. is a U.S. partnership with State Street that wholly owns the following operating joint ventures:
International Financial Data Services, Canada ("IFDS Canada")
IFDS Canada has developed iFAST, a proprietary mutual fund recordkeeping system. IFDS Canada provides full, remote and shared service processing to the Canadian mutual fund industry using iFAST and full-service and remote-service processing for U.S. offshore mutual funds using TA2000 and iFAST. Revenues are derived from providing remote, shared and full service mutual fund shareowner processing services based upon the number of shareowner accounts and transactions. IFDS Canada also receives time and material fees based upon the number of billable hours for client-specific enhancements and support to remote processing.
International Financial Data Services, Ireland ("IFDS Ireland")
IFDS Ireland provides transfer agency services to State Street Ireland under an outsourcing agreement. Client servicing activities are focused on supporting State Street's services to fund promoters and investment managers who provide offshore funds. Revenues are derived from an agreement with State Street which encompasses a combination of fixed monthly fees and per transaction fees. IFDS Ireland purchased an approximate 46.6% interest in Percana Group Limited ("Percana") in September 2008. Percana is a software development company that provides policy holder servicing systems to the international life assurance industry. In addition, Percana provides consultancy and outsourcing services to its clients.
International Financial Data Services, Luxembourg ("IFDS Luxembourg")
IFDS Luxembourg provides transfer agency services to State Street Luxembourg under an outsourcing agreement. Client servicing activities are focused on supporting State Street's services to fund promoters and investment managers in the Luxembourg and Continental European market. Revenues are derived from an agreement with State Street which encompasses a combination of fixed monthly fees and per transaction fees.
Business Process Management through AWD
AWD is an enterprise-scale software system that enables companies to improve operating efficiency and customer satisfaction. AWD supports the capture of all inbound work at the point of contact (mail, telephone calls, Internet, e-mail, faxes, etc.). It then manages the work steps required to complete the request. The system assigns work, based on priority, to the resource most qualified to complete the current work step. AWD's sealed audit trail tracks all activities associated with completing each item of work, providing a valuable tool for ensuring compliance with internal and external regulations. By enforcing standard business processes regardless of the origin of the request, the system ensures every AWD user within a customer organization is consistently working on the most important item that he or she has the training and experience to complete.
12
AWD's automation components allow customers to streamline tasks in which human interaction is not required, resulting in increased productivity. In addition, AWD's orchestration components allow customers to seamlessly link business processes that cross multiple application systems. AWD also enables customers with multiple service centers to seamlessly move work between locations, minimizing geography as a barrier to productivity gains. The AWD platform also includes imaging and content management, business intelligence and monitoring, a contact center desktop with proactive call scripting, intelligent character and word recognition capabilities and correspondence tools.
Initially introduced to enhance the Company's mutual fund shareowner recordkeeping system, AWD was designed to interface with a wide range of high volume application processing systems. AWD's services oriented architecture ("SOA") operates on Linux, Sun Solaris, Microsoft and IBM platforms utilizing Windows and browser-based desktops. The Company's best practice templates allow customers to implement the solution quickly, providing the opportunity for a rapid return on investment. The Company's integration toolkit, catalog of adapters and support for J2EE application servers allow AWD to easily interface with customers' existing application systems and operating environments. Classified as a "business process management" (BPM) solution by technology industry analysts, AWD is a mission-critical application implemented in many different industries including mutual funds, life insurance, variable annuities, healthcare providers and payers, property and casualty insurance, banking, mortgage, brokerage and video/broadband/telephony. AWD customers are located in over twenty countries including the U.S., Canada, the U.K., continental Europe, Australia, South Africa, India, China, Taiwan and Japan.
The Company's value proposition combines the AWD system with hosting services and business process outsourcing for AWD clients. The Company also offers hosting services of the licensed AWD software in the Company's AWD Data Center, which is fully redundant with the Company's primary data center—the Winchester Data Center.
The Company derives AWD revenues from multi-year service and usage agreements based on the number of users accessing the software and fixed fee license agreements that may include provisions for additional license payments in the event that usage increases. The Company also derives AWD revenues from fees for implementation services, custom programming, annual software maintenance and AWD Data Center operations.
The Company has developed a new service offering to assist clients with their record management needs. The Company's Electronic File Solution ("EFS") provides a reliable and secure electronic system for long-term records management. EFS allows for the scanning, indexing, storage and retrieval of important documents according to each client's unique business requirements. Industries that may use this solution include mutual funds, healthcare, law, banking, insurance, mortgage, staffing firms and third party administrators. EFS also provides archival, audit and oversight features. Client selected records are electronically stored in the Company's redundant data centers, with the Company providing hardware, maintenance and support for the EFS. The Company expects to recognize revenue from the EFS product launch in 2010. The Company plans to market EFS as a software as a service and anticipates recognizing revenues for data conversion projects and a monthly rental charge for data storage used.
Investment Management Solutions & Services
DST Global Solutions Group Services Limited ("DST Global Solutions" and formerly DST International), a wholly owned U.K. company, provides software applications, implementation and other professional services. It has offices in the U.K., U.S., Australia, Canada, China, Dubai, Hong Kong, New Zealand, Singapore, South Africa, Switzerland and Thailand. Its development centers are presently in the U.K. and Australia.
13
On November 14, 2008, the Company acquired BlueDoor, a private company based in Melbourne, Australia, that provides software solutions to retirement fund management companies that perform participant accounting and funds management services for the retirement savings ("superannuation") markets in Australia.
On August 9, 2007, DST Global Solutions North America, Inc. acquired Mosiki which provides professional consulting services and solutions to investment management software customers.
Investment Management Solutions ("IMS")
DST Global Solutions' investment management solutions service clients in two primary markets:
- •
- Asset managers covering a wide range of traditional investment strategies for registered funds, insurance funds, manager
of managers and separately managed accounts, and;
- •
- Third-party administrators serving the above asset managers.
The core of these solutions are middle and back office software applications and services:
- •
- Back office is based on asset servicing and portfolio accounting applications sold as software applications
- •
- Middle office applications include: performance measurement and attribution analysis, risk analytics for post-trade, data management and integration technology on the front end of these applications and finally institutional client reporting toolkit. Middle office applications are offered both on an ASP and for license sale basis.
The Company believes that DST Global Solutions' offerings are uniquely positioned because it has extensive penetration in both of these segments. The connectivity required between these segments is essential for these firms to reduce both operational risks and operating costs.
DST Global Solutions has continued its commitment to investment in a program to expand into middle office applications, with an emphasis on support for alternative investments such as OTC derivatives. Its background in business process management and workflow applications are expected to provide a unique solution set compared to both traditional competitors as well as new entrants.
DST Global Solutions also offers solutions in the distribution of investment products in select markets. The Company has a long-time offering for transfer agency that is used in seven developing market countries. As a result of the BlueDoor acquisition, it is competing extensively in participant services for superannuation funds in Australia. DST Global Solutions is looking to extend this offering into other countries with similar pension fund market structures.
Business Process Solutions
DST Global Solutions distributes, implements and services the Company's AWD product outside of North America. The clients are primarily in retail banking and insurance. DST Global Solutions also provides implementation and business process management consulting services to these clients. The application has been implemented in a variety of functions, including insurance policy administration, claims processing, mortgages and call center support.
The Company believes that it is uniquely positioned because of its expertise in this area, accumulated from years of developing these capabilities for ourselves and others in the U.S. marketplace. It also believes that it can achieve significant synergies by integrating these applications with its Distribution and Investment Management solutions.
While competition has increased, interest in and demand for these kinds of products and services has been consistent or growing.
14
The Company derives revenues from the above solutions and services, from license fees, fees for customized installation and programming services and annual maintenance fees, which include ASP solutions.
Healthcare Administration Solutions
The Company has two businesses focused on providing solutions to meet the information processing needs of healthcare organizations. DST Health Solutions, LLC ("DSTHS") was created by combining the Health Plan Solutions business, acquired from Computer Sciences Corporation in April 2006, with Amisys Synertech, Inc., which DST acquired in October 2007. DSTHS provides proprietary software and processing services to the healthcare payer industry. Service offerings of DSTHS include claims and data processing solutions and software and support. DST acquired the remaining 50% equity interest in Argus on March 31, 2009. Argus is principally engaged in the business of providing pharmacy claims processing and other related services to help clients manage pharmacy benefit programs.
DST Health Solutions
DSTHS provides enterprise software solutions, ASP and BPO services for the U.S. healthcare industry. DSTHS' integrated solutions provide systems and services that support health plan business and strategic operations including claims processing, member and provider management, benefit plan management, new product development, care management and medical management, and decision support/analytics for nearly 200 clients representing 23.5 million covered lives. DSTHS supports diverse lines of business to national health plans including: HMO, PPO, POS, CDH, dental, vision, behavioral health and government-sponsored initiatives (Medicare Advantage, Medicare Part D and Medicaid).
DST Health Solutions is positioned to respond to the continued consolidation of companies in the health plan industry by offering a single-delivery model for all transaction processing. As health plans consolidate it becomes increasingly difficult for them to merge non-complimentary infrastructures such as current systems, data centers and business processes to achieve post acquisition operational and cost efficiency. By outsourcing non-core services to DSTHS, health plans help streamline integration and maintain focus on their core customer-facing initiatives.
Business intelligence methodologies and analytic tools are necessary for health plans to access information that is crucial to helping consumers make better health decisions. DSTHS combines elements of care opportunities along with risk and provider efficiency to provide more complete member assessment based on analytic solutions that drive care management decisions for payers, providers and members.
As new health plans emerge in the government healthcare arena, DSTHS helps support rapid market entry with end-to-end administration solutions. Its government administration solution is designed to provide value to existing government healthcare providers by offering Centers for Medicare & Medicaid Services ("CMS") compliant packaged enrollment services, Special Needs Plan ("SNP") growth opportunities through packaged Medicare Advantage and Private Fee for Service solutions, expansion of CMS compliance through stand alone Risk Adjustment Payment System ("RAPS") management services and identification of high risk claims providing financial risk management.
Speed-to-market is critical for evolving lines of business and the risk of diverting valuable resources creates additional challenges. DSTHS' outsourcing solutions are designed to help health plan organizations prevent the negative impact of expansion and help achieve economies of scale and mitigate risk in their new lines of business such as CDH, Medicare Advantage, Medicare Part D and Medicaid.
DSTHS derives revenues by using its proprietary software systems to provide services on a BPO, ASP and turnkey (license) basis. Fees are generally charged based on a per member/ per month ("PMPM")
15
basis and transactional basis for BPO services. DSTHS also receives PMPM revenues from ASP agreements, which are multi-year service and usage agreements that allow users to access the DSTHS proprietary software hosted in DST data centers. DSTHS realizes revenue from fixed-fee license agreements that include provisions for ongoing support and maintenance and for additional license payments in the event that usage or members increase. DSTHS also derives professional service revenues from fees for implementation services, custom programming and data center operations.
In the healthcare payer market, DSTHS has increased its investment in platform-independent, service-oriented component applications that are designed to enable clients to accelerate customer acquisition and deliver new, profitable products to market rapidly and cost-effectively. It facilitates the administration of consumer-directed healthcare, improves enterprise workflow and enhances health payer revenue cycles. All these areas can be deployed as part of a core replacement project including DSTHS' core administration engines; PowerMHC, PowerMHS, PowerSTEPP and AMISYS Advance, or as stand-alone component solutions that extend a health plans' existing core systems.
Health Plan Solutions
DSTHS supports health plan clients with diverse lines of business including: indemnity, HMO, PPO, POS, CDH, dental, vision, behavioral health and government-sponsored initiatives (Medicaid, Medicare Advantage and Part D).
Health Plan Business Process Outsourcing ("BPO") Solutions
DSTHS provides claims administration BPO services that include mail receipt and processing, imaging/OCR (optical character recognition)/data capture, eligibility and enrollment management, benefit plan management, claims processing, overflow, fulfillment, utilization management, case management and customer service, delivered as discrete, a la carte services or as a comprehensive administrative solution.
DSTHS' outsourcing solutions focus on the following areas:
- •
- Care Management
- •
- Consumer-Directed Healthcare
- •
- Government Solutions
- •
- Health Plan Analytics and Decision Support
- •
- Business Process Management
Care Management
DSTHS' care management, medical utilization management and case management solutions aid health plans in controlling medical costs, delivering quality care and automating paperwork associated with these processes. Additionally, by centralizing member information that represents the sum of the member's healthcare experiences via integrated care, utilization, case and disease management, the health plan facilitates the coordination of care provided which improves both the continuity and quality of care and lowers the costs of delivered care.
Consumer-Directed Healthcare ("CDH")
DSTHS' CDH solutions allow individuals to manage healthcare costs by bringing critical financial and healthcare transactions and information together into a single, integrated platform. Through the DSTHS' array of FSA, HSA and HRA administrative services, health plans are able to establish operational efficiency while mitigating risk and expense.
16
Government Solutions
DSTHS' portfolio of government solutions support the administrative requirements for processing government health plan member populations, including Medicare Advantage, Medicare Part D, Medicaid and other assistance programs. Segmenting the Medicare Advantage, Medicare Part D and Medicaid line of business offers predictable costs while positioning health plans to proactively address the needs of members and the ever-changing demands of market and government regulations. DSTHS' government solution portfolio includes sales and marketing, eligibility and CMS payment/revenue reconciliation and Hierarchical Condition Categories (HCC) analytics.
Health Plan Analytics and Decision Support
DSTHS' analytics and decision support solutions help health plans select members who will benefit most from care management. The unique analytic approach combines elements of care opportunities, risk and provider effectiveness to provide a more complete member assessment within a single integrated tool. By combining predictive modeling, Healthcare Effectiveness Data and Information Set, or HEDIS, and Pay for Performance, health plans are provided a common classification for quality managers, finance/actuarial, underwriting and sales/marketing. DSTHS' solutions were designed to engage multiple participants in managing healthcare quality and resources: the case manager, employer, provider and member.
DSTHS is the exclusive distributor of a patient classification system developed by Johns Hopkins University, Johns Hopkins' ACG System. Johns Hopkins' Adjusted Clinical Groups ("ACG") System is a software tool for provider profiling, predictive modeling, resource management and reimbursement rate adjustment. The ACG System markers identify individual patient risk for the evaluation and forecasting of healthcare utilization and costs.
Business Process Management ("BPM")
Using AWD, DSTHS' BPO Centers of Excellence achieve greater efficiency, functionality and scalability. The integration with AWD also offers health plan clients real-time operational efficiency for core administration systems through automation and continuous process improvement, providing higher quality and reducing manual touch points. BPM functionality includes support for claims routing, quality audits, customer service, correspondence processing and imaging.
Physician Practice Management and Billing Solutions
Designed to enhance physician practice profitability, DSTHS' suite of applications and reporting tools work in tandem with provider office staff to provide operational control and enhance decision-making capabilities. DSTHS' solutions for physician practices provide revenue cycle management, from scheduling to reimbursement. The flexible business process outsourcing (BPO) or application services provider (ASP) solutions assist in optimizing reimbursement, reducing claims denials and forecasting operational costs.
DSTHS supports practice groups of any size and specialty, including physician networks, hospital-based physicians, hospital emergency departments and management services organizations (MSOs).
Argus Health Systems, Inc. ("Argus")
Argus Health Systems, Inc. is a leading independent provider of health care information management services supporting commercial, Medicaid and Medicare Part D. Argus serves a wide range of clients and key health care organizations including managed care organizations, pharmacy benefit managers and pharmaceutical manufacturers. Argus became a wholly-owned, consolidated subsidiary of DST on
17
March 31, 2009 when DST purchased the remaining 50% equity interest in Argus. Prior to March 31, 2009, Argus was an unconsolidated affiliate of DST and was accounted for as an equity investment.
Argus has grown to become one of the largest pharmacy claims processors in the industry. In 2009, Argus processed more than 500 million claims, including 20% of Medicare Part D claims nationwide.
Argus provides claims processing, information services and administrative support to help clients manage pharmacy benefit programs, including Medicare Part D. These services include pharmacy and member reimbursements, call center, pharmacy network management, clinical information services, rebate contracting and rebate processing. Argus' business model provides full disclosure and is transparent and auditable.
Argus' proprietary claims processing system, the Integrated Pharmacy Network System ("IPNS"), is an interactive, database managed processing system for administration of prescription drug claims, pharmacy and member reimbursement and drug utilization review. IPNS, which provides substantial flexibility to accommodate varying provider requirements, allows point-of-sale monitoring and control of pharmacy plan benefits with on-line benefit authorization and can provide information to dispensing pharmacists that helps ascertain potential medication problems arising from such factors as duplicate prescriptions, incorrect dosage and drug interactions.
Argus operates IPNS at the Company's Winchester and AWD Data Centers. Argus' primary clients are providers of pharmacy benefit plans including insurance companies, health maintenance organizations, preferred provider organizations, other pharmacy benefit managers, pharmaceutical manufacturers and distributors.
Argus derives revenue from pharmacy claims processing services provided to managed care organizations, pharmacy benefit managers and pharmaceutical manufacturers. Argus also derives revenue from the management of pharmacy networks, call center services, pharmaceutical rebate contracting and administration, and clinical programs and management reporting for the benefit of their customers, as well as investment earnings related to client cash balances maintained in the Company's bank accounts.
Vermont Western Assurance, Inc. ("Vermont Western"), a single parent captive insurance company domiciled in Vermont, is engaged in a variety of insurance programs.
Vermont Western provides insurance to the Company and its affiliates under deductible reimbursement insurance programs for certain workers' compensation and group health programs. The Company and its affiliates obtain property insurance from a commercial insurance company and Vermont Western reinsures the commercial insurer for a layer of coverage in excess of the Company's deductible. Premiums paid by the Company and its affiliates to Vermont Western are generally consistent and competitive with industry pricing practices.
Vermont Western also writes reinsurance coverages for surety programs that are provided in association with the corporate securities processing services of Computershare Ltd. Computershare assists shareholders of corporate securities to obtain lost instrument surety bond coverage when the shareholders want to replace certificates for shares they own that have been lost, stolen or destroyed. Bonds may also be issued in-lieu of probate. Typically, the surety coverage is provided by a commercial surety company under an arrangement with Computershare and then Vermont Western assumes a substantial amount of the surety exposure through a reinsurance arrangement with that surety company. Vermont Western revenues for the lost instrument surety bond coverage come in the form of reinsurance premiums paid to it by the commercial surety companies that are the primary providers of the coverage. Lost instrument surety bond coverage premium is typically paid by the shareholders who are seeking the replacement of the lost, stolen or destroyed certificates. Premiums are consistent and
18
competitive with industry pricing practices. Vermont Western has an agreement to continue providing lost instrument surety bond coverage to Computershare through 2017.
Information Processing Facilities and Services
The data processing needs of the Company's Financial Services Segment and certain products of the Output Solutions Segment are provided by two data centers in Kansas City, Missouri, and a Recovery Data Center in St. Louis, Missouri.
The Winchester Data Center ("Winchester") is the Company's primary central computer operations and data processing facility. Winchester has a total of 163,000 square feet, of which 76,000 square feet is raised floor computer room space. Winchester runs mainframe computers with a combined processing capacity of more than 32,000 million instructions per second ("MIPS") and direct access storage devices with an aggregate storage capacity that exceeds 270 trillion bytes. Winchester also contains more than 1,000 servers with over 600 trillion bytes of storage capacity supporting Windows, UNIX and iSeries small and midrange computing environments. These servers are used to support the Company's products and processing for certain of the Company's affiliates. The physical facility is seismically braced and designed to withstand tornado-force winds.
The AWD Data Center supports the Company's AWD Image processing services. The facility has a total of 13,000 square feet. The computer room houses IBM iSeries computers, disk-based storage systems, and optical storage systems (over 825 million images), which support more than 39,000 AWD users. In addition to the Company's full-service mutual fund operations, AWD users include clients in the healthcare, insurance and brokerage industries. The AWD Data Center also houses over 500 servers supporting various Company products and Winchester's remote tape storage using IBM's automated tape libraries. The Company derives revenues from its AWD Data Center based upon data center capacity utilized, which is significantly influenced by the volume of transactions and the number of users.
The Company's Recovery Data Center is essentially equivalent in size to the Winchester Data Center. It houses mainframe technology equivalent to Winchester, including mainframe computers that have the capacity to run over 30,000 MIPS and the capacity to store more than 580 trillion bytes of DASD (direct access storage devices). The Company's data communications network is linked to the Recovery Data Center to enable client access to the center. The iSeries processors at the AWD Data Center and the iSeries processors at Winchester provide contingency plan capabilities for each other's processing needs. The Company regularly tests disaster recovery processes.
All three data centers are staffed 24 hours a day, seven days a week and have self-contained power plants with mechanical and electrical systems designed to operate virtually without interruption in the event of commercial power loss. The data centers utilize redundant telecommunications networks serving the Company's clients. The networks, which serve hundreds of thousands of computer users, have redundant pathing and software, which is designed for rerouting of data transmission in the event of carrier circuit failure.
Prior to July 3, 2007, DST owned an approximate 37.4% ownership interest in Asurion Corporation, a global provider of enhanced services and specialty insurance products to the wireless industry. On July 3, 2007, the Board of Directors of Asurion consummated a transaction whereby certain private equity firms acquired a significant stake in Asurion. In connection with that transaction, DST received cash proceeds of $986.3 million and receivables of approximately $39.2 million that were collected in June 2008, and DST's equity interest in Asurion was reduced. Effective with the closing of the transaction, DST accounts for its investment in Asurion under the cost basis of accounting and no longer records equity in earnings of Asurion. At December 31, 2009, DST's net investment in Asurion was $3.1 million. The 2007 sale of Asurion resulted in DST recording a $998.0 million pretax gain during the year ended December 31, 2007.
19
The Financial Services Segment's five largest customers accounted for 30.4% of Segment operating revenues in 2009, including 11.4% from its largest customer.
In the U.S., U.K., Canada, Europe, Australia, South Africa, Asia-Pacific and the Middle East markets, the Company identifies potential users of its Financial Services Segment products and services and tailors its marketing programs to focus on their needs. The Segment's marketing efforts also include cross-selling the Company's wide range of products and services to its existing clients. The Financial Services Segment's sales efforts are closely coordinated with the Company's joint venture and strategic alliance partners.
Sources of new business for the Financial Services Segment include (i) existing clients, particularly with respect to complementary and new products and services; (ii) companies relying on their own in-house capabilities and not using outside vendors; (iii) companies using competitors' systems; and (iv) new entrants into the markets served by the Company. The Company considers its existing client base to be one of its best sources of new business.
The Company markets its U.S. Investment Recordkeeping Solutions' systems and related products and services to investment company sponsors, plan recordkeepers and financial intermediaries. The shareowner recordkeeping systems and services support open and closed-end mutual funds, REITs and various forms of tax advantaged savings vehicles. Generally, mutual fund products are promoted and distributed in fund groups, which provide investors with a variety of mutual fund investments and the ability to transfer investments from one fund to another within the group. This often means that a single service agent, such as the Company, is used for all funds in the group. Investor attraction to a wide array of mutual fund investment products (to address different investment objectives) with increasingly specialized features has increased the number of shareowner accounts, the volume of transactions and the complexity of recordkeeping. In addition, new technologies have changed the service requirements and distribution channels of the mutual fund market. The Company has made significant investments in computer capacities and systems functionality to handle the increasing marketplace demands in order to maintain its market position and to improve quality and productivity. The Company markets mutual fund shareowner recordkeeping services to brokerage firms who perform subaccounting for mutual fund accounts that have been sold by the broker/dealer's financial advisors. The Company markets its participant recordkeeping and plan administration services for defined contribution plans to investment company sponsors and plan recordkeepers. The Company markets its distribution support solutions to financial intermediaries.
The Company markets its AWD product directly to mutual fund and other investment management firms, life insurance companies, healthcare providers and payers, property and casualty insurance companies, banks, mortgage operations, brokerage firms and video/broadband/telephony operators. The Company maintains a sales and marketing staff, including professional services and technical support teams to target these markets. Computer Sciences Corporation ("CSC") distributes the Company's AWD product to life, property and casualty insurance companies worldwide. The Company markets its EFS product to mutual fund companies, insurance companies, professional service (legal, accounting and others) firms and other companies that have record management needs.
DST Global Solutions markets its solutions and services directly to its end clients, which are generally asset managers and third party administrators. Many of the applications require integration into the client's environment. This results in demand for implementation support, such as testing, training and process flow documentation. DST Global Solutions is continuing to improve its capabilities to provide these services to clients. This ability is considered to be a competitive advantage versus other competitors when servicing large global clients with dispersed operations and larger local clients in certain developing markets.
20
DST Health Solutions' business process outsourcing services and solutions are marketed to health insurance companies, health plans, benefits administrators, private physician practices and hospital-based physician groups. Argus markets its claims processing services to pharmacy benefit managers, managed care organizations, insurance companies, health maintenance organizations, preferred provider organizations, pharmaceutical manufacturers and distributors, and third party administrators.
The insurance programs provided by the Company are internal or are developed and offered as integral parts of other Financial Services Segment products and services. Therefore, there are no separate, external marketing or distribution activities for insurance programs.
The Company believes that competition in the markets in which the Financial Services Segment operates is based largely on price, quality of service, features offered, the ability to handle rapidly changing volumes, product innovation and responsiveness. The Company believes there is significant competition in its markets. The Company's ability to compete effectively is dependent in part on the availability of capital.
The Company's U.S. Investment Recordkeeping Solutions compete not only with third party providers but also with in-house systems. Financial institutions competing with the Company may have an advantage because they can take into consideration the value of their clients' funds on deposit or under management in pricing their services. The Company believes its most significant competitors for third party shareowner accounting systems and subaccounting systems are PNC Global Investment Servicing, Inc., a unit of PNC Bank which recently announced it would be acquired by Bank of New York Mellon Corp., and SunGard Data Systems, Inc. The Company believes its most significant competitors for retirement savings plan accounting and recordkeeping services are SunGard Data Systems, Inc., Ascensus and GreatWest. The Company believes its most significant competitor for REIT processing services is Phoenix American.
The Company's AWD products compete with BPMS vendors, other data processing and financial software vendors. Competitive factors include features and adaptability of the software, level and quality of customer support, software development expertise, and price. The Company believes that it can compete effectively in those markets the Company chooses to pursue. The Company believes its most significant AWD competitors are IBM, Lombardi, PegaSystems, Savvion, and TIBCO Software, Inc.
The Company's EFS product competes with providers of document storage solutions. The Company believes its most significant competitors are SourceCorp, Iron Mountain and Recall.
DST Global Solutions' competitors vary by market segment and solution set. The Company believes that its most significant competitors in investment and fund accounting solutions globally include SunGard Data Systems, Inc., Simcorp and IGEFI. In the middle office the competitors include RiskMetrics and Algorithmics in the risk analytics arena, and StatPro and Bisam in performance measurement. The Company expects that the mix of competitors will shift over time as the industry changes from more traditional investment strategies around equities and fixed income instruments to encompass alternative investment products. The primary competitors in distribution solutions include GBST, Bravura, and FNZ in markets such as Australia. The Company believes that it has a unique combination of capabilities against this array of competitors, because of its expertise in specific application areas such as large-scale accounting and record-keeping applications.
DST Health Solutions' competitors vary by the healthcare market segment. In the health plan insurance market, DSTHS competes with Trizetto (MyHealthBank), Perot Systems, ACS, EDS, TMG Health, Fiserv (Caregain) and ConnectYourCare. These competitors' solutions are primarily based on complete replacement of a payer's core system. DSTHS believes that a component application approach shifts
21
the focus away from core application replacement to one in which clients have more alternatives for modernization of the business operation. With a component approach, health payer clients can still choose core application replacement if warranted, or adopt component applications that address only those areas of the business that need to be improved, resulting in protection of the client's current IT investment and less overall disruption to its business operation. In the healthcare provider market, including physician networks, hospital-based physicians, hospital emergency departments, and management services organizations (MSOs), DSTHS competes with Misys, Cerner, GE Healthcare and McKesson. DSTHS believes there is a competitive advantage in providing physician practice management services that have been enhanced with AWD in an outsourcing model.
Argus' claims processing services compete with other third party providers. For certain product offerings, competitors include companies who perform their services in-house with licensed or internally developed systems and processes. A significant competitive factor is the level and quality of customer support provided. The Company believes that it competes effectively in the market by its ongoing investment in its products and the development of new products to meet the needs of managed care organizations, pharmacy benefit managers, pharmaceutical manufacturers and distributors, and third party administrators. Another competitive difference is Argus' business model provides a transparent drug pricing transaction between Argus customer and the pharmacy with no markup between the price paid by our customer and the negotiated charge from the pharmacy. Some competitors derive revenue through spread pricing whereby the drug cost charged to customers is higher than the negotiated rate with pharmacies. In addition, some competitors own mail order facilities which enables them to earn spread revenue on the drug transaction and may result in conflicts in objectives of the servicer to drive members to mail order vs. objectives of the customer to offer more competitive rates for other alternatives, such as 90 day at retail. The Company believes its most significant third party competitors for claims processing services are Medco, Express Scripts, Systems Excellence and CVS Caremark.
The Company's third party insurance programs, which are offered as integral parts of other products and services, generally experience competition in connection with the overall product or service being offered.
The Company holds U.S. patents, U.S. copyrights, and various trademarks covering various aspects of the information processing and computer software services and products provided by the Financial Services Segment. The duration of the patent term is generally 20 years from its earliest application filing date. The patent term is not renewable. The durations of the copyrights depend on a number of factors, such as who created the work and whether he or she was employed by the Company at the time. The trademark rights generally will continue for as long as the Company maintains usage of the trademarks. The Company believes its copyrights are adequate to protect its original works of authorship. The Company believes that although the patent, trademarks and copyrights related to Financial Services are valuable, the success of Financial Services primarily depends upon its product and service quality, marketing and service skills. Despite patent, trademark and copyright protection, the Company may be vulnerable to competitors who attempt to imitate the Company's systems or processes. In addition, other companies and inventors may receive patents that contain claims applicable to the Company's systems and processes.
The service agreements the Company separately negotiates with Financial Services Segment clients are typically multi-year agreements. The agreements sometimes contain service standards and/or allow clients to terminate for convenience with the payment of a termination fee. The domestic agreements typically obligate the Company to indemnify the client for damages from third party claims arising from the Company's breach and obligate the client to indemnify the Company for damages from third party claims arising from the Company's performance of services in accordance with the terms and conditions of the agreement. The agreements typically limit the Company's aggregate liability for performing the services and allow either party to avoid automatic renewal by notice to the other.
22
The Company has historically licensed its optical storage, investment portfolio, business and work process management systems (but not its transfer agency systems) and certain healthcare administration processing systems on a perpetual basis. The Company is currently transitioning, where feasible, the investment management and healthcare administration processing licenses from principally up-front, perpetual licenses to term licenses. Customers typically execute ancillary service and maintenance agreements in connection with perpetual licenses, which must be current for the Company to have any continuing maintenance obligations under the license. Customer use of the Company's products in certain industries, however, is frequently based on a model under which the customer's business operations are hosted in a DST data center and the customer accesses the system on a remote basis.
Other than terms and conditions that evolve as a result of new laws, regulations, industry practices and contract administration procedures, the terms and conditions contained in typical Financial Services Segment client agreements have not changed materially over the last three years.
The Company's Output Solutions Segment provides single source, integrated print and electronic statement and billing output solutions. The Output Solutions Segment also provides customized statement and bill production, marketing and personalization services, postal optimization, and electronic presentment, payment and distribution solutions. These capabilities enable the Output Solutions Segment to provide services to industries that place a premium on customer communications that require high quality, accurate and timely statement and billing output processing.
The Segment produced 12.9 billion images and delivered 2.4 billion items in 2009 from five operating facilities strategically located throughout North America and in the U.K. DST Output is among the largest users of continuous, high-speed, full-color inkjet printing systems and among the largest First-Class mailers in the United States.
The following table provides key operating data, including sources of revenue by major industry served, for the Output Solutions Segment:
| |
Year Ended December 31, | ||||||||||
|---|---|---|---|---|---|---|---|---|---|---|---|
Output Solutions Operating Data
|
2009 | 2008 | 2007 | ||||||||
Revenues (in millions) |
|||||||||||
U.S. operating revenues |
|||||||||||
Mutual fund/investment management |
$ | 108.9 | $ | 116.8 | $ | 111.6 | |||||
Telecommunications, video and utilities |
193.5 | 208.7 | 225.8 | ||||||||
Healthcare related services |
21.2 | 21.3 | 18.4 | ||||||||
Other financial services |
54.1 | 70.9 | 77.2 | ||||||||
Other |
34.4 | 37.8 | 43.2 | ||||||||
|
412.1 | 455.5 | 476.2 | ||||||||
International operating revenues |
|||||||||||
Investment management and other financial services |
36.8 | 38.3 | 31.7 | ||||||||
Telecommunications, video and utilities |
29.4 | 26.5 | 32.3 | ||||||||
Other |
4.0 | 7.9 | 14.9 | ||||||||
|
70.2 | 72.7 | 78.9 | ||||||||
Total operating revenues |
482.3 | 528.2 | 555.1 | ||||||||
Out-of-pocket reimbursements(1) |
571.5 | 537.2 | 542.0 | ||||||||
Total revenues |
$ | 1,053.8 | $ | 1,065.4 | $ | 1,097.1 | |||||
Images produced (billions) |
12.9 | 13.6 | 17.0 | ||||||||
Items mailed (billions) |
2.4 | 2.3 | 2.3 | ||||||||
- (1)
- Principally postage expenditures, which are reimbursed by the customer.
23
Statement and Bill Production Services
Statement and bill production services are supported by integrated and automated production environments that rapidly and cost-effectively transform electronic data received from clients into customized statements that can be delivered in print or electronic format in accordance with individual client preferences. The highly automated production environment increases postal savings while minimizing delivery time.
For the Financial Services industry, products and services include electronic printing, variable and selective insertion and distribution of custom designed shareowner and other account-based communications, including transaction confirmations, dividend checks, account statements and year-end tax reports. These clients are offered the capability of personalizing their individual customer communications through proprietary segmentation tools that facilitate targeted messaging and utilization of syndicated content and full color. The Output Solutions Segment is integrated in part with and uses processing functions of the Company's TA2000 system and the Company's information data processing facilities.
Single source statement and bill production services are provided to the Mutual Fund, Retirement, Brokerage, Banking, Consumer Finance, Cable TV, Telecommunications, Healthcare, Insurance, Utilities, Package Delivery and other service industries.
Advanced high-speed, full-color digital printing solutions and targeted messaging and graphics management tools provide clients with additional capabilities to develop marketing campaigns, cross-sell services, and improve customer loyalty.
The Output Solutions Segment's research and development efforts have resulted in two mail and postal processing initiatives, Smart Commingling and Intelligent Mail barcode, in compliance with United States Postal Services requirements. The Segment's Digital Press Technology ("DPT") high-speed color printing and inserting platform combines a state-of-the-art digital printing press with the Company's patent-pending technology. The platform enables the Output Solutions Segment to produce high-speed transactional printing combined with dynamic color printing. The platform enables the client's corporate logo and other static information to be printed in color onto the paper stock simultaneous with customer and other bill/statement data, where previously either the client provided preprinted paper stock or the Output Solutions Segment prepared paper stock for production. Similar technological innovations enable clients to add highlight color or full-color printing throughout the statements or bills. DST Output believes DPT is a technologically differentiated service offering that enables them to provide better and more efficient products and services to clients.
Advanced statement consolidation capabilities, which combine data from multiple services and funds into a single integrated statement, offer clients potentially significant savings both in paper and mailing costs while creating a marketing tool for companies seeking to establish brand name recognition and sell combined services.
Output's Customer Portal enables clients to access multiple tools that support their statement and bill production services. These tools include campaign management, online job auditing, job and mail tracking, etc. In addition, clients can use near real-time reports and inquiries to monitor production activities including job tracking, postage expense amounts and insert counts throughout the production process.
The Output Solutions Segment offers a full range of technical support. Customized programming tools have been developed that allow electronic information streams from a variety of client systems to be received without the need to make changes to the client's software. These tools are to enable rapid and smooth transitions when clients outsource their statement processing and electronic functions.
24
The Output Solutions Segment derives revenues from its statement and bill production services based generally on the number of images processed and the range of customization and personalization options chosen by the clients.
As one of the largest First-Class mailers in the U.S., the Output Solutions Segment provides a range of postal services for clients to optimize mail efficiencies and streamline postage expenses. These postal processing services include address quality, mail design, presentment and tracking.
In response to recent changes in postal regulations, the Output Solutions Segment has expanded its postal processing offerings. A recent value-added service called Smart Commingling combines multiple clients' First-Class mail to qualify for finer ZIP Code sort. Combining clients' mail pieces enables more mail to meet the volumes established by the USPS for three-digit and five-digit priority processing. The service enables the Company to bypass traditional postal processing touch-points resulting in faster delivery times, which can enhance customer satisfaction and help clients get a return response or paid faster. New capital equipment investments were made in 2008 and 2009 to support the processes and are among the largest and most advanced in existence. The Segment processed more than 600.0 million pieces in 2009 through its advanced commingling solution in the three U.S. operating facilities.
The Output Solutions Segment deployed the Intelligent Mail barcode for all U.S. clients. The Segment's Full Service Intelligent Mail solution enables clients to pay the best available postage rates for their mail volume and postal density.
Mail piece tracking software integrated with the U.S. Postal Service allows clients to predict incoming mail volumes and confirm consumer delivery. This prevents unnecessary past due notices or calls and thus saves costs and enhances customer satisfaction. By having information to assist in predicting mail delivery, this software provides clients the ability to make decisions about how to properly staff their processing and call centers.
The Output Solutions Segment affiliate, DST Mailing Services, Inc., focuses on managing postage-related services including postal compliance, automated postage payment, postage advance accounts (deposits and escrow accounts) and management of presort vendors and international mail.
The Company believes that having one Output Solutions Segment entity focused on print and mail processing and one focused on postage management provides advantages to addressing ongoing U.S. Postal Service initiatives to improve quality and lower costs.
The Output Solutions Segment derives revenues from its postal optimization services based generally on the number of mail pieces processed through each service option chosen by the clients.
Marketing and Personalization Services
Targeted Marketing
The Company's Campaign Manager offering allows clients to segment their customer databases for targeting variable campaigns through selective inserting, personalized messaging and the targeted use of syndicated content to selected audiences across multiple output media. The offering includes a graphical workflow management capability that enables clients to create, target, and schedule text graphics that are dynamically placed on the color statements for both print and electronic distribution. This solution facilitates customer acquisition, response rates, nurturing and retention, product cross selling and brand awareness.
The DPT platform, when combined with campaign management capabilities, enables affordable "TransPromo" capabilities—integrating transactional printing with proactive promotional marketing offers based on customer demographics and buying habits. TransPromo opportunities allow clients to
25
target and customize content and graphic images at the individual statement level for their printed as well as electronic customer communications.
Revenue is derived from the number of images, statements and inserts processed.
Direct Marketing
Direct marketing solutions provide highly personalized and targeted mail pieces to clients' target audiences. Services include database list management, development and programming, print production, postal processing, personalization, inkjet addressing, inserting and other direct marketing production services.
Variable data printing technology allows individual mail pieces to be personalized to drive response rates, increase average order values and boost sales. Solutions allow for monthly short runs to large cross-country campaigns according to the clients' needs.
Revenue for these services is generally based on number of distributed mail pieces.
Graphic Design Services
The Company's communications design services offer expertise and industry knowledge of how recipients are affected by information placement, use of color and white space, charts and graphs and personalized content placement before statements are initially developed. Many clients have the opportunity through statement-based marketing and creative design services to use the print or electronic statement to reinforce a corporate image, advertise special offers and features, deliver customer-specific messages and otherwise market their services to customers.
Revenue for these services is based on billable hours.
The Segment has created an automated information and technology infrastructure that electronically formats data and manages presentation over the Web, and provides alternative media in the form of encrypted CD/DVD and computer output microfiche ("COM"). As electronic statements and payment solutions have become more widely expected by consumers and intermediaries, communications service providers, utility companies, financial services firms, healthcare insurers, and other companies continue to implement electronic presentment capabilities. To fulfill this requirement, the Company offers a broad range of electronic solutions designed to meet the needs of electronic statement presentment, payment, and distribution, including secure e-mail push delivery.
The need for customer service retrieval of statements is addressed by the Company's presentment solutions. These products provide customer service representatives with a searchable, indexed statement image that matches the print or electronic version sent to consumers, which can enable faster customer service calls and improved first-call resolution rates. In addition to variable retention via Web presentment solutions, encrypted CD/DVD, microfilm and microfiche capabilities are also available for longer-term storage and archival.
A number of key alliances have been established with industry-leading companies to extend the reach and value of the Output Solutions Segment's electronic solutions. Because of its industry-leading volumes, state-of-the-art processing systems and client relationships, the Company is a full-service supplier of fully integrated print and electronic statement and billing output solutions that enable clients to build lasting one-to-one relationships with their customers.
Revenues from electronic statement and payment solutions are generally based on the number of statements processed, loaded, viewed, distributed, and payments processed electronically. These
26
revenues are influenced by both new account acquisitions and consumer adoption rates. Revenue is also derived from the number of images processed to alternative media.
Proxy Delivery Solution
As a result of the SEC's Notice and Access rules, the Output Solutions Segment and the Company provide a presentment solution for Mutual Fund companies to electronically deliver proxy materials via the Internet. The Segment's integrated solution, called eProxyDirect, includes the printing and mailing of proxy notices and ballots, on-demand production and delivery of proxy materials at shareholder requests, as well as proxy voting capabilities via the Web, IVR (interactive voice response) and mail.
Summary Prospectus Solution
The Output Solutions Segment announced a new prospectus delivery offering to assist Mutual Fund companies in complying with the SEC's new Summary Prospectus rule, which went into effect January 1, 2010. The Segment has developed a fully-integrated, single vendor solution called eProspectusDirect, which offers the following print and electronic services: (i) print and mail, (ii) post-sale fulfillment, (iii) document hosting and electronic delivery, and (iv) consent management.
In the United States, the Output Solutions Segment manages geographically dispersed operating facilities in El Dorado Hills, California; Kansas City, Missouri; and Hartford, Connecticut. The centers offer high-volume production roll form and sheet-fed production print processes, monochrome to full color, variable data printing and selective insertion, pre-sorting and full integration with electronic delivery capabilities depending on client preferences. Services for the Canadian and U.K. marketplaces are provided through facilities in Toronto, Canada and Bristol, England, respectively.
The Output Solutions Segment has proprietary processes and technologies that provide a fully integrated, computerized and automated production environment. The production system (i) processes, logs, verifies and authenticates customer data, (ii) creates automated production controls for a statement, including form bar codes, weight and thickness parameters, unique statement tracking numbers, "due out" dates, address correction, carrier route/delivery point bar codes and postal processing parameters, (iii) models production runs on-line before printing or electronic transmission and (iv) enables postal processing, sorting and discounting to be performed electronically.
The Company continues to expand its DPT printing and inserting platform for its U.S.-based Output Solutions Segment operations. In connection with the platform, the Segment implemented new DPT printers to expand its full-color variable data printing capabilities including higher resolution digital-color printing with variable processing options such as integrated Punch/Perforation, Selective Perforation, and in-line MICR production. The Segment achieved CPSA (Check Payment Systems Association) certification for enhanced check printing security feature capabilities.
Full real-time automation enables the Output Solutions Segment to monitor quality, control remakes, predict and schedule production loading, verify customer mailing data and maintain production system history on-line. The system is controlled by an on-line production control system that is based on advanced client/server architecture and has high-speed data transmission capabilities.
Outside of the United States, the Output Solutions Segment offers statement and output solution services to the Canadian and U.K. markets.
DST Output Canada offers custom communications and document automation solution and is among the largest providers of services for paper-intensive businesses in Canada.
27
DST International Output provides personalized print and electronic communications and pioneered the use of high-volume, full color variable digital solutions within the U.K. transactional print and mail market. These solutions can be tailored for each client. With the ability to customize the message for each end customer and a full range of color and graphics, client communications on statements and invoices can be enhanced to provide one-to-one marketing.
The Output Solutions Segment's five largest clients accounted for 29.7% of segment operating revenues in 2009, including 7.3% from its largest client.
The Output Solutions Segment offers its services directly to clients and through relationships in which its services are combined with or offered concurrently through providers of data processing services. The Output Solutions Segment's services are also distributed or bundled with product offerings to clients of the Financial Services Segment. The Output Solutions Segment maintains a field operations sales staff, including client services, technical support teams and design resources, to target these markets. Key marketing alliances have been established with industry-leading companies to extend the reach and value of the Output Solutions Segment's print and electronic statement and billing output solutions.
The Output Solutions Segment advocates preserving natural resources and more efficient use of energy while supporting measures that enhance the health and safety of its associates and communities. DST Output was one of the original signatories to the Carbon Disclosure Project, which is a global voluntary carbon footprint disclosure effort by corporations initiated in 2000. Examples of "green" and environmentally friendly initiatives include switching from toner-based to water-based inkjet ink that is non-hazardous and made of 95 percent to 98 percent water. DST Output orders all paper stock for the Company's production facilities from sustainable, managed forests under the guidance of the Sustainable Forestry Initiative and the Forest Stewardship Council, which call for the responsible management and stewardship of forested environments. DST Output's El Dorado Hills' facility received chain of custody certification through the Sustainable Forestry Initiative (SFI) and the Forestry Stewardship Council (FSC) to print the SFI and FSC logos on forms and envelopes when the Segment purchases certified paper. The Kansas City and Hartford locations are expected to become certified in 2010. DST Output's DPT platform utilizes plain white paper, as opposed to pre-printed stock, which reduces obsolete inventory. The DPT platform also has the ability to use recycled paper. DST Output has been recognized by the State of California Integrated Waste Management board and Waste Reduction Award Program on four occasions for its commitment to improving the environment by reducing waste. DST Output has also initiated several conservation and energy saving measures that reduce its use of water and electricity.
The key competitive factors for the Output Solutions Segment are price, the ability to offer single source print and electronic statement and billing output solutions, postage capabilities allowing more efficient delivery and potential cost savings, the range of customization options available for personalizing communications and their ease of application, the quality and speed of services provided, the multi-channel delivery capability based on customer preference, the quality of customer support, and the ability to handle large volumes efficiently and cost effectively. The most significant competitors for print or electronic statement and billing output solutions are those corporations that provide these services on an in-house basis, local companies in the cities where the Segment's printing operations are
28
located and national competitors. These include: R.R. Donnelly, Inc., Bowne and Co., Inc., FiServ, Inc., Personix, Broadridge, Inc., CSG Systems International, Inc., Regulus, Emdeon, Inc. and Metavante Technologies, Inc.
The Company holds U.S. patents, U.S. copyrights, and various trademarks covering various aspects of the statement and mail processing services and technology provided by the Output Solutions Segment. In addition, the Company is engaged in a continuing effort to patent the new technology it develops for the Output Solutions Segment. The duration of each patent term is generally 20 years from its earliest application filing date. A patent term is not renewable. The durations of the copyrights depend on a number of factors, such as who created the work and whether he or she was employed by the Company at the time. The trademark rights generally will continue for as long as the Company maintains usage of the trademarks. The Company believes its copyrights are adequate to protect its original works of authorship. The Company believes that although the patents, trademarks and copyrights related to the Output Solutions Segment are valuable, the success of the Output Solutions Segment primarily depends upon its product and service quality, marketing and service skills. Despite patent, trademark and copyright protection, the Company may be vulnerable to competitors who attempt to imitate the Company's systems or processes. In addition, other companies and inventors may receive patents that contain claims applicable to the Company's systems and processes.
The Company's subsidiaries in the Output Solutions Segment typically enter into multi-year agreements with their clients. Separately negotiated written agreements (a) contain service standards, and (b) sometimes allow clients to terminate for convenience with the payment of a termination fee. They typically obligate the Company's subsidiary to indemnify the client for damages arising from the subsidiary's breach, limit the subsidiary's liability for performing the services, and allow either party to avoid automatic renewal by notice to the other. Other than terms and conditions that evolve as a result of technology capabilities, new laws, regulations, industry practices and contract administration procedures, the terms and conditions contained in typical Output Solutions Segment client agreements have not changed materially over the last three years.
The Investments and Other Segment is comprised of the Company's real estate subsidiaries and affiliates, investments in equity securities, private equity funds, and other financial interests. The assets held by the Investments and Other Segment are primarily passive in nature. In the U.S. and U.K., the Company and its real estate subsidiaries own approximately 1.4 million square feet of office and retail space and 1.4 million square feet of production facilities, which are held primarily for lease to the Company's other business Segments. The real estate subsidiaries also hold master leases in certain properties, which are leased to the Company's operating segments. The Company's real estate subsidiaries also own a number of parking facilities, various developed and undeveloped properties, a residential apartment facility and an underground facility. The Company is a partner in certain real estate joint ventures that lease office space to the Company, certain of its unconsolidated affiliates and unrelated third parties. The Company is a 50% partner in a limited purpose real estate joint venture which developed and leased approximately 1.1 million square feet of office space to the U.S. government. The Investments and Other Segment holds investments in available-for-sale equity securities with a market value of approximately $851.9 million at December 31, 2009, including approximately 10.6 million shares of State Street Corporation, 22.3 million shares of Computershare Ltd. and 1.9 million shares of Euronet Worldwide, Inc., with a market value of
29
$460.7 million, $228.8 million and $41.4 million respectively, based on closing exchange values at December 31, 2009.
SOFTWARE DEVELOPMENT AND MAINTENANCE
The Company's software development and maintenance efforts are focused on introducing new products and services, as well as ongoing enhancement of its existing products and services. The Company expended $176.1 million, $155.1 million, and $156.2 million in 2009, 2008 and 2007, respectively, for software development and maintenance and enhancements to the Company's proprietary systems and software products, of which $27.7 million, $20.4 million, and $22.3 million was capitalized in 2009, 2008 and 2007, respectively.
As of December 31, 2009, the Company and its majority owned subsidiaries employed approximately 11,200 employees, including approximately 7,900 in the Financial Services Segment and 3,300 in the Output Solutions Segment. In addition, unconsolidated affiliates of the Company and its subsidiaries employed approximately 5,100 employees, including approximately 2,700 at BFDS, 1,700 at IFDS U.K., 500 at IFDS Canada and 200, in aggregate, at IFDS Luxembourg and IFDS Ireland. None of the Company's employees are represented by a labor union or covered by a collective bargaining agreement. The Company considers its employee relations to be good.
There are many risks and uncertainties that can affect our future business, financial performance or share price. Many of these are beyond our control. A description follows of some of the important factors that could have a material negative impact on our future business, financial performance or share price. This discussion includes a number of forward-looking statements. You should refer to the description of the qualifications and limitations on forward- looking statements in the first paragraph under Item 7 "Management's Discussion and Analysis of Financial Condition and Results of Operations" of this Form 10-K.
Unless otherwise indicated or the context otherwise requires, reference in this section to "we," "ours," "us" or similar terms means the Company, together with its subsidiaries. The level of importance of each of the following trends and risks may vary from time to time, and the trends and risks are not listed in any specific order of importance. These risks, however, are not the only risks facing our Company. Additional risks and uncertainties not currently known to us or that we currently deem to be immaterial also may materially adversely affect our business, financial condition and/or operating results.
Trends or events affecting our clients or their industries could decrease the demand for our products and services.
We derive our consolidated revenues from the delivery of products and services to clients in the mutual fund, brokerage, investment management, healthcare, telecommunications and utilities, cable TV, other financial service (i.e. insurance, banking, financial planning and mortgage) and other industries. A decline or lack of growth in demand for our products and services in any of the industries we serve could adversely affect our business and earnings. Demand for our products and services among companies in those industries could decline for many reasons. Consolidation or limited growth in an industry could reduce the number of our clients and potential clients.
Events that adversely affect our clients' businesses, rates of growth or numbers of customers they serve, including decreased demand for our customers' products and services, adverse conditions in our customers' markets or adverse economic conditions generally could decrease demand for our products
30
and services and the number of transactions we process. We cannot always predict the needs of changing industries or whether potential customers will accept our products or services. Concentrating our resources based on trends or events that do not occur as we expected could negatively impact any of our various businesses.
An increase in subaccounting services performed by brokerage firms could adversely impact our revenues.
Our mutual fund clients may decide to allow a broker/dealer who has assisted with the purchase or sale of mutual fund shares to perform subaccounting services. A brokerage firm typically maintains an "omnibus" account with the fund's transfer agent that represents the aggregate number of shares of a mutual fund owned by the brokerage firm's customers. The omnibus account structure results in fewer mutual fund shareowner accounts on our systems, which adversely affects our revenues.
We offer subaccounting services to brokerage firms that perform mutual fund shareowner subaccounting. As the recordkeeping functions in connection with subaccounting are more limited than traditional shareowner accounting, the fees charged are generally lower on a per unit basis. Clients who determine to use the omnibus accounting structure of brokerage firms could allow the conversion of accounts currently on our traditional recordkeeping system to our subaccounting system, or to the subaccounting systems of other service providers, which could result in lower revenues.
The demand for our products and services could decrease if we do not continually address our and our clients' technology and capacity requirements.
Our clients use computer technology based products and services in the complex and rapidly changing markets in which they operate. We must substantially invest in technology and systems to meet customer demand for transaction processing and volume capacities. If we do not meet clients' technology and capacity demands in advance of our competitors or if the investments we make are not cost-effective or do not result in successful products or services, our businesses could be adversely affected.
Damage to our facilities or declining real estate values could impact our operations or financial condition.
We own, lease and manage real estate as part of our business. The performance of our services also depends upon facilities that house central computer operations or operating centers or in which we process information, images, bills or statements. Declining property values in the markets in which we own investment properties may adversely affect our financial condition. Significant damage to any of our operating facilities could interrupt the operations at those facilities and interfere with our ability to serve customers.
We may be unable to attract and retain capable technical personnel for our processing businesses or quality executives to manage the complex structure of our business.
Our success depends on recruiting and retaining adept management and personnel with expertise in software and systems development and the types of computer hardware and software we utilize. Losing key personnel or not hiring qualified personnel could have a material adverse effect on our operations. Companies in our industry compete fiercely for qualified management and technical personnel. We cannot guarantee that we will be able to adequately compete for or keep qualified personnel. Lack of qualified management could increase the risk of unfavorable business strategies, especially in a complex business like ours with multiple segments and operating entities. Lack of qualified technical personnel could also affect our ability to develop the systems and services our clients demand.
31
Our businesses are subject to substantial competition.
We are subject to intense competition from other established service providers in all industries we serve. Some of our competitors are able to bundle service offerings and offer more appealing pricing structures. Some of our clients, or the clients they serve, may develop, have developed or are developing the in-house capacity to perform the transaction processing, recordkeeping, and output services they have paid us to perform. Some of our competitors and clients have greater financial and human resources and access to capital than we do.
Our failure to successfully compete in any of our operating segments could have a material adverse effect on our financial results. Competition could also affect the revenue mix of services we provide, resulting in decreased revenues in lines of business with higher profit margins.
We and companies in which we own a significant interest are subject to government regulation. Any regulatory violations, changes or uncertainties could adversely affect our business.
A number of our businesses are subject to U.S. or foreign regulatory oversight, as well as privacy, licensing, processing, recordkeeping, reporting and related obligations. Any violation of those obligations or related laws or regulations could expose us or those businesses to costly fines or sanctions or damage our reputation, which could adversely affect our business or financial performance. Governmental changes and uncertainties surrounding services we provide could increase our costs of business or diminish business, which could materially and adversely affect the Company's financial results.
Our clients are subject to government regulation that could affect our business.
Our clients are subject to extensive government regulation, including investment adviser, broker/dealer and privacy regulations applicable to services we provide to the financial industry, and insurance, privacy and other regulations applicable to services we provide to the healthcare industry. Any violation by our clients of applicable laws and regulations could diminish their business or financial condition and thus their demand for our products and services. Demand could also decrease if we do not continue to offer products and services that help our clients comply with regulations.
We operate internationally and are thus exposed to foreign political, economic and other conditions that could adversely affect our revenues from or support by foreign operations.
Consolidated revenues from our subsidiaries in Asia, Australia, Canada, Europe and elsewhere outside the U.S. are an important element of our revenues. Inherent risks in our international business activities could decrease our international sales and have a material adverse effect on our overall financial condition, results of operations and cash flow. These risks include potentially unfavorable foreign economic conditions, political conditions or national priorities, foreign government regulation, potential expropriation of assets by foreign governments, the failure to bridge cultural differences, and limited or prohibited access to our foreign operations and the support they provide. We may also have difficulty repatriating profits or be adversely affected by exchange rate fluctuations in our international business.
Various events may cause our financial results to fluctuate from quarter to quarter or year to year. The nature of these events might inhibit our ability to anticipate and act in advance to counter them.
We cannot always control when and whether events occur, that could cause varying financial results. Unfavorable results may occur that we did not anticipate or take advance action to address. The various reasons our quarterly and annual results may fluctuate include unanticipated economic conditions, and costs for starting up significant client operations, for hiring staff, and for developing products. Our results may also vary as a result of pricing pressures, increased cost of supplies, timing of
32
license fees, the evolving and unpredictable markets in which our products and services are sold, changes in accounting principles, and competitors' new products or services.
Investment decisions with respect to cash balances, market returns or losses on those investments, and limits on insurance applicable to cash balances held in bank and brokerage accounts, including as agent on behalf of our clients, could expose us to losses of such cash balances and adversely affect revenues attributable to cash balance deposit investments.
As part of our transaction processing and other services, we maintain and manage large bank and investment accounts containing client funds which we hold as agent as well as operational funds. Our revenues include investment earnings related to client fund cash balances. Our choices in selecting investments, or market conditions that affect the rate of return on or the availability of investments, could have an adverse effect on the level of such revenues. The amounts held in our operational and client deposit accounts could exceed the limits of government insurance programs of organizations such as the Federal Deposit Insurance Corporation and the Securities Investors Protection Corporation.
Our revenues and profit margins could decrease if clients cancel contracts, fail to renew contracts, renegotiate contracts or use our services at less than anticipated rates.
Client contract terminations, non-renewals, renegotiations or under-utilization of our services could decrease our revenues and profit margins. We derive revenue by selling products and services under long-term contracts. We cannot unilaterally extend the terms of these contracts when they expire. Some of these contracts contain "termination for convenience" clauses, which enable clients to cancel the agreements by providing written notice to us. Any failure to extend these contracts under their current terms, or any early termination of these contracts by customers, could adversely affect our business.
Claims against us, including claims for the lost market value of securities and class action claims, could cause significant liability and damage our reputation and business prospects.
Our proprietary applications and related services involve the processing of financial transactions for our clients and their customers. The dollar amount of transactions processed is vastly higher than the revenues derived from providing these services. We may be subject to claims, including class actions, for reimbursements, losses or damages arising from any transaction processing or operational error, or from process mismanagement, that causes, among other potential issues, processing delays, disclosure of protected information, miscalculations, failure to follow a clients' instructions, failure of third parties to recognize our role as our clients' agent, or mishandling of pass-through disbursements or other processes. Because of the sensitive nature of the financial and healthcare transactions we process, our liability and alleged damages may significantly exceed the fees we receive for performing the service at issue. Litigation can include class action claims based, among other theories, upon various regulatory requirements and consumer protection and privacy laws that class action plaintiffs may attempt to use to assert private rights of action. Any of these claims and related settlements or judgments could affect our profitability, damage our reputation, decrease demand for our services, or cause us to make costly operating changes.
We are substantially dependent on our intellectual property rights, and a claim for infringement or a requirement to indemnify a client for infringement could adversely affect us.
We have made substantial investments in software and other intellectual property on which our business is highly dependent. Any loss of our intellectual property rights, or any significant claim of infringement or indemnity for violation of the intellectual property rights of others, could have a material adverse effect on our financial condition, results of operations and cash flow. We rely on patent, trade secret and copyright laws, nondisclosure agreements, and other contractual and internal security measures to protect our proprietary technology. We cannot guarantee these measures will be
33
effective. Our products and services rely on technology developed by others, including open source software, and we have no control over possible infringement of someone else's intellectual property rights by the provider of this technology. The owner of the rights could seek damages from us rather than or in addition to the persons who provide the technology to us. We could be subject at any time to intellectual property infringement claims that are costly to evaluate and defend. Our clients may also face infringement claims, allege that such claims relate to our products and services, and seek indemnification from us.
Failure to protect the confidential information of our clients could hurt our business.
We often maintain trade secrets and proprietary information, including sensitive financial and personal health information of our clients' customers, electronically. A material breach of our security systems and procedures could lead to significant claims for liability, cause our customers to reconsider using our services and products, damage our reputation, or otherwise have a material adverse effect on us. We maintain systems and procedures to protect against unauthorized access to electronic information and computer viruses, but we cannot guarantee these systems and procedures will always protect us. Rapid advances in technology may prevent us from anticipating all potential security threats, and the limits of technology and skills or the prohibitive cost of more advanced security solutions might prevent us from addressing these threats.
We do not control certain businesses in which we have significant ownership.
We invest in joint ventures and other unconsolidated affiliates as part of our business strategy, and part of our net income is derived from our pro rata share of the earnings of those businesses. Despite owning significant equity interests in those companies and having directors on their boards, we do not control their operations, strategies or financial decisions. The other owners may have economic, business or legal interests or goals that are inconsistent with our goals or the goals of the businesses we co-own. Our pro rata share of any losses due to unfavorable performance of those companies could negatively impact our financial statements.
We own interests in companies under agreements that may inhibit our ability to sell our interests and the other owners may ask us to increase our investment.
We own interests in Boston Financial Data Services, International Financial Data Services Limited Partnership, International Financial Data Services Limited, and various real estate joint ventures. Our interests in these companies are subject to buy/sell arrangements, which may restrict our ability to sell our interests when we believe it is prudent to do so. These arrangements may also allow us to purchase the other owners' interests to prevent someone else from acquiring them and we cannot control the timing of occasions to do so. The businesses or other owners may encourage us to increase our investment in or make contributions to the businesses at an inopportune time.
The financial results of our reinsurance subsidiary could be adversely affected if actual loss experience exceeds estimated loss experience.
Our subsidiary, Vermont Western Assurance, Inc., which we refer to as Vermont Western, reinsures a portion of the risk in connection with replacing lost stock certificates for registered shareholders of unrelated companies. Vermont Western utilizes underwriting procedures and actuarial advisors to assess risk and establish reserves against loss. Vermont Western does not control clients' loss experience. Vermont Western could inaccurately assess risk at any time and actual loss experience could exceed estimates. Vermont Western's results, if unfavorable, could have a material adverse effect on our financial condition, operating results or cash flow.
34
We hold equity investments in companies that operate in various industries, and the value of those investments could decrease.
We hold significant investments in available-for-sale equity securities of other companies or other financial interests that are subject to fluctuations in market prices. A significant decline in the value of our equity investments could have a material adverse effect on our financial condition or results of operations. We may not always be able to sell those investments at higher prices than we paid for them or than the value of the consideration used to acquire them.
We hold significant investments in illiquid private equity funds.
We are a limited partner in various private equity funds and have significant future capital commitments related to certain private equity fund investments. These investments are illiquid. Generally, private equity fund securities are non-transferable or are subject to long holding periods, and withdrawals from the private equity firm partnerships are typically not permitted. Even when transfer restrictions do not apply, there is generally no public market for the securities. Therefore, we may not be able to sell the securities at a time when the Company desires to do so.
Various plans, agreements, laws and organizational documents may make more difficult or prevent a change in control.
Provisions in our Certificate of Incorporation, Bylaws, certain plans and agreements, and applicable laws could make it more difficult for a party to make a tender offer for our shares or complete a takeover, which is not approved by our Board of Directors. The provisions include:
- •
- super-majority stockholder approval required for certain actions
- •
- staggered terms for directors
- •
- specific procedures for stockholders to nominate new directors
- •
- cumulative voting in election of directors
- •
- the Board's authority to issue and set the terms of preferred stock
- •
- a stockholders' rights plan giving stockholders' rights to purchase preferred stock if certain changes in our ownership
occur
- •
- various rights of debenture holders, joint venture co-owners, lenders and certain customers and executives in
the event of a change in control
- •
- public reporting of ownership and of changes in ownership by stockholders with at least a 5% interest in us
- •
- legal restrictions on business combinations with certain stockholders
Because of contractual commitments, a change in control could affect our operating results and weaken our management retention and incentive tools.
A change in control of the Company would trigger various rights and obligations in service agreements with our customers, in agreements governing our joint ventures, and in incentive award and employment agreements with our management. A change in control could also allow some clients to terminate their agreements with us or to obtain rights to use our processing software. We are parties to joint venture agreements that allow other co-owners to buy our equity interests if we undergo a change in control. A change in control or a termination of employment without "cause" or their resignation for "good reason" (each as defined in applicable agreements) after a change in control could accelerate certain restricted stock and other awards we have granted to our management employees. This award
35
vesting may decrease an employee's incentive to continue employment with us. Certain executive officers have agreements with us that require us to continue to employ them for three years after a change in control or to pay certain amounts if we terminate their employment without cause or they resign for good reason following a change in control. The executives might not be incented to achieve results for the new owners of our business, and the cost of keeping the executives on the payroll might deter potential new owners from acquiring us or hinder new owners from hiring replacement management.
Our equity incentive and stockholders' rights plans could have a dilutive effect on our common stock.
Our directors, officers and certain managers have received restricted stock units and options to purchase our common stock as part of their compensation. These equity grants could have a dilutive effect on our common stock. A change of control would trigger the right of stockholders under our stockholders' rights plan to purchase 1/1000th shares of our preferred stock for each share of our common stock, which could be dilutive in value to common stockholders who do not exercise those rights.
Conversion or settlement of our debentures could have a dilutive effect on our common stock or affect our liquidity.
The Company has issued convertible senior debentures. Issuing common stock to settle conversions could be dilutive to the price of our common stock, and settlement of debentures for cash could affect our financial condition, operating results and cash flow. The debentures are convertible into shares of common stock under specified circumstances, which we refer to as Conversion Triggers. We cannot accurately predict when certain Conversion Triggers outside of our control may occur. To satisfy a conversion notice subsequent to a Conversion Trigger, we must deliver our common stock unless we properly notify the holder that we will settle with cash or a combination of cash and shares of common stock. A conversion notice settled with shares will cause additional dilution to existing common shareholders, while a conversion notice settled in cash may require the Company to access credit markets or sell its investments.
Adverse conditions in the credit and financial markets could adversely affect our business, financial condition and results of operations.
Within the last 18 months, the global financial markets experienced extreme disruption including, among other things, extreme volatility in security prices, diminished liquidity and credit availability, rating downgrades of certain investments and declining valuations of others. Governments have taken unprecedented actions intended to address extreme market conditions that include severely restricted credit and declines in real estate values. If disruptions continue to impact the financial markets, it could affect the Company's plans to refinance its accounts receivable securitization program by May 20, 2010 and its syndicated revolving credit facility by July 1, 2010. If the Company is not successful refinancing its accounts receivable securitization program and syndicated revolving credit facility, the Company may need to liquidate other assets (principally available-for-sale securities and other investments) or raise equity capital which could cause additional dilution to existing common shareholders.
Item 1B. Unresolved SEC Staff Comments
None.
36
The following table provides certain summary information with respect to the principal properties owned or leased by the Company. The Company believes the facilities, office space and other properties owned or leased are adequate for its current operations.
Location
|
Use(1) | Owned/ Leased(2) |
Square Feet |
||||||
|---|---|---|---|---|---|---|---|---|---|
Financial Services Segment(3) |
|||||||||
Kansas City, MO |
Office Space | Leased | 356,000 | ||||||
Kansas City, MO |
Office Space | Owned | (4) | 520,000 | |||||
Kansas City, MO |
Data Center | Owned | (4) | 163,000 | |||||
St. Louis, MO |
Data Center | Owned | 108,000 | ||||||
Jefferson City, MO |
Office Space | Leased | 27,000 | ||||||
Harrisburg, PA |
Office Space | Leased | 217,000 | ||||||
Birmingham, AL |
Office Space | Leased | 98,000 | ||||||
Lawrence, KS |
Office Space | Owned | (4) | 49,000 | |||||
Cohoes, NY |
Office Space | Leased | 15,000 | ||||||
New York, NY |
Office Space | Leased | 15,000 | ||||||
Southfield, MI |
Office Space | Leased | 30,000 | ||||||
Boston, MA |
Office Space | Leased | 24,000 | ||||||
Minneapolis, MN |
Office Space | Leased | 15,000 | ||||||
Bangkok, Thailand |
Office Space | Leased | 92,000 | ||||||
Hyderabad, India |
Office Space | Leased | 76,000 | ||||||
London, United Kingdom |
Office Space | Owned | 47,000 | ||||||
London, United Kingdom |
Office Space | Leased | 4,000 | ||||||
Rochester, United Kingdom |
Office Space | Owned | 19,000 | ||||||
Melbourne, Australia |
Office Space | Leased | 27,000 | ||||||
Sydney, Australia |
Office Space | Leased | 6,000 | ||||||
Johannesburg, South Africa |
Office Space | Owned | 8,000 | ||||||
Nine other smaller properties |
Office Space | Leased | 16,000 | ||||||
Output Solutions Segment(3) |
|||||||||
El Dorado Hills, CA |
Production | Owned | (4) | 580,000 | |||||
El Dorado Hills, CA |
Office Space | Leased | 47,000 | ||||||
Kansas City, MO |
Production | Owned | (4) | 305,000 | |||||
Kansas City, MO |
Office Space | Owned | (4) | 66,000 | |||||
Hartford, CT |
Production | Owned | (4) | 302,000 | |||||
Toronto, Canada |
Production | Owned | 113,000 | ||||||
Ottawa, Canada |
Production | Leased | 13,000 | ||||||
Bristol, United Kingdom |
Production | Owned | 54,000 | ||||||
Investments and Other Segment(5) |
|||||||||
Kansas City, MO |
Office Space | Owned | (4) | 490,000 | |||||
Kansas City, MO |
Retail | Owned | 47,000 | ||||||
Kansas City, MO |
Office Space | Leased | 4,000 | ||||||
Kansas City, MO |
Production | Owned | 177,000 | ||||||
El Dorado Hills, CA |
Office Space | Owned | 65,000 | ||||||
Bristol, United Kingdom |
Production | Owned | 72,000 | ||||||
Johannesburg, South Africa |
Office Space | Owned | 7,000 | ||||||
- (1)
- Property specified as being used for production includes space used for manufacturing operations and warehouse space.
37
- (2)
- Within
Kansas City, MO, the Company owns a number of surface parking facilities, a 120 unit apartment building, various developed and undeveloped
properties, and an underground facility with 536,000 square feet leased to third parties. The Company also owns approximately 200 acres of undeveloped land adjacent to its buildings in El Dorado
Hills, CA.
In addition to the property listed in the table and discussed above, the Company leases space in Singapore, China, Hong Kong, France, Switzerland, United Arab Emirates and New Zealand.
- (3)
- Includes
approximately 2.4 million square feet of property owned or leased by the Company's real estate subsidiaries, which are part of the
Investments and Other Segment. These properties are primarily leased to other segments of the Company, including approximately 1.0 million square feet in the Financial Services Segment and
1.4 million square feet in the Output Solutions Segment. The Financial Services Segment has subleased 64,000 square feet of office space to third parties.
- (4)
- Several
owned properties are mortgaged with aggregate indebtedness of $119.5 million as of December 31, 2009.
- (5)
- The Company, through its real estate subsidiaries, leases office and production space to various third-party tenants in Kansas City, MO, El Dorado Hills, CA and Bristol, UK. The number of square footage leased to third-parties in office, retail and production facilities is 408,000, plus approximately 480,000 in square footage leased to third parties at the underground facility.
Investments and Other Segment
The Company and its real estate subsidiaries own approximately 1.4 million square feet of office and retail space and 1.4 million square feet of production facilities which are held primarily for lease to the Company's other business segments. The real estate subsidiaries also hold master leases in certain properties which are leased to the Company's operating segments. The Company's real estate subsidiaries also own a number of parking facilities, various developed and undeveloped properties, a residential apartment facility and an underground facility.
The Company and its subsidiaries are involved in various legal proceedings arising in the normal course of their businesses. While the ultimate outcome of such legal proceedings cannot be predicted with certainty, management believes, after consultation with legal counsel, that the final outcome in such proceedings, in the aggregate, would not have a material adverse effect on the consolidated financial condition, results of operations or cash flows of the Company.
Item 4. Submission of Matters to a Vote of Security Holders
Executive Officers and Significant Employees of the Company
Pursuant to General Instruction G(3) of Form 10-K and instruction 3 to paragraph (b) of Item 401 of Regulation S-K, the following list is included as an unnumbered Item in Part I of this Annual Report on Form 10-K in lieu of being included in the Company's Definitive Proxy Statement in connection with its annual meeting of stockholders scheduled for May 11, 2010.
All executive officers are elected by and serve at the discretion of the Company's Board of Directors. Certain of the executive officers have employment agreements with the Company. There are no arrangements or understandings between the executive officers and any other person pursuant to which he was or is to be selected as an officer, except with respect to the executive officers who have entered into employment agreements, which agreements designate the position or positions to be held by the
38
executive officer. None of the executive officers are related to one another or to any of the members of the Board of Directors.
Thomas A. McDonnell, age 64, has served as director of the Company since 1971. He has served as Chief Executive Officer of the Company since October 1984, and he served as President of the Company from January 1973 through June 2009 (except for a 30 month period from October 1984 to April 1987). He served as Treasurer of the Company from February 1973 to September 1995 and as Vice Chairman of the Board from June 1984 to September 1995. He is a director of Commerce Bancshares, Euronet Worldwide, Inc., Garmin Ltd., and Kansas City Southern Industries, Inc. Within the past five years, Mr. McDonnell was also a director of Blue Valley Ban Corp.
Stephen C. Hooley, age 46, joined the Company in July 2009 as its President and Chief Operating Officer. His responsibilities include U.S. Investment Recordkeeping Solutions, Automated Work Distributor products, information systems, product sales and marketing, data centers, and human resources. He has served since July 2009 as non-executive Chairman of Boston Financial Data Services ("Boston Financial") and since May 30, 2007 as chief executive officer of IFDS, L.P. Boston Financial and IFDS, L.P. are 50% owned joint ventures of the Company and State Street Corporation. Mr. Hooley served from January 2004 through June 2009 as President and Chief Executive Officer of Boston Financial.
Jonathan J. Boehm, age 49, joined the Company in 1977. He became an Executive Vice President in July 2009. Prior to his promotion, he served as Group Vice President—Mutual Funds Full Service since 1997. He is responsible for the Company's subsidiaries DST Health Solutions and Argus Health Systems.
Robert L. Tritt, age 54, joined the Company in 1977. He became an Executive Vice President in July 2009. Prior to his promotion, he served as Group Vice President—Mutual Funds Remote since 1989. He is responsible for the Company's U.S. Investment Recordkeeping Solutions, including full service transfer agency, subaccounting and remote mutual fund processing operations and mutual fund product development.
Thomas R. Abraham, age 58, has served as Chief Executive Officer of DST Global Solutions, an indirect wholly-owned subsidiary, since February 2007. Prior to joining the Company, Mr. Abraham served at Citibank, N.A. from 2001 as Managing Director and Head of Strategic Solutions—Global Transaction Services.
Steven J. Towle, age 52, has served since January 1, 2004 as President and Chief Executive Officer of the Company's subsidiary DST Output. Prior to joining the Company, he was President and Chief Executive Officer of Boston Financial from December 2000 to December 2003 and Senior Vice President of Boston Financial from April 1997 to December 2000.
Gregg Wm. Givens, age 49, joined the Company in 1996 as an officer and has served as Vice President and Chief Accounting Officer since 1999.
Kenneth V. Hager, age 59, has served as Vice President and Chief Financial Officer of the Company since April 1988 and as Treasurer since August 1995. He is responsible for the financial function of the Company.
Randall D. Young, age 53, joined the Company as a Vice President in January 1995 and has served as Vice President, General Counsel and Secretary of the Company since July 2002.
39
Item 5. Market for the Registrant's Common Equity, Related Stockholder Matters and Issuer Purchases of Equity Securities
The Company's common stock trades under the symbol "DST" on the New York Stock Exchange ("NYSE"). As of February 23, 2010, there were approximately 29,400 beneficial owners of the Company's common stock.
The Company has historically retained its earnings for use in its business and has therefore not paid dividends since its formation in 1995. The Company is considering the possibility of paying dividends in the future, subject to the Company's capital position, liquidity, and contractual restrictions. There can be no assurance as to whether the Company will pay dividends in the future or the duration of any future dividend practice. Under the Company's June 28, 2005 syndicated revolving credit agreement, the Company is limited, on an annual basis, to making dividends and repurchasing or redeeming its capital stock and/or settling forward equity transactions in an aggregate amount in any fiscal year not to exceed 10.0% of consolidated net tangible assets. Certain items under the Company's convertible senior debentures require that the conversion rate of the debentures be adjusted if the Company does declare a dividend, possibly making the debentures more dilutive upon conversion.
The information set forth in response to Item 201 of Regulation S-K in Part II Item 8, Financial Statements and Supplementary Data at Note 17, Quarterly Financial Data (Unaudited) ("Note 17"), in this Form 10-K is incorporated by reference in partial response to this Item 5. The prices set forth in Note 17 do not include commissions and do not necessarily represent actual transactions. The closing price of the Company's common stock on the NYSE on December 31, 2009, was $43.55.
The following table sets forth information with respect to shares of Company common stock purchased by the Company during the quarter ended December 31, 2009.
Period
|
Total Number of Shares Purchased |
Average Price Paid Per Share |
Total Number of Shares Purchased as Part of Publicly Announced Plans or Programs |
Maximum Number of Shares That May Yet Be Purchased Under the Plans or Programs |
|||||||||
|---|---|---|---|---|---|---|---|---|---|---|---|---|---|
October 1 - October 31 |
3,431 | (1) | $ | 43.71 | 2,382,010 | (2) | |||||||
November 1 - November 30 |
643,443 | (1) | $ | 43.39 | 85,000 | 2,297,010 | (2) | ||||||
December 1 - December 31 |
110,613 | (1) | $ | 43.66 | 10,000 | 2,287,010 | (2) | ||||||
- (1)
- For
the three months ended December 31, 2009, the Company purchased, in accordance with the 2005 Equity Incentive Plan (formerly the 1995 Stock
Option and Performance Award Plan), 662,487 shares of its common stock for participant income tax withholding in conjunction with stock option exercises or from the vesting of restricted stock shares,
as requested by the participants. These purchases were not made under the publicly-announced repurchase plans or programs, but were allowed by the rules of the Compensation Committee of the DST Board
of Directors. Of these shares, 3,431 shares were purchased in October 2009, 558,443 shares were purchased in November 2009, and 100,613 shares were purchased in December 2009.
- (2)
- On February 20, 2009, DST's Board of Directors authorized the repurchase of an additional 2.0 million shares under the existing share repurchase authorization plan. The plan allows, but does not require, the repurchase of common stock in open market and private transactions through December 31, 2011. The Company may enter into one or more plans with its brokers or banks for pre-authorized purchases within defined limits pursuant to Rule 10b5-1 to effect all or a portion of such share repurchases.
40
The following performance graph and related information shall not be deemed "soliciting material" or to be "filed" with the Securities and Exchange Commission, nor shall such information be incorporated by reference into any future filing under the Securities Act of 1933 or Securities Exchange Act of 1934, each as amended, except to the extent that the Company specifically incorporates it by reference into such filing.
The following graph shows the changes in value since December 31, 2004 of an assumed investment of $100 in: (i) DST Common Stock; (ii) the stocks that comprise the S&P 400 MidCap index(1); and (iii) the stocks that comprise a peer group of companies ("Peer Group")(2). The table following the graph shows the dollar value of those investments as of December 31, 2009 and as of December 31 for each of the five preceding years. The value for the assumed investments depicted on the graph and in the table has been calculated assuming that cash dividends, if any, are reinvested at the end of each quarter in which they are paid.
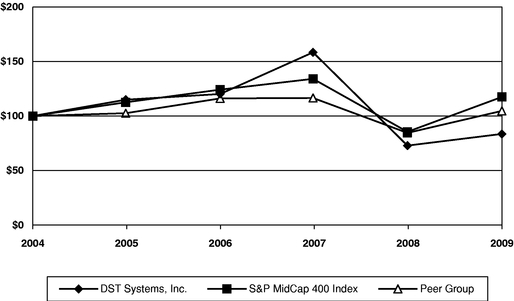
| |
As of December 31, | ||||||||||||||||||
|---|---|---|---|---|---|---|---|---|---|---|---|---|---|---|---|---|---|---|---|
| |
2004 | 2005 | 2006 | 2007 | 2008 | 2009 | |||||||||||||
DST Systems, Inc |
$ | 100.00 | $ | 114.95 | $ | 120.17 | $ | 158.38 | $ | 72.87 | $ | 83.56 | |||||||
S&P MidCap 400 Index |
100.00 | 112.56 | 124.17 | 134.08 | 85.50 | 117.46 | |||||||||||||
Peer Group |
100.00 | 102.57 | 116.12 | 116.54 | 84.51 | 104.66 | |||||||||||||
- (1)
- Standard &
Poor's Corporation, an independent company, prepares the S&P 400 MidCap Index.
- (2)
- The
companies included in the Peer Group are Affiliated Computer Services, Alliance Data Systems Corporation, Automatic Data Processing, Inc.,
Broadridge Financial Solutions, Inc., Convergys Corporation, CSG Systems International, Inc., Fiserv, Inc., IMS Health Incorporated, NCR Corporation, Paychex, Inc, SEI
Investments Co., TeleTech Holdings, Inc., and Total System Services, Inc.
Also included in the Peer Group data for earlier years of the five year period are the following companies: Ceridian Corporation (included through 2006 as it was acquired by Thomas H. Lee Partners in November 2007), Choicepoint Inc. (included through 2007 as it was acquired by Reed Elsevier in September 2008), First Data Corporation (included through 2006 as it was acquired by Kohlberg Kravis in September 2007), and Perot Systems Corporation (included through 2008 as it was acquired by Dell in 2009).
DST selected the Peer Group based on comparable company information for DST's industry developed by an independent compensation consultant with the input of the Company's CFO.
41
Item 6. Selected Financial Data
The following table sets forth selected consolidated financial data of the Company. The selected consolidated financial data should be read in conjunction with and are qualified by reference to "Management's Discussion and Analysis of Financial Condition and Results of Operations" included in Item 7 of this Annual Report on Form 10-K and the Company's audited consolidated financial statements, including the notes thereto, and the report of the independent registered public accounting firm thereon and the other financial information included in Item 8 of this Form 10-K.
| |
Years Ended December 31, | |||||||||||||||
|---|---|---|---|---|---|---|---|---|---|---|---|---|---|---|---|---|
| |
2009(1) | 2008(2) | 2007(3) | 2006(4)(9) | 2005(5)(9) | |||||||||||
| |
(dollars in millions, except per share amounts) |
|||||||||||||||
Operating revenues |
$ | 1,595.4 | $ | 1,675.5 | $ | 1,695.4 | $ | 1,556.2 | $ | 1,744.6 | ||||||
Out-of-pocket reimbursements(6) |
622.5 | 609.9 | 607.1 | 679.6 | 770.5 | |||||||||||
Total revenues |
2,217.9 | 2,285.4 | 2,302.5 | 2,235.8 | 2,515.1 | |||||||||||
Costs and expenses |
1,813.2 | 1,813.6 | 1,828.0 | 1,800.6 | 2,020.6 | |||||||||||
Depreciation and amortization |
130.4 | 125.3 | 130.6 | 129.9 | 158.1 | |||||||||||
Income from operations |
274.3 | 346.5 | 343.9 | 305.3 | 336.4 | |||||||||||
Interest expense |
(42.2 | ) | (55.4 | ) | (60.3 | ) | (139.6 | ) | (80.9 | ) | ||||||
Other income (expense), net |
85.1 | (15.5 | ) | 45.0 | 50.0 | 114.2 | ||||||||||
Gains on sale of businesses |
274.2 | |||||||||||||||
Gain on sale of Asurion and lock\line |
998.0 | 52.8 | ||||||||||||||
Equity in earnings of unconsolidated affiliates |
37.3 | 34.7 | 62.6 | 47.7 | 44.8 | |||||||||||
Income before income taxes |
354.5 | 310.3 | 1,389.2 | 316.2 | 688.7 | |||||||||||
Income taxes |
112.9 | 67.4 | 514.5 | 82.2 | 273.0 | |||||||||||
Net income |
$ | 241.6 | $ | 242.9 | $ | 874.7 | $ | 234.0 | $ | 415.7 | ||||||
Basic earnings per share(10) |
$ | 4.87 | $ | 4.53 | $ | 13.80 | $ | 3.41 | $ | 5.33 | ||||||
Diluted earnings per share(10) |
$ | 4.84 | $ | 4.21 | $ | 12.14 | $ | 3.17 | $ | 5.12 | ||||||
Non-GAAP diluted earnings per share(8) |
$ | 3.59 | $ | 3.71 | $ | 3.48 | $ | 2.96 | $ | 2.62 | ||||||
Total assets |
$ | 2,912.8 | $ | 2,509.4 | $ | 3,395.9 | $ | 3,119.1 | $ | 3,029.5 | ||||||
Total debt |
$ | 1,221.9 | $ | 1,435.3 | $ | 1,061.1 | $ | 1,441.2 | $ | 1,342.2 | ||||||
Ratio of earnings to fixed charges(7) |
7.6 | 5.1 | 18.1 | 2.9 | 7.2 | |||||||||||
- (1)
- In 2009, the Company recognized a $41.7 million gain in other income (expense), net associated with the purchase of the remaining 50% equity interest of Argus on March 31, 2009 for $57.0 million in cash. The income tax benefit associated with this transaction was approximately $0.9 million related to the elimination of deferred tax liabilities previously established for equity in earnings of Argus. In accordance with authoritative accounting guidance for income taxes, no income taxes were recorded on the $41.7 million gain. The Company recognized a $5.9 million gain in other income (expense), net associated with the repurchase of senior convertible debentures. The income tax expense associated with this gain was approximately $2.2 million. The Company recorded an income tax benefit of approximately $5.7 million resulting from a reduction in income tax related liabilities principally associated with the completion of an IRS examination for the tax years ended December 2002 through 2005. The Company recorded net gains on securities and other investments of $17.2 million in other income (expense), net. The income tax expense associated with this investment gain was approximately $6.9 million. The Company recorded a $4.5 million gain in equity in earnings of unconsolidated affiliates associated with the consolidation and change in value of an equity method investment held by an unconsolidated affiliate. The income tax expense associated with this gain was approximately $1.8 million. The Company recorded interest expense associated with financing costs from the 2009 convertible
42
senior debenture exchange transactions in the amount of $4.7 million. The income tax benefit associated with this expense was approximately $1.9 million.
- (2)
- In
2008, the Company recognized a $10.8 million gain in other income (expense), net associated with the repurchase of senior convertible debentures.
The income tax expense associated with this gain was approximately $4.2 million. During 2008, the Company recorded an income tax benefit of approximately $48.2 million associated with a
reduction in income tax related liabilities in accordance with accounting guidance for uncertain income tax positions. In addition, the Company recorded net losses on securities and other investments
of $41.8 million in other income (expense), net during 2008. The income tax benefit associated with this investment loss was approximately $15.5 million.
- (3)
- In
2007, the Company recognized a $998.0 million net gain from sale of Asurion on July 3, 2007. The income tax expense associated with this
gain was approximately $381.7 million. Also included in 2007 is a net gain resulting from the sale of office buildings, in the amount of $12.4 million, that was recorded as a reduction
in costs and expenses. The income tax expense associated with this net property gain was approximately $4.9 million.
- (4)
- In
2006, the Company recognized a $52.8 million net gain from the lock\line merger with Asurion on January 1, 2006. The income tax expense
associated with this gain was approximately $23.1 million. In addition, DST acquired Amisys Synertech, Inc. on October 2, 2006. In 2006, the Company incurred interest expense of
$12.7 million resulting from the write-off of the Company's convertible debenture debt issuance costs.
- (5)
- In
2005, the Company sold EquiServe and recorded a gain of $120.4 million. In 2005, the Company sold the Innovis Entities and recorded a gain of
$153.8 million. The total income tax expense related to these gains on sale of businesses was $113.1 million. Included in other income (expense), net for 2005 is a security gain of
$76.3 million associated with the gain on the exchange of the CSC shares for the DST Health Solutions business which was acquired on April 29, 2005. Also included in 2005 is net gain
resulting from the sale of an office building, in the amount of $26.0 million, that was recorded as a reduction in costs and expenses. The income tax expense associated with this net property
gain was approximately $10.7 million.
- (6)
- The
Company's significant Out-of-Pocket ("OOP") expenditures include postage and telecommunication costs which are reimbursed by the
customer. OOP expenses are included in costs and expenses.
- (7)
- For
purposes of calculating the ratio of earnings to fixed charges, earnings consists of pretax income less equity in earnings (losses) of unconsolidated
affiliates, plus distributed earnings of unconsolidated affiliates, plus consolidated fixed charges, plus amortization of capitalized interest, less capitalized interest. Fixed charges include gross
interest expense, amortization of deferred financing expenses and an amount equivalent to interest included in rental charges. The Company has assumed that one-third of rental expense is
representative of the interest factor.
- (8)
- Non-GAAP diluted earnings per share have been calculated by taking into account the impact of certain items that are not necessarily ongoing in nature, do not have a high level of predictability associated with them or are non-operational items. Management believes the exclusion of these items provides a useful basis for evaluating underlying business unit performance, but should not be considered in isolation and is not in accordance with, or a substitute for, evaluating business unit performance utilizing GAAP financial information. A reconciliation of diluted earnings per share and non-GAAP diluted earnings per share is included below. In addition, a detailed description of the items removed from net income for the three years ended December 31, 2009 are included in Item 7, Use of Non-GAAP Financial Information.
43
| |
Year Ended December 31, | ||||||||||||||||
|---|---|---|---|---|---|---|---|---|---|---|---|---|---|---|---|---|---|
| |
2009 | 2008 | 2007 | 2006 | 2005 | ||||||||||||
GAAP Diluted Earnings per Share |
$ | 4.84 | $ | 4.21 | $ | 12.14 | $ | 3.17 | $ | 5.12 | |||||||
Disposition of businesses |
(8.56 |
) |
(0.40 |
) |
(1.92 |
) |
|||||||||||
Business acquisitions |
(0.85 | ) | |||||||||||||||
Net (gains) losses on securities and other investments |
(0.21 | ) | 0.46 | (0.02 | ) | (0.15 | ) | (0.58 | ) | ||||||||
Gain on sale of property |
(0.01 | ) | (0.10 | ) | (0.19 | ) | |||||||||||
Gain on extinguishment of convertible debentures |
(0.07 | ) | (0.11 | ) | |||||||||||||
Interest costs assocated with convertible debentures |
0.05 | 0.63 | 0.11 | ||||||||||||||
Equity in earnings items |
(0.05 | ) | 0.04 | 0.12 | (0.09 | ) | |||||||||||
Asset impairment |
0.10 | ||||||||||||||||
Other |
0.03 | (0.05 | ) | 0.04 | |||||||||||||
Income tax items |
(0.12 |
) |
(0.84 |
) |
(0.05 |
) |
(0.36 |
) |
0.03 |
||||||||
Non-GAAP Diluted Earnings per Share |
$ | 3.59 | $ | 3.71 | $ | 3.48 | $ | 2.96 | $ | 2.62 | |||||||
- (9)
- 2006
and 2005 earnings have been retrospectively restated for the adoption of authoritative accounting guidance related to convertible debt instruments that
may be settled in cash upon conversion.
- (10)
- The years ended December 31, 2008, 2007, 2006 and 2005 have been retrospectively restated for the adoption of authoritative accounting guidance related to earnings per share.
Item 7. Management's Discussion and Analysis of Financial Condition and Results of Operations
The discussions set forth in this Annual Report on Form 10-K contain statements concerning potential future events. Such forward-looking statements are based upon assumptions by the Company's management, as of the date of this Annual Report, including assumptions about risks and uncertainties faced by the Company. In addition, management may make forward-looking statements orally or in other writings, including, but not limited to, in press releases, in the annual report and in the Company's other filings with the Securities and Exchange Commission. Readers can identify these forward-looking statements by the use of such verbs as expects, anticipates, believes or similar verbs or conjugations of such verbs. If any of management's assumptions prove incorrect or should unanticipated circumstances arise, the Company's actual results could materially differ from those anticipated by such forward-looking statements. The differences could be caused by a number of factors or combination of factors including, but not limited to, those factors identified in Item 1A, "Risk Factors" of this Form 10-K. Readers are strongly encouraged to consider those factors when evaluating any forward-looking statements concerning the Company. The Company undertakes no obligation to update any forward-looking statements in this Annual Report on Form 10-K to reflect future events or developments.
44
Originally established in 1969, the Company is a leading global provider of sophisticated information processing and computer software services and products to the financial services industry (primarily mutual funds and investment managers), healthcare industry, telecommunications industry and other service industries. The Company's business units are reported as two operating Segments (Financial Services and Output Solutions). In addition, the Company's real estate subsidiaries and affiliates, investments in equity securities, private equity investments and other financial interests have been aggregated into the Investments and Other Segment.
The Financial Services Segment's revenues are derived primarily from remote or full service transfer agency or third party administration product offerings that utilize the Company's proprietary software applications being processed at the Company's data centers. The Financial Services Segment's revenues are generally based on the number of accounts/members or transactions processed. The Company's mutual fund revenues are dependent upon the number of accounts or transactions processed. The Financial Services Segment's healthcare administration processing revenues are generally earned on a per member, per month basis for BPO services and ASP agreements. Argus derives revenue from pharmacy claims processing services and from investment earnings related to client balances maintained by Argus. The Company also derives revenues from transfer agency asset balances invested and investment earnings related to customer cash balances maintained in Company investment accounts. The Company also licenses its work management software, healthcare administration processing systems software, certain investment management and, outside the U.S., certain mutual fund shareowner accounting systems. Revenues for licensed software products are primarily comprised of: (i) license fees; (ii) consulting and development revenues based primarily on time and materials billings; and (iii) annual maintenance fees. The license fee component of these revenues is not significant. The Company provides data processing services to certain clients who utilize the Company's AWD products. Revenues are primarily based upon data center capacity utilized, which is significantly influenced by the volume of transactions or the number of users. The Financial Services Segment records investment income (dividends, interest and net gains (losses) on investment securities) within other income (expense), net.
The Financial Services Segment derives part of its income from its pro rata share in the earnings (losses) of certain unconsolidated affiliates, including BFDS, IFDS U.K. and IFDS L.P.
The Output Solutions Segment's revenues are derived from presentation and delivery (either printed or electronic) and archival of customer documents, and are based generally on the number of images processed and the range of customization and personalization options chosen by the client. Formatting and custom programming revenues are based on time and materials billings or on the number of images produced.
The Investments and Other Segment's revenues are derived from rental income from Company owned and third party real estate leases. Rental income from Company owned real estate is recorded as revenue when earned, which is based on lease terms, but is eliminated in consolidation for the portion that relates to real estate leased to the Company's other consolidated subsidiaries. The Investments and Other Segment records investment income (dividends, interest and net gains (losses) on investment securities) within other income (expense), net.
Significant Events
Acquisition of Argus Health Systems, Inc.
Prior to March 31, 2009, DST owned a 50% equity interest in Argus, which provides pharmacy claims processing and other related services to help clients manage pharmacy benefit programs. On March 31, 2009, DST purchased the remaining 50% interest of Argus for $57.0 million in cash. As a result, Argus
45
is no longer an unconsolidated affiliate, but rather is a wholly owned subsidiary resulting in DST consolidating the results of Argus after March 31, 2009 rather than recording equity in earnings of Argus. The acquisition of the remaining 50% of Argus was treated as a step acquisition. Accordingly, DST remeasured its previously held equity interest in Argus to fair value, in the amount of $57.0 million, and recorded a gain of $41.7 million, which is included in Other income (expense), net in the Consolidated Statement of Income. DST has recognized identifiable assets (comprised of proprietary software of $26.0 million, customer relationships of $14.0 million and other intangible assets of $1.0 million) and goodwill resulting from the acquisition of the remaining 50% Argus interest and the remeasurement of its previously held equity interest. Based on the purchase price allocation, DST estimates that annual amortization expense from Argus acquired intangible assets will be approximately $4.2 million. The Company believes that the acquisition of Argus complements its existing DST Health Solutions business, increases the size of its healthcare processing capabilities and will enable the Company to provide broader product offerings to new and existing customers.
Expansion of Shareowner Subaccounting Service Offerings
DST has traditionally offered mutual fund shareowner subaccounting services on a remote (ASP) and shared service basis to broker/dealers who perform shareowner accounting and recordkeeping for mutual fund accounts that have been sold by the broker/dealer's registered representatives. DST has enhanced its proprietary mutual fund shareowner accounting and recordkeeping system, TA2000, to meet the complex reconciliation and system interfaces required by the broker/dealers. The Company believes that using the same system for both transfer agency shareowner recordkeeping and subaccounting should result in consistent accounting for shareowner ownership positions, since the recordkeeping is done by one system—TA2000.
On July 31, 2007, DST acquired TASS, LLC ("TASS"). TASS provides mutual fund shareowner subaccounting services on a full service basis to the broker/dealer industry. TASS uses the subaccounting platform of TA2000 to perform these services for its customers. The acquisition of TASS expanded DST's presence in the subaccounting marketplace.
Revenues for subaccounting services are generally based on the number of subaccounts serviced, and, as a result of the level of services provided directly by the broker/dealer, the per account revenue is less than what DST derives from its traditional mutual fund shareowner processing services because fewer of TA2000's features are required.
Acquisition of BlueDoor Technologies
On November 14, 2008, DST completed the acquisition of BlueDoor Technologies Pty Ltd ("BlueDoor"), which provides software solutions for participant accounting for the funds management and retirement savings ("superannuation") markets in Australia. The acquisition was accounted for as a purchase and the consideration paid for BlueDoor on the acquisition date consisted of approximately $10.3 million of cash and 85,006 shares of DST common stock at an approximate value of $3.1 million. DST believes the expansion of its software solution offerings will provide broader product offerings to existing and new customers.
Gain on Sale of Asurion
On July 3, 2007, the Board of Directors of Asurion consummated a transaction whereby certain private equity firms acquired a significant stake in Asurion. In connection with the sale, DST received cash proceeds of $986.3 million and receivables of approximately $39.2 million that were collected in June 2008, and DST's equity interest in Asurion was reduced. Effective with the closing of the transaction, DST accounts for its investment in Asurion under the cost basis of accounting and no longer records equity in earnings of Asurion. At December 31, 2009, DST's net investment in Asurion was
46
$3.1 million. The sale of Asurion resulted in DST recording a $998.0 million pretax gain during the year ended December 31, 2007. A majority of the cash proceeds received in connection with this transaction were used to pay down the Company's debt and related facilities and to satisfy income tax obligations associated with the sale.
Workforce Reduction
On January 29, 2010, DST began implementation of a plan to reduce its workforce during 2010. This plan was necessitated by the extended economic downturn which has negatively impacted the financial services industry. The plan will result in a reduction of approximately 7% of the employee workforce, affecting all DST domestic and international business units. The Company anticipates a reduction in annual pre-tax operating costs of approximately $67 million as a result of the reduction. The reduction in workforce is part of the Company's ongoing cost management initiatives which have included a general freeze on hiring and management salaries, and other controls over operating expenses. As a result of this workforce reduction, the Company anticipates a pre-tax charge in 2010 of approximately $21 million in connection with its payment of related termination benefits. Approximately $18 million in pre-tax charges will occur in the first half of 2010, with the remaining charges occurring throughout the remainder of 2010.
Off-Balance Sheet Arrangements
An off-balance sheet arrangement is any transaction, agreement or other contractual arrangement involving an unconsolidated entity under which a company has (1) made guarantees, (2) a retained or a contingent interest in transferred assets, (3) an obligation under derivative instruments classified as equity or (4) any obligation arising out of a material variable interest in an unconsolidated entity that provides financing, liquidity, market risk or credit risk support to the company, or that engages in leasing, hedging or research and development arrangements with the company.
The Company believes that its guarantee arrangements will not have a material current or future effect on its financial condition, changes in financial condition, revenues or expenses, capital expenditures, capital resources, liquidity or results of operations. These arrangements are described in Note 15 to the consolidated financial statements included in Item 8 of this report.
In January 2009, the Company entered an interest rate swap with a bank to fix the interest rate on its syndicated real estate credit agreement at approximately 4.49% (includes 1.75% applicable margin rate) beginning January 2010. This interest rate swap qualifies as a derivative instrument.
Accounting and reporting guidance for derivative instruments, including certain derivative instruments embedded in other contracts and hedging activities requires that an entity recognize all derivatives as either assets or liabilities in the balance sheet and measure those instruments at fair value, and that the changes in the fair value of derivatives are recorded each period in current earnings or other comprehensive income, depending on whether a derivative is designated as part of a hedge transaction and, if it is, the type of hedge transaction.
47
The Company's interest rate swap is a cash flow hedge of future interest payments under the Company's real estate credit agreement and uses a pay-fixed, receive-variable, forward starting interest rate swap. The Company's risk management objective and strategy for undertaking this hedge is to eliminate the variability of interest cash flows related to the Company's floating-rate real estate credit agreement. Changes in the cash flows of the interest rate swap are expected to offset the changes in cash flows attributable to fluctuations in the one-month LIBOR benchmark interest rate. The derivative instrument is a receive floating, pay 2.74% fixed, forward starting interest rate swap with an effective date of January 4, 2010 and a maturity date of September 16, 2013. Effectiveness of the hedge relationship is assessed on a quarterly basis both prospectively and retrospectively using the "cumulative dollar offset" method, in which the cumulative changes in the value of the hedging instrument are directly compared with the cumulative change in the fair value or cash flows of the hedged item. A dollar offset ratio of between 0.80 and 1.25 is required in order to qualify for hedge accounting treatment. At inception of the hedge, the cumulative dollar offset ratio is 1.00 since the terms of the perfect hypothetical swap match those of the actual swap. The derivative accounting guidance indicates that hedge effectiveness occurs only if the cumulative gain or loss on the derivative hedging instrument exceeds the cumulative change in the expected future cash flows of the hedged transaction. At December 31, 2009, the fair value of the Company's pay-fixed, receive-variable, forward starting interest rate swap was a liability of $1.9 million, which is included in other non-current liabilities in the Consolidated Balance Sheet. The Company determined there was no ineffectiveness during the year ended December 31, 2009, which resulted in the changes in fair value of this swap being recorded in other comprehensive income.
The Company may have obligations arising out of variable interests in unconsolidated entities. See the discussion included in Note 2 to the consolidated financial statements included in Item 8 of this report.
In addition, the Company has $580.1 million of convertible senior debentures outstanding at December 31, 2009. The debentures are convertible under specified circumstances into shares of the Company's common stock.
DST securitizes certain of its domestic accounts receivable. On May 21, 2009, DST entered into a $175.0 million accounts receivable securitization program with a third-party, multi-seller, asset-backed commercial paper conduit administered by a bank. This $175.0 million program replaced DST's previous $200.0 million accounts receivable securitization program with a third-party, multi-seller, asset-backed commercial paper conduit administered by a different bank which expired by its terms on May 21, 2009.
Under the terms of the $175.0 million accounts receivable securitization program, (a) DST periodically acquires accounts receivable originated by certain of its domestic subsidiaries, including, but not limited to, DST Output, DST Health Solutions, DST Technologies and Argus Health Systems (the "Subsidiary Originators"), (b) DST transfers receivables originated by DST and receivables acquired from the Subsidiary Originators, on a periodic basis, to a wholly-owned bankruptcy remote special purpose subsidiary of DST (the "SPE"), and (c) the SPE then sells undivided interests in the receivables to the commercial paper conduit. DST retains servicing responsibility over the receivables. The assets of the SPE are not available to satisfy the creditors of any other person, including DST or any of its subsidiaries or affiliates. Further, neither DST nor the SPE guarantees collectability of the receivables or the creditworthiness of obligors. If DST has not refinanced its $600.0 million syndicated line of credit agreement (maturing on July 1, 2010) by March 31, 2010, the $175.0 million accounts receivable securitization program commitment is scheduled to become $125.0 million. The conduit's purchase commitment will expire on May 20, 2010 unless otherwise extended in accordance with the program agreements.
The periodic transfers of undivided interests in the receivables by the SPE to the conduit meet the requirements for sale accounting treatment in accordance with the authoritative accounting guidance
48
for transfers and servicing of financial assets. Accordingly, the portion of the receivables transferred to the conduit, up to an advance amount which cannot exceed $175.0 million, have been removed from the Consolidated Balance Sheet. The SPE retains an interest in the receivables in excess of the amount transferred to the conduit, and such receivables will continue to be recognized on the Consolidated Balance Sheet. The carrying value of the retained interest approximates its estimated fair value at the balance sheet date. The Company believes increases in the level of assumed interest rates and/or credit losses compared to assumptions in effect at the balance sheet date by 10% or 20% would not materially affect the fair value of the retained interest at the reporting date.
At December 31, 2009 and 2008, the total outstanding undivided interest in the receivables held by the conduit under the accounts receivable securitization programs was $125.0 million and $130.0 million, respectively. The Consolidated Statement of Cash Flows for the year ended December 31, 2009 presents the net cash flows under the Company's accounts receivable securitization programs. Proceeds received from accounts receivable securitizations under the $175.0 million program have been presented net of cash collections from transferred receivable interests under the $200.0 million program that were remitted to the conduit prior to the expiration of the $200.0 million program.
Aggregate transfers of undivided interests in the receivables from the SPE to the conduit were $1,738.7 million and $1,789.9 million for the years ended December 31, 2009 and 2008, respectively. A $26.6 million and $32.0 million retained interest in the receivables partially sold is included in accounts receivable on the Consolidated Balance Sheet at December 31, 2009 and 2008, respectively. The impact on net income stemming from these transfers was not material.
New Authoritative Accounting Guidance
Accounting for Transfers of Financial Assets
In June 2009, the Financial Accounting Standards Board ("FASB") issued new authoritative accounting guidance related to transfers of financial assets. This guidance changes the accounting for securitizations of mortgages and other financial instruments and the consolidation requirements for qualifying special-purpose entities ("QSPE"). DST will be required to adopt this guidance on January 1, 2010. Early application is prohibited.
Besides removing the concept of a QSPE, this new accounting guidance: a) clarifies the determination of whether a transferor and all the entities included in the transferor's financial statements being presented have surrendered control over transferred financial assets; b) defines the term participating interest to establish specific conditions for reporting a transfer of a portion of a financial asset as a sale; c) requires a transferor to recognize and initially measure at fair value all assets obtained and liabilities incurred as a result of a transfer of financial assets accounted for as a sale; and d) enhances disclosures to provide financial statement users with greater transparency about transfers of financial assets and a transferor's continuing involvement with transferred financial assets.
DST currently believes that the adoption of this new authoritative accounting guidance will require accounts receivable transferred under the Company's accounts receivable securitization program to be reflected as assets of the Company and the proceeds received from such transfers being reflected as debt on the Consolidated Balance Sheet on January 1, 2010. As of December 31, 2009, the amount of transferred accounts receivable was $125.0 million. DST continues to evaluate this new guidance and the impact it may have on the consolidated financial statements.
Variable Interest Entities
In June 2009, the FASB issued new authoritative accounting guidance related to variable interest entities. Among other items, this accounting guidance responds to concerns about the application of certain key provisions of the current accounting guidance for variable interest entities, including those
49
regarding the transparency of the involvement with variable interest entities. DST will be required to adopt this new authoritative accounting guidance on January 1, 2010. Early application is prohibited. The Company has not yet determined the impact that the adoption of this new accounting guidance may have on the consolidated financial statements.
Multiple-Element Revenue Arrangements
In October 2009, the FASB issued new authoritative accounting guidance related to multiple element revenue arrangements. This update provides guidance on whether multiple elements (deliverables) exist, how the deliverables should be separated and how the consideration should be allocated. The new guidance established a hierarchy for determining the selling price of a deliverable. The guidance is effective prospectively for revenue arrangements entered into or materially modified in fiscal years beginning on or after June 15, 2010. Early adoption is permitted. The Company has not yet determined the impact that the adoption of this new accounting guidance may have on the consolidated financial statements.
Certain Revenue Arrangements That Include Software Elements
In October 2009, the FASB issued new authoritative accounting guidance related to certain revenue arrangements that include software elements. This new guidance changes the accounting model for revenue arrangements that include both tangible products and software elements and also provides guidance on how consideration should be allocated in an arrangement that includes both tangible products and software. The new authoritative accounting guidance is effective prospectively for revenue arrangements entered into or materially modified in fiscal years beginning on or after June 15, 2010. Early adoption is permitted. The Company has not yet determined the impact that the adoption of this new accounting guidance may have on the consolidated financial statements.
Earnings per Share Proposed Accounting Standard
In August 2008, the FASB issued a revised exposure draft, that would amend current earnings per share accounting guidance to clarify guidance for mandatorily convertible instruments, the treasury stock method, contingently issuable shares, and contracts that may be settled in cash or shares. The final authoritative accounting guidance has yet to be issued. In April 2009, the FASB decided to pause the earnings per share project.
The proposed guidance, which is designed for convergence with international accounting standards, would require the use of the "if-converted" method from the date of issuance of the convertible debentures. The proposed guidance would remove the ability of a company to support the presumption that the convertible securities will be satisfied in cash and not converted into shares of common stock. Accordingly, the Company's stated intention to settle conversions of its convertible debentures with cash for the principal and accrued and unpaid interest and issue common stock for any conversion value amount over the principal and accrued and unpaid interest amounts would no longer be accepted under the current guidance, if amended as proposed. Retrospective application would be required for all changes, except that retrospective application would be prohibited for contracts that were either settled in cash prior to adoption or modified prior to adoption to require cash settlement. For DST, adoption of this accounting guidance, as proposed, will require retroactive restatement of the Company's diluted earnings per share calculations subsequent to the issuance of the convertible debentures. In calculating diluted earnings per share using the "if converted" method included in the exposure draft, the Company would need to increase net income for the interest expense associated with the convertible debentures, net of tax, and increase the incremental shares assumed to be issued upon conversion by approximately 11.7 million shares (less shares already included in diluted earnings per share, if any), the amount of shares that would be issued if all $580.1 million of the senior convertible debentures at December 31, 2009 would be converted to equity. Under this "if converted"
50
method, diluted earnings per share would have been $4.15, $3.68 and $10.81 (versus reported diluted earnings per share of $4.84, $4.21 and $12.14) for the years ended December 31, 2009, 2008 and 2007, respectively. The revised exposure draft also contains other EPS computational changes (e.g., treasury stock method considerations) that may have an effect on the Company's diluted earnings per share calculation. DST is continuing to monitor the FASB's progress related to this proposed accounting guidance.
The proposed change in accounting principle would affect the calculation of diluted earnings per share during the period the debentures are outstanding, but would not affect DST's ability to ultimately settle the convertible debentures in cash, shares or any combination thereof.
The estimated impact of this new accounting guidance reflects the Company's current estimates based upon the exposure draft in its current form. There may be material differences between these estimates and the actual impact of the guidance when issued as final.
Critical Accounting Policies and Estimates
The Company's discussion and analysis of its financial condition, results of operations and cash flows are based upon its consolidated financial statements, which have been prepared in accordance with accounting principles generally accepted in the United States of America. The preparation of these consolidated financial statements requires the Company to make estimates and judgments that affect the reported amounts of assets, liabilities, revenues and expenses and related disclosures of contingent assets and liabilities. The Company bases its estimates on historical experience and on various other assumptions that are believed to be reasonable under the circumstances, the results of which form the basis for making judgments about the carrying values of assets and liabilities that are not readily apparent from other sources. Actual results may differ from these estimates under different assumptions or conditions.
The Company believes the following critical accounting policies affect its more significant judgments and estimates used in the preparation of its consolidated financial statements: revenue recognition; software capitalization and amortization; depreciation of fixed assets; valuation of long-lived and intangible assets and goodwill; accounting for investments; and accounting for income taxes.
Use of estimates
The preparation of financial statements in conformity with accounting principles generally accepted in the United States of America requires management to make estimates and assumptions that affect the reported amounts of assets and liabilities and disclosure of contingent assets and liabilities at the date of the financial statements and the reported amounts of revenues and expenses during the reporting period. Actual results could differ from those estimates.
Revenue recognition
The Company derives over 90% of its revenues as a result of providing processing and services under contracts. The majority of the amount is billed on a monthly basis generally with thirty-day collection terms. Revenues are recognized for monthly processing and services upon performance of the services. In the event a portion of the Company's revenues are due 12 months or more from the invoice date, the Company accounts for the revenue as not being fixed and determinable. In these cases, the revenue is recognized as it becomes due.
The Company recognizes revenue when the following criteria are met: (1) persuasive evidence of an arrangement exists; (2) delivery has occurred or services have been rendered; (3) the sales price is fixed or determinable; and (4) collectability is reasonably assured. If there is a customer acceptance provision
51
in a contract or if there is uncertainty about customer acceptance, the associated revenue is deferred until the Company has evidence of customer acceptance.
The Company may enter into revenue arrangements to sell products and services in which the Company is obligated to deliver to its customers multiple products and/or services (multiple deliverables). Revenue arrangements with multiple deliverables are evaluated to determine if the deliverables (items) can be divided into more than one unit of accounting. An item can generally be considered a separate unit of accounting if all of the following criteria are met: (1) the delivered item(s) has value to the customer on a standalone basis; (2) there is objective and reliable evidence of the fair value of the undelivered item(s); and (3) if the arrangement includes a general right of return relative to the delivered item(s), delivery or performance of the undelivered item(s) is considered probable and substantially in the control of the Company. Items which do not meet these criteria are combined into a single unit of accounting. If there is objective and reliable evidence of fair value for all units of accounting, the arrangement consideration is allocated to the separate units of accounting based on their relative fair values. In cases where there is objective and reliable evidence of the fair value of the undelivered item(s) in an arrangement but no such evidence for the delivered item(s), the residual method is used to allocate the arrangement consideration. For units of accounting which include more than one deliverable, the Company generally defers all revenue for the unit of accounting until the period over which the last undelivered item is delivered.
The Company's standard business practice is to bill monthly for development, consulting and training services on a time and materials basis. There are exceptions, whereby certain commercial arrangements require a fixed fee for development and consulting services. For fixed fee arrangements, the Company recognizes revenue on a "percentage of completion" basis.
The Company derives less than 10% of its revenues from licensing products. The Company licenses its asset management products and its AWD product generally to non-mutual fund customers and international customers, its healthcare administration processing software solutions to domestic customers and its customer billing software solution products to international and domestic customers. Perpetual software license revenues are recognized at the time the contract is signed, the software is delivered and no future software obligations exist. Deferral of software license revenue billed results from delayed payment provisions, disproportionate discounts between the license and other services or the inability to unbundle certain services. Term software license revenues are recognized ratably over the term of the license agreement.
The Company recognizes revenues for maintenance services ratably over the contract term, after collectability has been assured.
The Company has entered into various agreements with related parties, principally unconsolidated affiliates, to utilize the Company's data processing facilities and computer software systems. The Company believes that the terms of its contracts with related parties are fair to the Company and are no less favorable than those obtained from unaffiliated parties.
The Company assesses collection based on a variety of factors, including past collection history with the customer and the credit- worthiness of the customer. The Company generally does not request collateral from its customers. If it is determined that collection of revenues is not reasonably assured, revenue is deferred and is recognized at the time it becomes reasonably assured, which is generally upon receipt of cash. Allowances for billing adjustments are determined as revenues are recognized and are recorded as reductions in revenues. Doubtful account expense for the Company is immaterial.
Software capitalization and amortization
The Company makes substantial investments in software to enhance the functionality and facilitate the delivery of its processing and services as well as its sale of licensed products. Purchased software is
52
recorded at cost and is amortized on a straight-line basis over the estimated economic lives of three to five years. The Company also develops a large portion of its software internally. The Company is required to capitalize software development costs under the authoritative accounting guidance related to accounting for the costs of computer software developed or obtained for internal use, which requires capitalization of certain development costs after the design has been approved and management is committed to funding the project. The authoritative accounting guidance related to accounting for the costs of computer software to be sold, leased or otherwise marketed applies to software that will be sold or delivered to third parties and requires capitalization of research and development costs after technological feasibility has been established and management is committed to funding the project. The capitalized software development costs are generally amortized on a straight-line basis, based on an estimated economic life, which is dependent on the nature of the project. The Company has assigned lives of three to five years for capitalized software development.
Significant management judgment is required in determining what projects and costs associated with software development will be capitalized and in assigning estimated economic lives to the completed projects. Management specifically analyzes software development projects and analyzes the percentage of completion as compared to the initial plan and subsequent forecasts, milestones achieved and the commitment to continue funding the projects. Significant changes in any of these items may result in discontinuing capitalization of development costs, as well as immediately expensing previously capitalized costs. The Company reviews, on a quarterly basis, its capitalized software for possible impairment.
Depreciation of fixed assets
The Company's approach on personal property, specifically data processing, printing and inserting equipment, is to own the property as opposed to leasing it where practicable. The Company believes this approach provides it better flexibility for disposing or redeploying the asset as it nears the completion of its economic life. The Company depreciates data processing equipment using accelerated depreciation methods over the following lives: (1) non-mainframe equipment—three years; (2) mainframe central processing unit—four years; and (3) mainframe direct access storage devices and tape devices—five years. The Company depreciates furniture and fixtures over estimated useful lives, principally three to five years, using accelerated depreciation methods. The Company depreciates large printing and inserting equipment used by the Output Solutions Segment over a five to seven year life using accelerated depreciation methods. The Company depreciates leasehold improvements using the straight-line method over the lesser of the term of the lease or life of the improvements. Management judgment is required in assigning economic lives to fixed assets. Management specifically analyzes fixed asset additions, remaining net book values and gain/loss upon disposition of fixed assets to determine the appropriateness of assigned economic lives. Significant changes in any of these items may result in changes in the economic life assigned and the resulting depreciation expense.
Valuation of long-lived and intangible assets and goodwill
The Company assesses the impairment of goodwill at least annually and assesses identifiable intangibles, long-lived assets and related assets whenever events or changes in circumstances indicate that the carrying value may not be recoverable. Factors that are considered important which could trigger an impairment review include the following: significant underperformance relative to expected historical or projected future operating results; significant changes in the manner of the Company's use of the acquired assets or the strategy for the overall business; and significant negative industry or economic trends. When it is determined that the carrying value of intangibles, long-lived assets and related goodwill may not be recoverable based upon the existence of one or more of the above indicators of impairment, the Company assesses actual impairment based on gross cash flows.
53
The Company and its unconsolidated affiliates do not amortize goodwill and intangible assets that have indefinite useful lives, instead these assets are tested for impairment annually (as of October 1) and whenever events or changes in circumstances indicate that the carrying value may not be recoverable. No impairments have been identified as a result of these annual tests. The fair value of the reporting units was estimated using the expected present value of future cash flows.
At December 31, 2009, the Company had $822.1 million of long-lived and intangible assets and goodwill on its Consolidated Balance Sheet.
Accounting for investments
The Company has three significant types of investments that require accounting judgment: 1) investments in available-for-sale securities, which are comprised principally of investments in State Street, Computershare and Euronet Worldwide, Inc.; 2) investments in unconsolidated affiliates, which is comprised principally of BFDS, IFDS U.K., IFDS L.P. and certain real estate joint ventures; and 3) investments in private equity funds and other investments accounted for under the cost method.
The Company accounts for investments in corporations, for which it owns less than 20% and does not have significant influence, in accordance with authoritative guidance related to accounting for certain investments in debt and equity securities, which requires the Company to designate its investments as trading or available-for-sale. At December 31, 2009, the Company had approximately $893.3 million of available-for-sale securities. Available-for-sale securities are reported at fair value with unrealized gains and losses excluded from earnings and recorded net of deferred taxes directly to stockholders' equity as accumulated other comprehensive income. At December 31, 2009, the Company's available-for-sale securities had gross unrealized holding gains of $557.8 million, gross unrealized holding losses of $0.9 million and unrealized gains from changes in foreign currency exchange rates of $17.0 million.
The impact of a 10% change in fair value of the Company's investments would be approximately $54.6 million to comprehensive income. The Company records an investment impairment charge for an investment with a gross unrealized holding loss resulting from a decline in value that is other than temporary. Future adverse changes in market conditions or poor operating results of underlying investments could result in losses or an inability to recover the carrying value of the investments that may not be reflected in an investment's current carrying value, thereby possibly requiring an impairment charge in the future, which could have a material effect on the Company's financial position.
The equity method of accounting is used for investments in corporations in which the Company or its subsidiaries have at least a 20% voting interest and significant influence but does not control, and for all investments in partnerships and similar interests which the Company has at least 5% ownership and does not control. The Company classifies these investments as unconsolidated affiliates. Under the equity method, the Company recognizes, on an equity basis, income or losses from its pro-rata share of these unconsolidated affiliates' net income or loss, which changes the carrying value of the investment of the unconsolidated affiliate. In certain cases, pro-rata losses are recognized only to the extent of the Company's investment and advances to the unconsolidated affiliate.
Partnership and similar investment interests (including investments in private equity funds where the Company is a limited partner) in which the Company has at least a 5% ownership are accounted for on an equity method basis based on the Company's pro-rata ownership; the cost method of accounting is used for these investments when the Company has a de-minimus ownership percentage and no ability to exercise significant influence. The Company's cost method investments are held at the lower of cost or market.
54
Accounting for income taxes
The Company accounts for income taxes in accordance with authoritative accounting guidance. The objectives of accounting for income taxes are to recognize the amount of taxes payable or refundable for the current year and deferred tax liabilities and assets for the future tax consequences of events that have been recognized in an entity's financial statements or tax returns. Judgment is required in addressing the future tax consequences of events that have been recognized in our consolidated financial statements or tax returns (e.g., realization of deferred tax assets, changes in tax laws or interpretations thereof).
In addition, the Company is subject to the continuous examination of its income tax returns by the Internal Revenue Service and other tax authorities. A change in the assessment of the outcomes of such matters could materially impact the consolidated financial statements. The calculation of tax liabilities involves dealing with uncertainties in the application of complex tax regulations. In accordance with authoritative accounting guidance related to accounting for uncertainty in income taxes, the Company recognizes liabilities for anticipated tax audit issues based on its estimate of whether, and the extent to which, additional taxes may be required. If the Company ultimately determines that payment of these amounts is unnecessary, then it reverses the liability and recognizes a tax benefit during the period in which it determines that the liability is no longer necessary. The Company also recognizes tax benefits to the extent that it is more likely than not that its positions will be sustained if challenged by the taxing authorities. To the extent the Company prevails in matters for which liabilities have been established, or is required to pay amounts in excess of its liabilities, the Company's effective tax rate in a given period may be materially affected. An unfavorable tax settlement would require cash payments and may result in an increase in the Company's effective tax rate in the year of resolution. A favorable tax settlement would be recognized as a reduction in its effective tax rate in the year of resolution. The Company reports interest and penalties related to uncertain income tax positions as income taxes.
55
The following table summarizes the Company's operating results (millions, except per share amounts):
| |
Year Ended December 31, | ||||||||||
|---|---|---|---|---|---|---|---|---|---|---|---|
| |
2009 | 2008 | 2007 | ||||||||
Revenues |
|||||||||||
Operating revenues |
|||||||||||
Financial Services |
$ | 1,115.2 | $ | 1,142.7 | $ | 1,134.6 | |||||
Output Solutions |
482.3 | 528.2 | 555.1 | ||||||||
Investments and Other |
59.4 | 61.8 | 63.1 | ||||||||
Elimination Adjustments |
(61.5 | ) | (57.2 | ) | (57.4 | ) | |||||
|
1,595.4 | 1,675.5 | 1,695.4 | ||||||||
% change from prior year |
(4.8 | )% | (1.2 | )% | 8.9 | % | |||||
Out-of-pocket reimbursements |
|||||||||||
Financial Services |
54.3 | 72.6 | 65.0 | ||||||||
Output Solutions |
571.5 | 537.2 | 542.0 | ||||||||
Investments and Other |
0.7 | 0.7 | 0.4 | ||||||||
Elimination Adjustments |
(4.0 | ) | (0.6 | ) | (0.3 | ) | |||||
|
622.5 | 609.9 | 607.1 | ||||||||
% change from prior year |
2.1 | % | 0.5 | % | (10.7 | )% | |||||
Total revenues |
$ | 2,217.9 | $ | 2,285.4 | $ | 2,302.5 | |||||
% change from prior year |
(3.0 | )% | (0.7 | )% | 3.0 | % | |||||
Income from operations |
|||||||||||
Financial Services |
$ | 248.6 | $ | 304.0 | $ | 286.7 | |||||
Output Solutions |
22.7 | 36.7 | 38.8 | ||||||||
Investments and Other |
10.7 | 13.4 | 25.9 | ||||||||
Elimination Adjustments |
(7.7 | ) | (7.6 | ) | (7.5 | ) | |||||
|
274.3 | 346.5 | 343.9 | ||||||||
Interest expense |
(42.2 | ) | (55.4 | ) | (60.3 | ) | |||||
Other income (expense), net |
85.1 | (15.5 | ) | 45.0 | |||||||
Gain on sale of Asurion |
998.0 | ||||||||||
Equity in earnings of unconsolidated affiliates |
37.3 | 34.7 | 62.6 | ||||||||
Income before income taxes |
354.5 | 310.3 | 1,389.2 | ||||||||
Income taxes |
112.9 | 67.4 | 514.5 | ||||||||
Net income |
$ | 241.6 | $ | 242.9 | $ | 874.7 | |||||
Basic earnings per share |
$ | 4.87 | $ | 4.53 | $ | 13.80 | |||||
Diluted earnings per share |
$ | 4.84 | $ | 4.21 | $ | 12.14 | |||||
Non-GAAP diluted earnings per share |
$ | 3.59 | $ | 3.71 | $ | 3.48 | |||||
Consolidated revenues
Consolidated total revenues (including Out-of-Pocket ("OOP") reimbursements) decreased $67.5 million or 3.0% during the year ended December 31, 2009 as compared to December 31, 2008 and decreased $17.1 million or 0.7% during the year ended December 31, 2008 as compared to December 31, 2007. Consolidated operating revenues decreased $80.1 million or 4.8% in 2009 as compared to 2008 and decreased $19.9 million or 1.2% in 2008 as compared to 2007. The $80.1 million decrease in consolidated operating revenues during 2009 was attributable to declines of $45.9 million in Output Solutions and $27.5 million in Financial Services, both as compared to 2008. The declines in
56
Output Solutions reflect lower images produced, lower revenue per unit (packages and images) processed and the effects of changes in foreign currency exchange rates. Absent $74.9 million of net incremental operating revenues resulting from both the consolidation of Argus and a full year of BlueDoor, Financial Services operating revenues decreased $102.4 million during 2009 as compared to 2008. On this basis, the declines in Financial Services resulted from lower international revenues from decreased demand for professional services and changes in foreign currency exchange rates (principally changes between the U.S. Dollar and the British Pound), reductions in mutual fund shareowner processing service revenues, lower DST Health Solutions professional services revenues, AWD software license revenues and lower data processing support revenue. The $19.9 million decrease in consolidated operating revenues during 2008 was attributable to a $26.9 million decline in Output Solutions partially offset by an increase in Financial Services of $8.1 million. The Output Solutions decline reflects lower U.S. images produced in 2008 and a $3.1 million contract termination fee recognized in first quarter 2007. The Financial Services increase is primarily from increases in mutual fund shareowner processing services attributable to higher levels of accounts serviced, principally from new client conversions since second quarter 2007, and higher levels of professional services provided by DST Health Solutions, partially offset by lower data processing support revenues of approximately $5.0 million due to the expiration of a contract on June 30, 2008 and lower international professional service revenues.
Consolidated OOP reimbursements increased $12.6 million or 2.1% in 2009 as compared to 2008 and increased $2.8 million or 0.5% in 2008 as compared to 2007. The increase in consolidated OOP reimbursement revenue in 2009 was primarily due to an increase in the number of clients where Output Solutions procures postage on behalf of the client. The increase in consolidated OOP reimbursement revenue in 2008 as compared to 2007 was primarily due to higher Financial Services OOP reimbursement revenues from higher volumes, partially offset by lower Output Solutions OOP reimbursement revenues resulting from certain clients purchasing postage directly from the postal service rather than have Output Solutions procure postage on behalf of the client.
Income from operations
Consolidated income from operations decreased $72.2 million or 20.8% during the year ended December 31, 2009 as compared to 2008 and increased $2.6 million or 0.8% during the year ended December 31, 2008 as compared to 2007. U.S. income from operations decreased $56.5 million or 15.8% in 2009 as compared to 2008 and increased $23.9 million or 7.2% in 2008 as compared to 2007. International income from operations decreased $15.7 million or 151.7% in 2009 as compared to 2008 and decreased $21.3 million or 195.5% in 2008 as compared to 2007. The $72.2 million decrease in consolidated income from operations during 2009 is attributable to declines of $55.4 million in Financial Services and $14.0 million in Output Solutions, both as compared to 2008. Excluding incremental revenues from the consolidation of Argus and acquisition of BlueDoor, operating revenues for Financial Services decreased $102.4 million in 2009. Argus and BlueDoor had minimal effect on operating income during 2009. Lower operating revenues from other financial services operations had a negative impact on operating income during 2009. Software license revenues declined approximately $10.0 million, which has a direct impact on operating income. Also contributing to the decline in operating income during 2009 were increased deferred compensation costs of approximately $20.9 million (the effect of which is offset as unrealized appreciation on trading securities in other income, net), severance costs incurred in international operations from reductions in staffing levels, software impairments of approximately $2.5 million and lower levels of data processing support revenues. These decreases in income from operations were partially offset by lower compensation and benefit related costs from lower staffing levels, lower incentive compensation accruals, lower share based compensation costs of approximately $6.9 million and lower travel related costs. In addition, costs and expenses during 2008 included higher compensation costs related to the achievement of goals from prior business acquisitions and higher costs related to a new client subaccount conversion in 2008. Output Solutions decrease in income from operations during 2009 primarily resulted from lower
57
operating revenues, primarily from lower images produced. The $2.6 million increase in consolidated income from operations during 2008 is from increased earnings in Financial Services of $17.3 million, partially offset by decreased earnings in Investments and Other of $12.5 million and Output Solutions of $2.1 million. The $17.3 million increase in 2008 for Financial Services is mostly related to a reduction in deferred compensation liabilities of approximately $14.0 million (the effect of which is offset as an expense in other income, net) and higher earnings from mutual fund shareowner processing from higher accounts serviced, partially offset by decreases in data processing support revenues of approximately $5.0 million and from lower international software license and professional service revenues. The lower earnings from the Investments and Other Segment during 2008 is primarily due to the sale of properties for a gain of approximately $12.4 million in 2007. Output Solutions income from operations decreased during 2008 from lower operating revenues related to lower images produced.
Interest expense
Interest expense was $42.2 million, $55.4 million and $60.3 million during the years ended December 31, 2009, 2008 and 2007, respectively. Interest expense decreased $13.2 million during 2009, as compared to 2008, attributable to lower average interest rates and lower average debt balances, partially offset by $4.7 million of financing costs associated with the Series A for Series C convertible senior debentures exchange transaction that occurred in fourth quarter 2009. Interest expense decreased $4.9 million during 2008, as compared to 2007, attributable to lower average interest rates partially offset by higher average debt balances. The Company used proceeds from the Asurion sale in 2007 to pay down debt. Increased share repurchase activity during 2008 resulted in higher average debt balances in 2008.
Other income (expense), net
The components of other income (expense) are as follows (in millions):
| |
Year Ended December 31, | |||||||||
|---|---|---|---|---|---|---|---|---|---|---|
| |
2009 | 2008 | 2007 | |||||||
Gain on equity interest in Argus Health Systems |
$ | 41.7 | $ | $ | ||||||
Net realized gains from sale of available-for-sale securities |
46.0 | 32.1 | 13.3 | |||||||
Other than temporary impairments / unrealized losses on available-for-sale securities |
(27.3 | ) | (53.1 | ) | (10.7 | ) | ||||
Net gains (losses) on private equity funds and other investments |
(1.8 | ) | (20.8 | ) | (1.4 | ) | ||||
Gain on extinguishment of senior convertible debentures |
5.9 | 10.8 | ||||||||
Dividend income |
10.4 | 24.6 | 23.9 | |||||||
Interest income |
5.7 | 7.4 | 15.1 | |||||||
Miscellaneous items |
4.5 | (16.5 | ) | 4.8 | ||||||
Other income (expense), net |
$ | 85.1 | $ | (15.5 | ) | $ | 45.0 | |||
Other income (expense), net was income of $85.1 million, expense of $15.5 million and income of $45.0 million during the years ended December 31, 2009, 2008, and 2007, respectively.
The Company recorded a gain of $41.7 million during 2009 related to its purchase of the remaining 50% interest of Argus for $57.0 million. In accordance with new authoritative accounting guidance on business combinations, the acquisition of the remaining 50% of Argus on March 31, 2009 was treated as a step acquisition. Accordingly, DST remeasured its previously held equity interest in Argus to fair value, in the amount of $57.0 million, and recorded a gain of $41.7 million.
58
Net realized gains from sale of available-for-sale securities were $46.0 million, $32.1 million and $13.3 million during the years ended December 31, 2009, 2008 and 2007, respectively. Included in the $46.0 million of net realized gains during 2009 are $31.5 million of gains from the sale of approximately 7.3 million shares of Computershare Ltd. and $14.5 million of net realized gains from sales of other securities. The Company holds 22.3 million shares of Computershare Ltd. at December 31, 2009. Included in the $32.1 million of net realized gains during 2008 are $25.4 million of gains from the sale of approximately 730,000 shares of State Street Corporation ("State Street") and $6.7 million of net realized gains from sales of other securities.
The Company records investment impairment charges for an available-for-sale securities with gross unrealized holding losses resulting from a decline in value that is other than temporary. During the years ended December 31, 2009, 2008 and 2007, the Company recorded impairments of $27.3 million, $53.1 million and $10.7 million, respectively. The Company recorded impairments of $25.6 million in first quarter 2009, but the financial markets and the values of the Company's equity holdings improved during the remainder of 2009. The increase in impairments during 2008, as compared to 2007, is from significant declines in securities share prices related to adverse economic conditions in the financial and other markets. The Company records lower of cost or market valuation adjustments on private equity fund investments and other cost method investments when impairment conditions are present. During the years ended December 31, 2009, 2008 and 2007, the Company recorded $1.8 million, $20.8 million and $1.4 million, respectively, of net impairments on private equity fund and other investments related to adverse market conditions and from poor performance of the underlying investment. Future adverse changes in market conditions or poor operating results of underlying investments could result in losses or an inability to recover the carrying value of the investments that may not be reflected in an investment's current carrying value, thereby possibly requiring an impairment charge in the future, which could have a material effect on the Company's financial position.
The Company recorded $5.9 million and $10.8 million in gains during the years ended December 31, 2009 and 2008, respectively, associated with the repurchase of a portion of the Company's senior convertible debentures at a discount to carrying value. The Company repurchased approximately $14.7 million and $120.0 million in principal amount of the original $300 million 3.625% Series B convertible senior debentures during 2009 and 2008, respectively. In addition, the Company repurchased approximately $122.6 million and $8.5 million in principal amount of the original $540 million 4.125% Series A convertible senior debentures during 2009 and 2008, respectively.
The Company receives dividend income from certain investments held, including its investments in State Street and Computershare common stock. Dividend income was $10.4 million, $24.6 million and $23.9 million during the three years ended December 31, 2009, 2008 and 2007, respectively. Dividends from State Street common stock were $0.4 million, $10.6 million and $9.9 million during the years ended December 31, 2009, 2008 and 2007, respectively. State Street reduced its quarterly dividend in first quarter 2009 to $0.01 per share as compared to $0.24 per share in fourth quarter 2008 which resulted in $10.2 million of lower dividend income for DST during 2009. In addition, approximately $4.0 million of lower dividend income from other investments was recorded during 2009 as compared to 2008, attributable to a reduction of dividends in other available-for-sale securities held. The sale of approximately 7.3 million shares of Computershare Ltd. during 2009 is expected to have a negative impact on the Company's future dividend income. Higher State Street dividends during 2008 were the primary reason for the increase in dividend income as compared to 2007.
Interest income was $5.7 million, $7.4 million and $15.1 million during the years ended December 31, 2009, 2008 and 2007, respectively. The $1.7 million decrease in interest income in 2009, as compared to 2008, is attributable to lower amounts of short-term investments and lower interest rates. The $7.7 million decrease in interest income in 2008, as compared to 2007, is attributable to lower amounts of short-term investments in 2008 and lower interest rates. A portion of the cash proceeds received
59
from the sale of Asurion were invested in July 2007 and used in December 2007 to fund the Company's income tax obligations resulting from the sale.
Miscellaneous items include unrealized gains and losses on marketable securities designated as trading securities, program fees related to the Company's accounts receivable securitization program, realized foreign currency gains and losses, amortization of deferred non-operating gains and other non-operating items. Miscellaneous items had income of $4.5 million and $4.8 million during the years ended December 31, 2009 and 2007, respectively and a loss of $16.5 million during the year ended December 31, 2008. Miscellaneous items income increased $21.0 million during 2009 as compared to 2008. The increase in Miscellaneous other income items from 2009 to 2008 is primarily attributable to unrealized appreciation on marketable securities designated as trading (the effect of which is offset in the Financial Services Segment as an increase in costs and expenses), partially offset by $0.8 million associated with renewal fees incurred upon replacing the existing $200 million accounts receivable securitization program with a $175 million program with a new, third-party, multi-seller, asset-backed commercial paper conduit in May 2009. Miscellaneous items income decreased $21.3 million during 2008 as compared to 2007. The decrease in Miscellaneous other income items from 2007 to 2008 is attributable to increased unrealized losses on marketable securities designated as trading in the amount of $14.0 million (the effect of which is offset in the Financial Services Segment as a decrease in costs and expenses), from higher accounts receivable securitization program costs related to the program being in place for twelve months in 2008, but only seven months in 2007 (beginning in May 2007), and the absence of approximately $2.5 million of non-operating gains that were recorded in 2007 related to the favorable settlement of a prior business acquisition dispute and the recovery of a Chapter 11 bankruptcy claim amount due from a customer of a previously disposed segment.
Gain on sale of Asurion
The Company recorded a $998.0 million gain on the sale of the majority of its investment in Asurion on July 3, 2007. In connection with the sale, DST received cash proceeds of $986.3 million and receivables of approximately $39.2 million that were collected in June 2008. DST's equity interest in Asurion was reduced as a result of the sale.
Equity in earnings (losses) of unconsolidated affiliates
Equity in earnings (losses) of unconsolidated affiliates, net of income taxes provided by the unconsolidated affiliates is as follows (in millions):
| |
Year Ended December 31, | |||||||||
|---|---|---|---|---|---|---|---|---|---|---|
| |
2009* | 2008 | 2007 | |||||||
BFDS |
$ | 12.1 | $ | 16.4 | $ | 30.9 | ||||
IFDS U.K. |
9.2 | 10.6 | 13.5 | |||||||
IFDS L.P. |
10.9 | 5.8 | 2.3 | |||||||
Argus |
(1.5 | ) | 0.7 | 2.3 | ||||||
Asurion |
21.9 | |||||||||
Other |
6.6 | 1.2 | (8.3 | ) | ||||||
|
$ | 37.3 | $ | 34.7 | $ | 62.6 | ||||
- *
- Equity in losses of Argus Health Systems, Inc. is for the period January 1, 2009 through March 31, 2009, the date DST acquired the remaining 50% equity interest and consolidated Argus.
For the year ended December 31, 2009, DST's equity in earnings of unconsolidated affiliates was $37.3 million, an increase of $2.6 million as compared to 2008, attributable to increases at IFDS L.P.
60
and other unconsolidated affiliates, partially offset by decreased earnings at BFDS and IFDS U.K. DST acquired the remaining 50% equity interest in Argus on March 31, 2009 and no longer records equity in earnings of Argus, but consolidates Argus' results into DST's consolidated financial statements. For the year ended December 31, 2008, DST's equity in earnings of unconsolidated affiliates was $34.7 million, a decrease of $27.9 million as compared to 2007. DST sold the majority of its equity interest in Asurion on July 3, 2007 and now accounts for this investment under the cost basis. The decrease in equity in earnings during the year ended December 31, 2008 is primarily attributable to no equity in earnings of Asurion recorded in 2008 versus $21.9 million for 2007 and from lower earnings at BFDS and IFDS U.K., partially offset by increases in earnings from other unconsolidated real estate joint ventures.
DST's equity in earnings of BFDS decreased $4.3 million during the year ended December 31, 2009 as compared to 2008. The decline in earnings is primarily attributable to lower investment earnings resulting principally from lower interest rates on cash balances maintained by BFDS on behalf of customers, lease abandonment costs of approximately $1.7 million (DST's share) incurred in 2009 associated with consolidating operational facilities and higher bank fees, partially offset by lower compensation and benefit related costs from lower staffing levels and from improvements in operations. Average daily balances invested by BFDS were $856.2 million and $987.2 million during the years ended December 31, 2009 and 2008, respectively. Average interest rates earned on the balances declined from 2.43% in 2008 to 0.22% in 2009. The aggregate effect of these volume and rate declines resulted in an approximate $16.6 million decline in interest earnings by BFDS, which resulted in a decrease of DST's equity in earnings of unconsolidated affiliates of approximately $5.1 million during the year ended December 31, 2009. DST's equity in earnings of BFDS decreased $14.5 million during the year ended December 31, 2008 as compared to 2007. The decline in earnings is primarily attributable to lower investment earnings resulting primarily from lower interest rates on cash balances maintained by BFDS on behalf of customers, lower operating revenues from lower client volumes, costs associated with a reduction in staffing levels and higher operating related costs. Investment earnings during 2008 were lower than 2007 associated with lower average interest rates and lower average daily balances invested, which resulted in a significant impact on DST's equity in earnings during this period of time.
DST's equity in earnings of IFDS U.K. decreased $1.4 million during the year ended December 31, 2009, as compared to 2008. The decrease is attributable to the foreign currency exchange effects between the U.S. Dollar and British Pound, partially offset by higher shareowner processing revenues from higher accounts serviced and increased operating efficiencies. Accounts serviced by IFDS U.K. were 6.6 million at December 31, 2009, an increase of 0.7 million accounts or 11.9% from December 31, 2008. DST's equity in earnings of IFDS U.K. decreased $2.9 million during the year ended December 31, 2008, as compared to 2007. The decrease is attributable to the foreign currency exchange effects of the U.S. Dollar strengthening against the British Pound, higher operating costs to support new and existing clients and higher income taxes, partially offset by higher operating revenues from increased volumes at existing clients and from new clients. Accounts serviced by IFDS U.K. were 5.9 million at December 31, 2008, an increase of 0.1 million accounts or 1.7% from December 31, 2007.
DST's equity in earnings of IFDS L.P. (which includes IFDS Canada, Ireland and Luxembourg) increased $5.1 million during the year ended December 31, 2009, as compared to 2008. Absent a $4.5 million gain (DST's share) from the consolidation of an equity method investment owned by IFDS L.P., as the existing investment was remeasured to fair value upon consolidation, IFDS L.P. increased $0.6 million during 2009 as compared to 2008. On that basis, the increase is attributable to the foreign currency exchange effects between the U.S. dollar, the Canadian dollar and other currencies. Accounts serviced by IFDS Canada were 10.2 million at December 31, 2009, a decrease of 0.4 million accounts or 3.8% from December 31, 2008. DST's equity in earnings of IFDS L.P. increased $3.5 million during the year ended December 31, 2008, as compared to 2007, as a result of higher
61
operating revenues associated with higher levels of shareowner accounts serviced and lower new client conversion costs, partially offset by increased costs to support the increased level of accounts. Accounts serviced by IFDS Canada were 10.6 million at December 31, 2008, an increase of 3.1 million accounts or 41.3% from December 31, 2007, primarily from the conversion of a new remote service client in January 2008.
DST's equity in earnings of Argus Health Systems decreased $1.6 million during the year ended December 31, 2008, as compared to 2007, primarily as a result of lower investment earnings from lower interest rates on cash balances maintained by Argus on behalf of customers.
The Other category in the unconsolidated affiliates table above includes principally real estate joint ventures. Equity in earnings of other unconsolidated affiliates was $6.6 million during the year ended December 31, 2009, an increase of $5.4 million as compared to 2008. The improvement during 2009 was attributable to improvements in operations at certain other unconsolidated affiliates. Equity in earnings of other unconsolidated affiliates was $1.2 million during the year ended December 31, 2008, an increase of $9.5 million as compared to 2007. The improvement during 2008 was attributable to no impairments recorded in 2008 (as compared to approximately $4.9 million recorded in 2007), a gain from the early extinguishment of debt at a real estate joint venture and higher rental revenues and cost efficiencies on various real estate joint ventures.
Income taxes
The Company's effective tax rate was 31.8%, 21.7% and 37.0% for the years ended December 31, 2009, 2008 and 2007, respectively. The effective tax rate for 2009 was greater than 2008 but less than the statutory federal income tax rate of 35% primarily from certain items in both periods that were given discrete period treatment, which were partially offset by valuation allowances against international operating losses and lower dividend income in 2009. During 2009, DST recorded a $41.7 million book gain on its equity interest in Argus with no related income tax expense, reversed approximately $0.9 million of deferred tax liabilities related to the elimination of deferred tax liabilities previously established for equity in earnings of Argus, recorded an income tax benefit of approximately $5.7 million resulting from a reduction in income tax related liabilities principally associated with the completion of an IRS examination in February 2009 for the tax years ended December 31, 2002 through 2005, and had increased utilization of foreign tax credits, which were partially offset by increased valuation allowances for higher international loss carryforwards.
The effective tax rate for 2008 is lower than 2007 primarily due to income tax benefits of approximately $39.7 million resulting primarily from a net reduction in the Company's income tax related liabilities related to accounting for uncertain income tax items and from the absence of income taxes related to the Asurion sale. The net decrease in liabilities related to accounting for uncertain income tax items is principally related to the resolution of an IRS examination matter (associated with a transaction in the 2000 tax year) that was resolved in DST's favor and a change in the Company's assessment of another IRS examination matter (associated with a 2005 transaction).
The tax rates in each of the three years ended December 31, 2009 were affected by tax benefits relating to certain international operations and recognition of state tax benefits associated with income apportionment rules.
Excluding the effect of discrete period items, the Company expects its tax rate to be approximately 35.9% in 2010. The 2010 tax rate can be affected as a result of variances among the estimates and amounts of 2010 sources of taxable income (e.g., domestic consolidated, joint venture and/or international), the realization of tax credits (e.g., historic rehabilitation, research and experimentation and state incentive), adjustments which may arise from the resolution of tax matters under review and the Company's assessment of its liability for uncertain tax positions.
62
YEAR TO YEAR BUSINESS SEGMENT COMPARISONS
FINANCIAL SERVICES SEGMENT
Revenues
Financial Services Segment total revenues of $1,169.5 million decreased $45.8 million or 3.8% in 2009 as compared to 2008. Financial Services Segment operating revenues of $1,115.2 million decreased $27.5 million or 2.4% in 2009 as compared to 2008. U.S. Financial Services operating revenues increased $13.3 million or 1.3% to $1,014.0 million in 2009 as compared to 2008. Absent $68.2 million of net incremental operating revenues resulting from the consolidation of Argus on March 31, 2009, U.S. Financial Services operating revenues decreased $54.9 million during 2009 as compared to 2008. On this basis, the decrease in U.S. Financial Services operating revenues is attributable to lower mutual fund shareowner processing service revenues, lower DST Health Solutions professional services revenues, lower AWD software license revenues and lower data processing support services. The net decrease in mutual fund shareowner processing service revenues resulted from lower levels of registered accounts serviced, including the deconversion of a full-service mutual fund client which occurred during second quarter 2009, and lower TRAC participants processed (principally from a client internalizing its participant accounting operations at the end of third quarter 2008), which were partially offset by higher levels of subaccounts serviced. The decrease in DST Health Solutions professional services revenue is attributable to lower client demand for professional services, the expiration of a client processing agreement in mid 2009 and from the 2008 recognition of $2.5 million of previously deferred professional services revenues. The decline in AWD software license fees is primarily attributable to lower demand in 2009. Data processing support revenues decreased by approximately $5.0 million due to the expiration of a contract in June 2008. Financial Services Segment operating revenues from international operations for 2009 decreased $40.8 million or 28.7% to $101.2 million. Professional services provided to international financial services clients decreased from continued lower demand for these services and from changes in foreign currency exchange rates between the U.S. Dollar, the British Pound and other foreign currencies, which reduced operating revenues by approximately $11.8 million, as compared to 2008. The decrease of international operating revenues was partially offset by $6.7 million of incremental operating revenues from the acquisition of BlueDoor.
Financial Services Segment total revenues of $1,215.3 million increased $15.7 million or 1.3% in 2008 as compared to 2007. Financial Services Segment operating revenues of $1,142.7 million increased $8.1 million or 0.7% in 2008 as compared to 2007. U.S. Financial Services operating revenues increased $32.0 million or 3.3% to $1,000.7 million in 2008 primarily from higher mutual fund shareowner processing services and from higher DST Health Solutions professional service revenues, partially offset by lower data processing support revenues. The increase in mutual fund shareowner processing services is attributable to higher levels of accounts serviced, principally from new client conversions since second quarter 2007. U.S. mutual fund servicing revenues during 2008 increased approximately 3.5% as compared to 2007. The increase in DST Health Solutions revenues is attributable to new clients and higher consulting, development and implementation related activities from existing clients. The decrease in data processing support revenues of approximately $5.0 million is principally due to the expiration of a contract on June 30, 2008. Financial Services Segment operating revenues from international operations for 2008 decreased $23.9 million or 14.4% to $142.0 million. This decrease was principally a result of lower professional services and software license revenues attributable to foreign currency exchange effects from the U.S. Dollar strengthening against the British Pound and from lower software solutions implementation and consulting services.
63
The following table summarizes mutual fund shareowner accounts serviced (in millions):
| |
December 31, | ||||||||||
|---|---|---|---|---|---|---|---|---|---|---|---|
| |
2009 | 2008 | 2007 | ||||||||
Registered accounts: |
|||||||||||
Non tax-advantaged |
63.6 | 65.4 | 71.0 | ||||||||
Tax-advantaged |
46.3 | 45.8 | 46.2 | ||||||||
|
109.9 | 111.2 | 117.2 | ||||||||
Subaccounts |
11.2 |
8.9 |
1.9 |
||||||||
Total |
121.1 | 120.1 | 119.1 | ||||||||
Total shareowner accounts serviced at December 31, 2009 were 121.1 million, an increase of 1.0 million accounts or 0.8% as compared to December 31, 2008. Total shareowner accounts serviced at December 31, 2008 were 120.1 million, an increase of 1.0 million accounts or 0.8% as compared to December 31, 2007.
Registered accounts serviced at December 31, 2009 decreased 1.3 million accounts or 1.2% from the comparable amount at December 31, 2008, comprised of conversions to non-DST platforms of 2.9 million accounts (2.3 million accounts to non-DST subaccounting platforms and 0.6 million to non-DST registered account platforms) and conversions to DST's subaccounting platform of 0.9 million accounts, partially offset by new client conversions of 1.6 million accounts and net increases in existing client accounts of 0.9 million. Registered accounts serviced at December 31, 2008 decreased 6.0 million accounts or 5.1% from the comparable amount at December 31, 2007, comprised of conversions to non-DST subaccounting platforms of 5.3 million accounts, net declines in existing client accounts of 2.2 million and conversions to DST's subaccounting platform of 1.1 million accounts, partially offset by new client conversions of 2.6 million. Tax-advantaged accounts were 46.3 million at December 31, 2009, an increase of 0.5 million accounts or 1.1% as compared to December 31, 2008. The increase is primarily attributable to net increase in existing client accounts. Tax-advantaged accounts were 45.8 million at December 31, 2008, a decrease of 0.4 million accounts or 0.9% as compared to December 31, 2007. Tax-advantaged accounts represent 42.1% of total registered accounts serviced at December 31, 2009 as compared to 41.2% at December 31, 2008.
Subaccounts serviced were 11.2 million at December 31, 2009. The increase of 2.3 million subaccounts serviced during the year ended December 31, 2009 is comprised of conversions of new subaccounting clients of 1.0 million subaccounts from non-DST platforms, conversions of 0.9 million registered accounts from TA2000 and a net increase in existing client subaccounts of 0.4 million. Subaccounts serviced were 8.9 million at December 31, 2008. The increase of 7.0 million subaccounts serviced during the year ended December 31, 2008 is comprised of conversions of new subaccounting clients of 6.8 million remote subaccounts from non-DST platforms and conversions of 1.1 million registered accounts from TA2000, partially offset by net declines in existing client subaccounts of 0.9 million. The acquisition of TASS and the conversion of 6.8 million new subaccounts during 2008 has expanded DST's presence in the subaccounting marketplace. Revenues from subaccounting services are generally based on the number of subaccounts serviced and, as a result of the level of services provided directly by the broker/dealer, the per account revenue is less than what DST derives from its traditional mutual fund shareowner processing services because fewer of TA2000's features are required.
At December 31, 2009, the Company had new client commitments representing approximately 0.6 million registered accounts which are expected to be converted to TA2000 in mid 2010. An existing client has notified DST of its intention to convert 1.0 million registered accounts to TA2000 during mid 2010. The Company also expects 10.3 million registered accounts will convert to subaccounting platforms during 2010 of which 4.0 million accounts will convert to TA2000 Subaccounting.
64
At December 31, 2009, the Company's subaccounting clients have indicated they plan to convert a total of 2.1 million new subaccounts to TA2000 Subaccounting from non-DST platforms during 2010. Two existing subaccounting clients of the Company have announced their intention to terminate their processing agreements with DST and to convert approximately 5.6 million subaccounts to non-DST subaccounting platforms in 2010.
The following table (in millions) presents mutual fund shareowner accounts at December 31, 2009 and summarizes the 2010 conversion activities described above (and without taking into account any other changes in accounts serviced during 2010) to arrive at an estimated total accounts at December 31, 2010.
| |
Registered Accounts |
Subaccounts | Total Accounts |
|||||||
|---|---|---|---|---|---|---|---|---|---|---|
Balance at December 31, 2009 |
109.9 | 11.2 | 121.1 | |||||||
New client conversions |
1.6 |
2.1 |
3.7 |
|||||||
Transfers to DST Subaccounting |
(4.0 | ) | 4.0 | |||||||
Conversions to non-DST platforms |
(6.3 | ) | (5.6 | ) | (11.9 | ) | ||||
Estimated balance at December 31, 2010 |
101.2 | 11.7 | 112.9 | |||||||
The actual number of accounts estimated to convert to and from various DST platforms, as well as the timing of those events, is dependent upon a number of factors. Actual results could differ from the Company's estimates.
Defined contribution ("DC") participants represent the number of active participants processed on DST's TA2000/TRAC platform. DC participants were 4.2 million at December 31, 2009, an increase of 0.5 million or 13.5% from December 31, 2008 attributable to new client conversions. The Company has new client commitments for approximately 0.5 million new participants which are expected to convert in 2010.
Pharmacy claims paid by Argus were 285.0 million from March 31, 2009 (acquisition date) through December 31, 2009.
Active U.S. AWD workstations were 161,000 at December 31, 2009, an increase of 1,400 as compared to December 31, 2008, principally from increased workstations licensed during 2009. Active U.S. AWD workstations were 159,600 at December 31, 2008, an increase of 67,400 as compared to December 31, 2007 related to the expansion of an existing client relationship. Active international AWD workstations were 32,500 at December 31, 2009, a decrease of 8.7% as compared to December 31, 2008. Active international AWD workstations were 35,600 at December 31, 2008, an increase of 0.3% as compared to December 31, 2007.
Financial Services Segment software license fee revenues are derived principally from AWD (business process management—BPM), DST Global Solutions (investment management) and DST Health Solutions (medical claims processing). Operating revenues include approximately $42.3 million of software license fee revenues for the year ended December 31, 2009, a decrease of $10.0 million as compared to 2008. The 2009 decrease is primarily due to lower AWD and investment management software license fee revenues. Operating revenues include approximately $52.3 million of software license fee revenues for the year ended December 31, 2008, a decrease of $5.2 million as compared to 2007. The 2008 decrease is due primarily to lower investment management software license fees, partially offset by higher AWD software license fees. While license revenues are not a significant percentage of DST's total operations, they can significantly impact earnings in the period in which they are recognized. Revenues and operating results from individual license sales depend heavily on the timing, size and nature of the contract.
65
Costs and expenses
Financial Services Segment costs and expenses (including OOP costs) for the year ended December 31, 2009 were $840.6 million, an increase of $9.9 million as compared to 2008. Costs and expenses in the Financial Services Segment are primarily comprised of compensation and benefit costs, but also include reimbursable operating expenses and other costs. Reimbursable operating expenses included in costs and expenses were $54.3 million for the year ended December 31, 2009, a decrease of $18.3 million compared to 2008. Incremental costs and expenses during 2009 attributable to the consolidation of Argus and the acquisition of BlueDoor were approximately $80.6 million. Excluding reimbursable operating expenses during 2009 and 2008 and incremental costs associated with Argus and BlueDoor during 2009, costs and expenses decreased $52.4 million or 6.9% to $704.8 million for 2009. On this basis, the decrease in costs and expenses is primarily attributable to lower compensation and benefit related costs from lower staffing levels, lower incentive compensation accruals, lower travel related costs, and the foreign currency exchange effects between the U.S. Dollar and other currencies of approximately $14.5 million, partially offset by higher deferred compensation costs of approximately $20.9 million (the effect of which is offset as unrealized appreciation on trading securities in other income, net) and higher costs associated with reductions in international staffing levels.
Financial Services Segment costs and expenses (including OOP costs) for the year ended December 31, 2008 decreased $0.3 million, as compared to 2007, to $830.7 million. Reimbursable operating expenses included in costs and expenses were $72.6 million for the year ended December 31, 2008, an increase of $7.6 million compared to the same period in 2007. Excluding reimbursable operating expenses, costs and expenses decreased $7.9 million to $758.1 million for 2008, primarily from reductions in deferred compensation liabilities of approximately $14.0 million (the effect of which is offset as an expense in Other income, net), foreign currency exchange effects of the U.S. Dollar strengthening against the British Pound, certain operating cost improvements, the absence of $4.3 million of Amisys Synertech merger integration costs incurred in 2007 and the absence of $3.3 million of costs associated with the partial termination of a non-qualified deferred compensation plan incurred in 2007, partially offset by higher costs associated with international reductions in staffing levels and higher compensation related costs associated with the accrual of contingent purchase consideration from business acquisitions.
Depreciation and amortization
Financial Services Segment depreciation and amortization expense for the year ended December 31, 2009 was $80.3 million, a decrease of $0.3 million or 0.4% as compared to 2008. Incremental depreciation and amortization costs attributable to the consolidation of Argus and the acquisition of BlueDoor were $6.9 million for 2009. Excluding incremental costs of Argus and BlueDoor, depreciation and amortization decreased $7.2 million during 2009. On that basis, the decrease in depreciation and amortization is attributable to certain assets becoming fully depreciated in 2009, the Company's use of accelerated depreciation methods and lower costs associated with foreign currency exchange effects between the U.S. Dollar and other currencies, partially offset by a $2.5 million impairment of international internally developed software recorded in 2009.
Financial Services Segment depreciation and amortization expense for the year ended December 31, 2008 decreased $1.3 million or 1.6%, as compared to 2007, to $80.6 million. The decrease in depreciation and amortization expense is attributable to certain assets becoming fully depreciated in 2008.
Income from operations
Financial Services Segment income from operations was $248.6 million, a decrease of $55.4 million or 18.2% as compared to 2008. Approximately $20.9 million of the decrease is attributable to an increase in deferred compensation costs (the effect of which is offset as unrealized appreciation on trading
66
securities in other income, net). Other significant factors were costs associated with reductions in staffing levels, software impairments of approximately $2.5 million, $10.0 million of lower software license revenues, lower levels of data processing support revenues and other lower operating revenues. These decreases in income from operations were partially offset by lower compensation and benefit related costs from lower staffing levels, lower incentive compensation accruals, lower share based compensation costs of approximately $6.9 million and lower travel related costs.
Financial Services income from operations was $304.0 million for the year ended December 31, 2008, an increase of $17.3 million as compared to 2007. The increase in Financial Services income from operations is attributable to reductions in deferred compensation costs of approximately $14.0 million (the effect of which is offset as unrealized depreciation in Other income, net), higher earnings from mutual fund shareowner processing from higher accounts serviced, increased earnings from DST Health Solutions due to the recognition of $2.5 million of previously deferred professional services revenues, increased earnings from AWD related to higher software license fees and from the absence of $3.3 million and $4.3 million of charges incurred in 2007 associated with the partial termination of a non-qualified deferred compensation plan and merger integration costs related to the acquisition of Amisys Synertech, respectively, partially offset by decreases in data processing support revenues of approximately $5.0 million, lower international software license and professional service revenues, higher costs associated with international reductions in staffing levels, and higher compensation related costs associated with the accrual of contingent purchase consideration from business acquisitions. There was minimal impact on income from operations from changes in foreign currency exchange rates during 2008 as compared to 2007.
Revenues
Output Solutions Segment total revenues were $1,053.8 million and $1,065.4 million for the years ended December 31, 2009 and 2008, respectively. Operating revenues decreased $45.9 million or 8.7% to $482.3 million for the year ended December 31, 2009 as compared to 2008. The decrease in operating revenues was primarily due to lower images produced, lower revenue per unit (packages and images) processed and the effects of changes in foreign currency exchange rates. The decrease in revenue per unit is attributable to higher relative volumes from clients with lower unit pricing. In addition, foreign currency exchange effects of approximately $7.7 million between the U.S. Dollar and both the British Pound and Canadian Dollar contributed to the decrease in revenues. Out-of-pocket revenues increased $34.3 million or 6.4% to $571.5 million during the year ended December 31, 2009 as compared to 2008 principally from an increase in the number of clients where Output Solutions procures postage on behalf of the client.
Output Solutions Segment total revenues were $1,065.4 million and $1,097.1 million for the years ended December 31, 2008 and 2007, respectively. Operating revenues decreased $26.9 million or 4.8% to $528.2 million for the year ended December 31, 2008 as compared to 2007. The decrease in operating revenues was primarily due to lower images produced and from a contract termination fee of $3.1 million recorded in 2007. Out-of-pocket revenues decreased $4.8 million or 0.9% to $537.2 million during the year ended December 31, 2008 as compared to 2007 principally from changes in client postage payment arrangements; however, that trend began to reverse itself in late 2008. In response to changes in postal regulations, Output Solutions expanded its postal processing offerings.
Images produced were 12.9 billion, 13.6 billion and 17.0 billion for the years ended December 31, 2009, 2008 and 2007, respectively. Images produced decreased 0.7 billion in 2009 as compared to 2008, principally from lower volumes from existing clients, reduced amounts of transaction information included on invoices and a special privacy notice completed in 2008 that did not recur in 2009, partially offset by new client volumes. Images produced decreased 3.4 billion in 2008 as compared to 2007,
67
principally from certain telecommunications clients reducing the amount of transaction information included on invoices thereby lowering total images produced.
Items mailed were 2.4 billion during the year ended December 31, 2009 and 2.3 billion during the years ended December 31, 2008 and 2007. Items mailed are reflective of the number of our clients' underlying accounts/subscribers/customers who receive their communications via paper. The increase for 2009 is due to new client volumes, partially offset by lower volumes from existing clients and a special privacy notice completed in 2008 that did not recur in 2009.
The Company has held discussions with a significant Output Solutions Segment client that is considering internalizing its print/mail processing operations. The Company's processing agreement with this client requires a termination payment in the event the client decides to terminate. The amount of the termination payment is based on a formula that takes into consideration the number of months remaining under the processing agreement at the time the termination notice is effective. If our client decides to terminate its processing agreement, this could result in future declines in operating revenues and production volumes.
Costs and expenses
Output Solutions Segment costs and expenses (including OOP costs) for the year ended December 31, 2009 decreased $0.2 million as compared to 2008. Costs and expenses in the Output Solutions Segment are primarily comprised of reimbursable operating expenses, compensation and benefits costs, material costs (principally paper and ink) and other operating costs. Reimbursable operating expenses included in costs and expenses were $571.5 million during the year ended December 31, 2009, an increase of $34.3 million or 6.4% as compared to 2008. The increase is primarily attributable to increases in customer postage. Excluding reimbursable operating expenses, costs and expenses decreased $34.5 million or 7.6% during the year ended December 31, 2009 to $418.1 million primarily from lower material and personnel costs resulting from lower processing volumes and reduced incentive compensation costs, lower travel costs, lower leased equipment costs resulting from the implementation of owned digital print technologies and lower costs related to the effect of foreign currency exchange rates of approximately $7.4 million. These decreases were partially offset by higher customer conversion related costs and higher product development costs during 2009.
Output Solutions Segment costs and expenses (including OOP costs) for the year ended December 31, 2008 decreased $26.2 million or 2.6%, as compared to 2007, to $989.8 million. Reimbursable operating expenses included in costs and expenses were $537.2 million during the year ended December 31, 2008, a decrease of $4.8 million as compared to 2007. The decrease is principally from changes in client postage payment arrangements. Excluding reimbursable operating expenses, costs and expenses decreased $21.4 million to $452.6 million during the year ended December 31, 2008 from lower leased equipment costs resulting from the implementation of owned digital print technologies, lower material costs resulting from lower processing volumes, partially offset by higher compensation and benefit related costs from increased restricted stock amortization from a 2008 grant.
Depreciation and amortization
Output Solutions Segment depreciation and amortization was $41.5 million, $38.9 million and $42.3 million for the years ended December 31, 2009, 2008 and 2007, respectively. The 2009 increase of $2.6 million or 6.7% is attributable to increased depreciation from additional equipment to support new client requirements and expanded postal processing offerings. The 2008 decrease of $3.4 million or 8.0% is attributable to higher levels of capital expenditures in years prior to 2008 and the Company's use of accelerated depreciation methods on printers and inserters, and from certain assets becoming fully depreciated, partially offset by depreciation on new equipment purchased to replace assets that were previously leased.
68
Income from operations
Output Solutions Segment income from operations was $22.7 million for the year ended December 31, 2009, a decrease of $14.0 million as compared to 2008, primarily from lower revenues and increased depreciation from costs of equipment purchased to support new client requirements and expanded postal processing offerings. In addition, the Output Solutions Segment incurred higher customer conversion related costs and higher product development costs during 2009 as compared to 2008.
Output Solutions Segment income from operations was $36.7 million for the year ended December 31, 2008, a decrease of $2.1 million as compared to 2007. Decreases in operating revenues from lower images produced and from a contract termination fee of $3.1 million recorded in 2007, were partially offset by lower costs and expenses from reduced material and leased equipment costs associated with reduced volumes and from the implementation of owned digital print technologies, and from lower depreciation and amortization expense.
Revenues
Investments and Other Segment total revenues, including out-of-pocket reimbursements, were $60.1 million, $62.5 million and $63.5 million during the years ended December 31, 2009, 2008 and 2007, respectively. Revenues are primarily derived from real estate activities. The majority of the real estate revenues are derived from the lease of facilities to the Company's other business segments. Operating revenues (excluding out-of-pocket reimbursements) were $59.4 million, $61.8 million and $63.1 million during the years ended December 31, 2009, 2008 and 2007. The decrease in operating revenues during 2009, as compared to 2008, is attributable to lower rental activities. The decrease in operating revenues during 2008, as compared to 2007, is attributable to lower rental activities principally related to the sale of certain real estate properties in 2007.
Costs and expenses
Occupancy costs are the single largest costs included in costs and expenses in the Investments and Other Segment. Investments and Other Segment costs and expenses decreased $2.4 million in 2009 as compared to 2008 and increased $12.1 million in 2008 as compared to 2007. The decrease in 2009 is attributable to lower rent expense from purchasing a building in December 2008 that was previously leased, partially offset by a $1.2 million gain from the sale of properties in 2008 recorded as a reduction to costs and expenses. Absent this gain, costs and expenses decreased $3.6 million during 2009. Excluding the 2008 property gain discussed above and a $12.4 million property gain in 2007, costs and expenses were $38.2 million, $41.8 million and $40.9 million during the years ended December 31, 2009, 2008 and 2007.
Depreciation and amortization
Investments and Other Segment depreciation and amortization was $11.2 million, $8.5 million and $9.1 million during the years ended December 31, 2009, 2008 and 2007. Depreciation and amortization was higher during 2009 primarily due to more buildings owned in 2009 and a real estate impairment of approximately $1.0 million recorded in third quarter 2009.
Depreciation and amortization was lower during 2008 primarily due to the sale of properties in 2007.
Income from operations
Investments and Other Segment income from operations was $10.7 million, $13.4 million and $25.9 million during the years ended December 31, 2009, 2008 and 2007, respectively. The 2009 decrease was attributable to the absence of a $1.2 million gain from the sale of real property in fourth
69
quarter 2008, a real estate impairment of approximately $1.0 million recorded in third quarter 2009 and from lower revenues. The 2008 decrease was attributable to the absence of a $12.4 million gain from the sale of office buildings recorded in 2007 and higher operating costs, partially offset by a $1.2 million gain from the sale of real property in fourth quarter 2008 and from lower depreciation expense.
Use of Non-GAAP Financial Information
In addition to reporting operating income, pretax income, net income and earnings per share on a GAAP basis, DST has also made certain non-GAAP adjustments which are described below in the section titled "Description of Non-GAAP Adjustments" and are reconciled to the corresponding GAAP measures in the attached financial schedules titled "Reconciliation of Reported Results to Income Adjusted for Certain Non-GAAP Items" below. In making these non-GAAP adjustments, the Company takes into account the impact of items that are not necessarily ongoing in nature, that do not have a high level of predictability associated with them or that are non-operational in nature. Generally, these items include net gains on dispositions of business units, net gains (losses) associated with securities and other investments, restructuring and impairment costs and other similar items. Management believes the exclusion of these items provides a useful basis for evaluating underlying business unit performance, but should not be considered in isolation and is not in accordance with, or a substitute for, evaluating business unit performance utilizing GAAP financial information. Management uses non-GAAP measures in its budgeting and forecasting processes and to further analyze its financial trends and "operational run-rate," as well as making financial comparisons to prior periods presented on a similar basis. The Company believes that providing such adjusted results allows investors and other users of DST's financial statements to better understand DST's comparative operating performance for the periods presented.
DST's management uses each of these non-GAAP financial measures in its own evaluation of the Company's performance, particularly when comparing performance to past periods. DST's non-GAAP measures may differ from similar measures by other companies, even if similar terms are used to identify such measures. Although DST's management believes non-GAAP measures are useful in evaluating the performance of its business, DST acknowledges that items excluded from such measures may have a material impact on the Company's income from operations, pretax income, net income and earnings per share calculated in accordance with GAAP. Therefore, management typically uses Non-GAAP measures in conjunction with GAAP results. These factors should be considered when evaluating DST's results.
Description of Non-GAAP Adjustments
The following items, which occurred during the year ended December 31, 2009, have been treated as Non-GAAP adjustments:
- •
- Interest expense, in the amount of $4.7 million, associated with financing costs from the convertible senior
debenture exchange transactions completed in October and November 2009. The income tax benefit associated with these financing costs was approximately $1.9 million.
- •
- Gain on equity interest in Argus, in the amount of $41.7 million, included in other income (expense), net associated with DST's purchase of the remaining 50% interest of Argus on March 31, 2009 for $57.0 million in cash. As required by generally accepted accounting principles, the Company adopted the new business combinations accounting guidance on January 1, 2009. In accordance with the guidance, the acquisition of the remaining 50% of Argus was treated as a step acquisition. Accordingly, DST remeasured its previously held equity interest in Argus to fair value and recorded a $41.7 million gain. In addition, the Company recorded an income tax benefit associated with this transaction of approximately $0.9 million
70
- •
- Other net gains, in the amount of $17.2 million, associated with realized and unrealized gains (losses) related to
securities and other investments, which are included in other income (expense), net. The income tax benefit associated with these gains was approximately $6.9 million. The $17.2 million
of net gains on securities and other investments for the year ended December 31, 2009 is comprised of net realized gains from sales of available-for-sale securities of
$46.3 million, net losses on private equity funds and other investments of $1.8 million and other than temporary impairments on available-for-sale securities and
other investments of $27.3 million.
- •
- Gains in the amount of $5.9 million, associated with the repurchase and extinguishment of senior convertible
debentures. The income tax expense associated with these gains was approximately $2.2 million.
- •
- Increased equity in earnings of unconsolidated affiliates, in the amount of $4.5 million, associated with a gain on
the change in equity interest of a subsidiary investment held by IFDS, L.P. The income tax expense associated with this gain was approximately $1.8 million. During fourth quarter 2009,
an equity method investment held by IFDS, L.P. was consolidated requiring the existing equity interest held by IFDS, L.P. to be remeasured to fair value. This remeasurement to fair value
resulted in a $9 million gain being recorded by IFDS, L.P.
- •
- An income tax benefit of approximately $5.7 million resulting from a reduction in income tax related liabilities principally associated with the completion of an IRS examination in February 2009 for the tax years ended December 31, 2002 through 2005.
related to the elimination of deferred tax liabilities previously established for equity in earnings of Argus. In accordance with income tax accounting guidance, no income taxes were recorded on the $41.7 million gain on equity interest in Argus.
The following items, which occurred during the year ended December 31, 2008, have been treated as a non-GAAP adjustments:
- •
- Net pre-tax gain resulting from the sale of real property, in the amount of $1.2 million, which is
included in Investments and Other Segment as a reduction to costs and expenses. The income tax expense associated with this gain was approximately $0.5 million.
- •
- Other net losses, in the amount of $41.8 million, associated with realized and unrealized gains (losses) related to
securities and other investments, which are included in other income (expense), net. The income tax benefit associated with these losses was approximately $15.5 million. The
$41.8 million of net losses on securities and other investments for the year ended December 30, 2008 are comprised of other than temporary impairments on
available-for-sale securities of $53.1 million, net losses on private equity funds and other investments of $20.8 million and net realized gains from sales of
available-for-sale securities of $32.1 million,. Included in the $32.1 million of net realized gains are $4.9 million of realized losses from sales of
securities and a $25.4 million gain from the sale of approximately 0.7 million shares of State Street Corporation.
- •
- Gains in the amount of $10.8 million, associated with the repurchase and extinguishment of senior convertible
debentures. The income tax expense associate with these gains was approximately $4.2 million.
- •
- An income tax benefit of approximately $48.2 million resulting from a reduction in the Company's liabilities related to accounting for uncertain income tax items. The decrease in income tax related liabilities is principally related to events occurring during fourth quarter 2008 that caused a change in the Company's assessment of the probability that a tax position taken in
71
its 2005 federal income tax return will be sustained and realized upon settlement and the resolution of an IRS examination matter that was resolved in DST's favor.
The following items, which occurred during the year ended December 31, 2007, have been treated as non-GAAP adjustments:
- •
- Merger integration costs incurred with the acquisition of Amisys Synertech, Inc., in the amount of
$4.3 million, included in Financial Services costs and expenses. The income tax benefit associated with these costs was approximately $1.7 million.
- •
- A contract termination fee, in the amount of $3.1 million, included in Output Solutions operating revenues. The
income tax expense associated with this income was approximately $1.2 million.
- •
- Net gain resulting from the sale of office buildings in California, in the amount of $12.4 million, which is
included in Investments and Other as a reduction to costs and expenses. The income tax expense associated with this gain was approximately $4.9 million.
- •
- Costs associated with the partial termination of a non-qualified deferred compensation plan in the amount of
$4.3 million. The $4.3 million cost (included in costs and expenses) was allocated to the Financial Services ($3.3 million), Output Solutions ($0.8 million) and Investments
and Other ($0.2 million) segments. The income tax benefit associated with these costs was approximately $1.6 million.
- •
- Other net gains, in the amount of $2.8 million, associated with realized and unrealized gains (losses) related to
securities and other investments, which are included in other income (expense), net. The income tax expense associated with these gains was approximately $1.3 million.
- •
- Non-operating gain related to the sale of Asurion, an equity investment, in the amount of
$998.0 million. The income tax expense associated with this gain was approximately $381.7 million.
- •
- Non-operating gain resulting principally from the settlement of a dispute related to a prior business
acquisition, in the amount of $1.5 million, which is included in other income (expense), net. The income tax expense associated with this gain was approximately $0.6 million.
- •
- A gain related to the recovery in a non-operating Chapter 11 bankruptcy claim of an amount due from a
previous client, in the amount of $1.0 million, included in other income (expense), net. The income tax expense associated with this gain was approximately $0.4 million.
- •
- Decreased equity in earnings of unconsolidated real estate affiliates associated with impairment charges on real estate
held for sale in the amount of $4.9 million. The income tax benefit associated with this these impairment charges was approximately $1.9 million.
- •
- Favorable resolution of an international income tax issue that resulted in a $3.8 million reduction in income tax expense.
72
DST SYSTEMS, INC.
RECONCILIATION OF REPORTED RESULTS TO INCOME ADJUSTED FOR CERTAIN
NON-GAAP ITEMS
Year Ended December 31,
(in millions, except per share amounts)
| |
2009 | |||||||||||||
|---|---|---|---|---|---|---|---|---|---|---|---|---|---|---|
| |
Operating Income |
Pretax Income |
Net Income |
Diluted EPS |
||||||||||
Reported GAAP income |
$ | 274.3 | $ | 354.5 | $ | 241.6 | $ | 4.84 | ||||||
Adjusted to remove: |
||||||||||||||
Included in non-operating income: |
||||||||||||||
Financing costs associated with the convertible debenture exchange transactions |
4.7 |
2.8 |
0.05 |
|||||||||||
Gain on equity interest in Argus Health Systems |
(41.7 | ) | (42.6 | ) | (0.85 | ) | ||||||||
Net gains on securities and other investments |
(17.2 | ) | (10.3 | ) | (0.21 | ) | ||||||||
Gain on extinguishment of senior convertible debentures |
(5.9 | ) | (3.7 | ) | (0.07 | ) | ||||||||
Gain on change in equity interest of a subsidiary investment held by an unconsolidated affiliate |
(4.5 | ) | (2.7 | ) | (0.05 | ) | ||||||||
Reduction in income tax related liabilities |
(5.7 | ) | (0.12 | ) | ||||||||||
Adjusted Non-GAAP income |
$ | 274.3 | $ | 289.9 | $ | 179.4 | $ | 3.59 | ||||||
| |
2008 | |||||||||||||
|---|---|---|---|---|---|---|---|---|---|---|---|---|---|---|
| |
Operating Income |
Pretax Income |
Net Income |
Diluted EPS |
||||||||||
Reported GAAP income |
$ | 346.5 | $ | 310.3 | $ | 242.9 | $ | 4.21 | ||||||
Adjusted to remove: |
||||||||||||||
Included in operating income: |
||||||||||||||
Gain on sale of real property—Investments and Other |
(1.2 |
) |
(1.2 |
) |
(0.7 |
) |
(0.01 |
) |
||||||
Included in non-operating income: |
||||||||||||||
Net losses on securities and other investments |
41.8 |
26.3 |
0.46 |
|||||||||||
Gain on extinguishment of senior convertible debentures |
(10.8 | ) | (6.6 | ) | (0.11 | ) | ||||||||
Reduction in income tax related liabilities |
(48.2 | ) | (0.84 | ) | ||||||||||
Adjusted Non-GAAP income |
$ | 345.3 | $ | 340.1 | $ | 213.7 | $ | 3.71 | ||||||
Note: See the Description of Non-GAAP Adjustments section for a description of each of the above adjustments and see the Use of Non-GAAP Financial Information section for management's reasons for providing non-GAAP financial information.
73
DST SYSTEMS, INC.
RECONCILIATION OF REPORTED RESULTS TO INCOME ADJUSTED FOR CERTAIN NON-GAAP ITEMS
For the Year Ended December 31,
(in millions, except per share amounts)
| |
2007 | |||||||||||||
|---|---|---|---|---|---|---|---|---|---|---|---|---|---|---|
| |
Operating Income |
Pretax Income |
Net Income |
Diluted EPS |
||||||||||
Reported GAAP income |
$ | 343.9 | $ | 1,389.2 | $ | 874.7 | $ | 12.14 | ||||||
Adjusted to remove: |
||||||||||||||
Included in operating income: |
||||||||||||||
ASI merger integration costs—Financial Services |
4.3 |
4.3 |
2.6 |
0.04 |
||||||||||
Contract termination fee—Output Solutions |
(3.1 | ) | (3.1 | ) | (1.9 | ) | (0.03 | ) | ||||||
Gain on sale of real property—Investments and Other |
(12.4 | ) | (12.4 | ) | (7.5 | ) | (0.10 | ) | ||||||
Non-qualified deferred comp. plan costs—Financial Services |
3.3 | 3.3 | 2.0 | 0.03 | ||||||||||
Non-qualified deferred comp. plan costs—Output Solutions |
0.8 | 0.8 | 0.5 | 0.01 | ||||||||||
Non-qualified deferred comp. plan costs—Inv. and Other |
0.2 | 0.2 | 0.2 | |||||||||||
Included in non-operating income: |
||||||||||||||
Net gains on securities and other investments |
(2.8 |
) |
(1.5 |
) |
(0.02 |
) |
||||||||
Asurion gain |
(998.0 | ) | (616.3 | ) | (8.56 | ) | ||||||||
Favorable settlement of a prior business acquisition dispute |
(1.5 | ) | (0.9 | ) | (0.01 | ) | ||||||||
Recovery of Chapter 11 bankruptcy claim |
(1.0 | ) | (0.6 | ) | (0.01 | ) | ||||||||
Real estate impairments at unconsolidated affiliates |
4.9 | 3.0 | 0.04 | |||||||||||
Favorable income tax resolution |
(3.8 | ) | (0.05 | ) | ||||||||||
Adjusted Non-GAAP income |
$ | 337.0 | $ | 383.9 | $ | 250.5 | $ | 3.48 | ||||||
Note: See the Description of Non-GAAP Adjustments section for a description of each of the above adjustments and see the Use of Non-GAAP Financial Information section for management's reasons for providing non-GAAP financial information.
Management's Analysis of Non-GAAP Results for 2009, 2008 and 2007
Taking into account the non-GAAP items described in the above tables, adjusted non-GAAP diluted earnings per share was $3.59, $3.71 and $3.48 during the years ended December 31, 2009, 2008 and 2007. Management's discussion of the Company's "Results of Operations" and "Year to Year Business Segment Comparisons" in the sections above are applicable for these changes in non-GAAP diluted earnings per share, when adjusting for the non-GAAP items in the reconciliation tables above. In addition, non-GAAP diluted earnings per share is impacted by changes in average diluted shares outstanding which were 50.0 million, 57.7 million and 72.0 million during the years ended December 31, 2009, 2008 and 2007, respectively. The decrease in average diluted shares outstanding during the three years ended December 31, 2009 is primarily attributable to shares repurchased during 2008 and 2007 and from lower dilutive effects of the convertible senior debentures in 2009 resulting from debenture repurchases in 2009 and 2008 and from a lower average DST stock price in 2009 and 2008.
74
LIQUIDITY AND CAPITAL RESOURCES
Sources and Uses of Cash
The Company's primary source of liquidity has historically been cash provided by operations. During the year ended December 31, 2007, the Company also realized significant cash flows from investing activities related to its investment in Asurion as $986.3 million was received from the Company's sale of the majority of its equity interest in Asurion on July 3, 2007. Principal uses of cash are operations, reinvestment in the Company's proprietary technologies, capital expenditures, stock repurchases, investment purchases, debenture repurchases and payments on debt. During the years ended December 31, 2008 and 2007, the Company significantly expanded its share repurchase activities and expended $724.3 million and $558.5 million, respectively, under the Company's commenced stock repurchase plans. Information on the Company's consolidated cash flows for the years ended December 31, 2009, 2008 and 2007 is presented in the Consolidated Statement of Cash Flows, categorized by operating activities, investing activities, and financing activities.
Operating Activities
Operations
Cash flows provided by operating activities were $362.4 million, $436.3 million and $51.9 million for the years ended December 31, 2009, 2008 and 2007, respectively. The decrease in operating cash flows during 2009, as compared to 2008, is primarily attributable to lower earnings in 2009 (as adjusted for non-cash items included in the determination of net income, principally the $41.7 million gain on equity interest of Argus), lower proceeds from accounts receivable securitization of $65.0 million and from negative working capital changes from higher payments in 2009 for income taxes, partially offset by $29.6 million of dividends received in 2009 from unconsolidated affiliates (principally Boston Financial Data Services). The increase in operating cash flows during 2008, as compared to 2007, is principally from lower income tax payments. During 2007, the Company paid approximately $362.8 million of income taxes related to the Asurion gain. The proceeds from the Asurion sale were included in investing activities, but the income tax payments on this transaction were required to be treated as an operating cash outflow. Also contributing to the increase in operating cash flows during 2008 as compared to 2007 were proceeds from the accounts receivable securitization program and decreases in accounts receivable, partially offset by decreases in accounts payable and accrued liabilities, accrued compensation and benefit liabilities and deferred revenue and gains.
The Company had $106.2 million, $78.7 million and $109.4 million of cash and cash equivalents at December 31, 2009, 2008 and 2007, respectively. Operating cash flows of $362.4 million in 2009 resulted principally from net income of $241.6 million adjusted for non-cash items included in the determination of net income, including the $41.7 million gain on equity interest of Argus, depreciation and amortization expense of $130.4 million and equity in earnings of unconsolidated affiliates of $29.6 million. Significant working capital related adjustments to net income include decreases in income taxes payable of $50.8 million decreases in accrued compensation and benefits of $16.7 million and decreases in accounts payable and accrued liabilities of $10.5 million, partially offset by decreases in accounts receivable of $46.2 million.
Operating cash flow of $436.3 million in 2008 resulted principally from net income of $242.9 million and non-cash operating items included in the determination of net income, including depreciation and amortization expense of $125.3 million and equity in earnings of unconsolidated affiliates of $34.7 million. Significant working capital related adjustments to net income include the receipt of $60.0 million of proceeds from the sale of receivables under the Company's accounts receivable securitization program, decreases in accounts receivable of $40.4 million, decreases accounts payable and accrued liabilities of $35.2 million, decreases in accrued compensation and benefits of $15.4 million and decreases in deferred revenue and gains of $11.5 million.
75
Operating cash flow of $51.9 million in 2007 resulted principally from net income of $874.7 million and non-cash operating items included in the determination of net income, including the gain on sale of Asurion of $998.0 million, depreciation and amortization expense of $130.6 million and equity in earnings of unconsolidated affiliates of $62.6 million. As described above, operating cash flows for 2007 were negatively impacted by the income tax payment on the Asurion gain of approximately $362.8 million. Significant working capital related adjustments to net income included include the receipt of $70.0 million of proceeds from the sale of receivables under the Company's accounts receivable securitization program, increases in accrued compensation and benefits of $35.7 million and income taxes payable of approximately $48.1 million, offset by decreases accounts payable and accrued liabilities of approximately $55.1 million.
Software Development and Maintenance
The Company's software development and maintenance efforts are focused on introducing new products and services as well as enhancing its existing products and services. The Company expended approximately $176.1 million, $155.1 million, and $156.2 million in 2009, 2008 and 2007, respectively, for software development and maintenance and enhancements to the Company's proprietary systems and software products, of which $27.7 million, $20.4 million and $22.3 million was capitalized and included in cash flows used in investing activities in 2009, 2008 and 2007, respectively.
Investing Activities
Cash flows provided by investing activities were $57.1 million and $813.8 million for the years ended December 31, 2009 and 2007, respectively, as compared to cash flows used in investing activities of $142.0 million during the year ended December 31, 2008. Investing cash outflows during 2009 for the step acquisition of Argus of $47.8 million, net, were more than offset by investing inflow proceeds of $149.1 million from a reduction in restricted cash and cash equivalents held to satisfy client funds obligations for transfer agency and Argus clients during 2009. Also contributing to the decrease in cash used in investing activities in 2009 as compared to 2008 were higher proceeds from securities sales, lower investment purchases and lower capital expenditures. The decrease in investing cash flows during 2008 is principally due to lower Asurion sale proceeds received in 2008 ($39.2 million) as compared to 2007 ($986.3 million) and a $31.9 million increase in restricted cash and cash equivalents held to satisfy client funds obligations for transfer agency clients. Also contributing to the decrease in investing cash flows during 2008 are higher capital expenditures, higher investments in / advances to unconsolidated affiliates (principally from a $34.5 million advance to an unconsolidated real estate joint venture), lower proceeds from the sale of properties, partially offset by lower net cash activities related to investments in securities.
Capital Expenditures
The following table summarizes capital expenditures by segment (in millions):
| |
For the Year Ended December 31, |
|||||||||
|---|---|---|---|---|---|---|---|---|---|---|
| |
2009 | 2008 | 2007 | |||||||
Financial Services Segment |
$ | 49.2 | $ | 45.4 | $ | 49.5 | ||||
Output Solutions Segment |
36.7 | 31.8 | 33.2 | |||||||
Investments and Other Segment |
12.1 | 34.1 | 8.0 | |||||||
|
$ | 98.0 | $ | 111.3 | $ | 90.7 | ||||
Investments and Other Segment capital expenditures are primarily buildings and building improvements. In July 2008, the Investments and Other Segment purchased the Bristol, United
76
Kingdom Output production facility, which was previously leased, and office buildings for approximately $20.5 million. Future capital expenditures are expected to be funded primarily by cash flows from operating activities, secured term notes or draws from bank lines of credit, as required.
Capitalized costs of software developed for internal use and systems to be sold or licensed to third parties totaled $27.7 million, $20.4 million and $22.3 million in 2009, 2008 and 2007, respectively. In addition, during 2009, 2008 and 2007, the Company purchased approximately $2.3 million, $13.2 million and $26.1 million, respectively, of electronic data processing equipment with secured promissory notes. Capital expenditures using promissory notes are treated as non-cash transactions and are not included in the annual capital expenditure amounts above. Future capital expenditures are expected to be funded primarily by cash flows from operating activities, secured term notes, the Company's equipment credit facility, or draws from bank lines of credit, as required.
Investments
The Company purchased $90.6 million, $127.8 million and $317.1 million of investments in securities in 2009, 2008 and 2007, respectively. Investment purchases during 2007 included approximately $172.6 million of short-term investments that matured prior to year-end. Absent this short-term investment purchase, investment purchases were $144.5 million during 2007 which were principally related to available-for-sale equity securities and private equity funds. The Company received proceeds from unconsolidated affiliates of $1.6 million and $28.4 million during the years ended December 31, 2009 and 2007, respectively, but made investments in/advances to unconsolidated affiliates of $35.8 million in 2008 (principally from a $34.5 million advance to an unconsolidated real estate joint venture). Included in the 2007 proceeds was the repayment of a loan originally made by the Company's captive insurance subsidiary to two of the Company's unconsolidated real-estate joint ventures. During 2009, 2008 and 2007, the Company received $142.2 million, $134.3 million and $231.0 million, respectively, from the sale of investments. The maturity of the short term investment, in the amount of approximately $172.6 million, is included in the proceeds from sale of investments for 2007. The remainder of the investment proceeds was principally from sale of available-for-sale securities. Gross realized gains of $49.4 million, $42.3 million and $16.2 million and gross realized losses of $3.1 million, $10.2 million and $2.9 million, were recorded in 2009, 2008 and 2007, respectively, from available-for-sale securities. In addition, the Company recorded unrealized losses on available for sale securities of $27.3 million, $53.1 million and $10.7 million related to other than temporary investment impairments for the years ended December 31, 2009, 2008 and 2007, respectively.
Funds Held on Behalf of Clients
The Company had $208.3 million, $209.3 million and $177.4 million of funds held on behalf of clients at December 31, 2009, 2008 and 2007, respectively. This amount is comprised of funds held on behalf of transfer agency clients and funds held on behalf of pharmacy processing clients.
End of day available client bank balances for full service mutual fund transfer agency clients are invested overnight by and in the name of the Company into credit-quality money market funds. Invested balances are returned to the full service mutual fund transfer agency client accounts the following business day. Based upon the Company's intent, these invested client balances represent assets that are restricted for use and have been classified as client funds obligations in the Company's Consolidated Balance Sheet.
Funds received from Argus clients for the payment of pharmacy claims incurred by its members are invested in cash and cash equivalents (credit-quality money market funds), short-term investments and available for sale debt securities (short-term) until the claim payments are presented to the bank. Certain of these amounts are included in funds held on behalf of clients in the Consolidated Balance Sheet and are also recorded as a client funds obligation liability. Funds held on behalf of clients
77
represent assets that, based upon the Company's intent, are restricted for use solely for the purposes of satisfying the obligations to remit funds to pharmacies, which are classified as client funds obligations in the Company's Consolidated Balance Sheet.
The Company has reported the cash flows related to the purchases of investment funds (available for sale securities) held on behalf of clients and the cash flows related to the proceeds from the sales/maturities of investment funds held on behalf of clients on a gross basis in the investing section of the Consolidated Statement of Cash Flows. The Company has reported the cash inflows and outflows related to client fund investments with original maturities of 90 days or less on a net basis within net (increase) decrease in restricted cash and cash equivalents held to satisfy client funds obligations in the investing section of the Consolidated Statement of Cash Flows. The Company has reported the cash flows related to client funds used in investing activities on a net basis within net increase (decrease) in client funds obligations in the financing section of the Consolidated Statement of Cash Flows.
Business Acquisitions
DST acquired the remaining 50% equity interest in Argus on March 31, 2009 and consolidated the financial statements of Argus and DST as of this acquisition date. The purchase price for the remaining 50% equity interest was $57.0 million in cash, but $9.2 million of cash acquired upon consolidation of Argus decreases the reported amount paid in the Consolidated Statement of Cash Flows to $47.8 million. On January 1, 2009, the Company adopted the new authoritative accounting guidance for business combinations. In accordance with the guidance, the acquisition of the remaining 50% of Argus was treated as a step acquisition. Accordingly, DST remeasured its previously held equity interest in Argus to fair value, in the amount of $57.0 million, and recorded a gain of $41.7 million, which is included in other income (expense), net in the Consolidated Statement of Income. DST has recognized identifiable assets (comprised of proprietary software of $26.0 million, customer relationships of $14.0 million and other intangible assets of $1.0 million) and goodwill resulting from the acquisition of the remaining 50% Argus interest and the remeasurement of DST's previously held equity interest.
On November 14, 2008, DST completed the acquisition of BlueDoor Technologies Pty Ltd ("BlueDoor"). The acquisition was accounted for as a purchase and the consideration paid for BlueDoor on the acquisition date consisted of approximately $10.3 million of cash and 85,006 shares of DST common stock at an approximate value of $3.1 million. Included in the net assets acquired from BlueDoor was approximately $0.8 million of cash. There are provisions in the BlueDoor acquisition agreement that allow for additional consideration to be paid if license and service fee revenue targets are achieved and upon the completion of future service by the former owners of BlueDoor. As of December 31, 2009, the aggregate amount of contingent consideration that could be paid related to this business acquisition was approximately $17.3 million.
Approximately $6.9 million of that amount would be due in 2010 while the remainder would be paid from 2011 through 2015.
On December 29, 2008, DST acquired the remaining 50% interest in an unconsolidated real estate joint venture, Broadway Realty Company, LLC ("BRC"). BRC owns an office building and parking garage in Kansas City, Missouri. DST accounted for its investment in BRC under the equity method of accounting prior to the acquisition date, but has consolidated this entity as of December 31, 2008. Cash consideration paid for the remaining 50% interest in BRC was approximately $13.3 million. Included in the net assets acquired from BRC was approximately $0.2 million of cash.
During 2007, the Company purchased two businesses in the Financial Services Segment for $14.9 million. There are provisions in both business acquisition agreements that allow for additional consideration to be paid if certain operating performance measures are met. As of December 31, 2009, the aggregate amount of contingent consideration that could be paid related to these business acquisitions was approximately $32.0 million, which would be due in 2011.
78
Proceeds from the sale of Asurion
DST sold the majority of its equity interest in Asurion on July 3, 2007 and received cash proceeds of $986.3 million in 2007 and $39.2 million in 2008. DST recorded a pretax gain on the sale of approximately $998.0 million during 2007. The cash proceeds received during 2007 were primarily used to pay down debt and related facilities and to satisfy tax obligations associated with the sale.
Proceeds from the sale of properties
The Company received approximately $0.6 million, $14.2 million and $43.2 million from the sale of real estate properties during 2009, 2008 and 2007, respectively.
Financing Activities
Cash flows used in financing activities totaled $392.0 million, $325.0 million and $816.9 million during the years ended December 31, 2009, 2008 and 2007, respectively. Financing cash outflows for 2009 were for the repurchase of convertible senior debentures of $131.3 million, share repurchases of $40.5 million and net repayments under the syndicated line of credit facility in the aggregate amount of $70.6 million. Client funds obligations decreased $149.1 million during the year ended December 31, 2009 and increased $31.9 million and $51.8 million during the years ended December 31, 2008 and 2007, respectively. Financing cash outflows for share repurchases in 2008 of $730.9 million were partially offset by $411.3 million of cash inflows from borrowings on revolving credit facilities and $114.0 million of net proceeds from the five-year real estate credit agreement (discussed below) completed in 2008.
Common Stock Issuances and Repurchases
The Company received proceeds of $14.0 million, $4.9 million and $112.3 million from the issuance of common stock from the exercise of employee stock options during the years ended December 31, 2009, 2008 and 2007, respectively.
Under the Company's stock repurchase plan, the Company expended $9.7 million for approximately 0.3 million shares, $724.3 million for approximately 11.3 million shares, and $558.5 million for approximately 7.1 million shares during the years ended December 31, 2009, 2008, and 2007, respectively. Payments made for tax withholding obligations arising from the exercise of options to purchase the Company's stock or from the vesting of restricted stock shares are included in common stock repurchased in the Consolidated Statement of Cash Flows. The amount of such share withholdings for option exercises was $30.8 million, $6.6 million, and $61.4 million during the years ended December 31, 2009, 2008 and 2007, respectively.
On February 20, 2009, the Company's Board of Directors authorized an additional 2.0 million shares to be repurchased under the existing share repurchase plan. At December 31, 2009, there were approximately 2.3 million shares remaining to be repurchased under the existing share repurchase plan. The plan allows, but does not require, the repurchase of common stock in open market and private transactions through December 31, 2011. The Company may enter into one or more plans with its brokers or banks for pre-authorized purchases within defined limits pursuant to Rule 10b5-1 to affect all or a portion of such share repurchases.
79
Client Funds Obligations
Client funds obligations represent the Company's contractual obligations to remit funds to satisfy client pharmacy claim obligations and are recorded on the balance sheet when incurred, generally after a claim has been processed by the Company. In addition, client funds obligations include transfer agency client balances invested overnight. Client funds obligations represent liabilities that will be repaid within one year of the balance sheet date. The Company had $312.1 million, $209.3 million and $177.4 million of client funds obligations at December 31, 2009, 2008 and 2007, respectively.
Debt Activity
The Company has used the following primary sources of financing: its syndicated line of credit facility; convertible debentures; subsidiary line of credit facilities; secured promissory notes; loans from unconsolidated affiliates; and secured borrowings. The Company has also utilized bridge loans as necessary to augment the above sources of debt financing. The Company had $1,221.9 million and $1,435.3 million of debt outstanding at December 31, 2009 and 2008, respectively, a decrease of $213.4 million during 2009 and an increase of $374.2 million during 2008. The 2009 decrease is principally from repayments on revolving credit facilities and the repurchase of $131.3 million of convertible senior debentures. The 2008 increase is principally from borrowings on revolving credit facilities and $114.0 million of net proceeds from the five-year real estate credit agreement (discussed below) completed during 2008 partially offset by $128.5 million reduction in convertible senior debentures from 2008 repurchases.
Convertible Senior Debentures
In August 2003, the Company issued $840 million aggregate principal amount of convertible senior debentures, consisting of $540 million of 4.125% Series A convertible senior debentures due 2023 and $300 million aggregate principal amount of 3.625% Series B convertible senior debentures due 2023. The Series A debentures and Series B debentures bear interest at a rate of 4.125% and 3.625% per annum, respectively. At December 31, 2009, the amount of Series A and Series B convertible senior debentures outstanding were $151.8 million and $171.3 million, respectively. During 2009, the Company repurchased approximately $122.6 million in principal amount of the Series A debentures and $14.7 million of the Series B debentures and recorded a gain of $5.9 million on these transactions. During 2008, the Company repurchased approximately $8.5 million in principal amount of the Series A debentures and $120.0 million of the Series B debentures and recorded a gain of $10.8 million on these transactions. During fourth quarter 2009, DST entered into separate privately negotiated exchange agreements under which it exchanged $257.0 million in aggregate principal of the Company's outstanding 4.125% Series A convertible senior debentures due 2023 for $257.0 million in aggregate principal of new 4.125% Series C convertible senior debentures due 2023. As of December 31, 2009, the outstanding amount of the Series C convertible senior debentures outstanding was $257.0 million.
Interest is payable initially in cash semiannually in arrears on February 15 and August 15 until August 15, 2010 for the Series A debentures and until August 15, 2008 for the Series B debentures. The Series C debentures bear regular cash interest on the original principal amount of each debenture at a rate of 4.125% per year, payable semiannually in arrears on February 15 until August 15, 2010. Beginning August 15, 2010 for the Series A and Series C debentures and August 15, 2008 for the Series B debentures, the Company will not pay regular cash interest on the debentures prior to maturity. Instead, the original principal amount of each debenture will increase daily at a rate of 4.125% per year (Series A and Series C) and 3.625% per year (Series B) to $1,700.28 for both the Series A and Series C debentures and $1,714.09 for the Series B debentures, which is the full accreted principal amount payable at maturity for each $1,000 original principal amount of the debentures. The Company will pay contingent interest on the Series A and Series C debentures during any six-month interest period commencing with the period from August 20, 2010 to February 14, 2011, and thereafter
80
from February 15 to August 14 or August 15 to February 14, for which the average trading price of the debentures for the applicable five trading-day reference period equals or exceeds 120% of the accreted principal amount of the debentures. In February 2009, the Company paid contingent interest for the period August 20, 2008 to February 14, 2009 on the Series B convertible senior debentures. The amount of contingent interest equals 0.19% of the average trading price for the reference period, or $2.55 per $1,000 principal amount of such Series B debentures. The Company will pay contingent interest on the Series B debentures during any six-month interest period thereafter from February 15 to August 14 or August 15 to February 14, for which the average trading price of the debentures for the applicable five trading-day reference period equals or exceeds 120% of the accreted principal amount of the debentures.
Beginning August 20, 2010 (Series A), August 20, 2008 (Series B) and August 15, 2013 (Series C), the Company may redeem for cash all or part of the debentures at any time (upon not less than 30 nor more than 60 days notice before the redemption date) at a redemption price equal to the accreted principal amount of the debentures to be redeemed or purchased plus any accrued and unpaid cash interest, including contingent interest and liquidated damages, if any, to the redemption date. Debenture holders may require the Company to purchase the debentures on August 15, 2010, 2015, and 2020 (Series A), August 15, 2013, and 2018 (Series B) and August 15, 2014, 2015 and 2020 (Series C) at a purchase price equal to the accreted principal amount of the debentures to be purchased plus any accrued and unpaid cash interest, including contingent interest and liquidated damages, if any, to such purchase date. The put right for cash for the Series B debentures expired on August 20, 2008 and resulted in no significant debenture purchases by DST. For purchases of Series A debentures on August 15, 2010 and Series C debentures on August 15, 2014, the Company will pay the purchase price in cash. For purchases of Series A debentures on August 15, 2015 and 2020, for purchases of Series B debentures on August 15, 2013 and 2018 and for purchases of Series C debentures on August 15, 2015 and 2020 and upon any fundamental change, the Company can pay the purchase price at its option in cash, common stock or any combination of cash and common stock.
The Series A, Series B and Series C debentures are convertible under specified circumstances into shares of the Company's common stock at an initial conversion rate of 20.3732 shares per $1,000 principal amount of debentures (which is equal to an initial conversion price of $49.08), subject to adjustment in certain events. The Series C debentures include a make-whole interest provision which may increase the conversion rate upon certain fundamental changes, as described in the Series C indenture, prior to August 15, 2013. The conversion rights for these debentures include: 1) during any calendar quarter if the last reported sale price of DST's common stock for at least 20 trading days during the period of 30 consecutive trading days ending on the last day of the previous calendar quarter, is greater than or equal to 120% of the applicable conversion price; 2) subject to certain exceptions, during the five day business period after any five consecutive trading day period in which the trading price per $1,000 original principal amount for each day of that period was less than 95% of the product of the last reported sales price of DST's common stock and the conversion rate on each such day; 3) if the debentures have been called for redemption; and 4) upon the occurrence of a specified corporate transaction as described in the indenture agreement. Upon conversion, the Company will have the right to deliver, in lieu of shares of its common stock, cash or a combination of cash and shares of common stock. The debentures if converted into common stock upon the occurrence of certain events would lead to the issuance of common stock and have a potentially dilutive effect on the Company's stock. The Company intends to settle any conversions of the Series A, Series B and Series C debentures with cash for the principal and accrued and unpaid interest and issue common stock for any conversion value amount over the principal and accrued and unpaid interest amounts. Holders of the senior convertible debentures do not have the right to convert these debentures at December 31, 2009 and 2008. Because the Series A convertible senior debentures can be put to the Company at par for cash for a 10-day period beginning August 15, 2010, the amount
81
outstanding of $151.8 million at December 31, 2009 has been classified as current portion of debt on the Consolidated Balance Sheet.
On January 1, 2009, DST adopted new authoritative accounting guidance related to convertible debt instruments that may be settled in cash upon conversion. The guidance clarifies that issuers of convertible debt instruments that may be settled in cash upon conversion (including partial cash settlement) should separately account for the liability and equity components in a manner that will reflect the entity's nonconvertible debt borrowing rate when interest cost is recognized in subsequent periods. DST retrospectively applied this guidance to all periods prior to January 1, 2009 beginning with August 2003 when the senior convertible debentures were issued. DST used non-convertible debenture interest rates of 6.35% for the original $540 million 4.125% Series A senior convertible debentures and 5.68% for the original $300 million 3.625% Series B senior convertible debentures. The retrospective adoption of this guidance increased the amount of interest expense recorded by DST for historical income statements periods prior to April 1, 2006 (as the debenture discount would have been fully amortized by that date), but did not impact the years ended December 31, 2009, 2008 or 2007. The adoption of this accounting guidance required DST to retrospectively restate retained earnings and additional paid in capital as of December 31, 2006 in the Statement of Changes in Stockholders' Equity, which resulted in a reduction of retained earnings of $58.4 million and an increase in additional paid in capital of the same amount, which had no change to total stockholders' equity.
Revolving Credit Facilities
The Company has a syndicated line of credit agreement that provides for a five-year revolving unsecured credit facility in an aggregate principal amount of up to $600 million. The interest rates applicable to loans under the credit agreement are generally based on the offshore (LIBOR), Federal Funds, or prime rates, plus applicable margins of 0.625% to 1.125%. The revolving credit facility has a grid that adjusts borrowing costs up or down based upon the Company's consolidated leverage ratio. The grid may result in fluctuations in borrowing costs. An annual facility fee of 0.15% to 0.225% is also required on this revolving syndicated line of credit. The credit agreement contains customary restrictive covenants, as well as certain customary events of default. The covenant limiting restricted payments, in addition to certain other exceptions, contains exceptions permitting the Company for a specified period to repurchase or redeem a specified amount of its capital stock. Among other provisions, the credit agreement limits consolidated indebtedness, liens, investments, subsidiary indebtedness, and asset dispositions, and requires certain leverage and interest coverage ratios to be maintained. If any event of default occurs and is continuing, all amounts payable under the credit agreement may be declared immediately due and payable. The maturity date for the credit facility is July 1, 2010. The Company was in compliance with all debt covenants at year-end.
The syndicated line of credit agreement has been amended since it was originally executed in June 2005 to, among other things: (i) allow the Company to request an increase of up to $600 million in the aggregate revolving commitment; (ii) clarify that the Company is allowed to use cash and/or the Company's stock to settle both the principal and accrued interest portion of the Company's Series A and B convertible senior debentures (upon conversion or otherwise) and use the Company's stock to settle any conversion premium payable upon any conversion of the Company's Series A and B convertible senior debentures; (iii) modify financial covenant requirements for the remaining term of the credit agreement; and (iv) allow a one time addition of $150 million to the $50 million exclusion on real property liens.
One of the Company's subsidiaries has available an unsecured line of credit agreement that provides for unsecured revolving borrowings up to $50 million that matures on September 30, 2010. Borrowings under the facility are available at rates based on LIBOR rates plus the applicable margin of 2.0%. Commitment fees of 0.40% per annum based on the unused portions are payable quarterly. Among other provisions, the agreement requires the subsidiary to maintain certain interest coverage ratios and
82
tangible net worth levels, for which a waiver was obtained through March 30, 2009. The Company was in compliance with all debt covenants at year-end. In the event of non-compliance, an event of default may occur, which could result in the loan becoming immediately due and payable. No amounts were borrowed under this line of credit at December 31, 2009 and 2008.
One of the Company's subsidiaries maintains a margin loan with a regulated broker/dealer. There were no borrowings under this loan at December 31, 2009 and amounts borrowed under this loan at December 31, 2008 were $0.3 million. This margin loan is collateralized by the underlying marketable securities. One of the Company's foreign subsidiaries has an available revolving credit agreement in the amount of $2.5 million. There were no borrowings against this foreign revolving credit agreement at December 31, 2009 and 2008. The Company has an unsecured revolving line of credit for $20.0 million that is payable immediately upon demand by the lender. Borrowings on the line of credit are available at variable rates of interest based on LIBOR plus 0.675%. Interest is payable monthly. No amounts were drawn on this facility during 2009 and 2008. The Company's U.K. subsidiary has an overdraft credit facility that provides for borrowings of up to $8.1 million at variable rates of interest based on the Bank's base rate plus 1.5% per annum. Amounts borrowed on this overdraft credit facility were $5.4 million at December 31, 2009.
Equipment Credit Facility
The Company has a $50.0 million unsecured credit facility with a vendor. Proceeds from loans made under the credit facility can be used to make purchases of the vendor's eligible equipment, software or services. Loans under this credit facility must be made prior to June 30, 2010, the draw period termination date. The maturity date for each loan under this credit facility is the earlier of i) the first day of the second calendar month following the third anniversary of the loan date or ii) August 1, 2013. Interest rates applicable to the loans under this credit facility are generally based on the offshore LIBOR rate plus an applicable margin of 0.40% to 0.85%. The applicable margin is based on a grid schedule that adjusts borrowing costs up or down based upon the Company's consolidated leverage ratio.
Real estate credit agreement and interest rate swap
On September 16, 2008, certain subsidiaries of DST entered into a real estate credit agreement with a syndicate of lenders. The credit agreement provides for a five-year, non-revolving credit facility in an aggregate principal amount of up to $120.0 million. Upon closing of the facility in September 2008, $115.0 million was advanced to DST. The credit facility is secured by, among other things, the real estate and properties owned by these DST subsidiaries as well as an assignment of the related leases, rents and other benefits of these assets. The interest rate applicable to the credit agreement is a floating rate tied to either offshore LIBOR rate plus an applicable margin rate of 1.75% or the prime rate (as defined in the credit agreement), as elected by DST. Principal and interest payments are due on the first of each month beginning in November 2008, and are based on a 20 year amortization schedule. Subject to provisions in the credit agreement, DST may voluntarily prepay the loan in whole or in part without premium or penalty, though amounts repaid may not be reborrowed. Concurrent with the lease, sale or other transfer of any of the collateralized properties, DST must prepay an amount equal to 125% of the allocated amount of such property as set forth in the credit agreement. The credit agreement contains customary restrictive covenants, as well as certain customary events of default. Among other provisions, the credit agreement requires certain interest coverage ratios to be maintained. If any event of default occurs and is continuing, all amounts payable under the credit agreement may be declared immediately due and payable. The balance of the loan is due on September 16, 2013, the maturity date for the credit facility.
83
In January 2009, the Company entered an interest rate swap with a bank to fix the interest rate on its syndicated real estate credit agreement at approximately 4.49% (includes 1.75% applicable margin rate) beginning January 2010. This interest rate swap qualifies as a derivative instrument.
Accounting and reporting guidance for derivative instruments, including certain derivative instruments embedded in other contracts and hedging activities requires that an entity recognize all derivatives as either assets or liabilities in the balance sheet and measure those instruments at fair value, and that the changes in the fair value of derivatives are recorded each period in current earnings or other comprehensive income, depending on whether a derivative is designated as part of a hedge transaction and, if it is, the type of hedge transaction.
The Company's interest rate swap is a cash flow hedge of future interest payments under the Company's real estate credit agreement and uses a pay-fixed, receive-variable, forward starting interest rate swap. The Company's risk management objective and strategy for undertaking this hedge is to eliminate the variability of interest cash flows related to the Company's floating-rate real estate credit agreement. Changes in the cash flows of the interest rate swap are expected to offset the changes in cash flows attributable to fluctuations in the one-month LIBOR benchmark interest rate. The derivative instrument is a receive floating, pay 2.74% fixed, forward starting interest rate swap with an effective date of January 4, 2010 and a maturity date of September 16, 2013. Effectiveness of the hedge relationship is assessed on a quarterly basis both prospectively and retrospectively using the "cumulative dollar offset" method, in which the cumulative changes in the value of the hedging instrument are directly compared with the cumulative change in the fair value or cash flows of the hedged item. A dollar offset ratio of between 0.80 and 1.25 is required in order to qualify for hedge accounting treatment. At inception of the hedge, the cumulative dollar offset ratio is 1.00 since the terms of the perfect hypothetical swap match those of the actual swap. The derivative accounting guidance indicates that hedge effectiveness occurs only if the cumulative gain or loss on the derivative hedging instrument exceeds the cumulative change in the expected future cash flows of the hedged transaction. At December 31, 2009, the fair value of the Company's pay-fixed, receive-variable, forward starting interest rate swap was a liability of $1.9 million, which is included in other non-current liabilities in the Consolidated Balance Sheet. The Company determined there was no ineffectiveness during the year ended December 31, 2009, which resulted in the changes in fair value of this swap being recorded in other comprehensive income.
Secured Promissory Notes
The secured promissory notes represent loans for real estate and equipment purchases. The outstanding amount at December 31, 2009 under the real estate notes and equipment notes was $7.9 million and $1.0 million, respectively. The real estate borrowings are due in installments with the balance due at the end of the term. Interest rates on the real estate borrowings are generally fixed. Fixed rates range from 6.0% to 8.39%. The real estate loans are secured by real property owned by the Company
Related Party Promissory Note
The Company has a related party promissory note with Boston Financial Data Services, Inc. ("BFDS"). The agreement provides for unsecured revolving borrowings by the Company of up to $100 million and matures on July 1, 2010. From time to time, BFDS may, subject to a ten day notice period, demand a prepayment of the loan by the Company in an amount not to exceed $25 million in each instance. The interest rate applicable to the loan is based on the British Bankers Association LIBOR rate plus an applicable margin correlating to the applicable margin under the Company's $600 million syndicated line of credit facility. The loan agreement incorporates by reference and requires the Company to comply with the affirmative and negative covenants contained in the Company's $600 million syndicated line of credit facility. The amount outstanding under this loan agreement was $75.0 million at both
84
December 31, 2009 and 2008. For the years ended December 31, 2009, 2008 and 2007, the Company recorded interest expense related to this loan of $1.0 million, $4.1 million and $4.4 million, respectively.
Other Indebtedness
Other indebtedness is comprised of debt obligations that the Company assumed in connection with the acquisition of a business in 2006. The indebtedness is payable in monthly installments. Interest rates are fixed and approximate 5.6%. The maturity date of the assumed indebtedness is October 2016.
Accounts Receivable Securitization Program
DST securitizes certain of its domestic accounts receivable. On May 21, 2009, DST entered into a $175.0 million accounts receivable securitization program with a third-party, multi-seller, asset-backed commercial paper conduit administered by a bank. This $175.0 million program replaced DST's previous $200.0 million accounts receivable securitization program with a third-party, multi-seller, asset-backed commercial paper conduit administered by a different bank which expired by its terms on May 21, 2009.
Under the terms of the $175.0 million accounts receivable securitization program, (a) DST periodically acquires accounts receivable originated by certain of its domestic subsidiaries, including, but not limited to, DST Output, DST Health Solutions, DST Technologies and Argus Health Systems (the "Subsidiary Originators"), (b) DST transfers receivables originated by DST and receivables acquired from the Subsidiary Originators, on a periodic basis, to a wholly-owned bankruptcy remote special purpose subsidiary of DST (the "SPE"), and (c) the SPE then sells undivided interests in the receivables to the commercial paper conduit. DST retains servicing responsibility over the receivables. The assets of the SPE are not available to satisfy the creditors of any other person, including DST or any of its subsidiaries or affiliates. Further, neither DST nor the SPE guarantees collectability of the receivables or the creditworthiness of obligors. If DST has not refinanced its $600.0 million syndicated line of credit agreement (maturing on July 1, 2010) by March 31, 2010, the $175.0 million accounts receivable securitization program commitment is scheduled to become $125.0 million. The conduit's purchase commitment will expire on May 20, 2010 unless otherwise extended in accordance with the program agreements.
The periodic transfers of undivided interests in the receivables by the SPE to the conduit meet the requirements for sale accounting treatment in accordance with the authoritative accounting guidance for transfers and servicing of financial assets. Accordingly, the portion of the receivables transferred to the conduit, up to an advance amount which cannot exceed $175.0 million, have been removed from the Consolidated Balance Sheet. The SPE retains an interest in the receivables in excess of the amount transferred to the conduit, and such receivables will continue to be recognized on the Consolidated Balance Sheet. The carrying value of the retained interest approximates its estimated fair value at the balance sheet date. The Company believes increases in the level of assumed interest rates and/or credit losses compared to assumptions in effect at the balance sheet date by 10% or 20% would not materially affect the fair value of the retained interest at the reporting date.
At December 31, 2009 and 2008, the total outstanding undivided interest in the receivables held by the conduit under the accounts receivable securitization programs was $125.0 million and $130.0 million, respectively. The Consolidated Statement of Cash Flows for the year ended December 31, 2009 presents the net cash flows under the Company's accounts receivable securitization programs. Proceeds received from accounts receivable securitizations under the $175.0 million program have been presented net of cash collections from transferred receivable interests under the $200.0 million program that were remitted to the conduit prior to the expiration of the $200.0 million program.
Aggregate transfers of undivided interests in the receivables from the SPE to the conduit were $1,738.7 million and $1,789.9 million for the years ended December 31, 2009 and 2008, respectively. A
85
$26.6 million and $32.0 million retained interest in the receivables partially sold is included in accounts receivable on the Consolidated Balance Sheet at December 31, 2009 and 2008, respectively. The impact on net income stemming from these transfers was not material.
Contractual Obligations and Commercial Commitments
The following table sets forth the Company's contractual obligations and commercial commitments (in millions):
| |
Payment Due by Period | |||||||||||||||
|---|---|---|---|---|---|---|---|---|---|---|---|---|---|---|---|---|
| |
Total | Less than 1 Year |
2-3 Years | 4-5 Years | More than 5 Years |
|||||||||||
Debt obligations |
$ | 1,221.9 | $ | 658.1 | $ | 19.7 | $ | 536.8 | $ | 7.3 | ||||||
Operating lease obligations |
98.7 | 19.5 | 27.7 | 24.7 | 26.8 | |||||||||||
Software license agreements |
57.4 | 19.5 | 37.2 | 0.7 | ||||||||||||
Income tax uncertainties |
57.1 | 57.1 | ||||||||||||||
Private equity fund capital commitments |
142.0 | 35.5 | 42.6 | 42.6 | 21.3 | |||||||||||
Other |
25.8 | 12.2 | 12.4 | 1.2 | ||||||||||||
|
$ | 1,602.9 | $ | 744.8 | $ | 196.7 | $ | 606.0 | $ | 55.4 | ||||||
Interest obligations on the Company's secured promissory notes, convertible senior debentures and revolving credit facilities are not included in the table above. Related to the secured promissory notes (both mortgage and equipment purchase related), interest rates are both fixed and variable. Fixed rates range from 6.0% to 8.39%. The Series A ($151.8 million principal), Series B ($171.3 million principal) and Series C ($257.0 million principal) convertible senior debentures bear interest at a rate of 4.125%, 3.625% and 4.125% per annum, respectively. However, they are no cash interest beginning August 2010 for the Series A and C debentures and August 2008 for the Series B debentures. Borrowings under the credit agreement are available at rates based on the offshore (LIBOR), Federal Funds or prime rates, plus an applicable margin ranging from 0.625% to 1.125%. An annual facility fee of 0.15% to 0.225% is also required on the credit agreement.
In addition to the financial instruments listed above, the program fees incurred on proceeds from the sale of receivables under the Company's accounts receivable securitization program are determined based on variable interest rates associated with commercial paper.
The Company is a limited partner in various private equity funds. At December 31, 2009 and 2008, the carrying value of these investments was approximately $94.4 million and $63.1 million, respectively. The Company has future capital commitments related to these private equity fund investments in the amount of $142.0 million. Although the exact timing of these investment contributions is uncertain, the Company has estimated the potential timing of these contributions in the table above based on information provided by the investment advisors.
The Company has income tax uncertainties in the amount of $57.1 million at December 31, 2009. Approximately $57.1 million of these obligations are classified as non-current on the Company's Consolidated Balance Sheet as resolution of these matters is expected to take more than a year. The Company estimates that these matters could be resolved in two to three years as reflected on the table above, however, the ultimate timing of resolution is uncertain.
Company's Assessment of Short-term and Long-term Liquidity
To meet the Company's operating and debt service requirements and other current liabilities, the Company is currently in the process of refinancing its two credit facilities maturing in 2010. In addition,
86
bondholders of one series of the Company's convertible senior debentures have the right to put the bonds to the Company for cash in August 2010.
On May 20, 2010, the Company's $175 million accounts receivable securitization program is scheduled to expire. At December 31, 2009, the Company had $125 million outstanding under the accounts receivable securitization program. The size of the accounts receivable securitization program is scheduled to be reduced to $125 million at March 31, 2010, in the event the Company has not refinanced its $600 million revolving syndicated credit facility. The Company does not expect to have its revolving syndicated line of credit refinanced by March 31, 2010. Accordingly, the Company believes the size of the accounts receivable securitization program will be reduced to $125 million unless the sponsoring bank agrees to an extension of this provision. The Company expects to renew the accounts receivable securitization program prior to its scheduled expiration date. There can be no assurance that the Company will be successful in renewing the accounts receivable securitization program on terms similar to the current terms or amount, or at all. Changes to the accounts receivable program's terms or amount could be material.
On July 1, 2010, the Company's $600 million revolving syndicated line of credit facility is scheduled to mature. At December 31, 2009, there was approximately $410.9 million outstanding under the facility. The Company is having active negotiations with its lead banks to replace the existing $600 million revolving syndicated credit facility with a new facility of approximately the same size. The Company anticipates that the new syndicated line of credit facility will be in place during the first part of second quarter 2010. The Company anticipates that the new facility will have covenants and events of default similar to the existing facility, but expects that a new facility will have a three year term and that the interest rate will be approximately 2-3% higher than the existing facility. Although the Company expects to be successful in the placement of a new revolving syndicated line of credit facility, the lending environment could change such that lending is not available or that the covenants, events of default, term, interest rate and/or amount of the new facility could change materially as a result. There can be no assurance that the Company will be successful in the placement of a new revolving syndicated line of credit facility on the terms described above, or at all.
The Company had $151.8 million of Series A senior convertible debentures outstanding at December 31, 2009. The Series A convertible debentures can be "put" to the Company at par for cash for a 10-day period beginning August 15, 2010. The Company believes there is a higher probability that a holder of the Series A convertible bonds will exercise the "put" if the Company's common stock share price is below $49.08. Even if the Company's share price exceeds $49.08, a holder of Series A convertible debentures may choose to exercise the cash put option.
As described above, the Company anticipates placement of a new revolving syndicated line of credit facility and renewal of the accounts receivable securitization program to occur in the first part of second quarter 2010. However, the Company believes that current cash balances, other current assets, expected cash flow from operating activities, use of debt instruments (if necessary), and liquidation of or borrowings against the Company's available-for-sale securities (which were $893.3 million at December 31, 2009) and other investments will be sufficient to provide the liquidity to fund the maturing revolving syndicated line of credit, the maturing accounts receivable securitization program as well as any cash "put" of some or all of the Company's outstanding Series A convertible debentures, the Company's operating requirements and other current liabilities for at least the next 12 months.
Further, the Company believes that its longer term liquidity and capital requirements will also be met through cash provided by operating activities, bank credit facilities, a renewed accounts receivable securitization program, and available-for-sale securities and other investments.
87
Unconsolidated affiliates
The Company has formed operating joint ventures to enter into or expand its presence in target markets. To further penetrate the mutual fund market, in 1974 the Company formed BFDS, a 50% owned joint venture with State Street, a leading mutual fund custodian. The Company's international mutual fund/unit trust shareowner processing businesses (IFDS U.K., IFDS L.P., IFDS Canada, IFDS Luxembourg and IFDS Ireland) are also owned 50% by the Company and 50% by State Street. The Company also utilizes real estate joint ventures as a means of capturing potential appreciation and economic development tax incentives of leased properties. Two of the largest of these real estate joint ventures were formed in 1988 and 2004. The Company receives revenues for processing services and products provided to the operating joint ventures. The Company pays lease payments to certain real estate joint ventures. The Company has entered into various agreements with unconsolidated affiliates to utilize the Company's data processing facilities and computer software systems. The Company believes that the terms of its contracts with unconsolidated affiliates are fair to the Company and are no less favorable to the Company than those obtained from unaffiliated parties. The Company recognizes, on an equity basis, income and losses from its pro-rata share of these companies' net income or loss.
The Company's unconsolidated affiliates had a carrying value of $359.5 million and $358.1 million at December 31, 2009 and 2008, respectively. The Company recognized operating revenues from these unconsolidated affiliates of $176.3 million, $195.2 million and $187.2 million during the years ended December 31, 2009, 2008 and 2007, respectively. The Company paid these unconsolidated affiliates $9.8 million, $11.3 million and $10.9 million in 2009, 2008 and 2007, respectively, for products, services and leases. At December 31, 2009 and 2008, the Company's unconsolidated affiliates owed the Company $63.9 million and $71.2 million, respectively, including approximately $37.6 million and $37.9 million of a secured commercial mortgage loan receivable at December 31, 2009 and 2008, respectively, and $10.3 million and $11.4 million of advances at December 31, 2009 and 2008, respectively. Excluding activity related to the BFDS promissory note, net repayments and advances, respectively to unconsolidated affiliates were $1.0 million and $43.6 million during 2009 and 2008, respectively, and net repayments from these unconsolidated affiliates were $36.8 million during 2007. Net proceeds from unconsolidated affiliates were $31.1 million and $9.6 million during 2009 and 2008, respectively, and net investments in unconsolidated affiliates were $8.5 million during 2007. Excluding amounts owed under the BFDS promissory note, the Company owed $0.4 million and $0.3 million to unconsolidated affiliates at December 31, 2009 and 2008, respectively.
The Company has entered into an agreement to guarantee 50% of the obligations of a 50% owned joint venture as a tenant under a real estate lease for an office building. The initial term of the lease is 10 years and 7 months, commencing March 1, 2007 and expiring September 30, 2017, with two five-year options to extend. The base rent for the initial term is $4.8 million per year, plus all operating expenses for the building.
The Company entered into an agreement to guarantee $2.0 million plus any enforcement costs related to a $32.0 million mortgage loan to a 33% owned real estate joint venture. The $32.0 million loan matures on July 1, 2013. At December 31, 2009, total borrowings on the loan were $31.1 million and the Company's guarantee totaled $1.0 million.
The Company's 50% owned joint ventures are generally governed by shareholder or partnership agreements. The agreements generally entitle the Company to elect one-half of the directors to the board in the case of corporations and to have 50% voting/managing interest in the case of partnerships. The agreements generally provide that the Company or the other party has the option to establish a price payable in cash, or a promise to pay cash, for all of the other's ownership in the joint venture and to submit an offer, in writing, to the other party to sell to the other party all of its ownership interests in the joint venture or to purchase all ownership interests owned by the other party at such offering
88
price. The party receiving the offer generally has a specified period of time to either accept the offer to purchase, or to elect to purchase the offering party's interest at the offering price. The Company cannot estimate the potential aggregate offering price that it could be required to receive or elect to pay in the event this option becomes operable; however, the amount could be material.
Guarantees
In addition to the guarantees entered into as mentioned above, the Company has also guaranteed certain obligations of certain joint ventures under service agreements entered into by the joint ventures and their customers. The amount of such obligations is not stated in the agreements. Depending on the negotiated terms of the guaranty and/or the underlying service agreement, the Company's liability under the guaranty may be subject to time and materiality limitations, monetary caps and other conditions and defenses.
In certain instances in which the Company licenses proprietary systems to customers, the Company gives certain warranties and infringement indemnities to the licensee, the terms of which vary depending on the negotiated terms of each respective license agreement, but which generally warrant that such systems will perform in accordance with their specifications. The amount of such obligations is not stated in the license agreements. The Company's liability for breach of such warranties may be subject to time and materiality limitations, monetary caps and other conditions and defenses.
From time to time, the Company enters into agreements with unaffiliated parties containing indemnification provisions, the terms of which vary depending on the negotiated terms of each respective agreement. The amount of such obligations is not stated in the agreements. The Company's liability under such indemnification provisions may be subject to time and materiality limitations, monetary caps and other conditions and defenses. Such indemnity obligations include the following:
The Company has entered into purchase and service agreements with its vendors, and consulting agreements with providers of consulting services to the Company, pursuant to which the Company has agreed to indemnify certain of such vendors and consultants, respectively, against third party claims arising from the Company's use of the vendor's product or the services of the vendor or consultant.
In connection with the acquisition or disposition of subsidiaries, operating units and business assets by the Company, the Company has entered into agreements containing indemnification provisions, the terms of which vary depending on the negotiated terms of each respective agreement, but which are generally described as follows: (i) in connection with acquisitions made by the Company, the Company has agreed to indemnify the seller against third party claims made against the seller relating to the subject subsidiary, operating unit or asset and arising after the closing of the transaction, and (ii) in connection with dispositions made by the Company, the Company has agreed to indemnify the buyer against damages incurred by the buyer due to the buyer's reliance on representations and warranties relating to the subject subsidiary, operating unit or business assets in the disposition agreement if such representations or warranties were untrue when made, or due to any breach of the representations, warranties, agreements or covenants contained in the agreement.
The Company has entered into agreements with certain third parties, including banks and escrow agents that provide software escrow, fiduciary and other services to the Company or to its benefit plans or customers. Under such agreements, the Company has agreed to indemnify such service providers for third party claims relating to the carrying out of their respective duties under such agreements.
The Company has entered into agreements with lenders providing financing to the Company pursuant to which the Company agrees to indemnify such lenders for third party claims arising from or relating to such financings. In connection with real estate mortgage financing, the Company has entered into environmental indemnity agreements in which the Company has agreed to indemnify the lenders for
89
any damage sustained by the lenders relating to any environmental contamination on the subject properties.
In connection with the acquisition or disposition of real estate by the Company, the Company has entered into real estate contracts containing indemnification provisions, the terms of which vary depending on the negotiated terms of each respective contract, but which are generally described as follows: (i) in connection with acquisitions by the Company, the Company has agreed to indemnify the seller against third party claims made against the seller arising from the Company's on-site inspections, tests and investigations of the subject property made by the Company as part of its due diligence and against third party claims relating to the operations on the subject property after the closing of the transaction, and (ii) in connection with dispositions by the Company, the Company has agreed to indemnify the buyer for damages incurred by the buyer due to the buyer's reliance on representations and warranties relating to the subject property made by the Company in the real estate contract if such representations or warranties were untrue when made and against third party claims relating to operations on the subject property prior to the closing of the transaction.
In connection with the leasing of real estate by the Company, as landlord and as tenant, the Company has entered into occupancy leases containing indemnification provisions, the terms of which vary depending on the negotiated terms of each respective lease, but which are generally described as follows: (i) in connection with leases in which the Company is the tenant, the Company has agreed to indemnify the landlord against third party claims relating to the Company's occupancy of the subject property, including claims arising from loss of life, bodily injury and/or damage to property thereon, and (ii) in connection with leases in which the Company is the landlord, the Company has agreed to indemnify the tenant against third party claims to the extent occasioned wholly or in part by any negligent act or omission of the Company or arising from loss of life, bodily injury and/or damage to property in or upon any of the common areas or other areas under the Company's control.
At December 31, 2009 and 2008, the Company had not accrued any liability on the aforementioned guarantees or indemnifications as they relate to future performance criteria or indirect guarantees of indebtedness of others in accordance with accounting and reporting guidance on guarantees, including indirect guarantees of indebtedness of others.
Seasonality
Generally, the Company does not have significant seasonal fluctuations in its business operations. Processing and Output Solutions volumes for mutual fund customers are usually highest during the quarter ended March 31 due primarily to processing year-end transactions and printing and mailing of year-end statements and tax forms during January. The Company has historically added operating equipment in the last half of the year in preparation for processing year-end transactions, which has the effect of increasing costs for the second half of the year. Revenues and operating results from individual license sales depend heavily on the timing and size of the contract.
Comprehensive income (loss)
The Company's comprehensive income totaled $388.7 million and $1,006.4 million for the years ended December 31, 2009 and 2007, respectively but was a loss of $218.5 million for the year ended December 31, 2008. Comprehensive income (loss) consists of net income of $241.6 million, $242.9 million and $874.7 million for the years ended December 31, 2009, 2008 and 2007, respectively, and other comprehensive income of $147.1 million and $131.7 million in 2009 and 2007, respectively, and other comprehensive loss of $461.4 million in 2008. Other comprehensive income (loss) consists of unrealized gains (losses) on available-for-sale securities, net of deferred taxes, reclassifications for net gains and losses included in net income, unrealized gain (loss) on interest rate swaps, the Company's proportional share of unconsolidated affiliates interest rate swaps and foreign currency translation
90
adjustments. The principal difference between net income and comprehensive net income is the net change in unrealized gains (losses) on available-for-sale securities. The Company's net unrealized gains and losses on available-for-sale securities results primarily from changes in market value of the Company's investments in approximately 10.6 million shares of State Street common stock, approximately 22.3 million shares of Computershare common stock and approximately 1.9 million shares of Euronet Worldwide, Inc. At December 31, 2009, these three investments had an aggregate pre-tax unrealized gain of approximately $730.9 million. One of DST's unconsolidated affiliates had an interest rate swap liability with a fair market value of $35.6 million, $72.8 million and $13.8 million at December 31, 2009, 2008 and 2007, respectively. DST's 50% proportionate share of this interest rate swap liability was $17.8 million, $36.4 million and $6.9 million at December 31, 2009, 2008 and 2007, respectively. The Company records in investments and accumulated other comprehensive income its proportionate share of this liability in an amount not to exceed the carrying value of its investment in this unconsolidated affiliate, which resulted in $5.0 million, $6.8 million and $6.9 million recorded at December 31, 2009, 2008 and 2007, respectively. The amounts of foreign currency translation adjustments included in other comprehensive income (loss) are $45.0 million, $(77.6) million and $31.2 million in 2009, 2008 and 2007, respectively. The unrealized loss on the Company's interest rate swap was $1.9 million at December 31, 2009.
Other than temporary impairments
At December 31, 2009, the Company's available-for-sale securities had gross unrealized holding losses of $0.9 million. If it is determined that a security's net realizable value is other than temporary, a realized loss will be recognized in the statement of operations and the cost basis of the security reduced to its estimated fair value. The Company does not believe that the gross unrealized losses at December 31, 2009 are other than temporary.
The Company recorded unrealized losses on available for sale securities of $27.3 million, $53.1 million and $10.7 million during the years ended December 31, 2009, 2008 and 2007, respectively, which the Company believed were other than temporary. The Company records lower of cost or market valuation adjustments on private equity fund investments and other cost method investments when impairment conditions are present. During the years ended December 31, 2009, 2008 and 2007, the Company recorded $1.8 million, $20.8 million and $1.4 million of impairments on private equity fund and other investments related to adverse market conditions and from poor performance of the underlying investment. The impairments related primarily to investments in the Financial Services and Investments and Other Segments. A decline in a security's net realizable value that is other than temporary is treated as a loss based on quoted market value and is reflected in other income, net, in the statement of income.
Derivative and Hedging Activities
Authoritative accounting guidance establishes accounting and reporting standards for derivative instruments, including certain derivative instruments embedded in other contracts and hedging activities. It requires that an entity recognize all derivatives as either assets or liabilities in the balance sheet and measure those instruments at fair value and that the changes in the fair value of derivatives are recorded each period in current earnings or other comprehensive income, depending on whether a derivative is designated as part of a hedge transaction and, if it is, the type of hedge transaction. While it is generally not the Company's practice to enter into derivative contracts, from time to time, the Company utilizes derivatives to manage certain risks. The Company does not enter into derivative arrangements for speculative purposes. At December 31, 2009, the Company's forward starting interest rate swap associated with the syndicated real estate credit agreement had a fair value of $1.9 million liability.
91
Item 7A. Quantitative and Qualitative Disclosures About Market Risk
In the operations of its businesses, the Company's financial results can be affected by changes in equity pricing, interest rates and currency exchange rates. Changes in interest rates and exchange rates have not materially impacted the consolidated financial position, results of operations or cash flow of the Company. Changes in equity values of the Company's investments have had a material effect on the Company's comprehensive income and financial position.
Available-for-sale equity price risk
The Company's investments in available-for-sale equity securities are subject to price risk. The fair value of the Company's available-for-sale investments as of December 31, 2009 was approximately $893.3 million. The impact of a 10% change in fair value of these investments would be approximately $54.6 million to comprehensive income. As discussed under "Management's Discussion and Analysis of Financial Condition and Results of Operations—Comprehensive Income" above, net unrealized gains and losses on the Company's investments in available-for-sale securities have had a material effect on the Company's comprehensive income (loss) and financial position.
Interest rate risk
The Company and certain of its joint ventures derive a certain amount of their service revenues from investment earnings related to cash balances maintained in bank accounts on which the Company is the agent for clients. The balances maintained in the bank accounts are subject to fluctuation. At December 31, 2009, the Company and BFDS had approximately $1.3 billion of cash balances maintained in such accounts, of which $0.9 billion are maintained at BFDS. The Company estimates that a 50 basis point change in interest earnings rate would equal approximately $2.2 million of net income.
At December 31, 2009, the Company had $1.2 billion of debt, of which $500.1 million was subject to variable interest rates (Federal Funds rates, LIBOR rates, Prime rates). As discussed above in comprehensive income (loss), the amount recorded related to the Company's proportional share of unconsolidated affiliates' interest rate swap was a loss of $5.0 million. The Company estimates that a 10% increase in interest rates would not be material to the Company's consolidated pretax earnings or to the fair value of its debt.
In addition to the financial instruments listed above, the program fees incurred on proceeds from the sale of receivables under the Company's accounts receivable securitization program are determined based on variable interest rates associated with commercial paper.
Foreign currency exchange rate risk
The operation of the Company's subsidiaries in international markets results in exposure to movements in currency exchange rates. The principal currencies involved are the British pound, Canadian dollar, Australian dollar, Thai baht and Indian rupee. Currency exchange rate fluctuations have not historically materially affected the consolidated financial results of the Company. At December 31, 2009, the Company's international subsidiaries had approximately $183.2 million in total assets and for the year ended December 31, 2009, these international subsidiaries produced approximately $10.5 million in net losses. The Company estimates that a 10% change in exchange rates could change total consolidated assets by approximately $18.3 million. Furthermore, a 10% change in exchange rates based upon historical earnings in international operations could change consolidated reported net income for 2009 by approximately $1.0 million.
The Company's international subsidiaries use the local currency as the functional currency. The Company translates its assets and liabilities at year-end exchange rates except for those accounts where historical rates are acceptable, and translates income and expense accounts at average rates during the year. While it is generally not the Company's practice to enter into derivative contracts, from time to time the Company and its subsidiaries do utilize forward foreign currency exchange contracts to minimize the impact of currency movements.
92
Item 8. Financial Statements and Supplementary Data
Report of Independent Registered Public Accounting Firm
To the Stockholders of DST Systems, Inc.:
In our opinion, the consolidated financial statements listed in the index appearing under Item 15(a)(1) present fairly, in all material respects, the financial position of DST Systems, Inc. and its subsidiaries at December 31, 2009 and 2008, and the results of their operations and their cash flows for each of the three years in the period ended December 31, 2009 in conformity with accounting principles generally accepted in the United States of America. Also in our opinion, the Company maintained, in all material respects, effective internal control over financial reporting as of December 31, 2009, based on criteria established in Internal Control—Integrated Framework issued by the Committee of Sponsoring Organizations of the Treadway Commission (COSO). The Company's management is responsible for these financial statements, for maintaining effective internal control over financial reporting and for its assessment of the effectiveness of internal control over financial reporting, included in the accompanying Report of Management on Internal Control over Financial Reporting appearing under Item 9A. Our responsibility is to express opinions on these financial statements and on the Company's internal control over financial reporting based on our integrated audits. We conducted our audits in accordance with the standards of the Public Company Accounting Oversight Board (United States). Those standards require that we plan and perform the audits to obtain reasonable assurance about whether the financial statements are free of material misstatement and whether effective internal control over financial reporting was maintained in all material respects. Our audits of the financial statements included examining, on a test basis, evidence supporting the amounts and disclosures in the financial statements, assessing the accounting principles used and significant estimates made by management, and evaluating the overall financial statement presentation. Our audit of internal control over financial reporting included obtaining an understanding of internal control over financial reporting, assessing the risk that a material weakness exists, and testing and evaluating the design and operating effectiveness of internal control based on the assessed risk. Our audits also included performing such other procedures as we considered necessary in the circumstances. We believe that our audits provide a reasonable basis for our opinions.
As discussed in Note 10 and Note 11 to the consolidated financial statements, the Company changed the manner in which it accounts for uncertain tax positions in 2007 and the manner in which certain share-based payment awards are included in earnings per share in 2009.
A company's internal control over financial reporting is a process designed to provide reasonable assurance regarding the reliability of financial reporting and the preparation of financial statements for external purposes in accordance with generally accepted accounting principles. A company's internal control over financial reporting includes those policies and procedures that (i) pertain to the maintenance of records that, in reasonable detail, accurately and fairly reflect the transactions and dispositions of the assets of the company; (ii) provide reasonable assurance that transactions are recorded as necessary to permit preparation of financial statements in accordance with generally accepted accounting principles, and that receipts and expenditures of the company are being made only in accordance with authorizations of management and directors of the company; and (iii) provide reasonable assurance regarding prevention or timely detection of unauthorized acquisition, use, or disposition of the company's assets that could have a material effect on the financial statements.
Because of its inherent limitations, internal control over financial reporting may not prevent or detect misstatements. Also, projections of any evaluation of effectiveness to future periods are subject to the risk that controls may become inadequate because of changes in conditions, or that the degree of compliance with the policies or procedures may deteriorate.
![]()
Kansas
City, Missouri
February 26, 2010
93
DST Systems, Inc.
Consolidated Balance Sheet
(dollars in millions, except per share amounts)
| |
December 31, | |||||||||
|---|---|---|---|---|---|---|---|---|---|---|
| |
2009 | 2008 | ||||||||
ASSETS |
||||||||||
Current assets |
||||||||||
Cash and cash equivalents |
$ | 106.2 | $ | 78.7 | ||||||
Funds held on behalf of clients |
208.3 | 209.3 | ||||||||
Client funding receivable |
103.8 | |||||||||
Accounts receivable (includes related party receivables of $15.5 and $21.9) |
167.2 | 198.2 | ||||||||
Deferred income taxes |
19.2 | 30.0 | ||||||||
Other assets |
74.2 | 40.2 | ||||||||
|
678.9 | 556.4 | ||||||||
Investments |
1,411.8 | 1,220.8 | ||||||||
Properties |
536.3 | 512.3 | ||||||||
Goodwill |
183.6 | 118.7 | ||||||||
Intangible assets |
43.0 | 31.2 | ||||||||
Other assets |
59.2 | 70.0 | ||||||||
Total assets |
$ | 2,912.8 | $ | 2,509.4 | ||||||
LIABILITIES AND STOCKHOLDERS' EQUITY |
||||||||||
Current liabilities |
||||||||||
Current portion of debt |
$ | 658.1 | $ | 89.9 | ||||||
Client funds obligations |
312.1 | 209.3 | ||||||||
Accounts payable |
69.9 | 51.2 | ||||||||
Accrued compensation and benefits |
90.8 | 111.7 | ||||||||
Deferred revenues and gains |
59.1 | 59.5 | ||||||||
Income taxes payable |
36.3 | |||||||||
Other liabilities |
91.2 | 94.3 | ||||||||
|
1,281.2 | 652.2 | ||||||||
Long-term debt |
563.8 | 1,345.4 | ||||||||
Income taxes payable |
57.1 | 46.8 | ||||||||
Deferred income taxes |
312.0 | 174.8 | ||||||||
Other liabilities |
64.3 | 52.0 | ||||||||
Total liabilities |
2,278.4 | 2,271.2 | ||||||||
Commitments and contingencies (Note 15) |
||||||||||
Stockholders' equity |
||||||||||
Preferred stock, $0.01 par, 10 million shares authorized and unissued Common stock, $0.01 par, 400 million shares authorized, 95.3 million shares issued |
1.0 | 1.0 | ||||||||
Additional paid-in capital |
235.6 | 212.6 | ||||||||
Retained earnings |
2,749.6 | 2,508.0 | ||||||||
Treasury stock, at cost |
(2,704.3 | ) | (2,688.8 | ) | ||||||
Accumulated other comprehensive income |
352.5 | 205.4 | ||||||||
Total stockholders' equity |
634.4 | 238.2 | ||||||||
Total liabilities and stockholders' equity |
$ | 2,912.8 | $ | 2,509.4 | ||||||
The accompanying notes are an integral part of these financial statements.
94
DST Systems, Inc.
Consolidated Statement of Income
(in millions, except per share amounts)
| |
Year Ended December 31, | |||||||||
|---|---|---|---|---|---|---|---|---|---|---|
| |
2009 | 2008 | 2007 | |||||||
Operating revenues |
$ | 1,595.4 | $ | 1,675.5 | $ | 1,695.4 | ||||
Out-of-pocket reimbursements |
622.5 | 609.9 | 607.1 | |||||||
Total revenues (includes related party revenues of $176.3, $195.2 and $187.2) |
2,217.9 | 2,285.4 | 2,302.5 | |||||||
Costs and expenses |
1,813.2 | 1,813.6 | 1,828.0 | |||||||
Depreciation and amortization |
130.4 | 125.3 | 130.6 | |||||||
Income from operations |
274.3 | 346.5 | 343.9 | |||||||
Interest expense |
(42.2 | ) | (55.4 | ) | (60.3 | ) | ||||
Other income (expense), net |
85.1 | (15.5 | ) | 45.0 | ||||||
Gain on sale of Asurion |
998.0 | |||||||||
Equity in earnings of unconsolidated affiliates |
37.3 | 34.7 | 62.6 | |||||||
Income before income taxes |
354.5 | 310.3 | 1,389.2 | |||||||
Income taxes |
112.9 | 67.4 | 514.5 | |||||||
Net income |
$ | 241.6 | $ | 242.9 | $ | 874.7 | ||||
Average common shares outstanding |
49.6 | 53.6 | 63.4 | |||||||
Average diluted shares outstanding |
50.0 | 57.7 | 72.0 | |||||||
Basic earnings per share |
$ | 4.87 | $ | 4.53 | $ | 13.80 | ||||
Diluted earnings per share |
$ | 4.84 | $ | 4.21 | $ | 12.14 | ||||
The accompanying notes are an integral part of these financial statements.
95
DST Systems, Inc.
Consolidated Statement of Changes in Stockholders' Equity
(in millions)
| |
Common Stock | |
|
|
|
|
||||||||||||||||||
|---|---|---|---|---|---|---|---|---|---|---|---|---|---|---|---|---|---|---|---|---|---|---|---|---|
| |
|
|
|
Accumulated Other Comprehensive Income |
|
|||||||||||||||||||
| |
Shares Outstanding |
Par Value |
Additional Paid-in Capital |
Retained Earnings |
Treasury Stock |
Total Stockholders' Equity |
||||||||||||||||||
December 31, 2006 |
65.7 | $ | 1.0 | $ | 179.0 | $ | 1,376.5 | $ | (1,519.3 | ) | $ | 535.1 | $ | 572.3 | ||||||||||
Adoption of authoritative accounting guidance on income tax uncertainties |
19.3 | 19.3 | ||||||||||||||||||||||
Comprehensive income: |
||||||||||||||||||||||||
Net income |
874.7 | |||||||||||||||||||||||
Other comprehensive income |
131.7 | |||||||||||||||||||||||
Comprehensive income |
1,006.4 | |||||||||||||||||||||||
Issuance of restricted stock, net of forfeitures |
(6.5 |
) |
6.5 |
|||||||||||||||||||||
Amortization of share based compensation. |
27.8 | 27.8 | ||||||||||||||||||||||
Issuance of common stock |
3.0 | 0.2 | 153.0 | 153.2 | ||||||||||||||||||||
Repurchase of common stock |
(7.9 | ) | (619.9 | ) | (619.9 | ) | ||||||||||||||||||
December 31, 2007 |
60.8 | 1.0 | 200.5 | 2,270.5 | (1,979.7 | ) | 666.8 | 1,159.1 | ||||||||||||||||
Comprehensive income: |
||||||||||||||||||||||||
Net income |
242.9 | |||||||||||||||||||||||
Other comprehensive income |
(461.4 | ) | ||||||||||||||||||||||
Comprehensive income |
(218.5 | ) | ||||||||||||||||||||||
Issuance of restricted stock, net of forfeitures |
(5.5 |
) |
5.5 |
|||||||||||||||||||||
Amortization of share based compensation. |
32.7 | 32.7 | ||||||||||||||||||||||
Issuance of common stock |
0.3 | (15.1 | ) | 16.2 | 1.1 | |||||||||||||||||||
Repurchase of common stock |
(11.4 | ) | (730.8 | ) | (730.8 | ) | ||||||||||||||||||
Other |
(5.4 | ) | (5.4 | ) | ||||||||||||||||||||
December 31, 2008 |
49.7 | 1.0 | 212.6 | 2,508.0 | (2,688.8 | ) | 205.4 | 238.2 | ||||||||||||||||
Comprehensive income: |
||||||||||||||||||||||||
Net income |
241.6 | |||||||||||||||||||||||
Other comprehensive income |
147.1 | |||||||||||||||||||||||
Comprehensive income |
388.7 | |||||||||||||||||||||||
Amortization of share based compensation. |
25.8 | 25.8 | ||||||||||||||||||||||
Issuance of common stock |
0.4 | (6.6 | ) | 26.6 | 20.0 | |||||||||||||||||||
Repurchase of common stock |
(0.9 | ) | (40.5 | ) | (40.5 | ) | ||||||||||||||||||
Other |
3.8 | (1.6 | ) | 2.2 | ||||||||||||||||||||
December 31, 2009 |
49.2 | $ | 1.0 | $ | 235.6 | $ | 2,749.6 | $ | (2,704.3 | ) | $ | 352.5 | $ | 634.4 | ||||||||||
The accompanying notes are an integral part of these financial statements.
96
DST Systems, Inc.
Consolidated Statement of Cash Flows
(in millions)
| |
Year Ended December 31, | ||||||||||
|---|---|---|---|---|---|---|---|---|---|---|---|
| |
2009 | 2008 | 2007 | ||||||||
Cash flows—operating activities: |
|||||||||||
Net income |
$ | 241.6 | $ | 242.9 | $ | 874.7 | |||||
Depreciation and amortization |
130.4 | 125.3 | 130.6 | ||||||||
Net (gains) losses on investments |
(15.6 | ) | 45.7 | (2.9 | ) | ||||||
Gain on sale of properties |
(0.2 | ) | (1.3 | ) | (13.5 | ) | |||||
Gain on sale of Asurion |
(998.0 | ) | |||||||||
Gain on equity interest in Argus Health Systems, Inc. |
(41.7 | ) | |||||||||
Gain on extinguishment of convertible senior debentures |
(5.9 | ) | (10.8 | ) | |||||||
Amortization of share based compensation |
25.8 | 32.7 | 27.8 | ||||||||
Equity in earnings of unconsolidated affiliates |
(37.3 | ) | (34.7 | ) | (62.6 | ) | |||||
Cash dividends from unconsolidated affiliates |
29.6 | ||||||||||
Deferred income taxes |
58.0 | (21.3 | ) | (0.3 | ) | ||||||
Changes in accounts receivable |
46.2 | 40.4 | 1.9 | ||||||||
Proceeds from (repayment from cash colletions on transferred receivables under the) accounts receivable securitization program, net |
(5.0 | ) | 60.0 | 70.0 | |||||||
Changes in other assets |
15.4 | 17.7 | 0.9 | ||||||||
Changes in client funds obligations |
4.2 | ||||||||||
Changes in client funding receivable |
(4.2 | ) | |||||||||
Changes in accounts payable and accrued liabilities |
(10.5 | ) | (35.2 | ) | (55.1 | ) | |||||
Changes in income taxes payable |
(50.8 | ) | 3.7 | 48.1 | |||||||
Changes in deferred revenues and gains |
(0.4 | ) | (11.5 | ) | (2.4 | ) | |||||
Changes in accrued compensation and benefits |
(16.7 | ) | (15.4 | ) | 35.7 | ||||||
Other, net |
(0.5 | ) | (1.9 | ) | (3.0 | ) | |||||
Total adjustments to net income |
120.8 | 193.4 | (822.8 | ) | |||||||
Net |
362.4 | 436.3 | 51.9 | ||||||||
Cash flows—investing activities: |
|||||||||||
Capital expenditures |
(98.0 | ) | (111.3 | ) | (90.7 | ) | |||||
Investments in securities |
(90.6 | ) | (127.8 | ) | (317.1 | ) | |||||
Proceeds from (investments in and advances to) unconsolidated affiliates |
1.6 | (35.8 | ) | 28.4 | |||||||
Proceeds from sale of investments |
142.2 | 134.3 | 231.0 | ||||||||
Proceeds from sale of properties |
0.6 | 14.2 | 43.2 | ||||||||
Net decrease (increase) in restricted cash and cash equivalents held to satisfy client funds obligations |
149.1 | (31.9 | ) | (51.8 | ) | ||||||
Acquisition of businesses and equity interest in Argus, net of cash acquired |
(47.8 | ) | (22.9 | ) | (15.5 | ) | |||||
Proceeds from sale of Asurion |
39.2 | 986.3 | |||||||||
Net |
57.1 | (142.0 | ) | 813.8 | |||||||
Cash flows—financing activities: |
|||||||||||
Proceeds from issuance of common stock |
14.0 | 4.9 | 112.3 | ||||||||
Principal payments on debt |
(14.7 | ) | (39.8 | ) | (24.9 | ) | |||||
Repurchases of senior convertible debentures |
(131.3 | ) | (117.7 | ) | |||||||
Proceeds from real estate credit agreement |
114.0 | ||||||||||
Net increase (decrease) in client funds obligations |
(149.1 | ) | 31.9 | 51.8 | |||||||
Net borrowings (repayments) on revolving credit facilities |
(70.6 | ) | 411.3 | (363.6 | ) | ||||||
Common stock repurchased |
(40.5 | ) | (730.9 | ) | (619.9 | ) | |||||
Excess tax benefits from share based compensation |
0.2 | 1.3 | 27.4 | ||||||||
Net |
(392.0 | ) | (325.0 | ) | (816.9 | ) | |||||
Net increase (decrease) in cash and cash equivalents |
27.5 |
(30.7 |
) |
48.8 |
|||||||
Cash and cash equivalents, beginning of year |
78.7 | 109.4 | 60.6 | ||||||||
Cash and cash equivalents, end of year |
$ | 106.2 | $ | 78.7 | $ | 109.4 | |||||
The accompanying notes are an integral part of these financial statements.
97
DST Systems, Inc.
Notes to Consolidated Financial Statements
1. Description of Business
DST Systems, Inc. (the "Company" or "DST") provides sophisticated information processing and computer software services and products to the financial services industry (primarily mutual funds, broker/dealers and investment managers), telecommunications, video and utilities industries, the healthcare industry and other service industries.
The Company's operating business units offer sophisticated information processing and software services and products. These business units are reported as two operating Segments (Financial Services and Output Solutions). In addition, investments in the Company's real estate subsidiaries and affiliates, equity securities, private equity funds, and certain financial interests have been aggregated into the Investments and Other Segment.
A summary of each of the Company's Segments follows:
Financial Services
The Company's Financial Services Segment provides sophisticated information processing and computer software services and products using proprietary software systems primarily to mutual funds, broker/dealers, investment managers, insurance companies, healthcare providers, banks, financial planners, healthcare payers, real estate partnerships, third party administrators and medical practice groups. The Company's proprietary software systems include mutual fund shareowner, subaccount and unit trust recordkeeping systems for U.S. and international mutual fund companies; a defined-contribution participant recordkeeping system for the U.S. retirement plan market; investment management systems offered to U.S. and international investment managers and fund accountants; a business process management and customer contact system offered to mutual funds, insurance companies, brokerage firms, banks, healthcare payers, healthcare providers, cable television operators and mortgage servicing organizations; healthcare claims administration processing systems and services offered to healthcare payers, third party administrators and medical practice groups; and pharmacy claims processing systems, offered to healthcare plans, insurance companies, third party administrators and pharmacy benefit managers.
The Financial Services Segment distributes its services and products on a direct basis and through subsidiaries and joint venture affiliates in the U.S., United Kingdom ("U.K."), Canada, Europe, Australia, South Africa and Asia-Pacific and, to a lesser degree, distributes such services and products through various strategic alliances.
Output Solutions
The Company's Output Solutions Segment provides single source, integrated print and electronic statement and billing output solutions. The Output Solutions Segment also provides customized statement and bill production, marketing and personalization services, postal optimization, and electronic presentment, payment and distribution solutions.
The Output Solutions Segment conducts its operations from five operating facilities located throughout North America and the U.K. DST Output is among the largest First-Class mailers in the U.S and is one of the largest users of continuous, high-speed, full-color inkjet printing systems.
The Output Solutions Segment distributes its product directly to customers and through relationships in which its services are combined with or offered concurrently through providers of data processing
98
DST Systems, Inc.
Notes to Consolidated Financial Statements (Continued)
1. Description of Business (Continued)
services. The Output Solutions Segment's products are also distributed or bundled with product offerings to customers of the Financial Services Segment.
Investments and Other
The Investments and Other Segment is comprised of the Company's real estate subsidiaries and affiliates, investments in equity securities, private equity funds and other financial interests. The assets held by the Investments and Other Segment are primarily passive in nature. The Company owns and operates real estate mostly in the U.S. and U.K., which is held primarily for lease to the Company's other business segments. The Company is a partner in certain real estate joint ventures that lease office space to the Company, certain of its unconsolidated affiliates and unrelated third parties. The Company is a 50% partner in a limited purpose real estate joint venture formed to develop and lease approximately 1.1 million square feet of office space to the U.S. government. The Investments and Other Segment holds investments in available-for-sale equity securities with a market value of approximately $851.9 million at December 31, 2009, including approximately 10.6 million shares of State Street Corporation ("State Street"), 22.3 million shares of Computershare Ltd. ("Computershare") and 1.9 million shares of Euronet Worldwide, Inc., with a market value of $460.7 million, $228.8 million and $41.4 million respectively, based on closing exchange values at December 31, 2009.
2. Significant Accounting Policies
Principles of consolidation
The consolidated financial statements include all majority-owned subsidiaries of the Company. Intercompany balances and transactions have been eliminated. Certain amounts in the 2007 and 2008 consolidated financial statements have been reclassified to conform to the 2009 presentation.
Authoritative accounting guidance related to consolidation of variable interest entities requires the consolidation of certain types of entities in which one company absorbs a majority of another entity's expected losses, receives a majority of the other entity's expected residual returns, or both, as a result of ownership, contractual or other financial interests in the other entity. These entities are called "variable interest entities." The principal characteristics of variable interest entities are (1) an insufficient amount of equity to absorb the entity's expected losses, (2) equity owners as a group are not able to make decisions about the entity's activities, or (3) equity that does not absorb the entity's losses or receive the entity's residual returns. "Variable interests" are contractual, ownership or other monetary interests in an entity that change with fluctuations in the entity's net asset value. As a result, variable interest entities can arise from items such as joint ventures, lease agreements, loan arrangements, guarantees or service contracts.
If an entity is determined to be a "variable interest entity," the "primary beneficiary" must consolidate the entity. The primary beneficiary is the holder of the variable interests that absorb a majority of the variable interest entity's expected losses or receive a majority of the entity's residual returns in the event no holder has a majority of the expected losses. There is no primary beneficiary in cases where no single holder absorbs the majority of the expected losses or receives a majority of the residual returns. The determination of the primary beneficiary is based on projected cash flows at the inception of the variable interests or at required measurement dates.
99
DST Systems, Inc.
Notes to Consolidated Financial Statements (Continued)
2. Significant Accounting Policies (Continued)
With regard to real estate, the Company is the lessee in a series of operating leases covering a large portion of its Kansas City based leased office facilities. The lessors are generally joint ventures (in which the Company has a 50% ownership) that have been established specifically to purchase, finance and engage in leasing activities with the joint venture partners and unrelated third parties. In June 2008, one of the real estate joint ventures entered into financing arrangements with the Company's wholly-owned captive insurance company, which loaned $34.5 million at variable rates of interest, secured by real estate and maturing on December 31, 2012. The other real estate joint venture partner guaranteed 60% of the loan balance. A company is generally not the primary beneficiary of the joint ventures if the lease terms are consistent with market terms at the inception of the lease and do not include a residual value guarantee, fixed-price purchase options or similar features that disproportionately obligate a company to absorb decreases in value or entitle it to participate in increases in the value of the real estate. The Company's analyses of its real estate joint ventures indicate that certain of the real estate joint ventures are variable interest entities; however, the real estate joint ventures do not need to be consolidated because the Company is not the primary beneficiary. The Company has not provided certain financial disclosures regarding the real estate variable interest entities where DST is not the primary beneficiary, due to the immaterial amounts involved.
With regard to operating joint ventures, the Company has formed or entered into operating joint ventures to enter into or expand its presence in target markets. The Company has the following significant operating joint ventures; Boston Financial Data Services, Inc. ("BFDS"); International Financial Data Services, U.K. ("IFDS U.K."); and International Financial Data Services, L.P. ("IFDS L.P."). Each of these operating joint ventures was formed prior to February 1, 2003. The Company's analyses of these operating joint ventures indicate that none qualifies as a variable interest entity in accordance with the operating joint venture exception in the accounting guidance. Accordingly, the Company accounts for the operating results of these operating joint ventures using the equity method of accounting.
Use of estimates
The preparation of financial statements in conformity with accounting principles generally accepted in the United States of America requires management to make estimates and assumptions that affect the reported amounts of assets and liabilities and disclosure of contingent assets and liabilities at the date of the financial statements and the reported amounts of revenues and expenses during the reporting period. Actual results could differ from those estimates.
Revenue recognition
The Company recognizes revenue when it is realized or realizable and it is earned. The majority of the Company's revenues are computer processing and services revenues and are recognized upon completion of the services provided. Software license fees, maintenance fees and other ancillary fees are recognized as services are provided or delivered and all customer obligations have been met. The Company generally does not have customer obligations that extend past one year. Revenue from equipment sales is recognized as equipment is shipped. Revenue from operating leases is recognized monthly as the rent accrues. Billing for services in advance of performance is recorded as deferred revenue. Allowances for billing adjustments and doubtful account expense are estimated as revenues
100
DST Systems, Inc.
Notes to Consolidated Financial Statements (Continued)
2. Significant Accounting Policies (Continued)
are recognized and are recorded as reductions in revenues, and the annual amounts are immaterial to the Company's consolidated financial statements.
The Company recognizes revenue when the following criteria are met: 1) persuasive evidence of an arrangement exists; 2) delivery has occurred or services have been rendered; 3) the sales price is fixed or determinable; and 4) collectability is reasonably assured. If there is a customer acceptance provision in a contract or if there is uncertainty about customer acceptance, the associated revenue is deferred until the Company has evidence of customer acceptance.
The Company may enter into revenue arrangements to sell products and services in which the Company is obligated to deliver to its customers multiple products and/or services (multiple deliverables). Revenue arrangements with multiple deliverables are evaluated to determine if the deliverables (items) can be divided into more than one unit of accounting. An item can generally be considered a separate unit of accounting if all of the following criteria are met: 1) the delivered item(s) has value to the customer on a standalone basis; 2) there is objective and reliable evidence of the fair value of the undelivered item(s); and 3) if the arrangement includes a general right of return relative to the delivered item(s), delivery or performance of the undelivered item(s) is considered probable and substantially in the control of the Company. Items which do not meet these criteria are combined into a single unit of accounting. If there is objective and reliable evidence of fair value for all units of accounting, the arrangement consideration is allocated to the separate units of accounting based on their relative fair values. In cases where there is objective and reliable evidence of the fair value of the undelivered item(s) in an arrangement but no such evidence for the delivered item(s), the residual method is used to allocate the arrangement consideration. For units of accounting which include more than one deliverable, the Company generally defers all revenue for the unit of accounting until the period over which the last undelivered item is delivered.
Software license revenues are recognized at the time the contract is signed, the software is delivered and no future software obligations exist. Deferral of software license revenue billed results from delayed payment provisions, disproportionate discounts between the license and other services or the inability to unbundle certain services.
The Company recognizes revenues for maintenance services ratably over the contract term, after collectability has been assured.
Authoritative accounting guidance related to the income statement characterization of reimbursements received for "out-of-pocket" ("OOP") expenses incurred, requires the Company to record reimbursements received for OOP expenses as revenue on an accrual basis. Because these additional revenues are offset by the reimbursable expenses incurred, it does not impact income from operations or net income. The Company's significant OOP expenses at the consolidated level include postage and telecommunication expenditures and at the segment level include print mail services between the Financial Services Segment and the Output Solutions Segment. For each segment, total revenues are reported in two categories, operating revenues and OOP reimbursements. OOP expenses are included in costs and expenses.
Costs and expenses
Costs and expenses include all costs, excluding depreciation and amortization, incurred by the Company to produce revenues. The Company believes that the nature of its business as well as its organizational
101
DST Systems, Inc.
Notes to Consolidated Financial Statements (Continued)
2. Significant Accounting Policies (Continued)
structure, in which virtually all officers and associates have operational responsibilities, does not allow for a meaningful segregation of selling, general and administrative costs. These costs, which the Company believes to be immaterial, are also included in costs and expenses. Substantially all depreciation and amortization is directly associated with the production of revenues.
Software development and maintenance
Purchased software is recorded at cost and is amortized over the estimated economic lives of three to five years. The Company capitalizes costs for the development of internal use software, including coding and software configuration costs and costs of upgrades and enhancements in accordance with authoritative accounting guidance related to accounting for the costs of computer software developed or obtained for internal use. These costs are amortized under the Company's current policy on a straight-line basis, depending on the nature of the project, generally over a three to five year period. The Company reviews, on a quarterly basis, its capitalized software for possible impairment.
The Company capitalizes software development costs for software that will be sold or licensed to third parties after the products reach technological feasibility, it has been determined that the software will result in probable future economic benefits and management has committed to funding the project. These capitalized development costs are amortized on a product-by-product basis using the greater of the amount computed by taking the ratio of current year's net revenue to current year's net revenue plus estimated future net revenues or the amount computed by the straight-line method over the estimated useful life of the product, generally three to five years. The Company evaluates the net realizable value of capitalized software development costs on a product-by-product basis.
The Company capitalized $27.7 million, $20.4 million and $22.3 million of costs related to the development of internal use software and systems to be sold or licensed to third parties for the years ended December 31, 2009, 2008 and 2007, respectively. Amortization expense related to capitalized software development costs totaled $20.1 million, $21.1 million and $25.5 million for the years ended December 31, 2009, 2008 and 2007, respectively.
Operating costs include software development costs, some of which are non-capitalizable, as well as maintenance costs relating to internal proprietary systems and systems to be sold or licensed to third parties of approximately $148.4 million, $134.7 million and $133.9 million for the years ended December 31, 2009, 2008 and 2007, respectively.
Cash equivalents
Short-term liquid investments with a maturity of 90 days or less are considered cash equivalents. Due to the short-term nature of these investments, carrying value approximates market value.
Client funds/obligations
Funds Held on Behalf of Clients
In connection with providing data processing services for its clients, the Company may hold client funds, comprised of funds held on behalf of transfer agency clients and funds held on behalf of pharmacy processing clients.
102
DST Systems, Inc.
Notes to Consolidated Financial Statements (Continued)
2. Significant Accounting Policies (Continued)
End of day available client bank balances for full service mutual fund transfer agency clients are invested overnight by and in the name of the Company into credit-quality money market funds. Invested balances are returned to the full service mutual fund transfer agency client accounts the following business day. Based upon the Company's intent, these invested client balances represent assets that are restricted for use and have been classified as client funds obligations in the Company's Consolidated Balance Sheet.
Funds received from clients of the Company's subsidiary, Argus Health Systems, Inc. ("Argus"), for the payment of pharmacy claims incurred by its members are invested in cash and cash equivalents (credit-quality money market funds), short-term investments and available for sale debt securities (short-term) until the claim payments are presented to the bank. Certain of these amounts are included in funds held on behalf of clients in the Consolidated Balance Sheet and are also recorded as a client funds obligation liability. Funds held on behalf of clients represent assets that, based upon the Company's intent, are restricted for use solely for the purposes of satisfying the obligations to remit funds to pharmacies, which are classified as client funds obligations in the Company's Consolidated Balance Sheet.
The Company has reported the cash flows related to the purchases of investment funds (available for sale securities) held on behalf of clients and the cash flows related to the proceeds from the sales/maturities of investment funds held on behalf of clients on a gross basis in the investing section of the Consolidated Statement of Cash Flows. The Company has reported the cash inflows and outflows related to client fund investments with original maturities of 90 days or less on a net basis within net (increase) decrease in restricted cash and cash equivalents held to satisfy clients fund obligations in the investing section of the Consolidated Statement of Cash Flows. The Company has reported the cash flows related to client funds used in investing activities on a net basis within net increase (decrease) in client funds obligations in the financing section of the Consolidated Statement of Cash Flows.
Client Funding Receivable
Client funding receivables represent amounts due the Company for pharmacy claims paid in advance of receiving client funding and for pharmacy claims processed for which client funding requests have not been made.
Client Funds Obligations
Client funds obligations represent the Company's contractual obligations to remit funds to satisfy client pharmacy claim obligations and are recorded on the balance sheet when incurred, generally after a claim has been processed by the Company. In addition, client funds obligations include transfer agency client balances invested overnight. Client funds obligations represent liabilities that will be repaid within one year of the balance sheet date.
Inventories
Inventories are comprised primarily of paper and envelope stocks. Inventories are stated at the lower of cost or realizable values. Inventories are valued at average cost. Cost for substantially all of the Company's inventories is determined on a specific identification or first-in, first-out basis.
103
DST Systems, Inc.
Notes to Consolidated Financial Statements (Continued)
2. Significant Accounting Policies (Continued)
Investments in securities
The equity method of accounting is used for companies in which the Company or its subsidiaries have at least a 20% voting interest and significant influence but do not control; the cost method of accounting is used for investments of less than 20% voting interest. Partnership and similar investment interests (including investments in private equity funds where the Company is a limited partner) in which the Company has at least 5% ownership are accounted for on an equity method basis based on the Company's pro-rata ownership; the cost method of accounting is used for these investments when the Company has a de-minimus ownership percentage and does not have significant influence. Investments classified as available-for-sale securities are reported at fair value with unrealized gains and losses excluded from earnings and recorded net of deferred taxes directly to stockholders' equity as accumulated other comprehensive income. Investments in trading securities are reported at fair value with unrealized gains and losses included in earnings. Investments classified as held-to-maturity securities are recorded at amortized cost which approximates fair value.
Security transactions and investment income
Security transactions are accounted for on the trade date. Security gains and losses are calculated on the specific identification method. Dividend income is recorded on the ex-dividend date. Interest income, adjusted for discounts and premiums, is recorded on the accrual basis.
Property and equipment
Property and equipment are recorded at cost with major additions and improvements capitalized. Cost includes the amount of interest cost associated with significant capital additions. Depreciation of buildings is recorded using the straight-line method over 30 to 40 years. Data processing equipment, furniture, fixtures and other equipment are depreciated using accelerated methods over the estimated useful lives, principally three to five years. Data processing software is depreciated using the straight-line method over the estimated useful lives, generally three to five years. The Company depreciates large printing and inserting equipment used by the Output Solutions Segment using accelerated methods over a five to seven year life. Leasehold improvements are depreciated using the straight-line method over the lesser of the term of the lease or life of the improvements. The Company reviews, on a quarterly basis, its property and equipment for possible impairment.
Goodwill and intangible assets
The authoritative accounting guidance for goodwill and intangible assets addresses, among other things, how goodwill and other intangible assets should be accounted for after they have been initially recognized in the financial statements. Goodwill and intangible assets that have indefinite useful lives will not be amortized but rather will be tested at least annually for impairment or whenever events or changes in circumstances indicate that the carrying value may not be recoverable. Intangible assets that have finite lives will continue to be amortized over their useful lives.
104
DST Systems, Inc.
Notes to Consolidated Financial Statements (Continued)
2. Significant Accounting Policies (Continued)
The Company's impairment tests indicated that there were no impairments. The fair value of the reporting units was estimated using the expected present value of future cash flows.
Income taxes
In accordance with authoritative accounting guidance for income taxes, the Company recognizes the amount of income taxes payable or refundable for the current year and deferred tax liabilities and assets for the future tax consequences of events that have been recognized in the Company's financial statements or tax returns. Deferred income tax effects of transactions reported in different periods for financial reporting and income tax return purposes are recorded by the liability method. This method gives consideration to the future tax consequences of deferred income or expense items and differences between the income tax and financial accounting statement bases of assets and liabilities and immediately recognizes changes in income tax laws upon enactment. The income statement effect is generally derived from changes in deferred income taxes on the balance sheet.
From time to time, the Company enters into transactions the tax treatment of which under the Internal Revenue Code or applicable state tax laws is uncertain. The Company provides federal and/or state income taxes on such transactions, together with related interest, net of income tax benefit, and any applicable penalties in accordance with accounting guidance for income tax uncertainties. Prior to the adoption of this authoritative guidance on January 1, 2007, the Company classified all income tax uncertainties as current liabilities. Upon adoption, the Company reclassified income tax uncertainties that are estimated to take more than 12 months to resolve as non-current. Interest and penalties related to unrecognized tax benefits, if any, are recorded in income tax expense.
Foreign currency translation
The Company's international subsidiaries use the local currency as the functional currency. The Company translates its assets and liabilities at period end exchange rates except for those accounts where historical rates are acceptable, and translates income and expense accounts at average rates during the period. Translation adjustments are recorded in stockholders' equity and was a cumulative gain of $17.3 million and a cumulative loss of $27.9 million at December 31, 2009 and 2008, respectively. While it is generally not the Company's practice to enter into derivative contracts, from time to time the Company and its subsidiaries do utilize forward foreign currency exchange contracts to minimize the impact of currency movements.
Earnings per share
Basic earnings per share are determined by dividing net income by the weighted average number of common shares outstanding during the year. Dilutive earnings per share are determined by including the dilutive effect of all potential common shares outstanding during the year. The Company issued convertible senior debentures (see Note 9) that if converted in the future would have a potentially dilutive effect on the Company's stock. As of December 31, 2009, the Series A debentures are convertible into 3.1 million shares of common stock, the Series B debentures are convertible into 3.4 million shares of common stock and the Series C debentures are convertible into 5.2 million shares of common stock, subject to adjustment. The Company intends to settle any conversions with cash for the principal and accrued and unpaid interest and issue common stock for any conversion value amount over the principal and accrued and unpaid interest amounts. Under authoritative accounting guidance
105
DST Systems, Inc.
Notes to Consolidated Financial Statements (Continued)
2. Significant Accounting Policies (Continued)
related to earnings per share, a company is required to include the effects of contingently convertible bonds in diluted earnings per share from the date of issuance, without considering the impact of the conversion price. Related to the Company's convertible debentures, the calculation of diluted earnings per share includes an incremental amount of shares assumed to be issued for the conversion spread when the Company's average daily stock price exceeds the average accreted bond price per share.
Derivative and Hedging Activities
Authoritative accounting guidance establishes accounting and reporting standards for derivative instruments, including certain derivative instruments embedded in other contracts and hedging activities. It requires that an entity recognize all derivatives as either assets or liabilities in the balance sheet and measure those instruments at fair value and that the changes in the fair value of derivatives are recorded each period in current earnings or other comprehensive income, depending on whether a derivative is designated as part of a hedge transaction and, if it is, the type of hedge transaction. While it is generally not the Company's practice to enter into derivative contracts, from time to time, the Company utilizes derivatives to manage certain risks. The Company does not enter into derivative arrangements for speculative purposes. During 2009, the Company entered a forward starting interest rate swap related to its real estate credit agreement as further described in Note 9.
Comprehensive income
The Company's comprehensive income consists of net income and unrealized gains (losses) on available-for-sale securities, net of deferred income taxes, reclassifications for net gains included in net income, the Company's proportional share of an unconsolidated affiliate's interest rate swap (except the loss is limited by the carrying value of the investment), unrealized losses on the Company's interest rate swap and foreign currency translation adjustments and are presented in the Consolidated Statement of Changes in Stockholders' Equity.
Share-based compensation
The Company has share-based compensation plans covering its employees and its non-employee directors and has outstanding share awards (primarily in the form of stock options and restricted stock) under each of these plans. The Company recognizes the cost of employee services received in exchange for awards of equity instruments based on the grant date fair value of those awards. The Company estimates compensation costs related to awards that are not expected to vest. For share-based awards granted, the Company expenses the grant date fair value of these awards using the straight-line method over the service period. Amortization for the grant date fair value of share-based awards containing both service and performance features depends on the Company's estimated judgments on whether the performance conditions will be achieved.
New Authoritative Accounting Guidance
Accounting for Transfers of Financial Assets
In June 2009, the Financial Accounting Standards Board ("FASB") issued new authoritative accounting guidance related to transfers of financial assets. This guidance changes the accounting for securitizations of mortgages and other financial instruments and the consolidation requirements for
106
DST Systems, Inc.
Notes to Consolidated Financial Statements (Continued)
2. Significant Accounting Policies (Continued)
qualifying special-purpose entities ("QSPE"). DST will be required to adopt this guidance on January 1, 2010. Early application is prohibited.
Besides removing the concept of a QSPE, this new accounting guidance: a) clarifies the determination of whether a transferor and all the entities included in the transferor's financial statements being presented have surrendered control over transferred financial assets; b) defines the term participating interest to establish specific conditions for reporting a transfer of a portion of a financial asset as a sale; c) requires a transferor to recognize and initially measure at fair value all assets obtained and liabilities incurred as a result of a transfer of financial assets accounted for as a sale; and d) enhances disclosures to provide financial statement users with greater transparency about transfers of financial assets and a transferor's continuing involvement with transferred financial assets.
DST currently believes that the adoption of this new authoritative accounting guidance will require accounts receivable transferred under the Company's accounts receivable securitization program to be reflected as assets of the Company and the proceeds received from such transfers being reflected as debt on the Consolidated Balance Sheet on January 1, 2010. As of December 31, 2009, the amount of transferred accounts receivable was $125.0 million. DST continues to evaluate this new guidance and the impact it may have on the consolidated financial statements.
Variable Interest Entities
In June 2009, the FASB issued new authoritative accounting guidance related to variable interest entities. Among other items, this accounting guidance responds to concerns about the application of certain key provisions of the current accounting guidance for variable interest entities, including those regarding the transparency of the involvement with variable interest entities. DST will be required to adopt this new authoritative accounting guidance on January 1, 2010. Early application is prohibited. The Company has not yet determined the impact that the adoption of this new accounting guidance may have on the consolidated financial statements.
Multiple-Element Revenue Arrangements
In October 2009, the FASB issued new authoritative accounting guidance related to multiple element revenue arrangements. This update provides guidance on whether multiple elements (deliverables) exist, how the deliverables should be separated and how the consideration should be allocated. The new guidance established a hierarchy for determining the selling price of a deliverable. The guidance is effective prospectively for revenue arrangements entered into or materially modified in fiscal years beginning on or after June 15, 2010. Early adoption is permitted. The Company has not yet determined the impact that the adoption of this new accounting guidance may have on the consolidated financial statements.
Certain Revenue Arrangements That Include Software Elements
In October 2009, the FASB issued new authoritative accounting guidance related to certain revenue arrangements that include software elements. This new guidance changes the accounting model for revenue arrangements that include both tangible products and software elements and also provides guidance on how consideration should be allocated in an arrangement that includes both tangible products and software. The new authoritative accounting guidance is effective prospectively for revenue arrangements entered into or materially modified in fiscal years beginning on or after June 15, 2010.
107
DST Systems, Inc.
Notes to Consolidated Financial Statements (Continued)
2. Significant Accounting Policies (Continued)
Early adoption is permitted. The Company has not yet determined the impact that the adoption of this new accounting guidance may have on the consolidated financial statements.
Earnings per Share Proposed Accounting Standard
In August 2008, the FASB issued a revised exposure draft, that would amend current earnings per share accounting guidance to clarify guidance for mandatorily convertible instruments, the treasury stock method, contingently issuable shares, and contracts that may be settled in cash or shares. The final authoritative accounting guidance has yet to be issued. In April 2009, the FASB decided to pause the earnings per share project.
The proposed guidance, which is designed for convergence with international accounting standards, would require the use of the "if-converted" method from the date of issuance of the convertible debentures. The proposed guidance would remove the ability of a company to support the presumption that the convertible securities will be satisfied in cash and not converted into shares of common stock. Accordingly, the Company's stated intention to settle conversions of its convertible debentures with cash for the principal and accrued and unpaid interest and issue common stock for any conversion value amount over the principal and accrued and unpaid interest amounts would no longer be accepted under the current guidance, if amended as proposed. Retrospective application would be required for all changes, except that retrospective application would be prohibited for contracts that were either settled in cash prior to adoption or modified prior to adoption to require cash settlement. For DST, adoption of this accounting guidance, as proposed, will require retroactive restatement of the Company's diluted earnings per share calculations subsequent to the issuance of the convertible debentures. In calculating diluted earnings per share using the "if converted" method included in the exposure draft, the Company would need to increase net income for the interest expense associated with the convertible debentures, net of tax, and increase the incremental shares assumed to be issued upon conversion by approximately 11.7 million shares (less shares already included in diluted earnings per share, if any), the amount of shares that would be issued if all $580.1 million of the senior convertible debentures at December 31, 2009 would be converted to equity. The revised exposure draft also contains other EPS computational changes (e.g., treasury stock method considerations) that may have an effect on the Company's diluted earnings per share calculation. DST is continuing to monitor the FASB's progress towards finalizing this proposed accounting guidance.
The proposed change in accounting principle would affect the calculation of diluted earnings per share during the period the debentures are outstanding, but would not affect DST's ability to ultimately settle the convertible debentures in cash, shares or any combination thereof.
3. Reclassification within Consolidated Statement of Cash Flows
The Company has reclassified the net (increase) decrease in funds held on behalf of clients (formerly reported under the heading "changes in transfer agency investments") in the Consolidated Statement of Cash Flows from operating activities to investing activities for all periods presented. In addition, the Company has reclassified the net increase (decrease) in client funds obligations (formerly reported under the heading "changes in transfer agency deposits") in the Consolidated Statement of Cash Flows from operating activities to financing activities for all periods presented.
108
DST Systems, Inc.
Notes to Consolidated Financial Statements (Continued)
3. Reclassification within Consolidated Statement of Cash Flows (Continued)
The impacts of the reclassifications were as follows (in millions):
| |
For the Years Ended December 31, |
||||||
|---|---|---|---|---|---|---|---|
| |
2008 | 2007 | |||||
Cash flows—investing activities: |
|||||||
Net cash provided by (used in) investing activities—as previously reported |
$ | (110.1 | ) | $ | 865.6 | ||
Impact of reclassification |
(31.9 |
) |
(51.8 |
) |
|||
Net cash provided by (used in) investing activities—as reclassified |
$ | (142.0 | ) | $ | 813.8 | ||
Cash flows—financing activities: |
|||||||
Net cash (used in) financing activities—as previously reported |
$ | (356.9 | ) | $ | (868.7 | ) | |
Impact of reclassification |
31.9 |
51.8 |
|||||
Net cash (used in) financing activities—as reclassified |
$ | (325.0 | ) | $ | (816.9 | ) | |
This reclassification had no impact on the net change in cash and cash equivalents or cash flows from operating activities for any period presented.
4. Significant Business Transactions
Acquisition of Argus Health Systems, Inc.
Prior to March 31, 2009, DST owned a 50% interest in Argus, which provides pharmacy claims processing and other related services to help clients manage pharmacy benefit programs. On March 31, 2009, DST purchased the remaining 50% interest of Argus for $57.0 million in cash. As a result, Argus is no longer an unconsolidated affiliate of DST, but rather is a wholly owned subsidiary resulting in DST consolidating the results of Argus after March 31, 2009 rather than recording equity in earnings of Argus. On January 1, 2009 and as required by generally accepted accounting principles, the Company adopted new authoritative accounting guidance for business combinations. In accordance with the guidance, the acquisition of the remaining 50% of Argus was treated as a step acquisition. Accordingly, DST remeasured its previously held equity interest in Argus to fair value, in the amount of $57.0 million, and recorded a gain of $41.7 million on March 31, 2009, which is included in other income (expense), net in the Consolidated Statement of Income. DST has recognized identifiable assets (comprised of proprietary software of $26.0 million, customer relationships of $14.0 million and other intangible assets of $1.0 million) and goodwill resulting from the acquisition of the remaining 50% Argus interest and the remeasurement of DST's previously held equity interest. Based on the purchase price allocation, DST estimates that annual amortization expense from acquired Argus intangible assets will be approximately $4.2 million. Goodwill of $63.0 million arising from the acquisition is comprised of the assembled workforce of Argus and other assets and is included in the Financial Services Segment. None of the goodwill is expected to be deductible for income tax purposes. DST believes that the acquisition of Argus complements its existing DST Health Solutions business, increases the size of DST's healthcare processing capabilities and will enable the Company to provide broader product offerings to new and existing customers. Argus recorded revenues of approximately $127.7 million during the year ended December 31, 2008. Assuming the acquisition of the remaining 50% of Argus
109
DST Systems, Inc.
Notes to Consolidated Financial Statements (Continued)
4. Significant Business Transactions (Continued)
had occurred on January 1, 2009 and 2008, the Company's total revenues would have been $2,236.7 million and $2,387.4 million for the years ended December 31, 2009 and 2008, respectively. Consolidated proforma net income and diluted earnings per share would not have been materially different from the reported amounts for the years ended December 31, 2009 and 2008. The unaudited proforma amounts are not necessarily indicative of what actual consolidated results of operations might have been if the acquisition had been effective as of January 1, 2009 and 2008.
The following table summarizes the consideration paid for Argus and the allocation of the fair value of Argus to the fair values of assets acquired and liabilities assumed at March 31, 2009 (in millions).
Consideration |
||||||
Cash paid for remaining 50% equity interest in Argus |
$ | 57.0 | ||||
Fair value of DST's equity interest in Argus before the business combination |
57.0 | |||||
Fair value of Argus |
$ | 114.0 | ||||
Recognized amounts of identifiable assets acquired and liabilities assumed |
||||||
Cash and cash equivalents |
$ | 9.2 | ||||
Funds held on behalf of clients |
148.0 | |||||
Client funding receivable |
99.6 | |||||
Accounts receivable |
16.9 | |||||
Other current assets |
7.5 | |||||
Properties (includes $26.0 of proprietary software) |
31.4 | |||||
Intangible assets |
15.0 | |||||
Goodwill |
63.0 | |||||
Other non-current assets |
2.9 | |||||
Total assets |
393.5 | |||||
Client funds obligations |
247.6 |
|||||
Other current liabilities |
16.7 | |||||
Deferred income tax liabilities |
13.9 | |||||
Non-current liabilities |
1.3 | |||||
Total liabilities |
279.5 | |||||
Net assets acquired |
$ | 114.0 | ||||
Acquisition of BlueDoor Technologies
On November 14, 2008, DST completed the acquisition of BlueDoor Technologies Pty Ltd ("BlueDoor"), a private company that provides software solutions for participant accounting for the funds management and retirement savings ("superannuation") markets in Australia. The acquisition was accounted for as a purchase and the consideration paid for BlueDoor on the acquisition date consisted of approximately $10.3 million of cash and 85,006 shares of DST common stock at an approximate value of $3.1 million. The acquisition of BlueDoor did not have a material impact on the Financial Services Segment or consolidated financial results of DST during the year ended
110
DST Systems, Inc.
Notes to Consolidated Financial Statements (Continued)
4. Significant Business Transactions (Continued)
December 31, 2008. DST believes the expansion of its software solution offerings will provide broader product offerings to existing and new customers.
There are provisions in the BlueDoor acquisition agreement that allow for additional consideration to be paid if license and service fee revenue targets are achieved and upon the completion of future service by the former owners of BlueDoor. As of December 31, 2009, the aggregate amount of contingent consideration that could be paid related to this business acquisition was approximately $17.3 million. Approximately $6.9 million of that amount would be due in 2010 while the remainder would be paid from 2011 through 2015. DST has allocated the total purchase price for BlueDoor to the fair values of assets acquired and liabilities assumed at the date of the acquisition. The initial $13.4 million purchase price allocation resulted in approximately $10.3 million of proprietary software $0.7 million of customer relationship intangible assets, $3.9 million of goodwill, and $1.5 million of net liabilities assumed. The software and customer relationship intangible assets are being amortized over a period ranging from 5-8 years.
Acquisition of remaining interest in an unconsolidated real estate joint venture
On December 29, 2008, DST acquired the remaining 50% interest in an unconsolidated real estate joint venture, Broadway Realty Company, LLC ("BRC"). BRC owns an office building and parking garage in Kansas City, Missouri. DST accounted for its investment in BRC under the equity method of accounting prior to the acquisition date, but has consolidated this entity as of December 31, 2008. Cash consideration paid for the remaining 50% interest in BRC was approximately $13.3 million. DST has allocated the purchase price to the fair value of BRC's net assets, which resulted in the purchase price being allocated primarily to the value of BRC's real estate assets. No amount of the purchase price for BRC was allocated to intangible assets or goodwill.
Acquisition of TASS, LLC and Mosiki, LLC
During 2007, DST acquired two businesses for an aggregate of $14.9 million. TASS, LLC ("TASS"), provides mutual fund shareowner subaccounting services on a full service basis to the broker/dealer industry. TASS uses the subaccounting platform of TA2000, DST's proprietary mutual fund shareowner accounting and recordkeeping system, to perform these services for its customers. Mosiki, LLC ("Mosiki"), provides professional consulting services and solutions to investment management software customers. TASS and Mosiki are both included in the Financial Services Segment. The acquisition of TASS and Mosiki did not have a material impact on the consolidated financial results of DST during the year ended December 31, 2007. DST believes the expansion of its mutual fund and investment management software offerings will provide broader product offerings to existing and new customers.
Both acquisitions were accounted for as a purchase and the results of TASS and Mosiki are included in DST's consolidated financial statements beginning July 31, 2007 and August 9, 2007, respectively. The minimum aggregate purchase price was $14.9 million and $2.3 million of net liabilities were assumed. The purchase price was paid in cash at closing and was funded with available cash balances and existing credit facilities. There are provisions in both acquisition agreements that allow for additional consideration to be paid if certain operating performance measures are met, including revenue, operating income and number of subaccounts processed on the subaccounting platform of TA2000, as these operating performance measures are described in the acquisition agreements. During the years ended December 31, 2009 and 2008, approximately $0.5 million and $1.0 million, respectively, of
111
DST Systems, Inc.
Notes to Consolidated Financial Statements (Continued)
4. Significant Business Transactions (Continued)
contingent consideration was paid related to these acquisitions. As of December 31, 2009, the aggregate amount of contingent consideration that could be paid related to these business acquisitions was approximately $32.0 million which would be due in 2011. DST allocated the total purchase prices for these businesses to the fair values of assets acquired and liabilities assumed at the date of the acquisition. The purchase price allocation resulted in approximately $8.9 million of customer relationship intangible assets, $2.8 million of other intangible assets related to proprietary software, tradenames, and non-compete agreements, $5.5 million of goodwill, and $2.3 million of net liabilities assumed. The intangible assets will be amortized over a period ranging from 3-15 years.
Gain on Sale of Asurion
On January 1, 2006, the Company completed a transaction to merge its DST lock\line, Inc. subsidiary into a wholly-owned subsidiary of Asurion Corporation. The merger was structured as a tax-free reorganization and resulted in DST acquiring a 37.4% ownership interest in Asurion.
On July 3, 2007, the Board of Directors of Asurion consummated a transaction whereby certain private equity firms acquired a significant stake in Asurion. In connection with the sale, DST received cash proceeds of $986.3 million and receivables of approximately $39.2 million that were collected in June 2008, and DST's equity interest in Asurion was reduced from 37.4% to approximately 6%. Effective with the closing of the transaction, DST accounts for its investment in Asurion under the cost basis of accounting and no longer records equity in earnings of Asurion. At December 31, 2009 and 2008, DST's net investment in Asurion was $3.1 million. The sale of Asurion resulted in DST recording a $998.0 million pretax gain during the year ended December 31, 2007. A majority of the cash proceeds received in connection with this transaction were used to pay down the Company's debt and related facilities and to satisfy income tax obligations associated with the sale.
112
DST Systems, Inc.
Notes to Consolidated Financial Statements (Continued)
5. Investments
Investments are as follows (in millions):
| |
|
Carrying Value December 31, |
||||||||||
|---|---|---|---|---|---|---|---|---|---|---|---|---|
| |
2009 Ownership Percentage |
|||||||||||
| |
2009 | 2008 | ||||||||||
Available-for-sale securities: |
||||||||||||
State Street Corporation |
2 | % | $ | 460.7 | $ | 416.1 | ||||||
Computershare Ltd |
4 | % | 228.8 | 163.4 | ||||||||
Euronet Worldwide, Inc. |
4 | % | 41.4 | 21.9 | ||||||||
Other available-for-sale securities |
162.4 | 149.9 | ||||||||||
|
893.3 | 751.3 | ||||||||||
Unconsolidated affiliates: |
||||||||||||
Boston Financial Data Services, Inc. |
50 | % | 154.5 | 167.4 | ||||||||
International Financial Data Services, U.K. |
50 | % | 65.1 | 50.3 | ||||||||
International Financial Data Services, L.P. |
50 | % | 38.5 | 24.3 | ||||||||
Argus Health Systems |
16.8 | |||||||||||
Unconsolidated real estate affiliates |
88.0 | 89.5 | ||||||||||
Other unconsolidated affiliates |
13.4 | 9.8 | ||||||||||
|
359.5 | 358.1 | ||||||||||
Other: |
||||||||||||
Trading securities |
48.8 | 34.2 | ||||||||||
Held-to-maturity |
6.9 | 3.0 | ||||||||||
Investments, at cost |
103.3 | 74.2 | ||||||||||
|
159.0 | 111.4 | ||||||||||
Total investments |
$ | 1,411.8 | $ | 1,220.8 | ||||||||
State Street Corporation ("State Street") is a financial services corporation that provides services to institutional investors. State Street's range of financial services includes banking, trust, global custody, research, investment management, trading services and investment servicing. The aggregate market value of the Company's investment in State Street's common stock presented above was based on the closing price on the New York Stock Exchange at the respective year end. The Company received $0.4 million, $10.6 million and $9.9 million in dividends from State Street during the years ended December 31, 2009, 2008 and 2007, respectively, which have been recorded in other income.
Computershare is a global provider of share registry management/transfer agency services and technology to the global securities industry. Computershare's common stock is listed on the Australian Stock Exchange under ASX: CPU. The aggregate market value of the Company's investment in Computershare's common stock presented above was based on the closing price on the Australian exchange at the respective year-end.
Euronet Worldwide, Inc. ("Euronet") is a leading provider of secure electronic financial transaction solutions. Euronet provides outsourcing and consulting services, integrated electronic funds transfer software, network gateways and electronic top-up services to financial institutions, mobile operators and retailers, as well as electronic consumer money transfers and bill payment services. The aggregate
113
DST Systems, Inc.
Notes to Consolidated Financial Statements (Continued)
5. Investments (Continued)
market value of the Company's investment in Euronet's common stock presented above was based on the closing price on the NASDAQ at the respective year end.
The Company is a limited partner in various private equity funds. At December 31, 2009 and 2008, the Company's carrying value of these private equity fund investments was approximately $94.4 million and $63.1 million, respectively. At December 31, 2009, the Company had future capital commitments related to these private equity fund investments of approximately $142.0 million.
Certain information related to the Company's available-for-sale securities is as follows (in millions):
| |
December 31, | ||||||
|---|---|---|---|---|---|---|---|
| |
2009 | 2008 | |||||
Book cost basis |
$ | 319.4 | $ | 394.2 | |||
Gross unrealized gains |
557.8 | 386.7 | |||||
Gross unrealized losses |
(0.9 | ) | (15.7 | ) | |||
Unrealized gain (loss) from changes in foreign currency exchange rates |
17.0 | (13.9 | ) | ||||
Market value |
$ | 893.3 | $ | 751.3 | |||
During 2009, 2008 and 2007, the Company received $146.3 million, $119.5 million and $58.4 million, respectively, from the sale of investments in available-for-sale securities. Gross realized gains of $49.1 million, $42.3 million and $16.2 million and gross realized losses of $3.1 million, $10.2 million and $2.9 million, were recorded in 2009, 2008 and 2007, respectively, from available-for-sale securities. In addition, the Company recorded unrealized losses on available-for-sale securities of $27.3 million, $53.1 million and $10.7 million related to other than temporary investment impairments for the years ended December 31, 2009, 2008 and 2007, respectively.
The following table summarizes the fair value and gross unrealized losses of the Company's investments by the length of time that the securities have been in a continuous loss position, at December 31, 2009 (in millions):
| |
Less than 12 months | Greater than 12 months | Total | ||||||||||||||||
|---|---|---|---|---|---|---|---|---|---|---|---|---|---|---|---|---|---|---|---|
| |
Fair Value | Unrealized losses |
Fair Value | Unrealized losses |
Fair Value | Unrealized losses |
|||||||||||||
Common Stock |
$ | 8.4 | $ | 0.9 | $ | $ | $ | 8.4 | $ | 0.9 | |||||||||
The Company recognized $27.3 million, $53.1 million and $10.7 million of investment impairments for the years ended December 31, 2009, 2008 and 2007, respectively, which the Company believed were other than temporary. The Company records lower of cost or market valuation adjustments on private equity fund investments and other cost method investments when impairment conditions are present. During the years ended December 31, 2009, 2008 and 2007, the Company recorded $1.8 million, $20.8 million and $1.4 million, respectively, of net impairments on private equity fund and other investments related to adverse market conditions and from poor performance of the underlying investment. The impairments related primarily to investments in the Financial Services and Investments and Other Segments. A decline in a security's net realizable value that is other than temporary is treated as a loss based on quoted market value and is reflected in Other income (expense), net, in the Consolidated Statement of Income.
114
DST Systems, Inc.
Notes to Consolidated Financial Statements (Continued)
5. Investments (Continued)
Future adverse changes in market conditions or poor operating results of underlying investments could result in losses or an inability to recover the carrying value of the investments that may not be reflected in an investment's current carrying value, thereby possibly requiring an impairment charge in the future. Such a charge could have a material effect on the Company's financial position.
Boston Financial Data Services ("BFDS") is a 50% owned corporate joint venture of the Company and State Street. BFDS combines use of the Company's proprietary applications and output solutions capabilities with the marketing and custodial capabilities of State Street to provide full-service and shared-service shareowner accounting and recordkeeping services to mutual fund companies. BFDS also offers settlement administration services, teleservicing and full-service support for defined contributions plans using the Company's TRAC system and provides non-traded REIT participant accounting services. In terms of operating revenues, BFDS was the largest customer of the Financial Services Segment during 2009 and 2008.
IFDS U.K. is a U.K. joint venture of the Company and State Street. IFDS U.K. provides full, remote and shared processing for U.K. unit trusts and related products. The largest remote unitholder client of IFDS U.K. at December 31, 2009 is Cofunds, Ltd. ("Cofunds"), a mutual fund supermarket. IFDS U.K. and one of its affiliates also have a non-controlling investment interest in Cofunds.
IFDS L.P. is a U.S. partnership between the Company and State Street. IFDS L.P. owns the following operating joint ventures: IFDS Canada, IFDS Ireland and IFDS Luxembourg. IFDS L.P. provides shareowner accounting and recordkeeping to international markets.
Pershing Road Development Company, LLC is a limited special purpose real estate joint venture of the Company and an undisclosed third party. The real estate joint venture was formed to develop and lease approximately 1.1 million square feet of office space for the U.S. government. This entity is included with other unconsolidated affiliates (primarily real-estate joint ventures) in other in the table below.
Equity in earnings (losses) of unconsolidated affiliates, net of income taxes provided by the unconsolidated affiliates follows (in millions):
| |
Year Ended December 31, | |||||||||
|---|---|---|---|---|---|---|---|---|---|---|
| |
2009 | 2008 | 2007 | |||||||
BFDS |
$ | 12.1 | $ | 16.4 | $ | 30.9 | ||||
IFDS U.K. |
9.2 | 10.6 | 13.5 | |||||||
IFDS L.P. |
10.9 | 5.8 | 2.3 | |||||||
Argus* |
(1.5 | ) | 0.7 | 2.3 | ||||||
Asurion |
21.9 | |||||||||
Other |
6.6 | 1.2 | (8.3 | ) | ||||||
|
$ | 37.3 | $ | 34.7 | $ | 62.6 | ||||
- *
- Equity in losses of Argus for 2009 is for the period January 1, 2009 through March 31, 2009, the date DST acquired the remaining 50% equity interest and consolidated Argus.
115
DST Systems, Inc.
Notes to Consolidated Financial Statements (Continued)
5. Investments (Continued)
Certain condensed financial information of the unconsolidated affiliates follows (in millions):
| |
Year Ended December 31, | |||||||||
|---|---|---|---|---|---|---|---|---|---|---|
| |
2009 | 2008 | 2007 | |||||||
Revenues |
$ | 948.8 | $ | 1,043.9 | $ | 1,703.3 | ||||
Costs and expenses |
847.4 | 975.4 | 1,554.2 | |||||||
Net income |
101.4 | 68.5 | 149.1 | |||||||
Current assets |
1,012.1 | 1,320.7 | 819.2 | |||||||
Noncurrent assets |
738.7 | 744.2 | 895.6 | |||||||
Current liabilities |
629.1 | 1,027.5 | 619.7 | |||||||
Noncurrent liabilities |
492.9 | 450.2 | 446.9 | |||||||
Partners' and stockholders' equity |
628.9 | 587.2 | 648.2 | |||||||
The Company's unconsolidated affiliates had a carrying value of $359.5 million and $358.1 million at December 31, 2009 and 2008, respectively. The Company recognized operating revenues from these unconsolidated affiliates of $176.3 million, $195.2 million and $187.2 million in 2009, 2008 and 2007, respectively. The Company paid these unconsolidated affiliates $9.8 million, $11.3 million and $10.9 million in 2009, 2008 and 2007, respectively, for products, services and leases. At December 31, 2009 and 2008, the Company's unconsolidated affiliates owed the Company $63.6 million and $71.2 million, respectively, including approximately $37.6 million and $37.9 million of a secured commercial mortgage loan receivable at December 31, 2009 and 2008, respectively, and $10.3 million and $11.4 million of advances at December 31, 2009 and 2008, respectively. Excluding activity related to the BFDS promissory note (Note 9), net repayments and advances, respectively to unconsolidated affiliates were $1.0 million and $43.6 million during 2009 and 2008, respectively, and net repayments from these unconsolidated affiliates were $36.8 million during 2007. Net proceeds from unconsolidated affiliates were $31.1 million and $9.6 million during 2009 and 2008, respectively, and net investments in unconsolidated affiliates were $8.5 million during 2007. Excluding amounts owed under the BFDS promissory note (Note 9), the Company owed $0.4 million and $0.3 million to unconsolidated affiliates at December 31, 2009 and 2008, respectively.
Goodwill and other intangibles is classified as part of the Company's investments in unconsolidated affiliates and represents the difference between the Company's carrying value of the unconsolidated affiliate and its pro-rata share of the unconsolidated affiliates' net tangible assets. At both December 31, 2009 and 2008, goodwill and intangible assets (net of accumulated depreciation) was $1.0 million. Related amortization expense was $0.3 million for the year ended December 31, 2007.
6. Fair Value Measurements
The authoritative accounting guidance on fair value measurements establishes a three-tier fair value hierarchy, which prioritizes the inputs used in measuring fair value. These tiers include: Level 1, defined as observable inputs such as quoted prices in active markets; Level 2, defined as inputs other than quoted prices in active markets that are either directly or indirectly observable; and Level 3, defined as unobservable inputs in which little or no market data exists, therefore requiring an entity to develop its own assumptions.
As of December 31, 2009, the Company held certain investment assets that are required to be measured at fair value on a recurring basis. These investments include the Company's available-for-sale
116
DST Systems, Inc.
Notes to Consolidated Financial Statements (Continued)
6. Fair Value Measurements (Continued)
equity securities and trading securities whereby fair value is determined using quoted prices in active markets. Accordingly, the fair value measurements of these investments have been classified as Level 1 in the table below. Included in funds held on behalf of clients at December 31, 2009 are approximately $11.1 million of available-for-sale fixed income securities held to satisfy client funds obligations. The Company also owns $4.4 million of other available-for-sale fixed income securities. In addition, the Company entered into a forward starting interest rate swap in January 2009 that is required to be reported at fair value. Fair value for the available-for-sale fixed income securities and for the interest rate swap was determined using inputs from quoted prices for similar assets and liabilities in active markets and other observable inputs directly or indirectly. Accordingly, these investments have been classified as Level 2 in the table below.
The following table presents assets and liabilities measured at fair value on a recurring basis as of December 31, 2009 (in millions):
| |
|
Fair Value Measurements at Reporting Date Using |
|||||||||||
|---|---|---|---|---|---|---|---|---|---|---|---|---|---|
| |
Total | Quoted prices in Active Markets for Identical Assets (Level 1) |
Significant Other Observable Inputs (Level 2) |
Significant Unobservable Inputs (Level 3) |
|||||||||
Available-for-sale securities |
$ | 893.3 | $ | 888.9 | $ | 4.4 | $ | ||||||
Trading securities |
48.8 | 48.8 | |||||||||||
Available-for-sale securities held to satisfy client funds obligations |
11.1 | 11.1 | |||||||||||
Interest rate swap liability |
(1.9 | ) | (1.9 | ) | |||||||||
|
$ | 951.3 | $ | 937.7 | $ | 13.6 | $ | ||||||
At December 31, 2009, one of DST's unconsolidated affiliates had an interest rate swap with a fair market value liability of $35.6 million. The unconsolidated affiliate used inputs from quoted prices for similar assets and liabilities in active markets and other observable inputs directly or indirectly related to the measurement of the interest rate swap. The fair value measurement of the interest rate swap has been classified as Level 2 by the unconsolidated affiliate. The above table presents only assets and liabilities measured at fair value for which the Company controls, and accordingly excludes items held by unconsolidated affiliates.
The following table presents the carrying value and estimated fair value for the convertible senior debentures as of December 31, 2009 (in millions):
| |
Carrying Value |
Estimated Fair Value |
|||||
|---|---|---|---|---|---|---|---|
Series A |
$ | 151.8 | $ | 151.8 | |||
Series B |
171.3 | 179.4 | |||||
Series C |
257.0 | 278.7 | |||||
Total |
$ | 580.1 | $ | 609.9 | |||
117
DST Systems, Inc.
Notes to Consolidated Financial Statements (Continued)
6. Fair Value Measurements (Continued)
The estimated fair values of the Company's publicly held convertible senior debentures were based on quoted market prices and are classified as Level 2.
7. Properties
Properties and related accumulated depreciation are as follows (in millions):
| |
December 31, | ||||||
|---|---|---|---|---|---|---|---|
| |
2009 | 2008 | |||||
Land |
$ | 65.8 | $ | 62.5 | |||
Buildings |
344.4 | 343.5 | |||||
Data processing equipment |
192.1 | 238.6 | |||||
Data processing software |
458.4 | 419.6 | |||||
Furniture, fixtures and other equipment |
396.0 | 373.4 | |||||
Leasehold improvements |
72.5 | 68.7 | |||||
Construction-in-progress |
35.3 | 14.1 | |||||
|
1,564.5 | 1,520.4 | |||||
Less accumulated depreciation and amortization |
1,028.2 | 1,008.1 | |||||
Net properties |
$ | 536.3 | $ | 512.3 | |||
At December 31, 2009 and 2008, there were approximately $8.9 million and $9.9 million of net properties, respectively, which are included in the above table, under lease with a municipality. At December 31, 2009 and 2008, there was approximately $6.0 million and $7.0 million, respectively, of assets (primarily buildings) under capital lease, net of accumulated depreciation, included in the above table.
Included in data processing software is $26.0 million of proprietary software acquired in the March 2009 acquisition of Argus. At December 31, 2009, the net book value of this acquired software was $23.6 million.
Depreciation expense for the years ended December 31, 2009, 2008 and 2007, was $123.7 million, $119.7 million and $127.1 million, respectively.
During the years ended December 31, 2009, 2008 and 2007, the Company recorded gains from the sale of properties in the amount of $0.2 million, $1.3 million and $12.4 million, respectively. The gains, which have been included as a reduction in Costs and expenses on the Consolidated Statement of Income, are primarily attributable to the sale of office buildings and other real estate and are included in the Investments and Other Segment.
118
DST Systems, Inc.
Notes to Consolidated Financial Statements (Continued)
8. Goodwill and Intangible Assets
Goodwill
The following tables summarize the changes in the carrying amount of goodwill for the years ended December 31, 2009 and 2008, by Segment (in millions):
| |
December 31, 2008 |
Acquisitions | Disposals | Other | December 31, 2009 |
|||||||||||
|---|---|---|---|---|---|---|---|---|---|---|---|---|---|---|---|---|
Financial Services |
$ | 109.9 | $ | 65.2 | $ | $ | (0.2 | ) | $ | 174.9 | ||||||
Output Solutions |
8.8 | (0.1 | ) | 8.7 | ||||||||||||
Total |
$ | 118.7 | $ | 65.2 | $ | $ | (0.3 | ) | $ | 183.6 | ||||||
| |
December 31, 2007 |
Acquisitions | Disposals | Other | December 31, 2008 |
|||||||||||
|---|---|---|---|---|---|---|---|---|---|---|---|---|---|---|---|---|
Financial Services |
$ | 108.5 | $ | 2.1 | $ | $ | (0.7 | ) | $ | 109.9 | ||||||
Output Solutions |
9.4 | (0.6 | ) | 8.8 | ||||||||||||
Total |
$ | 117.9 | $ | 2.1 | $ | $ | (1.3 | ) | $ | 118.7 | ||||||
Approximately $67.4 million of consolidated goodwill is tax deductible at December 31, 2009. In the table above, the "other" column primarily represents the effects of foreign currency translation.
Intangible Assets
The following table summarizes intangible assets (in millions):
| |
December 31, 2009 | December 31, 2008 | ||||||||||||
|---|---|---|---|---|---|---|---|---|---|---|---|---|---|---|
| |
Gross Carrying Amount |
Accumulated Amortization |
Gross Carrying Amount |
Accumulated Amortization |
||||||||||
Amortized intangible assets: |
||||||||||||||
Customer relationships |
$ | 51.2 | $ | 11.6 | $ | 37.2 | $ | 8.1 | ||||||
Other |
6.0 | 2.6 | 3.8 | 1.7 | ||||||||||
Total |
$ | 57.2 | $ | 14.2 | $ | 41.0 | $ | 9.8 | ||||||
As described in Note 4, the purchase of the remaining 50% equity interest in Argus on March 31, 2009, resulted in $63.0 million of goodwill, $14.0 million of customer relationship intangible assets, $1.0 million of other intangible assets and $26.0 million of proprietary software (which has been included in properties). These items are not deductible for income tax purposes. During 2008, DST acquired BlueDoor which resulted in $0.7 million of customer relationships intangible assets.
Intangible assets at December 31, 2009 primarily represent customer relationships with estimated useful lives ranging from 5 to 17 years. The weighted average amortization period for customer relationships and other intangibles assets is 13.6 years and 5.5 years, respectively. Amortization of intangible assets for the years ended December 31, 2009, 2008 and 2007 was $4.4 million, $3.9 million and $3.3 million, respectively. Annual amortization for intangible assets recorded as of December 31, 2009 is estimated to be $4.7 million for 2010, $4.5 million for 2011, $4.3 million for 2012, $3.6 million for 2013, $3.5 million for 2014 and $22.4 million thereafter. Except for approximately $1.3 million of intangible assets acquired in a 2006 business combination and the intangibles acquired in the 2009 Argus acquisition, substantially all of the remaining intangibles in the above table are tax-deductible.
119
DST Systems, Inc.
Notes to Consolidated Financial Statements (Continued)
9. Long-Term Debt
The Company is obligated under notes and other indebtedness as follows (in millions):
| |
December 31, | |||||||
|---|---|---|---|---|---|---|---|---|
| |
2009 | 2008 | ||||||
Secured promissory notes |
$ | 8.9 | $ | 13.1 | ||||
Equipment credit facility |
8.8 | 10.3 | ||||||
Real estate credit agreement |
111.6 | 114.5 | ||||||
Convertible senior debentures |
||||||||
Series A |
151.8 | 531.4 | ||||||
Series B |
171.3 | 179.8 | ||||||
Series C |
257.0 | |||||||
Revolving credit facilities |
416.3 |
487.3 |
||||||
Related party promissory note |
75.0 | 75.0 | ||||||
Other indebtedness |
21.2 | 23.9 | ||||||
|
1,221.9 | 1,435.3 | ||||||
Less current portion of debt |
658.1 | 89.9 | ||||||
Long-term debt |
$ | 563.8 | $ | 1,345.4 | ||||
Secured promissory notes
The secured promissory notes represent loans for real estate and equipment purchases. The outstanding amount at December 31, 2009 under the real estate notes and equipment notes was $7.9 million and $1.0 million, respectively. The real estate borrowings are due in installments with the balance due at the end of the term. Interest rates on the real estate borrowings are generally fixed. Fixed rates range from 6.0% to 8.39%. The real estate loans are secured by real property owned by the Company.
Equipment credit facility
The Company has a $50.0 million unsecured credit facility with a vendor. Proceeds from loans made under the credit facility can be used to make purchases of the vendor's eligible equipment, software or services. Loans under this credit facility must be made prior to June 30, 2010, the draw period termination date. The maturity date for each loan under this credit facility is the earlier of i) the first day of the second calendar month following the third anniversary of the loan date or ii) August 1, 2013. Interest rates applicable to the loans under this credit facility are generally based on the offshore LIBOR rate plus an applicable margin of 0.40% to 0.85%. The applicable margin is based on a grid schedule that adjusts borrowing costs up or down based upon the Company's consolidated leverage ratio.
Real estate credit agreement and interest rate swap
On September 16, 2008, certain subsidiaries of DST entered into a real estate credit agreement with a syndicate of lenders. The credit agreement provides for a five-year, non-revolving credit facility in an aggregate principal amount of up to $120.0 million. Upon closing of the facility in September 2008, $115.0 million was advanced to DST. The credit facility is secured by, among other things, the
120
DST Systems, Inc.
Notes to Consolidated Financial Statements (Continued)
9. Long-Term Debt (Continued)
real estate and properties owned by these DST subsidiaries as well as an assignment of the related leases, rents and other benefits of these assets. The interest rate applicable to the credit agreement is a floating rate tied to either offshore LIBOR rate plus an applicable margin rate of 1.75% or the prime rate (as defined in the credit agreement), as elected by DST. Principal and interest payments are due on the first of each month beginning in November 2008, and are based on a 20 year amortization schedule. Subject to provisions in the credit agreement, DST may voluntarily prepay the loan in whole or in part without premium or penalty, though amounts repaid may not be reborrowed. Concurrent with the lease, sale or other transfer of any of the collateralized properties, DST must prepay an amount equal to 125% of the allocated amount of such property as set forth in the credit agreement. The credit agreement contains customary restrictive covenants, as well as certain customary events of default. Among other provisions, the credit agreement requires certain interest coverage ratios to be maintained. If any event of default occurs and is continuing, all amounts payable under the credit agreement may be declared immediately due and payable. The balance of the loan is due on September 16, 2013, the maturity date for the credit facility.
In January 2009, the Company entered an interest rate swap with a bank to fix the interest rate on its syndicated real estate credit agreement at approximately 4.49% (includes 1.75% applicable margin rate) beginning January 2010. This interest rate swap qualifies as a derivative instrument.
Accounting and reporting guidance for derivative instruments, including certain derivative instruments embedded in other contracts and hedging activities requires that an entity recognize all derivatives as either assets or liabilities in the balance sheet and measure those instruments at fair value, and that the changes in the fair value of derivatives are recorded each period in current earnings or other comprehensive income, depending on whether a derivative is designated as part of a hedge transaction and, if it is, the type of hedge transaction.
The Company's interest rate swap is a cash flow hedge of future interest payments under the Company's real estate credit agreement and uses a pay-fixed, receive-variable, forward starting interest rate swap. The Company's risk management objective and strategy for undertaking this hedge is to eliminate the variability of interest cash flows related to the Company's floating-rate real estate credit agreement. Changes in the cash flows of the interest rate swap are expected to offset the changes in cash flows attributable to fluctuations in the one-month LIBOR benchmark interest rate. The derivative instrument is a receive floating, pay 2.74% fixed, forward starting interest rate swap with an effective date of January 4, 2010 and a maturity date of September 16, 2013. Effectiveness of the hedge relationship is assessed on a quarterly basis both prospectively and retrospectively using the "cumulative dollar offset" method, in which the cumulative changes in the value of the hedging instrument are directly compared with the cumulative change in the fair value or cash flows of the hedged item. A dollar offset ratio of between 0.80 and 1.25 is required in order to qualify for hedge accounting treatment. At inception of the hedge, the cumulative dollar offset ratio is 1.00 since the terms of the perfect hypothetical swap match those of the actual swap. The derivative accounting guidance indicates that hedge effectiveness occurs only if the cumulative gain or loss on the derivative hedging instrument exceeds the cumulative change in the expected future cash flows of the hedged transaction. At December 31, 2009, the fair value of the Company's pay-fixed, receive-variable, forward starting interest rate swap was a liability of $1.9 million, which is included in other non-current liabilities in the Consolidated Balance Sheet. The Company determined there was no ineffectiveness during the year ended December 31, 2009, which resulted in the changes in fair value of this swap being recorded in other comprehensive income.
121
DST Systems, Inc.
Notes to Consolidated Financial Statements (Continued)
9. Long-Term Debt (Continued)
Convertible senior debentures
In August 2003, the Company issued $840 million aggregate principal amount of convertible senior debentures, consisting of $540 million of 4.125% Series A convertible senior debentures due 2023 and $300 million aggregate principal amount of 3.625% Series B convertible senior debentures due 2023. The Series A debentures and Series B debentures bear interest at a rate of 4.125% and 3.625% per annum, respectively. At December 31, 2009, the amount of Series A and Series B convertible senior debentures outstanding were $151.8 million and $171.3 million, respectively. During 2009, the Company repurchased approximately $122.6 million in principal amount of the Series A debentures and $14.7 million of the Series B debentures and recorded a gain of $5.9 million on these transactions. During 2008, the Company repurchased approximately $8.5 million in principal amount of the Series A debentures and $120.0 million of the Series B debentures and recorded a gain of $10.8 million on these transactions. During fourth quarter 2009, DST entered into separate privately negotiated exchange agreements under which it exchanged $257.0 million in aggregate principal of the Company's outstanding 4.125% Series A convertible senior debentures due 2023 for $257.0 million in aggregate principal of new 4.125% Series C convertible senior debentures due 2023. As of December 31, 2009, the outstanding amount of the Series C convertible senior debentures outstanding was $257.0 million.
Interest is payable initially in cash semiannually in arrears on February 15 and August 15 until August 15, 2010 for the Series A debentures and until August 15, 2008 for the Series B debentures. The Series C debentures bear regular cash interest on the original principal amount of each debenture at a rate of 4.125% per year, payable semiannually in arrears on February 15 until August 15, 2010. Beginning August 15, 2010 for the Series A and Series C debentures and August 15, 2008 for the Series B debentures, the Company will not pay regular cash interest on the debentures prior to maturity. Instead, the original principal amount of each debenture will increase daily at a rate of 4.125% per year (Series A and Series C) and 3.625% per year (Series B) to $1,700.28 for both the Series A and Series C debentures and $1,714.09 for the Series B debentures, which is the full accreted principal amount payable at maturity for each $1,000 original principal amount of the debentures. The Company will pay contingent interest on the Series A and Series C debentures during any six-month interest period commencing with the period from August 20, 2010 to February 14, 2011, and thereafter from February 15 to August 14 or August 15 to February 14, for which the average trading price of the debentures for the applicable five trading-day reference period equals or exceeds 120% of the accreted principal amount of the debentures. In February 2009, the Company paid contingent interest for the period August 20, 2008 to February 14, 2009 on the Series B convertible senior debentures. The amount of contingent interest equals 0.19% of the average trading price for the reference period, or $2.55 per $1,000 principal amount of such Series B debentures. The Company will pay contingent interest on the Series B debentures during any six-month interest period thereafter from February 15 to August 14 or August 15 to February 14, for which the average trading price of the debentures for the applicable five trading-day reference period equals or exceeds 120% of the accreted principal amount of the debentures.
Beginning August 20, 2010 (Series A), August 20, 2008 (Series B) and August 15, 2013 (Series C), the Company may redeem for cash all or part of the debentures at any time (upon not less than 30 nor more than 60 days notice before the redemption date) at a redemption price equal to the accreted principal amount of the debentures to be redeemed or purchased plus any accrued and unpaid cash interest, including contingent interest and liquidated damages, if any, to the redemption date. Debenture holders may require the Company to purchase the debentures on August 15, 2010, 2015,
122
DST Systems, Inc.
Notes to Consolidated Financial Statements (Continued)
9. Long-Term Debt (Continued)
and 2020 (Series A), August 15, 2013, and 2018 (Series B) and August 15, 2014, 2015 and 2020 (Series C) at a purchase price equal to the accreted principal amount of the debentures to be purchased plus any accrued and unpaid cash interest, including contingent interest and liquidated damages, if any, to such purchase date. The put right for cash for the Series B debentures expired on August 20, 2008 and resulted in no significant debenture purchases by DST. For purchases of Series A debentures on August 15, 2010 and Series C debentures on August 15, 2014, the Company will pay the purchase price in cash. For purchases of Series A debentures on August 15, 2015 and 2020, for purchases of Series B debentures on August 15, 2013 and 2018 and for purchases of Series C debentures on August 15, 2015 and 2020 and upon any fundamental change, the Company can pay the purchase price at its option in cash, common stock or any combination of cash and common stock.
The Series A, Series B and Series C debentures are convertible under specified circumstances into shares of the Company's common stock at an initial conversion rate of 20.3732 shares per $1,000 principal amount of debentures (which is equal to an initial conversion price of $49.08), subject to adjustment in certain events. The Series C debentures include a make-whole interest provision which may increase the conversion rate upon certain fundamental changes, as described in the Series C indenture, prior to August 15, 2013. The conversion rights for these debentures include: 1) during any calendar quarter if the last reported sale price of DST's common stock for at least 20 trading days during the period of 30 consecutive trading days ending on the last day of the previous calendar quarter, is greater than or equal to 120% of the applicable conversion price; 2) subject to certain exceptions, during the five day business period after any five consecutive trading day period in which the trading price per $1,000 original principal amount for each day of that period was less than 95% of the product of the last reported sales price of DST's common stock and the conversion rate on each such day; 3) if the debentures have been called for redemption; and 4) upon the occurrence of a specified corporate transaction as described in the indenture agreement. Upon conversion, the Company will have the right to deliver, in lieu of shares of its common stock, cash or a combination of cash and shares of common stock. The debentures if converted into common stock upon the occurrence of certain events would lead to the issuance of common stock and have a potentially dilutive effect on the Company's stock. The Company intends to settle any conversions of the Series A, Series B and Series C debentures with cash for the principal and accrued and unpaid interest and issue common stock for any conversion value amount over the principal and accrued and unpaid interest amounts. Holders of the senior convertible debentures do not have the right to convert these debentures at December 31, 2009 and 2008. Because the Series A convertible senior debentures can be put to the Company at par for cash for a 10-day period beginning August 15, 2010, the amount outstanding of $151.8 million at December 31, 2009 has been classified as current portion of debt on the Consolidated Balance Sheet.
On January 1, 2009, DST adopted new authoritative accounting guidance related to convertible debt instruments that may be settled in cash upon conversion. The guidance clarifies that issuers of convertible debt instruments that may be settled in cash upon conversion (including partial cash settlement) should separately account for the liability and equity components in a manner that will reflect the entity's nonconvertible debt borrowing rate when interest cost is recognized in subsequent periods. DST retrospectively applied this guidance to all periods prior to January 1, 2009 beginning with August 2003 when the senior convertible debentures were issued. DST used non-convertible debenture interest rates of 6.35% for the original $540 million 4.125% Series A senior convertible debentures and 5.68% for the original $300 million 3.625% Series B senior convertible debentures. The
123
DST Systems, Inc.
Notes to Consolidated Financial Statements (Continued)
9. Long-Term Debt (Continued)
retrospective adoption of this guidance increased the amount of interest expense recorded by DST for historical income statements periods prior to April 1, 2006 (as the debenture discount would have been fully amortized by that date), but did not impact the years ended December 31, 2009, 2008 or 2007. The adoption of this accounting guidance required DST to retrospectively restate retained earnings and additional paid in capital as of December 31, 2006 in the Statement of Changes in Stockholders' Equity, which resulted in a reduction of retained earnings of $58.4 million and an increase in additional paid in capital of the same amount, which had no change to total stockholders' equity.
Revolving credit facilities
The Company has a syndicated line of credit agreement that provides for a five-year revolving unsecured credit facility in an aggregate principal amount of up to $600 million. The interest rates applicable to loans under the credit agreement are generally based on the offshore (LIBOR), Federal Funds, or prime rates, plus applicable margins of 0.625% to 1.125%. The revolving credit facility has a grid that adjusts borrowing costs up or down based upon the Company's consolidated leverage ratio. The grid may result in fluctuations in borrowing costs. An annual facility fee of 0.15% to 0.225% is also required on this revolving syndicated line of credit. The credit agreement contains customary restrictive covenants, as well as certain customary events of default. The covenant limiting restricted payments, in addition to certain other exceptions, contains exceptions permitting the Company for a specified period to repurchase or redeem a specified amount of its capital stock. Among other provisions, the credit agreement limits consolidated indebtedness, liens, investments, subsidiary indebtedness, and asset dispositions, and requires certain leverage and interest coverage ratios to be maintained. If any event of default occurs and is continuing, all amounts payable under the credit agreement may be declared immediately due and payable. The maturity date for the credit facility is July 1, 2010. The Company was in compliance with all debt covenants at year-end.
The syndicated line of credit agreement has been amended since it was originally executed in June 2005 to, among other things: (i) allow the Company to request an increase of up to $600 million in the aggregate revolving commitment; (ii) clarify that the Company is allowed to use cash and/or the Company's stock to settle both the principal and accrued interest portion of the Company's Series A and B convertible senior debentures (upon conversion or otherwise) and use the Company's stock to settle any conversion premium payable upon any conversion of the Company's Series A and B convertible senior debentures; (iii) modify financial covenant requirements for the remaining term of the credit agreement; and (iv) allow a one time addition of $150 million to the $50 million exclusion on real property liens.
One of the Company's subsidiaries has available an unsecured line of credit agreement that provides for unsecured revolving borrowings up to $50 million that matures on September 30, 2010. Borrowings under the facility are available at rates based on LIBOR rates plus the applicable margin of 2.0%. Commitment fees of 0.40% per annum based on the unused portions are payable quarterly. Among other provisions, the agreement requires the subsidiary to maintain certain interest coverage ratios and tangible net worth levels, for which a waiver was obtained through March 30, 2009. The Company was in compliance with all debt covenants at year-end. In the event of non-compliance, an event of default may occur, which could result in the loan becoming immediately due and payable. No amounts were borrowed under this line of credit at December 31, 2009 and 2008.
124
DST Systems, Inc.
Notes to Consolidated Financial Statements (Continued)
9. Long-Term Debt (Continued)
One of the Company's subsidiaries maintains a margin loan with a regulated broker/dealer. There were no borrowings under this loan at December 31, 2009 and amounts borrowed under this loan at December 31, 2008 were $0.3 million. This margin loan is collateralized by the underlying marketable securities. One of the Company's foreign subsidiaries has an available revolving credit agreement in the amount of $2.5 million. There were no borrowings against this foreign revolving credit agreement at December 31, 2009 and 2008. The Company has an unsecured revolving line of credit for $20.0 million that is payable immediately upon demand by the lender. Borrowings on the line of credit are available at variable rates of interest based on LIBOR plus 0.675%. Interest is payable monthly. No amounts were drawn on this facility during 2009 and 2008. The Company's U.K. subsidiary has an overdraft credit facility that provides for borrowings of up to $8.1 million at variable rates of interest based on the Bank's base rate plus 1.5% per annum. Amounts borrowed on this overdraft credit facility were $5.4 million at December 31, 2009.
Related party promissory note
The Company has a related party promissory note with Boston Financial Data Services, Inc. ("BFDS"). The agreement provides for unsecured revolving borrowings by the Company of up to $100 million and matures on July 1, 2010. From time to time, BFDS may, subject to a ten day notice period, demand a prepayment of the loan by the Company in an amount not to exceed $25 million in each instance. The interest rate applicable to the loan is based on the British Bankers Association LIBOR rate plus an applicable margin correlating to the applicable margin under the Company's $600 million syndicated line of credit facility. The loan agreement incorporates by reference and requires the Company to comply with the affirmative and negative covenants contained in the Company's $600 million syndicated line of credit facility. The amount outstanding under this loan agreement was $75.0 million at both December 31, 2009 and 2008. For the years ended December 31, 2009, 2008 and 2007, the Company recorded interest expense related to this loan of $1.0 million, $4.1 million and $4.4 million, respectively.
Other indebtedness
Other indebtedness is comprised of debt obligations that the Company assumed in connection with the acquisition of a business in 2006. The indebtedness is payable in monthly installments. Interest rates are fixed and approximate 5.6%. The maturity date of the assumed indebtedness is October 2016.
Future principal payments of indebtedness at December 31, 2008 are as follows (in millions):
2010 |
$ | 658.1 | ||
2011 |
12.2 | |||
2012 |
7.5 | |||
2013 |
276.2 | |||
2014 |
260.6 | |||
Thereafter |
7.3 | |||
Total |
$ | 1,221.9 | ||
Based upon the borrowing rates currently available to the Company and its subsidiaries for indebtedness with similar terms and average maturities, the carrying value of long-term debt, with the
125
DST Systems, Inc.
Notes to Consolidated Financial Statements (Continued)
9. Long-Term Debt (Continued)
exception of the senior debentures is considered to approximate fair value at December 31, 2009 and 2008.
10. Income Taxes
Deferred tax assets and liabilities are determined based on the differences between the financial statement and tax bases of assets and liabilities as measured by the enacted tax rates which will be in effect when these differences reverse. Deferred tax expense (benefit) is generally the result of changes in the assets or liabilities for deferred taxes.
The following summarizes pretax income (loss) (in millions):
| |
Year Ended December 31, | |||||||||
|---|---|---|---|---|---|---|---|---|---|---|
| |
2009 | 2008 | 2007 | |||||||
U.S. |
$ | 366.4 | $ | 303.0 | $ | 1,369.1 | ||||
International |
(11.9 | ) | 7.3 | 20.1 | ||||||
Total |
$ | 354.5 | $ | 310.3 | $ | 1,389.2 | ||||
Provision for income taxes (benefits) consists of the following components (in millions):
| |
Year Ended December 31, | |||||||||||
|---|---|---|---|---|---|---|---|---|---|---|---|---|
| |
2009 | 2008 | 2007 | |||||||||
Current |
||||||||||||
Federal |
$ | 51.0 | $ | 73.4 | $ | 445.4 | ||||||
State and local |
7.8 | 10.1 | 58.3 | |||||||||
International |
2.4 | 5.2 | 10.6 | |||||||||
Total current |
61.2 | 88.7 | 514.3 | |||||||||
Deferred |
||||||||||||
Federal |
47.9 | (20.0 | ) | 9.8 | ||||||||
State and local |
2.0 | (0.5 | ) | 1.3 | ||||||||
International |
1.8 | (0.8 | ) | (10.9 | ) | |||||||
Total deferred |
51.7 | (21.3 | ) | 0.2 | ||||||||
Total provision for income taxes |
$ | 112.9 | $ | 67.4 | $ | 514.5 | ||||||
126
DST Systems, Inc.
Notes to Consolidated Financial Statements (Continued)
10. Income Taxes (Continued)
Differences between the Company's effective income tax rate and the U.S. federal income tax statutory rate are as follows (in millions):
| |
Year Ended December 31, | ||||||||||
|---|---|---|---|---|---|---|---|---|---|---|---|
| |
2009 | 2008 | 2007 | ||||||||
Provision for income taxes using the statutory rate in effect |
$ | 124.0 | $ | 108.7 | $ | 486.2 | |||||
Tax effect of: |
|||||||||||
State and local income taxes, net |
9.8 | 7.7 | 11.3 | ||||||||
International income taxes, net |
0.4 | (3.5 | ) | (10.9 | ) | ||||||
Earnings of U.S. unconsolidated affiliates |
(3.0 | ) | (5.0 | ) | (9.3 | ) | |||||
Argus nontaxable gain |
(16.6 | ) | |||||||||
Valuation allowance |
1.8 | 3.0 | 3.0 | ||||||||
Tax credits |
(8.8 | ) | (0.4 | ) | |||||||
Uncertain tax positions |
9.5 | (39.7 | ) | 35.9 | |||||||
Other |
(4.2 | ) | (3.4 | ) | (1.7 | ) | |||||
Total provision for income taxes |
$ | 112.9 | $ | 67.4 | $ | 514.5 | |||||
Effective tax rate |
31.8 | % | 21.7 | % | 37.0 | % | |||||
Statutory federal tax rate |
35.0 | % | 35.0 | % | 35.0 | % | |||||
The federal and state deferred tax assets (liabilities) recorded on the Consolidated Balance Sheet are as follows (in millions):
| |
December 31, | ||||||||
|---|---|---|---|---|---|---|---|---|---|
| |
2009 | 2008 | |||||||
Liabilities: |
|||||||||
Investments in available for sale securities |
$ | (221.0 | ) | $ | (143.4 | ) | |||
Unconsolidated affiliates and investments |
(14.7 | ) | (18.3 | ) | |||||
Accumulated depreciation and amortization |
(13.5 | ) | (4.0 | ) | |||||
Debenture original issue discount |
(96.3 | ) | (81.4 | ) | |||||
Other |
(0.8 | ) | |||||||
Total deferred tax liabilities |
(346.3 | ) | (247.1 | ) | |||||
Assets: |
|||||||||
Book accruals not currently deductible for tax |
2.2 | 17.3 | |||||||
Deferred compensation and other employee benefits |
56.1 | 60.2 | |||||||
Net operating loss (federal and state) |
7.6 | 9.9 | |||||||
Other |
22.5 | ||||||||
Total deferred tax assets |
65.9 | 109.9 | |||||||
Valuation allowance, net |
(12.4 | ) | (7.6 | ) | |||||
Net deferred tax liability |
$ | (292.8 | ) | $ | (144.8 | ) | |||
127
DST Systems, Inc.
Notes to Consolidated Financial Statements (Continued)
10. Income Taxes (Continued)
The Company has approximately $20.0 million of net operating losses as of December 31, 2009 as a result of the ASI acquisition on October 2, 2006. These net operating losses expire in years 2022 through 2025 and are available to reduce future income taxes. Since these net operating losses were generated prior to the acquisition of ASI, their utilization is subject to certain limitations imposed by the Internal Revenue Code. The Company does not anticipate that such limitations will prohibit the utilization of the federal net operating loss carryforwards prior to their expiration.
The Company has approximately $42.7 million of net operating loss carryforwards as of December 31, 2009 in international jurisdictions. These carryforwards do not expire but may be limited in their ability to offset only certain income. A net benefit of approximately $6.8 million of these net operating losses will be recorded in additional paid in capital upon realization. Authoritative accounting guidance requires a valuation allowance against deferred tax assets if, based on the weight of available evidence, it is more likely than not that some or all of the deferred tax assets will not be realized. In evaluating the realizability of certain international net deferred tax assets, the Company also anticipates that limitations may result in the benefit of these amounts not being realized and has established corresponding valuation allowances as of December 31, 2009 and 2008 of $12.4 million and $5.1 million, respectively. The Company also believed it was not more likely than not that certain state deferred tax assets would be realized, and, accordingly, recorded a valuation allowance at December 31, 2008. During the Company's 2009 reassessment of this valuation allowance requirement, it was determined that the valuation allowance was no longer required. As a result, it was released during 2009. The valuation allowance amount as of December 31, 2009 and 2008 was $0 and $2.5 million, respectively. The above table does not include foreign tax credit carryforwards of approximately $3.2 million as of December 31, 2008 for which a full valuation allowance was provided. In the course of finalizing the 2002 through 2005 IRS examination described below, favorable adjustments were identified and recognized in first quarter 2009, including foreign tax credit carryforward utilization.
Prior to 1993, the Company generally did not provide deferred income taxes for unremitted earnings of certain investees accounted for under the equity method because those earnings have been and will continue to be reinvested indefinitely. Beginning in 1993, pursuant to the provisions of the authoritative accounting guidance related to income taxes, the Company began providing deferred taxes for unremitted earnings of U.S. unconsolidated affiliates net of the 80% dividends received deduction provided for under current tax law. Through December 31, 2009, the cumulative amount of such unremitted earnings was $175.3 million. These amounts would become taxable to the Company if distributed by the affiliates as dividends, in which case the Company would be entitled to the dividends received deduction for 80% of the dividends; alternatively, these earnings could be realized by the sale of the affiliates' stock, which would give rise to tax at federal capital gains rates and state ordinary income tax rates, to the extent the stock sale proceeds exceeded the Company's tax basis. Deferred taxes provided on unremitted earnings through December 31, 2009 and 2008 were $11.7 million and $13.9 million, respectively. As a result of the purchase of the remaining 50% interest of Argus on March 31, 2009, $0.9 million of deferred taxes provided on unremitted earnings of Argus was reversed during first quarter 2009.
As of December 31, 2009, accumulated undistributed earnings of foreign subsidiaries were $81.1 million. The Company intends to indefinitely reinvest these earnings in the businesses of its foreign subsidiaries. As a consequence, no federal or state income taxes or foreign withholding taxes have been provided for amounts which would become payable, if any, on the distribution of such earnings. In the event of such a distribution, the Company may be able to offset, at least in part, the
128
DST Systems, Inc.
Notes to Consolidated Financial Statements (Continued)
10. Income Taxes (Continued)
U.S. federal income tax consequences of such a distribution with foreign income tax credits which would become creditable as a result of such a distribution. It is not practicable for the Company to determine the income tax it would incur, if any, if such earnings were distributed.
On January 1, 2007, DST adopted authoritative accounting guidance related to accounting for uncertainty in income taxes recognized in an entity's financial statements. The accounting guidance indicates that the impact from adoption should be reflected as a cumulative effect adjustment from a change in accounting principle to the beginning retained earnings amount reported for that fiscal year, unless the amount relates to a previous business combination, in which case the impact would be recorded as an adjustment to the purchase price allocation for the previous business combination. The adjustment to the purchase price allocation would first reduce remaining goodwill and identified intangibles related to the business combination and the residual would be reflected as a cumulative effect adjustment to beginning retained earnings.
DST's adoption of the accounting guidance resulted in approximately $87.5 million of previously recorded liabilities for uncertain tax positions being reduced to zero, of which $68.2 million (net of related deferred income taxes) resulted in a reduction in previously recorded identified intangibles (including capitalized software) relating to the Company's April 2005 acquisition of DST Health Solutions, and the remainder of $19.3 million was recorded as an increase in retained earnings as a cumulative effect of a change in accounting principle adjustment. During 2008, the Company determined that the $19.3 million cumulative effect of a change in accounting principle adjustment was overstated by $5.4 million. The Company reduced retained earnings and increased deferred tax liabilities by $5.4 million in 2008 to correct this item. The Company's management believed the amount was immaterial to reflect in the 2007 financial statements and was also immaterial to the 2008 financial statements.
A reconciliation of the beginning and ending amount of unrecognized tax benefits is as follows (in millions):
| |
Year Ended December 31, | |||||||||
|---|---|---|---|---|---|---|---|---|---|---|
| |
2009 | 2008 | 2007 | |||||||
Balance at beginning of year |
$ | 75.7 | $ | 100.6 | $ | 53.8 | ||||
Additions based on tax positions related to the current year |
4.1 |
4.1 |
44.8 |
|||||||
Additions for tax positions of prior years |
19.4 | 22.3 | 4.6 | |||||||
Reductions for tax positions of prior years |
(1.6 | ) | (50.6 | ) | (1.9 | ) | ||||
Settlements |
(18.4 | ) | (0.2 | ) | ||||||
Statute expirations |
(0.7 | ) | (0.5 | ) | (0.7 | ) | ||||
Balance at end of year |
$ | 78.5 | $ | 75.7 | $ | 100.6 | ||||
129
DST Systems, Inc.
Notes to Consolidated Financial Statements (Continued)
10. Income Taxes (Continued)
Included in the Company's net unrecognized tax benefit at December 31, 2009, 2008 and 2007 are $43.6 million, $46.8 million and $78.5 million, respectively, of tax positions which, if recognized, would affect the effective tax rate. The Company recognizes interest and penalties accrued related to unrecognized tax benefits in income taxes, which is consistent with the recognition of these items in prior reporting periods. As of December 31, 2008, the Company had $9.3 million of interest and penalties accrued associated with unrecognized tax benefits. The liability for interest and penalties decreased $0.4 million during the year ended December 31, 2009 to $8.9 million. The liability for interest and penalties decreased $8.0 million during the year ended December 31, 2008 to $9.3 million.
It is expected that the amount of unrecognized tax benefits will change during the next year; however, the Company does not expect the change to have a significant impact on its results of operations or financial position.
The Company files income tax returns in the U.S. federal jurisdiction, and various state and foreign jurisdictions. The IRS examination for the tax years ended December 31, 2002 through 2005 was completed in February 2009. This examination included the Health Solutions transaction (discussed below). In the course of finalizing the examination, favorable adjustments of approximately $5.0 million were identified and recognized in first quarter 2009 that were not recorded at December 31, 2008, including foreign tax credit carryforward utilization. An IRS examination for the tax years ended December 31, 2006 and 2007 began during 2009. As of December 31, 2009, the IRS has not proposed any significant adjustments which would be material to the Company's financial statements. Various state, local, and foreign income tax returns are also under examination by taxing authorities. The Company does not believe that the outcome of any examination will have a material impact on its financial statements.
In connection with the examination of the Company's 2000 tax return, the IRS accepted the manner in which the Company reported a transaction in its return. As a result, the Company reversed the income tax liability of $14.8 million previously provided for this matter, as well as $12.4 million of accrued interest and penalty, as a reduction of income tax expense during 2008.
The Company filed federal income tax refund claims for research and experimentation credits for the tax years 1996 through 2001. A settlement was reached with respect to the Company's refund claims for research and experimentation credits for the years 1996 through 2001. Despite the settlement, the IRS has challenged the amount and availability of research and experimentation credits attributable to the Company's operations after 2001. Income tax expense for 2008 includes no research and experimentation credit benefits applicable to 2002 through 2008 operations. Income tax expense for 2009 includes $0.5 million of research and experimentation credit benefits applicable to 2002 through 2009 operations.
The Health Solutions exchange transaction (exchange of CSC shares for DST Health Solutions which was acquired April 2005) has been structured to meet the requirements for treatment as a tax-free exchange in accordance with Section 355 of the Internal Revenue Code. The Company had a liability for uncertain tax positions related to this matter of $23.0 million, including interest. The Company continued to accrue interest, through the Company's tax provision, related to this matter. During 2008, the Company changed its assessment of the probability of prevailing on this matter and released approximately $24.9 million or all of the previously recorded liabilities for uncertain tax positions, which is consistent with the final IRS examination report for periods prior to and including 2005.
130
DST Systems, Inc.
Notes to Consolidated Financial Statements (Continued)
11. Stockholders' Equity
Preferred Stock
The Company has authorized 10 million shares of preferred stock, of which no shares are currently issued or outstanding. However, 0.1 million shares of preferred stock have been designated as Series A Preferred Stock in connection with the Company's rights agreement, the terms of which entitle the holders of the Company's common stock to which the rights are attached to purchase 1/1000ths of a share of Series A Preferred Stock (or in some cases, shares of the Company's common stock, other securities, cash or other assets) at a purchase price of $225 per share.
Earnings per share
The computation of basic and diluted earnings per share is as follows (in millions, except per share amounts):
| |
Year Ended December 31, | |||||||||
|---|---|---|---|---|---|---|---|---|---|---|
| |
2009 | 2008 | 2007 | |||||||
Net income |
$ | 241.6 | $ | 242.9 | $ | 874.7 | ||||
Dilutive securities at unconsolidated affiliates |
(1.1 | ) | ||||||||
Net income for dilutive computation |
$ | 241.6 | $ | 242.9 | $ | 873.6 | ||||
Average common shares outstanding |
49.6 | 53.6 | 63.4 | |||||||
Incremental shares from assumed conversions of stock options and debenture conversion |
0.4 | 4.1 | 8.6 | |||||||
Average diluted shares outstanding |
50.0 | 57.7 | 72.0 | |||||||
Basic earnings per share |
$ | 4.87 | $ | 4.53 | $ | 13.80 | ||||
Diluted earnings per share |
$ | 4.84 | $ | 4.21 | $ | 12.14 | ||||
The Company had approximately 49.2 million and 49.7 million shares outstanding at December 31, 2009 and 2008, respectively. Shares from options to purchase common stock that were excluded from the diluted earnings per share calculation because they were anti-dilutive totaled 3.2 million and 1.0 million for the years ended December 31, 2009 and 2008, respectively. There were no anti-dilutive shares from options to purchase common stock for the year ended December 31, 2007. The Company's convertible senior debentures would have a potentially dilutive effect on the Company's stock if converted in the future. At December 31, 2009 outstanding Series A debentures were convertible into 3.1 million shares of common stock, outstanding Series B debentures are convertible into 3.4 million shares of common stock and outstanding Series C debentures are convertible into 5.2 million shares of common stock, subject to adjustment. The Company intends to settle any conversions with cash for the principal amount of the bonds and accrued and unpaid interest and issue common stock for any conversion value amount over the principal and accrued and unpaid interest amount. Related to the debentures, the calculation of diluted earnings per share includes an incremental amount of shares assumed to be issued for the conversion spread when the Company's average daily stock price exceeds the average accreted bond price per share. There was additional dilution of approximately 2.5 million shares and 6.4 million shares for the years ended December 31, 2008 and 2007, respectively, related to the Company's average daily share price exceeding the then prevailing conversion prices per share, but no dilution during the year ended December 31, 2009 because of a decline in the Company's average share price.
131
DST Systems, Inc.
Notes to Consolidated Financial Statements (Continued)
11. Stockholders' Equity (Continued)
On January 1, 2009, DST adopted new authoritative accounting guidance related to share-based payment transactions. Under this guidance, certain share-based payment awards that allow holders to receive dividends before they vest should be treated as participating securities. Although unvested share-based payment awards with nonforfeitable rights to dividends have typically been included in the calculation of diluted EPS using the treasury stock method, these awards are now included in the calculation of basic EPS using the two-class method. Because DST's existing restricted stock awards allow holders the right to receive cash dividends, if any, on a 1:1 basis, DST was required to treat these awards as participating securities. DST applied this guidance retrospectively to all periods prior to 2009, which resulted in increases in previously reported average common and diluted shares outstanding. The increase in average common and diluted shares outstanding reduced previously reported basic and diluted earnings per share in those prior periods. A comparison of amounts previously reported and as retrospectively restated is presented in the following table (in millions, except per share amounts).
| |
As previously reported For the Year Ended |
As retrospectively restated For the Year Ended |
As previously reported For the Year Ended |
As retrospectively restated For the Year Ended |
|||||||||
|---|---|---|---|---|---|---|---|---|---|---|---|---|---|
| |
December 31, 2008 |
December 31, 2008 |
December 31, 2007 |
December 31, 2007 |
|||||||||
Net income |
$ | 242.9 | $ | 242.9 | $ | 874.7 | $ | 874.7 | |||||
Dilutive securities at unconsolidated affiliates |
(1.1 | ) | (1.1 | ) | |||||||||
Net income for dilutive computation |
$ | 242.9 | $ | 242.9 | $ | 873.6 | $ | 873.6 | |||||
Average common shares outstanding |
51.0 |
53.6 |
60.8 |
63.4 |
|||||||||
Average diluted shares outstanding |
56.7 | 57.7 | 70.7 | 72.0 | |||||||||
Basic earnings per share |
$ |
4.76 |
$ |
4.53 |
$ |
14.38 |
$ |
13.80 |
|||||
Diluted earnings per share |
$ | 4.28 | $ | 4.21 | $ | 12.35 | $ | 12.14 | |||||
132
DST Systems, Inc.
Notes to Consolidated Financial Statements (Continued)
11. Stockholders' Equity (Continued)
Other comprehensive income (loss)
Components of other comprehensive income (loss) consist of the following (in millions):
| |
Year Ended December 31, | ||||||||||
|---|---|---|---|---|---|---|---|---|---|---|---|
| |
2009 | 2008 | 2007 | ||||||||
Unrealized gains (losses) on investments: |
|||||||||||
Unrealized holding gains (losses) arising during the period |
$ | 204.8 | $ | (673.5 | ) | $ | 179.0 | ||||
Proportional share of unconsolidated affiliate interest rate swap |
1.8 | 0.1 | 1.6 | ||||||||
Unrealized loss on interest rate swap |
(1.9 | ) | |||||||||
Less reclassification adjustments for net (gains) losses included in net income |
(18.6 | ) | 21.1 | (2.8 | ) | ||||||
Foreign currency translation adjustments |
45.0 | (77.6 | ) | 31.2 | |||||||
Deferred income taxes |
(84.0 | ) | 268.5 | (77.3 | ) | ||||||
Other comprehensive income (loss) |
$ | 147.1 | $ | (461.4 | ) | $ | 131.7 | ||||
Components of the related tax provision of other comprehensive income consists of the following (in millions):
| |
Year Ended December 31, | ||||||||||
|---|---|---|---|---|---|---|---|---|---|---|---|
| |
2009 | 2008 | 2007 | ||||||||
Unrealized gains (losses) on investments: |
|||||||||||
Unrealized holding gains (losses) arising during the period and proportional share of unconsolidated affiliates' interest rate swaps |
$ | 76.8 | $ | (260.3 | ) | $ | 76.2 | ||||
Less reclassification adjustments for (gains) losses included in net income |
(7.2 | ) | 8.2 | (1.1 | ) | ||||||
Deferred income taxes |
$ | 84.0 | $ | (268.5 | ) | $ | 77.3 | ||||
One of DST's unconsolidated affiliates had an interest rate swap liability with a fair market value of $35.6 million, $72.8 million and $13.8 million at December 31, 2009, 2008 and 2007, respectively. DST's 50% proportionate share of this interest rate swap liability was $17.8 million, $36.4 million and $6.9 million at December 31, 2009, 2008 and 2007, respectively. The Company records in investments and accumulated other comprehensive income its proportionate share of this liability in an amount not to exceed the carrying value of its investment in this unconsolidated affiliate, which resulted in $5.0 million, $6.8 million and $6.9 million recorded at December 31, 2009, 2008 and 2007, respectively.
Stock repurchases
At December 31, 2009, there were approximately 2.3 million shares remaining to be repurchased under the Company's existing share repurchase authorization plan. The plan allows, but does not require, the repurchase of common stock in open market and private transactions through December 31, 2011. The Company may enter into one or more plans with its brokers or banks for pre-authorized purchases
133
DST Systems, Inc.
Notes to Consolidated Financial Statements (Continued)
11. Stockholders' Equity (Continued)
within defined limits pursuant to Rule 10b5-1 to effect all or a portion of such share repurchases. Under the share repurchase plans, the Company expended $9.7 million for approximately 260,000 shares, $724.3 million for approximately 11.3 million shares, and $558.5 million for approximately 7.1 million shares during the years ended December 31, 2009, 2008, and 2007, respectively.
Shares received in exchange for tax withholding obligations arising from the exercise of options to purchase the Company's stock or from the vesting of restricted stock shares are included in common stock repurchased in the Consolidated Statement of Cash Flows. The amount of such share withholdings for option exercises was $30.8 million, $6.6 million and $61.4 million during the years ended December 31, 2009, 2008 and 2007, respectively.
The Company had 46.2 million and 45.6 million shares of common stock held in treasury at December 31, 2009 and 2008, respectively.
Share-Based Compensation
The Company has a share-based compensation plan covering its employees and a share-based compensation plan covering its non-employee directors and has outstanding share awards (primarily in the form of stock options and restricted stock) under each of these plans. Both of these share-based compensation plans have been approved by the Company's Board of Directors and shareholders. The DST Systems, Inc. 2005 Equity Incentive Plan (the "Employee Plan") and the DST Systems, Inc. 2005 Non-Employee Directors' Award Plan (the "Directors' Plan") became effective on May 10, 2005. The term of both the Employee Plan and the Directors' Plan is from May 10, 2005 through May 9, 2015.
The Consolidated Statement of Income for the years ended December 31, 2009, 2008, and 2007 reflects share-based compensation cost of $25.8 million, $32.7 million, and $27.8 million, respectively. The total tax benefit recognized in earnings from share-based compensation arrangements for the years ended December 31, 2009, 2008, and 2007, was $10.1 million, $12.8 million, and $10.9 million, respectively. Excess tax benefits of $0.2 million, $1.3 million and $27.4 million were classified as a financing cash inflow during the years ended December 31, 2009, 2008 and 2007, respectively. Cash proceeds from options exercised for the years ended December 31, 2009, 2008 and 2007 were $14.0 million, $4.9 million and $112.3 million, respectively. The Company generally issues shares out of treasury to satisfy stock option exercises.
The Employee Plan amends, restates and renames the DST Systems, Inc. 1995 Stock Option and Performance Award Plan ("1995 Plan"). The number of shares of common stock reserved for delivery under the Employee Plan is the sum of (a) 4.0 million shares, plus (b) the number of shares remaining under the 1995 Plan (originally 30 million shares available) as of May 10, 2005 (not subject to outstanding Awards under the 1995 Plan and not delivered out of the Shares reserved thereunder), plus (c) shares that become available under the 1995 Plan after May 10, 2005 pursuant to forfeiture, termination, lapse or satisfaction of an award in cash or property other than shares of common stock, application as payment for an award, or, except with respect to restricted stock, to satisfy tax withholding, plus (d) any shares of common stock required to satisfy substitute awards. As of December 31, 2009, approximately 4.8 million shares were available under the Employee Plan. The Employee Plan provides for the availability of shares of the Company's common stock for the grant of awards to employees, prospective employees and consultants to the Company or an affiliate. Awards under the Employee Plan may take the form of shares, dividend equivalents, options, stock appreciation rights, limited stock appreciation rights, performance units, restricted stock, restricted
134
DST Systems, Inc.
Notes to Consolidated Financial Statements (Continued)
11. Stockholders' Equity (Continued)
stock units, deferred stock, annual incentive awards, service awards and substitute awards (each as defined in the plan).
The Directors' Plan replaced the component of the 1995 Plan that provided for equity awards to directors who are not employees of DST or any affiliate. Subject to adjustment, as provided in the Directors' Plan, the number of shares of common stock reserved for delivery under this plan is the sum of (a) 300,000 shares plus (b) any shares of common stock required to satisfy substitute awards, as defined in the Directors' Plan. As of December 31, 2009, approximately 237,000 shares were available under the Directors' Plan. Awards under the Directors' Plan may take the form of shares, dividend equivalents, options, restricted stock, restricted stock units, deferred stock and substitute awards (each as defined in the plan).
Vesting terms for options granted under the Employee Plan and the Director Plan differ based on the grant made. Options vest and generally become fully exercisable over three or five years of continued employment, depending upon the grant type. For grants in any of the Company's plans that are subject to graded vesting over a service period, the Company recognizes expense on a straight-line basis over the requisite service period for the entire award. On December 14, 2009, the Company issued approximately 1.3 million common stock options. No other stock options were issued during the three years ended December 31, 2009. Approximately 0.2 million of the Company's grants include performance-based conditions, as defined.
The Black-Scholes option valuation model was used in estimating the fair value of options granted. In addition, option valuation models require the input of somewhat subjective assumptions including expected stock price volatility. The Company estimates expected stock price volatility via observations of the historical (generally the last three years) volatility trends. In determining the expected life of the 2009 option grants, the Company applied the simplified method, which uses the weighted average of the vesting period and contractual term of each option granted. The risk-free interest rates used were actual U.S. Government zero-coupon rates for bonds matching the expected term of the option as of the option grant date.
The fair value of each option grant is estimated on the date of grant using a modified Black-Scholes option pricing model. The Company did not grant stock options in 2008 and 2007. The following table provides the ranges of assumptions and weighted-average assumptions used for grants made under the option plans during 2009, as well as the range of fair values and weighted-average fair value of options granted:
| |
Year ended December 31, 2009 | |
|---|---|---|
Weighted average risk free interest rate |
2.70% | |
Range of risk free interest rates |
2.67% - 2.86% | |
Weighted average expected life of option (years) |
6.1 | |
Range of expected life of option (years) |
6.0 - 6.5 | |
Weighted average expected stock volatility |
34.83% | |
Range of expected stock volatilities |
34.83% - 34.83% | |
Weighted average expected dividend yield |
n/a | |
Range of expected dividend yields |
n/a | |
Weighted average stock option fair value |
$16.99 | |
Range of stock option fair values |
$16.87 - $17.75 |
135
DST Systems, Inc.
Notes to Consolidated Financial Statements (Continued)
11. Stockholders' Equity (Continued)
Summary stock option activity is presented in the table below (shares in millions):
| |
Shares | Weighted Average Exercise Price |
Weighted Average Remaining Contractual Life (in years) |
Aggregate Intrinsic Value (in millions) |
|||||||||
|---|---|---|---|---|---|---|---|---|---|---|---|---|---|
Outstanding at December 31, 2006 |
8.9 | $ | 40.84 | ||||||||||
Exercised |
(2.8 |
) |
39.92 |
$ |
108.4 |
||||||||
Outstanding at December 31, 2007 |
6.1 | 41.27 | |||||||||||
Exercised |
(0.2 |
) |
32.53 |
5.0 |
|||||||||
Outstanding at December 31, 2008 |
5.9 | 41.48 | |||||||||||
Granted |
1.3 |
43.83 |
|||||||||||
Exercised |
(0.4 | ) | 32.31 | 3.1 | |||||||||
Cancelled |
(0.2 | ) | 43.86 | ||||||||||
Outstanding at December 31, 2009 |
6.6 | $ | 42.50 | 3.4 | $ | 27.9 | |||||||
Exercisable at December 31, 2009 |
5.4 | $ | 42.19 | 1.8 | $ | 27.9 | |||||||
The total aggregate intrinsic value of options exercised for all plans during the years ended December 31, 2009, 2008, and 2007, was $3.1 million, $5.0 million, and $108.4 million, respectively.
Grants of restricted stock are valued at the date of grant and expensed using the straight-line method over the service period. Unvested shares of restricted stock may be forfeited upon termination of employment with the Company depending on the circumstances of the termination. Except for restrictions placed on the transferability of the restricted stock, holders of restricted stock have full stockholders rights during the term of restriction, including voting rights and the right to receive cash dividends, if any. The amount of unvested restricted shares outstanding at December 31, 2009 and 2008 is 1.0 million and 2.6 million, respectively. The Company granted approximately 2.8 million shares of restricted common stock to officers and certain other participants in November 2004. Approximately 1.6 million of these restricted shares vested in November 2009 and 0.7 million of these shares vested in January 2010, while the remaining shares were either vested or forfeited prior to December 31, 2009.
Included in the 1.0 million shares of outstanding restricted stock at December 31, 2009 are approximately 0.3 million of restricted shares granted in 2008 and 2007 that contain both service and performance features based on achieving certain operating performance measures. The restrictions on the shares granted in 2008 and 2007 lapse by December 31, 2010 and December 31, 2012, respectively, assuming certain performance features are met. The grant date fair value of these awards was approximately $7.2 million and $10.6 million for the 2008 and 2007 grants, respectively. The Company is amortizing the 2008 grant on a straight-line basis over the three year service period and the 2007 grant over a five year service period assuming full achievement of the required performance feature of the awards. The Company will continue to monitor and evaluate its assumptions over the performance period.
136
DST Systems, Inc.
Notes to Consolidated Financial Statements (Continued)
11. Stockholders' Equity (Continued)
Summary restricted stock activity is presented in the table below (shares in millions):
| |
Shares | Weighted Average Grant Date Fair Value |
|||||
|---|---|---|---|---|---|---|---|
Non-vested at December 31, 2006 |
2.5 | $ | 48.01 | ||||
Granted |
0.3 |
77.39 |
|||||
Vested |
(0.1 | ) | 47.62 | ||||
Forfeited |
(0.1 | ) | 48.07 | ||||
Non-vested at December 31, 2007 |
2.6 | 50.79 | |||||
Granted |
0.1 |
70.80 |
|||||
Vested |
(0.1 | ) | 55.43 | ||||
Non-vested at December 31, 2008 |
2.6 | 51.66 | |||||
Vested |
(1.6 |
) |
49.23 |
||||
Non-vested at December 31, 2009 |
1.0 | $ | 55.41 | ||||
The fair value of restricted stock awards which vested during the years ended December 31, 2009, 2008 and 2007 was $77.4 million, $3.3 million and $3.6 million, respectively.
At December 31, 2009, the Company had $27.5 million of total unrecognized compensation expense (included in additional paid-in-capital on the Consolidated Balance Sheet) related to its share based compensation arrangements, net of estimated forfeitures. The Company estimates that the amortized compensation expense attributable to the stock option and restricted stock grants will be approximately $16.2 million for 2010, $7.3 million for 2011, $3.6 million for 2012 and $0.2 million each for 2013 and 2014, based on awards currently outstanding.
Stock purchase plans
The 2000 DST Systems, Inc. Employee Stock Purchase Plan ("ESPP") provides the right to subscribe to 2.0 million shares of common stock to substantially all employees of the Company and participating subsidiaries, except those whose customary employment is less than 20 hours per week or is five months or less per calendar year, or those who are 5% or greater stockholders of DST. The purchase price for shares under any stock offering is to be 85% of the average market price on either the exercise date or the offering date, whichever is lower. At December 31, 2009, there were approximately 0.6 million shares available for future offerings. This ESPP plan was suspended effective January 1, 2006.
Rights plan
The Company is party to a Stockholders' Rights Agreement (the "Rights Plan") dated as of October 10, 2005, which replaced the October 6, 1995 Rights Plan, as amended. Pursuant to the terms of the Rights Plan, each share of the Company's common stock held of record on October 18, 2005 has received one Right. Each Right entitles the registered holder to purchase from the Company 1/1000ths of a share of Series A Preferred Stock, or in some circumstances, shares of the Company's Common
137
DST Systems, Inc.
Notes to Consolidated Financial Statements (Continued)
11. Stockholders' Equity (Continued)
Stock, other securities, cash or other assets, at a purchase price of $225 per share, subject to certain adjustments. Under certain circumstances, the Company may redeem the rights in whole, but not in part, at a redemption price of $0.0025 per Right.
The Rights, which are automatically attached to common stock, are not exercisable or transferable separately from shares of common stock until upon the earlier of (i) ten (10) business days following a public announcement that a person or group of affiliated or associated persons has acquired beneficial ownership of fifteen percent (15%) or more of the then outstanding shares of Common Stock (each such person or group of affiliated or associated persons referred to herein and in the Rights Agreement as an "Acquiring Person"), or (ii) ten (10) business days following the commencement of a tender offer or exchange offer that would result in a person or group becoming an Acquiring Person, unless the Board of Directors sets a later date in either event. The Rights attached to the stock of an Acquiring Person become void.
The Rights Plan is intended to encourage a potential acquiring person to negotiate directly with the Board of Directors, but may have certain anti-takeover effects. The Rights Plan could significantly dilute the interests in the Company of an Acquiring Person. The Rights Plan may therefore have the effect of delaying, deterring or preventing a change in control of the Company.
12. Accounts Receivable Securitization Program
DST securitizes certain of its domestic accounts receivable. On May 21, 2009, DST entered into a $175.0 million accounts receivable securitization program with a third-party, multi-seller, asset-backed commercial paper conduit administered by a bank. This $175.0 million program replaced DST's previous $200.0 million accounts receivable securitization program with a third-party, multi-seller, asset-backed commercial paper conduit administered by a different bank which expired by its terms on May 21, 2009.
Under the terms of the $175.0 million accounts receivable securitization program, (a) DST periodically acquires accounts receivable originated by certain of its domestic subsidiaries, including, but not limited to, DST Output, DST Health Solutions, DST Technologies and Argus Health Systems (the "Subsidiary Originators"), (b) DST transfers receivables originated by DST and receivables acquired from the Subsidiary Originators, on a periodic basis, to a wholly-owned bankruptcy remote special purpose subsidiary of DST (the "SPE"), and (c) the SPE then sells undivided interests in the receivables to the commercial paper conduit. DST retains servicing responsibility over the receivables. The assets of the SPE are not available to satisfy the creditors of any other person, including DST or any of its subsidiaries or affiliates. Further, neither DST nor the SPE guarantees collectability of the receivables or the creditworthiness of obligors. If DST has not refinanced its $600.0 million syndicated line of credit agreement (maturing on July 1, 2010) by March 31, 2010, the $175.0 million accounts receivable securitization program commitment is scheduled to become $125.0 million. The conduit's purchase commitment will expire on May 20, 2010 unless otherwise extended in accordance with the program agreements.
The periodic transfers of undivided interests in the receivables by the SPE to the conduit meet the requirements for sale accounting treatment in accordance with the authoritative accounting guidance for transfers and servicing of financial assets. Accordingly, the portion of the receivables transferred to the conduit, up to an advance amount which cannot exceed $175.0 million, have been removed from the Consolidated Balance Sheet. The SPE retains an interest in the receivables in excess of the amount
138
DST Systems, Inc.
Notes to Consolidated Financial Statements (Continued)
12. Accounts Receivable Securitization Program (Continued)
transferred to the conduit, and such receivables will continue to be recognized on the Consolidated Balance Sheet. The carrying value of the retained interest approximates its estimated fair value at the balance sheet date. The Company believes increases in the level of assumed interest rates and/or credit losses compared to assumptions in effect at the balance sheet date by 10% or 20% would not materially affect the fair value of the retained interest at the reporting date.
At December 31, 2009 and 2008, the total outstanding undivided interest in the receivables held by the conduit under the accounts receivable securitization programs was $125.0 million and $130.0 million, respectively. The Consolidated Statement of Cash Flows for the year ended December 31, 2009 presents the net cash flows under the Company's accounts receivable securitization programs. Proceeds received from accounts receivable securitizations under the $175.0 million program have been presented net of cash collections from transferred receivable interests under the $200.0 million program that were remitted to the conduit prior to the expiration of the $200.0 million program.
Aggregate transfers of undivided interests in the receivables from the SPE to the conduit were $1,738.7 million and $1,789.9 million for the years ended December 31, 2009 and 2008, respectively. A $26.6 million and $32.0 million retained interest in the receivables partially sold is included in accounts receivable on the Consolidated Balance Sheet at December 31, 2009 and 2008, respectively. The impact on net income stemming from these transfers was not material.
Delinquencies and credit losses related to the accounts receivable sold were not significant during the years ended December 31, 2009 and 2008.
As mentioned above, the Company believes the new authoritative accounting guidance related to transfers of financial assets, which is effective January 1, 2010, will require transferred accounts receivable ($125.0 million at December 31, 2009) to be reflected as assets of the Company and the proceeds received from such transfers to be reflected as debt.
13. Benefit Plans
The Company sponsors defined contribution plans that cover domestic and non-domestic employees following the completion of an eligibility period. Employer contribution expense under these plans totaled $40.4 million, $41.4 million and $41.0 million during the years ended December 31, 2009, 2008 and 2007, respectively.
The Company has active and non-active non-qualified deferred compensation plans for senior management, certain highly compensated employees and directors. Certain of the active plans permit existing participants to defer a portion of their compensation until termination of their employment, at which time payment of amounts deferred is made in a lump sum or annual installments. Deferred amounts earn interest at a rate determined by the Board of Directors or are credited with deemed gains or losses of the underlying hypothetical investments. Included in the 2007 plan costs was a $4.3 million charge related to the partial termination of certain non-qualified deferred compensation plans for senior management and certain highly compensated employees. Assets related to the partially terminated plans of approximately $8.8 million were paid in March 2008. Amounts deferred under these plans were approximately $35.2 million and $31.1 million at December 31, 2009 and 2008, respectively.
139
DST Systems, Inc.
Notes to Consolidated Financial Statements (Continued)
14. Supplemental Cash Flow Information
Supplemental disclosure of cash flow information (in millions):
| |
Year Ended December 31, | |||||||||
|---|---|---|---|---|---|---|---|---|---|---|
| |
2009 | 2008 | 2007 | |||||||
Interest paid during the year |
$ | 40.1 | $ | 55.2 | $ | 58.1 | ||||
Income taxes paid during the year |
96.8 | 84.1 | 446.5 | |||||||
The Company purchased approximately $0.3 million and $1.1 million of marketable securities under a margin loan with a regulated broker\dealer during the years ended December 31, 2008 and 2007, respectively. There were no borrowings under this loan at December 31, 2009. The Company purchased $2.3 million, $13.2 million and $26.1 million of equipment with a promissory note during the years ended December 31, 2009, 2008 and 2007, respectively. Approximately $3.1 million of DST common stock was issued from treasury as partial purchase consideration for the 2008 acquisition of BlueDoor (Note 4).
15. Commitments and Contingencies
The Company has future obligations under certain operating leases and software license agreements. The operating leases, which include facilities, data processing and other equipment, have lease terms ranging from 1 to 12 years excluding options to extend the leases for various lengths of time. Rental expense from operating leases was $31.9 million, $37.8 million and $51.7 million for the years ended December 31, 2009, 2008 and 2007, respectively. Certain leases have clauses that call for the annual rents to be increased during the term of the lease. Such lease payments are expensed on a straight-line basis. Obligations under software license agreements generally relate to purchase obligations under maintenance agreements that support the software license. The Company leases certain facilities from unconsolidated real estate affiliates and incurred occupancy expenses of $5.4 million, $6.9 million and $8.3 million for the years ended December 31, 2009, 2008 and 2007, respectively.
The Company has letters of credit of $8.3 million and $9.0 million outstanding at December 31, 2009 and 2008, respectively. Letters of credit are secured by the Company's debt facility.
The Company has entered into agreements with certain officers whereby upon defined circumstances constituting a change in control of the Company, certain benefit entitlements are automatically funded and such officers are entitled to specific cash payments upon termination of employment.
The Company has established trusts to provide for the funding of corporate commitments and entitlements of Company officers, directors, employees and others in the event of a change in control of the Company. Assets held in such trusts at December 31, 2009 were not significant.
The Company and its subsidiaries are involved in various legal proceedings arising in the normal course of their businesses. While the ultimate outcome of these legal proceedings cannot be predicted with certainty, it is the opinion of management, after consultation with legal counsel, that the final outcome in such proceedings, in the aggregate, would not have a material adverse effect on the consolidated financial condition, results of operations and cash flow of the Company.
The Company has entered into an agreement to guarantee 50% of the obligations of a 50% owned joint venture as a tenant under a real estate lease for an office building. The initial term of the lease is 10 years and 7 months, commencing March 1, 2007 and expiring September 30, 2017, with two five-year
140
DST Systems, Inc.
Notes to Consolidated Financial Statements (Continued)
15. Commitments and Contingencies (Continued)
options to extend. The base rent for the initial term is $4.8 million per year, plus all operating expenses for the building.
The Company entered into an agreement to guarantee $2.0 million plus any enforcement costs related to a $32.0 million mortgage loan to a 33% owned real estate joint venture. The $32.0 million loan matures on July 1, 2010. At December 31, 2009 and 2008, total borrowings on the loan were $31.1 million and $28.3 million, respectively, and the Company's guarantee totaled $1.0 million for both December 31, 2009 and 2008.
The Company's 50% owned joint ventures are generally governed by shareholder or partnership agreements. The agreements generally entitle the Company to elect one-half of the directors to the board in the case of corporations and to have 50% voting/managing interest in the case of partnerships. The agreements generally provide that the Company or the other party has the option to establish a price payable in cash, or a promise to pay cash, for all of the other's ownership in the joint venture and to submit an offer, in writing, to the other party to sell to the other party all of its ownership interests in the joint venture or to purchase all ownership interests owned by the other party at such offering price. The party receiving the offer generally has a specified period of time to either accept the offer to purchase, or to elect to purchase the offering party's interest at the offering price. The Company cannot estimate the potential aggregate offering price that it could be required to receive or elect to pay in the event this option becomes operable; however, the amount could be material.
The following table sets forth the Company's contractual cash obligations including minimum rentals for the non-cancelable term of all operating leases and obligations under software license and other agreements (in millions):
| |
Debt | Operating Leases |
Software License Agreements |
Other | Total | |||||||||||
|---|---|---|---|---|---|---|---|---|---|---|---|---|---|---|---|---|
2010 |
$ | 658.1 | $ | 19.5 | $ | 19.5 | $ | 12.2 | $ | 709.3 | ||||||
2011 |
12.2 | 14.7 | 20.0 | 9.5 | 56.4 | |||||||||||
2012 |
7.5 | 13.0 | 17.2 | 2.9 | 40.6 | |||||||||||
2013 |
276.2 | 12.6 | 0.4 | 0.6 | 289.8 | |||||||||||
2014 |
260.6 | 12.1 | 0.3 | 0.6 | 273.6 | |||||||||||
Thereafter |
7.3 | 26.8 | 34.1 | |||||||||||||
Total |
$ | 1,221.9 | $ | 98.7 | $ | 57.4 | $ | 25.8 | $ | 1,403.8 | ||||||
Debt includes secured promissory notes, real estate credit agreement, equipment credit facility, convertible debentures, revolving credit facilities, related party promissory notes and other indebtedness described in Note 9 above.
141
DST Systems, Inc.
Notes to Consolidated Financial Statements (Continued)
15. Commitments and Contingencies (Continued)
The Company's other commercial commitments are as follows (in millions):
| |
Standby Letters of Credit |
Guarantees | Total | |||||||
|---|---|---|---|---|---|---|---|---|---|---|
2010 |
$ | 8.0 | $ | 1.0 | $ | 9.0 | ||||
2011 |
||||||||||
2012 |
0.3 | 0.3 | ||||||||
2013 |
0.7 | 0.7 | ||||||||
2014 |
||||||||||
Total |
$ | 8.3 | $ | 1.7 | $ | 10.0 | ||||
In addition to the guarantees entered into as mentioned above, the Company has also guaranteed certain obligations of certain joint ventures under service agreements entered into by the joint ventures and their customers. The amount of such obligations is not stated in the agreements. Depending on the negotiated terms of the guaranty and/or the underlying service agreement, the Company's liability under the guaranty may be subject to time and materiality limitations, monetary caps and other conditions and defenses.
In certain instances in which the Company licenses proprietary systems to customers, the Company gives certain warranties and infringement indemnities to the licensee, the terms of which vary depending on the negotiated terms of each respective license agreement, but which generally warrant that such systems will perform in accordance with their specifications. The amount of such obligations is not stated in the license agreements. The Company's liability for breach of such warranties may be subject to time and materiality limitations, monetary caps and other conditions and defenses.
From time to time, the Company enters into agreements with unaffiliated parties containing indemnification provisions, the terms of which vary depending on the negotiated terms of each respective agreement. The amount of such obligations is not stated in the agreements. The Company's liability under such indemnification provisions may be subject to time and materiality limitations, monetary caps and other conditions and defenses. Such indemnity obligations include the following:
The Company has entered into purchase and service agreements with its vendors, and consulting agreements with providers of consulting services to the Company, pursuant to which the Company has agreed to indemnify certain of such vendors and consultants, respectively, against third party claims arising from the Company's use of the vendor's product or the services of the vendor or consultant.
In connection with the acquisition or disposition of subsidiaries, operating units and business assets by the Company, the Company has entered into agreements containing indemnification provisions, the terms of which vary depending on the negotiated terms of each respective agreement, but which are generally described as follows: (i) in connection with acquisitions made by the Company, the Company has agreed to indemnify the seller against third party claims made against the seller relating to the subject subsidiary, operating unit or asset and arising after the closing of the transaction, and (ii) in connection with dispositions made by the Company, the Company has agreed to indemnify the buyer against damages incurred by the buyer due to the buyer's reliance on representations and warranties relating to the subject subsidiary, operating unit or business assets in the disposition agreement if such
142
DST Systems, Inc.
Notes to Consolidated Financial Statements (Continued)
15. Commitments and Contingencies (Continued)
representations or warranties were untrue when made, or due to any breach of the representations, warranties, agreements or covenants contained in the agreement.
The Company has entered into agreements with certain third parties, including banks and escrow agents that provide software escrow, fiduciary and other services to the Company or to its benefit plans or customers. Under such agreements, the Company has agreed to indemnify such service providers for third party claims relating to the carrying out of their respective duties under such agreements.
The Company has entered into agreements with lenders providing financing to the Company pursuant to which the Company agrees to indemnify such lenders for third party claims arising from or relating to such financings. In connection with real estate mortgage financing, the Company has entered into environmental indemnity agreements in which the Company has agreed to indemnify the lenders for any damage sustained by the lenders relating to any environmental contamination on the subject properties.
In connection with the acquisition or disposition of real estate by the Company, the Company has entered into real estate contracts containing indemnification provisions, the terms of which vary depending on the negotiated terms of each respective contract, but which are generally described as follows: (i) in connection with acquisitions by the Company, the Company has agreed to indemnify the seller against third party claims made against the seller arising from the Company's on-site inspections, tests and investigations of the subject property made by the Company as part of its due diligence and against third party claims relating to the operations on the subject property after the closing of the transaction, and (ii) in connection with dispositions by the Company, the Company has agreed to indemnify the buyer for damages incurred by the buyer due to the buyer's reliance on representations and warranties relating to the subject property made by the Company in the real estate contract if such representations or warranties were untrue when made and against third party claims relating to operations on the subject property prior to the closing of the transaction.
In connection with the leasing of real estate by the Company, as landlord and as tenant, the Company has entered into occupancy leases containing indemnification provisions, the terms of which vary depending on the negotiated terms of each respective lease, but which are generally described as follows: (i) in connection with leases in which the Company is the tenant, the Company has agreed to indemnify the landlord against third party claims relating to the Company's occupancy of the subject property, including claims arising from loss of life, bodily injury and/or damage to property thereon, and (ii) in connection with leases in which the Company is the landlord, the Company has agreed to indemnify the tenant against third party claims to the extent occasioned wholly or in part by any negligent act or omission of the Company or arising from loss of life, bodily injury and/or damage to property in or upon any of the common areas or other areas under the Company's control.
At December 31, 2009 and 2008, the Company had not accrued any liability on the aforementioned guarantees or indemnifications as they relate to future performance criteria or indirect guarantees of indebtedness of others in accordance with accounting and reporting guidance on guarantees, including indirect guarantees of indebtedness of others.
143
DST Systems, Inc.
Notes to Consolidated Financial Statements (Continued)
16. Segment and Geographic Information
The Company's operating business units offer sophisticated information processing and software services and products. The Company has elected to organize and report on these business units as two operating Segments (Financial Services and Output Solutions). In addition, investments in the Company's real estate subsidiaries and affiliates, equity securities, private equity investments and certain financial interests have been aggregated into the Investments and Other Segment.
The Output Solutions Segment leases its California, Connecticut and Missouri production facilities from the Investments and Other Segment, but the Company reports financial results for the Output Solutions Segment on the basis that the Output Solutions Segment owns its production facilities. Management believes reporting Output Solutions on this basis improves its ability to analyze the Output Solutions Segment operating results taking into consideration the special purpose nature of the production plants. The Investments and Other Segment continues to present rental revenues from the Output Solutions Segment along with the related depreciation expense associated with the properties, while the elimination of the inter-segment activity is included in the Elimination Adjustments.
The Company evaluates the performance of its Segments based on income before income taxes and interest expense. Intersegment revenues are reflected at rates prescribed by the Company and may not be reflective of market rates.
Summarized financial information concerning the Company's segments is shown in the following tables (in millions):
| |
Year Ended December 31, 2009 | |||||||||||||||
|---|---|---|---|---|---|---|---|---|---|---|---|---|---|---|---|---|
| |
Financial Services |
Output Solutions |
Investments/ Other |
Elimination Adjustments |
Consolidated Total |
|||||||||||
Operating revenues |
$ | 1,106.0 | $ | 477.4 | $ | 12.0 | $ | $ | 1,595.4 | |||||||
Intersegment operating revenues |
9.2 | 4.9 | 47.4 | (61.5 | ) | |||||||||||
Out-of-pocket reimbursements |
54.3 | 571.5 | 0.7 | (4.0 | ) | 622.5 | ||||||||||
Total revenues |
1,169.5 | 1,053.8 | 60.1 | (65.5 | ) | 2,217.9 | ||||||||||
Costs and expenses |
840.6 |
989.6 |
38.2 |
(55.2 |
) |
1,813.2 |
||||||||||
Depreciation and amortization |
80.3 | 41.5 | 11.2 | (2.6 | ) | 130.4 | ||||||||||
Income (loss) from operations |
248.6 | 22.7 | 10.7 | (7.7 | ) | 274.3 | ||||||||||
Other expense, net |
44.5 | 0.5 | 40.1 | 85.1 | ||||||||||||
Equity in earnings of unconsolidated affiliates |
38.1 | (0.8 | ) | 37.3 | ||||||||||||
Earnings before interest and income taxes |
$ | 331.2 | $ | 23.2 | $ | 50.0 | $ | (7.7 | ) | $ | 396.7 | |||||
144
DST Systems, Inc.
Notes to Consolidated Financial Statements (Continued)
16. Segment and Geographic Information (Continued)
| |
Year Ended December 31, 2008 | |||||||||||||||
|---|---|---|---|---|---|---|---|---|---|---|---|---|---|---|---|---|
| |
Financial Services |
Output Solutions |
Investments/ Other |
Elimination Adjustments |
Consolidated Total |
|||||||||||
Operating revenues |
$ | 1,134.5 | $ | 528.2 | $ | 12.8 | $ | $ | 1,675.5 | |||||||
Intersegment operating revenues |
8.2 | 49.0 | (57.2 | ) | ||||||||||||
Out-of-pocket reimbursements |
72.6 | 537.2 | 0.7 | (0.6 | ) | 609.9 | ||||||||||
Total revenues |
1,215.3 | 1,065.4 | 62.5 | (57.8 | ) | 2,285.4 | ||||||||||
Costs and expenses |
830.7 |
989.8 |
40.6 |
(47.5 |
) |
1,813.6 |
||||||||||
Depreciation and amortization |
80.6 | 38.9 | 8.5 | (2.7 | ) | 125.3 | ||||||||||
Income (loss) from operations |
304.0 | 36.7 | 13.4 | (7.6 | ) | 346.5 | ||||||||||
Other expense, net |
(3.0 | ) | (0.3 | ) | (12.2 | ) | (15.5 | ) | ||||||||
Equity in earnings of unconsolidated affiliates |
33.9 | 0.8 | 34.7 | |||||||||||||
Earnings before interest and income taxes |
$ | 334.9 | $ | 36.4 | $ | 2.0 | $ | (7.6 | ) | $ | 365.7 | |||||
| |
Year Ended December 31, 2007 | |||||||||||||||
|---|---|---|---|---|---|---|---|---|---|---|---|---|---|---|---|---|
| |
Financial Services |
Output Solutions |
Investments/ Other |
Elimination Adjustments |
Consolidated Total |
|||||||||||
Operating revenues |
$ | 1,127.0 | $ | 555.1 | $ | 13.3 | $ | $ | 1,695.4 | |||||||
Intersegment operating revenues |
7.6 | 49.8 | (57.4 | ) | ||||||||||||
Out-of-pocket reimbursements |
65.0 | 542.0 | 0.4 | (0.3 | ) | 607.1 | ||||||||||
Total revenues |
1,199.6 | 1,097.1 | 63.5 | (57.7 | ) | 2,302.5 | ||||||||||
Costs and expenses |
831.0 |
1,016.0 |
28.5 |
(47.5 |
) |
1,828.0 |
||||||||||
Depreciation and amortization |
81.9 | 42.3 | 9.1 | (2.7 | ) | 130.6 | ||||||||||
Income (loss) from operations |
286.7 | 38.8 | 25.9 | (7.5 | ) | 343.9 | ||||||||||
Other income, net |
4.8 | 40.2 | 45.0 | |||||||||||||
Gain on sale of Asurion |
998.0 | 998.0 | ||||||||||||||
Equity in earnings (losses) of unconsolidated affiliates |
72.8 | (10.2 | ) | 62.6 | ||||||||||||
Earnings before interest and income taxes |
$ | 1,362.3 | $ | 38.8 | $ | 55.9 | $ | (7.5 | ) | $ | 1,449.5 | |||||
Earnings before interest and income taxes in the segment reporting information above less interest expense of $42.2 million, $55.4 million and $60.3 million for the years ended December 31, 2009, 2008 and 2007, respectively, is equal to the Company's income before income taxes on a consolidated basis for the corresponding year.
145
DST Systems, Inc.
Notes to Consolidated Financial Statements (Continued)
16. Segment and Geographic Information (Continued)
Information concerning the revenues of principal geographic areas is as follows (in millions):
| |
Year Ended December 31, | ||||||||||
|---|---|---|---|---|---|---|---|---|---|---|---|
| |
2009 | 2008 | 2007 | ||||||||
Revenues(1): |
|||||||||||
U.S. |
$ | 2,032.9 | $ | 2,033.2 | $ | 2,004.7 | |||||
U.K. |
75.9 | 136.5 | 176.4 | ||||||||
Canada |
48.8 | 44.4 | 44.9 | ||||||||
Australia |
34.2 | 29.1 | 30.2 | ||||||||
Others |
26.1 | 42.2 | 46.3 | ||||||||
|
$ | 2,217.9 | $ | 2,285.4 | $ | 2,302.5 | |||||
- (1)
- Revenues are attributed to countries based on location of the client.
Information concerning total assets by reporting segment is as follows (in millions):
| |
December 31, | ||||||
|---|---|---|---|---|---|---|---|
| |
2009 | 2008 | |||||
Financial Services |
$ | 1,477.8 | $ | 1,411.6 | |||
Output Solutions |
253.4 | 253.3 | |||||
Investments and Other |
1,267.0 | 1,031.9 | |||||
Elimination Adjustments |
(85.4 | ) | (187.4 | ) | |||
|
$ | 2,912.8 | $ | 2,509.4 | |||
Information concerning the long-lived assets of principal geographic areas is as follows (in millions):
| |
December 31, | |||||||
|---|---|---|---|---|---|---|---|---|
| |
2009 | 2008 | ||||||
Long-lived assets: |
||||||||
U.S. |
$ | 491.6 | $ | 480.6 | ||||
U.K. |
65.9 | 62.6 | ||||||
Canada |
18.3 | 16.2 | ||||||
Australia |
13.0 | 17.5 | ||||||
Others |
6.7 | 5.4 | ||||||
|
$ | 595.5 | $ | 582.3 | ||||
146
DST Systems, Inc.
Notes to Consolidated Financial Statements (Continued)
17. Quarterly Financial Data (Unaudited)
(in millions, except per share amounts):
| |
|
Year Ended December 31, 2009 | ||||||||||||||||
|---|---|---|---|---|---|---|---|---|---|---|---|---|---|---|---|---|---|---|
| |
|
First Quarter |
Second Quarter |
Third Quarter |
Fourth Quarter |
Total | ||||||||||||
Operating revenues |
$ | 395.6 | $ | 404.5 | $ | 395.6 | $ | 399.7 | $ | 1,595.4 | ||||||||
Out-of-pocket reimbursements |
165.3 | 149.5 | 156.1 | 151.6 | 622.5 | |||||||||||||
Total revenues |
560.9 | 554.0 | 551.7 | 551.3 | 2,217.9 | |||||||||||||
Cost and expenses |
458.2 | 454.5 | 454.6 | 445.9 | 1,813.2 | |||||||||||||
Depreciation and amortization |
28.3 | 31.0 | 34.5 | 36.6 | 130.4 | |||||||||||||
Income from operations |
74.4 | 68.5 | 62.6 | 68.8 | 274.3 | |||||||||||||
Interest expense |
(10.6 | ) | (9.5 | ) | (8.8 | ) | (13.3 | ) | (42.2 | ) | ||||||||
Other income (expense), net |
16.2 | 11.2 | 33.2 | 24.5 | 85.1 | |||||||||||||
Equity in earnings of unconsolidated affiliates |
5.7 | 10.5 | 7.8 | 13.3 | 37.3 | |||||||||||||
Income before income taxes |
85.7 | 80.7 | 94.8 | 93.3 | 354.5 | |||||||||||||
Income taxes |
12.5 | 32.0 | 33.9 | 34.5 | 112.9 | |||||||||||||
Net income |
$ | 73.2 | $ | 48.7 | $ | 60.9 | $ | 58.8 | $ | 241.6 | ||||||||
Average common shares outstanding |
49.7 | 49.7 | 49.7 | 49.4 | 49.6 | |||||||||||||
Basic earnings per share |
$ | 1.47 | $ | 0.98 | $ | 1.22 | $ | 1.19 | $ | 4.87 | (1) | |||||||
Average diluted shares outstanding |
49.9 |
50.0 |
50.2 |
49.8 |
50.0 |
|||||||||||||
Diluted earnings per share |
$ | 1.47 | $ | 0.97 | $ | 1.21 | $ | 1.18 | $ | 4.84 | (1) | |||||||
Common stock price ranges: |
High |
$ |
40.93 |
$ |
39.26 |
$ |
47.31 |
$ |
45.09 |
$ |
47.31 |
|||||||
|
Low | $ | 25.89 | $ | 35.01 | $ | 34.95 | $ | 41.71 | $ | 25.89 | |||||||
- (1)
- Earnings per share are computed independently for each of the quarters presented. Accordingly, the accumulation of 2009 quarterly earnings per share may not equal the total computed for the year.
147
DST Systems, Inc.
Notes to Consolidated Financial Statements (Continued)
17. Quarterly Financial Data (Unaudited) (Continued)
| |
|
Year Ended December 31, 2008 | ||||||||||||||||
|---|---|---|---|---|---|---|---|---|---|---|---|---|---|---|---|---|---|---|
| |
|
First Quarter |
Second Quarter |
Third Quarter |
Fourth Quarter |
Total | ||||||||||||
Operating revenues |
$ | 430.8 | $ | 426.6 | $ | 414.2 | $ | 403.9 | $ | 1,675.5 | ||||||||
Out-of-pocket reimbursements |
157.0 | 146.3 | 146.2 | 160.4 | 609.9 | |||||||||||||
Total revenues |
587.8 | 572.9 | 560.4 | 564.3 | 2,285.4 | |||||||||||||
Cost and expenses |
472.8 | 458.9 | 449.3 | 432.6 | 1,813.6 | |||||||||||||
Depreciation and amortization |
30.6 | 31.0 | 32.2 | 31.5 | 125.3 | |||||||||||||
Income from operations |
84.4 | 83.0 | 78.9 | 100.2 | 346.5 | |||||||||||||
Interest expense |
(12.7 | ) | (13.8 | ) | (13.8 | ) | (15.1 | ) | (55.4 | ) | ||||||||
Other income (expense), net |
(4.4 | ) | (2.5 | ) | 2.8 | (11.4 | ) | (15.5 | ) | |||||||||
Equity in earnings of unconsolidated affiliates |
8.7 | 11.6 | 9.0 | 5.4 | 34.7 | |||||||||||||
Income before income taxes |
76.0 | 78.3 | 76.9 | 79.1 | 310.3 | |||||||||||||
Income taxes |
3.8 | 28.4 | 26.7 | 8.5 | 67.4 | |||||||||||||
Net income |
$ | 72.2 | $ | 49.9 | $ | 50.2 | $ | 70.6 | $ | 242.9 | ||||||||
Average common shares outstanding |
58.6 | 54.2 | 51.9 | 49.7 | 53.6 | |||||||||||||
Basic earnings per share |
$ | 1.23 | $ | 0.92 | $ | 0.97 | $ | 1.42 | $ | 4.53 | (1) | |||||||
Average diluted shares outstanding |
65.5 |
59.0 |
56.2 |
50.1 |
57.7 |
|||||||||||||
Diluted earnings per share |
$ | 1.10 | $ | 0.85 | $ | 0.90 | $ | 1.41 | $ | 4.21 | (1) | |||||||
Common stock price ranges: |
High |
$ |
80.65 |
$ |
67.30 |
$ |
66.01 |
$ |
55.46 |
$ |
80.65 |
|||||||
|
Low | $ | 65.15 | $ | 55.05 | $ | 53.14 | $ | 32.04 | $ | 32.04 | |||||||
- (1)
- Earnings per share are computed independently for each of the quarters presented. Accordingly, the accumulation of 2008 quarterly earnings per share may not equal the total computed for the year.
148
Item 9. Changes in and Disagreements with Accountants on Accounting and Financial Disclosure
Item 9A. Controls and Procedures
Evaluation of Disclosure Controls and Procedures and Changes in Internal Control Over Financial Reporting
As of the end of the fiscal year for which this annual report on Form 10-K is filed, the Company's Chief Executive Officer and Chief Financial Officer evaluated the effectiveness of the Company's disclosure controls and procedures. Based upon that evaluation, the Chief Executive Officer and Chief Financial Officer have concluded that the Company's disclosure controls and procedures (i) are effective for recording, processing, summarizing and reporting, within the time periods specified in the Securities and Exchange Commission's rules and forms, the information required to be disclosed by the Company in reports that it files or submits under the Securities Exchange Act of 1934, and (ii) include controls and procedures designed to ensure that information required to be disclosed by the Company in such reports is accumulated and communicated to the Company's management, including the Chief Executive Officer and Chief Financial Officer, as appropriate to allow timely decisions regarding required disclosure. There has been no change in the Company's internal control over financial reporting that occurred during the last fiscal quarter of the fiscal year for which this annual report on Form 10-K is filed that has materially affected, or is reasonably likely to materially affect, the Company's internal control over financial reporting.
Report of Management on Internal Control over Financial Reporting
The Company's management is responsible for establishing and maintaining adequate internal control over financial reporting, as such term is defined in Exchange Act Rule 13a-15(f). Under the supervision and with the participation of management, including the Chief Executive Officer and Chief Financial Officer, the Company conducted an evaluation of the effectiveness of our internal control over financial reporting based on the framework in Internal Control—Integrated Framework issued by the Committee of Sponsoring Organizations of the Treadway Commission. Based on our evaluation under the framework in Internal Control—Integrated Framework, management concluded that our internal control over financial reporting was effective as of December 31, 2009.
The effectiveness of the Company's internal control over financial reporting as of December 31, 2009 has been audited by PricewaterhouseCoopers LLP, an independent registered public accounting firm, as stated in their report which appears herein.
We are providing the following disclosures in lieu of providing this information in a current report on Form 8-K pursuant to the following items:
Item 5.03, Amendments to Articles of Incorporation or Bylaws; Change in Fiscal Year.
On February 23, 2010, the Board of Directors of the Company approved amended and restated bylaws of the Company. The bylaws as amended and restated have been revised primarily to reflect the fact that the Company's Chief Executive Officer and its President are no longer the same person. Some of the powers and duties formerly provided to the President have been assigned to the Chief Executive Officer, and some of those powers and duties are now shared by both the President and the Chief Executive Officer. In connection with these changes, the powers and duties of certain offices of the Company, including Chief Executive Officer, President, and Treasurer, have been revised or described. In addition, Article IX Section 1 of the Company's bylaws has been revised to eliminate the reference to indemnification.
149
The foregoing description of the Company's amended and restated bylaws is not complete and is subject to and qualified in its entirety by reference to the Company's amended and restated bylaws, a copy of which is attached as Exhibit 3.1 and incorporated herein by reference. In addition, a marked copy of the Company's amended and restated bylaws indicating changes made to the Company's bylaws as they existed immediately prior to the adoption of those amended and restated bylaws is attached as Exhibit 99.1.
Item 1.01, Entry into a Material Definitive Agreement, and Item 5.02, Departure of Directors or Certain Officers; Election of Directors; Appointment of Certain Officers; Compensatory Arrangements of Certain Officers.
On February 23, 2010, the Compensation Committee of the Board of Directors of the Company (the "Committee") granted awards of restricted stock units ("RSUs") to certain executive officers of the Company, including Thomas A. McDonnell, Chief Executive Officer; Stephen C. Hooley, President and Chief Operating Officer; Kenneth V. Hager, Chief Financial Officer; and Jonathan J. Boehm, Executive Vice President and also President of Argus Health Systems The RSU grants were made under the Company's 2005 Equity Incentive Plan ("Plan"), were effective February 23, 2010, and are a component of executive compensation for 2010.
Messrs. McDonnell, Hooley, Hager and Boehm received grants of 31,100, 21,100, 8,300 and 5,850 RSUs, respectively, the vesting of which depend on achievement of DST goals. Mr. Boehm received an additional 5,850 RSUs the vesting of which depend on achievement of Argus Health Systems goals. Each RSU is for the right to receive one share of the Company's common stock upon vesting.
Pursuant to the terms of each officer's award that is based on Company goals, in connection with each year's meeting of the Committee at which the Company's financial results for the preceding calendar year are approved for Plan purposes (beginning with such meeting in 2011), a percentage of the RSUs vest if an increase over prior year DST earnings per share as determined by the Committee for purposes of such award ("EPS") has occurred. The percentage of the aggregate award of options vesting as of each such date shall equal two times the percentage of increase over the previous year's EPS.
Predetermined levels of pretax income apply to Mr. Boehm's RSUs based on the achievement of Argus goals. Those RSUs vest as follows: 1/3 if Argus reaches an initial goal level, an additional 1/3 if it achieves a second goal level (or 2/3 if Argus has not achieved the initial level prior to this time), and an additional 1/3 if Argus reaches the highest goal level (or the entire amount if Argus has not achieved the other hurdles prior to this time).
Any amounts not vested by the date of the Committee's meeting in 2015 will be forfeited. The RSUs are also forfeited if the employee violates any of the non-compete, non-use or non-disclosure provisions of the Restricted Stock Unit Award Agreement, which governs the award and which the grantee must accept in order for the award to be effective.
In the event of a voluntary or involuntary termination of employment that is not in connection with death, disability, business unit divestiture, reduction in force or retirement, the unvested RSUs will be forfeited. Any unvested amounts shall vest and become immediately exercisable upon termination by reason of disability, as determined in accordance with the Committee's rules for administration of the Plan, or death.
In the event of a termination of employment in connection with a business unit divestiture (as defined in the award agreement), RSUs that are unvested as of the date of the business unit divestiture may vest pro rata based on the number of calendar months that have elapsed from the first day of the performance period to the date of such divestiture. Pro rata vesting will occur only if any level of goal achievement has been certified prior to or for the performance year in which the divestiture occurred.
150
If no level of goal achievement has occurred by the date of the business unit divestiture, the determination of whether pro rata vesting shall occur is to be delayed until the Committee determines whether goals were achieved for the performance year in which the business unit divestiture occurred. The remaining RSU's will be forfeited.
In the event of a termination of employment in connection with a reduction in force or in the event of a retirement (each as defined in the award agreement), the vesting determination will be delayed until the Committee's determination of performance for the year in which termination of employment occurred, and RSUs that would have vested on the determination date shall vest pro rata based on the number of calendar months worked in the year prior to the termination. The remaining RSUs will be forfeited.
In the event of a Change in Control (as defined in the Plan), one-third of any unvested RSUs shall vest annually on each anniversary of the Change in Control, and all unvested RSUs will vest upon termination without cause or a resignation with good reason (as defined in the award agreement) following the Change in Control. In the event of a retirement that occurs subsequent to a Change in Control, a pro rata portion of the number of RSUs that would have vested on the next Change in Control anniversary date shall vest based on the number of months that have elapsed since the Change in Control or the preceding anniversary date.
This summary is not intended to be complete, and is qualified in its entirety by reference to the form of Restricted Stock Unit Award Agreement included as Exhibit 10.3 to this report and incorporated herein by reference.
Item 10. Directors, Executive Officers and Corporate Governance
The Company has incorporated by reference certain information in response or partial response to the Items under this Part III of this Annual Report on Form 10-K pursuant to General Instruction G(3) of this Form 10-K and Rule 12b-23 under the Exchange Act. The Company's definitive proxy statement in connection with its annual meeting of stockholders scheduled for May 11, 2010 (the "Definitive Proxy Statement"), will be filed with the Securities and Exchange Commission no later than 120 days after December 31, 2009.
(a) Directors of the Company
The information set forth in response to Item 401 of Regulation S-K under the heading "The Board of Directors" in the Company's Definitive Proxy Statement is hereby incorporated herein by reference in partial response to this Item 10.
(b) Executive Officers of the Company
The information set forth in response to Item 401 of Regulation S-K under the heading "Executive Officers and Significant Employees of the Company" in Part I of this Form 10-K is incorporated herein by reference in partial response to this Item 10.
(c) Compliance with Section 16(a) of the Exchange Act
The information set forth in response to Item 405 of Regulation S-K under the heading "Corporate Insiders and Significant Shareholders—Insider Disclosures" in the Company's Definitive Proxy Statement is hereby incorporated herein by reference in partial response to this Item 10.
151
(d) Code of Ethics
The Company has adopted a Code of Business Conduct and Ethics (the "Code of Ethics") that applies to directors, officers (including, among others, the Company's principal executive officer, principal financial officer, principal accounting officer or controller, or persons performing similar functions) and employees. The Company has posted its Code of Ethics on its Internet website at www.dstsystems.com. The Company will also post on this Internet website any amendments to, or waivers from, a provision of its Code of Ethics that apply to the Company's principal executive officer, principal financial officer, principal accounting officer, or persons performing similar functions as required by applicable rules and regulations.
(e) Audit Committee and Audit Committee Financial Expert
The information set forth in response to Item 407(d)(4) and (d)(5) of Regulation S-K under the heading "The Board of Directors" and the subheading "Audit Committee" in the Company's Definitive Proxy Statement is hereby incorporated herein by reference in partial response to this Item 10.
Item 11. Executive Compensation
The information set forth in response to Item 402 of Regulation S-K under the sections "Non-Employee Director Compensation," "Compensation Discussion and Analysis," "Named Officer Compensation," "Insider Disclosures," "Compensation Committee Report", and "Board Committee Matters and Reports—Compensation Committee" in the Company's Definitive Proxy Statement is hereby incorporated herein by reference in response to this Item 11.
Item 12. Security Ownership of Certain Beneficial Owners and Management and Related Stockholder Matters
The information set forth in response to Item 403 of Regulation S-K under the heading "Corporate Insiders and Significant Shareholders—Beneficial Ownership" in the Company's Definitive Proxy Statement is hereby incorporated herein by reference in response to this Item 12.
The Company has no knowledge of any arrangement the operation of which may at a subsequent date result in a change of control of the Company.
The Company's Definitive Proxy Statement provides in an Equity Compensation Plan Table information as of December 31, 2009 about the Company's common stock that may be issued upon the exercise of options, warrants and rights, as well as shares of restricted stock and other shares of the Company's common stock issued under all of the Company's equity compensation plans existing as of December 31, 2009, and the number of securities remaining available for issuance under those equity compensation plans which have a specified number of shares available for issuance. The table is hereby incorporated herein by reference in response to this Item 12.
Item 13. Certain Relationships and Related Transactions, and Director Independence
The information set forth in response to Item 404 and Item 407(a) of Regulation S-K under the headings "Corporate Insiders and Significant Shareholders—Insider Disclosures" and "The Board of Directors—Independence and Accessibility" in the Company's Definitive Proxy Statement is incorporated herein by reference in response to this Item 13.
Item 14. Principal Accountant Fees and Services
The information set forth in response to Item 9(e) of Schedule 14A under the heading "Independent Registered Public Accounting Firm" in the Company's Definitive Proxy Statement is incorporated herein by reference in response to this Item 14.
152
Item 15. Exhibits and Financial Statement Schedules
- (a)
- List of Documents filed as part of this Report
- (1)
- Consolidated Financial Statements
The consolidated financial statements and related notes, together with the report of PricewaterhouseCoopers LLP, appear in Part II Item 8 Financial Statements and Supplementary Data of this Form 10-K.
The consolidated financial statements consist of the following:
- 1.
- Consolidated
Balance Sheets as of December 31, 2009 and 2008;
- 2.
- Consolidated
Statement of Income for the three years ended December 31, 2009;
- 3.
- Consolidated
Statement of Changes in Stockholders' Equity for the three years ended December 31, 2009;
- 4.
- Consolidated
Statement of Cash Flows for the three years ended December 31, 2009.
- 5.
- Notes
to Consolidated Financial Statements
- (2)
- Consolidated Financial Statement Schedules
All schedules have been omitted because they are not applicable, are insignificant or the required information is shown in the consolidated financial statements or notes thereto.
- (3)
- List of Exhibits
The Company has incorporated by reference herein certain exhibits as specified below pursuant to Rule 12b-32 under the Exchange Act.
- 3.
- Articles of Incorporation and by-laws
| 3.1.1 | The Company's Amended Delaware Certificate of Incorporation, as restated, which is attached as Exhibit 3.1 to the Company's Registration Statement on Form S-1 filed on September 1, 1995, as amended (Registration No. 33-96526) (the "IPO Registration Statement"), is hereby incorporated by reference as Exhibit 3.1.l. | |
3.1.2 |
The Company's Certificate of Amendment of Certificate of Incorporation, dated May 9, 2000, which is attached as Exhibit 3.1 to the Company's Quarterly Report on Form 10-Q dated May 15, 2000 (Commission File No. 1-14036), is hereby incorporated by reference as Exhibit 3.1.2. |
|
3.1.3 |
The Company's Certificate of Amendment of Certificate of Incorporation, dated May 11, 2004, which is attached as Exhibit 3.1.2 to the Company's Quarterly Report on Form 10-Q dated August 9, 2004 (Commission File No. 1-14036), is hereby incorporated by reference as Exhibit 3.1.3. |
|
3.2 |
The Company's Amended and Restated Bylaws, dated February 23, 2010, attached to this Form 10-K as Exhibit 3.1, is hereby incorporated by reference as Exhibit 3.2. |
153