Attached files
| file | filename |
|---|---|
| 8-K - FORM 8-K - HOME BANCORP, INC. | v474656_8k.htm |
Raymond James U.S. Bank Conference September 6, 2017

FORWARD - LOOKING STATEMENTS This presentation contains certain forward - looking statements within the meaning of the safe harbor provisions of the Private Securities Litigation Reform Act of 1995, as amended. Forward - looking statements do not relate strictly to historical or current facts. Forward - looking statements reflect management’s current views and estimates of future economic circumstances, industry conditions, company performance and financial results. They often include the words “believe,” “expect,” “anticipate,” “intend,” “plan,” “estimate” or words of similar meaning, or future or conditional verbs such as “will,” “would,” “should,” “could” or “may.” Forward - looking statements, by their nature, are subject to risks and uncertainties. A number of factors - many of which are beyond our control - could cause actual conditions, events or results to differ significantly from those described in the forward - looking statements. Forward - looking statements regarding this transaction are based upon currently available information. Actual results could differ materially from those indicated in forward - looking statements. Among other factors, actual results may differ from those described in forward - looking statements due to: the possibility that the proposed transaction does not close when expected or at all because required regulatory, shareholder or other approvals and other conditions to closing are not received or satisfied on a timely basis or at all; the terms of the proposed transaction may need to be modified to obtain such approvals or satisfy such conditions; the anticipated benefits from the proposed transaction are not realized in the time frame anticipated or at all as a result of changes in general economic and market conditions, interest rates, laws and regulations and their enforcement, and the degree of competition in our markets; the ability to promptly and effectively integrate the businesses of the companies; the reaction of the companies' customers to the transaction; diversion of management time on merger - related issues; changes in asset quality and credit risk; the inability to sustain revenue and earnings; and other competitive conditions. Home Bancorp’s Annual Reports on Form 10 - K and other reports filed with the SEC describe some additional factors which could cause actual conditions, events or results to differ significantly from those described in forward - looking statements. Forward - looking statements speak only as of the date they are made. Copies of Home Bancorp’s reports filed with the SEC are available in the Investor Relations section of our website, www.home24bank.com. We do not undertake to update forward - looking statements to reflect circumstances or events that occur after the date the forward - looking statements are made or to reflect the occurrence of unanticipated events. Annualized, pro forma, projected and estimated numbers presented herein are presented for illustrative purpose only, are not forecasts and may not reflect actual results.
Additional Information Regarding The Merger Home Bancorp intends to file with the SEC a Registration Statement on Form S - 4 relating to its proposed merger with St. Martin Bancshares, Inc., which will include a prospectus for the issuance of shares of Home Bancorp’s common stock in the merger as well as the joint proxy statement of Home Bancorp and St. Martin Bancshares for the solicitation of proxies from their respective shareho lde rs for use at the meetings at which the merger will be considered. This communication does not constitute an offer to sell or the solicitat ion of an offer to buy any securities or a solicitation of any vote or approval. SHAREHOLDERS OF HOME BANCORP AND ST. MARTIN BANCSHARES ARE URGED TO READ THE REGISTRATION STATEMENT AND THE JOINT PROXY STATEMENT/PROSPECTUS REGARDING THE MERGER WHEN IT BECOMES AVAILABLE AND ANY OTHER RELEVANT DOCUMENTS FILED BY HOME BANCORP WITH THE SEC, AS WELL AS ANY AMENDMENTS OR SUPPLEMENTS TO THOSE DOCUMENTS, BECAUSE THEY WILL CONTAIN IMPORTANT INFORMATION. A free copy of the joint proxy statement/prospectus, as well as other filings containing information about Home Bancorp, may be obtained at the SEC’s website at http://www.sec.gov, when they are filed by Home Bancorp. You will also be able to obtain these documents , w hen they are filed, free of charge, from Home Bancorp under the Investor Relations section of its website, www.home24bank.com. In addi tio n, copies of the joint proxy statement/prospectus can also be obtained, when it becomes available, free of charge, by directing a reque st to Home Bancorp, Inc., Richard J. Bourgeois, Corporate Secretary, 503 Kaliste Saloom Road, Lafayette, Louisiana 70508, phone 337 - 237 - 1960 , or by contacting Guy M. Labbe ’, Chief Executive Officer, St . Martin Bancshares, Inc., 301 S. Main Street, St. Martinville , Louisiana 70582, phone 337 - 394 - 7816. Home Bancorp and St. Martin Bancshares and certain of their directors and executive officers may be deemed to be “participants” in the solicitation of proxies in connection with the proposed merger . Information about the directors and officers of Home Bancorp is set forth in the proxy statement for Home Bancorp’s 2017 annual meeting of shareholders, as filed with the SEC on March 24, 2017. Informat ion concerning the directors and officers of St. Martin Bancshares and other persons who may be deemed participants in the solici tat ion of proxies will be set forth in the joint proxy statement/prospectus relating to the merger , when it becomes available. Free copies of this document may be obtained as described in the preceding paragraph.
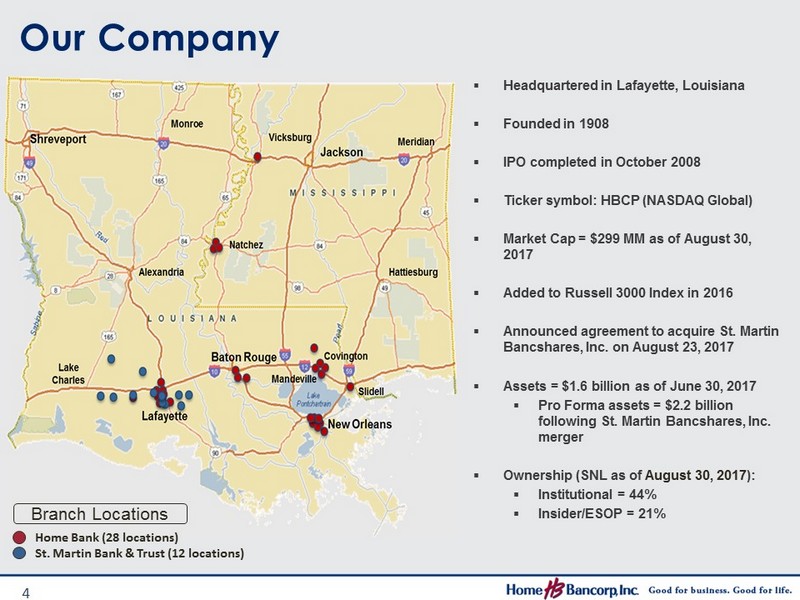
Home Bank (28 locations) St. Martin Bank & Trust (12 locations) Branch Locations Our Company ▪ Headquartered in Lafayette, Louisiana ▪ Founded in 1908 ▪ IPO completed in October 2008 ▪ Ticker symbol: HBCP (NASDAQ Global) ▪ Market Cap = $299 MM as of August 30, 2017 ▪ Added to Russell 3000 Index in 2016 ▪ Announced agreement to acquire St. Martin Bancshares, Inc. on August 23, 2017 ▪ Assets = $1.6 billion as of June 30, 2017 ▪ Pro Forma assets = $2.2 billion following St. Martin Bancshares , Inc. merger ▪ Ownership (SNL as of August 30, 2017 ): ▪ Institutional = 44% ▪ Insider/ESOP = 21% 4

Consistent Growth in Shareholder Return Driven by EPS Growth $0.00 $0.10 $0.20 $0.30 $0.40 $0.50 $0.60 $0.70 $0.80 $0 $5 $10 $15 $20 $25 $30 $35 $40 $45 EPS Price per Share Reported Diluted EPS HBCP Stock Price 5
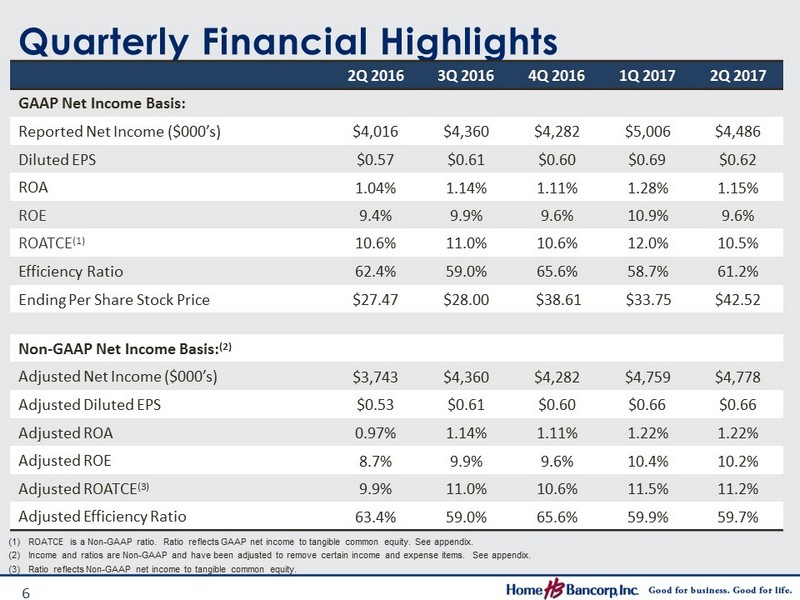
Quarterly Financial Highlights 2Q 2016 3Q 2016 4Q 2016 1Q 2017 2Q 2017 GAAP Net Income Basis: Reported Net Income ($000’s) $4,016 $4,360 $4,282 $5,006 $4,486 Diluted EPS $0.57 $0.61 $0.60 $0.69 $0.62 ROA 1.04% 1.14% 1.11% 1.28% 1.15% ROE 9.4% 9.9% 9.6% 10.9% 9.6% ROATCE (1) 10.6% 11.0% 10.6% 12.0% 10.5% Efficiency Ratio 62.4% 59.0% 65.6% 58.7% 61.2% Ending Per Share Stock Price $27.47 $28.00 $38.61 $33.75 $42.52 Non - GAAP Net Income Basis : (2) Adjusted Net Income ($000’s) $3,743 $4,360 $4,282 $4,759 $4,778 Adjusted Diluted EPS $0.53 $0.61 $0.60 $0.66 $0.66 Adjusted ROA 0.97% 1.14% 1.11% 1.22% 1.22% Adjusted ROE 8.7% 9.9% 9.6% 10.4% 10.2% Adjusted ROATCE (3) 9.9% 11.0% 10.6% 11.5% 11.2% Adjusted Efficiency Ratio 63.4% 59.0% 65.6% 59.9% 59.7% (1) ROATCE is a Non - GAAP ratio. Ratio reflects GAAP net income to tangible common equity. See appendix. (2) Income and ratios are Non - GAAP and have been adjusted to remove certain income and expense items. See appendix. (3) Ratio reflects Non - GAAP net income to tangible common equity. 6

Disciplined Acquirer since IPO 300,000 600,000 900,000 1,200,000 1,500,000 1,800,000 2,100,000 2,400,000 2008 2009 2010 2011 2012 2013 2014 2015 2016 Pro Forma - June 2017 Home Bank Total Assets ($000s) St. Martin Bank & Trust (1) Statewide Bank Britton & Koontz Bank Bank of New Orleans CAGR = 17% Guaranty Savings Bank Acquired Bank Date Assets ($ in MM) % of TBV # of Branches Consideration Statewide Bank Mar - 2010 $199 FDIC - assisted 6 All Cash Guaranty Savings Bank Jul – 2011 257 95% 5 All Cash Britton & Koontz Bank Feb – 2014 301 88% 8 All Cash Bank of New Orleans Sep – 2015 346 126% 4 All Cash St. Martin Bank & Trust (1) Announced Aug – 2017 596 183% 12 ~80% Stock, 20% Cash (2) 7 (1) Pending (2) Cash is comprised of an aggregate $19.5 million special cash distribution to be paid by St. Martin Bancshares to its sharehol der s immediately prior to closing.

Effective Balance Sheet Management % of total assets ▪ Steady organic loan growth ▪ Relatively small investment portfolio ▪ Core deposit growth has offset capital deployment and borrowings (1) Excludes loans held for sale 2009 2010 2011 2012 2013 2014 2015 2016 2Q 2017 Cash and Equivalents 5% 6% 4% 4% 4% 3 % 2% 2% 3% Investments 23% 18% 16% 17% 16% 15% 12% 13% 13% Total Loans, net (1) 64% 63% 69% 70% 71% 74% 78% 78% 77% Other Assets 8% 13% 11% 9% 9% 8% 8% 7% 7% Non Maturity Deposits 41% 47% 46% 54% 56% 63% 62% 63% 64% CDs 30% 32% 30% 26% 19% 18% 18% 17% 19% Borrowings and Other Liabilities 4% 2% 10% 5% 11% 6% 9% 8% 5% Shareholders’ Equity 25% 19% 14% 15% 14% 13% 11% 12% 12% 8

$0 $200,000 $400,000 $600,000 $800,000 $1,000,000 $1,200,000 $1,400,000 2008 2009 2010 2011 2012 2013 2014 2015 2016 2Q 2017 Loan Balance Outstanding ($000's) Total Originated Statewide GSB B&K BNO Steady Organic Loan Growth Organic Loan CAGR = 12.5% (excludes acquisition accounting adjustments) 9

Non Performing Assets / Assets 0.3% 0.3% 0.2% 0.4% 0.5% 0.7% 0.5% 0.4% 0.9% 0.9% 0.8% 1.2% 1.1% 1.2% 0.6% 0.4% 0.2% 0.1% 0.0% 0.5% 1.0% 1.5% 2.0% 2.5% 3.0% 2008 2009 2010 2011 2012 2013 2014 2015 2016 2Q 2017 Originated Acquired Peer Median Peers throughout presentation = BHCs $1 - $3 billion in assets as of 6/30/2017. Source: SNL.com 10

Credit Quality ▪ Low net charge offs ▪ Increased ALLL on originated loans due primarily to the potential direct and indirect impact of continued low energy prices ▪ ALLL does not include credit discounts on acquired loans 0.78% 0.85% 0.94% 0.99% 1.02% 1.05% 1.07% 1.15% 1.20% 1.33% 1.36% 1.38% 1.38% 1.40% 0.6% 0.8% 1.0% 1.2% 1.4% 1.6% 1.8% 4Q 2015 1Q 2016 2Q 2016 3Q 2016 4Q 2016 1Q 2017 2Q 2017 Allowance / Loans Reported ALLL Originated ALLL $5.8 $5.8 $15.4 $17.6 $13.0 $13.8 $14.4 $5.6 $3.7 $4.0 $3.6 $3.6 $2.4 $2.1 $0 $5 $10 $15 $20 $25 4Q 2015 1Q 2016 2Q 2016 3Q 2016 4Q 2016 1Q 2017 2Q 2017 NPA's Outstanding ($millions) Non Performing Assets Originated Acquired (dollars in thousands) 4Q 2015 1Q 2016 2Q 2016 3Q 2016 4Q 2016 1Q 2017 2Q 2017 Beginning Balance $8,932 $9,547 $10,397 $11,447 $12,193 $12,511 $12,918 Provision 670 850 1,050 800 500 307 150 Charge offs - 185 - 106 - 80 - 63 - 197 - 18 - 73 Recoveries 130 106 80 9 15 118 15 Ending Balance $9,547 $10,397 $11,447 $12,193 $12,511 $12,918 $13,010 Net Charge Offs - Originated $41 $94 $0 $54 $149 - $100 $58 Net Charge Offs - Acquired 14 - 94 0 0 33 0 0 Total Net Charge Offs $55 $0 $0 $54 $182 - $100 $58 Annualized Net Charge Offs 0.02% 0.00% 0.00% 0.02% 0.06% - 0.03% 0.02% 11

Net Interest Margin (TE) 4.38% 3.61% 3.00% 3.25% 3.50% 3.75% 4.00% 4.25% 4.50% 4.75% 5.00% 2008 2009 2010 2011 2012 2013 2014 2015 2016 June 2017 YTD Home Bank Peer Median 0.77% Spread ▪ Continually higher NIM than peers ▪ Yield on earning assets = 4.78% (91 st percentile) ▪ Net loans represent 77% of assets ▪ Loan yield of 5.28% (85 th percentile) ▪ Cost of funding earning assets = 0.40% (38 th percentile ) ▪ Stable NIM during current rate cycle ▪ Shorter investment portfolio with a 3.1 year effective duration in +100 environment ▪ Reduced exposure to overnight advances through deposit growth ▪ Limited concentration of 30 year fixed mortgages (< 5% of total loans) ▪ Construction and development loans 12

2.77% 2.85% 2.60% 2.70% 2.80% 2.90% 3.00% 3.10% 3.20% 3.30% 3.40% 3.50% 3.60% 2008 2009 2010 2011 2012 2013 2014 2015 2016 June 2017 YTD NIE / Avg. Assets Peer Median Home Bancorp Average gap = 0.41% Non Interest Income & Expense (1) 0.82% 0.65% 0.40% 0.50% 0.60% 0.70% 0.80% 0.90% 1.00% 2008 2009 2010 2011 2012 2013 2014 2015 2016 June 2017 YTD NII / Avg. Assets ▪ Deposit redesign full rollout in 2H17 ▪ Restructured mortgage sales for greater alignment (1) Excludes non core income and expense: see appendix 13 ▪ Demonstrated expense control after acquisitions in 2014 and 2015 ▪ Continued back office and infrastructure investments provide ability for continued expansion

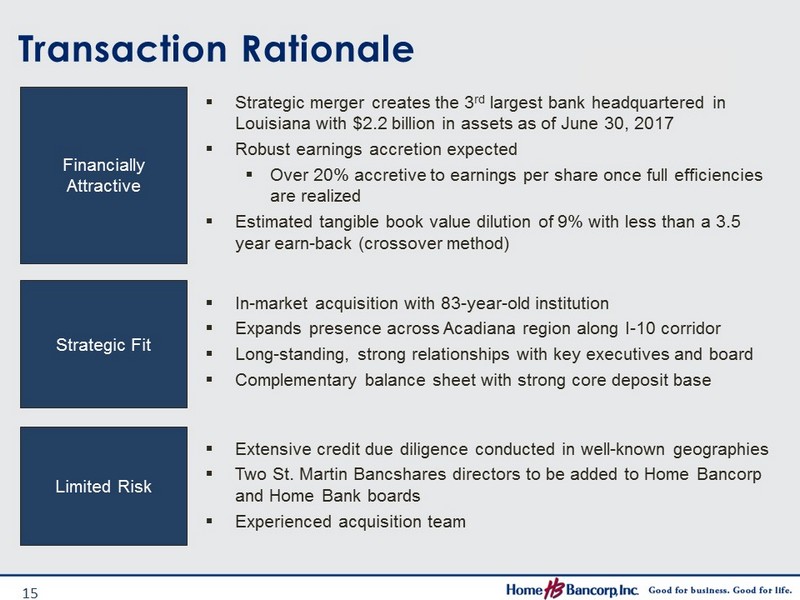
Transaction Rationale ▪ Strategic merger creates the 3 rd largest bank headquartered in Louisiana with $2.2 billion in assets as of June 30, 2017 ▪ Robust earnings accretion expected ▪ Over 20% accretive to earnings per share once full efficiencies are realized ▪ Estimated tangible book value dilution of 9% with less than a 3.5 year earn - back (crossover method) Financially Attractive Strategic Fit ▪ In - market acquisition with 83 - year - old institution ▪ Expands presence across Acadiana region along I - 10 corridor ▪ Long - standing, strong relationships with key executives and board ▪ Complementary balance sheet with strong core deposit base Limited Risk ▪ Extensive credit due diligence conducted in well - known geographies ▪ Two St. Martin Bancshares directors to be added to Home Bancorp and Home Bank boards ▪ Experienced acquisition team 15

Transaction Terms and Key Assumptions ▪ Approximately 80% Stock, 20% Cash (1) ▪ Approximately 1,927,000 new HBCP shares to be issued (2) Consideration Transaction Value ▪ Aggregate Value = $ 96.1 million (1,2,3) ▪ $457.47 per share (1,2) Valuation Multiples ▪ Aggregate Value / Tangible Book Value = 183% (2,4) ▪ Aggregate Value / LTM Earnings = 12.3x (2,4,5) Key Assumptions ▪ Cost savings of $5.1 million pre - tax ( ~ 32% of noninterest expense) (4) ▪ Loan mark of $7.2 million (includes $12.3 million credit mark) ▪ $5.8 million of estimated pre - tax merger - related costs Required Approvals ▪ Home Bancorp, Inc. shareholder approval ▪ St. Martin Bancshares, Inc. shareholder approval ▪ Customary regulatory approvals Timing ▪ Expected close in 4 th Q 2017 or 1 st Q 2018 (1) Includes $19.5 million special cash distribution to be paid by St. Martin Bancshares to its shareholders immediately prior to cl osing. (2) Fixed exchange ratio of 9.2839 shares of HBCP and a 10 - day average HBCP closing price through August 22, 2017 of $39.15. (3) Includes $1.1 million payment for options outstanding. (4) Based on St. Martin Bancshares unaudited financial statements as of and for the twelve months ended June 30, 2017. (5) Earnings are S - Corp adjusted using a 35% tax rate – see appendix. 16

▪ Headquartered in St. Martinville , Louisiana ▪ Founded in 1933 ▪ 12 branches ▪ Consistently generates outstanding returns ($ in 000s) 2014 (3) 2015 2016 June 2017 YTD Assets $525,828 $538,493 $580,430 $596,448 Gross Loans 395,689 419,051 443,002 455,456 Deposits 458,735 462,938 496,345 509,766 Tier 1 Capital 42,914 47,573 52,149 55,292 Loans / Deposits 86.3% 90.5% 89.2% 89.3% NPAs / Assets ( excl.TDRs ) 0.65% 0.89% 0.68% 0.71% Asset Growth (2) 24.5% 2.4% 7.8% 5.5% Loan Growth (2) 26.6% 5.9% 5.7% 5.6% Net Interest Margin 5.48% 5.29% 5.22% 4.69% Cost of Funds 0.44% 0.41% 0.45% 0.44% Efficiency Ratio 50.4% 52.4% 52.7% 53.9% Net Charge - offs / Loans (2) 0.03% 0.07% 0.26% 0.08% MSA 2016 Rank (4) # of Branches Deposits in Market ($000) Market Share Lafayette, LA 8 9 400,599 3.7% Jennings, LA 3 3 70,488 12.9% (1) Earnings are S - Corp adjusted using a 35% tax rate – see appendix. (2) Annualized ratio in 2017. (3) Financials were impacted by CPB Bancshares, Inc. acquisition. (4) Source: S&P Global Intelligence; deposit ranking data as of 6/30/2016. St. Martin Bancshares, Inc. Franchise Overview (bank only financials) 1.62% 1.55% 1.51% 1.41% 10% 11% 12% 13% 14% 15% 16% 17% 18% 19% 20% 0.7% 0.8% 0.9% 1.0% 1.1% 1.2% 1.3% 1.4% 1.5% 1.6% 1.7% 2014 2015 2016 June 2017 YTD ROE ROA Profitability (1,2) ROA ROE 17

Home Bank (28 locations) St. Martin Bank & Trust (12 locations) Branch Locations Locations Lafayette 18

Pro Forma Loan Composition St. Martin Bank & Trust (1) Home Bank CRE 36% 1 - 4 Family 32% Agricultural 9% C&D 8% C&I 8% Consumer & Other 6% Home Equity 1% Pro Forma Total Loans: $455 million Yield on Loans: 5.89% Net Loans / Assets = 75% Total Loans: $1.7 billion Net Loans / Assets = 76% Total Loans: $1.2 billion Yield on Loans: 5.29% Net Loans / Assets = 77% (1) Source: S&P Global Intelligence; bank call report as of 6/30/2017 CRE 41% 1 - 4 Family 28% C&I 11% C&D 10% Home Equity 7% Consumer & Other 3% CRE 40% 1 - 4 Family 29% C&I 10% C&D 9% Home Equity 6% Consumer & Other 4% Agricultural 2% 19

▪ Outstanding balance = $33.4 million, or 2.7% of loans ▪ Unfunded commitments = $5.0 million ▪ 95% of loans are performing in accordance with original terms ▪ 5% of loans paying in accordance with restructured terms ▪ ALLL / Energy - related loans = 3.4% Energy & Agricultural Loan Exposure ▪ Outstanding balance = $24.9 million, or 5.5% of loans ▪ Unfunded commitments = $9.4 million ▪ 100% of loans are performing ▪ ~ 90% Rice ▪ ~ 10% Sugarcane ▪ Collateral distribution ▪ Equipment/Working capital = 96% ▪ ~40% of balances are USDA guaranteed Home Bank Energy Exposure St. Martin Energy Exposure (1) St. Martin Ag Exposure (1) ▪ Outstanding balance = $30.4 million, or 6.7% of loans ▪ Unfunded commitments = $3.7 million ▪ Non accrual loans = $4.6 million, or 15% of energy loans ▪ Collateral distribution: ▪ CRE = 71% ▪ Equipment = 21% ▪ 1 - 4 Family Mortgage = 8% Pro Forma combined Energy portfolio = $64 million, or 3.8% of loans (1) Based on credit due diligence 20

Pro Forma Deposit Composition Int Bearing NMD 48% Non Interest 34% Retail CDs 15% Jumbo CDs 3% St. Martin Bank & Trust (1) Int Bearing NMD 54% Non Interest 23% Retail CDs 20% Jumbo CDs 3% Home Bank Int Bearing NMD 52% Non Interest 26% Retail CDs 19% Jumbo CDs 3% Pro Forma Total Deposits: $510 million Cost of Interest - bearing Deposits: 0.58% Total Deposits: $1.8 billion Total Deposits: $1.3 billion Cost of Interest - bearing Deposits: 0.44% (1) Source: S&P Global Intelligence; bank call report as of 6/30/2017 21

Combined Deposit Market Share (1) Bank 2016 Rank Deposits in Market ($000) Branches Deposit Market Share (%) Iberiabank 1 $2,891,414 19 26.6 JP Morgan Chase 2 1,360,147 18 12.5 Home Bank – Pro Forma 3 1,020,517 18 9.4 Capital One 4 737,200 9 6.8 MidSouth Bank 5 664,990 17 6.1 Whitney Bank 6 624,284 7 5.7 Lafayette, LA MSA (1) Reflects pro - forma market share of Home Bank and St. Martin Bank & Trust combined. Source : S&P Global Intelligence; deposit ranking data as of 6/30/2016 State of Louisiana ▪ Considerably enhances presence in Acadiana market ▪ Home Bank pre - acquisition m arket share = 6 th ▪ St. Martin pre - acquisition m arket share = 8 th Bank 2016 Rank Deposits in Market ($000) Branches Deposit Market Share (%) Capital One 1 $18,090,251 131 17.7 JP Morgan Chase 2 17,589,216 148 17.2 Whitney Bank 3 15,074,618 127 14.8 Regions 4 7,445,705 103 7.3 Iberiabank 5 6,866,575 78 6.7 Origin Bank 6 1,677,116 22 1.6 Home Bank – Pro Forma 7 1,594,149 3 6 1.5 ▪ Creates 3 rd largest bank headquartered in Louisiana by deposits and assets ▪ Significantly increases Home Bank’s Louisiana deposit market share (pre - acquisition market share = 12 th ) 22

Share Information – Home Bancorp, Inc. 3Q 2016 4Q 2016 1Q 2017 2Q 2017 12 Months Diluted EPS (GAAP) $0.61 $0.60 $0.69 $0.62 $2.52 Adjusted Diluted EPS (Non - GAAP) (1) $0.61 $0.60 $0.66 $0.66 $2.53 Ending Share Price $28.00 $38.61 $33.75 $42.52 Dividend Yield 1.4% 1.2% 1.5% 1.3% P/ BV 116% 158% 135% 167% P/TBV (2) 125% 170% 145% 178% Home Bancorp Price / Earnings Share price as of 8/30/2017 $40.34 Next 4 quarters average analyst earnings estimate (adjusted) $2.65 2018 average analyst earnings estimate (adjusted) $2.93 Forward P/E based on estimates (next 4 quarters) 15.3x Forward P/E based on estimates (2018) 13.8x (1) Excludes non core income and expense: see appendix (2) Non - GAAP ratio: see appendix 23
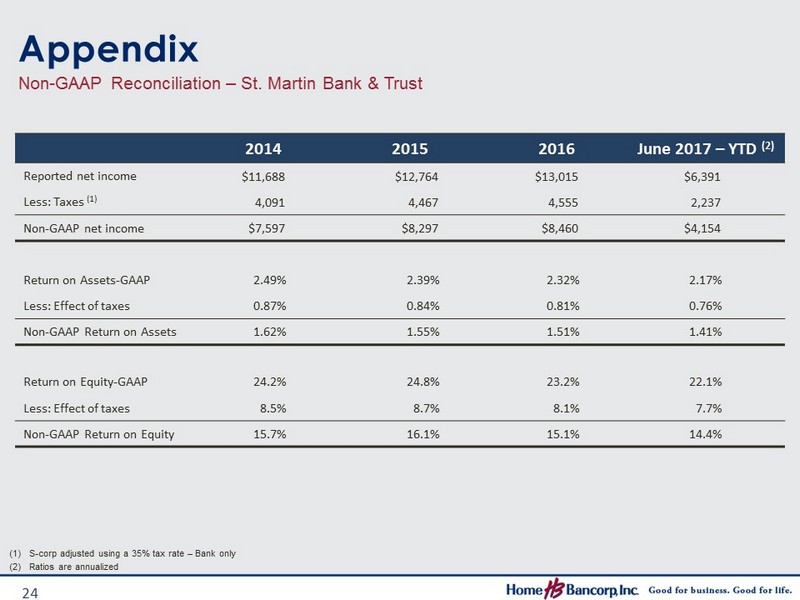
2014 2015 2016 June 2017 – YTD (2) Reported net income $11,688 $12,764 $13,015 $6,391 Less: Taxes (1) 4,091 4,467 4,555 2,237 Non - GAAP net income $7,597 $8,297 $8,460 $4,154 Return on Assets - GAAP 2.49% 2.39% 2.32% 2.17% Less: Effect of taxes 0.87% 0.84% 0.81% 0.76% Non - GAAP Return on Assets 1.62% 1.55% 1.51% 1.41% Return on Equity - GAAP 24.2% 24.8% 23.2% 22.1% Less: Effect of taxes 8.5% 8.7% 8.1% 7.7% Non - GAAP Return on Equity 15.7% 16.1% 15.1% 14.4% Appendix Non - GAAP Reconciliation – St. Martin Bank & Trust (1) S - corp adjusted using a 35% tax rate – Bank only (2) Ratios are annualized 24

Appendix Non - GAAP Reconciliation – Home Bancorp, Inc. (dollars in thousands) 2Q 2016 3Q 2016 4Q 2016 1Q 2017 2Q 2017 Total Shareholders' Equity $173,567 $177,362 $179,843 $184,720 $188,939 Less: Intangibles 13,524 12,956 12,762 12,577 12,403 Non - GAAP tangible shareholders' equity $160,043 $164,406 $167,081 $172,143 $176,536 Total Assets $1,545,049 $1,549,542 $1,556,732 $1,583,497 $1,574,181 Less: Intangibles 13,542 12,956 12,762 12,577 12,403 Non - GAAP tangible assets $1,531,507 $1,536,586 $1,543,970 $1,570,920 $1,561,778 Common Equity Ratio 11.2% 11.4% 11.6% 11.7% 12.0% Less: Intangibles 0.8% 0.7% 0.8% 0.7% 0.7% Non - GAAP tangible common equity ratio 10.5% 10.7% 10.8% 11.0% 11.3% Book Value Per Share $23.75 $24.22 $24.47 $25.05 $25.53 Less: Intangibles 1.85 1.77 1.74 1.70 1.68 Non - GAAP tangible book value per share $21.90 $22.45 $22.73 $23.35 $23.85 Reported net income $4,016 $4,360 $4,282 $5,006 $4,486 Add: Amortization CDI, net tax 130 127 126 121 113 Non - GAAP tangible shareholders' equity $4,146 $4,487 $4,408 $5,127 $4,599 Return on average equity 9.4% 9.9% 9.6% 10.9% 9.6% Add: Intangibles 1.2% 1.1% 1.0% 1.1% 0.9% Non - GAAP return on tangible common equity 10.6% 11.0% 10.6% 12.0% 10.5% (dollars in thousands) 2010 2011 2012 2013 2014 2015 2016 June 2017 YTD Reported non - interest expense $24,373 $31,002 $32,763 $33,205 $41,772 $42,022 $46,797 $22,082 Less: Merger - related expenses 1,000 2,053 0 307 2,286 1,411 856 - Non - GAAP non - interest expense $23,373 $28,949 $32,763 $32,898 $39,486 $40,611 $45,941 $22,082 25
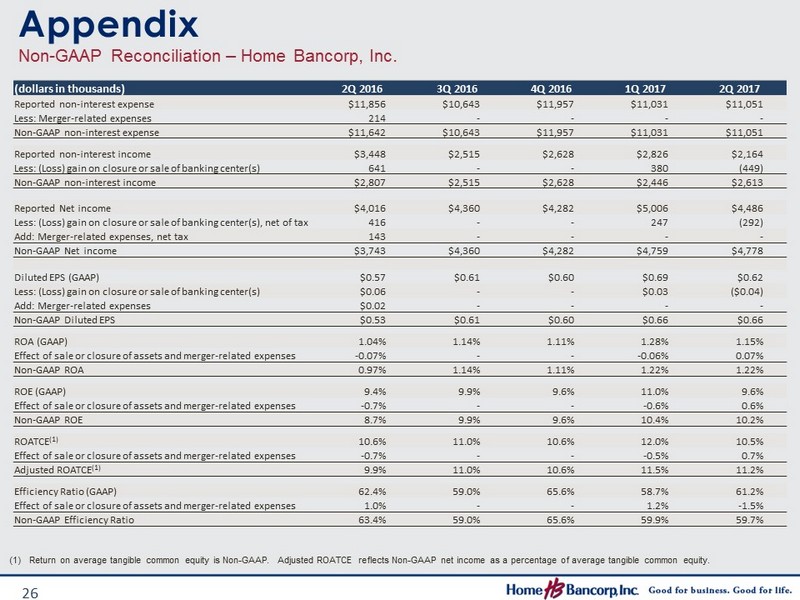
Appendix Non - GAAP Reconciliation – Home Bancorp, Inc. (dollars in thousands) 2Q 2016 3Q 2016 4Q 2016 1Q 2017 2Q 2017 Reported non - interest expense $11,856 $10,643 $11,957 $11,031 $11,051 Less: Merger - related expenses 214 - - - - Non - GAAP non - interest expense $11,642 $10,643 $11,957 $11,031 $11,051 Reported non - interest income $3,448 $2,515 $2,628 $2,826 $2,164 Less: (Loss) gain on closure or sale of banking center(s) 641 - - 380 (449) Non - GAAP non - interest income $2,807 $2,515 $2,628 $2,446 $2,613 Reported Net income $4,016 $4,360 $4,282 $5,006 $4,486 Less: (Loss) gain on closure or sale of banking center(s), net of tax 416 - - 247 (292) Add: Merger - related expenses, net tax 143 - - - - Non - GAAP Net income $3,743 $4,360 $4,282 $4,759 $4,778 Diluted EPS (GAAP) $0.57 $0.61 $0.60 $0.69 $0.62 Less: (Loss) gain on closure or sale of banking center(s) $0.06 - - $0.03 ($0.04) Add: Merger - related expenses $0.02 - - - - Non - GAAP Diluted EPS $0.53 $0.61 $0.60 $0.66 $0.66 ROA (GAAP) 1.04% 1.14% 1.11% 1.28% 1.15% Effect of sale or closure of assets and merger - related expenses - 0.07% - - - 0.06% 0.07% Non - GAAP ROA 0.97% 1.14% 1.11% 1.22% 1.22% ROE (GAAP) 9.4% 9.9% 9.6% 11.0% 9.6% Effect of sale or closure of assets and merger - related expenses - 0.7% - - - 0.6% 0.6% Non - GAAP ROE 8.7% 9.9% 9.6% 10.4% 10.2% ROATCE (1) 10.6% 11.0% 10.6% 12.0% 10.5% Effect of sale or closure of assets and merger - related expenses - 0.7% - - - 0.5% 0.7% Adjusted ROATCE (1) 9.9% 11.0% 10.6% 11.5% 11.2% Efficiency Ratio (GAAP) 62.4% 59.0% 65.6% 58.7% 61.2% Effect of sale or closure of assets and merger - related expenses 1.0% - - 1.2% - 1.5% Non - GAAP Efficiency Ratio 63.4% 59.0% 65.6% 59.9% 59.7% 26 (1) Return on average tangible common equity is Non - GAAP. Adjusted ROATCE reflects Non - GAAP net income as a percentage of average t angible common equity.
