Attached files
| file | filename |
|---|---|
| EX-99.2 - EXHIBIT 99.2 - BAY BANKS OF VIRGINIA INC | v474499_ex99-2.htm |
| EX-10.1 - EXHIBIT 10.1 - BAY BANKS OF VIRGINIA INC | v474499_ex10-1.htm |
| 8-K - 8-K - BAY BANKS OF VIRGINIA INC | v474499_8k.htm |
Exhibit 99.1
Investor Presentation August 2017

2 This presentation is confidential and has been prepared for use only in connection with the private placement (the “Placement”) of securities (the “Securities”) of Bay Banks of Virginia, Inc . (the “Company”) . The Securities have not been registered under the Securities Act of 1933 , as amended (the “Securities Act”), and will be offered and sold only to “accredited investors” in a private placement exempt from the registration requirements of the Securities Act pursuant to Section 4 (a)( 2 ) thereof and Rule 506 (b) thereunder and applicable state securities laws . The Securities are subject to restrictions on transferability and may not be re - offered or re - sold absent registration or an applicable exemption from such registration requirements . The Securities are not a deposit or an account that is insured by the Federal Deposit Insurance Corporation (“FDIC”) or any other government agency . This presentation is for informational purposes only and is being furnished solely for the purpose of enabling prospective investors to determine whether they wish to proceed with further investigation of the Company and the Placement . The information contained herein is a summary and is not intended to and does not contain all the information that you should consider in making an investment decision . The Company makes no express or implied representations or warranties as to the completeness of the information contained herein . The Company shall not have any liability for any information included herein or otherwise made available in connection with the Placement, except as may be provided in a securities purchase agreement or other definitive written agreement executed in connection with the purchase of Securities . The information contained herein speaks as of the date hereof . Neither the delivery of this presentation or any eventual sale of the Securities shall, under any circumstances, imply that the information contained herein is correct as of any future date or that there has been no change in the Company’s business affairs described herein after the date hereof . Nothing contained herein is, or should be relied upon as, a promise or representation as to future performance . Neither the Company nor any of its affiliates undertakes any obligation to update or revise this presentation . The Company will provide you with the opportunity to ask questions, receive answers, obtain additional information and complete your own due diligence review concerning the Company and the Placement prior to entering into a securities purchase agreement . By accepting delivery of the information contained herein, you agree to undertake and rely on your own independent investigation and analysis and consult with your own attorneys, accountants, and other professional advisors regarding the Company and the merits and risks of an investment in the Securities, including all related legal, investment, tax, and other matters . This presentation is not an offer to sell or a solicitation of an offer to purchase the Securities described herein, which offers and solicitations shall be made only by means of a securities purchase agreement, nor shall there be any sale of such Securities in any state or jurisdiction in which such an offer or solicitation is not permitted or would be unlawful . Each investor must comply with all legal requirements in each jurisdiction in which it purchases, offers, or sells the Securities, and must obtain any consent, approval, or permission required by it in connection with the Securities or the Placement . The Company does not make any representation or warranty regarding, and has no responsibility for, the legality of an investment in the Securities under any investment, securities, or similar laws . THE SECURITIES HAVE NOT BEEN APPROVED OR DISAPPROVED BY THE SECURITIES AND EXCHANGE COMMISSION (“SEC”), THE FDIC, OR ANY OTHER GOVERNMENT AGENCY, NOR HAS THE SEC, THE FDIC, OR ANY OTHER GOVERNMENT AGENCY PASSED ON THE ADEQUACY OR ACCURACY OF THIS PRESENTATION . ANY REPRESENTATION TO THE CONTRARY IS UNLAWFUL . Securities Disclaimers

3 The information contained herein is confidential and proprietary to the Company and its subsidiaries . By accepting delivery of this information, each recipient acknowledges and agrees to the following : • The information contained herein will be used by the recipient solely for the purpose of deciding whether to proceed with a further investigation of the Company and its subsidiaries ; • This information will be kept in strict confidence and will not, whether in whole or in part, be released or discussed by the recipient, nor will any reproductions of such information be made, for any other purpose other than an analysis of the merits of an eventual investment in the Company by its intended recipient ; and • Upon written request of the Company, this information, any other documents or information furnished and any and all reproductions thereof and notes relating thereto will be promptly returned to the Company . Confidentiality and Recipient’s Undertakings

4 This presentation contains forward - looking statements (within the meaning of the Private Securities Litigation Reform Act of 1995 ) . Such statements are not historical facts, but rather are based on our current expectations, estimates and projections about our industry, our beliefs and assumptions . These include statements about the Company’s future economic performance, financial condition, prospects, growth, strategies and expectations, objectives of management, and merger synergies and cost savings, and are generally identified by the use of words such as “may,” “will,” “could,” “would,” “should,” “anticipate,” “expect,” “intend,” “plan,” “project,” “believe,” “seek,” “estimate” and similar expressions . These statements are not guarantees of future performance and are subject to certain risks, uncertainties and other factors, some of which remain beyond our control, are difficult to predict, and could cause actual results to differ materially from those expressed or forecasted in the forward - looking statements . Factors that could cause actual results to differ materially from the results anticipated may include, but are not limited to, disruptions to customer and employee relationships and business operations caused by the merger ; the ability to implement integration plans associated with the merger, which may be more difficult, time - consuming or costly than expected ; the ability to achieve the cost savings and synergies contemplated by the merger within the expected timeframe, or at all ; changes in interest rates, general economic and business conditions ; the legislative/regulatory climate ; monetary and fiscal policies of the U . S . Government, including policies of the U . S . Treasury and the Board of Governors of the Federal Reserve System ; the quality or composition of the Company’s loan or investment portfolios ; demand for loan products ; deposit flows ; competitive pressures among depository and other financial institutions ; the ability to successfully and profitably implement growth or expansion activities ; demand for financial services in the Company’s market area ; implementation of new technologies and the ability to develop and maintain secure and reliable electronic systems ; changes in accounting principles, policies and guidelines ; and the other factors detailed in the Company’s publicly filed documents from time to time . We caution you not to place undue reliance on these forward - looking statements, which reflect management’s view only as of the date of this presentation . We are not obligated to update these statements or publicly release the result of any revisions to them to reflect events or circumstances after the date of this presentation or to reflect the occurrence of unanticipated events . Caution Regarding Forward Looking Statements

5 SECTION DESCRIPTION I. Executive Summary II. Recent Highlights III. Financial Performance IV. Pro Forma Impact Table of Contents
6 I. Executive Summary

7 Issuer: Bay Banks of Virginia, Inc. Ticker: OTCQB: BAYK Offering Type: Private placement Security Type: Common stock Offering Amount : $35.0 million Price: $9.25 per share Use of Proceeds: General corporate purposes, including organic growth and potential acquisitions Closing Date: August 2017 Distribution: Institutional & accredited investors Placement Agent: FIG Partners, LLC Offering Summary

8 Investment Highlights x Emerging presence and the 3 rd largest community bank headquartered in one of Virginia’s most attractive markets: Richmond x Attractive entry point on both a tangible book value and earnings basis compared to peers x Growth story with improving performance x Management team is on target to achieve anticipated cost save synergies and has significantly outperformed budget on one - time merger costs x Deep, talented leadership team with the ability to take the Company to the next level x Offering is an opportunity to broaden the investor base and increase sponsorship x Greater market capitalization and potential for improved trading liquidity post - offering

9 □ Balance Sheet ( 06/30/17): ▪ Assets – $867.4 million ▪ Net l oans – $701.3 million ▪ Deposits – $689.0 million ▪ Tangible c ommon e quity – $ 74.2 million □ Profitability ( 6/30/17 YTD): ▪ Net income – $380 thousand ▪ Core ROAA 1 – 0.35% ▪ Net i nterest m argin – 3.68% ▪ Efficiency r atio – 79.56% ▪ Net income has been negatively affected due to one time expenses – merger costs, provisioning for combined loan portfolio & new hires in the Richmond market □ Capital (6/30/2017): ▪ Tang. common equity / tang. assets – 8.66% ▪ Bank leverage r atio – 9.48% ▪ Bank total r isk b ased c apital – 13.79% □ H eadquartered in Richmond, the Company has 19 branches in the Eastern Virginia r egion after the recent merger of Bank of Lancaster and Virginia Commonwealth Bank www.vacommbank.com Company Overview 1 Excludes nonrecurring items and amortization of intangible assets Source : SNL Financial, Company documents

10 Randal R. “Randy” Greene – Vice Chairman, President & Chief Executive Officer Mr. Greene is the President and CEO of Bay Banks of Virginia. He serves on the Boards of Bay Banks, Virginia Commonwealth Bank and Bay Trust Company. He joined the family of companies in the fall of 2011. Randy received his Bachelor of Business Administration from East Tennessee State University in 1982 and began his banking career in 1984. Prior to joining Bay Banks, Randy most recently was a Regional President of State of Franklin Bank, a division of Jefferson Federal Bank in Johnson City, Tennessee. From 1996 to 2008, he was President and CEO, Director and Founder of State of Franklin Savings Bank and Chairman of its Executive Committee. Randy has substantial knowledge of successfully growing a community bank with experience in all areas of banking, including managing multiple teams, as a senior credit officer with years of direct experi enc e working with regulatory agencies, 25 years of lending experience, and has been directly responsible for managing the asset quality of a $350 million community bank. He was awarded 2015 Outstanding Alumni for the college of business at Eastern Tennessee State University. C. Frank Scott, III – Chairman of the Board, Chairman of VCB Financial Group & President of Virginia Commonwealth Bank Mr. Scott is currently the Chairman of the Board, Chairman of VCB Financial Group and President of Virginia Commonwealth Bank. Before the merger, he was the Chief Executive Officer of Virginia Commonwealth Bank and served on the Board since 1987. He worked at Virginia Commonwealth Bank since 1999, before becoming CEO in 2011. He is the past President of the Petersburg Lions Club, the Southside Virginia Association of Realtors, and the Tri Cities Independent Insurance Agent’s Association. He is currently a Member of the Board of the Appomattox Educational Foundation, the Prince George Alliance for Education Association, and the Richard Bland College Foundation. He is a Member of Redeemer Lutheran Church in Midlothian, and currently serves as a Member of the Board and as Treasurer. He received his BS degree in Finance from Virginia Tech in 1974 and his MA from the Charles F. Dolan School of Business at Fairfield University in Fairfield Connecticut in 2003 . James A . “Jim” Wilson Jr . , Chief Financial Officer James A. Wilson, Jr . serves as Executive Vice President and Chief Financial Officer of Bay Banks of Virginia and Virginia Commonwealth Bank. Prior to the merger, he served as Executive Vice President, Treasurer and Chief Financial Officer of Virginia Commonwealth Bank and as Treasurer/Vice President of Virginia BanCorp . Mr. Wilson joined Virginia Commonwealth Bank in August 1989 as Treasurer/Controller and was soon thereafter promoted to Senior Vice President/Chief Financial Officer. In 2012, he was promoted to Executive Vice President/Chief Financial Officer of Virginia Commonwealth Bank . Mr. Wilson is a Certified Public Accountant, CFA® charterholder and Chartered Global Management Accountant. Leadership

11 Douglas F. Jenkins, Jr . – Chief Banking Officer Mr . Jenkins serves as Executive Vice President and Chief Banking Officer of Virginia Commonwealth Bank and Bay Banks of Virginia. Prior to the merger, he was Executive Vice President and Chief Banking Officer of Bank of Lancaster. Mr. Jenkins served as Senior Vice President of Bank of Lancaster from December 2009 until December 2011 and served as Senior Lending Officer from May 2008 until April 2013. From June 2011 until April 2013, he served as Retail Delivery Administrator. Prior to joining Bank of Lancaster in 2006 as a Vice President and Business Development Officer, Mr. Jenkins was a Vice President at SunTrust Bank, where he was a member of its Financial Institutions Group . C . Rodes “Dusty” Boyd, Jr . – Chief Lending Officer Mr. Boyd has served as Executive Vice President and Chief Banking Officer of Virginia Commonwealth Bank since July 2012. Mr. Boyd joined Virginia Commonwealth Bank in April 2011 as Executive Vice President and Chief Credit Officer, a role he served in until July 2012. Prior to joining Virginia Commonwealth Bank, Mr. Boyd was a Vice President in Commercial Banking with The Bank of Richmond and Gateway Bank from 2002 until 2009, and was the Richmond Market President for the Bank of Hampton Roads from March 2009 through December 2010. Mr. Boyd is currently serving a two year term as Chairman of the Lending Executive Committee for the Virginia Banker’s Association. Gary Armstrong – Richmond Market Executive Mr. Armstrong, a 31 - year commercial banking veteran, was hired in January as Richmond Market Executive. Mr. Armstrong most recently served as Park Sterling Bank’s Richmond Market President, a position that immediately followed the acquisition of First Capital Bank in January 2016. At First Capital Bank, he was Executive Vice President and Chief Lending Officer. Prior to that, he spent 11 years with and was a founding management member of Richmond - based First Market Bank, where he managed the Commercial Banking Group. Eric F . Nost – President & Chief Executive Officer of VCB Financial Group Mr. Nost, a financial services executive with over 30 years experience, has joined Bay Banks to lead its new wealth management subsidiary, VCB Financial Group, as President and CEO. He most recently managed a bank - owned investment firm, C&F Wealth Management Corp., building it to over $400 million in assets under management. A U.S. Navy veteran, Mr. Nost is a graduate of Virginia Military Institute, earned an MBA degree from Liberty University, and is a Certified Financial Planner. Leadership
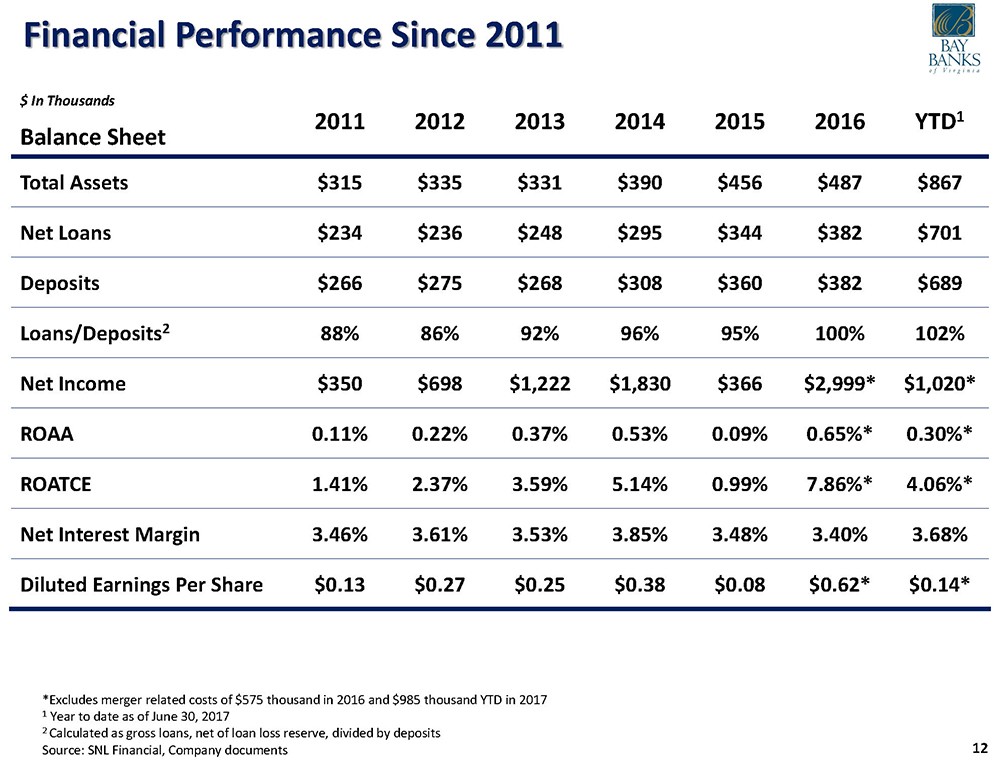
12 Financial Performance Since 2011 *Excludes merger related costs of $575 thousand in 2016 and $985 thousand YTD in 2017 1 Year to date as of June 30, 2017 2 Calculated as gross loans, net of loan loss reserve, divided by deposits Source : SNL Financial, Company documents $ In Thousands 2011 2012 2013 2014 2015 2016 YTD 1 Balance Sheet Total Assets $315 $335 $331 $390 $456 $487 $867 Net Loans $234 $236 $248 $295 $344 $382 $701 Deposits $266 $275 $268 $308 $360 $382 $689 Loans/Deposits 2 88% 86% 92% 96% 95% 100% 102% Net Income $350 $698 $1,222 $1,830 $366 $2,999* $1,020* ROAA 0.11% 0.22% 0.37% 0.53% 0.09% 0.65%* 0.30%* ROATCE 1.41% 2.37% 3.59% 5.14% 0.99% 7.86%* 4.06%* Net Interest Margin 3.46% 3.61% 3.53% 3.85% 3.48% 3.40% 3.68% Diluted Earnings Per Share $0.13 $0.27 $0.25 $0.38 $0.08 $0.62* $0.14*

13 □ Grow organically to $1.0 billion in assets by the first quarter of 2018 □ Reach 1.00% ROAA during 2019 □ Achieve double digit loan growth, return on equity and EPS growth by capitalizing on the significant opportunities in the Richmond market □ Become the community bank of choice in Richmond by attracting top talent and leveraging the ability to serve larger customers □ Outperform anticipated cost saving estimates and manage merger expenses by regularly monitoring and tracking progress □ Increase the contribution of the wealth management subsidiary, VCB Financial Group, to 25% of the Company’s total noninterest income by 2020 □ Continue to provide customers with personalized service while using the additional resources to offer enhanced products and solutions to meet their banking needs Corporate Goals

14 II. Recent Highlights

15 1 At close 2 At close; includes $6.2 million of goodwill and $3.7 million core deposit intangible Source : SNL Financial and internal Company documents Transaction Value 1 : $43.2 million Consideration: 100% Stock Exchange Ratio: 1.178 Cost Saves: 14% of combined expenses Intangibles Created 2 : $9.8 million Closing Date: April 1, 2017 Board Seats: Equal representation Earnings Accretion: ~20% per year VCB Locations BAYK Locations In $000s 12/31/14 12/31/15 12/31/16 03/31/17 Balance Sheet Total Assets $282,147 $325,783 $318,977 $326,719 Total Loans $183,312 $247,375 $266,609 $274,831 Total Deposits $219,097 $237,926 $257,888 $266,103 Profitability Measures Net Interest Margin 3.48% 3.31% 3.40% 3.46% ROAA 2.04% 0.70% 0.56% 0.56% ROAE 19.18% 6.25% 5.26% 5.10% Net Income $5,186 $2,066 $1,834 $448 Asset Quality NPAs/Assets 2.32% 2.01% 1.75% 1.79% NPAs (excl TDRs)/Assets 1.97% 1.75% 1.27% 1.29% Quarter EndedTwelve Months Ended Merger With Virginia Commonwealth Bank Transaction Terms Legacy VCB Financial Profile Pro Forma Map 100% of projected cost savings will be realized in 2018

16 ▪ Complementary footprints have created a more diversified franchise ▪ Combination of Bay Bank’s loan generation capacity with Virginia Commonwealth’s attractive funding base ▪ Footprint provides significant growth opportunities ▪ Meaningful cost savings and revenue synergies expected ▪ 20%+ EPS accretion for both companies (with full cost savings realized) ▪ Shareholders should benefit from a larger market cap, greater liquidity, and a higher stock valuation ▪ Ability to pay and increase cash dividends going forward ▪ Gaining critical mass – over $850 million in assets ▪ Creates one of the largest community banks headquartered in Richmond ▪ Increased lending limit will help better serve customers ▪ Positioned for additional M&A opportunities as the acquirer of choice in the Richmond market ▪ Attractive franchise in a robust market Complementary Markets Significant Financial Impact Well - Positioned Franchise Strategic Rationale

17 ▪ Reallocation of resources to focus on the Company’s fastest growing market ▪ More visible presence in the community ▪ Greater ability to attract talented bankers ▪ 10 locations with $356 million deposits in the Richmond MSA as of June 30, 2017 Market Information Source : SNL Financial, regional chamber of commerce Relocation of Headquarters to Richmond 13.0% 5.5% 3.9% 0.0% 3.0% 6.0% 9.0% 12.0% 15.0% Proj. HHI Growth (2016-2022) Proj. Population Growth (2016-2022) Unemployment Rate Strategic Rationale ▪ The capitol of Virginia and one of America’s oldest cities is a diverse economic hub along the James River ▪ Population: 1.3 million ▪ 8 Fortune 500 companies and over 46,000 businesses ▪ Contains over 125,000 households with an annual income greater than $100,000 ▪ Home to many institutions of higher education including University of Richmond and Virginia Commonwealth University Richmond MSA

18 Gary Armstrong , a 31 - year commercial banking veteran, was hired in January as Richmond Market Executive. Mr. Armstrong most recently served as Park Sterling Bank’s Richmond Market President, a position that immediately followed the acquisition of First Capital Bank in January 2016. At First Capital Bank, he was Executive Vice President and Chief Lending Officer. Prior to that, he spent 11 years with and was a founding management member of Richmond - based First Market Bank, where he managed the Commercial Banking Group. Since joining the team, Mr. Armstrong has filled out his team with a number of talented individuals. He and his team have more than 110 years of combined banking experience and have managed combined loan books in excess of $450 million. ▪ Matt Paciocco - hired as Senior Vice President, Commercial Banking and brings more than 12 years of banking experience in the Richmond area ▪ Del Ward - joined as Senior Vice President, Commercial Banking and brings more than 29 years of banking experience in the Richmond area ▪ Bill Bien - hired as Senior Vice President, Commercial Banking and brings more than 35 years of banking experience in the Richmond area ▪ Additionally, t he Company has hired a Residential Construction Lender and Treasury Management Specialist in the Richmond market Recent Richmond Growth Recent additions to the team position the Company to be a dominant community bank player in the Richmond market
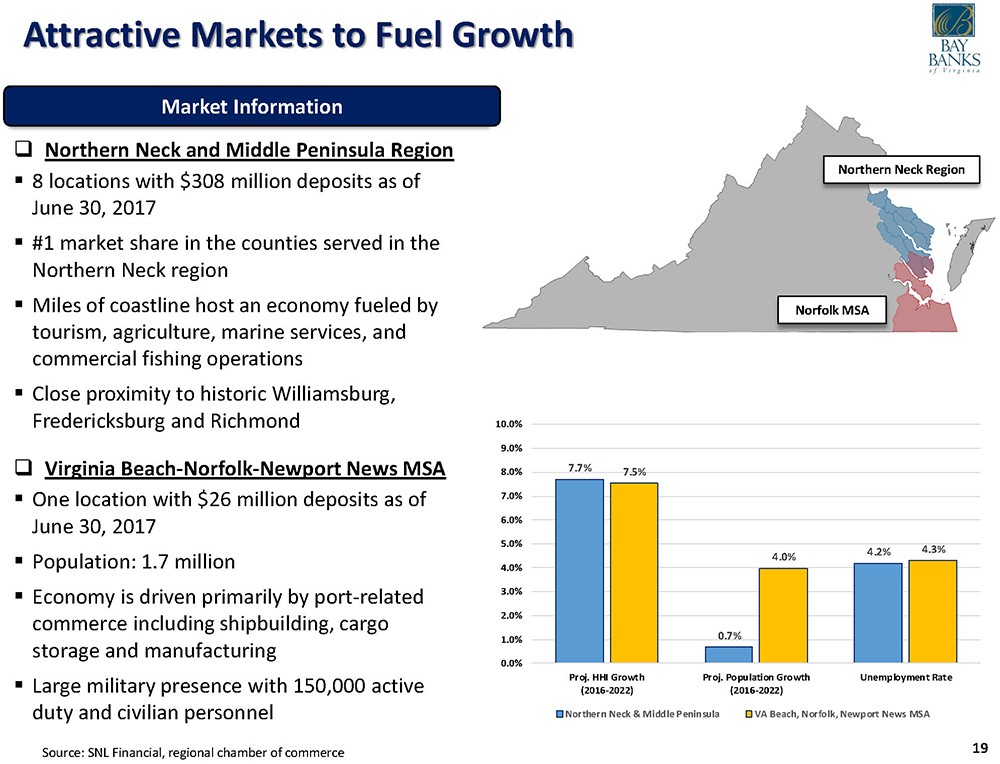
19 Northern Neck Region Norfolk MSA □ Northern Neck and Middle Peninsula Region ▪ 8 locations with $ 308 million deposits as of June 30, 2017 ▪ # 1 market share in the counties served in the Northern Neck region ▪ Miles of coastline host an economy fueled by tourism, agriculture , marine services, and commercial fishing operations ▪ Close proximity to historic Williamsburg, Fredericksburg and Richmond □ Virginia Beach - Norfolk - Newport News MSA ▪ One location with $26 million deposits as of June 30, 2017 ▪ Population: 1.7 million ▪ Economy is driven primarily by port - related commerce including shipbuilding, cargo storage and manufacturing ▪ Large military presence with 150,000 active duty and civilian personnel Market Information Source : SNL Financial, regional chamber of commerce Attractive Markets to Fuel Growth 7.7% 0.7% 4.2% 7.5% 4.0% 4.3% 0.0% 1.0% 2.0% 3.0% 4.0% 5.0% 6.0% 7.0% 8.0% 9.0% 10.0% Proj. HHI Growth (2016-2022) Proj. Population Growth (2016-2022) Unemployment Rate Northern Neck & Middle Peninsula VA Beach, Norfolk, Newport News MSA
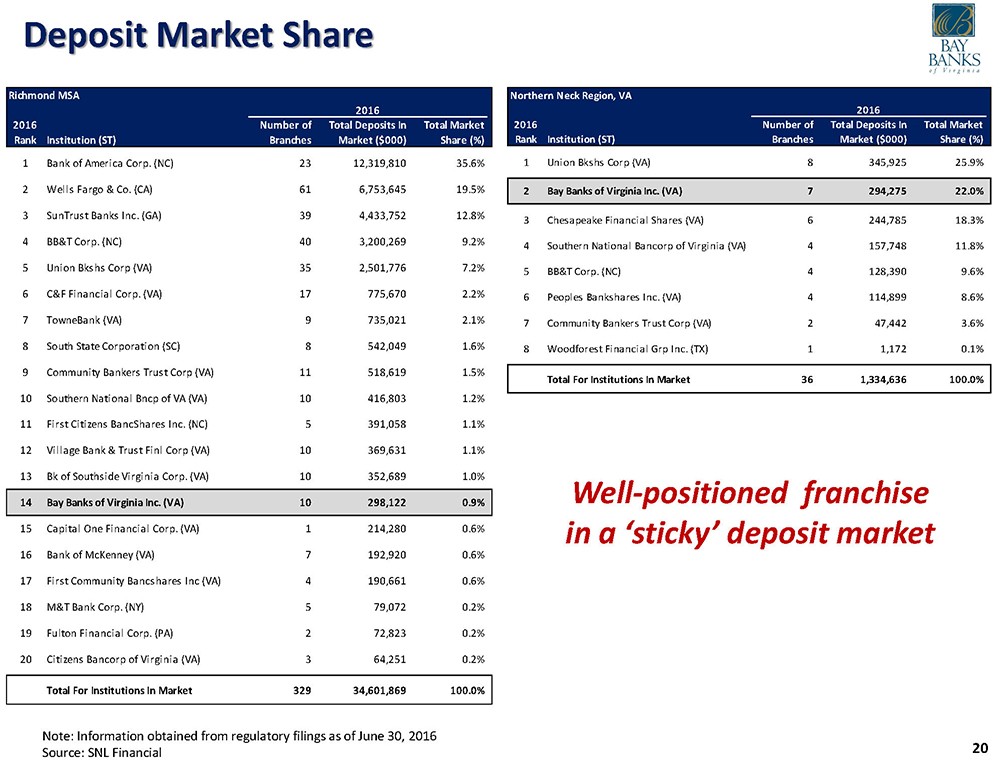
20 Northern Neck Region, VA Number of Branches Total Deposits In Market ($000) Total Market Share (%) 1 Union Bkshs Corp (VA) 8 345,925 25.9% 2 Bay Banks of Virginia Inc. (VA) 7 294,275 22.0% 3 Chesapeake Financial Shares (VA) 6 244,785 18.3% 4 Southern National Bancorp of Virginia (VA) 4 157,748 11.8% 5 BB&T Corp. (NC) 4 128,390 9.6% 6 Peoples Bankshares Inc. (VA) 4 114,899 8.6% 7 Community Bankers Trust Corp (VA) 2 47,442 3.6% 8 Woodforest Financial Grp Inc. (TX) 1 1,172 0.1% Total For Institutions In Market 36 1,334,636 100.0% 2016 Rank Institution (ST) 2016 Note: Information obtained from regulatory filings as of June 30, 2016 Source: SNL Financial Richmond MSA Number of Branches Total Deposits In Market ($000) Total Market Share (%) 1 Bank of America Corp. (NC) 23 12,319,810 35.6% 2 Wells Fargo & Co. (CA) 61 6,753,645 19.5% 3 SunTrust Banks Inc. (GA) 39 4,433,752 12.8% 4 BB&T Corp. (NC) 40 3,200,269 9.2% 5 Union Bkshs Corp (VA) 35 2,501,776 7.2% 6 C&F Financial Corp. (VA) 17 775,670 2.2% 7 TowneBank (VA) 9 735,021 2.1% 8 South State Corporation (SC) 8 542,049 1.6% 9 Community Bankers Trust Corp (VA) 11 518,619 1.5% 10 Southern National Bncp of VA (VA) 10 416,803 1.2% 11 First Citizens BancShares Inc. (NC) 5 391,058 1.1% 12 Village Bank & Trust Finl Corp (VA) 10 369,631 1.1% 13 Bk of Southside Virginia Corp. (VA) 10 352,689 1.0% 14 Bay Banks of Virginia Inc. (VA) 10 298,122 0.9% 15 Capital One Financial Corp. (VA) 1 214,280 0.6% 16 Bank of McKenney (VA) 7 192,920 0.6% 17 First Community Bancshares Inc (VA) 4 190,661 0.6% 18 M&T Bank Corp. (NY) 5 79,072 0.2% 19 Fulton Financial Corp. (PA) 2 72,823 0.2% 20 Citizens Bancorp of Virginia (VA) 3 64,251 0.2% Total For Institutions In Market 329 34,601,869 100.0% 2016 Rank Institution (ST) 2016 Deposit Market Share Well - positioned franchise in a ‘sticky’ deposit market

21 Eric F. Nost , a financial services executive with over 30 years experience, has joined Bay Banks to lead its new wealth management subsidiary, VCB Financial Group, as President and CEO. Nost most recently managed a bank - owned investment firm, C&F Wealth Management Corp., building it to over $400 million in assets under management. A U.S. Navy veteran, Nost is a graduate of Virginia Military Institute, earned an MBA degree from Liberty University, and is a Certified Financial Planner. Since joining the Company, Mr. Nost has added three noteworthy individuals to the existing wealth management team: ▪ Angela Brown, JD – Certified Financial Planner hired as a Trust Officer for VCB Financial Group that brings more than 24 years of wealth management experience ▪ Randy Reynolds, Jr. - added as a member of VCB Financial Group board of directors; he is principal of Reynolds Development, a full - service commercial real estate company specializing in commercial real estate and property management ▪ Pam Comstock – added as a member of VCB Financial Group board of directors; she was previously on the board of Bay Trust, the wealth management division of Bank of Lancaster, and is the Chair of the Cameron Foundation in Virginia Wealth Management Initiative Bay Banks recently undertook an initiative to ramp up its wealth management business to complement its other business lines
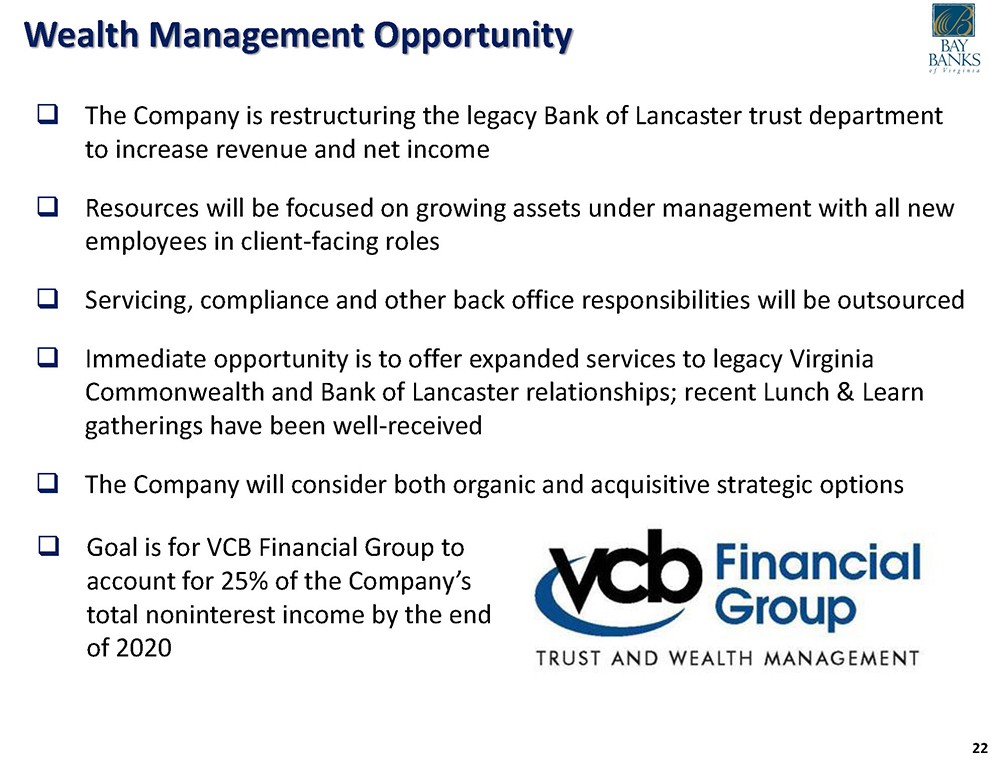
22 Wealth Management Opportunity □ The Company is restructuring the legacy Bank of Lancaster trust department to increase revenue and net income □ Resources will be focused on growing assets under management with all new employees in client - facing roles □ Servicing, compliance and other back office responsibilities will be outsourced □ Immediate opportunity is to offer expanded services to legacy Virginia Commonwealth and Bank of Lancaster relationships; recent Lunch & Learn gatherings have been well - received □ The Company will consider both organic and acquisitive strategic options □ Goal is for VCB Financial Group to account for 25% of the Company’s total noninterest income by the end of 2020

23 III. Financial Information
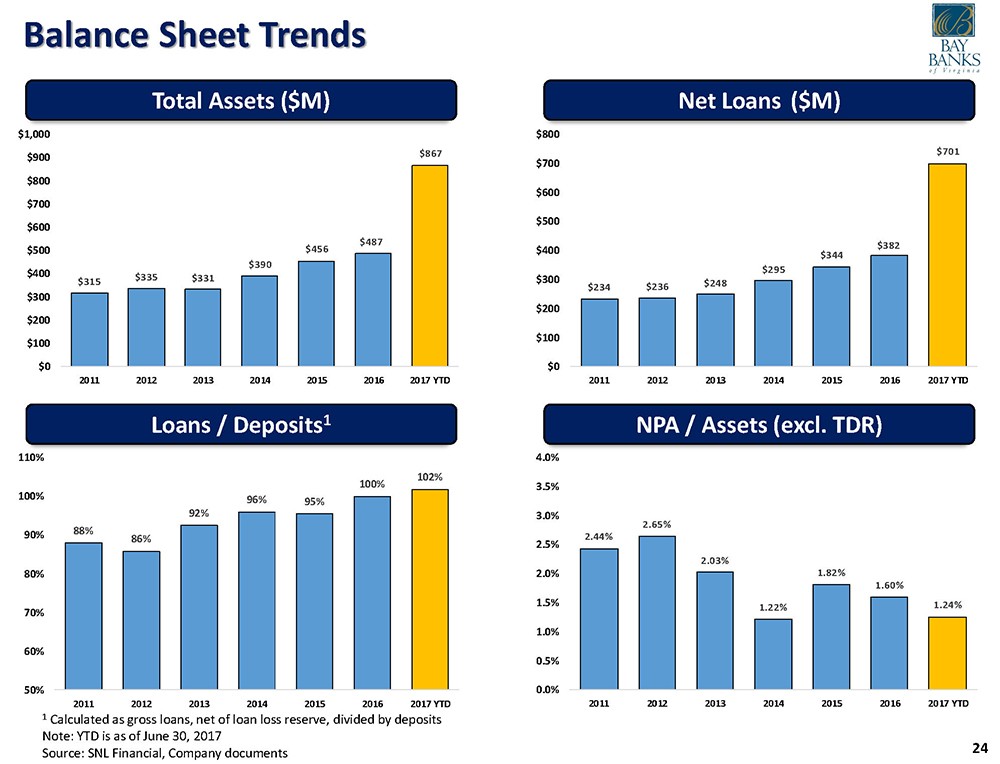
24 Balance Sheet Trends $315 $335 $331 $390 $456 $487 $867 $0 $100 $200 $300 $400 $500 $600 $700 $800 $900 $1,000 2011 2012 2013 2014 2015 2016 2017 YTD $234 $236 $248 $295 $344 $382 $701 $0 $100 $200 $300 $400 $500 $600 $700 $800 2011 2012 2013 2014 2015 2016 2017 YTD 88% 86% 92% 96% 95% 100% 102% 50% 60% 70% 80% 90% 100% 110% 2011 2012 2013 2014 2015 2016 2017 YTD 2.44% 2.65% 2.03% 1.22% 1.82% 1.60% 1.24% 0.0% 0.5% 1.0% 1.5% 2.0% 2.5% 3.0% 3.5% 4.0% 2011 2012 2013 2014 2015 2016 2017 YTD Net Loans ($M) Total Assets ($M) Loans / Deposits 1 NPA / Assets (excl. TDR) 1 Calculated as gross loans, net of loan loss reserve, divided by deposits Note: YTD is as of June 30, 2017 Source : SNL Financial, Company documents

25 Performance Trends 0.11% 0.22% 0.37% 0.53% 0.09% 0.55% 0.11% 0.00% 0.10% 0.20% 0.30% 0.40% 0.50% 0.60% 0.70% 0.80% 2011 2012 2013 2014 2015 2016 2017 YTD Annualized $350 $698 $1,222 $1,830 $366 $2,535 $760 $0 $500 $1,000 $1,500 $2,000 $2,500 $3,000 2011 2012 2013 2014 2015 2016 2017 YTD Annualized 89.0% 81.7% 80.6% 77.9% 86.0% 77.4% 79.6% 40.0% 50.0% 60.0% 70.0% 80.0% 90.0% 100.0% 2011 2012 2013 2014 2015 2016 2017 YTD Annualized 1.3% 2.2% 3.3% 4.8% 0.9% 6.2% 1.2% 0.0% 1.0% 2.0% 3.0% 4.0% 5.0% 6.0% 7.0% 8.0% 9.0% 10.0% 2011 2012 2013 2014 2015 2016 2017 YTD Annualized Efficiency Ratio Net Income ($000) ROAA ROAE Note: YTD as of June 30, 2017; includes merger related expenses of $985 thousand Source : SNL Financial, Company documents

26 Note: Bank regulatory data as of June 30, 2017 Source: SNL Financial Loan Portfolio Loan Mix Portfolio Details □ Real estate exposure accounts for approximately 82% of the portfolio □ 1 - 4 Family is the largest category at 38.1%, but that is expected to decline as Richmond’s economy presents a wider range of lending opportunities □ CRE concentration, excluding Owner - Occupied, is 230% of total risk based capital and C&D concentration is below 70% of total risk based capital C&D 8.2% 1 - 4 Fam 38.1% HELOC 5.8% OwnOcc CRE 10.5% Other CRE 16.8% Multifam 2.4% C&I 11.0% Consr & Other 7.2% ($000s) 2012 2013 2014 2015 2016 2017Q1 2017Q2 C&D $29,025 $31,838 $43,048 $42,129 $39,818 $44,119 $57,899 Agriculture 2,253 1,959 2,088 1,367 1,046 1,016 987 HELOC 16,981 16,003 18,542 20,343 20,421 20,517 41,179 1-4 Family 117,557 123,202 142,518 171,153 200,665 212,088 268,737 Multifamily 4,112 3,254 3,916 6,525 4,415 4,386 16,854 Owner-Occupied CRE 33,634 34,177 33,326 43,956 41,825 42,550 73,981 Non-Owner Occ. CRE 9,308 11,372 16,618 22,561 30,928 31,078 118,777 C&I 14,379 16,298 23,851 24,199 37,034 37,660 77,568 Consumer & other 11,989 12,929 14,540 15,583 9,524 11,847 49,582 Total Gross Loans $239,238 $251,032 $298,447 $347,816 $385,676 $405,261 $705,562 Regulatory Data
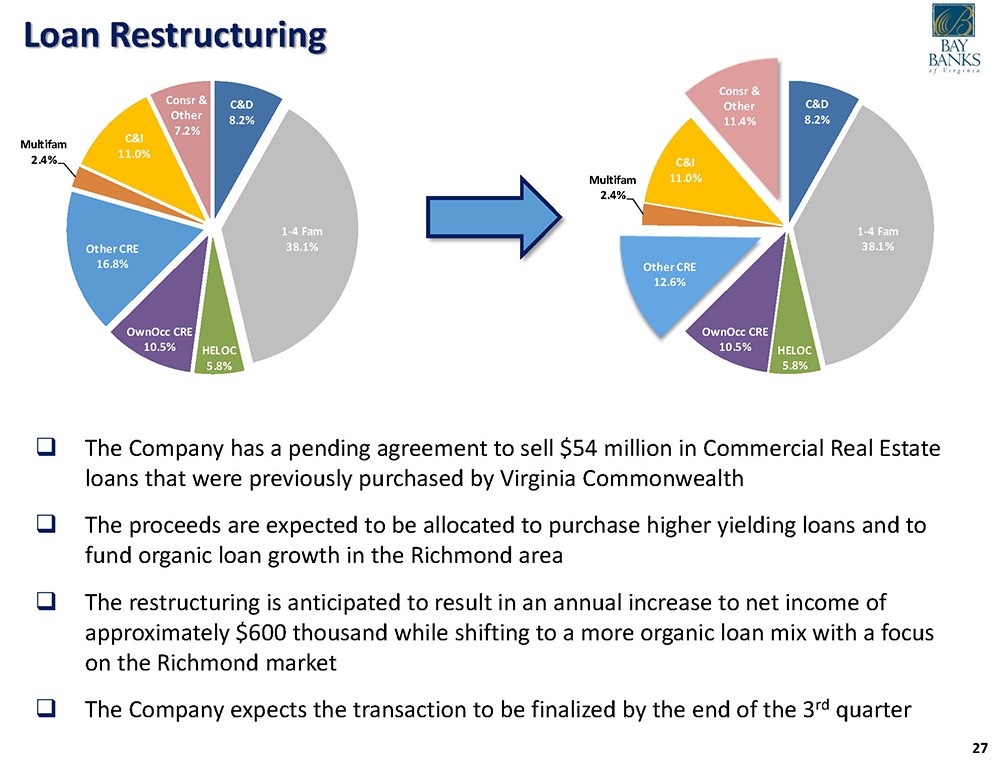
27 Loan Restructuring □ The Company has a pending agreement to sell $54 million in Commercial Real Estate loans that were previously purchased by Virginia Commonwealth □ The proceeds are expected to be allocated to purchase higher yielding loans and to fund organic loan growth in the Richmond area □ The restructuring is anticipated to result in an annual increase to net income of approximately $600 thousand while shifting to a more organic loan mix with a focus on the Richmond market □ The Company expects the transaction to be finalized by the end of the 3 rd quarter C&D 8.2% 1 - 4 Fam 38.1% HELOC 5.8% OwnOcc CRE 10.5% Other CRE 16.8% Multifam 2.4% C&I 11.0% Consr & Other 7.2% C&D 8.2% 1 - 4 Fam 38.1% HELOC 5.8% OwnOcc CRE 10.5% Other CRE 12.6% Multifam 2.4% C&I 11.0% Consr & Other 11.4%
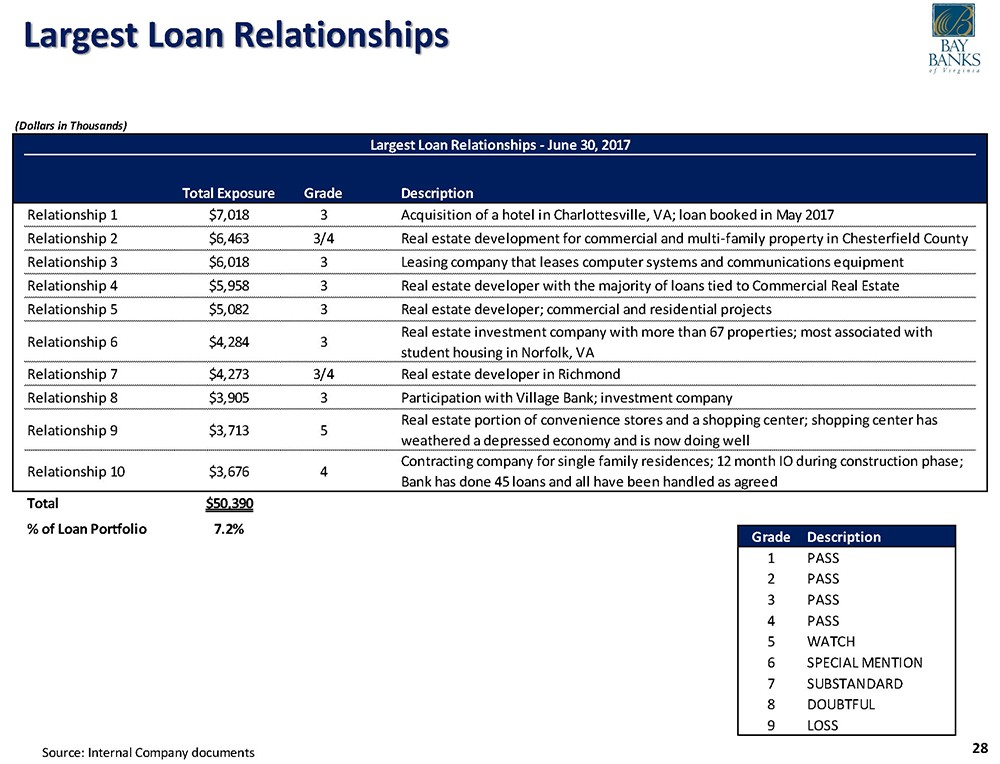
28 Source : Internal Company documents Largest Loan Relationships (Dollars in Thousands) Largest Loan Relationships - June 30, 2017 Total Exposure Grade Description Relationship 1 $7,018 3 Acquisition of a hotel in Charlottesville, VA; loan booked in May 2017 Relationship 2 $6,463 3/4 Real estate development for commercial and multi-family property in Chesterfield County Relationship 3 $6,018 3 Leasing company that leases computer systems and communications equipment Relationship 4 $5,958 3 Real estate developer with the majority of loans tied to Commercial Real Estate Relationship 5 $5,082 3 Real estate developer; commercial and residential projects Relationship 6 $4,284 3 Real estate investment company with more than 67 properties; most associated with student housing in Norfolk, VA Relationship 7 $4,273 3/4 Real estate developer in Richmond Relationship 8 $3,905 3 Participation with Village Bank; investment company Relationship 9 $3,713 5 Real estate portion of convenience stores and a shopping center; shopping center has weathered a depressed economy and is now doing well Relationship 10 $3,676 4 Contracting company for single family residences; 12 month IO during construction phase; Bank has done 45 loans and all have been handled as agreed Total $50,390 % of Loan Portfolio 7.2% Grade Description 1 PASS 2 PASS 3 PASS 4 PASS 5 WATCH 6 SPECIAL MENTION 7 SUBSTANDARD 8 DOUBTFUL 9 LOSS

29 1 No longer reclassifying NOW accounts as savings accounts; approximately 85% of checking accounts were previously being classi fi ed as savings accounts Note : Bank regulatory data as of June 30, 2017 Source: SNL Financial Deposit Breakdown Deposit Mix Deposit Quarterly Lookback Non Int. Bearing 14.2% NOW Accts 12.9% MMDA & Sav 28.1% Time Deposits < $100k 21.8% Time Deposits > $100k 23.1% ($000) 3Q'15 4Q'15 1Q'16 2Q'16 3Q'16 4Q'16 1Q'17 2Q'17 Demand $16,761 $16,658 $17,145 $17,961 $19,150 $18,600 $20,151 $101,004 MRQ NOW & Other Trans. 1 3,083 4,450 2,397 1,443 875 674 4,795 88,609 Cost of Deposits MMDA & Savings 201,499 211,544 209,007 232,305 231,580 236,393 223,293 190,120 0.64% CD < 100k 57,168 60,776 63,140 65,223 65,788 65,247 67,937 150,262 CDs > 100k 61,333 66,612 65,466 62,574 62,127 62,804 68,168 159,357 Total Deposits $339,844 $360,040 $357,155 $379,506 $379,520 $383,718 $384,344 $689,352 Deposit Composition - Quarter Lookback 0% 20% 40% 60% 80% 100% 3Q'15 4Q'15 1Q'16 2Q'16 3Q'16 4Q'16 1Q'17 2Q'17 Demand NOW & Other Trans. MMDA & Sav CD < 100k CDs > 100k

30 $6,433 $5,300 $5,820 $5,362 $0 $242 $241 $1,858 $1,870 $2,494 $2,436 $5,360 $0 $1,000 $2,000 $3,000 $4,000 $5,000 $6,000 $7,000 2015 2016 2017Q1 2017Q2 Nonaccrual TDR OREO Credit Quality Overview (Dollars in Thousands) 2015 2016 1Q'17 2Q'17 Nonperforming Assets Nonaccrual Loans $6,433 $5,300 $5,820 $5,362 Restructured Loans 0 242 241 1,858 OREO & Repo. Assets 1,870 2,494 2,436 5,360 Total NPAs & TDRs $8,303 $8,036 $8,497 $12,580 30-89 Days Past Due $1,907 $2,679 $1,005 $1,262 90+ Days Past Due, Accruing 11 - - - Loan Loss Reserve Loan Loss Reserve - Beginning $3,205 $4,223 $3,863 $3,994 Charge-offs & Adj. 659 973 139 440 Recoveries 79 326 80 119 Provision 1,597 287 190 568 Loan Loss Reserve - Ending $4,223 $3,863 $3,994 $4,241 Asset Quality Ratios (%) NPAs/Assets 1.82 1.65 1.69 1.45 NPAs/Assets (excluding TDRs) 1.82 1.60 1.64 1.24 NPAs & 90s/Assets 1.82 1.65 1.69 1.45 NPLs/Loans 1.85 1.44 1.50 1.02 Reserves/NPLs 65.65 69.70 65.90 58.74 Loan Loss Reserves/Gross Loans 1.21 1.00 0.99 0.60 Merger Credit Mark - - - $6,159 Reserves/NPLs (incl. Credit Mark) - - - 144.04 Reserves/Gross Loans (incl. Credit Mark) - - - 1.47 Year Ended, Quarter Ended, □ Conservative underwriting standards and a strong credit culture have lead to excellent asset quality – NPA/Assets reached a high point of only 3.14% during the recession □ Increase in aggregate non - performing assets is due to the merger; the merger credit mark is $6.2 million □ Including the credit mark, the Company remains well reserved with a ratio of reserves to gross loans of 1.47% Nonperforming Assets Note: GAAP data as of June 30, 2017 Source: SNL Financial
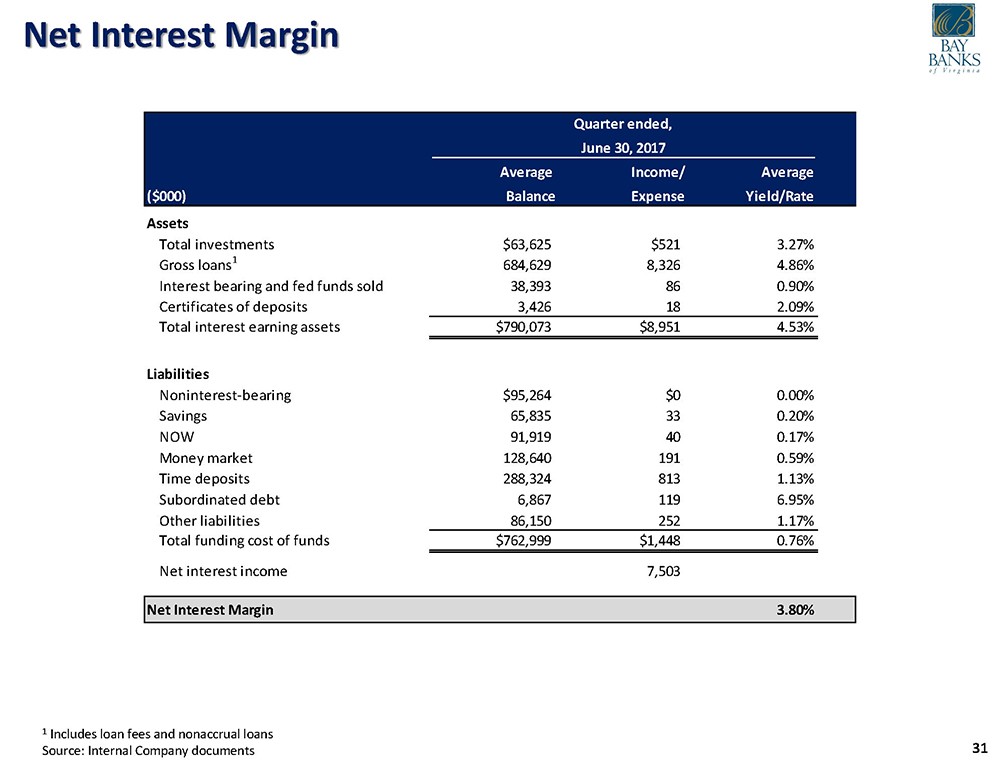
31 1 Includes loan fees and nonaccrual loans Source : Internal Company documents Net Interest Margin Quarter ended, June 30, 2017 Average Income/ Average ($000) Balance Expense Yield/Rate Assets Total investments $63,625 $521 3.27% Gross loans 1 684,629 8,326 4.86% Interest bearing and fed funds sold 38,393 86 0.90% Certificates of deposits 3,426 18 2.09% Total interest earning assets $790,073 $8,951 4.53% Liabilities Noninterest-bearing $95,264 $0 0.00% Savings 65,835 33 0.20% NOW 91,919 40 0.17% Money market 128,640 191 0.59% Time deposits 288,324 813 1.13% Subordinated debt 6,867 119 6.95% Other liabilities 86,150 252 1.17% Total funding cost of funds $762,999 $1,448 0.76% Net interest income 7,503 Net Interest Margin 3.80%

32 Note: Tangible book value is calculated using intangible assets, net of taxes and mortgage servicing rights, of $10.3 million Source : SNL Financial, internal Company documents Capital Structure Bay Banks of Virginia, Inc. $ 000s 6/30/17 $ 000s 6/30/17 Borrowings Bank Capital Structure FHLB Advances $70,000 Total Common Equity $87,646 Trust Preferred 0 Unrealized (Loss) / Gain (202) Other Borrowings 17,654 Acc Net Gain Cash Flow Hdgs 0 Total Borrowings $87,654 Qualifying TRUPs 0 Disallowable Goodwill & Intangibles 8,270 Shareholders' Equity Disallowable DTA 344 Preferred Stock $0 Other (704) Common Equity 46,996 Tier I Capital $79,938 APIC & Retained Earnings 39,308 Tier II Qualifying Debt 0 Other Comprehensive Income (915) Qualifying ALLL 4,241 Other (911) Total Risk Based Capital $84,179 Total Shareholders' Equity $84,478 Regulatory Capital Ratios Tangible Common Equity $74,199 Leverage Ratio 9.48% Tang. Common Equity / Tang. Assets 8.66% Tier I Risk-based Capital 13.10% Shares Outstanding 9,399,138 Total Risk-based Capital 13.79% Tangible Book Value per Share $7.89 Virginia Commonwealth Bank
33 IV. Pro Forma Impact
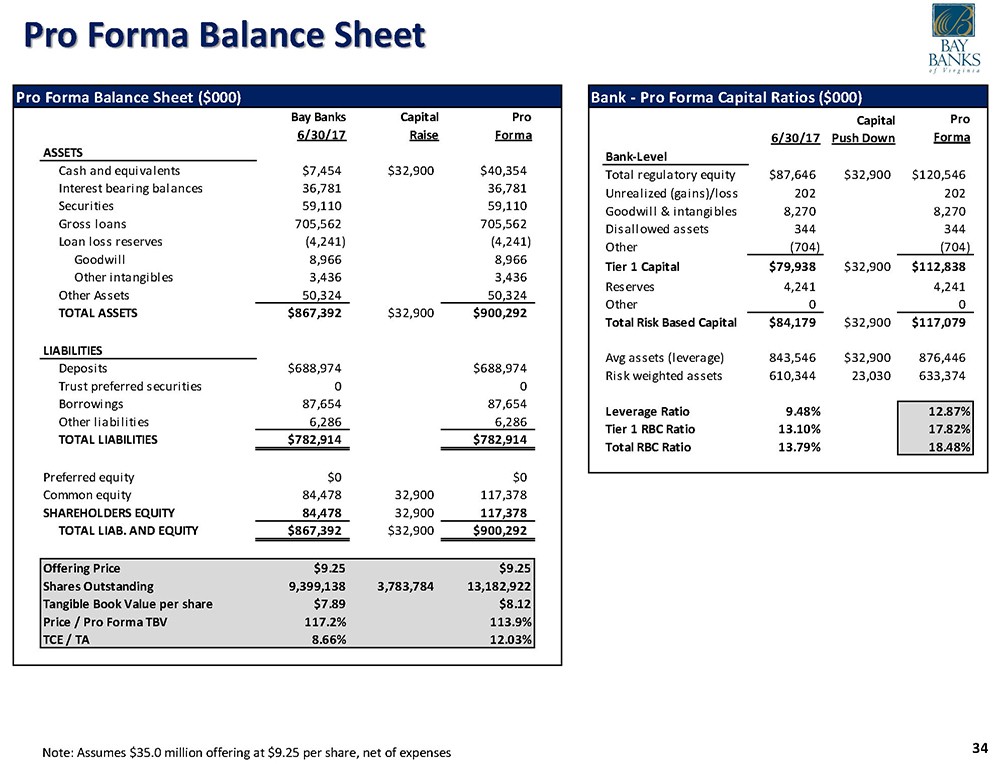
34 Pro Forma Balance Sheet Note: Assumes $35.0 million offering at $9.25 per share, net of expenses Pro Forma Balance Sheet ($000) Bay Banks Capital Pro 6/30/17 Raise Forma ASSETS Cash and equivalents $7,454 $32,900 $40,354 Interest bearing balances 36,781 36,781 Securities 59,110 59,110 Gross loans 705,562 705,562 Loan loss reserves (4,241) (4,241) Goodwill 8,966 8,966 Other intangibles 3,436 3,436 Other Assets 50,324 50,324 TOTAL ASSETS $867,392 $32,900 $900,292 LIABILITIES Deposits $688,974 $688,974 Trust preferred securities 0 0 Borrowings 87,654 87,654 Other liabilities 6,286 6,286 TOTAL LIABILITIES $782,914 $782,914 Preferred equity $0 $0 Common equity 84,478 32,900 117,378 SHAREHOLDERS EQUITY 84,478 32,900 117,378 TOTAL LIAB. AND EQUITY $867,392 $32,900 $900,292 Offering Price $9.25 $9.25 Shares Outstanding 9,399,138 3,783,784 13,182,922 Tangible Book Value per share $7.89 $8.12 Price / Pro Forma TBV 117.2% 113.9% TCE / TA 8.66% 12.03% Bank - Pro Forma Capital Ratios ($000) Capital Pro 6/30/17 Push Down Forma Bank-Level Total regulatory equity $87,646 $32,900 $120,546 Unrealized (gains)/loss 202 202 Goodwill & intangibles 8,270 8,270 Disallowed assets 344 344 Other (704) (704) Tier 1 Capital $79,938 $32,900 $112,838 Reserves 4,241 4,241 Other 0 0 Total Risk Based Capital $84,179 $32,900 $117,079 Avg assets (leverage) 843,546 $32,900 876,446 Risk weighted assets 610,344 23,030 633,374 Leverage Ratio 9.48% 12.87% Tier 1 RBC Ratio 13.10% 17.82% Total RBC Ratio 13.79% 18.48%

www.vacommbank.com