Attached files
| file | filename |
|---|---|
| EX-99.2 - EX-99.2 EARNINGS RELEASE - CrossAmerica Partners LP | capl-ex992_6.htm |
| EX-99.1 - EX-99.1 JET-PEP ASSET PURCHASE AGREEMENT ANNOUNCEMENT - CrossAmerica Partners LP | capl-ex991_8.htm |
| 8-K - 8-K - CrossAmerica Partners LP | capl-8k_20170804.htm |
August 2017 Second Quarter 2017 Earnings Call Exhibit 99.3
Safe Harbor Statement Statements contained in this presentation that state the Partnership’s or management’s expectations or predictions of the future are forward-looking statements. The words “believe,” “expect,” “should,” “intends,” “estimates,” “target” and other similar expressions identify forward-looking statements. It is important to note that actual results could differ materially from those projected in such forward-looking statements. For more information concerning factors that could cause actual results to differ from those expressed or forecasted, see CrossAmerica’s Forms 10-Q or Form 10-K filed with the Securities and Exchange Commission and available on CrossAmerica’s website at www.crossamericapartners.com. If any of these factors materialize, or if our underlying assumptions prove to be incorrect, actual results may vary significantly from what we projected. Any forward-looking statement you see or hear during this presentation reflects our current views as of the date of this presentation with respect to future events. We assume no obligation to publicly update or revise these forward-looking statements for any reason, whether as a result of new information, future events, or otherwise.
CrossAmerica Business Overview Jeremy Bergeron, President & CEO
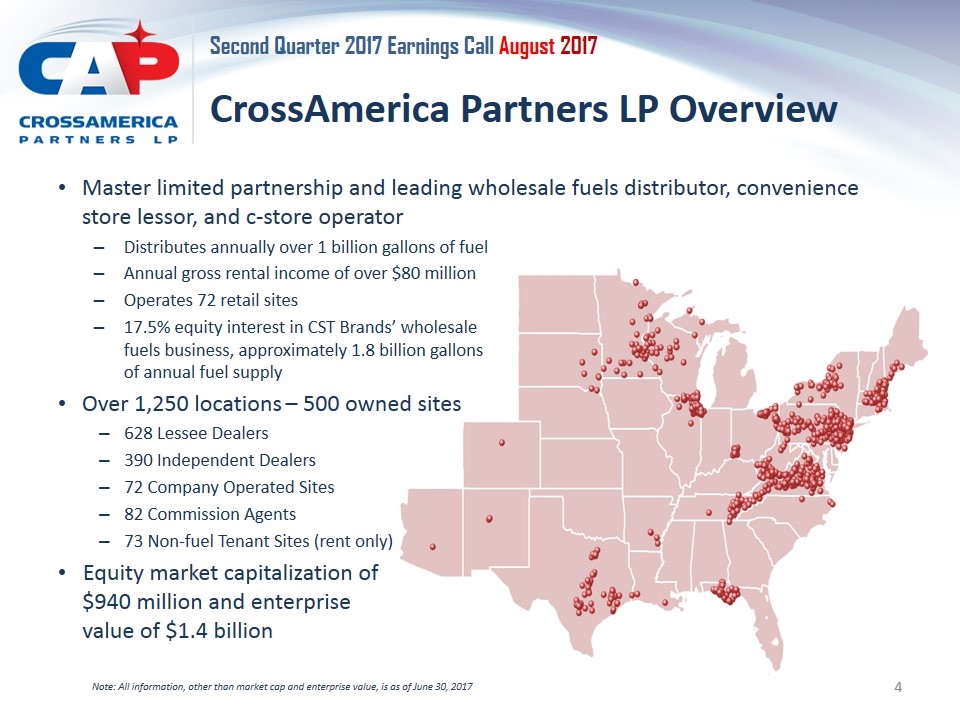
CrossAmerica Partners LP Overview Master limited partnership and leading wholesale fuels distributor, convenience store lessor, and c-store operator Distributes annually over 1 billion gallons of fuel Annual gross rental income of over $80 million Operates 72 retail sites 17.5% equity interest in CST Brands’ wholesale fuels business, approximately 1.8 billion gallons of annual fuel supply Over 1,250 locations – 500 owned sites 628 Lessee Dealers 390 Independent Dealers 72 Company Operated Sites 82 Commission Agents 73 Non-fuel Tenant Sites (rent only) Equity market capitalization of $940 million and enterprise value of $1.4 billion Note: All information, other than market cap and enterprise value, is as of June 30, 2017
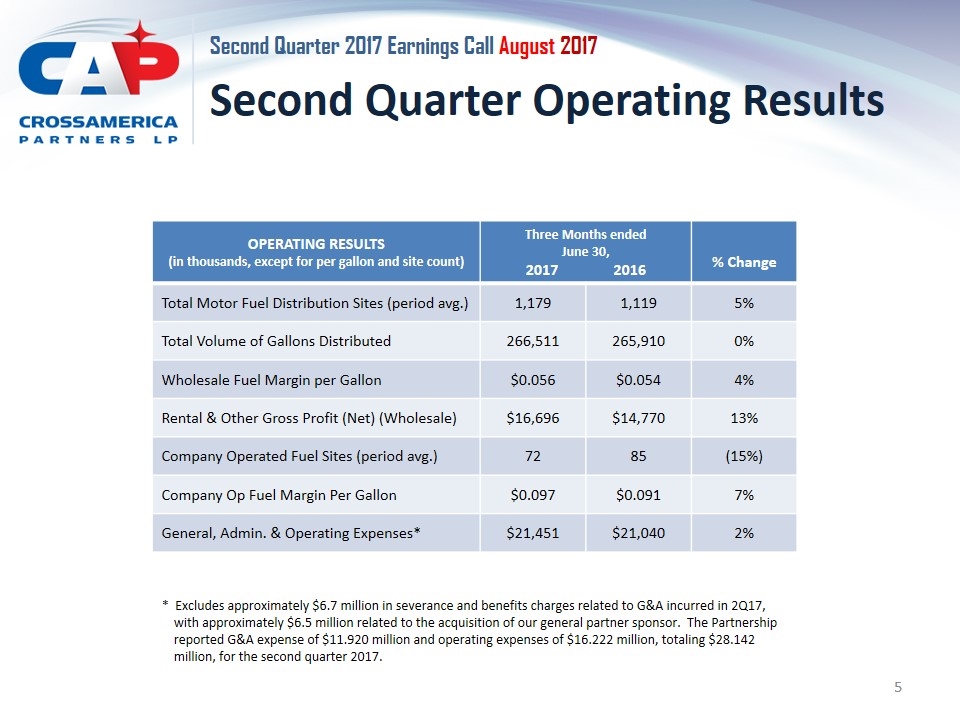
Second Quarter Operating Results OPERATING RESULTS (in thousands, except for per gallon and site count) Three Months ended June 30, 2017 2016 % Change Total Motor Fuel Distribution Sites (period avg.) 1,179 1,119 5% Total Volume of Gallons Distributed 266,511 265,910 0% Wholesale Fuel Margin per Gallon $0.056 $0.054 4% Rental & Other Gross Profit (Net) (Wholesale) $16,696 $14,770 13% Company Operated Fuel Sites (period avg.) 72 85 (15%) Company Op Fuel Margin Per Gallon $0.097 $0.091 7% General, Admin. & Operating Expenses* $21,451 $21,040 2% * Excludes approximately $6.7 million in severance and benefits charges related to G&A incurred in 2Q17, with approximately $6.5 million related to the acquisition of our general partner sponsor. The Partnership reported G&A expense of $11.920 million and operating expenses of $16.222 million, totaling $28.142 million, for the second quarter 2017.
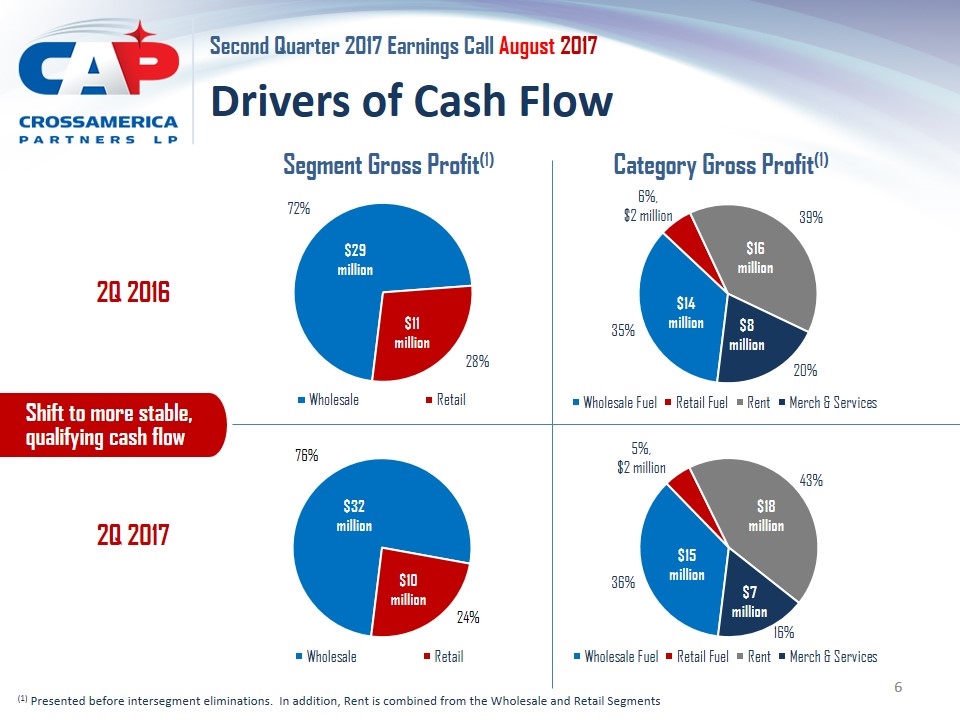
Drivers of Cash Flow Segment Gross Profit(1) Category Gross Profit(1) (1) Presented before intersegment eliminations. In addition, Rent is combined from the Wholesale and Retail Segments 2Q 2017 $32 million $10 million $18 million $7 million $15 million 2Q 2016 $29 million $11 million $16 million $8 million $14 million Shift to more stable, qualifying cash flow
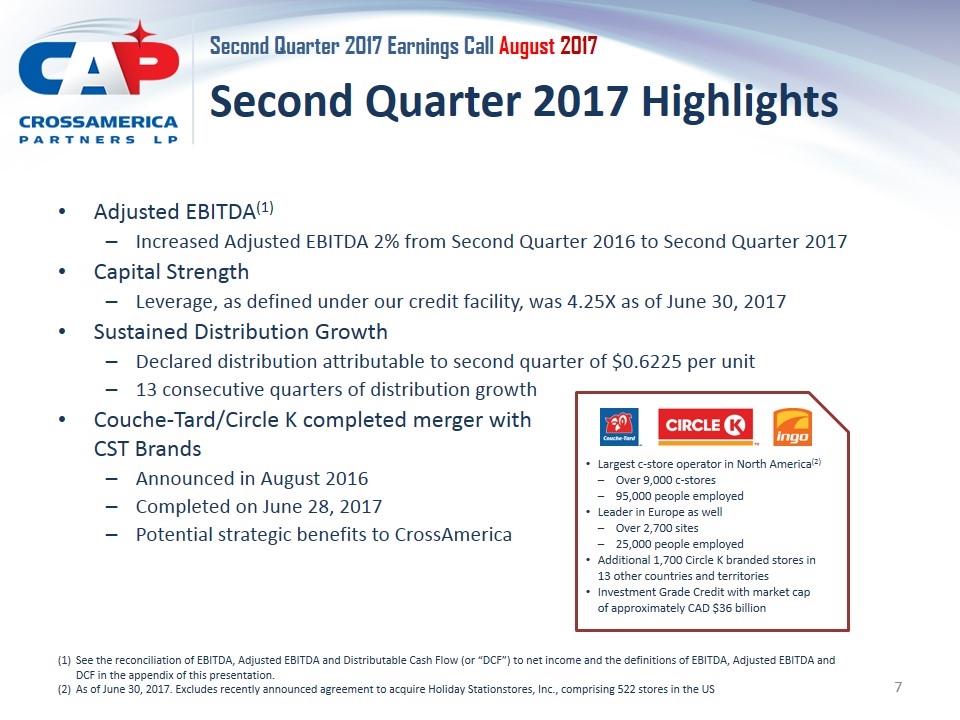
Second Quarter 2017 Highlights Adjusted EBITDA(1) Increased Adjusted EBITDA 2% from Second Quarter 2016 to Second Quarter 2017 Capital Strength Leverage, as defined under our credit facility, was 4.25X as of June 30, 2017 Sustained Distribution Growth Declared distribution attributable to second quarter of $0.6225 per unit 13 consecutive quarters of distribution growth Couche-Tard/Circle K completed merger with CST Brands Announced in August 2016 Completed on June 28, 2017 Potential strategic benefits to CrossAmerica See the reconciliation of EBITDA, Adjusted EBITDA and Distributable Cash Flow (or “DCF”) to net income and the definitions of EBITDA, Adjusted EBITDA and DCF in the appendix of this presentation. As of June 30, 2017. Excludes recently announced agreement to acquire Holiday Stationstores, Inc., comprising 522 stores in the US Largest c-store operator in North America(2) Over 9,000 c-stores 95,000 people employed Leader in Europe as well Over 2,700 sites 25,000 people employed Additional 1,700 Circle K branded stores in 13 other countries and territories Investment Grade Credit with market cap of approximately CAD $36 billion
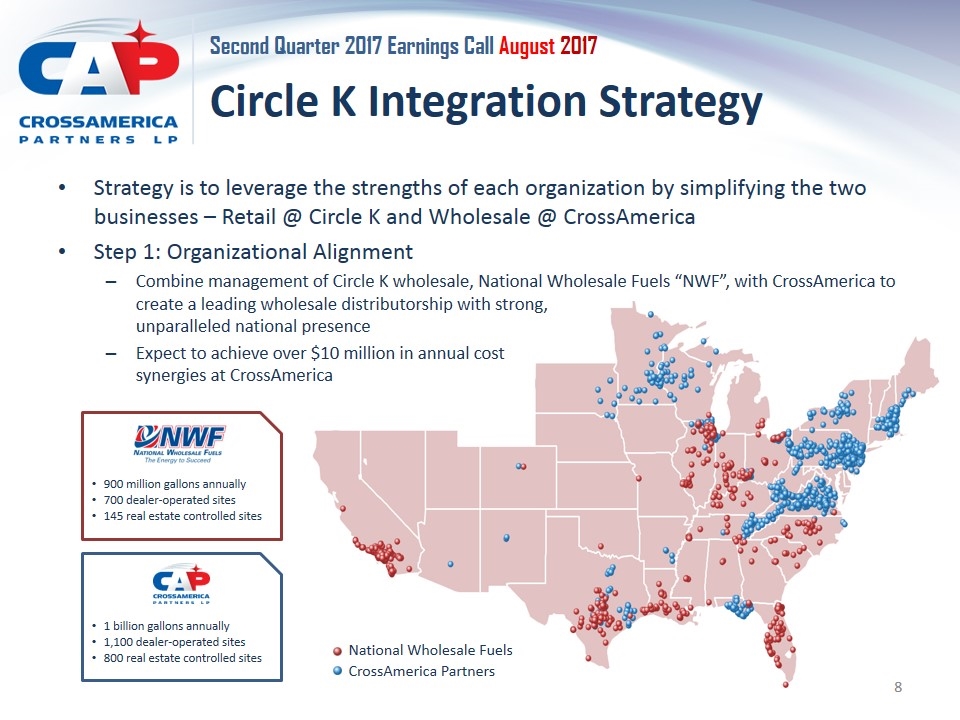
Circle K Integration Strategy Strategy is to leverage the strengths of each organization by simplifying the two businesses – Retail @ Circle K and Wholesale @ CrossAmerica Step 1: Organizational Alignment Combine management of Circle K wholesale, National Wholesale Fuels “NWF”, with CrossAmerica to create a leading wholesale distributorship with strong, unparalleled national presence Expect to achieve over $10 million in annual cost synergies at CrossAmerica 900 million gallons annually 700 dealer-operated sites 145 real estate controlled sites 1 billion gallons annually 1,100 dealer-operated sites 800 real estate controlled sites National Wholesale Fuels CrossAmerica Partners
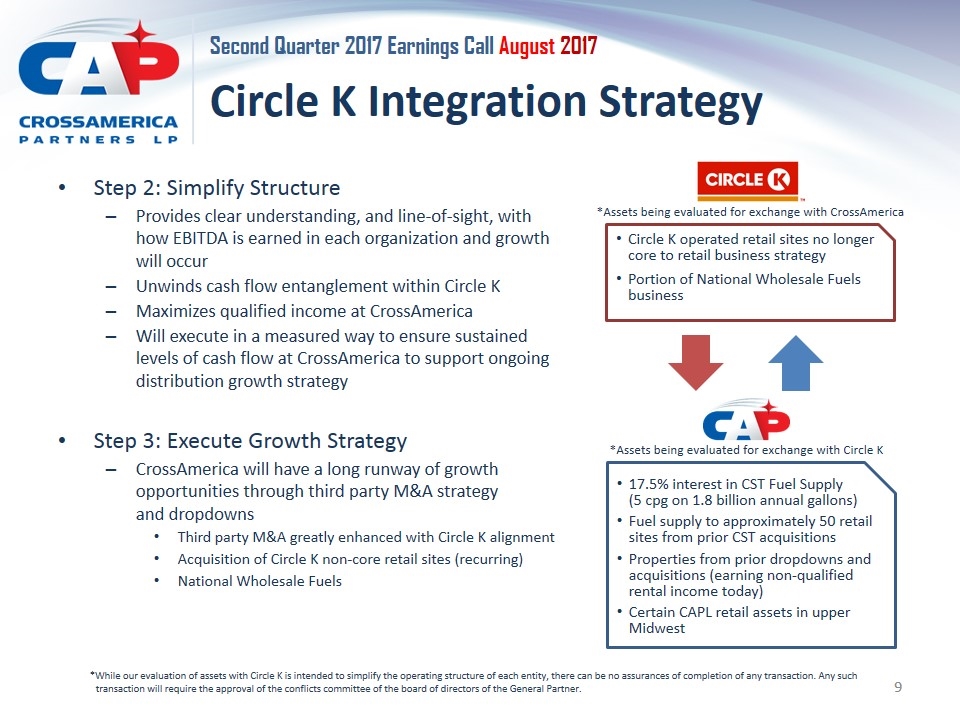
Circle K Integration Strategy Step 2: Simplify Structure Provides clear understanding, and line-of-sight, with how EBITDA is earned in each organization and growth will occur Unwinds cash flow entanglement within Circle K Maximizes qualified income at CrossAmerica Will execute in a measured way to ensure sustained levels of cash flow at CrossAmerica to support ongoing distribution growth strategy Step 3: Execute Growth Strategy CrossAmerica will have a long runway of growth opportunities through third party M&A strategy and dropdowns Third party M&A greatly enhanced with Circle K alignment Acquisition of Circle K non-core retail sites (recurring) National Wholesale Fuels Circle K operated retail sites no longer core to retail business strategy Portion of National Wholesale Fuels business 17.5% interest in CST Fuel Supply (5 cpg on 1.8 billion annual gallons) Fuel supply to approximately 50 retail sites from prior CST acquisitions Properties from prior dropdowns and acquisitions (earning non-qualified rental income today) Certain CAPL retail assets in upper Midwest *Assets being evaluated for exchange with Circle K *Assets being evaluated for exchange with CrossAmerica *While our evaluation of assets with Circle K is intended to simplify the operating structure of each entity, there can be no assurances of completion of any transaction. Any such transaction will require the approval of the conflicts committee of the board of directors of the General Partner.
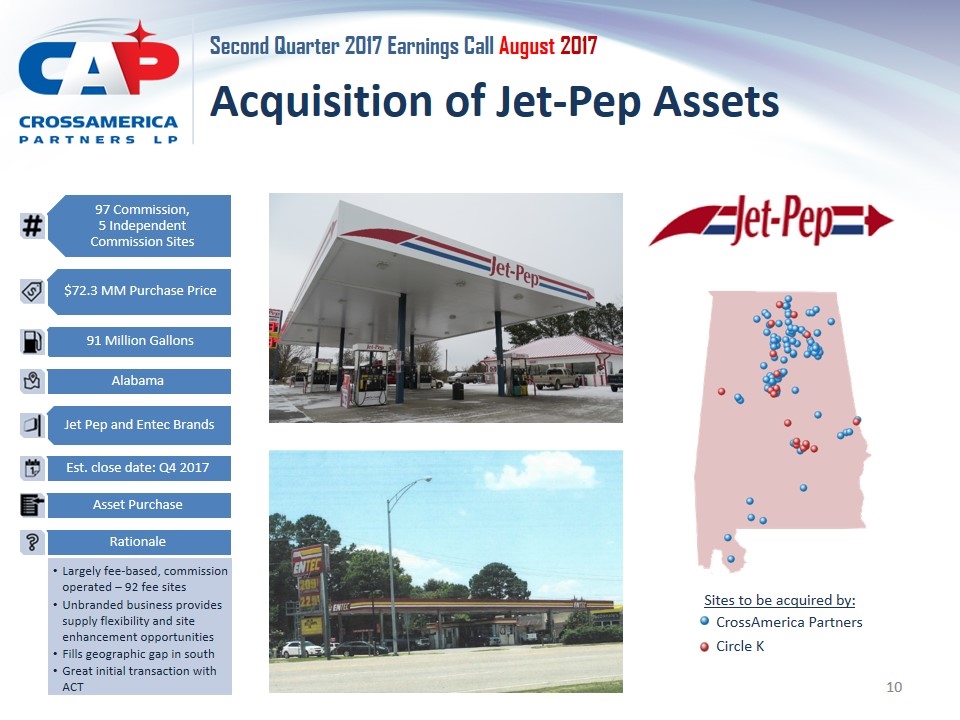
Acquisition of Jet-Pep Assets Largely fee-based, commission operated – 92 fee sites Unbranded business provides supply flexibility and site enhancement opportunities Fills geographic gap in south Great initial transaction with ACT Circle K CrossAmerica Partners Sites to be acquired by: 97 Commission, 5 Independent Commission Sites Alabama Jet Pep and Entec Brands Est. close date: Q4 2017 Asset Purchase Rationale $72.3 MM Purchase Price 91 Million Gallons
CrossAmerica Financial Overview Evan Smith, Chief Financial Officer
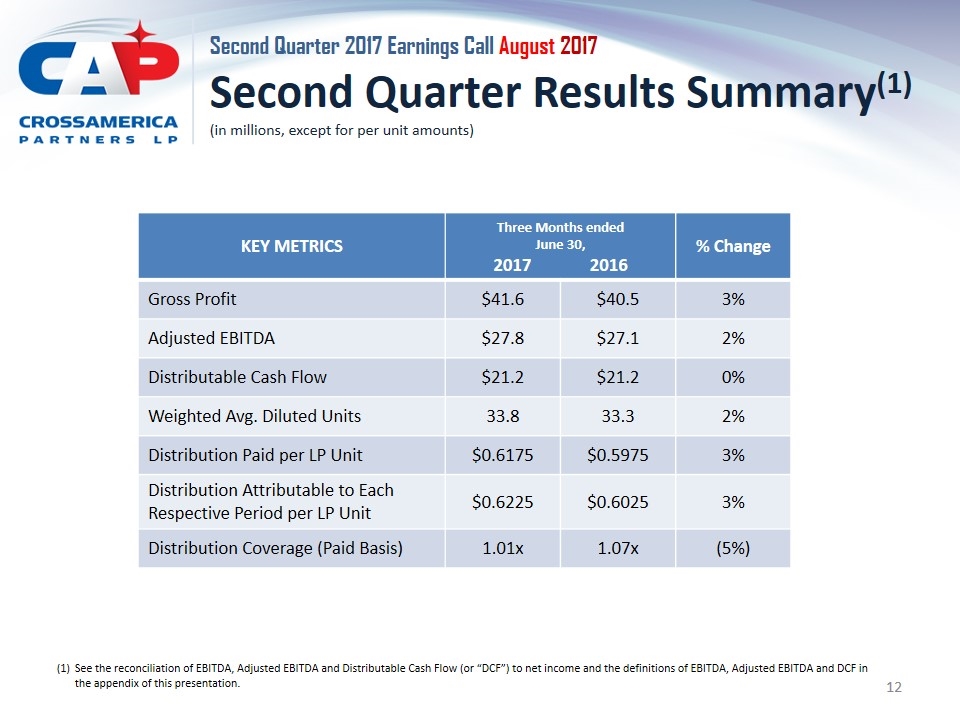
Second Quarter Results Summary(1) (in millions, except for per unit amounts) KEY METRICS Three Months ended June 30, 2017 2016 % Change Gross Profit $41.6 $40.5 3% Adjusted EBITDA $27.8 $27.1 2% Distributable Cash Flow $21.2 $21.2 0% Weighted Avg. Diluted Units 33.8 33.3 2% Distribution Paid per LP Unit $0.6175 $0.5975 3% Distribution Attributable to Each Respective Period per LP Unit $0.6225 $0.6025 3% Distribution Coverage (Paid Basis) 1.01x 1.07x (5%) See the reconciliation of EBITDA, Adjusted EBITDA and Distributable Cash Flow (or “DCF”) to net income and the definitions of EBITDA, Adjusted EBITDA and DCF in the appendix of this presentation.
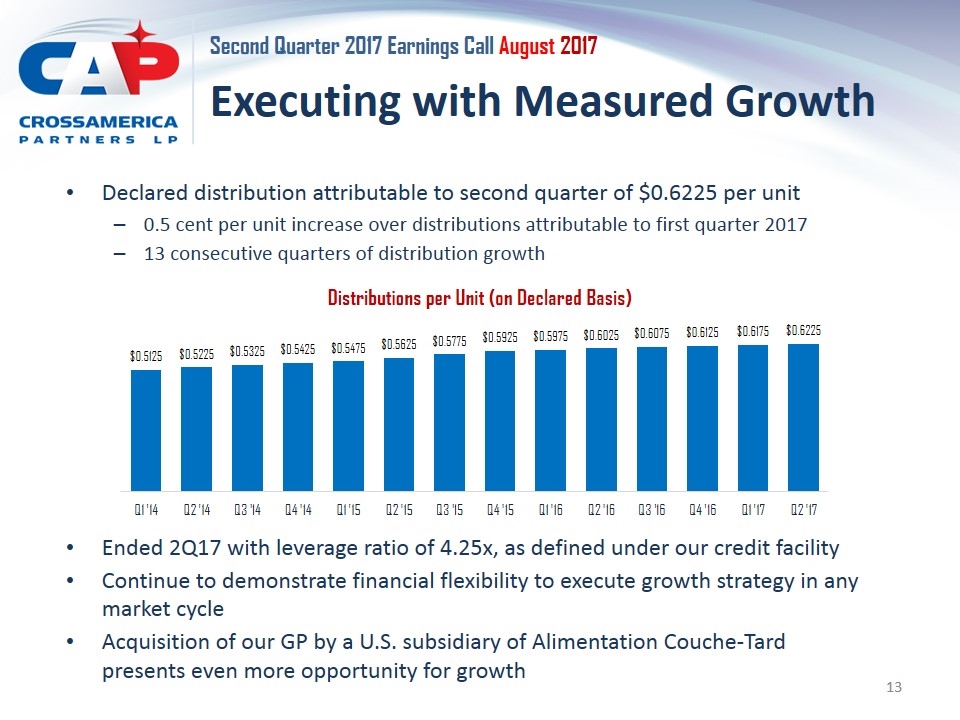
Executing with Measured Growth Declared distribution attributable to second quarter of $0.6225 per unit 0.5 cent per unit increase over distributions attributable to first quarter 2017 13 consecutive quarters of distribution growth Ended 2Q17 with leverage ratio of 4.25x, as defined under our credit facility Continue to demonstrate financial flexibility to execute growth strategy in any market cycle Acquisition of our GP by a U.S. subsidiary of Alimentation Couche-Tard presents even more opportunity for growth
Appendix Second Quarter 2017 Earnings Call
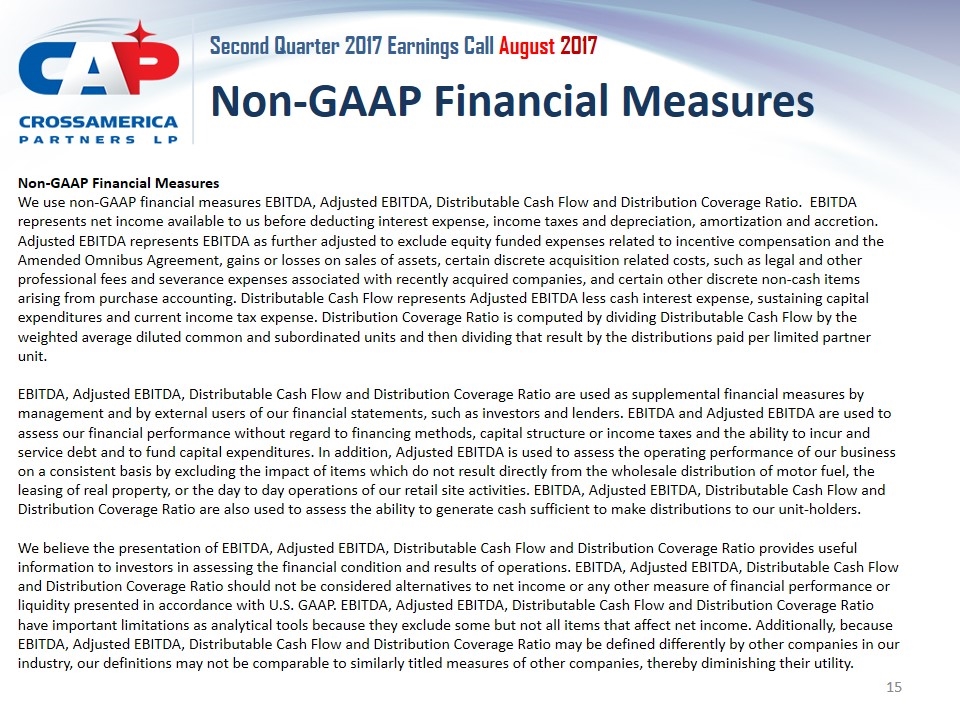
Non-GAAP Financial Measures Non-GAAP Financial Measures We use non-GAAP financial measures EBITDA, Adjusted EBITDA, Distributable Cash Flow and Distribution Coverage Ratio. EBITDA represents net income available to us before deducting interest expense, income taxes and depreciation, amortization and accretion. Adjusted EBITDA represents EBITDA as further adjusted to exclude equity funded expenses related to incentive compensation and the Amended Omnibus Agreement, gains or losses on sales of assets, certain discrete acquisition related costs, such as legal and other professional fees and severance expenses associated with recently acquired companies, and certain other discrete non-cash items arising from purchase accounting. Distributable Cash Flow represents Adjusted EBITDA less cash interest expense, sustaining capital expenditures and current income tax expense. Distribution Coverage Ratio is computed by dividing Distributable Cash Flow by the weighted average diluted common and subordinated units and then dividing that result by the distributions paid per limited partner unit. EBITDA, Adjusted EBITDA, Distributable Cash Flow and Distribution Coverage Ratio are used as supplemental financial measures by management and by external users of our financial statements, such as investors and lenders. EBITDA and Adjusted EBITDA are used to assess our financial performance without regard to financing methods, capital structure or income taxes and the ability to incur and service debt and to fund capital expenditures. In addition, Adjusted EBITDA is used to assess the operating performance of our business on a consistent basis by excluding the impact of items which do not result directly from the wholesale distribution of motor fuel, the leasing of real property, or the day to day operations of our retail site activities. EBITDA, Adjusted EBITDA, Distributable Cash Flow and Distribution Coverage Ratio are also used to assess the ability to generate cash sufficient to make distributions to our unit-holders. We believe the presentation of EBITDA, Adjusted EBITDA, Distributable Cash Flow and Distribution Coverage Ratio provides useful information to investors in assessing the financial condition and results of operations. EBITDA, Adjusted EBITDA, Distributable Cash Flow and Distribution Coverage Ratio should not be considered alternatives to net income or any other measure of financial performance or liquidity presented in accordance with U.S. GAAP. EBITDA, Adjusted EBITDA, Distributable Cash Flow and Distribution Coverage Ratio have important limitations as analytical tools because they exclude some but not all items that affect net income. Additionally, because EBITDA, Adjusted EBITDA, Distributable Cash Flow and Distribution Coverage Ratio may be defined differently by other companies in our industry, our definitions may not be comparable to similarly titled measures of other companies, thereby diminishing their utility.
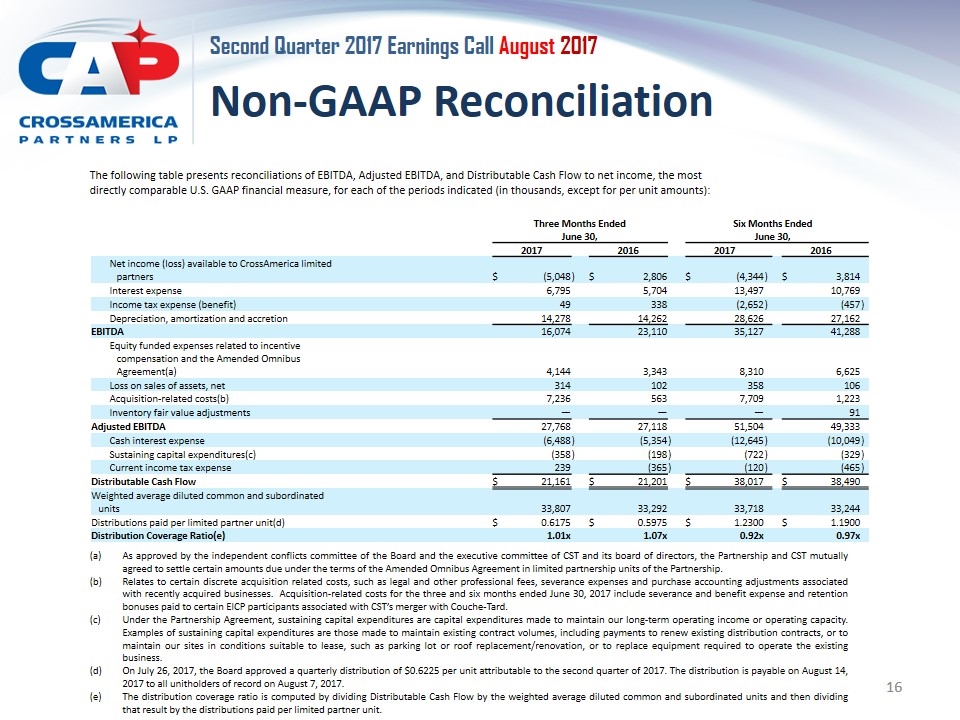
Non-GAAP Reconciliation Three Months Ended June 30, Six Months Ended June 30, 2017 2016 2017 2016 Net income (loss) available to CrossAmerica limited partners $ (5,048 ) $ 2,806 $ (4,344 ) $ 3,814 Interest expense 6,795 5,704 13,497 10,769 Income tax expense (benefit) 49 338 (2,652 ) (457 ) Depreciation, amortization and accretion 14,278 14,262 28,626 27,162 EBITDA 16,074 23,110 35,127 41,288 Equity funded expenses related to incentive compensation and the Amended Omnibus Agreement(a) 4,144 3,343 8,310 6,625 Loss on sales of assets, net 314 102 358 106 Acquisition-related costs(b) 7,236 563 7,709 1,223 Inventory fair value adjustments — — — 91 Adjusted EBITDA 27,768 27,118 51,504 49,333 Cash interest expense (6,488 ) (5,354 ) (12,645 ) (10,049 ) Sustaining capital expenditures(c) (358 ) (198 ) (722 ) (329 ) Current income tax expense 239 (365 ) (120 ) (465 ) Distributable Cash Flow $ 21,161 $ 21,201 $ 38,017 $ 38,490 Weighted average diluted common and subordinated units 33,807 33,292 33,718 33,244 Distributions paid per limited partner unit(d) $ 0.6175 $ 0.5975 $ 1.2300 $ 1.1900 Distribution Coverage Ratio(e) 1.01x 1.07x 0.92x 0.97x The following table presents reconciliations of EBITDA, Adjusted EBITDA, and Distributable Cash Flow to net income, the most directly comparable U.S. GAAP financial measure, for each of the periods indicated (in thousands, except for per unit amounts): (a)As approved by the independent conflicts committee of the Board and the executive committee of CST and its board of directors, the Partnership and CST mutually agreed to settle certain amounts due under the terms of the Amended Omnibus Agreement in limited partnership units of the Partnership. (b)Relates to certain discrete acquisition related costs, such as legal and other professional fees, severance expenses and purchase accounting adjustments associated with recently acquired businesses. Acquisition-related costs for the three and six months ended June 30, 2017 include severance and benefit expense and retention bonuses paid to certain EICP participants associated with CST’s merger with Couche-Tard. (c)Under the Partnership Agreement, sustaining capital expenditures are capital expenditures made to maintain our long-term operating income or operating capacity. Examples of sustaining capital expenditures are those made to maintain existing contract volumes, including payments to renew existing distribution contracts, or to maintain our sites in conditions suitable to lease, such as parking lot or roof replacement/renovation, or to replace equipment required to operate the existing business. (d)On July 26, 2017, the Board approved a quarterly distribution of $0.6225 per unit attributable to the second quarter of 2017. The distribution is payable on August 14, 2017 to all unitholders of record on August 7, 2017. (e)The distribution coverage ratio is computed by dividing Distributable Cash Flow by the weighted average diluted common and subordinated units and then dividing that result by the distributions paid per limited partner unit.
