Attached files
| file | filename |
|---|---|
| 8-K - 8-K - CLOUD PEAK ENERGY INC. | a17-18865_18k.htm |
Exhibit 99.1
INVESTOR Presentation August 2017
Cautionary Note Regarding Forward-Looking Statements This presentation contains “forward-looking statements” within the meaning of the safe harbor provisions of Section 27A of the Securities Act of 1933 and Section 21E of the Securities Exchange Act of 1934. Forward-looking statements are not statements of historical facts, and often contain words such as “may,” “will,” “expect,” “believe,” “anticipate,” “plan,” “estimate,” “seek,” “could,” “should,” “intend,” “potential,” or words of similar meaning. Forward-looking statements are based on management’s current expectations, beliefs, assumptions and estimates regarding our company, industry, economic conditions, government regulations, energy policies and other factors. These statements are subject to significant risks, uncertainties and assumptions that are difficult to predict and could cause actual results to differ materially and adversely from those expressed or implied in the forward-looking statements. For a description of some of the risks and uncertainties that may adversely affect our future results, refer to the risk factors described from time to time in the reports and registration statements we file with the Securities and Exchange Commission, including those in Item 1A "Risk Factors" of our most recent Form 10-K and any updates thereto in our Forms 10-Q and Forms 8-K. There may be other risks and uncertainties that are not currently known to us or that we currently believe are not material. We make forward-looking statements based on currently available information, and we assume no obligation to, and expressly disclaim any obligation to, update or revise publicly any forward-looking statements made in our presentation, whether as a result of new information, future events or otherwise, except as required by law. Non-GAAP Financial Measures This presentation includes the non-GAAP financial measure of Adjusted EBITDA (on a consolidated basis and for our reporting segments). Adjusted EBITDA is intended to provide additional information only and does not have any standard meaning prescribed by accounting principles generally accepted in the U.S. (“GAAP”). A quantitative reconciliation of historical net income (loss) to Adjusted EBITDA (as defined below) is found in the tables accompanying this presentation. EBITDA represents net income (loss) before: (1) interest income (expense) net, (2) income tax provision, (3) depreciation and depletion, and (4) amortization. Adjusted EBITDA represents EBITDA as further adjusted for accretion, which represents non-cash increases in asset retirement obligation liabilities resulting from the passage of time, and specifically identified items that management believes do not directly reflect our core operations. For the periods presented herein, the specifically identified items are: (1) adjustments to exclude the changes in the Tax Receivable Agreement, (2) adjustments for derivative financial instruments, excluding fair value mark-to-market gains or losses and including cash amounts received or paid, (3) adjustments to exclude non-cash impairment charges, (4) adjustments to exclude debt restructuring costs, (5) non-cash throughput amortization expense and contract termination payments made to amend the BNSF and Westshore agreements, and (6) adjustments to exclude the gain from the sale of our 50% non-operating interest in the Decker Mine in September 2014. We enter into certain derivative financial instruments such as put options that require the payment of premiums at contract inception. The reduction in the premium value over time is reflected in the mark-to-market gains or losses. Our calculation of Adjusted EBITDA does not include premiums paid for derivative financial instruments; either at contract inception, as these payments pertain to future settlement periods, or in the period of contract settlement, as the payment occurred in a preceding period. In prior years the amortization of port and rail contract termination payments were included as part of EBITDA and Adjusted EBITDA because the cash payments approximated the amount of amortization being taken during the year. During 2017, management determined that the non-cash portion of amortization arising from payments made in prior years as well as the amortization of contract termination payments should be adjusted out of Adjusted EBITDA because the ongoing cash payments are now significantly smaller than the overall amortization of these payments and no longer reflect the transactional results. Because of the inherent uncertainty related to the items identified above, management does not believe it is able to provide a meaningful forecast of the comparable U.S. GAAP measures or reconciliation to any forecasted U.S. GAAP measure. Adjusted EBITDA is an additional tool intended to assist our management in comparing our performance on a consistent basis for purposes of business decision making by removing the impact of certain items that management believes do not directly reflect our core operations. Adjusted EBITDA is a metric intended to assist management in evaluating operating performance, comparing performance across periods, planning and forecasting future business operations and helping determine levels of operating and capital investments. Period-to-period comparisons of Adjusted EBITDA are intended to help our management identify and assess additional trends potentially impacting our company that may not be shown solely by period-to-period comparisons of net income (loss). Consolidated Adjusted EBITDA is also used as part of our incentive compensation program for our executive officers and others. We believe Adjusted EBITDA is also useful to investors, analysts and other external users of our consolidated financial statements in evaluating our operating performance from period to period and comparing our performance to similar operating results of other relevant companies. Adjusted EBITDA allows investors to measure a company’s operating performance without regard to items such as interest expense, taxes, depreciation and depletion, amortization and accretion and other specifically identified items that are not considered to directly reflect our core operations. Our management recognizes that using Adjusted EBITDA as a performance measure has inherent limitations as compared to net income (loss), or other GAAP financial measures, as this non-GAAP measure excludes certain items, including items that are recurring in nature, which may be meaningful to investors. As a result of these exclusions, Adjusted EBITDA should not be considered in isolation and does not purport to be an alternative to net income (loss) or other GAAP financial measures as a measure of our operating performance. Because not all companies use identical calculations, our presentation of Adjusted EBITDA may not be comparable to other similarly titled measures of other companies. 2
Cloud Peak Energy Profile 3
One of the largest U.S. coal producers and only PRB pure-play coal company 2016 coal shipments from our three mines of 58.5 million tons 2016 proven & probable reserves of 1.1 billion tons Extensive NPRB projects and options for long-term growth opportunities Employs approximately 1,300 people Company and Financial Overview NYSE: CLD (7/21/17) $3.52 Market Capitalization (7/21/17) $264.5 million Total Available Liquidity (6/30/17) $452.8 million 2016 Revenue $800.4 million Senior Debt Principal (6/30/17) $346.8 million 4
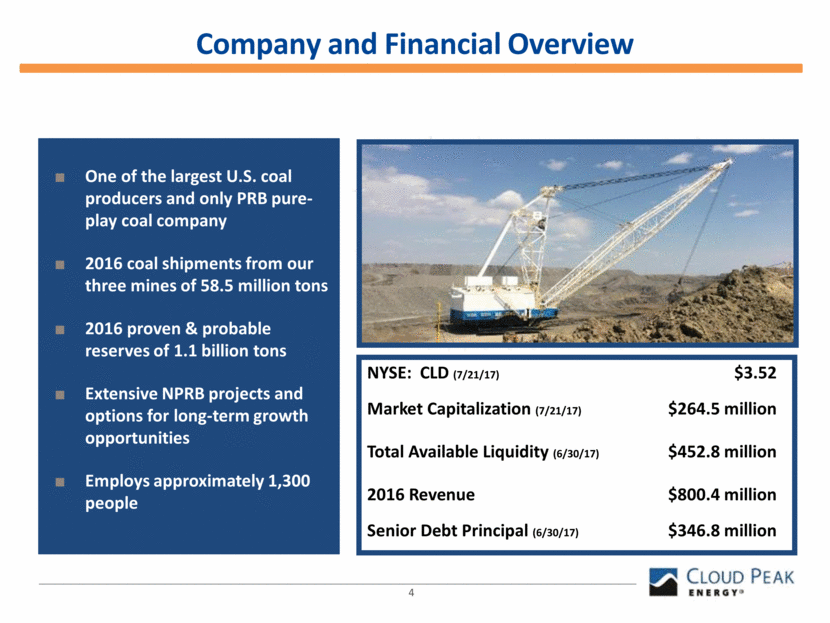
Good Safety Record = Well-Run Operations Source: Mine Safety and Health Administration Note: Total Incident Rate = (total number of employee incidents x 200,000) / total man-hours. 5 Top Coal Producing Companies – 2016 Incident Rates (MSHA) Cloud Peak Energy June 30, 2017 MSHA AIFR 0.17 0.00 0.25 0.55 0.62 0.85 0.87 1.28 1.29 1.30 1.56 2.16 2.63 3.79 3.82 3.93 4.30 4.34 4.42 4.52 4.67 5.18 5.88 6.21 7.19
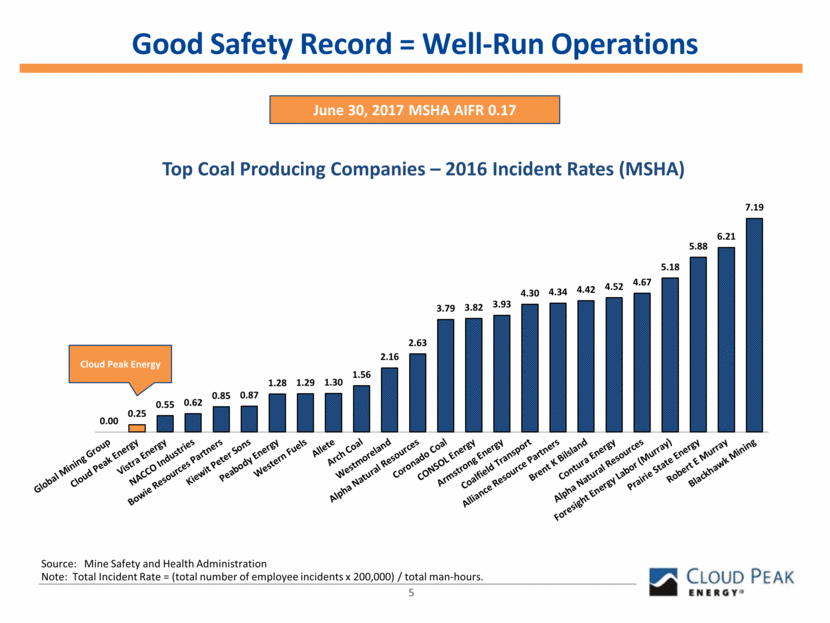
Low-Risk Surface Operations One of the best safety records in the industry Surface mining allows for high-quality reclamation Strong environmental compliance programs are ISO-14001 certified Highly productive, non-unionized workforce at all of our mines 6
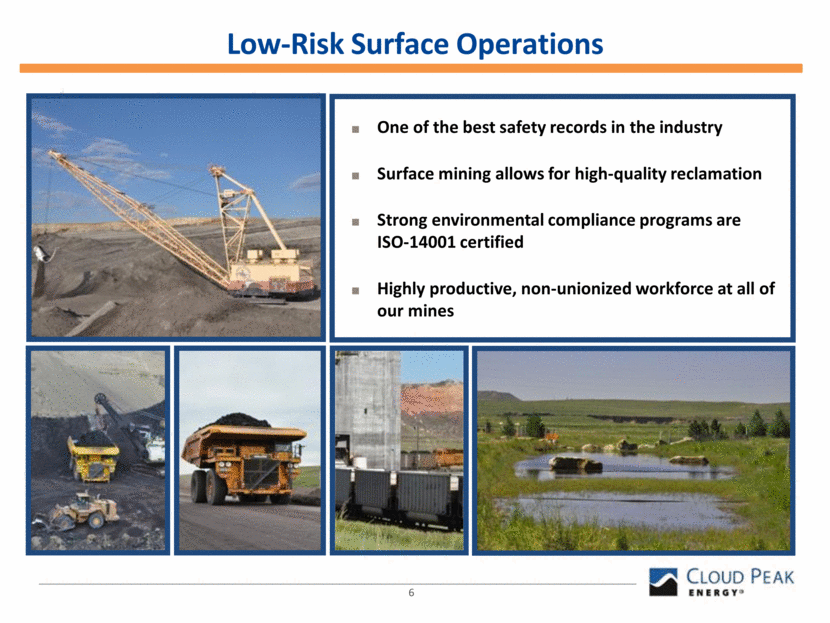
Increasing Workload A Function of Surface Mining in the PRB 7 Additional overburden as coal seams dip moving west Haul distances increase as mining pits progress further from load-out More equipment, personnel, resources required to maintain production Imposes production growth constraints in the PRB over time
Extensive Coal Reserves and Projects Spring Creek Mine – MT 2016 Tons Sold 10.3M tons 2016 Proven & Probable Reserves 248.5M tons Average Reserve Coal Quality 9,350 Btu/lb Mine Life (1) 24 years Cordero Rojo Mine – WY 2016 Tons Sold 18.3M tons 2016 Proven & Probable Reserves 315.9M tons Average Reserve Coal Quality 8,425 Btu/lb Mine Life (1) 17 years Antelope Mine – WY 2016 Tons Sold 29.8M tons 2016 Proven & Probable Reserves 516.9M tons Average Reserve Coal Quality 8,875 Btu/lb Mine Life (1) 17 years Antelope Mine 7.8M tons Cordero Rojo Mine 53.1M tons Spring Creek Mine 3.9M tons Youngs Creek Project (non-federal coal) 292.4M tons 357.2M tons 2016 Non-Reserve Coal Deposits(2) 0.36B Tons Big Metal Project 1,387M tons Additional Non-Federal Coal (3) 1.4B Tons 2016 Proven & Probable Reserves 1.1B Tons Source: SNL Energy7 (1) Assumes production at the 2016 level. (2) Non-reserve coal deposits are not reserves under SEC Industry Guide 7. Estimates of non-reserve coal deposits are subject to further exploration and development, are more speculative, and may not be converted to future reserves of the company. (3) Subject to exercise of options. Represents a current estimate of physical in-place coal tons. Does not represent proven and probable reserves, non-reserve coal deposits or a forecast of tons to be produced and sold in the future. Future production and sales of such tons, if any, are subject to exercise of options and significant risk and uncertainty. 8
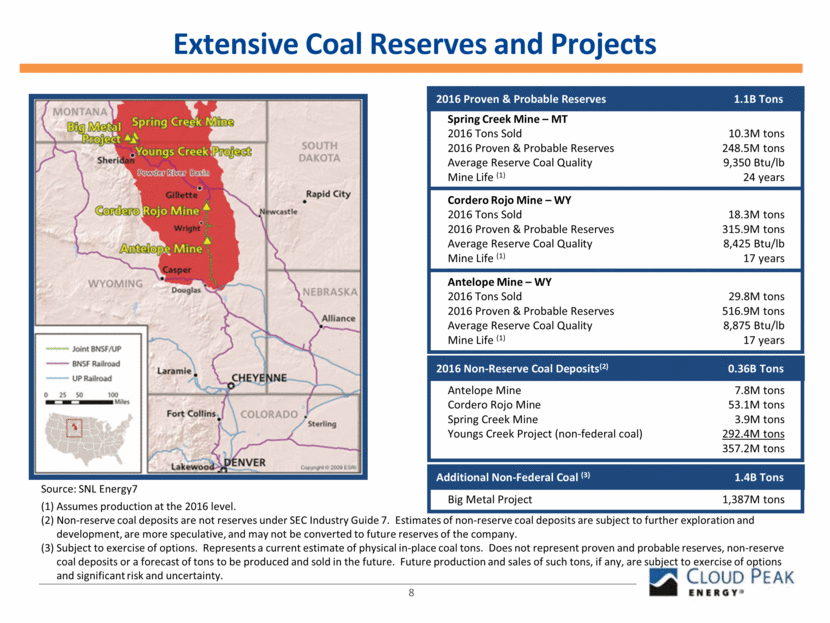
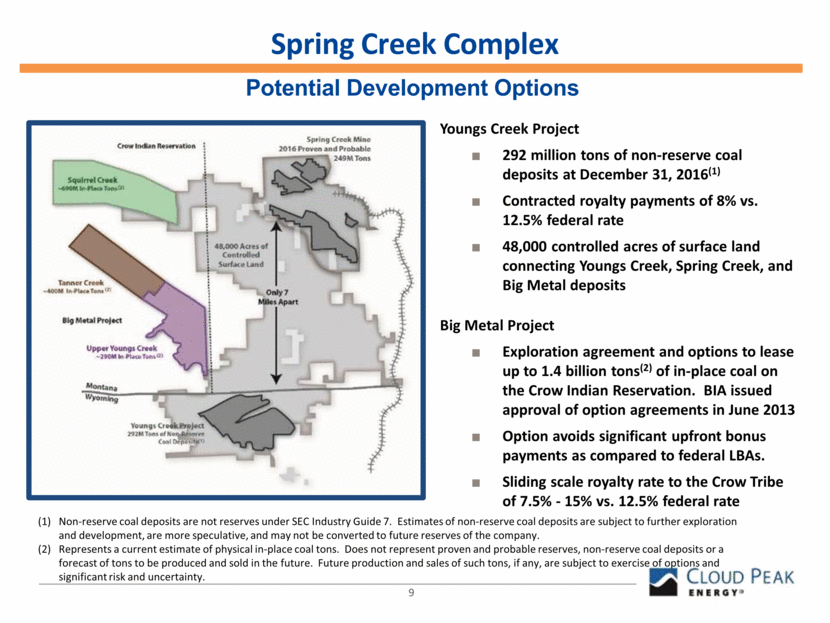
9 Spring Creek Complex Potential Development Options (1) Non-reserve coal deposits are not reserves under SEC Industry Guide 7. Estimates of non-reserve coal deposits are subject to further exploration and development, are more speculative, and may not be converted to future reserves of the company. (2) Represents a current estimate of physical in-place coal tons. Does not represent proven and probable reserves, non-reserve coal deposits or a forecast of tons to be produced and sold in the future. Future production and sales of such tons, if any, are subject to exercise of options and significant risk and uncertainty. Youngs Creek Project 292 million tons of non-reserve coal deposits at December 31, 2016(1) Contracted royalty payments of 8% vs. 12.5% federal rate 48,000 controlled acres of surface land connecting Youngs Creek, Spring Creek, and Big Metal deposits Big Metal Project Exploration agreement and options to lease up to 1.4 billion tons(2) of in-place coal on the Crow Indian Reservation. BIA issued approval of option agreements in June 2013 Option avoids significant upfront bonus payments as compared to federal LBAs. Sliding scale royalty rate to the Crow Tribe of 7.5% - 15% vs. 12.5% federal rate
10 Spring Creek Complex High Btu Coal Resources No new federal coal LBAs have been issued in the PRB since 2012, and Bureau of Land Management has no PRB leases scheduled for sale at this time. Prospects for new LBAs have been challenged in recent years by low coal prices, financial challenges facing the industry, and federal regulatory pressures. Currently leased 8800 Btu coal reserves in the PRB are expected to decline at current production rates over the next 5-7 years absent new LBAs. The process to obtain, permit, and develop new LBA reserves has recently taken 7-10 years. The Spring Creek Complex offers an opportunity to incrementally develop lower ratio, >9000 Btu coal potentially in the 2020-2021 timeframe by leveraging the existing Spring Creek Mine loadout and infrastructure. Cloud Peak Energy is actively seeking to develop new domestic and international customers for Spring Creek coal to provide a foundation for potential development of the Spring Creek Complex.
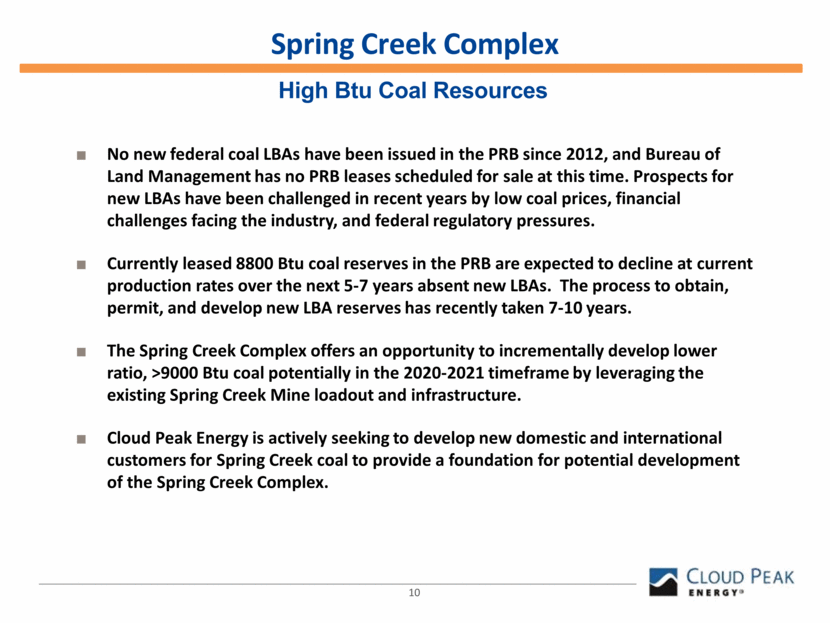
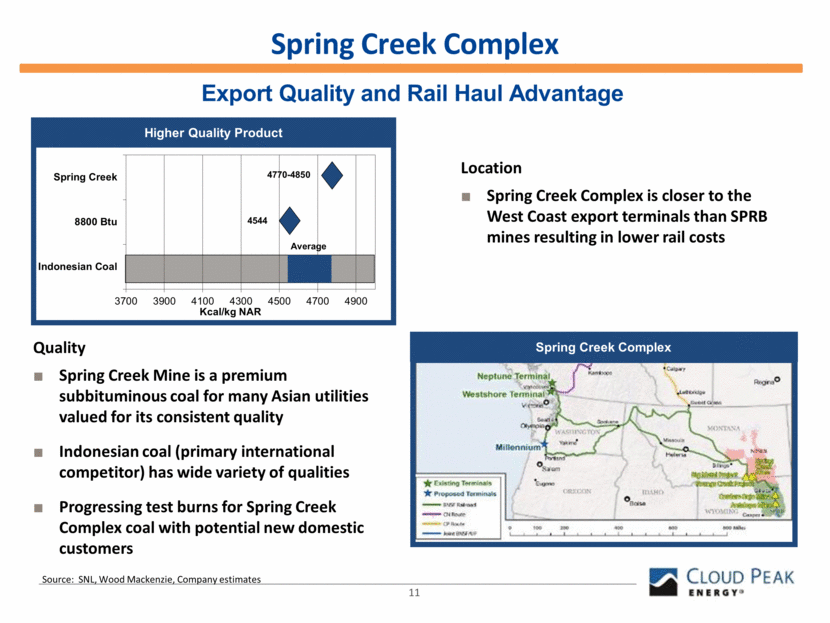
11 Spring Creek Complex Export Quality and Rail Haul Advantage Source: SNL, Wood Mackenzie, Company estimates 4770-4850 4544 Average Higher Quality Product Location Spring Creek Complex is closer to the West Coast export terminals than SPRB mines resulting in lower rail costs Quality Spring Creek Mine is a premium subbituminous coal for many Asian utilities valued for its consistent quality Indonesian coal (primary international competitor) has wide variety of qualities Progressing test burns for Spring Creek Complex coal with potential new domestic customers Spring Creek Complex 3700 3900 4100 4300 4500 4700 4900 Indonesian Coal 8800 Btu Spring Creek Kcal/kg NAR
Finance 12
13 Managing Through Changing Environments Adjusted production to match demand, including export volumes that resumed in 2017. First and second half domestic shipments are on pace to be relatively equal, which would be unusual compared to historical norms in which second half shipments are typically greater. Reduced total costs as production declined, managed our core cash costs on a per ton basis. Successfully managed capital spend to a sustainably low level while keeping equipment fleet in good condition. Controlling Costs Reducing Capital Expenditures (1) Includes labor, repairs, maintenance, tires, explosives, outside services, and other mining costs $4.97 $4.99 $5.05 $4.45 $4.20 $4.60 $5.24 $5.14 $5.36 $5.55 $9.57 $10.23 $10.19 $9.81 $9.75 $0 $2 $4 $6 $8 $10 $12 2012 2013 2014 2015 2016 (cash cost per ton) Royalties/Taxes/Fuel/Lubricants Core Cash Cost (1) 86.2 81.3 81.9 71.5 57.9 51.5 - 54.5 4.4 4.7 4.0 3.6 0.6 4.5 90.6 86.0 85.9 75.1 58.5 56 - 59 0 10 20 30 40 50 60 70 80 90 100 2012 2013 2014 2015 2016 2017E (in millions) North American Deliveries Asian Exports Reducing Shipments $54 $57 $20 $39 $35 $20 - 25 $129 $79 $69 $69 $0 $20 $40 $60 $80 $100 $120 $140 $160 $180 $200 2012 2013 2014 2015 2016 2017E (in millions) Capex LBA Payments
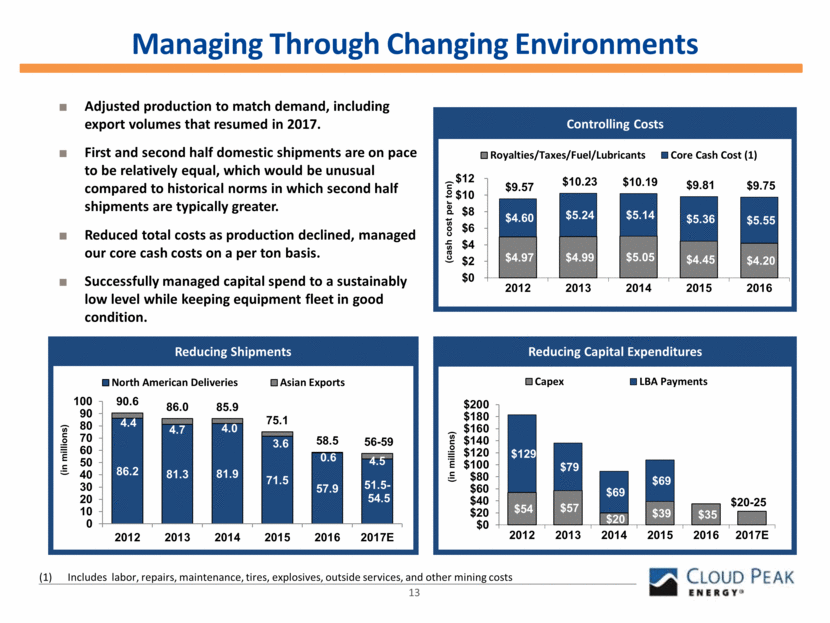
14 Liquidity and Bonding Obligations Actively Managing Financial Obligations and Commitments June 30, 2017 Cash and cash equivalents $80 Credit Agreement capacity $400 A/R Securitization 23 Available borrowing capacity 423 Letters of credit issued (1) (51) Total Available Liquidity $453 Surety bonds outstanding Third-party surety bonds $410 Lease bonds 26 Total Bonding Obligation $436 Cash balance of $80 million is only $3.2 million lower than where we began the year. $400 million Credit Agreement has a minimum monthly liquidity covenant of $125 million. The A/R Securitization has a maturity date of 2020 and includes the capability to issue letters of credit. At June 30, 2017, had available borrowing capacity under the Credit Agreement and A/R Securitization Program of $372 million, as $51 million undrawn letters of credit were outstanding. The undrawn letters of credit provide collateral on the reclamation surety bonds. The improved Company and coal industry conditions supported a lower amount of collateral for the reclamation bonding program. As of July 27, 2017, further reduced undrawn letters of credit to $28.6 million. (1) Letters of credit issued under our Credit Agreement and A/R Securitization Program provide approximately 6% collateral to sureties for reclamation bonds as of July 27, 2017. (in millions)
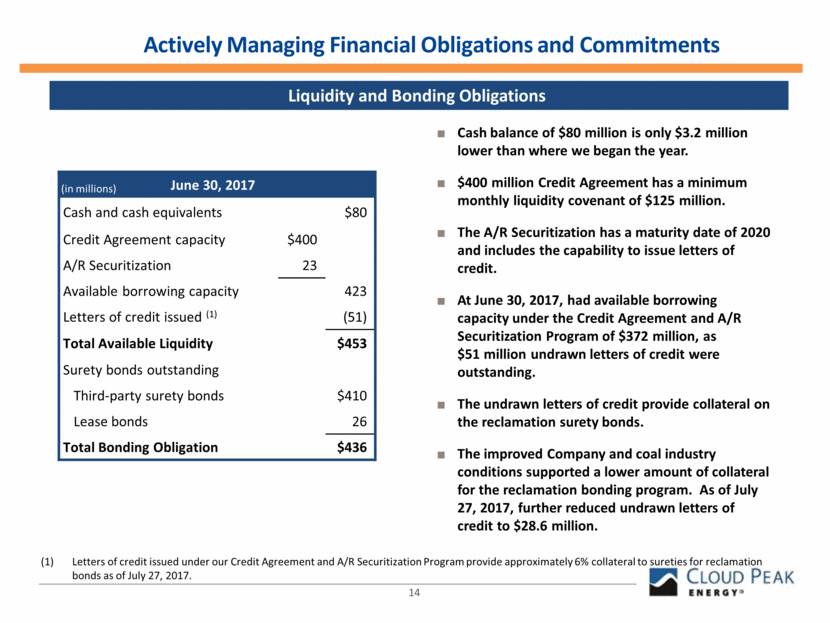
15 Maturity Profile – Debt and Transportation Commitments Actively Managing Financial Obligations and Commitments June 30, 2017 12% Second Lien Notes due 2021 $290 6.375% High-Yield Notes due 2024 57 Bonds Outstanding $347 Deferred gain and other (1) 62 Carrying Value of Debt $409 Capital leases 6 Total Debt on Balance Sheet $415 Total Debt / TTM Adjusted EBITDA (2) 2.7X Net Debt / TTM Adjusted EBITDA (2) 2.1X Transportation (3) 2017 Take-or-Pay Commitments $ 17 2018 Take-or-Pay Commitments $ 24 Through the exchange offer in Q3 2016 and equity raise in Q1 2017, accomplished total deleveraging of $153 million. Nearest principal maturity wall is 2021. Port and rail agreements were replaced and shortened to reduce the take-or-pay commitments through 2018. Represents the deferred gain on the Q4 2016 bond exchange transaction less unamortized debt issuance costs and cash premium paid Total debt includes high-yield notes and capital leases Commitments represent replacement Westshore and BNSF agreements. See Item 7—“Management’s Discussion and Analysis of Financial Condition and Results of Operations—Contractual Obligations” in our 2016 Form 10-K and Item 1—Note 7 “Transportations Agreements” of our Notes to Unaudited Condensed Consolidated Financial Statements in our June 30, 2017 Form 10-Q for additional information. (in millions) $0 $100 $200 $300 $400 Credit Facility Bonds Take-or-Pay Commitments A/R Securitization
16 2017 Guidance (as of July 27, 2017) Coal shipments for our three mines (1) 56 – 59 million tons Committed sales with fixed prices Approximately 56 million tons Anticipated realized price of produced coal with fixed prices Approximately $12.18 per ton Adjusted EBITDA (2) $85 – $105 million Net interest expense Approximately $40 million Cash interest paid Approximately $45 million Depreciation, depletion, amortization, and accretion $70 – $80 million Capital expenditures $20 – $25 million Inclusive of intersegment sales. Non-GAAP financial measure; please see definition below in this presentation. Management did not prepare estimates of reconciliation with comparable GAAP measures, including net income, because information necessary to provide such a forward-looking estimate is not available without unreasonable effort.
Domestic Coal Environment Conditions and Regulations 17
Domestic Environment Coal production in the U.S. through June 2017 has increased 15% compared to June 2016, while PRB production is up 22% for the same period (1) Coal burn stronger in current year as natural gas prices are around $3.00 MMBtu Slow start to summer has kept utility coal stockpiles elevated 8400 Btu volumes continue to be challenged by low 8800 Btu coal prices Trump Administration Shorter-term impact positive Longer-term impact less certain Anti-fossil fuel campaigns remain active Activist NGO groups not going away More activity at state and local level Pacific Northwest challenges to fossil fuel exports 18 (1) Source: Mine Safety and Health Administration
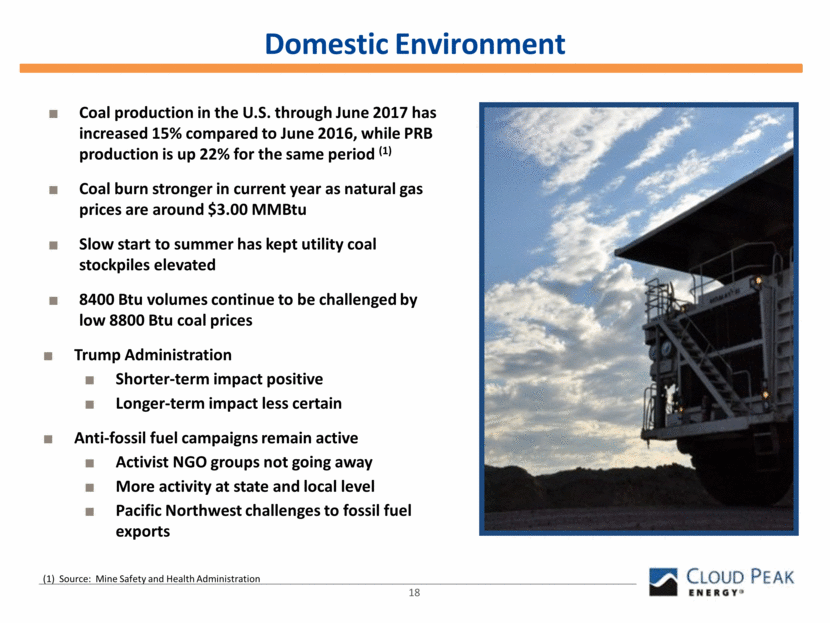
Natural Gas Storage and Pricing Natural Gas Storage Q2 production was lower than last year, but lower consumption has allowed for net injections above 2016 levels Storage levels are down 299 Bcf or 9.1% from this time last year For the first half of 2017, storage levels have been well below 2016 record levels Natural Gas Pricing and Rig Count Financial pressure on oil and gas producers Rig counts have continued to increase during Q2 in the lowest cost basins, led by the Permian Prices have currently maintained in the $3.00 MMBtu range 19 Source: EIA Source: EIA, Baker Hughes $1.50 $2.00 $2.50 $3.00 $3.50 $4.00 $4.50 $5.00 $5.50 $6.00 0 50 100 150 200 250 300 350 400 450 Price ($/MMBtu) Rig Count Rigs Price 0 1,000 2,000 3,000 4,000 5,000 BCF Week 5-Year Range 2017 2016
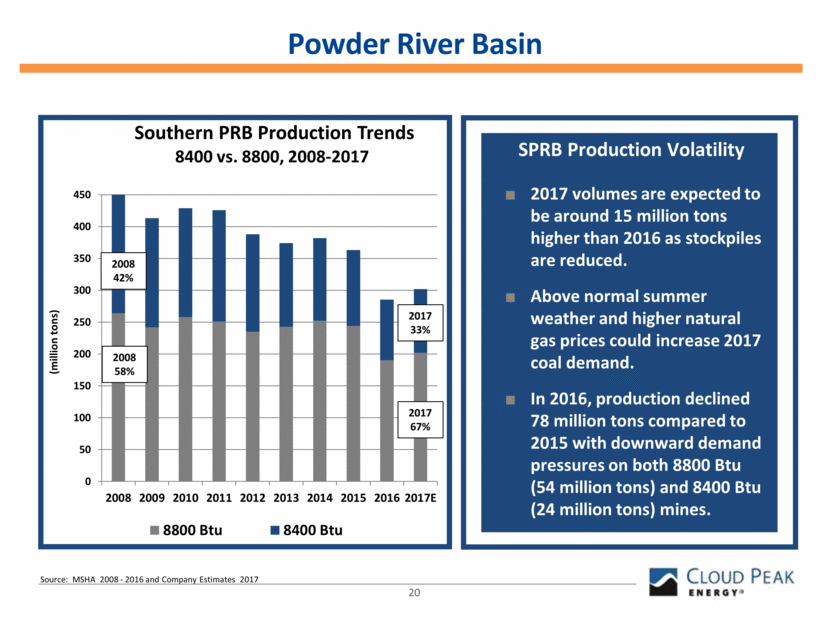
20 Powder River Basin 2008 42% 2008 58% 2017 33% 2017 67% Source: MSHA 2008 - 2016 and Company Estimates 2017 SPRB Production Volatility 2017 volumes are expected to be around 15 million tons higher than 2016 as stockpiles are reduced. Above normal summer weather and higher natural gas prices could increase 2017 coal demand. In 2016, production declined 78 million tons compared to 2015 with downward demand pressures on both 8800 Btu (54 million tons) and 8400 Btu (24 million tons) mines. 0 50 100 150 200 250 300 350 400 450 2008 2009 2010 2011 2012 2013 2014 2015 2016 2017E (million tons) Southern PRB Production Trends 8400 vs. 8800, 2008 - 2017 8800 Btu 8400 Btu
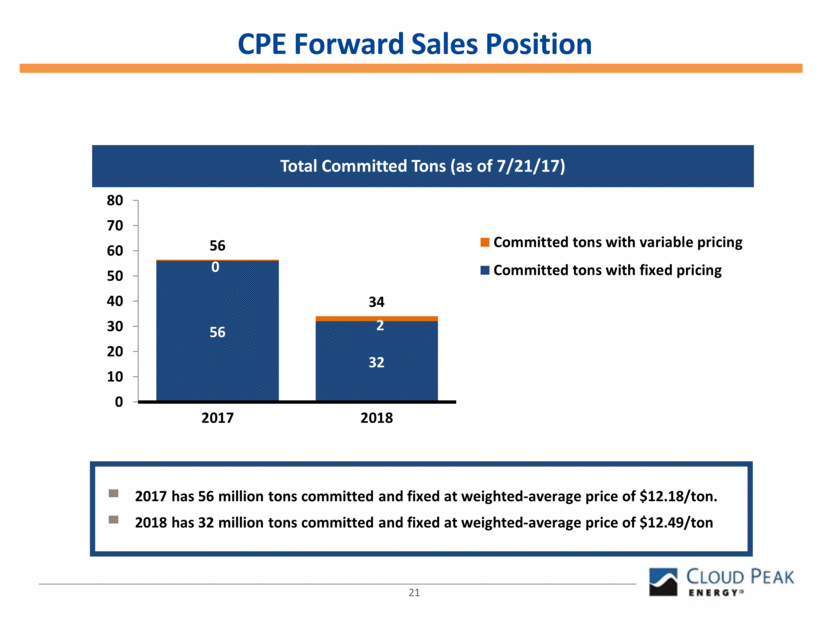
21 CPE Forward Sales Position 2017 has 56 million tons committed and fixed at weighted-average price of $12.18/ton. 2018 has 32 million tons committed and fixed at weighted-average price of $12.49/ton 56 32 0 2 56 34 0 10 20 30 40 50 60 70 80 2017 2018 Committed tons with variable pricing Committed tons with fixed pricing Total Committed Tons (as of 7/21/17)
Export Environment 22
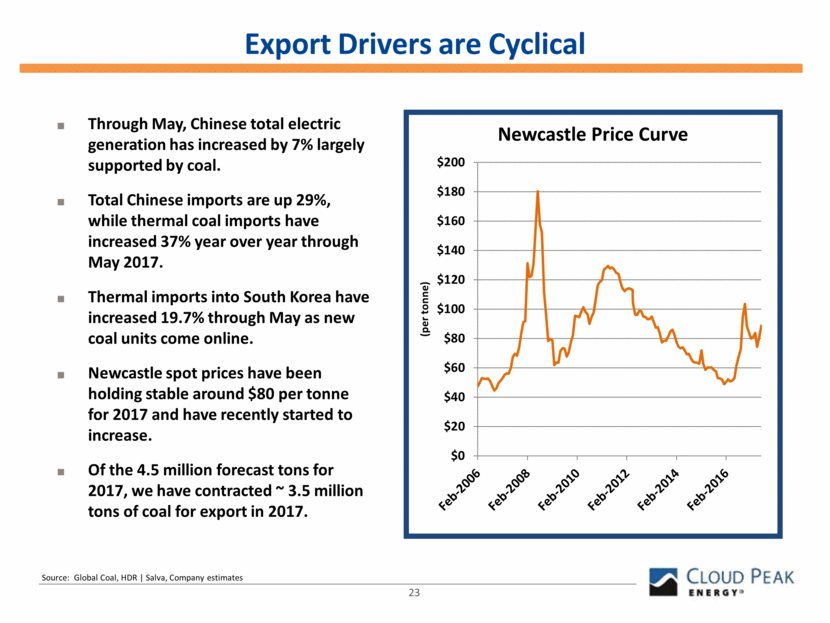
23 Through May, Chinese total electric generation has increased by 7% largely supported by coal. Total Chinese imports are up 29%, while thermal coal imports have increased 37% year over year through May 2017. Thermal imports into South Korea have increased 19.7% through May as new coal units come online. Newcastle spot prices have been holding stable around $80 per tonne for 2017 and have recently started to increase. Of the 4.5 million forecast tons for 2017, we have contracted ~ 3.5 million tons of coal for export in 2017. Source: Global Coal, HDR Salva, Company estimates Export Drivers are Cyclical $0 $20 $40 $60 $80 $100 $120 $140 $160 $180 $200 (per tonne) Newcastle Price Curve
Positioned to Capitalize on Improving Export Sales Optionality to Grow Exports We currently retain ~5.0 million tons of export capacity at Westshore for 2017 – 2018. We expect to export ~4.5 million tons during 2017, down from 5.0 million tons due to delays in ramping up rail service in the first quarter. We have shipped 1.8 million tons in first half of 2017 and have contracted 3.5 million tons of coal for export for the full year. (million tons) Export Tons $123 $103 $85 $71 $59 Avg. annual Newcastle benchmark ($/tonne) 24 $66 4.7 4.4 4.7 4.0 3.6 0.4 4.5 2011 2012 2013 2014 2015 2016 2017E
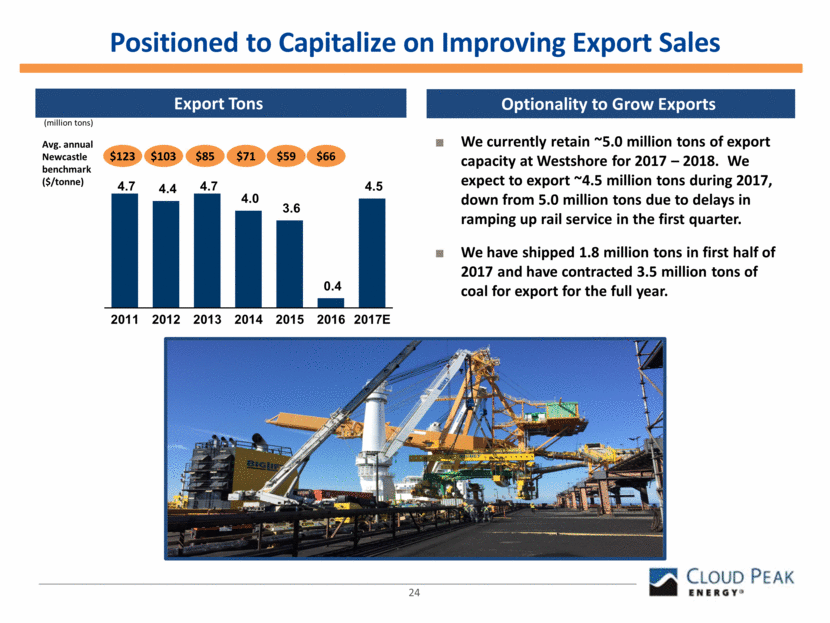
25 Cloud Peak Energy Terminal Position Westshore Terminal – Existing lowest cost, cape-size port Capesize vessels – deep-water port 5 million tons of port capacity in 2018 Proposed Millennium Bulk Terminal Panamax vessels Permitting process continues CPE has an option for up to 3 million tonnes per year at Stage 1 of development (total throughput of at least 10 million tonnes per year) and option for an additional 4 million tonnes per year at Stage 2 of development (total throughput of at least 30 million tonnes per year)
Appendix 26
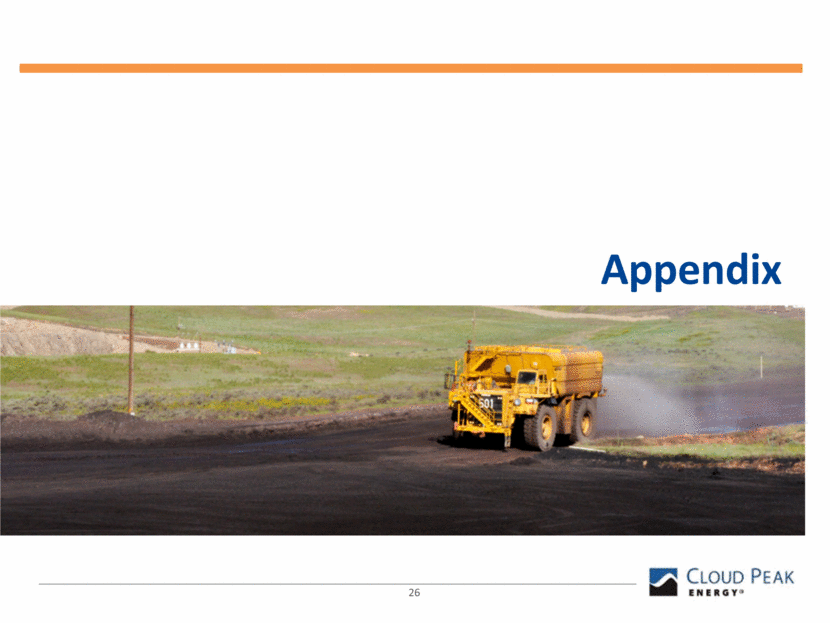
Note: Represents average cost of product sold for produced coal for our three mines. $10.19/ton $10.23/ton 2013 2014 2012 $9.57/ton 2015 $9.81/ton Royalties and taxes Labor Repairs, maintenance, and tires Fuel and lubricants Explosives Outside services Other mining costs 2016 $9.75/ton Average Cost of Produced Coal 27 36% 20% 15% 13% 6% 4% 6% 40% 20% 14% 12% 5% 4% 5% 37% 28% 14% 7% 6% 2% 6% 37% 21% 15% 12% 6% 4% 5% 38% 24% 15% 8% 6% 4% 5%
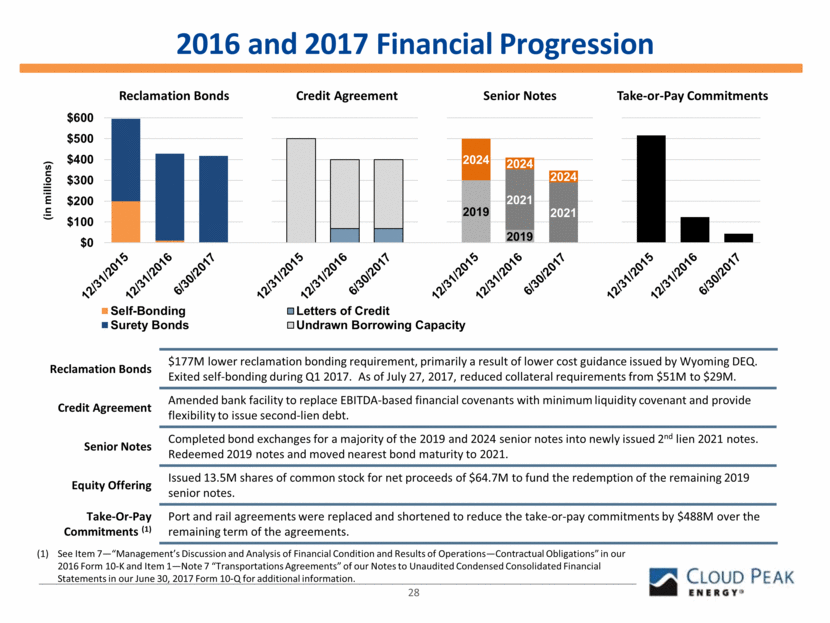
2016 and 2017 Financial Progression Reclamation Bonds Credit Agreement Senior Notes Take-or-Pay Commitments Reclamation Bonds $177M lower reclamation bonding requirement, primarily a result of lower cost guidance issued by Wyoming DEQ. Exited self-bonding during Q1 2017. As of July 27, 2017, reduced collateral requirements from $51M to $29M. Credit Agreement Amended bank facility to replace EBITDA-based financial covenants with minimum liquidity covenant and provide flexibility to issue second-lien debt. Senior Notes Completed bond exchanges for a majority of the 2019 and 2024 senior notes into newly issued 2nd lien 2021 notes. Redeemed 2019 notes and moved nearest bond maturity to 2021. Equity Offering Issued 13.5M shares of common stock for net proceeds of $64.7M to fund the redemption of the remaining 2019 senior notes. Take-Or-Pay Commitments (1) Port and rail agreements were replaced and shortened to reduce the take-or-pay commitments by $488M over the remaining term of the agreements. 28 (1) See Item 7—“Management’s Discussion and Analysis of Financial Condition and Results of Operations—Contractual Obligations” in our 2016 Form 10-K and Item 1—Note 7 “Transportations Agreements” of our Notes to Unaudited Condensed Consolidated Financial Statements in our June 30, 2017 Form 10-Q for additional information. 2019 2019 2021 2021 2024 2024 2024 $0 $100 $200 $300 $400 $500 $600 (in millions) Self-Bonding Letters of Credit Surety Bonds Undrawn Borrowing Capacity
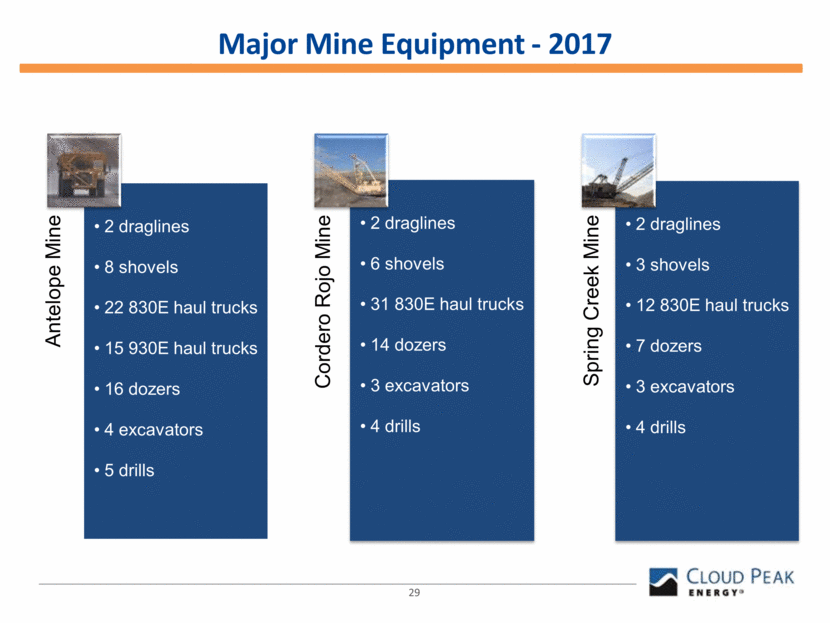
29 Major Mine Equipment - 2017 Antelope Mine 2 draglines 8 shovels 22 830E haul trucks 15 930E haul trucks 16 dozers 4 excavators 5 drills Cordero Rojo Mine 2 draglines 6 shovels 31 830E haul trucks 14 dozers 3 excavators 4 drills Spring Creek Mine 2 draglines 3 shovels 12 830E haul trucks 7 dozers 3 excavators 4 drills
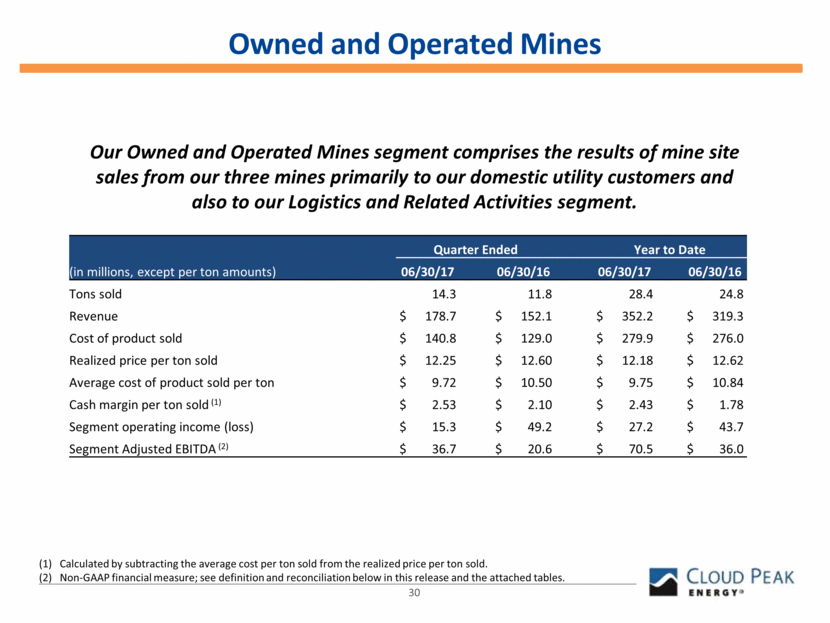
30 Owned and Operated Mines Our Owned and Operated Mines segment comprises the results of mine site sales from our three mines primarily to our domestic utility customers and also to our Logistics and Related Activities segment. Calculated by subtracting the average cost per ton sold from the realized price per ton sold. Non-GAAP financial measure; see definition and reconciliation below in this release and the attached tables. Quarter Ended Year to Date (in millions, except per ton amounts) 06/30/17 06/30/16 06/30/17 06/30/16 Tons sold 14.3 11.8 28.4 24.8 Revenue $ 178.7 $ 152.1 $ 352.2 $ 319.3 Cost of product sold $ 140.8 $ 129.0 $ 279.9 $ 276.0 Realized price per ton sold $ 12.25 $ 12.60 $ 12.18 $ 12.62 Average cost of product sold per ton $ 9.72 $ 10.50 $ 9.75 $ 10.84 Cash margin per ton sold (1) $ 2.53 $ 2.10 $ 2.43 $ 1.78 Segment operating income (loss) $ 15.3 $ 49.2 $ 27.2 $ 43.7 Segment Adjusted EBITDA (2) $ 36.7 $ 20.6 $ 70.5 $ 36.0
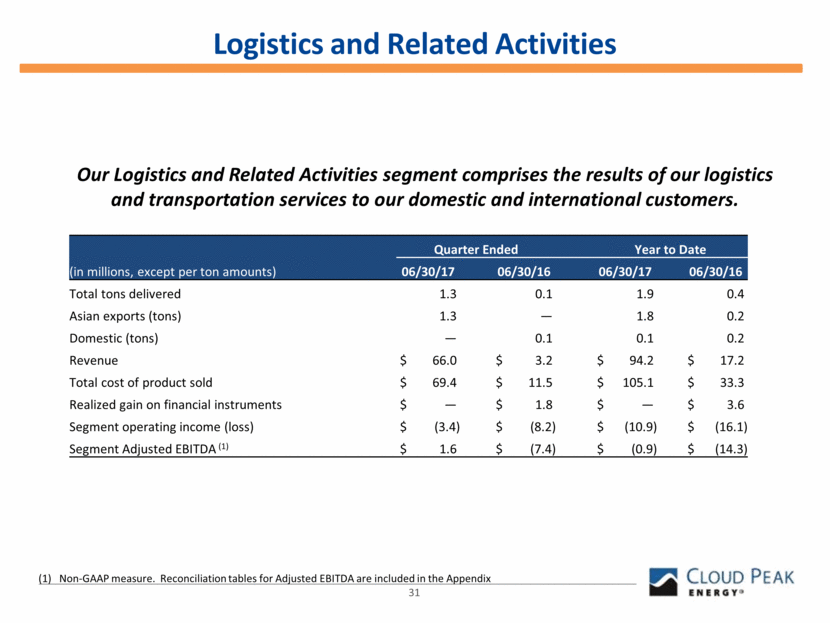
31 Logistics and Related Activities Our Logistics and Related Activities segment comprises the results of our logistics and transportation services to our domestic and international customers. (1) Non-GAAP measure. Reconciliation tables for Adjusted EBITDA are included in the Appendix Quarter Ended Year to Date (in millions, except per ton amounts) 06/30/17 06/30/16 06/30/17 06/30/16 Total tons delivered 1.3 0.1 1.9 0.4 Asian exports (tons) 1.3 — 1.8 0.2 Domestic (tons) — 0.1 0.1 0.2 Revenue $ 66.0 $ 3.2 $ 94.2 $ 17.2 Total cost of product sold $ 69.4 $ 11.5 $ 105.1 $ 33.3 Realized gain on financial instruments $ — $ 1.8 $ — $ 3.6 Segment operating income (loss) $ (3.4) $ (8.2) $ (10.9) $ (16.1) Segment Adjusted EBITDA (1) $ 1.6 $ (7.4) $ (0.9) $ (14.3)
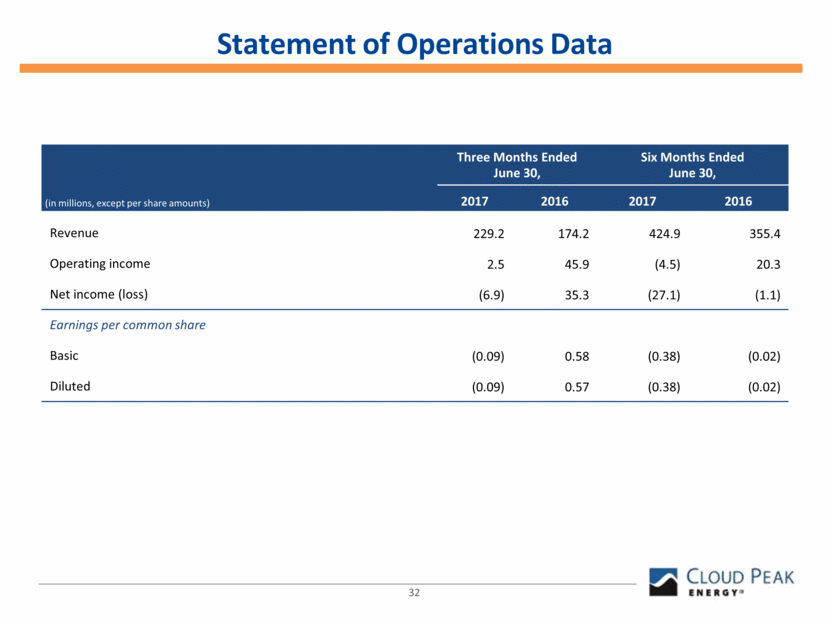
Three Months Ended June 30, Six Months Ended June 30, 2017 2016 2017 2016 Revenue 229.2 174.2 424.9 355.4 Operating income 2.5 45.9 (4.5) 20.3 Net income (loss) (6.9) 35.3 (27.1) (1.1) Earnings per common share Basic (0.09) 0.58 (0.38) (0.02) Diluted (0.09) 0.57 (0.38) (0.02) Statement of Operations Data 32 (in millions, except per share amounts)
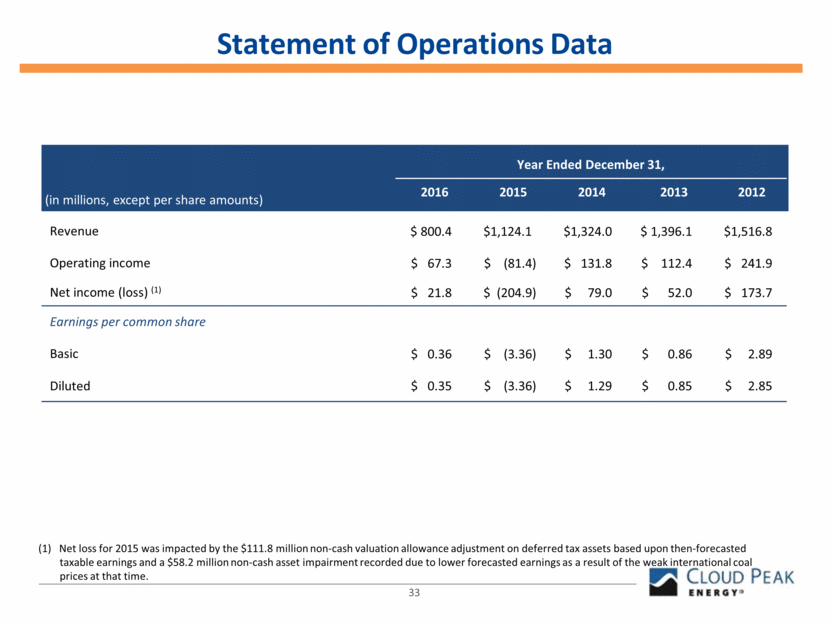
Revenue $ 800.4 $1,124.1 $1,324.0 $ 1,396.1 $1,516.8 Operating income $ 67.3 $ (81.4) $ 131.8 $ 112.4 $ 241.9 Net income (loss) (1) $ 21.8 $ (204.9) $ 79.0 $ 52.0 $ 173.7 Earnings per common share Basic $ 0.36 $ (3.36) $ 1.30 $ 0.86 $ 2.89 Diluted $ 0.35 $ (3.36) $ 1.29 $ 0.85 $ 2.85 Year Ended December 31, 2016 2015 2014 2013 2012 Statement of Operations Data 33 (in millions, except per share amounts) (1) Net loss for 2015 was impacted by the $111.8 million non-cash valuation allowance adjustment on deferred tax assets based upon then-forecasted taxable earnings and a $58.2 million non-cash asset impairment recorded due to lower forecasted earnings as a result of the weak international coal prices at that time.
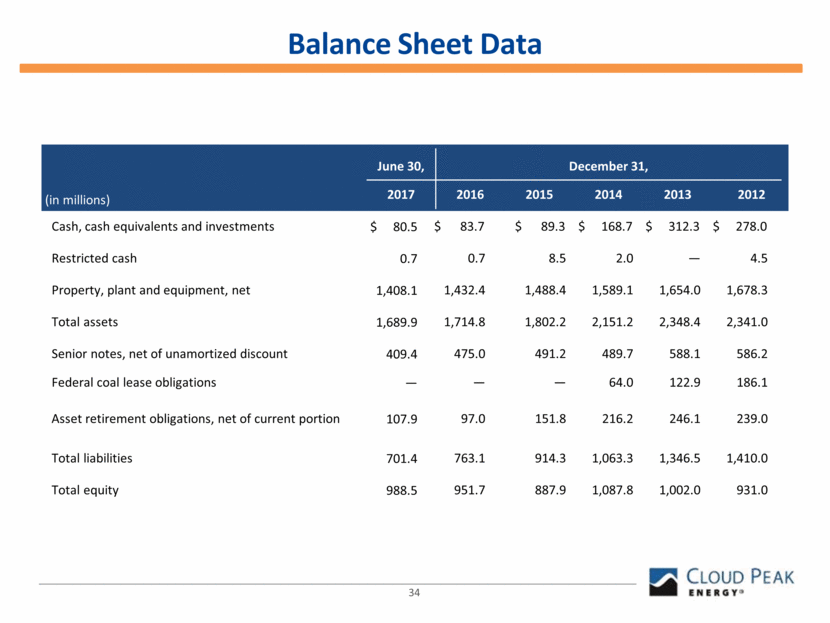
Cash, cash equivalents and investments $ 80.5 $ 83.7 $ 89.3 $ 168.7 $ 312.3 $ 278.0 Restricted cash 0.7 0.7 8.5 2.0 — 4.5 Property, plant and equipment, net 1,408.1 1,432.4 1,488.4 1,589.1 1,654.0 1,678.3 Total assets 1,689.9 1,714.8 1,802.2 2,151.2 2,348.4 2,341.0 Senior notes, net of unamortized discount 409.4 475.0 491.2 489.7 588.1 586.2 Federal coal lease obligations — — — 64.0 122.9 186.1 Asset retirement obligations, net of current portion 107.9 97.0 151.8 216.2 246.1 239.0 Total liabilities 701.4 763.1 914.3 1,063.3 1,346.5 1,410.0 Total equity 988.5 951.7 887.9 1,087.8 1,002.0 931.0 June 30, December 31, 2017 2016 2015 2014 2013 2012 Balance Sheet Data 34 (in millions)
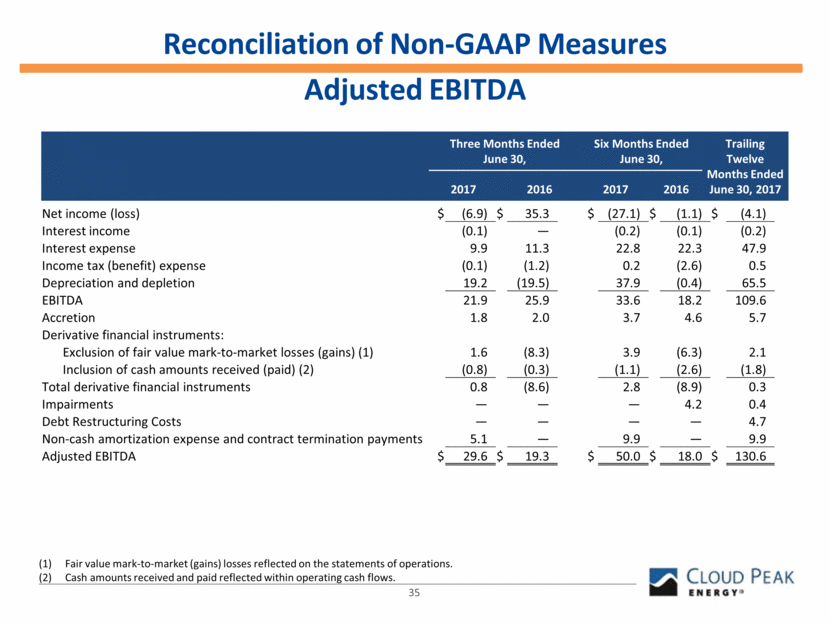
Reconciliation of Non-GAAP Measures Adjusted EBITDA 35 (1) Fair value mark-to-market (gains) losses reflected on the statements of operations. Cash amounts received and paid reflected within operating cash flows. (in millions) Net income (loss) $ (6.9) $ 35.3 $ (27.1) $ (1.1) $ (4.1) Interest income (0.1) — (0.2) (0.1) (0.2) Interest expense 9.9 11.3 22.8 22.3 47.9 Income tax (benefit) expense (0.1) (1.2) 0.2 (2.6) 0.5 Depreciation and depletion 19.2 (19.5) 37.9 (0.4) 65.5 EBITDA 21.9 25.9 33.6 18.2 109.6 Accretion 1.8 2.0 3.7 4.6 5.7 Derivative financial instruments: Exclusion of fair value mark-to-market losses (gains) (1) 1.6 (8.3) 3.9 (6.3) 2.1 Inclusion of cash amounts received (paid) (2) (0.8) (0.3) (1.1) (2.6) (1.8) Total derivative financial instruments 0.8 (8.6) 2.8 (8.9) 0.3 Impairments — — — 4.2 0.4 Debt Restructuring Costs — — — — 4.7 Non-cash amortization expense and contract termination payments 5.1 — 9.9 — 9.9 Adjusted EBITDA $ 29.6 $ 19.3 $ 50.0 $ 18.0 $ 130.6 Three Months Ended June 30, Six Months Ended June 30, Trailing Twelve Months Ended June 30, 2017 2017 2016 2017 2016
Year Ended December 31, 2016 2015 2014 2013 2012 (1) Changes to related deferred taxes are included in income tax expense. (2) Fair value mark-to-market (gains) losses reflected on the statement of operations. (3) Cash amounts received and paid reflected within operating cash flows. (4) Excludes premiums paid at option contract inception of $5.8 million and $4.0 million during the years ended December 31, in 2015 and 2014, respectively, for original settlement dates in subsequent years. (5) Non-cash impairments of $33.4 million related to goodwill at the Cordero Rojo Mine, $52.2 million of port access rights, and $6.0 million related to our investment in GPT during the year ended December 31, 2015. Reconciliation of Non-GAAP Measures Adjusted EBITDA 36 (in millions) Net income (loss) $ 21.8 $ (204.9) $ 79.0 $ 52.0 $ 173.7 Interest income (0.1) (0.2) (0.3) (0.4) (1.1) Interest expense 47.4 47.6 77.2 41.7 36.3 Income tax expense (benefit) (2.2) 77.4 34.9 11.6 62.6 Depreciation and depletion 27.2 66.1 112.0 100.5 94.6 Amortization of port access rights — 3.7 — — — EBITDA $ 94.1 $ (10.4) $ 302.8 $ 205.3 $ 366.1 Accretion 6.6 12.6 15.1 15.3 13.2 Tax agreement expense (benefit) (1) — — (58.6) 10.5 (29.0) Derivative financial instruments: Exclusion of fair value mark-to-market losses (gains) (2) (8.2) 30.6 (7.8) (25.6) (22.8) Inclusion of cash amounts received (paid) (3)(4) (3.3) (0.6) 24.7 13.0 11.2 Total derivative financial instruments (11.5) 30.0 16.9 (12.6) (11.6) Impairments (5) 4.6 91.5 — — — Gain on sale of Decker Mine interest — — (74.3) — — Debt restructuring costs 4.7 — — — — Adjusted EBITDA $ 98.6 $ 123.8 $ 201.9 $ 218.6 $ 338.8
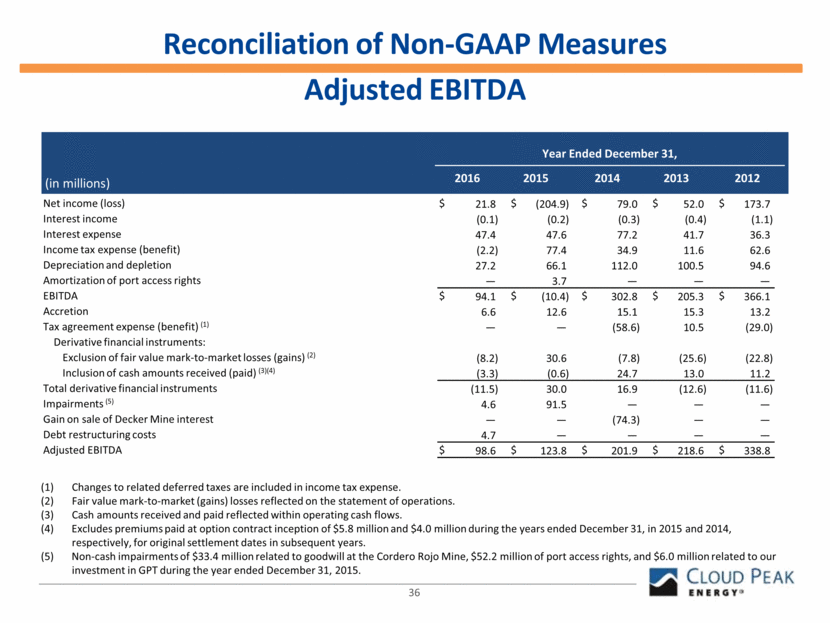
Adjusted EBITDA by Segment 37 (in millions) Three Months Ended Six Months Ended June 30, June 30, (in millions) 2017 2016 2017 2016 Net income (loss) $ (6.9) $ 35.3 $ (27.1) $ (1.1) Interest income (0.1) — (0.2) (0.1) Interest expense 9.9 11.3 22.8 22.3 Other, net 0.1 0.2 0.4 0.6 Income tax expense (benefit) (0.1) (1.2) 0.2 (2.6) (Income) loss from unconsolidated affiliates, net of tax (0.3) 0.3 (0.6) 1.1 Consolidated operating income (loss) $ 2.5 $ 45.9 $ (4.5) $ 20.3 Owned and Operated Mines Operating income (loss) $ 15.3 $ 49.2 $ 27.2 $ 43.7 Depreciation and depletion 19.1 (19.9) 37.5 (1.1) Accretion 1.7 1.9 3.4 4.3 Derivative financial instruments: Exclusion of fair value mark-to-market (gains) losses 1.6 (8.3) 3.9 (6.3) Inclusion of cash amounts received (paid) (0.8) (2.1) (1.1) (6.2) Total derivative financial instruments 0.8 (10.4) 2.8 (12.5) Impairments — — — 2.2 Other (0.2) (0.2) (0.4) (0.6) Adjusted EBITDA $ 36.7 $ 20.6 $ 70.5 $ 36.0 Logistics and Related Activities Operating income (loss) $ (3.4) $ (8.2) $ (10.9) $ (16.1) Derivative financial instruments: Inclusion of cash amounts received (paid) — 1.8 — 3.6 Total derivative financial instruments — 1.8 — 3.6 Non-cash throughput amortization expense and contract termination payments 5.1 — 9.9 — Other (0.1) (1.0) 0.1 (1.8) Adjusted EBITDA $ 1.6 $ (7.4) $ (0.9) $ (14.3) Other Operating income (loss) $ (9.9) $ 5.1 $ (20.9) $ (7.3) Depreciation and depletion 0.2 0.3 0.4 0.7 Accretion 0.2 0.1 0.3 0.3 Impairment — 0.1 — 2.0 Other 0.3 0.5 0.7 0.7 Adjusted EBITDA $ (9.2) $ 6.1 $ (19.5) $ (3.6) Eliminations Operating income (loss) $ 0.5 $ (0.1) $ — $ (0.1) Adjusted EBITDA $ 0.5 $ (0.1) $ — $ (0.1)
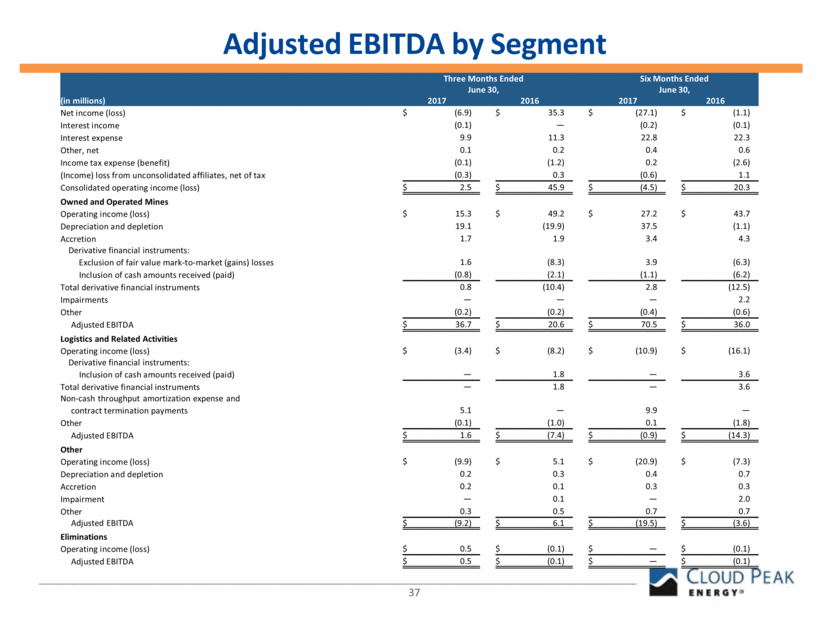
Former non-operating interest divested by Cloud Peak Energy in September 2014. Represents only the three company-operated mines. Q2 Q1 Q4 Q3 Q2 Year Year Year Year Year 2017 2017 2016 2016 2016 2016 2015 2014 2013 2012 Tons sold Antelope Mine 6,712 7,375 8,070 8,612 6,273 29,807 35,167 33,647 31,354 34,316 Cordero Rojo Mine 4,227 4,441 5,562 5,492 3,608 18,332 22,872 34,809 36,670 39,205 Spring Creek Mine 3,390 2,210 3,111 2,854 1,946 10,348 17,027 17,443 18,009 17,102 Decker Mine (50% interest)(1) — — — — — — — 1,079 1,519 1,441 Total tons sold 14,328 14,026 16,743 16,958 11,827 58,487 75,066 86,978 87,552 92,064 Average realized price per ton sold(2) $12.25 $12.10 $12.15 $12.33 $12.60 $12.40 $12.79 $13.01 $13.08 $13.19 Average cost of product sold per ton(2) $9.72 $ 9.78 $ 8.96 $ 8.95 $10.50 $ 9.75 $ 9.81 $10.19 $10.23 $ 9.57 Other Data 38 (in millions)
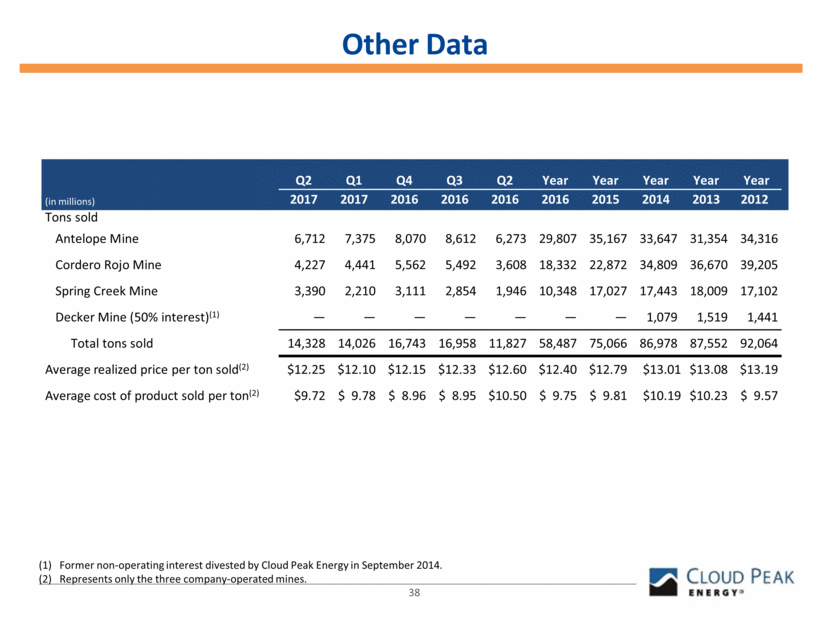
High Quality Customer Base Our Deliveries to Power Plants in 2016 39
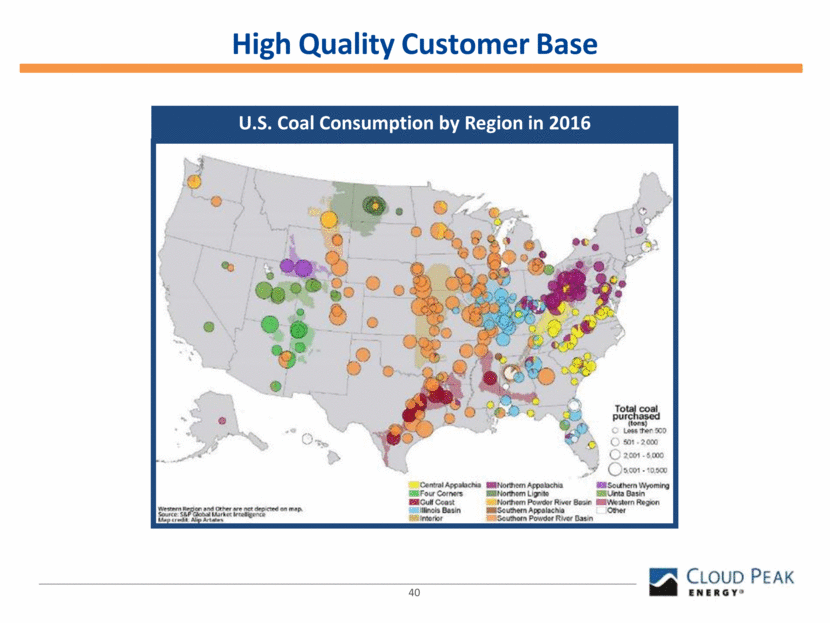
High Quality Customer Base U.S. Coal Consumption by Region in 2016 40
