Attached files
| file | filename |
|---|---|
| EX-95.1 - EX-95.1 - CLOUD PEAK ENERGY INC. | a17-1132_1ex95d1.htm |
| EX-32.2 - EX-32.2 - CLOUD PEAK ENERGY INC. | a17-1132_1ex32d2.htm |
| EX-32.1 - EX-32.1 - CLOUD PEAK ENERGY INC. | a17-1132_1ex32d1.htm |
| EX-31.2 - EX-31.2 - CLOUD PEAK ENERGY INC. | a17-1132_1ex31d2.htm |
| EX-31.1 - EX-31.1 - CLOUD PEAK ENERGY INC. | a17-1132_1ex31d1.htm |
| EX-23.2 - EX-23.2 - CLOUD PEAK ENERGY INC. | a17-1132_1ex23d2.htm |
| EX-23.1 - EX-23.1 - CLOUD PEAK ENERGY INC. | a17-1132_1ex23d1.htm |
| EX-21.1 - EX-21.1 - CLOUD PEAK ENERGY INC. | a17-1132_1ex21d1.htm |
| EX-12.1 - EX-12.1 - CLOUD PEAK ENERGY INC. | a17-1132_1ex12d1.htm |
| EX-10.57 - EX-10.57 - CLOUD PEAK ENERGY INC. | a17-1132_1ex10d57.htm |
| EX-10.54 - EX-10.54 - CLOUD PEAK ENERGY INC. | a17-1132_1ex10d54.htm |
| EX-10.48 - EX-10.48 - CLOUD PEAK ENERGY INC. | a17-1132_1ex10d48.htm |
UNITED STATES
SECURITIES AND EXCHANGE COMMISSION
WASHINGTON, DC 20549
FORM 10-K
|
(Mark One) | |
|
x |
ANNUAL REPORT PURSUANT TO SECTION 13 OR 15(d) OF THE SECURITIES EXCHANGE ACT OF 1934 |
|
|
|
|
|
For the fiscal year ended December 31, 2016 |
|
|
or |
|
o |
TRANSITION REPORT PURSUANT TO SECTION 13 OR 15(d) OF THE SECURITIES EXCHANGE ACT OF 1934 |
|
|
|
|
|
For the transition period from to |
Commission File Number: 001-34547

Cloud Peak Energy Inc.
(Exact name of registrant as specified in its charter)
|
|
|
|
|
Delaware |
|
26-3088162 |
|
(State or other jurisdiction of |
|
(I.R.S. Employer |
|
|
|
|
|
505 S. Gillette Ave., Gillette, Wyoming |
|
82716 |
|
(Address of principal executive offices) |
|
(Zip Code) |
(307) 687-6000
(Registrant’s telephone number, including area code)
Securities registered pursuant to Section 12(b) of the Act:
|
Title of each class |
|
Name of each exchange on which registered |
|
Common Stock, par value $0.01 per share |
|
New York Stock Exchange |
Securities registered pursuant to Section 12(g) of the Act:
None
Indicate by check mark if the registrant is a well-known seasoned issuer, as defined in Rule 405 of the Securities Act. Yeso Nox
Indicate by check mark if the registrant is not required to file reports pursuant to Section 13 or Section 15(d) of the Act. Yeso Nox
Indicate by check mark whether the registrant (1) has filed all reports required to be filed by Section 13 or 15(d) of the Securities Exchange Act of 1934 during the preceding 12 months (or for such shorter period that the registrant was required to file such reports), and (2) has been subject to such filing requirements for the past 90 days. Yesx Noo
Indicate by check mark whether the registrant has submitted electronically and posted on its corporate Web site, if any, every Interactive Data File required to be submitted and posted pursuant to Rule 405 of Regulation S-T (§ 232.405 of this chapter) during the preceding 12 months (or for such shorter period that the registrant was required to submit and post such files). Yesx Noo
Indicate by check mark if disclosure of delinquent filers pursuant to Item 405 of Regulation S-K (§ 229.405) is not contained herein, and will not be contained, to the best of registrant’s knowledge, in definitive proxy or information statements incorporated by reference in Part III of this Form 10-K or any amendment to this Form 10-K. x
Indicate by check mark whether the registrant is a large accelerated filer, an accelerated filer, a non-accelerated filer, or a smaller reporting company. See the definitions of “large accelerated filer,” “accelerated filer” and “smaller reporting company” in Rule 12b-2 of the Exchange Act. (Check one):
|
Large |
Accelerated |
Non-accelerated filer |
Smaller |
|
o |
x |
o |
o |
Indicate by check mark whether the registrant is a shell company (as defined in Rule 12b-2 of the Exchange Act). Yeso Nox
As of June 30, 2016, the last business day of Cloud Peak Energy Inc.’s most recently completed second fiscal quarter, the aggregate market value of the voting and non-voting common stock held by non-affiliates of Cloud Peak Energy Inc. was approximately $126 million based on the closing price of Cloud Peak Energy Inc.’s common stock as reported that day on the New York Stock Exchange of $2.06 per share. In determining this figure, Cloud Peak Energy Inc. has assumed that all of its directors and executive officers are affiliates. Such assumptions should not be deemed conclusive for any other purpose.
Number of shares outstanding of Cloud Peak Energy Inc.’s common stock, as of the latest practicable date: Common stock, $0.01 par value per share, 61,464,793 shares outstanding as of February 8, 2017.
DOCUMENTS INCORPORATED BY REFERENCE
Portions of Cloud Peak Energy Inc.’s proxy statement to be filed with the Securities and Exchange Commission in connection with Cloud Peak Energy Inc.’s 2017 annual meeting of stockholders (the “Proxy Statement”) are incorporated by reference into Part III hereof. Other documents incorporated by reference in this report are listed in the Exhibit Index of this Form 10-K.
CLOUD PEAK ENERGY INC.
Unless the context indicates otherwise, the terms “Cloud Peak Energy,” the “Company,” “we,” “us,” and “our” refer to Cloud Peak Energy Inc. and its subsidiaries.
CAUTIONARY NOTICE REGARDING FORWARD-LOOKING STATEMENTS
This report contains forward-looking statements that involve substantial risks and uncertainties. You can identify these statements by forward-looking words such as “anticipate,” “believe,” “could,” “estimate,” “expect,” “intend,” “may,” “plan,” “potential,” “should,” “will,” “would,” or similar words. You should read statements that contain these words carefully because they discuss our current plans, strategies, prospects, and expectations concerning our business, operating results, financial condition, and other similar matters. While we believe that these forward-looking statements are reasonable as and when made, there may be events in the future that we are not able to predict accurately or control, and there can be no assurance that future developments affecting our business will be those that we anticipate. Additionally, all statements concerning our expectations regarding future operating results are based on current forecasts for our existing operations and do not include the potential impact of any future acquisitions. The factors listed under “Risk Factors,” as well as any cautionary language in this report, describe the known material risks, uncertainties, and events that may cause our actual results to differ materially and adversely from the expectations we describe in our forward-looking statements. Additional factors or events that may emerge from time to time, or those that we currently deem to be immaterial, could cause our actual results to differ, and it is not possible for us to predict all of them. You are cautioned not to place undue reliance on the forward-looking statements contained herein. We undertake no obligation to update or revise publicly any forward-looking statements, whether as a result of new information, future events, or otherwise, except as required by law. The following factors are among those that may cause actual results to differ materially and adversely from our forward-looking statements:
· the timing and extent of any sustained recovery of the currently depressed coal industry, domestically and internationally, and the impact of ongoing or further depressed industry conditions on our financial performance, liquidity, and financial covenant compliance;
· the prices we receive for our coal and logistics services, our ability to effectively execute our forward sales strategy, and changes in utility purchasing patterns resulting in decreased long-term purchases of coal;
· the timing of reductions or increases in customer coal inventories;
· our ability to obtain new coal sales agreements on favorable terms, to resolve customer requests for reductions or deferrals, and to respond to any cancellations of their committed volumes on terms that preserve the amount and timing of our forecasted economic value;
· the impact of increasingly variable and less predictable demand for thermal coal based on natural gas prices, summer cooling demand, winter heating demand, economic growth rates, and other factors that impact overall demand for electricity;
· our ability to efficiently and safely conduct our mining operations and to adjust our planned production levels to respond to market conditions and effectively manage the costs of our operations;
· competition with other producers of coal and with traders and re-sellers of coal, including the current oversupply of thermal coal, the impacts of currency exchange rate fluctuations and the strong U.S. dollar, and government environmental, energy and tax policies and regulations that make foreign coal producers more competitive for international transactions;
· the impact of coal industry bankruptcies on our competitive position relative to other companies who may emerge from bankruptcy with reduced leverage and potentially reduced operating costs;
· competition with natural gas, wind, solar, and other non-coal energy resources, which may continue to increase as a result of low domestic natural gas prices, the declining cost of renewables and due to environmental, energy and tax policies, regulations, subsidies, and other government actions that encourage or mandate use of alternative energy sources;
· coal-fired power plant capacity and utilization, including the impact of climate change and other environmental regulations and initiatives, energy policies, political pressures, NGO activities, international treaties or agreements and other factors that may cause domestic and international electric utilities to continue to phase out or close existing coal-fired power plants, reduce or eliminate construction of any new coal-fired power plants, or reduce consumption of coal from the PRB;
· the failure of economic, commercially available carbon capture technology to be developed and adopted by utilities in a timely manner;
· the impact of “keep coal in the ground” campaigns and other well-funded, anti-coal initiatives by environmental activist groups and others targeting substantially all aspects of our industry;
· our ability to offset declining U.S. demand for coal and achieve longer term growth in our business through our logistics revenue and export sales, including the significant impact of Chinese and Indian thermal coal import demand and production levels from other basins on overall seaborne coal prices;
· railroad, export terminal and other transportation performance, costs and availability, including the availability of sufficient and reliable rail capacity to transport PRB coal, the development of future export terminal capacity and our ability to access capacity on commercially reasonable terms;
· the impact of our rail and terminal take-or-pay commitments if we do not meet our required export shipment obligations;
· weather conditions and weather-related damage that impact our mining operations, our customers, or transportation infrastructure;
· operational, geological, equipment, permit, labor, and other risks inherent in surface coal mining;
· future development or operating costs for our development projects exceeding our expectations;
· our ability to successfully acquire coal and appropriate land access rights at economic prices and in a timely manner and our ability to effectively resolve issues with conflicting mineral development that may impact our mine plans;
· the impact of asset impairment charges if required as a result of challenging industry conditions or other factors;
· our plans and objectives for future operations and the development of additional coal reserves, including risks associated with acquisitions;
· the impact of current and future environmental, health, safety, endangered species and other laws, regulations, treaties, executive orders, court decisions or governmental policies, or changes in interpretations thereof and third-party regulatory challenges, including additional requirements, uncertainties, costs, liabilities or restrictions adversely affecting the use, demand or price for coal, our mining operations or the logistics, transportation, or terminal industries;
· the impact of required regulatory processes and approvals to lease coal and obtain permits for coal mining operations or to transport coal to domestic and foreign customers, including third-party legal challenges to regulatory approvals that are required for some or all of our current or planned mining activities and the recent moratorium on federal coal leasing or other unfavorable regulatory changes to the LBA and coal permitting processes;
· any increases in rates or changes in regulatory interpretations or assessment methodologies with respect to royalties or severance and production taxes and the potential impact of associated interest and penalties, including the impact of recently finalized federal royalty rule changes for non-arm’s length sales;
· inaccurately estimating the costs or timing of our reclamation and mine closure obligations and our assumptions underlying reclamation and mine closure obligations;
· our ability to obtain required surety bonds and provide any associated collateral on commercially reasonable terms;
· the availability of, disruptions in delivery or increases in pricing from third-party vendors of raw materials, capital equipment and consumables which are necessary for our operations, such as explosives, petroleum-based fuel, tires, steel, and rubber;
· our assumptions concerning coal reserve estimates;
· our relationships with, and other conditions affecting, our customers (including our largest customers who account for a significant portion of our total revenue) and other counterparties, including economic conditions and the credit performance and credit risks associated with our customers and other counterparties, such as traders, brokers, and lenders under our Credit Agreement (as defined below) and financial institutions with whom we maintain accounts or enter hedging arrangements;
· the results of our hedging programs for domestic and international coal sales and diesel fuel costs and changes in the fair value of derivative financial instruments that are not accounted for as hedges;
· the terms and restrictions of our indebtedness;
· liquidity constraints, access to capital and credit markets and availability and costs of credit, surety bonds, letters of credit, and insurance, including risks resulting from the cost or unavailability of financing due to debt and equity capital and credit market conditions for the coal sector or in general, changes in our credit rating, our compliance with the covenants in our debt agreements, the increasing credit pressures on our industry due to depressed conditions, or any demands for increased collateral by our surety bond providers;
· volatility in the price of our common stock, including the impact of any delisting of our stock from the NYSE if we fail to meet the minimum average closing price listing standard;
· our liquidity, results of operations, and financial condition generally, including amounts of working capital that are available;
· litigation and other contingencies;
· the authority of federal and state regulatory authorities to order any of our mines to be temporarily or permanently closed under certain circumstances; and
· other risk factors or cautionary language described from time to time in the reports and registration statements we file with the SEC, including those in Item 1A of this Form 10-K.
GLOSSARY FOR SELECTED TERMS
Anthracite. Anthracite is the highest rank coal. It is hard, shiny (or lustrous), has a high heat content, and little moisture. Anthracite is used in residential and commercial heating as well as a mix of industrial applications. Some waste products from anthracite piles are used in energy generation.
A/R Securitization Program. Our accounts receivable securitization program.
Ash. Inorganic material consisting of iron, alumina, sodium, and other incombustible matter that remain after the combustion of coal. The composition of the ash can affect the burning characteristics of coal.
Assigned reserves. Reserves that are committed to our surface mine operations with operating mining equipment and plant facilities. All our reported reserves are considered to be assigned reserves.
Bituminous coal. The most common type of coal that is between subbituminous and anthracite in rank. Bituminous coal produced from the central and eastern U.S. coal fields typically have moisture content less than 20% by weight and heating value of 10,500 to 14,000 Btus.
BLM. Department of the Interior, Bureau of Land Management.
BNSF. Burlington Northern Santa Fe Railroad.
Btu. British thermal unit. A measure of the thermal energy required to raise the temperature of one pound of pure liquid water one degree Fahrenheit at the temperature at which water has its greatest density (39 degrees Fahrenheit).
CAA. Clean Air Act.
CAIR. Clean Air Interstate Rule.
CEQ. Council on Environmental Quality.
CO2. Carbon dioxide. A gaseous chemical compound that is generated, among other ways, as a by-product of the combustion of fossil fuels, including coal, or the burning of vegetable matter.
CPE Inc. Cloud Peak Energy Inc., a Delaware corporation.
CPE Resources. Cloud Peak Energy Resources LLC, a Delaware limited liability company, formerly known as Rio Tinto Sage LLC, which is the sole direct subsidiary of CPE Inc.
Coal seam. Coal deposits occur in layers typically separated by layers of rock. Each layer is called a “seam.” A coal seam can vary in thickness from inches to a hundred feet or more.
Coalbed methane. Also referred to as CBM or coalbed natural gas (“CBNG”). Coalbed methane is methane gas formed during the coalification process and stored within the coal seam.
Coke. A hard, dry carbon substance produced by heating coal to a very high temperature in the absence of air. Coke is used in the manufacture of iron and steel.
Compliance coal. Coal that when combusted emits no greater than 1.2 pounds of sulfur dioxide per million Btus and requires no blending or sulfur-reduction technology to comply with current sulfur dioxide emissions under the Clean Air Act.
Credit Agreement. Our revolving credit agreement with PNC Bank, National Association, as administrative agent, and a syndicate of lenders, as amended.
CSAPR. Cross-State Air Pollution Rule.
Dragline. A large excavating machine used in the surface mining process to remove overburden. A dragline has a large bucket suspended from the end of a boom, which may be 275 feet long or larger. The bucket is suspended by cables and capable of scooping up significant amounts of overburden as it is pulled across the excavation area. The dragline, which can “walk” on large pontoon-like “feet,” is one of the largest land-based machines in the world.
EIA. Energy Information Administration.
EIS. Environmental Impact Statement.
EPA. United States Environmental Protection Agency.
Force majeure. An event not anticipated as of the date of the applicable contract, which is not within the reasonable control of the party affected by such event, which partially or entirely prevents such party’s ability to perform its contractual obligations. During the duration of such force majeure but for no longer period, the obligations of the party affected by the event may be excused to the extent required.
Fossil fuel. A hydrocarbon such as coal, petroleum, or natural gas that may be used as a fuel.
GHG. Greenhouse gas.
GW. Gigawatts.
Highwalls. The unexcavated face of exposed overburden and coal in a surface mine.
IR. Incident rate. The rate of injury occurrence, as determined by MSHA, based on 200,000 hours of employee exposure and calculated as follows:
IR = (number of cases x 200,000) / hours of employee exposure.
LBA. Lease by Application. Before a mining company can obtain new coal leases on federal land, the company must nominate lands for lease. The BLM then reviews the proposed tract to ensure maximum coal recovery. The BLM also requires completion of a detailed environmental assessment or an EIS, and then schedules a competitive lease sale. Lease sales must meet fair market value as determined by the BLM. The process is known as Lease by Application. After a lease is awarded, the BLM also has the responsibility to assure development of the resource is conducted in a fashion that achieves maximum economic recovery.
LBM. Lease by Modification. A process of acquiring federal coal through a non-competitive leasing process. An LBM is used in circumstances where a lessee is seeking to modify an existing federal coal lease by adding less than 960 acres in a configuration that is deemed non-competitive to other coal operators.
Lbs SO2/mmBtu. Pounds of sulfur dioxide emitted per million Btu of heat generated.
Lignite. The lowest rank of coal. It is brownish-black with a high moisture content commonly above 35% by weight and heating value commonly less than 8,000 Btu.
LMU. Logical Mining Unit. A combination of contiguous federal coal leases that allows the production of coal from any of the individual leases within the LMU to be used to meet the continuous operation requirements for the entire LMU.
MATS. Mercury and Air Toxics Standards (formerly Utility Maximum Achievable Control Technology, or Utility MACTS).
Metallurgical coal. The various grades of coal suitable for carbonization to make coke for steel manufacture. Also known as “met” coal, it possesses four important qualities: volatility, which affects coke yield; the level of impurities, which affects coke quality; composition, which affects coke strength; and basic characteristics, which affect coke oven safety. Metallurgical coal has a particularly high Btu, but low ash content.
MSHA. Mine Safety and Health Administration.
NAAQ. National Ambient Air Quality.
NEPA. National Environmental Policy Act.
NGO. Non-governmental organization.
NOx. Nitrogen oxides. NOx represents both nitrogen dioxide (“NO2”) and nitrogen trioxide (“NO3”), which are gases formed in high temperature environments, such as coal combustion. It is a harmful pollutant that contributes to acid rain and is a precursor of ozone.
Non-reserve coal deposits. Non-reserve coal deposits are coal bearing bodies that have been sufficiently sampled and analyzed in trenches, outcrops, drilling, and underground workings to assume continuity between sample points, and therefore warrant further exploration work. However, this coal does not qualify as commercially viable coal reserves as prescribed by SEC standards until a final comprehensive evaluation based on unit cost per ton, recoverability, and other material factors concludes legal and economic feasibility. Non-reserve coal deposits may be classified as such by either limited property control or geologic limitation, or both.
Northern PRB. The area within the PRB that lies within Montana and the northern part of Sheridan County, Wyoming.
NYSE. New York Stock Exchange.
ONRR. Department of the Interior, Office of Natural Resources Revenue.
QSO. Qualified Surface Owner. A status attributed by the BLM to a certain class of surface owners of split estate lands which allow the QSO to prohibit leasing of federal coal without their explicit consent.
Overburden. Layers of earth and rock covering a coal seam. In surface mining operations, overburden is removed prior to coal extraction.
PRB. Powder River Basin. Coal producing area in northeastern Wyoming and southeastern Montana.
Preparation plant. Usually located on a mine site, although one plant may serve several mines. A preparation plant is a facility for crushing, sizing, and washing coal to prepare it for use by a particular customer. The washing process separates higher ash coal and may also remove some of the coal’s sulfur content.
Probable reserves. Reserves for which quantity and grade and/or quality are computed from information similar to that used for proven reserves, but the sites for inspection, sampling, and measurement are farther apart or are otherwise less adequately spaced. The degree of assurance, although lower than that for proven reserves, is high enough to assume continuity between points of observation.
Proven reserves. Reserves for which: (a) quantity is computed from dimensions revealed in outcrops, trenches, workings, or drill holes; grade and/or quality are computed from the results of detailed sampling; and (b) the sites for inspection, sampling, and measurement are spaced so closely and the geologic character is so well defined that size, shape, depth, and mineral content of reserves are well-established.
Reclamation. The process of restoring land to its prior condition, productive use, or other permitted condition following mining activities. The process commonly includes “recontouring” or reshaping the land to its approximate original appearance, restoring topsoil, and planting native grass and shrubs. Reclamation operations are typically conducted concurrently with coal mining operations. Reclamation is closely regulated by both state and federal laws.
Reserve. That part of a mineral deposit that could be economically and legally extracted or produced at the time of the reserve determination.
Rio Tinto. Rio Tinto plc and Rio Tinto Limited and their direct and indirect subsidiaries, including Rio Tinto Energy America Inc. (“RTEA”), our predecessor for accounting purposes; Kennecott Management Services Company (“KMS”); and Rio Tinto America Inc. (“RTA”), which is the owner of RTEA and KMS.
Riparian habitat. Areas adjacent to rivers and streams with a differing density, diversity, and productivity of plant and animal species relative to nearby uplands.
Riverine habitat. A habitat occurring along a river.
Scrubber. Any of several forms of chemical physical devices which operate to control sulfur compounds formed during coal combustion. An example of a scrubber is a flue gas desulfurization unit.
SEC. Securities and Exchange Commission.
SMCRA. Surface Mining Control and Reclamation Act of 1977.
Spoil-piles. Pile used for any dumping of waste material or overburden material, particularly used during the dragline method of mining.
Subbituminous coal. Black coal that ranks between lignite and bituminous coal. Subbituminous coal produced from the PRB has moisture content between 20% to over 30% by weight, and its heat content ranges from 8,000 to 9,500 Btus.
Sulfur. One of the elements present in varying quantities in coal. Sulfur dioxide (“SO2”) is produced as a gaseous by-product of coal combustion.
Sulfur dioxide emission allowance. A tradable authorization to emit sulfur dioxide. Under Title IV of the Clean Air Act, one allowance permits the emission of one ton of sulfur dioxide.
Surface mine. A mine in which the coal lies near the surface and can be extracted by removing the covering layer of soil overburden. Surface mines are also known as open-pit mines.
Tax agreement liability. The undiscounted estimated future liability previously owed by CPE Inc. to Rio Tinto under the Tax Receivable Agreement.
Thermal coal. Coal used by power plants and industrial steam boilers to produce electricity or process steam. It generally is lower in Btu heat content and higher in volatile matter than metallurgical coal.
Tonnes. A “metric” ton, equal to 2,205 pounds.
Tons. A “short” or net ton, equal to 2,000 pounds.
TRA. Tax Receivable Agreement. We and RTEA entered into a Tax Receivable Agreement in connection with the IPO and the acquisition of our membership units of CPE Resources. The Tax Receivable Agreement required us to pay to RTEA 85% of the amount of cash tax savings, if any, that we realized as a result of the increases in tax basis that we obtained in connection with the initial acquisition of our interest in CPE Resources and our subsequent acquisition of RTEA’s remaining units in CPE Resources. In August 2014, we entered into an acceleration and release agreement with Rio Tinto whereby we agreed to pay $45 million to Rio Tinto to terminate the Tax Receivable Agreement.
Truck-and-shovel mining. Similar forms of mining where large shovels or front-end loaders are used to remove overburden, which is used to backfill pits after the coal is removed. Smaller shovels load coal in haul trucks for transportation to the preparation plant or rail loading facilities.
UP. Union Pacific Railroad.
U.S. GAAP. Generally accepted accounting principles in the United States of America.
Overview
We are one of the largest producers of coal in the United States of America (“U.S.”) and the PRB, based on our 2016 coal sales. We operate some of the safest mines in the coal industry. According to the most current MSHA data, we have one of the lowest employee all injury incident rates among the largest U.S. coal producing companies. We currently operate solely in the PRB, the lowest cost region of the major coal producing regions in the U.S., where we own and operate three surface coal mines: the Antelope Mine, the Cordero Rojo Mine, and the Spring Creek Mine.
Our Antelope Mine and Cordero Rojo Mine are located in Wyoming and our Spring Creek Mine is located in Montana. Our mines produce subbituminous thermal coal with low sulfur content, and we sell our coal primarily to domestic and foreign electric utilities. Thermal coal is primarily consumed by electric utilities and industrial consumers as fuel for electricity generation. In 2016, the coal we produced generated approximately 3% of the electricity produced in the U.S. As of December 31, 2016, we controlled approximately 1.1 billion tons of proven and probable reserves. We do not produce any metallurgical coal. See Item 1. “Business—Mining Operations.”
In addition, we have two development projects, both located in the Northern PRB. The Youngs Creek project is an undeveloped surface mine project located in Wyoming, seven miles south of our Spring Creek Mine, and contiguous with the Wyoming-Montana state line. The Big Metal project is located near the Youngs Creek project on the Crow Indian Reservation in southeast Montana. These two projects are described in more detail under Item 1. “Business—Development Projects.”
Our logistics business provides a variety of services designed to facilitate the sale and delivery of coal. These services include the purchase of coal from third parties or from our owned and operated mines, coordination of the transportation and delivery of purchased coal, negotiation of take-or-pay rail agreements and take-or-pay port agreements and demurrage settlement with vessel operators. See Item 1. “Business—Transportation and Logistics Services” for further discussion.
Segment Information
Our reportable segments include Owned and Operated Mines and Logistics and Related Activities. For a discussion on these segments, please see Item 7. Management’s Discussion and Analysis of Financial Condition and Results of Operations as well as Note 23 of Notes to Consolidated Financial Statements in Item 8.
History
CPE Inc., a Delaware corporation organized on July 31, 2008, is a holding company that manages its 100% owned consolidated subsidiary CPE Resources, but has no business operations or material assets other than its ownership interest in CPE Resources. CPE Inc.’s only source of cash flow from operations is distributions from CPE Resources pursuant to the CPE Resources limited liability company agreement. CPE Inc. also receives management fees pursuant to a management services agreement between CPE Inc. and CPE Resources as reimbursement of certain administrative expenses. Our business operations are conducted by CPE Resources, a Delaware limited liability company formed on August 19, 2008. Between 1993 and 1998, our predecessor acquired the Antelope Mine, Spring Creek Mine, the Cordero Rojo Mine, and a 50% non-operating interest in the Decker Mine. On September 12, 2014, we sold our 50% interest in the Decker Mine to an affiliate of Ambre Energy North America, Inc. (“Ambre Energy”), now known as Lighthouse Resources Inc.
CPE Inc. acquired approximately 51% and the managing member interest in CPE Resources in exchange for a promissory note, which was repaid with proceeds from the initial public offering of its common stock (“IPO”) on November 19, 2009. Rio Tinto retained ownership of the remaining 49% interest in CPE Resources until December 15, 2010, when CPE Inc. priced a secondary offering of its common stock on behalf of Rio Tinto (the “Secondary Offering”) In connection with the Secondary Offering, CPE Inc. exchanged shares of its common stock for common membership units of CPE Resources held by Rio Tinto, resulting in our acquisition of 100% of Rio Tinto’s holdings in CPE Resources.
Coal Characteristics
In general, coal of all geological compositions is characterized by end use either as thermal or metallurgical. Heat value and sulfur content are the most important variables in the economic marketing and transportation of thermal coal. We mine, process, and market low sulfur content, subbituminous thermal coal, the characteristics of which are described below. Because we currently operate only in the PRB, which does not have metallurgical coal, we produce only thermal coal.
Heat Value
The heat value of coal is commonly measured in Btus. Subbituminous coal from the PRB has a typical heat value that ranges from 8,000 to 9,500 Btus. Subbituminous coal from the PRB is used primarily by electric utilities and by some industrial customers for steam generation. Coal found in other regions in the U.S., including the eastern and Midwestern regions, tends to have a higher heat value than coal found in the PRB, other than lignite coal which has lower heat value than subbituminous coal but is typically only used to supply coal to utilities that are directly adjacent to the mine.
Sulfur Content
Federal and state environmental regulations, including regulations that limit the amount of sulfur dioxide that may be emitted as a result of combustion, have affected and may continue to affect the demand for certain types of coal. See “Environmental and Other Regulatory Matters—Clean Air Act.” The sulfur content of coal can vary from seam to seam and within a single seam. The concentration of sulfur in coal affects the amount of sulfur dioxide produced in combustion. Coal-fired power plants can comply with sulfur dioxide emissions regulations by burning coal with low sulfur content, blending coals with various sulfur contents, purchasing emission allowances on the open market and/or using sulfur-reduction technology, such as scrubbers, which can reduce sulfur dioxide emissions by up to 95% or more.
PRB coal typically has a lower sulfur content than eastern U.S. coal and generally emits no greater than 1.2 pounds of sulfur dioxide per million Btus.
Other
Ash is the inorganic residue remaining after the combustion of coal. As with sulfur content, ash content varies from seam to seam. Ash content is an important characteristic of coal because it impacts boiler performance and electric generating plants must handle and dispose of ash following combustion. The ash content of PRB coal is generally low, representing approximately 5% to 10% by weight. The composition of the ash, including the proportion of sodium oxide, as well as the ash fusion temperatures are important characteristics of coal and help determine the suitability of the coal to specific end users. In limited cases, domestic customers at the Spring Creek Mine have required, and may continue to require, the addition of earthen materials to dilute the sodium oxide content of the post-combustion ash of the coal.
Moisture content of coal varies by the type of coal and the region where it is mined. In general, high moisture content is associated with lower heat values and generally makes the coal more expensive to transport. Moisture content in coal, on an as-sold basis, can range from approximately 2% to over 35% of the coal’s weight. PRB coals have typical moisture content of 20% to 30%.
Mercury and chlorine are trace elements within coal that are of primary consideration relative to utility plant emissions and performance. Trace amounts of mercury and chlorine in PRB coal are relatively low compared to coal from other regions.
Coal Mining Methods
Surface Mining
All of our mines are surface mining operations utilizing both dragline and truck-and-shovel mining methods. Surface mining is used when coal is found relatively close to the surface. Surface mining typically involves the removal of topsoil and drilling and blasting the overburden with explosives. The overburden is then removed with draglines, trucks, shovels, and dozers. Trucks and shovels then remove the coal. The final step involves replacing the overburden and topsoil after the coal has been excavated, reestablishing vegetation into the natural habitat and making other changes designed to provide local community benefits. We typically recover 90% or more of the economic coal seam for the mines we operate.
Coal Preparation and Blending
In almost all cases, the coal from our mines is crushed and shipped directly from our mines to the customer. Typically, no other preparation is needed for a saleable product. However, coals of various sulfur and ash contents can be mixed or “blended” to meet the specific combustion and environmental needs of customers. All of our coal can be blended with coal from other coal producers. Spring Creek Mine’s location and the high Btu content of its coal make its coal better suited than our other coal for export and transportation to U.S. coal customers on the Great Lakes for blending by the customer with coal sourced from other locations to achieve a suitable overall product.
Mining Operations
We currently operate solely in the PRB. Two of the mines we operate are located in Wyoming and one is located in Montana. We currently own the majority of the equipment utilized in our mining operations. We employ preventative maintenance and rebuild programs and upgrade our equipment as part of our efforts to ensure that it is productive, well-maintained, and cost-competitive. Our maintenance programs also utilize procedures designed to enhance the efficiencies of our operations. The following table provides summary information regarding our mines as of December 31, 2016.
|
|
|
2016 As Delivered Average |
|
Tons Sold |
| ||||||||||
|
|
|
Btu |
|
Ash |
|
|
|
|
|
|
|
|
|
|
|
|
Mine |
|
per lb |
|
Content |
|
Sulfur Content |
|
2016 |
|
2015 |
|
2014 |
| ||
|
|
|
|
|
(%) |
|
(%) |
|
(lbs SO2/mmBtu) |
|
|
|
(million tons) |
|
|
|
|
Antelope |
|
8,864 |
|
5.47 |
|
0.23 |
|
0.52 |
|
29.8 |
|
35.2 |
|
33.6 |
|
|
Cordero Rojo |
|
8,393 |
|
5.96 |
|
0.30 |
|
0.71 |
|
18.3 |
|
22.9 |
|
34.8 |
|
|
Spring Creek |
|
9,219 |
|
5.75 |
|
0.33 |
|
0.72 |
|
10.3 |
|
17.0 |
|
17.4 |
|
|
Decker(1) |
|
N/A |
|
N/A |
|
N/A |
|
N/A |
|
— |
|
— |
|
1.1 |
|
|
Other(2) |
|
N/A |
|
N/A |
|
N/A |
|
N/A |
|
0.4 |
|
0.2 |
|
0.2 |
|
|
Total |
|
|
|
|
|
|
|
|
|
58.8 |
|
75.3 |
|
87.1 |
|
(1) Tons sold numbers reflect our 50% non-operating interest through our September 12, 2014 divestiture.
(2) The tonnage shown for “Other” represents our purchases from third-party sources that we have resold. See “—Mining Operations—Broker Sales and Third-Party Sources.”
Our Owned and Operated Mines segment includes our Antelope Mine, Cordero Rojo Mine, and Spring Creek Mine. Our Antelope and Cordero Rojo mines are served by the BNSF and UP railroads. Our Spring Creek Mine is served solely by the BNSF railroad.
The following map shows the locations of our mining operations:
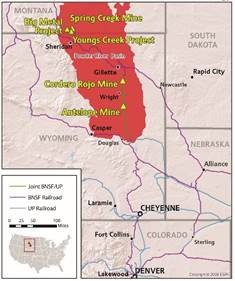
Antelope Mine
The Antelope Mine is located in the southern end of the PRB approximately 60 miles south of Gillette, Wyoming. The mine extracts thermal coal from the Anderson and Canyon Seams, with up to 44 and 36 feet, respectively, in thickness. Significant areas of unleased coal north and west of the mine are available for nomination by us or other mining operations or persons. Based on the average sulfur content of 0.50 lbs SO2/mmBtu, the reserves at our Antelope Mine are considered to be compliance coal under the Clean Air Act, and this coal is some of the lowest sulfur coal produced in the PRB.
Cordero Rojo Mine
The Cordero Rojo Mine is located approximately 25 miles south of Gillette, Wyoming. The mine extracts thermal coal from the Wyodak Seam, which ranges from approximately 55 to 70 feet in thickness. Significant additional areas of unleased coal are potentially available for nomination by us or other mining operations or persons adjacent to our current operations. Based on the average sulfur content of 0.69 lbs SO2/mmBtu, the reserves at our Cordero Rojo Mine are considered to be compliance coal under the Clean Air Act.
Spring Creek Mine
The Spring Creek Mine is located in Montana approximately 20 miles north of Sheridan, Wyoming. The mine extracts thermal coal from the Anderson-Dietz Seam, which averages approximately 80 feet in thickness. The location of the mine relative to the Great Lakes is attractive to our customers in the northeast because of lower transportation costs. The location of the Spring Creek Mine also provides access to export terminals in the Pacific Northwest, providing a geographic advantage relative to other PRB mines. During the years ended December 31, 2016, 2015, and 2014, we shipped approximately 0.6, 3.6, and 4.0 million tons, respectively, of Spring Creek coal through terminals located in British Columbia, Canada. Based on the average sulfur content of 0.73 lbs SO2/mmBtu, the reserves at our Spring Creek Mine are considered to be compliance coal under the Clean Air Act.
Development Projects
Youngs Creek Project
The Youngs Creek project, an undeveloped surface mine project in the Northern PRB region, is located in Wyoming, approximately 13 miles north of Sheridan, Wyoming, seven miles south of our Spring Creek Mine and seven miles from the mainline railroad, contiguous with the Wyoming-Montana state line. It is near the Big Metal project (described below). We acquired the Youngs Creek project in June 2012. The coal located at the Youngs Creek project is similar quality to that of our Spring Creek Mine and offers lower sodium levels. We have not been able to classify the Youngs Creek project mineral rights as proven and probable reserves as they remain subject to further exploration and evaluation based on market conditions. The Youngs Creek project mining permit covers 292.4 million tons of non-reserve coal deposits, of which approximately 274 million tons benefit from a royalty rate of 8.0% of the coal sales price free on board (“FOB”) at the mine site, payable to the sellers, which is below the normal 12.5% royalty rate payable on federal coal. We control additional leased and private coal related to the Youngs Creek project that has not yet been evaluated and is not yet in any mine plan. We also acquired approximately 38,800 acres of surface rights which includes land extending north to our Spring Creek Mine, and onto the Crow Indian Reservation to the west. We are in the process of evaluating the development options for this project and believe that its proximity to the Spring Creek Mine and the Big Metal project represent an opportunity to optimize our mine developments in the Northern PRB.
Big Metal Project
In January 2013, we entered into an option agreement and a corresponding exploration agreement with the Crow Tribe of Indians. These agreements were approved by the Department of the Interior on June 14, 2013. This coal project is located on the Crow Indian Reservation in southeast Montana, near our Spring Creek Mine and Youngs Creek project in the Northern PRB region. We paid the Crow Tribe $1.5 million in each of the years ended December 31, 2016, 2015, and 2014, respectively, for the option agreement. We will continue to make annual option payments throughout the term of the option agreement, which, during the initial option period could total up to $10 million. The option and exploration agreements provide for exploration rights and exclusive options to lease three separate coal deposits on the Crow Indian Reservation over an initial five-year term, with two extension periods through 2035 if certain conditions are met. Upon the exercise of an option or options to lease, we would pay the Crow Tribe an amount equal to $0.08 per ton to $0.15 per ton, depending on the lease area and coal deposit and subject to adjustment for inflation. The agreements also set forth adjustable royalty rates, ranging from 7.5% to 15% of the coal sales price FOB at the mine site and contain standard coal production taxes to be paid
to the Crow Tribe. The coal located at the Big Metal project is similar quality to that of our Spring Creek Mine and offers lower sodium levels. We have completed the exploration program for the Big Metal project and are evaluating the development options for this project and believe that its proximity to the Spring Creek Mine and the Youngs Creek project represents an opportunity to optimize our mine developments in the Northern PRB.
The map below shows where the Youngs Creek project and Big Metal project (Squirrel Creek, Tanner Creek, and Upper Youngs Creek coal deposits) are located relative to our Spring Creek Mine.
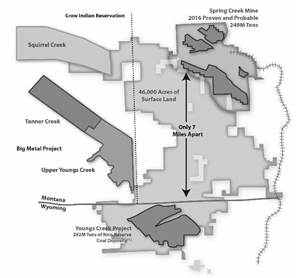
(1) Non-reserve coal deposits are not reserves under SEC Industry Guide 7. Estimates of non-reserve coal deposits are subject to further exploration and development, are more speculative, and may or may not be converted to future reserves of the company.
Customers, Contracts and Logistics Services
We focus on building long-term relationships with customers through our reliable performance and commitment to customer service. We supply coal to 46 domestic and foreign electric utilities and over 70% of our sales were to customers with an investment grade credit rating as of December 31, 2016. Furthermore, 86% of our 2016 sales were to customers with whom we have had relationships for more than 10 years. During 2016, approximately 51% of our consolidated revenue was derived from our top ten customers. No customer accounted for 10% or more of our total revenue in 2016, 2015, or 2014. A significant portion of our 2016 revenue for the Logistics and Related Activities segment was derived from entities owned or controlled by Korea Electric Power Corporation.
Coal produced approximately 30% of electricity generation in the U.S. through November 2016. The following map shows the percentage of our tons sold by state of destination during 2016 from coal produced at the three mines we own and operate. Our coal supplies fueled approximately 3% of the electricity generated in the U.S. in 2016. We also supplied approximately 2% of the tons produced at our mines to customers outside of the U.S. in 2016.
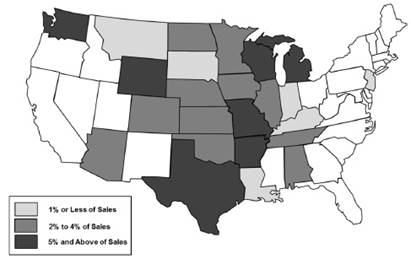
We categorize our customers by how we sell coal to them. Our mine customers purchase coal directly from our mine sites, where the sale occurs at the mine site and where title and risk of loss typically pass to the customer at that point. Mine customers arrange for and bear the costs of transporting their coal from our mines to their plants or other specified discharge points. Our mine customers are typically domestic utility companies primarily located in the mid-west and south central U.S., although we also sell to other domestic utility companies, as well as to third-party brokers.
Our logistics customers purchase coal from us, along with our logistics services to deliver the coal to the customer at a terminal or the customer’s plant or other delivery point remote from our mine site. Title and risk of loss pass to the customer at the remote delivery point. Our logistics services include the purchase of coal from third parties or from our owned and operated mines, at market prices, as well as the contracting and coordination of the transportation and other handling services from third-party operators, which are typically rail and terminal companies. Logistics customers are primarily foreign and domestic utility companies as well as third-party brokers. With respect to our international sales, at present, we are primarily focused on end-user customers; however, a small portion of our sales are made to international traders who sell on to end-user customers.
Mine Customers
Long-term Coal Sales Agreements
As is customary in the coal industry, we generally enter into fixed price, fixed volume supply contracts with our mine customers. Contracts with our mine customers generally have terms of one to five years, although some are as short as one to six months and others may be longer than ten years. For the year ended December 31, 2016, approximately 79% of our total revenue attributable to our Owned and Operated Mines segment was derived from long-term supply contracts with terms of one year or greater.
Our coal is primarily sold on a mine-specific basis to utility customers through a request-for-proposal process. The terms of our coal sales agreements result from competitive bidding and extensive negotiations with customers. Consequently, the terms of these contracts vary by customer, including base price adjustment features, price re-opener terms, coal quality requirements, quantity parameters, permitted sources of supply, impact of future regulatory changes, extension options, force majeure, termination, assignment and other provisions.
Our coal sales agreements typically contain “hardship” provisions to adjust the base price due to new statutes, ordinances or regulations that affect our costs related to performance of the agreement. Additionally, some of our contracts contain provisions that allow for the recovery of costs incurred as a result of modifications or changes in the interpretations or application of any applicable statute by local, state or federal government authorities. These provisions only apply to the base price of coal contained in these supply contracts. In some circumstances, a significant adjustment in base price can lead to termination of the contract. In addition, a small number of our contracts contain clauses that may allow customers to terminate the contract in the event of significant changes in environmental laws and regulations, which result in the customer being unable to perform under the terms of the contract.
Most of our coal sales agreements to mine customers include a fixed price for the term of the agreement or a pre-determined escalation in price for each year. Some of these contracts that extend for a four- or five-year term or longer may include variable pricing. These price re-opener and index provisions may allow either party to commence a renegotiation of the contract price at a pre-determined time. Price re-opener provisions may automatically set a new price based on prevailing market price or, in some instances, require us to negotiate a new price, sometimes between a specified range of prices. In some agreements, if the parties do not agree on a new price, either party has an option to terminate the contract. Under some of our contracts, we have the right to match lower prices offered to our customers by other suppliers.
Quality and volumes for the coal are stipulated in coal sales agreements. Some customers are allowed to vary the amount of coal taken under the contract. Most of our coal sales agreements contain provisions requiring us to deliver coal within certain ranges for specific coal characteristics, such as heat content, sulfur, ash and ash fusion temperature. Failure to meet these specifications can result in economic penalties, suspension or cancellation of shipments or termination of the contracts. Our contracts also typically attempt to account for the low sulfur content of our coal by reflecting a market adjustment for the low sulfur in the contract price or through an adjustment calculated based on the as-delivered average sulfur content of our coal, or both.
Contracts with our mine customers also typically contain force majeure provisions allowing temporary suspension of performance by us or our customers for the duration of specified events beyond the control of the affected party, including events such as strikes, adverse mining conditions, mine closures or serious transportation problems that affect us or unanticipated plant outages that may affect the buyer. These contracts generally provide that, in the event a force majeure circumstance exceeds a certain time period (e.g., 60-90 days); the unaffected party may have the option to terminate the transaction or transactions under the agreement. Some of those contracts stipulate that this tonnage can be made up by mutual agreement or at the discretion of the buyer. Generally, contracts with our mine customers allow our customers to suspend performance in the event that the railroad fails to provide its services due to circumstances that would constitute a force majeure under the terms of the contract between the mine customer and the railroad.
Many of our contracts contain clauses that require us and our customers to maintain a certain level of creditworthiness or provide appropriate credit enhancement upon request. The failure to do so can result in a suspension of shipments under the contract. In some of our contracts, we have a right of substitution, allowing us to provide coal from different mines, including third-party mines, as long as the replacement coal meets quality specifications and will be sold at the same delivered cost.
Generally, under the terms of our coal sales agreements, we agree to indemnify or reimburse our customers for damage to their or their rail carrier’s equipment resulting from our negligence, and for damage to their equipment due to non-coal materials being included with our coal before leaving our property.
Transportation
Transportation is typically one of the largest components of a purchaser’s total cost. Coal used for domestic consumption by our mine customers is typically sold FOB at the mine or nearest loading facility, and the purchaser of the coal bears the transportation costs and risk of loss. Most electric generators arrange long-term shipping contracts with rail or barge companies to assure stable delivery costs. Our Antelope and Cordero Rojo mines are served by the BNSF and UP railroads. Our Spring Creek Mine is served solely by the BNSF railroad.
Although the purchaser pays the freight, transportation costs still are important to coal mining companies because the purchaser will consider the delivered cost of coal, including transportation costs, in determining from which mines it will purchase. Transportation costs borne by the customer vary greatly based on each customer’s proximity to the mine.
Logistics Customers
Long-term Coal Sales Agreements
We generally enter into binding contracts that are fixed-price, fixed-volume supply contracts with our domestic logistics customers. Contracts with these logistics customers generally have terms of one to three years. The terms of our sales agreements result from competitive bidding and extensive negotiations with customers. Consequently, the terms of these contracts vary by customer, including base price adjustment features, price re-opener terms, logistics and coal quality requirements, quantity parameters, permitted sources of supply, impact of future regulatory changes, extension options, force majeure, termination, assignment and other provisions.
With our international logistics customers, we have contracts that contain evergreen clauses, meaning that there is an expectation of sales, provided that mutual agreement on pricing can be reached. This is consistent with conventional industry standards for sales into the Asian Pacific region. Our Asian delivered shipments are typically priced broadly in line with a number of relevant international coal indices adjusted for energy content and other quality and delivery criteria. These indices include the Newcastle benchmark price, which is an established index for high Btu Australian thermal coal available to be loaded on a vessel at a coal terminal near Newcastle, north of Sydney. Based on the comparative quality and transport costs, our delivered sales are generally priced at approximately 60% to 75% of the forward Newcastle price.
Contracts with our logistics customers include terms similar to those described for our mine customers and may also include terms relating to:
· demurrage fees for international contracts, charged to us when a vessel is not dispatched on time;
· fixed pricing for the first year of sales, and a provision providing for future years’ pricing to be negotiated at a specific point in time related to some of our foreign contracts; and
· additional coal quality requirements, such as grindability, which deals with the hardness of the coal, and ash fusion temperature, which measures the softening and melting behavior of the ash contained in the coal.
Transportation and Logistics Services
For our logistics customers, we provide a variety of services designed to facilitate the sale and delivery of coal. These services include the purchase of coal from third parties or from our owned and operated mines, coordination of the transportation and delivery of purchased coal, negotiation of take-or-pay rail agreements and take-or-pay port agreements and demurrage settlement with vessel operators. We also bear the costs of transporting the coal to the delivery point. For our international customers, this includes export terminals located in the Pacific Northwest. Our logistics customers located overseas are generally responsible for paying the cost of ocean freight, although occasionally we may arrange that transportation as well.
We have an agreement with an unaffiliated Korean representative company, WoonBong Energy, which helps us facilitate our sales in South Korea. WoonBong Energy provides market research on Korean coal customers and demand, acts as an intermediary for communications with our Korean customers and assists with logistics issues in sales to Korean customers. WoonBong Energy provides these services exclusively for us in South Korea.
To help support and ensure export terminal capacity for export sales, we enter into multi-year throughput agreements with export terminal companies and railroads. These types of take-or-pay agreements require us to pay for a minimum quantity of coal to be transported on the railway or through the terminal regardless of whether we sell any coal. If we fail to make sufficient export sales to meet our minimum obligations under the take-or-pay agreements, we are still obligated to make payments to the export terminal company or railroad. See Item 7—Management’s Discussion and Analysis of Financial Condition and Results of Operations — Contractual Obligations for more detail. Also included in the costs within our Logistics and Related Activities segment are fees to cover rail and export terminal charges, as well as fees to cover capital costs and investments that we incur to enable us to provide logistics services to our logistics customers, such as the purchase or lease of rail cars.
In 2011, we entered into a multi-year throughput contract with Westshore Terminals Limited Partnership (“Westshore”) for a portion of our anticipated export sales through their export terminal in Vancouver, British Columbia. In August 2014, we increased our long-term committed capacity at Westshore from 2.8 million tons to 6.3 million tons initially, increasing to 7.2 million tons in 2019. In addition, the revised agreement extended the term of our throughput agreement by two years through the end of 2024.
In October 2015, we announced an amended agreement with Westshore whereby the previously committed volumes for 2016 through 2018 were reduced to zero in exchange for an upfront payment made in October 2015, plus quarterly payments during 2016 through 2018, as specified in the amended agreement. In December 2015, we announced a similar amendment to our transportation agreement with BNSF.
In November 2016, due to the improvement in export coal prices, we entered into agreements with Westshore and BNSF to ship coal during the fourth quarter of 2016. These agreements were effective for the fourth quarter of 2016 only, and did not change the aforementioned amended agreements discussed above, or the terms of the previous throughput or transportation agreements. Under the fourth quarter agreements, we received a partial credit against current charges for the quarterly payments made under the previous agreements.
At December 31, 2016, we terminated our previous agreement with Westshore and entered into a new agreement. In February 2017, we terminated our previous agreement with BNSF and entered into a new agreement effective in April 2017. The new agreements provide for shipments in 2017 and 2018 and require minimum payments for those two years. We have the right to terminate our commitments for 2017 and 2018 at any time in exchange for buyout payments.
The new agreements do not contain any commitments subsequent to the end of 2018, unless the parties elect to extend the agreements through 2019. Additionally, after the new Westshore agreement terminates and through 2024, if we choose to ship to export customers, we are required to offer to ship through Westshore up to a specified annual tonnage on terms similar to the new agreement before shipping through any other export terminal. Westshore has the right to accept or reject our offer in its sole discretion. See Note 10 of Notes to Consolidated Financial Statements in Item 8 for further discussion regarding the accounting treatment of these transactions.
In addition to our current port agreement with Westshore, we hold an option contract to increase our future export capacity through the proposed Millennium Bulk Terminals (“MBT”) coal export facility in Washington State. The timing and outcome of the permit process related to MBT, and therefore the construction of the terminal, is uncertain. We previously had a minority ownership interest in the joint venture that was seeking to develop Gateway Pacific Terminal (“GPT”) in Washington State. SSA Marine, the majority interest holder and project developer, recently notified us of its intention to no longer pursue a coal terminal. As a result, in January 2017, we abandoned our ownership interest in the joint venture, and we no longer have any ownership interest or associated funding obligations for the joint venture. We continue to have residual contractual rights as a potential customer of the terminal if the project is resumed in a designated period of time in the future. The abandonment of our interest in GPT had no effect on our financial statements since we fully impaired our investment in 2015.
Broker Sales and Third-Party Sources
From time to time, we purchase coal through brokers. We also sell any excess produced coal to brokers and third-party sources, including brokers who sell to end users in foreign countries. For delivery during the year ended December 31, 2016, we purchased and resold 0.3 million tons through brokers and third-party sources.
Sales and Marketing
We have a team of experienced sales, marketing and customer service personnel. To help develop and maintain the relationships we have with our mine and logistics customers, we have divided the department into teams consisting of:
· Sales and Marketing, which focuses on traditional requests for proposals by our mine customers;
· Customer Service, which provides contract and after-sales support to our customers;
· Logistics and Industrial Sales, which focuses on logistics, transportation and related services on behalf of our Logistics and Related Activities segment;
· Trading and Revenue Management, which provides industry insight, recommends pricing strategies and participates in the spot and forward markets; and
· Export Sales, which focuses on sales to our international logistics customers.
As of February 8, 2017, we had 11 employees in our sales and marketing department.
Suppliers
Principal supplies used in our business include heavy mobile equipment, petroleum-based fuels, explosives, tires, steel and other raw materials, as well as spare parts and other consumables used in the mining process. We use third-party suppliers for a portion of our equipment rebuilds and repairs, drilling services and construction. We use sole source suppliers for certain parts of our business such as dragline shovel parts and services and tires. We believe adequate substitute suppliers are available. For further discussion of our suppliers, see Item 1A “Risk Factors—Risks Related to Our Business and Industry—Increases in the cost of raw materials and other industrial supplies, or the inability to obtain a sufficient quantity of those supplies, could increase our operating expenses, disrupt or delay our production and materially adversely affect our profitability.”
Competition
The coal industry is highly competitive. See Item 1A “Risk Factors—Risks Related to Our Business and Industry—Competition with domestic and foreign coal producers, with traders and re-sellers of coal and with producers of natural gas and other competing energy sources may continue to negatively affect our sales volumes and our ability to sell coal at a favorable price.” We compete with other coal producers, with traders and re-sellers of coal and with other energy producers throughout the U.S. and, for our export sales, internationally. The most important factors on which we compete with other coal producers and with traders and re-sellers of coal are coal price, coal quality and characteristics, costs to transport the coal, customer service and the reliability of supply. Demand for coal and the prices that we will be able to obtain for our coal are closely linked to coal consumption patterns of the domestic and foreign electric generation industries. These coal consumption patterns are influenced by factors beyond our control, including weather and economic conditions, the supply and demand for domestic and foreign electricity, domestic and foreign governmental regulations and taxes, environmental and other regulatory changes, global climate change initiatives, technological developments, the price and availability of other fuels, such as natural gas and crude oil, the availability of subsidies, and renewable mandates designed to encourage greater use of alternative energy sources, including hydroelectric, nuclear, wind and solar power, and currency exchange rate fluctuations, all of which can decrease demand for thermal coal or may decrease demand for PRB coal compared to other global coal basins.
Because most of the coal in the vicinity of our mines is owned by the U.S. federal government, we compete with other coal producers operating in the PRB for additional coal through the competitive LBA process.
Employees
As of February 8, 2017, we had approximately 1,300 full-time employees. None of our employees are currently parties to collective bargaining agreements. We believe that we have good relations with our employees. As of February 8, 2017, we had approximately 185 external contractors on a full-time, equivalent basis.
Executive Officers
Set forth below is information concerning our current executive officers as of December 31, 2016.
|
Name |
|
Age |
|
Position(s) |
|
Colin Marshall |
|
52 |
|
President, Chief Executive Officer and Director |
|
|
|
|
|
|
|
Heath Hill |
|
46 |
|
Executive Vice President and Chief Financial Officer |
|
|
|
|
|
|
|
Gary Rivenes |
|
46 |
|
Executive Vice President and Chief Operating Officer |
|
|
|
|
|
|
|
Bryan Pechersky |
|
46 |
|
Executive Vice President, General Counsel and Corporate Secretary |
|
|
|
|
|
|
|
Bruce Jones |
|
58 |
|
Senior Vice President, Technical Services |
|
|
|
|
|
|
|
Cary Martin |
|
64 |
|
Senior Vice President, Human Resources |
|
|
|
|
|
|
|
Todd Myers |
|
52 |
|
Senior Vice President, Marketing and Business Development |
|
|
|
|
|
|
|
Kendall Carbone |
|
51 |
|
Vice President and Chief Accounting Officer |
Colin Marshall has served as our President, Chief Executive Officer and a director since July 2008. Previously, he served as the President and Chief Executive Officer of RTEA from June 2006 until November 2009. From March 2004 to May 2006, Mr. Marshall served as General Manager of Rio Tinto’s Pilbara Iron’s west Pilbara iron ore operations in Tom Price, West Australia, from June 2001 to March 2004, he served as General Manager of RTEA’s Cordero Rojo Mine in Wyoming, and from August 2000 to June 2001, he served as Operations Manager of RTEA’s Cordero Rojo Mine. From 1996 to 2000, he was Finance Director of the Rio Tinto Pacific Coal business unit based in Brisbane Australia. Mr. Marshall worked for Rio Tinto plc in London as an analyst in the Business Evaluation Department from 1992 to 1996. Mr. Marshall holds a Bachelor of Engineering degree and a Master’s degree in mechanical engineering from Brunel University and a Master of Business Administration from the London Business School.
Heath Hill has served as our Executive Vice President and Chief Financial Officer since March 2015, and prior to that, he served as our Vice President and Chief Accounting Officer since September 2010. Previously, Mr. Hill served in various capacities with PricewaterhouseCoopers LLP, our independent public accountants, from September 1998 to September 2010, including Senior Manager from September 2006 to September 2010, and Manager from September 2003 to September 2006. While with PricewaterhouseCoopers LLP, Mr. Hill’s responsibilities included assurance services primarily
related to SEC registrants, including annual audits of financial statements and internal controls, public debt offerings and IPO transactions. From June 2003 to June 2005 he held a position with PricewaterhouseCoopers in Germany serving U.S. registrants throughout Europe. Mr. Hill never worked on any engagements or projects for CPE Inc. or its predecessor, Rio Tinto, while he was with PricewaterhouseCoopers LLP. Mr. Hill earned his Bachelor’s degree in accounting from the University of Northern Colorado and is an active certified public accountant.
Gary Rivenes has served as our Executive Vice President and Chief Operating Officer since October 2009. Previously, he served as Vice President, Operations, of RTEA from December 2008 until November 2009, and as Acting Vice President, Operations, of RTEA from January 2008 to November 2008. From September 2007 to December 2007, Mr. Rivenes served as General Manager for RTEA’s Jacobs Ranch Mine, from October 2006 to September 2007, he served as General Manager for RTEA’s Antelope Mine and from November 2003 to September 2006, he served as Manager, Mine Operations for RTEA’s Antelope Mine. Prior to that, he worked for RTEA in a variety of operational and technical positions for RTEA’s Antelope, Colowyo and Jacobs Ranch mines since 1992. Mr. Rivenes holds a Bachelor of Science in mining engineering from Montana College of Mineral, Science & Technology.
Bryan Pechersky has served as our Executive Vice President since January 2015, our General Counsel since January 2010, and our Corporate Secretary since March 2013. Prior to his promotion to Executive Vice President, he served as Senior Vice President beginning in 2010. Mr. Pechersky oversees our legal department, and since June 2016, our government affairs department. Previously, Mr. Pechersky was Senior Vice President, General Counsel and Secretary for Harte-Hanks, Inc., a worldwide, direct and targeted marketing company from March 2007 to January 2010. Prior to that, he also served as Senior Vice President, Secretary and Senior Corporate Counsel for Blockbuster Inc., a global movie and game entertainment retailer from October 2005 to March 2007, and was Deputy General Counsel and Secretary for Unocal Corporation, an international energy company acquired by Chevron Corporation in 2005, from March 2004 until October 2005. While in these capacities, Mr. Pechersky’s responsibilities included advising on various legal, regulatory and compliance matters, transactions and other responsibilities that are common for a general counsel and corporate secretary. Mr. Pechersky was in private practice for approximately seven years with the international law firm Vinson & Elkins L.L.P. before joining Unocal Corporation. Mr. Pechersky also served as a Law Clerk to the Hon. Loretta A. Preska of the U.S. District Court for the Southern District of New York in 1995 and 1996. Mr. Pechersky earned his Bachelor’s degree and Juris Doctorate from the University of Texas, Austin, Texas.
Bruce Jones has served as our Senior Vice President, Technical Services since July 2013, with responsibilities in strategic and long-term mine planning, geological services, land management and environmental affairs. Prior to his appointment as Senior Vice President, Mr. Jones was General Manager of our Spring Creek Mine from March 2007 to July 2013. Before joining the Spring Creek Mine, Mr. Jones was the Operations Manager for Kennecott Utah Copper at the Bingham Canyon Mine in Bingham Canyon, Utah. Mr. Jones began his career as a mining engineer for Inspiration Coal, Inc. in 1982 and has worked in several sectors of the mining industry. During his career, Mr. Jones has held engineering and operations management positions at gold, copper, and coal mining operations. Mr. Jones holds a Bachelor of Science degree in mining engineering from the University of Wisconsin-Platteville and a Master of Business Administration from the University of Utah. Mr. Jones is a registered professional engineer in Kentucky and Utah.
Cary Martin has served as our Senior Vice President, Human Resources since October 2009. Previously, he served as Vice President / Corporate Officer of Human Resources for OGE Energy Corp., an electric utility and natural gas processing holding company from September 2006 until March 2008, and as a Segment Vice President for several different divisions of SPX Corporation, an international multi-industry manufacturing and services company from December 1999 until May 2006. In these capacities, Mr. Martin’s responsibilities included oversight of employee and labor relations, workforce planning, employee development, compensation administration, policies and procedures and other responsibilities that are common for a human resources executive. From 1982 until 1999, Mr. Martin served in various management and officer positions for industries ranging from medical facilities to cable manufacturers. Mr. Martin received his Bachelor’s degree in business administration from the University of Missouri and his Master’s degree in management sciences from St. Louis University.
Todd Myers has served as our Senior Vice President, Marketing and Business Development since June 2016. Prior to that appointment, he served as our Senior Vice President, Business Development beginning in July 2010. Previously, he served as President of Westmoreland Coal Sales Company and in other senior leadership positions with Westmoreland Coal in marketing and business development during two periods dating to 1989. In his various capacities with Westmoreland Coal, Mr. Myers’s responsibilities included developing and implementing corporate merger and acquisition strategies, divesting coal related assets, negotiating complex transactions and other responsibilities generally attributable to the management of coal businesses. Mr. Myers also spent five years with RDI Consulting, a leading consulting firm in the coal and energy industries, where he led the environment consulting practice. In 1987, Mr. Myers served as a staff assistant in the U.S. House
of Representatives. Mr. Myers earned his Bachelor of Arts in political science from Pennsylvania State University in University Park, Pennsylvania, and his Masters in International Management from the Thunderbird Graduate School of Global Management in Glendale, Arizona.
Kendall Carbone has served as our Vice President and Chief Accounting Officer since March 2015 and previously as our Assistant Chief Accounting Officer since January 2015. Prior to joining us, Ms. Carbone served as Vice President, Controller and Chief Accounting Officer for both Cool Planet Energy Systems, Inc. from 2013 to 2014 and QEP Resources, Inc. from 2010 to 2013. Ms. Carbone has extensive experience in the energy industry including bio-fuel, natural gas and oil refining as well as previous experience in mining. Ms. Carbone is a certified public accountant and holds a Master’s degree in accounting from New York University and a Bachelor’s degree in economics from Dartmouth College.
Environmental and Other Regulatory Matters
Federal, state and local authorities regulate the U.S. coal mining industry with respect to various matters, including air quality standards, water pollution, plant and wildlife protection, the discharge of materials into the environment and the effects of mining on surface and groundwater quality and availability. These laws and regulations, which are extensive, change frequently, and have tended to become stricter over time, have had, and will continue to have, a significant adverse effect on our production costs and our competitive position relative to certain other sources of electricity generation. Future laws, regulations, orders, or treaties, including those relating to global climate change, may continue to cause coal to become a less attractive fuel source, thereby further reducing coal’s share of the market for fuels and other energy sources used to generate electricity. See “Environmental and Other Regulatory Matters—Global Climate Change.”
We are committed to conducting our mining operations in compliance with all applicable federal, state and local laws and regulations. We have procedures in place that are designed to enable us to comply with these laws and regulations. As an example, all of the mines we operate are certified to the international standard for environmental management systems (“ISO 14001”). We believe we are substantially in compliance with applicable laws and regulations. However, due to the complexity and interpretation of these laws and regulations, we cannot guarantee that we have been or will be at all times in complete compliance.
Mining Permits and Approvals
Numerous governmental permits or approvals are required for mining operations. When we apply for these permits and approvals, we may be required to prepare and present data to federal, state or local authorities pertaining to the effect or impact that any proposed production or processing of coal may have upon the environment. For example, in order to obtain a federal coal lease, an EIS must be prepared to assist the BLM in determining the potential environmental impact of lease issuance, including any direct and indirect effects from the mining, transportation and burning of coal. In recent years, particular attention has been focused on the impact of the production and usage of coal on global climate change. This has resulted in extensive comments and regulatory litigation from environmental groups, including, for example, unsuccessful challenges related to the EIS prepared in connection with our West Antelope II LBA. See also Note 19 of Notes to Consolidated Financial Statements in Item 8 for a discussion regarding challenges by environmental activist groups against various regulatory processes impacting our mines. Final guidance released by the CEQ regarding climate change considerations in the NEPA analyses may, if continued under the current U.S. Presidential administration, increase the likelihood of future challenges to the NEPA documents prepared for actions requiring federal approval. Accordingly, our nominations or lease applications may be subject to delays or challenges. In order to obtain mining permits and approvals from federal and state regulatory authorities, mine operators must also submit a reclamation plan for restoring, upon the completion of mining operations, the mined property to its prior condition, productive use or other permitted condition. Typically, we submit the necessary permit applications several months or even years before we plan to begin mining a new area. In the states where we operate, the applicable laws and regulations also provide that a mining permit or modification can be delayed, refused or revoked if officers, directors, stockholders with specified interests or certain other affiliated entities with specified interests in the applicant or permittee have, or are affiliated with another entity that has, outstanding permit violations. Thus, past or ongoing violations of applicable laws and regulations by these interested persons and entities could provide a basis to revoke our existing permits and to deny the issuance of additional permits. As a result of these requirements, the authorization, permitting and implementation requirements imposed by federal, state and local authorities may be costly and time consuming and may limit or delay commencement or continuation of mining operations. Under some circumstances, substantial fines and penalties, including revocation or suspension of mining permits, may be imposed under governing laws, rules, and regulations. Monetary sanctions and, in severe circumstances, criminal sanctions may be imposed for failure to comply with these laws.
Permitting requirements also require, under certain circumstances, that we obtain surface owner consent if the surface estate has been split from the mineral estate. This requires us to negotiate with third parties for surface access that overlies coal we acquired or intend to acquire. These negotiations can be costly and time-consuming, lasting years in some instances, which can create additional delays in the permitting process. If we cannot successfully negotiate for land access, we could be denied a permit to mine coal we already own.
Surface Mining Control and Reclamation Act
SMCRA establishes mining, environmental protection, reclamation and closure standards for all aspects of surface coal mining. Mining operators must obtain SMCRA permits and permit renewals from the federal Office of Surface Mining (“OSM”) or from the applicable state agency if the state agency has obtained regulatory primacy by developing a mining regulatory program no less stringent than that established under SMCRA. Both Wyoming and Montana, where our owned and operated mines are located, have achieved primacy to administer the SMCRA program.
SMCRA permit provisions include a complex set of requirements, which include, among other things, coal prospecting, mine plan development, topsoil or growth medium removal and replacement, selective handling of overburden materials, mine pit backfilling and grading, disposal of excess spoil, protection of the hydrologic balance, surface runoff and drainage control, establishment of suitable post mining land uses and re-vegetation. We begin the process of preparing a mining permit application by collecting baseline data to adequately characterize the pre-mining environmental conditions of the permit area. This work is typically conducted by third-party consultants with specialized expertise and typically includes surveys and/or assessments of: cultural and historical resources; geology; soils; vegetation; aquatic organisms; wildlife; potential for threatened, endangered or other special status species; surface and ground water hydrology; climatology; riverine and riparian habitat and wetlands. The geologic data and information derived from the surveys and/or assessments are used to develop the mining and reclamation plans presented in the permit application, which address the provisions and performance standards of the state’s equivalent SMCRA regulatory program. SMCRA permit applications also include information used for documenting surface and mineral ownership, variance requests, access roads, mining methods, mining phases, other agreements that may relate to coal, other minerals, oil and gas rights, water rights, permitted areas and ownership and control information required to determine compliance with OSM’s regulations, including information regarding mining and compliance history. A mine operator must also submit a bond or otherwise secure the performance of all reclamation obligations associated with the proposed activities.
Upon submission to the regulatory agency, a permit application goes through an administrative completeness review and a thorough technical review. Public notice of the proposed permit is required, beginning a notice and comment period that is required before a permit can be issued. It is not uncommon for a SMCRA mine permit application to take over two years to prepare and review, depending on the size and complexity of the mine, and another two or more years for the permit to be issued, depending primarily on the regulatory authority’s approach to handling comments and objections received from the general public and other agencies. Also, it is not uncommon for a permit to be delayed as a result of litigation related to the specific permit or another related company’s permit.
From time to time, OSM will also update its mining regulations under SMCRA. For example, in December 2016, the OSM published a final rule to revise its regulations related to protecting streams and related wildlife from adverse impacts of surface coal mining operations. The final rule became effective in January 2017 and imposes stricter guidelines on conducting coal mining operations within buffer zones; requires mine operators to collect additional baseline data about the site of the proposed mining operation and adjacent areas; imposes additional surface and groundwater monitoring requirements; enacts specific requirements for the protection or restoration of perennial and intermittent streams; and imposes additional bonding and financial assurance requirements. In February 2017, the House and Senate passed a resolution disapproving of the Stream Protection Rule pursuant to the Congressional Review Act. If signed by President Trump, the rule will have no force or effect and cannot be replaced by a similar rule absent future legislation. This rule, if not repealed, or other new SMCRA regulations could result in additional material costs, obligations, and restrictions associated with our operations.
In addition to the bond requirement described above, the Abandoned Mine Land Fund, which was created by SMCRA, imposes a fee on all coal produced. The proceeds of the fee are used to restore mines closed or abandoned prior to SMCRA’s adoption in 1977. The current fee is $0.28 per ton of coal produced from surface mines. In 2016, 2015, and 2014 we recorded $16.3 million, $20.9 million, and $24.6 million, respectively, of expense related to these reclamation fees.
Surety Bonds
Federal and state laws require a mine operator to secure the performance of its reclamation and lease obligations required under SMCRA through the use of surety bonds or other approved forms of security to cover the costs the state would incur if the mine operator were unable to fulfill its obligations. As of December 31, 2016, there were approximately $448.4 million in third-party surety bonds outstanding to primarily secure the performance of our reclamation and lease obligations, and we were self-bonded for $10 million. In January 2017, we received approval to remove the final $10 million of self-bonding. We exited self-bonding in the first quarter of 2017. At some point, federal and state laws may be amended to require certain forms of financial assurance that are more costly to obtain, such as letters of credit. Recently, there has been heightened regulatory pressure on reclamation bonding and self-bonding in particular. In January 2016, the federal Office of Surface Mining Reclamation and Enforcement (“OSMRE”) sent Ten-Day Notices to the Wyoming Department of Environmental Quality regarding self-bonding of certain other coal companies who have filed for bankruptcy. In its notices, OSMRE asserted that a violation of the Wyoming approved state program may exist by allowing the specified companies to continue mining without sufficient reclamation bonding in place. In August 2016, the OSMRE issued a Policy Advisory discouraging state regulatory authorities from approving self-bonding arrangements. The Policy Advisory indicated that the OSMRE would begin more closely reviewing instances in which states accept self-bonds for mining operations. In the same month, the OSMRE also announced that it was beginning the rulemaking process to strengthen regulations on self-bonding. In addition, as a result of increasing credit pressures on the coal industry, it is possible that surety bond providers could demand cash collateral as a condition to providing or maintaining surety bonds. Any such demands, depending on the amount of any cash collateral required, could have a material adverse impact on our liquidity and financial position. If we are unable to meet cash collateral requirements and cannot otherwise obtain or retain required surety bonds, we may be unable to satisfy legal requirements necessary to conduct our mining operations.
Mine Safety and Health
Stringent health and safety standards have been in effect since Congress enacted the Coal Mine Health and Safety Act of 1969. The Federal Mine Safety and Health Act of 1977 (the “Mine Act”), significantly expanded the enforcement of safety and health standards and imposed safety and health standards on all aspects of mining operations. In addition to federal regulatory programs, all of the states in which we operate also have state programs for mine safety and health regulation and enforcement. Collectively, federal and state safety and health regulation in the coal mining industry is among the most comprehensive and pervasive systems for protection of employee health and safety affecting any segment of U.S. industry. The Mine Act is a strict liability statute that requires mandatory inspections of surface and underground coal mines and requires the issuance of enforcement action when it is believed that a standard has been violated. A penalty is required to be imposed for each cited violation. Negligence and gravity assessments result in a cumulative enforcement arrangement that may result in the issuance of withdrawal orders. The Mine Act also contains criminal liability provisions. For example, it imposes criminal liability for corporate operators who knowingly or willfully authorize, order or carry out violations and for any person who knowingly falsifies records required under the Mine Act. The Mine Act also provides that civil and criminal penalties may be assessed against individual agents, officers and directors who knowingly authorize, order or carry out violations.
In 2006, in response to underground mine accidents, Congress enacted the Mine Improvement and New Emergency Response Act (the “MINER Act”). The MINER Act significantly amended the Mine Act, requiring improvements in mine safety practices, increasing criminal penalties and establishing a maximum civil penalty for non-compliance, and expanding the scope of federal oversight, inspection and enforcement activities. Since passage of the MINER Act, and particularly since the April 2010 explosion at Massey Energy Company’s (now Alpha Natural Resources) Upper Big Branch Mine, enforcement scrutiny has increased, including more inspection hours at mine sites, increased numbers of inspections and increased issuance of the number and the severity of enforcement actions and related penalties. Various states also have enacted their own new laws and regulations addressing many of these same subjects. MSHA continues to interpret and implement various provisions of the MINER Act, along with introducing new proposed regulations and standards. For example, the second phase of the MSHA’s respirable coal mine dust rule went into effect in February 2016, and requires increased sampling frequency and the use of continuous personal dust monitors. In August 2016, the third and final phase of the rule became effective, reducing the overall respirable dust standard in coal mines from 2.0 to 1.5 milligrams per cubic meter of air. Our compliance with these or any other new mine health and safety regulations could increase our mining costs.
We have implemented various internal standards to promote employee health and safety. In addition, we are also Occupational Health and Safety Assessment Series 18001 certified. According to MSHA data, we have one of the lowest employee all injury incident rates among the largest U.S. coal producing companies. Nevertheless, if we were to be found in violation of mine safety and health regulations, we could face penalties or restrictions that may materially and adversely impact our operations, financial results and liquidity.
Black Lung
Under the Black Lung Benefits Revenue Act of 1977 and the Black Lung Benefits Reform Act of 1977, as amended in 1981, each coal mine operator must pay federal black lung benefits to claimants who are current and former employees and also make payments to a trust fund for the payment of benefits and medical expenses to claimants who last worked in the coal industry prior to January 1, 1970. The trust fund is funded by an excise tax on production of up to $1.10 per ton for deep-mined coal and up to $0.55 per ton for surface-mined coal, neither amount to exceed 4.4% of the gross sales price. The excise tax does not apply to coal shipped outside the U.S. In 2016, 2015, and 2014 we recorded $28.6 million, $36.3 million, and $42.0 million, respectively, of expense related to this excise tax.
The Patient Protection and Affordable Care Act includes significant changes to the federal black lung program including an automatic survivor benefit paid upon the death of a miner with an awarded black lung claim and establishes a rebuttable presumption with regard to pneumoconiosis among miners with 15 or more years of coal mine employment that are totally disabled by a respiratory condition. These changes could have a material impact on our costs expended in association with the federal black lung program. For miners last employed as miners after 1969 and who are determined to have contracted black lung, we maintain coverage sufficient to cover the cost of present and future claims through the use of trusts or insurance policies. We may also be liable under state laws for black lung claims that are covered through insurance policies.
Clean Air Act
The CAA and comparable state laws that regulate air emissions affect coal mining operations both directly and indirectly. Direct impacts on coal mining and processing operations include CAA permitting requirements and emission control requirements relating to air pollutants, including particulate matter, which may include controlling fugitive dust. The CAA indirectly affects coal mining operations by extensively regulating the emissions of particulate matter, sulfur dioxide, nitrogen oxides, mercury and other compounds emitted by coal-fired power plants. In recent years, Congress has considered legislation that would require increased reductions in emissions of sulfur dioxide, nitrogen oxide and mercury. In addition to the GHG issues discussed below, the air emissions programs that may materially and adversely affect our operations, financial results, liquidity, and demand for our coal, directly or indirectly, include, but are not limited to, the following:
· Acid Rain. Title IV of the CAA requires reductions of sulfur dioxide emissions by electric utilities. Affected power plants have sought to reduce sulfur dioxide emissions by switching to lower sulfur fuels, installing pollution control devices, reducing electricity generating levels or purchasing or trading sulfur dioxide emission allowances. We cannot accurately predict the future effect of these Clean Air Act provisions on our operations.
· NAAQS for Criterion Pollutants. The CAA requires the EPA to set standards, referred to as NAAQS, for six common air pollutants, including nitrogen oxide, sulfur dioxide, particulate matter, and ozone. Areas that are not in compliance (referred to as non-attainment areas) with these standards must take steps to reduce emissions levels. Although our operations are not currently located in non-attainment areas, we could be required to incur significant costs to install additional emissions control equipment, or otherwise change our operations and future development if that were to change. Over the past several years, the EPA has revised its NAAQS for nitrogen oxide, sulfur dioxide, and particulate matter, and, in November 2014, proposed a revised standard for ozone, in each case making the standards more stringent. The EPA has determined that the areas in which we operate are classified under the new nitrogen oxide standard as “unclassifiable/attainment”. Based on the EPA’s second round of area designations, effective September 2016, no areas in which we operate have been designated as nonattainment under the 2010 revised sulfur dioxide NAAQS. In November 2015, the EPA also revised the NAAQS for ground level ozone to a stricter, lower standard of 70 parts per billion. In September 2016, both Montana and Wyoming submitted state designation recommendations to the EPA recommending that all areas/counties within each state be classified as either attainment/unclassifiable or attainment under the 2015 revised Ozone NAAQS. The EPA has not yet designated which areas of the country are out of attainment with the new ground level ozone standard, and it will take the states several years to develop compliance plans for their non-attainment areas. Certain areas of the country previously in compliance with the various NAAQS standards may be reclassified as non-attainment. Such reclassification may make it more difficult to construct new or modified sources of air pollution in newly designated non-attainment areas.
· Clean Air Interstate Rule and Cross-State Air Pollution Rule. CAIR calls for power plants in 28 states and the District of Columbia to reduce emission levels of sulfur dioxide and nitrogen oxide pursuant to a cap-and-trade program similar to the system now in effect for acid rain. In June 2011, the EPA finalized CSAPR, a replacement
rule to CAIR, which requires 28 states in the Midwest and eastern seaboard of the U.S.to reduce power plant emissions that cross state lines and contribute to ozone and/or fine particle pollution in other states. Nitrogen oxide and sulfur dioxide emissions reductions were scheduled to commence in 2012, with further reductions effective in 2014. However, in August 2012, the U.S. Court of Appeals for the District of Columbia Circuit (the “D.C. Circuit”) vacated CSAPR and ordered the EPA to continue enforcing CAIR. In April 2014, the U.S. Supreme Court reversed the D.C. Circuit’s decision vacating CSAPR. The EPA subsequently moved the Appeals Court for an order lifting the stay of CSAPR and extending the CSAPR compliance deadlines. In October 2014, the Court granted the EPA’s request to lift the stay, and in November 2014, the EPA issued an interim final rule reconciling the CSAPR rule with the Court’s order, which calls for Phase 1 implementation in 2015 and Phase 2 implementation in 2017. In September 2016, the EPA finalized an update to the CSAPR ozone season program by issuing the Final CSAPR Update. For states to meet their requirements under CSAPR, a number of coal-fired electric generating units will likely need to be retired, rather than retrofitted with the necessary emission control technologies, reducing demand for thermal coal.
· NOx SIP Call. The NOx SIP Call program was established by the EPA in October 1998 to reduce the transport of nitrogen oxide and ozone on prevailing winds from the Midwest and South to states in the Northeast, which alleged that they could not meet federal air quality standards because of migrating pollution. The program is designed to reduce nitrogen oxide emissions by one million tons per year in 22 eastern states and the District of Columbia. As a result of the program, many power plants have been or will be required to install additional emission control measures, such as selective catalytic reduction devices. Installation of additional emission control measures will make it more costly to operate coal-fired power plants, potentially making coal a less attractive fuel.
· Mercury and Hazardous Air Pollutants. In February 2012, the EPA formally adopted a rule to regulate emissions of mercury and other metals, fine particulates, and acid gases such as hydrogen chloride from coal- and oil-fired power plants, referred to as “MATS”. In March 2013, the EPA finalized reconsideration of the MATS rule as it pertains to new power plants, principally adjusting emissions limits for new coal-fired units to levels considered attainable by existing control technologies. In subsequent litigation, the U.S. Court of Appeals for the D.C. Circuit upheld various portions of the rulemaking in two separate decisions issued in March and April 2014, respectively. In June 2015, the U.S. Supreme Court struck down the MATS rule based on the EPA’s failure to take costs into consideration and remanded the case back to the D.C. Circuit. The D.C. Circuit has remanded the rule to the EPA, but allowed the current rule to stay in place until the EPA issues a new finding. In April 2016, the EPA issued a final finding that it is appropriate and necessary to set standards for emissions of air toxics from coal- and oil-fired power plants. Apart from MATS, several states have enacted or proposed regulations requiring reductions in mercury emissions from coal-fired power plants, and federal legislation to reduce mercury emissions from power plants has been proposed. Regulation of mercury emissions by the EPA, states, Congress, or pursuant to an international treaty may further decrease the demand for coal. Like CSAPR, MATS and other similar future regulations could accelerate the retirement of a significant number of coal-fired power plants, in addition to the significant number of plants and units that have already been retired as a result of environmental and regulatory requirements and uncertainties adversely impacting coal-fired generation. Such retirements would likely adversely impact our business.
· Regional Haze, New Source Review and Methane. The EPA has initiated a regional haze program to protect and improve visibility at and around national parks, national wilderness areas and international parks. In December 2011, the EPA issued a final rule under which the emission caps imposed under CSAPR for a given state would supplant the obligations of that state with regard to visibility protection. In May 2012, the EPA finalized a rule that allows the trading programs in CSAPR to serve as an alternative to determining source-by-source Best Available Retrofit Technology (“BART”). This rule provides that states in the CSAPR region can substitute participation in CSAPR for source-specific BART for sulfur dioxide and/or nitrogen oxides emissions from power plants. The Tenth Circuit Court of Appeals is hearing Wyoming’s challenge to the EPA’s partial disapproval of the State’s related plan for reducing emissions of haze-causing nitrogen dioxide. Wyoming’s current plan to mitigate nitrogen dioxide will continue during the appeal. In September 2014, the Court stayed the EPA’s rejection of Wyoming’s plan and the litigation is still ongoing. An adverse outcome in this case could result in additional regulatory requirements and compliance costs for our operations.
· In addition, the EPA’s new source review program under certain circumstances requires existing coal-fired power plants, when modifications to those plants significantly change emissions, to install the more stringent air emissions control equipment required of new plants. Litigation seeking to force the EPA to list coal mines as a category of air pollution sources that endanger public health or welfare under Section 111 of the CAA and establish standards to reduce emissions from sources of methane and other emissions related to coal mines was dismissed by the D.C. Circuit in May 2014. In that case, the Court denied a rulemaking petition citing agency discretion and budgetary
restrictions, and ruled the EPA has reasonable discretion to carry out its delegated responsibilities, which includes determining the timing and relative priority of its regulatory agenda. In July 2014, the D.C. Circuit denied a petition seeking a rehearing of the case en banc. Litigation around these issues may continue, and could result in the need for additional air pollution controls for coal fired units and our operations.
Global Climate Change
Global climate change initiatives and public perceptions have resulted, and are expected to continue to result, in decreased coal-fired power plant capacity and utilization, phasing out and closing many existing coal-fired power plants, reducing or eliminating construction of new coal-fired power plants in the United States and certain other countries, increased costs to mine coal and decreased demand and prices for thermal coal, including PRB coal.
There are three important sources of GHGs associated with the coal industry. The end use of our coal in electricity generation is the largest of the three sources of GHGs. Combustion of fuel for mining equipment used in coal production is another source of GHGs. In addition, coal mining can release methane, a GHG, directly into the atmosphere. These emissions from coal consumption and production are subject to pending and proposed regulation as part of initiatives to address global climate change.
The Kyoto Protocol to the 1992 United Nations Framework Convention on Climate Change (the “Kyoto Protocol”) became effective in 2005, and bound those developed countries that ratified it (which the U.S. did not do) to reduce their global GHG emissions. Discussions to develop a treaty to replace the Kyoto Protocol after its expiration in 2012 are still ongoing. Most recently, the United Nations Framework Convention on Climate Change met in Paris, France in December 2015 and agreed to an international climate agreement. Although this agreement does not create any binding obligations for nations to limit their GHG emissions, it does include pledges to voluntarily limit or reduce future emissions. The Paris climate agreement entered into force in November 2016. These commitments could further reduce demand and prices for our coal.
The EPA has adopted rules requiring the reporting of GHG emissions from specified large GHG emission sources in the U.S., including coal-fired electric power plants, and begun adopting and implementing regulations to restrict emissions of GHGs under existing provisions of the CAA. These rules were legally challenged, but in June 2012, the D.C. Circuit denied these challenges. Among the rules promulgated after the EPA’s endangerment finding was the Tailoring Rule, which requires that all new or modified stationary sources of GHGs that will emit more than 75,000 tons of carbon dioxide per year and are otherwise subject to CAA regulation, and any other facilities that will emit more than 100,000 tons of carbon dioxide per year, to undergo prevention of significant deterioration (“PSD”) permitting, which requires that the permitted entity adopt the best available control technology. As a result, the EPA is now requiring new sources, including coal-fired power plants, to undergo control technology reviews for GHGs (predominately carbon dioxide) as a condition of permit issuance. These reviews may impose limits on GHG emissions, or otherwise be used to compel consideration of alternative fuels and generation systems, as well as increase litigation risk for—and so discourage development of—coal-fired power plants.
Additionally, the U.S. Supreme Court, in a decision issued in June 2014, addressed whether the EPA’s regulation of GHG emissions from new motor vehicles properly triggered GHG permitting requirements for stationary sources under the CAA. The decision reversed, in part, and affirmed, in part, a 2012 D.C. Circuit decision that upheld the EPA’s GHG-related regulations. Specifically, the Court held that the EPA exceeded its statutory authority when it interpreted the CAA to require PSD and Title V permitting for stationary sources based on their potential GHG emissions. However, the Court also held that the EPA’s determination that a source already subject to the PSD program due to its emission of conventional pollutants may be required to limit its GHG emissions by employing the “best available control technology” was permissible.
In August 2015, the EPA issued its final Clean Power Plan (“CPP”) rules that establish carbon pollution standards for power plants, called CO2 emission performance rates. The EPA expects each state to develop implementation plans for power plants in its state to meet the individual state targets established in the CPP. The EPA has given states the option to develop compliance plans for annual rate-based reductions (pounds per megawatt hour) or mass-based tonnage limits for CO2. The state plans were to be due in September 2016, subject to potential extensions of up to two years for final plan submission. The compliance period begins in 2022, and emission reductions will be phased in up to 2030. The EPA also proposed a federal compliance plan to implement the CPP in the event that an approvable state plan is not submitted to the EPA. Judicial challenges have been filed. On February 9, 2016, the U.S. Supreme Court granted a stay of the implementation of the CPP before the United States Court of Appeals for the District of Columbia (“Circuit Court”) even issued a decision. By its terms, this stay will remain in effect throughout the pendency of the appeals process including at the Circuit Court and the Supreme Court through any certiorari petition that may be granted. The stay suspends the rule, including the requirement that states submit their initial plans by September 2016. The Supreme Court’s stay applies only to
EPA’s regulations for CO2 emissions from existing power plants and will not affect EPA’s standards for new power plants. It is not yet clear how either the Circuit Court or the Supreme Court will rule on the legality of the CPP. Additionally, it is unclear how the CPP may be impacted by the 2017 change in the U.S. Presidential administration. If the rules were upheld at the conclusion of this appellate process and were implemented in their current form, demand for coal would likely be further decreased, potentially significantly, and our business would be adversely impacted.
Various states and regions have adopted GHG initiatives and certain governmental bodies, including the State of California, have or are considering the imposition of fees or taxes based on the emission of GHGs by certain facilities. A number of states have enacted legislative mandates requiring electricity suppliers to use renewable energy sources to generate a certain percentage of power.
These and other current or future global climate change laws, regulations, court orders or other legally enforceable mechanisms, or related public perceptions regarding climate change, are expected to require additional controls on coal-fired power plants and industrial boilers and may cause some users of coal to further switch from coal to alternative sources of fuel, thereby depressing demand and pricing for coal.
Clean Water Act
The Clean Water Act (“CWA”) and corresponding state and local laws and regulations affect coal mining operations by restricting the discharge of pollutants, including dredged or fill materials, into waters of the U.S. The CWA provisions and associated state and federal regulations are complex and subject to amendments, legal challenges and changes in implementation. Legislation that seeks to clarify the scope of CWA jurisdiction has also been considered by Congress. Recent court decisions, regulatory actions and proposed legislation have created uncertainty over CWA jurisdiction and permitting requirements.
CWA requirements that may directly or indirectly affect our operations include the following:
· Wastewater Discharge. Section 402 of the CWA creates a process for establishing effluent limitations for discharges to streams that are protective of water quality standards through the National Pollutant Discharge Elimination System (“NPDES”), and corresponding programs implemented by state regulatory agencies. Regular monitoring, reporting and compliance with performance standards are preconditions for the issuance and renewal of NPDES permits that govern discharges into waters of the U.S. Failure to comply with the CWA or NPDES permits can lead to the imposition of significant penalties, litigation, compliance costs and delays in coal production. Furthermore, the imposition of future restrictions on the discharge of certain pollutants into waters of the U.S. could increase the difficulty of obtaining and complying with NPDES permits, which could impose additional time and cost burdens on our operations. For instance, waters that states have designated as impaired (i.e., as not meeting present water quality standards) are subject to Total Maximum Daily Load regulations, which may lead to the adoption of more stringent discharge standards for our coal mines and could require more costly treatment.
Likewise, when water quality in a receiving stream is better than required, states are required to conduct an anti-degradation review before approving discharge permits. Anti-degradation policies may increase the cost, time and difficulty associated with obtaining and complying with NPDES permits and may also require more costly treatment.
· Dredge and Fill Permits. Many mining activities, including the development of settling ponds and other impoundments, require a Section 404 permit from the Army Corps of Engineers (the “Corps”). Generally speaking, these Section 404 permits allow the placement of fill materials into navigable waters of the U.S. including wetlands, streams, and other regulated areas. The Corps has issued general “nationwide” permits for specific categories of activities that are similar in nature and that are determined to have minimal adverse effects on the environment. Permits issued pursuant to Nationwide Permit 21 (“NWP 21”) generally authorize the disposal of dredged or fill material from surface coal mining activities into waters of the U.S., subject to certain restrictions. NWP 21s are typically reissued for a five-year period and require appropriate mitigation, and permit holders must receive explicit authorization from the Corps before proceeding with proposed mining activities. The Corps reauthorized use of NWP 21 for surface coal mines in January 2017. The new NWP 21 closely mirrors the 2012 NWP 21, but removes a provision authorizing disposal of dredged or fill material from certain surface coal mining activities that were previously authorized by the 2007 NWP 21 and clarifies that any losses of stream bed are applied to the 1/2-acre limit for loss of jurisdictional wetlands and waters. Expansion of our mining operations into new areas may trigger the need for individual Corps approvals which could be more costly and take more time to obtain.
Because of the U.S. Supreme Court’s divided decision in Rapanos v. United States, there is some regulatory uncertainty about what constitutes jurisdictional waters and wetlands. Consequently, in April 2014, the EPA and the Corps released a proposed rule to revise the definition of “waters of the United States” (“WOTUS”) for all CWA programs. The EPA subsequently released the WOTUS rule, which went into effect in August 2015. The U.S. Court of Appeals for the Sixth Circuit has stayed the WOTUS rule nationwide pending further action of the court. In response to this decision, the EPA and the Corps resumed nationwide use of the agencies’ prior regulations defining the term “waters of the United States.” Those regulations will be implemented as they were prior to the effective date of the new WOTUS rule. On January 13, 2017, the U.S. Supreme Court granted review to decide whether jurisdiction to hear a challenge to the WOTUS rule lies in the courts of appeal or federal district courts. The WOTUS rule could significantly expand federal control of land and water resources across the U.S., triggering substantial additional permitting and regulatory requirements.
In March 2010, the Corps made a determination that there are no jurisdictional wetlands at our Spring Creek Mine. Similarly, in September 2012, the Corps made a determination of an absence of waters of the U.S. for our Antelope Mine. Therefore, the Corps’ authorization of mining activities is not required for currently permitted lands. In September 2014, the Corps authorized proposed operations under NWP 21 for our Cordero Rojo Mine. All jurisdictional determinations are resolved, where applicable. Where there are jurisdictional wetlands, our Wyoming coal mines continue to operate under their respective NWP 21 permits.
· Cooling Water Intake. In May 2014, the EPA issued a new final rule pursuant to Section 316(b) of the CWA that affects the cooling water intake structures at power plants in order to reduce fish impingement and entrainment. The rule is expected to affect over 500 power plants. These requirements could increase our customers’ costs and may adversely affect the demand for coal, which may materially impact our results or operations.
Resource Conservation and Recovery Act
The EPA determined that coal combustion residues (“CCR”) do not warrant regulation as hazardous wastes under the Resource Conservation and Recovery Act (“RCRA”) in May 2000. Most state hazardous waste laws do not regulate CCR as hazardous wastes. The EPA also concluded that beneficial uses of CCR, other than for mine filling, pose no significant risk and no additional national regulations of such beneficial uses are needed. However, the EPA determined that national non-hazardous waste regulations under RCRA are warranted for certain wastes generated from coal combustion, such as coal ash, when the wastes are disposed of in surface impoundments or landfills or used as minefill. In December 2014, the EPA finalized regulations that address the management of coal ash as a non-hazardous solid waste under Subtitle D. The rules impose engineering, structural and siting standards on surface impoundments and landfills that hold coal combustion wastes and mandate regular inspections. The rule also requires fugitive dust controls and imposes various monitoring, cleanup, and closure requirements. There have also been several legislative proposals that would require the EPA to further regulate the storage of CCR. For example, in December 2016, Congress passed the Water Infrastructure Improvements for the Nation Act, which allows states to establish permit programs to regulate the disposal of CCR units in lieu of the EPA’s CCR regulations. These requirements, as well as any future changes in the management of CCR, could increase our customers’ operating costs and potentially reduce their ability or need to purchase coal. In addition, contamination caused by the past disposal of CCR, including coal ash, can lead to material liability for our customers under RCRA or other federal or state laws and potentially further reduce the demand for coal.
Comprehensive Environmental Response, Compensation and Liability Act
The Comprehensive Environmental Response, Compensation and Liability Act (“CERCLA”) and similar state laws affect coal mining operations by, among other things, imposing cleanup requirements for threatened or actual releases of hazardous substances into the environment. Under CERCLA and similar state laws, joint and several liability may be imposed on hazardous substance generators, site owners, transporters, lessees and others regardless of fault or the legality of the original disposal activity. Although the EPA currently excludes most wastes generated by coal mining and processing operations from the primary hazardous waste laws, such wastes can, in certain circumstances, constitute hazardous substances for the purposes of CERCLA. In addition, the disposal, release or spilling of some products used by coal companies in operations, such as chemicals, could trigger the liability provisions of CERCLA or similar state laws. Thus, we may be subject to liability under CERCLA and similar state laws for coal mines that we currently own, lease or operate or that we or our predecessors have previously owned, leased or operated, and sites to which we or our predecessors sent hazardous substances. We may be liable under CERCLA or similar state laws for the cleanup of hazardous substance contamination and natural resource damages at sites where we control surface rights. These liabilities could be significant and materially and adversely impact our financial results and liquidity.
Endangered Species Act
The federal Endangered Species Act (the “ESA”) and counterpart state legislation protect species threatened with possible extinction. The U.S. Fish and Wildlife Service (the “USFWS”) works closely with the OSM and state regulatory agencies to ensure that species subject to the ESA are protected from mining-related impacts. A number of species indigenous to the areas in which we operate are protected under the ESA. Other species in the vicinity of our operations, such as the mountain plover, which the USFWS determined not to list as threatened in May 2011, may have their listing status reviewed in the future.
Compliance with ESA requirements could have the effect of prohibiting or delaying us from obtaining mining permits. These requirements may also include restrictions on timber harvesting, road building and other mining or agricultural activities in areas containing the affected species or their habitats. For example, our Spring Creek Mine applied for lease modification under the BLM leasing regulations and a mine permit amendment to add lands to the permit area. Portions of these lands have been designated as core habitat for the greater sage grouse by the Montana Fish, Wildlife and Parks Department. While the USFWS has determined that the greater sage grouse should not be listed as a threatened or endangered species, the BLM has developed Conservation Plans designed to preserve and protect greater sage-grouse habitat. Montana has also developed sage grouse conservation plans through Governor’s executive order. Our approvals to mine or otherwise affect these areas will be subject to review by the BLM and the Montana Department of Environmental Quality and determinations of our ability to adequately mitigate impacts to sage grouse and sage grouse habitat. The plans do however, recognize the right to mine where there are valid existing rights. The BLM has stated that conserving sagebrush habitat will be an important consideration in the BLM review of proposed coal mines or coal mine expansions. The plans also recommend that the Secretary of the Interior withdraw 10 million acres from hardrock mining for up to 20 years. The BLM is beginning that separate, public withdrawal process by putting in place a temporary, two-year prohibition for new hardrock mining location and entry in certain areas. Our mines are not located within the areas that the BLM has designated for withdrawing from hardrock mining.
These and any similar future actions could result in more stringent requirements being issued by the BLM and other agencies involved in the leasing and permitting process. The USFWS must review its 2015 decision to not list the sage grouse again in five years. Should more stringent protective measures be applied or if the greater sage-grouse is listed as a threatened species by the USFWS, this could significantly impair our ability to conduct our mining operations or result in increased operating costs, heightened difficulty in obtaining future mining permits, or the need to implement additional mitigation measures.
Use of Explosives
Our surface mining operations are subject to numerous regulations relating to blasting activities. Pursuant to these regulations, we incur costs to design and implement blast schedules and to conduct pre-blast surveys and blast monitoring. In addition, the storage of explosives is subject to regulatory requirements. For example, pursuant to a rule issued by the Department of Homeland Security in 2007, facilities in possession of chemicals of interest (including ammonium nitrate at certain threshold levels) are required to complete a screening review. Our mines are low risk, Tier 4 facilities which are not subject to additional security plans. In 2008, the Department of Homeland Security proposed regulation of ammonium nitrate under the ammonium nitrate security rule. Many of the requirements of the rule would be duplicative of those in place under the Bureau of Alcohol Tobacco and Firearms, including registration and background checks. Additional requirements may include tracking and verifications for each transaction related to ammonium nitrate. A final rule has yet to be issued. In December 2014, the OSM announced its decision to pursue a rulemaking to revise regulations under SMCRA which will address all blast generated fumes and toxic gases. OSM has not yet issued a proposed rule to address these blasts. The outcome of these rulemakings could materially adversely impact our cost or ability to conduct our mining operations.
National Environmental Policy Act
NEPA requires federal agencies, including the Department of the Interior, to evaluate major agency actions that have the potential to significantly impact the environment, such as issuing a permit or other approval. In the course of such evaluations, an agency will typically prepare an environmental assessment to assess the potential direct, indirect and cumulative impacts of a proposed project. Where the activities in question have significant impacts to the environment, the agency must prepare an EIS. Compliance with NEPA can be time-consuming and may result in the imposition of mitigation measures that could affect the amount of coal that we are able to produce from mines on federal lands, and may require public comment. Whether agencies have complied with NEPA is subject to protest, appeal or litigation, which can delay or halt projects. The NEPA review process, including potential disputes regarding the level of evaluation required for climate change impacts, may extend the time and/or increase the costs and difficulty for obtaining necessary governmental approvals,
and may lead to litigation regarding the adequacy of the NEPA analysis, which could delay or potentially preclude the issuance of approvals or grant of leases.
In August 2016, the CEQ released final guidance discussing how federal agencies should consider the effects of GHG emissions and climate change in their NEPA evaluations. The guidance directs agencies to consider: (1) the potential effects of a proposed action on climate change as indicated by assessing GHG emissions; and, (2) the effects of climate change on a proposed action and its environmental impacts. This guidance, if continued under the current U.S. Presidential administration, could create additional delays and costs in the NEPA review process or in our operations, or even an inability to obtain necessary federal approvals for our operations, including due to the increased risk of legal challenges from environmental groups seeking additional analysis of climate impacts.
DOI Moratorium and Programmatic EIS
On January 15, 2016, the Secretary of the Department of the Interior (“DOI”) announced a moratorium on the issuance of new leases for coal resources on federally-owned lands in order to allow for a “comprehensive review” of the federal coal programs. The terms of this moratorium preclude the BLM from accepting new applications for thermal coal sales, or modifying existing leases subject to certain exceptions. The Secretary did not set a deadline for completing this analysis but estimated that it may take three years to finalize. The moratorium does not preclude a company holding a lease from developing coal resources and thus should not interfere with our on-going operations. We are having discussions with the BLM as to whether certain pending applications to modify existing coal leases by adding additional resources fall within the exceptions set out by BLM.
It remains to be seen what the ultimate outcome of this comprehensive review of the federal program will mean for the future of developing coal on federal lands. Part of the analysis that DOI will undertake involves determining whether the “federal coal program conflicts with the Administration’s climate policy” and whether the system provides a “way to systematically consider the climate impacts and costs to taxpayers of Federal coal development.” This analysis will include a “Programmatic EIS” under NEPA. Depending on the outcome of this comprehensive review including the Programmatic EIS, either we may not be able obtain leases for developing coal resources on federal lands, or the terms of any such leases that we may be able to obtain may not be economically viable. Our business of leasing coal on federal lands may not remain economically viable at the conclusion of this “comprehensive review.” It remains unclear whether the current U.S. Presidential administration will modify or cancel this moratorium and EIS process.
Other Environmental Laws
We are required to comply with numerous other federal, state and local environmental laws and regulations in addition to those previously discussed. These additional laws include, for example, the Safe Drinking Water Act, and the Toxic Substances Control Act and transportation laws adopted to ensure the appropriate transportation of our coal both nationally and internationally. Laws, regulations, and treaties of other countries may also adversely impact our export sales by reducing demand for PRB coal, or coal in general, as a source of power generation in those countries.
Available Information
We file annual, quarterly and current reports, and amendments to those reports, proxy statements and other information with the SEC. You may access and read our filings without charge through the SEC’s website at www.sec.gov. You may also read and copy any document we file at the SEC’s public reference room located at 100 F Street, N.E., Room 1580, Washington, D.C. 20549. Please call the SEC at 1-800-SEC-0330 for further information on the public reference room.
We also make the documents listed above available without charge through our website, www.cloudpeakenergy.com, as soon as practicable after we file or furnish them with the SEC. You may also request copies of the documents, at no cost, by telephone at (720) 566-2900 or by mail at Cloud Peak Energy Inc., 385 Interlocken Crescent, Suite 400, Broomfield, Colorado, 80021, Attention: Investor Relations. In addition to reports we file or furnish with the SEC, we publicly disclose material information from time to time in our press releases, at annual meetings of stockholders, in publicly accessible conferences and investor presentations, and through our website. The information on our website is not part of this Form 10-K.
You should carefully consider the risk factors described below and other information contained in this Form 10-K. If any of the following risk factors, as well as other risks and uncertainties that are not currently known to us or that we currently believe are not material, actually occur, our business, financial condition and results of operations could be materially adversely affected and you may lose all or a significant part of your investment.
Risks Related to Our Business and Industry
Numerous political and regulatory authorities, along with well-funded environmental activist groups, are devoting substantial resources to anti-coal activities to minimize or eliminate the use of coal as a source of electricity generation, domestically and internationally, thereby further reducing the demand and pricing for coal, including PRB coal, and potentially materially and adversely impacting our future financial results, liquidity and growth prospects.
Concerns about the environmental impacts of coal combustion, including perceived impacts on global climate issues, are resulting in increased regulation of coal combustion in many jurisdictions, unfavorable lending policies by government-backed lending institutions and development banks toward the financing of new overseas coal-fueled power plants and divestment efforts affecting the investment community, which could significantly affect demand for our products or our securities. Global climate issues continue to attract public and scientific attention. Numerous reports, such as the Fourth and Fifth Assessment Report of the Intergovernmental Panel on Climate Change, have also engendered concern about the impacts of human activity, especially fossil fuel combustion, on global climate issues. In turn, increasing government attention is being paid to global climate issues and to emissions of GHGs, including emissions of carbon dioxide from coal combustion by power plants. The 2015 Paris climate summit agreement resulted in voluntary commitments by numerous countries to reduce their GHG emissions, and could result in additional firm commitments by various nations with respect to future GHG emissions. These commitments could further disfavor coal-fired generation, particularly in the medium- to long-term.
Enactment of laws or passage of regulations regarding emissions from the combustion of coal by the United States, some of its states or other countries, or other actions to limit such emissions, could also result in electricity generators further switching from coal to other fuel sources or additional coal-fueled power plant closures. Further, policies limiting available financing for the development of new coal-fueled power plants could adversely impact the global demand for coal in the future.
There have also been efforts in recent years affecting the investment community, including investment advisors, sovereign wealth funds, public pension funds, universities and other groups, promoting the divestment of fossil fuel equities and also pressuring lenders to limit funding to companies engaged in the extraction of fossil fuel reserves. In California, for example, legislation was signed into law in October 2015 that requires California’s state pension funds to divest investments in companies that generate 50% or more of their revenue from coal mining by July 2017. Other activist campaigns have urged banks to cease financing coal-driven businesses. As a result, numerous major banks have enacted such policies. The impact of such efforts may adversely affect the demand for and price of securities issued by us, and impact our access to the capital and financial markets.
Additional regulatory developments are slated to take place over the next few years that appear oriented at increasing the regulatory burden associated with mining coal and coal-fired generation. Regulatory initiatives that have been proposed, adopted, or enacted in the United States include: the MATS rule, the national emission standards for hazardous air pollutants boiler rules, the new source performance standards for fossil-fuel fired power plants, revisions to the nitrogen oxide and sulfur dioxide NAAQS, the CAIR rule, the Clean Power Plan, the regional haze program, regulation of CCR, revisions to the Corps’ Section 404 permitting regime, and OSM’s stream protection rule. See Item 1 “Business—Environmental and Other Regulatory Matters.” These and other governmental actions that directly or indirectly affect the coal mining industry and coal-fired power generation have made, and will continue to make, it more difficult and costly to mine and ship coal, and operate coal-fired assets. Meanwhile, substantial government subsidies are available to fund various aspects of renewable power generation and supply, which may hurt our ability to compete against these alternative forms of electric generation.
In addition, several well-funded non-governmental organizations have explicitly undertaken campaigns to minimize or eliminate the use of coal as a source of electricity generation. For example, the goals of Sierra Club’s “Beyond Coal” campaign include retiring one-third of the nation’s coal-fired power plants by 2020, replacing retired coal plants with “clean energy solutions,” and “keeping coal in the ground.” It has been reported that the Beyond Coal campaign has been funded by several high-profile, high-net-worth individuals and organizations, including approximately $80 million from Michael
Bloomberg and his philanthropic foundation, Bloomberg Philanthropies. In an effort to stop or delay coal mining activities, the Sierra Club and other activist groups have brought, and continue to bring, numerous lawsuits, including against the BLM to challenge not only the issuance of individual coal leases, but also the federal coal leasing program more broadly. Other lawsuits continue to be brought challenging historical and pending regulatory approvals, permits and processes that are necessary to conduct coal mining operations or to operate coal-fueled power plants, including so-called “sue and settle” lawsuits where regulatory authorities reach private agreements with environmental activists that often involve additional regulatory restrictions or processes being implemented without formal rulemaking. The announcement on January 15, 2016 by the Secretary of the DOI of a moratorium on the issuance of new leases by the BLM for developing coal resources on federally-owned lands was another regulatory initiative of the former U.S. Presidential administration oriented at reducing the availability of coal for power production domestically and internationally.
The net effect of these developments is to make it more costly and difficult to maintain our business and to continue to depress demand and pricing for our coal. A substantial or extended decline in the prices we receive for our coal due to these or other factors could further reduce our revenue and profitability, cash flows, liquidity, and value of our coal reserves and result in losses.
Coal prices are subject to change based on a number of factors and coal prices are currently depressed. If coal prices remain depressed, or if there is a substantial or extended decline in prices, it could materially reduce our revenue and profitability, cash flows, liquidity, and value of our coal reserves and result in losses.
Our revenue, results of operations, and the value of our coal reserves depend on the prices we receive for our coal and logistics services. Over the last several years, prices for coal have become more volatile and depressed due to an oversupply of coal and significantly reduced demand in the U.S. and various other countries. The prices we receive for our coal and logistics services depend upon factors beyond our control, including:
· domestic and foreign supply and demand for coal, including Asian and other foreign demand for PRB coal exports, and the impact of domestic and foreign government environmental, energy and tax policies and currency exchange rate fluctuations;
· domestic and foreign demand for electricity and steel;
· domestic and foreign economic conditions;
· the quantity, quality, and price of coal available from domestic and foreign competitors, including coal re-sellers and traders;
· competition for production of electricity from non-coal sources, including the price and availability of alternative fuels, such as natural gas and crude oil, and alternative energy sources, such as nuclear, hydroelectric, wind and solar power, and the effects of technological developments related to these non-coal and alternative energy sources;
· adverse weather, climatic or other natural conditions, including natural disasters;
· legislative, regulatory and judicial developments, environmental regulatory changes, or changes in energy and tax policy and energy conservation measures that would adversely affect the coal or utility industries, such as legislation or regulation that limits carbon dioxide or sulfur dioxide emissions or provides for increased funding, subsidies or other incentives for, or mandates the use of, alternative energy sources to address climate change;
· domestic and foreign governmental regulations and taxes, including with respect to air emission standards for coal-fired power plants, and the ability of coal-fired power plants to economically meet these standards;
· changes in coal-fired power plant capacity and utilization, including the extent to which new coal plants are built in the United States and other countries;
· market price fluctuations for sulfur dioxide emission allowances;
· the capacity of, cost of, and proximity to, rail transportation and terminal facilities and rail and terminal performance; and
· the other risks described in this Item 1A.
If coal prices remain depressed, or if there is a substantial or extended decline in the prices we receive for our coal and logistics services due to these or other factors, it could materially reduce our revenue and profitability, cash flows, liquidity, and value of our coal reserves and result in losses.
Competition with domestic and foreign coal producers, with traders and re-sellers of coal and with producers of natural gas and other competing energy sources may continue to negatively affect our sales volumes and our ability to sell coal at a favorable price.
The coal industry is highly competitive. We compete with other domestic and many foreign coal producers, with traders and re-sellers of coal and with other energy producers throughout the U.S. and, for our export sales, internationally. In addition to the price of coal, coal quality, and transportation costs, demand for coal also has a significant impact on our ability to compete domestically and internationally for coal sales. Demand for coal depends upon a number of factors, including:
· general economic conditions and weather patterns, both of which are significant contributors to the demand for electricity;
· delivered prices for coal, including the relative costs of transportation, such as ocean freight rates, from our mine site and competing mines or supplies of coal;
· availability and cost of alternative fuel sources, such as natural gas;
· technological developments;
· environmental, tax, and other governmental policies and regulations, including EPA regulations; and
· currency exchange rate fluctuations impacting our export sales.
Demand for U.S. coal has fluctuated over the last decade because of these and other factors and, in recent years, has declined substantially due to global climate change initiatives and other regulatory initiatives that favor natural gas or non-fossil fuel sources of electricity generation, sustained low natural gas prices in the United States, weak global economic conditions and other factors, including those described in this Item 1A. A decline in domestic demand for coal, or a decline in foreign demand for U.S. coal, has caused, and could continue to cause, additional significant competition among coal producers and downward pressure on coal prices. Furthermore, overcapacity and increased production in the future, similar to the activities that occurred during the mid-1970s and early 1980s, could result in additional production capacity throughout the industry, causing increased competition and lower coal prices, materially reducing our revenue, profitability, cash flows, and liquidity.
In addition to competing with other coal producers, we compete generally with producers of other fuels, such as natural gas. A decline in the price of natural gas has made natural gas more competitive against coal and resulted in utilities switching from coal to natural gas. Sustained low natural gas prices may also cause utilities to continue to phase out or close existing coal-fired power plants or reduce or eliminate construction of any new coal-fired power plants, which could have a material adverse effect on demand and prices received for our coal.
Legislation requiring the use and dispatch of alternative energy sources and fuels or legislation providing financing or incentives to encourage continuing technological advances and deployment in this area could further enable alternative energy sources to become more competitive with coal. If alternative energy sources, such as hydroelectric, wind or solar, become more cost-competitive, demand for coal could decrease and cause a decrease in the price of coal.
If we do not grow our longer term logistics revenue and export sales at favorable prices, we may incur losses in our logistics business and be subject to significant take-or-pay commitments.
Our ability to grow our export sales revenue and logistics margins depends on a number of factors, including the price we receive for our coal and our logistics services, the existence of sufficient and cost-effective export terminal capacity for the shipment of thermal coal to foreign customers, and demand by customers in Asia and in other potential export destinations for PRB coal.
International customer demand for PRB coal, and the prices those customers may be willing to pay for PRB coal and related transportation services provided by our logistics business, can be affected by a variety of factors, including supplier diversity and security considerations, economic conditions and demand for electricity in the relevant locations, international energy and tax policies and regulatory requirements, and availability and pricing for thermal coal delivered from alternative international coal basins. Further, our export sales are priced relative to the international Newcastle benchmark price index, which is volatile and is heavily influenced by Chinese and Indian thermal coal import demand. For example, on December 31, 2015, spot Newcastle prices were $51.96 per tonne. As of December 31, 2016, spot Newcastle prices increased significantly to $88.14 per tonne. Fluctuations in this index may be affected by a wide range of international supply and demand factors, including those listed above. Our export sales may also be negatively impacted by currency exchange rate fluctuations that make coal from other countries more economical than PRB coal and provide competitive advantages to non-U.S. producers when the U.S. dollar is strong in comparison to those foreign currencies. For example, the Newcastle benchmark price index is denominated in U.S. dollars. The conversion rate of U.S. dollars to Australian dollars increased from 1.37 as of December 31, 2015 to 1.39 as of December 31, 2016. If demand for exports remains low or declines or we are unable to secure a favorable price for the export of our coal and logistics services, our cash flows, profitability, liquidity, and results of operations may be materially adversely affected.
At present, there is limited terminal capacity for the export of PRB coal to foreign destinations. Our access to existing and any future terminal capacity, including the proposed MBT in which we have an option for potential future capacity, may be adversely affected by regulatory and permit requirements, environmental and other legal challenges, public perceptions and resulting political pressures, operational issues at terminals and competition among North American coal producers for access to limited terminal capacity, among other factors. If we fail to maintain terminal capacity, or are denied access to existing or any future terminals for the export of our coal on commercially reasonable terms, or at all, our results from our future export transactions will be materially adversely affected.
In addition, we have significant multi-year take-or-pay contracts for rail and terminal capacity related to our logistics services for export sales. These contracts require us to pay for a minimum quantity of coal to be transported on the railway or through the terminal regardless of whether we sell any coal or the prices we receive for our coal or logistics services. If we fail to make sufficient export sales to meet our minimum obligations under these take-or-pay contracts, we are still obligated to make payments to the railway or terminal, which could have a negative impact on our cash flows, profitability and results of operations. As of December 31, 2016, we had take-or-pay commitments of $127.1 million that could be potentially payable if we fail to meet our minimum shipment obligations. See Item 7—“Management’s Discussion and Analysis of Financial Condition and Results of Operations—Contractual Obligations.”
The regulatory environment may also adversely impact our logistics business and future export sales. For example, the ONRR finalized changes to how coal royalties are calculated for sales to affiliated entities, which could adversely impact export sales for vertically integrated mining and logistics entities, such as our logistics business, and place vertically integrated entities at a competitive disadvantage compared to independent coal brokers. Moreover, the ONRR proposal includes a so-called “default provision”, which creates further uncertainty as to how the ONRR would apply its proposed royalty rules to our export sales. We, along with other energy industry companies and trade associations, have filed litigation to challenge this ONRR rule. The timing and ultimate outcome of the litigation is uncertain and cannot be predicted.
Our long-term growth may be materially adversely impacted if economic, commercially available carbon capture technology for power plants is not developed and adopted in a timely manner.
Federal or state laws or regulations may be adopted that would impose new or additional limits on the emissions of GHGs, including, but not limited to, CO2 from electric generating units using fossil fuels such as coal or natural gas. In order to comply with such regulations, electric generating units using fossil fuels may be required to implement carbon capture technology. For example, in October 2015, the EPA released a rule that establishes, for the first time, new source performance standards under the federal Clean Air Act for CO2 emissions from new fossil fuel-fired electric utility generating power plants. The EPA has designated partial carbon capture and sequestration as the best system of emission reduction for newly constructed fossil fuel-fired steam generating units at power plants to employ to meet the standard. However, there is a risk that such technology, which may include storage, conversion, or other commercial use for captured carbon, may not be commercially practical in limiting emissions as otherwise required by the proposed rule or similar rules that may be proposed in the future. If such legislative or regulatory programs are adopted, and economic, commercially available carbon capture technology for power plants is not developed or adopted in a timely manner, it would negatively affect our customers and would further reduce the demand for coal as a fuel source, causing coal prices and sales of our coal to decline, perhaps materially.
As a result of ongoing depressed industry conditions and recent coal producer bankruptcy filings, the coal industry has experienced increasing credit pressures that could result in demands for credit support by third parties or decisions by banks, surety bond providers, investors or other companies to reduce or eliminate their exposure to the coal industry, including our company. These credit pressures could materially and adversely impact our liquidity and ability to meet our regulatory requirements.
Ongoing depressed industry conditions and recent coal producer bankruptcy filings have resulted in increased credit pressures on the coal industry. These credit pressures include, for example, (a) vendors, suppliers, customers and other commercial counterparties seeking prepayments, security deposits, letters of credit and other credit protections, and (b) banks, surety bond providers, investors and other companies reducing or eliminating their exposure to the coal industry. Although some of these credit pressures may be company-specific, many are directed to the coal industry in general due to the current overall negative investor sentiment toward the industry. Any credit demands by third parties or refusals by banks, surety bond providers, investors or others to extend, renew or refinance credit on commercially reasonable terms may adversely impact our business, financial condition, results of operations, cash flows and liquidity. In some cases, such as any collateral requirements imposed by surety bond providers to issue surety bonds that secure our future performance under various federal and state laws, our ability to meet regulatory requirements may also be adversely impacted if we are not able to satisfy cash or other collateral requirements. As of December 31, 2016, there were approximately $448.4 million in third-party surety bonds outstanding to primarily secure the performance of our reclamation and lease obligations, and we were self-bonded for $10 million.
Our business, financial condition and results of operations may be adversely affected by unfavorable global or U.S. economic and market conditions.
In recent years, the global economic downturn, particularly with respect to the U.S. economy and various European and Asian economies, and global financial and credit market disruptions had a negative impact on us and the coal industry generally. For example, the economic downturn in recent years has negatively impacted electricity demand and led to an oversupply of coal and depressed prices.
Furthermore, because we typically seek to enter into long-term arrangements for the sale of a substantial portion of our coal, the average sales price we receive for our coal may lag behind any general economic recovery. Future economic downturns or further disruptions in the financial and credit markets could negatively impact our business, financial condition and results of operations.
Decreases in U.S. and global demand for electricity due to economic, weather or other conditions could negatively affect coal prices.
Our coal customers primarily use our coal as fuel for electricity generation. Overall economic activity and the associated demands for power by industrial users can have significant effects on overall electricity demand and can be caused by a number of factors. An economic slowdown can significantly slow the growth of electricity demand and could result in reduced demand for coal. For example, declines in the rate of international economic growth in countries such as China, India or other developing countries could further negatively impact the demand for U.S. coal and result in a continuing oversupply of coal. Weather patterns can also greatly affect electricity demand. Extreme temperatures, both hot and cold, cause increased power usage and, therefore, increase generating requirements from all sources. Mild temperatures, on the other hand, result in lower electrical demand, which allows generators to choose the sources of power generation when deciding which generation sources to dispatch. For example, the unusually warm winter of 2015/2016 led to low gas heating demand at a time of high gas production. This in turn led to low natural gas prices and substitution of gas for coal. When gas prices rose, this substitution of PRB coal decreased, but not enough to offset the increased utility coal stockpiles during this period, which lead to a reduction in utility coal contracting and depressed coal prices. Decreases in coal demand for these or other reasons could cause further downward pressure on coal prices and would negatively impact our results of operations.
Our coal mining operations are subject to operating risks, which could result in materially increased operating expenses and decreased production levels.
We mine coal at surface mining operations located in Wyoming and Montana. Our coal mining operations are subject to a number of operating risks. These operating risks include, among others:
· poor mining conditions resulting from geological, hydrologic, ground or other conditions, which may cause instability of highwalls or spoil-piles or cause damage to nearby infrastructure such as roads, power lines, railways and gas pipelines;
· critical mining and plant equipment failures, unexpected maintenance problems or damage from fire, flooding or other events;
· adverse weather and natural disasters, such as heavy rains, flooding, droughts, dust and other natural events affecting operations, transportation or customers;
· the unavailability of raw materials, equipment (including heavy mobile equipment) or other critical supplies such as tires and explosives, fuel, lubricants and other consumables of the type, quantity and/or size needed to meet production expectations;
· the capacity of, and proximity to, rail transportation facilities and rail transportation delays or interruptions, including derailments;
· competition and/or conflicts with other natural resource extraction activities and production within our operating areas, such as coalbed methane extraction or oil and gas development; and
· a major incident at a mine site that causes all or part of the operations of a mine to cease for some period of time.
Because we maintain very little produced coal inventory, disruptions in our operations due to these or other risks could negatively impact or even halt production and shipments, significantly increase the cost of mining and impact our ability to meet our contractual obligations to customers and others, which could have a material adverse effect on our results of operations. We maintain insurance policies that provide limited coverage for some of these risks, although there can be no assurance regarding the extent, if any, to which these risks would be covered by our insurance policies.
The availability and reliability of sufficient transportation capacity and increases in transportation costs could materially adversely affect the demand for our coal or impair our ability to supply coal to our domestic and export customers.
Transportation costs represent a significant portion of the total cost of coal for our domestic and export customers. The cost and availability of transportation is a key factor in a customer’s purchasing decision and impacts our coal sales and the price we receive for our coal. Coal could become a less competitive source of energy if the costs of transportation increase or the availability or capacity of rail lines or export terminals is insufficient. Transportation costs and availability could also make our coal less competitive than coal produced from other regions.
Our ability to sell coal to our customers depends primarily upon third-party rail systems and export terminals. If our customers are unable to obtain transportation services, or to do so on a cost-effective basis, our business and growth strategy could be adversely affected. Alternative transportation and delivery systems are generally inadequate and not suitable to handle the quantity of our shipments or to ensure timely delivery to our customers. Existing and proposed export terminals are also subject to permit requirements and challenges from environmental organizations which may make it complicated or expensive to expand existing terminal capacity or open new export terminals in a timely and cost-effective manner. In addition, much of the PRB is served by two rail carriers, and the Northern PRB is only serviced by one rail carrier. The loss of sufficient and reliable access to rail capacity in the PRB, as we have experienced in recent years, could create disruption until this access was restored; significantly impairing our ability to supply coal and resulting in materially decreased revenue. Similarly, being denied access to an export terminal could significantly affect our future export sales, materially decreasing our logistics revenue and growth opportunities. Our ability to open new mines or expand existing mines may also be affected by the access to, and availability and cost of rail, export terminal or other transportation systems available for servicing these mines.
Typically, our mine customers contract and pay directly for transportation of coal from the mine or port to the point of use. However, for contracts with our logistics customers, we are required to enter into transportation agreements pursuant to which we arrange and pay for all rail transport, terminal, and for our international customers, demurrage charges. As the volume of deliveries coordinated to customer contracted destinations increases, so do our costs and risks. Our ability to supply coal to our customers and our customers’ ability to take our coal may be impacted by the disruption of these transportation services because of weather-related problems; mechanical difficulties; maintenance shut-downs; environmental, political and regulatory issues; train derailment; bridge or structural concerns; infrastructure damage, whether caused by ground instability, accidents or otherwise; strikes; lock-outs; lack of fuel or maintenance items; fuel costs; accidents; terrorism or domestic catastrophe or other events. For example, in the spring and summer of 2011, the Midwest region experienced severe flooding which disrupted rail service to mines in the PRB and affected the ability of those customers who were impacted by the flooding to take coal deliveries. During 2014, we also experienced rail interruptions
due to increased competition for rail crews from crude oil and grain shipments, which negatively impacted our shipments and financial results. Any similar disruption in the future could negatively impact our results of operations. In addition, some scientists have opined that increasing concentrations of GHGs in the Earth’s atmosphere may produce climate changes that have significant physical effects, such as increased frequency and severity of storms, droughts and floods and other climatic events. If any such effects were to occur in areas where we or our clients operate, they could have an adverse effect on our assets and operations.
If we are unable to acquire or develop additional coal reserves that are economically recoverable, our future profitability may be reduced and our future success and growth may be significantly impacted.
Our profitability depends substantially on our ability to mine, in a timely and cost-effective manner, coal reserves that possess the quality characteristics our customers’ desire. Because our reserves decline as we mine our coal, our future success and growth depend upon our ability to acquire additional coal that is economically recoverable. We primarily acquire additional coal through the federal competitive leasing process, but we also enter into state and private coal leases as well as acquire coal from private third parties. If we fail to acquire or develop additional reserves, our existing reserves will eventually be depleted. Our ability to obtain additional coal reserves in the future could also be limited by a number of factors, any of which could impact our business and growth strategy, including:
· the availability of cash we generate from our operations;
· available financing and restrictions under our debt instruments;
· competition from other coal companies for properties;
· lack of suitable acquisition or LBA opportunities;
· delays or changes in the federal leasing process due to third-party legal challenges, regulatory developments or climate change initiatives; or
· the inability to acquire coal properties or federal coal leases on commercially reasonable terms.
Any significant delay in acquiring reserves could negatively impact our production rate. We will need to acquire additional coal reserves that can be mined on an economically recoverable basis to maintain our production capacity and competitive position. We may be unable to mine future reserves at profitability levels achieved at times in the past. The price we receive for our coal also impacts how economically we can recover our existing coal. Our ability to develop economically recoverable reserves will be materially adversely impacted if prices for coal sold remain depressed or decrease significantly.
Because most of the coal in the vicinity of our mines is owned by the U.S. federal government, our future success and growth would be affected if we are unable to acquire or are significantly delayed in the acquisition of additional reserves through the federal competitive leasing process, including due to third party legal challenges or changes in the federal coal leasing program.
The U.S. federal government owns most of the coal in the vicinity of our mines. Accordingly, the federal competitive leasing process is our primary means of acquiring additional reserves. There is no requirement that the federal government must lease its coal or give preference to any LBA applicant, which means our bids for federal coal leases may compete with other coal producers’ bids. Federal coal leases are expensive to obtain and the review process to submit an LBA for bid continues to lengthen. We expect this trend to continue. The size of potential LBA tracts may also make it easier for new mining operators to enter the market on economic terms and may, therefore, further increase competition for federal coal leases. In order to win a lease in the LBA process and acquire additional coal, our bid for a coal tract must meet or exceed the fair market value of the coal based on the internal estimates of the BLM, which are not published. Any failure or delay in acquiring a coal lease through the LBA process, or the inability to do so on economic terms, could cause our production to decline, materially adversely affecting our business, cash flows and results of operations.
Increased opposition from non-governmental organizations and other third parties may also lengthen, delay or adversely impact the LBA process. For example, the West Antelope II leases we were awarded through the LBA process in 2011 were subject to legal challenges against the BLM and the Secretary of the Interior by environmental organizations. Though these challenges were unsuccessful and the plaintiffs abandoned their efforts for appeal, our nominations or lease
applications may be subject to similar delays or challenges, which may result in difficulties in obtaining leases or impact our ability to mine the coal subject to those leases and/or delay our access to mine the coal. See Note 19 of Notes to Consolidated Financial Statements in Item 8 for a discussion regarding challenges by environmental activist groups against a potential lease modification for our Antelope Mine. If the plaintiff’s claims are successful, the timing and ability of our company to lease and mine the coal underlying the applicable surface acres would be materially adversely impacted.
In addition to third party regulatory challenges, the Department of the Interior continues to actively review and consider new regulations governing the valuation of federal coal resources, as well as expanded guidance on the production of coal on public lands issued by the BLM. On January 15, 2016, the Secretary of the DOI announced a moratorium on the issuance of new leases for coal resources on federally-owned lands in order to allow for a “comprehensive review” of the federal coal programs. The outcome of this moratorium and other initiatives is uncertain, but may lead to further difficulty and increased costs to acquire leases to federal coal unless discontinued by the current U.S. Presidential administration. See Item 1 “Business—Environmental and Other Regulatory Matters—DOI Moratorium and Programmatic EIS.”
The LBA process also requires us to acquire rights to mine from certain surface owners overlying the coal before the federal government will agree to lease the coal. Surface rights in the PRB are becoming increasingly more difficult and costly to acquire. Certain federal regulations provide a specific class of surface owners, also known as QSO, with the ability to prohibit the BLM from leasing its coal. For example, in connection with an LBA that we previously nominated for our Cordero Rojo Mine, the BLM indicated that certain surface owners satisfy the regulatory definition of QSO. If a QSO owns the land overlying a coal tract, federal laws prohibit us from leasing the coal tract without first securing surface rights to the land, or purchasing the surface rights from the QSO. This right of QSOs allows them to exercise significant influence over negotiations to acquire surface rights and can delay the LBA process or ultimately prevent the acquisition of coal underlying their surface. If we are unable to successfully negotiate access rights with QSOs at a price and on terms acceptable to us, we may be unable to acquire federal coal leases on land owned by the QSO. Our profitability could be materially adversely affected if the prices to acquire land owned by QSOs increase.
If we are unable to acquire surface rights to access our coal, we may be unable to obtain a permit or otherwise be unable to mine coal we own and may be required to employ expensive techniques to mine around those sections of land we cannot access in order to access other sections of coal reserves.
After we acquire coal we are required to obtain a permit to mine the coal through the applicable state agencies before we are allowed to begin mining. In part, the permitting requirements provide that, under certain circumstances, we must obtain surface owner consent if the surface estate has been split from the mineral estate, which is commonly known as a “split estate.” We have in the past and may in the future be required to negotiate with multiple parties for the surface access that overlies coal we acquired. If we are unable to successfully negotiate surface access with any of these surface owners, or do so on commercially reasonable terms, we may be denied a permit to mine some of the coal we have acquired or may find that we cannot mine the coal at a profit or at all. If we are denied a permit, this would create significant delays and restrictions in our mining operations and materially adversely impact our business and results of operations. Furthermore, if we determine to alter our plans to mine around the affected areas, we could incur significant additional costs to do so, which could increase our operating expenses considerably and could materially adversely affect our results of operations. Failure to successfully negotiate access for surface rights overlying coal that we control in a timely manner may also result in significant accounting charges, which could have a material adverse impact on our results of operations.
Defects in title or the loss of a leasehold interest in, or superior or conflicting property rights impacting, reserves or surface rights could limit our ability to mine our coal reserves and adversely impact our operations and costs.
A title defect on any lease, whether private or through a governmental entity, or the surface rights related to any of our reserves could adversely affect our ability to mine the associated coal reserves. Consistent with industry practice, we conduct only limited investigations of title to our coal properties prior to leasing. Title to properties leased from private third parties is not usually fully verified until we make a commitment to develop a property, which may not occur until we have obtained the necessary permits and completed exploration of the property. Title or other defects in surface rights held by us or other third parties could impair our ability to mine the associated coal reserves or cause us to incur unanticipated costs.
In addition, these leasehold interests may be subject to superior property rights of other third parties. The federal government leases many different mineral rights in addition to coal, such as coalbed methane, natural gas and crude oil rights. Some of these minerals are located on, or are adjacent to, some of our coal and LBA areas, potentially creating conflicting interests between us and the lessees of those interests and may affect our ability to operate as planned if our title is not superior or cost-effective arrangements cannot be timely negotiated. We are regularly in negotiations with third parties in an effort to address potentially conflicting mineral development. These negotiations may not be effective. In that event, our
mine plans, future costs and production rates may be adversely impacted. Anticipated oil and gas development is expected to continue to increase the frequency of these potential conflicts.
Further, the majority of our coal interests are acquired by lease from state or federal governments. If any of our leases are terminated, for lack of diligent development or otherwise, we would be unable to mine the affected coal and our business and results of operations could be materially adversely affected.
We may not recover our investments in our mining, exploration, port access rights, and other assets, which may require us to recognize impairment charges related to those assets.
The value of our assets may be adversely affected by numerous uncertain factors, some of which are beyond our control, including:
· unfavorable changes in the economic environments in which we operate;
· unfavorable regulatory or legal developments impacting our industry;
· lower-than-expected domestic and international demand and coal pricing;
· technical and geological operating difficulties;
· an inability to economically extract our coal reserves;
· unanticipated increases in operating costs; and
· an inability to obtain additional export terminal capacity due to extensive permit requirements and challenges from environmental organizations.
These may cause us to fail to recover all or a portion of our investments in those assets and may trigger the recognition of impairment charges, which could have a substantial adverse impact on our results of operations. For example, due to the weak outlook for 8400 Btu coal, we recorded a non-cash impairment charge of $33.4 million related to goodwill at our 8400 Btu Cordero Rojo Mine during the year ended December 31, 2015. This represented a full write down of the Cordero Rojo Mine’s goodwill. Additionally, in consideration of consensus projections of weak export pricing, a weak outlook for coal exports, and our associated decision at that time to amend the port and rail contracts to require no export shipments from 2016 through 2018, we determined that the carrying values of certain intangible assets in our Logistics and Related Activities segment were impaired. Therefore, during the year ended December 31, 2015, we wrote off the full value of our port access rights of $52.2 million and our $6.0 million equity investment in GPT. During the year ended December 31, 2016, we recorded impairments of $2.6 million, primarily for engineering costs related to the Overland Conveyor project at our Antelope Mine and $2.0 million related to a shovel that we do not expect to use because of declining productions. Because of the volatile nature of U.S. and international coal demand and pricing, it is reasonably possible that our current estimates of projected future cash flows from our mining assets may change in the near term, which may result in the need for further adjustments to the carrying value of mineral rights and other assets.
Acquisitions are a potentially important part of our long-term growth strategy and involve a number of risks, any of which could cause us not to realize the anticipated benefits.
Acquisitions are a potentially important part of our long-term growth strategy, and we may pursue acquisition opportunities in the future in the U.S. and other jurisdictions. If we fail to accurately estimate the future results and value of an acquired business or are unable to successfully integrate the businesses or properties we acquire, our business, financial condition or results of operations could be negatively affected, and we may be unable to grow our business. Acquisition transactions involve various risks, including:
· uncertainties in assessing the strengths and potential profitability, and the related weaknesses, risks, contingent and other liabilities, of acquisition candidates;
· changes in business, industry, market or general economic conditions that affect the assumptions underlying our rationale for pursuing the acquisition;
· the inability to achieve identified operating and financial synergies anticipated to result from an acquisition;
· the potential loss of key customers, management or employees of an acquired business;
· the nature and composition of the workforce, including the acquisition of a unionized workforce;
· diversion of our management’s attention from other business concerns;
· regulatory challenges for completing and operating the acquired business, including opposition from environmental groups or regulatory agencies;
· environmental or geological problems in acquired coal properties, including factors that make the coal unsuitable for intended customers (due to ash, heat value, moisture, or contaminants), that make the coal more expensive to mine, or delay our ability to mine;
· inability to acquire sufficient surface rights to enable extraction of coal resources;
· outstanding permit violations associated with acquired assets;
· difficulties or unexpected issues arising from our evaluation of internal control over financial reporting of the acquired business;
· risks related to operating in new jurisdictions or industries, including increased exposure to foreign government and currency risks with respect to any international acquisitions; and
· unanticipated liabilities associated with the acquired companies.
Any one or more of these factors could cause us not to realize the benefits we might anticipate from an acquisition. Moreover, any acquisition opportunities we pursue could materially increase our liquidity and capital resource needs and may require us to incur indebtedness, seek equity capital or both. We may not be able to satisfy these liquidity and capital resource needs on acceptable terms or at all. In addition, future acquisitions could result in our assuming significant long-term liabilities relative to the value of the acquisitions.
We may be unable to obtain, maintain or renew permits or licenses necessary for our operations, including due to third party legal challenges or climate change-related assessments that are increasingly required as part of our regulatory processes, which would materially reduce our production, cash flows and profitability.
As a mining company, we must obtain a number of permits and licenses from various federal, state and local agencies and regulatory bodies that impose strict regulations on environmental and operational matters in connection with our coal operations, including restricting the number of tons we may mine under our air quality permits. The permitting rules, and the interpretations of these rules, are complex, change frequently and are often subject to discretionary interpretations by the regulators, all of which make compliance more difficult or impractical, and may possibly preclude the continuance of ongoing operations, impact the development of future mining operations or restrict the amount of our production.
The public, including non-governmental organizations, anti-mining groups and individuals, have certain statutory rights to comment upon and submit objections to requested permits and EISs prepared in connection with applicable regulatory processes. These groups may also participate in the permitting and licensing process, including bringing citizens’ lawsuits to challenge the issuance of permits, the validity of an EIS or performance of mining activities, which can create delay and uncertainty in acquiring permits and mining the coal underlying our leases. For example, the EIS and other regulatory matters associated with our West Antelope II LBAs were legally challenged by several non-governmental organizations. These challenges were unsuccessful and the plaintiffs abandoned their efforts for appeal. Refer to Note 19 of Notes to Consolidated Financial Statements in Item 8 for a discussion regarding other challenges by environmental activist groups against regulatory permits and approvals for our mines. These challenges seek to vacate prior regulatory decisions and authorizations that are legally required for some or all of our current or planned mining activities. If we are required to reduce or modify our mining activities as a result of these challenges, the impact could have a material adverse effect on our shipments, financial results and liquidity, and could result in claims from third parties if we are unable to meet our commitments under pre-existing commercial agreements as a result of any such required reductions or modifications to our mining activities.
A group of organizations also challenged BLM’s federal coal management program, under which BLM issues lease to leases for mining on federal lands. These groups alleged that BLM could not rely on an EIS conducted in 1979 to serve as the basis of the program because the EIS has not been updated to include an assessment of climate change. The district court dismissed the case, and the organizations appealed to the U.S. Court of Appeals for the District of Columbia, which has not yet ruled on the case. At this time, we cannot predict the outcome of this litigation. However, an unfavorable ruling could adversely impact our ability to receive future permits.
If our permits or licenses are not issued or renewed in a timely fashion or at all, or if permits issued or renewed are conditioned in a manner that restricts our ability to efficiently and economically conduct our mining activities, we could suffer a material reduction in our production, an impairment of our mineral rights, and our cash flows or profitability could be materially adversely affected.
Existing and future legislation, treaties, regulatory requirements and public concerns relating to GHG emissions could negatively affect our customers and further reduce the demand for coal as a fuel source, causing coal prices and sales of our coal to materially decline.
Global climate change initiatives and public perceptions have resulted, and are expected to continue to result, in decreased coal-fired power plant capacity and utilization, phasing out and closing many existing coal-fired power plants, reducing or eliminating construction of new coal-fired power plants in the United States and certain other countries, increased costs to mine coal and decreased demand and prices for thermal coal, including PRB coal. See Item 1 “Business—Environmental and Other Regulatory Matters—Global Climate Change.”
There are three important sources of GHGs associated with the coal industry. The end use of our coal in electricity generation is the largest of the three sources of GHGs. Combustion of fuel for mining equipment used in coal production is another source of GHGs. In addition, coal mining can release methane, a GHG, directly into the atmosphere. These emissions from coal consumption and production are subject to pending and proposed regulations as part of regulatory initiatives to address global climate change and global warming. Various international, federal, regional and state proposals are being considered to limit emissions of GHGs, including possible future U.S. treaty commitments, new federal or state legislation that may, among other things establish a cap-and-trade regime, and regulation under existing environmental laws by the EPA and other regulatory agencies. For example, the United States recently joined nearly 200 other nations in an agreement to voluntarily limit GHG emissions. These voluntary pledges could further decrease demand and pricing for our coal. Future regulation of GHG emissions may require additional controls on, or the closure of, coal-fired power plants and industrial boilers or may restrict the construction of new coal-fired power plants. For example, the EPA released the CPP, which requires reductions in emissions from existing power plants, as well as new source performance standards for GHG emissions for new coal and oil-fired power plants, which require partial carbon capture and sequestration. See “Risks Related to Our Business and Industry— Our long-term growth may be materially adversely impacted if economic, commercially available carbon capture technology for power plants is not developed and adopted in a timely manner.” These regulatory initiatives may increase our costs and decrease demand and pricing for our coal and logistics services, and may lead to increased demand for domestic electricity fired by natural gas because gas-fired plants are cheaper to construct, and permits to construct these plants can be easier to obtain.
The permitting of new coal-fired power plants has also recently been contested, at times successfully, by state regulators and environmental organizations due to concerns related to GHG emissions from the new plants. Private litigation has also been brought against industry participants based on GHG-related concerns. The U.S. Supreme Court held that federal common law provides no basis for public nuisance claims against utilities due to their carbon dioxide emissions, but tort-type liabilities and other GHG-related claims against utilities and energy producers may be asserted. For example, in 2011 residents and property owners along the Mississippi Gulf coast filed litigation against approximately 90 companies in energy, fossil fuels and chemical industries, including PRB and other domestic coal companies, alleging that the defendants caused the emission of GHGs that contributed to global warming, which in turn caused a rise in sea levels and added to the ferocity of Hurricane Katrina in 2005, which combined to destroy the plaintiffs’ property. The lawsuit was dismissed by the Federal District Court in 2012 and the dismissal was affirmed by the Fifth Circuit Court of Appeals in May 2013. However, if other GHG-related litigation is successful, the coal industry and our company may be materially adversely impacted.
Extensive environmental laws, including existing and potential future legislation, treaties and regulatory requirements relating to air emissions, affect our customers and could further reduce the demand for coal as a fuel source and cause coal prices and sales of our coal to materially decline.
The operations of our customers are subject to extensive environmental regulation particularly with respect to air emissions. For example, CSAPR initially requires 28 states in the Midwest and eastern seaboard of the U.S. to significantly
improve air quality by reducing power plant emissions that cross state lines and contribute to ozone and/or fine particle pollution in other states. In August 2012, the U.S. Court of Appeals for the District of Columbia Circuit vacated CSAPR and ordered the EPA to continue enforcing CAIR. More recently, the U.S. Supreme Court reversed the D.C. Circuit’s vacation of CSAPR, and the D.C. Circuit has granted a request by the EPA to lift the stay of the rule. Subsequently, in November 2014, the EPA issued an interim final rule reconciling the CSAPR rule with the Court’s order to lift the stay, calling for Phase 1 implementation in 2015 and Phase 2 implementation in 2017. In September 2016, the EPA finalized an update to the CSAPR ozone season program by issuing the Final CSAPR Update. CSAPR is one of a number of significant regulations that the EPA has issued or expects to issue that will impose more stringent requirements relating to air, water and waste controls on electric generating units. These rules include the EPA’s requirements for CCR management, which were finalized in December 2014 and further regulate the handling of wastes from the combustion of coal. In addition, in March 2013, the EPA formally adopted a revised final rule to reduce emissions of toxic air pollutants from power plants. Specifically, MATS for power plants will reduce emissions from new and existing coal- and oil-fired electric utility steam generating units. In June 2015, the U.S. Supreme Court struck down the MATS rule based on the EPA’s failure to take costs into consideration and remanded the case back to the D.C. Circuit. The D.C. Circuit remanded the rule to the EPA, but the current rule will stay in place until EPA issues a new finding. In April 2016, the EPA issued a final finding that it is appropriate and necessary to set standards for emissions of air toxics from coal- and oil-fired power plants.
Considerable uncertainty is associated with air emissions initiatives. New regulations are in the process of being developed, and many existing and potential regulatory initiatives are subject to review by federal or state agencies or the courts. Stringent air emissions limitations are either in place or are likely to be imposed in the short to medium term, and these limitations will likely require significant emissions control expenditures for many coal-fired power plants. As a result, these power plants may switch to other fuels that generate fewer of these emissions or may install more effective pollution control equipment that reduces the need for low-sulfur coal. Any further switching of fuel sources away from coal, closure of existing coal-fired power plants, or reduced construction of new coal-fired power plants could have a material adverse effect on demand for, and prices received for, our coal. Alternatively, less stringent air emissions limitations, particularly related to sulfur, to the extent enacted, could make low-sulfur coal less attractive, which could also have a material adverse effect on the demand for, and prices received for, our coal. See Item 1 “Business—Environmental and Other Regulatory Matters.”
Our mining operations are subject to extensive environmental, health, safety or other laws and regulations that could materially increase our costs or limit our ability to produce and sell coal.
Our mining operations are subject to extensive federal, state and local environmental, health and safety, transportation, labor and other laws and regulations. See Item 1 “Business—Environmental and Other Regulatory Matters.” Examples include those relating to:
· employee health and safety;
· emissions to air and discharges to water;
· plant and wildlife protection, including endangered species protections;
· the reclamation and restoration of properties after mining or other activity has been completed;
· remediation of contaminated soil, surface and groundwater; and
· the effects of operations on surface water and groundwater quality and availability.
Furthermore, we must compensate employees for work-related injuries through our workers’ compensation insurance funds. The erosion through tort liability of the protections we are currently provided by workers’ compensation laws could increase our liability for work-related injuries.
MSHA is responsible for monitoring compliance with federal mine health and safety standards at our mines. MSHA has various enforcement tools that it can use, including the issuance of citations resulting in monetary penalties and orders of withdrawal from a mine or part of a mine. Since the April 2010 explosion at Massey Energy Company’s (now Alpha Natural Resources) Upper Big Branch Mine, increased scrutiny has been placed on the mining industry and has had significant impacts on the regulation of mine safety matters at the federal and state levels. For example, federal authorities have announced additional targeted inspections of coal mines to evaluate several safety concerns, including the accumulation of coal dust and the proper ventilation of gases such as methane. Federal authorities are also frequently proposing changes to
mine safety rules and regulations which could potentially result in additional or enhanced required safety equipment, more frequent mine inspections, stricter and more thorough enforcement practices and enhanced reporting requirements. Any new environmental and/or health and safety requirements may be replicated in the states in which we operate and could increase our operating costs or otherwise prevent, delay or reduce our planned production, any of which could adversely affect our financial condition, results of operations and cash flows.
The costs, liabilities and requirements associated with complying with these requirements are often significant and time-consuming and may delay commencement or continuation of exploration or production. These factors could have a material adverse effect on our results of operations, cash flows and financial condition. New legislation or administrative regulations or new judicial interpretations or administrative enforcement of existing laws and regulations may also require us to change operations significantly or incur increased costs. For example, in November 2011, several environmental groups sued the EPA in Washington federal court to compel the EPA to include coal mines on the list of stationary sources governed by air pollution performance standards. In that case, the Court denied the groups’ rulemaking petition, and in July 2014, also denied a petition seeking a rehearing of the case en banc. Any imposition of air emission standards on coal mines or any other such changes could have a material adverse effect on our financial condition and results of operations.
Because of the extensive regulatory environment in which we operate, we cannot assure complete compliance with all laws and regulations. Failure to comply with these laws may result in significant costs to us to correct such violations, as well as civil or criminal penalties and limitations or shutdowns of our operations. These laws and regulations may also significantly impair our ability to conduct our mining operations or result in increased operating costs.
Federal and state regulatory agencies have the authority to order any of our mines to be temporarily or permanently closed under certain circumstances, which could materially adversely affect our ability to meet our customers’ demands.
Federal and state regulatory agencies have the authority following significant health and safety incidents, such as fatalities, to order a mine to be temporarily or permanently closed. If this were to occur, we may be required to incur capital expenditures to re-open the mine. In the event that these agencies order the closing of our mines, our coal sales agreements and our take-or-pay contracts related to our export terminals may permit us to issue force majeure notices, which suspend our obligations to deliver coal under these contracts. However, our customers may challenge our issuances of force majeure notices. If these challenges are successful, we may have to purchase coal from third-party sources, if it is available, to fulfill these obligations, incur capital expenditures to re-open the mines and/or negotiate settlements with the customers, which may include price reductions, the reduction of commitments or the extension of time for delivery or terminate customers’ contracts. Any of these actions could have a material adverse effect on our business and results of operations.
Our operations may affect the environment or cause exposure to hazardous substances, and our properties may have environmental contamination, any of which could result in material liabilities to us.
Our operations use hazardous materials and generate hazardous and non-hazardous wastes. In addition, many of the locations that we own, lease or operate were used for coal mining and/or involved the generation, use, storage and disposal of hazardous substances either before or after we were involved with these locations. We may be subject to claims under federal and state statutes and/or common law doctrines for toxic torts, natural resource damages and other damages, as well as for the investigation and cleanup of soil, surface water, groundwater and other media. These claims may arise, for example, out of current or former conditions at sites that we own, lease or operate currently, as well as at sites that we or predecessor entities owned, leased or operated in the past, and at contaminated third-party sites at which we have disposed of hazardous substances and waste. As a matter of law, and despite any contractual indemnity or allocation arrangements or acquisition agreements to the contrary, our liability for these claims may be joint and several, so that we may be held responsible for more than our share of any contamination, or even for the entire share.
We may incur material costs and liabilities resulting from claims for damage to property or natural resources or injury to persons arising from our operations. If we are pursued for sanctions, costs and liabilities in respect of these matters, our mining operations and, as a result, our profitability could be materially adversely affected.
Significant increases in taxes we pay on the coal we produce at our mine sites or deliver through our logistics business, such as royalties or severance and production taxes, including as a result of governmental audits, legislative, regulatory, or interpretive changes, could materially and adversely affect our profitability.
We pay federal, state and private royalties and federal, state and county severance and production taxes on the coal we sell. A substantial portion of our royalties and severance and production taxes are levied as a percentage of gross revenue with the remaining levied on a per ton basis. For example, we pay production royalties of 12.5% of gross proceeds to the
federal government on all coal sold at the mine sites. We incurred royalties and severance and production taxes totaling $208.7 million, $277.1 million and $331.6 million for the years ended December 31, 2016, 2015 and 2014, respectively. The calculations used to determine royalty or severance and production tax payments can be complex and subject to interpretation, making it difficult in some cases to estimate such payments. If royalties or severance and production tax rates were to significantly increase, or if the methodology by which the government agencies assess royalties or severance and production tax rates materially changes, our results of operations could be materially adversely affected. See Note 19 of Notes to Consolidated Financial Statements in Item 8. Examples that could materially adversely affect our results include:
· the federal government has recently finalized rules to significantly alter the method for valuing royalty payments;
· a state government could increase severance or production taxes or any other tax applicable to our operations in that state; and
· we could be required to make additional payments (including significant related interest and penalties) as a result of pending or future governmental audits, which can date back many years.
Additionally, from time to time legislation is proposed that could result in the reduction or elimination of certain U.S. federal income tax incentives currently available to coal companies. These include the elimination of percentage depletion for coal and the elimination of the domestic manufacturing deduction for income from the production of coal. It is unclear whether these or similar changes will be enacted, and if enacted, how soon any such changes would take effect.
Failure to maintain our surety bonds on acceptable terms could affect our ability to secure reclamation and coal lease obligations and materially adversely affect our ability to mine or lease coal.
Federal and state laws require us to secure the performance of certain long-term obligations, such as mine closure costs, reclamation costs, and federal and state workers’ compensation costs, including black lung. The primary methods we use to meet those obligations are to provide a third-party surety bond or a letter of credit. As of December 31, 2016, we had outstanding surety bonds with third parties of $448.4 million and were self-bonded for $10 million. Surety bond issuers and holders may demand additional collateral, unfavorable terms or higher fees. Recently, there has been heightened regulatory pressure on reclamation bonding and self-bonding in particular. In January 2016, the OSMRE sent Ten-Day Notices to the Wyoming Department of Environmental Quality regarding self-bonding of certain other coal companies who have filed for bankruptcy. In its notices, the OSMRE asserted that a violation of the Wyoming approved state program may exist by allowing the specified companies to continue mining without sufficient reclamation bonding in place. In August 2016, the OSMRE issued a Policy Advisory discouraging state regulatory authorities from approving self-bonding arrangements. The Policy Advisory indicated that the OSMRE would begin more closely reviewing instances in which states accept self-bonding for mining operations. In the same month, the OSMRE also announced that it was beginning the rulemaking process to strengthen regulations on self-bonding. Our failure to retain, or inability to acquire, surety bonds or letters of credit or to provide a suitable alternative could adversely affect our ability to mine or lease coal, which would materially adversely affect our business and results of operations. That failure could result from a variety of factors, including lack of availability, higher expense or unfavorable market terms, the exercise by third-party surety bond issuers of their right to refuse to renew the surety bonds and restrictions on availability of collateral for current and future third-party surety bond issuers under the terms of any credit arrangements then in place. In addition, as a result of increasing credit pressures on the coal industry, it is possible that surety bond providers could demand cash collateral as a condition to providing or maintaining surety bonds. Any such demands, depending on the amount of any cash collateral required, could have a material adverse impact on our liquidity and financial position. If we are unable to meet cash collateral requirements and cannot otherwise obtain or retain required surety bonds, we may be unable to satisfy legal requirements necessary to conduct our mining operations.
Furthermore, while we have maintained a history of timely payments related to our LBAs, if we are unable to maintain our “good payer” status, we would be required to seek bonding for any remaining payments, which could adversely impact our cash flows and the amount of availability under our Credit Agreement, if such bonds could be obtained at all.
In addition, if federal or state laws are amended to require certain forms of financial assurance other than surety bonds, such as letters of credit, obtaining them, if we could obtain them at all, could have a material negative impact on our liquidity and results of operations.
Our business requires substantial capital expenditures, which we may be unable to provide.
Our business plan and strategy are dependent upon our acquisitions of additional reserves, which require substantial capital expenditures. We also require capital for, among other purposes:
· acquisition of surface rights;
· equipment and the development of our mining operations;
· capital renovations;
· export terminal development projects;
· maintenance and expansions of plants and equipment; and
· compliance with environmental laws and regulations.
To the extent that cash on hand, cash generated internally and cash available under our Credit Agreement are not sufficient to fund capital requirements, we will require additional debt and/or equity financing. However, additional debt or equity financing may not be available to us or, if available, may not be available on satisfactory terms. Additionally, our debt instruments may restrict our ability to obtain such financing. If we are unable to obtain additional capital, we may not be able to maintain or increase our existing production rates and we could be forced to reduce or delay capital expenditures or change our business strategy, sell assets or restructure or refinance our indebtedness, all of which could have a material adverse effect on our business or financial condition.
If the assumptions underlying our reclamation and mine closure obligations are materially inaccurate, our costs could be significantly greater than anticipated.
SMCRA and counterpart state laws and regulations establish operational, reclamation and closure standards for all aspects of surface mining. We accrue for the costs of current mine disturbance and final mine closure. Estimates of our total reclamation and mine-closing liabilities are based upon permit requirements and our experience. The amounts recorded are dependent upon a number of variables, including the estimated future asset retirement costs, estimated proven reserves, assumptions involving profit margins of third-party contractors, inflation rates, discount rates and assumed credit-adjusted, risk-free rates. Furthermore, these obligations are unfunded. If our accruals are insufficient or our liability in a particular year is greater than currently anticipated, our future operating results could be materially adversely affected.
Increases in the cost of raw materials and other industrial supplies, or the inability to obtain a sufficient quantity of those supplies, could increase our operating expenses, disrupt or delay our production and materially adversely affect our profitability.
We use considerable quantities of explosives, petroleum-based fuels, tires, steel and other raw materials, as well as spare parts and other consumables in the mining process. If the prices of steel, explosives, tires, petroleum products or other materials increase significantly or if the value of the U.S. dollar declines relative to foreign currencies with respect to certain imported supplies or other products, our operating expenses will increase, which could materially adversely impact our profitability. Additionally, a limited number of suppliers exist for certain supplies, such as explosives and tires, as well as certain mining equipment, and any of our suppliers may divert their products to buyers in other mines or industries or divert their raw materials to produce other products that have a higher profit margin. Shortages in raw materials used in the manufacturing of supplies and mining equipment, which, in some cases, do not have ready substitutes, or the cancellation of our supply contracts under which we obtain these raw materials and other consumables, could limit our ability to obtain these supplies or equipment. As a result, we may not be able to acquire adequate replacements for these supplies or equipment on a cost-effective basis or at all, which could also materially increase our operating expenses or halt, disrupt or delay our production.
Furthermore, operating expenses at our mining locations are sensitive to changes in certain variable costs, including diesel fuel prices, which is one of our largest variable costs. Our results depend on our ability to adequately control our costs, including diesel fuel. Any increase in the price we pay for diesel fuel will have a negative impact on our results of operations. See Item 7 “Management’s Discussion and Analysis of Financial Condition and Results of Operations—Years
Ended December 31, 2016, 2015, and 2014 —Cost of Product Sold” and Item 7A “Quantitative and Qualitative Disclosures About Market Risk—Commodity Price Risk.”
Our hedging activities for diesel fuel may prevent us from benefiting from cost price decreases.
We enter into derivative financial instruments to help manage our exposure to market price changes to our diesel fuel costs, which are indexed to the West Texas Intermediate (“WTI”) crude oil price as quoted on the New York Mercantile Exchange. As such, the nature of the derivative financial instruments does not directly offset market changes to our diesel fuel costs.
As of December 31, 2016, we held swap positions for 0.6 million WTI crude oil barrels which approximated 100% of our forecasted 2017 diesel fuel needs. While our hedging strategy provides us protection in the event of crude oil price increases, it reduces our benefit when crude oil prices decrease below our floor and may require substantial payments by us to settle our financial instruments. See Item 7A “Quantitative and Qualitative Disclosures About Market Risk—Commodity Price Risk” and Note 7 of Notes to Consolidated Financial Statements in Item 8.
Our hedging activities for coal sales prices may result in a negative impact from sales price changes.
As part of our logistics business, we periodically enter into derivative financial instruments in the form of international coal forward contracts to help manage our exposure to future coal sales prices by fixing a price now for a future contracted coal delivery. This type of hedge is designed to protect us from any price decreases. While our hedging strategy provides us some degree of protection in the event future coal prices decrease it may also prevent us from benefiting if future coal prices increase above our hedged price and may require substantial payments by us to settle our financial instruments.
In addition, we periodically use domestic coal futures contracts to help manage our exposure to market changes in domestic coal prices. This type of hedge is designed to benefit us when prices change relative to our current open positions. If there are significant and extended unfavorable price movements against our positions, our earnings and liquidity could be negatively impacted. See Item 7A “Quantitative and Qualitative Disclosures About Market Risk—Commodity Price Risk” and Note 7 of Notes to Consolidated Financial Statements in Item 8.
Changes in the fair value of derivative financial instruments that are not accounted for as a hedge could cause volatility in our earnings.
From time to time, we enter into certain derivative financial instruments to help manage our exposure to future coal prices, both with respect to our export and domestic sales prices and to rises in our diesel costs. Derivative financial instruments are recognized as either assets or liabilities and are measured at fair value. To the extent these derivative financial instruments do not qualify for hedge accounting or we choose not to designate them for hedge accounting, we are required to record changes in the fair value of these derivative financial instruments in our Consolidated Statement of Operations, resulting in increased volatility in our income in future periods.
Inaccuracies or future reductions in our estimates of our coal reserves could result in decreased profitability from lower than expected revenue or higher than expected costs.
We base our estimates of reserves on engineering, economic and geological data assembled and analyzed by our internal geologists and engineers, which are reviewed by an independent consultant every two years. Our estimates of proven and probable coal reserves as to both quantity and quality are updated annually to reflect the production of coal from the reserves, updated geological models and mining recovery data, the tonnage contained in new lease areas acquired and estimated costs of production and sales prices. There are numerous factors and assumptions inherent in estimating the quantities and qualities of, and costs to mine, coal reserves, any one of which may vary considerably from actual results. These factors and assumptions include:
· coal characteristics such as Btu and sulfur content;
· geological and mining conditions, which may not be fully identified by available exploration data and/or may differ from our experiences in areas where we currently mine;
· future coal prices and demand;
· equipment and productivity;
· operating costs, including for critical supplies such as fuel, tires and explosives;
· capital expenditures and development and reclamation costs;
· the percentage of coal ultimately recoverable;
· the effects of regulation, including the issuance of required permits, and taxes, including severance and production taxes and royalties, and other payments to governmental agencies; and
· timing for the development of the reserves.
Any changes to the above factors and assumptions could cause our estimates of the quantities and qualities of economically recoverable coal to vary significantly. Changes to the above factors and assumptions could also materially impact how we classify our reserves based on risk of recovery and our estimates of future net cash flows expected from these properties. Actual production recovered from identified reserve areas and properties, and revenue and expenditures associated with our mining operations, may vary materially from estimates. Any inaccuracy or further reductions in our proven and probable reserves estimates could result in decreased profitability from lower than expected revenue and/or higher than expected costs.
The majority of our coal sales agreements are forward sales contracts at fixed prices, which may not reflect favorable then-existing prices for coal or may affect our profitability if we cannot adequately control the costs of production for coal underlying such contracts.
We have historically sold most of our coal under long-term coal sales agreements, which we generally define as contracts with a term of one to five years. For the year ended December 31, 2016, approximately 79% of our revenue was derived from coal sales that were made under multi-year coal sales agreements. The prices for coal sold under these agreements are typically fixed for an agreed amount of time. Pricing in some of these contracts is subject to certain adjustments in later years or under certain circumstances, and may be below the current market price for similar type coal at any given time, depending on the time frame of the contract.
As a consequence of the substantial volume of our forward sales, our ability to capitalize on near term rises in coal prices is limited. We have less coal available to sell under short-term contracts or on the spot market and we similarly have fewer tons to commit under long-term contracts at higher prices. Our ability to realize higher prices is also restricted if customers elect to purchase additional volumes of coal, which is allowable under some contracts, at contract prices that are lower than spot prices.
Furthermore, to the extent our costs increase but pricing under our long-term coal sales agreements remains fixed, we may be unable to pass such increasing costs on to our customers. If we are unable to control our costs, our results may be negatively impacted.
The loss of, or significant reduction in, purchases by our largest customers could adversely affect our revenue and profitability.
For the year ended December 31, 2016, we derived approximately 22% of our total revenue from sales to our three largest customers and approximately 51% of our total revenue from sales to our ten largest customers. We may be unsuccessful in obtaining and renewing coal sales agreements with these customers, and some or all of these customers could discontinue purchasing coal from us. If any of these customers, particularly any of our three largest customers, was to significantly reduce the quantities of coal it purchases from us, or if we are unable to sell coal to these customers on terms as favorable to us, the results of our business would be adversely impacted.
Changes in purchasing patterns in the coal industry may make it difficult for us to enter into new contracts with customers, or do so on favorable terms, which could materially adversely affect our business and results of operations.
In recent years, we have experienced customers being less willing to enter into long-term coal sales agreements as they continue to adjust to relatively low U.S. natural gas prices, increased price volatility, increased fungibility of coal products, frequently changing regulations that have often disfavored coal usage and the increasing deregulation of their
industry. In addition, the prices for coal in the spot market may be lower than the prices previously set under many of our long-term coal sales agreements. As our contracts with customers expire or are otherwise renegotiated, our customers may be less willing to extend or enter into new long-term coal sales agreements under their existing or similar pricing terms or our customers may decide to purchase fewer tons of coal than in the past.
To the extent our customers shift away from long-term supply contracts, it will be more difficult to predict our future sales. As a result, we may not have a market for our future production at acceptable prices. The prices we receive in the spot market may be less than the contractual price an electric utility is willing to pay for a committed supply. Furthermore, spot market prices tend to be more volatile than contractual prices, which could result in decreased revenue and profitability. As of February 2017, we had approximately 54 million tons of committed sales for 2017 and 27 million tons for 2018, which is below our typical forward sales levels, leaving more coal left to be sold for those periods.
As a result of depressed coal demand and competition from low priced natural gas, we received in the past, and may receive in the future, increased requests from customers to renegotiate, defer or cancel committed purchases under existing agreements. If we are unable to resolve these customer requests on terms that preserve the amount and timing of our forecasted economic value, our anticipated cash flows, results and liquidity may be materially adversely impacted.
From time to time in the ordinary course of our business, customers may seek to renegotiate the terms of our coal sales agreements to reallocate certain committed volumes into future time periods, reduce or cancel committed volumes or make other adjustments to our coal sales agreements. We address these requests on a case-by-case basis and seek to reach mutually agreed resolutions of these requested modifications as part of managing our long term customer relationships. As a result of depressed coal demand and competition from low priced natural gas, we have received in the past, and may receive in the future, increased requests from customers to renegotiate, defer or cancel committed purchases under existing agreements, as occurred in early 2016. If we are unable to resolve these customer requests on terms that preserve the amount and timing of our forecasted economic value, our anticipated cash flows, results and liquidity may be materially adversely impacted.
Demand for U.S. thermal coal has declined significantly in recent years and is increasingly subject to fluctuations due to summer cooling demand, winter heating demand, economic growth rates and other factors that impact demand for electricity. This has resulted in a reduction in long term sales, less visibility into future shipment volumes and increased fluctuations in shipments and associated financial results from period to period.
As a result of regulatory, political, and public pressures against using coal to generate electricity, increased competition with low-cost natural gas, increased competition with taxpayer subsidized solar and wind generation, improving energy efficiency, and other factors, demand for U.S. thermal coal has declined significantly in recent years, supporting a lower percentage of baseload electricity demand, and is increasingly subject to fluctuations due to summer cooling demand, winter heating demand, economic growth rates and other factors that impact demand for electricity. This has resulted in a reduction in long term sales of thermal coal, less visibility into future shipment volumes and increased fluctuations in shipments and associated financial results from period to period. Although we are seeking to adjust our business and cost structure to reflect lower and more variable demand for thermal coal and to address the adverse impact of these changing conditions on our financial performance, our business requires substantial fixed costs and long lead-time investment decisions and we may not be successful in adjusting to these changing conditions.
We are exposed to counterparty risk with our customers, trading partners, financial institutions, and other parties with whom we conduct business.
We face an increased risk that we do not receive payment for coal sold and delivered if the creditworthiness of any of our counterparties deteriorates or if any of our counterparties become subject to bankruptcy proceedings. The creditworthiness of these counterparties depends on any number of factors, including the economic volatility and tightening of credit markets, and deregulation of the U.S. utilities markets, allowing utilities to sell their power plants to their non-regulated affiliates or third parties that may have credit ratings that are below investment grade. Competition with other coal suppliers could cause us to extend credit to customers and on terms that could increase the risk of payment default.
From time to time, we have contracts to supply coal to energy trading and brokering companies, under which they purchase the coal for their own account or resell to domestic and foreign end users. If the creditworthiness of these energy trading and brokering companies declines, this would increase the risk that we may not be able to collect payment for all coal sold and delivered to or on behalf of those companies. Furthermore, if any of these companies seek to renegotiate or cancel sales of coal because of fluctuations in spot prices for coal, issues with their end users accepting the coal or other factors, we may be unable to sell previously anticipated volumes of coal at favorable prices or at all. We also enter into derivative
financial instruments with a number of financial institutions. If one or more of these institutions were to default on its future obligation to us, our cash flows and results of operations would be negatively impacted.
In certain circumstances we may be entitled to demand credit enhancements or withhold shipments of coal from these parties if we determine they are not creditworthy. However, these protections may be insufficient to cover our risks or could cause us to resell the coal on the spot market at unfavorable prices or not at all.
We maintain cash balances that we may invest from time to time in marketable securities issued by various counterparties including the U.S. government and U.S. government sponsored entities, municipal entities, financial institutions and other corporations. If any of these counterparties fail, we could lose the principal invested with such counterparties, which would materially adversely impact our business, liquidity, and results of operations.
Certain provisions in our coal sales agreements may provide limited protection during adverse economic conditions or may result in economic penalties or suspension upon a failure to meet contractual requirements.
Price adjustment, “price re-opener” and other similar provisions in our long-term supply contracts may reduce the protection from short-term coal price volatility traditionally provided by these contracts. Most of our contracts with mine customers and some of our contracts with logistics customers contain provisions that allow for the base price of our coal to be adjusted due to new statutes, ordinances or regulations that affect our costs related to performance. Because these provisions only apply to the base price of coal, these terms may provide only limited protection due to changes in regulations. Some of our contracts with mine customers also contain provisions that allow for the purchase price to be renegotiated at periodic intervals. A price re-opener provision is one in which either party can renegotiate the price of the contract, sometimes at pre-determined times. Index provisions allow for the adjustment of the price based on a fixed formula. These provisions may reduce the protection available under long-term contracts from short-term coal price volatility. Our international contracts typically contain a fixed price for the first year of the contract with future years’ prices to be negotiated at a specific point in time. If the parties fail to satisfactorily negotiate a price, the contract could be terminated. Any adjustment or renegotiations leading to a significantly lower contract price, or a termination of the contract, could result in decreased revenue.
Our coal sales agreements with our mine customers typically contain force majeure provisions allowing temporary suspension of performance by us or our customers during the duration of specified events beyond the control of the affected party. For example, as a result of the very mild 2015/16 winter and low natural gas prices, a greater than normal number of our customers in 2016 sought to reduce the amount of tons delivered to them under our coal sales agreements through contractual remedies, such as contract buyout provisions. Our contracts with our mine customers also typically allow our customers to suspend performance in the event that the railroad fails to provide its services due to circumstances that would constitute a force majeure. In addition, our contracts with our international logistics customers generally contain a clause that requires us to pay the demurrage fee charged by the vessel for delays in shipping the coal on behalf of our foreign customers.
Most of our coal sales agreements also contain provisions requiring us to deliver coal within certain ranges for specific coal characteristics, such as heat content, sulfur, ash and ash fusion temperature. Failure to meet these specifications can result in economic penalties, including price adjustments, suspension, rejection or cancellation of deliveries or termination of the contracts. A number of our contracts also contain clauses which, in some cases, may allow customers to terminate the contract in the event of certain changes in environmental laws and regulations.
Our ability to operate our business effectively could be impaired if we fail to attract and retain key personnel.
Our ability to operate our business and implement our strategies depends, in part, on the continued contributions of our executive officers and other key employees. The loss of any of our key senior executives could have a material adverse effect on our business unless and until we find a qualified replacement. A limited number of persons exist with the requisite experience and skills to serve in our senior management positions. We may not be able to locate or employ qualified executives on acceptable terms and our failure to retain or attract qualified executives could have an adverse effect on our ability to operate our business.
Efficient coal mining using modern techniques and equipment also requires skilled laborers in multiple disciplines such as electricians, equipment operators, mechanics, engineers and welders, among others. We have from time to time encountered shortages for these types of skilled labor and typically compete for such positions with other industries, including oil and gas. If we experience shortages of skilled labor in the future, our labor and overall productivity or costs could be materially adversely affected. In the future, we may utilize a greater number of external contractors for portions of our operations. The costs of these contractors have historically been higher than that of our employed laborers. If our labor
and contractor prices increase, or if we experience materially increased health and benefit costs with respect to our employees, our results of operations could be materially adversely affected.
Our work force could become unionized in the future, which could negatively impact the stability of our production and materially reduce our profitability.
All of our mines are operated by non-union employees. Our employees have the right at any time under the National Labor Relations Act to form or affiliate with a union, and in the past, unions have conducted limited organizing activities in this regard. If our employees choose to form or affiliate with a union and the terms of a union collective bargaining agreement are significantly different from our current compensation and job assignment arrangements with our employees, these arrangements could negatively impact the stability of our production and materially reduce our profitability. In addition, even if our managed operations remain non-union, our business may still be adversely affected by work stoppages at unionized companies or unionized transportation and service providers.
Terrorist attacks and threats, escalation of military activity in response to these attacks or acts of war may materially adversely affect our business and results of operations.
Terrorist attacks and threats, escalation of military activity or acts of war may have significant effects on general economic conditions, fluctuations in consumer confidence and spending and market liquidity, each of which could negatively impact our business. Furthermore, any such acts which directly affect our customers and their business may have negative consequences to our own operations. Strategic targets such as energy-related assets and transportation assets may be at greater risk of future terrorist attacks than other targets in the U.S. or in other countries. Disruption or significant increases in energy prices could result in government-imposed price controls. It is possible that any of these occurrences, or a combination of them, could have a material adverse effect on our business and results of operations, including from delays or losses in transportation, decreased sales of our coal or extended collections from customers that are unable to timely pay us in accordance with the terms of their supply agreement.
We face the risk of systems failures as well as cybersecurity risks, including “hacking.”
The computer systems and network infrastructure we and others use could be vulnerable to unforeseen problems. These problems may arise in both our internally developed systems and the systems of our third-party service providers. Our operations are dependent upon our ability to protect computer equipment against damage from fire, power loss or telecommunication failure. Any damage or failure that causes an interruption in our operations could adversely affect our business. In addition, our computer systems and network infrastructure present security risks, and could be susceptible to hacking.
Risks Related to Our Indebtedness and Liquidity
Our substantial indebtedness could adversely affect our results of operations and financial condition and prevent us from fulfilling our financial obligations.
As of December 31, 2016, we had consolidated indebtedness of $416.4 million. We also have lease and royalty obligations related to our federal coal leases. Our outstanding indebtedness could have important consequences such as:
· limiting our ability to obtain additional financing to fund growth, such as mergers and acquisitions; working capital; capital expenditures; debt service requirements; future LBAs, or other cash requirements;
· requiring much of our cash flow to be dedicated to interest obligations and making it unavailable for other purposes;
· with respect to any indebtedness under the Credit Agreement or other variable rate debt, exposing us to the risk of increased interest costs if the underlying interest rates rise on our variable rate debt;
· limiting our ability to invest operating cash flow in our business (including to obtain new LBAs or make capital expenditures) due to debt service requirements;
· causing us to need to sell assets and properties at an inopportune time;
· limiting our ability to compete effectively with companies that are not as leveraged and that may be better positioned to withstand economic downturns, including competitors who may become less leveraged when they emerge from bankruptcy;
· limiting our ability to acquire new coal reserves and/or LBAs and plant and equipment needed to conduct operations;
· limiting our flexibility in planning for, or reacting to, and increasing our vulnerability to, changes in our business, the industry in which we operate and general economic and market conditions; and
· a downgrade in the credit rating of our indebtedness, which could increase the cost of further borrowings and negatively impact our available liquidity.
We may incur substantially more debt in the future. If our indebtedness is further increased, the related risks that we now face, including those described above, could increase. In addition to the principal repayments on outstanding debt, we have other demands on our cash resources, including significant maintenance and other capital expenditures, including LBAs, and operating expenses. Our ability to pay our debt depends upon our operating performance. In particular, economic conditions could cause revenue to decline, and hamper our ability to repay indebtedness. If we do not have enough cash to satisfy our debt service obligations, we may be required to refinance all or part of our debt, sell assets, limit certain capital expenditures, including future LBAs, or reduce spending or we may be required to issue equity. We may not be able to, at any given time, refinance our debt or sell assets and we may not be able to, at any given time, issue equity, in either case on acceptable terms or at all.
If we are unable to comply with the covenants or restrictions contained in our debt instruments, the lenders could declare all amounts outstanding under those instruments to be due and payable and foreclose on their collateral, which could materially adversely affect our financial condition and operations.
Our debt instruments include covenants that, among other things, restrict our ability to dispose of assets, incur additional indebtedness, pay dividends or make other restricted payments, create liens on assets, make investments, loans or advances, make acquisitions, engage in mergers or consolidations and engage in certain transactions with affiliates. The debt instruments also require compliance with various financial covenants. These restrictions could limit our ability to plan for or react to market conditions or meet extraordinary capital needs or otherwise restrict corporate activities.
A failure to comply with any of these restrictions or covenants could have serious consequences to our financial condition or result in a default under those debt instruments and under other agreements containing cross-default provisions. A default would permit lenders to accelerate the maturity of the debt under these debt instruments and to foreclose upon collateral securing the debt. Furthermore, an event of default or an acceleration under one of our debt instruments could also cause a cross-default or cross-acceleration of another debt instrument or contractual obligation, which would adversely impact our liquidity. Under these circumstances, we might not have sufficient funds or other resources to satisfy all of our obligations. We may not be granted waivers or amendments to these debt instruments if for any reason we are unable to comply with these debt instruments, and we may not be able to refinance our debt on terms acceptable to us, or at all.
Covenants under our Credit Agreement may limit the amount of funds available to us.
Our ability to borrow is subject to the terms and conditions of our Credit Agreement. The financial covenants are based on a monthly minimum liquidity covenant that requires us to maintain liquidity of not less than $125 million as of the last day of each month. We had $440.2 million of liquidity under this measure as of December 31, 2016. Our aggregate available borrowing capacity under the Credit Agreement and the Accounts Receivable Securitization Facility (“A/R Securitization Program”) was approximately $356.5 million as of December 31, 2016. See Item 7 “Management’s Discussion and Analysis of Financial Condition and Results of Operations—Liquidity and Capital Resources—Credit Agreement” and “Management’s Discussion and Analysis of Financial Condition and Results of Operations—Liquidity and Capital Resources—A/R Securitization Program.”
Provisions in our debt instruments could discourage an acquisition of us by a third party.
Upon the occurrence of certain transactions constituting a “change of control” as defined in the indentures, holders of the senior notes have the right to require us to repurchase all outstanding notes at 101% of the principal amount thereof, plus accrued and unpaid interest, if any, to the date of repurchase. Furthermore, a “change in control” as defined in our Credit Agreement is considered an event of default. These provisions could make it more difficult or more expensive for a third party to acquire us.
Our Credit Agreement provides an important source of our overall liquidity. Because the Second Amendment did not change its February 2019 maturity, we will need to extend or replace the Credit Agreement before its maturity and may
need to first address our significant obligations coming due in 2019 and thereafter. If we are unable to successfully extend or replace the Credit Agreement in a timely manner, our future financial condition and liquidity may be materially adversely affected.
On September 9, 2016, CPE Resources entered into the Second Amendment (the “Second Amendment”) to our existing revolving credit agreement with PNC Bank, National Association, as administrative agent, and a syndicate of lenders (as amended, the “Credit Agreement”) which, among other things, replaced quarterly EBITDA-based financial covenants that previously required us to (a) maintain defined minimum levels of interest coverage and (b) comply with a maximum net secured debt leverage ratio, with a new monthly minimum liquidity covenant that requires us to maintain liquidity of not less than $125 million as of the last day of each month. The Second Amendment also reduced the maximum borrowing capacity under the Credit Agreement to $400 million from the previous maximum capacity of $500 million.
The Second Amendment, however, did not change the maturity of the Credit Agreement, which remains February 21, 2019. As a result, we will need to extend or replace the Credit Agreement before its maturity to ensure we maintain sufficient liquidity for our business.
On October 17, 2016, we completed exchange offers (the “Exchange Offers”) for a substantial portion of our outstanding 8.50% Senior Notes due 2019 (the “2019 Notes”) and 6.375% Senior Notes due 2024 (the “2024 Notes”). The 2019 Notes not tendered in the Exchange Offers continue to be due at their stated maturity in December 2019, which could negatively impact our ability to extend or replace our Credit Agreement prior to its February 2019 maturity.
Our ability to timely extend or replace our Credit Agreement in a sufficient amount, for a sufficient term and on commercially reasonable terms, or at all, may be adversely impacted by numerous other factors, including, for example, the remaining portion of the 2019 Notes, our overall financial condition, results and financial projections, the amount and timing of our other obligations and liquidity needs, coal industry conditions in the U.S. and globally, investor sentiment toward the coal industry, the availability of credit and impact of anti-fossil fuel loan and investment restrictions imposed by traditional sources of credit and capital, general debt and capital markets conditions, U.S. and global economic conditions and other factors and circumstances existing at that time.
If we are unable to successfully extend or replace our Credit Agreement in a timely manner due to any of these or other factors, our future financial condition and liquidity may be materially adversely affected.
Other Risks Related to Our Corporate Structure and Common Stock
Our previous separation from Rio Tinto could subject us and our stockholders to any number of risks and uncertainties.
We entered into various agreements with Rio Tinto and its affiliates in connection with the IPO and separation from Rio Tinto. CPE Resources agreed to indemnify Rio Tinto for certain losses pursuant to these agreements. Because these agreements were entered into while we were part of Rio Tinto, some of the terms of these agreements are likely less favorable to us than similar agreements negotiated between unaffiliated third parties. Third parties may also seek to hold us responsible for liabilities of Rio Tinto that we did not assume in connection with the IPO and for which Rio Tinto agreed to indemnify us, including liabilities related to the Jacobs Ranch and Colowyo mines, as well as the uranium mining venture that we do not own. If those liabilities are significant and we are ultimately held liable for them, we may not be able to recover the full amount of our losses from Rio Tinto. Refer to the applicable exhibits listed in Item 15 of this Form 10-K for the complete terms and conditions of the principal outstanding agreements with Rio Tinto entered into in connection with our 2009 IPO.
CPE Inc. is a holding company with no direct operations of its own and depends on distributions from CPE Resources to meet its ongoing obligations.
CPE Inc. is a holding company with no direct operations of its own and has no independent ability to generate revenue. Consequently, its ability to obtain operating funds depends upon distributions from CPE Resources and payments under the management services agreement. Pursuant to its management services agreement, CPE Resources makes payments to CPE Inc. in the form of a management fee and cost reimbursements to fund CPE Inc.’s day-to-day operating expenses, such as payroll for its officers. However, if CPE Resources cannot make the payments pursuant to the management services agreement, CPE Inc. may be unable to cover these expenses.
The distribution of cash flows by CPE Resources to CPE Inc. is subject to statutory restrictions under the Delaware Limited Liability Company Act and contractual restrictions under CPE Resources’s debt instruments that may limit the
ability of CPE Resources to make distributions. In addition, any distributions and payments of fees or costs are subject to CPE Resources’s financial condition.
As the sole member of CPE Resources, CPE Inc. incurs income taxes on any net taxable income of CPE Resources. The debt instruments allow CPE Resources to distribute cash in amounts sufficient for CPE Inc. to pay its tax liabilities payable to any governmental entity. To the extent CPE Inc. needs funds for any other purpose, and CPE Resources is unable to provide such funds for any reason, it could have a material adverse effect on our business, financial condition, results of operations or prospects.
The price of our common stock has declined significantly in the past and could decline further for a variety of reasons, resulting in a substantial loss on investment and negatively impacting our ability to raise equity capital.
Our stock price decreased from $9.26 per share on January 2, 2015 to $2.08 per share on December 31, 2015. While it has recovered to $5.67 per share on February 8, 2017, it could decline again. Such decline could result from a variety of factors, including, among other things, actual or anticipated fluctuations in our operating results or financial condition, new laws or regulations or new interpretations of existing laws or regulations impacting our business, our customers’ businesses, or the coal transportation and logistics industry, sales of CPE Inc.’s common stock by our stockholders or by us, a downgrade or cessation in coverage from one or more of our analysts, broad market fluctuations and general economic conditions and any other factors described in this “Risk Factors” section of this Form 10-K.
The current trading price of our common stock, or any further decline thereof, might impede our ability to raise capital through the issuance of additional shares of CPE Inc.’s common stock or other equity securities and may cause a loss of part or all of an investment in shares of our common stock. In addition, if we sell additional shares of CPE Inc. common stock, that would result in dilution to existing stockholders and may result in decreases to our stock price and the value of existing investments in our stock. Those decreases may be more significant if we sell additional shares at depressed trading prices.
The closing market price of our common stock has declined significantly in the past. If the average closing price of our common stock declines to less than $1.00 over 30 consecutive trading days, our common stock could be delisted from the NYSE or trading could be suspended.
Our common stock is currently listed on the NYSE. In order for our common stock to continue to be listed on the NYSE, we are required to comply with various listing standards, including the maintenance of a minimum average closing price of at least $1.00 per share during a consecutive 30 trading-day period. A renewed or continued decline in the closing price of our common stock on the NYSE could result in a breach of these requirements. Although we would have an opportunity to take action to cure such a breach, if we did not succeed, the NYSE could commence suspension or delisting procedures in respect of our common stock. The commencement of suspension or delisting procedures by an exchange remains, at all times, at the discretion of such exchange and would be publicly announced by the exchange. If a suspension or delisting were to occur, there would be significantly less liquidity in the suspended or delisted securities. In addition, our ability to raise additional necessary capital through equity or debt financing, and attract and retain personnel by means of equity compensation, would be greatly impaired. Furthermore, with respect to any suspended or delisted securities, we would expect decreases in institutional and other investor demand, analyst coverage, market making activity and information available concerning trading prices and volume, and fewer broker-dealers would be willing to execute trades with respect to such securities. A suspension or delisting would likely decrease the attractiveness of our common stock to investors and cause the trading volume of our common stock to decline, which could result in a further decline in the market price of our common stock.
We may issue shares of preferred stock with greater rights than our common stock.
Our certificate of incorporation authorizes our board of directors to issue one or more series of preferred stock and set the terms of the preferred stock without seeking any further approval from our stockholders. Any preferred stock that is issued may rank ahead of our common stock in terms of dividends, liquidation rights, or voting rights. If we issue preferred stock, it may adversely affect the market price of our common stock.
We do not expect to pay dividends on our common stock.
We do not expect to pay any dividends on our common stock, in cash or otherwise, in the foreseeable future. We intend to retain any earnings for use in our business. In addition, the indentures governing our senior notes restrict our ability to pay dividends on our common stock. In the future, we may agree to further restrictions on our ability to pay dividends.
Anti-takeover provisions in our charter documents and other aspects of our structure may discourage, delay or prevent a change in control of our company and may adversely affect the trading price of CPE Inc.’s common stock.
Certain provisions in CPE Inc.’s amended and restated certificate of incorporation and amended and restated bylaws and other aspects of our structure may discourage, delay or prevent a change in our management or a change in control over us that stockholders may consider favorable. Among other things, CPE Inc.’s amended and restated certificate of incorporation and amended and restated bylaws:
· provide for a classified Board of Directors, which may delay the ability of our stockholders to change the membership of a majority of our Board of Directors;
· authorize the issuance of “blank check” preferred stock that could be issued by our Board of Directors to thwart a takeover attempt;
· do not provide for cumulative voting;
· provide that vacancies on the Board of Directors, including newly created directorships, may be filled only by a majority vote of directors then in office;
· limit the calling of special meetings of stockholders;
· provide that stockholders may not act by written consent;
· provide that our directors may be removed only for cause;
· require supermajority voting to effect certain amendments to our certificate of incorporation and our bylaws; and
· require stockholders to provide advance notice of new business proposals and director nominations under specific procedures.
Item 1B. Unresolved Staff Comments.
None.
See Item 1 “Business—Mining Operations” for specific information about our mining operations.
Coal Reserves
As of December 31, 2016, we controlled approximately 1.1 billion tons of proven and probable coal reserves. All of our proven and probable reserves are classified as thermal coal.
The following table summarizes the tonnage of our coal reserves that is classified as proven or probable, and assigned, as well as our property interest, as of December 31, 2016:
|
Mine |
|
Proven |
|
Probable |
|
Total Proven |
|
Assigned |
|
Reserves |
|
Reserves |
|
|
|
|
(nearest million, in tons) |
|
(%) |
|
(nearest million, in tons) |
| ||||||
|
|
|
|
|
|
|
|
|
|
|
|
|
|
|
|
Antelope |
|
409.3 |
|
107.6 |
|
516.9 |
|
100 |
|
— |
|
516.9 |
|
|
Cordero Rojo |
|
237.9 |
|
78.0 |
|
315.9 |
|
100 |
|
42.0 |
|
273.9 |
|
|
Spring Creek |
|
231.2 |
|
17.3 |
|
248.5 |
|
100 |
|
— |
|
248.5 |
|
|
Total (1) |
|
878.4 |
|
202.9 |
|
1081.3 |
|
|
|
42.0 |
|
1039.3 |
|
(1) Totals reflect rounding.
The following table provides the “quality” (average sulfur content and average Btu per pound) of our coal reserves as of December 31, 2016:
|
Mine |
|
Total Proven & Probable Reserves |
|
Average Btu |
|
Average |
|
Average Sulfur |
|
|
|
|
(nearest million, in tons) |
|
|
|
(%) |
|
(lbs SO2/ mmBtu) |
|
|
|
|
|
|
|
|
|
|
|
|
|
Antelope |
|
516.9 |
|
8,875 |
|
0.22 |
|
0.50 |
|
|
Cordero Rojo |
|
315.9 |
|
8,425 |
|
0.29 |
|
0.69 |
|
|
Spring Creek |
|
248.5 |
|
9,350 |
|
0.34 |
|
0.73 |
|
|
Total (2) |
|
1081.3 |
|
|
|
|
|
|
|
(1) Average Btu per pound includes weight of moisture in the coal on an as-sold basis.
(2) Totals reflect rounding.
We also control certain coal deposits that are contiguous to or near our primary reserve bases. The tons in these deposits are classified as non-reserve coal deposits and are not included in our reported reserves. These non-reserve coal deposits include:
· 7.8 million tons near our Antelope Mine;
· 53.1 million tons near our Cordero Rojo Mine;
· 3.9 million tons near our Spring Creek Mine; and
· 292.4 million tons at the Youngs Creek project.
Non-reserve coal deposits are not reserves under SEC Industry Guide 7. Estimates of non-reserve coal deposits are subject to further exploration and development, are more speculative and may or may not be converted to future reserves of the company.
Our reserve and non-reserve coal deposit estimates as of December 31, 2016 were prepared by our staff of geologists and engineers, who have extensive experience in PRB coal. These individuals are responsible for collecting and analyzing geologic data within and adjacent to leases controlled by us. Our Manager, Geology is the technical person primarily responsible for the preparation of our reserves estimates. He has a Bachelor of Science degree in Geology and 10 years of industry experience with positions of increasing responsibility in mining geology and reserve determination. He reports to our Director, Geological Services and Special Projects, who has a Bachelor of Science degree in Mining Engineering and over 30 years of industry experience with positions of increasing responsibility in coal quality and mine planning, operations, project evaluations, risk management, and technical management at CPE Inc. The Director, Geological Services and Special Projects reports directly to our Senior Vice President, Technical Services. An external review of our reserves and non-reserve coal deposit estimates is performed every two years. The most recent review was performed for the year ended December 31, 2016 and was completed in January 2017 by John T. Boyd Company, mining and geological consultants. The results verified our reserve and non-reserve coal deposit estimates for the year ended December 31, 2016.
Our coal reserve estimates are based on data obtained from our drilling activities and other available geologic data. All of our reserves are assigned, associated with our active coal properties, and incorporated in detailed mine plans. Estimates of our reserves are based on more than 7,000 drill holes. Our proven reserves have a typical drill hole spacing of 1,500 feet or less, and our probable reserves have a typical drill hole spacing of 2,500 feet or less.
Along with the geological data we assemble for our coal reserve estimates, our staff of geologists and engineers also analyzes the economic data such as cost of production, projected sales price and other data concerning permitting and advances in mining technology. Various factors and assumptions are utilized in estimating coal reserves, including assumptions concerning future coal prices and operating costs. These estimates are periodically updated to reflect past coal production and other geologic or mining data. Acquisitions or sales of coal properties will also change these estimates. Changes in mining methods or the utilization of new technologies may increase or decrease the recovery basis for a coal seam.
Reserve Acquisition Process
Since our inception, we have focused on growth through the acquisition of proven and probable coal reserves and non-reserve coal deposits. Historically, this was accomplished through the federal competitive leasing process, known as the LBA process. For example, in 2011 we acquired 383 million tons of proven and probable coal reserves in two federal coal leases for our Antelope Mine.
On January 15, 2016, the Secretary of the DOI announced a moratorium on the issuance of new leases for coal resources on federally-owned lands in order to allow for a “comprehensive review” of the federal coal programs. The terms of this moratorium preclude the BLM from accepting new applications for thermal coal sales, or modifying existing leases subject to certain exceptions. See Item 1 “Business—Environmental and Other Regulatory Matters—DOI Moratorium and Programmatic EIS.” The following disclosure describes the LBA process by which we have historically acquired coal.
We acquire a large portion of our coal through the LBA process, and as a result, most of our coal is held under federal leases. Under this process, before a mining company can obtain a new federal coal lease, the company must nominate a coal tract for lease and then win the lease through a competitive bidding process. The LBA process has lasted anywhere from two to five years or more from the time the coal tract is nominated to the time a final bid is accepted by the BLM. After the LBA is awarded, the company then conducts the necessary testing to determine what amount can be classified as reserves and begins the process to permit the coal for mining, which generally takes another two to five years. Third-party legal challenges, such as legal challenges filed against the BLM and the Secretary of the Interior by environmental groups with respect to the LBA process in the PRB may result in delays and other adverse impacts on the LBA process.
To initiate the LBA process, companies wanting to acquire additional coal must file an application with the BLM’s state office indicating interest in a specific coal tract. The BLM reviews the initial application to determine whether the application conforms to existing land-use plans for that particular tract of land and whether the application would provide for maximum coal recovery. The application is further reviewed by a regional coal team at a public meeting. Based on a review of the available information and public comment, the regional coal team will make a recommendation to the BLM whether to continue, modify or reject the application.
The BLM also allows for small tracts of coal to be acquired through the LBM leasing process. An LBM is a non-competitive leasing process and is used in circumstances where a lessee is seeking to modify an existing federal coal lease by adding less than 960 acres in a configuration that is deemed non-competitive to other coal operators. For example, in December 2012, we applied for two separate LBMs with the BLM: one at the Spring Creek Mine and one at the Antelope Mine. A Decision Record to issue the Antelope LBM has been made by BLM and appealed by certain environmental groups. The appeal is under review by the Interior Board of Land Appeals. The Spring Creek application is being processed by the BLM.
If the BLM determines to continue the application, the company that submitted the application will pay for a BLM-directed environmental analysis or an EIS to be completed. This analysis or impact statement is subject to publication and public comment. The BLM may consult with other government agencies during this process, including state and federal agencies, surface management agencies, Native American tribes or bands, the U.S. Department of Justice or others as needed. The public comment period for an analysis or impact statement typically occurs over a 60-day period.
After the environmental analysis or EIS has been issued and a recommendation has been published that supports the lease sale of the LBA tract, the BLM schedules a public competitive lease sale. The BLM prepares an internal estimate of the fair market value of the coal that is based on its economic analysis and comparable sales analysis. Prior to the lease sale, companies interested in acquiring the lease must send sealed bids to the BLM. The bid amounts for the lease are payable in five annual installments, with the first 20% installment due when the mining operator submits its initial bid for an LBA. Before the lease is approved by the BLM, the company must first furnish to the BLM an initial rental payment for the first year of rent along with either a bond for the next 20% annual installment payment for the bid amount, or an application for history of timely payment, in which case the BLM may waive the bond requirement if the company successfully meets all the qualifications of a timely payer. The bids are opened at the lease sale. If the BLM decides to grant a lease, the lease is awarded to the company that submitted the highest total bid meeting or exceeding the BLM’s fair market value estimate, which is not published. The BLM, however, is not required to grant a lease even if it determines that a bid meeting or exceeding the fair market value of the coal has been submitted. The winning bidder must also submit a report setting forth the nature and extent of its coal holdings to the U.S. Department of Justice for a 30-day antitrust review of the lease. If the successful bidder was not the initial applicant, the BLM will refund the initial applicant certain fees it paid in connection with the application process, for example the fees associated with the environmental analysis or EIS, and the winning bidder will bear those costs. Coal awarded through the LBA process and subject to federal leases is administered by the U.S.
Department of Interior under the Federal Coal Leasing Amendment Act of 1976. Once the BLM has issued a lease, the company must next complete the permitting process before it can mine the coal. See Item 1 “Business—Environmental and Other Regulatory Matters—Mining Permits and Approvals.”
The federal coal leasing process is designed to be a public process, giving stakeholders and other interested parties opportunities to comment on the BLM’s proposed and final actions and allow third-party comments. Because of this, third parties, including NGOs, can challenge the BLM’s actions, which may delay the leasing process. If these challenges prove successful or are litigated for a prolonged period of time, a coal company’s ability to bid on or acquire a new coal lease could be significantly delayed, or could cause the BLM to not offer a lease for bid at all. For example, environmental organizations filed legal challenges against the BLM’s findings on the final EIS and other matters associated with the West Antelope II LBA, which was nominated by our Antelope Mine. Though these challenges were unsuccessful and the plaintiffs abandoned their efforts for appeal, these types of challenges create some uncertainty with respect to the timing of future LBA bids and lease acquisitions and may ultimately delay the leasing process or prevent mining operations. Even after a lease has been issued and a successful bidder has paid installment money to the BLM, legal challenges may still seek to delay or prevent mining operations. It is possible that subsequent EISs for other mines in the PRB currently underway but not yet final could be similarly challenged. There also exists the possibility of similar challenges to the permitting and licensing process, which is also a public process designed to allow public comments. Refer to Note 19 of Notes to Consolidated Financial Statements in Item 8 for a discussion regarding current challenges by environmental activist groups against existing regulatory permits and approvals for our mines and against a pending lease modification for our Antelope Mine.
Each of our federal coal leases has an initial term of 20 years, renewable for subsequent 10-year periods and for so long thereafter as coal is produced in commercial quantities. The lease requires diligent development within the first 10 years of the lease award with a required coal extraction of 1% of the total coal under the lease by the end of that 10-year period. At the end of the 10-year development period, the lessee is required to maintain continuous operations, as defined in the applicable leasing regulations. In certain cases, a lessee may combine contiguous leases into an LMU. This allows the production of coal from any of the leases within the LMU to be used to meet the continuous operation requirements for the entire LMU. We currently have an LMU for our Antelope Mine. We pay to the federal government an annual rent of $3.00 per acre and production royalties of 12.5% of gross revenue on surface mined coal. The federal government remits approximately 50% of the production royalty payments to the state after deducting administrative expenses. Some of our mines are also subject to coal leases with the states of Montana or Wyoming, as applicable, and have different terms and conditions that we must adhere to in a similar way to our federal leases. Under these federal and state leases, if the leased coal is not diligently developed during the initial 10-year development period or if certain other terms of the leases are not complied with, including the requirement to produce a minimum quantity of coal or pay a minimum production royalty, if applicable, the BLM or the applicable state regulatory agency can terminate the lease prior to the expiration of its term.
Most of the coal we lease from the U.S. comes from “split estate” lands in which one party, such as the federal government, owns the coal and a private party owns the surface. In order to mine the coal we acquire, we must acquire rights to mine from certain owners of the surface lands overlying the coal. Certain federal regulations provide a specific class of surface owners, QSOs, with the ability to prohibit the BLM from leasing its coal. For example, in connection with an LBA tract that we previously nominated for our Cordero Rojo Mine, the BLM indicated that certain surface owners satisfied the regulatory definition of QSO. If the land overlying a coal tract is owned by a QSO, federal laws prohibit us from leasing the coal tract without first securing surface rights to the land, or purchasing the surface rights from the QSO, which would allow us to conduct our mining operations. Furthermore, the state permitting process requires us to demonstrate surface owner consent for split estate lands before the state will issue a permit to mine coal. This consent is separate from the QSO consent required before leasing federal coal. This right of QSOs and certain other surface owners allows them to exercise significant influence over negotiations and prices to acquire surface rights and can delay the federal coal lease or permitting processes or ultimately prevent the acquisition of the federal coal lease or permit over that land entirely. There are QSOs that own land adjacent to or near our existing mines that may be attractive acquisition candidates for us. Typically, we seek to purchase the land overlying our coal or enter into option agreements granting us an option to purchase the land upon acquiring a federal coal lease. We own substantially all of the land over our reserves. We may not own or control the land over our non-reserve coal deposits, which would be required before these non-reserve coal deposits could be classified as reserves and mined.
Most of the coal we have acquired from private third parties is in the form of coal leases obtained through private negotiations with one or more third parties. These leases generally include, among other terms and conditions, a set term of years with the right to renew the lease for a stated period and royalties to be paid to the lessor as a percentage of the sales price. These leases may require payment of a lease bonus or minimum royalty, payable either at the time of execution of the lease or in periodic installments, and a minimum production of coal from the leased areas in order to hold the leases by active production. We believe that the term of years will allow the recoverable reserve to be fully extracted in accordance with our projected mine plan. Consistent with industry practice, we conduct only limited investigations of title to our coal properties
prior to leasing. Title to properties leased from private third parties is not usually fully verified until we make a commitment to develop a property, which may not occur until we have obtained the necessary permits and completed exploration of the property.
We acquired significant coal deposits when we completed the acquisition of the Youngs Creek project, a non-operating mine in Northeast Wyoming in the Northern PRB, whereby we acquired 292 million tons of non-reserve coal deposits along with significant related surface assets. We also announced in 2013 that we signed an option agreement and a corresponding exploration agreement with the Crow Tribe of Indians for the exploration and potential development of significant coal resources on the Crow Indian Reservation in southeast Montana in the Northern PRB region. Subject to market conditions, we intend to continue to seek opportunities to acquire additional coal through the federal leasing process upon expiration of the leasing moratorium as well as through private transactions with third parties or sovereign nations such as the Crow Tribe of Indians.
Office Space
Our corporate headquarters is located in Gillette, Wyoming, where we own approximately 32,000 square feet of office space. In addition, we lease approximately 28,000 square feet of office space in Broomfield, Colorado under a lease that expires in February 2021. As of December 31, 2016, all of our long-lived assets were located in the U.S. See Note 23 of Notes to Consolidated Financial Statements in Item 8.
For a discussion of legal proceedings, please see Note 19 of Notes to the Consolidated Financial Statements in Item 8.
Item 4. Mine Safety Disclosures
The information concerning mine safety violations or other regulatory matters required by Section 1503(a) of the Dodd-Frank Wall Street Reform and Consumer Protection Act and Item 104 of Regulation S-K is included in Exhibit 95.1 to this Form 10-K.
Item 5. Market for Registrant’s Common Equity and Related Stockholder Matters.
Our common stock, $0.01 par value, is traded on the NYSE under the symbol “CLD”. The following table sets forth the intraday high and low sales prices of our common stock, as reported by the NYSE, for each of the periods listed.
|
|
|
High |
|
Low |
| ||
|
Fiscal Year 2016 |
|
|
|
|
| ||
|
Fourth Quarter 2016 |
|
$ |
8.04 |
|
$ |
4.80 |
|
|
Third Quarter 2016 |
|
$ |
5.44 |
|
$ |
2.03 |
|
|
Second Quarter 2016 |
|
$ |
2.73 |
|
$ |
1.64 |
|
|
First Quarter 2016 |
|
$ |
2.28 |
|
$ |
1.08 |
|
|
|
|
|
|
|
| ||
|
Fiscal Year 2015 |
|
|
|
|
| ||
|
Fourth Quarter 2015 |
|
$ |
3.83 |
|
$ |
1.95 |
|
|
Third Quarter 2015 |
|
$ |
4.79 |
|
$ |
2.41 |
|
|
Second Quarter 2015 |
|
$ |
7.39 |
|
$ |
4.35 |
|
|
First Quarter 2015 |
|
$ |
9.36 |
|
$ |
5.62 |
|
The last reported sale price of our common stock on the NYSE on December 30, 2016 was $5.61 per share. As of the close of business on February 8, 2017, there were 76 holders of record of our common stock.
Dividend Policy
We have not historically paid, and we do not anticipate that we will pay in the near term, cash dividends on CPE Inc.’s common stock. Any determination to pay dividends to holders of CPE Inc.’s common stock in the future will be at the discretion of our Board of Directors and will depend on many factors, including our financial condition; results of operations; general business conditions; contractual restrictions, including those under our debt instruments; capital requirements; business prospects; restrictions on the payment of dividends under Delaware Law; and any other factors our Board of Directors deems relevant. See Item 7 “Management’s Discussion and Analysis of Financial Condition and Results of Operations—Liquidity and Capital Resources—Senior Notes” and “—Credit Agreement.”
Stock Performance Graph
The following performance graph compares the cumulative total return on CPE Inc.’s common stock with the cumulative total return of the following indices: (i) the Standard & Poor’s (“S&P”) MidCap 400 stock index and (ii) the Custom Composite Index. The Custom Composite Index is comprised of the peer group that is associated with our performance-based share units issued under our Long Term Incentive Plan. As of December 31, 2016, this group was comprised of Alliance Resource Partners LP, Antero Resources Corporation, Cabot Oil & Gas Corporation, CONSOL Energy Inc., EQT Corporation, Foresight Energy LP, Hallador Energy Company, Newfield Exploration Co., Noble Energy, Inc., Peabody Energy Corp., Range Resources Corporation, Rhino Resource Partners LP, SM Energy Company, SunCoke Energy Inc., Westmoreland Coal Co., and Whiting Petroleum Corp. Each year the compensation committee of our Board of Directors seeks to refine this group, if deemed appropriate in the judgment of the compensation committee, to be the most representative comparable companies for purposes of our performance-based share units. In 2016, Alpha Natural Resources, Inc., Arch Coal, Inc., Penn Virginia Corporation, Sabine Oil & Gas Corporation, SandRidge Energy, Inc., and Walter Energy, Inc. were removed from the Custom Composite Index as a result of their bankruptcy filings. To replace these companies, Antero Resources Corporation, Hallador Energy Company and Range Resources Corporation were added.
The graph assumes that you invested $100 in CPE Inc.’s common stock and in each index at the closing price on December 31, 2011, that all dividends, if any, were reinvested and that you continued to hold your investment through December 31, 2016.
These indices are included for comparative purposes only and do not necessarily reflect management’s opinion that such indices are an appropriate measure of the relative performance of the stock involved, and are not intended to forecast or be indicative of possible future performance of CPE Inc.’s common stock.
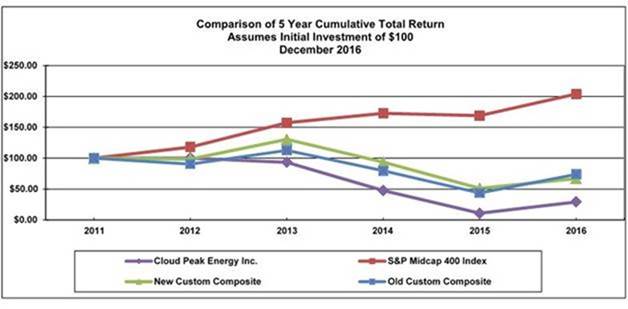
Company/ Market/ Peer Group
|
|
|
2011 |
|
2012 |
|
2013 |
|
2014 |
|
2015 |
|
2016 |
| ||||||
|
CPE Inc. |
|
$ |
100.00 |
|
$ |
100.05 |
|
$ |
93.17 |
|
$ |
47.52 |
|
$ |
10.77 |
|
$ |
29.04 |
|
|
S&P Midcap 400 Index |
|
$ |
100.00 |
|
$ |
117.88 |
|
$ |
157.37 |
|
$ |
172.74 |
|
$ |
168.98 |
|
$ |
204.03 |
|
|
New Custom Composite (1) |
|
$ |
100.00 |
|
$ |
98.47 |
|
$ |
130.52 |
|
$ |
93.61 |
|
$ |
51.11 |
|
$ |
66.98 |
|
|
Old Custom Composite (2) |
|
$ |
100.00 |
|
$ |
90.39 |
|
$ |
112.62 |
|
$ |
79.63 |
|
$ |
43.54 |
|
$ |
73.84 |
|
(1) Reflects the Custom Composite Index as of December 31, 2016.
(2) Reflects the Custom Composite Index as of December 31, 2015.
In accordance with SEC rules, the information contained in the Stock Performance Graph above shall not be deemed to be “soliciting material,” or to be “filed” with the SEC or subject to the SEC’s Regulation 14A or 14C, other than as provided under Item 201(e) of Regulation S-K, or to the liabilities of Section 18 of the Securities Exchange Act of 1934, as amended, except to the extent that we specifically request that the information be treated as soliciting material or specifically incorporate it by reference into a document filed under the Securities Act of 1933, as amended, or the Securities Exchange Act of 1934, as amended.
Issuer Purchases of Equity Securities
The table below represents information pursuant to Item 703 of Regulation S-K regarding all share repurchases for the three-month period ended December 31, 2016:
|
|
|
|
|
|
|
|
|
(d) |
| |
|
|
|
(a) |
|
(b) |
|
(c) |
|
Maximum |
| |
|
October 1 through October 31, 2016 |
|
— |
|
$ |
— |
|
— |
|
N/A |
|
|
November 1 through November 30, 2016 |
|
— |
|
$ |
— |
|
— |
|
N/A |
|
|
December 1 through December 31, 2016 |
|
— |
|
$ |
— |
|
— |
|
N/A |
|
(1) Represents shares withheld to cover withholding taxes upon the vesting of restricted stock.
Item 6. Selected Financial Data.
The following tables set forth our selected consolidated financial and other data on a historical basis. The information below should be read in conjunction with Item 7 “Management’s Discussion and Analysis of Financial Condition and Results of Operations” and Item 8 “Financial Statements and Supplementary Data” included elsewhere in this report.
We have derived the historical consolidated financial data as of December 31, 2016 and 2015 and for each of the three years in the period ended December 31, 2016 from our audited consolidated financial statements included in Item 8 of this report. We have derived the historical consolidated balance sheet data as of December 31, 2014, 2013, and 2012 and the historical consolidated statements of operations data for the years ended December 31, 2013 and 2012 from our audited consolidated financial statements not included in this report.
Selected Consolidated Financial and Other Data
|
|
|
Year Ended December 31, |
| |||||||||||||
|
|
|
2016 |
|
2015 |
|
2014 |
|
2013 |
|
2012 |
| |||||
|
|
|
(in millions, except per share amounts) |
| |||||||||||||
|
Statement of Operations Data |
|
|
|
|
|
|
|
|
|
|
| |||||
|
Revenue |
|
$ |
800.4 |
|
$ |
1,124.1 |
|
$ |
1,324.0 |
|
$ |
1,396.1 |
|
$ |
1,516.8 |
|
|
Operating income (loss) |
|
$ |
67.3 |
|
$ |
(81.4 |
) |
$ |
131.8 |
|
$ |
112.4 |
|
$ |
241.9 |
|
|
Net income (loss) |
|
$ |
21.8 |
|
$ |
(204.9 |
) |
$ |
79.0 |
|
$ |
52.0 |
|
$ |
173.7 |
|
|
Income (loss) per common share - basic |
|
$ |
0.36 |
|
$ |
(3.36 |
) |
$ |
1.30 |
|
$ |
0.86 |
|
$ |
2.89 |
|
|
Income (loss) per common share - diluted |
|
$ |
0.35 |
|
$ |
(3.36 |
) |
$ |
1.29 |
|
$ |
0.85 |
|
$ |
2.85 |
|
|
|
|
December 31, |
| |||||||||||||
|
|
|
2016 |
|
2015 |
|
2014 |
|
2013 |
|
2012 |
| |||||
|
|
|
(in millions) |
| |||||||||||||
|
Balance Sheet Data |
|
|
|
|
|
|
|
|
|
|
| |||||
|
Cash and cash equivalents |
|
$ |
83.7 |
|
$ |
89.3 |
|
$ |
168.7 |
|
$ |
231.6 |
|
$ |
197.7 |
|
|
Investments in marketable securities |
|
$ |
— |
|
$ |
— |
|
$ |
— |
|
$ |
80.7 |
|
$ |
80.3 |
|
|
Property, plant and equipment, net |
|
$ |
1,432.4 |
|
$ |
1,488.4 |
|
$ |
1,589.1 |
|
$ |
1,654.0 |
|
$ |
1,678.3 |
|
|
Total assets |
|
$ |
1,714.8 |
|
$ |
1,802.2 |
|
$ |
2,151.2 |
|
$ |
2,348.5 |
|
$ |
2,341.0 |
|
|
Long-term debt |
|
$ |
475.0 |
|
$ |
491.2 |
|
$ |
489.7 |
|
$ |
588.1 |
|
$ |
586.2 |
|
|
Federal coal leases obligations |
|
$ |
— |
|
$ |
— |
|
$ |
64.0 |
|
$ |
122.9 |
|
$ |
186.1 |
|
|
Capital leases |
|
$ |
7.6 |
|
$ |
8.9 |
|
$ |
9.0 |
|
$ |
9.5 |
|
$ |
— |
|
|
Total liabilities |
|
$ |
763.1 |
|
$ |
914.3 |
|
$ |
1,063.3 |
|
$ |
1,346.5 |
|
$ |
1,410.0 |
|
|
Total equity (1) |
|
$ |
951.7 |
|
$ |
887.9 |
|
$ |
1,087.8 |
|
$ |
1,002.0 |
|
$ |
931.0 |
|
|
|
|
Year Ended December 31, |
| |||||||||||||
|
|
|
2016 |
|
2015 |
|
2014 |
|
2013 |
|
2012 |
| |||||
|
|
|
(in millions) |
| |||||||||||||
|
Other Data |
|
|
|
|
|
|
|
|
|
|
| |||||
|
Adjusted EBITDA (2) |
|
$ |
98.6 |
|
$ |
123.8 |
|
$ |
201.9 |
|
$ |
218.6 |
|
$ |
338.8 |
|
|
Asian export tons—Logistics and Related Activities |
|
0.6 |
|
3.6 |
|
4.0 |
|
4.7 |
|
4.4 |
| |||||
|
Tons sold—Owned and Operated Mines (3) |
|
58.5 |
|
75.1 |
|
85.9 |
|
86.0 |
|
90.6 |
| |||||
|
Tons purchased and resold |
|
0.3 |
|
0.3 |
|
0.1 |
|
1.5 |
|
0.9 |
| |||||
|
Total tons sold |
|
58.8 |
|
75.3 |
|
87.1 |
|
89.1 |
|
93.0 |
| |||||
(1) No cash dividends were declared or paid on our common stock during the periods presented.
(2) EBITDA and Adjusted EBITDA are intended to provide additional information only and do not have any standard meaning prescribed by U.S. GAAP. A quantitative reconciliation of historical net income (loss) to Adjusted EBITDA is found in Item 7 “Management’s Discussion and Analysis of Financial Condition and Results of Operations—Non-GAAP Financial Measures.”
(3) Inclusive of intersegment sales.
Item 7. Management’s Discussion and Analysis of Financial Condition and Results of Operations.
Unless the context indicates otherwise, the terms “Cloud Peak Energy,” the “Company,” “we,” “us,” and “our” refer to Cloud Peak Energy Inc. and its subsidiaries.
This Item 7 may contain forward-looking statements that involve substantial risks and uncertainties. When considering these forward-looking statements, you should keep in mind the cautionary statements in this report and our other SEC filings. See “Cautionary Notice Regarding Forward-Looking Statements” and Item 1A “Risk Factors” elsewhere in this document.
This Item 7 is intended to help the reader understand our results of operations and financial condition. This discussion should be read in conjunction with our consolidated financial statements in Item 8.
Overview
We are one of the largest producers of coal in the United States of America (“U.S.”) and the PRB, based on our 2016 coal sales. We operate some of the safest mines in the coal industry. According to the most current MSHA data, we have one of the lowest employee all injury incident rates among the largest U.S. coal producing companies. We currently operate solely in the PRB, the lowest cost region of the major coal producing regions in the U.S., where we own and operate three surface coal mines: the Antelope Mine, the Cordero Rojo Mine, and the Spring Creek Mine.
Our Antelope Mine and Cordero Rojo Mine are located in Wyoming and our Spring Creek Mine is located in Montana. Our mines produce subbituminous thermal coal with low sulfur content, and we sell our coal primarily to domestic and foreign electric utilities. Thermal coal is primarily consumed by electric utilities and industrial consumers as fuel for electricity generation. In 2016, the coal we produced generated approximately 3% of the electricity produced in the U.S. As of December 31, 2016, we controlled approximately 1.1 billion tons of proven and probable reserves. We do not produce any metallurgical coal. See Item 1. “Business—Mining Operations.”
In addition, we have two development projects, both located in the Northern PRB. The Youngs Creek project is an undeveloped surface mine project located in Wyoming, seven miles south of our Spring Creek Mine, located in Wyoming, and contiguous with the Wyoming-Montana state line. The Big Metal project is near the Youngs Creek project located on the Crow Indian Reservation in southeast Montana. These two projects are described in more detail under Item 1. “Business—Development Projects.”
Our logistics business provides a variety of services designed to facilitate the sale and delivery of coal. These services include the purchase of coal from third parties or from our owned and operated mines, coordination of the transportation and delivery of purchased coal, negotiation of take-or-pay rail agreements and take-or-pay port agreements and demurrage settlement with vessel operators. See Item 1. “Business—Transportation and Logistics Services” for further discussion.
Segment Information
Our reportable segments include Owned and Operated Mines and Logistics and Related Activities. For a discussion of these segments, see Note 23 of Notes to Consolidated Financial Statements in Item 8.
Core Business Operations
Our key business drivers include the following:
· the volume of coal sold by our Owned and Operated Mines segment;
· the price for which we sell our coal;
· the costs of mining, including labor, repairs and maintenance, fuel, explosives, depreciation of capital equipment, and depletion of coal leases;
· the amount of royalties, severance taxes, and other governmental levies that we pay;
· capital expenditures to acquire property, plant and equipment;
· the volume of deliveries coordinated by our Logistics and Related Activities segment to customer contracted destinations;
· the revenue we receive for our logistics services;
· the costs for logistics services, rail and port charges for coal sales made on a delivered basis, including demurrage and any take-or-pay charges; and
· the results of our derivative financial instruments.
The volume of coal that we sell in any given year is driven by global and domestic demand for coal-generated electric power. Demand for coal-generated electric power may be affected by many factors including weather patterns, natural gas prices, railroad performance, the availability of coal-fired and alternative generating capacity and utilization, environmental and legal challenges, political and regulatory factors, energy policies, international and domestic economic conditions, currency exchange rate fluctuations, and other factors discussed in this Item 7 and in Item 1A “Risk Factors.”
The price at which we sell our coal is a function of the demand for coal relative to the supply. We typically enter into multi-year contracts with our customers, which helps mitigate the risks associated with any short-term imbalance in supply and demand. We typically seek to enter each year with expected production effectively fully sold. This strategy helps us run our mines at predictable production rates, which improves control of operating costs.
As is common in the PRB, coal seams at our existing mines naturally deepen, resulting in additional overburden to be removed at additional cost. We have experienced increased operating costs for longer haul distances, maintenance and supplies, and employee wages and salaries. We use derivative financial instruments to help manage our exposure to diesel fuel prices.
We incur significant capital expenditures to maintain, update and expand our mining equipment, surface land holdings and coal reserves. As the costs of acquiring federal coal leases and associated surface rights increase, our depletion costs also increase.
The volume of coal sold on a delivered basis is influenced by international and domestic market conditions. Coal sold on a delivered basis to customer contracted destinations, including sales to Asian customers, involves us arranging and paying for logistics services, which can include rail, rail car hire, and port charges, including any demurrage incurred and other costs. These logistics costs are affected by volume, various scheduling considerations, and negotiated rates for rail and port services. We have exposure to take-or-pay commitments for our rail and port committed capacities. We are also incurring costs to investigate and pursue development of additional port opportunities.
Current Considerations
Owned and Operated Mines Segment
While overall shipments for the year ended December 31, 2016 declined as compared to the prior year, we saw an increase in shipments in the second half of the year as customers stockpiles decreased and they started to take their contracted volumes. With natural gas prices remaining over $3.00 MMBtu, many utilities increased their consumption of PRB coal as the economic dispatch of their coal units became more favorable. The latest data from EIA shows natural gas inventories have declined by 11% due to winter heating demand and reduced production, compared to 2015 levels. The Energy Ventures Analysis estimates that PRB coal inventories at utilities closed the year 15% lower than 2015 levels. The extent to which winter heating demand extends into March and April and levels of summer cooling demand will impact natural gas prices and full-year coal burn and shipments. While PRB coal prices have increased from the low levels this time last year, they are not expected to increase significantly until utility stockpiles decline further. Utilities have continued to delay contracting tons as they seek to maximize their ability to quickly switch burn between coal and natural gas. While this maximizes their flexibility, it could lead to strong price support during periods of increased gas and electricity demand.
Logistics and Related Activities Segment
International thermal coal prices increased significantly during the second half of 2016 as China increased imports to offset declining domestic production levels. Declining Chinese production, driven by government imposed production limits and years of low prices, resulted in production declines in 2016 of 9%. Chinese 2016 thermal coal imports, which include Bituminous, Sub-bituminous, and Lignite coals, were up approximately 30% from 2015. Seaborne thermal coal prices rose rapidly in late 2016 as some coal was diverted to metallurgical customers and years of low prices and subsequent low investment reduced Indonesian and Australian producers’ ability to increase supply.
Higher international prices allowed us to re-enter the export market and ship 0.4 million tons on three vessels during the fourth quarter of 2016. We currently have committed sales for the first half of 2017 and continue to get strong interest from Asian customers. The new agreements with our port and rail providers have allowed us to greatly reduce our total take-or-pay commitments while allowing us to export when profitable to do so.
2017 Outlook
We are currently anticipating similar production for 2017 compared to what we experienced in 2016. However, we expect to see lower domestic results offset by higher export shipments. We do not anticipate contract buy-out revenue at the level experienced in 2016.
Lower domestic coal prices and lower production volumes, such as those experienced recently, may not only decrease our revenues and cash flows but also may reduce the amount of coal we can produce economically. In addition, lower coal prices may result in asset impairment charges on our long-lived assets due to reductions in the future cash flows associated with our Owned and Operated Mines. We expect domestic coal prices and production levels to remain at or near current levels for the next few years and then to begin improving as the market for PRB coal continues stabilizing. We also expect the demand and related prices for coal sold to Asian customers will continue to improve as we saw at the end of 2016. If prices and demand should decline further, or remain at current levels for an extended period of time, or not improve as expected, we may incur impairment charges with respect to certain of our long-lived assets. Additional triggering events could include, but are not limited to, an impairment of coal reserves caused by continued declines in coal prices, increasing costs of production or regulatory changes that adversely impact coal-fired electricity generation.
Environmental and Other Regulatory Matters
Federal, state and local authorities regulate the U.S. coal mining industry with respect to various matters, including air quality standards, water pollution, plant and wildlife protection, the discharge of materials into the environment and the effects of mining on surface and groundwater quality and availability. These laws and regulations have had, and will continue to have, a significant adverse effect on our production costs and our competitive position relative to certain other sources of electricity generation. Future laws, regulations or orders, including those relating to global climate change, may cause coal to become a less attractive fuel source, thereby reducing coal’s share of the market for fuels and other energy sources used to generate electricity. See Item 1 “Business—Environmental and Other Regulatory Matters.”
In August 2015, the EPA issued its final CPP rules that establish carbon pollution standards for power plants, called CO2 emission performance rates. The EPA expects each state to develop implementation plans for power plants in its state to meet the individual state targets established in the CPP. The EPA has given states the option to develop compliance plans for annual rate-based reductions (pounds per megawatt hour) or mass-based tonnage limits for CO2. The state plans were to be due in September 2016, subject to potential extensions of up to two years for final plan submission. The compliance period begins in 2022, and emission reductions will be phased in up to 2030. The EPA also proposed a federal compliance plan to implement the CPP in the event that an approvable state plan is not submitted to the EPA. Judicial challenges have been filed. On February 9, 2016, the U.S. Supreme Court granted a stay of the implementation of the CPP before the United States Court of Appeals for the District of Columbia (“Circuit Court”) even issued a decision. By its terms, this stay will remain in effect throughout the pendency of the appeals process including at the Circuit Court and the Supreme Court through any certiorari petition that may be granted. The stay suspends the rule, including the requirement that states submit their initial plans by September 2016. The Supreme Court’s stay applies only to EPA’s regulations for CO2 emissions from existing power plants and will not affect EPA’s standards for new power plants. It is not yet clear how either the Circuit Court or the Supreme Court will rule on the legality of the CPP. Additionally, it is unclear how the CPP will be impacted by the change in the U.S. Presidential administration. If the rules were upheld at the conclusion of this appellate process and were implemented in their current form, demand for coal would likely be further decreased, potentially significantly, and our business would be adversely impacted.
On January 15, 2016, the Secretary of the DOI announced a moratorium on the issuance of new leases for coal resources on federally-owned lands in order to allow for a “comprehensive review” of the federal coal programs. The terms of this moratorium preclude the BLM from accepting new applications for thermal coal sales or modifying existing leases subject to certain exceptions.
Years Ended December 31, 2016, 2015, and 2014
Summary
The following table summarizes key results (in millions):
|
|
|
Year Ended |
|
|
|
|
| |||||||
|
|
|
December 31, |
|
Percent Change |
| |||||||||
|
|
|
2016 |
|
2015 |
|
2014 |
|
2016 vs 2015 |
|
2015 vs 2014 |
| |||
|
Total tons sold |
|
58.8 |
|
75.3 |
|
87.1 |
|
(21.9 |
)% |
(13.5 |
)% | |||
|
Total revenue |
|
$ |
800.4 |
|
$ |
1,124.1 |
|
$ |
1,324.0 |
|
(28.8 |
) |
(15.1 |
) |
|
Net income (loss) |
|
$ |
21.8 |
|
$ |
(204.9 |
) |
$ |
79.0 |
|
110.6 |
|
(359.4 |
) |
|
Adjusted EBITDA (1) |
|
$ |
98.6 |
|
$ |
123.8 |
|
$ |
201.9 |
|
(20.4 |
) |
(38.7 |
) |
(1) EBITDA and Adjusted EBITDA are intended to provide additional information only and do not have any standard meaning prescribed by U.S. GAAP. A quantitative reconciliation of historical net income (loss) to Adjusted EBITDA is found in Item 7 “Management’s Discussion and Analysis of Financial Condition and Results of Operations—Non-GAAP Financial Measures.”
Results of Operations
Revenue
The following table presents Revenue (in millions except per ton amounts):
|
|
|
Year Ended |
|
|
|
|
| |||||||
|
|
|
December 31, |
|
Percent Change |
| |||||||||
|
|
|
2016 |
|
2015 |
|
2014 |
|
2016 vs 2015 |
|
2015 vs 2014 |
| |||
|
Owned and Operated Mines |
|
|
|
|
|
|
|
|
|
|
| |||
|
Realized price per ton sold |
|
$ |
12.40 |
|
$ |
12.79 |
|
$ |
13.01 |
|
(3.0 |
)% |
(1.7 |
)% |
|
Tons sold |
|
58.5 |
|
75.1 |
|
85.9 |
|
(22.1 |
) |
(12.6 |
) | |||
|
|
|
|
|
|
|
|
|
|
|
|
| |||
|
Coal revenue |
|
$ |
725.4 |
|
$ |
959.9 |
|
$ |
1,117.9 |
|
(24.4 |
) |
(14.1 |
) |
|
Other revenue |
|
$ |
13.2 |
|
$ |
14.7 |
|
$ |
14.1 |
|
(10.2 |
) |
4.3 |
|
|
Logistics and Related Activities |
|
|
|
|
|
|
|
|
|
|
| |||
|
Total tons delivered |
|
0.9 |
|
5.1 |
|
5.1 |
|
(82.4 |
) |
— |
| |||
|
Asian export tons |
|
0.6 |
|
3.6 |
|
4.0 |
|
(83.3 |
) |
(10.0 |
) | |||
|
|
|
|
|
|
|
|
|
|
|
|
| |||
|
Revenue |
|
$ |
43.6 |
|
$ |
185.8 |
|
$ |
224.9 |
|
(76.5 |
) |
(17.4 |
) |
|
Other |
|
|
|
|
|
|
|
|
|
|
| |||
|
Revenue |
|
$ |
30.3 |
|
$ |
10.5 |
|
$ |
22.8 |
|
188.6 |
|
(53.9 |
) |
|
Eliminations of intersegment sales |
|
|
|
|
|
|
|
|
|
|
| |||
|
Revenue |
|
$ |
(12.1 |
) |
$ |
(46.8 |
) |
$ |
(55.7 |
) |
(74.1 |
) |
(16.0 |
) |
|
Total Consolidated |
|
|
|
|
|
|
|
|
|
|
| |||
|
Revenue |
|
$ |
800.4 |
|
$ |
1,124.1 |
|
$ |
1,324.0 |
|
(28.8 |
)% |
(15.1 |
)% |
Owned and Operated Mines Segment
The following table shows volume and price related changes to coal revenue at our Owned and Operated Mines (in millions):
|
Year ended December 31, 2014 |
|
$ |
1,117.9 |
|
|
Changes associated with volumes |
|
(140.9 |
) | |
|
Changes associated with prices |
|
(16.5 |
) | |
|
Year ended December 31, 2015 |
|
$ |
959.9 |
|
|
Changes associated with volumes |
|
(212.0 |
) | |
|
Changes associated with prices |
|
(22.8 |
) | |
|
Year ended December 31, 2016 |
|
$ |
725.4 |
|
Revenue decreased approximately 24% for the year ended December 31, 2016 compared to the year ended December 31, 2015 primarily due to fewer tons sold. Volumes decreased by approximately 22% as a result of the mild winter weather, low natural gas prices, and higher customer stockpiles. Realized prices decreased as the domestic coal market was depressed through much of the year.
Revenue decreased approximately 14% for the year ended December 31, 2015 compared to the year ended December 31, 2014 primarily due to lower volumes and lower realized prices. Volumes decreased by approximately 13% primarily as a result of reduced production at the Cordero Rojo Mine. Additionally, lower customer demand as stockpiles increased during the mild start to winter and lower natural gas prices also resulted in decreased volumes. Realized prices decreased as the domestic coal market declined.
Logistics and Related Activities Segment
Our Asian delivered sales are priced broadly in line with a number of relevant international coal indices adjusted for energy content and other quality and delivery criteria. These indices include the Newcastle benchmark price. Based on the comparative quality and transport costs, our delivered sales are generally priced at approximately 60% to 75% of the forward Newcastle price.
Revenue decreased approximately 77% for the year ended December 31, 2016 compared to the year ended December 31, 2015 due to continued weak international prices for seaborne thermal coal through much of the year. Although three vessels were carried over from 2015 into the first quarter of 2016, there were no further international shipments until the fourth quarter of 2016 when pricing started to recover and we were able to ship 0.4 million tons on three vessels.
Revenue decreased approximately 17% for the year ended December 31, 2015 compared to the year ended December 31, 2014 due to reduced Asian deliveries through the port. Weak international prices for seaborne thermal coal and decreased volumes both contributed to the decrease. Partially offsetting the decreased Asian revenue was an increase in revenue from domestic delivered deals for the year ended December 31, 2015 compared to the year ended December 31, 2014, primarily related to increased volumes.
Other
Revenue increased for the year ended December 31, 2016 compared to the year ended December 31, 2015 due to an increase of $21.2 million related to buyouts of customer coal contracts, partially offset by a decrease of $0.7 million in broker revenue.
Revenue decreased for the year ended December 31, 2015 compared to the year ended December 31, 2014 primarily due to the sale of the Decker Mine in September 2014. The decrease was partially offset by an increase of $4.8 million related to buyouts of customer coal contracts and an increase of $1.8 million in broker revenue.
Cost of Product Sold
The following table presents Cost of product sold (in millions except per ton amounts):
|
|
|
Year Ended |
|
|
|
|
| |||||||
|
|
|
December 31, |
|
Percent Change |
| |||||||||
|
|
|
2016 |
|
2015 |
|
2014 |
|
2016 vs 2015 |
|
2015 vs 2014 |
| |||
|
Owned and Operated Mines |
|
|
|
|
|
|
|
|
|
|
| |||
|
Average cost per ton sold |
|
$ |
9.75 |
|
$ |
9.81 |
|
$ |
10.19 |
|
(0.6 |
)% |
(3.7 |
)% |
|
|
|
|
|
|
|
|
|
|
|
|
| |||
|
Cost of product sold (produced coal) |
|
$ |
570.5 |
|
$ |
736.7 |
|
$ |
875.4 |
|
(22.6 |
) |
(15.8 |
) |
|
Other cost of product sold |
|
$ |
12.1 |
|
$ |
12.6 |
|
$ |
11.4 |
|
(4.0 |
) |
10.5 |
|
|
Logistics and Related Activities |
|
|
|
|
|
|
|
|
|
|
| |||
|
Cost of product sold |
|
$ |
72.6 |
|
$ |
243.3 |
|
$ |
242.0 |
|
(70.2 |
) |
0.5 |
|
|
Other |
|
|
|
|
|
|
|
|
|
|
| |||
|
Cost of product sold |
|
$ |
2.7 |
|
$ |
3.4 |
|
$ |
20.0 |
|
(20.6 |
) |
(83.0 |
) |
|
Eliminations of Intersegment Sales |
|
|
|
|
|
|
|
|
|
|
| |||
|
Cost of product sold |
|
$ |
(11.5 |
) |
$ |
(45.4 |
) |
$ |
(54.5 |
) |
74.7 |
|
16.7 |
|
|
Total Consolidated |
|
|
|
|
|
|
|
|
|
|
| |||
|
Cost of product sold |
|
$ |
646.4 |
|
$ |
950.6 |
|
$ |
1,094.3 |
|
(32.0 |
)% |
(13.1 |
)% |
Owned and Operated Mines Segment
Cost of product sold decreased for the year ended December 31, 2016 as compared to the year ended December 31, 2015 as a result of 16.6 million fewer tons of coal sold, which resulted in lower direct operating costs. We saw significant decreases in production taxes and royalties, repairs and maintenance, diesel costs, outside services and labor. Repairs and maintenance decreased $24.0 million due to lower equipment hours, condition monitoring, and in-house repairs completed at our rebuild center. Diesel costs were lower by $20.0 million as a result of lower fuel prices, combined with lower consumption from decreased fleet hours. Outside services decreased $14.5 million as a result of performing more work in-house rather than using contractors. Labor was lower by $14.4 million in part due to decreased headcount from the prior year related to our lower production.
Cost of product sold decreased for the year ended December 31, 2015 as compared to the year ended December 31, 2014 primarily as a result of 10.8 million fewer tons of coal sold, which resulted in lower direct operating costs. We also experienced a decrease of approximately $50 million in fuel costs resulting primarily from a reduction in fuel prices combined with lower consumption from decreased fleet hours compared to the year ended December 31, 2014. Repair parts and supplies decreased $16.5 million as a result of fewer fleet hours due to decreased production. The average cost per ton sold decreased as a result of the cost reductions discussed above, partially offset by attributing costs to fewer tons sold.
Logistics and Related Activities Segment
Cost of product sold decreased for the year ended December 31, 2016 as compared to the year ended December 31, 2015 due to a reduction in the volume of Asia tons delivered. Although three vessels were carried over from 2015 into the first quarter of 2016, there were no further international shipments until the fourth quarter of 2016, when pricing started to recover.
Cost of product sold increased slightly for the year ended December 31, 2015 as compared to the year ended December 31, 2014 despite the decrease in international shipments, primarily due to expenses incurred related to reducing the contracted minimum throughput commitments at Westshore for 2015. The cost increases were partially offset by decreased freight costs resulting from lower fuel surcharge.
Other
Cost of product sold was slightly lower for the year ended December 31, 2016 as compared to the year ended December 31, 2015 due to decreases in the cost of purchased coal for our broker deals.
Cost of product sold decreased for the year ended December 31, 2015 as compared to the year ended December 31, 2014 due to the sale of Decker Mine in September 2014.
Operating Income (Loss)
The following table presents Operating income (loss) (in millions):
|
|
|
Year Ended |
|
|
|
|
| |||||||
|
|
|
December 31, |
|
Percent Change |
| |||||||||
|
|
|
2016 |
|
2015 |
|
2014 |
|
2016 vs 2015 |
|
2015 vs 2014 |
| |||
|
Owned and Operated Mines |
|
|
|
|
|
|
|
|
|
|
| |||
|
Operating income (loss) |
|
$ |
125.5 |
|
$ |
89.0 |
|
$ |
109.9 |
|
41.0 |
% |
(19.0 |
)% |
|
Logistics and Related Activities |
|
|
|
|
|
|
|
|
|
|
| |||
|
Operating income (loss) |
|
$ |
(28.9 |
) |
$ |
(125.5 |
) |
$ |
4.2 |
|
77.0 |
|
* |
|
|
Other |
|
|
|
|
|
|
|
|
|
|
| |||
|
Operating income (loss) |
|
$ |
(28.7 |
) |
$ |
(43.5 |
) |
$ |
19.0 |
|
34.0 |
|
* |
|
|
Eliminations of Intersegment Sales |
|
|
|
|
|
|
|
|
|
|
| |||
|
Operating income (loss) |
|
$ |
(0.6 |
) |
$ |
(1.4 |
) |
$ |
(1.2 |
) |
57.1 |
|
(16.7 |
) |
|
Total Consolidated |
|
|
|
|
|
|
|
|
|
|
| |||
|
Operating income (loss) |
|
$ |
67.3 |
|
$ |
(81.4 |
) |
$ |
131.8 |
|
(182.7 |
)% |
(161.8 |
)% |
* Not meaningful
Owned and Operated Mines Segment
In addition to the revenue and cost of product sold factors previously discussed, the increase in operating income for the year ended December 31, 2016 as compared to the year ended December 31, 2015 was due to a $28.6 million reduction to reclamation asset depreciation related to a decrease in the ARO liability at all three mine sites. Additionally, we recognized mark-to-market gains on our domestic coal futures contracts and WTI derivative financial instruments of $8.1 million in 2016 as compared to losses of $24.6 million in 2015. Finally, 2015 included a goodwill impairment charge of $33.4 million compared to impairments of $2.6 million in 2016.
In addition to the revenue and cost of product sold factors previously discussed, the decrease in operating income for the year ended December 31, 2015 as compared to the year ended December 31, 2014 was due to the goodwill impairment charge of $33.4 million recognized during 2015. Additionally, we recognized mark-to-market losses of $24.6 million on our domestic coal futures contracts and WTI derivative financial instruments for the year ended December 31, 2015 as compared to losses of $13.6 million for the year ended December 31, 2014. These were partially offset by a credit to depreciation of $24.8 million associated with a decrease in the ARO liabilities at the Cordero Rojo and Spring Creek Mines and lower Depreciation and depletion for the year ended December 31, 2015 due to lower shipments as compared to the year ended December 31, 2014.
Logistics and Related Activities Segment
In addition to the revenue and cost of product sold factors previously discussed, the decrease in operating loss for the year ended December 31, 2016 as compared to the year ended December 31, 2015 was due to $6.1 million fewer derivative losses and decreased amortization of $3.7 million due to the impairment of port access rights for the year ended December 31, 2015.
In addition to the revenue and cost of product sold factors previously discussed, the decrease in operating income for the year ended December 31, 2015 as compared to the year ended December 31, 2014 was due to the impairment charge of $58.2 million recognized in the fourth quarter of 2015 on port access rights and our equity investment in GPT. In addition, there were lower gains on our international coal forward contracts and put options of $1.4 million for the year ended December 31, 2015 as compared to gains of $21.4 million for the year ended December 31, 2014. We also recognized $7.5 million of mark-to-market losses on our highway diesel derivatives for the year ended December 31, 2015 as compared to none in the year ended December 31, 2014. These decreases were offset by the recognition of $3.7 million of amortization related to port access rights during the year ended December 31, 2015 compared to none for the year ended December 31, 2014.
Other
In addition to the revenue and cost of product sold factors previously discussed, the decrease in operating loss for the year ended December 31, 2016 as compared to the year ended December 31, 2015 was partially offset by Debt restructuring of $4.7 million related to the exchange offers on our senior notes, an increase in SG&A costs of $1.9 million due to higher stock compensation and bonus accrual expense, and impairments of $2.0 million related to a shovel that we no longer expect to use because of declining production.
In addition to the revenue and cost of product sold factors previously discussed, the decrease in operating loss for the year ended December 31, 2015 as compared to the year ended December 31, 2014 was due to the gain recognized on the sale of the Decker Mine interest in 2014.
Other Income (Expense)
The following table presents Other income (expense) (in millions):
|
|
|
Year Ended |
|
|
|
|
| |||||||
|
|
|
December 31, |
|
Percent Change |
| |||||||||
|
|
|
2016 |
|
2015 |
|
2014 |
|
2016 vs 2015 |
|
2015 vs 2014 |
| |||
|
Other income (expense) |
|
$ |
(48.3 |
) |
$ |
(47.3 |
) |
$ |
(18.5 |
) |
(2.1 |
)% |
(155.7 |
)% |
Other expense for the year ended December 31, 2016 remained similar to the year ended December 31, 2015 as lower imputed interest on our federal coal lease obligations was partially offset by increased amortization of deferred financing costs due to the write-off of $1.3 million related to the decrease in the Credit Agreement’s borrowing capacity.
Other expense for the year ended December 31, 2015 increased as compared to the year ended December 31, 2014 primarily as a result of the 2014 acceleration and release agreement signed with Rio Tinto, which terminated the tax receivable agreement and resulted in a gain of $58.6 million in the year ended December 31, 2014. This was partially offset by a 2014 loss of $21.5 million related to the early retirement of debt and refinancing as well as lower interest expense of $8.1 million for the year ended December 31, 2015 compared to the year ended December 31, 2014 due to lower interest rates on our senior notes and lower imputed interest on our federal coal lease obligations as well as lower outstanding balances.
Income Tax Provision
The following table presents Income tax benefit (expense) (in millions):
|
|
|
Year Ended |
|
|
|
|
| |||||||
|
|
|
December 31, |
|
Percent Change |
| |||||||||
|
|
|
2016 |
|
2015 |
|
2014 |
|
2016 vs 2015 |
|
2015 vs 2014 |
| |||
|
Income tax benefit (expense) |
|
$ |
2.2 |
|
$ |
(77.4 |
) |
$ |
(34.9 |
) |
102.8 |
% |
(121.8 |
)% |
|
Effective tax rate |
|
(11.7 |
)% |
(60.1 |
)% |
30.8 |
% |
80.5 |
% |
(295.1 |
)% | |||
Our statutory income tax rate including state income taxes, for the years ended December 31, 2016, 2015, and 2014 was approximately 37%.
The difference between our statutory income tax rate and our effective income tax rate for the year ended December 31, 2016 is primarily the result of the change in valuation allowance to maintain the carrying amount of our deferred tax assets at zero. The difference between our statutory rate and the effective rate for the year ended December 31, 2015 was primarily the result of the increase to the valuation allowance to reduce the carrying amount of our deferred tax assets to zero. The difference between our statutory rate and the effective rate for the year ended December 31, 2014 was primarily related to the impact of percentage depletion and other items.
In December 2016, we received an assessment from ONRR related to royalties paid on coal sales to international customers during the period 2008 — 2011. We have appealed the Order and expect to prevail on the merits should the action move beyond our appeal, although there is inherent uncertainty in the litigation process and we cannot assure you that our appeal will be successful.
Liquidity and Capital Resources
|
|
|
Year Ended December 31, |
| |||||||
|
|
|
2016 |
|
2015 |
|
2014 |
| |||
|
|
|
(in millions) |
| |||||||
|
Cash and cash equivalents |
|
$ |
83.7 |
|
$ |
89.3 |
|
$ |
168.7 |
|
In addition to our cash and cash equivalents, our primary sources of liquidity are cash from our operations and borrowing capacity under our Credit Agreement and A/R Securitization Program. We also have a capital leasing program that could grow over time from its December 31, 2016 balance of $7.5 million for some of our capital equipment purchases subject to the conditions in the master lease agreement. These programs provide flexibility and liquidity to our capital structure.
Cash balances depend on a number of factors, such as the volume of coal sold by our Owned and Operated Mines segment; the price for which we sell our coal; the costs of mining, including labor, repairs and maintenance, fuel and explosives; the amount of royalties, severance taxes, and other governmental levies that we pay; capital expenditures to acquire property, plant and equipment; the volume of deliveries coordinated by our Logistics and Related Activities segment to customer contracted destinations; the revenue we receive for our logistics services; demurrage and any take-or-pay charges; the results of our derivative financial instruments; coal-fired electricity demand, regulatory changes and energy policies impacting our business; and other risks and uncertainties, including those discussed in Item 1A “Risk Factors.” Ongoing depressed industry conditions and recent coal producer bankruptcy filings have resulted in increased credit pressures on the coal industry. Any credit demands by third parties or refusals by banks, surety bond providers, investors or others to extend, renew or refinance credit on commercially reasonable terms may adversely impact our business, financial condition, results of operations, cash flows and liquidity.
Capital expenditures are necessary to keep our equipment fleets updated to maintain our mining productivity and competitive position and to add new equipment as necessary. Capital expenditures (excluding capitalized interest) for the years ended December 31, 2016, 2015 and 2014 were $33.6 million, $37.7 million, and $18.7 million, respectively. Our anticipated capital expenditures are expected to be between $20 million and $30 million in 2017, which we plan to fund through cash from operations.
Overview of Cash Transactions
We started 2016 with cash and cash equivalents of $89.3 million and concluded the year ended December 31, 2016 with $83.7 million. The primary reasons for the decrease were capital expenditures of $33.6 million and the cash payment related to the restructuring of the 2019 Notes and 2014 Notes (as defined below) of $18.3 million, partially offset by cash provided by operating activities of $48.7 million.
Cash Flows
|
|
|
Year Ended December 31, |
| |||||||
|
|
|
2016 |
|
2015 |
|
2014 |
| |||
|
|
|
(in millions) |
| |||||||
|
Beginning balance - cash and cash equivalents |
|
$ |
89.3 |
|
$ |
168.7 |
|
$ |
231.6 |
|
|
Net cash provided by operating activities |
|
48.7 |
|
41.6 |
|
98.2 |
| |||
|
Net cash provided by (used in) investing activities |
|
(25.3 |
) |
(55.0 |
) |
13.4 |
| |||
|
Net cash used in financing activities |
|
(29.0 |
) |
(66.0 |
) |
(174.4 |
) | |||
|
Ending balance - cash and cash equivalents |
|
$ |
83.7 |
|
$ |
89.3 |
|
$ |
168.7 |
|
The increase in cash provided by operating activities from 2015 to 2016 was primarily due to an increase in net income as adjusted for noncash items due to lower operating costs partially offset by a decrease in working capital, including $30.5 million in payments to Westshore and BNSF related to our amended logistics agreements.
The decrease in cash provided by operating activities from 2014 to 2015 was primarily due to a decrease in net income as adjusted for noncash items due to lower realized prices and fewer tons sold, and a decrease in working capital, including $37.5 million in payments to Westshore and BNSF to amend our logistics agreements.
The decrease in cash used in investing activities from 2015 to 2016 was primarily related to the 2016 release of $8.5 million of restricted cash held in an escrow account with Westshore as a result of the 2016 amendment of the throughput agreement compared to a $6.5 million payment of restricted cash in 2015. In addition, we made no capital contributions to GPT in 2016, compared to $6.6 million of contributions in 2015. There was a decrease in the purchases of property, plant and equipment of $4.0 million and a decrease of $2.2 million related to port access contract rights from 2015 to 2016. Finally, we received $2.8 million in 2016 related to an insurance settlement on a flood at our Cordero Rojo Mine in 2014.
The increase in cash used in investing activities from 2014 to 2015 was primarily related to the net redemption of investments in marketable securities of $80.7 million in 2014, a $6.5 million payment of restricted cash in 2015 used to fund an escrow account associated with our increased Westshore capacity, and $6.6 million in capital contributions to GPT. In addition, purchases of property, plant and equipment increased by $19.0 million in 2015 as compared to 2014, primarily as a result of relocating a dragline from our Cordero Rojo Mine to our Antelope Mine. This was partially offset by a $37.1 million investment in port access rights in 2014.
The decrease in cash used in financing activities from 2015 to 2016 was primarily due to the final federal coal lease payment of $64.0 million in 2015 partially offset by the payment of $18.3 million of cash premium related to the Exchange Offers and the issuance of the 2021 Notes (each as defined below).
The decrease in cash used in financing activities from 2014 to 2015 was primarily due to the net repayment and issuance of senior notes of $100 million and additional deferred financing costs of $14.7 million that occurred in 2014.
Senior Notes
On October 17, 2016, our direct and indirect wholly-owned subsidiaries, CPE Resources and Cloud Peak Energy Finance Corp. (collectively, the “Issuers”), completed offers to exchange (the “Exchange Offers”) up to $400 million aggregate principal amount of their outstanding $300 million aggregate principal balance of 8.50% Senior Notes due 2019 (the “2019 Notes”) and $200 million aggregate principal balance of 6.375% Senior Notes due 2024 (the “2024 Notes”, together with the 2019 Notes, the “Old Notes”) for new 12.00% Second Lien Senior Secured Notes due 2021 to be issued by the Issuers (the “2021 Notes”) and, in some cases, cash consideration, subject to the terms and conditions of the Exchange Offers. The primary purposes of the Exchange Offers were to extend the maturity of the 2019 Notes to November 2021, to reduce leverage by capturing the trading discounts on the Old Notes and to further our ongoing efforts to provide sufficient liquidity to manage through depressed industry conditions and better position the capital structure to help facilitate a future extension of the Credit Agreement or new bank facility or other line of credit before the Credit Agreement terminates in February 2019.
Holders of $237.9 million aggregate principal amount of the 2019 Notes and $143.6 million aggregate principal amount of the 2024 Notes tendered such notes pursuant to the Exchange Offers. On October 17, 2016, the Issuers accepted for exchange all such Old Notes validly tendered, issued $290.4 million aggregate principal amount of 2021 Notes, and made cash payments of $26.0 million in the aggregate (including $7.7 million in accrued and unpaid interest) to tendering holders of the Old Notes. The transaction resulted in recognition of $4.7 million in expenses for the year ended December 31, 2016. Upon completion of the Exchange Offers, $62.1 million aggregate principal amount of the 2019 Notes and $56.4 million aggregate principal amount of the 2024 Notes remain outstanding.
The exchanges of the Old Notes for the 2021 Notes were accounted for as a troubled debt restructuring. As the future cash flows of the 2021 Notes were greater than the carrying amount of the Old Notes, no gain was recognized. The amount of extinguished debt will be amortized over the remaining life of the 2021 Notes using the effective interest method and recognized as a reduction of interest expense. The effective interest rate of the 2021 Notes is 6.46% compared to the stated rate of 12.00%. As a result, our reported interest expense will be significantly less than the contractual cash interest payments throughout the term of the 2021 Notes. Our current tax attributes are expected to offset any cash tax impacts from the Exchange Offers.
We refer to the 2019 Notes, the 2021 Notes, and the 2024 Notes collectively as the “senior notes.” The 2019 Notes, 2021 Notes, and 2024 Notes bear interest at fixed annual rates of 8.50%, 12.00%, and 6.375%, respectively. There are no mandatory redemption or sinking fund payments for the senior notes. Interest payments are due semi-annually on June 15 and December 15 for the 2019 Notes, due semi-annually on May 1 and November 1 for the 2021 Notes, and due semi-annually on March 15 and September 15 for the 2024 Notes. Subject to certain limitations, we may redeem the 2019 Notes by paying specified redemption prices in excess of their principal amount prior to December 15, 2017, or by paying their principal amount thereafter, plus accrued and unpaid interest, if any. We may also redeem some or all of the 2021 Notes by paying specified redemption prices in excess of their principal amount, plus accrued and unpaid interest, if any, prior to
November 1, 2020, or by paying their principal amount thereafter, plus accrued and unpaid interest, if any. Lastly, we may redeem some or all of the 2024 Notes by paying specified redemption prices in excess of their principal amount, plus accrued and unpaid interest, if any, prior to March 15, 2022, or by paying their principal amount thereafter, plus accrued and unpaid interest, if any.
The 2021 Notes and 2024 Notes are jointly and severally guaranteed by CPE Inc. and by all of our existing and future domestic restricted subsidiaries that guarantee our debt under our Credit Agreement. The 2019 Notes are jointly and severally guaranteed by CPE Inc. and by all of our existing and future restricted subsidiaries that guarantee our debt under our Credit Agreement. See “—Credit Agreement” below. Substantially all of our current consolidated subsidiaries, excluding Cloud Peak Energy Receivables LLC, are considered to be restricted subsidiaries and guarantee the senior notes. The 2021 Notes are secured by second-priority liens on substantially all of our assets.
The indentures governing the senior notes, among other things, limit our ability and the ability of our restricted subsidiaries to incur additional indebtedness and issue preferred equity; pay dividends or distributions; repurchase equity or repay subordinated indebtedness; make investments or certain other restricted payments; create liens; sell assets; enter into agreements that restrict dividends, distributions, or other payments from restricted subsidiaries; enter into transactions with affiliates; and consolidate, merge, or transfer all or substantially all of their assets and the assets of their restricted subsidiaries on a combined basis.
Upon the occurrence of certain transactions constituting a “change in control” as defined in the indentures, holders of our senior notes could require us to repurchase all outstanding senior notes at 101% of the principal amount thereof, plus accrued and unpaid interest, if any, to the date of repurchase.
On March 11, 2014, the Issuers issued the 2024 Notes, of which the net proceeds were used to fund a portion of the Issuers’ tender offer and consent solicitation for the Issuers’ previously existing 8.25% Senior Notes due 2017 (“2017 Notes”). When we retired the 2017 Notes, we recognized a loss on early retirement of debt of $19.3 million, which was comprised of $13.8 million related to the premium paid in excess of par, $5.1 million related to the write-off of deferred financing costs and original issue discount, and $0.4 million in related expenses. The loss is classified in Interest expense.
A/R Securitization Program
In January 2013, we formed Cloud Peak Energy Receivables LLC, a special purpose, bankruptcy-remote wholly-owned subsidiary, to purchase, subject to certain exclusions, in a true sale, trade receivables generated by certain of our subsidiaries without recourse (other than customary indemnification obligations for breaches of specific representations and warranties), and then transfer undivided interests of those accounts receivable to a financial institution for cash borrowings for our ultimate benefit. On February 11, 2013, we executed the A/R Securitization Program with a committed capacity of up to $75 million, which was due to expire on February 11, 2015. The total borrowings are limited by eligible accounts receivable, as defined under the terms of the A/R Securitization Program. On January 23, 2015, we entered into an agreement extending the term of the A/R Securitization Program to January 23, 2018. On January 31, 2017, the A/R Securitization Program was amended to extend the term of the A/R Securitization Program to January 23, 2020, allow for the ability to issue letters of credit, and revise the maximum combined borrowing capacity for both cash and letters of credit to $70 million. All other terms of the program remained substantially the same. As of December 31, 2016, the A/R Securitization Program would have allowed for $24 million of borrowing capacity. There were no borrowings outstanding from the A/R Securitization Program as of December 31, 2016.
Credit Agreement
On February 21, 2014, CPE Resources entered into a five-year Credit Agreement with PNC Bank, National Association, as administrative agent, and a syndicate of lenders, which was amended on September 5, 2014 and September 9, 2016 (as amended, the “Credit Agreement”). The Credit Agreement provides us with a senior secured revolving credit facility with a capacity of up to $400 million that can be used to borrow funds or obtain letters of credit. The borrowing capacity under the Credit Agreement is reduced by the undrawn face amount of letters of credit issued and outstanding, which may be up to $250 million at any time.
On September 9, 2016, we entered into a Second Amendment to the Credit Agreement (the “Second Amendment”), which replaced the quarterly EBITDA-based financial covenants that previously required us to (a) maintain defined minimum levels of interest coverage and (b) comply with a maximum net secured debt leverage ratio. These financial covenants were replaced with a new monthly minimum liquidity covenant that requires us to maintain liquidity, as defined in the Credit Agreement, of not less than $125 million as of the last day of each month. The Second Amendment reduced the maximum
borrowing capacity under the Credit Agreement to $400 million, from the previous maximum capacity of $500 million. It also revised the permitted debt covenant and permitted lien covenant to allow the issuance of second lien debt in an amount up to $350 million. Additionally, it revised various negative covenants and baskets that would apply to, among other things, the incurrence of debt, making investments, asset dispositions and restricted payments. Lastly, it established a requirement for deposit account control agreements with the administrative agent for certain of our deposit accounts. The Second Amendment did not change the maturity of the Credit Agreement, which remains February 21, 2019.
The Credit Agreement also contains other non-financial covenants, including covenants related to our ability to incur additional debt or take other corporate actions. The Credit Agreement contains customary events of default with customary grace periods and thresholds. Our ability to access the available funds under the Credit Agreement may be prohibited in the event that we do not comply with the covenant requirements or if we default on our obligations under the Credit Agreement.
Loans under the Credit Agreement bear interest at the London Interbank Offered Rate (“LIBOR”) plus an applicable margin of 3.50%. We pay the lenders a commitment fee of 0.50% per year on the unused amount of the Credit Agreement. Letters of credit issued under the Credit Agreement, unless drawn upon, will incur a per annum fee from the date at which they are issued of 3.50%. Letters of credit that are drawn upon may be converted to loans at our request, subject to the conditions to borrowing set forth in the Credit Agreement. In addition, in connection with the issuance of a letter of credit, we are required to pay the issuing bank a fronting fee of 0.125% per annum.
As of December 31, 2016, we had no borrowings and the undrawn face amount of letters of credit outstanding under the Credit Agreement was $67.5 million. As of December 31, 2015, there were no borrowings or letters of credit outstanding under the Credit Agreement. We were in compliance with the covenants contained in the Credit Agreement as of December 31, 2016 and December 31, 2015.
Liquidity
Our aggregate availability for borrowing under the Credit Agreement and the A/R Securitization Program was approximately $356.5 million as of December 31, 2016. Our total liquidity, which includes cash and cash equivalents and amounts available under both our Credit Agreement and the A/R Securitization Program, was $440.2 million as of December 31, 2016.
We believe our sources of liquidity will be sufficient to fund our primary ordinary course uses of cash for the next twelve months, which include our costs of coal production and logistics services, capital expenditures, and interest on our debt.
If we do not have sufficient resources from ongoing operations to satisfy our obligations or the timing of payments on our obligations does not coincide with cash inflows from operations, we may need to use our cash on hand or borrow under our Credit Agreement or our A/R Securitization Program. If the obligation is in excess of these amounts, we may need to seek additional borrowing sources or take other actions. Depending upon existing circumstances at the time, we may not be able to obtain additional funding on acceptable terms or at all. In addition, our existing debt instruments contain restrictive covenants, which may prohibit us from borrowing under our Credit Agreement or pursuing certain alternatives to obtain additional funding.
We regularly monitor the capital and bank credit markets for opportunities that we believe will improve our balance sheet, and may engage, from time to time, in financing or refinancing transactions as market conditions permit. Future activities may include, but are not limited to, public or private debt or equity offerings, the purchase of our outstanding debt for cash in open market purchases or privately negotiated refinancing, extension and exchange transactions or public or private exchange offers or tender offers. Any financing or refinancing transaction may occur on a stand-alone basis or in connection with, or immediately following, other transactions. Our ability to access the debt or equity capital markets on economic terms in the future will be affected by general economic conditions, the domestic and global financial markets, our operational and financial performance, the value and performance of our debt or equity securities, prevailing commodity prices and other macroeconomic factors outside of our control.
Off-Balance Sheet Arrangements
In the normal course of business, we are party to a number of arrangements that secure our performance under certain legal obligations. These arrangements include letters of credit and surety bonds. We use these arrangements primarily to comply with federal and state laws that require us to secure the performance of certain long-term obligations,
such as mine closure or reclamation costs, coal lease obligations, state workers’ compensation, and federal black lung liabilities. These arrangements are typically renewable annually. Liabilities related to these arrangements are not reflected in our Consolidated Balance Sheets.
As of December 31, we used surety bonds and self-bonding to secure outstanding obligations as follows (in millions):
|
|
|
2016 |
|
2015 |
| ||
|
Reclamation obligations - surety bonds (1) |
|
$ |
418.2 |
|
$ |
394.9 |
|
|
Reclamation obligations - self-bonding (1) |
|
10.0 |
|
200.0 |
| ||
|
Lease obligations (2) |
|
29.7 |
|
38.4 |
| ||
|
Other obligations (3) |
|
0.5 |
|
0.6 |
| ||
|
Total off-balance sheet obligations |
|
$ |
458.4 |
|
$ |
633.9 |
|
(1) Reclamation obligations include amounts to secure performance related to our outstanding obligations to reclaim areas disturbed by our mining activities and are a requirement under our state mining permits.
(2) Lease obligations include amounts generally required as a condition to state or federal coal leases; the amounts vary and are mandated by the governing agency.
(3) Other obligations include amounts required for exploration permits, water well construction and monitoring, exporting, and other miscellaneous items as mandated by applicable governing agencies.
Our outstanding surety bonds in respect of our reclamation, lease, and other obligations were $448.4 million as of December 31, 2016 and are required by law. In addition, we were self-bonded for $10 million related to our reclamation obligations in the State of Wyoming. Recently, there has been heightened regulatory pressure on reclamation bonding and self-bonding in particular. In January 2016, the federal OSMRE sent Ten-Day Notices to the Wyoming Department of Environmental Quality regarding self-bonding of certain other coal companies who have filed for bankruptcy. In its notices, OSMRE asserted that a violation of the Wyoming approved state program may exist by allowing the specified companies to continue mining without sufficient reclamation bonding in place. State statutes regulate and determine the calculation of the amounts of the bonds that we are required to hold. We do not believe that these state-mandated estimates are a true reflection of what our actual reclamation costs will be. Reclamation bond amounts represent an estimate of the near-term reclamation liability that assumes reclamation activities will be performed by a third party during the next one to five years. Because this evaluation is near-term, it is recalculated on a frequent basis, often annually. The basis for calculating bond requirements is substantially different than the requirements that apply to the determination of our asset retirement obligation (“ARO”) liability in our Consolidated Balance Sheets, which is determined in accordance with U.S. GAAP. The state calculates our specific bond requirements considering assumed costs that the state would incur if they were required to complete the reclamation on our behalf. Additionally, where a multi-year bond, such as a three to five-year bond, is put into place, the state regulatory authority requires that the reclamation liability be calculated for the highest cost scenario over that period.
The carrying amount of our reclamation obligations, as determined in accordance with U.S. GAAP, which are reported in our Consolidated Balance Sheets as ARO liabilities, was $98.2 million as of December 31, 2016, $1.1 million of which is classified as a current liability. We estimate our ARO liabilities based on disturbed acreage to date and the estimated cost of a third party to perform the work. The estimated ARO liabilities are based on engineering studies and our engineering expertise related to the reclamation requirements. We assume that reclamation will be completed after the end of the mine life based on our current reclamation area profiles, which may be a different land disturbance assumption than the state requires, as we generally perform reclamation concurrently with our mining activities. Finally, the carrying amount of our ARO liabilities reflects discounting of estimated reclamation costs using credit-adjusted, risk-free rates. For a discussion of the risks relating to our reclamation obligations, see Item 1A “Risk Factors—Risks Related to Our Business and Industry—If the assumptions underlying our reclamation and mine closure obligations are materially inaccurate, our costs could be significantly greater than anticipated.”
Because we are required by state and federal law to have these bonds or letters of credit in place before mining can commence, or continue, our failure to maintain surety bonds, letters of credit, or other guarantees or security arrangements would materially adversely affect our ability to mine or lease coal. That failure could result from a variety of factors including lack of availability, higher expense or unfavorable market terms, the exercise by third-party surety bond issuers of their right to refuse to renew the surety and restrictions on availability of collateral for current and future third-party surety bond issuers under the terms of any credit facility then in place. For a discussion of the risks relating to our surety bonds, see Item 1A “Risk Factors—Risks Related to Our Business and Industry—Failure to maintain our surety bonds on acceptable
terms could affect our ability to secure reclamation and coal lease obligations and materially adversely affect our ability to mine or lease coal.” See Note 19 of Notes to Consolidated Financial Statements in Item 8.
Contractual Obligations
As of December 31, 2016, we had the following contractual obligations (in millions):
|
|
|
|
|
|
|
|
|
|
|
2022 and |
| |||||
|
|
|
Total |
|
2017 |
|
2018-2019 |
|
2020-2021 |
|
Thereafter |
| |||||
|
Transportation obligations (1)(2) |
|
$ |
127.1 |
|
$ |
27.4 |
|
$ |
79.7 |
|
$ |
20.0 |
|
$ |
— |
|
|
Senior notes and Credit Agreement (3) |
|
408.9 |
|
— |
|
62.1 |
|
290.4 |
|
56.4 |
| |||||
|
Interest related to long-term obligations (4) |
|
218.5 |
|
45.2 |
|
87.4 |
|
76.9 |
|
9.0 |
| |||||
|
Operating and capital lease obligations |
|
12.5 |
|
3.7 |
|
6.2 |
|
2.2 |
|
0.4 |
| |||||
|
Coal purchase obligations |
|
4.2 |
|
4.2 |
|
— |
|
— |
|
— |
| |||||
|
Capital expenditure obligations |
|
3.2 |
|
3.2 |
|
— |
|
— |
|
— |
| |||||
|
Total |
|
$ |
774.4 |
|
$ |
83.7 |
|
$ |
235.4 |
|
$ |
389.5 |
|
$ |
65.8 |
|
(1) Includes undiscounted port take-or-pay commitments as agreed to in the fourth quarter of 2016 for 2017-2018. The new agreement does not contain any commitments subsequent to the end of 2018, unless we elect to exercise an option to extend the agreement through 2019. We have the right to terminate our commitments for 2017 and 2018 at any time in exchange for a buyout payment. All prior agreements, including the previous take-or-pay commitments through 2024, have been terminated. These amounts when paid under the new agreement are considered minimum payments on services. The per tonne loading charges through 2018 reflect these advance payments.
(2) Includes undiscounted rail take-or-pay commitments if we exercise our contractual buyout option in 2019, which requires one year’s notice plus a lump sum payment. Reflects the 2016-2018 amendment entered in the fourth quarter of 2015. Assumes we do not ship any export tons, and does not include transportation or other charges based on any actual shipments. The full term of the agreement continues through 2024. Assuming we did not exercise our buyout option in 2019 and did not meet minimum shipment requirements, we would owe additional take-or-pay amounts through the remaining term of the agreement.
(3) In October 2016, CPE Resources completed offers to exchange a portion of its 2019 Notes and 2024 Notes for 2021 Notes, resulting in $408.9 million aggregate principal amount of senior notes outstanding, a decrease from the $500 million aggregate principal amount previously owed. CPE Resources is a party to a $400 million Credit Agreement, under which there were no borrowings outstanding as of December 31, 2016. See Notes 13 and 14 of Notes to Consolidated Financial Statements in Item 8.
(4) As of December 31, 2016, we had outstanding commitments for interest related to our senior notes. See Note 13 of Notes to Consolidated Financial Statements in Item 8.
In 2016 and early 2017, we made considerable progress toward decreasing our contractual obligations. As shown in the following table, we have 1) renegotiated our contracts with Westshore and BNSF, and 2) completed exchange offers for our senior notes. See Notes 10 and 13 of Notes to Consolidated Financial Statements in Item 8 for further details.
|
|
|
December 31, |
|
2016 Change |
|
Post |
| |||
|
|
|
Total (1) |
|
Event |
|
Total (2) |
| |||
|
Transportation obligations (3)(4) |
|
$ |
549.0 |
|
$ |
(488.0 |
) |
$ |
61.0 |
|
|
Senior notes and Credit Agreement |
|
500.0 |
|
(91.1 |
) |
408.9 |
| |||
|
Interest related to long-term obligations |
|
210.4 |
|
8.1 |
|
218.5 |
| |||
|
Operating and capital lease obligations |
|
11.7 |
|
0.8 |
|
12.5 |
| |||
|
Coal purchase obligations |
|
— |
|
4.2 |
|
4.2 |
| |||
|
Capital expenditure obligations |
|
33.9 |
|
(30.7 |
) |
3.2 |
| |||
|
Total |
|
$ |
1,305.0 |
|
$ |
(596.7 |
) |
$ |
708.3 |
|
(1) Represents amounts disclosed in the December 31, 2015 Form 10-K.
(2) Reflects amounts as of December 31, 2016 disclosed above, as adjusted for the termination of our previous agreement with BNSF and the new agreement effective April 2017.
(3) As of December 31, 2015, includes previous undiscounted port take-or-pay commitments through the remaining term of the agreement in 2024. Reflects the 2016-2018 amendment entered in the fourth quarter of 2015. Assumes we do not ship any export tons, and does not include throughput or other charges based on any actual shipments. As of December 31, 2016, includes undiscounted port take-or-pay commitments as agreed to in the fourth quarter of 2016 for 2017-2018. The new agreement does not contain any commitments subsequent to the end of 2018, unless we elect to exercise an option to extend the agreement through 2019. We have the right to terminate our commitments for 2017 and 2018 at any time in exchange for a buyout payment. All prior agreements, including the previous take-or-pay commitments through 2024, have been terminated. These amounts when paid under the new agreement are considered minimum payments on services. The per tonne loading charges through 2018 reflect these advance payments.
(4) As of December 31, 2015, includes previous applicable undiscounted rail take-or-pay commitments if we exercise our contractual buyout option in 2019, which required one year’s notice plus a lump sum payment. Reflects the previous 2016-2018 amendment entered in the fourth quarter of 2015. Assumes we do not ship any export tons, and does not include transportation or other charges based on any actual shipments. Assuming we did not exercise our buyout option in 2019 and did not meet minimum shipment requirements, we would have owed additional take-or-pay amounts through the remaining term of the agreement. In February, 2017 the previous rail agreement was terminated and a new agreement reached. The new agreement does not contain any commitments subsequent to the end of 2018, unless the parties agree to extend the agreement. We have the right to terminate our commitments for 2017 and 2018 at any time in exchange for a buyout payment. If we do not meet the required portion of our nominated tons, there would be incremental liquidated damages due under the new agreement.
Neither of the above tables includes our estimated AROs. As discussed in “Critical Accounting Policies and Estimates—Asset Retirement Obligations” below, the current and noncurrent carrying amount of our AROs involves a number of estimates, including the amount and timing of the payments to satisfy these obligations. The timing of payments is based on numerous factors, including projected mine closing dates. Based on our assumptions, the carrying amount of our AROs (excluding concurrent reclamation and amounts due in the current period) as determined in accordance with U.S. GAAP was $97.0 million as of December 31, 2016. See Note 16 of Notes to Consolidated Financial Statements in Item 8.
Critical Accounting Policies and Estimates
The preparation of consolidated financial statements and related disclosures in accordance with U.S. GAAP requires us to make judgments, estimates, and assumptions that affect the reported amounts of assets, liabilities, and revenue and expenses, as well as the disclosure of contingent assets and liabilities. We base our judgments, estimates, and assumptions on historical information and other known factors that we deem relevant. Estimates are inherently subjective, as significant management judgment is required regarding the assumptions utilized to calculate accounting estimates in our consolidated financial statements, including the notes thereto. Actual results could differ materially from the amounts reported based on variability in factors affecting these consolidated financial statements. Our significant accounting policies are described in Note 3 of Notes to Consolidated Financial Statements in Item 8. This section describes those accounting policies and estimates that we believe are critical to understanding our consolidated financial statements.
Revenue Recognition
We recognize revenue from a sale when persuasive evidence of an arrangement exists, the price is determinable, the product has been delivered, title has transferred to the customer and collection of the sales price is reasonably assured. Some coal sales agreements provide for price adjustments based on variations in quality characteristics of the coal shipped. In certain cases, a customer’s analysis of the coal quality is binding and the results of the analysis are received on a delayed basis. In these cases, we estimate the amount of the quality adjustment and adjust the estimate to actual when the information is provided by the customer. Historically, such adjustments have not been material.
Impairment of Long-Lived Assets
The carrying amounts of our mineral properties, equipment, port access rights, and other long-lived assets are sensitive to declines in domestic and international coal prices. The cash flow models that we use to assess impairment includes numerous assumptions such as our current estimates of forecast coal production, management’s outlook on forward commodity prices, operating and development costs, and discount rates. If prices remain at current levels for an extended period of time or do not recover as anticipated, if regulatory changes adversely impact coal-fired electricity generation, or if
we receive an unfavorable outcome of the litigation described in Note 19, we may incur impairment charges on certain of these assets.
We evaluate the recoverability of our long-lived assets when events or changes in circumstances indicate that the carrying amount of property, plant and equipment may not be recovered over its remaining service life. An asset impairment charge is recognized when the sum of estimated future cash flows associated with the operation and disposal of the asset, on an undiscounted basis, is less than the carrying amount of the asset. An impairment charge is measured as the amount by which the carrying amount of the asset exceeds its fair value. Fair value is measured using discounted cash flows based on estimates of coal reserves, coal prices, operating expenses, and capital costs or by reference to observable comparable transaction or replacement cost data. See Note 9 of Notes to Consolidated Financial Statements in Item 8 for a description of recent impairments of our long-lived assets.
Asset Retirement Obligations
Our AROs arise from the SMCRA and similar state statutes. These regulations require that we, upon closure of a mine, restore the mine property in accordance with an approved reclamation plan issued in conjunction with our mining permit.
Our AROs are recorded when a mine site is disturbed by mining activities and as the extent of disturbance increases. AROs reflect costs associated with legally required mine reclamation and closure activities, including earthwork, vegetation, and demolition and are estimated based upon detailed engineering calculations of the amount and timing of the future cash spending for a third party to perform the required work. Spending estimates are adjusted for estimated inflation and discounted at credit-adjusted, risk-free rates to arrive at a present value of estimated future reclamation costs. Upon initial recognition of the ARO, a corresponding amount is capitalized as part of the carrying value of the related long-lived asset. As changes in estimates occur (such as changes in estimated costs or timing of reclamation activities resulting from mine plan revisions or new LBAs), the ARO liability and related asset are adjusted to reflect the updated estimates. If a reduction of the ARO exceeds the carrying amount of the related asset retirement cost, the adjustment is recorded as a reduction of Depreciation and depletion. Annually, we analyze AROs on a mine-by-mine basis and, if necessary, adjust the balance to take into account any changes in estimates. In addition, on an interim basis, we may update the liability based on significant changes to the life of mine.
Seasonality
Our customers generally respond to seasonal variations in electricity demand based upon the number of heating degree days and cooling degree days. Due to utility stockpile management, our coal sales do not experience the same direct seasonal volatility; however, extended mild weather patterns can materially and adversely impact the demand and pricing for our coal. In addition, mild weather can reduce demand and therefore, the price for natural gas, which can displace coal in electricity generation. Our sales typically benefit from decreases in customers’ stockpiles due to high electricity demand. Conversely, when these stockpiles increase, demand and pricing for our coal will typically soften. Further, our ability to deliver coal is impacted by the seasons. For example, in the spring and summer of 2011, the Midwest region experienced severe flooding which disrupted rail service to mines in the PRB and affected the ability of those customers who were impacted by the flooding to take coal deliveries. Some scientists have opined that increasing concentrations of GHGs in the earth’s atmosphere may produce climate changes, which increase the frequency and severity of storms, droughts and floods and other climatic events. If any such effects were to occur in areas where we or our clients operate, they could have an adverse effect on our assets and operations.
Global Climate Change
Enactment of current, proposed, or future laws or regulations regarding emissions from the combustion of coal by the U.S. or some of its states or by other countries, or other actions to limit such emissions, like the creation of mandatory use requirements for renewable fuel sources, will likely result in electricity generators further switching from coal to other fuel sources. Public concern and the political environment may also continue to materially and adversely impact future coal demand and usage to generate electricity, regardless of applicable legal and regulatory requirements. Additionally, the creation and issuance of subsidies designed to encourage use of alternative energy sources could further decrease the demand of coal as an energy source. The potential financial impact on us as a result of these factors will depend upon the degree to which electricity generators diminish their reliance on coal as a fuel source as a result thereof. That, in turn, will depend on a number of factors, including the appeal and design of the subsidies being offered, the specific requirements imposed by any such laws or regulations such as mandating use by utilities of renewable fuel sources, the time periods over which those laws or regulations would be phased in and the state of commercial development and deployment of carbon capture technologies,
including storage, conversion, or other commercial use for captured carbon. In view of the significant uncertainty surrounding each of these factors, it is not possible for us to reasonably predict the impact that any such laws or regulations may have on our results of operations, financial condition or cash flows. However, such impacts may be significant. See Item 1 “Business—Environmental and Other Regulatory Matters—Global Climate Change” and Item 1A “Risk Factors” for additional discussion regarding how climate change and other environmental regulatory matters may materially adversely impact our business.
Newly Adopted Accounting Standards and Recently Issued Accounting Pronouncements
See Note 3 of Notes to Consolidated Financial Statements in Item 8 for a discussion of newly adopted accounting standards and recently issued accounting pronouncements.
Non-GAAP Financial Measures
EBITDA and Adjusted EBITDA are intended to provide additional information only and do not have any standard meaning prescribed by U.S. GAAP. A quantitative reconciliation of historical net income (loss) to Adjusted EBITDA is found in the tables below.
EBITDA represents net income (loss) before: (1) interest income (expense) net, (2) income tax provision, (3) depreciation and depletion, and (4) amortization. Adjusted EBITDA represents EBITDA as further adjusted for accretion, which represents non-cash increases in asset retirement obligation liabilities resulting from the passage of time, and specifically identified items that management believes do not directly reflect our core operations. For the periods presented herein, the specifically identified items are: (1) adjustments to exclude the changes in the Tax Receivable Agreement, (2) adjustments for derivative financial instruments, excluding fair value mark-to-market gains or losses and including cash amounts received or paid, (3) adjustments to exclude non-cash impairment charges, (4) adjustments to exclude debt restructuring costs, and (5) adjustments to exclude the gain from the sale of our 50% non-operating interest in the Decker Mine in September 2014. We enter into certain derivative financial instruments such as put options that require the payment of premiums at contract inception. The reduction in the premium value over time is reflected in the mark-to-market gains or losses. Our calculation of Adjusted EBITDA does not include premiums paid for derivative financial instruments; either at contract inception, as these payments pertain to future settlement periods, or in the period of contract settlement, as the payment occurred in a preceding period. Because of the inherent uncertainty related to the items identified above, management does not believe it is able to provide a meaningful forecast of the comparable U.S. GAAP measures or reconciliation to any forecasted U.S. GAAP measure.
Adjusted EBITDA is an additional tool intended to assist our management in comparing our performance on a consistent basis for purposes of business decision making by removing the impact of certain items that management believes do not directly reflect our core operations. Adjusted EBITDA is a metric intended to assist management in evaluating operating performance, comparing performance across periods, planning and forecasting future business operations and helping determine levels of operating and capital investments. Period-to-period comparisons of Adjusted EBITDA are intended to help our management identify and assess additional trends potentially impacting our company that may not be shown solely by period-to-period comparisons of net income (loss). Consolidated Adjusted EBITDA is also used as part of our incentive compensation program for our executive officers and others.
We believe Adjusted EBITDA is also useful to investors, analysts and other external users of our consolidated financial statements in evaluating our operating performance from period to period and comparing our performance to similar operating results of other relevant companies. Adjusted EBITDA allows investors to measure a company’s operating performance without regard to items such as interest expense, taxes, depreciation and depletion, amortization and accretion and other specifically identified items that are not considered to directly reflect our core operations.
Our management recognizes that using Adjusted EBITDA as a performance measure has inherent limitations as compared to net income (loss) or other U.S. GAAP financial measures, as this non-GAAP measure excludes certain items, including items that are recurring in nature, which may be meaningful to investors. Adjusted EBITDA excludes interest expense and interest income; however, as we have historically borrowed money in order to finance transactions and operations and have invested available cash to generate interest income, interest expense and interest income are elements of our cost structure and influence our ability to generate revenue and returns for stockholders. Adjusted EBITDA excludes depreciation and depletion and amortization; however, as we use capital and intangible assets to generate revenue, depreciation, depletion and amortization are necessary elements of our costs and ability to generate revenue. Adjusted EBITDA also excludes accretion expense; however, as we are legally obligated to pay for costs associated with the reclamation and closure of our mine sites, the periodic accretion expense relating to these reclamation costs is a necessary
element of our costs and ability to generate revenue. Adjusted EBITDA excludes income taxes; however, as we are organized as a corporation, the payment of taxes is a necessary element of our operations. Adjusted EBITDA excludes the changes in the TRA. Adjusted EBITDA excludes fair value mark-to-market gains or losses for derivative financial instruments and premiums paid at contract inception; however, Adjusted EBITDA includes cash amounts received or paid upon contract settlement on derivative financial instruments. Adjusted EBITDA excludes adjustments to non-cash impairment charges. Adjusted EBITDA excludes debt restructuring costs. Finally, Adjusted EBITDA excludes the gain from the sale of the Decker Mine; however, the release of the reclamation and other liabilities was a significant benefit to us.
As a result of these exclusions, Adjusted EBITDA should not be considered in isolation and does not purport to be an alternative to net income (loss) or other U.S. GAAP financial measures as a measure of our operating performance.
When using Adjusted EBITDA as a performance measure, management intends to compensate for these limitations by comparing it to net income (loss) in each period to allow for the comparison of the performance of the underlying core operations with the overall performance of the company on a full-cost, after-tax basis. Using Adjusted EBITDA and net income (loss) to evaluate the business assists management and investors in (a) assessing our relative performance against our competitors and (b) monitoring our capacity to generate returns for stockholders.
Because not all companies use identical calculations, our presentation of Adjusted EBITDA may not be comparable to other similarly titled measures of other companies.
A quantitative reconciliation for each of the periods presented of net income (loss) to Adjusted EBITDA is as follows:
|
|
|
Year Ended December 31, |
| |||||||||||||
|
|
|
2016 |
|
2015 |
|
2014 |
|
2013 |
|
2012 |
| |||||
|
|
|
(in millions) |
| |||||||||||||
|
Net income (loss) |
|
$ |
21.8 |
|
$ |
(204.9 |
) |
$ |
79.0 |
|
$ |
52.0 |
|
$ |
173.7 |
|
|
Interest income |
|
(0.1 |
) |
(0.2 |
) |
(0.3 |
) |
(0.4 |
) |
(1.1 |
) | |||||
|
Interest expense |
|
47.4 |
|
47.6 |
|
77.2 |
|
41.7 |
|
36.3 |
| |||||
|
Income tax expense (benefit) |
|
(2.2 |
) |
77.4 |
|
34.9 |
|
11.6 |
|
62.6 |
| |||||
|
Depreciation and depletion |
|
27.2 |
|
66.1 |
|
112.0 |
|
100.5 |
|
94.6 |
| |||||
|
Amortization of port access rights |
|
— |
|
3.7 |
|
— |
|
— |
|
— |
| |||||
|
EBITDA |
|
94.1 |
|
(10.4 |
) |
302.8 |
|
205.3 |
|
366.1 |
| |||||
|
Accretion |
|
6.6 |
|
12.6 |
|
15.1 |
|
15.3 |
|
13.2 |
| |||||
|
Tax agreement expense (benefit) (1) |
|
— |
|
— |
|
(58.6 |
) |
10.5 |
|
(29.0 |
) | |||||
|
Derivative financial instruments: |
|
|
|
|
|
|
|
|
|
|
| |||||
|
Exclusion of fair value mark-to-market losses (gains) (2) |
|
(8.2 |
) |
30.6 |
|
(7.8 |
) |
(25.6 |
) |
(22.8 |
) | |||||
|
Inclusion of cash amounts received (paid) (3)(4) |
|
(3.3 |
) |
(0.6 |
) |
24.7 |
|
13.0 |
|
11.2 |
| |||||
|
Total derivative financial instruments |
|
(11.5 |
) |
30.0 |
|
16.9 |
|
(12.6 |
) |
(11.5 |
) | |||||
|
Impairments |
|
4.6 |
|
91.5 |
|
— |
|
— |
|
— |
| |||||
|
Gain on sale of Decker Mine interest |
|
— |
|
— |
|
(74.3 |
) |
— |
|
— |
| |||||
|
Debt restructuring costs |
|
4.7 |
|
— |
|
— |
|
— |
|
— |
| |||||
|
Adjusted EBITDA |
|
$ |
98.6 |
|
$ |
123.8 |
|
$ |
201.9 |
|
$ |
218.6 |
|
$ |
338.8 |
|
(1) Changes to related deferred taxes are included in income tax expense.
(2) Fair value mark-to-market (gains) losses reflected in the Consolidated Statements of Operations.
(3) Cash amounts received and paid reflected within operating cash flows.
(4) Excludes premiums paid at option contract inception of $5.8 million and $4.0 million during the years ended December 31, in 2015 and 2014, respectively, for original settlement dates in subsequent years.
See Note 6 of Notes to Consolidated Financial Statements in Item 8 for a discussion related to the fair value of derivative financial instruments.
Adjusted EBITDA by Segment
|
|
|
Year Ended |
| ||||||||||||||||
|
|
|
December 31, |
| ||||||||||||||||
|
|
|
2016 |
|
2015 |
|
2014 |
| ||||||||||||
|
Owned and Operated Mines |
|
|
|
|
|
|
|
|
|
|
|
|
| ||||||
|
Adjusted EBITDA |
|
|
|
$ |
143.7 |
|
|
|
$ |
209.9 |
|
|
|
$ |
240.8 |
| |||
|
Depreciation and depletion |
|
|
|
(29.1 |
) |
|
|
(64.9 |
) |
|
|
(107.6 |
) | ||||||
|
Accretion |
|
|
|
(6.0 |
) |
|
|
(12.0 |
) |
|
|
(11.7 |
) | ||||||
|
Derivative financial instruments: |
|
|
|
|
|
|
|
|
|
|
|
|
| ||||||
|
Exclusion of fair value mark-to-market gains (losses) |
|
$ |
8.1 |
|
|
|
$ |
(24.6 |
) |
|
|
$ |
(13.6 |
) |
|
| |||
|
Inclusion of cash amounts (received) paid (1) |
|
10.4 |
|
|
|
14.0 |
|
|
|
2.3 |
|
|
| ||||||
|
Total derivative financial instruments |
|
|
|
18.5 |
|
|
|
(10.6 |
) |
|
|
(11.3 |
) | ||||||
|
Impairments |
|
|
|
(2.6 |
) |
|
|
(33.4 |
) |
|
|
— |
| ||||||
|
Other |
|
|
|
1.0 |
|
|
|
— |
|
|
|
(0.3 |
) | ||||||
|
Operating income (loss) |
|
|
|
125.5 |
|
|
|
89.0 |
|
|
|
109.9 |
| ||||||
|
|
|
|
|
|
|
|
|
|
|
|
|
|
| ||||||
|
Logistics and Related Activities |
|
|
|
|
|
|
|
|
|
|
|
|
| ||||||
|
Adjusted EBITDA |
|
|
|
(23.6 |
) |
|
|
(44.7 |
) |
|
|
9.8 |
| ||||||
|
Amortization of port access rights |
|
|
|
— |
|
|
|
(3.7 |
) |
|
|
— |
| ||||||
|
Derivative financial instruments: |
|
|
|
|
|
|
|
|
|
|
|
|
| ||||||
|
Exclusion of fair value mark-to-market gains (losses) |
|
0.1 |
|
|
|
(6.1 |
) |
|
|
21.4 |
|
|
| ||||||
|
Inclusion of cash amounts (received) paid (1) |
|
(7.1 |
) |
|
|
(13.4 |
) |
|
|
(27.0 |
) |
|
| ||||||
|
Total derivative financial instruments |
|
|
|
(7.0 |
) |
|
|
(19.5 |
) |
|
|
(5.6 |
) | ||||||
|
Impairments |
|
|
|
— |
|
|
|
(58.2 |
) |
|
|
— |
| ||||||
|
Other |
|
|
|
1.7 |
|
|
|
0.6 |
|
|
|
0 |
| ||||||
|
Operating income (loss) |
|
|
|
(28.9 |
) |
|
|
(125.5 |
) |
|
|
4.2 |
| ||||||
|
|
|
|
|
|
|
|
|
|
|
|
|
|
| ||||||
|
Other |
|
|
|
|
|
|
|
|
|
|
|
|
| ||||||
|
Adjusted EBITDA |
|
|
|
(20.9 |
) |
|
|
(40.0 |
) |
|
|
(47.4 |
) | ||||||
|
Depreciation and depletion |
|
|
|
1.9 |
|
|
|
(1.1 |
) |
|
|
(4.5 |
) | ||||||
|
Accretion |
|
|
|
(0.6 |
) |
|
|
(0.6 |
) |
|
|
(3.4 |
) | ||||||
|
Gain on sale of Decker Mine interest |
|
|
|
— |
|
|
|
— |
|
|
|
74.3 |
| ||||||
|
Debt restructuring costs |
|
|
|
(4.7 |
) |
|
|
— |
|
|
|
— |
| ||||||
|
Impairment |
|
|
|
(2.0 |
) |
|
|
— |
|
|
|
— |
| ||||||
|
Other |
|
|
|
(2.4 |
) |
|
|
(1.8 |
) |
|
|
— |
| ||||||
|
Operating income (loss) |
|
|
|
(28.7 |
) |
|
|
(43.5 |
) |
|
|
19.0 |
| ||||||
|
|
|
|
|
|
|
|
|
|
|
|
|
|
| ||||||
|
Eliminations |
|
|
|
|
|
|
|
|
|
|
|
|
| ||||||
|
Adjusted EBITDA |
|
|
|
(0.6 |
) |
|
|
(1.4 |
) |
|
|
(1.2 |
) | ||||||
|
Operating income (loss) |
|
|
|
(0.6 |
) |
|
|
(1.4 |
) |
|
|
(1.2 |
) | ||||||
|
Consolidated operating income (loss) |
|
|
|
67.3 |
|
|
|
(81.4 |
) |
|
|
131.8 |
| ||||||
|
Interest income |
|
|
|
0.1 |
|
|
|
0.2 |
|
|
|
0.3 |
| ||||||
|
Interest expense |
|
|
|
(47.4 |
) |
|
|
(47.6 |
) |
|
|
(77.2 |
) | ||||||
|
Tax agreement benefit (expense) |
|
|
|
— |
|
|
|
— |
|
|
|
58.6 |
| ||||||
|
Other, net |
|
|
|
(1.0 |
) |
|
|
0.1 |
|
|
|
(0.2 |
) | ||||||
|
Income tax benefit (expense) |
|
|
|
2.2 |
|
|
|
(77.4 |
) |
|
|
(34.9 |
) | ||||||
|
Earnings from unconsolidated affiliates, net of tax |
|
|
|
0.7 |
|
|
|
1.2 |
|
|
|
0.6 |
| ||||||
|
Net income (loss) |
|
|
|
$ |
21.8 |
|
|
|
$ |
(204.9 |
) |
|
|
$ |
79.0 |
| |||
(1) Excludes premiums paid at option contract inception of $5.8 million, related to our Logistics and Related Activities segment, and $4.0 million, related to our Owned and Operated Mines segment, during the years ended December 31, 2015 and 2014, respectively, for original settlement dates in subsequent years.
Item 7A. Quantitative and Qualitative Disclosures About Market Risk.
We define market risk as the risk of economic loss as a consequence of the adverse movement of market rates and prices or credit standings. We believe our principal market risks are commodity price risk, interest rate risk, and credit risk.
Commodity Price Risk
Historically, we have principally managed the commodity price risk for our coal contract portfolio through the use of long-term coal sales agreements of varying terms and durations. Market risk includes the potential for changes in the market value of our coal portfolio, which includes index sales, export pricing, and PRB derivative financial instruments. As of February 2017, we had committed to sell approximately 54 million tons for 2017, of which 53 million tons are under fixed-price contracts. A $1 change to the average coal sales price per ton for the 1 million unpriced tons would result in an approximate $1 million change to the coal revenue.
We also face price risk involving other commodities used in our production process, primarily diesel fuel. Based on our projections of our usage of diesel fuel for the next 12 months, and assuming that the average cost of diesel fuel increases by 10%, we would incur additional fuel costs of approximately $4.5 million over the next 12 months. In addition, we use WTI derivative financial instruments to manage certain exposures to diesel fuel prices. If WTI decreases by 10%, we would incur additional costs of $3.3 million. The terms of the program are disclosed in Note 7 to our notes to consolidated financial statements in Item 8.
Interest Rate Risk
Our Credit Agreement and A/R Securitization Program are subject to adjustable interest rates. See Item 7 “Management’s Discussion and Analysis of Financial Condition and Results of Operations—Liquidity and Capital Resources.” We had no outstanding borrowings under our Credit Agreement or A/R Securitization Program as of December 31, 2016. If we borrow funds under the Credit Agreement or A/R Securitization Program, we may be subject to increased sensitivity to interest rate movements.
Some of the $7.5 million of borrowings under the capital leasing program are also subject to adjustable interest rates although any change to the rate would not have a significant impact on cash flow. Any future debt arrangements that we enter into may also have adjustable interest rates that may increase our sensitivity to interest rate movements.
Credit Risk
We are exposed to credit loss in the event of non-performance by our counterparties, which may include end-use customers, trading houses, brokers, and financial institutions that serve as counterparties to our derivative financial instruments and hold our investments. We attempt to manage this exposure by entering into agreements with counterparties that meet our credit standards and that are expected to fully satisfy their obligations under the contracts. These steps may not always be effective in addressing counterparty credit risk.
When appropriate (as determined by our credit management function), we have taken steps to reduce our credit exposure to customers that do not meet our credit standards or whose credit has deteriorated. These steps include obtaining letters of credit and requiring prepayments for shipments. See Item 1A “Risk Factors—Risks Related to Our Business and Industry—We are exposed to counterparty risk with our customers, trading partners, financial institutions, and other parties with whom we conduct business.”
Item 8. Financial Statements and Supplementary Data.
Report of Independent Registered Public Accounting Firm
To the Board of Directors and Shareholders of Cloud Peak Energy Inc.,
In our opinion, the consolidated financial statements listed in the index appearing under Item 15(a)(1) present fairly, in all material respects, the financial position of Cloud Peak Energy Inc. and its subsidiaries (“the Company”) at December 31, 2016 and 2015, and the results of their operations and their cash flows for each of the three years in the period ended December 31, 2016, in conformity with accounting principles generally accepted in the United States of America. In addition, in our opinion, the financial statement schedule listed in the index appearing under Item 15(a)(2) presents fairly, in all material respects, the information set forth therein when read in conjunction with the related consolidated financial statements. Also in our opinion, the Company maintained, in all material respects, effective internal control over financial reporting as of December 31, 2016, based on criteria established in Internal Control - Integrated Framework (2013) issued by the Committee of Sponsoring Organizations of the Treadway Commission (COSO). The Company’s management is responsible for these financial statements and financial statement schedule, for maintaining effective internal control over financial reporting and for its assessment of the effectiveness of internal control over financial reporting, included in Management’s Report on Internal Control over Financial Reporting appearing under Item 9A. Our responsibility is to express opinions on these financial statements, on the financial statement schedule and on the Company’s internal control over financial reporting based on our integrated audits. We conducted our audits in accordance with the standards of the Public Company Accounting Oversight Board (United States). Those standards require that we plan and perform the audits to obtain reasonable assurance about whether the financial statements are free of material misstatement and whether effective internal control over financial reporting was maintained in all material respects. Our audits of the financial statements included examining, on a test basis, evidence supporting the amounts and disclosures in the financial statements, assessing the accounting principles used and significant estimates made by management, and evaluating the overall financial statement presentation. Our audit of internal control over financial reporting included obtaining an understanding of internal control over financial reporting, assessing the risk that a material weakness exists, and testing and evaluating the design and operating effectiveness of internal control based on the assessed risk. Our audits also included performing such other procedures as we considered necessary in the circumstances. We believe that our audits provide a reasonable basis for our opinions.
A company’s internal control over financial reporting is a process designed to provide reasonable assurance regarding the reliability of financial reporting and the preparation of financial statements for external purposes in accordance with generally accepted accounting principles. A company’s internal control over financial reporting includes those policies and procedures that (i) pertain to the maintenance of records that, in reasonable detail, accurately and fairly reflect the transactions and dispositions of the assets of the company; (ii) provide reasonable assurance that transactions are recorded as necessary to permit preparation of financial statements in accordance with generally accepted accounting principles, and that receipts and expenditures of the company are being made only in accordance with authorizations of management and directors of the company; and (iii) provide reasonable assurance regarding prevention or timely detection of unauthorized acquisition, use, or disposition of the company’s assets that could have a material effect on the financial statements.
Because of its inherent limitations, internal control over financial reporting may not prevent or detect misstatements. Also, projections of any evaluation of effectiveness to future periods are subject to the risk that controls may become inadequate because of changes in conditions, or that the degree of compliance with the policies or procedures may deteriorate.
/s/PricewaterhouseCoopers LLP
Denver, Colorado
February 15, 2017
CLOUD PEAK ENERGY INC.
CONSOLIDATED STATEMENTS OF OPERATIONS AND COMPREHENSIVE INCOME
(in thousands, except per share data)
|
|
|
Year Ended |
| |||||||
|
|
|
December 31, |
| |||||||
|
|
|
2016 |
|
2015 |
|
2014 |
| |||
|
Revenue |
|
$ |
800,438 |
|
$ |
1,124,111 |
|
$ |
1,324,044 |
|
|
|
|
|
|
|
|
|
| |||
|
Costs and expenses |
|
|
|
|
|
|
| |||
|
Cost of product sold (exclusive of depreciation, depletion, amortization, and accretion, shown separately) |
|
646,404 |
|
950,580 |
|
1,094,257 |
| |||
|
Depreciation and depletion |
|
27,218 |
|
66,064 |
|
112,022 |
| |||
|
Amortization of port access rights (Note 10) |
|
— |
|
3,710 |
|
— |
| |||
|
Accretion (Note 16) |
|
6,645 |
|
12,555 |
|
15,136 |
| |||
|
(Gain) loss on derivative financial instruments (Note 7) |
|
(8,180 |
) |
30,635 |
|
(7,805 |
) | |||
|
Selling, general and administrative expenses |
|
50,868 |
|
48,925 |
|
50,201 |
| |||
|
Impairments (Note 9) |
|
4,609 |
|
91,541 |
|
— |
| |||
|
Debt restructuring costs |
|
4,665 |
|
— |
|
— |
| |||
|
Other operating costs |
|
941 |
|
1,492 |
|
2,693 |
| |||
|
Total costs and expenses |
|
733,170 |
|
1,205,502 |
|
1,266,504 |
| |||
|
Gain on sale of Decker Mine interest (Note 4) |
|
— |
|
— |
|
(74,262 |
) | |||
|
Operating income (loss) |
|
67,268 |
|
(81,391 |
) |
131,802 |
| |||
|
|
|
|
|
|
|
|
| |||
|
Other income (expense) |
|
|
|
|
|
|
| |||
|
Interest income |
|
138 |
|
170 |
|
259 |
| |||
|
Interest expense (Note 15) |
|
(47,434 |
) |
(47,561 |
) |
(77,160 |
) | |||
|
Tax agreement benefit (expense) (Note 12) |
|
— |
|
— |
|
58,595 |
| |||
|
Other, net |
|
(1,001 |
) |
62 |
|
(202 |
) | |||
|
Total other income (expense) |
|
(48,297 |
) |
(47,329 |
) |
(18,508 |
) | |||
|
Income (loss) before income tax provision and earnings from unconsolidated affiliates |
|
18,971 |
|
(128,720 |
) |
113,294 |
| |||
|
Income tax benefit (expense) (Note 17) |
|
2,213 |
|
(77,380 |
) |
(34,913 |
) | |||
|
Income (loss) from unconsolidated affiliates, net of tax (Note 11) |
|
657 |
|
1,200 |
|
579 |
| |||
|
Net income (loss) |
|
21,841 |
|
(204,900 |
) |
78,960 |
| |||
|
|
|
|
|
|
|
|
| |||
|
Other comprehensive income (loss) |
|
|
|
|
|
|
| |||
|
Postretirement medical plan amortization of prior service costs (Note 18) |
|
(5,253 |
) |
1,252 |
|
989 |
| |||
|
Postretirement medical plan adjustments (Note 18) |
|
(1,792 |
) |
(3,874 |
) |
(5,564 |
) | |||
|
Postretirement medical plan change (Note 18) |
|
42,851 |
|
— |
|
— |
| |||
|
Write-off of prior service costs related to Decker Mine pension plan (Note 21) |
|
— |
|
— |
|
3,183 |
| |||
|
Income tax on postretirement medical and pension changes |
|
(971 |
) |
970 |
|
372 |
| |||
|
Other comprehensive income (loss) |
|
34,835 |
|
(1,652 |
) |
(1,020 |
) | |||
|
Total comprehensive income (loss) |
|
$ |
56,676 |
|
$ |
(206,552 |
) |
$ |
77,940 |
|
|
|
|
|
|
|
|
|
| |||
|
Income (loss) per common share (Note 22) |
|
|
|
|
|
|
| |||
|
Basic |
|
$ |
0.36 |
|
$ |
(3.36 |
) |
$ |
1.30 |
|
|
Diluted |
|
$ |
0.35 |
|
$ |
(3.36 |
) |
$ |
1.29 |
|
|
Weighted-average shares outstanding - basic |
|
61,328 |
|
61,053 |
|
60,826 |
| |||
|
Weighted-average shares outstanding - diluted |
|
62,290 |
|
61,053 |
|
61,295 |
| |||
The accompanying notes are an integral part of these consolidated financial statements.
CLOUD PEAK ENERGY INC.
CONSOLIDATED BALANCE SHEETS
(in thousands)
|
|
|
December 31, |
|
December 31, |
| ||
|
|
|
2016 |
|
2015 |
| ||
|
ASSETS |
|
|
|
|
| ||
|
Current assets |
|
|
|
|
| ||
|
Cash and cash equivalents |
|
$ |
83,708 |
|
$ |
89,313 |
|
|
Accounts receivable |
|
49,311 |
|
43,248 |
| ||
|
Due from related parties |
|
— |
|
160 |
| ||
|
Inventories, net (Note 5) |
|
68,683 |
|
76,763 |
| ||
|
Derivative financial instruments (Note 7) |
|
752 |
|
— |
| ||
|
Income tax receivable |
|
1,601 |
|
8,659 |
| ||
|
Other prepaids and deferred charges |
|
20,361 |
|
25,945 |
| ||
|
Other assets |
|
741 |
|
98 |
| ||
|
Total current assets |
|
225,157 |
|
244,186 |
| ||
|
|
|
|
|
|
| ||
|
Noncurrent assets |
|
|
|
|
| ||
|
Property, plant and equipment, net (Note 8) |
|
1,432,361 |
|
1,488,371 |
| ||
|
Goodwill (Note 9) |
|
2,280 |
|
2,280 |
| ||
|
Other assets |
|
54,978 |
|
67,323 |
| ||
|
Total assets |
|
$ |
1,714,776 |
|
$ |
1,802,160 |
|
|
|
|
|
|
|
| ||
|
LIABILITIES AND EQUITY |
|
|
|
|
| ||
|
Current liabilities |
|
|
|
|
| ||
|
Accounts payable |
|
$ |
27,678 |
|
$ |
44,385 |
|
|
Royalties and production taxes |
|
63,018 |
|
74,054 |
| ||
|
Accrued expenses |
|
35,857 |
|
42,317 |
| ||
|
Due to related parties |
|
71 |
|
— |
| ||
|
Other liabilities |
|
2,567 |
|
2,133 |
| ||
|
Total current liabilities |
|
129,191 |
|
162,889 |
| ||
|
|
|
|
|
|
| ||
|
Noncurrent liabilities |
|
|
|
|
| ||
|
Senior notes (Note 13) |
|
475,009 |
|
491,160 |
| ||
|
Asset retirement obligations, net of current portion (Note 16) |
|
97,048 |
|
151,755 |
| ||
|
Accumulated postretirement benefit obligation, net of current portion (Note 18) |
|
22,950 |
|
60,845 |
| ||
|
Royalties and production taxes |
|
21,557 |
|
34,680 |
| ||
|
Other liabilities |
|
17,360 |
|
12,950 |
| ||
|
Total liabilities |
|
763,115 |
|
914,279 |
| ||
|
Commitments and Contingencies (Note 19) |
|
|
|
|
| ||
|
|
|
|
|
|
| ||
|
Equity |
|
|
|
|
| ||
|
Common stock ($0.01 par value; 200,000 shares authorized; 61,942 and 61,647 shares issued and 61,465 and 61,170 outstanding as of December 31, 2016 and December 31, 2015, respectively) |
|
615 |
|
612 |
| ||
|
Treasury stock, at cost (477 shares as of both December 31, 2016 and December 31, 2015, respectively) |
|
(6,498 |
) |
(6,498 |
) | ||
|
Additional paid-in capital |
|
581,975 |
|
574,874 |
| ||
|
Retained earnings |
|
353,685 |
|
331,844 |
| ||
|
Accumulated other comprehensive income (loss) |
|
21,884 |
|
(12,951 |
) | ||
|
Total equity |
|
951,661 |
|
887,881 |
| ||
|
Total liabilities and equity |
|
$ |
1,714,776 |
|
$ |
1,802,160 |
|
The accompanying notes are an integral part of these consolidated financial statements.
CLOUD PEAK ENERGY INC.
CONSOLIDATED STATEMENTS OF EQUITY
(in thousands)
|
|
|
|
|
|
|
|
|
|
|
|
|
|
|
Accumulated |
|
|
| ||||||
|
|
|
|
|
|
|
|
|
|
|
Additional |
|
|
|
Other |
|
|
| ||||||
|
|
|
Common Stock |
|
Treasury Stock |
|
Paid-In |
|
Retained |
|
Comprehensive |
|
|
| ||||||||||
|
|
|
Shares |
|
Amount |
|
Shares |
|
Amount |
|
Capital |
|
Earnings |
|
Income (Loss) |
|
Total |
| ||||||
|
Balances as of December 31, 2013 |
|
60,896 |
|
609 |
|
400 |
|
(5,667 |
) |
559,602 |
|
457,784 |
|
(10,279 |
) |
1,002,049 |
| ||||||
|
Net income (loss) |
|
— |
|
— |
|
— |
|
— |
|
— |
|
78,960 |
|
— |
|
78,960 |
| ||||||
|
Write-off of prior service costs related to Decker Mine pension, net of tax |
|
— |
|
— |
|
— |
|
— |
|
— |
|
— |
|
2,038 |
|
2,038 |
| ||||||
|
Postretirement benefit adjustment, net of tax |
|
— |
|
— |
|
— |
|
— |
|
— |
|
— |
|
(3,058 |
) |
(3,058 |
) | ||||||
|
Write off of excess tax benefits related to equity-based compensation |
|
— |
|
— |
|
— |
|
— |
|
(914 |
) |
— |
|
— |
|
(914 |
) | ||||||
|
Employee stock purchases |
|
56 |
|
1 |
|
— |
|
— |
|
794 |
|
— |
|
— |
|
795 |
| ||||||
|
Equity-based compensation expense |
|
— |
|
— |
|
— |
|
— |
|
7,966 |
|
— |
|
— |
|
7,966 |
| ||||||
|
Restricted stock issuance, net of forfeitures |
|
16 |
|
— |
|
3 |
|
— |
|
— |
|
— |
|
— |
|
— |
| ||||||
|
Employee common stock withheld to cover withholding taxes |
|
(29 |
) |
(1 |
) |
29 |
|
(576 |
) |
(15 |
) |
— |
|
— |
|
(592 |
) | ||||||
|
Exercise of stock options |
|
83 |
|
1 |
|
— |
|
— |
|
589 |
|
— |
|
— |
|
590 |
| ||||||
|
Balances as of December 31, 2014 |
|
61,022 |
|
610 |
|
432 |
|
(6,243 |
) |
568,022 |
|
536,744 |
|
(11,299 |
) |
1,087,834 |
| ||||||
|
|
|
|
|
|
|
|
|
|
|
|
|
|
|
|
|
|
| ||||||
|
Net income (loss) |
|
— |
|
— |
|
— |
|
— |
|
— |
|
(204,900 |
) |
— |
|
(204,900 |
) | ||||||
|
Postretirement benefit adjustment, net of tax |
|
— |
|
— |
|
— |
|
— |
|
— |
|
— |
|
(1,652 |
) |
(1,652 |
) | ||||||
|
Write-off of excess tax benefits related to equity-based compensation |
|
— |
|
— |
|
— |
|
— |
|
(415 |
) |
— |
|
— |
|
(415 |
) | ||||||
|
Employee stock purchases |
|
136 |
|
1 |
|
— |
|
— |
|
585 |
|
— |
|
— |
|
586 |
| ||||||
|
Equity-based compensation expense |
|
— |
|
— |
|
— |
|
— |
|
6,935 |
|
— |
|
— |
|
6,935 |
| ||||||
|
Restricted stock issuance, net of forfeitures |
|
56 |
|
1 |
|
1 |
|
— |
|
(1 |
) |
— |
|
— |
|
— |
| ||||||
|
Employee common stock withheld to cover withholding taxes |
|
(44 |
) |
— |
|
44 |
|
(255 |
) |
(252 |
) |
— |
|
— |
|
(507 |
) | ||||||
|
Balances as of December 31, 2015 |
|
61,170 |
|
612 |
|
477 |
|
(6,498 |
) |
574,874 |
|
331,844 |
|
(12,951 |
) |
887,881 |
| ||||||
|
|
|
|
|
|
|
|
|
|
|
|
|
|
|
|
|
|
| ||||||
|
Net income (loss) |
|
— |
|
— |
|
— |
|
— |
|
— |
|
21,841 |
|
— |
|
21,841 |
| ||||||
|
Postretirement benefit adjustment, net of tax |
|
— |
|
— |
|
— |
|
— |
|
— |
|
— |
|
34,835 |
|
34,835 |
| ||||||
|
Employee stock purchases |
|
134 |
|
1 |
|
— |
|
— |
|
457 |
|
— |
|
— |
|
458 |
| ||||||
|
Equity-based compensation expense |
|
— |
|
— |
|
— |
|
— |
|
6,845 |
|
— |
|
— |
|
6,845 |
| ||||||
|
Restricted stock issuance, net of forfeitures |
|
230 |
|
2 |
|
— |
|
— |
|
(2 |
) |
— |
|
— |
|
— |
| ||||||
|
Employee common stock withheld to cover withholding taxes |
|
(69 |
) |
— |
|
— |
|
— |
|
(199 |
) |
— |
|
— |
|
(199 |
) | ||||||
|
Balances as of December 31, 2016 |
|
61,465 |
|
$ |
615 |
|
477 |
|
$ |
(6,498 |
) |
$ |
581,975 |
|
$ |
353,685 |
|
$ |
21,884 |
|
$ |
951,661 |
|
The accompanying notes are an integral part of these consolidated financial statements.
CLOUD PEAK ENERGY INC.
CONSOLIDATED STATEMENTS OF CASH FLOWS
(in thousands)
|
|
|
Year Ended |
| |||||||
|
|
|
December 31, |
| |||||||
|
|
|
2016 |
|
2015 |
|
2014 |
| |||
|
Cash flows from operating activities |
|
|
|
|
|
|
| |||
|
Net income (loss) |
|
$ |
21,841 |
|
$ |
(204,900 |
) |
$ |
78,960 |
|
|
Adjustments to reconcile net income (loss) to net cash provided by operating activities: |
|
|
|
|
|
|
| |||
|
Depreciation, depletion, and amortization |
|
27,218 |
|
69,774 |
|
112,022 |
| |||
|
Accretion |
|
6,645 |
|
12,555 |
|
15,136 |
| |||
|
Impairments |
|
4,609 |
|
91,541 |
|
— |
| |||
|
Earnings from unconsolidated affiliates, net of tax |
|
(657 |
) |
(1,200 |
) |
(579 |
) | |||
|
Distributions of income from unconsolidated affiliates |
|
1,515 |
|
— |
|
2,250 |
| |||
|
Deferred income taxes |
|
(971 |
) |
79,486 |
|
31,921 |
| |||
|
Gain on sale of Decker Mine interest |
|
— |
|
— |
|
(74,262 |
) | |||
|
Tax agreement expense (benefit) |
|
— |
|
— |
|
(58,595 |
) | |||
|
Equity-based compensation expense |
|
13,064 |
|
6,935 |
|
7,966 |
| |||
|
(Gain) loss on derivative financial instruments |
|
(8,180 |
) |
30,635 |
|
(7,805 |
) | |||
|
Cash received (paid) on derivative financial instrument settlements |
|
(3,305 |
) |
(585 |
) |
24,672 |
| |||
|
Premium payments on derivative financial instruments |
|
— |
|
(5,813 |
) |
(3,950 |
) | |||
|
Non-cash interest expense related to early retirement of debt and refinancings |
|
1,254 |
|
— |
|
7,338 |
| |||
|
Net periodic postretirement benefit costs |
|
(1,841 |
) |
8,096 |
|
7,880 |
| |||
|
Addback of debt restructuring costs |
|
4,665 |
|
— |
|
— |
| |||
|
Payments for 2015 amendment of logistics contracts |
|
(22,500 |
) |
(37,500 |
) |
— |
| |||
|
Payment for 2016 amendment of logistics contract |
|
(8,000 |
) |
— |
|
— |
| |||
|
Logistics volume shortfall expense |
|
32,667 |
|
— |
|
— |
| |||
|
Other |
|
3,798 |
|
16,736 |
|
4,137 |
| |||
|
Changes in operating assets and liabilities: |
|
|
|
|
|
|
| |||
|
Accounts receivable |
|
(8,889 |
) |
44,012 |
|
(12,825 |
) | |||
|
Inventories, net |
|
8,047 |
|
3,153 |
|
(4,218 |
) | |||
|
Other assets |
|
16,057 |
|
(18,202 |
) |
15,103 |
| |||
|
Other liabilities |
|
(38,321 |
) |
(53,134 |
) |
(1,977 |
) | |||
|
Tax agreement liability |
|
— |
|
— |
|
(45,000 |
) | |||
|
Net cash provided by (used in) operating activities |
|
48,716 |
|
41,589 |
|
98,174 |
| |||
|
|
|
|
|
|
|
|
| |||
|
Investing activities |
|
|
|
|
|
|
| |||
|
Purchases of property, plant and equipment |
|
(33,639 |
) |
(37,662 |
) |
(18,719 |
) | |||
|
Cash paid for capitalized interest |
|
(1,444 |
) |
(843 |
) |
(4,133 |
) | |||
|
Investments in marketable securities |
|
— |
|
— |
|
(8,159 |
) | |||
|
Maturity and redemption of investments |
|
— |
|
— |
|
88,845 |
| |||
|
Investment in port access rights |
|
— |
|
(2,160 |
) |
(39,260 |
) | |||
|
Investment in unconsolidated affiliate |
|
— |
|
(6,570 |
) |
— |
| |||
|
Investment in development projects |
|
(1,500 |
) |
(1,526 |
) |
(3,522 |
) | |||
|
Payment of restricted cash |
|
(725 |
) |
(6,500 |
) |
— |
| |||
|
Return of restricted cash |
|
8,500 |
|
— |
|
— |
| |||
|
Insurance proceeds |
|
2,826 |
|
— |
|
— |
| |||
|
Other |
|
659 |
|
223 |
|
(1,687 |
) | |||
|
Net cash provided by (used in) investing activities |
|
(25,323 |
) |
(55,038 |
) |
13,365 |
| |||
|
|
|
|
|
|
|
|
| |||
|
Financing activities |
|
|
|
|
|
|
| |||
|
Principal payments on federal coal leases |
|
— |
|
(63,970 |
) |
(58,958 |
) | |||
|
Issuance of senior notes |
|
— |
|
— |
|
200,000 |
| |||
|
Repayment of senior notes |
|
— |
|
— |
|
(300,000 |
) | |||
|
Payment of deferred financing costs |
|
(3,624 |
) |
(342 |
) |
(14,755 |
) | |||
|
Cash paid on tender of 2019 and 2024 senior notes |
|
(18,335 |
) |
— |
|
— |
| |||
|
Payment of debt restructuring costs |
|
(4,665 |
) |
— |
|
— |
| |||
|
Other |
|
(2,374 |
) |
(1,671 |
) |
(714 |
) | |||
|
Net cash provided by (used in) financing activities |
|
(28,998 |
) |
(65,983 |
) |
(174,427 |
) | |||
|
|
|
|
|
|
|
|
| |||
|
Net increase (decrease) in cash and cash equivalents |
|
(5,605 |
) |
(79,432 |
) |
(62,888 |
) | |||
|
Cash and cash equivalents at beginning of period |
|
89,313 |
|
168,745 |
|
231,633 |
| |||
|
Cash and cash equivalents at end of period |
|
$ |
83,708 |
|
$ |
89,313 |
|
$ |
168,745 |
|
|
|
|
|
|
|
|
|
| |||
|
Supplemental cash flow disclosures |
|
|
|
|
|
|
| |||
|
Interest paid |
|
$ |
39,560 |
|
$ |
46,445 |
|
$ |
50,330 |
|
|
Income taxes paid (refunded) |
|
$ |
(8,443 |
) |
$ |
10,049 |
|
$ |
(6,874 |
) |
|
Supplemental noncash investing and financing activities |
|
|
|
|
|
|
| |||
|
Capital expenditures included in accounts payable |
|
$ |
3,227 |
|
$ |
682 |
|
$ |
2,144 |
|
|
Assets acquired under capital leases |
|
$ |
964 |
|
$ |
1,568 |
|
$ |
1,209 |
|
|
Port access rights acquired in connection with sale of Decker Mine interest |
|
$ |
— |
|
$ |
— |
|
$ |
5,000 |
|
|
Debt restructuring of 2019 and 2024 senior notes (Note 13) |
|
$ |
(290,366 |
) |
$ |
— |
|
$ |
— |
|
|
Debt issuance of 2021 senior notes (Note 13) |
|
$ |
290,366 |
|
$ |
— |
|
$ |
— |
|
The accompanying notes are an integral part of these consolidated financial statements.
CLOUD PEAK ENERGY INC.
NOTES TO CONSOLIDATED FINANCIAL STATEMENTS
1. Organization and Business
We are one of the largest producers of coal in the United States of America (“U.S.”) and the PRB, based on our 2016 coal sales. We operate some of the safest mines in the coal industry. According to the most current MSHA data, we have one of the lowest employee all injury incident rates among the largest U.S. coal producing companies. We currently operate solely in the PRB, the lowest cost region of the major coal producing regions in the U.S., where we own and operate three surface coal mines: the Antelope Mine, the Cordero Rojo Mine, and the Spring Creek Mine.
Our Antelope Mine and Cordero Rojo Mine are located in Wyoming and our Spring Creek Mine is located in Montana. Our mines produce subbituminous thermal coal with low sulfur content, and we sell our coal primarily to domestic and foreign electric utilities. Thermal coal is primarily consumed by electric utilities and industrial consumers as fuel for electricity generation. In 2016, the coal we produced generated approximately 3% of the electricity produced in the U.S. We do not produce any metallurgical coal.
In addition, we have two development projects, both located in the Northern PRB. The Youngs Creek project is an undeveloped surface mine project located in Wyoming, seven miles south of our Spring Creek Mine, and contiguous with the Wyoming-Montana state line. The Big Metal project is located near the Youngs Creek project on the Crow Indian Reservation in southeast Montana. These two projects are described in more detail under Item 1. “Business — Development Projects.”
Our logistics business provides a variety of services designed to facilitate the sale and delivery of coal. These services include the purchase of coal from third parties or from our owned and operated mines, coordination of the transportation and delivery of purchased coal, negotiation of take-or-pay rail agreements and take-or-pay port agreements and demurrage settlement with vessel operators. See Note 10 for further discussion.
2. Basis of Presentation
Principles of Consolidation
We consolidate the accounts of entities in which we have a controlling financial interest under the voting control model. We accounted for our 50% non-operating interest in the Decker Mine, which was sold on September 12, 2014, using the proportionate consolidation method, whereby our share of Decker Mine’s assets, liabilities, revenue and expenses were included in our consolidated financial statements through the date of the sale. Investments in other entities that we do not control but have the ability to exercise significant influence over the investee’s operating and financial policies, are accounted for under the equity method. The consolidated financial statements have been prepared in conformity with accounting principles generally accepted in the Unites States of America (“U.S. GAAP”). All intercompany balances and transactions have been eliminated in the consolidated financial statements.
Certain amounts have been reclassified to conform to current period presentations. Due to the tabular presentation of rounded amounts, certain tables reflect insignificant rounding differences.
3. Critical and Significant Accounting Policies
Use of Estimates
The preparation of our consolidated financial statements in conformity with U.S. GAAP requires our management to make estimates and assumptions that affect the reported amounts of assets and liabilities, the disclosure of contingent assets and liabilities at the date of the financial statements, and the reported amounts of revenue and expenses during the reporting periods. Significant estimates in these consolidated financial statements include: assumptions about the amount and timing of future cash flows and related discount rates used in determining asset retirement obligations (“AROs”) and in testing long-lived assets and goodwill for impairment; the fair value of derivative financial instruments; the calculation of mineral reserves; equity-based compensation expense; reserves for contingencies and litigation; useful lives of long-lived assets; postretirement employee benefit obligations; the recognition and measurement of income tax benefits and related deferred tax asset valuation allowances; allowances for inventory obsolescence and net realizable value; and assumptions about the timing of future cash flows used in determining the tax agreement liability for periods before its termination in August 2014. Actual results could differ materially from those estimates.
CLOUD PEAK ENERGY INC.
NOTES TO CONSOLIDATED FINANCIAL STATEMENTS
Critical Accounting Policies
We consider certain accounting policies to be critical, as their application requires management’s judgment about the effects of matters that are inherently uncertain. The following is a discussion of the accounting policies we consider critical to our consolidated financial statements.
Revenue Recognition
We recognize revenue from a sale when persuasive evidence of an arrangement exists, the price is determinable, the product has been delivered, title has transferred to the customer and collection of the sales price is reasonably assured.
Coal sales revenue include sales to customers of coal produced at our facilities and coal purchased from other companies. Coal sales are made to our customers under the terms of coal sales agreements, most of which have a term greater than one year. Under the typical terms of these coal sales agreements, title and risk of loss transfer to the customer at the time the coal is shipped, which is the point at which revenue is recognized. Certain contracts provide for title and risk of loss transfer at the point of destination, in which case revenue is recognized when it arrives at its destination.
Coal sales agreements typically contain coal quality specifications. With coal quality specifications in place, the raw coal sold by us to the customer at the delivery point must be substantially free of magnetic material and other foreign material impurities, and crushed to a maximum size as set forth in the respective coal sales agreement. Prior to billing the customer, price adjustments are made based on quality standards that are specified in the coal sales agreement, such as Btu factor, moisture, ash, and sodium content and can result in either increases or decreases in the value of the coal shipped.
Transportation and related costs are included in Cost of product sold, and amounts we bill to our customers for transportation are included in Revenue.
Impairment of Long-Lived Assets
The carrying amounts of our mineral properties, equipment, port access rights, and other long-lived assets are sensitive to declines in domestic and international coal prices. The cash flow models that we use to assess impairment includes numerous assumptions such as our current estimates of forecast coal production, management’s outlook on forward commodity prices, operating and development costs, and discount rates. If prices remain at current levels for an extended period of time or do not recover as anticipated, if regulatory changes adversely impact coal-fired electricity generation, or if we receive an unfavorable outcome of the litigation described in Note 19, we may incur impairment charges on certain of these assets.
We evaluate the recoverability of our long-lived assets when events or changes in circumstances indicate that the carrying amount of property, plant and equipment may not be recovered over its remaining service life. An asset impairment charge is recognized when the sum of estimated future cash flows associated with the operation and disposal of the asset, on an undiscounted basis, is less than the carrying amount of the asset. An impairment charge is measured as the amount by which the carrying amount of the asset exceeds its fair value. Fair value is measured using discounted cash flows based on estimates of coal reserves, coal prices, operating expenses, and capital costs or by reference to observable comparable transaction or replacement cost data. See Note 9 for a description of recent impairments of our long-lived assets.
Asset Retirement Obligations and Remediation Costs
We recognize liabilities for AROs where we have legal obligations associated with the retirement of long-lived assets. We recognize AROs at fair value at the time the obligations are incurred. Our AROs generally are incurred when a mine site is disturbed by mining activities and as the extent of disturbance increases. AROs reflect costs associated with legally required mine reclamation and closure activities, including earthwork, vegetation, and demolition and are estimated based upon detailed engineering calculations of the amount and timing of the future cash spending for a third party to perform the required work. Spending estimates are adjusted for estimated inflation and discounted at credit-adjusted, risk-free rates to arrive at a present value of estimated future reclamation costs. The ARO amount is capitalized as part of the related mining property upon initial recognition and is included in Depreciation and depletion using the units-of-production method based on proven and probable reserves. As changes in estimates occur (such as changes in estimated costs or timing of reclamation activities resulting from mine plan revisions or new LBAs), the ARO liability and related asset are adjusted to reflect the updated estimates. If a reduction of the ARO exceeds the carrying amount of the related asset retirement cost, the
CLOUD PEAK ENERGY INC.
NOTES TO CONSOLIDATED FINANCIAL STATEMENTS
adjustment is recorded as a reduction to Depreciation and depletion. Increases in ARO liabilities resulting from the passage of time are recognized as Accretion. Other costs related to environmental remediation are charged to expense as incurred.
Significant Accounting Policies
Cash and Cash Equivalents
We consider all highly-liquid investments with an original maturity of three months or less to be cash equivalents. Money market funds that meet all qualifying criteria for a money market fund under the Investment Company Act of 1940 are considered to be cash equivalents.
Allowance for Doubtful Accounts Receivable
We determine an allowance for doubtful accounts based on the aging of accounts receivable, historical experience, and management judgment. We write off accounts receivable against the allowance when we determine a balance is uncollectible and we no longer continue to actively pursue collection of the receivable. Based on our assessment of the above criteria, an allowance for doubtful accounts was not required as of December 31, 2016 and 2015.
Inventories, Net
Materials and Supplies
We state materials and supplies at average cost. We establish allowances for excess or obsolete materials and supplies inventory based on prior experience and estimates of future usage.
Coal Inventory
We state our coal inventory, which consists of coal stockpiles that may be sold in their current condition or may be further processed prior to shipment to a customer, at the lower of cost or net realizable value. Net realizable value represents the estimated future sales price based on spot coal prices and prices under long-term contracts, less the estimated costs to complete production and bring the product to sale. The cost of coal inventory reflects mining costs incurred up to the point of stockpiling the coal and includes labor, supplies, equipment, applicable operating overhead, and depreciation, depletion, and amortization related to mining operations.
Prepaid Freight
Our logistics business incurs freight and related charges moving coal from the Spring Creek Mine to the port, as well as terminal handling charges and demurrage. These costs are included in Other assets until such time as the revenue is recognized on the associated coal.
Property, Plant and Equipment
Plant and Equipment
We state plant and equipment at cost, less accumulated depreciation. Plant and equipment used in mining operations that are expected to remain in service for the life of the related mine are depreciated using the units-of-production method based on proven and probable reserves. Depreciation of other plant and equipment is computed using the straight-line method over the following estimated useful lives:
|
Buildings and improvements |
|
5 to 25 years |
|
|
Machinery and equipment |
|
3 to 20 years |
|
|
Furniture and fixtures |
|
3 years |
|
CLOUD PEAK ENERGY INC.
NOTES TO CONSOLIDATED FINANCIAL STATEMENTS
Mineral Rights
Mineral rights include both proven and probable reserves and non-reserve coal deposits. We state our mineral rights at cost, less accumulated depletion. We compute depletion of mineral rights using the units-of-production method based on proven and probable reserves. Non-reserve coal deposits are not depleted until they qualify as proven and probable reserves and the mining begins. Mineral rights are included in Property, plant and equipment, net.
Upon the award date of federal coal leases, pursuant to which payments are required to be made in equal annual installments, we recognize an asset for the related mineral rights in Property, plant and equipment, net and a corresponding liability for our future payment obligations in current and non-current liabilities. The amount recognized as an asset is the sum of the initial installment due at the effective date of the lease and the amount recognized in current and non-current liabilities, which reflects the present value of the remaining installments. We determine the present value of the remaining installments using an estimate of the credit-adjusted, risk-free rates that reflects our credit rating. Interest expense is recognized over the term of the lease based on the imputed interest rate that was used to determine the initial current and non-current liabilities amount on the effective date. Such interest may be capitalized while activities are in progress to prepare the acquired coal reserves for mining.
Land and Surface Rights
We purchase surface lands in order to gain access to our mineral rights. Land is typically acquired for amounts greater than its fair value as a result of the value of the coal beneath it. The value of the land is determined based on published agricultural values and is not depleted. The value of the surface rights is the amount paid in excess of the published agricultural value and is depleted over the useful life of the respective land parcel. Both land and surface rights are included in land and land improvements in Property, plant and equipment, net.
Capitalization of Interest
We capitalize interest costs on accumulated expenditures incurred in preparing capital projects for their intended use.
Mine Development Costs
We capitalize costs of developing new mines where proven and probable reserves exist. We amortize mine development costs using the units-of-production method based on proven and probable reserves that are associated with the property being developed. Costs may include construction permits and licenses; mine design; construction of access roads, slopes and main entries; and removing overburden and waste materials to access the coal ore body in a new pit prior to the production phase, which commences when saleable coal, beyond a de minimis amount, is produced. Where multiple pits exist at a mining operation, overburden removal costs are capitalized if such costs are for the development of a new area that is separate and distinct from the existing production phase mines. Overburden removal costs that relate to the enlargement of an existing pit are expensed as incurred. Overburden removal costs incurred during the production phase are included as a cost of inventory to be recognized in Cost of product sold in the same period as the revenue from the sale of inventory. Additionally, mine development costs include the costs associated with AROs. Mine development costs are included in land, improvements, and mineral rights in Property, plant and equipment, net.
Repairs and Maintenance
We capitalize costs associated with major renewals and improvements. Expenditures to replace or completely rebuild major components of major equipment, which are required at predictable intervals to maintain or extend asset life or performance, are capitalized. These major components are capitalized separately from the major equipment and depreciated according to their own estimated useful life, rather than the estimated useful life of the major equipment. All other costs of repairs and maintenance are charged to expense as incurred.
CLOUD PEAK ENERGY INC.
NOTES TO CONSOLIDATED FINANCIAL STATEMENTS
Exploration Costs
We expense all direct costs incurred in identifying new resources and in converting resources to reserves at development and production stage projects. Exploration costs are included in Cost of product sold and consisted of the following for the years ended December 31 (in thousands):
|
|
|
2016 |
|
2015 |
|
2014 |
| |||
|
Exploration Costs |
|
$ |
1,179 |
|
$ |
1,778 |
|
$ |
3,101 |
|
Derivative Financial Instruments
We are exposed to various types of risk in the normal course of business, including fluctuations in the price at which we are able to sell our coal in the future and the price we are able to purchase diesel fuel used in our operations. We seek to mitigate some of the volatility of these fluctuations by using derivative financial instruments. We recognize all derivative financial instruments as assets or liabilities at their respective fair values in the Consolidated Balance Sheets. All derivative financial instruments are included in current assets or liabilities as we have the ability to settle the positions at any time. Gains or losses from changes in the fair value of derivative financial instruments are recognized immediately in the Consolidated Statements of Operations in Operating income (loss). Assets and liabilities with the same counterparty, where right of offset is allowed, are recorded on a net basis in the Consolidated Balance Sheets.
Our derivative financial instruments do not qualify for hedge accounting; therefore, changes in the fair value of the derivative financial instruments are recorded in Derivative financial instruments in the Consolidated Statements of Operations each period using mark-to-market accounting.
Fair Value of Financial Instruments
Our financial instruments include cash equivalents, accounts receivable, amounts due from related parties, accounts payable, and certain current liabilities. Due to the short-term nature of these instruments, we believe that their carrying amounts approximated fair value.
Certain cash equivalents and derivative financial instruments are reported in our Consolidated Balance Sheets at fair value. We categorize assets and liabilities measured at fair value based on the observability of the inputs utilized in the valuation. See Notes 6 and 7.
Pensions and Other Postretirement Benefits
Our employees participate in defined contribution retirement plans, which require us to make contributions based on a percentage of compensation or to match employee contributions, subject to limitations. We recognize compensation expense for our required contributions as incurred.
Our postretirement medical plan provides retiree medical benefits for our employees. We accrue costs of these benefits over the employees’ period of active service. These costs are determined on an actuarial basis. In April 2016, we communicated certain changes in our Retiree Medical Plan to employees that became effective January 1, 2017. Changes include a decrease in the number of active employees that are eligible for the plan as well as moving to a defined contribution plan away from a defined benefit plan. See Note 18.
Income Taxes
We account for income taxes using a balance sheet approach in accordance with U.S. GAAP. Deferred income taxes are provided for temporary differences arising from differences between the financial statement and tax bases of assets and liabilities existing at each balance sheet date using enacted tax rates expected to be in effect when the related taxes are expected to be paid or recovered. A valuation allowance is established if it is more likely than not that a deferred tax asset will not be realized. In determining the appropriate valuation allowance, we consider projected realization of tax benefits based on expected levels of future taxable income, available tax planning strategies, and our overall deferred tax position. We recognize the benefit of uncertain tax positions at the greatest amount that is determined to be more likely than not of being realized. Interest and penalties related to income tax matters are included in Income tax benefit (expense).
CLOUD PEAK ENERGY INC.
NOTES TO CONSOLIDATED FINANCIAL STATEMENTS
Non-Income Based Taxes and Royalties
We are subject to certain production, severance, and extraction taxes and royalties that are charged based on coal production or coal sales. The taxes and royalties are paid to federal, state and local governments or to private parties based on legally established methodologies, rates, and timeframes. Amounts payable within one year are classified as current liabilities and are included in Royalties and production taxes in the Consolidated Balance Sheets. Amounts payable after one year are included in Other liabilities, noncurrent. We are open to federal and state audits on our non-income based taxes and royalties until statutes of limitations expire. Through the normal course of business, we receive audit findings and assessments, which may be resolved or disputed and appealed. If it is determined that it is more likely than not that adjustments to our filed positions are warranted, we record an accrual.
Equity-Based Compensation
We grant restricted stock and performance-based share units to certain officers, employees and non-employee directors under our Long-Term Incentive Plan (LTIP) and have granted stock options in the past. We measure the cost of equity-based employee compensation based on the fair value of the award and recognize that cost over the period during which the recipient is required to provide services in exchange for the award, typically the vesting period. Awards granted to employees generally cliff vest over a three-year period while awards granted to non-employee directors vest in one year. The granting of restricted stock results in recognition of compensation cost measured at the grant-date market price. Compensation cost for stock options is measured based on grant-date fair value of the award using the Black-Scholes option valuation model and for equity settled performance-based share units, a Monte Carlo simulation is utilized. For performance-based share units that are expected to be settled in cash upon any vesting, such as the 2016 grant, which vests in 2019, compensation cost is equal to its fair value as of the period-end based upon the share price and our relative total stockholder return and is classified as a liability.
Earnings per Share
We compute basic earnings per share by dividing net income (loss) by the weighted-average number of common shares outstanding during the period. Diluted earnings per share is computed using the weighted-average number of shares of common and potential dilutive common stock outstanding during the period. We apply the treasury stock method to determine potential dilutive common shares related to our stock options and non-vested stock awards.
Contingent Liabilities
We account for contingent liabilities related to litigation, claims, and assessments based on the specific facts and circumstances and our experience with similar matters. We record our best estimate of a loss when the loss is considered probable and the amount of loss is reasonably estimable. When a loss is probable and there is a range of the estimated loss with no best estimate in the range, we record our estimate of the minimum liability. As additional information becomes available, we revise our estimates as appropriate.
Recently Issued Accounting Pronouncements
From time to time, the Financial Accounting Standards Board (“FASB”) or other standard setting bodies issue new accounting pronouncements. Updates to the FASB Accounting Standards Codification are communicated through issuance of an Accounting Standards Update (“ASU”). Unless otherwise discussed, we believe that the impact of recently issued guidance will not be material to our consolidated financial statements upon adoption.
In November 2016, the FASB issued ASU 2016-18, Statement of Cash Flows — Restricted Cash (“ASU 2016-18”), which requires the statement of cash flows to explain the change during the period in total cash, cash equivalents, and amounts generally described as restricted cash and restricted cash equivalents. The new guidance is effective for fiscal years beginning after December 15, 2017, including interim periods within those fiscal years. Early adoption is permitted. We are considering the impact the adoption of ASU 2016-18 may have on our presentation of cash flows.
In October 2016, the FASB issued ASU 2016-16, Accounting for Income Taxes — Intra-Entity Asset Transfers of Assets other than Inventory (“ASU 2016-16”), which would require the recognition of the tax expense from the sale of an asset other than inventory when the transfer occurs, rather than when the asset is sold to a third party or otherwise recovered through use. The new guidance is effective for fiscal years beginning after December 15, 2017, including interim periods
CLOUD PEAK ENERGY INC.
NOTES TO CONSOLIDATED FINANCIAL STATEMENTS
within those fiscal years. Early adoption is permitted. We are considering the impact the adoption of ASU 2016-16 may have on our results of operations, financial condition, and cash flows.
In August 2016, the FASB issued ASU 2016-15, Classification of Certain Cash Receipts and Cash Payments (“ASU 2016-15”), which standardizes cash flow statement classification of certain transactions, including cash payments for debt prepayment or extinguishment, proceeds from insurance claim settlements, and distributions received from equity method investments. The new guidance is effective for fiscal years beginning after December 15, 2017, including interim periods within those fiscal years. Early adoption is permitted. We are considering the impact the adoption of ASU 2016-15 may have on our presentation of cash flows.
In March 2016, the FASB issued ASU 2016-09, Improvements to Share Based Payment Accounting (“ASU 2016-09”), which simplifies the accounting for stock-based compensation transactions, including income tax consequences, classification of awards as either equity or liabilities, and classification on the statement of cash flows. The new guidance is effective for fiscal years beginning after December 15, 2016, including interim periods within those fiscal years. Early adoption is permitted. We do not anticipate that adoption of this standard will have a significant impact on our results of operations, financial condition, and cash flows.
In February 2016, the FASB issued ASU 2016-02, Leases (“ASU 2016-02”), which would require the lessee to recognize the assets and liabilities on all leases that may have not been recognized in the past. The new guidance is effective for fiscal years beginning after December 15, 2018, including interim periods within those fiscal years. Although early adoption is permitted, we anticipate adopting the new standard effective January 1, 2019. We are still evaluating the impact the adoption of ASU 2016-02. However, based upon our initial reviews and the future payments under operating leases disclosed in Note 19, we do not currently anticipate that adoption of this standard will have a significant impact on our results of operations, financial condition, and cash flows.
From May 2014 through December 2016, the FASB issued several ASUs related to Revenue from Contracts with Customers. These ASUs are intended to provide greater insight into both revenue that has been recognized and revenue that is expected to be recognized in the future from existing contracts. The new guidance is effective for interim and annual periods beginning after December 15, 2017, although entities may adopt one year earlier if they choose. The two permitted transition methods under the new standard are the full retrospective method, in which case the standard would be applied to each prior reporting period presented and the cumulative effect of applying the standard would be recognized at the earliest period shown, or the modified retrospective method, in which case the cumulative effect of applying the standard would be recognized at the date of initial application.
During 2016, we started our initial review of contracts with customers and have determined that for the significant majority of our contracts, we do not currently anticipate there would be any change to timing or method of recognizing revenue. As such, we do not believe this new standard will have a material impact on our results of operations, financial condition or cash flows. We are planning to adopt the new standard as of January 1, 2018 and utilize the modified retrospective method.
In August 2014, the FASB issued ASU 2014-15, Presentation of Financial Statements — Going Concern (“ASU 2014-15”), which would require disclosure of uncertainties about an entity’s ability to continue as a going concern. The new guidance is effective for the annual period ending after December 15, 2016 and for interim periods thereafter. We adopted ASU 2014-15 as of December 31, 2016, which did not have a significant impact on our financial statement disclosures.
4. Sale of Decker Mine Interest
On September 12, 2014, we completed the sale of our 50% non-operating interest in the Decker Mine to an affiliate of Ambre Energy North America, Inc. (“Ambre Energy”), now known as Lighthouse Resources Inc. Under the terms of the agreement, Ambre Energy acquired our 50% interest in the Decker Mine and related assets and assumed all reclamation and other liabilities, giving Ambre Energy 100% ownership of the Decker Mine. Ambre Energy also fully replaced our $66.7 million in outstanding reclamation and lease bonds relating to our 50% interest in the Decker Mine’s reclamation and lease liabilities. As we no longer have any ownership interest and all of the Decker Mine liabilities have been assumed by Ambre Energy, Ambre Energy is now fully responsible for reclamation at the end of the Decker Mine’s life. As a result, we released the related $72.2 million of asset retirement obligation in 2014.
CLOUD PEAK ENERGY INC.
NOTES TO CONSOLIDATED FINANCIAL STATEMENTS
In addition, an affiliate of Ambre Energy granted us an option for up to 7.7 million tons per year of its throughput capacity at the proposed Millennium Bulk Terminals (“MBT”) coal export facility. We originally valued the option using a discounted cash flow analysis based on comparable agreements, the terms of the agreement and general market data.
As a result of this agreement, during the year ended December 31, 2014, we recognized a gain on sale of the Decker Mine interest of $74.3 million as follows (in thousands):
|
Net cash surrendered |
|
$ |
(207 |
) |
|
ARO liability released |
|
72,175 |
| |
|
Millennium Bulk Terminals option |
|
5,000 |
| |
|
Write-off of prior service costs related to the Decker Mine pension plan |
|
(3,183 |
) | |
|
Net other (assets) liabilities |
|
820 |
| |
|
Other |
|
(343 |
) | |
|
Pre-tax gain on sale of Decker Mine interest |
|
$ |
74,262 |
|
Results of operations for our proportionate share of the Decker Mine up to the date of sale included in the Consolidated Statements of Operations consist of the following for the year ended December 31, 2014 (in thousands):
|
|
|
|
| |
|
Revenue |
|
$ |
15,653 |
|
|
Costs and expenses |
|
19,475 |
| |
|
Operating income (loss) |
|
(3,823 |
) | |
|
Other income (expense) |
|
(41 |
) | |
|
Income (loss) before income tax provision |
|
$ |
(3,863 |
) |
5. Inventories, Net
Inventories, net, consisted of the following as of December 31 (in thousands):
|
|
|
2016 |
|
2015 |
| ||
|
Materials and supplies |
|
$ |
67,933 |
|
$ |
74,353 |
|
|
Less: Obsolescence allowance |
|
(956 |
) |
(988 |
) | ||
|
Material and supplies, net |
|
66,977 |
|
73,365 |
| ||
|
Coal inventory |
|
1,706 |
|
3,398 |
| ||
|
Inventories, net |
|
$ |
68,683 |
|
$ |
76,763 |
|
6. Fair Value of Financial Instruments
We use a three-level fair value hierarchy that categorizes assets and liabilities measured at fair value based on the observability of the inputs utilized in the valuation. The levels of the hierarchy, as defined below, give the highest priority to unadjusted quoted prices in active markets for identical assets or liabilities and the lowest priority to unobservable inputs.
· Level 1 is defined as observable inputs such as quoted prices in active markets for identical assets. Our Level 1 assets currently include money market funds.
· Level 2 is defined as observable inputs other than Level 1 prices, including quoted prices for similar assets or liabilities in an active market, quoted prices for identical assets and liabilities in markets that are not active, or other inputs that are observable or can be corroborated by observable market data for substantially the full term of the assets or liabilities. Our Level 2 assets and liabilities include derivative financial instruments with fair values derived from quoted prices in over-the-counter markets or from prices received from direct broker quotes.
· Level 3 is defined as unobservable inputs in which little or no market data exists, therefore requiring an entity to develop its own assumptions. We had no Level 3 financial assets or liabilities as of December 31, 2016 or 2015.
CLOUD PEAK ENERGY INC.
NOTES TO CONSOLIDATED FINANCIAL STATEMENTS
The tables below set forth, by level, our financial assets and liabilities that are recorded at fair value in the accompanying Consolidated Balance Sheets (in thousands):
|
|
|
Fair Value as of December 31, 2016 |
| |||||||
|
Description |
|
Level 1 |
|
Level 2 |
|
Total |
| |||
|
Assets |
|
|
|
|
|
|
| |||
|
Money market funds(1) |
|
$ |
12,997 |
|
$ |
— |
|
$ |
12,997 |
|
|
Derivative financial instruments |
|
$ |
— |
|
$ |
752 |
|
$ |
752 |
|
|
Liabilities |
|
|
|
|
|
|
| |||
|
Derivative financial instruments |
|
$ |
— |
|
$ |
— |
|
$ |
— |
|
|
|
|
Fair Value as of December 31, 2015 |
| |||||||
|
Description |
|
Level 1 |
|
Level 2 |
|
Total |
| |||
|
Assets |
|
|
|
|
|
|
| |||
|
Money market funds(1) |
|
$ |
41,285 |
|
$ |
— |
|
$ |
41,285 |
|
|
Liabilities |
|
|
|
|
|
|
| |||
|
Derivative financial instruments |
|
— |
|
10,734 |
|
10,734 |
| |||
(1) Included in Cash and cash equivalents along with $70.7 million and $48.0 million of demand deposits as of December 31, 2016 and 2015, respectively.
We did not have any transfers between levels during the years ended December 31, 2016 and 2015. Our policy is to value all transfers between levels using the beginning of period valuation.
7. Derivative Financial Instruments
Coal Contracts
We use derivative financial instruments to help manage our exposure to market changes in coal prices. To manage our exposure in the international markets, we have international coal forward contracts linked to forward Newcastle coal prices. We use domestic coal futures contracts referenced to the 8800 Btu coal price sold from the PRB, as quoted on the Chicago Mercantile Exchange (“CME”), to help manage our exposure to market changes in domestic coal prices.
Under the international coal forward contracts, if the monthly average index price is lower than the contract price, we receive the difference, and if the monthly average index price is higher than the contract price, we pay the difference. For our 2016 positions, we executed offsetting contracts to lock in the amount we received each month.
Under the domestic coal futures contracts, if the monthly average index price is higher than the contract price, we receive the difference, and if the monthly average index price is lower than the contract price, we pay the difference. Amounts due to us or to the CME as a result of changes in the market price of our open domestic coal futures contracts and to fulfill margin requirements are received or paid through our brokerage bank on a daily basis; therefore, there is no asset or liability on the Consolidated Balance Sheets.
During the year ended December 31, 2015, we entered into international coal put options. Under the international put options, if the monthly average index price was lower than the option price, we received the difference, and if the monthly average index price was higher than the option price, we did not receive or pay anything. All of our international coal put option positions were closed as of December 31, 2015 as forecasted shipments were reduced to zero for 2016 under the amended port and rail agreements described in Note 10. We did not enter in to any international coal put options during the year ended December 31, 2016.
WTI Derivatives
We use derivative financial instruments, such as collars and swaps, to help manage our exposure to market changes in diesel fuel prices. The derivatives are indexed to the West Texas Intermediate (“WTI”) crude oil price as quoted on the
CLOUD PEAK ENERGY INC.
NOTES TO CONSOLIDATED FINANCIAL STATEMENTS
New York Mercantile Exchange. As such, the nature of the derivatives does not directly offset market changes to our diesel costs.
Under a collar agreement, we pay the difference between the monthly average index price and a floor price if the index price is below the floor, and we receive the difference between the ceiling price and the monthly average index price if the index price is above the ceiling price. No amounts are paid or received if the index price is between the floor and ceiling prices. While we would not receive the full benefit of price decreases beyond the floor price, the collars mitigate the risk of crude oil price increases and thereby increased diesel costs that would otherwise have a negative impact on our cash flow. We used collar agreements to fix a portion of our forecasted diesel costs for 2016. All collar agreements were settled as of December 31, 2016.
Under a swap agreement, if the monthly average index price is higher than the swap price, we receive the difference and if the monthly average index price is lower than the swap price, we pay the difference. We used swap agreements to fix a portion of our forecasted diesel costs for 2016 and all of our forecasted diesel costs for 2017.
As of December 31, 2016, we were fully hedged for 2017 and held the following WTI derivative financial instruments:
|
|
|
Swaps |
| |||
|
Settlement Period |
|
Notional |
|
Weighted- |
| |
|
|
|
(barrels in |
|
|
| |
|
|
|
thousands) |
|
|
| |
|
2017 swap positions (1) |
|
636 |
|
$ |
55.00 |
|
|
Total |
|
636 |
|
$ |
55.00 |
|
(1) Represents 100% of expected diesel consumption for 2017.
U.S. On-Highway Diesel Derivatives
Additionally, we entered into swap positions indexed to the U.S. On-Highway Diesel prices to help fix a portion of the rail fuel surcharge for 2015 and 2016. These swap positions were intended to help manage risk around price fluctuations in the rail fuel surcharge for our rail transportation cost for coal shipments to Westshore. The rail fuel surcharge is priced using the Department of Energy’s U.S. On-Highway Diesel Fuel Prices (“U.S. On-Highway Diesel”). Under the swap agreement, if the monthly average index price was higher than the swap price, we received the difference, and if the monthly average index price was lower than the swap price, we paid the difference. All of our U.S. On-Highway Diesel swap positions were closed as of December 31, 2015 as forecasted shipments were reduced to zero for 2016 under the amended port and rail agreements described in Note 10. We did not enter in to any U.S. On-Highway Diesel swap positions during the year ended December 31, 2016.
Offsetting and Balance Sheet Presentation
|
|
|
December 31, 2016 |
| ||||||||||||||||
|
|
|
|
|
Gross Amounts Offset in |
|
Net Amounts Presented |
| ||||||||||||
|
|
|
Gross Amounts |
|
the Consolidated Balance |
|
in the Consolidated |
| ||||||||||||
|
|
|
Recognized |
|
Sheets |
|
Balance Sheets |
| ||||||||||||
|
|
|
Assets |
|
Liabilities |
|
Assets |
|
Liabilities |
|
Assets |
|
Liabilities |
| ||||||
|
International coal forward contracts |
|
$ |
— |
|
$ |
— |
|
$ |
— |
|
$ |
— |
|
$ |
— |
|
$ |
— |
|
|
WTI derivative financial instruments |
|
752 |
|
— |
|
— |
|
— |
|
752 |
|
— |
| ||||||
|
Total |
|
$ |
752 |
|
$ |
— |
|
$ |
— |
|
$ |
— |
|
$ |
752 |
|
$ |
— |
|
CLOUD PEAK ENERGY INC.
NOTES TO CONSOLIDATED FINANCIAL STATEMENTS
|
|
|
December 31, 2015 |
| ||||||||||||||||
|
|
|
|
|
Gross Amounts Offset in |
|
Net Amounts Presented |
| ||||||||||||
|
|
|
Gross Amounts |
|
the Consolidated Balance |
|
in the Consolidated |
| ||||||||||||
|
|
|
Recognized |
|
Sheets |
|
Balance Sheets |
| ||||||||||||
|
|
|
Assets |
|
Liabilities |
|
Assets |
|
Liabilities |
|
Assets |
|
Liabilities |
| ||||||
|
International coal forward contracts |
|
$ |
7,462 |
|
$ |
(398 |
) |
$ |
(7,462 |
) |
$ |
7,462 |
|
$ |
— |
|
$ |
7,064 |
|
|
WTI derivative financial instruments |
|
— |
|
(17,798 |
) |
— |
|
— |
|
— |
|
(17,798 |
) | ||||||
|
Total |
|
$ |
7,462 |
|
$ |
(18,196 |
) |
$ |
(7,462 |
) |
$ |
7,462 |
|
$ |
— |
|
$ |
(10,734 |
) |
Net amounts of derivative assets are included in Derivative financial instruments and net amounts of derivative liabilities are included in Accrued expenses in the Consolidated Balance Sheets. There were no cash collateral requirements as of December 31, 2016 or December 31, 2015.
Derivative Gains and Losses
(Gains) and losses on derivative financial instruments recognized in the Consolidated Statements of Operations for the years ended December 31 were as follows (in thousands):
|
|
|
2016 |
|
2015 |
|
2014 |
| |||
|
International coal forward contracts |
|
$ |
(61 |
) |
$ |
4,382 |
|
$ |
(21,369 |
) |
|
International coal put options |
|
— |
|
(5,813 |
) |
— |
| |||
|
Domestic coal futures contracts |
|
(55 |
) |
4,340 |
|
1,701 |
| |||
|
WTI derivative financial instruments |
|
(8,065 |
) |
20,229 |
|
11,863 |
| |||
|
U.S. On-Highway Diesel derivative financial instruments |
|
— |
|
7,496 |
|
— |
| |||
|
Net derivative financial instruments loss (gain) |
|
$ |
(8,180 |
) |
$ |
30,635 |
|
$ |
(7,805 |
) |
The mark-to-market loss on the WTI and U.S. On-Highway derivative financial instruments in 2015 was related to the decline in oil prices to an average forward price of $37.04 per barrel as of December 31, 2015. See Note 6 for a discussion related to the fair value of derivative financial instruments.
8. Property, Plant and Equipment, Net
Property, plant and equipment, net consisted of the following as of December 31 (in thousands):
|
|
|
2016 |
|
2015 |
| ||
|
Land, surface rights, and mineral rights(1) |
|
$ |
1,643,096 |
|
$ |
1,636,700 |
|
|
Mining equipment |
|
915,649 |
|
885,903 |
| ||
|
Construction in progress |
|
11,467 |
|
33,404 |
| ||
|
Other equipment |
|
38,966 |
|
39,462 |
| ||
|
Buildings and improvements |
|
72,998 |
|
72,627 |
| ||
|
Total |
|
2,682,176 |
|
2,668,096 |
| ||
|
Less: accumulated depreciation and depletion |
|
(1,249,815 |
) |
(1,179,725 |
) | ||
|
Property, plant and equipment, net |
|
$ |
1,432,361 |
|
$ |
1,488,371 |
|
(1) Includes mineral rights of $685.9 million as of December 31, 2016 and 2015, attributable to areas where we were not yet engaged in mining operations and, therefore, the mineral rights are not being depleted.
CLOUD PEAK ENERGY INC.
NOTES TO CONSOLIDATED FINANCIAL STATEMENTS
During the years ended December 31, interest costs capitalized on mine development and construction projects totaled the following (in thousands):
|
|
|
2016 |
|
2015 |
|
2014 |
| |||
|
Interest costs capitalized |
|
$ |
1,205 |
|
$ |
1,018 |
|
$ |
208 |
|
Included in mining equipment above are capital leases under various lease schedules, which are subject to the master lease agreement, and are pre-payable at our option. Assets under capital lease consisted of the following as of December 31 (in thousands):
|
|
|
2016 |
|
2015 |
| ||
|
Leased assets |
|
$ |
13,967 |
|
$ |
12,998 |
|
|
Less: accumulated depreciation and depletion |
|
4,993 |
|
3,190 |
| ||
|
Capital equipment lease assets, net |
|
$ |
8,974 |
|
$ |
9,808 |
|
Our capital equipment lease obligations are included in Other liabilities. Future payments for these obligations for the years ended December 31 are as follows (in thousands):
|
2017 |
|
$ |
2,754 |
|
|
2018 |
|
2,538 |
| |
|
2019 |
|
1,680 |
| |
|
2020 |
|
880 |
| |
|
2021 |
|
— |
| |
|
Total |
|
7,852 |
| |
|
Less: interest |
|
327 |
| |
|
Total principal payments |
|
7,524 |
| |
|
Less: current portion |
|
2,567 |
| |
|
Capital equipment lease obligations, net of current portion |
|
$ |
4,957 |
|
Interest on the variable rate capital leases is imputed based on the one-month LIBOR plus 1.95% for a rate of 2.69% and 2.30% as of December 31, 2016 and 2015, respectively. Due to the variable nature of the imputed interest, fair value is equal to carrying value.
9. Impairments
Goodwill
During the second quarter of 2015, due to the weak domestic coal market outlook, especially as it related to 8400 Btu coal, coupled with our decision to reduce annual production at the Cordero Rojo Mine, we performed a goodwill impairment assessment. We determined that the carrying amount of the Cordero Rojo Mine exceeded its estimated fair value. The implied fair value of the related goodwill, which related to an acquisition completed in 1997, was $0 requiring a $33.4 million impairment charge related to our Owned and Operated Mines segment, which is reflected in the year ended December 31, 2015. The remaining $2.3 million balance in goodwill relates to our other mines in the Owned and Operated Mines segment.
Intangible Assets
During the fourth quarter of 2015, due to consensus projections of weak export pricing, a weak outlook for coal exports, and our associated decision to amend the port and rail contracts, we determined that the carrying values of certain intangible assets in our Logistics and Related Activities segment were impaired. The port access rights related to Westshore Terminals Limited Partnership (“Westshore”), MBT, and Gateway Pacific Terminal (“GPT”) of $33.4 million, $5.0 million, and $13.8 million, respectively, were written off during the year ended December 31, 2015.
CLOUD PEAK ENERGY INC.
NOTES TO CONSOLIDATED FINANCIAL STATEMENTS
Due to the factors described above, we fully impaired our equity investment in GPT by recording a charge of $6.0 million during the fourth quarter of 2015. No impairments of intangible assets were recognized for the years ended December 31, 2016 or 2014.
Long-Lived Assets
Due to lower planned production estimates as well as continued weak coal prices, management completed an impairment analysis with respect to each of the mines in our Owned and Operated Mines segment during the second quarter of 2016. Management continues to evaluate certain idled equipment to determine if the associated costs are recoverable during the life of the mine but presently believes that all costs are recoverable. During the year ended December 31, 2016, we recorded impairments of $2.6 million in the Owned and Operated Mines segment, primarily for engineering costs related to the Overland Conveyor project at our Antelope Mine and $2.0 million related to a shovel that we no longer expect to use because of declining production that is part of Other. No impairments of long-lived assets were recognized for the years ended December 31, 2015 or 2014.
10. Port Access Rights and Related Transportation Contracts
Westshore Terminals
In August 2014, we paid $37.1 million to Coal Valley Resources, Inc. (“CVRI”), a unit of Westmoreland Coal Company, to terminate its throughput agreement with Westshore. We initially capitalized the $37.1 million payment as an intangible asset and began amortizing it in 2015 on a straight line basis over the term of the contract. However, as previously described in Note 9, in consideration of previous consensus projections of weak export pricing, a weak outlook for coal exports, and our prior decision to amend the port and rail contracts to require no export shipments from 2016 through 2018 as described below, we determined that the carrying value of this intangible asset was impaired as of year-end 2015. We wrote off the Westshore port access rights of $33.4 million during the year ended December 31, 2015.
In October 2015, we announced an amended agreement with Westshore whereby the previously committed volumes for 2016 through 2018 were reduced to zero in exchange for an upfront payment made in October 2015, plus quarterly payments during 2016 through 2018, as specified in the amended agreement.
In December 2015, we also announced an amended agreement with BNSF, whereby the previously committed volumes for 2016 through 2018 were reduced to zero in exchange for an upfront payment made in December 2015, plus quarterly payments during 2016 through 2018, as specified in the amended agreement. Under the terms of the existing agreement with BNSF, we have the ability to cancel the agreement with one year’s advance notice in exchange for a buy-out payment. Should we elect to cancel the agreement, payments made under the December 2015 amendment with respect to 2016 through 2018 would be applied against the required buy-out payment on a dollar for dollar basis. We made upfront payments totaling $37.5 million during the fourth quarter of 2015 relating to these two amendments. We capitalized the $37.5 million in payments made to Westshore and BNSF as a deferred asset and amortized these costs throughout 2016, and will continue to amortize the costs through 2018.
In November 2016, due to the improvement in export coal prices, we entered into agreements with Westshore and BNSF to ship coal during the fourth quarter of 2016. These agreements were effective for the fourth quarter of 2016 only, and did not change the aforementioned amended agreements discussed above, or the terms of the previous throughput or transportation agreements. Under the fourth quarter agreements, we received a partial credit against current charges for the quarterly payments made under the previous agreements.
At December 31, 2016, we terminated our previous agreement with Westshore and entered into a new agreement. In February 2017, we terminated our previous agreement with BNSF and entered into a new agreement effective in April 2017. The new agreements provide for shipments in 2017 and 2018 and require minimum payments for those two years. We have the right to terminate our commitments for 2017 and 2018 at any time in exchange for buyout payments.
The new agreements do not contain any commitments subsequent to the end of 2018, unless the parties elect to extend the agreements through 2019. Additionally, after the new Westshore agreement terminates and through 2024, if we choose to ship to export customers, we are required to offer to ship through Westshore up to a specified annual tonnage on terms similar to the new agreement before shipping through any other export terminal. Westshore has the right to accept or reject our offer in its sole discretion.
CLOUD PEAK ENERGY INC.
NOTES TO CONSOLIDATED FINANCIAL STATEMENTS
In exchange for the termination of the previous agreements, we made termination payments. These amounts have been deferred and will be amortized, along with the previous amendment payments made in 2015, over the two-year life of the new agreement. As of December 31, 2016 and 2015, there was $35.3 million and $37.5 million, respectively, recorded as a deferred asset for these agreements. Amortization of the agreements was $32.7 million for the year ended December 31, 2016.
Intangible Assets Related to Port Access Rights
Port access rights, net consisted of the following as of December 31 (in thousands):
|
|
|
2016 |
|
2015 |
| ||
|
Port access rights (1) |
|
$ |
— |
|
$ |
55,940 |
|
|
Less: Accumulated amortization (2) |
|
— |
|
(3,710 |
) | ||
|
Less: Impairments (3) |
|
— |
|
(52,230 |
) | ||
|
Port access rights, net |
|
$ |
— |
|
$ |
— |
|
(1) As of December 31, 2015 amount included $37.1 million related to Westshore, $13.8 million related to GPT in Washington State, and $5.0 million related to MBT in Washington State.
(2) Amortization of the Westshore port access rights.
(3) In consideration of consensus projections of weak export pricing, a weak outlook for coal exports and our associated decision to amend our port and rail take-or-pay requirements, we determined that the carrying value of these intangible assets was impaired. We wrote off $33.4 million, $13.8 million, and $5.0 million during the year ended December 31, 2015 related to port access rights at Westshore, GPT, and MBT, respectively.
We previously had a minority ownership interest in the joint venture that was seeking to develop GPT in Washington State. SSA Marine, the majority interest holder and project developer, recently notified us of its intention to no longer pursue a coal terminal. As a result, in January 2017, we abandoned our ownership interest in the joint venture, and we no longer have any ownership interest or associated funding obligations for the joint venture.
Take-or-Pay
We incurred $51.5 million, $154.4 million and $149.3 million in costs under our logistics agreements with Westshore and BNSF during the years ended December 31, 2016, 2015 and 2014, respectively, including shortfall payments of $32.7 million and $26.2 million in 2016 and 2015, respectively. There were no shortfall payments made in 2014.
11. Equity Method Investments
Equity method investments include our 50% equity investment in Venture Fuels Partnership, a coal marketing company, and our 49% ownership interest in the Gateway Pacific Terminal. In consideration of consensus projections of weak export pricing and a weak outlook for coal exports, we wrote off our equity investment in GPT by recording a charge of $6.0 million during the fourth quarter of 2015. Our equity method investments are included in noncurrent Other assets and had a carrying amount of the following as of December 31 (in thousands):
|
|
|
2016 |
|
2015 |
| ||
|
Venture Fuels Partnership |
|
$ |
7,575 |
|
$ |
6,681 |
|
|
Other |
|
1,006 |
|
1,005 |
| ||
|
Total equity method investments |
|
$ |
8,581 |
|
$ |
7,686 |
|
CLOUD PEAK ENERGY INC.
NOTES TO CONSOLIDATED FINANCIAL STATEMENTS
Income (loss) from unconsolidated affiliates, net of tax included the following for the years ended December 31 (in thousands):
|
|
|
2016 |
|
2015 |
|
2014 |
| |||
|
Venture Fuels Partnership |
|
$ |
2,394 |
|
$ |
1,801 |
|
$ |
584 |
|
|
Gateway Pacific Terminal |
|
(1,753 |
) |
(613 |
) |
— |
| |||
|
Other |
|
16 |
|
11 |
|
(5 |
) | |||
|
Income (loss) from unconsolidated affiliates, net of tax |
|
$ |
657 |
|
$ |
1,200 |
|
$ |
579 |
|
We received $1.5 million and $2.3 million in distributions for the years ended December 31, 2016 and 2014, respectively, related to our investment in Venture Fuels Partnership. We received no distributions for the year ended December 31, 2015.
We have related party transactions with our equity method investments. Related party activity consists primarily of coal sales to Venture Fuels Partnership, for delivery of coal under arms-length commercial arrangements in the ordinary course of business.
The following table summarizes related party transactions for the years ended December 31 (in thousands):
|
|
|
2016 |
|
2015 |
|
2014 |
| |||
|
Sales of coal to Venture Fuels Partnership |
|
$ |
11,922 |
|
$ |
26,754 |
|
$ |
20,755 |
|
12. Tax Agreement Liability
In connection with the 2009 initial public offering (“IPO”), we entered into the TRA with Rio Tinto, our former parent, and recognized a liability for the undiscounted amounts that we estimated would be paid to Rio Tinto under this agreement. The amounts paid were determined based on an annual calculation of future income tax savings that we actually realized as a result of the tax basis increase that resulted from the 2009 IPO and 2010 Secondary Offering transactions. Generally, we retained 15% of the realized tax savings generated from the tax basis step-up and Rio Tinto was entitled to the remaining 85%.
In August 2014, we entered into an acceleration and release agreement with Rio Tinto whereby we agreed to pay $45.0 million to Rio Tinto to terminate the TRA. This payment settles all existing and future liabilities that were or would have been owed under the TRA. At the date of signing, we carried an undiscounted liability of $103.6 million in respect of our estimated future obligations under the TRA and anticipated making cash payments of approximately $14 million each year in 2014 and 2015 and additional payments in subsequent years.
The termination of the TRA resulted in a non-cash gain during the third quarter of 2014 of $58.6 million before tax and $37.1 million after adjustments to the associated deferred tax assets. We continue to retain the deferred tax assets related to the step up in tax basis as a result of the 2009 IPO and 2010 secondary offering by CPE Inc. of its common stock on behalf of Rio Tinto (the “Secondary Offering”). As such, we now expect to benefit from 100% of the increased tax depreciation.
13. Senior Notes
On October 17, 2016, our direct and indirect wholly-owned subsidiaries, CPE Resources and Cloud Peak Energy Finance Corp. (collectively, the “Issuers”), completed offers to exchange (the “Exchange Offers”) up to $400 million aggregate principal amount of their outstanding $300 million aggregate principal balance of 8.50% Senior Notes due 2019 (the “2019 Notes”) and $200 million aggregate principal balance of 6.375% Senior Notes due 2024 (the “2024 Notes”, together with the 2019 Notes, the “Old Notes”) for new 12.00% Second Lien Senior Secured Notes due 2021 to be issued by the Issuers (the “2021 Notes”) and, in some cases, cash consideration, subject to the terms and conditions of the Exchange Offers. The primary purposes of the Exchange Offers were to extend the maturity of the 2019 Notes to November 2021, to reduce leverage by capturing the trading discounts on the Old Notes and to further our ongoing efforts to provide sufficient liquidity to manage through depressed industry conditions and better position the capital structure to help facilitate a future extension of the Credit Agreement or new bank facility or other line of credit before the Credit Agreement terminates in February 2019.
CLOUD PEAK ENERGY INC.
NOTES TO CONSOLIDATED FINANCIAL STATEMENTS
Holders of $237.9 million aggregate principal amount of the 2019 Notes and $143.6 million aggregate principal amount of the 2024 Notes tendered such notes pursuant to the Exchange Offers. On October 17, 2016, the Issuers accepted for exchange all such Old Notes validly tendered, issued $290.4 million aggregate principal amount of 2021 Notes, and made cash payments of $26.0 million in the aggregate (including $7.7 million in accrued and unpaid interest) to tendering holders of the Old Notes. The transaction resulted in recognition of $4.7 million in expenses for the year ended December 31, 2016. Upon completion of the Exchange Offers, $62.1 million aggregate principal amount of the 2019 Notes and $56.4 million aggregate principal amount of the 2024 Notes remain outstanding.
The exchanges of the Old Notes for the 2021 Notes were accounted for as a troubled debt restructuring. As the future cash flows of the 2021 Notes were greater than the carrying amount of the Old Notes, no gain was recognized. The amount of extinguished debt will be amortized over the remaining life of the 2021 Notes using the effective interest method and recognized as a reduction of interest expense. The effective interest rate of the 2021 Notes is 6.46% compared to the stated rate of 12.00%. As a result, our reported interest expense will be significantly less than the contractual cash interest payments throughout the term of the 2021 Notes. Our current tax attributes are expected to offset any cash tax impacts from the Exchange Offers
We refer to the 2019 Notes, the 2021 Notes, and the 2024 Notes collectively as the “senior notes.” The 2019 Notes, 2021 Notes, and 2024 Notes bear interest at fixed annual rates of 8.50%, 12.00%, and 6.375%, respectively. There are no mandatory redemption or sinking fund payments for the senior notes. Interest payments are due semi-annually on June 15 and December 15 for the 2019 Notes, due semi-annually on May 1 and November 1 for the 2021 Notes, and due semi-annually on March 15 and September 15 for the 2024 Notes. Subject to certain limitations, we may redeem the 2019 Notes by paying specified redemption prices in excess of their principal amount prior to December 15, 2017, or by paying their principal amount thereafter, plus accrued and unpaid interest, if any. We may also redeem some or all of the 2021 Notes by paying specified redemption prices in excess of their principal amount, plus accrued and unpaid interest, if any, prior to November 1, 2020, or by paying their principal amount thereafter, plus accrued and unpaid interest, if any. Lastly, we may redeem some or all of the 2024 Notes by paying specified redemption prices in excess of their principal amount, plus accrued and unpaid interest, if any, prior to March 15, 2022, or by paying their principal amount thereafter, plus accrued and unpaid interest, if any.
The 2021 Notes and 2024 Notes are jointly and severally guaranteed by CPE Inc. and by all of our existing and future domestic restricted subsidiaries that guarantee our debt under our Credit Agreement. The 2019 Notes are jointly and severally guaranteed by CPE Inc. and by all of our existing and future restricted subsidiaries that guarantee our debt under our Credit Agreement. See Note 14. Substantially all of our current consolidated subsidiaries, excluding Cloud Peak Energy Receivables LLC, are considered to be restricted subsidiaries and guarantee the senior notes. The 2021 Notes are secured by second-priority liens on substantially all of our assets.
The indentures governing the senior notes, among other things, limit our ability and the ability of our restricted subsidiaries to incur additional indebtedness and issue preferred equity; pay dividends or distributions; repurchase equity or repay subordinated indebtedness; make investments or certain other restricted payments; create liens; sell assets; enter into agreements that restrict dividends, distributions, or other payments from restricted subsidiaries; enter into transactions with affiliates; and consolidate, merge, or transfer all or substantially all of their assets and the assets of their restricted subsidiaries on a combined basis.
Upon the occurrence of certain transactions constituting a “change in control” as defined in the indentures, holders of our senior notes could require us to repurchase all outstanding senior notes at 101% of the principal amount thereof, plus accrued and unpaid interest, if any, to the date of repurchase.
On March 11, 2014, the Issuers issued the 2024 Notes, of which the net proceeds were used to fund a portion of the Issuers’ tender offer and consent solicitation for the Issuers’ previously existing 8.25% Senior Notes due 2017 (“2017 Notes”). When we retired the 2017 Notes, we recognized a loss on early retirement of debt of $19.3 million, which was comprised of $13.8 million related to the premium paid in excess of par, $5.1 million related to the write-off of deferred financing costs and original issue discount, and $0.4 million in related expenses. The loss is classified in Interest expense.
CLOUD PEAK ENERGY INC.
NOTES TO CONSOLIDATED FINANCIAL STATEMENTS
Senior notes consisted of the following as of December 31 (in thousands):
|
|
|
2016 |
| |||||||||||||
|
|
|
Carrying |
|
Unamortized |
|
Unamortized |
|
Principal |
|
Fair |
| |||||
|
8.50% senior notes due 2019 |
|
$ |
61,383 |
|
$ |
711 |
|
$ |
— |
|
$ |
62,094 |
|
$ |
57,903 |
|
|
12.00% second lien senior notes due 2021 |
|
358,217 |
|
17,511 |
|
(85,362 |
) |
290,366 |
|
306,336 |
| |||||
|
6.375% senior notes due 2024 |
|
55,410 |
|
998 |
|
— |
|
56,408 |
|
42,306 |
| |||||
|
Total senior notes |
|
$ |
475,009 |
|
$ |
19,220 |
|
$ |
(85,362 |
) |
$ |
408,868 |
|
$ |
406,545 |
|
|
|
|
2015 |
| |||||||||||||
|
|
|
Carrying |
|
Unamortized |
|
Unamortized |
|
Principal |
|
Fair |
| |||||
|
8.50% senior notes due 2019 |
|
$ |
295,214 |
|
$ |
4,785 |
|
$ |
— |
|
$ |
300,000 |
|
$ |
151,500 |
|
|
6.375% senior notes due 2024 |
|
195,945 |
|
4,055 |
|
— |
|
200,000 |
|
61,000 |
| |||||
|
Total senior notes |
|
$ |
491,160 |
|
$ |
8,840 |
|
$ |
— |
|
$ |
500,000 |
|
$ |
212,500 |
|
(1) The fair value of the senior notes was based on observable market inputs, which are considered Level 2 in the fair value hierarchy.
The following table reflects the impact of the Exchange Offers on our Senior notes:
|
|
|
December |
|
Exchanges |
|
Deferred |
|
Cash |
|
Amortized |
|
December |
| ||||||
|
8.50% senior notes due 2019 |
|
$ |
295,214 |
|
$ |
(199,703 |
) |
$ |
(35,062 |
) |
$ |
— |
|
$ |
933 |
|
$ |
61,383 |
|
|
12.00% second lien senior notes due 2021 |
|
— |
|
290,366 |
|
85,362 |
|
(18,335 |
) |
824 |
|
358,217 |
| ||||||
|
6.375% senior notes due 2024 |
|
195,945 |
|
(90,663 |
) |
(50,300 |
) |
— |
|
427 |
|
55,410 |
| ||||||
|
Total senior notes |
|
$ |
491,160 |
|
$ |
— |
|
$ |
— |
|
$ |
(18,335 |
) |
$ |
2,184 |
|
$ |
475,009 |
|
Future Maturities
Aggregate future maturities of long-term debt as of December 31, 2016 are as follows (in thousands):
|
2019 |
|
$ |
62,094 |
|
|
2021 |
|
290,366 |
| |
|
2024 |
|
56,408 |
| |
|
Less unamortized debt issuance costs |
|
(19,032 |
) | |
|
Less unamortized discount |
|
(188 |
) | |
|
Plus unamortized deferred gain |
|
85,362 |
| |
|
Total long-term debt |
|
$ |
475,009 |
|
CLOUD PEAK ENERGY INC.
NOTES TO CONSOLIDATED FINANCIAL STATEMENTS
14. Other Obligations
Accounts Receivable Securitization Program
In January 2013, we formed Cloud Peak Energy Receivables LLC, a special purpose, bankruptcy-remote 100% owned subsidiary, to purchase, subject to certain exclusions, in a true sale, trade receivables generated by certain of our subsidiaries without recourse (other than customary indemnification obligations for breaches of specific representations and warranties) and then transfer undivided interests of those accounts receivable to a financial institution for cash borrowings for our ultimate benefit. On February 11, 2013, we executed an Accounts Receivable Securitization Program (“A/R Securitization Program”) with a committed capacity of up to $75 million, which was due to expire on February 11, 2015. The total borrowings are limited by eligible accounts receivable, as defined under the terms of the A/R Securitization Program. On January 23, 2015, we entered into an agreement extending the term of the A/R Securitization Program to January 23, 2018. On January 31, 2017, the A/R Securitization Program was amended to extend the term of the A/R Securitization Program to January 23, 2020, allows for the ability to issue letters of credit and revise the maximum borrowing capacity for both cash and letters of credit to $70 million. All other terms of the program remained substantially the same. As of December 31, 2016, the A/R Securitization Program would have allowed for $24 million of borrowing capacity. There were no borrowings outstanding from the A/R Securitization Program as of December 31, 2016 or December 31, 2015. Cloud Peak Energy Receivables LLC is included in our consolidated financial statements.
Credit Agreement
On February 21, 2014, Cloud Peak Energy Resources LLC entered into a five-year Credit Agreement with PNC Bank, National Association, as administrative agent, and a syndicate of lenders, which was amended on September 5, 2014 and September 9, 2016 (as amended, the “Credit Agreement”). The Credit Agreement provides us with a senior secured revolving credit facility with a capacity of up to $400 million that can be used to borrow funds or obtain letters of credit. The borrowing capacity under the Credit Agreement is reduced by the undrawn face amount of letters of credit issued and outstanding, which may be up to $250 million at any time.
The September 9, 2016 Second Amendment to the Credit Agreement (the “Second Amendment”) replaced the quarterly EBITDA-based financial covenants that previously required us to (a) maintain defined minimum levels of interest coverage and (b) comply with a maximum net secured debt leverage ratio. These financial covenants were replaced with a new monthly minimum liquidity covenant that requires us to maintain liquidity, as defined in the Credit Agreement, of not less than $125 million as of the last day of each month. The Second Amendment reduced the maximum borrowing capacity under the Credit Agreement to $400 million, from the previous maximum capacity of $500 million. It also revised the permitted debt covenant and permitted lien covenant to allow the issuance of second lien debt in an amount up to $350 million. Additionally, it revised various negative covenants and baskets that would apply to, among other things, the incurrence of debt, making investments, asset dispositions and restricted payments. Lastly, it established a requirement for deposit account control agreements with the administrative agent for certain of our deposit accounts. The Second Amendment did not change the maturity of the Credit Agreement, which remains February 21, 2019.
Loans under the Credit Agreement bear interest at the London Interbank Offered Rate (“LIBOR”) plus an applicable margin of 3.50%. We pay the lenders a commitment fee of 0.50% per year on the unused amount of the Credit Agreement. Letters of credit issued under the Credit Agreement, unless drawn upon, will incur a per annum fee from the date at which they are issued of 3.50%. Letters of credit that are drawn upon may be converted to loans at our request, subject to the conditions to borrowing set forth in the Credit Agreement. In addition, in connection with the issuance of a letter of credit, we are required to pay the issuing bank a fronting fee of 0.125% per annum.
Prior to the Second Amendment, loans under the Credit Agreement bore interest at the London Interbank Offered Rate (“LIBOR”) plus an applicable margin of 2.00% to 2.75%, depending on our net total leverage to EBITDA ratio. We paid the lenders a commitment fee between 0.375% and 0.50% per year, depending on our net total leverage to EBITDA ratio, on the unused amount of the Credit Agreement. Letters of credit issued under the Credit Agreement, unless drawn upon, incurred a per annum fee from the date at which they were issued between 2.00% and 2.75% depending on our net total leverage to EBITDA ratio. Letters of credit that were drawn upon were converted to loans. In addition, in connection with the issuance of a letter of credit, we were required to pay the issuing bank a fronting fee of 0.125% per annum.
Our obligations under the Credit Agreement are secured by substantially all of our assets and substantially all of the assets of certain of our subsidiaries, subject to certain permitted liens and customary exceptions for similar coal financings.
CLOUD PEAK ENERGY INC.
NOTES TO CONSOLIDATED FINANCIAL STATEMENTS
Our obligations under the Credit Agreement are also supported by a guarantee by CPE Inc. and our domestic restricted subsidiaries.
Under the Credit Agreement, the subsidiaries of CPE Inc. are permitted to make distributions to CPE Inc. to enable it to pay (i) federal, state and local income and certain other taxes it incurs that are attributable to the business and operations of its subsidiaries and (ii) amounts on the tax agreement liability, which was terminated in August 2014. In addition, as long as no default under the Credit Agreement exists, the subsidiaries of CPE Inc. also may make annual distributions to CPE Inc. to fund dividends or repurchases of CPE Inc.’s stock and additional distributions in accordance with certain distribution limits in the Credit Agreement. Finally, the subsidiaries of CPE Inc. may make loans to CPE Inc. subject to certain limitations in the Credit Agreement.
As of December 31, 2016, we had no borrowings and the undrawn face amount of letters of credit outstanding under the Credit Agreement was $67.5 million. As of December 31, 2015, there were no borrowings or letters of credit outstanding under the Credit Agreement. We were in compliance with the covenants contained in the Credit Agreement as of December 31, 2016 and December 31, 2015.
Liquidity
Our aggregate availability for borrowing under the Credit Agreement and the A/R Securitization Program was approximately $356.5 million as of December 31, 2016. Our total liquidity, which includes cash and cash equivalents and amounts available under both our Credit Agreement and the A/R Securitization Program, was $440.2 million as of December 31, 2016.
Debt Issuance Costs
Debt issuance costs of $1.3 million related to the decrease in the Credit Agreement’s borrowing capacity were written off in the third quarter of 2016. Debt issuance costs of $3.6 million were incurred in connection with the Second Amendment. These costs were deferred and are being amortized to Interest expense over the remaining term of the Credit Agreement. There were $7.7 million and $8.3 million of unamortized debt issuance costs as of December 31, 2016 and December 31, 2015, respectively, related to the A/R Securitization Program and the Credit Agreement included in noncurrent Other assets.
15. Interest Expense
Interest expense consisted of the following (in thousands):
|
|
|
Year Ended |
| |||||||
|
|
|
December 31, |
| |||||||
|
|
|
2016 |
|
2015 |
|
2014 |
| |||
|
Senior notes |
|
$ |
37,481 |
|
$ |
38,250 |
|
$ |
40,702 |
|
|
Credit Agreement commitment fee |
|
2,665 |
|
2,753 |
|
2,485 |
| |||
|
Federal coal lease obligations imputed interest |
|
342 |
|
2,960 |
|
8,062 |
| |||
|
Amortization of deferred financing costs and original issue discount |
|
5,173 |
|
4,174 |
|
4,321 |
| |||
|
Other |
|
1,724 |
|
442 |
|
260 |
| |||
|
Subtotal |
|
47,385 |
|
48,579 |
|
55,830 |
| |||
|
|
|
|
|
|
|
|
| |||
|
Premium on early retirement of debt |
|
— |
|
— |
|
13,837 |
| |||
|
Write-off of deferred financing costs and original issue discount |
|
1,254 |
|
— |
|
7,338 |
| |||
|
Other |
|
— |
|
— |
|
364 |
| |||
|
Subtotal - cost of early retirement of debt and refinancings |
|
1,254 |
|
— |
|
21,538 |
| |||
|
|
|
|
|
|
|
|
| |||
|
Total interest expense |
|
48,639 |
|
48,579 |
|
77,368 |
| |||
|
Less interest capitalized |
|
(1,205 |
) |
(1,018 |
) |
(208 |
) | |||
|
Interest expense |
|
$ |
47,434 |
|
$ |
47,561 |
|
$ |
77,160 |
|
CLOUD PEAK ENERGY INC.
NOTES TO CONSOLIDATED FINANCIAL STATEMENTS
16. Asset Retirement Obligations
Changes in the carrying amount of our AROs were as follows (in thousands):
|
|
|
2016 |
|
2015 |
| ||
|
Balance as of January 1 |
|
$ |
153,155 |
|
$ |
217,312 |
|
|
Accretion |
|
6,645 |
|
12,555 |
| ||
|
Revisions to estimated future reclamation cash flows |
|
(60,681 |
) |
(75,779 |
) | ||
|
Payments |
|
(953 |
) |
(933 |
) | ||
|
Balance as of December 31 |
|
98,166 |
|
153,155 |
| ||
|
Less: current portion |
|
(1,118 |
) |
(1,400 |
) | ||
|
Asset retirement obligation, net of current portion |
|
$ |
97,048 |
|
$ |
151,755 |
|
The above amounts exclude $4.6 million and $5.9 million of concurrent reclamation for the years ended December 31, 2016 and 2015, respectively.
Revisions to estimated future reclamation cash flows reflect our regular updates to our estimated costs of closure activities throughout the lives of the respective mines and reflect changes in estimates of closure volumes, disturbed acreages, the timing of the reclamation activities, and third-party unit costs as of December 31, 2016 and 2015.
Revisions during the year ended December 31, 2016 related to our Antelope Mine, Cordero Rojo Mine, and Spring Creek Mine were $22.3 million, $34.7 million, and $1.9 million, respectively. These downward revisions were primarily due to updated equipment and fuel cost guidance issued by the State of Wyoming as well as changes in each mine’s life due to updated estimates of annual production rates. Reductions to AROs resulting from such revisions generally result in a corresponding reduction to the related asset retirement cost in Property, plant and equipment, net, however, if the decrease to the asset retirement obligation exceeds the carrying amount of the related asset retirement costs, the resulting non-cash credit will reduce Depreciation and depletion in the Consolidated Statements of Operations. As of December 31, 2016, these revisions reduced the related asset by $ 8.7 million. The remaining $ 53.3 million reduced Depreciation and depletion for the year ended December 31, 2016.
Revisions during the year ended December 31, 2015 related to our Antelope Mine, Cordero Rojo Mine, and Spring Creek Mine were $6.2 million, $46.8 million, and $21.6 million, respectively. Revisions related to our Cordero Rojo Mine were primarily related to an increase in the mine life by seven years due to a land acquisition, providing access to additional proven and probable reserves; a decrease in the expected annual production rate; and modifications to the reclamation plan resulting in significantly less soil movement to achieve the post mining topography. Revisions related to our Spring Creek Mine primarily related to an increase in the mine life of eight years due to a decrease in the expected annual production rate. These revisions reduced the related asset by $49.8 million as of December 31, 2015. Depreciation and depletion was reduced by $25.8 million for the year ended December 31, 2015.
17. Income Taxes
Our Income (loss) before income tax provision and earnings from unconsolidated affiliates is earned solely in the U.S.
Income tax benefit (expense) consisted of the following for the years ended December 31 (in thousands):
|
|
|
2016 |
|
2015 |
|
2014 |
| |||
|
Current: |
|
|
|
|
|
|
| |||
|
Federal |
|
$ |
1,494 |
|
$ |
1,571 |
|
$ |
(2,383 |
) |
|
State |
|
(252 |
) |
535 |
|
(609 |
) | |||
|
Total current |
|
1,242 |
|
2,106 |
|
(2,992 |
) | |||
|
Deferred: |
|
|
|
|
|
|
| |||
|
Federal |
|
915 |
|
(76,300 |
) |
(30,873 |
) | |||
|
State |
|
56 |
|
(3,186 |
) |
(1,048 |
) | |||
|
Total deferred |
|
971 |
|
(79,486 |
) |
(31,921 |
) | |||
|
Total income tax benefit (expense) |
|
$ |
2,213 |
|
$ |
(77,380 |
) |
$ |
(34,913 |
) |
CLOUD PEAK ENERGY INC.
NOTES TO CONSOLIDATED FINANCIAL STATEMENTS
We report the tax effects of differences between the tax bases of assets and liabilities and the financial statement carrying amounts of these items as deferred tax assets and deferred tax liabilities. Our deferred tax assets and liabilities consisted of the following as of December 31 (in thousands):
|
|
|
2016 |
|
2015 |
| ||
|
Deferred income tax assets: |
|
|
|
|
| ||
|
Accrued expense and liabilities |
|
$ |
26,746 |
|
$ |
30,574 |
|
|
Pension and other postretirement benefits |
|
8,621 |
|
22,851 |
| ||
|
Accrued reclamation and mine closure costs |
|
34,326 |
|
52,297 |
| ||
|
Contract rights |
|
69,352 |
|
70,195 |
| ||
|
Debt restructuring |
|
25,183 |
|
— |
| ||
|
Mark-to-market gain (loss) |
|
(191 |
) |
4,071 |
| ||
|
AMT Credit carryforward |
|
31,625 |
|
33,625 |
| ||
|
Net operating loss carryforward |
|
54,764 |
|
51,155 |
| ||
|
Other |
|
7,606 |
|
3,319 |
| ||
|
Total deferred income tax assets |
|
258,032 |
|
268,087 |
| ||
|
Less valuation allowance |
|
(99,638 |
) |
(118,957 |
) | ||
|
Net deferred income tax asset |
|
158,394 |
|
149,130 |
| ||
|
|
|
|
|
|
| ||
|
Deferred income tax liabilities: |
|
|
|
|
| ||
|
Property, plant and equipment |
|
(37,954 |
) |
(22,128 |
) | ||
|
Inventories |
|
(17,435 |
) |
(17,233 |
) | ||
|
Mineral rights |
|
(78,819 |
) |
(87,862 |
) | ||
|
Throughput payments |
|
(12,928 |
) |
(13,926 |
) | ||
|
Other |
|
(11,258 |
) |
(7,981 |
) | ||
|
Total deferred income tax liabilities |
|
(158,394 |
) |
(149,130 |
) | ||
|
Net deferred income tax assets (liabilities) |
|
$ |
— |
|
$ |
— |
|
The estimated statutory income tax rates that are applied to our current and deferred income tax calculations are impacted significantly by the states in which we do business. Changes in apportionment laws or business conditions result in changes in the calculation of our current and deferred income taxes, including the valuation of our deferred tax assets and liabilities. Such adjustments can increase or decrease our net deferred tax assets at period end as well as the corresponding deferred tax expense or benefit during the period.
The realization of our deferred income tax assets depends on the existence of sufficient future taxable income. As of December 31, 2015, after considering operating results as well as our projected results for the next few years, we determined that it was unlikely that we would realize our deferred tax assets. As a result, we recorded a $111.8 million charge in 2015 to increase our deferred tax valuation allowance to $119.0 million and reduce the carrying value of our deferred tax assets to zero. As of December 31, 2016 the deferred tax valuation allowance decreased by $19.3 million to $99.6 million in order to keep the carrying value of our deferred tax assets at zero. The valuation allowance will be released once sustained profitable operations return. During the fourth quarter of 2015, management completed an analysis of our deferred tax assets and liabilities and identified errors that resulted in an overstatement of our deferred tax assets.
As of December 31, 2016, we have a federal net operating loss carryforward of $151.6 million which is scheduled to expire between 2029 and 2036. We also have a combined state net operating loss carryforward of $45.2 million which is scheduled to expire between 2022 and 2036. In addition, we have an alternative minimum tax credit carryforward of $31.6 million which does not have an expiration.
CLOUD PEAK ENERGY INC.
NOTES TO CONSOLIDATED FINANCIAL STATEMENTS
The effective tax rate is reconciled to the U.S. federal statutory income tax rate for the years ended December 31 as follows:
|
|
|
2016 |
|
2015 |
|
2014 |
|
|
United States federal statutory income tax rate |
|
35.0 |
% |
35.0 |
% |
35.0 |
% |
|
State income taxes, net of federal tax benefit |
|
1.2 |
|
1.3 |
|
1.3 |
|
|
Percentage depletion deduction |
|
(25.0 |
) |
5.7 |
|
(0.7 |
) |
|
Section 199 domestic manufacturing deduction |
|
— |
|
— |
|
(0.5 |
) |
|
Change in valuation allowance |
|
(32.4 |
) |
(86.9 |
) |
(4.9 |
) |
|
Non-deductible expenses |
|
13.8 |
|
(2.0 |
) |
— |
|
|
Non-deductible goodwill impairment |
|
— |
|
(9.1 |
) |
— |
|
|
Current and deferred tax adjustments |
|
(4.7 |
) |
(4.7 |
) |
— |
|
|
Other |
|
0.4 |
|
0.6 |
|
0.6 |
|
|
Effective tax rate |
|
(11.7 |
)% |
(60.1 |
)% |
30.8 |
% |
The difference between our statutory income tax rate and our effective income tax rate for the year ended December 31, 2016 is primarily the result of the change in valuation allowance to maintain the carrying amount of our deferred tax assets at zero. The difference between our statutory rate and the effective rate for the year ended December 31, 2015 was primarily the result of the increase to the valuation allowance to reduce the carrying amount of our deferred tax assets to zero. The difference between our statutory rate and the effective rate for the year ended December 31, 2014 was primarily related to the impact of percentage depletion and other items.
As of December 31, 2016 and 2015, we had no uncertain tax positions that we expect to have a material impact on the financial statements as a result of tax deductions taken during the year or in prior periods or due to settlements with taxing authorities or lapses of applicable statute of limitations. We are open to federal and state tax audits until the applicable statutes of limitations expire. The statute of limitations has expired for all state returns filed for periods ending before 2012, and all federal returns for periods ending before 2013.
18. Employee Benefit Plans
Our Consolidated Statements of Operations include expenses in connection with employee benefit plans, as follows for the years ended December 31 (in thousands):
|
|
|
2016 |
|
2015 |
|
2014 |
| |||
|
Cloud Peak Energy defined contribution retirement plans |
|
$ |
10,312 |
|
$ |
11,725 |
|
$ |
13,392 |
|
|
Cloud Peak Energy retiree medical plan |
|
(1,841 |
) |
8,096 |
|
6,996 |
| |||
|
|
|
8,471 |
|
19,821 |
|
20,388 |
| |||
|
|
|
|
|
|
|
|
| |||
|
Decker Mine pension plan (1) |
|
— |
|
— |
|
884 |
| |||
|
Total |
|
$ |
8,471 |
|
$ |
19,821 |
|
$ |
21,272 |
|
(1) In connection with the sale of our 50% non-operating interest in the Decker Mine to Ambre Energy, the obligations under the Decker Mine pension plan were assumed by Ambre Energy.
Cloud Peak Energy Defined Contribution Retirement Plans
We sponsor two defined contribution plans to assist eligible employees in providing for retirement. Our employees may elect to contribute a portion of their salary on a pre- or post-tax basis to their accounts. We match all employee contributions up to 6% of eligible compensation. We also contribute an additional 4% of eligible compensation to employee accounts under one of the plans. All contributions are fully vested at the date of contribution. Total contributions for the years ended December 31 are as follows (in thousands):
|
|
|
2016 |
|
2015 |
|
2014 |
| |||
|
Contributions |
|
$ |
10,312 |
|
$ |
11,725 |
|
$ |
13,392 |
|
CLOUD PEAK ENERGY INC.
NOTES TO CONSOLIDATED FINANCIAL STATEMENTS
Cloud Peak Energy Retiree Medical Plan
We provide certain postretirement medical coverage for eligible employees (the “Retiree Medical Plan”). Employees who are 55 years old and have completed ten years of service with us generally are entitled to receive benefits under the Retiree Medical Plan, except for employees who were eligible at the date of the IPO to receive benefits under the Rio Tinto retiree medical plan and elect to receive such benefits. Our retiree medical plan grants credit for service rendered by our employees to Rio Tinto prior to the IPO. This plan is unfunded.
In April 2016, we communicated certain changes in our Retiree Medical Plan to employees that became effective January 1, 2017. Changes include a decrease in the number of active employees that are eligible for the plan as well as moving to a fixed dollar subsidy amount away from a defined benefit plan. These plan changes reduced our accumulated postretirement benefit obligation by $47.7 million during the second quarter of 2016. The plan changes eliminated the old prior service cost base and established a new negative prior service cost base of approximately $41.1 million, which will be amortized to income over 4.2 years.
Net periodic postretirement benefit costs included the following components (in thousands):
|
|
|
2016 |
|
2015 |
|
2014 |
| |||
|
Service cost |
|
$ |
2,225 |
|
$ |
4,916 |
|
$ |
4,150 |
|
|
Interest cost |
|
1,187 |
|
1,929 |
|
1,857 |
| |||
|
Amortization of prior service cost (credit) |
|
(5,253 |
) |
1,252 |
|
989 |
| |||
|
Net periodic postretirement benefit cost |
|
$ |
(1,841 |
) |
$ |
8,096 |
|
$ |
6,996 |
|
Annually, we remeasure and adjust the liability for the accumulated postretirement benefit obligation (“APBO”). Changes in the APBO include the following components (in thousands):
|
|
|
2016 |
|
2015 |
|
2014 |
| |||
|
Beginning Balance |
|
$ |
61,407 |
|
$ |
50,697 |
|
$ |
39,172 |
|
|
Current period service costs |
|
2,225 |
|
4,916 |
|
4,150 |
| |||
|
Interest costs |
|
1,187 |
|
1,929 |
|
1,857 |
| |||
|
Plan amendment |
|
(47,671 |
) |
— |
|
— |
| |||
|
Benefits paid, net of retiree contributions |
|
(198 |
) |
(9 |
) |
(46 |
) | |||
|
Change in actuarial assumptions and actuarial loss |
|
6,612 |
|
3,874 |
|
5,564 |
| |||
|
Ending Balance |
|
23,562 |
|
61,407 |
|
50,697 |
| |||
|
Less current portion |
|
612 |
|
562 |
|
421 |
| |||
|
Long-term APBO |
|
$ |
22,950 |
|
$ |
60,845 |
|
$ |
50,276 |
|
We used the following assumptions in the measurement of the APBO for the years ended December 31:
|
|
|
2016 |
|
2015 |
|
2014 |
|
|
Discount rate |
|
3.95 |
% |
4.14 |
% |
3.82 |
% |
|
Health care cost trend rate assumed for next year |
|
N/A |
|
7.50 |
% |
6.50 |
% |
|
Ultimate health care cost trend rate |
|
N/A |
|
5.00 |
% |
5.00 |
% |
|
Year that the rate reaches the ultimate trend rate |
|
N/A |
|
2026 |
|
2018 |
|
CLOUD PEAK ENERGY INC.
NOTES TO CONSOLIDATED FINANCIAL STATEMENTS
Our estimated future benefit payments under the Retiree Medical Plan, which are net of estimated employee contributions and reflect expected future service, are as follows for the years ended December 31 (in thousands):
|
2017 |
|
$ |
624 |
|
|
2018 |
|
778 |
| |
|
2019 |
|
970 |
| |
|
2020 |
|
1,114 |
| |
|
2021 |
|
1,259 |
| |
|
2022 - 2026 |
|
7,701 |
| |
19. Commitments and Contingencies
Commitments
Operating Leases
We occupy various facilities and lease certain equipment under various lease agreements. The minimum rental commitments under non-cancelable operating leases, with lease terms in excess of one year subsequent to December 31, 2016, are as follows (in thousands):
|
2017 |
|
$ |
930 |
|
|
2018 |
|
982 |
| |
|
2019 |
|
1,035 |
| |
|
2020 |
|
1,088 |
| |
|
2021 |
|
201 |
| |
|
Thereafter |
|
397 |
| |
Rental expenses for the years ended December 31 were as follows (in thousands):
|
|
|
2016 |
|
2015 |
|
2014 |
| |||
|
Rent expense |
|
$ |
2,183 |
|
$ |
2,361 |
|
$ |
2,326 |
|
Contingencies
Litigation
WildEarth Guardians’ and Northern Plains Resource Council’s Regulatory Challenge to OSM’s Approval Process for Mine Plans
Background—On February 27, 2013, WildEarth Guardians (“WildEarth”) filed a complaint in the United States District Court for the District of Colorado (“Colorado District Court”) challenging the federal Office of Surface Mining’s (“OSM”) approvals of mine plans for seven different coal mines located in four different states. The challenged approvals included two that were issued to subsidiaries of Cloud Peak Energy: one for the Cordero Rojo Mine in Wyoming and one for the Spring Creek Mine in Montana.
On February 7, 2014, the Colorado District Court severed the claims in WildEarth’s complaint and transferred all the claims pertaining to non-Colorado mines to the federal district courts for the states in which the mines were located. Pursuant to this order, the challenge to Cordero Rojo’s mine plan approval (along with challenges to two other OSM approvals) was transferred to the United States District Court in Wyoming (“Wyoming District Court”) and the challenge to Spring Creek’s mine plan approval was transferred to the United States District Court for the District of Montana (“Montana District Court”). On February 14, 2014, WildEarth voluntarily dismissed the case pending in the Wyoming District Court, thereby concluding its challenge to OSM’s approval of the Cordero Rojo mine plan. WildEarth has continued to pursue its challenges to mine plan approvals pending in district courts in Colorado, New Mexico, and Montana.
CLOUD PEAK ENERGY INC.
NOTES TO CONSOLIDATED FINANCIAL STATEMENTS
On March 14, 2014, WildEarth amended its complaint in the Montana District Court to reflect the transfer order from the Colorado District Court. WildEarth has asked the Montana District Court to vacate OSM’s 2012 approval of the Spring Creek mine plan and enjoin mining operations at the Spring Creek Mine until OSM undertakes additional environmental analysis and related public process requested by WildEarth.
On August 14, 2014, Northern Plains Resource Council and the Western Organization of Resource Councils (collectively “Northern Plains”) filed a complaint in the Montana District Court challenging the same OSM approval of Spring Creek’s mine plan. Northern Plains, like WildEarth, requested that the Montana District Court vacate OSM’s 2012 approval of the Spring Creek mine plan and enjoin mining operations at the Spring Creek Mine until OSM undertakes the additional analysis requested by Northern Plains.
Intervention by Cloud Peak Energy and Others—By orders dated May 30, 2014, May 9, 2014, and April 28, 2014, the Montana District Court granted intervention to the State of Montana, the National Mining Association, and Spring Creek Coal LLC, a 100% owned subsidiary of Cloud Peak Energy, respectively. Each of these parties intervened on the side of OSM.
Current Schedule—On October 28, 2014, the Montana District Court consolidated the WildEarth and Northern Plains cases and set a briefing schedule for resolution of all of WildEarth’s and Northern Plains’ claims through motions for summary judgment. Plaintiffs filed their opening briefs on December 8, 2014, and under a revised schedule, briefing by all parties was completed on May 7, 2015. The Montana District Court held an oral argument on July 31, 2015 before a Magistrate Judge in Billings, Montana. At the conclusion of the oral argument, the Magistrate Judge ordered the parties to negotiate and attempt to resolve this dispute by agreement of the parties. In October 2015, the parties jointly submitted a status report to the Montana District Court stating they were unable to reach a settlement. On October 23, 2015, the Magistrate Judge issued her findings and recommendations to the District Court Judge. In this order, the Magistrate found that OSM had failed to follow the procedural requirements of the National Environmental Policy Act by failing to provide notice to the public when the agency had completed its environmental analysis and by failing to explain how OSM concluded that its approval of the 2012 mining plan would have no significant environmental impacts. Based on these findings, the Magistrate further recommended that OSM be directed to prepare a supplemental environmental analysis within 180 days from the date the Montana District Court issues a final judgment. Under the Magistrate’s recommendation, mining at the Spring Creek mine would proceed unabated during the time OSM is undertaking its supplemental analysis. The mining plan for the Spring Creek Mine would not be vacated unless OSM failed to complete its supplemental analysis within 180 days.
On November 6, 2015, Spring Creek Coal, the National Mining Association and the State of Montana filed objections to the Magistrate’s findings and recommendations. The federal defendants filed limited objections on that same day. WildEarth and Northern Plains filed responses to these objections on November 17, 2015 and November 20, 2015, respectively. On January 21, 2016, the Montana District Court issued an order adopting most of the Magistrate’s findings and recommendations, but provided OSM 240 days (rather than 180 days) to prepare a supplemental environmental analysis. Under the Montana District Court’s order, mining at the Spring Creek mine would proceed unabated during the time OSM is undertaking its supplemental analysis and OSM was ordered to submit monthly status reports informing the court and the parties of OSM’s progress in preparing the analysis. The mining plan for the Spring Creek Mine would not be vacated unless OSM fails to complete its supplemental analysis within 240 days. The order provides that OSM may request and obtain additional time to prepare its analysis “for good cause.” On June 27, 2016, the Montana District Court granted a joint motion by plaintiff Northern Plains and OSM to extend the compliance deadline from 240 days to 256 days. On October 3, 2016, OSM notified the Montana District Court that OSM had completed its supplemental environmental analysis and issued a new decision on October 3, 2016 re-approving the 2012 mine plan for the Spring Creek Mine. OSM’s decision and accompanying environmental assessment satisfies the Court’s January 21, 2016 remedy order. On October 19, 2016, the Court found that OSM had complied with the Court’s January 21, 2016 remedy order and entered final judgment. No party appealed the District Court’s judgment and the case is now concluded.
Administrative Appeals of the BLM’s Approval of the Potential West Antelope II South Lease Modification
Background—On September 5, 2014, WildEarth filed an appeal with the Interior Board of Land Appeals (“IBLA”) challenging the BLM’s August 15, 2014 decision to approve Antelope Coal LLC’s proposed modification of Antelope Coal’s West Antelope II South (“WAII South”) lease. Antelope Coal is a 100% owned subsidiary of Cloud Peak Energy. On September 12, 2014, Powder River Basin Resource Council and Sierra Club (collectively “PRBRC”) filed an appeal with the IBLA challenging this same BLM decision. The BLM’s decision that is the subject of both appeals approves the proposed amendment of WAII South lease. If the lease modification is entered into, it would add approximately 15.8 million tons of
CLOUD PEAK ENERGY INC.
NOTES TO CONSOLIDATED FINANCIAL STATEMENTS
coal underlying nearly 857 surface acres. WildEarth and PRBRC have asked the IBLA to vacate the proposed WAII South lease modification and direct the BLM to prepare additional environmental analysis on the impacts of the lease modification.
Intervention by Cloud Peak Energy and State of Wyoming—On September 24, 2014 and October 6, 2014, Antelope Coal and the State of Wyoming, respectively, moved to intervene in the WildEarth and PRBRC appeals as respondents to defend the BLM’s lease modification decision. The IBLA granted these intervention motions.
Current Schedule. WildEarth filed its Statement of Reasons (opening brief) on October 6, 2014, and PRBRC filed its Statement of Reasons on October 10, 2014. The BLM filed its Answer (opposition brief) on January 12, 2015 and moved for the two appeals to be consolidated. Antelope Coal and State of Wyoming filed their respective Answers on January 20, 2015. Briefing has been completed in both appeals. On September 2, 2016, WildEarth filed a Notice of Supplemental Authority indicating that decisions in three unrelated IBLA appeals call into question whether BLM’s decision record approving the WAII South LBM was signed by the appropriate BLM official. In response to a September 12, 2016 Show Cause Order from the IBLA, BLM filed a response brief on September 26, 2016 representing that the High Plains District Manager had properly signed the decision record approving the WAII South LBM. Antelope Coal and the State of Wyoming filed briefs in support of BLM’s response on September 27, 2016 and September 30, 2016, respectively. WildEarth filed a brief in response to BLM’s and Antelope’s response briefs on September 29, 2016. On February 7, 2017, the IBLA issued a decision setting aside BLM’s decision to issue the WAII South lease modification and remanding that decision to BLM on the ground that the Wyoming High Plains District Manager lacked the appropriate delegation of authority to approve such a leasing decision. The IBLA specifically declined to address the merits of WildEarth’s and PRBRC’s claims challenging whether BLM’s underlying environmental analysis was sufficient to support the agency’s lease modification decision. Now that the decision has been remanded, BLM will decide whether and how to move forward with the WAII South lease modification. We believe the WildEarth and PRBRC appeals challenging the BLM’s West Antelope II South lease modification decision are without merit. Nevertheless, if, after BLM reconsiders the issue on remand, the plaintiffs are ultimately successful in frustrating or delaying the approval of the WAII lease modification , the timing and ability of Cloud Peak Energy to lease and mine the coal underlying the applicable surface acres would be materially adversely impacted. We are unable to estimate a loss or range of loss for this contingency because (1) the challenge does not seek monetary relief, (2) the nature of the relief sought is to require the regulatory agency to address alleged deficiencies in complying with applicable regulatory and legal requirements and (3) BLM has not decided whether or how to proceed on the WAII South leasing modification proposal following the remand from the IBLA.
WildEarth Guardians’ Regulatory Challenge to OSM’s Approval Process for Antelope Mine Plan
Background—On September 15, 2015, WildEarth filed a complaint in the Colorado District Court challenging the Department of Interior’s and Office of Surface Mining Reclamation and Enforcement’s (collectively, “OSM”) approvals of mine plans for four different coal mines, one of which is located in Colorado and three of which are located in Wyoming. The challenged approvals included one mine plan modification that was issued to Antelope Coal LLC, a subsidiary of Cloud Peak Energy, for the Antelope Mine in Wyoming. The plaintiff seeks to vacate existing, required regulatory approvals and to enjoin mining operations at Antelope Mine.
Intervention by Cloud Peak Energy and Others—The State of Wyoming and all the operators of the mines whose mine plans are being challenged have moved to intervene as Defendants to defend the challenged mine plans. The prospective intervenors filed their motions on the following dates: State of Wyoming (November 12, 2015), Antelope Coal LLC (November 13, 2015), New Mexico Coal Resources, LLC (November 16, 2015), Bowie Resources, LLC (November 24, 2015), Thunder Basin Coal, L.L.C. (December 4, 2015).
Current Schedule—On November 25, 2015, the OSM filed a motion to sever WildEarth’s complaint and transfer those claims against the two Wyoming mines (Antelope and Black Thunder) to the District of Wyoming and the New Mexico mine (El Segundo) to the District of New Mexico. Each of the prospective intervenors filed conditional responses in support of OSM’s transfer motion. On January 7, 2016, WildEarth filed its opposition to OSM’s transfer motion. On January 29, 2016, WildEarth and OSM filed a Joint Motion to Stay all proceedings for 60 days in order for the parties to pursue settlement discussions. On February 1, 2016, the prospective intervenors filed a proposed response to the stay motion in which they asked the Colorado District Court to grant (1) the pending intervention motions, and (2) the pending motion to sever transfer, before staying the portion of the case that remained in the District of Colorado. On February 3, 2016, WildEarth and OSM filed separate reply briefs in support of their stay motion. On February 16, 2016, the court granted the motion to stay the case for 60 days, and on February 18, 2016, the court granted the pending motions to intervene by Antelope, the State of Wyoming, and the other coal producers. The stay expired on April 1, 2016 after the parties were
CLOUD PEAK ENERGY INC.
NOTES TO CONSOLIDATED FINANCIAL STATEMENTS
unable to reach a voluntary settlement and OSM filed its reply brief in support of its motion to sever and transfer on April 11, 2016. On June 17, 2016, the Colorado District Court granted OSM’s motion to sever and transfer WildEarth’s claims against the Antelope and Black Thunder mine plans to the District of Wyoming and the El Segundo mine plan to the District of New Mexico. The challenges against the Antelope and Black Thunder mine plans, which are docketed as separate cases, have both been assigned to Judge Johnson of the District of Wyoming. On October 7, 2016, BLM filed its administrative record for the case challenging the Antelope mine plan. On October 21, 2016, WildEarth filed a motion to supplement the administrative record with three administrative documents prepared by other federal agencies. On November 4, 2016, OSM and Antelope each filed opposition briefs. On November 11, 2016, WildEarth filed its reply brief. On December 1, 2016, the Court denied WildEarth’s motion to supplement the record. WildEarth filed its opening merits brief on January 27, 2017, Opposition briefs by OSM, Antelope Coal, and the State of Wyoming are due March 13, 2017. WildEarth’s reply brief is due April 12, 2017.
We believe WildEarth’s challenge is without merit. Nevertheless, if WildEarth’s claims against OSM’s approval of the Antelope mine plan modification are successful, any court order granting the requested relief could have a material adverse impact on our shipments, financial results and liquidity, and could result in claims from third parties if we are unable to meet our commitments under pre-existing commercial agreements as a result of any required reductions or modifications to our mining activities. We are unable to estimate a loss or range of loss for this contingency because (1) the challenge does not seek monetary relief, (2) the nature of the relief sought is to require the regulatory agency to address alleged deficiencies in complying with applicable regulatory and legal requirements and (3) even if the challenges are successful in whole or in part, the court has broad discretion in determining the nature of the relief ultimately granted.
Other Legal Proceedings
We are involved in other legal proceedings arising in the ordinary course of business and may become involved in additional proceedings from time to time. We believe that there are no other legal proceedings pending that are likely to have a material adverse effect on our consolidated financial condition, results of operations or cash flows. Nevertheless, we cannot predict the impact of future developments affecting our claims and lawsuits, and any resolution of a claim or lawsuit or an accrual within a particular fiscal period may materially and adversely impact our results of operations for that period. In addition to claims and lawsuits against us, our LBAs, lease by modifications, permits, and other industry regulatory processes and approvals, including those applicable to the utility and coal logistics and transportation industries, may also continue to be subject to legal challenges that could materially and adversely impact our mining operations, results and liquidity. These regulatory challenges may seek to vacate prior regulatory decisions and authorizations that are legally required for some or all of our current or planned mining activities. If we are required to reduce or modify our mining activities as a result of these challenges, the impact could have a material adverse effect on our shipments, financial results and liquidity, and could result in claims from third parties if we are unable to meet our commitments under pre-existing commercial agreements as a result of any such required reductions or modifications to our mining activities.
Tax Contingencies
Our income tax calculations are based on application of the respective U.S. federal or state tax laws. Our tax filings, however, are subject to audit by the respective tax authorities. Accordingly, we recognize tax benefits when it is more likely than not a position will be upheld by the tax authorities. To the extent the final tax liabilities are different from the amounts originally accrued, the increases or decreases are recorded as income tax expense.
Several non-income based production tax audits related to federal and state royalties and severance taxes are currently in progress. The financial statements reflect our best estimate of taxes and related interest and penalties due for potential adjustments that may result from the resolution of such tax audits. From time to time, we receive audit assessments and engage in settlement discussions with applicable tax authorities, which may result in adjustments to our estimates of taxes and related interest and penalties.
Concentrations of Risk and Major Customers
Approximately 79%, 67%, and 79% of our revenue for the years ended December 31, 2016, 2015, and 2014, respectively, were under multi-year contracts. While the majority of the contracts are fixed-price contracts, certain contracts have adjustment provisions for determining periodic price changes. There was no single customer that represented 10% or more of consolidated revenue in 2016, 2015, or 2014. We generally do not require collateral or other security on accounts
CLOUD PEAK ENERGY INC.
NOTES TO CONSOLIDATED FINANCIAL STATEMENTS
receivable because our customers are comprised primarily of investment grade electric utilities. The credit risk is controlled through credit approvals and monitoring procedures.
Guarantees and Off-Balance Sheet Risk
In the normal course of business, we are party to guarantees and financial instruments with off-balance sheet risk, such as bank letters of credit, performance or surety bonds and indemnities, which are not reflected on the Consolidated Balance Sheets. In our past experience, virtually no claims have been made against these financial instruments. Management does not expect any material losses to result from these guarantees or off-balance-sheet instruments.
U.S. federal and state laws require we secure certain of our obligations to reclaim lands used for mining and to secure coal lease obligations. The primary method we have used to meet these reclamation obligations and to secure coal lease obligations is to provide a third-party surety bond, typically through an insurance company, or provide a letter of credit, typically through a bank. Specific bond and/or letter of credit amounts may change over time, depending on the activity at the respective site and any specific requirements by federal or state laws. As of December 31, 2016, we were self-bonded for $10 million and had $448.4 million of third-party surety bonds outstanding to secure certain of our obligations to reclaim lands used for mining and to secure coal lease obligations.
On September 12, 2014, we completed the sale of our 50% non-operating interest in the Decker Mine to Ambre Energy. See Note 4. Upon completion, Ambre Energy fully replaced our $66.7 million in outstanding reclamation and lease bonds related to the Decker Mine.
20. Equity-Based Compensation
The Cloud Peak Energy Inc. 2009 Long Term Incentive Plan (“LTIP”) permits awards to our employees and eligible non-employee directors, which we generally grant in the first quarter of each year. The LTIP allows for the issuance of equity-based compensation in the form of restricted stock, restricted stock units, options, stock appreciation rights, dividend equivalent rights, performance awards, and share awards. Our stockholders have approved a pool of up to 7.1 million shares (which includes the 1.6 million shares approved by stockholders at our 2016 annual meeting) of CPE Inc.’s common stock authorized for issuance in connection with equity-based awards under the LTIP, since its initial inception. As of December 31, 2016, 2.0 million shares were available for grant.
Generally, each form of equity-based compensation awarded to eligible employees cliff vests on the third anniversary of the grant date, subject to meeting any applicable performance criteria for the award. However, the awards will pro-rata vest sooner if an employee terminates employment with or stops providing services to us because of death, “disability,” “redundancy” or “retirement” (as such terms are defined in the award agreement or the LTIP, as applicable), or if an employee subject to an employment agreement is terminated for any other reason than for “cause” or leaves for “good reason” (as such terms are defined in the relevant employment agreement). In addition, the awards will fully vest if an employee is terminated without cause (or leaves for good reason, if the employee is subject to an employment agreement) within two years after a “change in control” (as such term is defined in the LTIP) occurs.
Total equity-based compensation expense recognized primarily within Selling, general, and administrative expenses was as follows for the years ended December 31 (in thousands):
|
|
|
2016 |
|
2015 |
|
2014 |
| |||
|
Total equity-based compensation expense |
|
$ |
13,064 |
|
$ |
6,935 |
|
$ |
7,966 |
|
Restricted Stock and Restricted Stock Units
We granted restricted stock and restricted stock units under the LTIP to eligible employees, and we granted restricted stock units to our non-employee directors. The restricted stock units granted to our directors generally vest upon their resignation or retirement (except for a removal for cause) or upon certain events constituting a “change in control” (as such term is defined in the award agreement). They will pro-rata vest if a director resigns or retires within one year of the date of grant.
CLOUD PEAK ENERGY INC.
NOTES TO CONSOLIDATED FINANCIAL STATEMENTS
A summary of restricted stock award activity is as follows (in thousands):
|
|
|
|
|
Weighted |
| |
|
|
|
|
|
Average |
| |
|
|
|
|
|
Grant-Date |
| |
|
|
|
Number |
|
Fair Value |
| |
|
|
|
|
|
(per share) |
| |
|
Non-vested shares as of January 1, 2016 |
|
732 |
|
$ |
11.61 |
|
|
Granted |
|
2,004 |
|
1.97 |
| |
|
Vested |
|
(165 |
) |
14.32 |
| |
|
Forfeited |
|
(233 |
) |
2.94 |
| |
|
Non-vested shares as of December 31, 2016 |
|
2,338 |
|
$ |
4.02 |
|
As of December 31, 2016, unrecognized compensation cost related to restricted stock awards was $3.1 million, which will be recognized over a weighted-average period of 1.8 years prior to vesting. The weighted average fair value of restricted stock awards granted during the years ended December 31, 2016, 2015, and 2014 was $1.97, $7.78, and $18.75 per share, respectively. The total fair value of restricted stock awards vested during the years ended December 31, 2016, 2015, and 2014 was $2.4 million, $2.0 million, and $1.6 million, respectively.
Performance Share Units
Performance-based share units granted represent the number of shares of common stock to be awarded based on the achievement of targeted performance levels related to pre-established total stockholder return goals over a three-year period and may range from 0% to 200% of the targeted amount.
In previous years, the performance-based units were settled in shares of common stock and the grant date fair value of the awards was calculated using a Monte Carlo simulation and amortized over the performance period. The 2016 grants are currently expected to be settled in cash upon any vesting in 2019, and therefore, were accounted for as a liability and marked to market on a quarterly basis.
A summary of performance-based share unit award activity is as follows (in thousands):
|
|
|
|
|
Weighted |
| |
|
|
|
|
|
Average |
| |
|
|
|
|
|
Grant-Date |
| |
|
|
|
Number |
|
Fair Value |
| |
|
|
|
|
|
(per share) |
| |
|
Non-vested units as of January 1, 2016 |
|
911 |
|
$ |
14.57 |
|
|
Granted |
|
2,493 |
|
1.95 |
| |
|
Forfeited |
|
(273 |
) |
3.43 |
| |
|
Canceled |
|
(99 |
) |
20.24 |
| |
|
Vested |
|
(74 |
) |
20.24 |
| |
|
Non-vested units as of December 31, 2016 |
|
2,958 |
|
$ |
4.63 |
|
The assumptions used to estimate the fair value of the performance-based share units granted during the year ended December 31, are as follows:
|
|
|
2015 |
|
2014 |
| ||
|
Risk-free interest rate |
|
1.0 |
% |
0.7 |
% | ||
|
Expected volatility |
|
37.7 |
% |
38.3 |
% | ||
|
Term (in years) |
|
2.8 |
|
2.8 |
| ||
|
|
|
|
|
|
| ||
|
Fair Value (per share) |
|
$ |
9.66 |
|
$ |
25.63 |
|
CLOUD PEAK ENERGY INC.
NOTES TO CONSOLIDATED FINANCIAL STATEMENTS
The weighted-average grant date fair values of the performance share units granted during the years ended December 31, 2016 and 2015 were $1.95 and $9.66 per share, respectively. During the year ended December 31, 2016, $6.2 million in expenses was recognized related to the cash settled 2016 performance share units. As of December 31, 2016, $18.5 million of unrecognized compensation cost, which represents the unvested portion of the fair market value of performance share units granted, is expected to be recognized over a weighted-average vesting period of 2.1 years.
Non-Qualified Stock Options
Annually through 2014, we granted non-qualified stock options under the LTIP to certain employees. All unexercised options will expire ten years after the date of grant unless expiring earlier following a termination of employment as described below. Generally, vested options will expire 30 days after the date of the grantee’s termination of employment with us (one year in the event of a termination due to the grantee’s death, and 90 days following a qualifying termination within the two-year period following a change in control).
A summary of non-qualified stock option activity is as follows (in thousands except per share amounts):
|
|
|
|
|
Weighted |
|
Weighted |
|
|
| ||
|
|
|
|
|
Average |
|
Average |
|
Aggregate |
| ||
|
|
|
|
|
Exercise |
|
Contractual |
|
Intrinsic |
| ||
|
|
|
Number |
|
Price |
|
Term |
|
Value(1) |
| ||
|
|
|
|
|
(per option) |
|
(years) |
|
|
| ||
|
Options outstanding as of January 1, 2016 |
|
1,208 |
|
$ |
16.78 |
|
5.4 |
|
$ |
— |
|
|
Forfeited |
|
(6 |
) |
$ |
19.35 |
|
|
|
|
| |
|
Expired |
|
(104 |
) |
$ |
17.17 |
|
|
|
|
| |
|
Options outstanding as of December 31, 2016 |
|
1,098 |
|
$ |
16.73 |
|
4.3 |
|
$ |
— |
|
|
Exercisable as of December 31, 2016 |
|
941 |
|
$ |
16.29 |
|
3.9 |
|
$ |
— |
|
|
Vested and expected to vest as of December 31, 2016 |
|
154 |
|
$ |
19.35 |
|
7.2 |
|
$ |
— |
|
(1) The intrinsic value of a stock option is the amount by which the market value of the underlying stock exceeds the exercise price of the option at year-end.
As of December 31, 2016, we had $0.1 million of unrecognized compensation expense, net of estimated forfeitures, for non-vested stock options, which will be recognized as expense over the remaining weighted-average vesting period of approximately 0.3 years. There were no options exercised during the years ended December 31, 2016 and 2015. The intrinsic value of options exercised during the year ended December 31, 2014 was $0.9 million.
We used the Black-Scholes option pricing model to determine the fair value of stock options. Determining the fair value of equity-based awards requires judgment, including estimating the expected term that stock options will be outstanding prior to exercise, and the associated volatility.
The assumptions used to estimate the fair value of options granted during the year ended December 31, 2014 are as follows:
|
Weighted-average grant date fair value (per option) |
|
$ |
8.89 |
|
|
Assumptions: |
|
|
| |
|
Risk-free interest rate |
|
2.1 |
% | |
|
Expected option life |
|
6.5 years |
| |
|
Expected volatility |
|
43.3 |
% | |
Employee Stock Purchase Plan
In May 2011, our stockholders approved the Cloud Peak Energy Inc. Employee Stock Purchase Plan (“ESPP”). The ESPP permits eligible employees to authorize payroll deductions on a voluntary basis to purchase shares of CPE Inc.’s
CLOUD PEAK ENERGY INC.
NOTES TO CONSOLIDATED FINANCIAL STATEMENTS
common stock at a discount from the market price. Employees are eligible to participate in the ESPP if employed by us for at least six months and are expected to work at least 1,000 hours of service per calendar year. Participating employees may contribute up to $200 of their eligible earnings during each pay period or $4,800 per plan year. The purchase price of common stock purchased under the ESPP is equal to the lesser of (i) 90% of the fair market value of CPE Inc.’s common stock on the offering date and (ii) 90% of the fair market value of CPE Inc.’s common stock on the last day of the annual option period.
A maximum of 500,000 shares of common stock were reserved for sale under the ESPP. Offering periods under the ESPP have typically been one year commencing each September 1 and ending the following August 30. Following the offering period ended August 30, 2016, the maximum share pool under the ESPP was nearly exhausted and we determined not to commence a new offering period on September 1, 2016 due to lack of shares.
Compensation costs related to the ESPP are as follows (in thousands):
|
|
|
2016 |
|
2015 |
|
2014 |
| |||
|
Unrecognized compensation expense |
|
$ |
— |
|
$ |
233 |
|
$ |
172 |
|
|
Recognized compensation expense |
|
90 |
|
248 |
|
276 |
| |||
|
Total ESPP compensation expense |
|
$ |
90 |
|
$ |
481 |
|
$ |
448 |
|
The fair value of each purchase right granted under the ESPP was estimated on the date of grant using the Black-Scholes option pricing model with the following assumptions:
|
|
|
2015 |
|
2014 |
| ||
|
Weighted-average fair value (per award) |
|
$ |
1.54 |
|
$ |
3.96 |
|
|
Assumptions: |
|
|
|
|
| ||
|
Risk-free interest rate |
|
0.4 |
% |
0.1 |
% | ||
|
Expected option life |
|
1.0 |
|
1.0 |
| ||
|
Expected volatility |
|
70.0 |
% |
28.0 |
% | ||
21. Accumulated Other Comprehensive Income (Loss)
The changes in Accumulated Other Comprehensive Income (Loss) (“AOCI”) by component, net of tax are as follows (in thousands):
|
|
|
Post- |
|
Decker |
|
Total |
| |||
|
Beginning balance, January 1, 2014 |
|
$ |
(8,242 |
) |
$ |
(2,038 |
) |
$ |
(10,279 |
) |
|
Other comprehensive income before reclassifications |
|
(3,691 |
) |
— |
|
(3,691 |
) | |||
|
Amounts reclassified from accumulated other comprehensive income |
|
633 |
|
2,038 |
|
2,671 |
| |||
|
Net current period other comprehensive income (loss) |
|
(3,058 |
) |
2,038 |
|
(1,020 |
) | |||
|
Ending balance, December 31, 2014 |
|
(11,299 |
) |
— |
|
(11,299 |
) | |||
|
Other comprehensive income before reclassifications |
|
(2,441 |
) |
— |
|
(2,441 |
) | |||
|
Amounts reclassified from accumulated other comprehensive income |
|
789 |
|
— |
|
789 |
| |||
|
Net current period other comprehensive income (loss) |
|
(1,652 |
) |
— |
|
(1,652 |
) | |||
|
Ending balance, December 31, 2015 |
|
(12,951 |
) |
— |
|
(12,951 |
) | |||
|
Other comprehensive income before reclassifications |
|
38,144 |
|
— |
|
38,144 |
| |||
|
Amounts reclassified from accumulated other comprehensive income |
|
(3,309 |
) |
— |
|
(3,309 |
) | |||
|
Net current period other comprehensive income (loss) |
|
34,835 |
|
— |
|
34,835 |
| |||
|
Ending balance, December 31, 2016 |
|
$ |
21,884 |
|
$ |
— |
|
$ |
21,884 |
|
CLOUD PEAK ENERGY INC.
NOTES TO CONSOLIDATED FINANCIAL STATEMENTS
The reclassifications out of AOCI are as follows for the years ended December 31 (in thousands):
|
|
|
2016 |
|
2015 |
|
2014 |
| |||
|
Postretirement Medical Plan (1) |
|
|
|
|
|
|
| |||
|
Amortization of prior service costs (credits) included in Cost of product sold (2) |
|
$ |
(4,394 |
) |
$ |
1,056 |
|
$ |
836 |
|
|
Amortization of prior service costs (credits) included in selling, general and administrative expenses (2) |
|
(859 |
) |
196 |
|
153 |
| |||
|
Write-off of Decker Mine pension prior service costs included in gain on sale of Decker Mine interest |
|
— |
|
— |
|
3,183 |
| |||
|
Total before tax |
|
(5,253 |
) |
1,252 |
|
4,172 |
| |||
|
Tax benefit |
|
1,944 |
|
(463 |
) |
(1,501 |
) | |||
|
Amounts reclassified from accumulated other comprehensive income |
|
$ |
(3,309 |
) |
$ |
789 |
|
$ |
2,671 |
|
(1) See Note 18 for the computation of net periodic postretirement benefit costs.
(2) Presented in the Consolidated Statements of Operations and Comprehensive Income.
22. Capital Stock and Earnings Per Share
Common Stock
We have 200.0 million authorized shares of $0.01 par value common stock. The holders of our common stock are entitled to one vote for each share held of record on all matters submitted to a vote of the shareholders. Our shareholders do not have cumulative voting rights in the election of directors. Subject to preferences that may be granted to any then-outstanding preferred stock, holders of our common stock are entitled to receive ratably only those dividends that the board of directors may from time to time declare, and we may pay, on our outstanding shares in the manner and upon the terms and conditions provided by law. See Item 5 “Market for Registrant’s Common Equity and Related Stockholder Matters—Dividend Policy.” In general, in the event of our liquidation, dissolution or winding up, holders of our common stock are entitled to share ratably in our assets, if any, remaining after we pay our liabilities and distribute the liquidation preference of any then-outstanding preferred stock. Holders of our common stock have no pre-emptive or other subscription or conversion rights. There are no redemption or sinking fund provisions applicable to our common stock.
Preferred Stock
Per our Amended and Restated Certificate of Incorporation, which was effective as of November 25, 2009, our board of directors is authorized to issue up to 20 million shares of preferred stock, $0.01 par value. The board of directors can determine the terms and rights, preferences, privileges and restrictions of each series. These rights, preferences, and privileges may include dividend rights, conversion rights, voting rights, terms of redemption, liquidation preferences, sinking fund terms, and the number of shares constituting any series or the designation of this series. There were no outstanding shares of preferred stock as of December 31, 2016 or 2015.
Treasury Stock
We allow employees to relinquish common stock to pay estimated taxes upon the vesting of restricted stock and upon the payout of performance units that settled in common stock. The value of the common stock withheld is based upon the closing price on the vesting date.
Earnings per Share
Dilutive potential shares of common stock include restricted stock and options issued under the LTIP. See Note 20. We apply the treasury stock method to determine dilution from restricted stock and options. Under the treasury stock method, awards are treated as if they had been exercised with any proceeds used to repurchase common stock at the average market price during the period. Any incremental difference between the assumed number of shares issued and purchased is included in the diluted share computation. For our performance units, the contingent feature results in an assessment for any potentially dilutive common stock by using the end of the reporting period as if it were the end of the contingency period.
CLOUD PEAK ENERGY INC.
NOTES TO CONSOLIDATED FINANCIAL STATEMENTS
The following table summarizes the calculation of basic and diluted earnings per share for the years ended December 31 (in thousands, except per share amounts):
|
|
|
2016 |
|
2015 |
|
2014 |
| |||
|
Numerator for calculation of basic earnings (loss) per share: |
|
|
|
|
|
|
| |||
|
Net income (loss) |
|
$ |
21,841 |
|
$ |
(204,900 |
) |
$ |
78,960 |
|
|
Denominator for basic income (loss) per share: |
|
|
|
|
|
|
| |||
|
Weighted-average shares outstanding |
|
61,328 |
|
61,053 |
|
60,826 |
| |||
|
Basic earnings (loss) per share |
|
$ |
0.36 |
|
$ |
(3.36 |
) |
$ |
1.30 |
|
|
|
|
|
|
|
|
|
| |||
|
Numerator for calculation of diluted earnings (loss) per share: |
|
|
|
|
|
|
| |||
|
Net income (loss) |
|
$ |
21,841 |
|
$ |
(204,900 |
) |
$ |
78,960 |
|
|
Denominator for diluted earnings (loss) per share: |
|
|
|
|
|
|
| |||
|
Weighted-average shares outstanding |
|
61,328 |
|
61,053 |
|
60,826 |
| |||
|
Dilutive effect of stock equivalents |
|
962 |
|
— |
|
469 |
| |||
|
Denominator for diluted earnings (loss) per share |
|
62,290 |
|
61,053 |
|
61,295 |
| |||
|
Diluted earnings (loss) per share |
|
$ |
0.35 |
|
$ |
(3.36 |
) |
$ |
1.29 |
|
For the years ended December 31, the following were excluded from the diluted earnings per share calculation because they were anti-dilutive (in thousands):
|
|
|
2016 |
|
2015 |
|
2014 |
|
|
Anti-dilutive stock equivalents |
|
1,706 |
|
2,276 |
|
985 |
|
23. Segment Information
We have two reportable segments; our Owned and Operated Mines segment and our Logistics and Related Activities segment.
Our Owned and Operated Mines segment is characterized by the predominant focus on thermal coal production where the sale occurs at the mine site and where title and risk of loss generally pass to the customer at that point. This segment includes our Antelope Mine, Cordero Rojo Mine, and Spring Creek Mine. Sales in this segment are primarily to domestic electric utilities, although a portion is made to our Logistics and Related Activities segment. Sales between reportable segments are priced based on prevailing market prices for arm’s length transactions. Our mines utilize surface mining extraction processes and are all located in the PRB. The gains and losses resulting from our domestic coal futures contracts and WTI derivative financial instruments are reported within this segment.
Our Logistics and Related Activities segment is characterized by the services we provide to our international and certain of our domestic customers where we deliver coal to the customer at a terminal or the customer’s plant or other delivery point, remote from our mine site. Services provided include the purchase of coal from third parties or from our Owned and Operated Mines segment, at market prices, as well as the contracting and coordination of the transportation and other handling services from third-party operators, which are typically rail and terminal companies. Title and risk of loss are retained by the Logistics and Related Activities segment through the transportation and delivery process. Title and risk of loss pass to the customer in accordance with the contract and typically occur at a vessel loading terminal, a vessel unloading terminal or an end use facility. Risk associated with rail and terminal take-or-pay agreements is also borne by the Logistics and Related Activities segment. The gains and losses resulting from our international coal forward contracts, international coal put options, and U.S. On-Highway Diesel derivative financial instruments are reported within this segment. Amortization related to port access contract rights prior to the fourth quarter 2015 impairment and the amended port and rail take-or-pay agreements are also included in this segment. Gains and losses associated with our investment in the Gateway Pacific Terminal are included in our Logistics and Related Activities segment.
Our business activities that are not considered operating segments are included in Other although they are not required to be included in this footnote. They are provided for reconciliation purposes and include Selling, general and administrative expenses (“SG&A”) as well as results relating to broker activity and our previous share of the Decker Mine operations, which was sold on September 12, 2014.
CLOUD PEAK ENERGY INC.
NOTES TO CONSOLIDATED FINANCIAL STATEMENTS
Eliminations represent the purchase and sale of coal between reportable segments and the associated elimination of intercompany profit or loss in inventory and are provided for reconciliation purposes.
The following table presents revenue, total assets, and capital expenditures by reportable segment for the years ended December 31 (in thousands):
|
|
|
Owned and |
|
Logistics and |
|
Other |
|
Eliminations |
|
Consolidated |
| |||||
|
Year Ended December 31, 2016 |
|
|
|
|
|
|
|
|
|
|
| |||||
|
Revenue |
|
$ |
738,579 |
|
$ |
43,553 |
|
$ |
30,305 |
|
$ |
(11,999 |
) |
$ |
800,438 |
|
|
Total assets |
|
1,516,881 |
|
51,586 |
|
146,623 |
|
(314 |
) |
1,714,776 |
| |||||
|
Capital expenditures |
|
37,156 |
|
— |
|
2,175 |
|
— |
|
39,331 |
| |||||
|
|
|
|
|
|
|
|
|
|
|
|
| |||||
|
Year Ended December 31, 2015 |
|
|
|
|
|
|
|
|
|
|
| |||||
|
Revenue |
|
$ |
974,623 |
|
$ |
185,820 |
|
$ |
10,515 |
|
$ |
(46,847 |
) |
$ |
1,124,111 |
|
|
Total assets |
|
1,578,692 |
|
55,597 |
|
168,045 |
|
(174 |
) |
1,802,160 |
| |||||
|
Capital expenditures |
|
38,042 |
|
— |
|
5,556 |
|
— |
|
43,598 |
| |||||
|
|
|
|
|
|
|
|
|
|
|
|
| |||||
|
Year Ended December 31, 2014 |
|
|
|
|
|
|
|
|
|
|
| |||||
|
Revenue |
|
$ |
1,132,012 |
|
$ |
224,938 |
|
$ |
22,809 |
|
$ |
(55,715 |
) |
$ |
1,324,044 |
|
|
Total assets |
|
1,704,267 |
|
92,347 |
|
354,846 |
|
(307 |
) |
2,151,153 |
| |||||
|
Capital expenditures |
|
19,273 |
|
39,260 |
|
4,177 |
|
— |
|
62,710 |
| |||||
As of December 31, 2016, 2015, and 2014, all of our long-lived assets were located in the U.S.
The following table presents revenue from external customers by geographic region for the years ended December 31, (in thousands):
|
|
|
2016 |
|
2015 |
|
2014 |
| |||
|
United States |
|
$ |
767,343 |
|
$ |
972,633 |
|
$ |
1,126,264 |
|
|
South Korea |
|
14,181 |
|
120,719 |
|
152,988 |
| |||
|
Other |
|
18,914 |
|
30,759 |
|
44,792 |
| |||
|
Total revenue from external customers |
|
$ |
800,438 |
|
$ |
1,124,111 |
|
$ |
1,324,044 |
|
We attribute revenue to individual countries based on the location of the physical delivery of the coal. All of our revenue for the years ended December 31, 2016, 2015, and 2014 originated in the U.S.
Adjusted EBITDA
EBITDA represents net income (loss) before: (1) interest income (expense) net, (2) income tax provision, (3) depreciation and depletion, and (4) amortization. Adjusted EBITDA represents EBITDA as further adjusted for accretion, which represents non-cash increases in asset retirement obligation liabilities resulting from the passage of time, and specifically identified items that management believes do not directly reflect our core operations. For the periods presented herein, the specifically identified items are: (1) adjustments to exclude the changes in the TRA, (2) adjustments for derivative financial instruments, excluding fair value mark-to-market gains or losses and including cash amounts received or paid, (3) adjustments to exclude non-cash impairment charges, (4) adjustments to exclude the gain from the sale of our 50% non-operating interest in the Decker Mine in September 2014, and (5) adjustments to exclude debt restructuring costs. We enter into certain derivative financial instruments such as put options that require the payment of premiums at contract inception. The reduction in the premium value over time is reflected in the mark-to-market gains or losses. Our calculation of Adjusted EBITDA does not include premiums paid for derivative financial instruments; either at contract inception, as these payments pertain to future settlement periods, or in the period of contract settlement, as the payment occurred in a preceding period.
CLOUD PEAK ENERGY INC.
NOTES TO CONSOLIDATED FINANCIAL STATEMENTS
The following table reconciles segment Adjusted EBITDA to Income (loss) before income tax provision and earnings from unconsolidated affiliates for the years ended December 31, (in thousands):
|
|
|
2016 |
|
2015 |
|
2014 |
| |||
|
Adjusted EBITDA |
|
|
|
|
|
|
| |||
|
Owned and Operated Mines |
|
$ |
143,666 |
|
$ |
209,931 |
|
$ |
240,777 |
|
|
Logistics and Related Activities |
|
(23,631 |
) |
(44,699 |
) |
9,817 |
| |||
|
Other |
|
(20,891 |
) |
(40,007 |
) |
(47,424 |
) | |||
|
Eliminations |
|
(570 |
) |
(1,435 |
) |
(1,227 |
) | |||
|
Adjustments to Income (loss) before income tax provision and earnings from unconsolidated affiliates |
|
|
|
|
|
|
| |||
|
Depreciation and depletion |
|
(27,218 |
) |
(66,064 |
) |
(112,022 |
) | |||
|
Amortization of port access rights |
|
— |
|
(3,710 |
) |
— |
| |||
|
Accretion |
|
(6,645 |
) |
(12,555 |
) |
(15,136 |
) | |||
|
Impairments |
|
(4,609 |
) |
(91,541 |
) |
— |
| |||
|
Debt restructuring costs |
|
(4,665 |
) |
— |
|
— |
| |||
|
Derivative financial instruments: |
|
|
|
|
|
|
| |||
|
Exclusion of fair value mark-to-market gains (losses)(1) |
|
8,180 |
|
(30,635 |
) |
7,805 |
| |||
|
Inclusion of cash amounts (received) paid(2)(3) |
|
3,305 |
|
585 |
|
(24,672 |
) | |||
|
Total derivative financial instruments |
|
11,485 |
|
(30,050 |
) |
(16,867 |
) | |||
|
Gain on sale of Decker Mine interest |
|
— |
|
— |
|
74,262 |
| |||
|
Interest expense, net |
|
(47,296 |
) |
(47,391 |
) |
(76,901 |
) | |||
|
Tax agreement benefit (expense)(4) |
|
— |
|
— |
|
58,595 |
| |||
|
(Income) loss from unconsolidated affiliates, net of tax |
|
(657 |
) |
(1,200 |
) |
(579 |
) | |||
|
Income (loss) before income tax provision and earnings from unconsolidated affiliates |
|
$ |
18,971 |
|
$ |
(128,720 |
) |
$ |
113,294 |
|
(1) Fair value mark-to-market (gains) losses reflected in the Consolidated Statements of Operations.
(2) Cash amounts received and paid reflected within operating cash flows.
(3) Excludes premiums paid at option contract inception of $5.8 million and $4.0 million during the years ended December 31, in 2015 and 2014, respectively, for original settlement dates in subsequent years.
(4) Changes to related deferred taxes are included in income tax expense.
24. Supplemental Guarantor/Non-Guarantor Financial Information
In accordance with the indentures governing the senior notes, CPE Inc. and certain of our 100% owned U.S. subsidiaries (the “Guarantor Subsidiaries”) have fully and unconditionally guaranteed the senior notes on a joint and several basis. These guarantees of the senior notes are subject to release in the following customary circumstances:
· a sale or other disposition (including by way of consolidation or merger or otherwise) of the Guarantor Subsidiary or the sale or other disposition of all or substantially all the assets of the Guarantor Subsidiary (other than to CPE Inc. or a Restricted Subsidiary (as defined in the applicable indenture) of CPE Inc. (in the case of the indenture for 2021 Notes and the indenture for 2024 Notes) or any issuer of the 2019 Notes or a Restricted Subsidiary (as defined in the applicable indenture) of CPE Resources (in the case of the indenture for 2019 Notes)) otherwise note in violation of the applicable indenture;
· a disposition of the majority of the capital stock of a Guarantor Subsidiary to a third person otherwise not in violation of the applicable indenture, after which the applicable Guarantor Subsidiary is no longer a Restricted Subsidiary;
· upon a liquidation or dissolution of a Guarantor Subsidiary so long as no default under the applicable indenture occurs as a result thereof;
· the designation in accordance with the applicable indenture of the Guarantor Subsidiary as an Unrestricted Subsidiary or the Guarantor Subsidiary otherwise ceases to be a Restricted Subsidiary of CPE Inc. (in the case of the
CLOUD PEAK ENERGY INC.
NOTES TO CONSOLIDATED FINANCIAL STATEMENTS
indenture for 2021 Notes and the indenture for 2024 Notes) and CPE Resources (in the case of the indenture for 2019 Notes) in accordance with the applicable indenture;
· defeasance or discharge of such series of senior notes;
· the release, other than the discharge through payment by the Guarantor Subsidiary, of all other guarantees by such Restricted Subsidiary of Debt (as defined in the applicable indenture) of either issuer of the senior notes or (in the case of the indenture for the 2021 Notes and indenture for the 2024 Notes) the debt of another Guarantor Subsidiary under the Credit Agreement; or
· in the case of the indenture for the 2021 Notes, as set forth in the First Lien/Second Lien Intercreditor Agreement, dated October 17, 2016, among Cloud Peak Energy Resources LLC, Cloud Peak Energy Finance Corp., PNC Bank, National Association, as Senior Representative for the First Lien Credit Agreement Secured Parties and Wilmington Trust, National Association, as the Second Priority Representative for the Second Lien Indenture Secured Parties.
The following historical financial statement information is provided for CPE Inc. and the Guarantor/Non-Guarantor Subsidiaries:
CLOUD PEAK ENERGY INC.
NOTES TO CONSOLIDATED FINANCIAL STATEMENTS
Supplemental Condensed Consolidating Statement of Operations and Comprehensive Income
(in thousands)
|
|
|
Year Ended December 31, 2016 |
| ||||||||||||||||
|
|
|
Parent |
|
Issuers |
|
Guarantor |
|
Non-Guarantor |
|
Eliminations |
|
Consolidated |
| ||||||
|
Revenue |
|
$ |
8,274 |
|
$ |
— |
|
$ |
800,438 |
|
$ |
— |
|
$ |
(8,274 |
) |
$ |
800,438 |
|
|
Costs and expenses |
|
|
|
|
|
|
|
|
|
|
|
|
| ||||||
|
Cost of product sold (exclusive of depreciation, depletion, amortization and accretion, shown separately) |
|
— |
|
122 |
|
646,282 |
|
— |
|
— |
|
646,404 |
| ||||||
|
Depreciation and depletion |
|
— |
|
1,172 |
|
26,046 |
|
— |
|
— |
|
27,218 |
| ||||||
|
Accretion |
|
— |
|
— |
|
6,645 |
|
— |
|
— |
|
6,645 |
| ||||||
|
(Gain) loss on derivative financial instruments |
|
— |
|
— |
|
(8,180 |
) |
— |
|
— |
|
(8,180 |
) | ||||||
|
Selling, general and administrative expenses |
|
— |
|
59,142 |
|
— |
|
— |
|
(8,274 |
) |
50,868 |
| ||||||
|
Impairments |
|
— |
|
2,048 |
|
2,561 |
|
— |
|
— |
|
4,609 |
| ||||||
|
Debt restructuring costs |
|
— |
|
4,665 |
|
— |
|
— |
|
— |
|
4,665 |
| ||||||
|
Other operating costs |
|
— |
|
— |
|
941 |
|
— |
|
— |
|
941 |
| ||||||
|
Total costs and expenses |
|
— |
|
67,149 |
|
674,295 |
|
— |
|
(8,274 |
) |
733,170 |
| ||||||
|
Operating income (loss) |
|
8,274 |
|
(67,149 |
) |
126,143 |
|
— |
|
— |
|
67,268 |
| ||||||
|
Other income (expense) |
|
|
|
|
|
|
|
|
|
|
|
|
| ||||||
|
Interest income |
|
27 |
|
110 |
|
1 |
|
— |
|
— |
|
138 |
| ||||||
|
Interest expense |
|
(244 |
) |
(46,318 |
) |
(489 |
) |
(383 |
) |
— |
|
(47,434 |
) | ||||||
|
Other, net |
|
— |
|
(138 |
) |
(1,001 |
) |
138 |
|
— |
|
(1,001 |
) | ||||||
|
Total other (expense) income |
|
(217 |
) |
(46,346 |
) |
(1,489 |
) |
(245 |
) |
— |
|
(48,297 |
) | ||||||
|
Income (loss) before income tax provision and earnings from unconsolidated affiliates |
|
8,057 |
|
(113,495 |
) |
124,654 |
|
(245 |
) |
— |
|
18,971 |
| ||||||
|
Income tax benefit (expense) |
|
(6,278 |
) |
15,586 |
|
(7,095 |
) |
— |
|
— |
|
2,213 |
| ||||||
|
Income (loss) from unconsolidated affiliates, net of tax |
|
— |
|
16 |
|
641 |
|
— |
|
— |
|
657 |
| ||||||
|
Earnings (losses) from consolidated affiliates, net of tax |
|
20,062 |
|
117,955 |
|
(245 |
) |
— |
|
(137,772 |
) |
— |
| ||||||
|
Net income (loss) |
|
21,841 |
|
20,062 |
|
117,955 |
|
(245 |
) |
(137,772 |
) |
21,841 |
| ||||||
|
Other comprehensive income (loss) |
|
|
|
|
|
|
|
|
|
|
|
|
| ||||||
|
Postretirement medical plan amortization of prior service costs |
|
(5,253 |
) |
(5,253 |
) |
(5,253 |
) |
— |
|
10,506 |
|
(5,253 |
) | ||||||
|
Postretirement medical plan adjustment |
|
(1,792 |
) |
(1,792 |
) |
(1,792 |
) |
— |
|
3,584 |
|
(1,792 |
) | ||||||
|
Postretirement medical plan change |
|
42,851 |
|
42,851 |
|
42,851 |
|
— |
|
(85,702 |
) |
42,851 |
| ||||||
|
Income tax on retiree medical and pension changes |
|
(971 |
) |
(971 |
) |
(971 |
) |
— |
|
1,942 |
|
(971 |
) | ||||||
|
Other comprehensive income (loss) |
|
34,835 |
|
34,835 |
|
34,835 |
|
— |
|
(69,670 |
) |
34,835 |
| ||||||
|
Total comprehensive income (loss) |
|
$ |
56,676 |
|
$ |
54,897 |
|
$ |
152,790 |
|
$ |
(245 |
) |
$ |
(207,442 |
) |
$ |
56,676 |
|
CLOUD PEAK ENERGY INC.
NOTES TO CONSOLIDATED FINANCIAL STATEMENTS
Supplemental Condensed Consolidating Statement of Operations and Comprehensive Income
(in thousands)
|
|
|
Year Ended December 31, 2015 |
| ||||||||||||||||
|
|
|
Parent Guarantor (CPE Inc.) |
|
Issuers |
|
Guarantor Subsidiaries |
|
Non-Guarantor Subsidiaries |
|
Eliminations |
|
Consolidated |
| ||||||
|
Revenue |
|
$ |
7,308 |
|
$ |
— |
|
$ |
1,124,111 |
|
$ |
— |
|
$ |
(7,308 |
) |
$ |
1,124,111 |
|
|
Costs and expenses |
|
|
|
|
|
|
|
|
|
|
|
|
| ||||||
|
Cost of product sold (exclusive of depreciation, depletion, amortization and accretion, shown separately) |
|
— |
|
(32 |
) |
950,612 |
|
— |
|
— |
|
950,580 |
| ||||||
|
Depreciation and depletion |
|
— |
|
2,127 |
|
63,937 |
|
— |
|
— |
|
66,064 |
| ||||||
|
Amortization of port access rights |
|
— |
|
— |
|
3,710 |
|
— |
|
— |
|
3,710 |
| ||||||
|
Accretion |
|
— |
|
— |
|
12,555 |
|
— |
|
— |
|
12,555 |
| ||||||
|
(Gain) loss on derivative financial instruments |
|
— |
|
— |
|
30,635 |
|
— |
|
— |
|
30,635 |
| ||||||
|
Selling, general and administrative expenses |
|
— |
|
56,233 |
|
— |
|
— |
|
(7,308 |
) |
48,925 |
| ||||||
|
Goodwill impairment |
|
— |
|
— |
|
91,541 |
|
— |
|
— |
|
91,541 |
| ||||||
|
Other operating costs |
|
— |
|
— |
|
1,493 |
|
— |
|
(1 |
) |
1,492 |
| ||||||
|
Total costs and expenses |
|
— |
|
58,328 |
|
1,154,483 |
|
— |
|
(7,309 |
) |
1,205,502 |
| ||||||
|
Operating income (loss) |
|
7,308 |
|
(58,328 |
) |
(30,372 |
) |
— |
|
1 |
|
(81,391 |
) | ||||||
|
Other income (expense) |
|
|
|
|
|
|
|
|
|
|
|
|
| ||||||
|
Interest income |
|
— |
|
169 |
|
1 |
|
— |
|
— |
|
170 |
| ||||||
|
Interest expense |
|
(36 |
) |
(43,638 |
) |
(3,543 |
) |
(344 |
) |
— |
|
(47,561 |
) | ||||||
|
Other, net |
|
— |
|
(177 |
) |
62 |
|
177 |
|
— |
|
62 |
| ||||||
|
Total other income (expense) |
|
(36 |
) |
(43,646 |
) |
(3,480 |
) |
(167 |
) |
— |
|
(47,329 |
) | ||||||
|
Income (loss) before income tax provision and earnings from unconsolidated affiliates |
|
7,272 |
|
(101,974 |
) |
(33,851 |
) |
(167 |
) |
1 |
|
(128,720 |
) | ||||||
|
Income tax benefit (expense) |
|
(62,019 |
) |
15,339 |
|
(30,762 |
) |
62 |
|
— |
|
(77,380 |
) | ||||||
|
Income (loss) from unconsolidated affiliates, net of tax |
|
— |
|
11 |
|
1,188 |
|
— |
|
1 |
|
1,200 |
| ||||||
|
Earnings (losses) from consolidated affiliates, net of tax |
|
(150,153 |
) |
(63,530 |
) |
(105 |
) |
— |
|
213,788 |
|
— |
| ||||||
|
Net income (loss) |
|
(204,900 |
) |
(150,153 |
) |
(63,530 |
) |
(105 |
) |
213,790 |
|
(204,900 |
) | ||||||
|
Other comprehensive income (loss) |
|
|
|
|
|
|
|
|
|
|
|
|
| ||||||
|
Postretirement medical plan amortization of prior service costs |
|
1,252 |
|
1,252 |
|
1,252 |
|
— |
|
(2,504 |
) |
1,252 |
| ||||||
|
Postretirement medical plan adjustment |
|
(3,874 |
) |
(3,874 |
) |
(3,874 |
) |
— |
|
7,748 |
|
(3,874 |
) | ||||||
|
Income tax on postretirement medical and pension changes |
|
970 |
|
970 |
|
970 |
|
— |
|
(1,940 |
) |
970 |
| ||||||
|
Other comprehensive income (loss) |
|
(1,652 |
) |
(1,652 |
) |
(1,652 |
) |
— |
|
3,304 |
|
(1,652 |
) | ||||||
|
Total comprehensive income (loss) |
|
$ |
(206,552 |
) |
$ |
(151,805 |
) |
$ |
(65,182 |
) |
$ |
(105 |
) |
$ |
217,092 |
|
$ |
(206,552 |
) |
CLOUD PEAK ENERGY INC.
NOTES TO CONSOLIDATED FINANCIAL STATEMENTS
Supplemental Condensed Consolidating Statement of Operations and Comprehensive Income
(in thousands)
|
|
|
Year Ended December 31, 2014 |
| ||||||||||||||||
|
|
|
Parent |
|
Issuers |
|
Guarantor Subsidiaries |
|
Non-Guarantor |
|
Eliminations |
|
Consolidated |
| ||||||
|
Revenue |
|
$ |
8,796 |
|
$ |
— |
|
$ |
1,308,391 |
|
$ |
15,653 |
|
$ |
(8,796 |
) |
$ |
1,324,044 |
|
|
Costs and expenses |
|
|
|
|
|
|
|
|
|
|
|
|
| ||||||
|
Cost of product sold (exclusive of depreciation, depletion, amortization and accretion, shown separately) |
|
— |
|
260 |
|
1,076,154 |
|
17,841 |
|
— |
|
1,094,257 |
| ||||||
|
Depreciation and depletion |
|
— |
|
2,994 |
|
110,196 |
|
(1,168 |
) |
— |
|
112,022 |
| ||||||
|
Accretion |
|
— |
|
— |
|
12,333 |
|
2,803 |
|
— |
|
15,136 |
| ||||||
|
(Gain) loss on derivative financial instruments |
|
— |
|
— |
|
(7,805 |
) |
— |
|
— |
|
(7,805 |
) | ||||||
|
Selling, general and administrative expenses |
|
— |
|
58,997 |
|
— |
|
— |
|
(8,796 |
) |
50,201 |
| ||||||
|
Other operating costs |
|
— |
|
— |
|
2,693 |
|
— |
|
— |
|
2,693 |
| ||||||
|
Total costs and expenses |
|
— |
|
62,252 |
|
1,193,571 |
|
19,476 |
|
(8,796 |
) |
1,266,504 |
| ||||||
|
Gain on sale of Decker Mine interest |
|
— |
|
— |
|
(74,262 |
) |
— |
|
— |
|
(74,262 |
) | ||||||
|
Operating income (loss) |
|
8,796 |
|
(62,252 |
) |
189,081 |
|
(3,823 |
) |
— |
|
131,802 |
| ||||||
|
Other income (expense) |
|
|
|
|
|
|
|
|
|
|
|
|
| ||||||
|
Interest income |
|
— |
|
259 |
|
— |
|
— |
|
— |
|
259 |
| ||||||
|
Interest expense |
|
— |
|
(68,064 |
) |
(8,710 |
) |
(386 |
) |
— |
|
(77,160 |
) | ||||||
|
Tax agreement benefit (expense) |
|
58,595 |
|
— |
|
— |
|
— |
|
— |
|
58,595 |
| ||||||
|
Other, net |
|
— |
|
(999 |
) |
374 |
|
422 |
|
— |
|
(202 |
) | ||||||
|
Total other (expense) income |
|
58,595 |
|
(68,804 |
) |
(8,336 |
) |
36 |
|
— |
|
(18,508 |
) | ||||||
|
Income (loss) before income tax provision and earnings from unconsolidated affiliates |
|
67,391 |
|
(131,056 |
) |
180,746 |
|
(3,787 |
) |
— |
|
113,294 |
| ||||||
|
Income tax benefit (expense) |
|
(20,439 |
) |
11,909 |
|
(27,889 |
) |
1,505 |
|
— |
|
(34,913 |
) | ||||||
|
Earnings from unconsolidated affiliates, net of tax |
|
— |
|
(4 |
) |
584 |
|
— |
|
— |
|
579 |
| ||||||
|
Earnings (losses) from consolidated affiliates, net of tax |
|
32,007 |
|
151,158 |
|
(2,282 |
) |
— |
|
(180,883 |
) |
— |
| ||||||
|
Net income (loss) |
|
78,960 |
|
32,007 |
|
151,158 |
|
(2,282 |
) |
(180,883 |
) |
78,960 |
| ||||||
|
Other comprehensive income (loss) |
|
|
|
|
|
|
|
|
|
|
|
|
| ||||||
|
Postretirement medical plan amortization of prior service costs |
|
989 |
|
989 |
|
989 |
|
— |
|
(1,978 |
) |
989 |
| ||||||
|
Postretirement medical plan adjustment |
|
(5,564 |
) |
(5,564 |
) |
(5,564 |
) |
— |
|
11,128 |
|
(5,564 |
) | ||||||
|
Write-off of prior service costs related to Decker Mine pension plan |
|
3,183 |
|
3,183 |
|
3,183 |
|
3,183 |
|
(9,549 |
) |
3,183 |
| ||||||
|
Income tax on retiree medical and pension changes |
|
372 |
|
372 |
|
372 |
|
(1,146 |
) |
402 |
|
372 |
| ||||||
|
Other comprehensive income (loss) |
|
(1,020 |
) |
(1,020 |
) |
(1,020 |
) |
2,037 |
|
3 |
|
(1,020 |
) | ||||||
|
Total comprehensive income (loss) |
|
$ |
77,940 |
|
$ |
30,987 |
|
$ |
150,138 |
|
$ |
(245 |
) |
$ |
(180,880 |
) |
$ |
77,940 |
|
CLOUD PEAK ENERGY INC.
NOTES TO CONSOLIDATED FINANCIAL STATEMENTS
Supplemental Condensed Consolidating Balance Sheets
(in thousands)
|
|
|
December 31, 2016 |
| ||||||||||||||||
|
|
|
Parent |
|
Issuers |
|
Guarantor |
|
Non-Guarantor |
|
Eliminations |
|
Consolidated |
| ||||||
|
ASSETS |
|
|
|
|
|
|
|
|
|
|
|
|
| ||||||
|
Current assets |
|
|
|
|
|
|
|
|
|
|
|
|
| ||||||
|
Cash and cash equivalents |
|
$ |
— |
|
$ |
83,673 |
|
$ |
35 |
|
$ |
— |
|
$ |
— |
|
$ |
83,708 |
|
|
Accounts receivable |
|
— |
|
— |
|
13,261 |
|
36,050 |
|
— |
|
49,311 |
| ||||||
|
Due from related parties |
|
— |
|
116,486 |
|
— |
|
— |
|
(116,486 |
) |
— |
| ||||||
|
Inventories, net |
|
— |
|
70 |
|
68,613 |
|
— |
|
— |
|
68,683 |
| ||||||
|
Derivative financial instruments |
|
— |
|
— |
|
752 |
|
— |
|
— |
|
752 |
| ||||||
|
Income tax receivable |
|
1,601 |
|
— |
|
— |
|
— |
|
— |
|
1,601 |
| ||||||
|
Other prepaid and deferred charges |
|
278 |
|
— |
|
20,083 |
|
— |
|
— |
|
20,361 |
| ||||||
|
Other assets |
|
— |
|
— |
|
741 |
|
— |
|
— |
|
741 |
| ||||||
|
Total current assets |
|
1,879 |
|
200,229 |
|
103,485 |
|
36,050 |
|
(116,486 |
) |
225,157 |
| ||||||
|
Noncurrent assets |
|
|
|
|
|
|
|
|
|
|
|
|
| ||||||
|
Property, plant and equipment, net |
|
— |
|
3,307 |
|
1,429,054 |
|
— |
|
— |
|
1,432,361 |
| ||||||
|
Goodwill |
|
— |
|
— |
|
2,280 |
|
— |
|
— |
|
2,280 |
| ||||||
|
Other assets |
|
1,019,289 |
|
1,299,413 |
|
52,793 |
|
— |
|
(2,316,517 |
) |
54,978 |
| ||||||
|
Total assets |
|
$ |
1,021,168 |
|
$ |
1,502,949 |
|
$ |
1,587,612 |
|
$ |
36,050 |
|
$ |
(2,433,003 |
) |
$ |
1,714,776 |
|
|
|
|
|
|
|
|
|
|
|
|
|
|
|
| ||||||
|
LIABILITIES AND MEMBER’S EQUITY |
|
|
|
|
|
|
|
|
|
|
|
|
| ||||||
|
Current liabilities |
|
|
|
|
|
|
|
|
|
|
|
|
| ||||||
|
Accounts payable |
|
$ |
4 |
|
$ |
1,748 |
|
$ |
25,896 |
|
$ |
30 |
|
$ |
— |
|
$ |
27,678 |
|
|
Royalties and production taxes |
|
— |
|
— |
|
63,018 |
|
— |
|
— |
|
63,018 |
| ||||||
|
Accrued expenses |
|
3,646 |
|
6,879 |
|
25,332 |
|
— |
|
— |
|
35,857 |
| ||||||
|
Due to related parties |
|
59,638 |
|
71 |
|
27,250 |
|
29,598 |
|
(116,486 |
) |
71 |
| ||||||
|
Other liabilities |
|
— |
|
— |
|
2,567 |
|
— |
|
— |
|
2,567 |
| ||||||
|
Total current liabilities |
|
63,288 |
|
8,698 |
|
144,063 |
|
29,628 |
|
(116,486 |
) |
129,191 |
| ||||||
|
Noncurrent liabilities |
|
|
|
|
|
|
|
|
|
|
|
|
| ||||||
|
Senior notes |
|
— |
|
475,009 |
|
— |
|
— |
|
— |
|
475,009 |
| ||||||
|
Asset retirement obligations, net of current portion |
|
— |
|
— |
|
97,048 |
|
— |
|
— |
|
97,048 |
| ||||||
|
Accumulated postretirement benefit obligation, net of current portion |
|
— |
|
— |
|
22,950 |
|
— |
|
— |
|
22,950 |
| ||||||
|
Royalties and production taxes, net of current portion |
|
— |
|
— |
|
21,557 |
|
— |
|
— |
|
21,557 |
| ||||||
|
Other liabilities |
|
6,219 |
|
— |
|
11,141 |
|
— |
|
— |
|
17,360 |
| ||||||
|
Total liabilities |
|
69,507 |
|
483,707 |
|
296,759 |
|
29,628 |
|
(116,486 |
) |
763,115 |
| ||||||
|
Commitments and Contingencies (Note 19) |
|
|
|
|
|
|
|
|
|
|
|
|
| ||||||
|
Total equity |
|
951,661 |
|
1,019,241 |
|
1,290,854 |
|
6,422 |
|
(2,316,517 |
) |
951,661 |
| ||||||
|
Total liabilities and equity |
|
$ |
1,021,168 |
|
$ |
1,502,948 |
|
$ |
1,587,613 |
|
$ |
36,050 |
|
$ |
(2,433,003 |
) |
$ |
1,714,776 |
|
CLOUD PEAK ENERGY INC.
NOTES TO CONSOLIDATED FINANCIAL STATEMENTS
Supplemental Condensed Consolidating Balance Sheets
(in thousands)
|
|
|
December 31, 2015 |
| ||||||||||||||||
|
|
|
Parent Guarantor |
|
Issuers |
|
Guarantor |
|
Non-Guarantor |
|
Eliminations |
|
Consolidated |
| ||||||
|
ASSETS |
|
|
|
|
|
|
|
|
|
|
|
|
| ||||||
|
Current assets |
|
|
|
|
|
|
|
|
|
|
|
|
| ||||||
|
Cash and cash equivalents |
|
$ |
— |
|
$ |
87,054 |
|
$ |
2,259 |
|
$ |
— |
|
$ |
— |
|
$ |
89,313 |
|
|
Accounts receivable |
|
— |
|
— |
|
4,327 |
|
38,921 |
|
— |
|
43,248 |
| ||||||
|
Due from related parties |
|
— |
|
— |
|
595,742 |
|
— |
|
(595,582 |
) |
160 |
| ||||||
|
Inventories, net |
|
— |
|
6,659 |
|
70,104 |
|
— |
|
— |
|
76,763 |
| ||||||
|
Income tax receivable |
|
8,659 |
|
— |
|
— |
|
— |
|
— |
|
8,659 |
| ||||||
|
Other prepaid and deferred charges |
|
291 |
|
47 |
|
25,607 |
|
— |
|
— |
|
25,945 |
| ||||||
|
Other assets |
|
— |
|
— |
|
98 |
|
— |
|
— |
|
98 |
| ||||||
|
Total current assets |
|
8,950 |
|
93,760 |
|
698,137 |
|
38,921 |
|
(595,582 |
) |
244,186 |
| ||||||
|
Noncurrent assets |
|
|
|
|
|
|
|
|
|
|
|
|
| ||||||
|
Property, plant and equipment, net |
|
— |
|
5,035 |
|
1,483,336 |
|
— |
|
— |
|
1,488,371 |
| ||||||
|
Goodwill |
|
— |
|
— |
|
2,280 |
|
— |
|
— |
|
2,280 |
| ||||||
|
Other assets |
|
956,296 |
|
1,844,033 |
|
64,401 |
|
— |
|
(2,797,407 |
) |
67,323 |
| ||||||
|
Total assets |
|
$ |
965,246 |
|
$ |
1,942,827 |
|
$ |
2,248,154 |
|
$ |
38,921 |
|
$ |
(3,392,988 |
) |
$ |
1,802,160 |
|
|
|
|
|
|
|
|
|
|
|
|
|
|
|
| ||||||
|
LIABILITIES AND MEMBER’S EQUITY |
|
|
|
|
|
|
|
|
|
|
|
|
| ||||||
|
Current liabilities |
|
|
|
|
|
|
|
|
|
|
|
|
| ||||||
|
Accounts payable |
|
$ |
— |
|
$ |
2,228 |
|
$ |
42,145 |
|
$ |
12 |
|
$ |
— |
|
$ |
44,385 |
|
|
Royalties and production taxes |
|
— |
|
— |
|
74,054 |
|
— |
|
— |
|
74,054 |
| ||||||
|
Accrued expenses |
|
2,296 |
|
5,420 |
|
34,601 |
|
— |
|
— |
|
42,317 |
| ||||||
|
Due to related parties |
|
75,068 |
|
487,772 |
|
— |
|
32,742 |
|
(595,582 |
) |
— |
| ||||||
|
Other liabilities |
|
— |
|
— |
|
2,133 |
|
— |
|
— |
|
2,133 |
| ||||||
|
Total current liabilities |
|
77,364 |
|
495,420 |
|
152,933 |
|
32,754 |
|
(595,582 |
) |
162,889 |
| ||||||
|
Noncurrent liabilities |
|
|
|
|
|
|
|
|
|
|
|
|
| ||||||
|
Senior notes |
|
— |
|
491,160 |
|
— |
|
— |
|
— |
|
491,160 |
| ||||||
|
Asset retirement obligations, net of current portion |
|
— |
|
— |
|
151,755 |
|
— |
|
— |
|
151,755 |
| ||||||
|
Accumulated postretirement benefit obligation, net of current portion |
|
— |
|
— |
|
60,845 |
|
— |
|
— |
|
60,845 |
| ||||||
|
Royalties and production taxes, net of current portion |
|
— |
|
— |
|
34,680 |
|
— |
|
— |
|
34,680 |
| ||||||
|
Other liabilities |
|
— |
|
— |
|
12,950 |
|
— |
|
— |
|
12,950 |
| ||||||
|
Total liabilities |
|
77,364 |
|
986,580 |
|
413,162 |
|
32,754 |
|
(595,581 |
) |
914,279 |
| ||||||
|
Commitments and Contingencies (Note 19) |
|
|
|
|
|
|
|
|
|
|
|
|
| ||||||
|
Total equity |
|
887,881 |
|
956,248 |
|
1,834,992 |
|
6,167 |
|
(2,797,407 |
) |
887,881 |
| ||||||
|
Total liabilities and equity |
|
$ |
965,246 |
|
$ |
1,942,827 |
|
$ |
2,248,154 |
|
$ |
38,921 |
|
$ |
(3,392,988 |
) |
$ |
1,802,160 |
|
CLOUD PEAK ENERGY INC.
NOTES TO CONSOLIDATED FINANCIAL STATEMENTS
Supplemental Condensed Consolidating Statement of Cash Flows
(in thousands)
|
|
|
Year Ended December 31, 2016 |
| ||||||||||||||||
|
|
|
Parent |
|
Issuers |
|
Guarantor |
|
Non-Guarantor |
|
Eliminations |
|
Consolidated |
| ||||||
|
Net cash provided by (used in) operating activities |
|
$ |
— |
|
$ |
25,246 |
|
$ |
23,470 |
|
$ |
— |
|
$ |
— |
|
$ |
48,716 |
|
|
|
|
|
|
|
|
|
|
|
|
|
|
|
| ||||||
|
Investing activities |
|
|
|
|
|
|
|
|
|
|
|
|
| ||||||
|
Purchases of property, plant and equipment |
|
— |
|
(2,003 |
) |
(31,636 |
) |
— |
|
— |
|
(33,639 |
) | ||||||
|
Cash paid for capitalized interest |
|
— |
|
— |
|
(1,444 |
) |
— |
|
— |
|
(1,444 |
) | ||||||
|
Investment in development projects |
|
— |
|
— |
|
(1,500 |
) |
— |
|
— |
|
(1,500 |
) | ||||||
|
Payment of restricted cash |
|
— |
|
— |
|
(725 |
) |
— |
|
— |
|
(725 |
) | ||||||
|
Return of restricted cash |
|
— |
|
— |
|
8,500 |
|
— |
|
— |
|
8,500 |
| ||||||
|
Insurance proceeds |
|
— |
|
— |
|
2,826 |
|
— |
|
— |
|
2,826 |
| ||||||
|
Other |
|
— |
|
— |
|
659 |
|
— |
|
— |
|
659 |
| ||||||
|
Net cash provided by (used in) investing activities |
|
— |
|
(2,003 |
) |
(23,320 |
) |
— |
|
— |
|
(25,323 |
) | ||||||
|
|
|
|
|
|
|
|
|
|
|
|
|
|
| ||||||
|
Financing activities |
|
|
|
|
|
|
|
|
|
|
|
|
| ||||||
|
Payment of deferred financing costs |
|
— |
|
(3,624 |
) |
— |
|
— |
|
— |
|
(3,624 |
) | ||||||
|
Cash paid on tender of 2019 and 2024 senior notes |
|
— |
|
(18,335 |
) |
— |
|
— |
|
— |
|
(18,335 |
) | ||||||
|
Payment of debt restructuring costs |
|
— |
|
(4,665 |
) |
— |
|
— |
|
— |
|
(4,665 |
) | ||||||
|
Other |
|
— |
|
— |
|
(2,374 |
) |
— |
|
— |
|
(2,374 |
) | ||||||
|
|
|
|
|
|
|
|
|
|
|
|
|
|
| ||||||
|
Net cash provided by (used in) financing activities |
|
— |
|
(26,624 |
) |
(2,374 |
) |
— |
|
— |
|
(28,998 |
) | ||||||
|
|
|
|
|
|
|
|
|
|
|
|
|
|
| ||||||
|
Net increase (decrease) in cash and cash equivalents |
|
— |
|
(3,381 |
) |
(2,224 |
) |
— |
|
— |
|
(5,605 |
) | ||||||
|
Cash and cash equivalents at beginning of period |
|
— |
|
87,054 |
|
2,259 |
|
— |
|
— |
|
89,313 |
| ||||||
|
Cash and cash equivalents at the end of period |
|
$ |
— |
|
83,673 |
|
35 |
|
— |
|
— |
|
83,708 |
| |||||
CLOUD PEAK ENERGY INC.
NOTES TO CONSOLIDATED FINANCIAL STATEMENTS
Supplemental Condensed Consolidating Statement of Cash Flows
(in thousands)
|
|
|
Year Ended December 31, 2015 |
| ||||||||||||||||
|
|
|
Parent |
|
Issuers |
|
Guarantor |
|
Non-Guarantor |
|
Eliminations |
|
Consolidated |
| ||||||
|
Net cash provided by (used in) operating activities |
|
$ |
— |
|
$ |
(77,090 |
) |
$ |
118,679 |
|
$ |
— |
|
$ |
— |
|
$ |
41,589 |
|
|
|
|
|
|
|
|
|
|
|
|
|
|
|
| ||||||
|
Investing activities |
|
|
|
|
|
|
|
|
|
|
|
|
| ||||||
|
Purchases of property, plant and equipment |
|
— |
|
(3,397 |
) |
(34,265 |
) |
— |
|
— |
|
(37,662 |
) | ||||||
|
Cash paid for capitalized interest |
|
— |
|
— |
|
(843 |
) |
— |
|
— |
|
(843 |
) | ||||||
|
Investment in port access rights |
|
— |
|
— |
|
(2,160 |
) |
— |
|
— |
|
(2,160 |
) | ||||||
|
Investment in development projects |
|
— |
|
— |
|
(1,526 |
) |
— |
|
— |
|
(1,526 |
) | ||||||
|
Investment in unconsolidated affiliate |
|
— |
|
— |
|
(6,570 |
) |
— |
|
— |
|
(6,570 |
) | ||||||
|
Payment of restricted cash |
|
— |
|
— |
|
(6,500 |
) |
— |
|
— |
|
(6,500 |
) | ||||||
|
Other |
|
— |
|
11 |
|
212 |
|
— |
|
— |
|
223 |
| ||||||
|
Net cash provided by (used in) investing activities |
|
— |
|
(3,386 |
) |
(51,652 |
) |
— |
|
— |
|
(55,038 |
) | ||||||
|
|
|
|
|
|
|
|
|
|
|
|
|
|
| ||||||
|
Financing activities |
|
|
|
|
|
|
|
|
|
|
|
|
| ||||||
|
Principal payments on federal coal leases |
|
— |
|
— |
|
(63,970 |
) |
— |
|
— |
|
(63,970 |
) | ||||||
|
Payment of deferred financing costs |
|
— |
|
(2 |
) |
(340 |
) |
— |
|
— |
|
(342 |
) | ||||||
|
Other |
|
— |
|
— |
|
(1,671 |
) |
— |
|
— |
|
(1,671 |
) | ||||||
|
Net cash provided by (used in) financing activities |
|
— |
|
(2 |
) |
(65,981 |
) |
— |
|
— |
|
(65,983 |
) | ||||||
|
|
|
|
|
|
|
|
|
|
|
|
|
|
| ||||||
|
Net increase (decrease) in cash and cash equivalents |
|
— |
|
(80,478 |
) |
1,046 |
|
— |
|
— |
|
(79,432 |
) | ||||||
|
Cash and cash equivalents at beginning of period |
|
— |
|
167,532 |
|
1,213 |
|
— |
|
— |
|
168,745 |
| ||||||
|
Cash and cash equivalents at the end of period |
|
$ |
— |
|
$ |
87,054 |
|
$ |
2,259 |
|
$ |
— |
|
$ |
— |
|
$ |
89,313 |
|
CLOUD PEAK ENERGY INC.
NOTES TO CONSOLIDATED FINANCIAL STATEMENTS
Supplemental Condensed Consolidating Statement of Cash Flows
(in thousands)
|
|
|
Year Ended December 31, 2014 |
| ||||||||||||||||
|
|
|
Parent |
|
Issuers |
|
Guarantor |
|
Non-Guarantor |
|
Eliminations |
|
Consolidated |
| ||||||
|
Net cash provided by (used in) operating activities |
|
$ |
(891 |
) |
$ |
(21,169 |
) |
$ |
124,642 |
|
$ |
(4,408 |
) |
$ |
— |
|
$ |
98,174 |
|
|
|
|
|
|
|
|
|
|
|
|
|
|
|
| ||||||
|
Investing activities |
|
|
|
|
|
|
|
|
|
|
|
|
| ||||||
|
Purchases of property, plant and equipment |
|
— |
|
(4,177 |
) |
(14,542 |
) |
— |
|
— |
|
(18,719 |
) | ||||||
|
Cash paid for capitalized interest |
|
— |
|
— |
|
(4,133 |
) |
— |
|
— |
|
(4,133 |
) | ||||||
|
Investments in marketable securities |
|
— |
|
(8,159 |
) |
— |
|
— |
|
— |
|
(8,159 |
) | ||||||
|
Maturity and redemption of investments |
|
— |
|
88,845 |
|
— |
|
— |
|
— |
|
88,845 |
| ||||||
|
Investment in port access rights |
|
— |
|
— |
|
(39,260 |
) |
— |
|
— |
|
(39,260 |
) | ||||||
|
Investment in development projects |
|
— |
|
— |
|
(3,522 |
) |
— |
|
— |
|
(3,522 |
) | ||||||
|
Contributions made to subsidiary |
|
— |
|
— |
|
(1,750 |
) |
— |
|
1,750 |
|
— |
| ||||||
|
Distribution received from subsidiary |
|
— |
|
— |
|
1,486 |
|
— |
|
(1,486 |
) |
— |
| ||||||
|
Other |
|
— |
|
(46 |
) |
(1,641 |
) |
— |
|
— |
|
(1,687 |
) | ||||||
|
Net cash provided by (used in) investing activities |
|
— |
|
76,463 |
|
(63,362 |
) |
— |
|
264 |
|
13,365 |
| ||||||
|
|
|
|
|
|
|
|
|
|
|
|
|
|
| ||||||
|
Financing activities |
|
|
|
|
|
|
|
|
|
|
|
|
| ||||||
|
Principal payments on federal coal leases |
|
— |
|
— |
|
(58,958 |
) |
— |
|
— |
|
(58,958 |
) | ||||||
|
Issuance of senior notes |
|
— |
|
200,000 |
|
— |
|
— |
|
— |
|
200,000 |
| ||||||
|
Repayment of senior notes |
|
— |
|
(300,000 |
) |
— |
|
— |
|
— |
|
(300,000 |
) | ||||||
|
Payment of deferred financing costs |
|
— |
|
(14,755 |
) |
— |
|
— |
|
— |
|
(14,755 |
) | ||||||
|
Contributions received from parent |
|
— |
|
— |
|
— |
|
1,750 |
|
(1,750 |
) |
— |
| ||||||
|
Distributions made to parent |
|
— |
|
— |
|
— |
|
(1,486 |
) |
1,486 |
|
— |
| ||||||
|
Other |
|
891 |
|
— |
|
(1,605 |
) |
— |
|
— |
|
(714 |
) | ||||||
|
Net cash provided by (used in) financing activities |
|
891 |
|
(114,755 |
) |
(60,563 |
) |
264 |
|
(264 |
) |
(174,427 |
) | ||||||
|
|
|
|
|
|
|
|
|
|
|
|
|
|
| ||||||
|
Net increase (decrease) in cash and cash equivalents |
|
— |
|
(59,461 |
) |
717 |
|
(4,144 |
) |
— |
|
(62,888 |
) | ||||||
|
Cash and cash equivalents at beginning of period |
|
— |
|
226,993 |
|
496 |
|
4,144 |
|
— |
|
231,633 |
| ||||||
|
Cash and cash equivalents at the end of period |
|
$ |
— |
|
$ |
167,532 |
|
$ |
1,213 |
|
$ |
— |
|
$ |
— |
|
$ |
168,745 |
|
CLOUD PEAK ENERGY INC.
NOTES TO CONSOLIDATED FINANCIAL STATEMENTS
25. Summary Unaudited Quarterly Financial Information
A summary of the unaudited quarterly results of operations for the years ended December 31, 2016 and 2015 is presented below (in thousands except per share amounts).
|
|
|
Year Ended December 31, 2016 |
| ||||||||||
|
|
|
First |
|
Second |
|
Third |
|
Fourth |
| ||||
|
Revenue |
|
$ |
181,249 |
|
$ |
174,188 |
|
$ |
217,073 |
|
$ |
227,928 |
|
|
Operating income (loss) |
|
(25,645 |
) |
45,920 |
|
10,861 |
|
36,131 |
| ||||
|
Net income (loss) |
|
(36,375 |
) |
35,289 |
|
(1,584 |
) |
24,511 |
| ||||
|
Income (loss) per common share: |
|
|
|
|
|
|
|
|
| ||||
|
Basic |
|
$ |
(0.59 |
) |
$ |
0.58 |
|
$ |
(0.03 |
) |
$ |
0.40 |
|
|
Diluted |
|
$ |
(0.59 |
) |
$ |
0.57 |
|
$ |
(0.03 |
) |
$ |
0.39 |
|
|
Closing stock price |
|
$ |
1.95 |
|
$ |
2.06 |
|
$ |
5.44 |
|
$ |
5.61 |
|
|
|
|
Year Ended December 31, 2015 |
| ||||||||||
|
|
|
First |
|
Second |
|
Third |
|
Fourth |
| ||||
|
Revenue |
|
$ |
317,553 |
|
$ |
244,148 |
|
$ |
301,673 |
|
$ |
260,737 |
|
|
Operating income (loss) |
|
7,984 |
|
(50,812 |
) |
17,458 |
|
(56,022 |
) | ||||
|
Net income (loss) |
|
(4,680 |
) |
(52,897 |
) |
8,873 |
|
(156,196 |
) | ||||
|
Income (loss) per common share: |
|
|
|
|
|
|
|
|
| ||||
|
Basic |
|
$ |
(0.08 |
) |
$ |
(0.87 |
) |
$ |
0.15 |
|
$ |
(2.55 |
) |
|
Diluted |
|
$ |
(0.08 |
) |
$ |
(0.87 |
) |
$ |
0.14 |
|
$ |
(2.55 |
) |
|
Closing stock price |
|
$ |
5.82 |
|
$ |
4.66 |
|
$ |
2.63 |
|
$ |
2.08 |
|
During the first quarter of 2016, Net income (loss) included non-cash impairments of $4.2 million related to engineering costs for the Overland Conveyor project and a shovel that we no longer expect to use because of declining production. During the second quarter of 2016, Net income (loss) included non-cash adjustments of $37.3 million to decrease Depreciation and depletion related to a decrease in the ARO liability. During the third quarter of 2016, we recorded $4.5 million in debt restructuring costs related to the Exchange Offers completed in the fourth quarter. Net income (loss) for the fourth quarter of 2016 included non-cash adjustments of $13.9 million for Depreciation and depletion related to additional decreases in the ARO liability, as well as an additional $0.2 million of debt restructuring costs.
During the first quarter of 2015, Net income (loss) included an out of period adjustment that decreased tax expense by $0.3 million. During the second quarter of 2015, we recorded a non-cash impairment charge of $33.4 million related to goodwill at our 8400 Btu Cordero Rojo Mine. During the fourth quarter of 2015, we recorded non-cash impairments of $52.2 million related to port access rights and $6.0 million related to our equity investment in GPT. Also recorded in the fourth quarter was a valuation allowance of $111.8 million on our deferred tax assets. Finally, Net income (loss) in the fourth quarter included an out of period adjustment that increased tax expense by $7.6 million.
Item 9. Changes in and Disagreements With Accountants on Accounting and Financial Disclosure.
None.
Item 9A. Controls and Procedures.
Disclosure Controls and Procedures
An evaluation was performed by management, under the supervision and with the participation of the Chief Executive Officer and Chief Financial Officer, of the effectiveness of the design and operation of our disclosure controls and procedures as of December 31, 2016. Our Chief Executive Officer and Chief Financial Officer have concluded that our disclosure controls and procedures, which are designed to provide reasonable assurance that information required to be disclosed in reports filed under the Securities and Exchange Act of 1934, as amended, is recorded, processed, summarized and reported within the specified time periods and accumulated and communicated to our management, including our Chief Executive Officer and Chief Financial Officer, as appropriate, to allow timely decisions regarding required disclosure, were effective at a reasonable assurance level as of December 31, 2016.
Our management, including our Chief Executive Officer and Chief Financial Officer, does not expect that our disclosure controls and procedures or our internal controls will prevent all error and all fraud. A control system, no matter how well conceived and operated, can provide only reasonable, not absolute, assurance that the objectives of the control system are met. Because of the inherent limitations in all control systems, no evaluation of controls can provide absolute assurance that all control issues and instances of fraud, if any, within the company have been detected.
Management’s Report on Internal Control Over Financial Reporting
Management is responsible for establishing and maintaining adequate internal control over financial reporting as defined in Exchange Act Rule 13a-15(f). Internal control over financial reporting is a process designed under the supervision of the Chief Executive Officer and Chief Financial Officer, and effected by our Board of Directors, management and other personnel to provide reasonable assurance regarding the reliability of financial reporting and the preparation of our consolidated financial statements for external purposes in accordance with generally accepted accounting principles.
Because of inherent limitations, internal control over financial reporting may not prevent or detect misstatements. Also, projections of any evaluation of effectiveness to future periods are subject to the risk that controls may become inadequate because of changes in conditions, or that the degree of compliance with the policies or procedures may deteriorate.
Management conducted an evaluation of the effectiveness of our internal control over financial reporting using the criteria set by the Committee of Sponsoring Organizations of the Treadway Commission (“COSO”) in Internal Control—Integrated Framework (2013). Based on this evaluation, management concluded that our internal control over financial reporting was effective as of December 31, 2016.
Our independent registered public accounting firm, PricewaterhouseCoopers LLP, has audited the effectiveness of our internal control over financial reporting as of December 31, 2016, as stated in their audit report included in Part II, Item 8.
Changes in Internal Control Over Financial Reporting
There were no changes in CPE Inc.’s internal control over financial reporting during the quarter ended December 31, 2016, that have materially affected, or are reasonably likely to materially affect, CPE Inc.’s internal control over financial reporting.
None.
Item 10. Directors, Executive Officers and Corporate Governance.
The information required by Item 401 of Regulation S-K is included under the caption Election of Class II Directors in our Proxy Statement to be distributed to our stockholders in connection with our 2017 annual meeting and in Part I of this report under the caption “Executive Officers.” Such information is incorporated herein by reference. The information required by Items 405 and 407(c)(3), (d)(4), and (d)(5) of Regulation S-K will be included under the captions Section 16(a) Beneficial Ownership Reporting Compliance and Corporate Governance in our Proxy Statement to be distributed to our stockholders in connection with our 2017 annual meeting and is incorporated herein by reference.
We have adopted a Code of Ethics for Principal Executive and Senior Financial Officers, which is available on our website at www.cloudpeakenergy.com in the “Corporate Governance” subsection in the “Investor Relations” section. We will disclose any future amendments to or waivers from our Code of Ethics for Principal Executive and Senior Financial Officers by posting such information on our website.
Item 11. Executive Compensation.
The information required by Items 402 and 407(e)(4) and (e)(5) of Regulation S-K will be included in our Proxy Statement to be distributed to our stockholders in connection with our 2017 annual meeting under the caption Executive Compensation and is incorporated herein by reference.
Item 12. Security Ownership of Certain Beneficial Owners and Management and Related Stockholder Matters.
The information required by Item 403 of Regulation S-K will be included under the caption Security Ownership of Management and Principal Stockholders in our Proxy Statement to be distributed to our stockholders in connection with our 2017 annual meeting and is incorporated herein by reference.
As required by Item 201(d) of Regulation S-K, the following table provides information regarding our equity compensation plans as of December 31, 2016:
|
|
|
|
|
|
|
Number of securities remaining |
| |
|
|
|
Number of securities to be |
|
Weighted -average |
|
available for future issuance |
| |
|
|
|
issued upon exercise of |
|
exercise price of |
|
under equity compensation |
| |
|
|
|
outstanding options, |
|
outstanding options, |
|
plans (excluding securities |
| |
|
Plan Category |
|
warrants, and rights |
|
warrants, and rights |
|
reflected in column (a)) |
| |
|
|
|
(a) |
|
(b) |
|
(c) |
| |
|
Equity compensation plans approved by security holders |
|
5,688,782 |
|
$ |
16.73 |
|
1,992,521 |
(1) |
|
Equity compensation plans not approved by security holders |
|
— |
|
— |
|
— |
| |
|
Total |
|
5,688,782 |
|
$ |
16.73 |
|
1,992,521 |
(1) |
(1) Includes 1,956,136 shares under the Long Term Incentive Plan and 36,385 shares under our Employee Stock Purchase Plan. Shares available for issuance under the Long Term Incentive Plan may be issued pursuant to restricted stock, restricted stock units, options, stock appreciation rights, dividend equivalent rights, performance awards, and share awards.
Item 13. Certain Relationships and Related Party Transactions, and Director Independence.
The information required by Item 404 of Regulation S-K will be included under the caption Certain Relationships and Related Party Transactions in our Proxy Statement to be distributed to our stockholders in connection with our 2017 annual meeting and is incorporated herein by reference. The information required by Item 407(a) of Regulation S-K will be included under the caption Independence of Directors in our Proxy Statement to be distributed to our stockholders in connection with our 2017 annual meeting and is incorporated herein by reference.
Item 14. Principal Accounting Fees and Services.
The information required by Item 9(e) of Schedule 14A will be included under the caption Independent Auditor Fees and Services in our Proxy Statement to be distributed to our stockholders in connection with our 2017 annual meeting and is incorporated herein by reference.
Item 15. Exhibits and Financial Statement Schedules
(a) The following documents are filed as part of this Report:
(1) Reports of Independent Registered Public Accounting Firm
Consolidated Balance Sheets as of December 31, 2016 and 2015
Consolidated Statements of Operations and Comprehensive Income for the Years Ended December 31, 2016, 2015, and 2014
Consolidated Statements of Equity for the Years Ended December 31, 2016, 2015, and 2014
Consolidated Statements of Cash Flows for the Years Ended December 31, 2016, 2015, and 2014
Notes to Consolidated Financial Statements
(2) Financial Statement Schedules
Schedule II — Valuation and Qualifying Accounts
(3) Exhibit List
(b) Exhibits
See Exhibit Index at page 127 of this report.
SIGNATURES
Pursuant to the requirements of Section 13 or 15(d) of the Securities Exchange Act of 1934, the registrant has duly caused this report to be signed on its behalf by the undersigned, thereunto duly authorized.
|
|
CLOUD PEAK ENERGY INC. | |
|
|
| |
|
|
By: |
/s/ COLIN MARSHALL |
|
Date: February 15, 2017 |
|
Colin Marshall |
Pursuant to the requirements of the Securities Exchange Act of 1934, this report has been signed by the following persons on behalf of the registrant and in the capacities and on the dates indicated:
|
Name and Signatures |
|
Title |
|
Date |
|
|
|
|
|
|
|
/s/ COLIN MARSHALL |
|
President and Chief Executive Officer |
|
February 15, 2017 |
|
Colin Marshall |
|
(Principal Executive Officer) |
|
|
|
|
|
|
|
|
|
/s/ HEATH A. HILL |
|
Executive Vice President and Chief Financial Officer |
|
February 15, 2017 |
|
Heath A. Hill |
|
(Principal Financial Officer) |
|
|
|
|
|
|
|
|
|
/s/ KENDALL K. CARBONE |
|
Vice President and Chief Accounting Officer |
|
February 15, 2017 |
|
Kendall K. Carbone |
|
(Principal Accounting Officer) |
|
|
|
|
|
|
|
|
|
/s/ WILLIAM T. FOX III |
|
(Chairman of the Board of Directors) |
|
February 15, 2017 |
|
William T. Fox III |
|
|
|
|
|
|
|
|
|
|
|
/s/ PATRICK J. CONDON |
|
(Director) |
|
February 15, 2017 |
|
Patrick J. Condon |
|
|
|
|
|
|
|
|
|
|
|
/s/ JEANE L. HULL |
|
(Director) |
|
February 15, 2017 |
|
Jeane L. Hull |
|
|
|
|
|
|
|
|
|
|
|
/s/ STEVEN W. NANCE |
|
(Director) |
|
February 15, 2017 |
|
Steven W. Nance |
|
|
|
|
|
|
|
|
|
|
|
/s/ WILLIAM F. OWENS |
|
(Director) |
|
February 15, 2017 |
|
William F. Owens |
|
|
|
|
|
|
|
|
|
|
|
/s/ ROBERT SKAGGS |
|
(Director) |
|
February 15, 2017 |
|
Robert Skaggs |
|
|
|
|
EXHIBIT INDEX
The exhibits below are numbered in accordance with the Exhibit Table of Item 601 of Regulation S-K. The headings below are for convenience only and do not modify in any way the requirements of the Securities and Exchange Commission with regard to exhibits.
|
Exhibit |
|
Description of Documents |
|
|
|
|
|
|
|
Acquisition Agreements |
|
|
|
|
|
2.1 |
|
Purchase and Sale Agreement, dated as of June 29, 2012, among Arrowhead I LLC, Chevron U.S.A. Inc., CONSOL Energy Inc., Consolidation Coal Company and Reserve Coal Properties Company (Incorporated herein by reference to Exhibit 2.1 to CPE Inc.’s Current Report on Form 8-K filed on July 2, 2012 (File No. 001-34547)) |
|
|
|
|
|
2.2 |
|
Purchase and Sale Agreement, dated as of June 29, 2012, among Chevron U.S.A. Inc. and Arrowhead I LLC (Incorporated herein by reference to Exhibit 2.2 to CPE Inc.’s Current Report on Form 8-K filed on July 2, 2012 (File No. 001-34547)) |
|
|
|
|
|
2.3 |
|
Purchase and Sale Agreement, dated as of June 29, 2012, among CONSOL Energy Inc., Consolidation Coal Company, Reserve Coal Properties Company and Arrowhead I LLC (Incorporated herein by reference to Exhibit 2.3 to CPE Inc.’s Current Report on Form 8-K filed on July 2, 2012 (File No. 001-34547)) |
|
|
|
|
|
|
|
Corporate Documents |
|
|
|
|
|
3.1 |
|
Amended and Restated Certificate of Incorporation of Cloud Peak Energy Inc. effective as of November 25, 2009 (Incorporated herein by reference to Exhibit 3.1 to CPE Inc.’s Annual Report on Form 10-K filed on February 14, 2014 (File No. 001-34547)) |
|
|
|
|
|
3.2 |
|
Amended and Restated Bylaws of Cloud Peak Energy Inc., effective July 28, 2016 (incorporated by reference to Exhibit 3.2 to Cloud Peak Energy Inc.’s Quarterly Report on Form 10-Q filed on July 28, 2016 (File No. 001-34547)) |
|
|
|
|
|
3.3 |
|
Form of Stock Certificate of Cloud Peak Energy Inc. (Incorporated herein by reference to Exhibit 4.1 to Amendment No. 5 to CPE Inc.’s Form S-1 filed on November 16, 2009 (File No. 333-161293)) |
|
|
|
|
|
|
|
Indenture |
|
|
|
|
|
4.1 |
|
Indenture, dated as of November 25, 2009, by and among Cloud Peak Energy Resources LLC (and its subsidiaries listed on the signature page), Cloud Peak Energy Finance Corp., Wilmington Trust Company and Citibank, N.A. (Incorporated herein by reference to Exhibit 4.1 to CPE Inc.’s Current Report on Form 8-K filed on December 2, 2009 (File No. 001-34547)) |
|
|
|
|
|
4.2 |
|
Form of Exchange Notes (Included in Exhibit 4.1 hereto) |
|
|
|
|
|
4.3 |
|
Fourth Supplemental Indenture, dated as of March 10, 2014, to the Indenture, dated as of November 25, 2009, among Cloud Peak Energy Resources LLC, Cloud Peak Energy Finance Corp., Wilmington Trust Company, as trustee, and Citibank N.A., as securities administrator (Incorporated by reference to Exhibit 4.1 to CPE Inc.’s Current Report on Form 8-K filed on March 11, 2014 (File No. 001-34547)) |
|
|
|
|
|
4.4 |
|
Fifth Supplemental Indenture, dated as of March 25, 2014, to the Indenture, dated as of November 25, 2009, among Cloud Peak Energy Resources LLC, Cloud Peak Energy Finance Corp., Wilmington Trust Company, as trustee, and Citibank N.A., as securities administrator (Incorporated by reference to Exhibit 4.1 to CPE Inc.’s Current Report on Form 8-K filed on March 25, 2014 (File No. 001-34547)) |
|
Exhibit |
|
Description of Documents |
|
|
|
|
|
4.5 |
|
Sixth Supplemental Indenture, dated as of September 10, 2015, to the Indenture, dated as of November 25, 2009, among Cloud Peak Energy Resources LLC, Cloud Peak Energy Finance Corp., the guarantors party thereto, Wilmington Trust Company, as trustee, and Citibank N.A., as securities administrator (Incorporated by reference to Exhibit 4.1 to CPE Inc.’s Quarterly Report on 10-Q filed on October 27, 2015 (File No. 001-34547)) |
|
|
|
|
|
4.6 |
|
Indenture, dated as of March 11, 2014, among Cloud Peak Energy Resources LLC, Cloud Peak Energy Finance Corp., the guarantors party thereto and Wells Fargo Bank, National Association, as trustee (Incorporated by reference to Exhibit 4.2 to CPE Inc.’s Current Report on Form 8-K filed on March 11, 2014 (File No. 001-34547)) |
|
|
|
|
|
4.7 |
|
First Supplemental Indenture, dated as of March 11, 2014, to the Indenture, dated as of March 11, 2014, among Cloud Peak Energy Resources LLC, Cloud Peak Energy Finance Corp., the guarantors party thereto and Wells Fargo Bank, National Association, as trustee (Incorporated by reference to Exhibit 4.3 to CPE Inc.’s Current Report on Form 8-K filed on March 11, 2014 (File No. 001-34547)) |
|
|
|
|
|
4.8 |
|
Second Supplemental Indenture, dated as of September 1, 2015, to the Indenture, dated as of March 11, 2014, among Cloud Peak Energy Resources LLC, Cloud Peak Energy Finance Corp., the guarantors party thereto and Wells Fargo Bank, National Association, as trustee (Incorporated by reference to Exhibit 4.2 to CPE Inc.’s Quarterly Report on 10-Q filed on October 27, 2015 (File No. 001-34547)) |
|
|
|
|
|
4.9 |
|
Agreement of Resignation, Appointment and Acceptance, dated as of May 24, 2016, among Cloud Peak Energy Resources LLC, Cloud Peak Energy Finance Corp., Wells Fargo Bank, National Association, as resigning trustee, and Wilmington Trust, National Association, as successor trustee (incorporated by reference to Exhibit 4.1 to Cloud Peak Energy Inc.’s Quarterly Report on 10-Q filed on July 29, 2016 (File No. 001-34547)) |
|
|
|
|
|
4.10 |
|
Indenture, dated October 17, 2016, among Cloud Peak Energy Resources LLC, Cloud Peak Energy Finance Corp., the guarantors party thereto and Wilmington Trust, National Association, as Trustee and Collateral Agent (incorporated by reference to Exhibit 4.1 to Cloud Peak Energy Inc.’s Current Report on Form 8-K filed on October 17, 2016 (File No. 001-34547)) |
|
|
|
|
|
|
|
Coal Leases |
|
|
|
|
|
10.1 |
|
Federal Coal Lease WYW-151643: Antelope Coal Mine (Incorporated herein by reference to Exhibit 10.1 to CPE Inc.’s Form S-1 filed on August 12, 2009 (File No. 333-161293)) |
|
|
|
|
|
10.2 |
|
Federal Coal Lease WYW-141435: Antelope Coal Mine (Incorporated herein by reference to Exhibit 10.2 to CPE Inc.’s Form S-1 filed on August 12, 2009 (File No. 333-161293)) |
|
|
|
|
|
10.3 |
|
Federal Coal Lease WYW-0321780: Antelope Coal Mine (Incorporated herein by reference to Exhibit 10.3 to CPE Inc.’s Form S-1 filed on August 12, 2009 (File No. 333-161293)) |
|
|
|
|
|
10.4 |
|
Federal Coal Lease WYW-0322255: Antelope Coal Mine (Incorporated herein by reference to Exhibit 10.4 to CPE Inc.’s Form S-1 filed on August 12, 2009 (File No. 333-161293)) |
|
|
|
|
|
10.5 |
|
Federal Coal Lease WYW-163340: Antelope Coal LLC (Incorporated herein by reference to Exhibit 10.1 to CPE Inc.’s Current Report on Form 8-K filed on July 1, 2011 (File No. 001-34547)) |
|
|
|
|
|
10.6 |
|
Federal Coal Lease WYW-177903: Antelope Coal LLC (Incorporated herein by reference to Exhibit 10.1 to CPE Inc.’s Current Report on Form 8-K filed on August 12, 2011 (File No. 001-34547)) |
|
|
|
|
|
10.7 |
|
State of Wyoming Coal Lease No. 0-26695: Antelope Coal Mine (Incorporated herein by reference to Exhibit 10.5 to CPE Inc.’s Form S-1 filed on August 12, 2009 (File No. 333-161293)) |
|
|
|
|
|
10.8 |
|
Federal Coal Lease WYW-8385: Cordero-Rojo Mine (Incorporated herein by reference to Exhibit 10.6 to CPE Inc.’s Form S-1 filed on August 12, 2009 (File No. 333-161293)) |
|
|
|
|
|
10.9 |
|
Federal Coal Lease WYW-23929: Cordero-Rojo Mine (Incorporated herein by reference to Exhibit 10.7 to CPE Inc.’s Form S-1 filed on August 12, 2009 (File No. 333-161293)) |
|
Exhibit |
|
Description of Documents |
|
|
|
|
|
10.10 |
|
Federal Coal Lease WYW-174407: Cordero-Rojo Mine (Incorporated herein by reference to Exhibit 10.8 to CPE Inc.’s Form S-1 filed on August 12, 2009 (File No. 333-161293)) |
|
|
|
|
|
10.11 |
|
Federal Coal Lease WYW-154432: Cordero-Rojo Mine (Incorporated herein by reference to Exhibit 10.9 to CPE Inc.’s Form S-1 filed on August 12, 2009 (File No. 333-161293)) |
|
|
|
|
|
10.12 |
|
State of Wyoming Coal Lease No. 0-26935-A: Cordero-Rojo Mine (Incorporated herein by reference to Exhibit 10.10 to CPE Inc.’s Form S-1 filed on August 12, 2009 (File No. 333-161293)) |
|
|
|
|
|
10.13 |
|
State of Wyoming Coal Lease No. 0-26936-A: Cordero-Rojo Mine (Incorporated herein by reference to Exhibit 10.11 to CPE Inc.’s Form S-1 filed on August 12, 2009 (File No. 333-161293)) |
|
|
|
|
|
10.14 |
|
Federal Coal Lease MTM-88405: Spring Creek Mine (Incorporated herein by reference to Exhibit 10.12 to CPE Inc.’s Form S-1 filed on August 12, 2009 (File No. 333-161293)) |
|
|
|
|
|
10.15 |
|
Modified Federal Coal Lease MTM-069782: Spring Creek Mine (Incorporated herein by reference to Exhibit 10.1 to CPE Inc.’s Current Report on Form 8-K filed on June 18, 2010 (File No. 001-34547)) |
|
|
|
|
|
10.16 |
|
Federal Coal Lease MTM-94378: Spring Creek Mine (Incorporated herein by reference to Exhibit 10.14 to CPE Inc.’s Form S-1 filed on August 12, 2009 (File No. 333-161293)) |
|
|
|
|
|
10.17 |
|
State of Montana Coal Lease No. C-1101-00: Spring Creek Mine (Incorporated herein by reference to Exhibit 10.15 to CPE Inc.’s Form S-1 filed on August 12, 2009 (File No. 333-161293)) |
|
|
|
|
|
10.18 |
|
State of Montana Coal Lease No. C-1099-00: Spring Creek Mine (Incorporated herein by reference to Exhibit 10.16 to CPE Inc.’s Form S-1 filed on August 12, 2009 (File No. 333-161293)) |
|
|
|
|
|
10.19 |
|
State of Montana Coal Lease No. C-1100-00: Spring Creek Mine (Incorporated herein by reference to Exhibit 10.17 to CPE Inc.’s Form S-1 filed on August 12, 2009 (File No. 333-161293)) |
|
|
|
|
|
10.20 |
|
State of Montana Coal Lease No. C-1088-05: Spring Creek Mine (Incorporated herein by reference to Exhibit 10.18 to CPE Inc.’s Form S-1 filed on August 12, 2009 (File No. 333-161293)) |
|
|
|
|
|
|
|
IPO Agreements |
|
|
|
|
|
10.21 |
|
Master Separation Agreement, dated as of November 19, 2009, by and among Cloud Peak Energy Inc., Cloud Peak Energy Resources LLC, Rio Tinto America Inc., Rio Tinto Energy America Inc. and Kennecott Management Services Company (Incorporated herein by reference to Exhibit 10.1 to CPE Inc.’s Current Report on Form 8-K filed on November 25, 2009 (File No. 001-34547)) |
|
|
|
|
|
10.22 |
|
Management Services Agreement, dated as of November 19, 2009, by and between Cloud Peak Energy Inc. and Cloud Peak Energy Resources LLC (Incorporated herein by reference to Exhibit 10.9 to CPE Inc.’s Current Report on Form 8-K filed on November 25, 2009 (File No. 001-34547)) |
|
|
|
|
|
10.23 |
|
Acceleration and Release Agreement, dated August 19, 2014, between Cloud Peak Energy Inc. and Rio Tinto Energy America Inc. (Incorporated by reference to Exhibit 10.1 to CPE Inc.’s Current Report on Form 8-K filed on August 20, 2014 (File No. 001-34547)) |
|
|
|
|
|
|
|
Credit Agreements and Security Agreements |
|
|
|
|
|
10.24 |
|
Credit Agreement, dated as of February 21, 2014, by and among Cloud Peak Energy Resources LLC (and its subsidiaries listed on the signature page), PNC Bank, National Association, as administrative agent, and a syndicate of lenders (Incorporated herein by reference to Exhibit 10.1 to CPE Inc.’s Current Report on 8-K filed on February 21, 2014 (File No. 001-34547)) |
|
|
|
|
|
10.25 |
|
First Amendment to Credit Agreement, dated September 5, 2014, between Cloud Peak Energy Resources LLC, the guarantors party thereto, the lenders party thereto and PNC Bank, National Association, as Administrative Agent (Incorporated herein by reference to Exhibit 10.1 to CPE Inc.’s Current Report on 8-K filed on September 10, 2014 (File No. 001-34547)) |
|
Exhibit |
|
Description of Documents |
|
|
|
|
|
10.26 |
|
Second Amendment to Credit Agreement, dated September 9, 2016, between Cloud Peak Energy Resources LLC, the guarantors party thereto, the lenders party thereto and PNC Bank, National Association, as Administrative Agent (incorporated by reference to Exhibit 10.1 to Cloud Peak Energy Inc.’s Current Report on Form 8-K filed on September 12, 2016 (File No. 001-34547)) |
|
|
|
|
|
10.27 |
|
Guarantee and Security Agreement, dated as of February 21, 2014, by and between Cloud Peak Energy Resources LLC (and its subsidiaries listed on the signature page) and PNC Bank, National Association (Incorporated herein by reference to Exhibit 10.2 to CPE Inc.’s Current Report on 8-K filed on February 21, 2014 (File No. 001-34547)) |
|
|
|
|
|
10.28 |
|
Security Agreement Supplement, dated as of March 11, 2014, between Cloud Peak Energy Inc. and PNC Bank, National Association, as administrative agent (Incorporated herein by reference to Exhibit 10.3 to CPE Inc.’s Quarterly Report on 10-Q filed on April 30, 2014 (File No. 001-34547)) |
|
|
|
|
|
10.29 |
|
Security Agreement, dated October 17, 2016, among Cloud Peak Energy Resources LLC, Cloud Peak Energy Finance Corp., the guarantors party thereto and Wilmington Trust, National Association, as Collateral Agent (incorporated by reference to Exhibit 10.1 to Cloud Peak Energy Inc.’s Current Report on Form 8-K filed on October 17, 2016 (File No. 001-34547)) |
|
|
|
|
|
10.30 |
|
First Lien/Second Lien Intercreditor Agreement, dated October 17, 2016, among Cloud Peak Energy Resources LLC, Cloud Peak Energy Finance Corp., PNC Bank, National Association, as Senior Representative for the First Lien Credit Agreement Secured Parties and Wilmington Trust, National Association, as the Second Priority Representative for the Second Lien Indenture Secured Parties (incorporated by reference to Exhibit 10.2 to Cloud Peak Energy Inc.’s Current Report on Form 8-K filed on October 17, 2016 (File No. 001-34547)) |
|
|
|
|
|
|
|
Receivables Agreements |
|
|
|
|
|
10.31 |
|
Amended and Restated Receivables Purchase Agreement, dated as of January 31 2017, by and among Cloud Peak Energy Receivables LLC, Cloud Peak Energy Resources LLC, PNC Bank, National Association, as administrator (Incorporated herein by reference to Exhibit 10.1 to CPE Inc.’s Current Report on Form 8-K filed on February 1, 2017 (File No. 001-34547)) |
|
|
|
|
|
|
|
LTIP |
|
|
|
|
|
10.32 |
|
Cloud Peak Energy Inc. 2009 Long Term Incentive Plan, as amended and restated effective March 12, 2016 (Incorporated herein by reference to Exhibit 10.1 to CPE Inc.’s Current Report on Form 8-K filed on March 14, 2016 (File No. 001-34547) † |
|
|
|
|
|
10.33 |
|
Amendment No. 1 to the Cloud Peak Energy Inc. 2009 Long Term Incentive Plan (Incorporated herein by reference to Exhibit 10.1 to CPE Inc.’s Current Report on Form 8-K filed on May 13, 2016 (File No. 001-34547)) † |
|
|
|
|
|
10.34 |
|
Amendment No. 2 to the Cloud Peak Energy Inc. 2009 Long Term Incentive Plan (Incorporated herein by reference to Exhibit 10.1 to CPE Inc.’s Current Report on Form 8-K filed on January 10, 2017 (File No. 001-34547)) † |
|
|
|
|
|
|
|
Forms of LTIP Award Agreements |
|
|
|
|
|
10.35 |
|
Form of Cloud Peak Energy Inc. 2009 Long Term Incentive Plan IPO Nonqualified Stock Option Agreement (Incorporated herein by reference to Exhibit 10.33 to Amendment No. 5 to CPE Inc.’s Form S-1 filed on November 16, 2009 (File No. 333-161293)) † |
|
|
|
|
|
10.36 |
|
Form of 2011 Cloud Peak Energy Inc. 2009 Long Term Incentive Plan Nonqualified Stock Option Agreement (Incorporated herein by reference to Exhibit 10.2 to CPE Inc.’s Current Report on Form 8-K filed on March 9, 2011 (File No. 001-34547)) † |
|
|
|
|
|
10.37 |
|
Form of 2011 Cloud Peak Energy Inc. 2009 Long Term Incentive Plan Director Restricted Stock Unit Agreement (Incorporated herein by reference to Exhibit 10.48 to CPE Inc.’s Annual Report on Form 10-K filed on February 25, 2011 (File No. 001-34547)) |
|
Exhibit |
|
Description of Documents |
|
|
|
|
|
10.38 |
|
Form of 2012 Cloud Peak Energy Inc. 2009 Long Term Incentive Plan Nonqualified Stock Option Agreement (Incorporated herein by reference to Exhibit 10.2 to CPE Inc.’s Current Report on Form 8-K filed on March 16, 2012 (File No. 001-34547)) † |
|
|
|
|
|
10.39 |
|
Form of 2012 Cloud Peak Energy Inc. 2009 Long Term Incentive Plan Director Restricted Stock Unit Agreement (Incorporated herein by reference to Exhibit 10.44 to CPE Inc.’s Annual Report on Form 10-K filed on February 18, 2015 (File No. 001-34547)) |
|
|
|
|
|
10.40 |
|
Form of 2013 Cloud Peak Energy Inc. 2009 Long Term Incentive Plan Performance Share Unit Award Agreement (Incorporated herein by reference to Exhibit 10.1 to CPE Inc.’s Current Report on Form 8-K filed on March 11, 2013 (File No. 001-34547)) † |
|
|
|
|
|
10.41 |
|
Form of 2013 Cloud Peak Energy Inc. 2009 Long Term Incentive Plan Nonqualified Stock Option Agreement (Incorporated herein by reference to Exhibit 10.2 to CPE Inc.’s Current Report on Form 8-K filed on March 11, 2013 (File No. 001-34547)) † |
|
|
|
|
|
10.42 |
|
Form of 2013 Cloud Peak Energy Inc. 2009 Long Term Incentive Plan Restricted Stock Unit Agreement (Incorporated herein by reference to Exhibit 10.3 to CPE Inc.’s Current Report on Form 8-K filed on March 11, 2013 (File No. 001-34547)) † |
|
|
|
|
|
10.43 |
|
Form of 2013 Cloud Peak Energy Inc. 2009 Long Term Incentive Plan Director Restricted Stock Unit Agreement (Incorporated herein by reference to Exhibit 10.44 to CPE Inc.’s Annual Report on Form 10-K filed on February 14, 2013 (File No. 001-34547)) |
|
|
|
|
|
10.44 |
|
Form of 2014 Cloud Peak Energy Inc. 2009 Long Term Incentive Plan Nonqualified Stock Option Agreement (Incorporated herein by reference to Exhibit 10.2 to CPE Inc.’s Current Report on 8-K filed on March 14, 2014 (File No. 001-34547)) |
|
|
|
|
|
10.45 |
|
Form of 2014 Cloud Peak Energy Inc. 2009 Long Term Incentive Plan Director Restricted Stock Unit Agreement (Incorporated herein by reference to Exhibit 10.52 to CPE Inc.’s Annual Report on Form 10-K filed on February 18, 2015 (File No. 001-34547)) |
|
|
|
|
|
10.46 |
|
Form of 2014 Cloud Peak Energy Inc. 2009 Long Term Incentive Plan Performance Share Unit Award Agreement (Incorporated herein by reference to Exhibit 10.1 to CPE Inc.’s Current Report on 8-K filed on March 14, 2014 (File No. 001-34547)) |
|
|
|
|
|
10.47 |
|
Form of 2014 Cloud Peak Energy Inc. 2009 Long Term Incentive Plan Restricted Stock Unit Agreement (Incorporated herein by reference to Exhibit 10.3 to CPE Inc.’s Current Report on 8-K filed on March 14, 2014 (File No. 001-34547)) |
|
|
|
|
|
10.48 * |
|
Form of 2015 Cloud Peak Energy Inc. 2009 Long Term Incentive Plan Director Restricted Stock Unit Agreement |
|
|
|
|
|
10.49 |
|
Form of 2015 Cloud Peak Energy Inc. 2009 Long Term Incentive Plan Performance Share Unit Award Agreement (Incorporated herein by reference to Exhibit 10.1 to CPE Inc.’s Current Report on 8-K filed on March 3, 2015 (File No. 001-34547)) |
|
|
|
|
|
10.50 |
|
Form of 2015 Cloud Peak Energy Inc. 2009 Long Term Incentive Plan Restricted Stock Unit Agreement (Incorporated herein by reference to Exhibit 10.2 to CPE Inc.’s Current Report on 8-K filed on March 3, 2015 (File No. 001-34547)) |
|
|
|
|
|
10.51 |
|
Form of 2016 Cloud Peak Energy Inc. 2009 Long Term Incentive Plan Director Restricted Stock Unit Agreement (Incorporated herein by reference to Exhibit 10.54 to CPE Inc.’s Annual Report on Form 10-K filed on February 17, 2016 (File No. 001-34547)) |
|
|
|
|
|
10.52 |
|
Form of 2016 Cloud Peak Energy Inc. 2009 Long Term Incentive Plan Performance Share Unit Award Agreement (Incorporated herein by reference to Exhibit 10.1 to CPE Inc.’s Current Report on 8-K filed on March 7, 2016 (File No. 001-34547)) |
|
|
|
|
|
10.53 |
|
Form of 2016 Cloud Peak Energy Inc. 2009 Long Term Incentive Plan Restricted Stock Unit Agreement (Incorporated herein by reference to Exhibit 10.2 to CPE Inc.’s Current Report on 8-K filed on March 7, 2016 (File No. 001-34547)) |
|
Exhibit |
|
Description of Documents |
|
|
|
|
|
10.54 * |
|
Form of 2017 Cloud Peak Energy Inc. 2009 Long Term Incentive Plan Director Restricted Stock Unit Agreement |
|
|
|
|
|
|
|
Annual Incentive Plan |
|
|
|
|
|
10.55 |
|
Cloud Peak Energy Inc. 2013 Annual Incentive Plan (Incorporated herein by reference to Exhibit 10.1 to CPE Inc.’s Current Report on Form 8-K filed on May 15, 2013 (File No. 001-34547)) † |
|
|
|
|
|
|
|
Deferred Compensation Plan |
|
|
|
|
|
10.56 |
|
Amended and Restated Deferred Compensation Plan for Cloud Peak Energy Resources LLC, effective April 1, 2016 (Incorporated herein by reference to Exhibit 10.2 to CPE Inc.’s Quarterly Report on Form 10-Q filed on July 29, 2016 (File No. 001-34547)) † |
|
|
|
|
|
|
|
ESPP |
|
|
|
|
|
10.57 * |
|
Second Amended and Restated Employee Stock Purchase Plan dated February 13, 2017 † |
|
|
|
|
|
|
|
Employment Agreements |
|
|
|
|
|
10.58 |
|
Employment Agreement between Cloud Peak Energy Inc. and Colin Marshall dated as of November 14, 2009 (Incorporated herein by reference to Exhibit 10.40 to CPE Inc.’s Annual Report on Form 10-K filed on March 17, 2010 (File No. 001-34547)) † |
|
|
|
|
|
10.59 |
|
Employment Agreement between Cloud Peak Energy Inc. and Michael Barrett dated as of November 14, 2009 (Incorporated herein by reference to Exhibit 10.41 to CPE Inc.’s Annual Report on Form 10-K filed on March 17, 2010 (File No. 001-34547)) † |
|
|
|
|
|
10.60 |
|
Employment Agreement between Cloud Peak Energy Inc. and Gary Rivenes dated as of November 14, 2009 (Incorporated herein by reference to Exhibit 10.43 to CPE Inc.’s Annual Report on Form 10-K filed on March 17, 2010 (File No. 001-34547)) † |
|
|
|
|
|
10.61 |
|
Employment Agreement between Cloud Peak Energy Inc. and James Orchard dated as of November 14, 2009 (Incorporated herein by reference to Exhibit 10.44 to CPE Inc.’s Annual Report on Form 10-K filed on March 17, 2010 (File No. 001-34547)) † |
|
|
|
|
|
10.62 |
|
Employment Agreement between Cloud Peak Energy Inc. and Cary Martin dated as of November 14, 2009 (Incorporated herein by reference to Exhibit 10.45 to CPE Inc.’s Annual Report on Form 10-K filed on March 17, 2010 (File No. 001-34547)) † |
|
|
|
|
|
10.63 |
|
Employment Agreement between Cloud Peak Energy Inc. and Bryan Pechersky dated as of March 3, 2010 (Incorporated herein by reference to Exhibit 10.46 to CPE Inc.’s Annual Report on Form 10-K filed on March 17, 2010 (File No. 001-34547)) † |
|
|
|
|
|
10.64 |
|
Employment Agreement between Cloud Peak Energy Inc. and Todd A. Myers dated as of July 6, 2010 (Incorporated herein by reference to Exhibit 10.2 to CPE Inc.’s Quarterly Report on Form 10-Q filed on August 5, 2010 (File No. 001-34547)) † |
|
|
|
|
|
10.65 |
|
Employment Agreement between Cloud Peak Energy Inc. and Bruce Jones dated as of July 8, 2013 (Incorporated herein by reference to Exhibit 10.1 to CPE Inc.’s Quarterly Report on Form 10-Q filed on July 31, 2013 (File No. 001-34547)) † |
|
|
|
|
|
10.66 |
|
Employment Agreement between Cloud Peak Energy Inc. and Heath Hill, dated as of March 16, 2015 (Incorporated herein by reference to Exhibit 10.1 to CPE Inc.’s Current Report on Form 8-K filed on March 17, 2015 (File No. 001-34547)) † |
|
|
|
|
|
|
|
Other Exhibits |
|
|
|
|
|
12.1* |
|
Computation of Ratio of Earnings to Fixed Charges |
|
|
|
|
|
21.1* |
|
List of Subsidiaries |
|
|
|
|
|
23.1* |
|
Consent of PricewaterhouseCoopers LLP, Independent Registered Public Accounting Firm |
|
Exhibit |
|
Description of Documents |
|
|
|
|
|
23.2* |
|
Consent of J.T. Boyd Company |
|
|
|
|
|
31.1* |
|
Certification of Chief Executive Officer pursuant to Section 302 of the Sarbanes-Oxley Act of 2002 |
|
|
|
|
|
31.2* |
|
Certification of Chief Financial Officer pursuant to Section 302 of the Sarbanes-Oxley Act of 2002 |
|
|
|
|
|
32.1* |
|
Certification of Chief Executive Officer pursuant to Section 906 of the Sarbanes-Oxley Act of 2002 |
|
|
|
|
|
32.2* |
|
Certification of Chief Financial Officer pursuant to Section 906 of the Sarbanes-Oxley Act of 2002 |
|
|
|
|
|
95.1* |
|
Mine Safety Disclosure |
|
|
|
|
|
101.INS* |
|
XBRL Instance Document |
|
|
|
|
|
101.SCH* |
|
XBRL Taxonomy Extension Schema Document |
|
|
|
|
|
101.CAL* |
|
XBRL Taxonomy Calculation Linkbase Document |
|
|
|
|
|
101.LAB* |
|
XBRL Taxonomy Label Linkbase Document |
|
|
|
|
|
101.PRE* |
|
XBRL Taxonomy Presentation Linkbase Document |
|
|
|
|
|
101.DEF* |
|
XBRL Taxonomy Definition Document |
* Filed or furnished herewith, as applicable
† Management contract or compensatory plan or arrangement
SCHEDULE II — VALUATION AND QUALIFYING ACCOUNTS
|
|
|
|
|
Additions |
|
|
|
|
| |||||||
|
|
|
Balance at |
|
Charged to |
|
Charged to |
|
Other |
|
Balance at |
| |||||
|
|
|
|
|
(in thousands) |
|
|
|
|
| |||||||
|
Reserves and allowances deducted from asset accounts: |
|
|
|
|
|
|
|
|
|
|
| |||||
|
Deferred Income Tax Valuation Allowance (1) |
|
|
|
|
|
|
|
|
|
|
| |||||
|
Year Ended December 31, 2016 |
|
$ |
118,957 |
|
$ |
— |
|
$ |
— |
|
$ |
(19,319 |
) |
$ |
99,638 |
|
|
Year Ended December 31, 2015 |
|
$ |
7,150 |
|
$ |
111,807 |
|
$ |
— |
|
$ |
— |
|
$ |
118,957 |
|
|
Year Ended December 31, 2014 |
|
$ |
12,711 |
|
$ |
1,145 |
|
$ |
— |
|
$ |
(6,706 |
) |
$ |
7,150 |
|
|
|
|
|
|
|
|
|
|
|
|
|
| |||||
|
Reserve for Materials and Supplies |
|
|
|
|
|
|
|
|
|
|
| |||||
|
Year Ended December 31, 2016 |
|
$ |
988 |
|
$ |
— |
|
$ |
— |
|
$ |
(32 |
) |
$ |
956 |
|
|
Year Ended December 31, 2015 |
|
$ |
1,101 |
|
$ |
— |
|
$ |
— |
|
$ |
(113 |
) |
$ |
988 |
|
|
Year Ended December 31, 2014 |
|
$ |
1,010 |
|
$ |
91 |
|
$ |
— |
|
$ |
— |
|
$ |
1,101 |
|
(1) See also Note 17 of Notes to Consolidated Financial Statements in Item 8.