Attached files
| file | filename |
|---|---|
| EX-95.1 - EXHIBIT 95.1 - FREEPORT-MCMORAN INC | q217exhibit951.htm |
| EX-32.2 - EXHIBIT 32.2 - FREEPORT-MCMORAN INC | q217exhibit322.htm |
| EX-32.1 - EXHIBIT 32.1 - FREEPORT-MCMORAN INC | q217exhibit321.htm |
| EX-31.2 - EXHIBIT 31.2 - FREEPORT-MCMORAN INC | q217exhibit312.htm |
| EX-31.1 - EXHIBIT 31.1 - FREEPORT-MCMORAN INC | q217exhibit311.htm |
| EX-15.1 - EXHIBIT 15.1 - FREEPORT-MCMORAN INC | q217exhibit151.htm |
UNITED STATES | ||
SECURITIES AND EXCHANGE COMMISSION | ||
Washington, D.C. 20549 | ||
FORM 10-Q | ||
(Mark One) | ||
[X] QUARTERLY REPORT PURSUANT TO SECTION 13 OR 15(d) OF THE SECURITIES EXCHANGE ACT OF 1934 | ||
For the quarterly period ended June 30, 2017 | ||
OR | ||
[ ] TRANSITION REPORT PURSUANT TO SECTION 13 OR 15(d) OF THE SECURITIES EXCHANGE ACT OF 1934 | ||
For the transition period from | to | |
Commission File Number: 001-11307-01 | ||
Freeport-McMoRan Inc.
(Exact name of registrant as specified in its charter)
Delaware | 74-2480931 |
(State or other jurisdiction of | (I.R.S. Employer Identification No.) |
incorporation or organization) | |
333 North Central Avenue | |
Phoenix, AZ | 85004-2189 |
(Address of principal executive offices) | (Zip Code) |
(602) 366-8100 | |
(Registrant’s telephone number, including area code) | |
Indicate by check mark whether the registrant (1) has filed all reports required to be filed by Section 13 or 15(d) of the Securities Exchange Act of 1934 during the preceding 12 months (or for such shorter period that the registrant was required to file such reports), and (2) has been subject to such filing requirements for the past 90 days.
þ Yes o No
Indicate by check mark whether the registrant has submitted electronically and posted on its corporate website, if any, every Interactive Data File required to be submitted and posted pursuant to Rule 405 of Regulation S-T (§ 232.405 of this chapter) during the preceding 12 months (or for such shorter period that the registrant was required to submit and post such files).
þ Yes o No
Indicate by check mark whether the registrant is a large accelerated filer, an accelerated filer, a non-accelerated filer, smaller reporting company, or an emerging growth company. See the definitions of “large accelerated filer,” “accelerated filer,” “smaller reporting company,” and "emerging growth company" in Rule 12b-2 of the Exchange Act.
Large accelerated filer þ | Accelerated filer ¨ | ||
Non-accelerated filer ¨ (Do not check if a smaller reporting company) | Smaller reporting company ¨ | ||
Emerging growth company ¨ | |||
If an emerging growth company, indicate by check mark if the registrant has elected not to use the extended transition period for complying with any new or revised financial accounting standards provided pursuant to Section 13(a) of the Exchange Act. ¨
Indicate by check mark whether the registrant is a shell company (as defined in Rule 12b-2 of the Exchange Act).
o Yes þ No
On July 31, 2017, there were issued and outstanding 1,447,307,382 shares of the registrant’s common stock, par value $0.10 per share.
FREEPORT-McMoRan INC.
TABLE OF CONTENTS
Page | |
2
Part I. | FINANCIAL INFORMATION |
Item 1. | Financial Statements. |
FREEPORT-McMoRan INC.
CONSOLIDATED BALANCE SHEETS (Unaudited)
June 30, 2017 | December 31, 2016 | ||||||
(In millions) | |||||||
ASSETS | |||||||
Current assets: | |||||||
Cash and cash equivalents | $ | 4,667 | $ | 4,245 | |||
Trade accounts receivable | 802 | 1,126 | |||||
Income and other tax receivables | 632 | 879 | |||||
Inventories: | |||||||
Materials and supplies, net | 1,264 | 1,306 | |||||
Mill and leach stockpiles | 1,359 | 1,338 | |||||
Product | 1,019 | 998 | |||||
Other current assets | 211 | 199 | |||||
Assets held for sale | 463 | 344 | |||||
Total current assets | 10,417 | 10,435 | |||||
Property, plant, equipment and mine development costs, net | 23,067 | 23,219 | |||||
Oil and gas properties, subject to amortization, less accumulated amortization and impairments | 48 | 74 | |||||
Long-term mill and leach stockpiles | 1,554 | 1,633 | |||||
Other assets | 1,957 | 1,956 | |||||
Total assets | $ | 37,043 | $ | 37,317 | |||
LIABILITIES AND EQUITY | |||||||
Current liabilities: | |||||||
Accounts payable and accrued liabilities | $ | 1,880 | $ | 2,393 | |||
Current portion of debt | 2,216 | 1,232 | |||||
Current portion of environmental and asset retirement obligations | 379 | 369 | |||||
Accrued income taxes | 196 | 66 | |||||
Liabilities held for sale | 273 | 205 | |||||
Total current liabilities | 4,944 | 4,265 | |||||
Long-term debt, less current portion | 13,138 | 14,795 | |||||
Deferred income taxes | 3,870 | 3,768 | |||||
Environmental and asset retirement obligations, less current portion | 3,512 | 3,487 | |||||
Other liabilities | 1,586 | 1,745 | |||||
Total liabilities | 27,050 | 28,060 | |||||
Equity: | |||||||
Stockholders’ equity: | |||||||
Common stock | 158 | 157 | |||||
Capital in excess of par value | 26,734 | 26,690 | |||||
Accumulated deficit | (16,043 | ) | (16,540 | ) | |||
Accumulated other comprehensive loss | (456 | ) | (548 | ) | |||
Common stock held in treasury | (3,720 | ) | (3,708 | ) | |||
Total stockholders’ equity | 6,673 | 6,051 | |||||
Noncontrolling interests | 3,320 | 3,206 | |||||
Total equity | 9,993 | 9,257 | |||||
Total liabilities and equity | $ | 37,043 | $ | 37,317 | |||
The accompanying notes are an integral part of these consolidated financial statements.
3
FREEPORT-McMoRan INC.
CONSOLIDATED STATEMENTS OF OPERATIONS (Unaudited)
Three Months Ended | Six Months Ended | ||||||||||||||
June 30, | June 30, | ||||||||||||||
2017 | 2016 | 2017 | 2016 | ||||||||||||
(In millions, except per share amounts) | |||||||||||||||
Revenues | $ | 3,711 | $ | 3,334 | $ | 7,052 | $ | 6,576 | |||||||
Cost of sales: | |||||||||||||||
Production and delivery | 2,495 | 2,956 | 4,695 | 5,455 | |||||||||||
Depreciation, depletion and amortization | 450 | 632 | 839 | 1,294 | |||||||||||
Impairment of oil and gas properties | — | 291 | — | 4,078 | |||||||||||
Total cost of sales | 2,945 | 3,879 | 5,534 | 10,827 | |||||||||||
Selling, general and administrative expenses | 107 | 160 | 260 | 298 | |||||||||||
Mining exploration and research expenses | 19 | 15 | 34 | 33 | |||||||||||
Environmental obligations and shutdown costs | (19 | ) | 11 | 8 | 21 | ||||||||||
Net gain on sales of assets | (10 | ) | (749 | ) | (33 | ) | (749 | ) | |||||||
Total costs and expenses | 3,042 | 3,316 | 5,803 | 10,430 | |||||||||||
Operating income (loss) | 669 | 18 | 1,249 | (3,854 | ) | ||||||||||
Interest expense, net | (162 | ) | (196 | ) | (329 | ) | (387 | ) | |||||||
Net (loss) gain on exchanges and early extinguishment of debt | (4 | ) | 39 | (3 | ) | 36 | |||||||||
Other income, net | 10 | 25 | 34 | 64 | |||||||||||
Income (loss) from continuing operations before income taxes and equity in affiliated companies’ net (losses) earnings | 513 | (114 | ) | 951 | (4,141 | ) | |||||||||
Provision for income taxes | (186 | ) | (116 | ) | (360 | ) | (193 | ) | |||||||
Equity in affiliated companies’ net (losses) earnings | (1 | ) | 1 | 3 | 8 | ||||||||||
Net income (loss) from continuing operations | 326 | (229 | ) | 594 | (4,326 | ) | |||||||||
Net income (loss) from discontinued operations | 9 | (181 | ) | 47 | (185 | ) | |||||||||
Net income (loss) | 335 | (410 | ) | 641 | (4,511 | ) | |||||||||
Net income attributable to noncontrolling interests: | |||||||||||||||
Continuing operations | (66 | ) | (47 | ) | (141 | ) | (109 | ) | |||||||
Discontinued operations | (1 | ) | (12 | ) | (4 | ) | (22 | ) | |||||||
Preferred dividends attributable to redeemable noncontrolling interest | — | (10 | ) | — | (21 | ) | |||||||||
Net income (loss) attributable to common stockholders | $ | 268 | $ | (479 | ) | $ | 496 | $ | (4,663 | ) | |||||
Basic and diluted net income (loss) per share attributable to common stockholders: | |||||||||||||||
Continuing operations | $ | 0.18 | $ | (0.23 | ) | $ | 0.31 | $ | (3.54 | ) | |||||
Discontinued operations | — | (0.15 | ) | 0.03 | (0.16 | ) | |||||||||
$ | 0.18 | $ | (0.38 | ) | $ | 0.34 | $ | (3.70 | ) | ||||||
Weighted-average common shares outstanding: | |||||||||||||||
Basic | 1,447 | 1,269 | 1,447 | 1,260 | |||||||||||
Diluted | 1,453 | 1,269 | 1,453 | 1,260 | |||||||||||
The accompanying notes are an integral part of these consolidated financial statements.
4
FREEPORT-McMoRan INC.
CONSOLIDATED STATEMENTS OF COMPREHENSIVE INCOME (LOSS) (Unaudited)
Three Months Ended | Six Months Ended | |||||||||||||||
June 30, | June 30, | |||||||||||||||
2017 | 2016 | 2017 | 2016 | |||||||||||||
(In millions) | ||||||||||||||||
Net income (loss) | $ | 335 | $ | (410 | ) | $ | 641 | $ | (4,511 | ) | ||||||
Other comprehensive income, net of taxes: | ||||||||||||||||
Unrealized gains on securities | 1 | 1 | 2 | 1 | ||||||||||||
Defined benefit plans: | ||||||||||||||||
Actuarial gains arising during the period, net of taxes of $48 million | 69 | — | 69 | — | ||||||||||||
Amortization or curtailment of unrecognized amounts included in net periodic benefit costs | 19 | 15 | 30 | 23 | ||||||||||||
Foreign exchange losses | — | (1 | ) | (1 | ) | (10 | ) | |||||||||
Other comprehensive income | 89 | 15 | 100 | 14 | ||||||||||||
Total comprehensive income (loss) | 424 | (395 | ) | 741 | (4,497 | ) | ||||||||||
Total comprehensive income attributable to noncontrolling interests | (75 | ) | (59 | ) | (153 | ) | (130 | ) | ||||||||
Preferred dividends attributable to redeemable noncontrolling interest | — | (10 | ) | — | (21 | ) | ||||||||||
Total comprehensive income (loss) attributable to common stockholders | $ | 349 | $ | (464 | ) | $ | 588 | $ | (4,648 | ) | ||||||
The accompanying notes are an integral part of these consolidated financial statements.
5
FREEPORT-McMoRan INC.
CONSOLIDATED STATEMENTS OF CASH FLOWS (Unaudited)
Six Months Ended | ||||||||
June 30, | ||||||||
2017 | 2016 | |||||||
(In millions) | ||||||||
Cash flow from operating activities: | ||||||||
Net income (loss) | $ | 641 | $ | (4,511 | ) | |||
Adjustments to reconcile net income (loss) to net cash provided by operating activities: | ||||||||
Depreciation, depletion and amortization | 839 | 1,374 | ||||||
Impairment of oil and gas properties | — | 4,078 | ||||||
Non-cash drillship settlements/idle rig costs and other oil and gas adjustments | (33 | ) | 694 | |||||
Net gain on sales of assets | (33 | ) | (749 | ) | ||||
Stock-based compensation | 44 | 42 | ||||||
Net charges for environmental and asset retirement obligations, including accretion | 87 | 107 | ||||||
Payments for environmental and asset retirement obligations | (59 | ) | (116 | ) | ||||
Net loss (gain) on exchanges and early extinguishment of debt | 3 | (36 | ) | |||||
Deferred income taxes | 55 | 169 | ||||||
(Gain) loss on disposal of discontinued operations | (38 | ) | 177 | |||||
Decrease (increase) in long-term mill and leach stockpiles | 80 | (99 | ) | |||||
Oil and gas contract settlement payments | (70 | ) | — | |||||
Other, net | (9 | ) | 18 | |||||
Changes in working capital and other tax payments, excluding amounts from dispositions: | ||||||||
Accounts receivable | 589 | 259 | ||||||
Inventories | (101 | ) | 190 | |||||
Other current assets | (2 | ) | (53 | ) | ||||
Accounts payable and accrued liabilities | (267 | ) | 44 | |||||
Accrued income taxes and changes in other tax payments | 103 | 26 | ||||||
Net cash provided by operating activities | 1,829 | 1,614 | ||||||
Cash flow from investing activities: | ||||||||
Capital expenditures: | ||||||||
North America copper mines | (67 | ) | (76 | ) | ||||
South America | (45 | ) | (293 | ) | ||||
Indonesia | (457 | ) | (453 | ) | ||||
Molybdenum mines | (2 | ) | (1 | ) | ||||
Other, including oil and gas operations | (135 | ) | (992 | ) | ||||
Net proceeds from the sale of additional interest in Morenci | — | 996 | ||||||
Net proceeds from sales of other assets | 4 | 290 | ||||||
Other, net | (8 | ) | (6 | ) | ||||
Net cash used in investing activities | (710 | ) | (535 | ) | ||||
Cash flow from financing activities: | ||||||||
Proceeds from debt | 606 | 2,811 | ||||||
Repayments of debt | (1,250 | ) | (3,649 | ) | ||||
Net proceeds from sale of common stock | — | 32 | ||||||
Cash dividends paid: | ||||||||
Common stock | (2 | ) | (5 | ) | ||||
Noncontrolling interests | (39 | ) | (39 | ) | ||||
Stock-based awards net payments | (8 | ) | (5 | ) | ||||
Debt financing costs and other, net | (11 | ) | (18 | ) | ||||
Net cash used in financing activities | (704 | ) | (873 | ) | ||||
Net increase in cash and cash equivalents | 415 | 206 | ||||||
Decrease (increase) in cash and cash equivalents in assets held for sale | 7 | (53 | ) | |||||
Cash and cash equivalents at beginning of year | 4,245 | 177 | ||||||
Cash and cash equivalents at end of period | $ | 4,667 | $ | 330 | ||||
The accompanying notes are an integral part of these consolidated financial statements.
6
FREEPORT-McMoRan INC.
CONSOLIDATED STATEMENT OF EQUITY (Unaudited)
Stockholders’ Equity | |||||||||||||||||||||||||||||||||||||
Common Stock | Accum-ulated Deficit | Accumu- lated Other Compre- hensive Loss | Common Stock Held in Treasury | Total Stock-holders’ Equity | |||||||||||||||||||||||||||||||||
Number of Shares | At Par Value | Capital in Excess of Par Value | Number of Shares | At Cost | Non- controlling Interests | Total Equity | |||||||||||||||||||||||||||||||
(In millions) | |||||||||||||||||||||||||||||||||||||
Balance at December 31, 2016 | 1,574 | $ | 157 | $ | 26,690 | $ | (16,540 | ) | $ | (548 | ) | 129 | $ | (3,708 | ) | $ | 6,051 | $ | 3,206 | $ | 9,257 | ||||||||||||||||
Exercised and issued stock-based awards | 3 | 1 | 4 | — | — | — | — | 5 | — | 5 | |||||||||||||||||||||||||||
Stock-based compensation | — | — | 40 | — | — | — | — | 40 | — | 40 | |||||||||||||||||||||||||||
Tender of shares for stock-based awards | — | — | — | — | — | 1 | (12 | ) | (12 | ) | — | (12 | ) | ||||||||||||||||||||||||
Dividends on common stock | — | — | — | 1 | — | — | — | 1 | — | 1 | |||||||||||||||||||||||||||
Dividends to noncontrolling interests | — | — | — | — | — | — | — | — | (39 | ) | (39 | ) | |||||||||||||||||||||||||
Net income attributable to common stockholders | — | — | — | 496 | — | — | — | 496 | — | 496 | |||||||||||||||||||||||||||
Net income attributable to noncontrolling interests, including discontinued operations | — | — | — | — | — | — | — | — | 145 | 145 | |||||||||||||||||||||||||||
Other comprehensive income | — | — | — | — | 92 | — | — | 92 | 8 | 100 | |||||||||||||||||||||||||||
Balance at June 30, 2017 | 1,577 | $ | 158 | $ | 26,734 | $ | (16,043 | ) | $ | (456 | ) | 130 | $ | (3,720 | ) | $ | 6,673 | $ | 3,320 | $ | 9,993 | ||||||||||||||||
The accompanying notes are an integral part of these consolidated financial statements.
7
FREEPORT-McMoRan INC.
NOTES TO CONSOLIDATED FINANCIAL STATEMENTS (Unaudited)
NOTE 1. GENERAL INFORMATION
The accompanying unaudited consolidated financial statements have been prepared in accordance with the instructions to Form 10-Q and do not include all information and disclosures required by generally accepted accounting principles (GAAP) in the United States (U.S.). Therefore, this information should be read in conjunction with Freeport-McMoRan Inc.’s (FCX) consolidated financial statements and notes contained in its annual report on Form 10-K for the year ended December 31, 2016. The information furnished herein reflects all adjustments that are, in the opinion of management, necessary for a fair statement of the results for the interim periods reported. With the exception of the accounting for discontinued operations, assets held for sale and the remeasurement of a pension plan, all such adjustments are, in the opinion of management, of a normal recurring nature. As a result of FCX’s sale of its interest in TF Holdings Limited (TFHL), FCX has reported TFHL as discontinued operations for all periods presented in the unaudited consolidated financial statements (refer to Note 2). Operating results for the six-month period ended June 30, 2017, are not necessarily indicative of the results that may be expected for the year ending December 31, 2017.
Indonesia Mining. As a result of the first-quarter 2017 regulatory restrictions and uncertainties regarding long-term investment stability, PT Freeport Indonesia (PT-FI) took actions to adjust its cost structure, reduce its workforce and slow investments in its underground development projects and new smelter. These actions included workforce reductions through furlough and voluntary retirement programs. Following the furlough and voluntary retirement programs, a significant number of employees and contractors elected to participate in an illegal strike action beginning in May 2017, and were subsequently deemed to have voluntarily resigned under existing laws and regulations. As a result, PT-FI recorded charges to operating income for employee severance and related costs totaling $83 million for second-quarter 2017 and $104 million for the first six months of 2017.
Additionally, because of the significant reduction in workforce, PT-FI was required to remeasure its pension assets and pension benefit obligation as of June 30, 2017. The discount rate and rate of compensation increase used for the June 30, 2017, remeasurement were 7.50 percent and 4.00 percent, respectively, compared to the December 31, 2016, discount rate of 8.25 percent and the rate of compensation increase of 8.00 percent. The expected long-term rate of return on the plan assets was unchanged (7.75 percent). The remeasurement and curtailment resulted in the projected benefit obligation declining by $145 million and plan assets declining by $21 million. In addition, PT-FI recognized a curtailment loss of $4 million in second-quarter 2017. As of June 30, 2017, the funded status of PT-FI’s pension plan was a net asset of $34 million (included in other assets in the consolidated balance sheet).
Oil and Gas Properties. In the first half of 2016, FCX Oil & Gas LLC (FM O&G, a wholly owned subsidiary of FCX) determined the carrying values of certain of its unevaluated properties were impaired. For the first six months of 2016, FM O&G transferred $3.2 billion of costs (including $3.1 billion in first-quarter 2016) associated with unevaluated properties to the full cost pool, mostly reflecting impairment of the carrying values of unevaluated properties. Combined with the impact of the reduction in twelve-month historical prices and reserve revisions in 2016, net capitalized costs exceeded the related ceiling test limitation under full cost accounting rules, which resulted in the recognition of impairment charges of $291 million in second-quarter 2016 and $4.1 billion for the first six months of 2016. Refer to Note 1 of FCX’s annual report on Form 10-K for the year ended December 31, 2016, for further discussion.
8
NOTE 2. DISPOSITIONS
TF Holdings Limited - Discontinued Operations. FCX had a 70 percent interest in TFHL, which owns 80 percent of Tenke Fungurume Mining S.A. (TFM or Tenke) located in the Democratic Republic of Congo (DRC). On November 16, 2016, FCX completed the sale of its interest in TFHL to China Molybdenum Co., Ltd. (CMOC) for $2.65 billion in cash (before closing adjustments) and contingent consideration of up to $120 million in cash, consisting of $60 million if the average copper price exceeds $3.50 per pound and $60 million if the average cobalt price exceeds $20 per pound, both during calendar years 2018 and 2019. The contingent consideration is considered a derivative, and at June 30, 2017, the related fair value of $55 million was recorded in other assets on the consolidated balance sheets. During the first six months of 2017, the fair value of the contingent consideration derivative increased by $42 million ($6 million in second-quarter 2017), primarily resulting from higher cobalt prices, and was recorded in net income (loss) from discontinued operations.
In accordance with accounting guidance, FCX has reported the results of operations of TFHL as discontinued operations in the consolidated statements of operations. The consolidated statements of cash flows are reported on a combined basis without separately presenting discontinued operations.
Net income (loss) from discontinued operations in the consolidated statements of operations consists of the following (in millions):
Three Months Ended | Six Months Ended | |||||||||||||||
June 30, | June 30, | |||||||||||||||
2017 | 2016 | 2017 | 2016 | |||||||||||||
Revenuesa | $ | 4 | $ | 272 | $ | 13 | $ | 558 | ||||||||
Costs and expenses: | ||||||||||||||||
Production and delivery costs | — | 256 | — | 482 | ||||||||||||
Depreciation, depletion and amortization | — | 20 | — | 80 | ||||||||||||
Interest expense allocated from parent | — | 11 | b | — | 21 | b | ||||||||||
Other costs and expenses, net | — | 5 | — | 6 | ||||||||||||
Income (loss) before income taxes and net gain (loss) on disposal | 4 | (20 | ) | 13 | (31 | ) | ||||||||||
Net gain (loss) on disposal | 6 | c | (177 | ) | d | 38 | c | (177 | ) | d | ||||||
Net income (loss) before income taxes | 10 | (197 | ) | 51 | (208 | ) | ||||||||||
(Provision for) benefit from income taxes | (1 | ) | 16 | (4 | ) | 23 | ||||||||||
Net income (loss) from discontinued operations | $ | 9 | $ | (181 | ) | $ | 47 | $ | (185 | ) | ||||||
a. | In accordance with accounting guidance, amounts are net of recognition (eliminations) of intercompany sales totaling $4 million in second-quarter 2017, $(41) million in second-quarter 2016, $13 million for the first six months of 2017 and $(73) million for the first six months of 2016. |
b. | In accordance with accounting guidance, interest associated with FCX’s term loan that was required to be repaid as a result of the sale of TFHL has been allocated to discontinued operations. |
c. | Includes a gain of $6 million in second-quarter 2017 and $42 million for the first six months of 2017 associated with the change in the fair value of contingent consideration. |
d. | In accordance with accounting guidance, an estimated loss on disposal was recorded in second-quarter 2016 and was adjusted through closing of the transaction in November 2016. |
Cash flows from discontinued operations included in the consolidated statements of cash flows for the six months ended June 30, 2016, follow (in millions):
Net cash provided by operating activities | $ | 157 | ||
Net cash used in investing activities | (57 | ) | ||
Net cash used in financing activities | (51 | ) | ||
Increase in cash and cash equivalents in assets held for sale | $ | 49 | ||
9
Oil and Gas Operations. On March 17, 2017, FM O&G sold property interests in the Madden area in central Wyoming for cash consideration of $17.5 million, before closing adjustments. Under the full cost accounting rules, the sale resulted in recognition of a $17 million gain for the first six months of 2017 because the reserves associated with the Madden properties were significant to the full cost pool.
On June 17, 2016, FM O&G sold certain oil and gas royalty interests for cash consideration of $102 million, before closing adjustments. Under the full cost accounting rules, the proceeds from this transaction were recorded as a reduction to capitalized oil and gas properties, with no gain or loss recognition in second-quarter 2016 because the reserves were not significant to the full cost pool.
Morenci. On May 31, 2016, FCX sold a 13 percent undivided interest in its Morenci unincorporated joint venture to SMM Morenci, Inc. for $1.0 billion in cash. FCX recorded a $577 million gain in second-quarter 2016 on the transaction and used losses to offset cash taxes on the transaction. A portion of the proceeds from the transaction was used to repay borrowings under FCX's unsecured bank term loan and revolving credit facility. As a result of the transaction, the unincorporated joint venture is owned 72 percent by FCX, 15 percent by Sumitomo Metal Mining Arizona, Inc. and 13 percent by SMM Morenci, Inc.
Timok. On May 2, 2016, Freeport Minerals Corporation (FMC), a wholly owned subsidiary of FCX, sold an interest in the Timok exploration project in Serbia to Global Reservoir Minerals Inc. (now known as Nevsun Resources, Ltd.) for consideration of $135 million in cash and contingent consideration of up to $107 million payable to FCX in stages upon achievement of defined development milestones. As a result of this transaction, FCX recorded a gain of $133 million in second-quarter 2016, and no amounts were recorded for contingent consideration under the loss recovery approach. A portion of the proceeds from the transaction was used to repay borrowings under FCX's unsecured bank term loan.
Assets Held for Sale. Freeport Cobalt includes the large-scale cobalt refinery in Kokkola, Finland, and the related sales and marketing business, in which FCX owns an effective 56 percent interest. Kisanfu is a copper and cobalt exploration project, located near Tenke, in which FCX holds a 100 percent interest. As a result of the sale of TFHL, FCX expects to sell its interest in Freeport Cobalt and Kisanfu, and the assets and liabilities of Freeport Cobalt and Kisanfu are classified as held for sale in the consolidated balance sheets. During second-quarter 2017, a favorable adjustment of $13 million was recorded in net gain on sales of assets in the consolidated statements of operations associated with the estimated fair value less costs to sell of the Kisanfu exploration project. The adjustment was limited to the reduction in the carrying value when the Kisanfu exploration project was initially classified as held for sale in November 2016.
NOTE 3. EARNINGS PER SHARE
FCX calculates its basic net income (loss) per share of common stock under the two-class method and calculates its diluted net income (loss) per share of common stock using the more dilutive of the two-class method or the treasury-stock method. Basic net income (loss) per share of common stock was computed by dividing net income (loss) attributable to common stockholders (after deducting accumulated dividends and undistributed earnings to participating securities) by the weighted-average shares of common stock outstanding during the period. Diluted net income (loss) per share of common stock was calculated by including the basic weighted-average shares of common stock outstanding adjusted for the effects of all potential dilutive shares of common stock, unless their effect would be anti-dilutive.
10
A reconciliation of net income (loss) and weighted-average shares of common stock outstanding for purposes of calculating basic and diluted net income (loss) per share follows (in millions, except per share amounts):
Three Months Ended | Six Months Ended | |||||||||||||||
June 30, | June 30, | |||||||||||||||
2017 | 2016 | 2017 | 2016 | |||||||||||||
Net income (loss) from continuing operations | $ | 326 | $ | (229 | ) | $ | 594 | $ | (4,326 | ) | ||||||
Net income from continuing operations attributable to noncontrolling interests | (66 | ) | (47 | ) | (141 | ) | (109 | ) | ||||||||
Preferred dividends on redeemable noncontrolling interest | — | (10 | ) | — | (21 | ) | ||||||||||
Undistributed earnings allocated to participating securities | (3 | ) | (3 | ) | (3 | ) | (3 | ) | ||||||||
Net income (loss) from continuing operations attributable to common stockholders | $ | 257 | $ | (289 | ) | $ | 450 | $ | (4,459 | ) | ||||||
Net income (loss) from discontinued operations | $ | 9 | $ | (181 | ) | $ | 47 | $ | (185 | ) | ||||||
Net income from discontinued operations attributable to noncontrolling interests | (1 | ) | (12 | ) | (4 | ) | (22 | ) | ||||||||
Net income (loss) from discontinued operations attributable to common stockholders | $ | 8 | $ | (193 | ) | $ | 43 | $ | (207 | ) | ||||||
Net income (loss) attributable to common stockholders | $ | 265 | $ | (482 | ) | $ | 493 | $ | (4,666 | ) | ||||||
Basic weighted-average shares of common stock outstanding | 1,447 | 1,269 | 1,447 | 1,260 | ||||||||||||
Add shares issuable upon exercise or vesting of dilutive stock options and restricted stock units | 6 | — | a | 6 | — | a | ||||||||||
Diluted weighted-average shares of common stock outstanding | 1,453 | 1,269 | 1,453 | 1,260 | ||||||||||||
Basic and diluted net income (loss) per share attributable to common stockholders: | ||||||||||||||||
Continuing operations | $ | 0.18 | $ | (0.23 | ) | $ | 0.31 | $ | (3.54 | ) | ||||||
Discontinued operations | — | (0.15 | ) | 0.03 | (0.16 | ) | ||||||||||
$ | 0.18 | $ | (0.38 | ) | $ | 0.34 | $ | (3.70 | ) | |||||||
a. | Excludes 12 million shares of common stock for second-quarter 2016 and 11 million for the first six months of 2016 associated with outstanding stock options with exercise prices less than the average market price of FCX’s common stock and restricted stock units that were anti-dilutive. |
Outstanding stock options with exercise prices greater than the average market price of FCX’s common stock during the period are excluded from the computation of diluted net income (loss) per share of common stock. Stock options for 44 million shares of common stock were excluded for second-quarter 2017, 46 million for second-quarter 2016, 44 million for the first six months of 2017 and 47 million for the first six months of 2016.
11
NOTE 4. INVENTORIES, INCLUDING LONG-TERM MILL AND LEACH STOCKPILES
The components of inventories follow (in millions):
June 30, 2017 | December 31, 2016 | |||||||
Current inventories: | ||||||||
Total materials and supplies, neta | $ | 1,264 | $ | 1,306 | ||||
Mill stockpiles | $ | 313 | $ | 259 | ||||
Leach stockpiles | 1,046 | 1,079 | ||||||
Total current mill and leach stockpiles | $ | 1,359 | $ | 1,338 | ||||
Raw materials (primarily concentrate) | $ | 295 | $ | 255 | ||||
Work-in-process | 121 | 114 | ||||||
Finished goods | 603 | 629 | ||||||
Total product inventories | $ | 1,019 | $ | 998 | ||||
Long-term inventories: | ||||||||
Mill stockpiles | $ | 425 | $ | 487 | ||||
Leach stockpiles | 1,129 | 1,146 | ||||||
Total long-term mill and leach stockpilesb | $ | 1,554 | $ | 1,633 | ||||
a. | Materials and supplies inventory was net of obsolescence reserves totaling $30 million at June 30, 2017, and $29 million at December 31, 2016. |
b. | Estimated metals in stockpiles not expected to be recovered within the next 12 months. |
NOTE 5. INCOME TAXES
Variations in the relative proportions of jurisdictional income result in fluctuations to FCX’s consolidated effective income tax rate. FCX’s consolidated effective income tax rate was 38 percent for the first six months of 2017 and (5) percent for first six months of 2016. Geographic sources of FCX’s provision for income taxes follow (in millions):
Three Months Ended | Six Months Ended | |||||||||||||||
June 30, | June 30, | |||||||||||||||
2017 | 2016 | 2017 | 2016 | |||||||||||||
U.S. operationsa | $ | 29 | $ | (49 | ) | $ | 22 | $ | (38 | ) | ||||||
International operations | (215 | ) | (67 | ) | (382 | ) | (155 | ) | ||||||||
Total | $ | (186 | ) | $ | (116 | ) | $ | (360 | ) | $ | (193 | ) | ||||
a. | Includes net tax credits of $32 million for second-quarter 2017 and $31 million for the first six months of 2017 associated with anticipated recovery of alternative minimum tax credit carryforwards. The second quarter and first six months of 2016 include net tax charges of $36 million associated with net operating loss carryback claims, partly offset by alternative minimum tax credits. |
Applicable accounting standards require that FCX estimate an annual effective tax rate and apply that rate to each year-to-date interim period. However, an exception is provided to exclude tax jurisdictions from the annual effective tax rate where losses are expected to be generated for which no tax benefit will be realized. Accordingly, U.S. operations have been excluded from the calculation of the estimated annual effective tax rate used to determine FCX’s income tax provision at June 30, 2017.
As a result of the impairment to U.S. oil and gas properties, FCX recorded tax charges of $1.5 billion for the first six months of 2016 to establish a valuation allowance primarily against U.S. federal and state deferred tax assets that will not generate a future benefit. FCX’s consolidated effective income tax rate was 33 percent for the first six months of 2016 excluding these tax charges.
12
NOTE 6. DEBT
The components of debt follow (in millions):
June 30, 2017 | December 31, 2016 | |||||||
Senior notes and debentures: | ||||||||
Issued by FCX | $ | 13,238 | $ | 13,745 | ||||
Issued by FMC | 358 | 359 | ||||||
Issued by Freeport-McMoRan Oil & Gas LLC (FM O&G LLC) | 266 | 267 | ||||||
Cerro Verde credit facility | 1,485 | 1,390 | ||||||
Cerro Verde shareholder loans | — | 261 | ||||||
Other | 7 | 5 | ||||||
Total debta | 15,354 | 16,027 | ||||||
Less current portion of debt | (2,216 | ) | (1,232 | ) | ||||
Long-term debt | $ | 13,138 | $ | 14,795 | ||||
a. | Includes additions for unamortized fair value adjustments totaling $163 million at June 30, 2017 ($179 million at December 31, 2016), and is net of reductions for unamortized net discounts and unamortized debt issuance costs totaling $98 million at June 30, 2017 ($100 million at December 31, 2016). |
Revolving Credit Facility. At June 30, 2017, there were no borrowings outstanding and $37 million in letters of credit issued under FCX’s revolving credit facility, resulting in availability of approximately $3.5 billion, of which approximately $1.5 billion could be used for additional letters of credit.
Senior Notes Issued by FCX. In March 2017, FCX’s 2.15% Senior Notes matured, and the $500 million outstanding principal balance was repaid.
Cerro Verde Credit Facility and Shareholder Loans. In June 2017, Cerro Verde’s credit facility was amended to increase the commitment by $225 million to $1.5 billion, modify the amortization schedule and to extend the maturity date to June 19, 2022. The amended credit facility amortizes in four installments, with $225 million due on December 31, 2020, $225 million due on June 30, 2021, $525 million due on December 31, 2021, and the remaining balance due on the maturity date of June 19, 2022. All other terms, including the interest rates, remain the same. The interest rate on Cerro Verde's credit facility was 3.12 percent at June 30, 2017. Cerro Verde used proceeds from its amended credit facility plus available cash to repay the balance of its shareholder loans in June 2017. Refer to Note 8 of FCX’s annual report on Form 10-K for the year ended December 31, 2016, for further discussion.
Exchanges and Early Extinguishment of Debt. During second-quarter 2017, a $4 million loss was recognized associated with the modification of Cerro Verde’s credit facility.
During second-quarter 2016, FCX redeemed certain senior notes in exchange for its common stock, which resulted in a gain of $39 million. Partially offsetting the gain was $3 million in losses primarily associated with the modification of FCX’s revolving credit facility in first-quarter 2016. Refer to Notes 8 and 10 of FCX’s annual report on Form 10-K for the year ended December 31, 2016, for further discussion.
Interest Expense, Net. Consolidated interest expense from continuing operations (excluding capitalized interest) totaled $192 million in second-quarter 2017, $218 million in second-quarter 2016, $387 million for the first six months of 2017 and $436 million for the first six months of 2016. Capitalized interest added to property, plant, equipment and mine development costs, net, totaled $30 million in second-quarter 2017, $22 million in second-quarter 2016, $58 million for the first six months of 2017 and $42 million for the first six months of 2016. Capitalized interest added to oil and gas properties not subject to amortization totaled $7 million for the first six months of 2016 (none in second-quarter 2016 or 2017).
13
NOTE 7. FINANCIAL INSTRUMENTS
FCX does not purchase, hold or sell derivative financial instruments unless there is an existing asset or obligation, or it anticipates a future activity that is likely to occur and will result in exposure to market risks, which FCX intends to offset or mitigate. FCX does not enter into any derivative financial instruments for speculative purposes, but has entered into derivative financial instruments in limited instances to achieve specific objectives. These objectives principally relate to managing risks associated with commodity price changes, foreign currency exchange rates and interest rates.
Commodity Contracts. From time to time, FCX has entered into derivative contracts to hedge the market risk associated with fluctuations in the prices of commodities it purchases and sells. Derivative financial instruments used by FCX to manage its risks do not contain credit risk-related contingent provisions. As of June 30, 2017, and December 31, 2016, FCX had no price protection contracts relating to its mine production. A discussion of FCX’s derivative contracts and programs follows.
Derivatives Designated as Hedging Instruments – Fair Value Hedges
Copper Futures and Swap Contracts. Some of FCX’s U.S. copper rod customers request a fixed market price instead of the Commodity Exchange Inc. (COMEX) average copper price in the month of shipment. FCX hedges this price exposure in a manner that allows it to receive the COMEX average price in the month of shipment while the customers pay the fixed price they requested. FCX accomplishes this by entering into copper futures or swap contracts. Hedging gains or losses from these copper futures and swap contracts are recorded in revenues. FCX did not have any significant gains or losses resulting from hedge ineffectiveness during the six-month periods ended June 30, 2017 and 2016. At June 30, 2017, FCX held copper futures and swap contracts that qualified for hedge accounting for 49 million pounds at an average contract price of $2.59 per pound, with maturities through December 2018.
A summary of gains (losses) recognized in revenues for derivative financial instruments related to commodity contracts that are designated and qualify as fair value hedge transactions, along with the unrealized gains (losses) on the related hedged item follows (in millions):
Three Months Ended | Six Months Ended | ||||||||||||||
June 30, | June 30, | ||||||||||||||
2017 | 2016 | 2017 | 2016 | ||||||||||||
Copper futures and swap contracts: | |||||||||||||||
Unrealized gains (losses): | |||||||||||||||
Derivative financial instruments | $ | 1 | $ | 3 | $ | (1 | ) | $ | 10 | ||||||
Hedged item – firm sales commitments | (1 | ) | (3 | ) | 1 | (10 | ) | ||||||||
Realized gains (losses): | |||||||||||||||
Matured derivative financial instruments | 1 | (4 | ) | 9 | (8 | ) | |||||||||
Derivatives Not Designated as Hedging Instruments
Embedded Derivatives. As described in Note 1 to FCX’s annual report on Form 10-K for the year ended December 31, 2016, under “Revenue Recognition,” certain FCX copper concentrate, copper cathode and gold sales contracts provide for provisional pricing primarily based on the London Metal Exchange (LME) copper price or the COMEX copper price and the London Bullion Market Association (London) gold price at the time of shipment as specified in the contract. Similarly, FCX purchases copper under contracts that provide for provisional pricing. FCX applies the normal purchases and normal sales scope exception in accordance with derivatives and hedge accounting guidance to the host sales agreements since the contracts do not allow for net settlement and always result in physical delivery. Sales and purchases with a provisional sales price contain an embedded derivative (i.e., the price settlement mechanism is settled after the time of delivery) that is required to be bifurcated from the host contract. The host contract is the sale or purchase of the metals contained in the concentrate or cathode at the then-current LME or COMEX copper price or the London gold price as defined in the contract. Mark-to-market price fluctuations from these embedded derivatives related to continuing operations are recorded through the settlement date and are reflected in revenues for sales contracts and in cost of sales as production and delivery costs for purchase contracts. Mark-to-market price fluctuations associated with embedded derivatives for discontinued operations, which were minimal, are included in discontinued operations for all periods presented in these financial statements.
14
A summary of FCX’s embedded derivatives at June 30, 2017, follows:
Open Positions | Average Price Per Unit | Maturities Through | ||||||||||
Contract | Market | |||||||||||
Embedded derivatives in provisional sales contracts: | ||||||||||||
Copper (millions of pounds) | 560 | $ | 2.58 | $ | 2.69 | November 2017 | ||||||
Gold (thousands of ounces) | 165 | 1,259 | 1,245 | August 2017 | ||||||||
Embedded derivatives in provisional purchase contracts: | ||||||||||||
Copper (millions of pounds) | 109 | 2.60 | 2.69 | October 2017 | ||||||||
Copper Forward Contracts. Atlantic Copper, FCX’s wholly owned smelting and refining unit in Spain, enters into copper forward contracts designed to hedge its copper price risk whenever its physical purchases and sales pricing periods do not match. These economic hedge transactions are intended to hedge against changes in copper prices, with the mark-to-market hedging gains or losses recorded in cost of sales. At June 30, 2017, Atlantic Copper held net copper forward sales contracts for 33 million pounds at an average contract price of $2.57 per pound, with maturities through September 2017.
Summary of Gains (Losses). A summary of the realized and unrealized gains (losses) recognized in operating income (loss) for commodity contracts that do not qualify as hedge transactions, including embedded derivatives, follows (in millions):
Three Months Ended | Six Months Ended | ||||||||||||||
June 30, | June 30, | ||||||||||||||
2017 | 2016 | 2017 | 2016 | ||||||||||||
Embedded derivatives in provisional copper and gold | |||||||||||||||
sales contractsa | $ | 34 | $ | 4 | $ | 160 | $ | 76 | |||||||
Copper forward contractsb | (4 | ) | (2 | ) | (5 | ) | 5 | ||||||||
a. | Amounts recorded in revenues. |
b. | Amounts recorded in cost of sales as production and delivery costs. |
Unsettled Derivative Financial Instruments
A summary of the fair values of unsettled commodity derivative financial instruments follows (in millions):
June 30, 2017 | December 31, 2016 | |||||||
Commodity Derivative Assets: | ||||||||
Derivatives designated as hedging instruments: | ||||||||
Copper futures and swap contracts | $ | 6 | $ | 9 | ||||
Derivatives not designated as hedging instruments: | ||||||||
Embedded derivatives in provisional copper and gold | ||||||||
sales/purchase contracts | 62 | 137 | ||||||
Total derivative assets | $ | 68 | $ | 146 | ||||
Commodity Derivative Liabilities: | ||||||||
Derivatives designated as hedging instruments: | ||||||||
Copper futures and swap contracts | $ | — | $ | 2 | ||||
Derivatives not designated as hedging instruments: | ||||||||
Embedded derivatives in provisional copper and gold | ||||||||
sales/purchase contracts | 14 | 56 | ||||||
Copper forward contracts | 4 | — | ||||||
Total derivative liabilities | $ | 18 | $ | 58 | ||||
15
FCX’s commodity contracts have netting arrangements with counterparties with which the right of offset exists, and it is FCX’s policy to offset balances by counterparty on its balance sheet. FCX’s embedded derivatives on provisional sales/purchase contracts are netted with the corresponding outstanding receivable/payable balances. A summary of these unsettled commodity contracts that are offset in the balance sheets follows (in millions):
Assets | Liabilities | |||||||||||||||
June 30, 2017 | December 31, 2016 | June 30, 2017 | December 31, 2016 | |||||||||||||
Gross amounts recognized: | ||||||||||||||||
Commodity contracts: | ||||||||||||||||
Embedded derivatives in provisional | ||||||||||||||||
sales/purchase contracts | $ | 62 | $ | 137 | $ | 14 | $ | 56 | ||||||||
Copper derivatives | 6 | 9 | 4 | 2 | ||||||||||||
68 | 146 | 18 | 58 | |||||||||||||
Less gross amounts of offset: | ||||||||||||||||
Commodity contracts: | ||||||||||||||||
Embedded derivatives in provisional | ||||||||||||||||
sales/purchase contracts | 4 | 12 | 4 | 12 | ||||||||||||
Copper derivatives | — | 2 | — | 2 | ||||||||||||
4 | 14 | 4 | 14 | |||||||||||||
Net amounts presented in balance sheet: | ||||||||||||||||
Commodity contracts: | ||||||||||||||||
Embedded derivatives in provisional | ||||||||||||||||
sales/purchase contracts | 58 | 125 | 10 | 44 | ||||||||||||
Copper derivatives | 6 | 7 | 4 | — | ||||||||||||
$ | 64 | $ | 132 | $ | 14 | $ | 44 | |||||||||
Balance sheet classification: | ||||||||||||||||
Trade accounts receivable | $ | 56 | $ | 119 | $ | — | $ | 13 | ||||||||
Other current assets | 6 | 7 | — | — | ||||||||||||
Accounts payable and accrued liabilities | 2 | 6 | 14 | 31 | ||||||||||||
$ | 64 | $ | 132 | $ | 14 | $ | 44 | |||||||||
Credit Risk. FCX is exposed to credit loss when financial institutions with which it has entered into derivative transactions (commodity, foreign exchange and interest rate swaps) are unable to pay. To minimize the risk of such losses, FCX uses counterparties that meet certain credit requirements and periodically reviews the creditworthiness of these counterparties. FCX does not anticipate that any of the counterparties it deals with will default on their obligations. As of June 30, 2017, the maximum amount of credit exposure associated with derivative transactions was $64 million.
Other Financial Instruments. Other financial instruments include cash and cash equivalents, accounts receivable, restricted cash, investment securities, legally restricted funds, accounts payable and accrued liabilities, and long-term debt. The carrying value for cash and cash equivalents (which included time deposits of $1.6 billion at June 30, 2017, and $64 million at December 31, 2016), accounts receivable, restricted cash, and accounts payable and accrued liabilities approximates fair value because of their short-term nature and generally negligible credit losses (refer to Note 8 for the fair values of investment securities, legally restricted funds and long-term debt).
In addition, as of June 30, 2017, FCX has contingent consideration assets related to the 2016 asset sales (refer to Note 8 for the related fair value and to Note 2 of FCX’s annual report on Form 10-K for the year ended December 31, 2016, for further discussion of these instruments).
16
NOTE 8. FAIR VALUE MEASUREMENT
Fair value accounting guidance includes a hierarchy that prioritizes the inputs to valuation techniques used to measure fair value. The hierarchy gives the highest priority to unadjusted quoted prices in active markets for identical assets or liabilities (Level 1) and the lowest priority to unobservable inputs (Level 3). FCX recognizes transfers between levels at the end of the reporting period. FCX did not have any significant transfers in or out of Level 1, 2 or 3 for second-quarter 2017.
FCX’s financial instruments are recorded on the consolidated balance sheets at fair value except for contingent consideration associated with the sale of the Deepwater Gulf of Mexico (GOM) oil and gas properties (which was recorded under the loss recovery approach) and debt. A summary of the carrying amount and fair value of FCX’s financial instruments, other than cash and cash equivalents, accounts receivable, restricted cash, and accounts payable and accrued liabilities (refer to Note 7) follows (in millions):
At June 30, 2017 | |||||||||||||||||||||||
Carrying | Fair Value | ||||||||||||||||||||||
Amount | Total | NAV | Level 1 | Level 2 | Level 3 | ||||||||||||||||||
Assets | |||||||||||||||||||||||
Investment securities:a,b | |||||||||||||||||||||||
U.S. core fixed income fund | $ | 25 | $ | 25 | $ | 25 | $ | — | $ | — | $ | — | |||||||||||
Money market funds | 22 | 22 | — | 22 | — | — | |||||||||||||||||
Equity securities | 5 | 5 | — | 5 | — | — | |||||||||||||||||
Total | 52 | 52 | 25 | 27 | — | — | |||||||||||||||||
Legally restricted funds:a | |||||||||||||||||||||||
U.S. core fixed income fund | 55 | 55 | 55 | — | — | — | |||||||||||||||||
Government bonds and notes | 36 | 36 | — | — | 36 | — | |||||||||||||||||
Corporate bonds | 32 | 32 | — | — | 32 | — | |||||||||||||||||
Government mortgage-backed securities | 28 | 28 | — | — | 28 | — | |||||||||||||||||
Asset-backed securities | 17 | 17 | — | — | 17 | — | |||||||||||||||||
Money market funds | 11 | 11 | — | 11 | — | — | |||||||||||||||||
Collateralized mortgage-backed securities | 8 | 8 | — | — | 8 | — | |||||||||||||||||
Municipal bonds | 1 | 1 | — | — | 1 | — | |||||||||||||||||
Total | 188 | 188 | 55 | 11 | 122 | — | |||||||||||||||||
Derivatives: | |||||||||||||||||||||||
Embedded derivatives in provisional sales/ | |||||||||||||||||||||||
purchase contracts in a gross asset positionc | 62 | 62 | — | — | 62 | — | |||||||||||||||||
Copper futures and swap contractsc | 6 | 6 | — | 5 | 1 | — | |||||||||||||||||
Contingent consideration for the sales of TFHL | |||||||||||||||||||||||
and onshore California oil and gas propertiesa | 76 | 76 | — | — | 76 | — | |||||||||||||||||
Total | 144 | 144 | — | 5 | 139 | — | |||||||||||||||||
Contingent consideration for the sale of the | |||||||||||||||||||||||
Deepwater GOM oil and gas propertiesa | 150 | 137 | — | — | — | 137 | |||||||||||||||||
Total assets | $ | 521 | $ | 80 | $ | 43 | $ | 261 | $ | 137 | |||||||||||||
Liabilities | |||||||||||||||||||||||
Derivatives:c | |||||||||||||||||||||||
Embedded derivatives in provisional sales/ | |||||||||||||||||||||||
purchase contracts in a gross liability position | 14 | $ | 14 | $ | — | $ | — | $ | 14 | $ | — | ||||||||||||
Copper forward contracts | 4 | 4 | — | 3 | 1 | — | |||||||||||||||||
Total | 18 | 18 | — | 3 | 15 | — | |||||||||||||||||
Long-term debt, including current portiond | 15,354 | 14,744 | — | — | 14,744 | — | |||||||||||||||||
Total liabilities | $ | 14,762 | $ | — | $ | 3 | $ | 14,759 | $ | — | |||||||||||||
17
At December 31, 2016 | |||||||||||||||||||||||
Carrying | Fair Value | ||||||||||||||||||||||
Amount | Total | NAV | Level 1 | Level 2 | Level 3 | ||||||||||||||||||
Assets | |||||||||||||||||||||||
Investment securities:a,b | |||||||||||||||||||||||
U.S. core fixed income fund | $ | 23 | $ | 23 | $ | 23 | $ | — | $ | — | $ | — | |||||||||||
Money market funds | 22 | 22 | — | 22 | — | — | |||||||||||||||||
Equity securities | 5 | 5 | — | 5 | — | — | |||||||||||||||||
Total | 50 | 50 | 23 | 27 | — | — | |||||||||||||||||
Legally restricted funds:a | |||||||||||||||||||||||
U.S. core fixed income fund | 53 | 53 | 53 | — | — | — | |||||||||||||||||
Government bonds and notes | 36 | 36 | — | — | 36 | — | |||||||||||||||||
Corporate bonds | 32 | 32 | — | — | 32 | — | |||||||||||||||||
Government mortgage-backed securities | 25 | 25 | — | — | 25 | — | |||||||||||||||||
Asset-backed securities | 16 | 16 | — | — | 16 | — | |||||||||||||||||
Money market funds | 12 | 12 | — | 12 | — | — | |||||||||||||||||
Collateralized mortgage-backed securities | 8 | 8 | — | — | 8 | — | |||||||||||||||||
Municipal bonds | 1 | 1 | — | — | 1 | — | |||||||||||||||||
Total | 183 | 183 | 53 | 12 | 118 | — | |||||||||||||||||
Derivatives: | |||||||||||||||||||||||
Embedded derivatives in provisional sales/ | |||||||||||||||||||||||
purchase contracts in a gross asset positionc | 137 | 137 | — | — | 137 | — | |||||||||||||||||
Copper futures and swap contractsc | 9 | 9 | — | 8 | 1 | — | |||||||||||||||||
Contingent consideration for the sales of TFHL | |||||||||||||||||||||||
and onshore California oil and gas propertiesa | 46 | 46 | — | — | 46 | — | |||||||||||||||||
Total | 192 | 192 | — | 8 | 184 | — | |||||||||||||||||
Contingent consideration for the sale of the | |||||||||||||||||||||||
Deepwater GOM oil and gas propertiesa | 150 | 135 | — | — | — | 135 | |||||||||||||||||
Total assets | $ | 560 | $ | 76 | $ | 47 | $ | 302 | $ | 135 | |||||||||||||
Liabilities | |||||||||||||||||||||||
Derivatives:c | |||||||||||||||||||||||
Embedded derivatives in provisional sales/ | |||||||||||||||||||||||
purchase contracts in a gross liability position | 56 | $ | 56 | $ | — | $ | — | $ | 56 | $ | — | ||||||||||||
Copper futures and swap contracts | 2 | 2 | — | 2 | — | — | |||||||||||||||||
Total | 58 | 58 | — | 2 | 56 | — | |||||||||||||||||
Contingent payments for the settlements of | |||||||||||||||||||||||
drilling rig contractse | 23 | 23 | — | — | 23 | — | |||||||||||||||||
Long-term debt, including current portiond | 16,027 | 15,196 | — | — | 15,196 | — | |||||||||||||||||
Total liabilities | $ | 15,277 | $ | — | $ | 2 | $ | 15,275 | $ | — | |||||||||||||
a. | Current portion included in other current assets and long-term portion included in other assets. |
b. | Excludes time deposits (which approximated fair value) included in (i) other current assets of $34 million at June 30, 2017, and $28 million at December 31, 2016, and (ii) other assets of $122 million at both June 30, 2017, and December 31, 2016, primarily associated with an assurance bond to support PT-FI’s commitment for smelter development in Indonesia. |
c. | Refer to Note 7 for further discussion and balance sheet classifications. |
d. | Recorded at cost except for debt assumed in acquisitions, which were recorded at fair value at the respective acquisition dates. |
e. | Included in accounts payable and accrued liabilities. |
18
Valuation Techniques. The U.S. core fixed income fund is valued at net asset value (NAV). The fund strategy seeks total return consisting of income and capital appreciation primarily by investing in a broad range of investment-grade debt securities, including U.S. government obligations, corporate bonds, mortgage-backed securities, asset-backed securities and money market instruments. There are no restrictions on redemptions (which are usually within one business day of notice).
Money market funds are classified within Level 1 of the fair value hierarchy because they are valued using quoted market prices in active markets.
Equity securities are valued at the closing price reported on the active market on which the individual securities are traded and, as such, are classified within Level 1 of the fair value hierarchy.
Fixed income securities (government securities, corporate bonds, asset-backed securities, collateralized mortgage-backed securities and municipal bonds) are valued using a bid-evaluation price or a mid-evaluation price. A bid-evaluation price is an estimated price at which a dealer would pay for a security. A mid-evaluation price is the average of the estimated price at which a dealer would sell a security and the estimated price at which a dealer would pay for a security. These evaluations are based on quoted prices, if available, or models that use observable inputs and, as such, are classified within Level 2 of the fair value hierarchy.
FCX’s embedded derivatives on provisional copper concentrate, copper cathode and gold purchases and sales are valued using only quoted monthly LME or COMEX copper forward prices and the London gold forward price at each reporting date based on the month of maturity (refer to Note 7 for further discussion); however, FCX’s contracts themselves are not traded on an exchange. As a result, these derivatives are classified within Level 2 of the fair value hierarchy.
FCX’s derivative financial instruments for copper futures and swap contracts and copper forward contracts that are traded on the respective exchanges are classified within Level 1 of the fair value hierarchy because they are valued using quoted monthly COMEX or LME prices at each reporting date based on the month of maturity (refer to Note 7 for further discussion). Certain of these contracts are traded on the over-the-counter market and are classified within Level 2 of the fair value hierarchy based on COMEX and LME forward prices.
The fair value of contingent consideration for the sales of TFHL and onshore California oil and gas properties is calculated based on average commodity price forecasts through applicable maturity dates using a Monte Carlo simulation model. The models use various observable inputs, including Brent crude oil forward prices, historical copper and cobalt prices, volatilities, discount rates and settlement terms. As a result, these contingent consideration assets are classified within Level 2 of the fair value hierarchy.
The fair value of contingent consideration for the sale of Deepwater GOM oil and gas properties is calculated based on a discounted cash flow model using inputs that include third-party reserve estimates, production rates, production timing and discount rates. Because significant inputs are not observable in the market, the contingent consideration is classified within Level 3 of the fair value hierarchy.
The December 31, 2016, fair value of contingent payments for the settlements of drilling rig contracts was calculated based on the average price forecasts of West Texas Intermediate (WTI) crude oil over the 12-month period ending June 30, 2017, using a mean-reverting model. The model used various observable inputs, including WTI crude oil forward prices, volatilities, discount rate and settlement terms. As a result, these contingent payments were classified within Level 2 of the fair value hierarchy. As of June 30, 2017, the contingency period for FM O&G’s drilling rig contract settlements ended, and no additional amounts were paid.
Long-term debt, including current portion, is valued using available market quotes and, as such, is classified within Level 2 of the fair value hierarchy.
The techniques described above may produce a fair value calculation that may not be indicative of net realizable value or reflective of future fair values. Furthermore, while FCX believes its valuation techniques are appropriate and consistent with other market participants, the use of different techniques or assumptions to determine fair value of certain financial instruments could result in a different fair value measurement at the reporting date. There have been no changes in the techniques used at June 30, 2017, as compared to those techniques used at December 31, 2016.
19
A summary of the changes in the fair value of FCX’s Level 3 instrument, contingent consideration for the sale of the Deepwater GOM oil and gas properties, during the first six months of 2017 follows (in millions):
Fair value at January 1, 2017 | $ | 135 | ||
Net unrealized gain related to assets still held at the end of the period | 2 | |||
Fair value at June 30, 2017 | $ | 137 | ||
NOTE 9. CONTINGENCIES AND COMMITMENTS
Environmental
Uranium Mining Sites
As reported in Note 12 of FCX’s annual report on Form 10-K for the year ended December 31, 2016, the Department of Justice, the U.S. Environmental Protection Agency, the Navajo Nation and two FCX-related subsidiaries reached an agreement regarding the scope of environmental investigation and remediation work for the cleanup of 94 former uranium mining sites on tribal lands, and the related financial contributions of the U.S. government and the FCX subsidiaries. The related Consent Decree was approved by the U.S. District Court for the District of Arizona in second-quarter 2017. Based on updated cash flow and timing estimates, FCX reduced its associated obligation for that contingency by recording a $41 million credit to operating income in second-quarter 2017 after receiving court approval.
Litigation
During second-quarter 2017, there were no significant updates to previously reported legal proceedings included in Note 12 of FCX’s annual report on Form 10-K for the year ended December 31, 2016.
Tax and Other Matters
Cerro Verde Royalty Dispute
As reported in Note 12 of FCX’s annual report on Form 10-K for the year ended December 31, 2016, SUNAT, the Peru national tax authority, has assessed mining royalties on ore processed by the Cerro Verde concentrator, which commenced operations in late 2006, for the period December 2006 to December 2007, the years 2008, 2009 and 2010, and the period January 2011 to September 2011. SUNAT may make additional assessments for mining royalties and associated penalties and interest for the period from October 2011 through December 2013, which Cerro Verde will contest. As of June 30, 2017, FCX estimates the total exposure associated with these mining royalties for the period from December 2006 through December 2013 approximates $582 million (based on the exchange rate as of June 30, 2017), including estimated accumulated interest and penalties. No charges have been recorded for these assessments as of June 30, 2017, because Cerro Verde believes its 1998 stability agreement exempts it from these royalties and believes any installment payments already made will be recoverable. On July 19, 2017, oral arguments related to the assessments for the year 2008 were presented to the Peruvian Supreme Court, and a decision is expected in the near future.
Other Peru Tax Matters
There were no significant changes to other Peru tax matters during second-quarter 2017 (refer to Note 12 of FCX’s annual report on Form 10-K for the year ended December 31, 2016).
Indonesia Tax Matters
The following information includes a discussion of updates to previously reported Indonesia tax matters included in Note 12 of FCX’s annual report on Form 10-K for the year ended December 31, 2016.
PT-FI received assessments from the local regional tax authority in Papua, Indonesia, for additional taxes and penalties related to surface water taxes for the period from January 2011 through June 2017. PT-FI has filed or will file objections to these assessments. In January 2017, the Indonesia Tax Court issued a ruling against PT-FI with respect to assessments for additional taxes and penalties for the period from January 2011 through July 2015 in the amount of $380 million (based on the exchange rate as of June 30, 2017, and including $229 million in penalties). The aggregate amount of assessments received from August 2015 through June 2017 was an additional $126 million, including penalties (based on the exchange rate as of June 30, 2017). No charges have been recorded for these assessments as of June 30, 2017, because PT-FI believes its Contract of Work (COW) exempts it from these payments and that it has the right to contest these assessments (in which FCX estimates the total exposure based on the exchange rate as of June 30, 2017, totals $506 million, including penalties) in the Indonesia Tax Court and ultimately the Indonesia Supreme Court. As of August 4, 2017, PT-FI has not paid and does not intend to pay these
20
assessments unless there is a mechanism established to secure a refund for any such payments upon the final court decision.
Indonesia Mining Contract. The following information includes updates to the discussion of PT-FI’s COW included in Note 13 of FCX’s annual report on Form 10-K for the year ended December 31, 2016.
In January and February 2017, the Indonesian government issued new regulations to address the export of unrefined metals, including copper concentrate and anode slimes, and other matters related to the mining sector. The new regulations permit the continuation of copper concentrate exports for a five-year period through January 2022, subject to various conditions, including conversion from a contract of work to a special operating license (known as an IUPK, which does not provide the same level of fiscal and legal protections as PT-FI’s COW, which remains in effect), a commitment to the completion of smelter construction in five years and payment of export duties to be determined by the Ministry of Finance. In addition, the new regulations enable application for an extension of operating rights five years before expiration of the IUPK and require foreign IUPK holders to divest a 51 percent interest in the licensed entity to Indonesian interests no later than the tenth year of production. Export licenses would be valid for one-year periods, subject to review every six months, depending on smelter construction progress.
Following the issuance of the January and February 2017 regulations and discussions with the Indonesian government, PT-FI advised the government that it was prepared to convert its COW to an IUPK, subject to obtaining an investment stability agreement providing contractual rights with the same level of legal and fiscal certainty enumerated under its COW, and provided that the COW would remain in effect until it is replaced by a mutually satisfactory alternative. PT-FI also committed to commence construction of a new smelter during a five-year time frame, subject to approval of the extension of its long-term operating rights.
In mid-February 2017, pursuant to the COW’s dispute resolution process, PT-FI provided formal notice to the Indonesian government of an impending dispute listing the government's breaches and violations of the COW. PT-FI continues to reserve its rights under these provisions.
As a result of the 2017 regulatory restrictions and uncertainties regarding long-term investment stability, PT-FI has taken actions to adjust its cost structure, slow investments in its underground development projects and new smelter, and place certain of its workforce on furlough programs.
In late March 2017, the Indonesian government amended the regulations to enable PT-FI to retain its COW until replaced with an IUPK accompanied by an investment stability agreement, and to grant PT-FI a temporary IUPK through October 10, 2017, that would allow concentrate exports to resume during this period. In April 2017, PT-FI entered into a Memorandum of Understanding with the Indonesian government confirming that the COW would continue to be valid and honored until replaced by a mutually agreed IUPK and investment stability agreement. PT-FI agreed to continue to pay a five percent export duty during this period.
On April 21, 2017, the Indonesian government issued a permit to PT-FI that allows exports to resume for a six-month period, and PT-FI commenced export shipments.
PT-FI and the Indonesian government are now engaged in active negotiations on the conversion of PT-FI's COW to an IUPK accompanied by an investment stability agreement with the objective of providing a mutually acceptable long-term investment framework. The parties are also discussing requirements for the construction of a new smelter and the government’s request for divestment.
PT-FI and the Indonesian government are working cooperatively with the objective of reaching a mutually acceptable long-term resolution during 2017 to secure PT-FI's long-term investments for the benefit of all stakeholders.
21
NOTE 10. BUSINESS SEGMENTS
FCX has organized its mining operations into four primary divisions – North America copper mines, South America mining, Indonesia mining and Molybdenum mines, and operating segments that meet certain thresholds are reportable segments. Separately disclosed in the following tables are FCX’s reportable segments, which include the Morenci, Cerro Verde and Grasberg (Indonesia Mining) copper mines, the Rod & Refining operations and Atlantic Copper Smelting & Refining.
FCX’s reportable segments previously included U.S. Oil & Gas operations. During 2016, FCX completed the sales of its Deepwater Gulf of Mexico, onshore California and Haynesville oil and gas properties, and in first-quarter 2017, completed the sale of its Madden property interests. The results of FCX’s U.S. oil and gas operations no longer qualify as a reportable segment, and oil and gas results for all periods presented have been included in Corporate, Other & Eliminations in the following tables. Refer to Note 2 of FCX’s annual report on Form 10-K for the year ended December 31, 2016, for additional information.
Intersegment sales between FCX’s business segments are based on terms similar to arms-length transactions with third parties at the time of the sale. Intersegment sales may not be reflective of the actual prices ultimately realized because of a variety of factors, including additional processing, timing of sales to unaffiliated customers and transportation premiums.
FCX defers recognizing profits on sales from its mines to other divisions, including Atlantic Copper (FCX’s wholly owned smelter and refinery in Spain) and on 25 percent of PT-FI’s sales to PT Smelting (PT-FI’s 25-percent-owned smelter and refinery in Indonesia), until final sales to third parties occur. Quarterly variations in ore grades, the timing of intercompany shipments and changes in product prices result in variability in FCX’s net deferred profits and quarterly earnings.
FCX allocates certain operating costs, expenses and capital expenditures to its operating divisions and individual segments. However, not all costs and expenses applicable to an operation are allocated. U.S. federal and state income taxes are recorded and managed at the corporate level (included in Corporate, Other & Eliminations), whereas foreign income taxes are recorded and managed at the applicable country level. In addition, most mining exploration and research activities are managed on a consolidated basis, and those costs, along with some selling, general and administrative costs, are not allocated to the operating divisions or individual segments. Accordingly, the following segment information reflects management determinations that may not be indicative of what the actual financial performance of each operating division or segment would be if it was an independent entity.
22
Financial Information by Business Segments
(In millions) | ||||||||||||||||||||||||||||||||||||||||||||||||
Atlantic | Corporate, | |||||||||||||||||||||||||||||||||||||||||||||||
North America Copper Mines | South America | Copper | Other | |||||||||||||||||||||||||||||||||||||||||||||
Cerro | Indonesia | Molybdenum | Rod & | Smelting | & Elimi- | FCX | ||||||||||||||||||||||||||||||||||||||||||
Morenci | Other | Total | Verde | Other | Total | Mining | Mines | Refining | & Refining | nationsa | Total | |||||||||||||||||||||||||||||||||||||
Three Months Ended June 30, 2017 | ||||||||||||||||||||||||||||||||||||||||||||||||
Revenues: | ||||||||||||||||||||||||||||||||||||||||||||||||
Unaffiliated customers | $ | 45 | $ | 32 | $ | 77 | $ | 567 | $ | 111 | $ | 678 | $ | 1,065 | b | $ | — | $ | 1,046 | $ | 400 | $ | 445 | c | $ | 3,711 | ||||||||||||||||||||||
Intersegment | 478 | 593 | 1,071 | 57 | — | 57 | — | 71 | 6 | — | (1,205 | ) | — | |||||||||||||||||||||||||||||||||||
Production and delivery | 268 | 457 | 725 | 376 | 87 | 463 | 554 | d | 59 | 1,048 | 400 | (754 | ) | e | 2,495 | |||||||||||||||||||||||||||||||||
Depreciation, depletion and amortization | 49 | 69 | 118 | 104 | 21 | 125 | 153 | 19 | 3 | 7 | 25 | 450 | ||||||||||||||||||||||||||||||||||||
Selling, general and administrative expenses | 1 | — | 1 | 3 | — | 3 | 30 | d | — | — | 4 | 69 | 107 | |||||||||||||||||||||||||||||||||||
Mining exploration and research expenses | — | 1 | 1 | — | — | — | — | — | — | — | 18 | 19 | ||||||||||||||||||||||||||||||||||||
Environmental obligations and shutdown costs | — | — | — | — | — | — | — | — | — | — | (19 | ) | (19 | ) | ||||||||||||||||||||||||||||||||||
Net gain on sales of assets | — | — | — | — | — | — | — | — | — | — | (10 | ) | (10 | ) | ||||||||||||||||||||||||||||||||||
Operating income (loss) | 205 | 98 | 303 | 141 | 3 | 144 | 328 | (7 | ) | 1 | (11 | ) | (89 | ) | 669 | |||||||||||||||||||||||||||||||||
Interest expense, net | — | 1 | 1 | 15 | — | 15 | — | — | — | 4 | 142 | 162 | ||||||||||||||||||||||||||||||||||||
Provision for (benefit from) income taxes | — | — | — | 56 | 2 | 58 | 135 | — | — | 3 | (10 | ) | 186 | |||||||||||||||||||||||||||||||||||
Total assets at June 30, 2017 | 2,830 | 4,314 | 7,144 | 8,828 | 1,479 | 10,307 | 11,154 | 1,900 | 253 | 739 | 5,546 | f | 37,043 | |||||||||||||||||||||||||||||||||||
Capital expenditures | 29 | 10 | 39 | 29 | 1 | 30 | 213 | 1 | 1 | 17 | 61 | g | 362 | |||||||||||||||||||||||||||||||||||
Three Months Ended June 30, 2016 | ||||||||||||||||||||||||||||||||||||||||||||||||
Revenues: | ||||||||||||||||||||||||||||||||||||||||||||||||
Unaffiliated customers | $ | 79 | $ | 43 | $ | 122 | $ | 494 | $ | 123 | $ | 617 | $ | 532 | b | $ | — | $ | 919 | $ | 493 | $ | 651 | c | $ | 3,334 | ||||||||||||||||||||||
Intersegment | 404 | 534 | 938 | 60 | — | 60 | (1 | ) | h | 45 | 7 | 2 | (1,051 | ) | — | |||||||||||||||||||||||||||||||||
Production and delivery | 298 | 428 | 726 | 303 | 103 | 406 | 356 | 50 | 919 | 466 | 33 | e | 2,956 | |||||||||||||||||||||||||||||||||||
Depreciation, depletion and amortization | 57 | 77 | 134 | 109 | 27 | 136 | 93 | 17 | 3 | 7 | 242 | 632 | ||||||||||||||||||||||||||||||||||||
Impairment of oil and gas properties | — | — | — | — | — | — | — | — | — | — | 291 | 291 | ||||||||||||||||||||||||||||||||||||
Selling, general and administrative expenses | 1 | 1 | 2 | 2 | — | 2 | 22 | — | — | 4 | 130 | i | 160 | |||||||||||||||||||||||||||||||||||
Mining exploration and research expenses | — | — | — | — | — | — | — | — | — | — | 15 | 15 | ||||||||||||||||||||||||||||||||||||
Environmental obligations and shutdown costs | — | — | — | — | — | — | — | — | — | — | 11 | 11 | ||||||||||||||||||||||||||||||||||||
Net gain on sales of assets | (577 | ) | — | (577 | ) | — | — | — | — | — | — | — | (172 | ) | (749 | ) | ||||||||||||||||||||||||||||||||
Operating income (loss) | 704 | 71 | 775 | 140 | (7 | ) | 133 | 60 | (22 | ) | 4 | 18 | (950 | ) | 18 | |||||||||||||||||||||||||||||||||
Interest expense, net | — | 1 | 1 | 20 | — | 20 | — | — | — | 4 | 171 | 196 | ||||||||||||||||||||||||||||||||||||
Provision for (benefit from) income taxes | — | — | — | 45 | (2 | ) | 43 | 18 | — | — | 1 | 54 | 116 | |||||||||||||||||||||||||||||||||||
Total assets at June 30, 2016 | 2,960 | 4,676 | 7,636 | 9,330 | 1,609 | 10,939 | 9,499 | 1,969 | 217 | 607 | 10,429 | f | 41,296 | |||||||||||||||||||||||||||||||||||
Capital expenditures | 37 | 5 | 42 | 135 | 1 | 136 | 231 | — | — | 5 | 419 | g | 833 | |||||||||||||||||||||||||||||||||||
a. | Includes U.S. oil and gas operations, which were previously a reportable segment. |
b. | Includes PT-FI's sales to PT Smelting totaling $536 million in second-quarter 2017 and $287 million in second-quarter 2016. |
c. | Includes revenues from FCX's molybdenum sales company, which includes sales of molybdenum produced by the Molybdenum mines and by certain of the North America and South America copper mines. |
d. | Includes net charges at PT-FI associated with workforce reductions totaling $82 million in production and delivery costs and $5 million in selling, general and administrative expenses. |
e. | Includes net credits (charges) for oil and gas operations totaling $6 million in second-quarter 2017, primarily associated with adjustments to the fair value of contingent payments for the 2016 drillship settlements and $(692) million in second-quarter 2016 for drillship settlements, inventory adjustments and asset impairment. |
f. | Includes assets held for sale totaling $463 million at June 30, 2017, primarily associated with Freeport Cobalt and the Kisanfu exploration project, and $5.1 billion at June 30, 2016, which also included discontinued operations. Also includes assets associated with oil and gas operations of $316 million at June 30, 2017, and $3.9 billion at June 30, 2016. |
g. | Includes $14 million in second-quarter 2017 and $392 million in second-quarter 2016 associated with oil and gas operations. Second-quarter 2016 also includes $20 million associated with discontinued operations. |
h. | Reflects net reductions for provisional pricing adjustments to prior period open sales. There were no intersegment sales from Grasberg in second-quarter 2016. |
i. | Includes other oil and gas net charges of $37 million in second-quarter 2016 for net restructuring. |
23
(In millions) | ||||||||||||||||||||||||||||||||||||||||||||||||
Atlantic | Corporate, | |||||||||||||||||||||||||||||||||||||||||||||||
North America Copper Mines | South America Mining | Copper | Other | |||||||||||||||||||||||||||||||||||||||||||||
Cerro | Indonesia | Molybdenum | Rod & | Smelting | & Elimi- | FCX | ||||||||||||||||||||||||||||||||||||||||||
Morenci | Other | Total | Verde | Other | Total | Mining | Mines | Refining | & Refining | nationsa | Total | |||||||||||||||||||||||||||||||||||||
Six Months Ended June 30, 2017 | ||||||||||||||||||||||||||||||||||||||||||||||||
Revenues: | ||||||||||||||||||||||||||||||||||||||||||||||||
Unaffiliated customers | $ | 111 | $ | 82 | $ | 193 | $ | 1,207 | $ | 223 | $ | 1,430 | $ | 1,599 | b | $ | — | $ | 2,153 | $ | 858 | $ | 819 | c | $ | 7,052 | ||||||||||||||||||||||
Intersegment | 894 | 1,156 | 2,050 | 173 | — | 173 | — | 134 | 14 | — | (2,371 | ) | — | |||||||||||||||||||||||||||||||||||
Production and delivery | 528 | d | 870 | 1,398 | 767 | 169 | 936 | 827 | e | 111 | 2,158 | 836 | (1,571 | ) | f | 4,695 | ||||||||||||||||||||||||||||||||
Depreciation, depletion and amortization | 96 | 138 | 234 | 216 | 42 | 258 | 236 | 38 | 5 | 14 | 54 | 839 | ||||||||||||||||||||||||||||||||||||
Selling, general and administrative expenses | 1 | 1 | 2 | 5 | — | 5 | 60 | e | — | — | 9 | 184 | g | 260 | ||||||||||||||||||||||||||||||||||
Mining exploration and research expenses | — | 2 | 2 | — | — | — | — | — | — | — | 32 | 34 | ||||||||||||||||||||||||||||||||||||
Environmental obligations and shutdown costs | — | — | — | — | — | — | — | — | — | — | 8 | 8 | ||||||||||||||||||||||||||||||||||||
Net gain on sales of assets | — | — | — | — | — | — | — | — | — | — | (33 | ) | (33 | ) | ||||||||||||||||||||||||||||||||||
Operating income (loss) | 380 | 227 | 607 | 392 | 12 | 404 | 476 | (15 | ) | 4 | (1 | ) | (226 | ) | 1,249 | |||||||||||||||||||||||||||||||||
Interest expense, net | 1 | 1 | 2 | 31 | — | 31 | — | — | — | 8 | 288 | 329 | ||||||||||||||||||||||||||||||||||||
Provision for (benefit from) income taxes | — | — | — | 154 | 5 | 159 | 202 | — | — | 3 | (4 | ) | 360 | |||||||||||||||||||||||||||||||||||
Capital expenditures | 52 | 15 | 67 | 43 | 2 | 45 | 457 | 2 | 2 | 25 | 108 | h | 706 | |||||||||||||||||||||||||||||||||||
Six Months Ended June 30, 2016 | ||||||||||||||||||||||||||||||||||||||||||||||||
Revenues: | ||||||||||||||||||||||||||||||||||||||||||||||||
Unaffiliated customers | $ | 241 | $ | 99 | $ | 340 | $ | 980 | $ | 267 | $ | 1,247 | $ | 1,030 | b | $ | — | $ | 1,890 | $ | 915 | $ | 1,154 | c | $ | 6,576 | ||||||||||||||||||||||
Intersegment | 761 | 1,095 | 1,856 | 101 | — | 101 | 57 | 90 | 15 | 3 | (2,122 | ) | — | |||||||||||||||||||||||||||||||||||
Production and delivery | 638 | 876 | 1,514 | 594 | 222 | 816 | 750 | 102 | 1,889 | 859 | (475 | ) | f | 5,455 | ||||||||||||||||||||||||||||||||||
Depreciation, depletion and amortization | 119 | 159 | 278 | 210 | 58 | 268 | 174 | 36 | 5 | 15 | 518 | 1,294 | ||||||||||||||||||||||||||||||||||||
Impairment of oil and gas properties | — | — | — | — | — | — | — | — | — | — | 4,078 | 4,078 | ||||||||||||||||||||||||||||||||||||
Selling, general and administrative expenses | 1 | 2 | 3 | 4 | — | 4 | 36 | — | — | 8 | 247 | g | 298 | |||||||||||||||||||||||||||||||||||
Mining exploration and research expenses | — | 1 | 1 | — | — | — | — | — | — | — | 32 | 33 | ||||||||||||||||||||||||||||||||||||
Environmental obligations and shutdown costs | — | — | — | — | — | — | — | — | — | — | 21 | 21 | ||||||||||||||||||||||||||||||||||||
Net gain on sales of assets | (577 | ) | — | (577 | ) | — | — | — | — | — | — | — | (172 | ) | (749 | ) | ||||||||||||||||||||||||||||||||
Operating income (loss) | 821 | 156 | 977 | 273 | (13 | ) | 260 | 127 | (48 | ) | 11 | 36 | (5,217 | ) | (3,854 | ) | ||||||||||||||||||||||||||||||||
Interest expense, net | 1 | 1 | 2 | 42 | — | 42 | — | — | — | 8 | 335 | 387 | ||||||||||||||||||||||||||||||||||||
Provision for (benefit from) income taxes | — | — | — | 90 | (8 | ) | 82 | 54 | — | — | 1 | 56 | 193 | |||||||||||||||||||||||||||||||||||
Capital expenditures | 65 | 11 | 76 | 291 | 2 | 293 | 453 | 1 | 1 | 7 | 984 | h | 1,815 | |||||||||||||||||||||||||||||||||||
a. | Includes U.S. oil and gas operations, which were previously a reportable segment. |
b. | Includes PT-FI’s sales to PT Smelting totaling $794 million for the first six months of 2017 and $564 million for the first six months of 2016. |
c. | Includes revenues from FCX’s molybdenum sales company, which includes sales of molybdenum produced by the Molybdenum mines and by certain of the North America and South America copper mines. |
d. | Includes asset impairment charges totaling $21 million. |
e. | Includes net charges at PT-FI associated with workforce reductions totaling $103 million in production and delivery costs and $5 million in selling, general and administrative expenses. |
f. | Includes net credits (charges) for oil and gas operations totaling $26 million for the first six months of 2017, primarily associated with adjustments to the fair value of the contingent payments for the 2016 drillship settlements and $(892) million for the first six months of 2016 for drillship settlement/idle rig costs, inventory adjustments and asset impairment. |
g. | Includes other oil and gas charges of $17 million for the first six months of 2017 for other contract termination charges and $39 million for the first six months of 2016 for net restructuring charges. |
h. | Includes $33 million for the first six months of 2017 and $915 million for the first six months of 2016 associated with oil and gas operations. The first six months of 2016 also includes $55 million associated with discontinued operations. |
24
NOTE 11. GUARANTOR FINANCIAL STATEMENTS
All of the senior notes issued by FCX are fully and unconditionally guaranteed on a senior basis jointly and severally by FM O&G LLC, as guarantor, which is a 100-percent-owned subsidiary of FM O&G and FCX. The guarantee is an unsecured obligation of the guarantor and ranks equal in right of payment with all existing and future indebtedness of FM O&G LLC, including indebtedness under FCX’s revolving credit facility. The guarantee ranks senior in right of payment with all of FM O&G LLC’s future subordinated obligations and is effectively subordinated in right of payment to any debt of FM O&G LLC’s subsidiaries. The indentures provide that FM O&G LLC’s guarantee may be released or terminated for certain obligations under the following circumstances: (i) all or substantially all of the equity interests or assets of FM O&G LLC are sold to a third party; or (ii) FM O&G LLC no longer has any obligations under any FM O&G senior notes or any refinancing thereof and no longer guarantees any obligations of FCX under the revolving credit facility or any other senior debt or, in each case, any refinancing thereof.
The following condensed consolidating financial information includes information regarding FCX, as issuer, FM O&G LLC, as guarantor, and all other non-guarantor subsidiaries of FCX. Included are the condensed consolidating balance sheets at June 30, 2017, and December 31, 2016, and the related condensed consolidating statements of comprehensive income (loss) for the three and six months ended June 30, 2017 and 2016, and the condensed consolidating statements of cash flows for the six months ended June 30, 2017 and 2016 (in millions), which should be read in conjunction with FCX’s notes to the consolidated financial statements.
CONDENSED CONSOLIDATING BALANCE SHEET
June 30, 2017
FCX | FM O&G LLC | Non-guarantor | Consolidated | ||||||||||||||||
Issuer | Guarantor | Subsidiaries | Eliminations | FCX | |||||||||||||||
ASSETS | |||||||||||||||||||
Current assets | $ | 212 | $ | 738 | $ | 10,246 | $ | (779 | ) | $ | 10,417 | ||||||||
Property, plant, equipment and mine development costs, net | 16 | 15 | 23,047 | (11 | ) | 23,067 | |||||||||||||
Oil and gas properties, subject to amortization, less accumulated amortization and impairments | — | — | 48 | — | 48 | ||||||||||||||
Investments in consolidated subsidiaries | 20,379 | — | — | (20,379 | ) | — | |||||||||||||
Other assets | 508 | 37 | 3,458 | (492 | ) | 3,511 | |||||||||||||
Total assets | $ | 21,115 | $ | 790 | $ | 36,799 | $ | (21,661 | ) | $ | 37,043 | ||||||||
LIABILITIES AND EQUITY | |||||||||||||||||||
Current liabilities | $ | 2,497 | $ | 129 | $ | 3,183 | $ | (865 | ) | $ | 4,944 | ||||||||
Long-term debt, less current portion | 11,028 | 6,397 | 5,613 | (9,900 | ) | 13,138 | |||||||||||||
Deferred income taxes | 859 | a | — | 3,011 | — | 3,870 | |||||||||||||
Environmental and asset retirement obligations, less current portion | — | 204 | 3,308 | — | 3,512 | ||||||||||||||
Investments in consolidated subsidiaries | — | 870 | 10,152 | (11,022 | ) | — | |||||||||||||
Other liabilities | 59 | 3,342 | 1,671 | (3,486 | ) | 1,586 | |||||||||||||
Total liabilities | 14,443 | 10,942 | 26,938 | (25,273 | ) | 27,050 | |||||||||||||
Equity: | |||||||||||||||||||
Stockholders’ equity | 6,672 | (10,152 | ) | 7,186 | 2,967 | 6,673 | |||||||||||||
Noncontrolling interests | — | — | 2,675 | 645 | 3,320 | ||||||||||||||
Total equity | 6,672 | (10,152 | ) | 9,861 | 3,612 | 9,993 | |||||||||||||
Total liabilities and equity | $ | 21,115 | $ | 790 | $ | 36,799 | $ | (21,661 | ) | $ | 37,043 | ||||||||
a. | All U.S.-related deferred income taxes are recorded at the parent company. |
25
CONDENSED CONSOLIDATING BALANCE SHEET
December 31, 2016
FCX | FM O&G LLC | Non-guarantor | Consolidated | ||||||||||||||||
Issuer | Guarantor | Subsidiaries | Eliminations | FCX | |||||||||||||||
ASSETS | |||||||||||||||||||
Current assets | $ | 230 | $ | 1,790 | $ | 11,675 | $ | (3,260 | ) | $ | 10,435 | ||||||||
Property, plant, equipment and mine development costs, net | 19 | 24 | 23,176 | — | 23,219 | ||||||||||||||
Oil and gas properties, subject to amortization, less accumulated amortization and impairments | — | — | 74 | — | 74 | ||||||||||||||
Investments in consolidated subsidiaries | 21,110 | — | — | (21,110 | ) | — | |||||||||||||
Other assets | 1,985 | 47 | 3,522 | (1,965 | ) | 3,589 | |||||||||||||
Total assets | $ | 23,344 | $ | 1,861 | $ | 38,447 | $ | (26,335 | ) | $ | 37,317 | ||||||||
LIABILITIES AND EQUITY | |||||||||||||||||||
Current liabilities | $ | 3,895 | $ | 308 | $ | 3,306 | $ | (3,244 | ) | $ | 4,265 | ||||||||
Long-term debt, less current portion | 12,517 | 6,062 | 11,297 | (15,081 | ) | 14,795 | |||||||||||||
Deferred income taxes | 826 | a | — | 2,942 | — | 3,768 | |||||||||||||
Environmental and asset retirement obligations, less current portion | — | 200 | 3,287 | — | 3,487 | ||||||||||||||
Investment in consolidated subsidiary | — | 893 | 8,995 | (9,888 | ) | — | |||||||||||||
Other liabilities | 55 | 3,393 | 1,784 | (3,487 | ) | 1,745 | |||||||||||||
Total liabilities | 17,293 | 10,856 | 31,611 | (31,700 | ) | 28,060 | |||||||||||||
Equity: | |||||||||||||||||||
Stockholders’ equity | 6,051 | (8,995 | ) | 4,237 | 4,758 | 6,051 | |||||||||||||
Noncontrolling interests | — | — | 2,599 | 607 | 3,206 | ||||||||||||||
Total equity | 6,051 | (8,995 | ) | 6,836 | 5,365 | 9,257 | |||||||||||||
Total liabilities and equity | $ | 23,344 | $ | 1,861 | $ | 38,447 | $ | (26,335 | ) | $ | 37,317 | ||||||||
a. | All U.S.-related deferred income taxes are recorded at the parent company. |
26
CONDENSED CONSOLIDATING STATEMENTS OF COMPREHENSIVE INCOME (LOSS)
Three Months Ended June 30, 2017 | |||||||||||||||||||
FCX | FM O&G LLC | Non-guarantor | Consolidated | ||||||||||||||||
Issuer | Guarantor | Subsidiaries | Eliminations | FCX | |||||||||||||||
Revenues | $ | — | $ | 12 | $ | 3,699 | $ | — | $ | 3,711 | |||||||||
Total costs and expenses | 14 | 11 | 3,007 | 10 | 3,042 | ||||||||||||||
Operating (loss) income | (14 | ) | 1 | 692 | (10 | ) | 669 | ||||||||||||
Interest expense, net | (117 | ) | (55 | ) | (74 | ) | 84 | (162 | ) | ||||||||||
Other income (expense), net | 80 | — | 10 | (84 | ) | 6 | |||||||||||||
(Loss) income before income taxes and equity in affiliated companies’ net earnings (losses) | (51 | ) | (54 | ) | 628 | (10 | ) | 513 | |||||||||||
(Provision for) benefit from income taxes | (72 | ) | 19 | (136 | ) | 3 | (186 | ) | |||||||||||
Equity in affiliated companies’ net earnings (losses) | 391 | (26 | ) | (62 | ) | (304 | ) | (1 | ) | ||||||||||
Net income (loss) from continuing operations | 268 | (61 | ) | 430 | (311 | ) | 326 | ||||||||||||
Net income from discontinued operations | — | — | 9 | — | 9 | ||||||||||||||
Net income (loss) | 268 | (61 | ) | 439 | (311 | ) | 335 | ||||||||||||
Net income attributable to noncontrolling interests: | |||||||||||||||||||
Continuing operations | — | — | (46 | ) | (20 | ) | (66 | ) | |||||||||||
Discontinued operations | — | — | (1 | ) | — | (1 | ) | ||||||||||||
Net income (loss) attributable to common stockholders | $ | 268 | $ | (61 | ) | $ | 392 | $ | (331 | ) | $ | 268 | |||||||
Other comprehensive income (loss) | 81 | — | 81 | (81 | ) | 81 | |||||||||||||
Total comprehensive income (loss) | $ | 349 | $ | (61 | ) | $ | 473 | $ | (412 | ) | $ | 349 | |||||||
Three Months Ended June 30, 2016 | |||||||||||||||||||
FCX | FM O&G LLC | Non-guarantor | Consolidated | ||||||||||||||||
Issuer | Guarantor | Subsidiaries | Eliminations | FCX | |||||||||||||||
Revenues | $ | — | $ | 106 | $ | 3,228 | $ | — | $ | 3,334 | |||||||||
Total costs and expenses | 17 | 964 | a | 2,335 | a | — | 3,316 | ||||||||||||
Operating (loss) income | (17 | ) | (858 | ) | 893 | — | 18 | ||||||||||||
Interest expense, net | (141 | ) | (15 | ) | (124 | ) | 84 | (196 | ) | ||||||||||
Other income (expense), net | 107 | — | 28 | (71 | ) | 64 | |||||||||||||
(Loss) income before income taxes and equity in affiliated companies’ net (losses) earnings | (51 | ) | (873 | ) | 797 | 13 | (114 | ) | |||||||||||
(Provision for) benefit from income taxes | (345 | ) | 306 | (69 | ) | (8 | ) | (116 | ) | ||||||||||
Equity in affiliated companies’ net (losses) earnings | (90 | ) | (280 | ) | (853 | ) | 1,224 | 1 | |||||||||||
Net (loss) income from continuing operations | (486 | ) | (847 | ) | (125 | ) | 1,229 | (229 | ) | ||||||||||
Net income (loss) from discontinued operations | 5 | — | (175 | ) | (11 | ) | (181 | ) | |||||||||||
Net (loss) income | (481 | ) | (847 | ) | (300 | ) | 1,218 | (410 | ) | ||||||||||
Net income and preferred dividends attributable to noncontrolling interests: | |||||||||||||||||||
Continuing operations | — | — | (50 | ) | (7 | ) | (57 | ) | |||||||||||
Discontinued operations | — | — | (12 | ) | — | (12 | ) | ||||||||||||
Net (loss) income attributable to common stockholders | $ | (481 | ) | $ | (847 | ) | $ | (362 | ) | $ | 1,211 | $ | (479 | ) | |||||
Other comprehensive income (loss) | 15 | — | 15 | (15 | ) | 15 | |||||||||||||
Total comprehensive (loss) income | $ | (466 | ) | $ | (847 | ) | $ | (347 | ) | $ | 1,196 | $ | (464 | ) | |||||
a. | Includes charges totaling $0.2 billion at the FM O&G LLC guarantor and $0.1 billion at the non-guarantor subsidiaries related to impairment of FCX’s oil and gas properties pursuant to full cost accounting rules. |
27
CONDENSED CONSOLIDATING STATEMENTS OF COMPREHENSIVE INCOME (LOSS)
Six Months Ended June 30, 2017 | |||||||||||||||||||
FCX | FM O&G LLC | Non-guarantor | Consolidated | ||||||||||||||||
Issuer | Guarantor | Subsidiaries | Eliminations | FCX | |||||||||||||||
Revenues | $ | — | $ | 25 | $ | 7,027 | $ | — | $ | 7,052 | |||||||||
Total costs and expenses | 23 | 61 | 5,707 | 12 | 5,803 | ||||||||||||||
Operating (loss) income | (23 | ) | (36 | ) | 1,320 | (12 | ) | 1,249 | |||||||||||
Interest expense, net | (239 | ) | (108 | ) | (145 | ) | 163 | (329 | ) | ||||||||||
Other income (expense), net | 159 | — | 35 | (163 | ) | 31 | |||||||||||||
(Loss) income before income taxes and equity in affiliated companies’ net earnings (losses) | (103 | ) | (144 | ) | 1,210 | (12 | ) | 951 | |||||||||||
(Provision for) benefit from income taxes | (132 | ) | 50 | (282 | ) | 4 | (360 | ) | |||||||||||
Equity in affiliated companies’ net earnings (losses) | 731 | (6 | ) | (98 | ) | (624 | ) | 3 | |||||||||||
Net income (loss) from continuing operations | 496 | (100 | ) | 830 | (632 | ) | 594 | ||||||||||||
Net income from discontinued operations | — | — | 47 | — | 47 | ||||||||||||||
Net income (loss) | 496 | (100 | ) | 877 | (632 | ) | 641 | ||||||||||||
Net income attributable to noncontrolling interests: | |||||||||||||||||||
Continuing operations | — | — | (111 | ) | (30 | ) | (141 | ) | |||||||||||
Discontinued operations | — | — | (4 | ) | — | (4 | ) | ||||||||||||
Net income (loss) attributable to common stockholders | $ | 496 | $ | (100 | ) | $ | 762 | $ | (662 | ) | $ | 496 | |||||||
Other comprehensive income (loss) | 92 | — | 92 | (92 | ) | 92 | |||||||||||||
Total comprehensive income (loss) | $ | 588 | $ | (100 | ) | $ | 854 | $ | (754 | ) | $ | 588 | |||||||
Six Months Ended June 30, 2016 | |||||||||||||||||||
FCX | FM O&G LLC | Non-guarantor | Consolidated | ||||||||||||||||
Issuer | Guarantor | Subsidiaries | Eliminations | FCX | |||||||||||||||
Revenues | $ | — | $ | 184 | $ | 6,392 | $ | — | $ | 6,576 | |||||||||
Total costs and expenses | 44 | 2,593 | a | 7,787 | a | 6 | 10,430 | ||||||||||||
Operating loss | (44 | ) | (2,409 | ) | (1,395 | ) | (6 | ) | (3,854 | ) | |||||||||
Interest expense, net | (278 | ) | (19 | ) | (238 | ) | 148 | (387 | ) | ||||||||||
Other income (expense), net | 157 | — | 68 | (125 | ) | 100 | |||||||||||||
(Loss) income before income taxes and equity in affiliated companies’ net (losses) earnings | (165 | ) | (2,428 | ) | (1,565 | ) | 17 | (4,141 | ) | ||||||||||
(Provision for) benefit from income taxes | (2,128 | ) | 922 | 1,019 | (6 | ) | (193 | ) | |||||||||||
Equity in affiliated companies’ net (losses) earnings | (2,376 | ) | (2,984 | ) | (4,483 | ) | 9,851 | 8 | |||||||||||
Net (loss) income from continuing operations | (4,669 | ) | (4,490 | ) | (5,029 | ) | 9,862 | (4,326 | ) | ||||||||||
Net income (loss) from discontinued operations | 5 | — | (169 | ) | (21 | ) | (185 | ) | |||||||||||
Net (loss) income | (4,664 | ) | (4,490 | ) | (5,198 | ) | 9,841 | (4,511 | ) | ||||||||||
Net income and preferred dividends attributable to noncontrolling interests: | |||||||||||||||||||
Continuing operations | — | — | (117 | ) | (13 | ) | (130 | ) | |||||||||||
Discontinued operations | — | — | (22 | ) | — | (22 | ) | ||||||||||||
Net (loss) income attributable to common stockholders | $ | (4,664 | ) | $ | (4,490 | ) | $ | (5,337 | ) | $ | 9,828 | $ | (4,663 | ) | |||||
Other comprehensive income (loss) | 15 | — | 15 | (15 | ) | 15 | |||||||||||||
Total comprehensive (loss) income | $ | (4,649 | ) | $ | (4,490 | ) | $ | (5,322 | ) | $ | 9,813 | $ | (4,648 | ) | |||||
a. | Includes charges totaling $1.5 billion at the FM O&G LLC guarantor and $2.6 billion at the non-guarantor subsidiaries related to impairment of FCX’s oil and gas properties pursuant to full cost accounting rules. |
28
CONDENSED CONSOLIDATING STATEMENTS OF CASH FLOWS
Six Months Ended June 30, 2017 | FCX | FM O&G LLC | Non-guarantor | Consolidated | |||||||||||||||
Issuer | Guarantor | Subsidiaries | Eliminations | FCX | |||||||||||||||
Net cash (used in) provided by operating activities | $ | (96 | ) | $ | (284 | ) | $ | 2,209 | $ | — | $ | 1,829 | |||||||
Cash flow from investing activities: | |||||||||||||||||||
Capital expenditures | — | (23 | ) | (683 | ) | — | (706 | ) | |||||||||||
Intercompany loans | (427 | ) | — | — | 427 | — | |||||||||||||
Dividends from (investments in) consolidated subsidiaries | 1,032 | (16 | ) | 62 | (1,078 | ) | — | ||||||||||||
Asset sales and other, net | — | (5 | ) | 1 | — | (4 | ) | ||||||||||||
Net cash provided by (used in) investing activities | 605 | (44 | ) | (620 | ) | (651 | ) | (710 | ) | ||||||||||
Cash flow from financing activities: | |||||||||||||||||||
Proceeds from debt | — | — | 606 | — | 606 | ||||||||||||||
Repayments of debt | (499 | ) | — | (751 | ) | — | (1,250 | ) | |||||||||||
Intercompany loans | — | 337 | 90 | (427 | ) | — | |||||||||||||
Cash dividends paid and contributions received, net | (2 | ) | — | (1,064 | ) | 1,025 | (41 | ) | |||||||||||
Other, net | (8 | ) | (9 | ) | (55 | ) | 53 | (19 | ) | ||||||||||
Net cash (used in) provided by financing activities | (509 | ) | 328 | (1,174 | ) | 651 | (704 | ) | |||||||||||
Net increase in cash and cash equivalents | — | — | 415 | — | 415 | ||||||||||||||
Decrease in cash and cash equivalents in assets held for sale | — | — | 7 | — | 7 | ||||||||||||||
Cash and cash equivalents at beginning of period | — | 3 | 4,242 | — | 4,245 | ||||||||||||||
Cash and cash equivalents at end of period | $ | — | $ | 3 | $ | 4,664 | $ | — | $ | 4,667 | |||||||||
Six Months Ended June 30, 2016 | FCX | FM O&G LLC | Non-guarantor | Consolidated | |||||||||||||||
Issuer | Guarantor | Subsidiaries | Eliminations | FCX | |||||||||||||||
Net cash (used in) provided by operating activities | $ | (173 | ) | $ | (90 | ) | $ | 1,875 | $ | 2 | $ | 1,614 | |||||||
Cash flow from investing activities: | |||||||||||||||||||
Capital expenditures | — | (433 | ) | (1,380 | ) | (2 | ) | (1,815 | ) | ||||||||||
Intercompany loans | (994 | ) | (493 | ) | — | 1,487 | — | ||||||||||||
Dividends from (investments in) consolidated subsidiaries | 1,935 | (41 | ) | 78 | (1,972 | ) | — | ||||||||||||
Asset sales and other, net | — | 91 | 1,189 | — | 1,280 | ||||||||||||||
Net cash provided by (used in) investing activities | 941 | (876 | ) | (113 | ) | (487 | ) | (535 | ) | ||||||||||
Cash flow from financing activities: | |||||||||||||||||||
Proceeds from debt | 1,505 | — | 1,306 | — | 2,811 | ||||||||||||||
Repayments of debt | (2,282 | ) | — | (1,367 | ) | — | (3,649 | ) | |||||||||||
Intercompany loans | — | 1,018 | 469 | (1,487 | ) | — | |||||||||||||
Net proceeds from sale of common stock | 32 | — | 42 | (42 | ) | 32 | |||||||||||||
Cash dividends paid and contributions received, net | (5 | ) | — | (1,989 | ) | 1,950 | (44 | ) | |||||||||||
Other, net | (18 | ) | (52 | ) | (17 | ) | 64 | (23 | ) | ||||||||||
Net cash (used in) provided by financing activities | (768 | ) | 966 | (1,556 | ) | 485 | (873 | ) | |||||||||||
Net increase in cash and cash equivalents | — | — | 206 | — | 206 | ||||||||||||||
Increase in cash and cash equivalents in assets held for sale | — | — | (53 | ) | — | (53 | ) | ||||||||||||
Cash and cash equivalents at beginning of period | — | — | 177 | — | 177 | ||||||||||||||
Cash and cash equivalents at end of period | $ | — | $ | — | $ | 330 | $ | — | $ | 330 | |||||||||
29
NOTE 12. NEW ACCOUNTING STANDARDS
In March 2016, the Financial Accounting Standards Board (FASB) issued an Accounting Standards Update (ASU) that simplifies various aspects of the accounting for share-based payment transactions, including the income tax consequences, statutory tax withholding requirements, an accounting policy election for forfeitures and the classification on the statement of cash flows. FCX adopted this ASU effective January 1, 2017, and adoption did not have a material impact on its financial statements.
In March 2017, FASB issued an ASU that changes how entities with a defined benefit pension or other postretirement benefit plans present net periodic benefit cost in the income statement. This ASU requires the service cost component of net periodic benefit cost to be presented in the same income statement line item or items as other compensation costs for those employees who are receiving the retirement benefit. In addition, only the service cost component is eligible for capitalization when applicable (i.e., as a cost of inventory or an internally constructed asset). The other components of net periodic benefit cost are required to be presented separately from the service cost component and outside of operating income. These other components of net periodic benefit cost are not eligible for capitalization, and the income statement line item or items must be disclosed. For public entities, this ASU is effective for annual periods beginning after December 15, 2017, and interim reporting periods within that reporting period. Early adoption is permitted. FCX expects to adopt this ASU on January 1, 2018, and does not expect it to have a material impact on its presentation of the statements of operations.
NOTE 13. SUBSEQUENT EVENTS
On July 31, 2017, FM O&G sold certain property interests in the Gulf of Mexico Shelf for cash consideration of $62 million, before closing adjustments. The transaction has an effective date of April 1, 2017, and is expected to result in a gain in third-quarter 2017 under the full cost accounting rules.
FCX evaluated events after June 30, 2017, and through the date the consolidated financial statements were issued, and determined any events or transactions occurring during this period that would require recognition or disclosure are appropriately addressed in these consolidated financial statements.
30
REVIEW REPORT OF INDEPENDENT REGISTERED PUBLIC ACCOUNTING FIRM
TO THE BOARD OF DIRECTORS AND STOCKHOLDERS OF
FREEPORT-McMoRan INC.
We have reviewed the consolidated balance sheet of Freeport-McMoRan Inc. as of June 30, 2017, and the related consolidated statements of operations and comprehensive income (loss) for the three- and six-month periods ended June 30, 2017 and 2016, the consolidated statements of cash flows for the six-month periods ended June 30, 2017 and 2016, and the consolidated statement of equity for the six-month period ended June 30, 2017. These financial statements are the responsibility of the Company’s management.
We conducted our review in accordance with the standards of the Public Company Accounting Oversight Board (United States). A review of interim financial information consists principally of applying analytical procedures and making inquiries of persons responsible for financial and accounting matters. It is substantially less in scope than an audit conducted in accordance with the standards of the Public Company Accounting Oversight Board (United States), the objective of which is the expression of an opinion regarding the financial statements taken as a whole. Accordingly, we do not express such an opinion.
Based on our review, we are not aware of any material modifications that should be made to the consolidated financial statements referred to above for them to be in conformity with U.S. generally accepted accounting principles.
We have previously audited, in accordance with the standards of the Public Company Accounting Oversight Board (United States), the consolidated balance sheet of Freeport-McMoRan Inc. as of December 31, 2016, and the related consolidated statements of operations, comprehensive loss, cash flows and equity for the year then ended (not presented herein) and we expressed an unqualified audit opinion on those consolidated financial statements in our report dated February 24, 2017. In our opinion, the accompanying consolidated balance sheet of Freeport-McMoRan Inc. as of December 31, 2016, is fairly stated, in all material respects, in relation to the consolidated balance sheet from which it has been derived.
/s/ ERNST & YOUNG LLP
Phoenix, Arizona
August 4, 2017
31
Item 2. | Management’s Discussion and Analysis of Financial Condition and Results of Operations. |
In Management’s Discussion and Analysis of Financial Condition and Results of Operations, “we,” “us” and “our” refer to Freeport-McMoRan Inc. (FCX) and its consolidated subsidiaries. You should read this discussion in conjunction with our financial statements, the related Management’s Discussion and Analysis of Financial Condition and Results of Operations and the discussion of our Business and Properties in our annual report on Form 10-K for the year ended December 31, 2016, filed with the United States (U.S.) Securities and Exchange Commission (SEC). The results of operations reported and summarized below are not necessarily indicative of future operating results (refer to “Cautionary Statement” for further discussion). References to “Notes” are Notes included in our Notes to Consolidated Financial Statements. Throughout Management’s Discussion and Analysis of Financial Condition and Results of Operations, all references to earnings or losses per share are on a diluted basis. Additionally, in accordance with accounting guidelines, TF Holdings Limited (TFHL), through which we held a controlling interest in the Tenke Fungurume (Tenke) mine until it was sold on November 16, 2016, is reported as a discontinued operation for all periods presented.
OVERVIEW
We are a leading international mining company with headquarters in Phoenix, Arizona. We operate large, long-lived, geographically diverse assets with significant proven and probable reserves of copper, gold and molybdenum. We are the world’s largest publicly traded copper producer. Our portfolio of assets includes the Grasberg minerals district in Indonesia, one of the world’s largest copper and gold deposits; and significant mining operations in the Americas, including the large-scale Morenci minerals district in North America and the Cerro Verde operation in South America.
Net income (loss) attributable to common stock totaled $268 million in second-quarter 2017, $(479) million in second-quarter 2016, $496 million for the first six months of 2017 and $(4.7) billion for the first six months of 2016. The 2017 periods, compared with the 2016 periods, benefited from higher copper prices and higher gold sales volumes, partly offset by lower copper sales volumes. The 2016 periods also included higher charges at our oil and gas operations primarily for the impairment of oil and gas properties, drillship settlements, inventory adjustments, asset impairment and restructuring charges, partly offset by a net gain on sales of mining assets. Refer to “Consolidated Results” for further discussion.
At June 30, 2017, we had $4.7 billion in consolidated cash and cash equivalents and $15.4 billion in total debt. We had no borrowings and $3.5 billion available under our revolving credit facility. Refer to Note 6 for further discussion of debt.
We continue to manage production, exploration and administrative costs and capital spending and, subject to commodity prices and operational results, expect to generate operating cash flows in excess of capital expenditures.
We believe that we have a high-quality portfolio of long-lived copper assets positioned to generate long-term value. We are pursuing opportunities to enhance our mines’ net present values, and we continue to advance studies for future development of our copper resources, the timing of which will be dependent on market conditions.
In late March 2017, the Indonesian government amended the regulations to enable PT Freeport Indonesia (PT-FI) to retain its Contract of Work (COW) until replaced with a special operating license (known as an IUPK) accompanied by an investment stability agreement, and to grant PT-FI a temporary IUPK through October 10, 2017, that would allow concentrate exports to resume during this period. PT-FI and the Indonesian government are in active negotiations and working cooperatively with the objective of reaching a mutually acceptable long-term resolution during 2017 to secure PT-FI's long-term investments for the benefit of all stakeholders. Refer to “Operations – Indonesia Mining” for further discussion.
OUTLOOK
We view the long-term outlook for our business positively, supported by limitations on supplies of copper and by the requirements for copper in the world’s economy. Our financial results vary as a result of fluctuations in market prices primarily for copper, gold and molybdenum, as well as other factors. World market prices for these commodities have historically fluctuated and are affected by numerous factors beyond our control. Because we
32
cannot control the price of our products, the key measures that management focuses on in operating our business are sales volumes, unit net cash costs, operating cash flow and capital expenditures.
Projections for 2017 and other forward-looking statements in this quarterly report on Form 10-Q assume achievement of planned operating rates at PT-FI during the second half of 2017, and the resolution or completion of negotiations with the Indonesian government on the conversion of PT-FI’s COW to an IUPK accompanied by an investment stability agreement by October 10, 2017. Refer to “Operations – Indonesia Mining” for further discussion of Indonesia regulatory matters, which may have a significant impact on future results.
Sales Volumes
Following are our projected consolidated sales volumes for the year 2017:
Copper (millions of recoverable pounds): | |||
North America copper mines | 1,460 | ||
South America mining | 1,230 | ||
Indonesia mining | 1,020 | ||
Total | 3,710 | ||
Gold (thousands of recoverable ounces) | 1,600 | ||
Molybdenum (millions of recoverable pounds) | 93 | a | |
a. | Projected molybdenum sales include 35 million pounds produced by our Molybdenum mines and 58 million pounds produced by our North America and South America copper mines. |
Consolidated sales volumes for third-quarter 2017 are expected to approximate 940 million pounds of copper, 375 thousand ounces of gold and 22 million pounds of molybdenum.
Projected sales volumes are dependent on operational performance and other factors. For other important factors that could cause results to differ materially from projections, refer to “Cautionary Statement.”
Unit Net Cash Costs
Assuming average prices of $1,250 per ounce of gold and $7.50 per pound of molybdenum for the second half of 2017 and achievement of current sales volume and cost estimates, consolidated unit net cash costs (net of by-product credits) for our copper mines are expected to average $1.19 per pound of copper for the year 2017. The impact of price changes for the second half of 2017 on consolidated unit net cash costs would approximate $0.015 per pound for each $50 per ounce change in the average price of gold and $0.01 per pound for each $2 per pound change in the average price of molybdenum. Quarterly unit net cash costs vary with fluctuations in sales volumes and realized prices primarily for gold and molybdenum. Refer to “Consolidated Results – Production and Delivery Costs” for further discussion of consolidated production costs for our mining operations.
Consolidated Operating Cash Flow
Our consolidated operating cash flows vary with sales volumes, prices realized from copper, gold and molybdenum sales, production costs, income taxes, other working capital changes and other factors. Based on current sales volume and cost estimates, and assuming average prices of $2.65 per pound of copper, $1,250 per ounce of gold and $7.50 per pound of molybdenum for the second half of 2017, consolidated operating cash flows are estimated to approximate $3.8 billion for the year 2017 (including $0.6 billion in working capital sources and changes in tax payments). Projected consolidated operating cash flows for the year 2017 also reflect an estimated income tax provision of $1.1 billion (refer to “Consolidated Results – Income Taxes” for further discussion of our projected income tax rate for the year 2017). The impact of price changes during the second half of 2017 on operating cash flows would approximate $180 million for each $0.10 per pound change in the average price of copper, $40 million for each $50 per ounce change in the average price of gold and $40 million for each $2 per pound change in the average price of molybdenum.
Consolidated Capital Expenditures
Consolidated capital expenditures are expected to approximate $1.6 billion for the year 2017, including $0.9 billion for major mining projects primarily associated with underground development activities at Grasberg. As a result of regulatory uncertainty, PT-FI has slowed investments in its underground development projects. If PT-FI is unable to
33
reach an agreement with the Indonesian government on its long-term mining rights, we intend to reduce or defer investments significantly in underground development projects and pursue arbitration under PT-FI’s COW.
MARKETS
World prices for copper, gold and molybdenum can fluctuate significantly. During the period from January 2007 through June 2017, the London Metal Exchange (LME) spot copper price varied from a low of $1.26 per pound in 2008 to a record high of $4.60 per pound in 2011; the London Bullion Market Association (London) PM gold price fluctuated from a low of $608 per ounce in 2007 to a record high of $1,895 per ounce in 2011; and the Metals Week Molybdenum Dealer Oxide weekly average price ranged from a low of $4.46 per pound in 2015 to a high of $33.88 per pound in 2008. Copper, gold and molybdenum prices are affected by numerous factors beyond our control as described further in “Risk Factors” contained in Part I, Item 1A. of our annual report on Form 10-K for the year ended December 31, 2016.
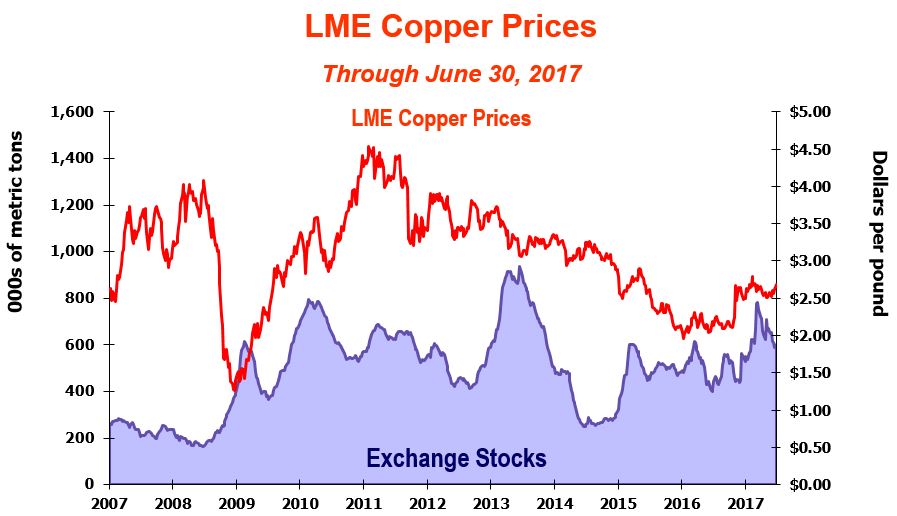
This graph presents LME spot copper prices and the combined reported stocks of copper at the LME, Commodity Exchange Inc. (COMEX), a division of the New York Mercantile Exchange (NYMEX), and the Shanghai Futures Exchange from January 2007 through June 2017. Beginning in mid-2014, copper prices declined because of concerns about slowing growth rates in China, a stronger U.S. dollar and a broad-based decline in commodity prices, but began to improve in fourth-quarter 2016. During second-quarter 2017, LME spot copper prices ranged from a low of $2.48 per pound to a high of $2.68 per pound, averaged $2.57 per pound, and closed at $2.68 per pound on June 30, 2017. The LME spot copper price was $2.88 per pound on July 31, 2017.
We believe the underlying long-term fundamentals of the copper business remain positive, supported by the significant role of copper in the global economy and a challenging long-term supply environment attributable to difficulty in replacing the output of existing large mines with new production sources. Future copper prices are expected to be volatile and are likely to be influenced by demand from China and emerging markets, as well as economic activity in the U.S. and other industrialized countries, the timing of the development of new supplies of copper and the production levels of mines and copper smelters.
34
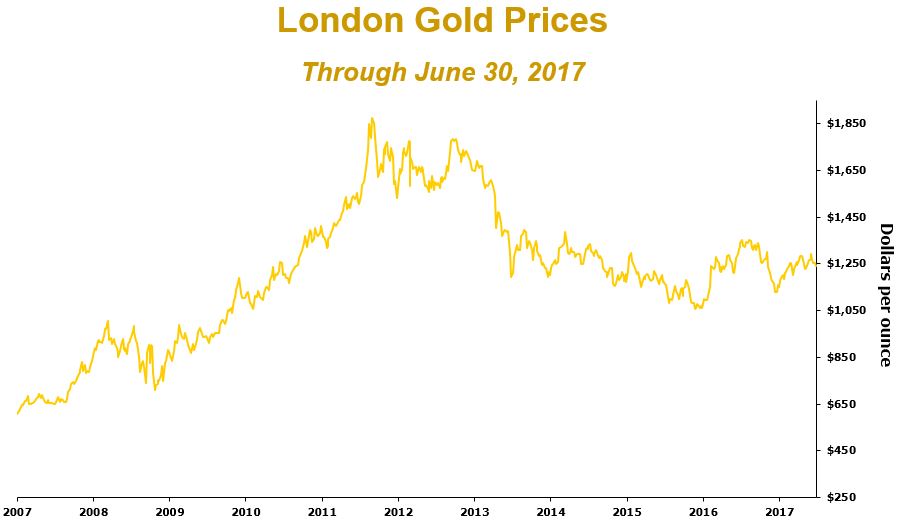
This graph presents London PM gold prices from January 2007 through June 2017. An improving economic outlook, stronger U.S. dollar and positive equity performance contributed to lower demand for gold since 2014. During second-quarter 2017, London PM gold prices ranged from a low of $1,220 per ounce to a high of $1,294 per ounce, averaged $1,257 per ounce, and closed at $1,242 per ounce on June 30, 2017. The London PM gold price was $1,268 per ounce on July 31, 2017.
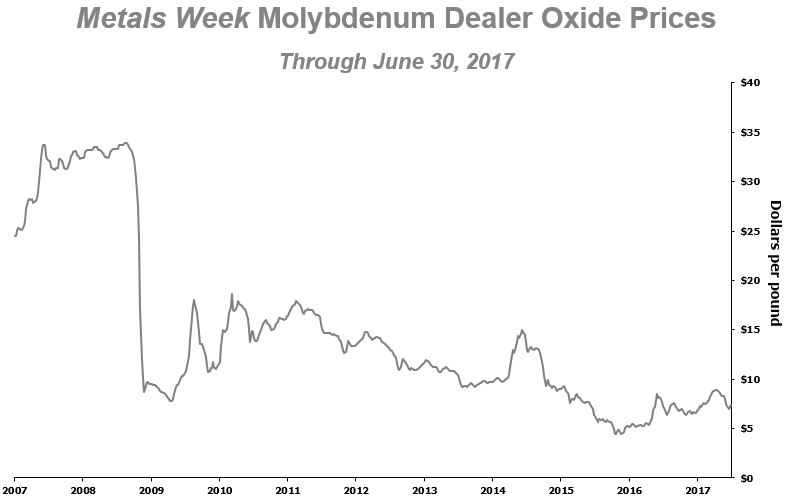
This graph presents the Metals Week Molybdenum Dealer Oxide weekly average prices from January 2007 through June 2017. Molybdenum prices declined beginning in mid-2014 because of weaker demand from global steel and stainless steel producers but have rebounded slightly starting in mid-2016. During second-quarter 2017, the weekly average price of molybdenum ranged from a low of $6.98 per pound to a high of $8.95 per pound, averaged $8.06 per pound, and was $7.34 per pound on June 30, 2017. The Metals Week Molybdenum Dealer Oxide weekly average price was $7.39 per pound on July 31, 2017.
35
CONSOLIDATED RESULTS
Three Months Ended June 30, | Six Months Ended June 30, | |||||||||||||||
2017 | 2016 | 2017 | 2016 | |||||||||||||
SUMMARY FINANCIAL DATA | (in millions, except per share amounts) | |||||||||||||||
Revenuesa,b | $ | 3,711 | $ | 3,334 | $ | 7,052 | $ | 6,576 | ||||||||
Operating income (loss)a,c,d | $ | 669 | e,f | $ | 18 | g | $ | 1,249 | e,f | $ | (3,854 | ) | g | |||
Net income (loss) from continuing operationsh,i,j | $ | 326 | $ | (229 | ) | $ | 594 | $ | (4,326 | ) | ||||||
Net income (loss) from discontinued operationsk | $ | 9 | $ | (181 | ) | $ | 47 | $ | (185 | ) | ||||||
Net income (loss) attributable to common stock | $ | 268 | $ | (479 | ) | $ | 496 | $ | (4,663 | ) | ||||||
Diluted net income (loss) per share of common stock: | ||||||||||||||||
Continuing operations | $ | 0.18 | $ | (0.23 | ) | $ | 0.31 | $ | (3.54 | ) | ||||||
Discontinued operations | — | (0.15 | ) | 0.03 | (0.16 | ) | ||||||||||
$ | 0.18 | $ | (0.38 | ) | $ | 0.34 | $ | (3.70 | ) | |||||||
Diluted weighted-average common shares outstanding | 1,453 | 1,269 | 1,453 | 1,260 | ||||||||||||
Operating cash flowsl | $ | 1,037 | $ | 874 | $ | 1,829 | $ | 1,614 | ||||||||
Capital expenditures | $ | 362 | $ | 833 | $ | 706 | $ | 1,815 | ||||||||
At June 30: | ||||||||||||||||
Cash and cash equivalents | $ | 4,667 | $ | 330 | $ | 4,667 | $ | 330 | ||||||||
Total debt, including current portion | $ | 15,354 | $ | 19,220 | $ | 15,354 | $ | 19,220 | ||||||||
a.As further detailed in Note 10, following is a summary of revenues and operating income (loss) by operating division (in millions):
Three Months Ended June 30, | Six Months Ended June 30, | |||||||||||||||
Revenues | 2017 | 2016 | 2017 | 2016 | ||||||||||||
North America copper mines | $ | 1,148 | $ | 1,060 | $ | 2,243 | $ | 2,196 | ||||||||
South America mining | 735 | 677 | 1,603 | 1,348 | ||||||||||||
Indonesia mining | 1,065 | 531 | 1,599 | 1,087 | ||||||||||||
Molybdenum mines | 71 | 45 | 134 | 90 | ||||||||||||
Rod & Refining | 1,052 | 926 | 2,167 | 1,905 | ||||||||||||
Atlantic Copper Smelting & Refining | 400 | 495 | 858 | 918 | ||||||||||||
Corporate, other & eliminations | (760 | ) | (400 | ) | (1,552 | ) | (968 | ) | ||||||||
Total revenues | $ | 3,711 | $ | 3,334 | $ | 7,052 | $ | 6,576 | ||||||||
Operating income (loss) | ||||||||||||||||
North America copper mines | $ | 303 | $ | 775 | $ | 607 | $ | 977 | ||||||||
South America mining | 144 | 133 | 404 | 260 | ||||||||||||
Indonesia mining | 328 | 60 | 476 | 127 | ||||||||||||
Molybdenum mines | (7 | ) | (22 | ) | (15 | ) | (48 | ) | ||||||||
Rod & Refining | 1 | 4 | 4 | 11 | ||||||||||||
Atlantic Copper Smelting & Refining | (11 | ) | 18 | (1 | ) | 36 | ||||||||||
Corporate, other & eliminations | (89 | ) | (950 | ) | (226 | ) | (5,217 | ) | ||||||||
Total operating income (loss) | $ | 669 | $ | 18 | $ | 1,249 | $ | (3,854 | ) | |||||||
b. | Includes (unfavorable) favorable adjustments to provisionally priced concentrate and cathode copper sales recognized in prior periods totaling $(20) million ($(8) million to net income attributable to common stock or $(0.01) per share) in second-quarter 2017, $(28) million ($(15) million to net loss attributable to common stock or $(0.01) per share) in second-quarter 2016, $81 million ($35 million to net income attributable to common stock or $0.02 per share) for the first six months of 2017 and $5 million ($2 million to net loss attributable to common stock or less than $0.01 per share) for the first six months of 2016. Refer to “Revenues” for further discussion. |
c. | Includes net charges to mining operations for inventory adjustments and asset impairment totaling $9 million ($9 million to net income attributable to common stock or $0.01 per share) in second-quarter 2017, $2 million ($2 million to net loss attributable to common stock or less than $0.01 per share) in second-quarter 2016, $28 million ($28 million to net income attributable to common stock or $0.02 per share) for the first six months of 2017 and $7 million ($7 million to net loss attributable to common stock or $0.01 per share) for the first six months of 2016. The 2017 periods also include net charges of $87 million ($46 million to net income attributable to common stock or $0.03 per share) in second-quarter 2017 and $108 million ($57 million to net income attributable to common stock or $0.04 per share) for the first six months of 2017 associated with workforce reductions at PT-FI. |
36
d. | Includes a net gain on sales of assets totaling $10 million ($10 million to net income attributable to common stock or $0.01 per share) in second-quarter 2017 and $33 million ($33 million to net income attributable to common stock or $0.02 per share) for the first six months of 2017, primarily reflecting adjustments associated with oil and gas transactions and an adjustment to assets held for sale. The second-quarter and first six months of 2016 include a net gain on sales of assets totaling $749 million ($744 million to net loss attributable to common stock or $0.59 per share), primarily associated with the sales of a 13 percent undivided interest in the Morenci unincorporated joint venture and our interest in the Timok exploration project in Serbia. |
e. | Includes net credits to oil and gas operations totaling $6 million ($6 million to net income attributable to common stock or less than $0.01 per share) in second-quarter 2017, primarily related to adjustments to the fair value of the contingent payments related to the 2016 drillship settlements, and $4 million ($4 million to net income attributable to common stock or less than $0.01 per share) for the first six months of 2017, primarily related to drillship settlements, including adjustments to the fair value of the contingent payments, partly offset by other contract termination charges. |
f. | Includes net credit adjustments to environmental obligations and related litigation reserves totaling $30 million ($30 million to net income attributable to common stock or $0.02 per share) in second-quarter 2017 and $11 million ($11 million to net income attributable to common stock or $0.01 per share) for the first six months of 2017. Refer to Note 9 for further discussion. |
g. | Includes net charges to oil and gas operations of (i) $729 million ($729 million to net loss attributable to common stock or $0.57 per share) in second-quarter 2016, and $931 million ($931 million to net loss attributable to common stock or $0.74 per share) for the first six months of 2016, for drillship settlements, inventory adjustments, asset impairment and restructuring charges, and (ii) $291 million ($291 million to net loss attributable to common stock or $0.23 per share) in second-quarter 2016 and $4.1 billion ($4.1 billion to net loss attributable to common stock or $3.24 per share) for the first six months of 2016 to reduce the carrying value of oil and gas properties pursuant to full cost accounting rules. |
h. | Includes net (losses) gains on exchanges and early extinguishment of debt totaling $(4) million ($(4) million to net income attributable to common stock or less than $0.01 per share) in second-quarter 2017, $39 million ($39 million to net loss attributable to common stock or $0.03 per share) in second-quarter 2016, $(3) million ($(3) million to net income attributable to common stock or less than $0.01 per share) for the first six months of 2017 and $36 million ($36 million to net loss attributable to common stock or $0.03 per share) for the first six months of 2016. |
i. | We defer recognizing profits on intercompany sales until final sales to third parties occur. Refer to “Operations – Smelting & Refining” for a summary of net impacts from changes in these deferrals. |
j. | Includes net tax credits of $32 million in second-quarter 2017 and $31 million for the first six months of 2017 associated with anticipated recovery of alternative minimum tax credit carryforwards, and net tax charges of $36 million for the second quarter and first six months of 2016 associated with net operating loss carryback claims, partly offset by alternative minimum tax credits. |
k. | Net income from discontinued operations for the second quarter and first six months of 2017 primarily reflects adjustments to the fair value of the potential $120 million in contingent consideration related to the November 2016 sale of our interest in TFHL, which totaled $55 million at June 30, 2017, and in accordance with accounting guidelines will continue to be adjusted through December 31, 2019. Net loss from discontinued operations for the second quarter and first six months of 2016 includes an estimated loss of $177 million ($0.14 per share) on the sale of our interest in TFHL. Refer to Note 2 for a summary of the components of net income (loss) from discontinued operations. |
l. | Includes net working capital sources and changes in tax payments of $144 million in second-quarter 2017, $278 million in second-quarter 2016, $322 million for the first six months of 2017 and $466 million for the first six months of 2016. |
37
Three Months Ended June 30, | Six Months Ended June 30, | |||||||||||||||
2017 | 2016a | 2017 | 2016a | |||||||||||||
SUMMARY OPERATING DATA | ||||||||||||||||
Copper (millions of recoverable pounds) | ||||||||||||||||
Production | 883 | 1,011 | 1,734 | 1,998 | ||||||||||||
Sales, excluding purchases | 942 | 987 | 1,751 | 1,987 | ||||||||||||
Average realized price per pound | $ | 2.65 | $ | 2.19 | $ | 2.65 | $ | 2.17 | ||||||||
Site production and delivery costs per poundb | $ | 1.64 | $ | 1.41 | $ | 1.62 | $ | 1.45 | ||||||||
Unit net cash costs per poundb | $ | 1.20 | $ | 1.33 | $ | 1.29 | $ | 1.36 | ||||||||
Gold (thousands of recoverable ounces) | ||||||||||||||||
Production | 353 | 166 | 592 | 350 | ||||||||||||
Sales, excluding purchases | 432 | 156 | 614 | 357 | ||||||||||||
Average realized price per ounce | $ | 1,243 | $ | 1,292 | $ | 1,242 | $ | 1,259 | ||||||||
Molybdenum (millions of recoverable pounds) | ||||||||||||||||
Production | 23 | 19 | 46 | 39 | ||||||||||||
Sales, excluding purchases | 25 | 19 | 49 | 36 | ||||||||||||
Average realized price per pound | $ | 9.58 | $ | 8.34 | $ | 9.16 | $ | 7.99 | ||||||||
Oil Equivalents | ||||||||||||||||
Sales volumes | ||||||||||||||||
Oil (millions of barrels (MMBbls)) | 0.5 | 8.7 | 0.9 | 17.0 | ||||||||||||
Natural gas (billion cubic feet (Bcf)) | 4.3 | 18.8 | 10.3 | 38.4 | ||||||||||||
Natural gas liquids (MMBbls) | 0.1 | 0.6 | 0.2 | 1.2 | ||||||||||||
Million barrels of oil equivalent (MMBOE) | 1.2 | 12.4 | 2.8 | 24.5 | ||||||||||||
Thousand BOE (MBOE) per day | 14 | 136 | 15 | 135 | ||||||||||||
a. | Excludes the results of the Tenke mine, which was sold in November 2016 and is reported as a discontinued operation. Copper sales from Tenke totaled 124 million pounds in second-quarter 2016 and 247 million for the first six months of 2016. |
b. | Reflects per pound weighted-average production and delivery costs and unit net cash costs (net of by-product credits) for all copper mines, before net noncash and other costs. For reconciliations of per pound unit costs by operating division to production and delivery costs applicable to sales reported in our consolidated financial statements, refer to “Product Revenues and Production Costs.” |
Revenues
Consolidated revenues totaled $3.7 billion in second-quarter 2017 and $7.1 billion for the first six months of 2017, compared with $3.3 billion in second-quarter 2016 and $6.6 billion for the first six months of 2016. Revenues from our mining operations primarily include the sale of copper concentrate, copper cathode, copper rod, gold in concentrate and molybdenum. Revenues from our oil and gas operations include the sale of oil, natural gas and natural gas liquids (NGLs).
38
Following is a summary of changes in our consolidated revenues between periods (in millions):
Three Months Ended June 30 | Six Months Ended June 30 | ||||||
Revenues - 2016 period | $ | 3,334 | $ | 6,576 | |||
(Lower) higher sales volumes: | |||||||
Copper | (97 | ) | (513 | ) | |||
Gold | 357 | 325 | |||||
Molybdenum | 51 | 104 | |||||
Oil and gas | (376 | ) | (637 | ) | |||
Higher (lower) average realized prices: | |||||||
Copper | 433 | 840 | |||||
Gold | (21 | ) | (10 | ) | |||
Molybdenum | 31 | 57 | |||||
Net adjustments for prior period provisionally priced copper sales | 8 | 76 | |||||
Lower treatment charges | 12 | 45 | |||||
Higher revenues from purchased copper | 72 | 169 | |||||
Lower Atlantic Copper revenues | (95 | ) | (60 | ) | |||
Other, including intercompany eliminations | 2 | 80 | |||||
Revenues - 2017 period | $ | 3,711 | $ | 7,052 | |||
Sales Volumes. Consolidated copper sales decreased to 942 million pounds in second-quarter 2017, compared with 987 million pounds in second-quarter 2016, primarily reflecting anticipated lower ore grades in North America and lower leach production and recoveries in South America, partly offset by higher volumes from Indonesia associated with higher ore grades and the sale of concentrate in inventory produced in first-quarter 2017. Consolidated copper sales decreased to 1.75 billion pounds for the first six months of 2017, compared with 2.0 billion pounds for the first six months of 2016, primarily reflecting lower ore grades in North America and the impact of the May 2016 sale of an additional 13 percent interest in Morenci.
Consolidated gold sales volumes increased to 432 thousand ounces in second-quarter 2017 and 614 thousand ounces for the first six months of 2017, compared with 156 thousand ounces in second-quarter 2016 and 357 thousand ounces for the first six months of 2016, primarily reflecting higher ore grades in Indonesia. Second-quarter 2017 also included the sale of concentrate in inventory produced in first-quarter 2017.
Consolidated molybdenum sales volumes increased to 25 million pounds in second-quarter 2017 and 49 million pounds for the first six months of 2017, compared with 19 million pounds in second-quarter 2016 and 36 million pounds for the first six months of 2016, primarily reflecting higher demand and higher molybdenum production.
Refer to “Operations” for further discussion of sales volumes at our mining operations.
Oil and gas sales volumes of 1.2 MMBOE in second-quarter 2017 and 2.8 MMBOE for the first six months of 2017, were lower than oil and gas sales volumes of 12.4 MMBOE in second-quarter 2016 and 24.5 MMBOE for the first six months of 2016, primarily reflecting the sales of significant oil and gas properties in 2016.
Realized Prices. Our consolidated revenues can vary significantly as a result of fluctuations in the market prices of copper, gold and molybdenum. Second-quarter 2017 average realized prices, compared with second-quarter 2016, were 21 percent higher for copper, 4 percent lower for gold and 15 percent higher for molybdenum, and average realized prices for the first six months of 2017, compared with the first six months of 2016, were 22 percent higher for copper, 1 percent lower for gold and 15 percent higher for molybdenum. Refer to “Markets” for further discussion.
Provisionally Priced Copper Sales. Substantially all of our copper concentrate and cathode sales contracts provide final copper pricing in a specified future month (generally one to four months from the shipment date) based primarily on quoted LME monthly average spot copper prices. We receive market prices based on prices in the specified future period, which results in price fluctuations recorded through revenues until the date of settlement. We record revenues and invoice customers at the time of shipment based on then-current LME prices, which results in an embedded derivative on our provisionally priced concentrate and cathode sales that is adjusted to fair value through earnings each period, using the period-end forward prices, until final pricing on the date of settlement.
39
To the extent final prices are higher or lower than what was recorded on a provisional basis, an increase or decrease to revenues is recorded each reporting period until the date of final pricing. Accordingly, in times of rising copper prices, our revenues benefit from adjustments to the final pricing of provisionally priced sales pursuant to contracts entered into in prior periods; in times of falling copper prices, the opposite occurs. (Unfavorable) favorable impacts of net adjustments to prior periods’ provisionally priced copper sales from continuing operations totaled $(20) million in second-quarter 2017 and $81 million for the first six months of 2017, compared with $(28) million in second-quarter 2016 and $5 million for the first six months of 2016.
At June 30, 2017, we had provisionally priced copper sales at our copper mining operations totaling 344 million pounds of copper (net of intercompany sales and noncontrolling interests) recorded at an average of $2.69 per pound, subject to final pricing over the next several months. We estimate that each $0.05 change in the price realized from the June 30, 2017, provisional price recorded would have an approximate $11 million effect on our 2017 net income attributable to common stock. The LME spot copper price was $2.88 per pound on July 31, 2017.
Treatment Charges. Revenues from our concentrate sales are recorded net of treatment charges. Lower treatment charges in the 2017 periods, compared with the 2016 periods, primarily reflect lower sales volumes at North America and South America copper mines.
Purchased Copper. We purchase copper cathode primarily for processing by our Rod & Refining operations. In addition to higher copper prices, we had higher purchased copper volumes in the 2017 periods (62 million pounds in second-quarter 2017 and 120 million for the first six months of 2017, compared with 43 million pounds in second-quarter 2016 and 70 million pounds for the first six months of 2016).
Atlantic Copper Revenues. Atlantic Copper revenues totaled $400 million in second-quarter 2017 and $858 million for the first six months of 2017, compared with $495 million in second-quarter 2016 and $918 million for the first six months of 2016. Lower revenues in the 2017 periods, compared with the 2016 periods, reflect lower sales volumes mostly associated with a 21-day maintenance turnaround in second-quarter 2017, partly offset by higher copper prices.
Production and Delivery Costs
Consolidated production and delivery costs totaled $2.5 billion in second-quarter 2017, $3.0 billion in second-quarter 2016, $4.7 billion for the first six months of 2017 and $5.5 billion for the first six months of 2016. Production and delivery costs were lower for the second quarter and first six months of 2017, compared to the 2016 periods, primarily reflecting lower costs at oil and gas operations associated with drillship settlements, inventory adjustments and asset impairment charges (which totaled a net credit of $6 million in second-quarter 2017 and $26 million for the first six months of 2017, compared with net charges of $692 million in second-quarter 2016 and $892 million for the first six months of 2016), partly offset by higher costs at Indonesia mining related to net charges at PT-FI associated with workforce reductions ($82 million in second-quarter 2017 and $103 million for the first six months of 2017) and higher maintenance costs at South America copper mines.
Mining Unit Site Production and Delivery Costs. Site production and delivery costs for our copper mining operations primarily include labor, energy and commodity-based inputs, such as sulphuric acid, reagents, liners, tires and explosives. Consolidated unit site production and delivery costs (before net noncash and other costs) for our copper mines averaged $1.64 per pound of copper in second-quarter 2017 and $1.62 for the first six months of 2017, compared with $1.41 per pound in second quarter of 2016 and $1.45 for the first six months of 2016. Higher consolidated unit site production and delivery costs for the 2017 periods, compared with the 2016 periods, primarily reflect lower sales volumes. Refer to “Operations – Unit Net Cash Costs” for further discussion of unit net cash costs associated with our operating divisions and to “Product Revenues and Production Costs” for reconciliations of per pound costs by operating division to production and delivery costs applicable to sales reported in our consolidated financial statements.
Depreciation, Depletion and Amortization
Depreciation will vary under the unit-of-production (UOP) method as a result of changes in sales volumes and the related UOP rates at our individual mines. Consolidated depreciation, depletion and amortization (DD&A) totaled $450 million in second-quarter 2017 and $839 million for the first six months of 2017, compared with $632 million in second-quarter 2016 and $1.3 billion for the first six months of 2016. Lower DD&A in the 2017 periods, compared with the 2016 periods, primarily reflects lower DD&A from oil and gas operations resulting from sales of significant oil and gas properties in 2016.
40
Impairment of Oil and Gas Properties
Under full cost accounting rules, a “ceiling test” is conducted each quarter to review the carrying value of our oil and gas properties for impairment, which resulted in the recognition of impairment charges totaling $291 million for second-quarter 2016 and $4.1 billion for the first six months of 2016.
Selling, General and Administrative Expenses
Consolidated selling, general and administrative expenses totaled $107 million in second-quarter 2017, $160 million in second-quarter 2016, $260 million for the first six months of 2017 and $298 million for the first six months of 2016. Selling, general and administrative expenses include net (credits) charges at our oil and gas operations totaling $(4) million for second-quarter 2017 and $17 million for the first six months of 2017 for contract termination and $37 million in second-quarter 2016 and $39 million or the first six months of 2016 for restructuring.
Consolidated selling, general and administrative expenses were net of capitalized general and administrative expenses at our oil and gas operations totaling $23 million in second-quarter 2016 and $50 million for the first six months of 2016.
Mining Exploration and Research Expenses
Consolidated exploration and research expenses for our mining operations totaled $19 million in second-quarter 2017, $15 million in second-quarter 2016, $34 million for the first six months of 2017 and $33 million for the first six months of 2016. Our mining exploration activities are generally associated with our existing mines and focus on opportunities to expand reserves and resources to support development of additional future production capacity. Exploration results continue to indicate opportunities for significant future potential reserve additions in North America and South America. Exploration spending is expected to approximate $70 million for the year 2017.
Environmental Obligations and Shutdown Costs
Environmental obligation costs reflect net revisions to our long-term environmental obligations, which vary from period to period because of changes to environmental laws and regulations, the settlement of environmental matters and/or circumstances affecting our operations that could result in significant changes in our estimates. Shutdown costs include care-and-maintenance costs and any litigation, remediation or related expenditures associated with closed facilities or operations. Net (credits) charges for environmental obligations and shutdown costs totaled $(19) million in second-quarter 2017, $11 million in second-quarter 2016, $8 million for the first six months of 2017 and $21 million for the first six months of 2016. Refer to Note 9 for discussion of 2017 environmental credits.
Net Gain on Sales of Assets
Net gain on sales of assets totaled $10 million in second-quarter 2017, primarily reflecting an adjustment to assets held for sale, partly offset by an adjustment to the estimated fair value of the potential $150 million in contingent consideration related to the December 2016 onshore California sale, which in accordance with accounting guidelines will continue to be adjusted through December 31, 2020. Net gain on sales of assets totaled $33 million for the first six months of 2017, primarily reflecting adjustments associated with oil and gas transactions and to assets held for sale, partly offset by an adjustment to the estimated fair value of the potential contingent consideration related to the December 2016 onshore California sale.
Net gain on sales of assets totaled $749 million in the second quarter and first six months of 2016, reflecting gains associated with the sales of a 13 percent undivided interest in the Morenci unincorporated joint venture and our interest in the Timok exploration project in Serbia.
Interest Expense, Net
Consolidated interest expense (excluding capitalized interest and interest expense allocated to discontinued operations) totaled $192 million in second-quarter 2017, $218 million in second-quarter 2016, $387 million for the first six months of 2017 and $436 million for the first six months of 2016. Lower net interest expense in the 2017 periods, compared to the 2016 periods, primarily reflects the decrease in total debt.
Capitalized interest varies with the level of expenditures for our development projects and average interest rates on our borrowings and totaled $30 million in second-quarter 2017, $22 million in second-quarter 2016, $58 million for the first six months of 2017 and $49 million for the first six months of 2016.
41
Income Taxes
Following is a summary of the approximate amounts used in the calculation of our consolidated income tax provision from continuing operations for the 2017 and 2016 periods (in millions, except percentages):
Six Months Ended June 30, | ||||||||||||||||||||
2017 | 2016 | |||||||||||||||||||
Incomea | Effective Tax Rate | Income Tax Benefit (Provision) | Income (Loss)a | Effective Tax Rate | Income Tax Benefit (Provision) | |||||||||||||||
U.S. | $ | 61 | (39)% | $ | 24 | b | $ | (535 | ) | (7)% | $ | (39 | ) | b | ||||||
South America | 386 | 41% | (159 | ) | 219 | 38% | (82 | ) | ||||||||||||
Indonesia | 487 | 41% | (202 | ) | 164 | 33% | (54 | ) | ||||||||||||
Impairment of oil and gas properties | — | N/A | — | (4,078 | ) | 38% | 1,543 | |||||||||||||
Valuation allowance, net | — | N/A | — | — | N/A | (1,543 | ) | c | ||||||||||||
Eliminations and other | 17 | N/A | (24 | ) | 89 | N/A | (25 | ) | ||||||||||||
Rate adjustmentd | — | N/A | 1 | — | N/A | 7 | ||||||||||||||
Consolidated FCX | $ | 951 | 38% | e | $ | (360 | ) | $ | (4,141 | ) | (5)% | $ | (193 | ) | ||||||
a. | Represents income (loss) from continuing operations by geographic location before income taxes and equity in affiliated companies’ net (losses) earnings. |
b. | Includes net tax credits of $31 million for the first six months of 2017 associated with anticipated recovery of alternative minimum tax credit carryforwards, and net tax charges of $36 million for the first six months of 2016 associated with net operating loss carryback claims, partly offset by alternative minimum tax credits. |
c. | As a result of the impairment to U.S. oil and gas properties, we recorded tax charges to establish valuation allowances against U.S. federal and state deferred tax assets that will not generate a future benefit. |
d. | In accordance with applicable accounting rules, we adjust our interim provision for income taxes to equal our consolidated tax rate. |
e. | The consolidated effective income tax rate is a function of the combined effective tax rates for the jurisdictions in which we operate. Accordingly, variations in the relative proportions of jurisdictional income result in fluctuations to our consolidated effective income tax rate. Assuming achievement of current sales volume and cost estimates and average prices of $2.65 per pound for copper, $1,250 per ounce for gold and $7.50 per pound for molybdenum for the second half of 2017, we estimate our consolidated effective tax rate related to continuing operations for the year 2017 will approximate 43 percent and would decrease with higher prices. |
Net Income (Loss) from Discontinued Operations
In November 2016, we completed the sale of our interest in TFHL, through which we had an effective 56 percent interest in the Tenke copper and cobalt concessions in the Democratic Republic of Congo. In accordance with accounting guidelines, the results of TFHL have been reported as discontinued operations for all periods presented. Net income from discontinued operations totaled $9 million in second-quarter 2017 and $47 million for the first six months of 2017, which primarily reflected adjustments to the fair value of the potential $120 million contingent consideration related to the sale, which totaled $55 million at June 30, 2017, and in accordance with accounting guidelines will continue to be adjusted through December 31, 2020. Net loss from discontinued operations of $181 million in second-quarter 2016 and $185 million for the first six months of 2016 includes a charge of $177 million for the estimated loss on the sale. Refer to Note 2 for a summary of the components of net income (loss) from discontinued operations.
OPERATIONS
North America Copper Mines
We operate seven open-pit copper mines in North America – Morenci, Bagdad, Safford, Sierrita and Miami in Arizona, and Chino and Tyrone in New Mexico. All of the North America mining operations are wholly owned, except for Morenci.
We record our undivided joint venture interest in Morenci using the proportionate consolidation method. On May 31, 2016, we completed the sale of an additional 13 percent undivided interest in Morenci. As a result of the transaction, our undivided interest in Morenci was prospectively reduced from 85 percent to 72 percent.
The North America copper mines include open-pit mining, sulfide ore concentrating, leaching and solution extraction/electrowinning (SX/EW) operations. A majority of the copper produced at our North America copper
42
mines is cast into copper rod by our Rod & Refining segment. The remainder of our North America copper sales is in the form of copper cathode or copper concentrate, a portion of which is shipped to Atlantic Copper (our wholly owned smelter). Molybdenum concentrate, gold and silver are also produced by certain of our North America copper mines.
Operating and Development Activities. We have significant undeveloped reserves and resources in North America and a portfolio of potential long-term development projects. Future investments will be undertaken based on the results of economic and technical feasibility studies, and are dependent on market conditions. We continue to study opportunities to reduce the capital intensity of our long-term development projects.
Through exploration drilling, we have identified a significant resource at the Lone Star project located near the Safford operation in eastern Arizona. Initial production from the Lone Star oxide ores could begin in 2021 using existing infrastructure to replace oxide production from Safford. We are seeking regulatory approvals for this project and continue to evaluate longer term opportunities available from the significant sulfide potential in the Lone Star/Safford minerals district.
Operating Data. Following is a summary of consolidated operating data for the North America copper mines for the second quarters and first six months of 2017 and 2016:
Three Months Ended June 30, | Six Months Ended June 30, | ||||||||||||||
2017 | 2016 | 2017 | 2016 | ||||||||||||
Operating Data, Net of Joint Venture Interests | |||||||||||||||
Copper (millions of recoverable pounds) | |||||||||||||||
Production | 384 | 469 | 776 | 956 | |||||||||||
Sales, excluding purchases | 408 | 464 | 783 | 967 | |||||||||||
Average realized price per pound | $ | 2.62 | $ | 2.18 | $ | 2.65 | $ | 2.17 | |||||||
Molybdenum (millions of recoverable pounds) | |||||||||||||||
Productiona | 8 | 8 | 17 | 16 | |||||||||||
100% Operating Data | |||||||||||||||
SX/EW operations | |||||||||||||||
Leach ore placed in stockpiles (metric tons per day) | 688,000 | 780,700 | 694,300 | 807,100 | |||||||||||
Average copper ore grade (percent) | 0.29 | 0.33 | 0.28 | 0.32 | |||||||||||
Copper production (millions of recoverable pounds) | 282 | 303 | 559 | 605 | |||||||||||
Mill operations | |||||||||||||||
Ore milled (metric tons per day) | 299,100 | 300,400 | 301,400 | 299,500 | |||||||||||
Average ore grade (percent): | |||||||||||||||
Copper | 0.39 | 0.48 | 0.40 | 0.49 | |||||||||||
Molybdenum | 0.03 | 0.03 | 0.03 | 0.03 | |||||||||||
Copper recovery rate (percent) | 86.7 | 86.6 | 86.6 | 85.6 | |||||||||||
Copper production (millions of recoverable pounds) | 174 | 219 | 360 | 445 | |||||||||||
a. | Refer to “Consolidated Results” for our consolidated molybdenum sales volumes, which include sales of molybdenum produced at the North America copper mines. |
North America’s consolidated copper sales volumes of 408 million pounds in second-quarter 2017 and 783 million pounds for the first six months of 2017 were lower than second-quarter 2016 sales of 464 million pounds and 967 million pounds for the first six months of 2016, primarily reflecting lower ore grades and the impact of the May 2016 sale of an additional interest in Morenci.
North America copper sales are estimated to approximate 1.5 billion pounds for the year 2017, compared with 1.8 billion pounds in 2016.
Unit Net Cash Costs. Unit net cash costs per pound of copper is a measure intended to provide investors with information about the cash-generating capacity of our mining operations expressed on a basis relating to the primary metal product for our respective operations. We use this measure for the same purpose and for monitoring operating performance by our mining operations. This information differs from measures of performance determined in accordance with U.S. GAAP and should not be considered in isolation or as a substitute for measures of
43
performance determined in accordance with U.S. GAAP. This measure is presented by other metals mining companies, although our measure may not be comparable to similarly titled measures reported by other companies.
Gross Profit per Pound of Copper and Molybdenum
The following table summarizes unit net cash costs and gross profit per pound at our North America copper mines for the second quarters and first six months of 2017 and 2016. Refer to “Product Revenues and Production Costs” for an explanation of the “by-product” and “co-product” methods and a reconciliation of unit net cash costs per pound to production and delivery costs applicable to sales reported in our consolidated financial statements.
Three Months Ended June 30, | ||||||||||||||||||||||||
2017 | 2016 | |||||||||||||||||||||||
By- Product Method | Co-Product Method | By- Product Method | Co-Product Method | |||||||||||||||||||||
Copper | Molyb- denuma | Copper | Molyb- denuma | |||||||||||||||||||||
Revenues, excluding adjustments | $ | 2.62 | $ | 2.62 | $ | 8.17 | $ | 2.18 | $ | 2.18 | $ | 5.92 | ||||||||||||
Site production and delivery, before net noncash and other costs shown below | 1.59 | 1.50 | 6.15 | 1.40 | 1.34 | 4.71 | ||||||||||||||||||
By-product credits | (0.16 | ) | — | — | (0.11 | ) | — | — | ||||||||||||||||
Treatment charges | 0.10 | 0.09 | — | 0.11 | 0.10 | — | ||||||||||||||||||
Unit net cash costs | 1.53 | 1.59 | 6.15 | 1.40 | 1.44 | 4.71 | ||||||||||||||||||
DD&A | 0.29 | 0.27 | 0.66 | 0.29 | 0.27 | 0.57 | ||||||||||||||||||
Noncash and other costs, net | 0.05 | 0.05 | 0.05 | 0.05 | 0.05 | 0.08 | ||||||||||||||||||
Total unit costs | 1.87 | 1.91 | 6.86 | 1.74 | 1.76 | 5.36 | ||||||||||||||||||
Revenue adjustments, primarily for pricing on prior period open sales | — | — | — | (0.01 | ) | (0.01 | ) | — | ||||||||||||||||
Gross profit per pound | $ | 0.75 | $ | 0.71 | $ | 1.31 | $ | 0.43 | $ | 0.41 | $ | 0.56 | ||||||||||||
Copper sales (millions of recoverable pounds) | 408 | 408 | 462 | 462 | ||||||||||||||||||||
Molybdenum sales (millions of recoverable pounds)a | 8 | 8 | ||||||||||||||||||||||
Six Months Ended June 30, | ||||||||||||||||||||||||
2017 | 2016 | |||||||||||||||||||||||
By- Product Method | Co-Product Method | By- Product Method | Co-Product Method | |||||||||||||||||||||
Copper | Molyb- denuma | Copper | Molyb- denuma | |||||||||||||||||||||
Revenues, excluding adjustments | $ | 2.65 | $ | 2.65 | $ | 7.56 | $ | 2.17 | $ | 2.17 | $ | 5.61 | ||||||||||||
Site production and delivery, before net noncash and other costs shown below | 1.56 | 1.47 | 5.65 | 1.40 | 1.34 | 4.51 | ||||||||||||||||||
By-product credits | (0.15 | ) | — | — | (0.10 | ) | — | — | ||||||||||||||||
Treatment charges | 0.10 | 0.10 | — | 0.11 | 0.11 | — | ||||||||||||||||||
Unit net cash costs | 1.51 | 1.57 | 5.65 | 1.41 | 1.45 | 4.51 | ||||||||||||||||||
DD&A | 0.30 | 0.28 | 0.59 | 0.29 | 0.27 | 0.55 | ||||||||||||||||||
Noncash and other costs, net | 0.07 | b | 0.07 | 0.06 | 0.05 | 0.05 | 0.02 | |||||||||||||||||
Total unit costs | 1.88 | 1.92 | 6.30 | 1.75 | 1.77 | 5.08 | ||||||||||||||||||
Revenue adjustments, primarily for pricing on prior period open sales | 0.01 | 0.01 | — | — | — | — | ||||||||||||||||||
Gross profit per pound | $ | 0.78 | $ | 0.74 | $ | 1.26 | $ | 0.42 | $ | 0.40 | $ | 0.53 | ||||||||||||
Copper sales (millions of recoverable pounds) | 782 | 782 | 964 | 964 | ||||||||||||||||||||
Molybdenum sales (millions of recoverable pounds)a | 17 | 16 | ||||||||||||||||||||||
a. | Reflects sales of molybdenum produced by certain of the North America copper mines to our molybdenum sales company at market-based pricing. |
b. | Includes $21 million ($0.03 per pound of copper) for other asset impairment charges at Morenci. |
Our North America copper mines have varying cost structures because of differences in ore grades and characteristics, processing costs, by-product credits and other factors. Average unit net cash costs (net of by-product credits) for the North America copper mines of $1.53 per pound of copper in second-quarter 2017 and $1.51 per pound for the first six months of 2017 were higher than unit net cash costs of $1.40 per pound in second-
44
quarter 2016 and $1.41 per pound for the first six months of 2016, primarily reflecting lower sales volumes, partly offset by higher by-product credits.
Because certain assets are depreciated on a straight-line basis, North America’s average unit depreciation rate may vary with asset additions and the level of copper production and sales.
Average unit net cash costs (net of by-product credits) for our North America copper mines are expected to approximate $1.54 per pound of copper for the year 2017, based on achievement of current sales volume and cost estimates and assuming an average molybdenum price of $7.50 per pound for the second half of 2017. North America’s average unit net cash costs for the year 2017 would change by approximately $0.02 per pound for each $2 per pound change in the average price of molybdenum.
South America Mining
We operate two copper mines in South America – Cerro Verde in Peru (in which we own a 53.56 percent interest) and El Abra in Chile (in which we own a 51 percent interest). These operations are consolidated in our financial statements.
South America mining includes open-pit mining, sulfide ore concentrating, leaching and SX/EW operations. Production from our South America mines is sold as copper concentrate or cathode under long-term contracts. Our South America mines also sell a portion of their copper concentrate production to Atlantic Copper. In addition to copper, the Cerro Verde mine produces molybdenum concentrate and silver.
Operating and Development Activities. The Cerro Verde expansion project commenced operations in September 2015 and achieved capacity operating rates during first-quarter 2016. Cerro Verde’s expanded operations benefit from its large-scale, long-lived reserves and cost efficiencies. The project expanded the concentrator facilities from 120,000 metric tons of ore per day to 360,000 metric tons of ore per day.
In the second half of 2015, we adjusted operations at our El Abra mine to reduce mining and stacking rates by approximately 50 percent to achieve lower operating and labor costs, defer capital expenditures and extend the life of the existing operations. El Abra continues to operate at reduced rates.
We continue to evaluate a potential large-scale milling operation at El Abra to process additional sulfide material and to achieve higher recoveries. Exploration results at El Abra indicate a significant sulfide resource, which could potentially support a major mill project. Future investments will depend on technical studies, economic factors and market conditions.
45
Operating Data. Following is a summary of consolidated operating data for our South America mining operations for the second quarters and first six months of 2017 and 2016:
Three Months Ended June 30, | Six Months Ended June 30, | ||||||||||||||
2017 | 2016 | 2017 | 2016 | ||||||||||||
Copper (millions of recoverable pounds) | |||||||||||||||
Production | 300 | 334 | 604 | 669 | |||||||||||
Sales | 287 | 327 | 596 | 650 | |||||||||||
Average realized price per pound | $ | 2.67 | $ | 2.19 | $ | 2.65 | $ | 2.18 | |||||||
Molybdenum (millions of recoverable pounds) | |||||||||||||||
Productiona | 7 | 4 | 13 | 9 | |||||||||||
SX/EW operations | |||||||||||||||
Leach ore placed in stockpiles (metric tons per day) | 152,400 | 170,400 | 139,200 | 155,500 | |||||||||||
Average copper ore grade (percent) | 0.36 | 0.39 | 0.39 | 0.40 | |||||||||||
Copper production (millions of recoverable pounds) | 59 | 82 | 125 | 172 | |||||||||||
Mill operations | |||||||||||||||
Ore milled (metric tons per day) | 347,600 | 352,000 | 343,300 | 345,700 | |||||||||||
Average ore grade (percent): | |||||||||||||||
Copper | 0.44 | 0.42 | 0.44 | 0.43 | |||||||||||
Molybdenum | 0.02 | 0.02 | 0.02 | 0.02 | |||||||||||
Copper recovery rate (percent) | 83.0 | 88.0 | 83.8 | 87.1 | |||||||||||
Copper production (millions of recoverable pounds) | 241 | 252 | 479 | 497 | |||||||||||
a. | Refer to “Consolidated Results” for our consolidated molybdenum sales volumes, which include sales of molybdenum produced at Cerro Verde. |
South America’s consolidated copper sales volumes of 287 million pounds in second-quarter 2017 were lower than second-quarter 2016 sales of 327 million pounds, primarily reflecting lower mining rates, ore grades and recoveries. In addition to lower recoveries, South America’s lower consolidated copper sales volumes of 596 million pounds for the first six months of 2017, compared to 650 million pounds for the first six months of 2016, reflected Cerro Verde’s operations being unfavorably impacted by unusually high rainfall and a 21-day labor strike during first-quarter 2017.
Copper sales from South America mines are expected to approximate 1.2 billion pounds of copper for the year 2017, compared with 1.3 billion pounds of copper in 2016.
Unit Net Cash Costs. Unit net cash costs per pound of copper is a measure intended to provide investors with information about the cash-generating capacity of our mining operations expressed on a basis relating to the primary metal product for our respective operations. We use this measure for the same purpose and for monitoring operating performance by our mining operations. This information differs from measures of performance determined in accordance with U.S. GAAP and should not be considered in isolation or as a substitute for measures of performance determined in accordance with U.S. GAAP. This measure is presented by other metals mining companies, although our measure may not be comparable to similarly titled measures reported by other companies.
46
Gross Profit per Pound of Copper
The following table summarizes unit net cash costs and gross profit per pound of copper at the South America mining operations for the second quarters and first six months of 2017 and 2016. Unit net cash costs per pound of copper are reflected under the by-product and co-product methods as the South America mining operations also had sales of molybdenum and silver. Refer to “Product Revenues and Production Costs” for an explanation of the “by-product” and “co-product” methods and a reconciliation of unit net cash costs per pound to production and delivery costs applicable to sales reported in our consolidated financial statements.
Three Months Ended June 30, | ||||||||||||||||
2017 | 2016 | |||||||||||||||
By-Product Method | Co-Product Method | By-Product Method | Co-Product Method | |||||||||||||
Revenues, excluding adjustments | $ | 2.67 | $ | 2.67 | $ | 2.19 | $ | 2.19 | ||||||||
Site production and delivery, before net noncash and other costs shown below | 1.55 | 1.47 | 1.20 | 1.13 | ||||||||||||
By-product credits | (0.13 | ) | — | (0.12 | ) | — | ||||||||||
Treatment charges | 0.22 | 0.22 | 0.23 | 0.23 | ||||||||||||
Royalty on metals | 0.01 | 0.01 | — | — | ||||||||||||
Unit net cash costs | 1.65 | 1.70 | 1.31 | 1.36 | ||||||||||||
DD&A | 0.44 | 0.41 | 0.41 | 0.39 | ||||||||||||
Noncash and other costs, net | 0.02 | 0.02 | 0.02 | 0.02 | ||||||||||||
Total unit costs | 2.11 | 2.13 | 1.74 | 1.77 | ||||||||||||
Revenue adjustments, primarily for pricing on prior period open sales | (0.05 | ) | (0.05 | ) | (0.04 | ) | (0.04 | ) | ||||||||
Gross profit per pound | $ | 0.51 | $ | 0.49 | $ | 0.41 | $ | 0.38 | ||||||||
Copper sales (millions of recoverable pounds) | 287 | 287 | 327 | 327 | ||||||||||||
Six Months Ended June 30, | |||||||||||||||
2017 | 2016 | ||||||||||||||
By-Product Method | Co-Product Method | By-Product Method | Co-Product Method | ||||||||||||
Revenues, excluding adjustments | $ | 2.65 | $ | 2.65 | $ | 2.18 | $ | 2.18 | |||||||
Site production and delivery, before net noncash and other costs shown below | 1.52 | 1.42 | 1.22 | 1.16 | |||||||||||
By-product credits | (0.16 | ) | — | (0.10 | ) | — | |||||||||
Treatment charges | 0.22 | 0.22 | 0.23 | 0.23 | |||||||||||
Royalty on metals | 0.01 | 0.01 | 0.01 | 0.01 | |||||||||||
Unit net cash costs | 1.59 | 1.65 | 1.36 | 1.40 | |||||||||||
DD&A | 0.43 | 0.40 | 0.41 | 0.39 | |||||||||||
Noncash and other costs, net | 0.02 | 0.02 | 0.02 | 0.02 | |||||||||||
Total unit costs | 2.04 | 2.07 | 1.79 | 1.81 | |||||||||||
Revenue adjustments, primarily for pricing on prior period open sales | 0.07 | 0.07 | 0.01 | 0.01 | |||||||||||
Gross profit per pound | $ | 0.68 | $ | 0.65 | $ | 0.40 | $ | 0.38 | |||||||
Copper sales (millions of recoverable pounds) | 596 | 596 | 650 | 650 | |||||||||||
Our South America mines have varying cost structures because of differences in ore grades and characteristics, processing costs, by-product credits and other factors. Average unit net cash costs (net of by-product credits) of $1.65 per pound of copper in second-quarter 2017 and $1.59 per pound for the first six months of 2017 were higher than unit net cash costs of $1.31 per pound in second-quarter 2016 and $1.36 per pound for the first six months of 2016, primarily reflecting lower sales volumes and higher maintenance costs.
Revenues from Cerro Verde’s concentrate sales are recorded net of treatment charges. Accordingly, treatment charges will vary with Cerro Verde’s sales volumes and the price of copper.
Because certain assets are depreciated on a straight-line basis, South America’s unit depreciation rate may vary with asset additions and the level of copper production and sales.
47
Revenue adjustments primarily result from changes in prices on provisionally priced copper sales recognized in prior periods. Refer to “Consolidated Results – Revenues” for further discussion of adjustments to prior period provisionally priced copper sales.
Average unit net cash costs (net of by-product credits) for our South America mining operations are expected to approximate $1.65 per pound of copper for the year 2017, based on current sales volume and cost estimates and assuming an average price of $7.50 per pound of molybdenum for the second half of 2017.
Indonesia Mining
Indonesia mining includes PT-FI’s Grasberg minerals district, one of the world’s largest copper and gold deposits, in Papua, Indonesia. We own 90.64 percent of PT-FI, including 9.36 percent owned through our wholly owned subsidiary, PT Indocopper Investama.
PT-FI proportionately consolidates an unincorporated joint venture with Rio Tinto plc (Rio Tinto), under which Rio Tinto has a 40 percent interest in certain assets and a 40 percent interest through 2022 in production exceeding specified annual amounts of copper, gold and silver. Refer to Note 3 in our annual report on Form 10-K for the year ended December 31, 2016, for discussion of our joint venture with Rio Tinto.
PT-FI produces copper concentrate that contains significant quantities of gold and silver. Substantially all of PT-FI’s copper concentrate is sold under long-term contracts, and during the first six months of 2017, approximately half of PT-FI’s concentrate production was sold to PT Smelting, its 25-percent-owned smelter and refinery in Gresik, Indonesia.
Regulatory Matters. In January and February 2017, the Indonesian government issued new regulations to address the export of unrefined metals, including copper concentrate and anode slimes, and other matters related to the mining sector. The new regulations permit the continuation of copper concentrate exports for a five-year period through January 2022, subject to various conditions, including conversion from a contract of work to a special operating license (known as an IUPK, which does not provide the same level of fiscal and legal protections as PT-FI’s COW, which remains in effect), a commitment to the completion of smelter construction in five years and payment of export duties to be determined by the Ministry of Finance. In addition, the new regulations enable application for an extension of operating rights five years before expiration of the IUPK and require foreign IUPK holders to divest a 51 percent interest in the licensed entity to Indonesian interests no later than the tenth year of production. Export licenses would be valid for one-year periods, subject to review every six months, depending on smelter construction progress.
Following the issuance of the January and February 2017 regulations and discussions with the Indonesian government, PT-FI advised the government that it was prepared to convert its COW to an IUPK, subject to obtaining an investment stability agreement providing contractual rights with the same level of legal and fiscal certainty enumerated under its COW, and provided that the COW would remain in effect until it is replaced by a mutually satisfactory alternative. PT-FI also committed to commence construction of a new smelter during a five-year time frame, subject to approval of the extension of its long-term operating rights.
In mid-February 2017, pursuant to the COW’s dispute resolution process, PT-FI provided formal notice to the Indonesian government of an impending dispute listing the government's breaches and violations of the COW. PT-FI continues to reserve its rights under these provisions.
As a result of the 2017 regulatory restrictions and uncertainties regarding long-term investment stability, PT-FI
has taken actions to adjust its cost structure, slow investments in its underground development projects and new
smelter, and place certain of its workforce on furlough programs.
In late March 2017, the Indonesian government amended the regulations to enable PT-FI to retain its COW until replaced with an IUPK accompanied by an investment stability agreement, and to grant PT-FI a temporary IUPK through October 10, 2017, that would allow concentrate exports to resume during this period. In April 2017, PT-FI entered into a Memorandum of Understanding with the Indonesian government confirming that the COW would continue to be valid and honored until replaced by a mutually agreed IUPK and investment stability agreement. PT-FI agreed to continue to pay a five percent export duty during this period.
On April 21, 2017, the Indonesian government issued a permit to PT-FI that allows exports to resume for a six-month period, and PT-FI commenced export shipments.
48
PT-FI and the Indonesian government are engaged in active negotiations on the conversion of PT-FI's COW to an IUPK accompanied by an investment stability agreement with the objective of providing a mutually acceptable long-term investment framework. The parties are also discussing requirements for the construction of a new smelter and the government's request for divestment.
PT-FI and the Indonesian government are working cooperatively with the objective of reaching a mutually acceptable long-term resolution during 2017 to secure PT-FI's long-term investments for the benefit of all stakeholders.
We cannot predict whether PT-FI will be successful in reaching a satisfactory agreement on the terms of its long-term mining rights. Refer to “Risk Factors” contained in Part I, Item 1A. of our annual report on Form 10-K for the year ended December 31, 2016, for further discussion of risks associated with our operations in Indonesia.
Operating and Development Activities. PT-FI is currently mining the final phase of the Grasberg open pit, which contains high copper and gold ore grades. PT-FI expects to mine high-grade ore over the next several quarters prior to transitioning to the Grasberg Block Cave underground mine in early 2019.
PT-FI has several projects in the Grasberg minerals district related to the development of its large-scale, long-lived, high-grade underground ore bodies. In aggregate, these underground ore bodies are expected to produce large-scale quantities of copper and gold following the transition from the Grasberg open pit. As a result of regulatory uncertainty, PT-FI has slowed investments in its underground development projects in 2017. Assuming an agreement is reached to support PT-FI’s long-term investment plans, estimated annual capital spending on these projects would average $1.0 billion per year ($0.8 billion per year net to PT-FI) over the next five years. Considering the long-term nature and size of these projects, actual costs could vary from these estimates. In response to market conditions and Indonesian regulatory uncertainty, timing of these expenditures continues to be reviewed. If PT-FI is unable to reach an agreement with the Indonesian government on its long-term mining rights, we intend to reduce or defer investments significantly in our underground development projects and pursue arbitration under PT-FI’s COW.
The following provides additional information on the continued development of the Common Infrastructure project, the Grasberg Block Cave underground mine and the Deep Mill Level Zone (DMLZ) ore body that lies below the Deep Ore Zone (DOZ) underground mine. Our current plans and mineral reserves in Indonesia assume that PT-FI’s long-term mining rights will be extended through 2041, as stated in the COW.
Common Infrastructure and Grasberg Block Cave Mine. In 2004, PT-FI commenced its Common Infrastructure project to provide access to its large undeveloped underground ore bodies located in the Grasberg minerals district through a tunnel system located approximately 400 meters deeper than its existing underground tunnel system. In addition to providing access to our underground ore bodies, the tunnel system will enable PT-FI to conduct future exploration in prospective areas associated with currently identified ore bodies. The tunnel system was completed to the Big Gossan terminal, and the Big Gossan mine was brought into production in 2010. The Big Gossan underground mine is currently on care-and-maintenance. Development of the DMLZ and Grasberg Block Cave underground mines is advancing using the Common Infrastructure project tunnels as access.
The Grasberg Block Cave underground mine accounts for approximately half of our recoverable proven and probable reserves in Indonesia. Production from the Grasberg Block Cave underground mine is expected to commence in early 2019, following the end of mining of the Grasberg open pit. Targeted production rates once the Grasberg Block Cave mining operation reaches full capacity are expected to approximate 130,000-160,000 metric tons of ore per day. PT-FI is reviewing its operating plans to determine the optimum mine plan for the Grasberg Block Cave.
Aggregate mine development capital for the Grasberg Block Cave underground mine and associated Common Infrastructure is expected to approximate $6.3 billion (incurred between 2008 and 2022), with PT-FI’s share totaling approximately $5.8 billion. Aggregate project costs totaling $3.1 billion have been incurred through June 30, 2017, including $121 million during second-quarter 2017. As a result of regulatory uncertainty, PT-FI has slowed investments in its underground development projects in 2017. If PT-FI is unable to reach an agreement with the Indonesian government on its long-term mining rights, we intend to reduce or defer investments significantly in our underground development projects and pursue arbitration under PT-FI’s COW.
49
DMLZ. The DMLZ ore body lies below the DOZ mine at the 2,590-meter elevation and represents the downward continuation of mineralization in the Ertsberg East Skarn system and neighboring Ertsberg porphyry. In September 2015, PT-FI initiated pre-commercial production that represents ore extracted during the development phase for the purpose of obtaining access to the ore body. In June 2017, production from the DMLZ underground mine was impacted by mining-induced seismic activity. Mining-induced seismic activity is not uncommon in block cave mining. To mitigate the impact of these events, PT-FI has adjusted the DMLZ mine plans while it evaluates the appropriate start-up schedule. PT-FI expects DMLZ to ramp up to full capacity of 80,000 metric tons of ore per day in 2021, but at a slower pace than previous estimates.
Drilling efforts continue to determine the extent of the ore body. Aggregate mine development capital costs for the DMLZ underground mine are expected to approximate $3.2 billion (incurred between 2009 and 2021), with PT-FI’s share totaling approximately $1.9 billion. Aggregate project costs totaling $2.0 billion have been incurred through June 30, 2017, including $71 million during second-quarter 2017. As a result of regulatory uncertainty, PT-FI has slowed investments in its underground development projects. If PT-FI is unable to reach an agreement with the Indonesian government on its long-term mining rights, we intend to reduce or defer investments significantly in our underground development projects and pursue arbitration under PT-FI’s COW.
Operating Data. Following is a summary of consolidated operating data for our Indonesia mining operations for the second quarters and first six months of 2017 and 2016:
Three Months Ended June 30, | Six Months Ended June 30, | ||||||||||||||
2017 | 2016 | 2017 | 2016 | ||||||||||||
Operating Data, Net of Joint Venture Interest | |||||||||||||||
Copper (millions of recoverable pounds) | |||||||||||||||
Production | 199 | 208 | 354 | 373 | |||||||||||
Sales | 247 | 196 | 372 | 370 | |||||||||||
Average realized price per pound | $ | 2.67 | $ | 2.20 | $ | 2.64 | $ | 2.17 | |||||||
Gold (thousands of recoverable ounces) | |||||||||||||||
Production | 348 | 158 | 580 | 336 | |||||||||||
Sales | 427 | 151 | 604 | 346 | |||||||||||
Average realized price per ounce | $ | 1,243 | $ | 1,292 | $ | 1,242 | $ | 1,260 | |||||||
100% Operating Data | |||||||||||||||
Ore milled (metric tons per day):a | |||||||||||||||
Grasberg open pit | 88,600 | 110,200 | 71,200 | 108,000 | |||||||||||
DOZ underground mineb | 27,300 | 36,700 | 26,800 | 40,500 | |||||||||||
DMLZ underground mine | 3,800 | 4,900 | 3,500 | 4,500 | |||||||||||
Grasberg Block Cave | 3,800 | 2,600 | 3,200 | 2,400 | |||||||||||
Big Gossan underground mine | — | 1,000 | 800 | 600 | |||||||||||
Total | 123,500 | 155,400 | 105,500 | 156,000 | |||||||||||
Average ore grades: | |||||||||||||||
Copper (percent) | 1.03 | 0.84 | 1.08 | 0.77 | |||||||||||
Gold (grams per metric ton) | 1.16 | 0.48 | 1.17 | 0.50 | |||||||||||
Recovery rates (percent): | |||||||||||||||
Copper | 91.8 | 90.4 | 92.0 | 89.9 | |||||||||||
Gold | 85.3 | 80.0 | 85.1 | 80.3 | |||||||||||
Production: | |||||||||||||||
Copper (millions of recoverable pounds) | 221 | 226 | 393 | 409 | |||||||||||
Gold (thousands of recoverable ounces) | 347 | 174 | 588 | 364 | |||||||||||
a. | Amounts represent the approximate average daily throughput processed at PT-FI’s mill facilities from each producing mine and from development activities that result in metal production. |
b. | Ore milled from the DOZ underground mine is expected to ramp up to 60,000 metric tons of ore per day in 2018. |
Beginning in mid-April 2017, PT-FI experienced a high level of worker absenteeism, which has unfavorably impacted mining and milling rates. During May 2017, a significant number of employees and contractors participated in an illegal strike and did not respond to PT-FI's multiple summons to return to work. As a result, these workers were deemed to have voluntarily resigned pursuant to Indonesian laws and regulations. During second-
50
quarter 2017, PT-FI took steps to mitigate the impacts of worker absenteeism, including producing from available mine and mill stockpiles and selling concentrate in inventory produced in first-quarter 2017. PT-FI is also taking steps to increase its workforce in order to restore normal operating rates.
PT-FI is also evaluating opportunities to mine a section of high-grade ore from the Grasberg open pit in 2018 and 2019 currently planned to be mined in future periods from the Grasberg Block Cave underground mine. These plans are expected to be evaluated through the remainder of 2017.
Indonesia mining’s consolidated sales volumes of 247 million pounds of copper in second-quarter 2017 were higher than sales of 196 million pounds of copper in second-quarter 2016, primarily reflecting the sale of concentrate in inventory and higher ore grades, partly offset by lower mill rates. Indonesia mining’s consolidated sales volumes of 372 million pounds of copper for the first six months of 2017 were slightly higher than sales of 370 million pounds of copper for the first six months of 2016, primarily reflecting higher ore grades, offset by the impact of regulatory restrictions on PT-FI’s concentrate exports from January 12, 2017 though April 21, 2017, as discussed above in “Regulatory Matters.”
Indonesia’s gold sales of 427 thousand ounces in second-quarter 2017 and 604 thousand ounces for the first six months of 2017 were higher than sales of 151 thousand ounces of gold in second-quarter 2016 and 346 thousand ounces for the first six months of 2016, primarily reflecting higher ore grades.
Assuming achieving planned operating rates for the second half of 2017, consolidated sales volumes from Indonesia mining operations are expected to approximate 1.0 billion pounds of copper and 1.6 million ounces of gold for the year 2017, compared with 1.1 billion pounds of copper and 1.1 million ounces of gold for the year 2016. At the Grasberg mine, the sequencing of mining areas with varying ore grades causes fluctuations in quarterly and annual production of copper and gold.
Indonesia mining’s projected sales volumes are dependent on a number of factors, including operational performance, workforce productivity, the timing of shipments and its ability to export copper concentrate.
Unit Net Cash Costs. Unit net cash costs per pound of copper is a measure intended to provide investors with information about the cash-generating capacity of our mining operations expressed on a basis relating to the primary metal product for our respective operations. We use this measure for the same purpose and for monitoring operating performance by our mining operations. This information differs from measures of performance determined in accordance with U.S. GAAP and should not be considered in isolation or as a substitute for measures of performance determined in accordance with U.S. GAAP. This measure is presented by other metals mining companies, although our measure may not be comparable to similarly titled measures reported by other companies.
51
Gross Profit per Pound of Copper and per Ounce of Gold
The following table summarizes the unit net cash costs and gross profit per pound of copper and per ounce of gold at our Indonesia mining operations for the second quarters and first six months of 2017 and 2016. Refer to “Product Revenues and Production Costs” for an explanation of “by-product” and “co-product” methods and a reconciliation of unit net cash costs per pound to production and delivery costs applicable to sales reported in our consolidated financial statements.
Three Months Ended June 30, | |||||||||||||||||||||||
2017 | 2016 | ||||||||||||||||||||||
By-Product Method | Co-Product Method | By-Product Method | Co-Product Method | ||||||||||||||||||||
Copper | Gold | Copper | Gold | ||||||||||||||||||||
Revenues, excluding adjustments | $ | 2.67 | $ | 2.67 | $ | 1,243 | $ | 2.20 | $ | 2.20 | $ | 1,292 | |||||||||||
Site production and delivery, before net noncash and other costs shown below | 1.80 | 0.99 | 459 | 1.77 | 1.20 | 706 | |||||||||||||||||
Gold and silver credits | (2.21 | ) | — | — | (1.05 | ) | — | — | |||||||||||||||
Treatment charges | 0.26 | 0.14 | 67 | 0.29 | 0.20 | 116 | |||||||||||||||||
Export duties | 0.11 | 0.06 | 28 | 0.08 | 0.05 | 32 | |||||||||||||||||
Royalty on metals | 0.17 | 0.09 | 47 | 0.11 | 0.07 | 45 | |||||||||||||||||
Unit net cash costs | 0.13 | 1.28 | 601 | 1.20 | 1.52 | 899 | |||||||||||||||||
DD&A | 0.62 | 0.34 | 158 | 0.48 | 0.33 | 190 | |||||||||||||||||
Noncash and other costs, net | 0.34 | a | 0.18 | 86 | 0.01 | 0.01 | 4 | ||||||||||||||||
Total unit costs | 1.09 | 1.80 | 845 | 1.69 | 1.86 | 1,093 | |||||||||||||||||
Revenue adjustments, primarily for pricing on prior period open sales | (0.03 | ) | (0.03 | ) | 5 | (0.06 | ) | (0.06 | ) | 7 | |||||||||||||
PT Smelting intercompany loss | (0.10 | ) | (0.06 | ) | (26 | ) | (0.03 | ) | (0.02 | ) | (14 | ) | |||||||||||
Gross profit per pound/ounce | $ | 1.45 | $ | 0.78 | $ | 377 | $ | 0.42 | $ | 0.26 | $ | 192 | |||||||||||
Copper sales (millions of recoverable pounds) | 247 | 247 | 196 | 196 | |||||||||||||||||||
Gold sales (thousands of recoverable ounces) | 427 | 151 | |||||||||||||||||||||
Six Months Ended June 30, | |||||||||||||||||||||||
2017 | 2016 | ||||||||||||||||||||||
By-Product Method | Co-Product Method | By-Product Method | Co-Product Method | ||||||||||||||||||||
Copper | Gold | Copper | Gold | ||||||||||||||||||||
Revenues, excluding adjustments | $ | 2.64 | $ | 2.64 | $ | 1,242 | $ | 2.17 | $ | 2.17 | $ | 1,260 | |||||||||||
Site production and delivery, before net noncash and other costs shown below | 1.91 | 1.07 | 504 | 1.99 | 1.27 | 740 | |||||||||||||||||
Gold and silver credits | (2.10 | ) | — | — | (1.27 | ) | — | — | |||||||||||||||
Treatment charges | 0.27 | 0.15 | 71 | 0.30 | 0.20 | 113 | |||||||||||||||||
Export duties | 0.11 | 0.06 | 29 | 0.08 | 0.05 | 29 | |||||||||||||||||
Royalty on metals | 0.17 | 0.10 | 47 | 0.12 | 0.07 | 47 | |||||||||||||||||
Unit net cash costs | 0.36 | 1.38 | 651 | 1.22 | 1.59 | 929 | |||||||||||||||||
DD&A | 0.63 | 0.35 | 167 | 0.47 | 0.30 | 175 | |||||||||||||||||
Noncash and other costs, net | 0.32 | a | 0.18 | 82 | 0.04 | 0.02 | 14 | ||||||||||||||||
Total unit costs | 1.31 | 1.91 | 900 | 1.73 | 1.91 | 1,118 | |||||||||||||||||
Revenue adjustments, primarily for pricing on prior period open sales | 0.11 | 0.11 | 15 | — | — | 48 | |||||||||||||||||
PT Smelting intercompany profit | — | — | 1 | — | — | 2 | |||||||||||||||||
Gross profit per pound/ounce | $ | 1.44 | $ | 0.84 | $ | 358 | $ | 0.44 | $ | 0.26 | $ | 192 | |||||||||||
Copper sales (millions of recoverable pounds) | 372 | 372 | 370 | 370 | |||||||||||||||||||
Gold sales (thousands of recoverable ounces) | 604 | 346 | |||||||||||||||||||||
a. | Includes fixed costs charged directly to production and delivery costs totaling $82 million ($0.33 per pound of copper) for second-quarter 2017 and $103 million ($0.28 per pound of copper) for the first six months of 2017 associated with workforce reductions. |
A significant portion of PT-FI’s costs are fixed and unit costs vary depending on production volumes and other factors. Indonesia’s unit net cash costs (including gold and silver credits) of $0.13 per pound of copper in second-quarter 2017 and $0.36 per pound of copper for the first six months of 2017 were lower than unit net cash costs of
52
$1.20 per pound of copper in second-quarter 2016 and $1.22 per pound of copper for the first six months of 2016, primarily reflecting higher gold and silver credits.
Treatment charges vary with the volume of metals sold and the price of copper, and royalties vary with the volume of metals sold and the prices of copper and gold.
PT-FI’s royalties totaled $43 million in second-quarter 2017, $21 million in second-quarter 2016, $63 million for the first six months of 2017 and $43 million for the first six months of 2016. Export duties totaled $27 million in second-quarter 2017, $16 million in second-quarter 2016, $41 million for the first six months of 2017 and $29 million for the first six months of 2016. As further discussed above in “Regulatory Matters,” PT-FI agreed to continue to pay a five percent export duty.
Higher depreciation rates for the 2017 periods, compared with the 2016 periods, primarily relate to higher amortization of asset retirement costs associated with the revision in estimates at the end of 2016 for an overburden stockpile. Additionally, because certain assets are depreciated on a straight-line basis, PT-FI’s unit depreciation rate varies with the level of copper production and sales.
Revenue adjustments primarily result from changes in prices on provisionally priced copper sales recognized in prior periods. Refer to “Consolidated Results – Revenues” for further discussion of adjustments to prior period provisionally priced copper sales.
PT Smelting intercompany (loss) profit represents the change in the deferral of 25 percent of PT-FI’s profit on sales to PT Smelting. Refer to “Operations – Smelting & Refining” for further discussion.
Assuming an average gold price of $1,250 per ounce for the second half of 2017 and achievement of current sales volume and cost estimates, unit net cash costs (net of gold and silver credits) for Indonesia mining are expected to approximate $0.13 per pound of copper for the year 2017. Indonesia mining’s unit net cash costs for the year 2017 would change by approximately $0.05 per pound for each $50 per ounce change in the average price of gold. Because of the fixed nature of a large portion of Indonesia’s costs, unit costs vary from quarter to quarter depending on copper and gold volumes.
Molybdenum Mines
We have two wholly owned molybdenum mines in North America – the Henderson underground mine and the Climax open-pit mine, both in Colorado. The Henderson and Climax mines produce high-purity, chemical-grade molybdenum concentrate, which is typically further processed into value-added molybdenum chemical products. The majority of the molybdenum concentrate produced at the Henderson and Climax mines, as well as from our North America and South America copper mines, is processed at our own conversion facilities.
Operating and Development Activities. In response to market conditions, the Henderson molybdenum mine continues to operate at reduced rates. Production from the Molybdenum mines totaled 8 million pounds of molybdenum in second-quarter 2017, 7 million pounds in second-quarter 2016, 16 million pounds for the first six months of 2017 and 14 million pounds for the first six months of 2016. Refer to “Consolidated Results” for our consolidated molybdenum operating data, which includes sales of molybdenum produced at our Molybdenum mines, and from our North America and South America copper mines, and refer to “Outlook” for projected consolidated molybdenum sales volumes.
Unit Net Cash Costs Per Pound of Molybdenum. Unit net cash costs per pound of molybdenum is a measure intended to provide investors with information about the cash-generating capacity of our mining operations expressed on a basis relating to the primary metal product for our respective operations. We use this measure for the same purpose and for monitoring operating performance by our mining operations. This information differs from measures of performance determined in accordance with U.S. GAAP and should not be considered in isolation or as a substitute for measures of performance determined in accordance with U.S. GAAP. This measure is presented by other metals mining companies, although our measure may not be comparable to similarly titled measures reported by other companies.
Average unit net cash costs for our Molybdenum mines of $7.81 per pound of molybdenum in second-quarter 2017 approximated second-quarter 2016 unit net cash costs of $7.80 per pound. Average unit net cash costs of $7.46 per pound for the first six months of 2017 were lower than $7.61 per pound for the first six months of 2016, primarily reflecting higher volumes. Assuming achievement of current sales volume and cost estimates, we estimate unit net
53
cash costs for the Molybdenum mines are expected to average $7.85 per pound of molybdenum for the year 2017. Refer to “Product Revenues and Production Costs” for a reconciliation of unit net cash costs per pound to production and delivery costs applicable to sales reported in our consolidated financial statements.
Smelting and Refining
We wholly own and operate a smelter in Arizona (Miami smelter) and a smelter and refinery in Spain (Atlantic Copper). Additionally, PT-FI owns 25 percent of a smelter and refinery in Gresik, Indonesia (PT Smelting). Treatment charges for smelting and refining copper concentrate consist of a base rate per pound of copper and per ounce of gold and are generally fixed. Treatment charges represent a cost to our mining operations and income to Atlantic Copper and PT Smelting. Thus, higher treatment charges benefit our smelter operations and adversely affect our mining operations. Our North America copper mines are less significantly affected by changes in treatment charges because these operations are largely integrated with our Miami smelter. Through this form of downstream integration, we are assured placement of a significant portion of our concentrate production.
Atlantic Copper smelts and refines copper concentrate and markets refined copper and precious metals in slimes. During the first six months of 2017, Atlantic Copper’s concentrate purchases from our copper mining operations included 18 percent from our North America copper mines and 14 percent from South America mining, with the remainder purchased from third parties.
In March 2017, PT Smelting’s anode slimes export license was renewed through March 1, 2018. PT-FI’s contract with PT Smelting provides for PT-FI to supply 100 percent of the copper concentrate requirements (subject to a minimum or maximum rate) necessary for PT Smelting to produce 205,000 metric tons of copper annually on a priority basis. PT-FI may also sell copper concentrate to PT Smelting at market rates for quantities in excess of 205,000 metric tons of copper annually. During the first six months of 2017, PT-FI supplied approximately 96 percent of PT Smelting’s concentrate requirements. An extension of the minimum and maximum treatment charge rates through April 2020 was finalized in April 2017, and has been approved by the Indonesian government.
We defer recognizing profits on sales from our mining operations to Atlantic Copper and on 25 percent of PT-FI’s sales to PT Smelting until final sales to third parties occur. Changes in these deferrals attributable to variability in intercompany volumes resulted in net reductions to net income attributable to common stock of $51 million in second-quarter 2017, $13 million for second-quarter 2016, $24 million for the first six months of 2017 and $11 million for the first six months of 2016. Our net deferred profits on our inventories at Atlantic Copper and PT Smelting to be recognized in future periods’ net income attributable to common stock from continuing operations totaled $68 million at June 30, 2017. Quarterly variations in ore grades, the timing of intercompany shipments and changes in product prices will result in variability in our net deferred profits and quarterly earnings.
CAPITAL RESOURCES AND LIQUIDITY
Our consolidated operating cash flows vary with sales volumes, prices realized from copper, gold and molybdenum sales, production costs, income taxes, other working capital changes and other factors. During 2016, we took actions to restore our balance sheet strength through a combination of asset sale transactions, cash flow from operations and capital market transactions. We believe that we have a high-quality portfolio of long-lived copper assets positioned to generate long-term value. We are pursuing opportunities to enhance our mines’ net present values, and we continue to advance studies for future development of our copper resources, the timing of which will be dependent on market conditions.
Cash
Following is a summary of the U.S. and international components of consolidated cash and cash equivalents available to the parent company at June 30, 2017, net of noncontrolling interests’ share, taxes and other costs (in billions):
Cash at domestic companies | $ | 3.8 | |
Cash at international operations | 0.9 | ||
Total consolidated cash and cash equivalents | 4.7 | ||
Noncontrolling interests’ share | (0.2 | ) | |
Cash, net of noncontrolling interests’ share | 4.5 | ||
Withholding taxes and other | (0.1 | ) | |
Net cash available | $ | 4.4 | |
54
Cash held at our international operations is generally used to support our foreign operations’ capital expenditures, operating expenses, working capital and other tax payments, or other cash needs. Management believes that
sufficient liquidity is available in the U.S. from cash balances and availability from our revolving credit facility and uncommitted lines of credit. We have not elected to permanently reinvest earnings from our foreign subsidiaries, and we have recorded deferred tax liabilities for foreign earnings that are available to be repatriated to the U.S. From time to time, our foreign subsidiaries distribute earnings to the U.S. through dividends that are subject to applicable withholding taxes and noncontrolling interests’ share.
Debt
Following is a summary of our total debt and the related weighted-average interest rates at June 30, 2017 (in billions, except percentages):
Weighted- | |||||
Average | |||||
Interest Rate | |||||
Senior Notes | $ | 13.9 | 4.4% | ||
Cerro Verde credit facility | 1.5 | 3.1% | |||
Total debt | $ | 15.4 | 4.3% | ||
In June 2017, the Cerro Verde credit facility was amended to increase the commitment by $225 million to $1.5 billion, modify the amortization schedule and to extend the maturity date to June 2022. All other terms, including the interest rates, remain the same. Refer to Note 6 for further discussion.
At June 30, 2017, we had no borrowings, $37 million in letters of credit issued and availability of $3.5 billion under our revolving credit facility.
Operating Activities
We generated consolidated operating cash flows of $1.8 billion (including $322 million in working capital sources and changes in tax payments) for the first six months of 2017 and $1.6 billion (including $466 million for working capital sources and changes in tax payments) for the first six months of 2016.
Subject to future commodity prices for copper, gold and molybdenum, we expect estimated consolidated operating cash flows for the year 2017, plus available cash and availability under our credit facility and uncommitted lines of credit, to be sufficient to fund our budgeted capital expenditures, scheduled debt maturities, noncontrolling interest distributions and other cash requirements for the year. Refer to “Outlook” for further discussion of projected operating cash flows for the year 2017, and to “Risk Factors,” contained in Part I, Item 1A. of our annual report on Form 10-K for the year ended December 31, 2016, for discussion of regulatory matters in Indonesia, which could have a significant impact on future results.
Investing Activities
Capital Expenditures. Capital expenditures, including capitalized interest, totaled $706 million for the first six months of 2017, including approximately $420 million for major mining projects. Capital expenditures, including capitalized interest, totaled $1.8 billion for the first six months of 2016, consisting of $0.9 billion for mining operations (including approximately $0.7 billion for major projects) and $0.9 billion for oil and gas operations.
Lower capital expenditures for the first six months of 2017, compared with the first six months of 2016, primarily reflect a decrease in oil and gas activities as a result of the sales of significant oil and gas properties in 2016 and a decrease in major mining projects associated with the completion of the Cerro Verde expansion. Refer to “Outlook” for further discussion of projected capital expenditures for the year 2017.
Dispositions. During second-quarter 2016, we completed asset sales, including the $1.0 billion sale of an additional 13 percent undivided interest in Morenci, the sale of an interest in the Timok exploration project in Serbia and the sale of certain oil and gas royalty interests.
Financing Activities
Debt Transactions. Net repayments of debt for the first six months of 2017 totaled $644 million primarily for the repayment of our 2.15% Senior Notes and the repayment of Cerro Verde’s shareholder loans, partly offset by the additional borrowings on Cerro Verde’s credit facility.
55
Net repayments of debt for the first six months of 2016 totaled $838 million primarily for $568 million to repay the balance of our term loan and the retirement of $268 million of our senior notes through a series of privately negotiated transactions.
Dividends. The Board of Directors (Board) suspended our annual common stock dividend in December 2015. The declaration of dividends is at the discretion of our Board and will depend upon our financial results, cash requirements, future prospects and other factors deemed relevant by our Board.
Common stock dividends of $2 million for the first six months of 2017 and $5 million for the first six months of 2016 related to accumulated dividends paid for vested stock-based compensation.
Cash dividends paid to noncontrolling interests totaled $39 million for the first six months of 2017 and 2016. These payments will vary based on the operating results and cash requirements of our consolidated subsidiaries.
CONTRACTUAL OBLIGATIONS
There have been no material changes in our contractual obligations since December 31, 2016. Refer to Part II, Items 7. and 7A. in our annual report on Form 10-K for the year ended December 31, 2016, for information regarding our contractual obligations.
CONTINGENCIES
Environmental and Asset Retirement Obligations
Our current and historical operating activities are subject to stringent laws and regulations governing the protection of the environment. We perform a comprehensive annual review of our environmental and asset retirement obligations and also review changes in facts and circumstances associated with these obligations at least quarterly. Other than as disclosed in Note 9, there have been no material changes to our environmental and asset retirement obligations since December 31, 2016. Updated cost assumptions, including increases and decreases to cost estimates, changes in the anticipated scope and timing of remediation activities, and settlement of environmental matters may result in additional revisions to certain of our environmental obligations. Refer to Note 12 in our annual report on Form 10-K for the year ended December 31, 2016, for further information regarding our environmental and asset retirement obligations.
Litigation and Other Contingencies
Other than as discussed in Note 9, there have been no material changes to our contingencies associated with legal proceedings and other matters since December 31, 2016. Refer to Note 12 and “Legal Proceedings” contained in Part I, Item 3. of our annual report on Form 10-K for the year ended December 31, 2016, for further information regarding legal proceedings and other matters.
NEW ACCOUNTING STANDARDS
Refer to Note 12 for a summary of recently adopted accounting standards.
56
PRODUCT REVENUES AND PRODUCTION COSTS
Mining Product Revenues and Unit Net Cash Cost
Unit net cash costs per pound of copper and molybdenum are measures intended to provide investors with information about the cash-generating capacity of our mining operations expressed on a basis relating to the primary metal product for the respective operations. We use this measure for the same purpose and for monitoring operating performance by our mining operations. This information differs from measures of performance determined in accordance with U.S. GAAP and should not be considered in isolation or as a substitute for measures of performance determined in accordance with U.S. GAAP. These measures are presented by other metals mining companies, although our measures may not be comparable to similarly titled measures reported by other companies.
We present gross profit per pound of copper in the following tables using both a “by-product” method and a “co-product” method. We use the by-product method in our presentation of gross profit per pound of copper because (i) the majority of our revenues are copper revenues, (ii) we mine ore, which contains copper, gold, molybdenum and other metals, (iii) it is not possible to specifically assign all of our costs to revenues from the copper, gold, molybdenum and other metals we produce and (iv) it is the method used by our management and our Board to monitor our mining operations and to compare mining operations in certain industry publications. In the co-product method presentations, shared costs are allocated to the different products based on their relative revenue values, which will vary to the extent our metals sales volumes and realized prices change.
We show revenue adjustments for prior period open sales as a separate line item. Because these adjustments do not result from current period sales, these amounts have been reflected separately from revenues on current period
sales. Noncash and other costs, which are removed from site production and delivery costs in the calculation of unit
net cash costs, consist of items such as stock-based compensation costs, start-up costs, inventory adjustments,
long-lived asset impairments, restructuring and/or unusual charges. As discussed above, gold, molybdenum and
other metal revenues at copper mines are reflected as credits against site production and delivery costs in the by-product method. The following schedules are presentations under both the by-product and co-product methods
together with reconciliations to amounts reported in our consolidated financial statements.
57
North America Copper Mines Product Revenues, Production Costs and Unit Net Cash Costs
Three Months Ended June 30, 2017 | |||||||||||||||||||||
(In millions) | By-Product | Co-Product Method | |||||||||||||||||||
Method | Copper | Molybdenuma | Otherb | Total | |||||||||||||||||
Revenues, excluding adjustments | $ | 1,068 | $ | 1,068 | $ | 63 | $ | 23 | $ | 1,154 | |||||||||||
Site production and delivery, before net noncash and other costs shown below | 650 | 610 | 47 | 14 | 671 | ||||||||||||||||
By-product credits | (65 | ) | — | — | — | — | |||||||||||||||
Treatment charges | 40 | 38 | — | 2 | 40 | ||||||||||||||||
Net cash costs | 625 | 648 | 47 | 16 | 711 | ||||||||||||||||
DD&A | 117 | 110 | 5 | 2 | 117 | ||||||||||||||||
Noncash and other costs, net | 19 | 18 | 1 | — | 19 | ||||||||||||||||
Total costs | 761 | 776 | 53 | 18 | 847 | ||||||||||||||||
Revenue adjustments, primarily for pricing on prior period open sales | (2 | ) | (2 | ) | — | — | (2 | ) | |||||||||||||
Gross profit | $ | 305 | $ | 290 | $ | 10 | $ | 5 | $ | 305 | |||||||||||
Copper sales (millions of recoverable pounds) | 408 | 408 | |||||||||||||||||||
Molybdenum sales (millions of recoverable pounds)a | 8 | ||||||||||||||||||||
Gross profit per pound of copper/molybdenum: | |||||||||||||||||||||
Revenues, excluding adjustments | $ | 2.62 | $ | 2.62 | $ | 8.17 | |||||||||||||||
Site production and delivery, before net noncash and other costs shown below | 1.59 | 1.50 | 6.15 | ||||||||||||||||||
By-product credits | (0.16 | ) | — | — | |||||||||||||||||
Treatment charges | 0.10 | 0.09 | — | ||||||||||||||||||
Unit net cash costs | 1.53 | 1.59 | 6.15 | ||||||||||||||||||
DD&A | 0.29 | 0.27 | 0.66 | ||||||||||||||||||
Noncash and other costs, net | 0.05 | 0.05 | 0.05 | ||||||||||||||||||
Total unit costs | 1.87 | 1.91 | 6.86 | ||||||||||||||||||
Revenue adjustments, primarily for pricing on prior period open sales | — | — | — | ||||||||||||||||||
Gross profit per pound | $ | 0.75 | $ | 0.71 | $ | 1.31 | |||||||||||||||
Reconciliation to Amounts Reported | |||||||||||||||||||||
(In millions) | Revenues | Production and Delivery | DD&A | ||||||||||||||||||
Totals presented above | $ | 1,154 | $ | 671 | $ | 117 | |||||||||||||||
Treatment charges | (19 | ) | 21 | — | |||||||||||||||||
Noncash and other costs, net | — | 19 | — | ||||||||||||||||||
Revenue adjustments, primarily for pricing on prior period open sales | (2 | ) | — | — | |||||||||||||||||
Eliminations and other | 15 | 14 | 1 | ||||||||||||||||||
North America copper mines | 1,148 | 725 | 118 | ||||||||||||||||||
Other miningc | 3,323 | 2,524 | 307 | ||||||||||||||||||
Corporate, other & eliminations | (760 | ) | (754 | ) | 25 | ||||||||||||||||
As reported in FCX’s consolidated financial statements | $ | 3,711 | $ | 2,495 | $ | 450 | |||||||||||||||
a. | Reflects sales of molybdenum produced by certain of the North America copper mines to our molybdenum sales company at market-based pricing. |
b. | Includes gold and silver product revenues and production costs. |
c. | Represents the combined total for our other mining operations, including South America mining, Indonesia mining, Molybdenum mines, Rod & Refining and Atlantic Copper Smelting & Refining, as presented in Note 10. |
58
North America Copper Mines Product Revenues, Production Costs and Unit Net Cash Costs
Three Months Ended June 30, 2016 | |||||||||||||||||||
(In millions) | By-Product | Co-Product Method | |||||||||||||||||
Method | Copper | Molybdenuma | Otherb | Total | |||||||||||||||
Revenues, excluding adjustments | $ | 1,010 | $ | 1,010 | $ | 50 | $ | 20 | $ | 1,080 | |||||||||
Site production and delivery, before net noncash and other costs shown below | 647 | 617 | 39 | 11 | 667 | ||||||||||||||
By-product credits | (50 | ) | — | — | — | — | |||||||||||||
Treatment charges | 49 | 47 | — | 2 | 49 | ||||||||||||||
Net cash costs | 646 | 664 | 39 | 13 | 716 | ||||||||||||||
DD&A | 134 | 127 | 5 | 2 | 134 | ||||||||||||||
Noncash and other costs, net | 22 | 21 | 1 | — | 22 | ||||||||||||||
Total costs | 802 | 812 | 45 | 15 | 872 | ||||||||||||||
Revenue adjustments, primarily for pricing on prior period open sales | (7 | ) | (7 | ) | — | — | (7 | ) | |||||||||||
Gross profit | $ | 201 | $ | 191 | $ | 5 | $ | 5 | $ | 201 | |||||||||
Copper sales (millions of recoverable pounds) | 462 | 462 | |||||||||||||||||
Molybdenum sales (millions of recoverable pounds)a | 8 | ||||||||||||||||||
Gross profit per pound of copper/molybdenum: | |||||||||||||||||||
Revenues, excluding adjustments | $ | 2.18 | $ | 2.18 | $ | 5.92 | |||||||||||||
Site production and delivery, before net noncash and other costs shown below | 1.40 | 1.34 | 4.71 | ||||||||||||||||
By-product credits | (0.11 | ) | — | — | |||||||||||||||
Treatment charges | 0.11 | 0.10 | — | ||||||||||||||||
Unit net cash costs | 1.40 | 1.44 | 4.71 | ||||||||||||||||
DD&A | 0.29 | 0.27 | 0.57 | ||||||||||||||||
Noncash and other costs, net | 0.05 | 0.05 | 0.08 | ||||||||||||||||
Total unit costs | 1.74 | 1.76 | 5.36 | ||||||||||||||||
Revenue adjustments, primarily for pricing on prior period open sales | (0.01 | ) | (0.01 | ) | — | ||||||||||||||
Gross profit per pound | $ | 0.43 | $ | 0.41 | $ | 0.56 | |||||||||||||
Reconciliation to Amounts Reported | |||||||||||||||||||
(In millions) | Revenues | Production and Delivery | DD&A | ||||||||||||||||
Totals presented above | $ | 1,080 | $ | 667 | $ | 134 | |||||||||||||
Treatment charges | (24 | ) | 25 | — | |||||||||||||||
Noncash and other costs, net | — | 22 | — | ||||||||||||||||
Revenue adjustments, primarily for pricing on prior period open sales | (7 | ) | — | — | |||||||||||||||
Eliminations and other | 11 | 12 | — | ||||||||||||||||
North America copper mines | 1,060 | 726 | 134 | ||||||||||||||||
Other miningc | 2,674 | 2,197 | 256 | ||||||||||||||||
Corporate, other & eliminations | (400 | ) | 33 | 242 | |||||||||||||||
As reported in FCX’s consolidated financial statements | $ | 3,334 | $ | 2,956 | $ | 632 | |||||||||||||
a. | Reflects sales of molybdenum produced by certain of the North America copper mines to our molybdenum sales company at market-based pricing. |
b. | Includes gold and silver product revenues and production costs. |
c. | Represents the combined total for our other mining operations, including South America mining, Indonesia mining, Molybdenum mines, Rod & Refining and Atlantic Copper Smelting & Refining, as presented in Note 10. |
59
North America Copper Mines Product Revenues, Production Costs and Unit Net Cash Costs
Six Months Ended June 30, 2017 | |||||||||||||||||||||
(In millions) | By-Product | Co-Product Method | |||||||||||||||||||
Method | Copper | Molybdenuma | Otherb | Total | |||||||||||||||||
Revenues, excluding adjustments | $ | 2,072 | $ | 2,072 | $ | 122 | $ | 43 | $ | 2,237 | |||||||||||
Site production and delivery, before net noncash | |||||||||||||||||||||
and other costs shown below | 1,218 | 1,146 | 91 | 24 | 1,261 | ||||||||||||||||
By-product credits | (122 | ) | — | — | — | — | |||||||||||||||
Treatment charges | 82 | 79 | — | 3 | 82 | ||||||||||||||||
Net cash costs | 1,178 | 1,225 | 91 | 27 | 1,343 | ||||||||||||||||
DD&A | 233 | 219 | 10 | 4 | 233 | ||||||||||||||||
Noncash and other costs, net | 53 | c | 52 | 1 | — | 53 | |||||||||||||||
Total costs | 1,464 | 1,496 | 102 | 31 | 1,629 | ||||||||||||||||
Revenue adjustments, primarily for pricing | |||||||||||||||||||||
on prior period open sales | 4 | 4 | — | — | 4 | ||||||||||||||||
Gross profit | $ | 612 | $ | 580 | $ | 20 | $ | 12 | $ | 612 | |||||||||||
Copper sales (millions of recoverable pounds) | 782 | 782 | |||||||||||||||||||
Molybdenum sales (millions of recoverable pounds)a | 17 | ||||||||||||||||||||
Gross profit per pound of copper/molybdenum: | |||||||||||||||||||||
Revenues, excluding adjustments | $ | 2.65 | $ | 2.65 | $ | 7.56 | |||||||||||||||
Site production and delivery, before net noncash | |||||||||||||||||||||
and other costs shown below | 1.56 | 1.47 | 5.65 | ||||||||||||||||||
By-product credits | (0.15 | ) | — | — | |||||||||||||||||
Treatment charges | 0.10 | 0.10 | — | ||||||||||||||||||
Unit net cash costs | 1.51 | 1.57 | 5.65 | ||||||||||||||||||
DD&A | 0.30 | 0.28 | 0.59 | ||||||||||||||||||
Noncash and other costs, net | 0.07 | c | 0.07 | 0.06 | |||||||||||||||||
Total unit costs | 1.88 | 1.92 | 6.30 | ||||||||||||||||||
Revenue adjustments, primarily for pricing | |||||||||||||||||||||
on prior period open sales | 0.01 | 0.01 | — | ||||||||||||||||||
Gross profit per pound | $ | 0.78 | $ | 0.74 | $ | 1.26 | |||||||||||||||
Reconciliation to Amounts Reported | |||||||||||||||||||||
(In millions) | |||||||||||||||||||||
Production | |||||||||||||||||||||
Revenues | and Delivery | DD&A | |||||||||||||||||||
Totals presented above | $ | 2,237 | $ | 1,261 | $ | 233 | |||||||||||||||
Treatment charges | (28 | ) | 54 | — | |||||||||||||||||
Noncash and other costs, net | — | 53 | — | ||||||||||||||||||
Revenue adjustments, primarily for pricing | |||||||||||||||||||||
on prior period open sales | 4 | — | — | ||||||||||||||||||
Eliminations and other | 30 | 30 | 1 | ||||||||||||||||||
North America copper mines | 2,243 | 1,398 | 234 | ||||||||||||||||||
Other miningd | 6,361 | 4,868 | 551 | ||||||||||||||||||
Corporate, other & eliminations | (1,552 | ) | (1,571 | ) | 54 | ||||||||||||||||
As reported in FCX’s consolidated financial statements | $ | 7,052 | $ | 4,695 | $ | 839 | |||||||||||||||
a. | Reflects sales of molybdenum produced by certain of the North America copper mines to our molybdenum sales company at market-based pricing. |
b. | Includes gold and silver product revenues and production costs. |
c. | Includes $21 million ($0.03 per pound of copper) for asset impairment charges at Morenci. |
d. | Represents the combined total for our other mining operations, including South America mining, Indonesia mining, Molybdenum mines, Rod & Refining and Atlantic Copper Smelting & Refining, as presented in Note 10. |
60
North America Copper Mines Product Revenues, Production Costs and Unit Net Cash Costs
Six Months Ended June 30, 2016 | |||||||||||||||||||||
(In millions) | By-Product | Co-Product Method | |||||||||||||||||||
Method | Copper | Molybdenuma | Otherb | Total | |||||||||||||||||
Revenues, excluding adjustments | $ | 2,092 | $ | 2,092 | $ | 90 | $ | 41 | $ | 2,223 | |||||||||||
Site production and delivery, before net noncash | |||||||||||||||||||||
and other costs shown below | 1,349 | 1,295 | 72 | 21 | 1,388 | ||||||||||||||||
By-product credits | (92 | ) | — | — | — | — | |||||||||||||||
Treatment charges | 103 | 99 | — | 4 | 103 | ||||||||||||||||
Net cash costs | 1,360 | 1,394 | 72 | 25 | 1,491 | ||||||||||||||||
DD&A | 277 | 263 | 9 | 5 | 277 | ||||||||||||||||
Noncash and other costs, net | 48 | 48 | — | — | 48 | ||||||||||||||||
Total costs | 1,685 | 1,705 | 81 | 30 | 1,816 | ||||||||||||||||
Revenue adjustments, primarily for pricing | |||||||||||||||||||||
on prior period open sales | (1 | ) | (1 | ) | — | — | (1 | ) | |||||||||||||
Gross profit | $ | 406 | $ | 386 | $ | 9 | $ | 11 | $ | 406 | |||||||||||
Copper sales (millions of recoverable pounds) | 964 | 964 | |||||||||||||||||||
Molybdenum sales (millions of recoverable pounds)a | 16 | ||||||||||||||||||||
Gross profit per pound of copper/molybdenum: | |||||||||||||||||||||
Revenues, excluding adjustments | $ | 2.17 | $ | 2.17 | $ | 5.61 | |||||||||||||||
Site production and delivery, before net noncash | |||||||||||||||||||||
and other costs shown below | 1.40 | 1.34 | 4.51 | ||||||||||||||||||
By-product credits | (0.10 | ) | — | — | |||||||||||||||||
Treatment charges | 0.11 | 0.11 | — | ||||||||||||||||||
Unit net cash costs | 1.41 | 1.45 | 4.51 | ||||||||||||||||||
DD&A | 0.29 | 0.27 | 0.55 | ||||||||||||||||||
Noncash and other costs, net | 0.05 | 0.05 | 0.02 | ||||||||||||||||||
Total unit costs | 1.75 | 1.77 | 5.08 | ||||||||||||||||||
Revenue adjustments, primarily for pricing | |||||||||||||||||||||
on prior period open sales | — | — | — | ||||||||||||||||||
Gross profit per pound | $ | 0.42 | $ | 0.40 | $ | 0.53 | |||||||||||||||
Reconciliation to Amounts Reported | |||||||||||||||||||||
(In millions) | Production | ||||||||||||||||||||
Revenues | and Delivery | DD&A | |||||||||||||||||||
Totals presented above | $ | 2,223 | $ | 1,388 | $ | 277 | |||||||||||||||
Treatment charges | (48 | ) | 55 | — | |||||||||||||||||
Noncash and other costs, net | — | 48 | — | ||||||||||||||||||
Revenue adjustments, primarily for pricing | |||||||||||||||||||||
on prior period open sales | (1 | ) | — | — | |||||||||||||||||
Eliminations and other | 22 | 23 | 1 | ||||||||||||||||||
North America copper mines | 2,196 | 1,514 | 278 | ||||||||||||||||||
Other miningc | 5,348 | 4,416 | 498 | ||||||||||||||||||
Corporate, other & eliminations | (968 | ) | (475 | ) | 518 | ||||||||||||||||
As reported in FCX’s consolidated financial statements | $ | 6,576 | $ | 5,455 | $ | 1,294 | |||||||||||||||
a. | Reflects sales of molybdenum produced by certain of the North America copper mines to our molybdenum sales company at market-based pricing. |
b. | Includes gold and silver product revenues and production costs. |
c. | Represents the combined total for our other mining operations, including South America mining, Indonesia mining, Molybdenum mines, Rod & Refining and Atlantic Copper Smelting & Refining, as presented in Note 10. |
61
South America Mining Product Revenues, Production Costs and Unit Net Cash Costs
Three Months Ended June 30, 2017 | ||||||||||||||||
(In millions) | By-Product | Co-Product Method | ||||||||||||||
Method | Copper | Othera | Total | |||||||||||||
Revenues, excluding adjustments | $ | 766 | $ | 766 | $ | 47 | $ | 813 | ||||||||
Site production and delivery, before net noncash | ||||||||||||||||
and other costs shown below | 448 | 424 | 34 | 458 | ||||||||||||
By-product credits | (37 | ) | — | — | — | |||||||||||
Treatment charges | 63 | 63 | — | 63 | ||||||||||||
Royalty on metals | 2 | 2 | — | 2 | ||||||||||||
Net cash costs | 476 | 489 | 34 | 523 | ||||||||||||
DD&A | 125 | 118 | 7 | 125 | ||||||||||||
Noncash and other costs, net | 5 | 5 | — | 5 | ||||||||||||
Total costs | 606 | 612 | 41 | 653 | ||||||||||||
Revenue adjustments, primarily for pricing | ||||||||||||||||
on prior period open sales | (14 | ) | (14 | ) | — | (14 | ) | |||||||||
Gross profit | $ | 146 | $ | 140 | $ | 6 | $ | 146 | ||||||||
Copper sales (millions of recoverable pounds) | 287 | 287 | ||||||||||||||
Gross profit per pound of copper: | ||||||||||||||||
Revenues, excluding adjustments | $ | 2.67 | $ | 2.67 | ||||||||||||
Site production and delivery, before net noncash | ||||||||||||||||
and other costs shown below | 1.55 | 1.47 | ||||||||||||||
By-product credits | (0.13 | ) | — | |||||||||||||
Treatment charges | 0.22 | 0.22 | ||||||||||||||
Royalty on metals | 0.01 | 0.01 | ||||||||||||||
Unit net cash costs | 1.65 | 1.70 | ||||||||||||||
DD&A | 0.44 | 0.41 | ||||||||||||||
Noncash and other costs, net | 0.02 | 0.02 | ||||||||||||||
Total unit costs | 2.11 | 2.13 | ||||||||||||||
Revenue adjustments, primarily for pricing | ||||||||||||||||
on prior period open sales | (0.05 | ) | (0.05 | ) | ||||||||||||
Gross profit per pound | $ | 0.51 | $ | 0.49 | ||||||||||||
Reconciliation to Amounts Reported | ||||||||||||||||
(In millions) | ||||||||||||||||
Production | ||||||||||||||||
Revenues | and Delivery | DD&A | ||||||||||||||
Totals presented above | $ | 813 | $ | 458 | $ | 125 | ||||||||||
Treatment charges | (63 | ) | — | — | ||||||||||||
Royalty on metals | (2 | ) | — | — | ||||||||||||
Noncash and other costs, net | — | 5 | — | |||||||||||||
Revenue adjustments, primarily for pricing | ||||||||||||||||
on prior period open sales | (14 | ) | — | — | ||||||||||||
Eliminations and other | 1 | — | — | |||||||||||||
South America mining | 735 | 463 | 125 | |||||||||||||
Other miningb | 3,736 | 2,786 | 300 | |||||||||||||
Corporate, other & eliminations | (760 | ) | (754 | ) | 25 | |||||||||||
As reported in FCX’s consolidated financial statements | $ | 3,711 | $ | 2,495 | $ | 450 | ||||||||||
a. Includes silver sales of 848 thousand ounces ($17.97 per ounce average realized price). Also reflects sales of molybdenum produced by Cerro Verde to our molybdenum sales company at market-based pricing.
b. Represents the combined total for our other mining operations, including North America copper mines, Indonesia mining, Molybdenum mines, Rod & Refining and Atlantic Copper Smelting & Refining, as presented in Note 10.
62
South America Mining Product Revenues, Production Costs and Unit Net Cash Costs
Three Months Ended June 30, 2016 | |||||||||||||||||
(In millions) | By-Product | Co-Product Method | |||||||||||||||
Method | Copper | Othera | Total | ||||||||||||||
Revenues, excluding adjustments | $ | 715 | $ | 715 | $ | 51 | $ | 766 | |||||||||
Site production and delivery, before net noncash | |||||||||||||||||
and other costs shown below | 391 | 369 | 33 | 402 | |||||||||||||
By-product credits | (40 | ) | — | — | — | ||||||||||||
Treatment charges | 76 | 76 | — | 76 | |||||||||||||
Royalty on metals | 2 | 2 | — | 2 | |||||||||||||
Net cash costs | 429 | 447 | 33 | 480 | |||||||||||||
DD&A | 136 | 127 | 9 | 136 | |||||||||||||
Noncash and other costs, net | 5 | 5 | — | 5 | |||||||||||||
Total costs | 570 | 579 | 42 | 621 | |||||||||||||
Revenue adjustments, primarily for pricing | |||||||||||||||||
on prior period open sales | (11 | ) | (11 | ) | — | (11 | ) | ||||||||||
Gross profit | $ | 134 | $ | 125 | $ | 9 | $ | 134 | |||||||||
Copper sales (millions of recoverable pounds) | 327 | 327 | |||||||||||||||
Gross profit per pound of copper: | |||||||||||||||||
Revenues, excluding adjustments | $ | 2.19 | $ | 2.19 | |||||||||||||
Site production and delivery, before net noncash | |||||||||||||||||
and other costs shown below | 1.20 | 1.13 | |||||||||||||||
By-product credits | (0.12 | ) | — | ||||||||||||||
Treatment charges | 0.23 | 0.23 | |||||||||||||||
Royalty on metals | — | — | |||||||||||||||
Unit net cash costs | 1.31 | 1.36 | |||||||||||||||
DD&A | 0.41 | 0.39 | |||||||||||||||
Noncash and other costs, net | 0.02 | 0.02 | |||||||||||||||
Total unit costs | 1.74 | 1.77 | |||||||||||||||
Revenue adjustments, primarily for pricing | |||||||||||||||||
on prior period open sales | (0.04 | ) | (0.04 | ) | |||||||||||||
Gross profit per pound | $ | 0.41 | $ | 0.38 | |||||||||||||
Reconciliation to Amounts Reported | |||||||||||||||||
(In millions) | Production | ||||||||||||||||
Revenues | and Delivery | DD&A | |||||||||||||||
Totals presented above | $ | 766 | $ | 402 | $ | 136 | |||||||||||
Treatment charges | (76 | ) | — | — | |||||||||||||
Royalty on metals | (2 | ) | — | — | |||||||||||||
Noncash and other costs, net | — | 5 | — | ||||||||||||||
Revenue adjustments, primarily for pricing | |||||||||||||||||
on prior period open sales | (11 | ) | — | — | |||||||||||||
Eliminations and other | — | (1 | ) | — | |||||||||||||
South America mining | 677 | 406 | 136 | ||||||||||||||
Other miningb | 3,057 | 2,517 | 254 | ||||||||||||||
Corporate, other & eliminations | (400 | ) | 33 | 242 | |||||||||||||
As reported in FCX’s consolidated financial statements | $ | 3,334 | $ | 2,956 | $ | 632 | |||||||||||
a. | Includes silver sales of 911 thousand ounces ($17.50 per ounce average realized price). Also reflects sales of molybdenum produced by Cerro Verde to our molybdenum sales company at market-based pricing. |
b. | Represents the combined total for our other mining operations, including North America copper mines, Indonesia mining, Molybdenum mines, Rod & Refining and Atlantic Copper Smelting & Refining, as presented in Note 10. |
63
South America Mining Product Revenues, Production Costs and Unit Net Cash Costs
Six Months Ended June 30, 2017 | |||||||||||||||||
(In millions) | By-Product | Co-Product Method | |||||||||||||||
Method | Copper | Othera | Total | ||||||||||||||
Revenues, excluding adjustments | $ | 1,581 | $ | 1,581 | $ | 115 | $ | 1,696 | |||||||||
Site production and delivery, before net noncash | |||||||||||||||||
and other costs shown below | 905 | 850 | 77 | 927 | |||||||||||||
By-product credits | (93 | ) | — | — | — | ||||||||||||
Treatment charges | 130 | 130 | — | 130 | |||||||||||||
Royalty on metals | 4 | 4 | — | 4 | |||||||||||||
Net cash costs | 946 | 984 | 77 | 1,061 | |||||||||||||
DD&A | 258 | 241 | 17 | 258 | |||||||||||||
Noncash and other costs, net | 10 | 10 | — | 10 | |||||||||||||
Total costs | 1,214 | 1,235 | 94 | 1,329 | |||||||||||||
Revenue adjustments, primarily for pricing | |||||||||||||||||
on prior period open sales | 41 | 41 | — | 41 | |||||||||||||
Gross profit | $ | 408 | $ | 387 | $ | 21 | $ | 408 | |||||||||
Copper sales (millions of recoverable pounds) | 596 | 596 | |||||||||||||||
Gross profit per pound of copper: | |||||||||||||||||
Revenues, excluding adjustments | $ | 2.65 | $ | 2.65 | |||||||||||||
Site production and delivery, before net noncash | |||||||||||||||||
and other costs shown below | 1.52 | 1.42 | |||||||||||||||
By-product credits | (0.16 | ) | — | ||||||||||||||
Treatment charges | 0.22 | 0.22 | |||||||||||||||
Royalty on metals | 0.01 | 0.01 | |||||||||||||||
Unit net cash costs | 1.59 | 1.65 | |||||||||||||||
DD&A | 0.43 | 0.40 | |||||||||||||||
Noncash and other costs, net | 0.02 | 0.02 | |||||||||||||||
Total unit costs | 2.04 | 2.07 | |||||||||||||||
Revenue adjustments, primarily for pricing | |||||||||||||||||
on prior period open sales | 0.07 | 0.07 | |||||||||||||||
Gross profit per pound | $ | 0.68 | $ | 0.65 | |||||||||||||
Reconciliation to Amounts Reported | |||||||||||||||||
(In millions) | Production | ||||||||||||||||
Revenues | and Delivery | DD&A | |||||||||||||||
Totals presented above | $ | 1,696 | $ | 927 | $ | 258 | |||||||||||
Treatment charges | (130 | ) | — | — | |||||||||||||
Royalty on metals | (4 | ) | — | — | |||||||||||||
Noncash and other costs, net | — | 10 | — | ||||||||||||||
Revenue adjustments, primarily for pricing | |||||||||||||||||
on prior period open sales | 41 | — | — | ||||||||||||||
Eliminations and other | — | (1 | ) | — | |||||||||||||
South America mining | 1,603 | 936 | 258 | ||||||||||||||
Other miningb | — | 7,001 | 5,330 | 527 | |||||||||||||
Corporate, other & eliminations | — | (1,552 | ) | (1,571 | ) | 54 | |||||||||||
As reported in FCX’s consolidated financial statements | $ | 7,052 | $ | 4,695 | $ | 839 | |||||||||||
a. | Includes silver sales of 1.8 million ounces ($16.95 per ounce average realized price). Also reflects sales of molybdenum produced by Cerro Verde to our molybdenum sales company at market-based pricing. |
b. | Represents the combined total for our other mining operations, including North America copper mines, Indonesia mining, Molybdenum mines, Rod & Refining and Atlantic Copper Smelting & Refining, as presented in Note 10. |
64
South America Mining Product Revenues, Production Costs and Unit Net Cash Costs
Six Months Ended June 30, 2016 | |||||||||||||||||
(In millions) | By-Product | Co-Product Method | |||||||||||||||
Method | Copper | Othera | Total | ||||||||||||||
Revenues, excluding adjustments | $ | 1,414 | $ | 1,414 | $ | 80 | $ | 1,494 | |||||||||
Site production and delivery, before net noncash | |||||||||||||||||
and other costs shown below | 789 | 754 | 53 | 807 | |||||||||||||
By-product credits | (62 | ) | — | — | — | ||||||||||||
Treatment charges | 151 | 151 | — | 151 | |||||||||||||
Royalty on metals | 3 | 3 | — | 3 | |||||||||||||
Net cash costs | 881 | 908 | 53 | 961 | |||||||||||||
DD&A | 267 | 253 | 14 | 267 | |||||||||||||
Noncash and other costs, net | 12 | 12 | — | 12 | |||||||||||||
Total costs | 1,160 | 1,173 | 67 | 1,240 | |||||||||||||
Revenue adjustments, primarily for pricing | |||||||||||||||||
on prior period open sales | 8 | 8 | — | 8 | |||||||||||||
Gross profit | $ | 262 | $ | 249 | $ | 13 | $ | 262 | |||||||||
Copper sales (millions of recoverable pounds) | 650 | 650 | |||||||||||||||
Gross profit per pound of copper: | |||||||||||||||||
Revenues, excluding adjustments | $ | 2.18 | $ | 2.18 | |||||||||||||
Site production and delivery, before net noncash | |||||||||||||||||
and other costs shown below | 1.22 | 1.16 | |||||||||||||||
By-product credits | (0.10 | ) | — | ||||||||||||||
Treatment charges | 0.23 | 0.23 | |||||||||||||||
Royalty on metals | 0.01 | 0.01 | |||||||||||||||
Unit net cash costs | 1.36 | 1.40 | |||||||||||||||
DD&A | 0.41 | 0.39 | |||||||||||||||
Noncash and other costs, net | 0.02 | 0.02 | |||||||||||||||
Total unit costs | 1.79 | 1.81 | |||||||||||||||
Revenue adjustments, primarily for pricing | |||||||||||||||||
on prior period open sales | 0.01 | 0.01 | |||||||||||||||
Gross profit per pound | $ | 0.40 | $ | 0.38 | |||||||||||||
Reconciliation to Amounts Reported | |||||||||||||||||
(In millions) | Production | ||||||||||||||||
Revenues | and Delivery | DD&A | |||||||||||||||
Totals presented above | $ | 1,494 | $ | 807 | $ | 267 | |||||||||||
Treatment charges | (151 | ) | — | — | |||||||||||||
Royalty on metals | (3 | ) | — | — | |||||||||||||
Noncash and other costs, net | — | 12 | — | ||||||||||||||
Revenue adjustments, primarily for pricing | |||||||||||||||||
on prior period open sales | 8 | — | — | ||||||||||||||
Eliminations and other | — | (3 | ) | 1 | |||||||||||||
South America mining | 1,348 | 816 | 268 | ||||||||||||||
Other miningb | 6,196 | 5,114 | 508 | ||||||||||||||
Corporate, other & eliminations | (968 | ) | (475 | ) | 518 | ||||||||||||
As reported in FCX’s consolidated financial statements | $ | 6,576 | $ | 5,455 | $ | 1,294 | |||||||||||
a. | Includes silver sales of 1.8 million ounces ($16.03 per ounce average realized price). Also reflects sales of molybdenum produced by Cerro Verde to our molybdenum sales company at market-based pricing. |
b. | Represents the combined total for our other mining operations, including North America copper mines, Indonesia mining, Molybdenum mines, Rod & Refining and Atlantic Copper Smelting & Refining, as presented in Note 10. |
65
Indonesia Mining Product Revenues, Production Costs and Unit Net Cash Costs
Three Months Ended June 30, 2017 | ||||||||||||||||||||
(In millions) | By-Product | Co-Product Method | ||||||||||||||||||
Method | Copper | Gold | Silvera | Total | ||||||||||||||||
Revenues, excluding adjustments | $ | 660 | $ | 660 | $ | 531 | $ | 14 | $ | 1,205 | ||||||||||
Site production and delivery, before net noncash | ||||||||||||||||||||
and other costs shown below | 444 | 243 | 196 | 5 | 444 | |||||||||||||||
Gold and silver credits | (547 | ) | — | — | — | — | ||||||||||||||
Treatment charges | 65 | 35 | 29 | 1 | 65 | |||||||||||||||
Export duties | 27 | 15 | 12 | — | 27 | |||||||||||||||
Royalty on metals | 43 | 22 | 20 | 1 | 43 | |||||||||||||||
Net cash costs | 32 | 315 | 257 | 7 | 579 | |||||||||||||||
DD&A | 153 | 84 | 67 | 2 | 153 | |||||||||||||||
Noncash and other costs, net | 84 | b | 46 | 37 | 1 | 84 | ||||||||||||||
Total costs | 269 | 445 | 361 | 10 | 816 | |||||||||||||||
Revenue adjustments, primarily for pricing on | ||||||||||||||||||||
prior period open sales | (7 | ) | (7 | ) | 2 | — | (5 | ) | ||||||||||||
PT Smelting intercompany loss | (26 | ) | (15 | ) | (11 | ) | — | (26 | ) | |||||||||||
Gross profit | $ | 358 | $ | 193 | $ | 161 | $ | 4 | $ | 358 | ||||||||||
Copper sales (millions of recoverable pounds) | 247 | 247 | ||||||||||||||||||
Gold sales (thousands of recoverable ounces) | 427 | |||||||||||||||||||
Gross profit per pound of copper/per ounce of gold: | ||||||||||||||||||||
Revenues, excluding adjustments | $ | 2.67 | $ | 2.67 | $ | 1,243 | ||||||||||||||
Site production and delivery, before net noncash | ||||||||||||||||||||
and other costs shown below | 1.80 | 0.99 | 459 | |||||||||||||||||
Gold and silver credits | (2.21 | ) | — | — | ||||||||||||||||
Treatment charges | 0.26 | 0.14 | 67 | |||||||||||||||||
Export duties | 0.11 | 0.06 | 28 | |||||||||||||||||
Royalty on metals | 0.17 | 0.09 | 47 | |||||||||||||||||
Unit net cash costs | 0.13 | 1.28 | 601 | |||||||||||||||||
DD&A | 0.62 | 0.34 | 158 | |||||||||||||||||
Noncash and other costs, net | 0.34 | b | 0.18 | 86 | ||||||||||||||||
Total unit costs | 1.09 | 1.80 | 845 | |||||||||||||||||
Revenue adjustments, primarily for pricing on | ||||||||||||||||||||
prior period open sales | (0.03 | ) | (0.03 | ) | 5 | |||||||||||||||
PT Smelting intercompany loss | (0.10 | ) | (0.06 | ) | (26 | ) | ||||||||||||||
Gross profit per pound/ounce | $ | 1.45 | $ | 0.78 | $ | 377 | ||||||||||||||
Reconciliation to Amounts Reported | ||||||||||||||||||||
(In millions) | Production | |||||||||||||||||||
Revenues | and Delivery | DD&A | ||||||||||||||||||
Totals presented above | $ | 1,205 | $ | 444 | $ | 153 | ||||||||||||||
Treatment charges | (65 | ) | — | — | ||||||||||||||||
Export duties | (27 | ) | — | — | ||||||||||||||||
Royalty on metals | (43 | ) | — | — | ||||||||||||||||
Noncash and other costs, net | — | 84 | — | |||||||||||||||||
Revenue adjustments, primarily for pricing on | ||||||||||||||||||||
prior period open sales | (5 | ) | — | — | ||||||||||||||||
PT Smelting intercompany loss | — | 26 | — | |||||||||||||||||
Indonesia mining | 1,065 | 554 | 153 | |||||||||||||||||
Other miningc | 3,406 | 2,695 | 272 | |||||||||||||||||
Corporate, other & eliminations | (760 | ) | (754 | ) | 25 | |||||||||||||||
As reported in FCX’s consolidated financial statements | $ | 3,711 | $ | 2,495 | $ | 450 | ||||||||||||||
a. | Includes silver sales of 851 thousand ounces ($16.26 per ounce average realized price). |
b. | Includes $82 million ($0.33 per pound of copper) of costs charged directly to production and delivery costs as a result of workforce reductions. |
c. | Represents the combined total for our other mining operations, including North America copper mines, South America mining, Molybdenum mines, Rod & Refining and Atlantic Copper Smelting & Refining, as presented in Note 10. |
66
Indonesia Mining Product Revenues, Production Costs and Unit Net Cash Costs
Three Months Ended June 30, 2016 | |||||||||||||||||||||
(In millions) | By-Product | Co-Product Method | |||||||||||||||||||
Method | Copper | Gold | Silvera | Total | |||||||||||||||||
Revenues, excluding adjustments | $ | 431 | $ | 431 | $ | 195 | $ | 10 | $ | 636 | |||||||||||
Site production and delivery, before net noncash | |||||||||||||||||||||
and other costs shown below | 347 | 235 | 107 | 5 | 347 | ||||||||||||||||
Gold and silver credits | (206 | ) | — | — | — | — | |||||||||||||||
Treatment charges | 57 | 39 | 17 | 1 | 57 | ||||||||||||||||
Export duties | 16 | 11 | 5 | — | 16 | ||||||||||||||||
Royalty on metals | 21 | 14 | 7 | — | 21 | ||||||||||||||||
Net cash costs | 235 | 299 | 136 | 6 | 441 | ||||||||||||||||
DD&A | 93 | 63 | 28 | 2 | 93 | ||||||||||||||||
Noncash and other costs, net | 2 | 1 | 1 | — | 2 | ||||||||||||||||
Total costs | 330 | 363 | 165 | 8 | 536 | ||||||||||||||||
Revenue adjustments, primarily for pricing on | |||||||||||||||||||||
prior period open sales | (12 | ) | (12 | ) | 1 | — | (11 | ) | |||||||||||||
PT Smelting intercompany loss | (7 | ) | (5 | ) | (2 | ) | — | (7 | ) | ||||||||||||
Gross profit | $ | 82 | $ | 51 | $ | 29 | $ | 2 | $ | 82 | |||||||||||
Copper sales (millions of recoverable pounds) | 196 | 196 | |||||||||||||||||||
Gold sales (thousands of recoverable ounces) | 151 | ||||||||||||||||||||
Gross profit per pound of copper/per ounce of gold: | |||||||||||||||||||||
Revenues, excluding adjustments | $ | 2.20 | $ | 2.20 | $ | 1,292 | |||||||||||||||
Site production and delivery, before net noncash | |||||||||||||||||||||
and other costs shown below | 1.77 | 1.20 | 706 | ||||||||||||||||||
Gold and silver credits | (1.05 | ) | — | — | |||||||||||||||||
Treatment charges | 0.29 | 0.20 | 116 | ||||||||||||||||||
Export duties | 0.08 | 0.05 | 32 | ||||||||||||||||||
Royalty on metals | 0.11 | 0.07 | 45 | ||||||||||||||||||
Unit net cash costs | 1.20 | 1.52 | 899 | ||||||||||||||||||
DD&A | 0.48 | 0.33 | 190 | ||||||||||||||||||
Noncash and other costs, net | 0.01 | 0.01 | 4 | ||||||||||||||||||
Total unit costs | 1.69 | 1.86 | 1,093 | ||||||||||||||||||
Revenue adjustments, primarily for pricing on | |||||||||||||||||||||
prior period open sales | (0.06 | ) | (0.06 | ) | 7 | ||||||||||||||||
PT Smelting intercompany loss | (0.03 | ) | (0.02 | ) | (14 | ) | |||||||||||||||
Gross profit per pound/ounce | $ | 0.42 | $ | 0.26 | $ | 192 | |||||||||||||||
Reconciliation to Amounts Reported | |||||||||||||||||||||
(In millions) | Production | ||||||||||||||||||||
Revenues | and Delivery | DD&A | |||||||||||||||||||
Totals presented above | $ | 636 | $ | 347 | $ | 93 | |||||||||||||||
Treatment charges | (57 | ) | — | — | |||||||||||||||||
Export duties | (16 | ) | — | — | |||||||||||||||||
Royalty on metals | (21 | ) | — | — | |||||||||||||||||
Noncash and other costs, net | — | 2 | — | ||||||||||||||||||
Revenue adjustments, primarily for pricing on | |||||||||||||||||||||
prior period open sales | (11 | ) | — | — | |||||||||||||||||
PT Smelting intercompany loss | — | 7 | — | ||||||||||||||||||
Indonesia mining | 531 | 356 | 93 | ||||||||||||||||||
Other miningb | 3,203 | 2,567 | 297 | ||||||||||||||||||
Corporate, other & eliminations | (400 | ) | 33 | 242 | |||||||||||||||||
As reported in FCX’s consolidated financial statements | $ | 3,334 | $ | 2,956 | $ | 632 | |||||||||||||||
a. | Includes silver sales of 562 thousand ounces ($17.42 per ounce average realized price). |
b. | Represents the combined total for our other mining operations, including North America copper mines, South America mining, Molybdenum mines, Rod & Refining and Atlantic Copper Smelting & Refining, as presented in Note 10. |
67
Indonesia Mining Product Revenues, Production Costs and Unit Net Cash Costs
Six Months Ended June 30, 2017 | ||||||||||||||||||||
(In millions) | By-Product | Co-Product Method | ||||||||||||||||||
Method | Copper | Gold | Silvera | Total | ||||||||||||||||
Revenues, excluding adjustments | $ | 982 | $ | 982 | $ | 752 | $ | 21 | $ | 1,755 | ||||||||||
Site production and delivery, before net noncash | ||||||||||||||||||||
and other costs shown below | 712 | 399 | 305 | 8 | 712 | |||||||||||||||
Gold and silver credits | (782 | ) | — | — | — | — | ||||||||||||||
Treatment charges | 100 | 56 | 43 | 1 | 100 | |||||||||||||||
Export duties | 41 | 23 | 18 | — | 41 | |||||||||||||||
Royalty on metals | 63 | 34 | 28 | 1 | 63 | |||||||||||||||
Net cash costs | 134 | 512 | 394 | 10 | 916 | |||||||||||||||
DD&A | 236 | 132 | 101 | 3 | 236 | |||||||||||||||
Noncash and other costs, net | 116 | b | 65 | 50 | 1 | 116 | ||||||||||||||
Total costs | 486 | 709 | 545 | 14 | 1,268 | |||||||||||||||
Revenue adjustments, primarily for pricing on | ||||||||||||||||||||
prior period open sales | 39 | 39 | 9 | — | 48 | |||||||||||||||
PT Smelting intercompany profit | 1 | 1 | — | — | 1 | |||||||||||||||
Gross profit | $ | 536 | $ | 313 | $ | 216 | $ | 7 | $ | 536 | ||||||||||
Copper sales (millions of recoverable pounds) | 372 | 372 | ||||||||||||||||||
Gold sales (thousands of recoverable ounces) | 604 | |||||||||||||||||||
Gross profit per pound of copper/per ounce of gold: | ||||||||||||||||||||
Revenues, excluding adjustments | $ | 2.64 | $ | 2.64 | $ | 1,242 | ||||||||||||||
Site production and delivery, before net noncash | ||||||||||||||||||||
and other costs shown below | 1.91 | 1.07 | 504 | |||||||||||||||||
Gold and silver credits | (2.10 | ) | — | — | ||||||||||||||||
Treatment charges | 0.27 | 0.15 | 71 | |||||||||||||||||
Export duties | 0.11 | 0.06 | 29 | |||||||||||||||||
Royalty on metals | 0.17 | 0.10 | 47 | |||||||||||||||||
Unit net cash costs | 0.36 | 1.38 | 651 | |||||||||||||||||
DD&A | 0.63 | 0.35 | 167 | |||||||||||||||||
Noncash and other costs, net | 0.32 | b | 0.18 | 82 | ||||||||||||||||
Total unit costs | 1.31 | 1.91 | 900 | |||||||||||||||||
Revenue adjustments, primarily for pricing on | ||||||||||||||||||||
prior period open sales | 0.11 | 0.11 | 15 | |||||||||||||||||
PT Smelting intercompany profit | — | — | 1 | |||||||||||||||||
Gross profit per pound/ounce | $ | 1.44 | $ | 0.84 | $ | 358 | ||||||||||||||
Reconciliation to Amounts Reported | ||||||||||||||||||||
(In millions) | Production | |||||||||||||||||||
Revenues | and Delivery | DD&A | ||||||||||||||||||
Totals presented above | $ | 1,755 | $ | 712 | $ | 236 | ||||||||||||||
Treatment charges | (100 | ) | — | — | ||||||||||||||||
Export duties | (41 | ) | — | — | ||||||||||||||||
Royalty on metals | (63 | ) | — | — | ||||||||||||||||
Noncash and other costs, net | — | 116 | — | |||||||||||||||||
Revenue adjustments, primarily for pricing on | ||||||||||||||||||||
prior period open sales | 48 | — | — | |||||||||||||||||
PT Smelting intercompany profit | — | (1 | ) | — | ||||||||||||||||
Indonesia mining | 1,599 | 827 | 236 | |||||||||||||||||
Other miningc | 7,005 | 5,439 | 549 | |||||||||||||||||
Corporate, other & eliminations | (1,552 | ) | (1,571 | ) | 54 | |||||||||||||||
As reported in FCX’s consolidated financial statements | $ | 7,052 | $ | 4,695 | $ | 839 | ||||||||||||||
a. | Includes silver sales of 1.3 million ounces ($16.66 per ounce average realized price). |
b. | Includes $103 million ($0.28 per pound of copper) of costs charged directly to production and delivery costs as a result of workforce reductions. |
c. | Represents the combined total for our other mining operations, including North America copper mines, South America mining, Molybdenum mines, Rod & Refining and Atlantic Copper Smelting & Refining, as presented in Note 10. |
68
Indonesia Mining Product Revenues, Production Costs and Unit Net Cash Costs
Six Months Ended June 30, 2016 | |||||||||||||||||||||
(In millions) | By-Product | Co-Product Method | |||||||||||||||||||
Method | Copper | Gold | Silvera | Total | |||||||||||||||||
Revenues, excluding adjustments | $ | 802 | $ | 802 | $ | 436 | $ | 17 | $ | 1,255 | |||||||||||
Site production and delivery, before net noncash | |||||||||||||||||||||
and other costs shown below | 737 | 471 | 256 | 10 | 737 | ||||||||||||||||
Gold and silver credits | (470 | ) | — | — | — | — | |||||||||||||||
Treatment charges | 112 | 72 | 39 | 1 | 112 | ||||||||||||||||
Export duties | 29 | 18 | 10 | 1 | 29 | ||||||||||||||||
Royalty on metals | 43 | 27 | 16 | — | 43 | ||||||||||||||||
Net cash costs | 451 | 588 | 321 | 12 | 921 | ||||||||||||||||
DD&A | 174 | 111 | 60 | 3 | 174 | ||||||||||||||||
Noncash and other costs, net | 14 | 9 | 5 | — | 14 | ||||||||||||||||
Total costs | 639 | 708 | 386 | 15 | 1,109 | ||||||||||||||||
Revenue adjustments, primarily for pricing on | |||||||||||||||||||||
prior period open sales | (1 | ) | (1 | ) | 17 | — | 16 | ||||||||||||||
PT Smelting intercompany profit | 1 | 1 | — | — | 1 | ||||||||||||||||
Gross profit | $ | 163 | $ | 94 | $ | 67 | $ | 2 | $ | 163 | |||||||||||
Copper sales (millions of recoverable pounds) | 370 | 370 | |||||||||||||||||||
Gold sales (thousands of recoverable ounces) | 346 | ||||||||||||||||||||
Gross profit per pound of copper/per ounce of gold: | |||||||||||||||||||||
Revenues, excluding adjustments | $ | 2.17 | $ | 2.17 | $ | 1,260 | |||||||||||||||
Site production and delivery, before net noncash | |||||||||||||||||||||
and other costs shown below | 1.99 | 1.27 | 740 | ||||||||||||||||||
Gold and silver credits | (1.27 | ) | — | — | |||||||||||||||||
Treatment charges | 0.30 | 0.20 | 113 | ||||||||||||||||||
Export duties | 0.08 | 0.05 | 29 | ||||||||||||||||||
Royalty on metals | 0.12 | 0.07 | 47 | ||||||||||||||||||
Unit net cash costs | 1.22 | 1.59 | 929 | ||||||||||||||||||
DD&A | 0.47 | 0.30 | 175 | ||||||||||||||||||
Noncash and other costs, net | 0.04 | 0.02 | 14 | ||||||||||||||||||
Total unit costs | 1.73 | 1.91 | 1,118 | ||||||||||||||||||
Revenue adjustments, primarily for pricing on | |||||||||||||||||||||
prior period open sales | — | — | 48 | ||||||||||||||||||
PT Smelting intercompany profit | — | — | 2 | ||||||||||||||||||
Gross profit per pound/ounce | $ | 0.44 | $ | 0.26 | $ | 192 | |||||||||||||||
Reconciliation to Amounts Reported | |||||||||||||||||||||
(In millions) | Production | ||||||||||||||||||||
Revenues | and Delivery | DD&A | |||||||||||||||||||
Totals presented above | $ | 1,255 | $ | 737 | $ | 174 | |||||||||||||||
Treatment charges | (112 | ) | — | — | |||||||||||||||||
Export duties | (29 | ) | — | — | |||||||||||||||||
Royalty on metals | (43 | ) | — | — | |||||||||||||||||
Noncash and other costs, net | — | 14 | — | ||||||||||||||||||
Revenue adjustments, primarily for pricing on | |||||||||||||||||||||
prior period open sales | 16 | — | — | ||||||||||||||||||
PT Smelting intercompany profit | — | (1 | ) | — | |||||||||||||||||
Indonesia mining | 1,087 | 750 | 174 | ||||||||||||||||||
Other miningb | 6,457 | 5,180 | 602 | ||||||||||||||||||
Corporate, other & eliminations | (968 | ) | (475 | ) | 518 | ||||||||||||||||
As reported in FCX’s consolidated financial statements | $ | 6,576 | $ | 5,455 | $ | 1,294 | |||||||||||||||
a. | Includes silver sales of 1.1 million ounces ($16.56 per ounce average realized price). |
b. | Represents the combined total for our other mining operations, including North America copper mines, South America mining, Molybdenum mines, Rod & Refining and Atlantic Copper Smelting & Refining, as presented in Note 10. |
69
Molybdenum Mines Product Revenues, Production Costs and Unit Net Cash Costs
Three Months Ended June 30, | ||||||||||||||
(In millions) | 2017 | 2016 | ||||||||||||
Revenues, excluding adjustmentsa | $ | 78 | $ | 50 | ||||||||||
Site production and delivery, before net noncash and other costs shown below | 57 | 45 | ||||||||||||
Treatment charges and other | 7 | 5 | ||||||||||||
Net cash costs | 64 | 50 | ||||||||||||
DD&A | 19 | 17 | ||||||||||||
Noncash and other costs, net | 2 | 5 | ||||||||||||
Total costs | 85 | 72 | ||||||||||||
Gross loss | $ | (7 | ) | $ | (22 | ) | ||||||||
Molybdenum sales (millions of recoverable pounds)a | 8 | 7 | ||||||||||||
Gross loss per pound of molybdenum: | ||||||||||||||
Revenues, excluding adjustmentsa | $ | 9.57 | $ | 7.87 | ||||||||||
Site production and delivery, before net noncash and other costs shown below | 6.96 | 6.95 | ||||||||||||
Treatment charges and other | 0.85 | 0.85 | ||||||||||||
Unit net cash costs | 7.81 | 7.80 | ||||||||||||
DD&A | 2.32 | 2.71 | ||||||||||||
Noncash and other costs, net | 0.27 | 0.82 | ||||||||||||
Total unit costs | 10.40 | 11.33 | ||||||||||||
Gross loss per pound | $ | (0.83 | ) | $ | (3.46 | ) | ||||||||
Reconciliation to Amounts Reported | ||||||||||||||
(In millions) | ||||||||||||||
Production | ||||||||||||||
Three Months Ended June 30, 2017 | Revenues | and Delivery | DD&A | |||||||||||
Totals presented above | $ | 78 | $ | 57 | $ | 19 | ||||||||
Treatment charges and other | (7 | ) | — | — | ||||||||||
Noncash and other costs, net | — | 2 | — | |||||||||||
Molybdenum mines | 71 | 59 | 19 | |||||||||||
Other miningb | 4,400 | 3,190 | 406 | |||||||||||
Corporate, other & eliminations | (760 | ) | (754 | ) | 25 | |||||||||
As reported in FCX’s consolidated financial statements | $ | 3,711 | $ | 2,495 | $ | 450 | ||||||||
Three Months Ended June 30, 2016 | ||||||||||||||
Totals presented above | $ | 50 | $ | 45 | $ | 17 | ||||||||
Treatment charges and other | (5 | ) | — | — | ||||||||||
Noncash and other costs, net | — | 5 | — | |||||||||||
Molybdenum mines | 45 | 50 | 17 | |||||||||||
Other miningb | 3,689 | 2,873 | 373 | |||||||||||
Corporate, other & eliminations | (400 | ) | 33 | 242 | ||||||||||
As reported in FCX’s consolidated financial statements | $ | 3,334 | $ | 2,956 | $ | 632 | ||||||||
a. | Reflects sales of the Molybdenum mines’ production to our molybdenum sales company at market-based pricing. On a consolidated basis, realizations are based on the actual contract terms for sales to third parties; as a result, our consolidated average realized price per pound of molybdenum will differ from the amounts reported in this table. |
b. | Represents the combined total for our other mining operations, including North America copper mines, South America mining, Indonesia mining, Rod & Refining and Atlantic Copper Smelting & Refining, as presented in Note 10. Also includes amounts associated with our molybdenum sales company, which includes sales of molybdenum produced by the Molybdenum mines and by certain of the North America and South America copper mines. |
70
Molybdenum Mines Product Revenues, Production Costs and Unit Net Cash Costs
Six Months Ended June 30, | ||||||||||||||
(In millions) | 2017 | 2016 | ||||||||||||
Revenues, excluding adjustmentsa | $ | 148 | $ | 102 | ||||||||||
Site production and delivery, before net noncash and other costs shown below | 108 | 92 | ||||||||||||
Treatment charges and other | 14 | 12 | ||||||||||||
Net cash costs | 122 | 104 | ||||||||||||
DD&A | 38 | 36 | ||||||||||||
Noncash and other costs, net | 3 | 10 | ||||||||||||
Total costs | 163 | 150 | ||||||||||||
Gross loss | $ | (15 | ) | $ | (48 | ) | ||||||||
Molybdenum sales (millions of recoverable pounds)a | 16 | 14 | ||||||||||||
Gross loss per pound of molybdenum: | ||||||||||||||
Revenues, excluding adjustmentsa | $ | 9.07 | $ | 7.47 | ||||||||||
Site production and delivery, before net noncash and other costs shown below | 6.61 | 6.76 | ||||||||||||
Treatment charges and other | 0.85 | 0.85 | ||||||||||||
Unit net cash costs | 7.46 | 7.61 | ||||||||||||
DD&A | 2.34 | 2.66 | ||||||||||||
Noncash and other costs, net | 0.21 | 0.69 | ||||||||||||
Total unit costs | 10.01 | 10.96 | ||||||||||||
Gross loss per pound | $ | (0.94 | ) | $ | (3.49 | ) | ||||||||
Reconciliation to Amounts Reported | ||||||||||||||
(In millions) | ||||||||||||||
Production | ||||||||||||||
Six Months Ended June 30, 2017 | Revenues | and Delivery | DD&A | |||||||||||
Totals presented above | $ | 148 | $ | 108 | $ | 38 | ||||||||
Treatment charges and other | (14 | ) | — | — | ||||||||||
Noncash and other costs, net | — | 3 | — | |||||||||||
Molybdenum mines | 134 | 111 | 38 | |||||||||||
Other miningb | 8,470 | 6,155 | 747 | |||||||||||
Corporate, other & eliminations | (1,552 | ) | (1,571 | ) | 54 | |||||||||
As reported in FCX’s consolidated financial statements | $ | 7,052 | $ | 4,695 | $ | 839 | ||||||||
Six Months Ended June 30, 2016 | ||||||||||||||
Totals presented above | $ | 102 | $ | 92 | $ | 36 | ||||||||
Treatment charges and other | (12 | ) | — | — | ||||||||||
Noncash and other costs, net | — | 10 | — | |||||||||||
Molybdenum mines | 90 | 102 | 36 | |||||||||||
Other miningb | 7,454 | 5,828 | 740 | |||||||||||
Corporate, other & eliminations | (968 | ) | (475 | ) | 518 | |||||||||
As reported in FCX’s consolidated financial statements | $ | 6,576 | $ | 5,455 | $ | 1,294 | ||||||||
a. | Reflects sales of the Molybdenum mines’ production to our molybdenum sales company at market-based pricing. On a consolidated basis, realizations are based on the actual contract terms for sales to third parties; as a result, our consolidated average realized price per pound of molybdenum will differ from the amounts reported in this table. |
b. | Represents the combined total for our other mining operations, including North America copper mines, South America mining, Indonesia mining, Rod & Refining and Atlantic Copper Smelting & Refining, as presented in Note 10. Also includes amounts associated with our molybdenum sales company, which includes sales of molybdenum produced by the Molybdenum mines and by certain of the North America and South America copper mines. |
71
CAUTIONARY STATEMENT
Our discussion and analysis contains forward-looking statements in which we discuss our potential future performance. Forward-looking statements are all statements other than statements of historical facts, such as projections or expectations relating to ore grades and milling rates, production and sales volumes, unit net cash costs, operating cash flows, capital expenditures, exploration efforts and results, development and production activities and costs, liquidity, tax rates, the impact of copper, gold and molybdenum price changes, the impact of deferred intercompany profits on earnings, reserve estimates, future dividend payments, and share purchases and sales. The words “anticipates,” “may,” “can,” “plans,” “believes,” “estimates,” “expects,” “projects,” “targets,” “intends,” “likely,” “will,” “should,” “to be,” “potential” and any similar expressions are intended to identify those assertions as forward-looking statements.
We caution readers that forward-looking statements are not guarantees of future performance and actual results may differ materially from those anticipated, projected or assumed in the forward-looking statements. Important factors that can cause our actual results to differ materially from those anticipated in the forward-looking statements include supply of and demand for, and prices of, copper, gold and molybdenum; mine sequencing; production rates; potential effects of cost and capital expenditure reductions and production curtailments on financial results and cash flow; potential inventory adjustments; potential impairment of long-lived mining assets; the outcome of negotiations with the Indonesian government regarding PT-FI’s COW; the potential effects of violence in Indonesia generally and in the province of Papua; industry risks; regulatory changes (including adoption of financial responsibility regulations as recently proposed by the U.S. Environmental Protection Agency and CERCLA for the hard rock mining industry); political risks; labor relations; weather- and climate-related risks; environmental risks; litigation results (including the final disposition of the unfavorable Indonesia Tax Court ruling relating to surface water taxes); and other factors described in more detail in Part I, Item 1A. “Risk Factors” of our annual report on Form 10-K for the year ended December 31, 2016, filed with the SEC as updated by our subsequent filings with the SEC. With respect to our operations in Indonesia, such factors include whether PT-FI will be able to resolve complex regulatory matters in Indonesia.
Investors are cautioned that many of the assumptions upon which our forward-looking statements are based are likely to change after the forward-looking statements are made, including for example commodity prices, which we cannot control, and production volumes and costs, some aspects of which we may not be able to control. Further, we may make changes to our business plans that could affect our results. We caution investors that we do not intend to update forward-looking statements more frequently than quarterly notwithstanding any changes in our assumptions, changes in business plans, actual experience or other changes, and we undertake no obligation to update any forward-looking statements.
72
Item 3. | Quantitative and Qualitative Disclosures About Market Risk. |
There have been no material changes in our market risks during the six-month period ended June 30, 2017. For additional information on market risks, refer to “Disclosures About Market Risks” included in Part II, Items 7. and 7A. of our annual report on Form 10-K for the year ended December 31, 2016. For projected sensitivities of our operating cash flow to changes in commodity prices, refer to “Outlook” in Part I, Item 2. of this quarterly report on Form 10-Q for the period ended June 30, 2017; for projected sensitivities of our provisionally priced copper sales and derivative instruments to changes in commodity prices refer to “Consolidated Results – Revenues” in Part I, Item 2. of this quarterly report on Form 10-Q for the period ended June 30, 2017.
Item 4. | Controls and Procedures. |
(a) | Evaluation of disclosure controls and procedures. Our chief executive officer and chief financial officer, with the participation of management, have evaluated the effectiveness of our “disclosure controls and procedures” (as defined in Rules 13a-15(e) and 15d-15(e) under the Securities Exchange Act of 1934) as of the end of the period covered by this quarterly report on Form 10-Q. Based on their evaluation, they have concluded that our disclosure controls and procedures are effective as of June 30, 2017. |
(b) | Changes in internal control over financial reporting. There has been no change in our internal control over financial reporting that occurred during the quarter ended June 30, 2017, that has materially affected, or is reasonably likely to materially affect, our internal control over financial reporting. |
Part II. | OTHER INFORMATION |
Item 1. | Legal Proceedings. |
We are involved in numerous legal proceedings that arise in the ordinary course of our business or that are associated with environmental issues arising from legacy operations conducted over the years by Freeport Minerals Corporation and its affiliates. We are also involved from time to time in other reviews, investigations and proceedings by government agencies, some of which may result in adverse judgments, settlements, fines, penalties, injunctions or other relief.
Management does not believe, based on currently available information, that the outcome of any proceeding reported in Note 9 of this quarterly report on Form 10-Q for the period ended June 30, 2017, and in Part I, Item 3. “Legal Proceedings” and Note 12 of our annual report on Form 10-K for the year ended December 31, 2016, will have a material adverse effect on our financial condition; although individual outcomes could be material to our operating results for a particular period, depending on the nature and magnitude of the outcome and the operating results for the period.
Item 1A. Risk Factors.
There have been no material changes to our risk factors during the three-month period ended June 30, 2017. For additional information on risk factors, refer to Part I, Item 1A. “Risk Factors” of our annual report on Form 10-K for the year ended December 31, 2016 and Part II, Item 1A. “Risk Factors” of our quarterly report on Form 10-Q for the quarter ended March 31, 2017.
Item 2. | Unregistered Sales of Equity Securities and Use of Proceeds. |
There were no unregistered sales of equity securities during the six months ended June 30, 2017.
There were no shares of common stock purchased by us during the six months ended June 30, 2017. On July 21, 2008, our Board of Directors approved an increase in our open-market share purchase program for up to 30 million shares. There have been no purchases under this program since 2008. This program does not have an expiration date. At June 30, 2017, there were 23.7 million shares that could still be purchased under the program.
73
Item 4. | Mine Safety Disclosures. |
The safety and health of all employees is our highest priority. Management believes that safety and health considerations are integral to, and compatible with, all other functions in the organization and that proper safety and health management will enhance production and reduce costs. Our approach towards the safety and health of our workforce is to continuously improve performance through implementing robust management systems and providing adequate training, safety incentive and occupational health programs. The information concerning mine safety violations or other regulatory matters required by Section 1503(a) of the Dodd-Frank Wall Street Reform and Consumer Protection Act and Item 104 of Regulation S-K is included in Exhibit 95.1 to this quarterly report on Form 10-Q.
Item 6. | Exhibits. |
The exhibits to this report are listed in the Exhibit Index beginning on Page E-1 hereof.
74
SIGNATURE
Pursuant to the requirements of the Securities Exchange Act of 1934, the registrant has duly caused this report to be signed on its behalf by the undersigned thereunto duly authorized.
FREEPORT-McMoRan INC. | ||
By: | /s/ C. Donald Whitmire, Jr. | |
C. Donald Whitmire, Jr. | ||
Vice President and | ||
Controller - Financial Reporting | ||
(authorized signatory | ||
and Principal Accounting Officer) | ||
Date: August 4, 2017
S-1
FREEPORT-McMoRan INC. | |||||
EXHIBIT INDEX | |||||
Filed | |||||
Exhibit | with this | Incorporated by Reference | |||
Number | Exhibit Title | Form 10-Q | Form | File No. | Date Filed |
3.1 | Amended and Restated Certificate of Incorporation of FCX, effective as of June 8, 2016. | 8-K | 001-11307-01 | 6/9/2016 | |
3.2 | Amended and Restated By-Laws of FCX, effective as of June 8, 2016. | 8-K | 001-11307-01 | 6/9/2016 | |
4.1 | Indenture dated as of February 13, 2012, between FCX and U.S. Bank National Association, as Trustee (relating to the 2.15% Senior Notes due 2017, the 3.55% Senior Notes due 2022, the 2.30% Senior Notes due 2017, the 4.00% Senior Notes due 2021, the 4.55% Senior Notes due 2024, and the 5.40% Senior Notes due 2034). | 8-K | 001-11307-01 | 2/13/2012 | |
4.2 | Second Supplemental Indenture dated as of February 13, 2012, between FCX and U.S. Bank National Association, as Trustee (relating to the 2.15% Senior Notes due 2017). | 8-K | 001-11307-01 | 2/13/2012 | |
4.3 | Third Supplemental Indenture dated as of February 13, 2012, between FCX and U.S. Bank National Association, as Trustee (relating to the 3.55% Senior Notes due 2022). | 8-K | 001-11307-01 | 2/13/2012 | |
4.4 | Fourth Supplemental Indenture dated as of May 31, 2013, among FCX, Freeport-McMoRan Oil & Gas LLC and U.S. Bank National Association, as Trustee (relating to the 2.15% Senior Notes due 2017, the 3.55% Senior Notes due 2022, the 2.30% Senior Notes due 2017, the 4.00% Senior Notes due 2021, the 4.55% Senior Notes due 2024, and the 5.40% Senior Notes due 2034). | 8-K | 001-11307-01 | 6/3/2013 | |
4.5 | Fifth Supplemental Indenture dated as of November 14, 2014 among FCX, Freeport-McMoRan Oil & Gas LLC and U.S. Bank National Association, as Trustee (relating to the 2.30% Senior Notes due 2017). | 8-K | 001-11307-01 | 11/14/2014 | |
4.6 | Sixth Supplemental Indenture dated as of November 14, 2014 among FCX, Freeport-McMoRan Oil & Gas LLC and U.S. Bank National Association, as Trustee (relating to the 4.00% Senior Notes due 2021). | 8-K | 001-11307-01 | 11/14/2014 | |
4.7 | Seventh Supplemental Indenture dated as of November 14, 2014 among FCX, Freeport-McMoRan Oil & Gas LLC and U.S. Bank National Association, as (relating to the 4.55% Senior Notes due 2024). | 8-K | 001-11307-01 | 11/14/2014 | |
4.8 | Eighth Supplemental Indenture dated as of November 14, 2014 among FCX, Freeport-McMoRan Oil & Gas LLC and U.S. Bank National Association, as Trustee (relating to the 5.40% Senior Notes due 2034). | 8-K | 001-11307-01 | 11/14/2014 | |
4.9 | Indenture dated as of March 7, 2013, between FCX and U.S. Bank National Association, as Trustee (relating to the 2.375% Senior Notes due 2018, the 3.100% Senior Notes due 2020, the 3.875% Senior Notes due 2023, and the 5.450% Senior Notes due 2043). | 8-K | 001-11307-01 | 3/7/2013 | |
4.10 | Indenture dated as of December 13, 2016, among FCX, Freeport-McMoRan Oil & Gas LLC, as guarantor, and U.S. Bank National Association, as Trustee (relating to the 6.125% Senior Notes due 2019, the 6.50% Senior Notes due 2020, the 6.625% Senior Notes due 2021, the 6.75% Senior Notes due 2022, and the 6.875% Senior Notes due 2023). | 8-K | 001-11307-01 | 12/13/2016 | |
E-1
FREEPORT-McMoRan INC. | |||||
EXHIBIT INDEX | |||||
Filed | |||||
Exhibit | with this | Incorporated by Reference | |||
Number | Exhibit Title | Form 10-Q | Form | File No. | Date Filed |
4.11 | Indenture dated as of March 13, 2007, among Plains Exploration & Production Company, the Subsidiary Guarantors parties thereto, and Wells Fargo Bank, N.A., as Trustee (relating to the 6.625% Senior Notes due 2021, the 6.75% Senior Notes due 2022, the 6.125% Senior Notes due 2019, the 6.5% Senior Notes due 2020, and the 6.875% Senior Notes due 2023). | 8-K | 001-31470 | 3/13/2007 | |
4.12 | Twelfth Supplemental Indenture dated as of March 29, 2011 to the Indenture dated as of March 13, 2007, among Plains Exploration & Production Company, the Subsidiary Guarantors parties thereto and Wells Fargo Bank, N.A., as Trustee (relating to the 6.625% Senior Notes due 2021). | 8-K | 001-31470 | 3/29/2011 | |
4.13 | Thirteenth Supplemental Indenture dated as of November 21, 2011 to the Indenture dated as of March 13, 2007, among Plains Exploration & Production Company, the Subsidiary Guarantors parties thereto and Wells Fargo Bank, N.A., as Trustee (relating to the 6.75% Senior Notes due 2022). | 8-K | 001-31470 | 11/22/2011 | |
4.14 | Fourteenth Supplemental Indenture dated as of April 27, 2012 to the Indenture dated as of March 13, 2007, among Plains Exploration & Production Company, the Subsidiary Guarantors parties thereto and Wells Fargo Bank, N.A., as Trustee (relating to the 6.125% Senior Notes due 2019). | 8-K | 001-31470 | 4/27/2012 | |
4.15 | Sixteenth Supplemental Indenture dated as of October 26, 2012 to the Indenture dated as of March 13, 2007, among Plains Exploration & Production Company, the Subsidiary Guarantors parties thereto and Wells Fargo Bank, N.A., as Trustee (relating to the 6.5% Senior Notes due 2020). | 8-K | 001-31470 | 10/26/2012 | |
4.16 | Seventeenth Supplemental Indenture dated as of October 26, 2012 to the Indenture dated as of March 13, 2007, among Plains Exploration & Production Company, the Subsidiary Guarantors parties thereto and Wells Fargo Bank, N.A., as Trustee (relating to the 6.875% Senior Notes due 2023). | 8-K | 001-31470 | 10/26/2012 | |
4.17 | Eighteenth Supplemental Indenture dated as of May 31, 2013 to the Indenture dated as of March 13, 2007, among Freeport-McMoRan Oil & Gas LLC, as Successor Issuer, FCX Oil & Gas Inc., as Co-Issuer, FCX, as Parent Guarantor, Plains Exploration & Production Company, as Original Issuer, and Wells Fargo Bank, N.A., as Trustee (relating to the 6.625% Senior Notes due 2021, the 6.75% Senior Notes due 2022, the 6.125% Senior Notes due 2019, the 6.5% Senior Notes due 2020, and the 6.875% Senior Notes due 2023). | 8-K | 001-11307-01 | 6/3/2013 | |
4.18 | Nineteenth Supplemental Indenture dated as of September 30, 2016 to the Indenture dated as of March 13, 2007, among Freeport-McMoRan Oil & Gas LLC, as Successor Issuer, FCX Oil & Gas Inc., as Co-Issuer, FMSTP Inc., as Additional Co-Issuer, FCX, as Parent Guarantor, and Wells Fargo Bank, N.A., as Trustee (relating to the 6.125% Senior Notes due 2019, the 6.50% Senior Notes due 2020, the 6.625% Senior Notes due 2021, the 6.75% Senior Notes due 2022 and the 6.875% Senior Notes due 2023). | 10-Q | 001-11307-01 | 11/9/2016 | |
E-2
FREEPORT-McMoRan INC. | |||||
EXHIBIT INDEX | |||||
Filed | |||||
Exhibit | with this | Incorporated by Reference | |||
Number | Exhibit Title | Form 10-Q | Form | File No. | Date Filed |
4.19 | Twentieth Supplemental Indenture dated as of December 13, 2016 to the Indendture dated as of March 13, 2007, among Freeport-McMoRan Oil & Gas LLC, as Successor Issuer, FCX Oil & Gas LLC, as Co-Issuer, FMSTP Inc., as Additional Co-Issuer, FCX, as Parent Guarantor, and Wells Fargo Bank, N.A., as Trustee (relating to the 6.125% Senior Notes due 2019, the 6.50% Senior Notes due 2020, the 6.625% Senior Notes due 2021, the 6.75% Senior Notes due 2022 and the 6.875% Senior Notes due 2023). | 8-K | 001-11307-01 | 12/13/2016 | |
4.20 | Form of Indenture dated as of September 22, 1997, between Phelps Dodge Corporation and The Chase Manhattan Bank, as Trustee (relating to the 7.125% Senior Notes due 2027, the 9.50% Senior Notes due 2031, and the 6.125% Senior Notes due 2034). | S-3 | 333-36415 | 9/25/1997 | |
4.21 | Form of 7.125% Debenture due November 1, 2027 of Phelps Dodge Corporation issued on November 5, 1997, pursuant to the Indenture dated as of September 22, 1997, between Phelps Dodge Corporation and The Chase Manhattan Bank, as Trustee (relating to the 7.125% Senior Notes due 2027). | 8-K | 01-00082 | 11/3/1997 | |
4.22 | Form of 9.5% Note due June 1, 2031 of Phelps Dodge Corporation issued on May 30, 2001, pursuant to the Indenture dated as of September 22, 1997, between Phelps Dodge Corporation and First Union National Bank, as successor Trustee (relating to the 9.50% Senior Notes due 2031). | 8-K | 01-00082 | 5/30/2001 | |
4.23 | Form of 6.125% Note due March 15, 2034 of Phelps Dodge Corporation issued on March 4, 2004, pursuant to the Indenture dated as of September 22, 1997, between Phelps Dodge Corporation and First Union National Bank, as successor Trustee (relating to the 6.125% Senior Notes due 2034). | 10-K | 01-00082 | 3/7/2005 | |
4.24 | Supplemental Indenture dated as of April 4, 2007 to the Indenture dated as of September 22, 1997, among Phelps Dodge Corporation, as Issuer, Freeport-McMoRan Copper & Gold Inc., as Parent Guarantor, and U.S. Bank National Association, as Trustee (relating to the 7.125% Senior Notes due 2027, the 9.50% Senior Notes due 2031, and the 6.125% Senior Notes due 2034). | 10-K | 001-11307-01 | 2/26/2016 | |
4.25 | Indenture dated as of December 13, 2016, among FCX, Freeport-McMoRan Oil & Gas LLC, as guarantor, and U.S. Bank National Association, as Trustee (relating to the 6.125% Senior Notes due 2019, the 6.50% Senior Notes due 2020, the 6.625% Senior Notes due 2021, the 6.75% Senior Notes due 2022, and the 6.875% Senior Notes due 2023). | 8-K | 001-11307-01 | 12/13/2016 | |
4.26 | Registration Rights Agreement dated as of December 13, 2016 among FCX, Freeport-McMoRan Oil & Gas LLC, as Guarantor, and J.P. Morgan Securities LLC and Merrill Lynch, Pierce, Fenner & Smith Incorporated, as Dealer Managers, relating to the 6.125% Senior Notes due 2019. | 8-K | 001-11307-01 | 12/13/2016 | |
4.27 | Registration Rights Agreement dated as of December 13, 2016 among FCX, Freeport-McMoRan Oil & Gas LLC, as Guarantor, and J.P. Morgan Securities LLC and Merrill Lynch, Pierce, Fenner & Smith Incorporated, as Dealer Managers, relating to the 6.50% Senior Notes due 2020. | 8-K | 001-11307-01 | 12/13/2016 | |
E-3
FREEPORT-McMoRan INC. | |||||
EXHIBIT INDEX | |||||
Filed | |||||
Exhibit | with this | Incorporated by Reference | |||
Number | Exhibit Title | Form 10-Q | Form | File No. | Date Filed |
4.28 | Registration Rights Agreement dated as of December 13, 2016 among FCX, Freeport-McMoRan Oil & Gas LLC, as Guarantor, and J.P. Morgan Securities LLC and Merrill Lynch, Pierce, Fenner & Smith Incorporated, as Dealer Managers, relating to the 6.625% Senior Notes due 2021. | 8-K | 001-11307-01 | 12/13/2016 | |
4.29 | Registration Rights Agreement dated as of December 13, 2016 among FCX, Freeport-McMoRan Oil & Gas LLC, as Guarantor, and J.P. Morgan Securities LLC and Merrill Lynch, Pierce, Fenner & Smith Incorporated, as Dealer Managers, relating to the 6.75% Senior Notes due 2022. | 8-K | 001-11307-01 | 12/13/2016 | |
4.30 | Registration Rights Agreement dated as of December 13, 2016 among FCX, Freeport-McMoRan Oil & Gas LLC, as Guarantor, and J.P. Morgan Securities LLC and Merrill Lynch, Pierce, Fenner & Smith Incorporated, as Dealer Managers, relating to the 6.875% Senior Notes due 2023. | 8-K | 001-11307-01 | 12/13/2016 | |
Letter from Ernst & Young LLP regarding unaudited interim financial statements. | X | ||||
Certification of Principal Executive Officer pursuant to Rule 13a-14(a)/15d – 14(a). | X | ||||
Certification of Principal Financial Officer pursuant to Rule 13a-14(a)/15d – 14(a). | X | ||||
Certification of Principal Executive Officer pursuant to 18 U.S.C. Section 1350. | X | ||||
Certification of Principal Financial Officer pursuant to 18 U.S.C Section 1350. | X | ||||
Mine Safety and Health Administration Safety Data. | X | ||||
101.INS | XBRL Instance Document. | X | |||
101.SCH | XBRL Taxonomy Extension Schema. | X | |||
101.CAL | XBRL Taxonomy Extension Calculation Linkbase. | X | |||
101.DEF | XBRL Taxonomy Extension Definition Linkbase. | X | |||
101.LAB | XBRL Taxonomy Extension Label Linkbase. | X | |||
101.PRE | XBRL Taxonomy Extension Presentation Linkbase. | X | |||
* Indicates management contract or compensatory plan or arrangement.
Note: Certain instruments with respect to long-term debt of FCX have not been filed as exhibits to this Quarterly Report on Form 10-Q since the total amount of securities authorized under any such instrument does not exceed 10 percent of the total assets of FCX and its subsidiaries on a consolidated basis. FCX agrees to furnish a copy of each such instrument upon request of the Securities and Exchange Commission.
E-4