Attached files
| file | filename |
|---|---|
| EX-10.1 - EXHIBIT 10.1 - FREEPORT-MCMORAN INC | q215exhibit101.htm |
| EX-15.1 - EXHIBIT 15.1 - FREEPORT-MCMORAN INC | q215exhibit151.htm |
| EX-31.2 - EXHIBIT 31.2 - FREEPORT-MCMORAN INC | q215exhibit312.htm |
| EX-31.1 - EXHIBIT 31.1 - FREEPORT-MCMORAN INC | q215exhibit311.htm |
| EX-32.2 - EXHIBIT 32.2 - FREEPORT-MCMORAN INC | q215exhibit322.htm |
| EX-32.1 - EXHIBIT 32.1 - FREEPORT-MCMORAN INC | q215exhibit321.htm |
| EX-95.1 - EXHIBIT 95.1 - FREEPORT-MCMORAN INC | q215exhibit951.htm |
UNITED STATES | ||
SECURITIES AND EXCHANGE COMMISSION | ||
Washington, D.C. 20549 | ||
FORM 10-Q | ||
(Mark One) | ||
[X] QUARTERLY REPORT PURSUANT TO SECTION 13 OR 15(d) OF THE SECURITIES EXCHANGE ACT OF 1934 | ||
For the quarterly period ended June 30, 2015 | ||
OR | ||
[ ] TRANSITION REPORT PURSUANT TO SECTION 13 OR 15(d) OF THE SECURITIES EXCHANGE ACT OF 1934 | ||
For the transition period from | to | |
Commission File Number: 001-11307-01 | ||
Freeport-McMoRan Inc.
(Exact name of registrant as specified in its charter)
Delaware | 74-2480931 |
(State or other jurisdiction of | (I.R.S. Employer Identification No.) |
incorporation or organization) | |
333 North Central Avenue | |
Phoenix, AZ | 85004-2189 |
(Address of principal executive offices) | (Zip Code) |
(602) 366-8100 | |
(Registrant's telephone number, including area code) | |
Indicate by check mark whether the registrant (1) has filed all reports required to be filed by Section 13 or 15(d) of the Securities Exchange Act of 1934 during the preceding 12 months (or for such shorter period that the registrant was required to file such reports), and (2) has been subject to such filing requirements for the past 90 days.
þ Yes o No
Indicate by check mark whether the registrant has submitted electronically and posted on its corporate website, if any, every Interactive Data File required to be submitted and posted pursuant to Rule 405 of Regulation S-T (§ 232.405 of this chapter) during the preceding 12 months (or for such shorter period that the registrant was required to submit and post such files). þ Yes o No
Indicate by check mark whether the registrant is a large accelerated filer, an accelerated filer, a non-accelerated filer, or a smaller reporting company. See the definitions of “large accelerated filer,” “accelerated filer” and “smaller reporting company” in Rule 12b-2 of the Exchange Act.
Large accelerated filer þ Accelerated filer o Non-accelerated filer o Smaller reporting company o
Indicate by check mark whether the registrant is a shell company (as defined in Rule 12b-2 of the Exchange Act).
o Yes þ No
On July 31, 2015, there were issued and outstanding 1,040,228,261 shares of the registrant’s common stock, par value $0.10 per share.
FREEPORT-McMoRan INC.
TABLE OF CONTENTS
Page | |
2
Part I. | FINANCIAL INFORMATION |
Item 1. | Financial Statements. |
FREEPORT-McMoRan INC.
CONDENSED CONSOLIDATED BALANCE SHEETS (Unaudited)
June 30, 2015 | December 31, 2014 | ||||||
(In millions) | |||||||
ASSETS | |||||||
Current assets: | |||||||
Cash and cash equivalents | $ | 466 | $ | 464 | |||
Trade accounts receivable | 949 | 953 | |||||
Other accounts receivable | 1,323 | 1,610 | |||||
Inventories: | |||||||
Materials and supplies, net | 2,014 | 1,886 | |||||
Mill and leach stockpiles | 1,933 | 1,914 | |||||
Product | 1,484 | 1,561 | |||||
Other current assets | 528 | 657 | |||||
Total current assets | 8,697 | 9,045 | |||||
Property, plant, equipment and mining development costs, net | 27,095 | 26,220 | |||||
Oil and gas properties, net - full cost method | |||||||
Subject to amortization, less accumulated amortization | 4,649 | 9,187 | |||||
Not subject to amortization | 9,312 | 10,087 | |||||
Long-term mill and leach stockpiles | 2,277 | 2,179 | |||||
Other assets | 1,978 | 1,956 | |||||
Total assets | $ | 54,008 | $ | 58,674 | |||
LIABILITIES AND EQUITY | |||||||
Current liabilities: | |||||||
Accounts payable and accrued liabilities | $ | 3,376 | $ | 3,653 | |||
Current portion of debt | 791 | 478 | |||||
Current portion of environmental and asset retirement obligations | 330 | 296 | |||||
Dividends payable | 175 | 335 | |||||
Accrued income taxes | 67 | 410 | |||||
Total current liabilities | 4,739 | 5,172 | |||||
Long-term debt, less current portion | 20,111 | 18,371 | |||||
Deferred income taxes | 4,870 | 6,398 | |||||
Environmental and asset retirement obligations, less current portion | 3,716 | 3,647 | |||||
Other liabilities | 1,760 | 1,861 | |||||
Total liabilities | 35,196 | 35,449 | |||||
Redeemable noncontrolling interest | 757 | 751 | |||||
Equity: | |||||||
Stockholders’ equity: | |||||||
Common stock | 117 | 117 | |||||
Capital in excess of par value | 22,330 | 22,281 | |||||
(Accumulated deficit) retained earnings | (4,417 | ) | 128 | ||||
Accumulated other comprehensive loss | (523 | ) | (544 | ) | |||
Common stock held in treasury | (3,702 | ) | (3,695 | ) | |||
Total stockholders’ equity | 13,805 | 18,287 | |||||
Noncontrolling interests | 4,250 | 4,187 | |||||
Total equity | 18,055 | 22,474 | |||||
Total liabilities and equity | $ | 54,008 | $ | 58,674 | |||
The accompanying notes are an integral part of these consolidated financial statements.
3
FREEPORT-McMoRan INC.
CONSOLIDATED STATEMENTS OF OPERATIONS (Unaudited)
Three Months Ended | Six Months Ended | ||||||||||||||
June 30, | June 30, | ||||||||||||||
2015 | 2014 | 2015 | 2014 | ||||||||||||
(In millions, except per share amounts) | |||||||||||||||
Revenues | $ | 4,248 | $ | 5,522 | $ | 8,401 | $ | 10,507 | |||||||
Cost of sales: | |||||||||||||||
Production and delivery | 2,848 | 3,082 | 5,760 | 5,819 | |||||||||||
Depreciation, depletion and amortization | 890 | 1,013 | 1,829 | 1,979 | |||||||||||
Impairment of oil and gas properties | 2,686 | — | 5,790 | — | |||||||||||
Total cost of sales | 6,424 | 4,095 | 13,379 | 7,798 | |||||||||||
Selling, general and administrative expenses | 151 | 164 | 305 | 299 | |||||||||||
Mining exploration and research expenses | 36 | 34 | 69 | 64 | |||||||||||
Environmental obligations and shutdown costs | 11 | 76 | 24 | 82 | |||||||||||
Net gain on sale of assets | — | — | (39 | ) | — | ||||||||||
Total costs and expenses | 6,622 | 4,369 | 13,738 | 8,243 | |||||||||||
Operating (loss) income | (2,374 | ) | 1,153 | (5,337 | ) | 2,264 | |||||||||
Interest expense, net | (149 | ) | (164 | ) | (295 | ) | (325 | ) | |||||||
Insurance and other third-party recoveries | 92 | — | 92 | — | |||||||||||
Net gain on early extinguishment of debt | — | 5 | — | 5 | |||||||||||
Other (expense) income, net | (55 | ) | (8 | ) | (48 | ) | 25 | ||||||||
(Loss) income before income taxes and equity in affiliated companies' net earnings | (2,486 | ) | 986 | (5,588 | ) | 1,969 | |||||||||
Benefit from (provision for) income taxes | 687 | (328 | ) | 1,382 | (685 | ) | |||||||||
Equity in affiliated companies’ net earnings | — | 2 | 1 | 2 | |||||||||||
Net (loss) income | (1,799 | ) | 660 | (4,205 | ) | 1,286 | |||||||||
Net income attributable to noncontrolling interests | (42 | ) | (168 | ) | (100 | ) | (274 | ) | |||||||
Preferred dividends attributable to redeemable noncontrolling interest | (10 | ) | (10 | ) | (20 | ) | (20 | ) | |||||||
Net (loss) income attributable to common stockholders | $ | (1,851 | ) | $ | 482 | $ | (4,325 | ) | $ | 992 | |||||
Net (loss) income per share attributable to common stockholders: | |||||||||||||||
Basic | $ | (1.78 | ) | $ | 0.46 | $ | (4.16 | ) | $ | 0.95 | |||||
Diluted | $ | (1.78 | ) | $ | 0.46 | $ | (4.16 | ) | $ | 0.95 | |||||
Weighted-average common shares outstanding: | |||||||||||||||
Basic | 1,040 | 1,039 | 1,040 | 1,039 | |||||||||||
Diluted | 1,040 | 1,045 | 1,040 | 1,045 | |||||||||||
Dividends declared per share of common stock | $ | 0.1605 | $ | 0.3125 | $ | 0.2105 | $ | 0.6250 | |||||||
The accompanying notes are an integral part of these consolidated financial statements.
4
FREEPORT-McMoRan INC.
CONSOLIDATED STATEMENTS OF COMPREHENSIVE (LOSS) INCOME (Unaudited)
Three Months Ended | Six Months Ended | |||||||||||||||
June 30, | June 30, | |||||||||||||||
2015 | 2014 | 2015 | 2014 | |||||||||||||
(In millions) | ||||||||||||||||
Net (loss) income | $ | (1,799 | ) | $ | 660 | $ | (4,205 | ) | $ | 1,286 | ||||||
Other comprehensive income, net of taxes: | ||||||||||||||||
Defined benefit plans: | ||||||||||||||||
Amortization of unrecognized amounts included in net periodic benefit costs | 8 | 4 | 16 | 7 | ||||||||||||
Foreign exchange gains (losses) | 1 | (3 | ) | 5 | (3 | ) | ||||||||||
Other comprehensive income | 9 | 1 | 21 | 4 | ||||||||||||
Total comprehensive (loss) income | (1,790 | ) | 661 | (4,184 | ) | 1,290 | ||||||||||
Total comprehensive income attributable to noncontrolling interests | (42 | ) | (168 | ) | (100 | ) | (274 | ) | ||||||||
Preferred dividends attributable to redeemable noncontrolling interest | (10 | ) | (10 | ) | (20 | ) | (20 | ) | ||||||||
Total comprehensive (loss) income attributable to common stockholders | $ | (1,842 | ) | $ | 483 | $ | (4,304 | ) | $ | 996 | ||||||
The accompanying notes are an integral part of these consolidated financial statements.
5
FREEPORT-McMoRan INC.
CONSOLIDATED STATEMENTS OF CASH FLOWS (Unaudited)
Six Months Ended | ||||||||
June 30, | ||||||||
2015 | 2014 | |||||||
(In millions) | ||||||||
Cash flow from operating activities: | ||||||||
Net (loss) income | $ | (4,205 | ) | $ | 1,286 | |||
Adjustments to reconcile net (loss) income to net cash provided by operating activities: | ||||||||
Depreciation, depletion and amortization | 1,829 | 1,979 | ||||||
Impairment of oil and gas properties | 5,790 | — | ||||||
Lower of cost or market inventory adjustments | 63 | — | ||||||
Net gain on sale of assets | (39 | ) | — | |||||
Net (gains) losses on crude oil and natural gas derivative contracts | (58 | ) | 120 | |||||
Net charges for environmental and asset retirement obligations, including accretion | 109 | 97 | ||||||
Payments for environmental and asset retirement obligations | (81 | ) | (96 | ) | ||||
Net gain on early extinguishment of debt | — | (5 | ) | |||||
Deferred income taxes | (1,432 | ) | 37 | |||||
Increase in long-term mill and leach stockpiles | (104 | ) | (131 | ) | ||||
Other, net | 104 | 77 | ||||||
Changes in working capital and other tax payments, excluding amounts from acquisitions and disposition: | ||||||||
Accounts receivable | 493 | (243 | ) | |||||
Inventories | 8 | (230 | ) | |||||
Other current assets | (1 | ) | 35 | |||||
Accounts payable and accrued liabilities | (205 | ) | (186 | ) | ||||
Accrued income taxes and changes in other tax payments | (485 | ) | (153 | ) | ||||
Net cash provided by operating activities | 1,786 | 2,587 | ||||||
Cash flow from investing activities: | ||||||||
Capital expenditures: | ||||||||
North America copper mines | (214 | ) | (627 | ) | ||||
South America | (902 | ) | (839 | ) | ||||
Indonesia | (438 | ) | (479 | ) | ||||
Africa | (97 | ) | (60 | ) | ||||
Molybdenum mines | (7 | ) | (33 | ) | ||||
United States oil and gas operations | (1,795 | ) | (1,484 | ) | ||||
Other | (75 | ) | (40 | ) | ||||
Acquisition of Deepwater Gulf of Mexico interests | — | (925 | ) | |||||
Net proceeds from sale of Eagle Ford shale assets | — | 3,009 | ||||||
Other, net | 136 | (363 | ) | |||||
Net cash used in investing activities | (3,392 | ) | (1,841 | ) | ||||
Cash flow from financing activities: | ||||||||
Proceeds from debt | 4,422 | 1,248 | ||||||
Repayments of debt | (2,360 | ) | (1,611 | ) | ||||
Cash dividends and distributions paid: | ||||||||
Common stock | (380 | ) | (653 | ) | ||||
Noncontrolling interests | (60 | ) | (250 | ) | ||||
Stock-based awards net (payments) proceeds, including excess tax benefit | (7 | ) | 3 | |||||
Debt financing costs and other, net | (7 | ) | (10 | ) | ||||
Net cash provided by (used in) financing activities | 1,608 | (1,273 | ) | |||||
Net increase (decrease) in cash and cash equivalents | 2 | (527 | ) | |||||
Cash and cash equivalents at beginning of year | 464 | 1,985 | ||||||
Cash and cash equivalents at end of period | $ | 466 | $ | 1,458 | ||||
The accompanying notes are an integral part of these consolidated financial statements.
6
FREEPORT-McMoRan INC.
CONSOLIDATED STATEMENT OF EQUITY (Unaudited)
Stockholders’ Equity | |||||||||||||||||||||||||||||||||||||
Common Stock | Retained Earnings(Accum-ulated Deficit) | Accumu- lated Other Compre- hensive Loss | Common Stock Held in Treasury | Total Stock-holders' Equity | |||||||||||||||||||||||||||||||||
Number of Shares | At Par Value | Capital in Excess of Par Value | Number of Shares | At Cost | Non- controlling Interests | Total Equity | |||||||||||||||||||||||||||||||
(In millions) | |||||||||||||||||||||||||||||||||||||
Balance at December 31, 2014 | 1,167 | $ | 117 | $ | 22,281 | $ | 128 | $ | (544 | ) | 128 | $ | (3,695 | ) | $ | 18,287 | $ | 4,187 | $ | 22,474 | |||||||||||||||||
Exercised and issued stock-based awards | 1 | — | 3 | — | — | — | — | 3 | — | 3 | |||||||||||||||||||||||||||
Stock-based compensation | — | — | 50 | — | — | — | — | 50 | 7 | 57 | |||||||||||||||||||||||||||
Reserve of tax benefit for stock-based awards | — | — | (2 | ) | — | — | — | — | (2 | ) | — | (2 | ) | ||||||||||||||||||||||||
Tender of shares for stock-based awards | — | — | — | — | — | — | (7 | ) | (7 | ) | — | (7 | ) | ||||||||||||||||||||||||
Dividends on common stock | — | — | — | (220 | ) | — | — | — | (220 | ) | — | (220 | ) | ||||||||||||||||||||||||
Dividends to noncontrolling interests | — | — | — | — | — | — | — | — | (46 | ) | (46 | ) | |||||||||||||||||||||||||
Noncontrolling interests' share of contributed capital in subsidiary | — | — | (2 | ) | — | — | — | — | (2 | ) | 2 | — | |||||||||||||||||||||||||
Net loss attributable to common stockholders | — | — | — | (4,325 | ) | — | — | — | (4,325 | ) | — | (4,325 | ) | ||||||||||||||||||||||||
Net income attributable to noncontrolling interests | — | — | — | — | — | — | — | — | 100 | 100 | |||||||||||||||||||||||||||
Other comprehensive income | — | — | — | — | 21 | — | — | 21 | — | 21 | |||||||||||||||||||||||||||
Balance at June 30, 2015 | 1,168 | $ | 117 | $ | 22,330 | $ | (4,417 | ) | $ | (523 | ) | 128 | $ | (3,702 | ) | $ | 13,805 | $ | 4,250 | $ | 18,055 | ||||||||||||||||
The accompanying notes are an integral part of these consolidated financial statements.
7
FREEPORT-McMoRan INC.
NOTES TO CONSOLIDATED FINANCIAL STATEMENTS (Unaudited)
NOTE 1. GENERAL INFORMATION
The accompanying unaudited consolidated financial statements have been prepared in accordance with the instructions to Form 10-Q and do not include all information and disclosures required by generally accepted accounting principles (GAAP) in the United States (U.S.). Therefore, this information should be read in conjunction with Freeport-McMoRan Inc.'s (FCX) consolidated financial statements and notes contained in its annual report on Form 10-K for the year ended December 31, 2014. The information furnished herein reflects all adjustments that are, in the opinion of management, necessary for a fair statement of the results for the interim periods reported. With the exception of the oil and gas properties impairment discussed below and the related tax charge to establish a deferred tax valuation allowance, all such adjustments are, in the opinion of management, of a normal recurring nature. Operating results for the quarter and six months ended June 30, 2015, are not necessarily indicative of the results that may be expected for the year ending December 31, 2015.
Oil and Gas Properties. Under the U.S. Securities and Exchange Commission's (SEC) full cost accounting rules, FCX reviews the carrying value of its oil and gas properties each quarter on a country-by-country basis. Under these rules, capitalized costs of oil and gas properties (net of accumulated depreciation, depletion, amortization and impairment, and related deferred income taxes) for each cost center may not exceed a “ceiling” equal to:
• | the present value, discounted at 10 percent, of estimated future net cash flows from the related proved oil and natural gas reserves, net of estimated future income taxes; plus |
• | the cost of the related unproved properties not being amortized; plus |
• | the lower of cost or estimated fair value of the related unproved properties included in the costs being amortized (net of related tax effects). |
These rules require that FCX price its future oil and gas production at the twelve-month average of the first-day-of-the-month historical reference prices as adjusted for location and quality differentials. FCX's reference prices are West Texas Intermediate (WTI) for oil and the Henry Hub spot price for natural gas. Such prices are utilized except where different prices are fixed and determinable from applicable contracts for the remaining term of those contracts. The reserve estimates exclude the effect of any crude oil derivatives FCX has in place. The estimated future net cash flows also exclude future cash outflows associated with settling asset retirement obligations included in the net book value of the oil and gas properties. The rules require an impairment if the capitalized costs exceed this “ceiling.”
At June 30, 2015, and March 31, 2015, net capitalized costs with respect to FCX's proved U.S. oil and gas properties exceeded the related ceiling test limitation; therefore, impairment charges of $2.7 billion were recorded in second-quarter 2015 and $5.8 billion for the first six months of 2015, primarily because of the lower twelve-month average of the first-day-of-the-month historical reference oil price and higher capitalized costs at such dates. The SEC requires that the twelve-month average of the first-day-of-the-month historical reference oil price be used in determining the ceiling amount under its full cost accounting rules. This price (using WTI as the reference oil price) was $71.68 per barrel at June 30, 2015 (the twelve-month average was $82.72 per barrel at March 31, 2015).
NOTE 2. ACQUISITIONS AND DISPOSITIONS
Eagle Ford Disposition. On June 20, 2014, FCX completed the sale of its Eagle Ford shale assets to a subsidiary of Encana Corporation for cash consideration of $3.1 billion, before closing adjustments from the April 1, 2014, effective date. Under full cost accounting rules, the proceeds were recorded as a reduction of capitalized oil and gas properties, with no gain or loss recognition, except for $58 million of deferred tax expense recorded in connection with the allocation of $221 million of goodwill (for which deferred taxes were not previously provided) to the Eagle Ford shale assets. Approximately $1.3 billion of proceeds from this transaction was placed in a like-kind exchange escrow and was used to reinvest in additional Deepwater Gulf of Mexico (GOM) oil and gas interests, as discussed below and in Note 2 of FCX's annual report on Form 10-K for the year ended December 31, 2014. The remaining proceeds were used to repay debt.
Deepwater GOM Acquisition. On June 30, 2014, FCX completed the acquisition of interests in the Deepwater GOM from a subsidiary of Apache Corporation, including interests in the Lucius and Heidelberg oil fields and several exploration leases, for $918 million ($451 million for oil and gas properties subject to amortization and $477 million for costs not subject to amortization, including transaction costs and $10 million of asset retirement costs). The Deepwater GOM acquisition was funded by the like-kind exchange escrow.
8
NOTE 3. EARNINGS PER SHARE
FCX’s basic net (loss) income per share of common stock was computed by dividing net (loss) income attributable to common stockholders by the weighted-average shares of common stock outstanding during the period. Diluted net income per share of common stock was computed using the most dilutive of (a) the two-class method or (b) the treasury stock method. Under the two-class method, net income is allocated to each class of common stock and participating securities as if all of the earnings for the period had been distributed. FCX’s participating securities consist of vested restricted stock units (RSUs) for which the underlying common shares are not yet issued and entitle holders to non-forfeitable dividends.
A reconciliation of net (loss) income and weighted-average shares of common stock outstanding for purposes of calculating basic and diluted net (loss) income per share follows (in millions, except per share amounts):
Three Months Ended | Six Months Ended | |||||||||||||||
June 30, | June 30, | |||||||||||||||
2015 | 2014 | 2015 | 2014 | |||||||||||||
Net (loss) income | $ | (1,799 | ) | $ | 660 | $ | (4,205 | ) | $ | 1,286 | ||||||
Net income attributable to noncontrolling interests | (42 | ) | (168 | ) | (100 | ) | (274 | ) | ||||||||
Preferred dividends on redeemable noncontrolling interest | (10 | ) | (10 | ) | (20 | ) | (20 | ) | ||||||||
Undistributed earnings allocable to participating securities | (3 | ) | (2 | ) | (3 | ) | (3 | ) | ||||||||
Net (loss) income allocable to common stockholders | $ | (1,854 | ) | $ | 480 | $ | (4,328 | ) | $ | 989 | ||||||
Basic weighted-average shares of common stock outstanding | 1,040 | 1,039 | 1,040 | 1,039 | ||||||||||||
Add shares issuable upon exercise or vesting of dilutive stock options and RSUs | — | a | 6 | a | — | a | 6 | a | ||||||||
Diluted weighted-average shares of common stock outstanding | 1,040 | 1,045 | 1,040 | 1,045 | ||||||||||||
Basic net (loss) income per share attributable to common stockholders | $ | (1.78 | ) | $ | 0.46 | $ | (4.16 | ) | $ | 0.95 | ||||||
Diluted net (loss) income per share attributable to common stockholders | $ | (1.78 | ) | $ | 0.46 | $ | (4.16 | ) | $ | 0.95 | ||||||
a. | Excludes approximately four million shares of common stock for both the quarter and six months ended June 30, 2015, and three million shares of common stock for both the quarter and six months ended June 30, 2014, associated with outstanding stock options with exercise prices less than the average market price of FCX's common stock and RSUs that were anti-dilutive. |
Outstanding stock options with exercise prices greater than the average market price of FCX’s common stock during the period are excluded from the computation of diluted net income per share of common stock. Excluded stock options totaled 40 million for both the quarter and six months ended June 30, 2015, and 30 million for both the quarter and six months ended June 30, 2014.
9
NOTE 4. INVENTORIES, INCLUDING LONG-TERM MILL AND LEACH STOCKPILES
The components of inventories follow (in millions):
June 30, 2015 | December 31, 2014 | |||||||
Current inventories: | ||||||||
Mill stockpiles | $ | 130 | $ | 86 | ||||
Leach stockpiles | 1,803 | 1,828 | ||||||
Total current mill and leach stockpiles | $ | 1,933 | $ | 1,914 | ||||
Total materials and supplies, neta | $ | 2,014 | $ | 1,886 | ||||
Raw materials (primarily concentrates) | $ | 306 | $ | 288 | ||||
Work-in-process | 155 | 174 | ||||||
Finished goods | 1,023 | 1,099 | ||||||
Total product inventories | $ | 1,484 | $ | 1,561 | ||||
Long-term inventories: | ||||||||
Mill stockpiles | $ | 361 | $ | 360 | ||||
Leach stockpiles | 1,916 | 1,819 | ||||||
Total long-term mill and leach stockpilesb | $ | 2,277 | $ | 2,179 | ||||
a. | Materials and supplies inventory was net of obsolescence reserves totaling $25 million at June 30, 2015, and $20 million at December 31, 2014. |
b. | Estimated metals in stockpiles not expected to be recovered within the next 12 months. |
FCX recorded charges for lower of cost or market (LCM) inventory adjustments of $59 million ($48 million for molybdenum inventories and $11 million for copper inventories) for second-quarter 2015 and $63 million ($52 million for molybdenum inventories and $11 million for copper inventories) for the first six months of 2015, primarily because of lower molybdenum and copper prices.
NOTE 5. INCOME TAXES
Variations in the relative proportions of jurisdictional income result in fluctuations to FCX's consolidated effective income tax rate. FCX’s consolidated effective income tax rate was 25 percent for the first six months of 2015 and 35 percent for the first six months of 2014. Geographic sources of FCX's (benefit from) provision for income taxes follow (in millions):
Three Months Ended | Six Months Ended | |||||||||||||||
June 30, | June 30, | |||||||||||||||
2015 | 2014 | 2015 | 2014 | |||||||||||||
U.S. operations | $ | (829 | ) | a | $ | 149 | b | $ | (1,664 | ) | a | $ | 285 | b | ||
International operations | 142 | 179 | 282 | 400 | ||||||||||||
Total | $ | (687 | ) | $ | 328 | $ | (1,382 | ) | $ | 685 | ||||||
a. | As a result of the impairment to oil and gas properties, FCX recorded tax charges of $305 million for second-quarter 2015 and $763 million for the first six months of 2015 to establish a valuation allowance primarily against U.S. federal alternative minimum tax credits. Excluding this charge, FCX's consolidated effective income tax rate was 38 percent for the first six months of 2015. |
b. | FCX recognized a $58 million charge for deferred taxes recorded in connection with the allocation of goodwill to the sale of Eagle Ford shale assets. |
10
NOTE 6. DEBT AND EQUITY TRANSACTIONS
Debt Transactions. At June 30, 2015, FCX had $20.9 billion in debt, which included additions for unamortized fair value adjustments of $225 million (primarily from the oil and gas acquisitions in 2013), and is net of reductions attributable to unamortized net discounts of $21 million and unamortized debt issuance costs of $116 million. Refer to Note 12 for discussion of a change in the presentation of debt issuance costs.
In February 2015, FCX's unsecured revolving credit facility and $4.0 billion bank term loan (Term Loan) were modified to amend the maximum total leverage ratio. In addition, the Term Loan amortization schedule was extended such that, as amended, the Term Loan’s scheduled payments total $205 million in 2016, $272 million in 2017, $1.0 billion in 2018, $313 million in 2019 and $1.3 billion in 2020, compared with the previous amortization schedule of $650 million in 2016, $200 million in 2017 and $2.2 billion in 2018.
At June 30, 2015, $985 million was outstanding and $42 million of letters of credit were issued under FCX's revolving credit facility, resulting in availability of approximately $3.0 billion, of which approximately $1.5 billion could be used for additional letters of credit.
At June 30, 2015, $1.3 billion was outstanding and no letters of credit were issued under Sociedad Minera Cerro Verde S.A.A.'s (Cerro Verde, FCX's mining subsidiary in Peru) credit facility, resulting in availability of $531 million. Cerro Verde's five-year, $1.8 billion senior unsecured credit facility is nonrecourse to FCX and the other shareholders of Cerro Verde.
In April 2014, FCX redeemed $210 million of the aggregate principal amount of FCX Oil & Gas Inc.'s (FM O&G, FCX's oil and gas subsidiary) outstanding 6.625% Senior Notes due 2021. In accordance with the terms of the senior notes, the redemption was funded with cash contributions to FM O&G by FCX in exchange for additional equity, which is eliminated in the consolidated financial statements. Holders of these senior notes received the principal amount together with the redemption premium and accrued and unpaid interest to the redemption date. As a result of the redemption, FCX recorded a gain on early extinguishment of debt of $6 million in second-quarter 2014.
Consolidated interest expense (excluding capitalized interest) totaled $215 million in second-quarter 2015, $225 million in second-quarter 2014, $425 million for the first six months of 2015 and $449 million for the first six months of 2014. Capitalized interest added to property, plant, equipment and mining development costs, net, totaled $47 million in second-quarter 2015, $39 million in second-quarter 2014, $92 million for the first six months of 2015 and $79 million for the first six months of 2014. Capitalized interest added to oil and gas properties not subject to amortization totaled $19 million in second-quarter 2015, $22 million in second-quarter 2014, $38 million for the first six months of 2015 and $45 million for the first six months of 2014.
Equity Transactions. On June 24, 2015, FCX's Board of Directors (the Board) declared a dividend of $0.1605 per share, which was paid on August 3, 2015, to common shareholders of record at the close of business on July 15, 2015. This common stock dividend consisted of $0.05 per share for FCX's regular quarterly dividend and $0.1105 per share as a one-time special dividend related to the settlement of the shareholder derivative litigation (refer to Note 9 for further discussion).
11
NOTE 7. FINANCIAL INSTRUMENTS
FCX does not purchase, hold or sell derivative financial instruments unless there is an existing asset or obligation, or it anticipates a future activity that is likely to occur and will result in exposure to market risks, which FCX intends to offset or mitigate. FCX does not enter into any derivative financial instruments for speculative purposes, but has entered into derivative financial instruments in limited instances to achieve specific objectives. These objectives principally relate to managing risks associated with commodity price changes, foreign currency exchange rates and interest rates.
Commodity Contracts. From time to time, FCX has entered into derivative contracts to hedge the market risk associated with fluctuations in the prices of commodities it purchases and sells. As a result of the acquisition of the oil and gas business in 2013, FCX assumed a variety of crude oil and natural gas commodity derivatives to hedge the exposure to the volatility of crude oil and natural gas commodity prices. Derivative financial instruments used by FCX to manage its risks do not contain credit risk-related contingent provisions. As of June 30, 2015, and December 31, 2014, FCX had no price protection contracts relating to its mine production. A discussion of FCX’s derivative contracts and programs follows.
Derivatives Designated as Hedging Instruments – Fair Value Hedges
Copper Futures and Swap Contracts. Some of FCX’s U.S. copper rod customers request a fixed market price instead of the Commodity Exchange Inc. (COMEX), a division of the New York Mercantile Exchange, average copper price in the month of shipment. FCX hedges this price exposure in a manner that allows it to receive the COMEX average price in the month of shipment while the customers pay the fixed price they requested. FCX accomplishes this by entering into copper futures or swap contracts. Hedging gains or losses from these copper futures and swap contracts are recorded in revenues. FCX did not have any significant gains or losses during the three-month or six-month periods ended June 30, 2015 and 2014, resulting from hedge ineffectiveness. At June 30, 2015, FCX held copper futures and swap contracts that qualified for hedge accounting for 51 million pounds at an average contract price of $2.71 per pound, with maturities through May 2017.
A summary of gains (losses) recognized in revenues for derivative financial instruments related to commodity contracts that are designated and qualify as fair value hedge transactions, along with the unrealized gains (losses) on the related hedged item follows (in millions):
Three Months Ended | Six Months Ended | ||||||||||||||
June 30, | June 30, | ||||||||||||||
2015 | 2014 | 2015 | 2014 | ||||||||||||
Copper futures and swap contracts: | |||||||||||||||
Unrealized gains (losses): | |||||||||||||||
Derivative financial instruments | $ | (4 | ) | $ | 12 | $ | 2 | $ | — | ||||||
Hedged item – firm sales commitments | 4 | (12 | ) | (2 | ) | — | |||||||||
Realized (losses) gains: | |||||||||||||||
Matured derivative financial instruments | (1 | ) | (2 | ) | (11 | ) | (4 | ) | |||||||
Derivatives Not Designated as Hedging Instruments
Embedded Derivatives. As described in Note 1 to FCX's annual report on Form 10-K for the year ended December 31, 2014, under “Revenue Recognition,” certain FCX copper concentrate, copper cathode and gold sales contracts provide for provisional pricing primarily based on the London Metal Exchange (LME) copper price or the COMEX copper price and the London Bullion Market Association (London) gold price at the time of shipment as specified in the contract. Similarly, FCX purchases copper under contracts that provide for provisional pricing. FCX applies the normal purchases and normal sales scope exception in accordance with derivatives and hedge accounting guidance to the host sales agreements since the contracts do not allow for net settlement and always result in physical delivery. Sales and purchases with a provisional sales price contain an embedded derivative (i.e., the price settlement mechanism is settled after the time of delivery) that is required to be bifurcated from the host contract. The host contract is the sale or purchase of the metals contained in the concentrates or cathodes at the then-current LME or COMEX copper price or the London gold price as defined in the contract. Mark-to-market price fluctuations from these embedded derivatives are recorded through the settlement date and are reflected in revenues for sales contracts and in cost of sales as production and delivery costs for purchase contracts.
12
A summary of FCX’s embedded commodity derivatives at June 30, 2015, follows:
Open Positions | Average Price Per Unit | Maturities Through | ||||||||||
Contract | Market | |||||||||||
Embedded derivatives in provisional sales contracts: | ||||||||||||
Copper (millions of pounds) | 572 | $ | 2.68 | $ | 2.58 | November 2015 | ||||||
Gold (thousands of ounces) | 229 | 1,189 | 1,174 | September 2015 | ||||||||
Embedded derivatives in provisional purchase contracts: | ||||||||||||
Copper (millions of pounds) | 134 | 2.75 | 2.61 | October 2015 | ||||||||
Crude Oil Contracts. As a result of the acquisition of the oil and gas business, FCX has derivative contracts extending through 2015 that consist of crude oil options. These crude oil derivatives are not designated as hedging instruments and are recorded at fair value with the mark-to-market gains and losses recorded in revenues.
The crude oil options were entered into by the oil and gas business to protect the realized price of a portion of expected future sales in order to limit the effects of crude oil price decreases. At June 30, 2015, these contracts are composed of crude oil put spreads consisting of put options with a floor limit. The premiums associated with put options are deferred until the settlement period. At June 30, 2015, the deferred option premiums and accrued interest associated with the crude oil option contracts totaled $106 million, which was included as a component of the fair value of the crude oil options contracts. At June 30, 2015, the outstanding 2015 crude oil option contracts, which settle monthly and cover approximately 15.5 million barrels over the remainder of 2015, follow:
Daily Volumes (thousand barrels) | Average Strike Price (per barrel)a | Weighted-Average Deferred Premium (per barrel) | |||||||||||||||||
2015 Period | Instrument Type | Floor | Floor Limit | Index | |||||||||||||||
July - December | Put optionsb | 84 | $ | 90 | $ | 70 | $ | 6.89 | Brent | ||||||||||
a. | The average strike prices do not reflect any premiums to purchase the put options. |
b. | If the index price is less than the per barrel floor, FCX receives the difference between the per barrel floor and the index price up to a maximum of $20 per barrel less the option premium. If the index price is at or above the per barrel floor, FCX pays the option premium and no cash settlement is received. |
Copper Forward Contracts. Atlantic Copper, FCX's wholly owned smelting and refining unit in Spain, enters into copper forward contracts designed to hedge its copper price risk whenever its physical purchases and sales pricing periods do not match. These economic hedge transactions are intended to hedge against changes in copper prices, with the mark-to-market hedging gains or losses recorded in cost of sales. At June 30, 2015, Atlantic Copper held net copper forward purchase contracts for 31 million pounds at an average contract price of $2.65 per pound, with maturities through August 2015.
13
Summary of (Losses) Gains. A summary of the realized and unrealized (losses) gains recognized in (loss) income before income taxes and equity in affiliated companies’ net earnings for commodity contracts that do not qualify as hedge transactions, including embedded derivatives, follows (in millions):
Three Months Ended | Six Months Ended | ||||||||||||||
June 30, | June 30, | ||||||||||||||
2015 | 2014 | 2015 | 2014 | ||||||||||||
Embedded derivatives in provisional copper and gold | |||||||||||||||
sales contractsa | $ | (78 | ) | $ | 84 | $ | (150 | ) | $ | (85 | ) | ||||
Crude oil optionsa | 6 | (68 | ) | 58 | (104 | ) | |||||||||
Natural gas swapsa | — | (2 | ) | — | (16 | ) | |||||||||
Copper forward contractsb | (6 | ) | 4 | (7 | ) | 5 | |||||||||
a. | Amounts recorded in revenues. |
b. | Amounts recorded in cost of sales as production and delivery costs. |
Unsettled Derivative Financial Instruments
A summary of the fair values of unsettled commodity derivative financial instruments follows (in millions):
June 30, 2015 | December 31, 2014 | |||||||
Commodity Derivative Assets: | ||||||||
Derivatives not designated as hedging instruments: | ||||||||
Embedded derivatives in provisional copper and gold | ||||||||
sales/purchase contracts | $ | 21 | $ | 15 | ||||
Crude oil optionsa | 174 | 316 | ||||||
Total derivative assets | $ | 195 | $ | 331 | ||||
Commodity Derivative Liabilities: | ||||||||
Derivatives designated as hedging instruments: | ||||||||
Copper futures and swap contractsb | $ | 5 | $ | 7 | ||||
Derivatives not designated as hedging instruments: | ||||||||
Embedded derivatives in provisional copper and gold | ||||||||
sales/purchase contracts | 65 | 93 | ||||||
Copper forward contracts | 1 | — | ||||||
Total derivative liabilities | $ | 71 | $ | 100 | ||||
a. | Amounts are net of $106 million at June 30, 2015, and $210 million at December 31, 2014, for deferred premiums and accrued interest. |
b. | FCX paid $9 million to brokers at June 30, 2015, and $10 million at December 31, 2014, for margin requirements (recorded in other current assets). |
14
FCX's commodity contracts have netting arrangements with counterparties with which the right of offset exists, and it is FCX's policy to offset balances by counterparty on the balance sheet. FCX's embedded derivatives on provisional sales/purchases are netted with the corresponding outstanding receivable/payable balances. A summary of these unsettled commodity contracts that are offset in the balance sheet follows (in millions):
Assets | Liabilities | |||||||||||||||
June 30, 2015 | December 31, 2014 | June 30, 2015 | December 31, 2014 | |||||||||||||
Gross amounts recognized: | ||||||||||||||||
Commodity contracts: | ||||||||||||||||
Embedded derivatives in provisional | ||||||||||||||||
sales/purchase contracts | $ | 21 | $ | 15 | $ | 65 | $ | 93 | ||||||||
Crude oil derivatives | 174 | 316 | — | — | ||||||||||||
Copper derivatives | — | — | 6 | 7 | ||||||||||||
195 | 331 | 71 | 100 | |||||||||||||
Less gross amounts of offset: | ||||||||||||||||
Commodity contracts: | ||||||||||||||||
Embedded derivatives in provisional | ||||||||||||||||
sales/purchase contracts | 1 | 1 | 1 | 1 | ||||||||||||
Copper derivatives | — | — | — | — | ||||||||||||
1 | 1 | 1 | 1 | |||||||||||||
Net amounts presented in balance sheet: | ||||||||||||||||
Commodity contracts: | ||||||||||||||||
Embedded derivatives in provisional | ||||||||||||||||
sales/purchase contracts | 20 | 14 | 64 | 92 | ||||||||||||
Crude oil derivatives | 174 | 316 | — | — | ||||||||||||
Copper derivatives | — | — | 6 | 7 | ||||||||||||
$ | 194 | $ | 330 | $ | 70 | $ | 99 | |||||||||
Balance sheet classification: | ||||||||||||||||
Trade accounts receivable | $ | 3 | $ | 5 | $ | 53 | $ | 56 | ||||||||
Other current assets | 174 | 316 | — | — | ||||||||||||
Accounts payable and accrued liabilities | 17 | 9 | 17 | 43 | ||||||||||||
$ | 194 | $ | 330 | $ | 70 | $ | 99 | |||||||||
Credit Risk. FCX is exposed to credit loss when financial institutions with which FCX has entered into derivative transactions (commodity, foreign exchange and interest rate swaps) are unable to pay. To minimize the risk of such losses, FCX uses counterparties that meet certain credit requirements and periodically reviews the creditworthiness of these counterparties. FCX does not anticipate that any of the counterparties it deals with will default on their obligations. As of June 30, 2015, the maximum amount of credit exposure associated with derivative transactions was $226 million.
Other Financial Instruments. Other financial instruments include cash and cash equivalents, accounts receivable, restricted cash, investment securities, legally restricted funds, accounts payable and accrued liabilities, dividends payable and long-term debt. The carrying value for cash and cash equivalents (which included time deposits of $27 million at June 30, 2015, and $48 million at December 31, 2014), accounts receivable, restricted cash, accounts payable and accrued liabilities, and dividends payable approximates fair value because of their short-term nature and generally negligible credit losses (refer to Note 8 for the fair values of investment securities, legally restricted funds and long-term debt).
15
NOTE 8. FAIR VALUE MEASUREMENT
Fair value accounting guidance includes a hierarchy that prioritizes the inputs to valuation techniques used to measure fair value. The hierarchy gives the highest priority to unadjusted quoted prices in active markets for identical assets or liabilities (Level 1 inputs) and the lowest priority to unobservable inputs (Level 3 inputs).
FCX recognizes transfers between levels at the end of the reporting period. FCX did not have any significant transfers in or out of Level 1, 2 or 3 for second-quarter 2015. A summary of the carrying amount and fair value of FCX’s financial instruments, other than cash and cash equivalents, accounts receivable, restricted cash, accounts payable and accrued liabilities, and dividends payable (refer to Note 7), follows (in millions):
At June 30, 2015 | |||||||||||||||||||
Carrying | Fair Value | ||||||||||||||||||
Amount | Total | Level 1 | Level 2 | Level 3 | |||||||||||||||
Assets | |||||||||||||||||||
Investment securities:a,b | |||||||||||||||||||
U.S. core fixed income fund | $ | 23 | $ | 23 | $ | — | $ | 23 | $ | — | |||||||||
Money market funds | 22 | 22 | 22 | — | — | ||||||||||||||
Equity securities | 3 | 3 | 3 | — | — | ||||||||||||||
Total | 48 | 48 | 25 | 23 | — | ||||||||||||||
Legally restricted funds:a,b,c,d | |||||||||||||||||||
U.S. core fixed income fund | 51 | 51 | — | 51 | — | ||||||||||||||
Government bonds and notes | 35 | 35 | — | 35 | — | ||||||||||||||
Corporate bonds | 28 | 28 | — | 28 | — | ||||||||||||||
Government mortgage-backed securities | 24 | 24 | — | 24 | — | ||||||||||||||
Asset-backed securities | 14 | 14 | — | 14 | — | ||||||||||||||
Money market funds | 9 | 9 | 9 | — | — | ||||||||||||||
Collateralized mortgage-backed securities | 8 | 8 | — | 8 | — | ||||||||||||||
Municipal bonds | 1 | 1 | — | 1 | — | ||||||||||||||
Total | 170 | 170 | 9 | 161 | — | ||||||||||||||
Derivatives:a,e | |||||||||||||||||||
Embedded derivatives in provisional sales/purchase | |||||||||||||||||||
contracts in a gross asset position | 21 | 21 | — | 21 | — | ||||||||||||||
Crude oil options | 174 | 174 | — | — | 174 | ||||||||||||||
Total | 195 | 195 | — | 21 | 174 | ||||||||||||||
Total assets | $ | 413 | $ | 34 | $ | 205 | $ | 174 | |||||||||||
Liabilities | |||||||||||||||||||
Derivatives:a,e | |||||||||||||||||||
Embedded derivatives in provisional sales/purchase | |||||||||||||||||||
contracts in a gross liability position | $ | 65 | $ | 65 | $ | — | $ | 65 | $ | — | |||||||||
Copper futures and swap contracts | 5 | 5 | 5 | — | — | ||||||||||||||
Copper forward contracts | 1 | 1 | — | 1 | — | ||||||||||||||
Total | 71 | 71 | 5 | 66 | — | ||||||||||||||
Long-term debt, including current portionf | 20,902 | 20,191 | — | 20,191 | — | ||||||||||||||
Total liabilities | $ | 20,262 | $ | 5 | $ | 20,257 | $ | — | |||||||||||
16
At December 31, 2014 | |||||||||||||||||||
Carrying | Fair Value | ||||||||||||||||||
Amount | Total | Level 1 | Level 2 | Level 3 | |||||||||||||||
Assets | |||||||||||||||||||
Investment securities:a,b | |||||||||||||||||||
U.S. core fixed income fund | $ | 23 | $ | 23 | $ | — | $ | 23 | $ | — | |||||||||
Money market funds | 20 | 20 | 20 | — | — | ||||||||||||||
Equity securities | 3 | 3 | 3 | — | — | ||||||||||||||
Total | 46 | 46 | 23 | 23 | — | ||||||||||||||
Legally restricted funds:a,b,c,d | |||||||||||||||||||
U.S. core fixed income fund | 52 | 52 | — | 52 | — | ||||||||||||||
Government bonds and notes | 39 | 39 | — | 39 | — | ||||||||||||||
Corporate bonds | 27 | 27 | — | 27 | — | ||||||||||||||
Government mortgage-backed securities | 19 | 19 | — | 19 | — | ||||||||||||||
Asset-backed securities | 17 | 17 | — | 17 | — | ||||||||||||||
Money market funds | 11 | 11 | 11 | — | — | ||||||||||||||
Collateralized mortgage-backed securities | 6 | 6 | — | 6 | — | ||||||||||||||
Municipal bonds | 1 | 1 | — | 1 | — | ||||||||||||||
Total | 172 | 172 | 11 | 161 | — | ||||||||||||||
Derivatives:a,e | |||||||||||||||||||
Embedded derivatives in provisional sales/purchase | |||||||||||||||||||
contracts in a gross asset position | 15 | 15 | — | 15 | — | ||||||||||||||
Crude oil options | 316 | 316 | — | — | 316 | ||||||||||||||
Total | 331 | 331 | — | 15 | 316 | ||||||||||||||
Total assets | $ | 549 | $ | 34 | $ | 199 | $ | 316 | |||||||||||
Liabilities | |||||||||||||||||||
Derivatives:a,e | |||||||||||||||||||
Embedded derivatives in provisional sales/purchase | |||||||||||||||||||
contracts in a gross liability position | $ | 93 | $ | 93 | $ | — | $ | 93 | $ | — | |||||||||
Copper futures and swap contracts | 7 | 7 | 6 | 1 | — | ||||||||||||||
Total | 100 | 100 | 6 | 94 | — | ||||||||||||||
Long-term debt, including current portionf | 18,849 | 18,735 | — | 18,735 | — | ||||||||||||||
Total liabilities | $ | 18,835 | $ | 6 | $ | 18,829 | $ | — | |||||||||||
a. | Recorded at fair value. |
b. | Current portion included in other current assets and long-term portion included in other assets. |
c. | Excludes time deposits (which approximated fair value) included in other assets of $117 million at June 30, 2015, and $115 million at December 31, 2014, associated with an assurance bond to support PT Freeport Indonesia's (PT-FI) commitment for smelter development in Indonesia. |
d. | Excludes time deposits (which approximated fair value) included in other current assets of $10 million at June 30, 2015, and $8 million at December 31, 2014, associated with a reclamation guarantee at PT-FI. Also, excludes a time deposit of $9 million at December 31, 2014, associated with a customs audit assessment. |
e. | Refer to Note 7 for further discussion and balance sheet classifications. Crude oil options are net of $106 million at June 30, 2015, and $210 million at December 31, 2014, for deferred premiums and accrued interest. |
f. | Recorded at cost except for debt assumed in acquisitions, which were recorded at fair value at the respective acquisition dates. |
17
Valuation Techniques
Money market funds are classified within Level 1 of the fair value hierarchy because they are valued using quoted market prices in active markets.
The U.S. core fixed income fund is valued at net asset value. The fund strategy seeks total return consisting of income and capital appreciation primarily by investing in a broad range of investment-grade debt securities, including U.S. government obligations, corporate bonds, mortgage-backed securities, asset-backed securities and money market instruments. There are no restrictions on redemptions (usually within one business day of notice) and, as such, this fund is classified within Level 2 of the fair value hierarchy.
Fixed income securities (government securities, corporate bonds, asset-backed securities, collateralized mortgage-backed securities and municipal bonds) are valued using a bid evaluation price or a mid-evaluation price. A bid evaluation price is an estimated price at which a dealer would pay for a security. A mid-evaluation price is the average of the estimated price at which a dealer would sell a security and the estimated price at which a dealer would pay for a security. These evaluations are based on quoted prices, if available, or models that use observable inputs and, as such, are classified within Level 2 of the fair value hierarchy.
Equity securities are valued at the closing price reported on the active market on which the individual securities are traded and, as such, are classified within Level 1 of the fair value hierarchy.
FCX’s embedded derivatives on provisional copper concentrate, copper cathode and gold purchases and sales are valued using quoted monthly LME or COMEX copper forward prices and the London gold forward price at each reporting date based on the month of maturity (refer to Note 7 for further discussion); however, FCX's contracts themselves are not traded on an exchange. As a result, these derivatives are classified within Level 2 of the fair value hierarchy.
FCX's derivative financial instruments for crude oil options are valued using an option pricing model, which uses various inputs including Intercontinental Exchange Holdings, Inc. crude oil prices, volatilities, interest rates and contract terms. Valuations are adjusted for credit quality, using the counterparties' credit quality for asset balances and FCX's credit quality for liability balances (which considers the impact of netting agreements on counterparty credit risk, including whether the position with the counterparty is a net asset or net liability). For asset balances, FCX uses the credit default swap value for counterparties when available or the spread between the risk-free interest rate and the yield rate on the counterparties' publicly traded debt for similar instruments. The crude oil options are classified within Level 3 of the fair value hierarchy because the inputs used in the valuation models are not observable for the full term of the instruments. The significant unobservable inputs used in the fair value measurement of the crude oil options are implied volatilities and deferred premiums. Significant increases (decreases) in implied volatilities in isolation would result in a significantly higher (lower) fair value measurement. The implied volatilities ranged from 28 percent to 41 percent, with a weighted average of 32 percent. The weighted-average cost of deferred premiums totals $6.89 per barrel at June 30, 2015. Refer to Note 7 for further discussion of these derivative financial instruments.
FCX’s derivative financial instruments for copper futures and swap contracts and copper forward contracts that are traded on the respective exchanges are classified within Level 1 of the fair value hierarchy because they are valued using quoted monthly COMEX or LME prices at each reporting date based on the month of maturity (refer to Note 7 for further discussion). Certain of these contracts are traded on the over-the-counter market and are classified within Level 2 of the fair value hierarchy based on COMEX and LME forward prices.
Long-term debt, including the current portion, is not actively traded and is valued using prices obtained from a readily available pricing source and, as such, is classified within Level 2 of the fair value hierarchy.
The techniques described above may produce a fair value calculation that may not be indicative of net realizable value or reflective of future fair values. Furthermore, while FCX believes its valuation techniques are appropriate and consistent with other market participants, the use of different techniques or assumptions to determine fair value of certain financial instruments could result in a different fair value measurement at the reporting date. There have been no changes in the techniques used at June 30, 2015.
18
A summary of the changes in the fair value of FCX's most significant Level 3 instruments, crude oil options, follows (in millions):
Crude Oil | ||||
Options | ||||
Fair value at December 31, 2014 | $ | 316 | ||
Net realized gains | 21 | |||
Net unrealized gains included in earnings related to assets and liabilities still held at the end of the period | 36 | a | ||
Net settlement receipts | (199 | ) | b | |
Fair value at June 30, 2015 | $ | 174 | ||
a. | Includes net unrealized gains of $37 million, partially offset by $1 million of interest expense associated with the deferred premiums. |
b. | Includes interest payments of $2 million. |
NOTE 9. CONTINGENCIES AND COMMITMENTS
Litigation. The following information includes a discussion of updates to previously reported legal proceedings included in Note 12 of FCX's annual report on Form 10-K for the year ended December 31, 2014, as updated in Note 8 of FCX's quarterly report on Form 10-Q for the quarterly period ended March 31, 2015.
Shareholder Litigation. On April 7, 2015, the Delaware Court of Chancery approved the settlement of FCX’s consolidated stockholder derivative litigation captioned In Re Freeport-McMoRan Copper & Gold Inc. Derivative Litigation, No. 8145-VCN, and awarded the plaintiffs legal fees and expenses. This settlement resolved all pending derivative claims against directors and officers of FCX challenging FCX's 2013 acquisitions of Plains Exploration & Production Company and McMoRan Exploration Co. During first-quarter 2015, insurers under FCX’s directors and officers liability insurance policies and other third parties funded an escrow account with the $125 million settlement amount, from which the proceeds, net of plaintiffs’ legal fees and expenses totaling $33 million, were released to FCX in May 2015. Upon the release of funds, FCX recognized a gain of $92 million in second-quarter 2015. As a result and in accordance with the approved settlement terms, FCX's Board declared a special dividend that was paid on August 3, 2015, together with the regular quarterly dividend paid on the same day (refer to Note 6 for further discussion).
Tax and Other Matters. There were no significant changes to the Cerro Verde royalty dispute or other Peruvian tax matters during the second quarter of 2015 (refer to Note 12 of FCX’s annual report on Form 10-K for the year ended December 31, 2014, for further discussion of these matters).
Indonesia Tax Matters. The following information includes a discussion of updates to previously reported Indonesia tax matters included in Note 12 of FCX’s annual report on Form 10-K for the year ended December 31, 2014, as updated in Note 8 of FCX's quarterly report on Form 10-Q for the quarterly period ended March 31, 2015.
PT-FI received assessments from the local regional tax authority in Papua, Indonesia, for additional taxes and penalties related to water rights tax payments for the period from January 2011 through June 2015. PT-FI has filed or will file objections to these assessments. In March 2015, the local government of Papua rejected PT-FI’s objections to the assessments related to the period from January 2011 through December 2014, and in April 2015, PT-FI filed appeals with the Indonesian tax court. The aggregate amount of all assessments received through August 3, 2015, including penalties, was 2.5 trillion Indonesian rupiah ($190 million based on exchange rates at June 30, 2015). Additional penalties, which could be significant, may be assessed depending on the outcome of the appeals process. No amounts have been accrued for these assessments as of June 30, 2015, because PT-FI believes its Contract of Work (COW) exempts it from these payments and that it has the right to contest these assessments in the tax court and ultimately the Indonesian Supreme Court.
19
NOTE 10. BUSINESS SEGMENTS
FCX has organized its mining operations into five primary divisions – North America copper mines, South America mining, Indonesia mining, Africa mining and Molybdenum mines. Notwithstanding this structure, FCX internally reports information on a mine-by-mine basis for its mining operations. Therefore, FCX concluded that its operating segments include individual mines or operations relative to its mining operations. For oil and gas operations, FCX determines its operating segments on a country-by-country basis. Operating segments that meet certain thresholds are reportable segments, which are separately disclosed in the following table.
Intersegment Sales. Intersegment sales between FCX’s mining operations are based on similar arms-length transactions with third parties at the time of the sale. Intersegment sales may not be reflective of the actual prices ultimately realized because of a variety of factors, including additional processing, timing of sales to unaffiliated customers and transportation premiums.
FCX defers recognizing profits on sales from its mines to other divisions, including Atlantic Copper (FCX's wholly owned smelter and refinery in Spain) and on 25 percent of PT-FI's sales to PT Smelting (FCX's 25 percent-owned smelter and refinery in Indonesia), until final sales to third parties occur. Quarterly variations in ore grades, the timing of intercompany shipments and changes in product prices result in variability in FCX's net deferred profits and quarterly earnings.
Allocations. FCX allocates certain operating costs, expenses and capital expenditures to its operating divisions and individual segments. However, not all costs and expenses applicable to an operation are allocated. U.S. federal and state income taxes are recorded and managed at the corporate level (included in corporate, other & eliminations), whereas foreign income taxes are recorded and managed at the applicable country level. In addition, most mining exploration and research activities are managed on a consolidated basis, and those costs along with some selling, general and administrative costs are not allocated to the operating divisions or individual segments. Accordingly, the following segment information reflects management determinations that may not be indicative of what the actual financial performance of each operating division or segment would be if it was an independent entity.
20
Financial Information by Business Segments
(In millions) | Mining Operations | ||||||||||||||||||||||||||||||||||||||||||||||||||||||||||||||
North America Copper Mines | South America | Indonesia | Africa | ||||||||||||||||||||||||||||||||||||||||||||||||||||||||||||
Atlantic | Other | Corporate, | |||||||||||||||||||||||||||||||||||||||||||||||||||||||||||||
Molyb- | Copper | Mining | U.S. | Other | |||||||||||||||||||||||||||||||||||||||||||||||||||||||||||
Other | Cerro | Other | denum | Rod & | Smelting | & Elimi- | Total | Oil & Gas | & Elimi- | FCX | |||||||||||||||||||||||||||||||||||||||||||||||||||||
Morenci | Mines | Total | Verde | Minesa | Total | Grasberg | Tenke | Mines | Refining | & Refining | nations | Mining | Operationsb | nations | Total | ||||||||||||||||||||||||||||||||||||||||||||||||
Three Months Ended June 30, 2015 | |||||||||||||||||||||||||||||||||||||||||||||||||||||||||||||||
Revenues: | |||||||||||||||||||||||||||||||||||||||||||||||||||||||||||||||
Unaffiliated customers | $ | 180 | $ | 92 | $ | 272 | $ | 195 | $ | 221 | $ | 416 | $ | 792 | c | $ | 310 | $ | — | $ | 1,089 | $ | 495 | $ | 305 | d | $ | 3,679 | $ | 569 | e | $ | — | $ | 4,248 | ||||||||||||||||||||||||||||
Intersegment | 427 | 706 | 1,133 | 37 | — | 37 | (2 | ) | f | 41 | 102 | 8 | 5 | (1,324 | ) | — | — | — | — | ||||||||||||||||||||||||||||||||||||||||||||
Production and delivery | 386 | 576 | g | 962 | 165 | 150 | 315 | 455 | 190 | 84 | g | 1,088 | 468 | (997 | ) | g | 2,565 | 281 | 2 | 2,848 | |||||||||||||||||||||||||||||||||||||||||||
Depreciation, depletion and amortization | 55 | 84 | 139 | 40 | 32 | 72 | 78 | 57 | 25 | 3 | 9 | 19 | 402 | 485 | 3 | 890 | |||||||||||||||||||||||||||||||||||||||||||||||
Impairment of oil and gas properties | — | — | — | — | — | — | — | — | — | — | — | — | — | 2,686 | — | 2,686 | |||||||||||||||||||||||||||||||||||||||||||||||
Selling, general and administrative expenses | — | 2 | 2 | — | 1 | 1 | 25 | 3 | — | — | 4 | 5 | 40 | 49 | 62 | 151 | |||||||||||||||||||||||||||||||||||||||||||||||
Mining exploration and research expenses | — | 2 | 2 | — | — | — | — | — | — | — | — | 34 | 36 | — | — | 36 | |||||||||||||||||||||||||||||||||||||||||||||||
Environmental obligations and shutdown costs | — | — | — | — | — | — | — | — | — | — | — | 11 | 11 | — | — | 11 | |||||||||||||||||||||||||||||||||||||||||||||||
Operating income (loss) | 166 | 134 | 300 | 27 | 38 | 65 | 232 | 101 | (7 | ) | 6 | 19 | (91 | ) | 625 | (2,932 | ) | (67 | ) | (2,374 | ) | ||||||||||||||||||||||||||||||||||||||||||
Interest expense, net | — | 1 | 1 | — | — | — | — | — | — | — | 2 | 39 | 42 | 41 | 66 | 149 | |||||||||||||||||||||||||||||||||||||||||||||||
Provision for (benefit from) income taxes | — | — | — | (5 | ) | 11 | 6 | 95 | 27 | — | — | — | — | 128 | — | (815 | ) | (687 | ) | ||||||||||||||||||||||||||||||||||||||||||||
Total assets at June 30, 2015 | 3,806 | 5,582 | 9,388 | 8,567 | 1,935 | 10,502 | 8,959 | 5,125 | 2,052 | 286 | 786 | 1,336 | 38,434 | 15,393 | 181 | 54,008 | |||||||||||||||||||||||||||||||||||||||||||||||
Capital expenditures | 79 | 28 | 107 | 444 | 13 | 457 | 213 | 58 | 4 | — | 4 | 11 | 854 | 777 | 30 | 1,661 | |||||||||||||||||||||||||||||||||||||||||||||||
Three Months Ended June 30, 2014 | |||||||||||||||||||||||||||||||||||||||||||||||||||||||||||||||
Revenues: | |||||||||||||||||||||||||||||||||||||||||||||||||||||||||||||||
Unaffiliated customers | $ | 52 | $ | 55 | $ | 107 | $ | 421 | $ | 524 | $ | 945 | $ | 523 | c | $ | 386 | $ | — | $ | 1,234 | $ | 623 | $ | 468 | d | $ | 4,286 | $ | 1,236 | e | $ | — | $ | 5,522 | ||||||||||||||||||||||||||||
Intersegment | 474 | 888 | 1,362 | 23 | 63 | 86 | — | 32 | 170 | 8 | 6 | (1,664 | ) | — | — | — | — | ||||||||||||||||||||||||||||||||||||||||||||||
Production and delivery | 312 | 558 | 870 | 195 | 335 | 530 | 511 | 198 | 81 | 1,233 | 618 | (1,287 | ) | 2,754 | 329 | (1 | ) | 3,082 | |||||||||||||||||||||||||||||||||||||||||||||
Depreciation, depletion and amortization | 43 | 85 | 128 | 43 | 52 | 95 | 54 | 63 | 24 | 3 | 10 | 17 | 394 | 616 | 3 | 1,013 | |||||||||||||||||||||||||||||||||||||||||||||||
Selling, general and administrative expenses | 1 | — | 1 | 1 | 1 | 2 | 25 | 3 | — | — | 5 | 6 | 42 | 59 | 63 | 164 | |||||||||||||||||||||||||||||||||||||||||||||||
Mining exploration and research expenses | — | 2 | 2 | — | — | — | — | — | — | — | — | 32 | 34 | — | — | 34 | |||||||||||||||||||||||||||||||||||||||||||||||
Environmental obligations and shutdown costs | — | — | — | — | — | — | — | — | — | — | — | 76 | 76 | — | — | 76 | |||||||||||||||||||||||||||||||||||||||||||||||
Operating income (loss) | 170 | 298 | 468 | 205 | 199 | 404 | (67 | ) | 154 | 65 | 6 | (4 | ) | (40 | ) | 986 | 232 | (65 | ) | 1,153 | |||||||||||||||||||||||||||||||||||||||||||
Interest expense, net | — | 1 | 1 | — | — | — | — | — | — | — | 3 | 18 | 22 | 74 | 68 | 164 | |||||||||||||||||||||||||||||||||||||||||||||||
Provision for (benefit from) income taxes | — | — | — | 73 | 67 | 140 | (33 | ) | 33 | — | — | — | — | 140 | — | 188 | 328 | ||||||||||||||||||||||||||||||||||||||||||||||
Total assets at June 30, 2014 | 3,675 | 5,822 | 9,497 | 6,876 | 3,791 | 10,667 | 7,972 | 4,952 | 2,095 | 299 | 882 | 1,127 | 37,491 | 25,293 | 1,119 | 63,903 | |||||||||||||||||||||||||||||||||||||||||||||||
Capital expenditures | 289 | 35 | 324 | 391 | 25 | 416 | 243 | 29 | 14 | 1 | 5 | 17 | 1,049 | 903 | (2 | ) | 1,950 | ||||||||||||||||||||||||||||||||||||||||||||||
a. | Second-quarter 2014 includes the results of the Candelaria and Ojos del Salado mining operations, which were sold in November 2014. |
b. | Second-quarter 2014 includes the results from Eagle Ford, which was sold in June 2014. |
c. | Includes PT-FI’s sales to PT Smelting totaling $293 million in second-quarter 2015 and $540 million in second-quarter 2014. |
d. | Includes revenues from FCX's molybdenum sales company, which includes sales of molybdenum produced by the Molybdenum mines and by certain of the North and South America copper mines. |
e. | Includes net mark-to-market gains (losses) associated with crude oil and natural gas derivative contracts totaling $6 million in second-quarter 2015 and $(70) million in second-quarter 2014. |
f. | Amounts include net reductions for provisional pricing adjustments to prior period open sales. There were no intersegment sales from Grasberg in second-quarter 2015. |
g. | Includes LCM inventory adjustments totaling $11 million at other North America copper mines, $3 million at Molybdenum mines and $45 million at other mining & eliminations (see Note 4). |
21
(In millions) | Mining Operations | ||||||||||||||||||||||||||||||||||||||||||||||||||||||||||||||
North America Copper Mines | South America | Indonesia | Africa | ||||||||||||||||||||||||||||||||||||||||||||||||||||||||||||
Atlantic | Other | Corporate, | |||||||||||||||||||||||||||||||||||||||||||||||||||||||||||||
Molyb- | Copper | Mining | U.S. | Other | |||||||||||||||||||||||||||||||||||||||||||||||||||||||||||
Other | Cerro | Other | denum | Rod & | Smelting | & Elimi- | Total | Oil & Gas | & Elimi- | FCX | |||||||||||||||||||||||||||||||||||||||||||||||||||||
Morenci | Mines | Total | Verde | Minesa | Total | Grasberg | Tenke | Mines | Refining | & Refining | nations | Mining | Operationsb | nations | Total | ||||||||||||||||||||||||||||||||||||||||||||||||
Six Months Ended June 30, 2015 | |||||||||||||||||||||||||||||||||||||||||||||||||||||||||||||||
Revenues: | |||||||||||||||||||||||||||||||||||||||||||||||||||||||||||||||
Unaffiliated customers | $ | 286 | $ | 207 | $ | 493 | $ | 443 | $ | 452 | $ | 895 | $ | 1,413 | c | $ | 692 | $ | — | $ | 2,151 | $ | 1,035 | $ | 653 | d | $ | 7,332 | $ | 1,069 | e | $ | — | $ | 8,401 | ||||||||||||||||||||||||||||
Intersegment | 877 | 1,370 | 2,247 | 51 | (7 | ) | f | 44 | (16 | ) | f | 69 | 215 | 15 | 11 | (2,585 | ) | — | — | — | — | ||||||||||||||||||||||||||||||||||||||||||
Production and delivery | 760 | 1,145 | g | 1,905 | 363 | 297 | 660 | 894 | 425 | 167 | g | 2,151 | 987 | (1,998 | ) | g | 5,191 | 564 | 5 | 5,760 | |||||||||||||||||||||||||||||||||||||||||||
Depreciation, depletion and amortization | 106 | 166 | 272 | 77 | 70 | 147 | 148 | 130 | 51 | 5 | 19 | 35 | 807 | 1,015 | 7 | 1,829 | |||||||||||||||||||||||||||||||||||||||||||||||
Impairment of oil and gas properties | — | — | — | — | — | — | — | — | — | — | — | — | — | 5,790 | — | 5,790 | |||||||||||||||||||||||||||||||||||||||||||||||
Selling, general and administrative expenses | 1 | 2 | 3 | 1 | 1 | 2 | 50 | 6 | — | — | 9 | 11 | 81 | 103 | 121 | 305 | |||||||||||||||||||||||||||||||||||||||||||||||
Mining exploration and research expenses | — | 5 | 5 | — | — | — | — | — | — | — | — | 64 | 69 | — | — | 69 | |||||||||||||||||||||||||||||||||||||||||||||||
Environmental obligations and shutdown costs | — | — | — | — | — | — | — | — | — | — | — | 24 | 24 | — | — | 24 | |||||||||||||||||||||||||||||||||||||||||||||||
Net gain on sales of assets | — | (39 | ) | (39 | ) | — | — | — | — | — | — | — | — | — | (39 | ) | — | — | (39 | ) | |||||||||||||||||||||||||||||||||||||||||||
Operating income (loss) | 296 | 298 | 594 | 53 | 77 | 130 | 305 | 200 | (3 | ) | 10 | 31 | (68 | ) | 1,199 | (6,403 | ) | (133 | ) | (5,337 | ) | ||||||||||||||||||||||||||||||||||||||||||
Interest expense, net | 1 | 1 | 2 | 1 | — | 1 | — | — | — | — | 5 | 79 | 87 | 78 | 130 | 295 | |||||||||||||||||||||||||||||||||||||||||||||||
Provision for (benefit from) income taxes | — | — | — | — | 30 | 30 | 124 | 53 | — | — | — | — | 207 | — | (1,589 | ) | (1,382 | ) | |||||||||||||||||||||||||||||||||||||||||||||
Capital expenditures | 163 | 51 | 214 | 875 | 27 | 902 | 438 | 97 | 7 | 1 | 8 | 27 | 1,694 | 1,795 | 39 | 3,528 | |||||||||||||||||||||||||||||||||||||||||||||||
Six Months Ended June 30, 2014 | |||||||||||||||||||||||||||||||||||||||||||||||||||||||||||||||
Revenues: | |||||||||||||||||||||||||||||||||||||||||||||||||||||||||||||||
Unaffiliated customers | $ | 75 | $ | 116 | $ | 191 | $ | 701 | $ | 946 | $ | 1,647 | $ | 985 | c | $ | 692 | $ | — | $ | 2,380 | $ | 1,211 | $ | 904 | d | $ | 8,010 | $ | 2,497 | e | $ | — | $ | 10,507 | ||||||||||||||||||||||||||||
Intersegment | 918 | 1,646 | 2,564 | 87 | 195 | 282 | 8 | 53 | 296 | 16 | 11 | (3,230 | ) | — | — | — | — | ||||||||||||||||||||||||||||||||||||||||||||||
Production and delivery | 595 | 1,061 | 1,656 | 360 | 646 | 1,006 | 894 | 350 | 157 | 2,381 | 1,206 | (2,470 | ) | 5,180 | 640 | (1 | ) | 5,819 | |||||||||||||||||||||||||||||||||||||||||||||
Depreciation, depletion and amortization | 77 | 158 | 235 | 79 | 103 | 182 | 102 | 114 | 46 | 5 | 20 | 36 | 740 | 1,232 | 7 | 1,979 | |||||||||||||||||||||||||||||||||||||||||||||||
Selling, general and administrative expenses | 1 | 1 | 2 | 2 | 2 | 4 | 46 | 6 | — | — | 9 | 13 | 80 | 116 | 103 | 299 | |||||||||||||||||||||||||||||||||||||||||||||||
Mining exploration and research expenses | — | 4 | 4 | — | — | — | — | — | — | — | — | 60 | 64 | — | — | 64 | |||||||||||||||||||||||||||||||||||||||||||||||
Environmental obligations and shutdown costs | — | — | — | — | — | — | — | — | — | — | — | 82 | 82 | — | — | 82 | |||||||||||||||||||||||||||||||||||||||||||||||
Operating income (loss) | 320 | 538 | 858 | 347 | 390 | 737 | (49 | ) | 275 | 93 | 10 | (13 | ) | (47 | ) | 1,864 | 509 | (109 | ) | 2,264 | |||||||||||||||||||||||||||||||||||||||||||
Interest expense, net | 1 | 1 | 2 | — | — | — | — | — | — | — | 7 | 36 | 45 | 150 | 130 | 325 | |||||||||||||||||||||||||||||||||||||||||||||||
Provision for (benefit from) income taxes | — | — | — | 130 | 137 | 267 | (15 | ) | 57 | — | — | — | — | 309 | — | 376 | 685 | ||||||||||||||||||||||||||||||||||||||||||||||
Capital expenditures | 533 | 94 | 627 | 791 | 48 | 839 | 479 | 60 | 33 | 2 | 6 | 27 | 2,073 | 1,484 | 5 | 3,562 | |||||||||||||||||||||||||||||||||||||||||||||||
a. | The first six months of 2014 include the results of the Candelaria and Ojos del Salado mining operations, which were sold in November 2014. |
b. | The first six months of 2014 include the results from Eagle Ford, which was sold in June 2014. |
c. | Includes PT-FI’s sales to PT Smelting totaling $643 million for the first six months of 2015 and $913 million for the first six months of 2014. |
d. | Includes revenues from FCX's molybdenum sales company, which includes sales of molybdenum produced by the Molybdenum mines and by certain of the North and South America copper mines. |
e. | Includes net mark-to-market gains (losses) associated with crude oil and natural gas derivative contracts totaling $58 million for the first six months 2015 and $(120) million for the first six months of 2014. |
f. | Amounts include net reductions for provisional pricing adjustments to prior period open sales. There were no intersegment sales from El Abra or Grasberg for the first six months of 2015. |
g. | Includes LCM inventory adjustments totaling $11 million at other North America copper mines, $3 million at Molybdenum mines and $49 million at other mining & eliminations (see Note 4). |
22
NOTE 11. GUARANTOR FINANCIAL STATEMENTS
All of the senior notes issued by FCX are fully and unconditionally guaranteed on a senior basis jointly and severally by Freeport-McMoRan Oil & Gas LLC (FM O&G LLC), as guarantor, which is a 100 percent owned subsidiary of FM O&G and FCX. The guarantee is an unsecured obligation of the guarantor and ranks equal in right of payment with all existing and future indebtedness of FM O&G LLC, including indebtedness under the revolving credit facility. The guarantee ranks senior in right of payment with all of FM O&G LLC's future subordinated obligations and is effectively subordinated in right of payment to any debt of FM O&G LLC's subsidiaries. The indentures provide that FM O&G LLC's guarantee may be released or terminated for certain obligations under the following circumstances: (i) all or substantially all of the equity interests or assets of FM O&G LLC are sold to a third party; or (ii) FM O&G LLC no longer has any obligations under any FM O&G senior notes or any refinancing thereof and no longer guarantees any obligations of FCX under the revolver, the Term Loan or any other senior debt.
The following condensed consolidating financial information includes information regarding FCX, as issuer, FM O&G LLC, as guarantor, and all other non-guarantor subsidiaries of FCX. Included are the condensed consolidating balance sheets at June 30, 2015, and December 31, 2014, and the related condensed consolidating statements of comprehensive (loss) income for the three and six months ended June 30, 2015 and 2014, and condensed consolidating statements of cash flows for the six months ended June 30, 2015 and 2014 (in millions), which should be read in conjunction with FCX's notes to the consolidated financial statements.
CONDENSED CONSOLIDATING BALANCE SHEET
June 30, 2015
FCX | FM O&G LLC | Non-guarantor | Consolidated | ||||||||||||||||
Issuer | Guarantor | Subsidiaries | Eliminations | FCX | |||||||||||||||
ASSETS | |||||||||||||||||||
Current assets | $ | 257 | $ | 2,900 | $ | 9,665 | $ | (4,125 | ) | $ | 8,697 | ||||||||
Property, plant, equipment and mining development costs, net | 20 | 51 | 27,024 | — | 27,095 | ||||||||||||||
Oil and gas properties, net - full cost method: | |||||||||||||||||||
Subject to amortization, less accumulated amortization | — | 1,507 | 3,142 | — | 4,649 | ||||||||||||||
Not subject to amortization | — | 2,649 | 6,659 | 4 | 9,312 | ||||||||||||||
Investments in consolidated subsidiaries | 24,153 | 2,216 | 4,019 | (30,388 | ) | — | |||||||||||||
Other assets | 9,991 | 4,703 | 4,179 | (14,618 | ) | 4,255 | |||||||||||||
Total assets | $ | 34,421 | $ | 14,026 | $ | 54,688 | $ | (49,127 | ) | $ | 54,008 | ||||||||
LIABILITIES AND EQUITY | |||||||||||||||||||
Current liabilities | $ | 3,106 | $ | 433 | $ | 5,325 | $ | (4,125 | ) | $ | 4,739 | ||||||||
Long-term debt, less current portion | 15,841 | 5,181 | 10,221 | (11,132 | ) | 20,111 | |||||||||||||
Deferred income taxes | 1,613 | a | — | 3,257 | — | 4,870 | |||||||||||||
Environmental and asset retirement obligations, less current portion | — | 307 | 3,409 | — | 3,716 | ||||||||||||||
Other liabilities | 56 | 3,361 | 1,829 | (3,486 | ) | 1,760 | |||||||||||||
Total liabilities | 20,616 | 9,282 | 24,041 | (18,743 | ) | 35,196 | |||||||||||||
Redeemable noncontrolling interest | — | — | 757 | — | 757 | ||||||||||||||
Equity: | |||||||||||||||||||
Stockholders' equity | 13,805 | 4,744 | 26,173 | (30,917 | ) | 13,805 | |||||||||||||
Noncontrolling interests | — | — | 3,717 | 533 | 4,250 | ||||||||||||||
Total equity | 13,805 | 4,744 | 29,890 | (30,384 | ) | 18,055 | |||||||||||||
Total liabilities and equity | $ | 34,421 | $ | 14,026 | $ | 54,688 | $ | (49,127 | ) | $ | 54,008 | ||||||||
a. | All U.S. related deferred income taxes are recorded at the parent company. |
23
CONDENSED CONSOLIDATING BALANCE SHEET
December 31, 2014
FCX | FM O&G LLC | Non-guarantor | Consolidated | ||||||||||||||||
Issuer | Guarantor | Subsidiaries | Eliminations | FCX | |||||||||||||||
ASSETS | |||||||||||||||||||
Current assets | $ | 323 | $ | 2,635 | $ | 8,659 | $ | (2,572 | ) | $ | 9,045 | ||||||||
Property, plant, equipment and mining development costs, net | 22 | 46 | 26,152 | — | 26,220 | ||||||||||||||
Oil and gas properties, net - full cost method: | |||||||||||||||||||
Subject to amortization, less accumulated amortization | — | 3,296 | 5,907 | (16 | ) | 9,187 | |||||||||||||
Not subject to amortization | — | 2,447 | 7,640 | — | 10,087 | ||||||||||||||
Investments in consolidated subsidiaries | 28,765 | 6,460 | 10,246 | (45,471 | ) | — | |||||||||||||
Other assets | 8,914 | 3,947 | 4,061 | (12,787 | ) | 4,135 | |||||||||||||
Total assets | $ | 38,024 | $ | 18,831 | $ | 62,665 | $ | (60,846 | ) | $ | 58,674 | ||||||||
LIABILITIES AND EQUITY | |||||||||||||||||||
Current liabilities | $ | 1,592 | $ | 560 | $ | 5,592 | $ | (2,572 | ) | $ | 5,172 | ||||||||
Long-term debt, less current portion | 14,930 | 3,874 | 8,879 | (9,312 | ) | 18,371 | |||||||||||||
Deferred income taxes | 3,161 | a | — | 3,237 | — | 6,398 | |||||||||||||
Environmental and asset retirement obligations, less current portion | — | 302 | 3,345 | — | 3,647 | ||||||||||||||
Other liabilities | 54 | 3,372 | 1,910 | (3,475 | ) | 1,861 | |||||||||||||
Total liabilities | 19,737 | 8,108 | 22,963 | (15,359 | ) | 35,449 | |||||||||||||
Redeemable noncontrolling interest | — | — | 751 | — | 751 | ||||||||||||||
Equity: | |||||||||||||||||||
Stockholders' equity | 18,287 | 10,723 | 35,268 | (45,991 | ) | 18,287 | |||||||||||||
Noncontrolling interests | — | — | 3,683 | 504 | 4,187 | ||||||||||||||
Total equity | 18,287 | 10,723 | 38,951 | (45,487 | ) | 22,474 | |||||||||||||
Total liabilities and equity | $ | 38,024 | $ | 18,831 | $ | 62,665 | $ | (60,846 | ) | $ | 58,674 | ||||||||
a. | All U.S. related deferred income taxes are recorded at the parent company. |
24
CONDENSED CONSOLIDATING STATEMENTS OF COMPREHENSIVE (LOSS) INCOME
Three Months Ended June 30, 2015 | |||||||||||||||||||
FCX | FM O&G LLC | Non-guarantor | Consolidated | ||||||||||||||||
Issuer | Guarantor | Subsidiaries | Eliminations | FCX | |||||||||||||||
Revenues | $ | — | $ | 169 | $ | 4,079 | $ | — | $ | 4,248 | |||||||||
Total costs and expenses | 19 | 1,217 | a | 5,383 | a | 3 | 6,622 | ||||||||||||
Operating (loss) income | (19 | ) | (1,048 | ) | (1,304 | ) | (3 | ) | (2,374 | ) | |||||||||
Interest expense, net | (121 | ) | (2 | ) | (67 | ) | 41 | (149 | ) | ||||||||||
Other income (expense), net | 127 | — | (56 | ) | (34 | ) | 37 | ||||||||||||
(Loss) income before income taxes and equity in affiliated companies' net (losses) earnings | (13 | ) | (1,050 | ) | (1,427 | ) | 4 | (2,486 | ) | ||||||||||
(Provision for) benefit from income taxes | (265 | ) | 374 | 580 | (2 | ) | 687 | ||||||||||||
Equity in affiliated companies' net (losses) earnings | (1,573 | ) | (1,920 | ) | (2,972 | ) | 6,465 | — | |||||||||||
Net (loss) income | (1,851 | ) | (2,596 | ) | (3,819 | ) | 6,467 | (1,799 | ) | ||||||||||
Net income and preferred dividends attributable to noncontrolling interests | — | — | (38 | ) | (14 | ) | (52 | ) | |||||||||||
Net (loss) income attributable to common stockholders | $ | (1,851 | ) | $ | (2,596 | ) | $ | (3,857 | ) | $ | 6,453 | $ | (1,851 | ) | |||||
Other comprehensive income (loss) | 9 | — | 9 | (9 | ) | 9 | |||||||||||||
Total comprehensive (loss) income | $ | (1,842 | ) | $ | (2,596 | ) | $ | (3,848 | ) | $ | 6,444 | $ | (1,842 | ) | |||||
a. | Includes charges totaling $1.0 billion at the FM O&G LLC guarantor and $1.7 billion at the non-guarantor subsidiaries related to ceiling test impairment of FCX's oil and gas properties pursuant to full cost accounting rules. |
Six Months Ended June 30, 2015 | |||||||||||||||||||
FCX | FM O&G LLC | Non-guarantor | Consolidated | ||||||||||||||||
Issuer | Guarantor | Subsidiaries | Eliminations | FCX | |||||||||||||||
Revenues | $ | — | $ | 350 | $ | 8,051 | $ | — | $ | 8,401 | |||||||||
Total costs and expenses | 35 | 2,535 | a | 11,181 | a | (13 | ) | 13,738 | |||||||||||
Operating (loss) income | (35 | ) | (2,185 | ) | (3,130 | ) | 13 | (5,337 | ) | ||||||||||
Interest expense, net | (236 | ) | (6 | ) | (124 | ) | 71 | (295 | ) | ||||||||||
Other income (expense), net | 156 | — | (48 | ) | (64 | ) | 44 | ||||||||||||
(Loss) income before income taxes and equity in affiliated companies' net (losses) earnings | (115 | ) | (2,191 | ) | (3,302 | ) | 20 | (5,588 | ) | ||||||||||
(Provision for) benefit from income taxes | (686 | ) | 790 | 1,286 | (8 | ) | 1,382 | ||||||||||||
Equity in affiliated companies' net (losses) earnings | (3,524 | ) | (4,279 | ) | (6,502 | ) | 14,306 | 1 | |||||||||||
Net (loss) income | (4,325 | ) | (5,680 | ) | (8,518 | ) | 14,318 | (4,205 | ) | ||||||||||
Net income and preferred dividends attributable to noncontrolling interests | — | — | (94 | ) | (26 | ) | (120 | ) | |||||||||||
Net (loss) income attributable to common stockholders | $ | (4,325 | ) | $ | (5,680 | ) | $ | (8,612 | ) | $ | 14,292 | $ | (4,325 | ) | |||||
Other comprehensive income (loss) | 21 | — | 21 | (21 | ) | 21 | |||||||||||||
Total comprehensive (loss) income | $ | (4,304 | ) | $ | (5,680 | ) | $ | (8,591 | ) | $ | 14,271 | $ | (4,304 | ) | |||||
a. | Includes charges totaling $2.1 billion at the FM O&G LLC guarantor and $3.7 billion at the non-guarantor subsidiaries related to ceiling test impairment of FCX's oil and gas properties pursuant to full cost accounting rules. |
25
CONDENSED CONSOLIDATING STATEMENTS OF COMPREHENSIVE INCOME (LOSS)
Three Months Ended June 30, 2014 | |||||||||||||||||||
FCX | FM O&G LLC | Non-guarantor | Consolidated | ||||||||||||||||
Issuer | Guarantor | Subsidiaries | Eliminations | FCX | |||||||||||||||
Revenues | $ | — | $ | 570 | $ | 4,952 | $ | — | $ | 5,522 | |||||||||
Total costs and expenses | 21 | 489 | 3,865 | (6 | ) | 4,369 | |||||||||||||
Operating (loss) income | (21 | ) | 81 | 1,087 | 6 | 1,153 | |||||||||||||
Interest expense, net | (87 | ) | (44 | ) | (51 | ) | 18 | (164 | ) | ||||||||||
Net (loss) gain on early extinguishment of debt | (1 | ) | 6 | — | — | 5 | |||||||||||||
Other income (expense), net | 17 | 1 | (8 | ) | (18 | ) | (8 | ) | |||||||||||
(Loss) income before income taxes and equity in affiliated companies' net earnings (losses) | (92 | ) | 44 | 1,028 | 6 | 986 | |||||||||||||
Benefit from (provision for) income taxes | 26 | 26 | (378 | ) | (2 | ) | (328 | ) | |||||||||||
Equity in affiliated companies' net earnings (losses) | 548 | 126 | 154 | (826 | ) | 2 | |||||||||||||
Net income (loss) | 482 | 196 | 804 | (822 | ) | 660 | |||||||||||||
Net income and preferred dividends attributable to noncontrolling interests | — | — | (180 | ) | 2 | (178 | ) | ||||||||||||
Net income (loss) attributable to common stockholders | $ | 482 | $ | 196 | $ | 624 | $ | (820 | ) | $ | 482 | ||||||||
Other comprehensive income (loss) | 1 | — | 1 | (1 | ) | 1 | |||||||||||||
Total comprehensive income (loss) | $ | 483 | $ | 196 | $ | 625 | $ | (821 | ) | $ | 483 | ||||||||
Six Months Ended June 30, 2014 | |||||||||||||||||||
FCX | FM O&G LLC | Non-guarantor | Consolidated | ||||||||||||||||
Issuer | Guarantor | Subsidiaries | Eliminations | FCX | |||||||||||||||
Revenues | $ | — | $ | 1,214 | $ | 9,293 | $ | — | $ | 10,507 | |||||||||
Total costs and expenses | 32 | 1,015 | 7,204 | (8 | ) | 8,243 | |||||||||||||
Operating (loss) income | (32 | ) | 199 | 2,089 | 8 | 2,264 | |||||||||||||
Interest expense, net | (169 | ) | (85 | ) | (109 | ) | 38 | (325 | ) | ||||||||||
Net (loss) gain on early extinguishment of debt | (1 | ) | 6 | — | — | 5 | |||||||||||||
Other income (expense), net | 37 | 1 | 25 | (38 | ) | 25 | |||||||||||||
(Loss) income before income taxes and equity in affiliated companies' net earnings (losses) | (165 | ) | 121 | 2,005 | 8 | 1,969 | |||||||||||||
Benefit from (provision for) income taxes | 5 | (17 | ) | (670 | ) | (3 | ) | (685 | ) | ||||||||||
Equity in affiliated companies' net earnings (losses) | 1,152 | 256 | 339 | (1,745 | ) | 2 | |||||||||||||
Net income (loss) | 992 | 360 | 1,674 | (1,740 | ) | 1,286 | |||||||||||||
Net income and preferred dividends attributable to noncontrolling interests | — | — | (291 | ) | (3 | ) | (294 | ) | |||||||||||
Net income (loss) attributable to common stockholders | $ | 992 | $ | 360 | $ | 1,383 | $ | (1,743 | ) | $ | 992 | ||||||||
Other comprehensive income (loss) | 4 | — | 4 | (4 | ) | 4 | |||||||||||||
Total comprehensive income (loss) | $ | 996 | $ | 360 | $ | 1,387 | $ | (1,747 | ) | $ | 996 | ||||||||
26
CONDENSED CONSOLIDATING STATEMENT OF CASH FLOWS
Six Months Ended June 30, 2015
FCX | FM O&G LLC | Non-guarantor | Consolidated | ||||||||||||||||
Issuer | Guarantor | Subsidiaries | Eliminations | FCX | |||||||||||||||
Cash flow from operating activities: | |||||||||||||||||||
Net (loss) income | $ | (4,325 | ) | $ | (5,680 | ) | $ | (8,518 | ) | $ | 14,318 | $ | (4,205 | ) | |||||
Adjustments to reconcile net (loss) income to net cash (used in) provided by operating activities: | |||||||||||||||||||
Depreciation, depletion and amortization | 2 | 223 | 1,638 | (34 | ) | 1,829 | |||||||||||||
Impairment of oil and gas properties | — | 2,052 | 3,717 | 21 | 5,790 | ||||||||||||||
Net gains on crude oil derivative contracts | — | (58 | ) | — | — | (58 | ) | ||||||||||||
Equity in losses (earnings) of consolidated subsidiaries | 3,524 | 4,279 | 6,502 | (14,306 | ) | (1 | ) | ||||||||||||
Other, net | (1,431 | ) | 9 | 43 | — | (1,379 | ) | ||||||||||||
Changes in working capital and other tax payments | 2,222 | (550 | ) | (1,870 | ) | 8 | (190 | ) | |||||||||||
Net cash (used in) provided by operating activities | (8 | ) | 275 | 1,512 | 7 | 1,786 | |||||||||||||
Cash flow from investing activities: | |||||||||||||||||||
Capital expenditures | — | (734 | ) | (2,787 | ) | (7 | ) | (3,528 | ) | ||||||||||
Intercompany loans | (1,073 | ) | (794 | ) | — | 1,867 | — | ||||||||||||
Dividends from (investments in) consolidated subsidiaries | 438 | (31 | ) | 74 | (481 | ) | — | ||||||||||||
Other, net | (10 | ) | (1 | ) | 137 | 10 | 136 | ||||||||||||
Net cash (used in) provided by investing activities | (645 | ) | (1,560 | ) | (2,576 | ) | 1,389 | (3,392 | ) | ||||||||||
Cash flow from financing activities: | |||||||||||||||||||
Proceeds from debt | 2,735 | — | 1,687 | — | 4,422 | ||||||||||||||
Repayments of debt | (1,690 | ) | — | (670 | ) | — | (2,360 | ) | |||||||||||
Intercompany loans | — | 1,321 | 546 | (1,867 | ) | — | |||||||||||||
Cash dividends and distributions paid, and contributions received | (380 | ) | — | (481 | ) | 421 | (440 | ) | |||||||||||
Other, net | (12 | ) | (37 | ) | (15 | ) | 50 | (14 | ) | ||||||||||
Net cash provided by (used in) financing activities | 653 | 1,284 | 1,067 | (1,396 | ) | 1,608 | |||||||||||||
Net (decrease) increase in cash and cash equivalents | — | (1 | ) | 3 | — | 2 | |||||||||||||
Cash and cash equivalents at beginning of period | — | 1 | 463 | — | 464 | ||||||||||||||
Cash and cash equivalents at end of period | $ | — | $ | — | $ | 466 | $ | — | $ | 466 | |||||||||
27
CONDENSED CONSOLIDATING STATEMENT OF CASH FLOWS
Six Months Ended June 30, 2014
FCX | FM O&G LLC | Non-guarantor | Consolidated | |||||||||||||||||
Issuer | Guarantor | Subsidiaries | Eliminations | FCX | ||||||||||||||||
Cash flow from operating activities: | ||||||||||||||||||||
Net income (loss) | $ | 992 | $ | 360 | $ | 1,674 | $ | (1,740 | ) | $ | 1,286 | |||||||||
Adjustments to reconcile net income (loss) to net cash (used in) provided by operating activities: | ||||||||||||||||||||
Depreciation, depletion and amortization | 2 | 545 | 1,440 | (8 | ) | 1,979 | ||||||||||||||
Net losses on crude oil and natural gas derivative contracts | — | 120 | — | — | 120 | |||||||||||||||
Net gain (loss) on early extinguishment of debt | 1 | (6 | ) | — | — | (5 | ) | |||||||||||||
Equity in (earnings) losses of consolidated subsidiaries | (1,152 | ) | (256 | ) | 39 | 1,367 | (2 | ) | ||||||||||||
Other, net | 121 | (12 | ) | (123 | ) | — | (14 | ) | ||||||||||||
Changes in working capital and other tax payments | (164 | ) | (2,165 | ) | 1,552 | — | (777 | ) | ||||||||||||
Net cash (used in) provided by operating activities | (200 | ) | (1,414 | ) | 4,582 | (381 | ) | 2,587 | ||||||||||||
Cash flow from investing activities: | ||||||||||||||||||||
Capital expenditures | — | (897 | ) | (2,665 | ) | — | (3,562 | ) | ||||||||||||
Acquisition of Deepwater GOM interests | — | — | (925 | ) | — | (925 | ) | |||||||||||||
Intercompany loans | 1,318 | 1,629 | — | — | (2,947 | ) | — | |||||||||||||
(Investments in) dividends from consolidated subsidiaries | (364 | ) | (96 | ) | 1,079 | (619 | ) | — | ||||||||||||
Net proceeds from sale of Eagle Ford shale assets | — | 3,009 | — | — | 3,009 | |||||||||||||||
Other, net | — | (381 | ) | 18 | — | (363 | ) | |||||||||||||
Net cash provided by (used in) investing activities | 954 | 3,264 | (2,493 | ) | (3,566 | ) | (1,841 | ) | ||||||||||||
Cash flow from financing activities: | ||||||||||||||||||||
Proceeds from debt | 890 | — | 358 | — | 1,248 | |||||||||||||||
Repayments of debt | (990 | ) | (224 | ) | (397 | ) | — | (1,611 | ) | |||||||||||
Intercompany loans | — | (170 | ) | (2,777 | ) | 2,947 | — | |||||||||||||
Cash dividends and distributions paid, and contributions received | (653 | ) | (1,453 | ) | 203 | 1,000 | (903 | ) | ||||||||||||
Other, net | (1 | ) | (2 | ) | (4 | ) | — | (7 | ) | |||||||||||
Net cash (used in) provided by financing activities | (754 | ) | (1,849 | ) | (2,617 | ) | 3,947 | (1,273 | ) | |||||||||||
Net increase (decrease) in cash and cash equivalents | — | 1 | (528 | ) | — | (527 | ) | |||||||||||||
Cash and cash equivalents at beginning of period | — | — | 1,985 | — | 1,985 | |||||||||||||||
Cash and cash equivalents at end of period | $ | — | $ | 1 | $ | 1,457 | $ | — | $ | 1,458 | ||||||||||
28
NOTE 12. NEW ACCOUNTING STANDARDS
In April 2015, the Financial Accounting Standards Board issued an Accounting Standards Update (ASU) to simplify the presentation of debt issuance costs. This ASU requires that debt issuance costs related to a recognized debt liability be presented in the balance sheet as a direct deduction from the carrying amount of that debt liability, consistent with debt discounts. For public entities, this ASU is effective for annual periods beginning after December 15, 2015, and interim periods within those fiscal years. Early adoption is permitted for financial statements that have not been previously issued. FCX adopted this ASU in first-quarter 2015 and retrospectively adjusted its previously issued financial statements. Upon adoption, FCX adjusted its December 31, 2014, balance sheet by decreasing other assets and long-term debt by $121 million for debt issuance costs related to corresponding debt balances. FCX elected to continue presenting debt issuance costs for its revolving credit facility as a deferred charge (asset) because of the volatility of its borrowings and repayments under the facility.
NOTE 13. SUBSEQUENT EVENTS
As reported in Note 13 of FCX's annual report on Form 10-K for the year ended December 31, 2014, PT-FI entered into a Memorandum of Understanding (MOU) with the Indonesian government in July 2014. Under the MOU, PT-FI provided a $115 million assurance bond to support its commitment for smelter development, agreed to increased royalty rates and agreed to pay export duties (which were set at 7.5 percent, declining to 5.0 percent when smelter development progress exceeds 7.5 percent and are eliminated when development progress exceeds 30 percent). The MOU also anticipated an amendment of the COW within six months to address other matters; however, no terms of the COW other than those relating to the smelter bond, increased royalties and export duties were changed. In January 2015, the MOU was extended to July 25, 2015, and it expired on that date. The increased royalty rates, export duties and smelter assurance bond remain in effect.
PT-FI is also required to apply for renewal of export permits at six-month intervals. On July 29, 2015, PT-FI's export permit was renewed through January 28, 2016. In connection with the renewal, export duties were reduced to 5.0 percent, as a result of smelter development progress.
FCX evaluated events after June 30, 2015, and through the date the consolidated financial statements were issued, and determined any events or transactions occurring during this period that would require recognition or disclosure are appropriately addressed in these consolidated financial statements.
29
REVIEW REPORT OF INDEPENDENT REGISTERED PUBLIC ACCOUNTING FIRM
TO THE BOARD OF DIRECTORS AND STOCKHOLDERS OF
FREEPORT-McMoRan INC.
We have reviewed the condensed consolidated balance sheet of Freeport-McMoRan Inc. (formerly Freeport-McMoRan Copper & Gold Inc.) as of June 30, 2015, and the related consolidated statements of operations and comprehensive (loss) income for the three- and six-month periods ended June 30, 2015 and 2014, the consolidated statements of cash flows for the six-month periods ended June 30, 2015 and 2014, and the consolidated statement of equity for the six-month period ended June 30, 2015. These financial statements are the responsibility of the Company’s management.
We conducted our review in accordance with the standards of the Public Company Accounting Oversight Board (United States). A review of interim financial information consists principally of applying analytical procedures and making inquiries of persons responsible for financial and accounting matters. It is substantially less in scope than an audit conducted in accordance with the standards of the Public Company Accounting Oversight Board (United States), the objective of which is the expression of an opinion regarding the financial statements taken as a whole. Accordingly, we do not express such an opinion.
Based on our review, we are not aware of any material modifications that should be made to the condensed consolidated financial statements referred to above for them to be in conformity with U.S. generally accepted accounting principles.
We have previously audited, in accordance with the standards of the Public Company Accounting Oversight Board (United States), the consolidated balance sheet of Freeport-McMoRan Inc. as of December 31, 2014, and the related consolidated statements of operations, comprehensive (loss) income, cash flows and equity for the year then ended (not presented herein) and we expressed an unqualified audit opinion on those consolidated financial statements in our report dated February 27, 2015. In our opinion, the accompanying condensed consolidated balance sheet of Freeport-McMoRan Inc. as of December 31, 2014, is fairly stated, in all material respects, in relation to the consolidated balance sheet from which it has been derived.
/s/ ERNST & YOUNG LLP
Phoenix, Arizona
August 10, 2015
30
Item 2. | Management's Discussion and Analysis of Financial Condition and Results of Operations. |
In Management’s Discussion and Analysis of Financial Condition and Results of Operations, "we," "us" and "our" refer to Freeport-McMoRan Inc. (FCX) and its consolidated subsidiaries. You should read this discussion in conjunction with our financial statements, the related Management’s Discussion and Analysis of Financial Condition and Results of Operations and the discussion of our Business and Properties in our annual report on Form 10-K for the year ended December 31, 2014, filed with the United States (U.S.) Securities and Exchange Commission (SEC). The results of operations reported and summarized below are not necessarily indicative of future operating results (refer to "Cautionary Statement" for further discussion). References to "Notes" are Notes included in our Notes to Consolidated Financial Statements. Throughout Management's Discussion and Analysis of Financial Condition and Results of Operations, all references to earnings or losses per share are on a diluted basis.
OVERVIEW
We are a premier U.S.-based natural resources company with an industry-leading global portfolio of mineral assets, significant oil and gas resources and a growing production profile. We are the world's largest publicly traded copper producer. Our portfolio of assets includes the Grasberg minerals district in Indonesia, one of the world's largest copper and gold deposits; significant mining operations in North and South America; the Tenke Fungurume (Tenke) minerals district in the Democratic Republic of Congo (DRC) in Africa; and significant U.S. oil and natural gas assets, including reserves in the Deepwater Gulf of Mexico (GOM), onshore and offshore California, the Haynesville shale play in Louisiana, the Madden area in Central Wyoming and a position in the Inboard Lower Tertiary/Cretaceous natural gas trend onshore in South Louisiana.
Our results for the second quarter and first six months of 2015, compared with 2014 periods, reflect lower commodity price realizations and lower oil sales volumes, partly offset by higher gold sales volumes. The first six months of 2015 also reflects higher copper sales volumes, compared with the first six months of 2014. Results for the 2015 periods were impacted by net charges of $2.7 billion ($2.0 billion to net loss attributable to common stockholders) in second-quarter 2015 and $5.8 billion ($4.4 billion to net loss attributable to common stockholders) for the first six months of 2015, for the impairment of our oil and gas properties pursuant to full cost accounting rules and the related tax charges to establish a deferred tax valuation allowance. Refer to “Consolidated Results” for further discussion of our consolidated financial results for the three- and six-month periods ended June 30, 2015 and 2014.
At June 30, 2015, we had $466 million in consolidated cash and cash equivalents and $20.9 billion in total debt. We have made substantial progress toward the completion of our major mining development projects, which are expected to result in increased near-term production, lower unit costs, declining capital expenditures and to contribute to cash flow from operations after capital expenditures in future years. In addition, positive oil and gas drilling and development activities are expected to result in a growing oil production profile. We remain focused on maintaining a strong balance sheet and on continuing to manage costs, capital spending plans and other actions as required to maintain financial strength.
Subsequent to June 30, 2015, copper and molybdenum prices have fallen and at July 31, 2015, prices we would expect to record additional charges for LCM inventory adjustments in third-quarter 2015. Additionally, as further discussed in “Critical Accounting Estimates” in Part II, Items 7. And 7A. of our annual report on Form 10-K for the year ended December 31, 2014, we regularly assess the carrying values of our long-lived mining assets, and decreases in metal prices or other factors may result in impairment of our long-lived mining assets. Also, refer to "Operations - Oil and Gas" for further discussion of potentially significant additional ceiling test impairments of our oil and gas properties.
In July 2015, we announced that we are undertaking a comprehensive review of operating plans in our mining and oil and gas businesses to target significant additional reductions in capital spending and operating and administrative costs in response to weak market conditions for our major products. On August 5, 2015, we provided an update on our progress and announced the deferral of investments in several long-term projects in our oil and gas business, which will result in a reduction of $0.9 billion in projected capital expenditures for each of the years 2016 and 2017. We have also revised our estimate of the start-up of initial production from its recent drilling success in the Horn Mountain area to 2016 from the previously estimated start-up in 2017. The revised plans, together with the previously announced potential initial public offering (IPO) of a minority interest in our wholly owned subsidiary, Freeport-McMoRan Oil & Gas Inc., and potential other actions, will be pursued as required to
31
fund oil and gas capital spending with cash flow for 2016 and subsequent years. Refer to “Operations - Oil and Gas” for further discussion of the potential IPO.
We are completing the review of operating plans at each of our copper and molybdenum mining operations and will revise operating and capital plans to strengthen our financial position in a weak copper price environment. The revised plans will target lower operating and capital costs to achieve maximum cash flow under the current market conditions. Production at certain operations challenged by low commodity prices will be curtailed. We expect to complete this review promptly and will report our revised plans during third-quarter 2015. We will also continue to assess opportunities to partner with strategic investors potentially interested in investing capital with FCX in the development of our oil and gas and mining properties. We have a broad set of assets with valuable infrastructure and associated resources with attractive long-term production and development potential.
OUTLOOK
We view the long-term outlook for our business positively, supported by limitations on supplies of copper and by the requirements for copper and oil in the world’s economy. Our financial results vary as a result of fluctuations in market prices primarily for copper, gold, molybdenum and oil, as well as other factors. World market prices for these commodities have fluctuated historically and are affected by numerous factors beyond our control. Because we cannot control the price of our products, the key measures that management focuses on in operating our business are sales volumes, unit net cash costs for our mining operations, cash production costs per barrel of oil equivalent (BOE) for our oil and gas operations and operating cash flow. As discussed above in "Overview," we are undertaking a comprehensive review of operating plans in our mining business to target significant additional reductions in capital spending, and operating and administrative costs, which we expect to report during third-quarter 2015. Accordingly, the following outlook is subject to change as a result of the review and other factors.
Sales Volumes. Following are our projected consolidated sales volumes for the year 2015:
Copper (millions of recoverable pounds): | |||
North America copper mines | 1,960 | ||
South America mining | 900 | ||
Indonesia mining | 860 | ||
Africa mining | 460 | ||
4,180 | |||
Gold (thousands of recoverable ounces) | 1,300 | ||
Molybdenum (millions of recoverable pounds) | 93 | a | |
Oil Equivalents (million BOE or MMBOE) | 52.9 | ||
a. | Projected molybdenum sales include 44 million pounds produced by our Molybdenum mines and 49 million pounds produced by our North and South America copper mines. |
Consolidated sales for third-quarter 2015 are expected to approximate 1.0 billion pounds of copper, 315 thousand ounces of gold, 24 million pounds of molybdenum and 13.6 MMBOE. Projected sales volumes are dependent on a number of factors, including operational performance and other factors. For other important factors that could cause results to differ materially from projections, refer to "Cautionary Statement."
Mining Unit Net Cash Costs. Assuming average prices of $1,150 per ounce of gold and $6 per pound of molybdenum for the second half of 2015, and achievement of current sales volume and cost estimates, consolidated unit net cash costs (net of by-product credits) for our copper mines are expected to average $1.53 per pound of copper for the year 2015. Quarterly unit net cash costs vary with fluctuations in sales volumes and average realized prices (primarily gold and molybdenum prices). The impact of price changes for the second half of 2015 on consolidated unit net cash costs would approximate $0.01 per pound for each $50 per ounce change in the average price of gold and $0.01 per pound for each $2 per pound change in the average price of molybdenum. Refer to “Consolidated Results – Production and Delivery Costs” for further discussion of consolidated production and delivery costs for our mining operations.
32
Oil and Gas Cash Production Costs per BOE. Based on current sales volume and cost estimates for the second half of 2015, oil and gas cash production costs are expected to approximate $20 per BOE for the year 2015. Refer to “Operations – Oil and Gas” for further discussion of oil and gas production costs.
Consolidated Operating Cash Flow. Our consolidated operating cash flows vary with prices realized from copper, gold, molybdenum and oil sales, sales volumes, production costs, income taxes (refer to “Consolidated Results – Income Taxes” for further discussion of projected income taxes), other working capital changes and other factors. Based on current sales volume and cost estimates, and assuming average prices of $2.50 per pound of copper, $1,150 per ounce of gold, $6 per pound of molybdenum and $56 per barrel of Brent crude oil for the second half of 2015, consolidated operating cash flows are estimated to approximate $3.6 billion for the year 2015. The impact of price changes during the second half of 2015 on operating cash flows would approximate $190 million for each $0.10 per pound change in the average price of copper, $25 million for each $50 per ounce change in the average price of gold, $60 million for each $2 per pound change in the average price of molybdenum and $55 million for each $5 per barrel change in the average Brent crude oil price.
MARKETS
Metals. World prices for copper, gold and molybdenum can fluctuate significantly. During the period from January 2005 through July 2015, the London Metal Exchange (LME) spot copper price varied from a low of $1.26 per pound in 2008 to a record high of $4.60 per pound in 2011; the London Bullion Market Association (London) PM gold price fluctuated from a low of $411 per ounce in 2005 to a record high of $1,895 per ounce in 2011; and the Metals Week Molybdenum Dealer Oxide weekly average price ranged from a low of $5.87 per pound in 2015 to a record high of $39.25 per pound in 2005. Copper, gold and molybdenum prices are affected by numerous factors beyond our control as described further in our “Risk Factors” contained in Part I, Item 1A of our annual report on Form 10-K for the year ended December 31, 2014.
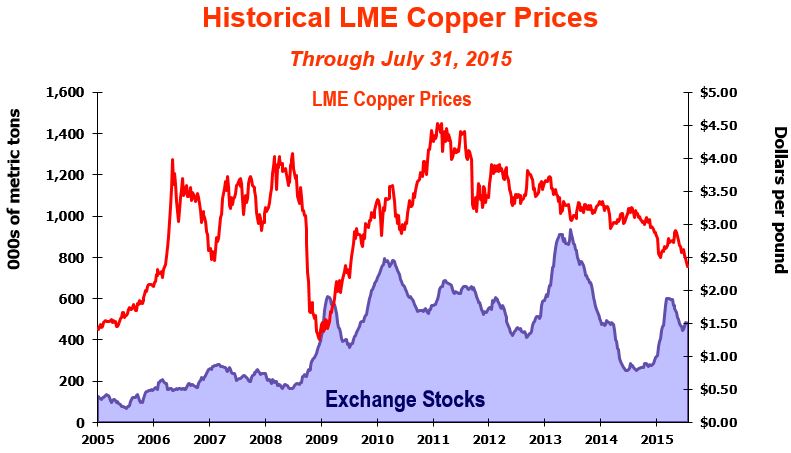
This graph presents LME spot copper prices and the combined reported stocks of copper at the LME, Commodity Exchange Inc., a division of the New York Mercantile Exchange (NYMEX), and the Shanghai Futures Exchange from January 2005 through July 2015. From 2006 through most of 2008, limited supplies, combined with growing demand from China and other emerging economies, resulted in high copper prices and low levels of inventories. We believe current copper prices are supported by a combination of demand from developing economies and pro-growth monetary fiscal policy decisions in Europe, China and the U.S. Since mid-2014, copper prices have declined because of concerns about slowing growth rates in China, a stronger U.S. dollar and a broad-based decline in commodity prices. Renewed concerns about Chinese economic growth rates, concerns about Europe, continued U.S. dollar strength and broad-based weakness in commodity prices in general put downward pressure on copper prices during second-quarter 2015. LME spot copper prices ranged from a low of $2.56 per pound to a high of
33
$2.92 per pound during second-quarter 2015, averaged $2.74 per pound and closed at $2.60 per pound on June 30, 2015. LME spot copper prices have declined further during July 2015, closing at $2.37 per pound on July 31, 2015.
We believe the underlying long-term fundamentals of the copper business remain positive, supported by the significant role of copper in the global economy and a challenging long-term supply environment attributable to difficulty in replacing existing large mines' output with new production sources. Future copper prices are expected to be volatile and are likely to be influenced by demand from China and emerging markets, as well as economic activity in the U.S. and other industrialized countries, the timing of the development of new supplies of copper, and production levels of mines and copper smelters.
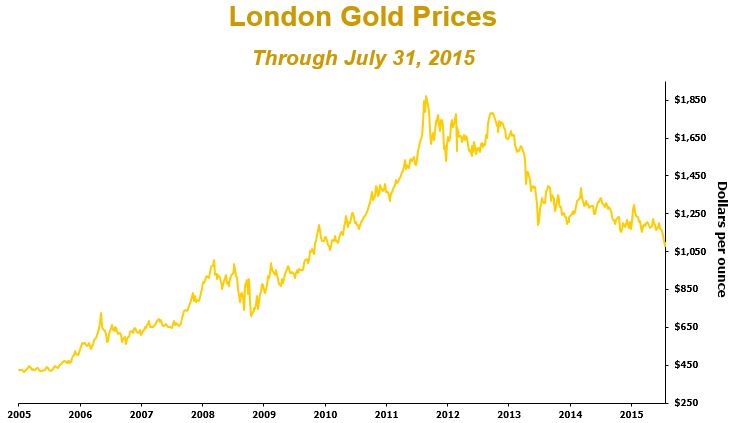
This graph presents London PM gold prices from January 2005 through July 2015. An improving economic outlook and positive equity performance contributed to lower demand for gold in 2014 and early 2015, resulting in generally lower prices. During second-quarter 2015, London PM gold prices ranged from a low of $1,165 per ounce to a high of $1,225 per ounce, averaged $1,192 per ounce and closed at $1,171 per ounce on June 30, 2015. Gold prices have declined further during 2015 and closed at $1,098 per ounce on July 31, 2015.
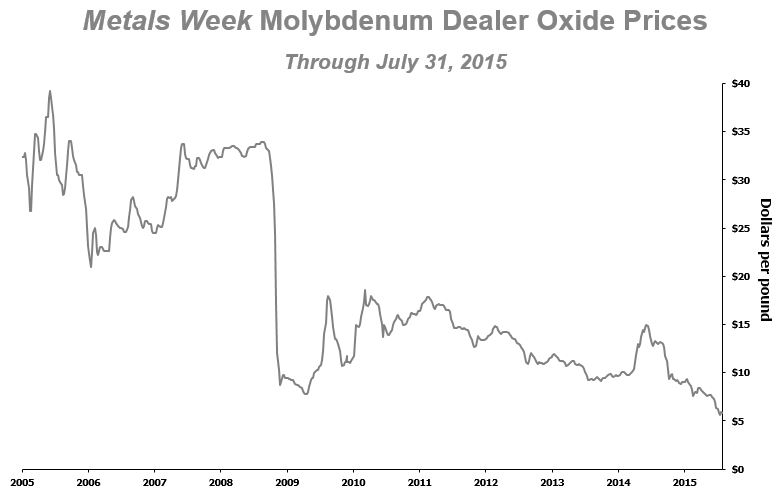
34
This graph presents the Metals Week Molybdenum Dealer Oxide weekly average prices from January 2005 through July 2015. Molybdenum prices have declined since mid-2014 because of weaker demand from European and U.S. steel and stainless steel producers. During second-quarter 2015, the weekly average price of molybdenum ranged from a low of $6.38 per pound to a high of $8.24 per pound, averaged $7.57 per pound and was $6.38 on June 30, 2015. The Metals Week Molybdenum Dealer Oxide weekly average price has declined further during July 2015 and was $5.87 per pound on July 31, 2015.
Oil and Gas. Market prices for crude oil and natural gas can fluctuate significantly. During the period from January 2005 through July 2015, the Brent crude oil price ranged from a low of $36.61 per barrel to a high of $146.08 per barrel in 2008 and the NYMEX natural gas price fluctuated from a low of $2.04 per million British thermal units (MMBtu) in 2012 to a high of $13.91 per MMBtu in 2005. Crude oil and natural gas prices are affected by numerous factors beyond our control as described further in our “Risk Factors” contained in Part I, Item 1A. of our annual report on Form 10-K for the year ended December 31, 2014.
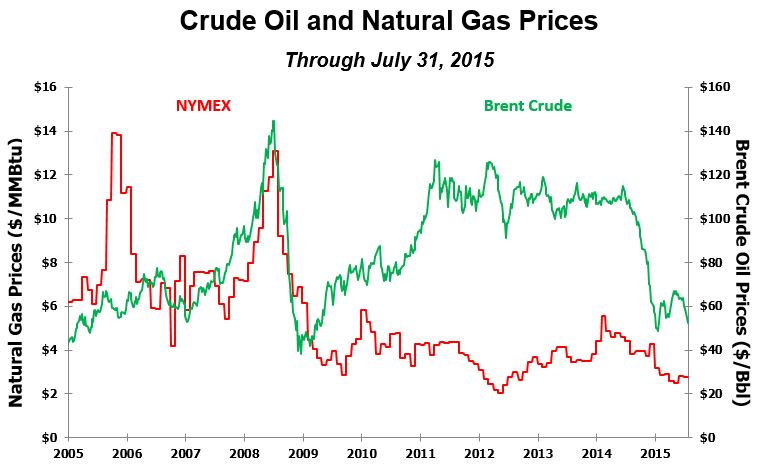
This graph presents Brent crude oil prices and NYMEX natural gas contract prices from January 2005 through July 2015. Crude oil prices reached a record high in July 2008 as economic growth in emerging economies and the U.S. created high global demand for oil and lower inventories. By the end of 2008, financial turmoil in the U.S. contributed to a global economic slowdown and a decline in many commodity prices. Crude oil prices rebounded
after 2008, supported by a gradually improving global economy and demand outlook. Since mid-2014, oil prices have significantly declined associated with global oversupply primarily attributable to continued strong production from U.S. shale plays, the Organization of Petroleum Exporting Countries and Russia, coupled with weak economic data in Europe and slowing Chinese demand. During second-quarter 2015, Brent crude oil prices ranged from a low of $54.95 per barrel to a high of $67.77 per barrel, averaged $63.57 per barrel and were $63.59 per barrel on June 30, 2015. The Brent crude oil price has declined further during July 2015 and was $52.21 per barrel on July 31, 2015.
35
CONSOLIDATED RESULTS
Three Months Ended | Six Months Ended | |||||||||||||||
June 30, | June 30, | |||||||||||||||
2015 | 2014a | 2015 | 2014a | |||||||||||||
SUMMARY FINANCIAL DATA | (in millions, except per share amounts) | |||||||||||||||
Revenuesb,c,d | $ | 4,248 | $ | 5,522 | $ | 8,401 | $ | 10,507 | ||||||||
Operating (loss) incomeb,c,d | $ | (2,374 | ) | e,f,g | $ | 1,153 | h,i | $ | (5,337 | ) | e,f,g,j | $ | 2,264 | h,i | ||
Net (loss) income attributable to common stockc,d,k | $ | (1,851 | ) | e,f,g,l,m | $ | 482 | h,i,n | $ | (4,325 | ) | e,f,g,j,l,m | $ | 992 | h,i,n | ||
Diluted net (loss) income per share attributable to common stock | $ | (1.78 | ) | e,f,g,l,m | $ | 0.46 | h,i,n | $ | (4.16 | ) | e,f,g,j,l,m | $ | 0.95 | h,i,n | ||
Diluted weighted-average common shares outstanding | 1,040 | 1,045 | 1,040 | 1,045 | ||||||||||||
Operating cash flowso | $ | 1,069 | $ | 1,386 | $ | 1,786 | $ | 2,587 | ||||||||
Capital expenditures | $ | 1,661 | $ | 1,950 | $ | 3,528 | $ | 3,562 | ||||||||
At June 30: | ||||||||||||||||
Cash and cash equivalents | $ | 466 | $ | 1,458 | $ | 466 | $ | 1,458 | ||||||||
Total debt, including current portion | $ | 20,902 | $ | 20,190 | $ | 20,902 | $ | 20,190 | ||||||||
a. | Includes the results of the Candelaria and Ojos del Salado mines that were sold in November 2014, and the Eagle Ford properties that were sold in June 2014. |
b.As further detailed in Note 10, following is a summary of revenues and operating income (loss) by operating division (in millions):
Three Months Ended | Six Months Ended | |||||||||||||||
June 30, | June 30, | |||||||||||||||
Revenues | 2015 | 2014 | 2015 | 2014 | ||||||||||||
North America copper mines | $ | 1,405 | $ | 1,469 | $ | 2,740 | $ | 2,755 | ||||||||
South America mining | 453 | 1,031 | 939 | 1,929 | ||||||||||||
Indonesia mining | 790 | 523 | 1,397 | 993 | ||||||||||||
Africa mining | 351 | 418 | 761 | 745 | ||||||||||||
Molybdenum mines | 102 | 170 | 215 | 296 | ||||||||||||
Rod & Refining | 1,097 | 1,242 | 2,166 | 2,396 | ||||||||||||
Atlantic Copper Smelting & Refining | 500 | 629 | 1,046 | 1,222 | ||||||||||||
U.S. oil & gas operations | 569 | 1,236 | 1,069 | 2,497 | ||||||||||||
Other mining, corporate, other & eliminations | (1,019 | ) | (1,196 | ) | (1,932 | ) | (2,326 | ) | ||||||||
Total revenues | $ | 4,248 | $ | 5,522 | $ | 8,401 | $ | 10,507 | ||||||||
Operating income (loss) | ||||||||||||||||
North America copper mines | $ | 300 | $ | 468 | $ | 594 | $ | 858 | ||||||||
South America mining | 65 | 404 | 130 | 737 | ||||||||||||
Indonesia mining | 232 | (67 | ) | 305 | (49 | ) | ||||||||||
Africa mining | 101 | 154 | 200 | 275 | ||||||||||||
Molybdenum mines | (7 | ) | 65 | (3 | ) | 93 | ||||||||||
Rod & Refining | 6 | 6 | 10 | 10 | ||||||||||||
Atlantic Copper Smelting & Refining | 19 | (4 | ) | 31 | (13 | ) | ||||||||||
U.S. oil & gas operations | (2,932 | ) | 232 | (6,403 | ) | 509 | ||||||||||
Other mining, corporate, other & eliminations | (158 | ) | (105 | ) | (201 | ) | (156 | ) | ||||||||
Total operating (loss) income | $ | (2,374 | ) | $ | 1,153 | $ | (5,337 | ) | $ | 2,264 | ||||||
c. | Includes (unfavorable) favorable adjustments to provisionally priced concentrate and cathode copper sales recognized in prior periods totaling $(20) million ($(10) million to net loss attributable to common stock or $(0.01) per share) for second-quarter 2015, $35 million ($16 million to net income attributable to common stock or $0.01 per share) for second-quarter 2014, $(106) million ($(50) million to net loss attributable to common stock or $(0.05) per share) for the first six months of 2015 and $(118) million ($(65) million to net income attributable to common stock or $(0.06) per share) for the first six months of 2014. Refer to “Revenues” for further discussion. |
d. | Includes net noncash mark-to-market (losses) gains associated with crude oil and natural gas derivative contracts totaling $(95) million ($(59) million to net loss attributable to common stock or $(0.06) per share) for second-quarter 2015, $(7) million ($(4) million to net income attributable to common stock or less than $(0.01) per share) for second-quarter 2014, $(143) million ($(89) million to net loss attributable to common stock or $(0.09) per share) for the first six months of 2015 |
36
and $8 million ($5 million to net income attributable to common stock or less than $0.01 per share) for the first six months of 2014. Refer to "Revenues" for further discussion.
e. | Includes charges to reduce the carrying value of oil and gas properties pursuant to full cost accounting rules of $2.7 billion ($1.7 billion to net loss attributable to common stock or $1.61 per share) for second-quarter 2015 and $5.8 billion ($3.6 billion to net loss attributable to common stock or $3.47 per share) for the first six months of 2015. See Note 1 and "Operations - Oil & Gas" for further discussion. |
f. | Includes charges for lower of cost or market (LCM) adjustments primarily attributable to molybdenum inventories totaling $59 million ($38 million to net loss attributable to common stock or $0.04 per share) for second-quarter 2015 and $63 million ($41 million to net loss attributable to common stock or $0.04 per share) for the first six months of 2015. See Note 4 for further discussion. |
g. | Includes net charges for idle/terminated rig costs and inventory write-downs at oil and gas operations of $22 million ($14 million to net loss attributable to common stock or $0.01 per share) for second-quarter 2015 and $39 million ($24 million to net loss attributable to common stock or $0.02 per share) for the first six months of 2015. |
h. | Includes net charges for adjustments to environmental obligations and related litigation reserves of $69 million ($68 million to net income attributable to common stock or $0.06 per share) for the second quarter and first six months of 2014. |
i. | Includes charges for fixed costs charged directly to cost of sales as a result of the impact of export restrictions on PT Freeport Indonesia's (PT-FI) operating rates of $56 million ($30 million to net income attributable to common stock or $0.03 per share) for second-quarter 2014 and $109 million ($58 million to net income attributable to common stock or $0.06 per share) for the first six months of 2014. |
j. | The first six months of 2015 includes a net gain of $39 million ($25 million to net loss attributable to common stock or $0.02 per share) associated with the sale of FCX's one-third interest in the Luna Energy power facility in New Mexico. |
k. | We defer recognizing profits on intercompany sales until final sales to third parties occur. For a summary of net impacts from changes in these deferrals, refer to "Operations - Smelting & Refining." |
l. | The second quarter and first six months of 2015 include a gain of $92 million ($0.09 per share) related to net proceeds received from insurance carriers and other third parties related to the shareholder derivative litigation settlement. |
m. | As a result of the impairment to oil and gas properties, we recorded tax charges to establish a valuation allowance primarily against U.S. federal alternative minimum tax credits of $305 million ($0.29 per share) for second-quarter 2015 and $763 million ($0.73 per share) for the first six months of 2015. |
n. | The second quarter and first six months of 2014 included a tax charge of $58 million ($0.06 per share) associated with deferred taxes recorded in connection with the allocation of goodwill to the sale of Eagle Ford. |
o. | Includes net working capital uses and changes in other tax payments of $104 million for second-quarter 2015, $364 million for second-quarter 2014, $190 million for the first six months of 2015, and $777 million for the first six months of 2014. |
37
Three Months Ended | Six Months Ended | |||||||||||||||
June 30, | June 30, | |||||||||||||||
2015 | 2014a | 2015 | 2014a | |||||||||||||
SUMMARY OPERATING DATA | ||||||||||||||||
Copper | ||||||||||||||||
Production (millions of recoverable pounds) | 977 | 931 | 1,892 | 1,879 | ||||||||||||
Sales, excluding purchases (millions of recoverable pounds) | 964 | 968 | 1,924 | 1,839 | ||||||||||||
Average realized price per pound | $ | 2.71 | $ | 3.16 | $ | 2.70 | $ | 3.17 | ||||||||
Site production and delivery costs per poundb | $ | 1.85 | $ | 1.99 | $ | 1.89 | $ | 1.94 | ||||||||
Unit net cash costs per poundb | $ | 1.50 | $ | 1.72 | $ | 1.57 | $ | 1.64 | ||||||||
Gold | ||||||||||||||||
Production (thousands of recoverable ounces) | 367 | 166 | 626 | 397 | ||||||||||||
Sales, excluding purchases (thousands of recoverable ounces) | 352 | 159 | 615 | 346 | ||||||||||||
Average realized price per ounce | $ | 1,174 | $ | 1,296 | $ | 1,183 | $ | 1,299 | ||||||||
Molybdenum | ||||||||||||||||
Production (millions of recoverable pounds) | 25 | 25 | 49 | 49 | ||||||||||||
Sales, excluding purchases (millions of recoverable pounds) | 23 | 25 | 46 | 52 | ||||||||||||
Average realized price per pound | $ | 9.51 | $ | 13.43 | $ | 9.84 | $ | 12.27 | ||||||||
Oil Equivalents | ||||||||||||||||
Sales volumes | ||||||||||||||||
MMBOE | 13.1 | 16.0 | 25.6 | 32.2 | ||||||||||||
Thousand BOE (MBOE) per day | 144 | 176 | 142 | 178 | ||||||||||||
Cash operating margin per BOEc | ||||||||||||||||
Realized revenues | $ | 50.04 | $ | 77.53 | $ | 46.95 | $ | 77.37 | ||||||||
Cash production costs | 19.04 | 19.57 | 19.62 | 19.03 | ||||||||||||
Cash operating margin | $ | 31.00 | $ | 57.96 | $ | 27.33 | $ | 58.34 | ||||||||
a. | The 2014 periods include the results of the Candelaria and Ojos del Salado mines that were sold in November 2014, and the Eagle Ford properties that were sold in June 2014. Sales volumes from Candelaria and Ojos del Salado totaled 80 million pounds of copper and 20 thousand ounces of gold for second-quarter 2014 and 174 million pounds of copper and 43 thousand ounces of gold for the first six months of 2014; sales volumes from Eagle Ford totaled 4.0 MMBOE (44 MBOE per day) for second-quarter 2014 and 8.7 MMBOE (48 MBOE per day) for the first six months of 2014. |
b. | Reflects per pound weighted-average production and delivery costs and unit net cash costs (net of by-product credits) for all copper mines. For reconciliations of per pound unit costs by operating division to production and delivery costs applicable to sales reported in our consolidated financial statements, refer to "Product Revenues and Production Costs." |
c. | Cash operating margin for oil and gas operations reflects realized revenues less cash production costs. Realized revenues exclude noncash mark-to-market adjustments on derivative contracts. For reconciliations of realized revenues and cash production costs per BOE to revenues and production and delivery costs reported in our consolidated financial statements, refer to "Product Revenues and Production Costs." |
Revenues
Consolidated revenues totaled $4.2 billion in second-quarter 2015 and $8.4 billion for the first six months of 2015, compared with $5.5 billion in second-quarter 2014 and $10.5 billion for the first six months of 2014. Revenues include the sale of copper concentrates, copper cathodes, copper rod, gold, molybdenum, silver and cobalt by our mining operations, and the sale of oil, natural gas and natural gas liquids (NGLs) by our oil and gas operations.
38
Following is a summary of changes in our consolidated revenues between periods (in millions):
Three Months Ended June 30, | Six Months Ended June 30, | ||||||
Consolidated revenues - 2014 periods | $ | 5,522 | $ | 10,507 | |||
Mining operations: | |||||||
Higher (lower) sales volumes from mining operations: | |||||||
Copper | (14 | ) | 268 | ||||
Gold | 248 | 349 | |||||
Molybdenum | (26 | ) | (65 | ) | |||
Lower average realized prices from mining operations: | |||||||
Copper | (434 | ) | (904 | ) | |||
Gold | (43 | ) | (72 | ) | |||
Molybdenum | (89 | ) | (112 | ) | |||
Net adjustments for prior period provisionally priced copper sales | (55 | ) | 12 | ||||
Lower revenues from purchased copper | (44 | ) | (52 | ) | |||
Lower Atlantic Copper revenues | (129 | ) | (176 | ) | |||
Oil and gas operations: | |||||||
Lower oil sales volumes | (293 | ) | (613 | ) | |||
Lower oil average realized prices, including cash gains (losses) on derivative contacts | (240 | ) | (552 | ) | |||
Net noncash mark-to-market adjustments on derivative contracts | (88 | ) | (151 | ) | |||
Other, including intercompany eliminations | (67 | ) | (38 | ) | |||
Consolidated revenues - 2015 periods | $ | 4,248 | $ | 8,401 | |||
Mining Operations
Sales Volumes. Consolidated copper sales volumes were 964 million pounds of copper in second-quarter 2015 and 1.9 billion pounds for the first six months of 2015, compared with 968 million pounds in second-quarter 2014 and 1.8 billion pounds for the first six months of 2014. The 2015 periods primarily reflect higher copper sales volumes from North America and Indonesia, offset by lower sales volumes from South America, resulting from the sale of Candelaria and Ojos del Salado in fourth-quarter 2014 and lower production from Cerro Verde and El Abra.
Consolidated gold sales increased to 352 thousand ounces of gold in second-quarter 2015 and 615 thousand ounces for the first six months of 2015, compared with 159 thousand ounces in second-quarter 2014 and 346 thousand ounces for the first six months of 2014, primarily reflecting higher ore grades and operating rates at PT-FI. Consolidated molybdenum sales volumes decreased to 23 million pounds in second-quarter 2015 and 46 million pounds for the first six months of 2015, compared with 25 million pounds of molybdenum in second-quarter 2014 and 52 million pounds for the first six months of 2014, primarily reflecting slowing demand in the metallurgic market for molybdenum. Refer to “Operations” for further discussion of sales volumes at our mining operations.
Metals Realized Prices. Our consolidated revenues can vary significantly as a result of fluctuations in the market prices of copper, gold, molybdenum, silver and cobalt. As presented above in the summary operating data table, metals price realizations were lower for the second quarter and first six months of 2015, compared with the 2014 periods. Refer to "Markets" for further discussion.
Provisionally Priced Copper Sales. During the first six months of 2015, 41 percent of our mined copper was sold in concentrate, 33 percent as cathode and 26 percent as rod from North America operations. Impacts of net adjustments for prior period provisionally priced sales primarily relate to copper sales. Substantially all of our copper concentrate and cathode sales contracts provide final copper pricing in a specified future month (generally one to four months from the shipment date) based primarily on quoted LME monthly average spot copper prices. We receive market prices based on prices in the specified future period, which results in price fluctuations recorded through revenues until the date of settlement. We record revenues and invoice customers at the time of shipment based on then-current LME prices, which results in an embedded derivative on our provisionally priced concentrate and cathode sales that is adjusted to fair value through earnings each period, using the period-end forward prices, until final pricing on the date of settlement. To the extent final prices are higher or lower than what was recorded on a provisional basis, an increase or decrease to revenues is recorded each reporting period until the date of final pricing. Accordingly, in times of rising copper prices, our revenues benefit from adjustments to the final pricing of provisionally priced sales pursuant to contracts entered into in prior periods; in times of falling copper prices, the
39
opposite occurs. The (unfavorable) favorable impacts of net adjustments to the prior periods' provisionally priced copper sales totaled $(20) million for second-quarter 2015 and $(106) million for the first six months of 2015, compared with $35 million for second-quarter 2014 and $(118) million for the first six months of 2014.
At June 30, 2015, we had provisionally priced copper sales at our copper mining operations, primarily South America and Indonesia, totaling 433 million pounds of copper (net of intercompany sales and noncontrolling interests) recorded at an average of $2.61 per pound, subject to final pricing over the next several months. We estimate that each $0.05 change in the price realized from the June 30, 2015, provisional price recorded would have an approximate $14 million effect on 2015 net income attributable to common stock. The LME spot copper price was $2.37 per pound on July 31, 2015.
Purchased Copper. We purchased copper cathode for processing by our Rod & Refining segment totaling 24 million pounds in second-quarter 2015 and 64 million for the first six months of 2015, compared with 34 million pounds in second-quarter 2014 and 66 million pounds for the first six months of 2014. Lower purchased copper revenues primarily reflect lower market prices for copper and lower sales volumes.
Oil and Gas Operations
Sales Volumes. Oil sales volumes of 8.6 million barrels (MMBbls) in second-quarter 2015 and 17.0 MMBbls for the first six months of 2015, were lower than sales volumes of 11.7 MMBbls in second-quarter 2014 and 23.5 MMBbls for the first six months of 2014, primarily reflecting the sale of the Eagle Ford properties in June 2014.
Realized Oil Prices and Derivative Contracts. Lower average realized prices for oil, excluding cash gains on derivative contracts, of $55.82 per barrel in second-quarter 2015 and $50.25 for the first six months of 2015, compared with $100.46 per barrel in second-quarter 2014 and $99.54 for the first six months of 2014, primarily reflected lower oil prices. Refer to “Operations” for further discussion of average realized prices and sales volumes at our oil and gas operations.
In connection with the acquisition of our oil and gas business, we have derivative contracts for 2015 consisting of crude oil options, and for 2014, had derivative contracts that consisted of crude oil options and natural gas swaps. These crude oil and natural gas derivative contracts are not designated as hedging instruments; accordingly, they are recorded at fair value with the mark-to-market gains and losses recorded in revenues each period. Cash gains (losses) on crude oil and natural gas derivative contracts totaled $101 million for second-quarter 2015 and $201 million for the first six months of 2015, compared with $(63) million for second-quarter 2014 and $(128) million for the first six months of 2014. Net noncash mark-to-market (losses) gains on crude oil and natural gas derivative contracts totaled $(95) million for second-quarter 2015 and $(143) million for the first six months of 2015, compared with $(7) million for second-quarter 2014 and $8 million for the first six months of 2014.
Following presents the estimated (decrease) increase in the net asset on our balance sheet of a 10 percent change in Brent crude oil prices on the fair values of outstanding crude oil derivative contracts, compared with forward prices used to determine the June 30, 2015, fair values (in millions):
10% Increase | 10% Decrease | |||||||
Crude oil options | $ | (37 | ) | $ | 18 | |||
Refer to Note 7 for further discussion of oil and natural gas derivative contracts.
Production and Delivery Costs
Consolidated production and delivery costs totaled $2.8 billion in second-quarter 2015 and $5.8 billion for the first six months of 2015, compared with $3.1 billion in second-quarter 2014 and $5.8 billion for the first six months of 2014. Production and delivery costs for the 2015 periods, compared with the 2014 periods, primarily reflect lower costs at our South America mining operations as a result of the sale of the Candelaria and Ojos del Salado mines in fourth-quarter 2014, partly offset by higher costs at our North America mines related to higher production volumes.
Consolidated production and delivery costs included LCM adjustments primarily attributable to molybdenum inventories totaling $59 million for second-quarter 2015 and $63 million for the first six months of 2015. Refer to "Overview" for further discussion of potential additional LCM inventory adjustments and impairments for third-quarter 2015.
40
Mining Unit Site Production and Delivery Costs
Site production and delivery costs for our copper mining operations primarily include labor, energy and commodity-based inputs, such as sulphuric acid, reagents, liners, tires and explosives. Consolidated unit site production and delivery costs (before net noncash and other costs) for our copper mines totaled $1.85 per pound of copper in second-quarter 2015 and $1.89 for the first six months of 2015, compared with $1.99 per pound in second-quarter 2014 and $1.94 for the first six months of 2014. Lower consolidated average site production and delivery costs for the 2015 periods, compared with the 2014 periods, primarily reflected higher copper sales volumes in North America and Indonesia, partly offset by lower sales volumes in South America. Refer to “Operations – Unit Net Cash Costs” for further discussion of unit net cash costs associated with our operating divisions and to “Product Revenues and Production Costs” for reconciliations of per pound costs by operating division to production and delivery costs applicable to sales reported in our consolidated financial statements.
Assuming achievement of current volume and cost estimates, consolidated unit site production and delivery costs are expected to be lower in the second half of 2015 and average $1.81 per pound of copper for the year 2015, which is subject to change as a result of the comprehensive review of operating plans as further discussed in “Overview.”
Oil and Gas Cash Production Costs per BOE
Production costs for our oil and gas operations primarily include costs incurred to operate and maintain wells and related equipment and facilities, such as lease operating expenses, steam gas costs, electricity, production and ad valorem taxes, and gathering and transportation expenses. Cash production costs for our oil and gas operations of $19.04 per BOE in second-quarter 2015 were lower than cash production costs of $19.57 per BOE in second-quarter 2014, primarily reflecting lower cash production costs in California related to reductions in repair and maintenance costs and well workover expense, partly offset by higher average costs per BOE resulting from the sale of lower-cost Eagle Ford properties. Cash production costs of $19.62 per BOE for the first six months of 2015, were higher than $19.03 for the first six months of 2014, primarily reflecting the sale of lower-cost Eagle Ford properties, partly offset by lower cash production costs in California. Refer to “Operations” for further discussion of cash production costs at our oil and gas operations.
Assuming achievement of current volume and cost estimates for the remainder of 2015, cash production costs are expected to approximate $20 per BOE for the year 2015.
Depreciation, Depletion and Amortization
Depreciation will vary under the unit-of-production (UOP) method as a result of changes in sales volumes and the related UOP rates at our mining and oil and gas operations. Consolidated depreciation, depletion and amortization (DD&A) totaled $890 million in second-quarter 2015 and $1.8 billion for first six months of 2015, compared with $1.0 billion in second-quarter 2014 and $2.0 billion for the first six months of 2014. DD&A in the 2015 periods, compared with the 2014 periods, reflected lower expense from our oil and gas operations associated with decreased production as a result of the sale of the Eagle Ford properties. Lower DD&A from our oil and gas operations for the first six months of 2015, compared with the first six months of 2014, was partly offset by higher DD&A from our mining operations mostly associated with higher sales volumes in North America and Indonesia.
Impairment of Oil and Gas Properties
Under full cost accounting rules, a "ceiling test" is conducted each quarter to review the carrying value of our oil and gas properties for impairment. At June 30, 2015, and March 31, 2015, net capitalized costs with respect to FCX's proved U.S. oil and gas properties exceeded the related ceiling test limitation, which resulted in the recognition of impairment charges of $2.7 billion in second-quarter 2015 and $5.8 billion for the first six months of 2015, reflecting the lower twelve-month average of the first-day-of-the-month historical reference oil price and higher capitalized costs at such dates. Refer to Note 1 and "Operations - Oil and Gas" for further discussion, including discussion of potentially significant additional ceiling test impairments.
41
Selling, General and Administrative Expenses
Consolidated selling, general and administrative expenses totaled $151 million in second-quarter 2015 and $305 million for the first six months of 2015, compared with $164 million in second-quarter 2014 and $299 million for the first six months of 2014. Consolidated selling, general and administrative expenses were net of capitalized general and administrative expense at our oil and gas operations, which totaled $38 million in second-quarter 2015 and $71 million for the first six months of 2015, compared with $40 million in second-quarter 2014 and $74 million for the first six months of 2014.
Mining Exploration and Research Expenses
Consolidated exploration and research expenses for our mining operations totaled $36 million in second-quarter 2015 and $69 million for the first six months of 2015, compared with $34 million in second-quarter 2014 and $64 million for the first six months of 2014. Our exploration activities are generally near our existing mines with a focus on opportunities to expand reserves and resources to support development of additional future production capacity in the large mineral districts where we currently operate. Exploration results continue to indicate opportunities for what we believe could be significant future potential reserve additions in North and South America, and in the Tenke minerals district. The drilling data in North America also indicates the potential for significantly expanded sulfide production. Drilling results and exploration modeling in North America have identified large-scale potential sulfide resources in the Morenci and Safford/Lone Star districts, providing a long-term pipeline for future growth in reserves and production capacity in an established minerals district.
For the year 2015, mining exploration expenditures are expected to total approximately $110 million, which is subject to change as a result of the comprehensive review of operating plans as further discussed in “Overview.”
As further discussed in Note 1 of our annual report on Form 10-K for the year ended December 31, 2014, under the full cost method of accounting, exploration costs for our oil and gas operations are capitalized to oil and gas properties.
Environmental Obligations and Shutdown Costs
Environmental obligation costs reflect net revisions to our long-term environmental obligations, which vary from period to period because of changes to environmental laws and regulations, the settlement of environmental matters and/or circumstances affecting our operations that could result in significant changes in our estimates. Shutdown costs include care and maintenance costs and any litigation, remediation or related expenditures associated with closed facilities or operations. Net charges for environmental obligations and shutdown costs totaled $11 million in second-quarter 2015 and $24 million for the first six months of 2015, compared with $76 million in second-quarter 2014 and $82 million for the first six months of 2014. Refer to "Contingencies" for further discussion of environmental obligations and litigation matters associated with closed facilities or operations.
Net Gain on Sale of Assets
Net gain on sale of assets totaled $39 million for the first six months of 2015, primarily related to the January 2015 $140 million sale of our one-third interest in the Luna Energy power facility in New Mexico.
Interest Expense, Net
Consolidated interest expense (excluding capitalized interest) totaled $215 million in second-quarter 2015 and $425 million for the first six months of 2015, compared with $225 million in second-quarter 2014 and $449 million for the first six months of 2014. Capitalized interest varies with the level of expenditures for our development projects and average interest rates on our borrowings, and totaled $66 million in second-quarter 2015 and $130 million for the first six months of 2015, compared with $61 million in second-quarter 2014 and $124 million for the first six months of 2014. Refer to "Operations" and “Capital Resources and Liquidity - Investing Activities” for further discussion of current development projects.
Insurance and Other Third-party Recoveries
As further discussed in Note 9, in second-quarter 2015, we recognized a gain of $92 million associated with net proceeds received from insurers under FCX’s directors and officers liability insurance policies and other third parties in accordance with the settlement terms of shareholder derivative litigation.
42
Income Taxes
Following is a summary of the approximate amounts used in the calculation of our consolidated income tax benefit (provision) for the 2015 and 2014 periods (in millions, except percentages):
Six Months Ended | Six Months Ended | |||||||||||||||||||
June 30, 2015 | June 30, 2014 | |||||||||||||||||||
Income(Loss)a | Effective Tax Rate | Income Tax (Provision) Benefit | Income (Loss)a | Effective Tax Rate | Income Tax (Provision) Benefit | |||||||||||||||
U.S. | $ | (469 | ) | b | 61% | $ | 288 | $ | 936 | 31% | $ | (291 | ) | c | ||||||
South America | 81 | 37% | (30 | ) | 747 | 36% | (267 | ) | ||||||||||||
Indonesia | 289 | 43% | (124 | ) | (39 | ) | 38% | 15 | ||||||||||||
Africa | 114 | 46% | (53 | ) | 187 | 30% | (57 | ) | ||||||||||||
Impairment of oil and gas properties | (5,790 | ) | 38% | 2,179 | — | N/A | — | |||||||||||||
Valuation allowance | — | N/A | (763 | ) | d | — | N/A | — | ||||||||||||
Eliminations and other | 187 | N/A | (28 | ) | 138 | N/A | (37 | ) | ||||||||||||
Annualized rate adjustmente | — | N/A | (87 | ) | — | N/A | (48 | ) | ||||||||||||
Consolidated FCX | $ | (5,588 | ) | 25% | f | $ | 1,382 | $ | 1,969 | 35% | $ | (685 | ) | |||||||
a. | Represents income (loss) by geographic location before income taxes and equity in affiliated companies’ net earnings. |
b. | Includes a gain of $92 million related to net proceeds received from insurance carriers and other third parties related to a shareholder derivative litigation settlement for which there is no related tax provision. |
c. | Includes a $58 million charge for deferred taxes recorded in connection with the allocation of goodwill to the sale of Eagle Ford. |
d. | As a result of the impairment to oil and gas properties, we recorded a tax charge to establish a valuation allowance primarily against U.S. federal alternative minimum tax credits. |
e. | In accordance with applicable accounting rules, we adjust our interim provision for income taxes equal to our estimated annualized tax rate. |
f. | Our consolidated effective income tax rate is a function of the combined effective tax rates for the jurisdictions in which we operate. Accordingly, variations in the relative proportions of jurisdictional income result in fluctuations to our consolidated effective income tax rate. Assuming achievement of current sales volume and cost estimates and average prices of $2.50 per pound for copper, $1,150 per ounce for gold, $6 per pound for molybdenum and $56 per barrel of Brent crude oil for the second half of 2015, we estimated a tax benefit of $1.4 billion for 2015, substantially all of which relates to the impairment of oil and gas properties and resulting tax charge to establish a valuation allowance in the first half of 2015. See "Operations - Oil and Gas" for discussion regarding the likelihood of potentially significant ceiling charges during the remainder of 2015, which would give rise to additional tax benefits. |
OPERATIONS
North America Copper Mines
We operate seven open-pit copper mines in North America – Morenci, Bagdad, Safford, Sierrita and Miami in Arizona, and Chino and Tyrone in New Mexico. All of the North America mining operations are wholly owned, except for Morenci. We record our 85 percent joint venture interest in Morenci using the proportionate consolidation method.
The North America copper mines include open-pit mining, sulfide ore concentrating, leaching and solution extraction/electrowinning (SX/EW) operations. A majority of the copper produced at our North America copper mines is cast into copper rod by our Rod & Refining segment. The remainder of our North America copper sales is in the form of copper cathode or copper concentrate, a portion of which is shipped to Atlantic Copper (our wholly owned smelter). Molybdenum concentrates and silver are also produced by certain of our North America copper mines.
As further discussed in “Overview,” we are currently reviewing operating plans at each of our copper and molybdenum mining operations and will revise operating and capital plans to strengthen our financial position in a weak copper price environment. The revised plans will target lower operating and capital costs to achieve maximum cash flow under the current market conditions. Production at certain operations challenged by low commodity prices will be curtailed. We expect to complete this review promptly and will report our revised plans during third-quarter
43
2015. Accordingly, our sales volume and unit costs estimates discussed below are subject to change as a result of this review and other factors.
Operating and Development Activities. We have increased production from our North America copper mines by approximately 50 percent over the past five years and continue to evaluate a number of opportunities to add production capacity following positive exploration results. Future investments will be undertaken based on the results of economic and technical feasibility studies and market conditions.
Morenci Mill Expansion. The Morenci mill expansion project commenced operations in May 2014 and successfully achieved full rates in second-quarter 2015. The project expanded mill capacity from 50,000 metric tons of ore per day to approximately 115,000 metric tons of ore per day, which results in incremental annual production of approximately 225 million pounds of copper. Morenci's copper production is expected to average over 900 million pounds per year over the next five years. Additionally, the molybdenum circuit began production in first-quarter 2015. Remaining items associated with the project include construction of the expanded tailings storage facility, which is expected to be completed in the second half of 2015.
Operating Data. Following is summary operating data for the North America copper mines for the second quarters and first six months of 2015 and 2014:
Three Months Ended | Six Months Ended | ||||||||||||||
June 30, | June 30, | ||||||||||||||
2015 | 2014 | 2015 | 2014 | ||||||||||||
Operating Data, Net of Joint Venture Interest | |||||||||||||||
Copper (recoverable) | |||||||||||||||
Production (millions of pounds) | 469 | 395 | 921 | 780 | |||||||||||
Sales (millions of pounds) | 486 | 423 | 958 | 794 | |||||||||||
Average realized price per pound | $ | 2.77 | $ | 3.16 | $ | 2.73 | $ | 3.21 | |||||||
Molybdenum (recoverable) | |||||||||||||||
Production (millions of pounds)a | 10 | 9 | 19 | 17 | |||||||||||
100% Operating Data | |||||||||||||||
SX/EW operations | |||||||||||||||
Leach ore placed in stockpiles (metric tons per day) | 890,000 | 1,044,500 | 902,500 | 1,014,000 | |||||||||||
Average copper ore grade (percent) | 0.26 | 0.25 | 0.25 | 0.25 | |||||||||||
Copper production (millions of recoverable pounds) | 261 | 234 | 508 | 463 | |||||||||||
Mill operations | |||||||||||||||
Ore milled (metric tons per day) | 316,000 | 260,100 | 308,800 | 257,700 | |||||||||||
Average ore grade (percent): | |||||||||||||||
Copper | 0.47 | 0.44 | 0.48 | 0.43 | |||||||||||
Molybdenum | 0.03 | 0.03 | 0.03 | 0.03 | |||||||||||
Copper recovery rate (percent) | 85.8 | 82.8 | 85.6 | 84.4 | |||||||||||
Copper production (millions of recoverable pounds) | 247 | 188 | 488 | 370 | |||||||||||
a. | Refer to "Consolidated Results" for our consolidated molybdenum sales volumes, which includes sales of molybdenum produced at the North America copper mines. |
Copper sales volumes from our North America copper mines increased to 486 million pounds in second-quarter 2015 and 958 million pounds for the first six months of 2015, compared with 423 million pounds in second-quarter 2014 and 794 million pounds for the first six months of 2014, primarily reflecting higher milling rates at Morenci and Chino.
Copper sales from North America are expected to approximate 1.96 billion pounds for the year 2015, compared with 1.66 billion pounds in 2014.
Unit Net Cash Costs. Unit net cash costs per pound of copper is a measure intended to provide investors with information about the cash-generating capacity of our mining operations expressed on a basis relating to the primary metal product for our respective operations. We use this measure for the same purpose and for monitoring
44
operating performance by our mining operations. This information differs from measures of performance determined in accordance with U.S. GAAP and should not be considered in isolation or as a substitute for measures of performance determined in accordance with U.S. GAAP. This measure is presented by other metals mining companies, although our measure may not be comparable to similarly titled measures reported by other companies.
Gross Profit per Pound of Copper and Molybdenum
The following table summarizes unit net cash costs and gross profit per pound at our North America copper mines for the second quarters and first six months of 2015 and 2014. Refer to “Product Revenues and Production Costs” for an explanation of the “by-product” and “co-product” methods and a reconciliation of unit net cash costs per pound to production and delivery costs applicable to sales reported in our consolidated financial statements.
Three Months Ended | Three Months Ended | |||||||||||||||||||||||
June 30, 2015 | June 30, 2014 | |||||||||||||||||||||||
By- Product Method | Co-Product Method | By- Product Method | Co-Product Method | |||||||||||||||||||||
Copper | Molyb- denuma | Copper | Molyb- denuma | |||||||||||||||||||||
Revenues, excluding adjustments | $ | 2.77 | $ | 2.77 | $ | 7.80 | $ | 3.16 | $ | 3.16 | $ | 12.49 | ||||||||||||
Site production and delivery, before net noncash and other costs shown below | 1.78 | 1.66 | 6.24 | 1.87 | 1.74 | 6.73 | ||||||||||||||||||
By-product credits | (0.16 | ) | — | — | (0.28 | ) | — | — | ||||||||||||||||
Treatment charges | 0.12 | 0.12 | — | 0.11 | 0.11 | — | ||||||||||||||||||
Unit net cash costs | 1.74 | 1.78 | 6.24 | 1.70 | 1.85 | 6.73 | ||||||||||||||||||
Depreciation, depletion and amortization | 0.28 | 0.27 | 0.53 | 0.30 | 0.28 | 0.64 | ||||||||||||||||||
Noncash and other costs, net | 0.10 | b | 0.09 | 0.06 | 0.07 | 0.06 | 0.05 | |||||||||||||||||
Total unit costs | 2.12 | 2.14 | 6.83 | 2.07 | 2.19 | 7.42 | ||||||||||||||||||
Revenue adjustments, primarily for pricing on prior period open sales | (0.03 | ) | (0.03 | ) | — | 0.02 | 0.02 | — | ||||||||||||||||
Gross profit per pound | $ | 0.62 | $ | 0.60 | $ | 0.97 | $ | 1.11 | $ | 0.99 | $ | 5.07 | ||||||||||||
Copper sales (millions of recoverable pounds) | 485 | 485 | 421 | 421 | ||||||||||||||||||||
Molybdenum sales (millions of recoverable pounds)a | 10 | 9 | ||||||||||||||||||||||
Six Months Ended | Six Months Ended | |||||||||||||||||||||||
June 30, 2015 | June 30, 2014 | |||||||||||||||||||||||
By- Product Method | Co-Product Method | By- Product Method | Co-Product Method | |||||||||||||||||||||
Copper | Molyb- denuma | Copper | Molyb- denuma | |||||||||||||||||||||
Revenues, excluding adjustments | $ | 2.73 | $ | 2.73 | $ | 8.28 | $ | 3.21 | $ | 3.21 | $ | 11.39 | ||||||||||||
Site production and delivery, before net noncash and other costs shown below | 1.79 | 1.68 | 6.24 | 1.87 | 1.76 | 6.45 | ||||||||||||||||||
By-product credits | (0.17 | ) | — | — | (0.25 | ) | — | — | ||||||||||||||||
Treatment charges | 0.13 | 0.12 | — | 0.12 | 0.12 | — | ||||||||||||||||||
Unit net cash costs | 1.75 | 1.80 | 6.24 | 1.74 | 1.88 | 6.45 | ||||||||||||||||||
Depreciation, depletion and amortization | 0.28 | 0.27 | 0.58 | 0.29 | 0.27 | 0.58 | ||||||||||||||||||
Noncash and other costs, net | 0.08 | b | 0.08 | 0.06 | 0.08 | 0.07 | 0.04 | |||||||||||||||||
Total unit costs | 2.11 | 2.15 | 6.88 | 2.11 | 2.22 | 7.07 | ||||||||||||||||||
Revenue adjustments, primarily for pricing on prior period open sales | (0.03 | ) | (0.03 | ) | — | (0.01 | ) | (0.01 | ) | — | ||||||||||||||
Gross profit per pound | $ | 0.59 | $ | 0.55 | $ | 1.40 | $ | 1.09 | $ | 0.98 | $ | 4.32 | ||||||||||||
Copper sales (millions of recoverable pounds) | 956 | 956 | 790 | 790 | ||||||||||||||||||||
Molybdenum sales (millions of recoverable pounds)a | 19 | 17 | ||||||||||||||||||||||
a. | Reflects sales of molybdenum produced by certain of the North America copper mines to our molybdenum sales company at market-based pricing. |
b. | Includes charges for LCM inventory adjustments totaling $0.02 per pound for second-quarter 2015 and $0.01 per pound for the first six months of 2015. |
45
Our North America copper mines have varying cost structures because of differences in ore grades and characteristics, processing costs, by-product credits and other factors. Average unit net cash costs (net of by-product credits) of $1.74 per pound of copper in second-quarter 2015 and $1.75 per pound for the first six months of 2015, were higher than unit net cash costs of $1.70 per pound in second-quarter 2014 and $1.74 per pound for the first six months of 2014, primarily reflecting lower by-product credits, partly offset by higher copper sales volumes.
Because certain assets are depreciated on a straight-line basis, North America's average unit depreciation rate may vary with asset additions and the level of copper production and sales.
Assuming achievement of current sales volume and cost estimates, and an average price of $6 per pound of molybdenum for the second half of 2015, average unit net cash costs (net of by-product credits) for our North America copper mines are expected to approximate $1.72 per pound of copper for the year 2015, compared with $1.73 per pound in 2014. North America's unit net cash costs would change by approximately $0.02 per pound for each $2 per pound change in the average price of molybdenum for the second half of 2015.
South America Mining
We operate two copper mines in South America – Cerro Verde in Peru (in which we own a 53.56 percent interest) and El Abra in Chile (in which we own a 51 percent interest). These operations in South America are consolidated in our financial statements.
On November 3, 2014, FCX completed the sale of its ownership interests in the Candelaria and Ojos del Salado mines in Chile.
South America mining includes open-pit mining, sulfide ore concentrating, leaching and SX/EW operations. Production from our South America mines is sold as copper concentrate or copper cathode under long-term contracts. Our South America mines also ship a portion of their copper concentrate inventories to Atlantic Copper. In addition to copper, the Cerro Verde mine produces molybdenum concentrates and silver.
As further discussed in “Overview,” we are currently reviewing operating plans at each of our copper and molybdenum mining operations and will revise operating and capital plans to strengthen our financial position in a weak copper price environment. The revised plans will target lower operating and capital costs to achieve maximum cash flow under the current market conditions. Production at certain operations challenged by low commodity prices will be curtailed. We expect to complete this review promptly and will report our revised plans during third-quarter 2015. Accordingly, our sales volume and unit costs estimates discussed below are subject to change as a result of this review and other factors.
Development Activities.
Cerro Verde Expansion. Construction activities associated with a large-scale expansion at Cerro Verde are advancing on schedule toward completion in late 2015. Detailed engineering and major procurement activities are complete and construction is more than 87 percent complete. The project will expand the concentrator facilities from 120,000 metric tons of ore per day to 360,000 metric tons of ore per day and provide incremental annual production of approximately 600 million pounds of copper and 15 million pounds of molybdenum beginning in 2016. As of June 30, 2015, $3.9 billion had been incurred for this project ($0.8 billion during the first six months of 2015), with approximately $0.7 billion remaining to be incurred.
El Abra Sulfide. We continue to evaluate a potential large-scale milling operation at El Abra to process additional sulfide material and to achieve higher recoveries. Exploration results in recent years at El Abra indicate a significant sulfide resource, which could potentially support a major mill project. Future investments will depend on technical studies, economic factors and global copper market conditions.
46
Operating Data. Following is summary operating data for our South America mining operations for the second quarters and first six months of 2015 and 2014:
Three Months Ended | Six Months Ended | ||||||||||||||
June 30, | June 30, | ||||||||||||||
2015 | 2014a | 2015 | 2014a | ||||||||||||
Copper (recoverable) | |||||||||||||||
Production (millions of pounds) | 188 | 300 | 381 | 614 | |||||||||||
Sales (millions of pounds) | 178 | 310 | 378 | 617 | |||||||||||
Average realized price per pound | $ | 2.69 | $ | 3.17 | $ | 2.68 | $ | 3.16 | |||||||
Gold (recoverable) | |||||||||||||||
Production (thousands of ounces) | — | 21 | — | 42 | |||||||||||
Sales (thousands of ounces) | — | 20 | — | 43 | |||||||||||
Average realized price per ounce | $ | — | $ | 1,302 | $ | — | $ | 1,302 | |||||||
Molybdenum (millions of recoverable pounds) | |||||||||||||||
Productionb | 2 | 2 | 4 | 5 | |||||||||||
SX/EW operations | |||||||||||||||
Leach ore placed in stockpiles (metric tons per day) | 237,000 | 281,700 | 235,300 | 284,200 | |||||||||||
Average copper ore grade (percent) | 0.41 | 0.52 | 0.41 | 0.51 | |||||||||||
Copper production (millions of recoverable pounds) | 109 | 125 | 223 | 248 | |||||||||||
Mill operations | |||||||||||||||
Ore milled (metric tons per day) | 116,500 | 182,200 | 117,900 | 185,500 | |||||||||||
Average ore grade: | |||||||||||||||
Copper (percent) | 0.46 | 0.56 | 0.45 | 0.58 | |||||||||||
Molybdenum (percent) | 0.01 | 0.02 | 0.02 | 0.02 | |||||||||||
Gold (grams per metric ton) | — | 0.11 | — | 0.11 | |||||||||||
Copper recovery rate (percent) | 78.2 | 88.7 | 78.9 | 89.4 | |||||||||||
Copper production (millions of recoverable pounds) | 79 | 175 | 158 | 366 | |||||||||||
a. | The 2014 periods include the results of the Candelaria and Ojos del Salado mines, which were sold in November 2014 and had sales volumes totaling 80 million pounds of copper and 20 thousand ounces of gold in second-quarter 2015 and 174 million pounds of copper and 43 thousand ounces of gold for the first six months of 2014. |
b. | Refer to "Consolidated Results" for our consolidated molybdenum sales volumes, which include sales of molybdenum produced at Cerro Verde. |
Consolidated copper sales volumes from South America of 178 million pounds in second-quarter 2015 and 378 million pounds for the first six months of 2015 were lower than sales of 310 million pounds in second-quarter 2014 and 617 million pounds for the first six months of 2014, reflecting the sale of the Candelaria and Ojos del Salado mines and lower production from Cerro Verde and El Abra primarily associated with lower ore grades and recovery rates.
For the year 2015, consolidated sales volumes from South America mines are expected to approximate 900 million pounds of copper, compared with 1.14 billion pounds in 2014, which included copper sales volumes of 268 million pounds from the Candelaria and Ojos del Salado mines.
Unit Net Cash Costs. Unit net cash costs per pound of copper is a measure intended to provide investors with information about the cash-generating capacity of our mining operations expressed on a basis relating to the primary metal product for our respective operations. We use this measure for the same purpose and for monitoring operating performance by our mining operations. This information differs from measures of performance determined in accordance with U.S. GAAP and should not be considered in isolation or as a substitute for measures of performance determined in accordance with U.S. GAAP. This measure is presented by other metals mining companies, although our measure may not be comparable to similarly titled measures reported by other companies.
47
Gross Profit per Pound of Copper
The following table summarizes unit net cash costs and gross profit per pound of copper at the South America mining operations for the second quarters and first six months of 2015 and 2014. Unit net cash costs per pound of copper are reflected under the by-product and co-product methods as the South America mining operations also had small amounts of molybdenum, gold and silver sales. Refer to “Product Revenues and Production Costs” for an explanation of the “by-product” and “co-product” methods and a reconciliation of unit net cash costs per pound to production and delivery costs applicable to sales reported in our consolidated financial statements.
Three Months Ended | Three Months Ended | |||||||||||||||
June 30, 2015 | June 30, 2014 | |||||||||||||||
By-Product Method | Co-Product Method | By-Product Method | Co-Product Method | |||||||||||||
Revenues, excluding adjustments | $ | 2.69 | $ | 2.69 | $ | 3.17 | $ | 3.17 | ||||||||
Site production and delivery, before net noncash and other costs shown below | 1.77 | 1.72 | 1.64 | 1.52 | ||||||||||||
By-product credits | (0.04 | ) | — | (0.23 | ) | — | ||||||||||
Treatment charges | 0.17 | 0.17 | 0.18 | 0.18 | ||||||||||||
Royalty on metals | — | — | 0.01 | 0.01 | ||||||||||||
Unit net cash costs | 1.90 | 1.89 | 1.60 | a | 1.71 | |||||||||||
Depreciation, depletion and amortization | 0.40 | 0.39 | 0.30 | 0.29 | ||||||||||||
Noncash and other (credits) costs, net | (0.02 | ) | (0.03 | ) | 0.08 | 0.06 | ||||||||||
Total unit costs | 2.28 | 2.25 | 1.98 | 2.06 | ||||||||||||
Revenue adjustments, primarily for pricing on prior period open sales | (0.05 | ) | (0.05 | ) | 0.10 | 0.10 | ||||||||||
Gross profit per pound | $ | 0.36 | $ | 0.39 | $ | 1.29 | $ | 1.21 | ||||||||
Copper sales (millions of recoverable pounds) | 178 | 178 | 310 | 310 | ||||||||||||
Six Months Ended | Six Months Ended | ||||||||||||||
June 30, 2015 | June 30, 2014 | ||||||||||||||
By-Product Method | Co-Product Method | By-Product Method | Co-Product Method | ||||||||||||
Revenues, excluding adjustments | $ | 2.68 | $ | 2.68 | $ | 3.16 | $ | 3.16 | |||||||
Site production and delivery, before net noncash and other costs shown below | 1.76 | 1.70 | 1.57 | 1.46 | |||||||||||
By-product credits | (0.06 | ) | — | (0.24 | ) | — | |||||||||
Treatment charges | 0.17 | 0.17 | 0.18 | 0.18 | |||||||||||
Royalty on metals | — | — | — | — | |||||||||||
Unit net cash costs | 1.87 | 1.87 | 1.51 | a | 1.64 | ||||||||||
Depreciation, depletion and amortization | 0.39 | 0.38 | 0.29 | 0.27 | |||||||||||
Noncash and other costs, net | — | — | 0.07 | 0.06 | |||||||||||
Total unit costs | 2.26 | 2.25 | 1.87 | 1.97 | |||||||||||
Revenue adjustments, primarily for pricing on prior period open sales | (0.08 | ) | (0.08 | ) | (0.11 | ) | (0.11 | ) | |||||||
Gross profit per pound | $ | 0.34 | $ | 0.35 | $ | 1.18 | $ | 1.08 | |||||||
Copper sales (millions of recoverable pounds) | 378 | 378 | 617 | 617 | |||||||||||
a. | Excluding the results of Candelaria and Ojos del Salado, South America mining's unit net cash costs for second-quarter 2014 averaged $1.55 per pound and $1.51 for the first six months of 2014. |
Our South America mines have varying cost structures because of differences in ore grades and characteristics, processing costs, by-product credits and other factors. Average unit net cash costs (net of by-product credits) of $1.90 per pound of copper in second-quarter 2015 and $1.87 per pound for the first six months of 2015 were higher than unit net cash costs of $1.60 per pound in second-quarter 2014 and $1.51 per pound for the first six months of 2014, primarily reflecting lower sales volumes and lower by-product credits. Lower by-product credits were mostly because of the sale of Candelaria and Ojos del Salado in fourth-quarter 2014.
Because certain assets are depreciated on a straight-line basis, South America's unit depreciation rate may vary with asset additions and the level of copper production and sales.
48
Revenue adjustments primarily result from changes in prices on provisionally priced copper sales recognized in prior periods. Refer to “Consolidated Results - Revenues” for further discussion of adjustments to prior period provisionally priced copper sales.
Assuming achievement of current sales volume and cost estimates, and average prices of $6 per pound of molybdenum for the second half of 2015, we estimate that average unit net cash costs (net of by-product credits) for our South America mining operations would approximate $1.75 per pound of copper for the year 2015, compared with $1.58 per pound in 2014.
Indonesia Mining
Indonesia mining includes PT-FI’s Grasberg minerals district, one of the world's largest copper and gold deposits, in Papua, Indonesia. We own 90.64 percent of PT-FI, including 9.36 percent owned through our wholly owned subsidiary, PT Indocopper Investama.
PT-FI proportionately consolidates an unincorporated joint venture with Rio Tinto plc (Rio Tinto), under which Rio Tinto has a 40 percent interest in certain assets and a 40 percent interest through 2021 in production exceeding specified annual amounts of copper, gold and silver. After 2021, all production and related revenues and costs are shared 60 percent PT-FI and 40 percent Rio Tinto. Refer to Note 3 in our annual report on Form 10-K for the year ended December 31, 2014, for discussion of our joint venture with Rio Tinto.
PT-FI produces copper concentrates that contain significant quantities of gold and silver. Substantially all of PT-FI’s copper concentrates are sold under long-term contracts, and during the first six months of 2015, approximately one-half of PT-FI's copper concentrates was sold to PT Smelting, our 25 percent owned smelter and refinery in Gresik. In July 2015, PT Smelting's operations were temporarily suspended pending completion of required repairs, which are expected to be completed in September 2015.
PT-FI has commenced discussions with union officials regarding its bi-annual labor agreement, which is scheduled for renewal in September 2015.
As further discussed in “Overview,” we are currently reviewing operating plans at each of our copper and molybdenum mining operations and will revise operating and capital plans to strengthen our financial position in a weak copper price environment. The revised plans will target lower operating and capital costs to achieve maximum cash flow under the current market conditions. Production at certain operations challenged by low commodity prices will be curtailed. We expect to complete this review promptly and will report our revised plans during third-quarter 2015. Accordingly, our sales volume and unit costs estimates discussed below are subject to change as a result of this review and other factors.
Regulatory Matters. In January 2014, the Indonesian government published regulations that among other things imposed a progressive export duty on copper concentrates. Despite PT-FI’s rights under its Contract of Work (COW) to export concentrates without the payment of duties, PT-FI was unable to obtain administrative approval for exports and operated at approximately half of its capacity from mid-January 2014 through July 2014.
In July 2014, PT-FI entered into a Memorandum of Understanding (MOU) with the Indonesian government. Under the MOU, PT-FI provided a $115 million assurance bond to support its commitment for smelter development, agreed to increased royalty rates and agreed to pay export duties (which were set at 7.5 percent, declining to 5.0 percent when smelter development progress exceeds 7.5 percent and are eliminated when development progress exceeds 30 percent). The MOU also anticipated an amendment of the COW within six months to address other matters; however, no terms of the COW other than those relating to the smelter bond, increased royalties and export duties were changed. In January 2015, the MOU was extended to July 25, 2015, and it expired on that date. The increased royalty rates, export duties and smelter assurance bond remain in effect.
PT-FI is also required to apply for renewal of export permits at six-month intervals. On July 29, 2015, PT-FI's export permit was renewed through January 28, 2016. In connection with the renewal, export duties were reduced to 5.0 percent, as a result of smelter development progress.
In April 2015, the Indonesian government instituted a requirement that all export sales of concentrates must be arranged through letters of credit with payments received through a foreign exchange bank located in Indonesia. Under the COW, PT-FI is not required to obtain letters of credit in connection with its sales, and PT-FI requested an
49
exemption from the new requirement. The Minister of Trade granted an initial exemption through July 25, 2015. If this exemption is not renewed, shipments could be delayed for a short period of time and additional costs could be incurred.
PT-FI continues to engage in active discussions with the Indonesian government regarding its COW and long-term operating rights. Negotiations are taking into consideration PT-FI's requirement for assurance of legal and fiscal terms post-2021 for PT-FI to continue with its large-scale investment program in Papua, Indonesia.
PT-FI is advancing plans for the construction of new smelter capacity in parallel with completing negotiations on its COW and long-term operating rights. PT-FI has identified potential sites for the construction of additional smelter capacity and is in discussions with potential partners for the project.
We expect, but cannot provide any assurance, that PT-FI will be successful in reaching a satisfactory agreement on the terms of its long-term mining rights. If PT-FI is unable to reach agreement with the Indonesian government on its long-term rights, we may be required to reduce or defer investments in underground development projects, which could have a material adverse effect on PT-FI’s future production and reserves. In addition, PT-FI would intend to pursue any and all claims against the Indonesian government for breach of contract through international arbitration.
Refer to Note 13 in our annual report on Form 10-K for the year ended December 31, 2014, for further discussion of our Indonesia mining contract. For additional discussion of risks associated with our operations in Indonesia, including labor matters and the COW, refer to "Risk Factors" contained in Part I, Item 1A. of our annual report on Form 10-K for the year ended December 31, 2014.
Operating and Development Activities. We have several projects in progress in the Grasberg minerals district related to the development of large-scale, long-lived, high-grade underground ore bodies. In aggregate, these underground ore bodies are expected to ramp up over several years to process approximately 240,000 metric tons of ore per day following the transition from the Grasberg open pit, currently anticipated to occur in late 2017. Development of the Grasberg Block Cave and Deep Mill Level Zone (DMLZ) underground mines is advancing to enable DMLZ to commence production in late 2015 and the Grasberg Block Cave mine to commence production in 2018. Over the next five years, estimated aggregate capital spending on these projects is expected to average $0.8 billion per year ($0.7 billion per year net to PT-FI). Additionally, over the next five years, estimated aggregate capital spending for processing and power facilities to optimize the handling of underground ore is expected to average $0.3 billion per year. Considering the long-term nature and size of these projects, actual costs could vary from these estimates. PT-FI may reduce or defer these activities pending resolution of negotiations regarding the COW.
The following provides additional information on the continued development of the Common Infrastructure project, the Grasberg Block Cave underground mine and the DMLZ ore body that lies below the Deep Ore Zone (DOZ) underground mine.
Common Infrastructure and Grasberg Block Cave Mine. In 2004, PT-FI commenced its Common Infrastructure project to provide access to its large undeveloped underground ore bodies located in the Grasberg minerals district through a tunnel system located approximately 400 meters deeper than its existing underground tunnel system. In addition to providing access to our underground ore bodies, the tunnel system will enable PT-FI to conduct future exploration in prospective areas associated with currently identified ore bodies. The tunnel system was completed to the Big Gossan terminal, and the Big Gossan mine was brought into production in 2010. Production from the Big Gossan mine is currently suspended and expected to restart production in the second half of 2016. Development of the DMLZ and Grasberg Block Cave underground mines is advancing using the Common Infrastructure project tunnels as access.
The Grasberg Block Cave underground mine accounts for more than 40 percent of our recoverable proven and probable reserves in Indonesia. Production at the Grasberg Block Cave mine is expected to commence in early 2018, at the end of mining the Grasberg open pit. Targeted production rates once the Grasberg Block Cave mining operation reaches full capacity are expected to approximate 160,000 metric tons of ore per day.
Aggregate mine development capital for the Grasberg Block Cave mine and associated Common Infrastructure is expected to approximate $5.7 billion (incurred between 2008 and 2021), with PT-FI’s share totaling approximately $5.1 billion. Aggregate project costs totaling $2.0 billion have been incurred through June 30, 2015 ($0.2 billion during the first six months of 2015).
50
DMLZ. The DMLZ ore body lies below the DOZ mine at the 2,590-meter elevation and represents the downward continuation of mineralization in the Ertsberg East Skarn system and neighboring Ertsberg porphyry. We plan to mine the ore body using a block-cave method with production beginning in late 2015. Targeted production rates once the DMLZ mining operation reaches full capacity are expected to approximate 80,000 metric tons of ore per day. Drilling efforts continue to determine the extent of this ore body. Aggregate mine development capital costs for the DMLZ mine are expected to approximate $2.7 billion (incurred between 2009 and 2020), with PT-FI’s share totaling approximately $1.6 billion. Aggregate project costs totaling $1.3 billion have been incurred through June 30, 2015 ($0.2 billion during the first six months of 2015).
Operating Data. Following is summary operating data for our Indonesia mining operations for the second quarters and first six months of 2015 and 2014:
Three Months Ended | Six Months Ended | ||||||||||||||
June 30, | June 30, | ||||||||||||||
2015 | 2014 | 2015 | 2014 | ||||||||||||
Operating Data, Net of Joint Venture Interest | |||||||||||||||
Copper (recoverable) | |||||||||||||||
Production (millions of pounds) | 205 | 122 | 359 | 262 | |||||||||||
Sales (millions of pounds) | 196 | 117 | 351 | 226 | |||||||||||
Average realized price per pound | $ | 2.61 | $ | 3.19 | $ | 2.66 | $ | 3.15 | |||||||
Gold (thousands of recoverable ounces) | |||||||||||||||
Production (thousands of ounces) | 360 | 142 | 615 | 350 | |||||||||||
Sales (thousands of ounces) | 346 | 135 | 606 | 297 | |||||||||||
Average realized price per ounce | $ | 1,173 | $ | 1,294 | $ | 1,183 | $ | 1,299 | |||||||
100% Operating Data | |||||||||||||||
Ore milled (metric tons per day):a | |||||||||||||||
Grasberg open pit | 134,200 | 50,700 | 121,200 | 58,200 | |||||||||||
DOZ underground mineb | 42,700 | 50,500 | 45,800 | 50,400 | |||||||||||
Big Gossan underground minec | — | 1,700 | — | 1,800 | |||||||||||
Total | 176,900 | 102,900 | 167,000 | 110,400 | |||||||||||
Average ore grades: | |||||||||||||||
Copper (percent) | 0.67 | 0.73 | 0.63 | 0.72 | |||||||||||
Gold (grams per metric ton) | 0.86 | 0.65 | 0.78 | 0.72 | |||||||||||
Recovery rates (percent): | |||||||||||||||
Copper | 90.6 | 89.0 | 90.6 | 88.7 | |||||||||||
Gold | 83.5 | 76.3 | 83.9 | 78.1 | |||||||||||
Production (recoverable): | |||||||||||||||
Copper (millions of pounds) | 205 | 125 | 359 | 269 | |||||||||||
Gold (thousands of ounces) | 360 | 142 | 615 | 351 | |||||||||||
a. | Amounts represent the approximate average daily throughput processed at PT-FI’s mill facilities from each producing mine. |
b. | Ore milled from the DOZ underground mine is expected to ramp up to 70,000 metric tons of ore per day in the second half of 2015. |
c. | Production from the Big Gossan underground mine is expected to restart in the second half of 2016 and ramp up to 7,000 metric tons of ore per day in 2018. |
Indonesia's sales volumes increased to 196 million pounds of copper and 346 thousand ounces of gold in second-quarter 2015 and 351 million pounds of copper and 606 thousand ounces of gold for the first six months of 2015, compared with 117 million pounds of copper and 135 thousand ounces of gold in second-quarter 2014 and 226 million pounds of copper and 297 thousand ounces of gold for the first six months of 2014, primarily reflecting higher operating rates and higher ore grades for gold.
At the Grasberg mine, the sequencing of mining areas with varying ore grades causes fluctuations in quarterly and annual production of copper and gold. PT-FI expects ore grades to increase beginning in fourth-quarter 2015 through 2017 as high-grade sections of the Grasberg open pit are mined. Consolidated sales volumes from our Indonesia mining operations are expected to approximate 860 million pounds of copper and 1.3 million ounces of
51
gold for the year 2015, compared with 664 million pounds of copper and 1.2 million ounces of gold for the year 2014.
Unit Net Cash Costs. Unit net cash costs per pound of copper is a measure intended to provide investors with information about the cash-generating capacity of our mining operations expressed on a basis relating to the primary metal product for our respective operations. We use this measure for the same purpose and for monitoring operating performance by our mining operations. This information differs from measures of performance determined in accordance with U.S. GAAP and should not be considered in isolation or as a substitute for measures of performance determined in accordance with U.S. GAAP. This measure is presented by other metals mining companies, although our measure may not be comparable to similarly titled measures reported by other companies.
Gross Profit (Loss) per Pound of Copper and per Ounce of Gold
The following table summarizes the unit net cash costs and gross profit (loss) per pound of copper and per ounce of gold at our Indonesia mining operations for the second quarters and first six months of 2015 and 2014. Refer to “Production Revenues and Production Costs” for an explanation of “by-product” and “co-product” methods and a reconciliation of unit net cash costs per pound to production and delivery costs applicable to sales reported in our consolidated financial statements.
Three Months Ended | Three Months Ended | ||||||||||||||||||||||
June 30, 2015 | June 30, 2014 | ||||||||||||||||||||||
By-Product Method | Co-Product Method | By-Product Method | Co-Product Method | ||||||||||||||||||||
Copper | Gold | Copper | Gold | ||||||||||||||||||||
Revenues, excluding adjustments | $ | 2.61 | $ | 2.61 | $ | 1,173 | $ | 3.19 | $ | 3.19 | $ | 1,294 | |||||||||||
Site production and delivery, before net noncash and other costs shown below | 2.26 | 1.25 | 560 | 3.86 | a | 2.59 | 1,050 | ||||||||||||||||
Gold and silver credits | (2.13 | ) | — | — | (1.57 | ) | — | — | |||||||||||||||
Treatment charges | 0.32 | 0.18 | 79 | 0.26 | 0.17 | 70 | |||||||||||||||||
Export duties | 0.18 | 0.10 | 45 | — | — | — | |||||||||||||||||
Royalty on metals | 0.18 | b | 0.10 | 45 | 0.11 | 0.08 | 31 | ||||||||||||||||
Unit net cash costs | 0.81 | 1.63 | 729 | 2.66 | 2.84 | 1,151 | |||||||||||||||||
Depreciation and amortization | 0.40 | 0.22 | 100 | 0.47 | 0.31 | 127 | |||||||||||||||||
Noncash and other costs, net | 0.04 | 0.02 | 10 | 0.55 | a | 0.37 | 151 | ||||||||||||||||
Total unit costs | 1.25 | 1.87 | 839 | 3.68 | 3.52 | 1,429 | |||||||||||||||||
Revenue adjustments, primarily for pricing on prior period open sales | (0.02 | ) | (0.02 | ) | 7 | 0.09 | 0.09 | 5 | |||||||||||||||
PT Smelting intercompany (loss) profit | (0.02 | ) | (0.01 | ) | (5 | ) | 0.03 | 0.02 | 9 | ||||||||||||||
Gross profit (loss) per pound/ounce | $ | 1.32 | $ | 0.71 | $ | 336 | $ | (0.37 | ) | $ | (0.22 | ) | $ | (121 | ) | ||||||||
Copper sales (millions of recoverable pounds) | 196 | 196 | 117 | 117 | |||||||||||||||||||
Gold sales (thousands of recoverable ounces) | 346 | 135 | |||||||||||||||||||||
52
Six Months Ended | Six Months Ended | ||||||||||||||||||||||
June 30, 2015 | June 30, 2014 | ||||||||||||||||||||||
By-Product Method | Co-Product Method | By-Product Method | Co-Product Method | ||||||||||||||||||||
Copper | Gold | Copper | Gold | ||||||||||||||||||||
Revenues, excluding adjustments | $ | 2.66 | $ | 2.66 | $ | 1,183 | $ | 3.15 | $ | 3.15 | $ | 1,299 | |||||||||||
Site production and delivery, before net noncash and other costs shown below | 2.51 | 1.41 | 626 | 3.60 | a | 2.31 | 950 | ||||||||||||||||
Gold and silver credits | (2.11 | ) | — | — | (1.85 | ) | — | — | |||||||||||||||
Treatment charges | 0.31 | 0.17 | 77 | 0.25 | 0.16 | 65 | |||||||||||||||||
Export duties | 0.16 | 0.09 | 41 | — | — | — | |||||||||||||||||
Royalty on metals | 0.17 | b | 0.10 | 42 | 0.12 | 0.07 | 31 | ||||||||||||||||
Unit net cash costs | 1.04 | 1.77 | 786 | 2.12 | 2.54 | 1,046 | |||||||||||||||||
Depreciation and amortization | 0.42 | 0.24 | 106 | 0.45 | 0.29 | 120 | |||||||||||||||||
Noncash and other costs, net | 0.04 | 0.02 | 10 | 0.61 | a | 0.39 | 161 | ||||||||||||||||
Total unit costs | 1.50 | 2.03 | 902 | 3.18 | 3.22 | 1,327 | |||||||||||||||||
Revenue adjustments, primarily for pricing on prior period open sales | (0.15 | ) | (0.15 | ) | 14 | (0.24 | ) | (0.24 | ) | 59 | |||||||||||||
PT Smelting intercompany profit | 0.01 | 0.01 | 2 | 0.26 | 0.16 | 68 | |||||||||||||||||
Gross profit (loss) per pound/ounce | $ | 1.02 | $ | 0.49 | $ | 297 | $ | (0.01 | ) | $ | (0.15 | ) | $ | 99 | |||||||||
Copper sales (millions of recoverable pounds) | 351 | 351 | 226 | 226 | |||||||||||||||||||
Gold sales (thousands of recoverable ounces) | 606 | 297 | |||||||||||||||||||||
a. | Fixed costs totaling $0.48 per pound of copper charged directly to cost of sales as a result of the impact of export restrictions on PT-FI's operating rates are excluded from site production and delivery and included in net noncash and other costs for the second quarter and first six months of 2014. |
b. | Includes $0.07 per pound of copper for the second quarter and first six months of 2015 associated with PT-FI's increased royalty rates. |
A significant portion of PT-FI's costs are fixed and unit costs vary depending on sales volumes. Indonesia's unit net cash costs (net of gold and silver credits) totaled $0.81 per pound of copper in second-quarter 2015 and $1.04 per pound of copper for the first six months of 2015, compared with $2.66 per pound in second-quarter 2014 and $2.12 per pound of copper for the first six months of 2014, primarily reflecting higher gold and silver credits and higher copper sales volumes, partly offset by the impact of export duties and increased royalty rates.
Treatment charges vary with the volume of metals sold and the price of copper, and royalties vary with the volume of metals sold and the prices of copper and gold.
Because certain assets are depreciated on a straight-line basis, PT-FI’s unit depreciation rate varies with the level of copper production and sales.
Revenue adjustments primarily result from changes in prices on provisionally priced copper sales recognized in prior periods. Refer to “Consolidated Results - Revenues” for further discussion of adjustments to prior period provisionally priced copper sales.
PT Smelting intercompany profit represents the change in the deferral of 25 percent of PT-FI's profit on sales to PT Smelting. Refer to "Operations - Smelting & Refining" for further discussion.
Based on current sales volume and cost estimates, and assuming an average gold price of $1,150 per ounce for the second half of 2015, Indonesia's unit net cash costs (net of gold and silver credits) are expected to approximate $1.08 per pound of copper for the year 2015, compared with $1.06 for the year 2014. Indonesia's projected unit net cash costs would change by approximately $0.05 per pound for each $50 per ounce change in the average price of gold for the second half of 2015. Because of the fixed nature of a large portion of Indonesia's costs, unit costs vary from quarter to quarter depending on copper and gold volumes.
Africa Mining
Africa mining includes the Tenke minerals district. We hold an effective 56 percent interest in the Tenke copper and cobalt mining concessions in the Katanga province of the DRC through our consolidated subsidiary Tenke Fungurume Mining S.A. (TFM), and we are the operator of Tenke.
53
The Tenke operation includes open-pit mining, leaching and SX/EW operations. Copper production from the Tenke minerals district is sold as copper cathode. In addition to copper, the Tenke minerals district produces cobalt hydroxide.
As further discussed in “Overview,” we are currently reviewing operating plans at each of our copper and molybdenum mining operations and will revise operating and capital plans to strengthen our financial position in a weak copper price environment. The revised plans will target lower operating and capital costs to achieve maximum cash flow under the current market conditions. Production at certain operations challenged by low commodity prices will be curtailed. We expect to complete this review promptly and will report our revised plans during third-quarter 2015. Accordingly, our sales volume and unit costs estimates discussed below are subject to change as a result of this review and other factors.
Operating and Development Activities. TFM completed its second phase expansion project in early 2013, which included increasing mine, mill and processing capacity. Construction of a second sulphuric acid plant is under way, with completion expected in the first half of 2016. We continue to engage in exploration activities and metallurgical testing to evaluate the potential of the highly prospective minerals district at Tenke. These analyses are being incorporated in future plans for potential expansions of production capacity. Future expansions are subject to a number of factors, including power availability, economic and market conditions, and the business and investment climate in the DRC.
Operating Data. Following is summary operating data for our Africa mining operations for the second quarters and first six months of 2015 and 2014:
Three Months Ended | Six Months Ended | ||||||||||||||
June 30, | June 30, | ||||||||||||||
2015 | 2014 | 2015 | 2014 | ||||||||||||
Copper (recoverable) | |||||||||||||||
Production (millions of pounds) | 115 | 114 | 231 | 223 | |||||||||||
Sales (millions of pounds) | 104 | 118 | 237 | 202 | |||||||||||
Average realized price per pounda | $ | 2.63 | $ | 3.08 | $ | 2.66 | $ | 3.08 | |||||||
Cobalt (contained) | |||||||||||||||
Production (millions of pounds) | 9 | 7 | 16 | 14 | |||||||||||
Sales (millions of pounds) | 8 | 7 | 16 | 15 | |||||||||||
Average realized price per pound | $ | 9.27 | $ | 9.58 | $ | 9.23 | $ | 9.29 | |||||||
Ore milled (metric tons per day) | 15,300 | 15,200 | 14,900 | 14,800 | |||||||||||
Average ore grades (percent): | |||||||||||||||
Copper | 4.02 | 4.08 | 4.18 | 4.07 | |||||||||||
Cobalt | 0.44 | 0.34 | 0.40 | 0.33 | |||||||||||
Copper recovery rate (percent) | 93.9 | 92.7 | 93.9 | 93.7 | |||||||||||
a. | Includes point-of-sale transportation costs as negotiated in customer contracts. |
TFM's copper sales of 104 million pounds in second-quarter 2015 were lower than second-quarter 2014 copper sales of 118 million pounds primarily because of timing of shipments. TFM's copper sales for the first six months of 2015 of 237 million were higher than copper sales of 202 million for the first six months of 2014, primarily reflecting higher ore grades and timing of shipments.
For the year 2015, we expect sales volumes from TFM to approximate 460 million pounds of copper and 36 million pounds of cobalt, compared with 425 million pounds of copper and 30 million pounds of cobalt for the year 2014.
Unit Net Cash Costs. Unit net cash costs per pound of copper is a measure intended to provide investors with information about the cash-generating capacity of our mining operations expressed on a basis relating to the primary metal product for our respective operations. We use this measure for the same purpose and for monitoring operating performance by our mining operations. This information differs from measures of performance determined in accordance with U.S. GAAP and should not be considered in isolation or as a substitute for measures of
54
performance determined in accordance with U.S. GAAP. This measure is presented by other metals mining companies, although our measure may not be comparable to similarly titled measures reported by other companies.
Gross Profit per Pound of Copper and Cobalt
The following table summarizes the unit net cash costs and gross profit per pound of copper and cobalt at our Africa mining operations for the second quarters and first six months of 2015 and 2014. Refer to “Production Revenues and Production Costs” for an explanation of “by-product” and “co-product” methods and a reconciliation of unit net cash costs per pound to production and delivery costs applicable to sales reported in our consolidated financial statements.
Three Months Ended | Three Months Ended | ||||||||||||||||||||||
June 30, 2015 | June 30, 2014 | ||||||||||||||||||||||
By-Product Method | Co-Product Method | By-Product Method | Co-Product Method | ||||||||||||||||||||
Copper | Cobalt | Copper | Cobalt | ||||||||||||||||||||
Revenues, excluding adjustmentsa | $ | 2.63 | $ | 2.63 | $ | 9.27 | $ | 3.08 | $ | 3.08 | $ | 9.58 | |||||||||||
Site production and delivery, before net noncash and other costs shown below | 1.54 | 1.35 | 5.48 | 1.46 | 1.35 | 5.22 | |||||||||||||||||
Cobalt creditsb | (0.53 | ) | — | — | (0.34 | ) | — | — | |||||||||||||||
Royalty on metals | 0.06 | 0.05 | 0.16 | 0.06 | 0.06 | 0.15 | |||||||||||||||||
Unit net cash costs | 1.07 | 1.40 | 5.64 | 1.18 | 1.41 | 5.37 | |||||||||||||||||
Depreciation, depletion and amortization | 0.55 | 0.43 | 1.42 | 0.54 | 0.46 | 1.30 | |||||||||||||||||
Noncash and other costs, net | 0.03 | 0.03 | 0.10 | 0.03 | 0.03 | 0.08 | |||||||||||||||||
Total unit costs | 1.65 | 1.86 | 7.16 | 1.75 | 1.90 | 6.75 | |||||||||||||||||
Revenue adjustments, primarily for pricing on prior period open sales | 0.02 | 0.02 | 0.50 | — | — | (0.19 | ) | ||||||||||||||||
Gross profit per pound | $ | 1.00 | $ | 0.79 | $ | 2.61 | $ | 1.33 | $ | 1.18 | $ | 2.64 | |||||||||||
Copper sales (millions of recoverable pounds) | 104 | 104 | 118 | 118 | |||||||||||||||||||
Cobalt sales (millions of contained pounds) | 8 | 7 | |||||||||||||||||||||
Six Months Ended | Six Months Ended | ||||||||||||||||||||||
June 30, 2015 | June 30, 2014 | ||||||||||||||||||||||
By-Product Method | Co-Product Method | By-Product Method | Co-Product Method | ||||||||||||||||||||
Copper | Cobalt | Copper | Cobalt | ||||||||||||||||||||
Revenues, excluding adjustmentsa | $ | 2.66 | $ | 2.66 | $ | 9.23 | $ | 3.08 | $ | 3.08 | $ | 9.29 | |||||||||||
Site production and delivery, before net noncash and other costs shown below | 1.56 | 1.37 | 5.54 | 1.47 | 1.30 | 5.19 | |||||||||||||||||
Cobalt creditsb | (0.44 | ) | — | — | (0.48 | ) | — | — | |||||||||||||||
Royalty on metals | 0.06 | 0.05 | 0.15 | 0.07 | 0.06 | 0.16 | |||||||||||||||||
Unit net cash costs | 1.18 | 1.42 | 5.69 | 1.06 | 1.36 | 5.35 | |||||||||||||||||
Depreciation, depletion and amortization | 0.55 | 0.46 | 1.31 | 0.57 | 0.49 | 1.03 | |||||||||||||||||
Noncash and other costs, net | 0.03 | 0.03 | 0.08 | 0.05 | 0.04 | 0.09 | |||||||||||||||||
Total unit costs | 1.76 | 1.91 | 7.08 | 1.68 | 1.89 | 6.47 | |||||||||||||||||
Revenue adjustments, primarily for pricing on prior period open sales | (0.03 | ) | (0.03 | ) | (0.04 | ) | (0.01 | ) | (0.01 | ) | 0.13 | ||||||||||||
Gross profit per pound | $ | 0.87 | $ | 0.72 | $ | 2.11 | $ | 1.39 | $ | 1.18 | $ | 2.95 | |||||||||||
Copper sales (millions of recoverable pounds) | 237 | 237 | 202 | 202 | |||||||||||||||||||
Cobalt sales (millions of contained pounds) | 16 | 15 | |||||||||||||||||||||
a. | Includes point-of-sale transportation costs as negotiated in customer contracts. |
b. | Net of cobalt downstream processing and freight costs. |
Unit net cash costs (net of cobalt credits) for our Africa operations of $1.07 per pound of copper in second-quarter 2015 were lower than unit net cash costs of $1.18 per pound in second-quarter 2014, primarily reflecting higher cobalt credits, partly offset by lower copper sales volumes. Africa's unit net cash costs of $1.18 per pound of copper
55
for the first six months of 2015 were higher than unit net cash costs of $1.06 per pound for the first six months of 2014, primarily reflecting higher site production and delivery costs, partly offset by higher copper sales volumes.
Because certain assets are depreciated on a straight-line basis, Africa's unit depreciation rate may vary with the level of copper production and sales.
Assuming achievement of current sales volume and cost estimates, and an average cobalt market price of $13 per pound for the second half of 2015, average unit net cash costs (net of cobalt credits) are expected to approximate $1.12 per pound of copper for the year 2015, compared with $1.15 per pound in 2014. Africa's projected unit net cash costs would change by $0.05 per pound for each $2 per pound change in the average price of cobalt during the second half of 2015.
Molybdenum Mines
We have two wholly owned molybdenum mines in North America – the Henderson underground mine and the Climax open-pit mine, both in Colorado. The Henderson and Climax mines produce high-purity, chemical-grade molybdenum concentrates, which are typically further processed into value-added molybdenum chemical products. The majority of the molybdenum concentrates produced at the Henderson and Climax mines, as well as from our North and South America copper mines, are processed at our own conversion facilities.
Production from the Molybdenum mines totaled 13 million pounds of molybdenum in second-quarter 2015, 26 million pounds of molybdenum for the first six months of 2015, 14 million pounds of molybdenum in second-quarter 2014 and 27 million pounds of molybdenum for the first six months of 2014. Refer to "Consolidated Results" for our consolidated molybdenum operating data, which includes sales of molybdenum produced at our Molybdenum mines, and from our North and South America copper mines, and refer to "Outlook" for projected consolidated molybdenum sales volumes.
Unit Net Cash Costs Per Pound of Molybdenum. Unit net cash costs per pound of molybdenum is a measure intended to provide investors with information about the cash-generating capacity of our mining operations expressed on a basis relating to the primary metal product for our respective operations. We use this measure for the same purpose and for monitoring operating performance by our mining operations. This information differs from measures of performance determined in accordance with U.S. GAAP and should not be considered in isolation or as a substitute for measures of performance determined in accordance with U.S. GAAP. This measure is presented by other metals mining companies, although our measure may not be comparable to similarly titled measures reported by other companies.
Average unit net cash costs for our Molybdenum mines of $7.19 per pound of molybdenum in second-quarter 2015 and $7.18 per pound of molybdenum for the first six months of 2015 were higher than average unit net cash costs of $6.47 per pound in second-quarter 2014 and $6.58 per pound of molybdenum for the first six months of 2014, primarily reflecting lower production volumes from the Henderson mine. Assuming achievement of current sales volume and cost estimates, we estimate unit net cash costs for the Molybdenum mines to average $7.50 per pound of molybdenum for the year 2015, compared with $7.08 per pound in 2014. Refer to “Product Revenues and Production Costs” for a reconciliation of unit net cash costs per pound to production and delivery costs applicable to sales reported in our consolidated financial statements.
As further discussed in “Overview,” we are currently reviewing operating plans at each of our copper and molybdenum mining operations and will revise operating and capital plans to strengthen our financial position in a weak copper price environment. The revised plans will target lower operating and capital costs to achieve maximum cash flow under the current market conditions. Production at certain operations challenged by low commodity prices will be curtailed. We expect to complete this review promptly and will report our revised plans during third-quarter 2015. Accordingly, our molybdenum sales volume and unit costs estimates are subject to change as a result of this review and other factors.
Smelting & Refining
We wholly own and operate a smelter in Arizona (Miami smelter) and a smelter and refinery in Spain (Atlantic Copper). Additionally, PT-FI owns 25 percent of a smelter and refinery in Gresik, Indonesia (PT Smelting). Treatment charges for smelting and refining copper concentrates consist of a base rate and, in certain contracts, price participation based on copper prices. Treatment charges represent a cost to our mining operations and income to Atlantic Copper and PT Smelting. Thus, higher treatment charges benefit our smelter operations and adversely affect our mining operations. Our North America copper mines are less significantly affected by changes
56
in treatment charges because these operations are largely integrated with our Miami smelter. Through this form of downstream integration, we are assured placement of a significant portion of our concentrate production.
Atlantic Copper smelts and refines copper concentrates and markets refined copper and precious metals in slimes. During the first six months of 2015, Atlantic Copper purchased 25 percent of its concentrate requirements from our North America mining operations and 5 percent of its concentrate requirements from our South America mining operations, with the remainder purchased from third parties.
PT-FI's contract with PT Smelting provides for PT-FI to supply 100 percent of the copper concentrate requirements (subject to a minimum or maximum rate) necessary for PT Smelting to produce 205,000 metric tons of copper annually on a priority basis. PT-FI also sells copper concentrate to PT Smelting at market rates for quantities in excess of 205,000 metric tons of copper annually. During the first six months of 2015, PT-FI sold approximately half of its copper concentrate production to PT Smelting. In July 2015, PT Smelting's operations were temporarily suspended pending completion of required repairs, which are expected to be completed in September 2015.
We defer recognizing profits on sales from our mining operations to Atlantic Copper and on 25 percent of Indonesia mining's sales to PT Smelting until final sales to third parties occur. Changes in these deferrals attributable to variability in intercompany volumes resulted in net additions to net income attributable to common stockholders of $13 million in second-quarter 2015 and $37 million for the first six months of 2015, compared with $41 million in second-quarter 2014 and $56 million for the first six months of 2014. Our net deferred profits on inventories at Atlantic Copper and PT Smelting to be recognized in future periods’ net income attributable to common stockholders totaled $28 million at June 30, 2015. Quarterly variations in ore grades, the timing of intercompany shipments and changes in product prices will result in variability in our net deferred profits and quarterly earnings.
Oil and Gas
Through our wholly owned oil and gas subsidiary FCX Oil & Gas Inc. (FM O&G), our portfolio of oil and gas assets includes significant oil production facilities and growth potential in the Deepwater GOM, established oil production facilities onshore and offshore California, large onshore natural gas resources in the Haynesville shale play in Louisiana, natural gas production from the Madden area in Central Wyoming, and a position in the Inboard Lower Tertiary/Cretaceous natural gas trend onshore in South Louisiana. For the first six months of 2015, 88 percent of our oil and gas revenues, excluding the impact of derivative contracts, were from oil and NGLs.
On June 23, 2015, our wholly owned subsidiary, Freeport-McMoRan Oil & Gas Inc., filed a registration statement on Form S-1 with the U.S. SEC related to its potential IPO of Class A common stock, representing a minority interest in the entity. Freeport-McMoRan Oil & Gas Inc. intends to apply to list the common stock on the New York Stock Exchange under the ticker “FMOG.” The registration statement has not yet become effective, and securities may not be sold nor may offers to buy be accepted prior to the time the registration statement becomes effective.
On August 5, 2015, we announced the deferral of investments in several long-term projects in our oil and gas business, which will result in a reduction of $0.9 billion in projected capital expenditures for each of the years 2016 and 2017. We have also revised our estimate of the start-up of initial production from its recent drilling success in the Horn Mountain area to 2016 from the previously estimated start-up in 2017. This revised operating plan will allow FM O&G to continue to grow production and enhance cash flow in a weak oil and gas price environment. The revised plans, together with the potential IPO of a minority interest in Freeport-McMoRan Oil & Gas Inc., and potential other actions, will be pursued as required to fund oil and gas capital spending with cash flow for 2016 and subsequent years.
Impairment of Oil and Gas Properties. We follow the full cost method of accounting for our oil and gas operations, whereby all costs associated with oil and gas property acquisition, exploration and development activities are capitalized and amortized to expense under the UOP method on a country-by-country basis using estimates of proved oil and natural gas reserves relating to each country where such activities are conducted. The costs of unproved oil and gas properties are excluded from amortization until the properties are evaluated. Our DD&A rate is affected by changes to estimates of proved reserves and costs subject to amortization, as further discussed in "Critical Accounting Estimates" in Part II, Items 7. and 7A. of our annual report on Form 10-K for the year ended December 31, 2014.
Under full cost accounting rules, a "ceiling test" is conducted each quarter to review the carrying value of our oil and gas properties for impairment. The SEC requires the twelve-month average of the first-day-of-the-month historical reference oil price be used in determining the ceiling test limitation. Using West Texas Intermediate (WTI) as the
57
reference oil price, the average price was $71.68 per barrel at June 30, 2015, compared with $82.72 per barrel at March 31, 2015. As of June 30, 2015, and March 31, 2015, net capitalized costs with respect to FM O&G's proved U.S. oil and gas properties exceeded the ceiling test limitation specified by the SEC's full cost accounting rules, which resulted in the recognition of impairment charges totaling $2.7 billion ($1.7 billion to net loss attributable to common stock) in second-quarter 2015 and $5.8 billion ($3.6 billion to net loss attributable to common stock) for the first six months of 2015.
If the twelve-month historical average price remains below the June 30, 2015, twelve-month average of $71.68 per barrel, the ceiling test limitation will decrease resulting in potentially significant additional ceiling test impairments of our oil and gas properties. The WTI spot oil price was $47.12 per barrel at July 31, 2015.
If the trailing twelve-month average prices for the period ended June 30, 2015, had been $59.35 per barrel of oil and $3.07 per MMBtu for natural gas, while all other inputs and assumptions remained constant, an additional pre-tax impairment charge of $1.8 billion would have been recorded to our oil and gas properties in second-quarter 2015. These oil and natural gas prices were determined using a twelve-month simple average of the first day of the month for the eleven months ended August 2015, and the August 2015, prices were held constant for the remaining one month. The additional pre-tax impairment is partly the result of a 26 percent decrease in proved undeveloped reserves because certain locations would not be economic at these prices. This calculation solely reflects the impact of hypothetical lower oil and natural gas prices on our ceiling test limitation and proved reserves as of June 30, 2015, and does not reflect the reduction in oil and gas capital expenditures that was announced on August 5, 2015. The oil and natural gas price is a single variable in the estimation of our proved reserves and other factors could have a significant impact on future reserves and the present value of future cash flows.
As further discussed in "Critical Accounting Estimates" in Part II, Items 7. and 7A. of our annual report on Form 10-K for the year ended December 31, 2014, in addition to declines in the trailing twelve-month average oil and natural gas prices, other factors that could result in future impairment of our oil and gas properties, include costs transferred from unevaluated properties to the full cost pool without corresponding proved oil and natural gas reserve additions, negative reserve revisions and increased future development or production costs. As FM O&G completes activities to assess its $9.3 billion in unevaluated properties, related costs currently recorded as unevaluated properties not subject to amortization will be transferred to the full cost pool. If these activities do not result in additions to discounted future net cash flows from proved oil and natural gas reserves at least equal to the related costs transferred (net of related tax effects), additional ceiling test impairments may occur.
58
U.S. Oil and Gas Operations. Following is summary operating results for the U.S. oil and gas operations for the second quarters and first six months of 2015 and 2014:
Three Months Ended | Six Months Ended | ||||||||||||||||
June 30, | June 30, | ||||||||||||||||
2015 | 2014a | 2015 | 2014a | ||||||||||||||
Sales Volumes | |||||||||||||||||
Oil (MMBbls) | 8.6 | 11.7 | 17.0 | 23.5 | |||||||||||||
Natural gas (Bcf) | 23.5 | 20.3 | 45.3 | 39.8 | |||||||||||||
NGLs (MMBbls) | 0.6 | 1.0 | 1.1 | 2.1 | |||||||||||||
MMBOE | 13.1 | 16.0 | 25.6 | 32.2 | |||||||||||||
Average Realized Pricesb | |||||||||||||||||
Oil (per barrel) | $ | 67.61 | $ | 95.50 | $ | 62.13 | $ | 94.63 | |||||||||
Natural gas (per MMBtu) | $ | 2.66 | $ | 4.44 | $ | 2.75 | $ | 4.55 | |||||||||
NGLs (per barrel) | $ | 20.50 | $ | 38.79 | $ | 21.71 | $ | 42.35 | |||||||||
Gross (Loss) Profit per BOE | |||||||||||||||||
Realized revenuesb | $ | 50.04 | $ | 77.53 | $ | 46.95 | $ | 77.37 | |||||||||
Less: cash production costsb | 19.04 | 19.57 | 19.62 | 19.03 | |||||||||||||
Cash operating marginb | 31.00 | 57.96 | 27.33 | 58.34 | |||||||||||||
Less: depreciation, depletion and amortization | 36.99 | 38.39 | 39.59 | 38.30 | |||||||||||||
Less: impairment of oil and gas properties | 204.91 | — | 225.89 | — | |||||||||||||
Less: accretion and other costs | 2.46 | 0.94 | 2.39 | 0.87 | |||||||||||||
Plus: net noncash mark-to-market (losses) gains on derivative contracts | (7.26 | ) | (0.44 | ) | (5.60 | ) | 0.23 | ||||||||||
Plus: other net adjustments | 0.61 | 0.04 | 0.34 | 0.04 | |||||||||||||
Gross (loss) profit | $ | (220.01 | ) | $ | 18.23 | $ | (245.80 | ) | $ | 19.44 | |||||||
a. | The 2014 periods include results from the Eagle Ford field through June 19, 2014. Eagle Ford had sales volumes totaling 4.0 MMBOE for second-quarter 2014 and 8.7 MMBOE for the first six months of 2014; excluding Eagle Ford, oil and gas cash production costs were $21.66 per BOE for second-quarter 2014 and $21.29 per BOE for the first six months of 2014. |
b. | Cash operating margin for our oil and gas operations reflects realized revenues less cash production costs. Realized revenues exclude noncash mark-to-market adjustments on derivative contracts. For reconciliations of realized revenues (including average realized prices for oil, natural gas and NGLs) and cash production costs to revenues and production and delivery costs reported in our consolidated financial statements, refer to the supplemental schedule, "Product Revenues and Production Costs." |
FM O&G's average realized price for crude oil was $67.61 per barrel, including $11.79 per barrel of cash gains on derivative contracts, in second-quarter 2015 and $62.13 per barrel, including $11.88 per barrel of cash gains on derivative contracts, for the first six months of 2015. Excluding the impact of derivative contracts, the second-quarter 2015 average realized price for crude oil was $55.82 per barrel (88 percent of the average Brent crude oil price of $63.57 per barrel) and $50.25 per barrel (85 percent of the average Brent crude oil price of $59.41 per barrel) for the first six months of 2015.
FM O&G has derivative contracts that provide price protection averaging between approximately $70 and $90 per barrel of Brent crude oil for more than 80 percent of estimated 2015 oil production. Assuming an average price of $56 per barrel for Brent crude oil, we would receive a benefit of $20 per barrel on remaining 2015 derivative contract volumes of 15.5 MMBbls, before taking into account weighted-average premiums of $6.89 per barrel. See Note 7 for further discussion.
FM O&G's average realized price for natural gas was $2.66 per MMBtu in second-quarter 2015, compared to the NYMEX natural gas price average of $2.65 per MMBtu for the April through June 2015 contracts; and $2.75 per MMBtu for the first six months of 2015, compared to the NYMEX natural gas price average of $2.81 per MMBtu for the January through June 2015 contracts.
Realized revenues for oil and gas operations of $50.04 per BOE in second-quarter 2015 and $46.95 per BOE for the first six months of 2015 were lower than realized revenues of $77.53 per BOE in second-quarter 2014 and $77.37 per BOE for the first six months of 2014, primarily reflecting lower oil prices, partly offset by the impact of higher realized cash gains on derivative contracts (cash gains were $101 million or $7.73 per BOE in second-
59
quarter 2015 and $201 million or $7.87 per BOE for the first six months of 2015, compared with losses of $63 million or $3.94 per BOE in second-quarter 2014 and $128 million or $3.97 per BOE for the first six months of 2014).
Cash production costs for oil and gas operations of $19.04 per BOE in second-quarter 2015 were lower than cash production costs of $19.57 per BOE in second-quarter 2014, primarily reflecting lower cash production costs in California related to reductions in repair and maintenance costs and well workover expense, partly offset by the impact of the sale of lower-cost Eagle Ford properties in June 2014. Cash production costs for oil and gas properties of $19.62 per BOE for the first six months of 2015 were higher than cash production costs of $19.03 per BOE for the first six months of 2014, primarily reflecting the sale of lower-cost Eagle Ford properties in June 2014, partly offset by lower cash production costs in California related to reductions in repair and maintenance costs and well workover expense.
Following is a summary of average sales volumes per day by region for oil and gas operations for the second quarters and first six months of 2015 and 2014:
Three Months Ended | Six Months Ended | ||||||||||
June 30, | June 30, | ||||||||||
2015 | 2014 | 2015 | 2014a | ||||||||
Sales Volumes (MBOE per day): | |||||||||||
GOMa | 80 | 75 | 77 | 73 | |||||||
California | 38 | 39 | 39 | 39 | |||||||
Haynesville/Madden/Other | 26 | 18 | 26 | 18 | |||||||
Eagle Fordb | — | 44 | — | 48 | |||||||
Total oil and gas operations | 144 | 176 | 142 | 178 | |||||||
a. | Includes sales from properties on the GOM Shelf and in the Deepwater GOM. |
b. | FM O&G completed the sale of Eagle Ford in June 2014. |
Daily sales volumes averaged 144 MBOE in second-quarter 2015, including 95 MBbls of crude oil, 259 million cubic feet (MMcf) of natural gas and 5 MBbls of NGLs, and 142 MBOE for the first six months of 2015, including 94 MBbls of crude oil, 250 MMcf of natural gas and 6 MBbls of NGLs. Oil and gas sales volumes are expected to average 145 MBOE per day for the year 2015, comprised of 68 percent oil, 27 percent natural gas and 5 percent NGLs.
Based on current sales volume and cost estimates, cash production costs are expected to approximate $20 per BOE for the year 2015.
Exploration, Operating and Development Activities. Our oil and gas business has significant proved, probable and possible reserves, a broad range of development opportunities and high-potential exploration prospects. The business is managed to reinvest its cash flows in projects with attractive rates of return and risk profiles. Following the sharp decline in oil prices in late 2014, we have taken steps to significantly reduce capital spending plans and are evaluating funding opportunities for capital expenditures for our oil and gas business, including the potential IPO for a minority interest in Freeport-McMoRan Oil & Gas Inc.
FM O&G is focused on growing its strategic position in the Deepwater GOM with significant current oil production, strong cash margins and existing infrastructure and facilities with excess production and handling capacity. These assets, combined with FM O&G’s large leasehold interests in an established geologic basin, provide financially attractive investment opportunities for high-impact growth in oil production and cash margins. FM O&G’s capital allocation strategy is principally focused on development opportunities that can be tied back to existing facilities.
During second-quarter 2015, FM O&G achieved several important accomplishments, principally in its Deepwater GOM focus areas, that are expected to contribute to future growth. Production reached full capacity at the Lucius facility and development advanced at the Heidelberg field. Positive drilling results were achieved at the Holstein Deep and Quebec/Victory (QV), Kilo/Oscar (KO) and Horn Mountain Updip tieback prospects. Since commencing development activities in 2014 at its three 100-percent-owned production platforms in the Deepwater GOM, FM O&G has drilled 10 wells with positive results. Three of these wells have been brought on production, and FM O&G plans to complete and place in production six wells over the next 12 months and the remaining well in 2017. Longer term, FM O&G's production is expected to benefit from the success in the Atwater Valley focus area, where multiple
60
discoveries have been drilled to date. During second-quarter 2015, FM O&G commenced drilling at the Deep Sleep exploration well in the Atwater Valley focus area.
U.S. Oil and Gas Capital Expenditures. Capital expenditures for our U.S. oil and gas operations totaled $0.8 billion (including $0.6 billion incurred for the Deepwater GOM and $0.1 billion for the Inboard Lower Tertiary/Cretaceous natural gas trend) for second-quarter 2015 and $1.8 billion (including $1.2 billion incurred for Deepwater GOM and $0.2 billion for the Inboard Lower Tertiary/Cretaceous natural gas trend) for the first six months of 2015.
Capital expenditures for oil and gas operations are estimated to total $2.8 billion for the year 2015, with approximately 85 percent of the 2015 capital budget expected to be directed to the highest potential return focus areas in the GOM.
Deepwater GOM. The drilling and evaluation of multiple development and exploration opportunities in the Deepwater GOM is in progress. These prospects benefit from tieback opportunities to significant available production capacity at the FM O&G operated large-scale Holstein, Marlin and Horn Mountain deepwater production platforms. In addition, FM O&G has interests in the Lucius and Heidelberg oil fields, and in the Atwater Valley focus area.
After successfully commencing first production in January 2015, the Lucius oil facility in Keathley Canyon reached capacity of 80 MBbls of oil per day in second-quarter 2015. FM O&G has a 25.1 percent working interest in Lucius, which consists of six subsea wells located in 7,200 feet of water tied back to a truss spar hull.
Field development continued at Heidelberg in the Green Canyon focus area during second-quarter 2015. Fabrication of the main topsides module is complete, the hull is on location, and mooring lines are completed. The Heidelberg truss spar was designed as a Lucius-look-alike facility with capacity of 80 MBbls of oil per day. Development drilling in the field is ongoing and first production is anticipated in 2016. Completion activities on the three initial wells are in progress. FM O&G has a 12.5 percent working interest in Heidelberg, which is a large, high-quality oil development project located in 5,300 feet of water.
In July 2015, FM O&G logged its third successful subsalt Miocene delineation well at the 100-percent-owned Holstein Deep development project in the Green Canyon focus area since commencing drilling in the area in third-quarter 2014. The third delineation well, which is the most updip in the reservoir, was drilled to 29,440 feet and wireline logs indicated that the well encountered approximately 200 feet of net oil pay. Drilling results from this initial three-well development program successfully established sand continuity across the primary reservoir.
Completion activities for the initial three-well subsea tieback development program are expected to commence in third-quarter 2015 and production is expected to begin in 2016. Successful results from the initial three-well drilling program established opportunities for additional wells. When fully developed, this project will have the potential to produce up to 75 MBOE per day. The Holstein Deep development is located in Green Canyon Block 643, west of the Holstein platform in 3,890 feet of water with production facilities capable of processing 113 MBbls of oil per day.
FM O&G’s 100-percent-owned Marlin Hub is located in the Mississippi Canyon focus area and has production facilities capable of processing 60 MBbls of oil per day. Several tieback opportunities have been identified, including the 100-percent-owned Dorado and King development projects. Future wells can be brought on-line using existing infrastructure with the potential to utilize subsea enhancement technologies that could increase total recovery efficiencies. In second-quarter 2015, FM O&G completed maintenance activities, including the installation of new export flow line flex joints, which will extend the life of the Marlin platform.
The initial FM O&G drilled Dorado well was placed in production in March 2015 after a successful production test with gross volumes in excess of 8 MBOE per day and continues to produce at strong rates. Drilling operations for the second and third wells, which are targeting similar undrained fault blocks and updip resource potential south of the Marlin facility, are expected to begin in 2016. The Dorado development is located on Viosca Knoll Block 915 in 3,860 feet of water.
Initial production from the first exploration well at King is expected to commence in fourth-quarter 2015, and additional drilling is planned in the area starting in the second-half of 2015. King is located in Mississippi Canyon south of the Marlin facility in 5,200 feet of water.
61
FM O&G’s 100-percent-owned Horn Mountain field is also located in the Mississippi Canyon focus area and has production facilities capable of processing 75 MBbls of oil per day. To enhance recovery of remaining oil in place, future development plans will target subsea tieback from multiple stacked sands in the area. In second-quarter 2015, the QV well, the first location of this program, was drilled to 14,780 feet and successfully logged 355 net feet of oil and gas pay. In June 2015, drilling operations commenced at the KO and Horn Mountain Updip wells. At KO, the well was drilled to a total depth of 14,250 feet in July 2015 and successfully logged 166 net feet of oil pay. FM O&G plans to complete the KO and QV wells and place them in production in 2016. At Horn Mountain Updip, the well was drilled to a total depth of 14,780 feet in July 2015 and successfully logged 112 net feet of oil and gas pay. These infill wells are targeting undrained fault blocks and updip resource potential east and west of the Horn Mountain facility, which is located in approximately 5,400 feet of water.
FM O&G has an 18.67 percent working interest in the Vito oil discovery and a significant lease position in the Atwater Valley focus area. Vito is a large, deep subsalt Miocene oil discovery made in 2009, located in approximately 4,000 feet of water. Exploration and delineation drilling in recent years confirmed a significant resource in high-quality, subsalt Miocene sands. Development options are under evaluation and FM O&G expects the operator to propose a sanctioning development plan in 2016.
As previously reported, success at the Power Nap exploration well and appraisal sidetracks, which are located in close proximity to Vito, produced positive results and development options are being assessed. The neighboring Deep Sleep exploration well in the greater Mars/Ursa basin commenced drilling in June 2015. Deep Sleep is located in 4,200 feet of water approximately five miles south of Power Nap. FM O&G owns a 50 percent working interest in the Power Nap and Deep Sleep prospects.
Inboard Lower Tertiary/Cretaceous. FM O&G has a position in the Inboard Lower Tertiary/Cretaceous natural gas trend, located onshore in South Louisiana.
In second-quarter 2015, the Highlander well, which has been restricted because of limited processing facilities, averaged a gross rate of 22 MMcf per day (approximately 11 MMcf per day net to FM O&G). As previously reported production testing in February 2015 indicated a flow rate of 75 MMcf per day (approximately 37 MMcf per day net to FM O&G). FM O&G is developing additional processing facilities to accommodate the higher flow rates with installation expected by year-end 2015. In July 2015, the Highlander well was shut in for remedial workover operations to address a mechanical issue encountered in the wellbore. A second well location has been identified, and future plans are being considered. FM O&G is the operator and has a 72 percent working interest and an approximate 49 percent net revenue interest in Highlander. FM O&G has identified multiple additional locations on the Highlander structure, which is located onshore in South Louisiana where FM O&G controls rights to more than 50,000 gross acres.
The Farthest Gate West onshore exploration prospect was drilled to a total depth of approximately 22,000 feet in March 2015. In May 2015, we completed our assessment of the Farthest Gate West well and commenced plug and abandonment activities. No proved reserves were identified.
California. Sales volumes from California averaged 38 MBOE per day for second-quarter 2015, compared with 39 MBOE per day for second-quarter 2014. FM O&G’s position in California is located onshore in the San Joaquin Valley and Los Angeles Basin, and offshore in the Point Arguello and Point Pedernales fields. During second-quarter 2015, production from Point Arguello platforms, which produced approximately 2 MBOE per day in first-quarter 2015, was temporarily shut in following the shutdown of a third-party operated pipeline system that transports oil to various California refineries.
Haynesville. FM O&G has rights to a substantial natural gas resource, located in the Haynesville shale play in North Louisiana. Drilling activities remain constrained in response to low natural gas prices in order to maximize near-term cash flows and to preserve the resource for potentially higher future natural gas prices.
International Exploration (Morocco). FM O&G has a farm-in arrangement to earn interests in exploration blocks located in the Mazagan permit area offshore Morocco. The exploration area covers 2.2 million gross acres in water depths of 4,500 to 9,900 feet. In May 2015, FM O&G commenced drilling the MZ-1 well associated with the Ouanoukrim prospect. In early August 2015, drilling of the well was completed to its targeted depth below 20,000 feet to evaluate the primary objectives, which did not contain hydrocarbons. As of June 30, 2015, capitalized costs for international oil and gas exploration activities in Morocco approximated $111 million and additional costs have
62
been incurred subsequent to June 30, 2015, all of which will be transferred to the Moroccan full cost pool in third-quarter 2015. FM O&G currently has no proved reserves or production in Morocco.
CAPITAL RESOURCES AND LIQUIDITY
Our operating cash flows vary with prices realized from copper, gold, molybdenum and oil sales, our sales volumes, production costs, income taxes, other working capital changes and other factors. Since December 31, 2014, our debt has increased primarily reflecting the impact of lower commodity prices and capital expenditures for our oil and gas exploration and development projects and mining expansion projects. Capital expenditures are expected to decline in future years as major mining projects near completion. We remain committed to a strong balance sheet and have sold assets, deferred capital spending and reduced dividends on our common stock.
In July 2015, we announced that we are undertaking a comprehensive review of operating plans in our mining and oil and gas businesses to target significant additional reductions in capital spending and operating and administrative costs in response to weak market conditions for our major products. On August 5, 2015, we provided an update on our progress and announced the deferral of investments in several long-term projects in our oil and gas business, which will result in a reduction of $0.9 billion in projected capital expenditures for each of the years 2016 and 2017. The revised plans, together with the potential IPO of a minority interest in our wholly owned subsidiary, Freeport-McMoRan Oil & Gas Inc., and potential other actions, will be pursued as required to fund oil and gas capital spending with cash flow for 2016 and subsequent years. Refer to “Operations - Oil and Gas” for further discussion of the potential IPO.
We are completing the review of operating plans at each of our copper and molybdenum mining operations and will revise operating and capital plans to strengthen our financial position in a weak copper price environment. The revised plans will target lower operating and capital costs to achieve maximum cash flow under the current market conditions. Production at certain operations challenged by low commodity prices will be curtailed. We expect to complete this review promptly and will report our revised plans during third-quarter 2015. We will also continue to assess opportunities to partner with strategic investors potentially interested in investing capital with FCX in the development of our oil and gas and mining properties. We have a broad set of assets with valuable infrastructure and associated resources with attractive long-term production and development potential.
Cash
Following is a summary of the U.S. and international components of consolidated cash and cash equivalents, including cash available to the parent company, net of noncontrolling interests' share, taxes and other costs (in millions):
June 30, 2015 | December 31, 2014 | ||||||
Cash at domestic companies | $ | 29 | $ | 78 | |||
Cash at international operations | 437 | 386 | |||||
Total consolidated cash and cash equivalents | 466 | 464 | |||||
Less: noncontrolling interests’ share | (119 | ) | (91 | ) | |||
Cash, net of noncontrolling interests’ share | 347 | 373 | |||||
Less: withholding taxes and other | (19 | ) | (16 | ) | |||
Net cash available | $ | 328 | $ | 357 | |||
Cash held at our international operations is generally used to support our foreign operations' capital expenditures, operating expenses, working capital and other tax payments, or other cash needs. With the exception of TFM, we have not elected to permanently reinvest earnings from our foreign subsidiaries, and we have recorded deferred tax liabilities for foreign earnings that are available to be repatriated to the U.S. From time to time, our foreign subsidiaries distribute earnings to the U.S. through dividends that are subject to applicable withholding taxes and noncontrolling interests' share.
63
Debt
Following is a summary of our total debt and the related weighted-average interest rates (in billions, except percentages):
June 30, 2015 | December 31, 2014 | ||||||||||||
Weighted- | Weighted- | ||||||||||||
Average | Average | ||||||||||||
Interest Rate | Interest Rate | ||||||||||||
FCX Senior Notes | $ | 11.9 | 3.8% | $ | 12.0 | 3.8 | % | ||||||
FCX Term Loan | 3.0 | 1.9% | 3.1 | 1.7 | % | ||||||||
FM O&G Senior Notes | 2.6 | 6.6% | 2.6 | 6.6 | % | ||||||||
Cerro Verde Term Loan | 1.3 | a | 2.1% | 0.4 | 2.1 | % | |||||||
Other FCX debt | 2.1 | b | 2.7% | 0.9 | 3.9 | % | |||||||
Total debt | $ | 20.9 | 3.6% | $ | 19.0 | 3.8 | % | ||||||
a. | At June 30, 2015, Cerro Verde had $1.3 billion of borrowings outstanding and no letters of credit issued under its $1.8 billion senior unsecured credit facility to fund a portion of its expansion project (see "Operations - South America Mining") and for Cerro Verde's general corporate purposes. |
b. | At June 30, 2015, we had $985 million of borrowings outstanding and $42 million in letters of credit issued under our $4 billion revolving credit facility. We also have uncommitted and short-term lines of credit with certain financial institutions that are unsecured, which have terms and pricing that are generally more favorable than our revolving credit facility. At June 30, 2015, there was $410 million of borrowings drawn on these lines of credit. |
As further discussed in Note 18 in our annual report on Form 10-K for the year ended December 31, 2014, in February 2015, our revolving credit facility and term loan were modified to amend the maximum total leverage ratio.
Our revolving credit facility and term loan contain financial ratio covenants governing maximum total leverage and minimum interest coverage, which limits our ability to incur additional debt. We are taking steps to enhance our financial position in response to recent declines in commodity prices. Further actions are being considered, such as additional equity capital or other transactions, including opportunities to partner with strategic investors potentially interested in investing capital in the development of our oil and gas and mining properties. We may also be required to seek an amendment to the covenants in our revolving credit facility and term loan.
For further discussion of our debt, refer to Note 6 in this report, and Note 8 in our annual report on Form 10-K for the year ended December 31, 2014.
Operating Activities
During the first six months of 2015, we generated consolidated operating cash flows totaling $1.8 billion (net of $190 million for working capital uses and changes in other tax payments), compared with consolidated operating cash flows for the first six months of 2014 of $2.6 billion (net of $777 million for working capital uses and changes in other tax payments). Lower consolidated operating cash flows for the first six months of 2015, compared with the first six months of 2014, primarily reflected the impact of lower commodity price realizations and lower oil volumes, partly offset by a decrease in working capital uses mostly associated with oil and gas derivative contracts and lower commodity prices.
Based on current operating plans and current commodity prices for copper, gold, molybdenum and crude oil, we expect estimated consolidated operating cash flows for the year 2015, plus available cash and availability under our credit facility and uncommitted lines of credit, to be sufficient to fund our budgeted capital expenditures, dividends, noncontrolling interest distributions and other cash requirements for the year. Refer to “Outlook” for further discussion of projected operating cash flows for the year 2015.
Investing Activities
Capital Expenditures. Capital expenditures, including capitalized interest, totaled $3.5 billion for the first six months of 2015, including $1.2 billion for major projects at mining operations and $1.8 billion for oil and gas operations, compared with $3.6 billion for the first six months of 2014, including $1.4 billion for major projects at mining operations and $1.5 billion for oil and gas operations. Lower capital expenditures for the first six months of 2015 were primarily associated with decreased spending for the Morenci mill expansion, partly offset by increased capital expenditures at our oil and gas operations and increased capital expenditures for the Cerro Verde expansion. Refer to “Operations” for further discussion.
64
Capital expenditures are currently expected to approximate $6.3 billion for the year 2015, including $2.5 billion for major projects at mining operations (primarily for the Cerro Verde expansion and underground development activities at Grasberg) and $2.8 billion for oil and gas operations, primarily at our highest potential return focus areas in the GOM. Projected 2015 capital expenditures for mining operations are subject to change as a result of the review of operating plans discussed above. We made substantial progress toward the completion of our major mining development projects, which are expected to result in increased near-term production, lower unit costs, declining capital expenditures and to contribute to cash flow from operations after capital expenditures in future years. In addition, positive oil and gas drilling and development activities are expected to result in a growing oil production profile.
Acquisitions and Dispositions. In June 2014, we acquired additional interests in the Deepwater GOM, for $0.9 billion, and also completed the sale of our Eagle Ford shale assets for $3.1 billion (before closing adjustments). The Deepwater GOM acquisition was funded with a portion of the net proceeds from the sale of Eagle Ford. The estimated combined after-tax net proceeds from these transactions approximated $1.8 billion, before purchase price adjustments. Refer to Note 2 for further discussion of our acquisition and disposal transactions.
Financing Activities
Debt Transactions. Net proceeds from debt for the first six months of 2015 primarily included net borrowings of $1.0 billion under our revolving credit facility and borrowings of $0.8 billion under Cerro Verde's senior unsecured credit facility to fund its expansion project.
On April 30, 2014, we redeemed $210 million of the aggregate principal amount of the outstanding 6.625% Senior Notes. Holders received the principal amount together with the redemption premium and accrued and unpaid interest to the redemption date. Refer to Note 6 for further discussion of debt transactions.
Dividends. We paid dividends on our common stock totaling $380 million for the first six months of 2015 and $653 million for the first six months of 2014. In response to the impact of lower commodity prices, in March 2015, the annual dividend rate for our common stock was reduced to $0.20 per share from the previous rate of $1.25 per share. On June 24, 2015, our Board of Directors (the Board) declared a regular quarterly dividend of $0.05 per share and a one-time special dividend of $0.1105 per share in accordance with the approved settlement terms of shareholder derivative litigation (refer to Note 9). Both the regular quarterly dividend and the special dividend were paid on August 3, 2015. The declaration of dividends is at the discretion of the Board and will depend upon our financial results, cash requirements, future prospects and other factors deemed relevant by the Board. Refer to Note 6 for further discussion.
Cash dividends and other distributions paid to noncontrolling interests totaled $60 million for the first six months of 2015 and $250 million for the first six months of 2014. These payments will vary based on the cash requirements of the related consolidated subsidiaries.
CONTRACTUAL OBLIGATIONS
As of June 30, 2015, we have current maturities of debt totaling $791 million, including $658 million for the second half of 2015 and $133 million for the first half of 2016, primarily reflecting bank lines of credit, which are extended to us on a uncommitted basis. As of June 30, 2015, debt maturities total $260 million for the year 2016 and $1.5 billion for the year 2017. With the exception of debt maturities and the related impact on scheduled interest payment obligations, there have been no material changes in our contractual obligations since December 31, 2014. Refer to Part II, Items 7. and 7A. in our annual report on Form 10-K for the year ended December 31, 2014, for further information regarding our contractual obligations.
CONTINGENCIES
Environmental and Asset Retirement Obligations
Our current and historical operating activities are subject to stringent laws and regulations governing the protection of the environment. We perform a comprehensive annual review of our environmental and asset retirement obligations and also review changes in facts and circumstances associated with these obligations at least quarterly. There have been no material changes to our environmental and asset retirement obligations since December 31, 2014. Updated cost assumptions, including increases and decreases to cost estimates, changes in the anticipated
65
scope and timing of remediation activities, and settlement of environmental matters may result in additional revisions to certain of our environmental obligations.
Refer to Note 12 in our annual report on Form 10-K for the year ended December 31, 2014, for further information regarding our environmental and asset retirement obligations.
Litigation and Other Contingencies
Other than as discussed in Note 9, and contained in "Legal Proceedings" in Part II, Item 1. of this quarterly report, there have been no material changes to our contingencies associated with legal proceedings and other matters since December 31, 2014. Refer to Note 12 and "Legal Proceedings" contained in Part I, Item 3. of our annual report on Form 10-K for the year ended December 31, 2014.
NEW ACCOUNTING STANDARDS
We do not expect the impact of recently issued accounting standards to have a significant impact on our future financial statements and disclosures. Refer to Note 12 for discussion of a recently adopted Accounting Standards Update.
66
PRODUCT REVENUES AND PRODUCTION COSTS
Mining Product Revenues and Unit Net Cash Cost
Unit net cash costs per pound of copper and molybdenum are measures intended to provide investors with information about the cash-generating capacity of our mining operations expressed on a basis relating to the primary metal product for the respective operations. We use this measure for the same purpose and for monitoring operating performance by our mining operations. This information differs from measures of performance determined in accordance with U.S. generally accepted accounting principles (GAAP) and should not be considered in isolation or as a substitute for measures of performance determined in accordance with U.S. GAAP. This measure is presented by other metals mining companies, although our measures may not be comparable to similarly titled measures reported by other companies.
We present gross profit per pound of copper in the following tables using both a “by-product” method and a “co-product” method. We use the by-product method in our presentation of gross profit per pound of copper because (i) the majority of our revenues are copper revenues, (ii) we mine ore, which contains copper, gold, molybdenum and other metals, (iii) it is not possible to specifically assign all of our costs to revenues from the copper, gold, molybdenum and other metals we produce, (iv) it is the method used to compare mining operations in certain industry publications and (v) it is the method used by our management and the Board to monitor operations. In the co-product method presentations below, shared costs are allocated to the different products based on their relative revenue values, which will vary to the extent our metals sales volumes and realized prices change.
We show revenue adjustments for prior period open sales as a separate line item. Because these adjustments do not result from current period sales, we have reflected these separately from revenues on current period sales. Noncash and other costs consist of items such as stock-based compensation costs, start-up costs, LCM inventory adjustments, write-offs of equipment and/or unusual charges. They are removed from site production and delivery costs in the calculation of unit net cash costs. As discussed above, gold, molybdenum and other metal revenues at copper mines are reflected as credits against site production and delivery costs in the by-product method. The following schedules for our mining operations are presentations under both the by-product and co-product methods together with reconciliations to amounts reported in our consolidated financial statements.
Oil and Gas Product Revenues and Cash Production Costs per Unit
Realized revenues and cash production costs per unit are measures intended to provide investors with information about the cash operating margin of our oil and gas operations. We use this measure for the same purpose and for monitoring operating performance by our oil and gas operations. This information differs from measures of performance determined in accordance with U.S. GAAP and should not be considered in isolation or as a substitute for measures of performance determined in accordance with U.S. GAAP. Our measures may not be comparable to similarly titled measures reported by other companies.
We show revenue adjustments from derivative contracts as separate line items. Because these adjustments do not result from oil and gas sales, these gains and losses have been reflected separately from revenues on current period sales. Additionally, accretion charges for asset retirement obligations and other costs are removed from production and delivery costs in the calculation of cash production costs per BOE. The following schedules include calculations of oil and gas product revenues and cash production costs together with a reconciliation to amounts reported in our consolidated financial statements.
67
North America Copper Mines Product Revenues, Production Costs and Unit Net Cash Costs
Three Months Ended June 30, 2015 | |||||||||||||||||||
(In millions) | By-Product | Co-Product Method | |||||||||||||||||
Method | Copper | Molybdenuma | Otherb | Total | |||||||||||||||
Revenues, excluding adjustments | $ | 1,341 | $ | 1,341 | $ | 80 | $ | 28 | $ | 1,449 | |||||||||
Site production and delivery, before net noncash and other costs shown below | 862 | 804 | 64 | 22 | 890 | ||||||||||||||
By-product credits | (80 | ) | — | — | — | — | |||||||||||||
Treatment charges | 60 | 58 | — | 2 | 60 | ||||||||||||||
Net cash costs | 842 | 862 | 64 | 24 | 950 | ||||||||||||||
Depreciation, depletion and amortization | 137 | 129 | 5 | 3 | 137 | ||||||||||||||
Noncash and other costs, net | 46 | c | 45 | 1 | — | 46 | |||||||||||||
Total costs | 1,025 | 1,036 | 70 | 27 | 1,133 | ||||||||||||||
Revenue adjustments, primarily for pricing on prior period open sales | (13 | ) | (13 | ) | — | — | (13 | ) | |||||||||||
Gross profit | $ | 303 | $ | 292 | $ | 10 | $ | 1 | $ | 303 | |||||||||
Copper sales (millions of recoverable pounds) | 485 | 485 | |||||||||||||||||
Molybdenum sales (millions of recoverable pounds)a | 10 | ||||||||||||||||||
Gross profit per pound of copper/molybdenum: | |||||||||||||||||||
Revenues, excluding adjustments | $ | 2.77 | $ | 2.77 | $ | 7.80 | |||||||||||||
Site production and delivery, before net noncash and other costs shown below | 1.78 | 1.66 | 6.24 | ||||||||||||||||
By-product credits | (0.16 | ) | — | — | |||||||||||||||
Treatment charges | 0.12 | 0.12 | — | ||||||||||||||||
Unit net cash costs | 1.74 | 1.78 | 6.24 | ||||||||||||||||
Depreciation, depletion and amortization | 0.28 | 0.27 | 0.53 | ||||||||||||||||
Noncash and other costs, net | 0.10 | c | 0.09 | 0.06 | |||||||||||||||
Total unit costs | 2.12 | 2.14 | 6.83 | ||||||||||||||||
Revenue adjustments, primarily for pricing | |||||||||||||||||||
on prior period open sales | (0.03 | ) | (0.03 | ) | — | ||||||||||||||
Gross profit per pound | $ | 0.62 | $ | 0.60 | $ | 0.97 | |||||||||||||
Reconciliation to Amounts Reported | |||||||||||||||||||
(In millions) | Revenues | Production and Delivery | Depreciation, Depletion and Amortization | ||||||||||||||||
Totals presented above | $ | 1,449 | $ | 890 | $ | 137 | |||||||||||||
Treatment charges | — | 60 | c | — | |||||||||||||||
Noncash and other costs, net | — | 46 | — | ||||||||||||||||
Revenue adjustments, primarily for pricing on prior period open sales | (13 | ) | — | — | |||||||||||||||
Eliminations and other | (31 | ) | (34 | ) | 2 | ||||||||||||||
North America copper mines | 1,405 | 962 | 139 | ||||||||||||||||
Other mining & eliminationsd | 2,274 | 1,603 | 263 | ||||||||||||||||
Total mining | 3,679 | 2,565 | 402 | ||||||||||||||||
U.S. oil & gas operations | 569 | 281 | 3,171 | e | |||||||||||||||
Corporate, other & eliminations | — | 2 | 3 | ||||||||||||||||
As reported in FCX’s consolidated financial statements | $ | 4,248 | $ | 2,848 | $ | 3,576 | e | ||||||||||||
a. | Reflects sales of molybdenum produced by certain of the North America copper mines to our molybdenum sales company at market-based pricing. |
b. | Includes gold and silver product revenues and production costs. |
c. | Includes charges totaling $11 million ($0.02 per pound) for LCM inventory adjustments. |
d. | Represents the combined total for all other mining operations and the related eliminations, as presented in Note 10. |
e. | Includes impairment of oil and gas properties of $2.7 billion. |
68
North America Copper Mines Product Revenues, Production Costs and Unit Net Cash Costs (continued)
Three Months Ended June 30, 2014 | |||||||||||||||||||
(In millions) | By-Product | Co-Product Method | |||||||||||||||||
Method | Copper | Molybdenuma | Otherb | Total | |||||||||||||||
Revenues, excluding adjustments | $ | 1,332 | $ | 1,332 | $ | 112 | $ | 30 | $ | 1,474 | |||||||||
Site production and delivery, before net noncash and other costs shown below | 786 | 733 | 60 | 19 | 812 | ||||||||||||||
By-product credits | (116 | ) | — | — | — | — | |||||||||||||
Treatment charges | 46 | 45 | — | 1 | 46 | ||||||||||||||
Net cash costs | 716 | 778 | 60 | 20 | 858 | ||||||||||||||
Depreciation, depletion and amortization | 125 | 117 | 6 | 2 | 125 | ||||||||||||||
Noncash and other costs, net | 29 | 29 | — | — | 29 | ||||||||||||||
Total costs | 870 | 924 | 66 | 22 | 1,012 | ||||||||||||||
Revenue adjustments, primarily for pricing on prior period open sales | 9 | 9 | — | — | 9 | ||||||||||||||
Gross profit | $ | 471 | $ | 417 | $ | 46 | $ | 8 | $ | 471 | |||||||||
Copper sales (millions of recoverable pounds) | 421 | 421 | |||||||||||||||||
Molybdenum sales (millions of recoverable pounds)a | 9 | ||||||||||||||||||
Gross profit per pound of copper/molybdenum: | |||||||||||||||||||
Revenues, excluding adjustments | $ | 3.16 | $ | 3.16 | $ | 12.49 | |||||||||||||
Site production and delivery, before net noncash and other costs shown below | 1.87 | 1.74 | 6.73 | ||||||||||||||||
By-product credits | (0.28 | ) | — | — | |||||||||||||||
Treatment charges | 0.11 | 0.11 | — | ||||||||||||||||
Unit net cash costs | 1.70 | 1.85 | 6.73 | ||||||||||||||||
Depreciation, depletion and amortization | 0.30 | 0.28 | 0.64 | ||||||||||||||||
Noncash and other costs, net | 0.07 | 0.06 | 0.05 | ||||||||||||||||
Total unit costs | 2.07 | 2.19 | 7.42 | ||||||||||||||||
Revenue adjustments, primarily for pricing | |||||||||||||||||||
on prior period open sales | 0.02 | 0.02 | — | ||||||||||||||||
Gross profit per pound | $ | 1.11 | $ | 0.99 | $ | 5.07 | |||||||||||||
Reconciliation to Amounts Reported | |||||||||||||||||||
(In millions) | Revenues | Production and Delivery | Depreciation, Depletion and Amortization | ||||||||||||||||
Totals presented above | $ | 1,474 | $ | 812 | $ | 125 | |||||||||||||
Treatment charges | — | 46 | — | ||||||||||||||||
Noncash and other costs, net | — | 29 | — | ||||||||||||||||
Revenue adjustments, primarily for pricing on prior period open sales | 9 | — | — | ||||||||||||||||
Eliminations and other | (14 | ) | (17 | ) | 3 | ||||||||||||||
North America copper mines | 1,469 | 870 | 128 | ||||||||||||||||
Other mining & eliminationsc | 2,817 | 1,884 | 266 | ||||||||||||||||
Total mining | 4,286 | 2,754 | 394 | ||||||||||||||||
U.S. oil & gas operations | 1,236 | 329 | 616 | ||||||||||||||||
Corporate, other & eliminations | — | (1 | ) | 3 | |||||||||||||||
As reported in FCX’s consolidated financial statements | $ | 5,522 | $ | 3,082 | $ | 1,013 | |||||||||||||
a. | Reflects sales of molybdenum produced by certain of the North America copper mines to our molybdenum sales company at market-based pricing. |
b. | Includes gold and silver product revenues and production costs. |
c. | Represents the combined total for all other mining operations and the related eliminations, as presented in Note 10. |
69
North America Copper Mines Product Revenues, Production Costs and Unit Net Cash Costs (continued)
Six Months Ended June 30, 2015 | |||||||||||||||||||
(In millions) | By-Product | Co-Product Method | |||||||||||||||||
Method | Copper | Molybdenuma | Otherb | Total | |||||||||||||||
Revenues, excluding adjustments | $ | 2,612 | $ | 2,612 | $ | 162 | $ | 54 | $ | 2,828 | |||||||||
Site production and delivery, before net noncash and other costs shown below | 1,715 | 1,605 | 122 | 41 | 1,768 | ||||||||||||||
By-product credits | (163 | ) | — | — | — | — | |||||||||||||
Treatment charges | 121 | 118 | — | 3 | 121 | ||||||||||||||
Net cash costs | 1,673 | 1,723 | 122 | 44 | 1,889 | ||||||||||||||
Depreciation, depletion and amortization | 270 | 254 | 11 | 5 | 270 | ||||||||||||||
Noncash and other costs, net | 77 | c | 76 | 1 | — | 77 | |||||||||||||
Total costs | 2,020 | 2,053 | 134 | 49 | 2,236 | ||||||||||||||
Revenue adjustments, primarily for pricing on prior period open sales | (28 | ) | (28 | ) | — | — | (28 | ) | |||||||||||
Gross profit | $ | 564 | $ | 531 | $ | 28 | $ | 5 | $ | 564 | |||||||||
Copper sales (millions of recoverable pounds) | 956 | 956 | |||||||||||||||||
Molybdenum sales (millions of recoverable pounds)a | 19 | ||||||||||||||||||
Gross profit per pound of copper/molybdenum: | |||||||||||||||||||
Revenues, excluding adjustments | $ | 2.73 | $ | 2.73 | $ | 8.28 | |||||||||||||
Site production and delivery, before net noncash | |||||||||||||||||||
and other costs shown below | 1.79 | 1.68 | 6.24 | ||||||||||||||||
By-product credits | (0.17 | ) | — | — | |||||||||||||||
Treatment charges | 0.13 | 0.12 | — | ||||||||||||||||
Unit net cash costs | 1.75 | 1.80 | 6.24 | ||||||||||||||||
Depreciation, depletion and amortization | 0.28 | 0.27 | 0.58 | ||||||||||||||||
Noncash and other costs, net | 0.08 | c | 0.08 | 0.06 | |||||||||||||||
Total unit costs | 2.11 | 2.15 | 6.88 | ||||||||||||||||
Revenue adjustments, primarily for pricing | |||||||||||||||||||
on prior period open sales | (0.03 | ) | (0.03 | ) | — | ||||||||||||||
Gross profit per pound | $ | 0.59 | $ | 0.55 | $ | 1.40 | |||||||||||||
Reconciliation to Amounts Reported | |||||||||||||||||||
(In millions) | Revenues | Production and Delivery | Depreciation, Depletion and Amortization | ||||||||||||||||
Totals presented above | $ | 2,828 | $ | 1,768 | $ | 270 | |||||||||||||
Treatment charges | — | 121 | — | ||||||||||||||||
Noncash and other costs, net | — | 77 | c | — | |||||||||||||||
Revenue adjustments, primarily for pricing on prior period open sales | (28 | ) | — | — | |||||||||||||||
Eliminations and other | (60 | ) | (61 | ) | 2 | ||||||||||||||
North America copper mines | 2,740 | 1,905 | 272 | ||||||||||||||||
Other mining & eliminationsd | 4,592 | 3,286 | 535 | ||||||||||||||||
Total mining | 7,332 | 5,191 | 807 | ||||||||||||||||
U.S. oil & gas operations | 1,069 | 564 | 6,805 | e | |||||||||||||||
Corporate, other & eliminations | — | 5 | 7 | ||||||||||||||||
As reported in FCX’s consolidated financial statements | $ | 8,401 | $ | 5,760 | $ | 7,619 | e | ||||||||||||
a. | Reflects sales of molybdenum produced by certain of the North America copper mines to our molybdenum sales company at market-based pricing. |
b. | Includes gold and silver product revenues and production costs. |
c. | Includes charges totaling $11 million ($0.01 per pound) for LCM inventory adjustments. |
d. | Represents the combined total for all other mining operations and the related eliminations, as presented in Note 10. |
e. | Includes impairment of oil and gas properties of $5.8 billion. |
70
North America Copper Mines Product Revenues, Production Costs and Unit Net Cash Costs (continued)
Six Months Ended June 30, 2014 | |||||||||||||||||||
(In millions) | By-Product | Co-Product Method | |||||||||||||||||
Method | Copper | Molybdenuma | Otherb | Total | |||||||||||||||
Revenues, excluding adjustments | $ | 2,535 | $ | 2,535 | $ | 194 | $ | 59 | $ | 2,788 | |||||||||
Site production and delivery, before net noncash and other costs shown below | 1,481 | 1,388 | 110 | 38 | 1,536 | ||||||||||||||
By-product credits | (198 | ) | — | — | — | — | |||||||||||||
Treatment charges | 93 | 91 | — | 2 | 93 | ||||||||||||||
Net cash costs | 1,376 | 1,479 | 110 | 40 | 1,629 | ||||||||||||||
Depreciation, depletion and amortization | 229 | 217 | 10 | 2 | 229 | ||||||||||||||
Noncash and other costs, net | 59 | 58 | — | 1 | 59 | ||||||||||||||
Total costs | 1,664 | 1,754 | 120 | 43 | 1,917 | ||||||||||||||
Revenue adjustments, primarily for pricing on prior period open sales | (7 | ) | (7 | ) | — | — | (7 | ) | |||||||||||
Gross profit | $ | 864 | $ | 774 | $ | 74 | $ | 16 | $ | 864 | |||||||||
Copper sales (millions of recoverable pounds) | 790 | 790 | |||||||||||||||||
Molybdenum sales (millions of recoverable pounds)a | 17 | ||||||||||||||||||
Gross profit per pound of copper/molybdenum: | |||||||||||||||||||
Revenues, excluding adjustments | $ | 3.21 | $ | 3.21 | $ | 11.39 | |||||||||||||
Site production and delivery, before net noncash | |||||||||||||||||||
and other costs shown below | 1.87 | 1.76 | 6.45 | ||||||||||||||||
By-product credits | (0.25 | ) | — | — | |||||||||||||||
Treatment charges | 0.12 | 0.12 | — | ||||||||||||||||
Unit net cash costs | 1.74 | 1.88 | 6.45 | ||||||||||||||||
Depreciation, depletion and amortization | 0.29 | 0.27 | 0.58 | ||||||||||||||||
Noncash and other costs, net | 0.08 | 0.07 | 0.04 | ||||||||||||||||
Total unit costs | 2.11 | 2.22 | 7.07 | ||||||||||||||||
Revenue adjustments, primarily for pricing | |||||||||||||||||||
on prior period open sales | (0.01 | ) | (0.01 | ) | — | ||||||||||||||
Gross profit per pound | $ | 1.09 | $ | 0.98 | $ | 4.32 | |||||||||||||
Reconciliation to Amounts Reported | |||||||||||||||||||
(In millions) | Revenues | Production and Delivery | Depreciation, Depletion and Amortization | ||||||||||||||||
Totals presented above | $ | 2,788 | $ | 1,536 | $ | 229 | |||||||||||||
Treatment charges | — | 93 | — | ||||||||||||||||
Noncash and other costs, net | — | 59 | — | ||||||||||||||||
Revenue adjustments, primarily for pricing on prior period open sales | (7 | ) | — | — | |||||||||||||||
Eliminations and other | (26 | ) | (32 | ) | 6 | ||||||||||||||
North America copper mines | 2,755 | 1,656 | 235 | ||||||||||||||||
Other mining & eliminationsc | 5,255 | 3,524 | 505 | ||||||||||||||||
Total mining | 8,010 | 5,180 | 740 | ||||||||||||||||
U.S. oil & gas operations | 2,497 | 640 | 1,232 | ||||||||||||||||
Corporate, other & eliminations | — | (1 | ) | 7 | |||||||||||||||
As reported in FCX’s consolidated financial statements | $ | 10,507 | $ | 5,819 | $ | 1,979 | |||||||||||||
a. | Reflects sales of molybdenum produced by certain of the North America copper mines to our molybdenum sales company at market-based pricing. |
b. | Includes gold and silver product revenues and production costs. |
c. | Represents the combined total for all other mining operations and the related eliminations, as presented in Note 10. |
71
South America Mining Product Revenues, Production Costs and Unit Net Cash Costs
Three Months Ended June 30, 2015 | |||||||||||||||
(In millions) | By-Product | Co-Product Method | |||||||||||||
Method | Copper | Othera | Total | ||||||||||||
Revenues, excluding adjustments | $ | 479 | $ | 479 | $ | 14 | $ | 493 | |||||||
Site production and delivery, before net noncash and other costs shown below | 314 | 305 | 15 | 320 | |||||||||||
By-product credits | (8 | ) | — | — | — | ||||||||||
Treatment charges | 30 | 30 | — | 30 | |||||||||||
Royalty on metals | 1 | 1 | — | 1 | |||||||||||
Net cash costs | 337 | 336 | 15 | 351 | |||||||||||
Depreciation, depletion and amortization | 72 | 70 | 2 | 72 | |||||||||||
Noncash and other (credits) costs, net | (4 | ) | (5 | ) | 1 | (4 | ) | ||||||||
Total costs | 405 | 401 | 18 | 419 | |||||||||||
Revenue adjustments, primarily for pricing on prior period open sales | (8 | ) | (8 | ) | — | (8 | ) | ||||||||
Gross profit (loss) | $ | 66 | $ | 70 | $ | (4 | ) | $ | 66 | ||||||
Copper sales (millions of recoverable pounds) | 178 | 178 | |||||||||||||
Gross profit per pound of copper: | |||||||||||||||
Revenues, excluding adjustments | $ | 2.69 | $ | 2.69 | |||||||||||
Site production and delivery, before net noncash and other costs shown below | 1.77 | 1.72 | |||||||||||||
By-product credits | (0.04 | ) | — | ||||||||||||
Treatment charges | 0.17 | 0.17 | |||||||||||||
Royalty on metals | — | — | |||||||||||||
Unit net cash costs | 1.90 | 1.89 | |||||||||||||
Depreciation, depletion and amortization | 0.40 | 0.39 | |||||||||||||
Noncash and other (credits) costs, net | (0.02 | ) | (0.03 | ) | |||||||||||
Total unit costs | 2.28 | 2.25 | |||||||||||||
Revenue adjustments, primarily for pricing | |||||||||||||||
on prior period open sales | (0.05 | ) | (0.05 | ) | |||||||||||
Gross profit per pound | $ | 0.36 | $ | 0.39 | |||||||||||
Reconciliation to Amounts Reported | |||||||||||||||
(In millions) | Revenues | Production and Delivery | Depreciation, Depletion and Amortization | ||||||||||||
Totals presented above | $ | 493 | $ | 320 | $ | 72 | |||||||||
Treatment charges | (30 | ) | — | — | |||||||||||
Royalty on metals | (1 | ) | — | — | |||||||||||
Noncash and other (credits) costs, net | — | (4 | ) | — | |||||||||||
Revenue adjustments, primarily for pricing on prior period open sales | (8 | ) | — | — | |||||||||||
Eliminations and other | (1 | ) | (1 | ) | — | ||||||||||
South America mining | 453 | 315 | 72 | ||||||||||||
Other mining & eliminationsb | 3,226 | 2,250 | 330 | ||||||||||||
Total mining | 3,679 | 2,565 | 402 | ||||||||||||
U.S. oil & gas operations | 569 | 281 | 3,171 | c | |||||||||||
Corporate, other & eliminations | — | 2 | 3 | ||||||||||||
As reported in FCX’s consolidated financial statements | $ | 4,248 | $ | 2,848 | $ | 3,576 | c | ||||||||
a. | Includes silver sales of 373 thousand ounces ($15.15 per ounce average realized price). Also reflects sales of molybdenum produced by Cerro Verde to our molybdenum sales company at market-based pricing. |
b. | Represents the combined total for all other mining operations and the related eliminations, as presented in Note 10. |
c. | Includes impairment of oil and gas properties of $2.7 billion. |
72
South America Mining Product Revenues, Production Costs and Unit Net Cash Costs (continued)
Three Months Ended June 30, 2014 | |||||||||||||||
(In millions) | By-Product | Co-Product Method | |||||||||||||
Method | Copper | Othera | Total | ||||||||||||
Revenues, excluding adjustments | $ | 984 | $ | 984 | $ | 75 | $ | 1,059 | |||||||
Site production and delivery, before net noncash and other costs shown below | 511 | 474 | 41 | 515 | |||||||||||
By-product credits | (71 | ) | — | — | — | ||||||||||
Treatment charges | 55 | 55 | — | 55 | |||||||||||
Royalty on metals | 3 | 3 | — | 3 | |||||||||||
Net cash costs | 498 | b | 532 | 41 | 573 | ||||||||||
Depreciation, depletion and amortization | 95 | 90 | 5 | 95 | |||||||||||
Noncash and other costs, net | 23 | 19 | 4 | 23 | |||||||||||
Total costs | 616 | 641 | 50 | 691 | |||||||||||
Revenue adjustments, primarily for pricing on prior period open sales | 32 | 32 | — | 32 | |||||||||||
Gross profit | $ | 400 | $ | 375 | $ | 25 | $ | 400 | |||||||
Copper sales (millions of recoverable pounds) | 310 | b | 310 | ||||||||||||
Gross profit per pound of copper: | |||||||||||||||
Revenues, excluding adjustments | $ | 3.17 | $ | 3.17 | |||||||||||
Site production and delivery, before net noncash and other costs shown below | 1.64 | 1.52 | |||||||||||||
By-product credits | (0.23 | ) | — | ||||||||||||
Treatment charges | 0.18 | 0.18 | |||||||||||||
Royalty on metals | 0.01 | 0.01 | |||||||||||||
Unit net cash costs | 1.60 | b | 1.71 | ||||||||||||
Depreciation, depletion and amortization | 0.30 | 0.29 | |||||||||||||
Noncash and other costs, net | 0.08 | 0.06 | |||||||||||||
Total unit costs | 1.98 | 2.06 | |||||||||||||
Revenue adjustments, primarily for pricing | |||||||||||||||
on prior period open sales | 0.10 | 0.10 | |||||||||||||
Gross profit per pound | $ | 1.29 | $ | 1.21 | |||||||||||
Reconciliation to Amounts Reported | |||||||||||||||
(In millions) | Revenues | Production and Delivery | Depreciation, Depletion and Amortization | ||||||||||||
Totals presented above | $ | 1,059 | $ | 515 | $ | 95 | |||||||||
Treatment charges | (55 | ) | — | — | |||||||||||
Royalty on metals | (3 | ) | — | — | |||||||||||
Noncash and other costs, net | — | 23 | — | ||||||||||||
Revenue adjustments, primarily for pricing on prior period open sales | 32 | — | — | ||||||||||||
Eliminations and other | (2 | ) | (8 | ) | — | ||||||||||
South America mining | 1,031 | 530 | 95 | ||||||||||||
Other mining & eliminationsc | 3,255 | 2,224 | 299 | ||||||||||||
Total mining | 4,286 | 2,754 | 394 | ||||||||||||
U.S. oil & gas operations | 1,236 | 329 | 616 | ||||||||||||
Corporate, other & eliminations | — | (1 | ) | 3 | |||||||||||
As reported in FCX’s consolidated financial statements | $ | 5,522 | $ | 3,082 | $ | 1,013 | |||||||||
a. | Includes gold sales of 20 thousand ounces ($1,302 per ounce average realized price) and silver sales of 748 thousand ounces ($18.83 per ounce average realized price). Also reflects sales of molybdenum produced by Cerro Verde to our molybdenum sales company at market-based pricing. |
b.Following is a reconciliation of South America mining's second-quarter 2014 unit net cash costs, excluding the Candelaria and Ojos del Salado mines:
Net Cash Costs (in millions) | Copper Sales (millions of recoverable pounds) | Unit Net Cash Costs (per pound of copper) | |||||||||
Presented above | $ | 498 | 310 | $ | 1.60 | ||||||
Less: Candelaria and Ojos del Salado | 140 | 80 | |||||||||
$ | 358 | 230 | $ | 1.55 | |||||||
c. | Represents the combined total for all other mining operations and the related eliminations, as presented in Note 10. |
73
South America Mining Product Revenues, Production Costs and Unit Net Cash Costs (continued)
Six Months Ended June 30, 2015 | |||||||||||||||
(In millions) | By-Product | Co-Product Method | |||||||||||||
Method | Copper | Othera | Total | ||||||||||||
Revenues, excluding adjustments | $ | 1,013 | $ | 1,013 | $ | 35 | $ | 1,048 | |||||||
Site production and delivery, before net noncash and other costs shown below | 664 | 642 | 33 | 675 | |||||||||||
By-product credits | (24 | ) | — | — | — | ||||||||||
Treatment charges | 64 | 64 | — | 64 | |||||||||||
Royalty on metals | 1 | 1 | — | 1 | |||||||||||
Net cash costs | 705 | 707 | 33 | 740 | |||||||||||
Depreciation, depletion and amortization | 147 | 143 | 4 | 147 | |||||||||||
Noncash and other costs, net | — | — | — | — | |||||||||||
Total costs | 852 | 850 | 37 | 887 | |||||||||||
Revenue adjustments, primarily for pricing on prior period open sales | (31 | ) | (31 | ) | — | (31 | ) | ||||||||
Gross profit (loss) | $ | 130 | $ | 132 | $ | (2 | ) | $ | 130 | ||||||
Copper sales (millions of recoverable pounds) | 378 | 378 | |||||||||||||
Gross profit per pound of copper: | |||||||||||||||
Revenues, excluding adjustments | $ | 2.68 | $ | 2.68 | |||||||||||
Site production and delivery, before net noncash | |||||||||||||||
and other costs shown below | 1.76 | 1.70 | |||||||||||||
By-product credits | (0.06 | ) | — | ||||||||||||
Treatment charges | 0.17 | 0.17 | |||||||||||||
Royalty on metals | — | — | |||||||||||||
Unit net cash costs | 1.87 | 1.87 | |||||||||||||
Depreciation, depletion and amortization | 0.39 | 0.38 | |||||||||||||
Noncash and other costs, net | — | — | |||||||||||||
Total unit costs | 2.26 | 2.25 | |||||||||||||
Revenue adjustments, primarily for pricing | |||||||||||||||
on prior period open sales | (0.08 | ) | (0.08 | ) | |||||||||||
Gross profit per pound | $ | 0.34 | $ | 0.35 | |||||||||||
Reconciliation to Amounts Reported | |||||||||||||||
(In millions) | Revenues | Production and Delivery | Depreciation, Depletion and Amortization | ||||||||||||
Totals presented above | $ | 1,048 | $ | 675 | $ | 147 | |||||||||
Treatment charges | (64 | ) | — | — | |||||||||||
Royalty on metals | (1 | ) | — | — | |||||||||||
Noncash and other costs, net | — | — | — | ||||||||||||
Revenue adjustments, primarily for pricing on prior period open sales | (31 | ) | — | — | |||||||||||
Eliminations and other | (13 | ) | (15 | ) | — | ||||||||||
South America mining | 939 | 660 | 147 | ||||||||||||
Other mining & eliminationsb | 6,393 | 4,531 | 660 | ||||||||||||
Total mining | 7,332 | 5,191 | 807 | ||||||||||||
U.S. oil & gas operations | 1,069 | 564 | 6,805 | c | |||||||||||
Corporate, other & eliminations | — | 5 | 7 | ||||||||||||
As reported in FCX’s consolidated financial statements | $ | 8,401 | $ | 5,760 | $ | 7,619 | c | ||||||||
a. | Includes silver sales of 759 thousand ounces ($14.97 per ounce average realized price). Also reflects sales of molybdenum produced by Cerro Verde to our molybdenum sales company at market-based pricing. |
b. | Represents the combined total for all other mining operations and the related eliminations, as presented in Note 10. |
c. | Includes impairment of oil and gas properties of $5.8 billion. |
74
South America Mining Product Revenues, Production Costs and Unit Net Cash Costs (continued)
Six Months Ended June 30, 2014 | |||||||||||||||
(In millions) | By-Product | Co-Product Method | |||||||||||||
Method | Copper | Othera | Total | ||||||||||||
Revenues, excluding adjustments | $ | 1,951 | $ | 1,951 | $ | 159 | $ | 2,110 | |||||||
Site production and delivery, before net noncash and other costs shown below | 972 | 900 | 81 | 981 | |||||||||||
By-product credits | (150 | ) | — | — | — | ||||||||||
Treatment charges | 108 | 108 | — | 108 | |||||||||||
Royalty on metals | 3 | 3 | — | 3 | |||||||||||
Net cash costs | 933 | b | 1,011 | 81 | 1,092 | ||||||||||
Depreciation, depletion and amortization | 182 | 170 | 12 | 182 | |||||||||||
Noncash and other costs, net | 40 | 38 | 2 | 40 | |||||||||||
Total costs | 1,155 | 1,219 | 95 | 1,314 | |||||||||||
Revenue adjustments, primarily for pricing on prior period open sales | (67 | ) | (67 | ) | — | (67 | ) | ||||||||
Gross profit | $ | 729 | $ | 665 | $ | 64 | $ | 729 | |||||||
Copper sales (millions of recoverable pounds) | 617 | b | 617 | ||||||||||||
Gross profit per pound of copper: | |||||||||||||||
Revenues, excluding adjustments | $ | 3.16 | $ | 3.16 | |||||||||||
Site production and delivery, before net noncash | |||||||||||||||
and other costs shown below | 1.57 | 1.46 | |||||||||||||
By-product credits | (0.24 | ) | — | ||||||||||||
Treatment charges | 0.18 | 0.18 | |||||||||||||
Royalty on metals | — | — | |||||||||||||
Unit net cash costs | 1.51 | b | 1.64 | ||||||||||||
Depreciation, depletion and amortization | 0.29 | 0.27 | |||||||||||||
Noncash and other costs, net | 0.07 | 0.06 | |||||||||||||
Total unit costs | 1.87 | 1.97 | |||||||||||||
Revenue adjustments, primarily for pricing | |||||||||||||||
on prior period open sales | (0.11 | ) | (0.11 | ) | |||||||||||
Gross profit per pound | $ | 1.18 | $ | 1.08 | |||||||||||
Reconciliation to Amounts Reported | |||||||||||||||
(In millions) | Revenues | Production and Delivery | Depreciation, Depletion and Amortization | ||||||||||||
Totals presented above | $ | 2,110 | $ | 981 | $ | 182 | |||||||||
Treatment charges | (108 | ) | — | — | |||||||||||
Royalty on metals | (3 | ) | — | — | |||||||||||
Noncash and other costs, net | — | 40 | — | ||||||||||||
Revenue adjustments, primarily for pricing on prior period open sales | (67 | ) | — | — | |||||||||||
Eliminations and other | (3 | ) | (15 | ) | — | ||||||||||
South America mining | 1,929 | 1,006 | 182 | ||||||||||||
Other mining & eliminationsc | 6,081 | 4,174 | 558 | ||||||||||||
Total mining | 8,010 | 5,180 | 740 | ||||||||||||
U.S. oil & gas operations | 2,497 | 640 | 1,232 | ||||||||||||
Corporate, other & eliminations | — | (1 | ) | 7 | |||||||||||
As reported in FCX’s consolidated financial statements | $ | 10,507 | $ | 5,819 | $ | 1,979 | |||||||||
a. | Includes gold sales of 43 thousand ounces ($1,302 per ounce average realized price) and silver sales of 1.5 million ounces ($19.34 per ounce average realized price). Also reflects sales of molybdenum produced by Cerro Verde to our molybdenum sales company at market-based pricing. |
b. | Following is a reconciliation of South America mining's unit net cash costs for the first six months of 2014, excluding the Candelaria and Ojos del Salado mines: |
Net Cash Costs (in millions) | Copper Sales (millions of recoverable pounds) | Unit Net Cash Costs (per pound of copper) | |||||||||
Presented above | $ | 933 | 617 | $ | 1.51 | ||||||
Less: Candelaria and Ojos del Salado | 263 | 174 | |||||||||
$ | 670 | 443 | $ | 1.51 | |||||||
c. Represents the combined total for all other mining operations and the related eliminations, as presented in Note 10.
75
Indonesia Mining Product Revenues, Production Costs and Unit Net Cash Costs
Three Months Ended June 30, 2015 | |||||||||||||||||||
(In millions) | By-Product | Co-Product Method | |||||||||||||||||
Method | Copper | Gold | Silvera | Total | |||||||||||||||
Revenues, excluding adjustments | $ | 511 | $ | 511 | $ | 406 | $ | 8 | $ | 925 | |||||||||
Site production and delivery, before net noncash and other costs shown below | 442 | 244 | 194 | 4 | 442 | ||||||||||||||
Gold and silver credits | (416 | ) | — | — | — | — | |||||||||||||
Treatment charges | 62 | 34 | 27 | 1 | 62 | ||||||||||||||
Export duties | 36 | 20 | 16 | — | 36 | ||||||||||||||
Royalty on metals | 35 | 19 | 16 | — | 35 | ||||||||||||||
Net cash costs | 159 | 317 | 253 | 5 | 575 | ||||||||||||||
Depreciation and amortization | 78 | 43 | 34 | 1 | 78 | ||||||||||||||
Noncash and other costs, net | 8 | 5 | 3 | — | 8 | ||||||||||||||
Total costs | 245 | 365 | 290 | 6 | 661 | ||||||||||||||
Revenue adjustments, primarily for pricing on prior period open sales | (4 | ) | (4 | ) | 2 | — | (2 | ) | |||||||||||
PT Smelting intercompany loss | (5 | ) | (3 | ) | (2 | ) | — | (5 | ) | ||||||||||
Gross profit | $ | 257 | $ | 139 | $ | 116 | $ | 2 | $ | 257 | |||||||||
Copper sales (millions of recoverable pounds) | 196 | 196 | |||||||||||||||||
Gold sales (thousands of recoverable ounces) | 346 | ||||||||||||||||||
Gross profit per pound of copper/per ounce of gold: | |||||||||||||||||||
Revenues, excluding adjustments | $ | 2.61 | $ | 2.61 | $ | 1,173 | |||||||||||||
Site production and delivery, before net noncash and other costs shown below | 2.26 | 1.25 | 560 | ||||||||||||||||
Gold and silver credits | (2.13 | ) | — | — | |||||||||||||||
Treatment charges | 0.32 | 0.18 | 79 | ||||||||||||||||
Export duties | 0.18 | 0.10 | 45 | ||||||||||||||||
Royalty on metals | 0.18 | 0.10 | 45 | ||||||||||||||||
Unit net cash costs | 0.81 | 1.63 | 729 | ||||||||||||||||
Depreciation and amortization | 0.40 | 0.22 | 100 | ||||||||||||||||
Noncash and other costs, net | 0.04 | 0.02 | 10 | ||||||||||||||||
Total unit costs | 1.25 | 1.87 | 839 | ||||||||||||||||
Revenue adjustments, primarily for pricing | |||||||||||||||||||
on prior period open sales | (0.02 | ) | (0.02 | ) | 7 | ||||||||||||||
PT Smelting intercompany loss | (0.02 | ) | (0.01 | ) | (5 | ) | |||||||||||||
Gross profit per pound/ounce | $ | 1.32 | $ | 0.71 | $ | 336 | |||||||||||||
Reconciliation to Amounts Reported | |||||||||||||||||||
(In millions) | Revenues | Production and Delivery | Depreciation, Depletion and Amortization | ||||||||||||||||
Totals presented above | $ | 925 | $ | 442 | $ | 78 | |||||||||||||
Treatment charges | (62 | ) | — | — | |||||||||||||||
Export duties | (36 | ) | — | — | |||||||||||||||
Royalty on metals | (35 | ) | — | — | |||||||||||||||
Noncash and other costs, net | — | 8 | — | ||||||||||||||||
Revenue adjustments, primarily for pricing on prior period open sales | (2 | ) | — | — | |||||||||||||||
PT Smelting intercompany loss | — | 5 | — | ||||||||||||||||
Indonesia mining | 790 | 455 | 78 | ||||||||||||||||
Other mining & eliminationsb | 2,889 | 2,110 | 324 | ||||||||||||||||
Total mining | 3,679 | 2,565 | 402 | ||||||||||||||||
U.S. oil & gas operations | 569 | 281 | 3,171 | c | |||||||||||||||
Corporate, other & eliminations | — | 2 | 3 | ||||||||||||||||
As reported in FCX’s consolidated financial statements | $ | 4,248 | $ | 2,848 | $ | 3,576 | c | ||||||||||||
a. | Includes silver sales of 558 thousand ounces ($15.48 per ounce average realized price). |
b. | Represents the combined total for all other mining operations and the related eliminations, as presented in Note 10. |
c. | Includes impairment of oil and gas properties of $2.7 billion. |
76
Indonesia Mining Product Revenues, Production Costs and Unit Net Cash Costs (continued)
Three Months Ended June 30, 2014 | |||||||||||||||||||
(In millions) | By-Product | Co-Product Method | |||||||||||||||||
Method | Copper | Gold | Silvera | Total | |||||||||||||||
Revenues, excluding adjustments | $ | 372 | $ | 372 | $ | 176 | $ | 7 | $ | 555 | |||||||||
Site production and delivery, before net noncash and other costs shown below | 451 | 303 | 142 | 6 | 451 | ||||||||||||||
Gold and silver credits | (184 | ) | — | — | — | — | |||||||||||||
Treatment charges | 30 | 20 | 10 | — | 30 | ||||||||||||||
Royalty on metals | 14 | 9 | 5 | — | 14 | ||||||||||||||
Net cash costs | 311 | 332 | 157 | 6 | 495 | ||||||||||||||
Depreciation and amortization | 54 | 36 | 17 | 1 | 54 | ||||||||||||||
Noncash and other costs, net | 64 | b | 43 | 20 | 1 | 64 | |||||||||||||
Total costs | 429 | 411 | 194 | 8 | 613 | ||||||||||||||
Revenue adjustments, primarily for pricing on prior period open sales | 11 | 11 | 1 | — | 12 | ||||||||||||||
PT Smelting intercompany profit | 4 | 3 | 1 | — | 4 | ||||||||||||||
Gross loss | $ | (42 | ) | $ | (25 | ) | $ | (16 | ) | $ | (1 | ) | $ | (42 | ) | ||||
Copper sales (millions of recoverable pounds) | 117 | 117 | |||||||||||||||||
Gold sales (thousands of recoverable ounces) | 135 | ||||||||||||||||||
Gross profit per pound of copper/per ounce of gold: | |||||||||||||||||||
Revenues, excluding adjustments | $ | 3.19 | $ | 3.19 | $ | 1,294 | |||||||||||||
Site production and delivery, before net noncash and other costs shown below | 3.86 | 2.59 | 1,050 | ||||||||||||||||
Gold and silver credits | (1.57 | ) | — | — | |||||||||||||||
Treatment charges | 0.26 | 0.17 | 70 | ||||||||||||||||
Royalty on metals | 0.11 | 0.08 | 31 | ||||||||||||||||
Unit net cash costs | 2.66 | 2.84 | 1,151 | ||||||||||||||||
Depreciation and amortization | 0.47 | 0.31 | 127 | ||||||||||||||||
Noncash and other costs, net | 0.55 | b | 0.37 | 151 | |||||||||||||||
Total unit costs | 3.68 | 3.52 | 1,429 | ||||||||||||||||
Revenue adjustments, primarily for pricing | |||||||||||||||||||
on prior period open sales | 0.09 | 0.09 | 5 | ||||||||||||||||
PT Smelting intercompany profit | 0.03 | 0.02 | 9 | ||||||||||||||||
Gross loss per pound/ounce | $ | (0.37 | ) | $ | (0.22 | ) | $ | (121 | ) | ||||||||||
Reconciliation to Amounts Reported | |||||||||||||||||||
(In millions) | Revenues | Production and Delivery | Depreciation, Depletion and Amortization | ||||||||||||||||
Totals presented above | $ | 555 | $ | 451 | $ | 54 | |||||||||||||
Treatment charges | (30 | ) | — | — | |||||||||||||||
Royalty on metals | (14 | ) | — | — | |||||||||||||||
Noncash and other costs, net | — | 64 | b | — | |||||||||||||||
Revenue adjustments, primarily for pricing on prior period open sales | 12 | — | — | ||||||||||||||||
PT Smelting intercompany profit | — | (4 | ) | — | |||||||||||||||
Indonesia mining | 523 | 511 | 54 | ||||||||||||||||
Other mining & eliminationsc | 3,763 | 2,243 | 340 | ||||||||||||||||
Total mining | 4,286 | 2,754 | 394 | ||||||||||||||||
U.S. oil & gas operations | 1,236 | 329 | 616 | ||||||||||||||||
Corporate, other & eliminations | — | (1 | ) | 3 | |||||||||||||||
As reported in FCX’s consolidated financial statements | $ | 5,522 | $ | 3,082 | $ | 1,013 | |||||||||||||
a. | Includes silver sales of 367 thousand ounces ($19.67 per ounce average realized price). |
b. | Includes $56 million ($0.48 per pound) of fixed costs charged directly to cost of sales as a result of the impact of export restrictions on PT-FI's operating rates. |
c. | Represents the combined total for all other mining operations and the related eliminations, as presented in Note 10. |
77
Indonesia Mining Product Revenues, Production Costs and Unit Net Cash Costs (continued)
Six Months Ended June 30, 2015 | |||||||||||||||||||
(In millions) | By-Product | Co-Product Method | |||||||||||||||||
Method | Copper | Gold | Silvera | Total | |||||||||||||||
Revenues, excluding adjustments | $ | 933 | $ | 933 | $ | 716 | $ | 16 | a | $ | 1,665 | ||||||||
Site production and delivery, before net noncash and other costs shown below | 882 | 494 | 380 | 8 | 882 | ||||||||||||||
Gold and silver credits | (741 | ) | — | — | — | — | |||||||||||||
Treatment charges | 108 | 61 | 46 | 1 | 108 | ||||||||||||||
Export duties | 57 | 32 | 24 | 1 | 57 | ||||||||||||||
Royalty on metals | 60 | 33 | 26 | 1 | 60 | ||||||||||||||
Net cash costs | 366 | 620 | 476 | 11 | 1,107 | ||||||||||||||
Depreciation and amortization | 148 | 83 | 64 | 1 | 148 | ||||||||||||||
Noncash and other costs, net | 14 | 8 | 6 | — | 14 | ||||||||||||||
Total costs | 528 | 711 | 546 | 12 | 1,269 | ||||||||||||||
Revenue adjustments, primarily for pricing on prior period open sales | (52 | ) | (52 | ) | 9 | — | (43 | ) | |||||||||||
PT Smelting intercompany profit | 2 | 2 | — | — | 2 | ||||||||||||||
Gross profit | $ | 355 | $ | 172 | $ | 179 | $ | 4 | $ | 355 | |||||||||
Copper sales (millions of recoverable pounds) | 351 | 351 | |||||||||||||||||
Gold sales (thousands of recoverable ounces) | 606 | ||||||||||||||||||
Gross profit per pound of copper/per ounce of gold: | |||||||||||||||||||
Revenues, excluding adjustments | $ | 2.66 | $ | 2.66 | $ | 1,183 | |||||||||||||
Site production and delivery, before net noncash | |||||||||||||||||||
and other costs shown below | 2.51 | 1.41 | 626 | ||||||||||||||||
Gold and silver credits | (2.11 | ) | — | — | |||||||||||||||
Treatment charges | 0.31 | 0.17 | 77 | ||||||||||||||||
Export duties | 0.16 | 0.09 | 41 | ||||||||||||||||
Royalty on metals | 0.17 | 0.10 | 42 | ||||||||||||||||
Unit net cash costs | 1.04 | 1.77 | 786 | ||||||||||||||||
Depreciation and amortization | 0.42 | 0.24 | 106 | ||||||||||||||||
Noncash and other costs, net | 0.04 | 0.02 | 10 | ||||||||||||||||
Total unit costs | 1.50 | 2.03 | 902 | ||||||||||||||||
Revenue adjustments, primarily for pricing | |||||||||||||||||||
on prior period open sales | (0.15 | ) | (0.15 | ) | 14 | ||||||||||||||
PT Smelting intercompany profit | 0.01 | 0.01 | 2 | ||||||||||||||||
Gross profit per pound/ounce | $ | 1.02 | $ | 0.49 | $ | 297 | |||||||||||||
Reconciliation to Amounts Reported | |||||||||||||||||||
(In millions) | Revenues | Production and Delivery | Depreciation, Depletion and Amortization | ||||||||||||||||
Totals presented above | $ | 1,665 | $ | 882 | $ | 148 | |||||||||||||
Treatment charges | (108 | ) | — | — | |||||||||||||||
Export duties | (57 | ) | — | — | |||||||||||||||
Royalty on metals | (60 | ) | — | — | |||||||||||||||
Noncash and other costs, net | — | 14 | — | ||||||||||||||||
Revenue adjustments, primarily for pricing on prior period open sales | (43 | ) | — | — | |||||||||||||||
PT Smelting intercompany profit | — | (2 | ) | — | |||||||||||||||
Indonesia mining | 1,397 | 894 | 148 | ||||||||||||||||
Other mining & eliminationsb | 5,935 | 4,297 | 659 | ||||||||||||||||
Total mining | 7,332 | 5,191 | 807 | ||||||||||||||||
U.S. oil & gas operations | 1,069 | 564 | 6,805 | c | |||||||||||||||
Corporate, other & eliminations | — | 5 | 7 | ||||||||||||||||
As reported in FCX’s consolidated financial statements | $ | 8,401 | $ | 5,760 | $ | 7,619 | c | ||||||||||||
a. | Includes silver sales of 993 thousand ounces ($15.75 per ounce average realized price). |
b. | Represents the combined total for all other mining operations and the related eliminations, as presented in Note 10. |
c. | Includes impairment of oil and gas properties of $5.8 billion. |
78
Indonesia Mining Product Revenues, Production Costs and Unit Net Cash Costs (continued)
Six Months Ended June 30, 2014 | |||||||||||||||||||
(In millions) | By-Product | Co-Product Method | |||||||||||||||||
Method | Copper | Gold | Silvera | Total | |||||||||||||||
Revenues, excluding adjustments | $ | 713 | $ | 713 | $ | 386 | $ | 14 | $ | 1,113 | |||||||||
Site production and delivery, before net noncash and other costs shown below | 814 | 521 | 283 | 10 | 814 | ||||||||||||||
Gold and silver credits | (419 | ) | — | — | — | — | |||||||||||||
Treatment charges | 56 | 36 | 19 | 1 | 56 | ||||||||||||||
Royalty on metals | 27 | 17 | 9 | 1 | 27 | ||||||||||||||
Net cash costs | 478 | 574 | 311 | 12 | 897 | ||||||||||||||
Depreciation and amortization | 102 | 65 | 36 | 1 | 102 | ||||||||||||||
Noncash and other costs, net | 138 | b | 88 | 48 | 2 | 138 | |||||||||||||
Total costs | 718 | 727 | 395 | 15 | 1,137 | ||||||||||||||
Revenue adjustments, primarily for pricing on prior period open sales | (56 | ) | (56 | ) | 18 | 1 | (37 | ) | |||||||||||
PT Smelting intercompany profit | 58 | 37 | 20 | 1 | 58 | ||||||||||||||
Gross (loss) profit | $ | (3 | ) | $ | (33 | ) | $ | 29 | $ | 1 | $ | (3 | ) | ||||||
Copper sales (millions of recoverable pounds) | 226 | 226 | |||||||||||||||||
Gold sales (thousands of recoverable ounces) | 297 | ||||||||||||||||||
Gross profit per pound of copper/per ounce of gold: | |||||||||||||||||||
Revenues, excluding adjustments | $ | 3.15 | $ | 3.15 | $ | 1,299 | |||||||||||||
Site production and delivery, before net noncash | |||||||||||||||||||
and other costs shown below | 3.60 | 2.31 | 950 | ||||||||||||||||
Gold and silver credits | (1.85 | ) | — | — | |||||||||||||||
Treatment charges | 0.25 | 0.16 | 65 | ||||||||||||||||
Royalty on metals | 0.12 | 0.07 | 31 | ||||||||||||||||
Unit net cash costs | 2.12 | 2.54 | 1,046 | ||||||||||||||||
Depreciation and amortization | 0.45 | 0.29 | 120 | ||||||||||||||||
Noncash and other costs, net | 0.61 | b | 0.39 | 161 | |||||||||||||||
Total unit costs | 3.18 | 3.22 | 1,327 | ||||||||||||||||
Revenue adjustments, primarily for pricing | |||||||||||||||||||
on prior period open sales | (0.24 | ) | (0.24 | ) | 59 | ||||||||||||||
PT Smelting intercompany profit | 0.26 | 0.16 | 68 | ||||||||||||||||
Gross (loss) profit per pound/ounce | $ | (0.01 | ) | $ | (0.15 | ) | $ | 99 | |||||||||||
Reconciliation to Amounts Reported | |||||||||||||||||||
(In millions) | Revenues | Production and Delivery | Depreciation, Depletion and Amortization | ||||||||||||||||
Totals presented above | $ | 1,113 | $ | 814 | $ | 102 | |||||||||||||
Treatment charges | (56 | ) | — | — | |||||||||||||||
Royalty on metals | (27 | ) | — | — | |||||||||||||||
Noncash and other costs, net | — | 138 | b | — | |||||||||||||||
Revenue adjustments, primarily for pricing on prior period open sales | (37 | ) | — | — | |||||||||||||||
PT Smelting intercompany profit | — | (58 | ) | — | |||||||||||||||
Indonesia mining | 993 | 894 | 102 | ||||||||||||||||
Other mining & eliminationsc | 7,017 | 4,286 | 638 | ||||||||||||||||
Total mining | 8,010 | 5,180 | 740 | ||||||||||||||||
U.S. oil & gas operations | 2,497 | 640 | 1,232 | ||||||||||||||||
Corporate, other & eliminations | — | (1 | ) | 7 | |||||||||||||||
As reported in FCX’s consolidated financial statements | $ | 10,507 | $ | 5,819 | $ | 1,979 | |||||||||||||
a. | Includes silver sales of 700 thousand ounces ($19.84 per ounce average realized price). |
b. | Includes $109 million ($0.48 per pound) of fixed costs charged directly to cost of sales as a result of the impact of export restrictions on PT-FI's operating rates. |
c. | Represents the combined total for all other mining operations and the related eliminations, as presented in Note 10. |
79
Africa Mining Product Revenues, Production Costs and Unit Net Cash Costs
Three Months Ended June 30, 2015 | |||||||||||||||
(In millions) | By-Product | Co-Product Method | |||||||||||||
Method | Copper | Cobalt | Total | ||||||||||||
Revenues, excluding adjustmentsa | $ | 275 | $ | 275 | $ | 76 | $ | 351 | |||||||
Site production and delivery, before net noncash and other costs shown below | 161 | 141 | 45 | 186 | |||||||||||
Cobalt creditsb | (55 | ) | — | — | — | ||||||||||
Royalty on metals | 6 | 5 | 1 | 6 | |||||||||||
Net cash costs | 112 | 146 | 46 | 192 | |||||||||||
Depreciation, depletion and amortization | 57 | 45 | 12 | 57 | |||||||||||
Noncash and other costs, net | 4 | 3 | 1 | 4 | |||||||||||
Total costs | 173 | 194 | 59 | 253 | |||||||||||
Revenue adjustments, primarily for pricing on prior period open sales | 2 | 2 | 4 | 6 | |||||||||||
Gross profit | $ | 104 | $ | 83 | $ | 21 | $ | 104 | |||||||
Copper sales (millions of recoverable pounds) | 104 | 104 | |||||||||||||
Cobalt sales (millions of contained pounds) | 8 | ||||||||||||||
Gross profit per pound of copper/cobalt: | |||||||||||||||
Revenues, excluding adjustmentsa | $ | 2.63 | $ | 2.63 | $ | 9.27 | |||||||||
Site production and delivery, before net noncash and other costs shown below | 1.54 | 1.35 | 5.48 | ||||||||||||
Cobalt creditsb | (0.53 | ) | — | — | |||||||||||
Royalty on metals | 0.06 | 0.05 | 0.16 | ||||||||||||
Unit net cash costs | 1.07 | 1.40 | 5.64 | ||||||||||||
Depreciation, depletion and amortization | 0.55 | 0.43 | 1.42 | ||||||||||||
Noncash and other costs, net | 0.03 | 0.03 | 0.10 | ||||||||||||
Total unit costs | 1.65 | 1.86 | 7.16 | ||||||||||||
Revenue adjustments, primarily for pricing | |||||||||||||||
on prior period open sales | 0.02 | 0.02 | 0.50 | ||||||||||||
Gross profit per pound | $ | 1.00 | $ | 0.79 | $ | 2.61 | |||||||||
Reconciliation to Amounts Reported | |||||||||||||||
(In millions) | Revenues | Production and Delivery | Depreciation, Depletion and Amortization | ||||||||||||
Totals presented above | $ | 351 | $ | 186 | $ | 57 | |||||||||
Royalty on metals | (6 | ) | — | — | |||||||||||
Noncash and other costs, net | — | 4 | — | ||||||||||||
Revenue adjustments, primarily for pricing on prior period open sales | 6 | — | — | ||||||||||||
Africa mining | 351 | 190 | 57 | ||||||||||||
Other mining & eliminationsc | 3,328 | 2,375 | 345 | ||||||||||||
Total mining | 3,679 | 2,565 | 402 | ||||||||||||
U.S. oil & gas operations | 569 | 281 | 3,171 | d | |||||||||||
Corporate, other & eliminations | — | 2 | 3 | ||||||||||||
As reported in FCX’s consolidated financial statements | $ | 4,248 | $ | 2,848 | $ | 3,576 | d | ||||||||
a. | Includes point-of-sale transportation costs as negotiated in customer contracts. |
b. | Net of cobalt downstream processing and freight costs. |
c. | Represents the combined total for all other mining operations and the related eliminations, as presented in Note 10. |
d. | Includes impairment of oil and gas properties of $2.7 billion. |
80
Africa Mining Product Revenues, Production Costs and Unit Net Cash Costs (continued)
Three Months Ended June 30, 2014 | |||||||||||||||
(In millions) | By-Product | Co-Product Method | |||||||||||||
Method | Copper | Cobalt | Total | ||||||||||||
Revenues, excluding adjustmentsa | $ | 362 | $ | 362 | $ | 65 | $ | 427 | |||||||
Site production and delivery, before net noncash and other costs shown below | 171 | 159 | 35 | 194 | |||||||||||
Cobalt creditsb | (41 | ) | — | — | — | ||||||||||
Royalty on metals | 8 | 7 | 1 | 8 | |||||||||||
Net cash costs | 138 | 166 | 36 | 202 | |||||||||||
Depreciation, depletion and amortization | 63 | 54 | 9 | 63 | |||||||||||
Noncash and other costs, net | 4 | 3 | 1 | 4 | |||||||||||
Total costs | 205 | 223 | 46 | 269 | |||||||||||
Revenue adjustments, primarily for pricing on prior period open sales | — | — | (1 | ) | (1 | ) | |||||||||
Gross profit | $ | 157 | $ | 139 | $ | 18 | $ | 157 | |||||||
Copper sales (millions of recoverable pounds) | 118 | 118 | |||||||||||||
Cobalt sales (millions of contained pounds) | 7 | ||||||||||||||
Gross profit per pound of copper/cobalt: | |||||||||||||||
Revenues, excluding adjustmentsa | $ | 3.08 | $ | 3.08 | $ | 9.58 | |||||||||
Site production and delivery, before net noncash and other costs shown below | 1.46 | 1.35 | 5.22 | ||||||||||||
Cobalt creditsb | (0.34 | ) | — | — | |||||||||||
Royalty on metals | 0.06 | 0.06 | 0.15 | ||||||||||||
Unit net cash costs | 1.18 | 1.41 | 5.37 | ||||||||||||
Depreciation, depletion and amortization | 0.54 | 0.46 | 1.30 | ||||||||||||
Noncash and other costs, net | 0.03 | 0.03 | 0.08 | ||||||||||||
Total unit costs | 1.75 | 1.90 | 6.75 | ||||||||||||
Revenue adjustments, primarily for pricing | |||||||||||||||
on prior period open sales | — | — | (0.19 | ) | |||||||||||
Gross profit per pound | $ | 1.33 | $ | 1.18 | $ | 2.64 | |||||||||
Reconciliation to Amounts Reported | |||||||||||||||
(In millions) | Revenues | Production and Delivery | Depreciation, Depletion and Amortization | ||||||||||||
Totals presented above | $ | 427 | $ | 194 | $ | 63 | |||||||||
Royalty on metals | (8 | ) | — | — | |||||||||||
Noncash and other costs, net | — | 4 | — | ||||||||||||
Revenue adjustments, primarily for pricing on prior period open sales | (1 | ) | — | — | |||||||||||
Africa mining | 418 | 198 | 63 | ||||||||||||
Other mining & eliminationsc | 3,868 | 2,556 | 331 | ||||||||||||
Total mining | 4,286 | 2,754 | 394 | ||||||||||||
U.S. oil & gas operations | 1,236 | 329 | 616 | ||||||||||||
Corporate, other & eliminations | — | (1 | ) | 3 | |||||||||||
As reported in FCX’s consolidated financial statements | $ | 5,522 | $ | 3,082 | $ | 1,013 | |||||||||
a. | Includes point-of-sale transportation costs as negotiated in customer contracts. |
b. | Net of cobalt downstream processing and freight costs. |
c. | Represents the combined total for all other mining operations and the related eliminations, as presented in Note 10. |
81
Africa Mining Product Revenues, Production Costs and Unit Net Cash Costs (continued)
Six Months Ended June 30, 2015 | |||||||||||||||
(In millions) | By-Product | Co-Product Method | |||||||||||||
Method | Copper | Cobalt | Total | ||||||||||||
Revenues, excluding adjustmentsa | $ | 631 | $ | 631 | $ | 152 | $ | 783 | |||||||
Site production and delivery, before net noncash and other costs shown below | 370 | 325 | 92 | 417 | |||||||||||
Cobalt creditsb | (104 | ) | — | — | — | ||||||||||
Royalty on metals | 14 | 12 | 2 | 14 | |||||||||||
Net cash costs | 280 | 337 | 94 | 431 | |||||||||||
Depreciation, depletion and amortization | 130 | 109 | 21 | 130 | |||||||||||
Noncash and other costs, net | 8 | 6 | 2 | 8 | |||||||||||
Total costs | 418 | 452 | 117 | 569 | |||||||||||
Revenue adjustments, primarily for pricing on prior period open sales | (7 | ) | (7 | ) | (1 | ) | (8 | ) | |||||||
Gross profit | $ | 206 | $ | 172 | $ | 34 | $ | 206 | |||||||
Copper sales (millions of recoverable pounds) | 237 | 237 | |||||||||||||
Cobalt sales (millions of contained pounds) | 16 | ||||||||||||||
Gross profit per pound of copper/cobalt: | |||||||||||||||
Revenues, excluding adjustmentsa | $ | 2.66 | $ | 2.66 | $ | 9.23 | |||||||||
Site production and delivery, before net noncash | |||||||||||||||
and other costs shown below | 1.56 | 1.37 | 5.54 | ||||||||||||
Cobalt creditsb | (0.44 | ) | — | — | |||||||||||
Royalty on metals | 0.06 | 0.05 | 0.15 | ||||||||||||
Unit net cash costs | 1.18 | 1.42 | 5.69 | ||||||||||||
Depreciation, depletion and amortization | 0.55 | 0.46 | 1.31 | ||||||||||||
Noncash and other costs, net | 0.03 | 0.03 | 0.08 | ||||||||||||
Total unit costs | 1.76 | 1.91 | 7.08 | ||||||||||||
Revenue adjustments, primarily for pricing | |||||||||||||||
on prior period open sales | (0.03 | ) | (0.03 | ) | (0.04 | ) | |||||||||
Gross profit per pound | $ | 0.87 | $ | 0.72 | $ | 2.11 | |||||||||
Reconciliation to Amounts Reported | |||||||||||||||
(In millions) | Revenues | Production and Delivery | Depreciation, Depletion and Amortization | ||||||||||||
Totals presented above | $ | 783 | $ | 417 | $ | 130 | |||||||||
Royalty on metals | (14 | ) | — | — | |||||||||||
Noncash and other costs, net | — | 8 | — | ||||||||||||
Revenue adjustments, primarily for pricing on prior period open sales | (8 | ) | — | — | |||||||||||
Africa mining | 761 | 425 | 130 | ||||||||||||
Other mining & eliminationsc | 6,571 | 4,766 | 677 | ||||||||||||
Total mining | 7,332 | 5,191 | 807 | ||||||||||||
U.S. oil & gas operations | 1,069 | 564 | 6,805 | d | |||||||||||
Corporate, other & eliminations | — | 5 | 7 | ||||||||||||
As reported in FCX’s consolidated financial statements | $ | 8,401 | $ | 5,760 | $ | 7,619 | d | ||||||||
a. | Includes point-of-sale transportation costs as negotiated in customer contracts. |
b. | Net of cobalt downstream processing and freight costs. |
c. | Represents the combined total for all other mining operations and the related eliminations, as presented in Note 10. |
d. | Includes impairment of oil and gas properties of $5.8 billion. |
82
Africa Mining Product Revenues, Production Costs and Unit Net Cash Costs (continued)
Six Months Ended June 30, 2014 | |||||||||||||||
(In millions) | By-Product | Co-Product Method | |||||||||||||
Method | Copper | Cobalt | Total | ||||||||||||
Revenues, excluding adjustmentsa | $ | 621 | $ | 621 | $ | 137 | $ | 758 | |||||||
Site production and delivery, before net noncash and other costs shown below | 296 | 262 | 77 | 339 | |||||||||||
Cobalt creditsb | (96 | ) | — | — | — | ||||||||||
Royalty on metals | 14 | 12 | 2 | 14 | |||||||||||
Net cash costs | 214 | 274 | 79 | 353 | |||||||||||
Depreciation, depletion and amortization | 114 | 99 | 15 | 114 | |||||||||||
Noncash and other costs, net | 11 | 10 | 1 | 11 | |||||||||||
Total costs | 339 | 383 | 95 | 478 | |||||||||||
Revenue adjustments, primarily for pricing on prior period open sales | (1 | ) | (1 | ) | 2 | 1 | |||||||||
Gross profit | $ | 281 | $ | 237 | $ | 44 | $ | 281 | |||||||
Copper sales (millions of recoverable pounds) | 202 | 202 | |||||||||||||
Cobalt sales (millions of contained pounds) | 15 | ||||||||||||||
Gross profit per pound of copper/cobalt: | |||||||||||||||
Revenues, excluding adjustmentsa | $ | 3.08 | $ | 3.08 | $ | 9.29 | |||||||||
Site production and delivery, before net noncash | |||||||||||||||
and other costs shown below | 1.47 | 1.30 | 5.19 | ||||||||||||
Cobalt creditsb | (0.48 | ) | — | — | |||||||||||
Royalty on metals | 0.07 | 0.06 | 0.16 | ||||||||||||
Unit net cash costs | 1.06 | 1.36 | 5.35 | ||||||||||||
Depreciation, depletion and amortization | 0.57 | 0.49 | 1.03 | ||||||||||||
Noncash and other costs, net | 0.05 | 0.04 | 0.09 | ||||||||||||
Total unit costs | 1.68 | 1.89 | 6.47 | ||||||||||||
Revenue adjustments, primarily for pricing | |||||||||||||||
on prior period open sales | (0.01 | ) | (0.01 | ) | 0.13 | ||||||||||
Gross profit per pound | $ | 1.39 | $ | 1.18 | $ | 2.95 | |||||||||
Reconciliation to Amounts Reported | |||||||||||||||
(In millions) | Revenues | Production and Delivery | Depreciation, Depletion and Amortization | ||||||||||||
Totals presented above | $ | 758 | $ | 339 | $ | 114 | |||||||||
Royalty on metals | (14 | ) | — | — | |||||||||||
Noncash and other costs, net | — | 11 | — | ||||||||||||
Revenue adjustments, primarily for pricing on prior period open sales | 1 | — | — | ||||||||||||
Africa mining | 745 | 350 | 114 | ||||||||||||
Other mining & eliminationsc | 7,265 | 4,830 | 626 | ||||||||||||
Total mining | 8,010 | 5,180 | 740 | ||||||||||||
U.S. oil & gas operations | 2,497 | 640 | 1,232 | ||||||||||||
Corporate, other & eliminations | — | (1 | ) | 7 | |||||||||||
As reported in FCX’s consolidated financial statements | $ | 10,507 | $ | 5,819 | $ | 1,979 | |||||||||
a. | Includes point-of-sale transportation costs as negotiated in customer contracts. |
b. | Net of cobalt downstream processing and freight costs. |
c. | Represents the combined total for all other mining operations and the related eliminations, as presented in Note 10. |
83
Molybdenum Mines Product Revenues, Production Costs and Unit Net Cash Costs
Three Months Ended June 30, | ||||||||||||
(In millions) | 2015 | 2014 | ||||||||||
Revenues, excluding adjustmentsa | $ | 112 | $ | 181 | ||||||||
Site production and delivery, before net noncash and other costs shown below | 80 | 79 | ||||||||||
Treatment charges and other | 10 | 11 | ||||||||||
Net cash costs | 90 | 90 | ||||||||||
Depreciation, depletion and amortization | 25 | 24 | ||||||||||
Noncash and other costs, net | 4 | b | 2 | |||||||||
Total costs | 119 | 116 | ||||||||||
Gross (loss) profit | $ | (7 | ) | $ | 65 | |||||||
Molybdenum sales (millions of recoverable pounds)a | 13 | 14 | ||||||||||
Gross profit per pound of molybdenum: | ||||||||||||
Revenues, excluding adjustmentsa | $ | 9.00 | $ | 12.90 | ||||||||
Site production and delivery, before net noncash and other costs shown below | 6.35 | 5.64 | ||||||||||
Treatment charges and other | 0.84 | 0.83 | ||||||||||
Unit net cash costs | 7.19 | 6.47 | ||||||||||
Depreciation, depletion and amortization | 1.97 | 1.69 | ||||||||||
Noncash and other costs, net | 0.37 | b | 0.10 | |||||||||
Total unit costs | 9.53 | 8.26 | ||||||||||
Gross (loss) profit per pound | $ | (0.53 | ) | $ | 4.64 | |||||||
Reconciliation to Amounts Reported | ||||||||||||
(In millions) | ||||||||||||
Three Months Ended June 30, 2015 | Revenues | Production and Delivery | Depreciation, Depletion and Amortization | |||||||||
Totals presented above | $ | 112 | $ | 80 | $ | 25 | ||||||
Treatment charges and other | (10 | ) | — | — | ||||||||
Noncash and other costs, net | — | 4 | b | — | ||||||||
Molybdenum mines | 102 | 84 | 25 | |||||||||
Other mining & eliminationsc | 3,577 | 2,481 | 377 | |||||||||
Total mining | 3,679 | 2,565 | 402 | |||||||||
U.S. oil & gas operations | 569 | 281 | 3,171 | d | ||||||||
Corporate, other & eliminations | — | 2 | 3 | |||||||||
As reported in FCX’s consolidated financial statements | $ | 4,248 | $ | 2,848 | $ | 3,576 | d | |||||
Three Months Ended June 30, 2014 | ||||||||||||
Totals presented above | $ | 181 | $ | 79 | $ | 24 | ||||||
Treatment charges and other | (11 | ) | — | — | ||||||||
Noncash and other costs, net | — | 2 | — | |||||||||
Molybdenum mines | 170 | 81 | 24 | |||||||||
Other mining & eliminationsc | 4,116 | 2,673 | 370 | |||||||||
Total mining | 4,286 | 2,754 | 394 | |||||||||
U.S. oil & gas operations | 1,236 | 329 | 616 | |||||||||
Corporate, other & eliminations | — | (1 | ) | 3 | ||||||||
As reported in FCX’s consolidated financial statements | $ | 5,522 | $ | 3,082 | $ | 1,013 | ||||||
a. | Reflects sales of the Molybdenum mines' production to our molybdenum sales company at market-based pricing. On a consolidated basis, realizations are based on the actual contract terms for sales to third parties; as a result, our consolidated average realized price per pound of molybdenum will differ from the amounts reported in this table. |
b. | Includes charges totaling $3 million ($0.21 per pound) for LCM inventory adjustments. |
c. | Represents the combined total for all other mining operations and the related eliminations, as presented in Note 10. Also includes amounts associated with our molybdenum sales company, which includes sales of molybdenum produced by the Molybdenum mines and by certain of the North and South America copper mines. |
d. | Includes impairment of oil and gas properties of $2.7 billion. |
84
Molybdenum Mines Product Revenues, Production Costs and Unit Net Cash Costs (continued)
Six Months Ended June 30, | ||||||||||||
(In millions) | 2015 | 2014 | ||||||||||
Revenues, excluding adjustmentsa | $ | 236 | $ | 318 | ||||||||
Site production and delivery, before net noncash and other costs shown below | 161 | 154 | ||||||||||
Treatment charges and other | 21 | 22 | ||||||||||
Net cash costs | 182 | 176 | ||||||||||
Depreciation, depletion and amortization | 51 | 46 | ||||||||||
Noncash and other costs, net | 6 | b | 3 | |||||||||
Total costs | 239 | 225 | ||||||||||
Gross (loss) profit | $ | (3 | ) | $ | 93 | |||||||
Molybdenum sales (millions of recoverable pounds)a | 26 | 27 | ||||||||||
Gross profit per pound of molybdenum: | ||||||||||||
Revenues, excluding adjustmentsa | $ | 9.34 | $ | 11.88 | ||||||||
Site production and delivery, before net noncash and other costs shown below | 6.34 | 5.75 | ||||||||||
Treatment charges and other | 0.84 | 0.83 | ||||||||||
Unit net cash costs | 7.18 | 6.58 | ||||||||||
Depreciation, depletion and amortization | 2.00 | 1.72 | ||||||||||
Noncash and other costs, net | 0.25 | b | 0.10 | |||||||||
Total unit costs | 9.43 | 8.40 | ||||||||||
Gross (loss) profit per pound | $ | (0.09 | ) | $ | 3.48 | |||||||
Reconciliation to Amounts Reported | ||||||||||||
(In millions) | ||||||||||||
Six Months Ended June 30, 2015 | Revenues | Production and Delivery | Depreciation, Depletion and Amortization | |||||||||
Totals presented above | $ | 236 | $ | 161 | $ | 51 | ||||||
Treatment charges and other | (21 | ) | — | — | ||||||||
Noncash and other costs, net | — | 6 | b | — | ||||||||
Molybdenum mines | 215 | 167 | 51 | |||||||||
Other mining & eliminationsc | 7,117 | 5,024 | 756 | |||||||||
Total mining | 7,332 | 5,191 | 807 | |||||||||
U.S. oil & gas operations | 1,069 | 564 | 6,805 | d | ||||||||
Corporate, other & eliminations | — | 5 | 7 | |||||||||
As reported in FCX’s consolidated financial statements | $ | 8,401 | $ | 5,760 | $ | 7,619 | d | |||||
Six Months Ended June 30, 2014 | ||||||||||||
Totals presented above | $ | 318 | $ | 154 | $ | 46 | ||||||
Treatment charges and other | (22 | ) | — | — | ||||||||
Noncash and other costs,net | — | 3 | — | |||||||||
Molybdenum mines | 296 | 157 | 46 | |||||||||
Other mining & eliminationsc | 7,714 | 5,023 | 694 | |||||||||
Total mining | 8,010 | 5,180 | 740 | |||||||||
U.S. oil & gas operations | 2,497 | 640 | 1,232 | |||||||||
Corporate, other & eliminations | — | (1 | ) | 7 | ||||||||
As reported in FCX’s consolidated financial statements | $ | 10,507 | $ | 5,819 | $ | 1,979 | ||||||
a. | Reflects sales of the Molybdenum mines' production to our molybdenum sales company at market-based pricing. On a consolidated basis, realizations are based on the actual contract terms for sales to third parties; as a result, our consolidated average realized price per pound of molybdenum will differ from the amounts reported in this table. |
b. | Includes charges totaling $3 million ($0.11 per pound) for LCM inventory adjustments. |
c. | Represents the combined total for all other mining operations and the related eliminations, as presented in Note 10. Also includes amounts associated with our molybdenum sales company, which includes sales of molybdenum produced by the Molybdenum mines and by certain of the North and South America copper mines. |
d. | Includes impairment of oil and gas properties of $5.8 billion. |
85
U.S. Oil & Gas Product Revenues, Cash Production Costs and Realizations
Three Months Ended June 30, 2015 | ||||||||||||||||
(In millions) | Oil | Natural Gas | NGLs | Total U.S. Oil & Gas | ||||||||||||
Oil and gas revenues before derivatives | $ | 480 | $ | 63 | $ | 12 | $ | 555 | ||||||||
Cash gains on derivative contracts | 101 | — | — | 101 | ||||||||||||
Realized revenues | $ | 581 | $ | 63 | $ | 12 | 656 | |||||||||
Less: cash production costs | 249 | |||||||||||||||
Cash operating margin | 407 | |||||||||||||||
Less: depreciation, depletion and amortization | 485 | |||||||||||||||
Less: impairment of oil and gas properties | 2,686 | |||||||||||||||
Less: accretion and other costs | 32 | |||||||||||||||
Plus: net noncash mark-to-market losses on derivative contracts | (95 | ) | ||||||||||||||
Plus: other net adjustments | 8 | |||||||||||||||
Gross loss | $ | (2,883 | ) | |||||||||||||
Oil (MMBbls) | 8.6 | |||||||||||||||
Gas (Bcf) | 23.5 | |||||||||||||||
NGLs (MMBbls) | 0.6 | |||||||||||||||
Oil Equivalents (MMBOE) | 13.1 | |||||||||||||||
Oil (per barrel) | Natural Gas (per MMBtu) | NGLs (per barrel) | Per BOE | |||||||||||||
Oil and gas revenues before derivatives | $ | 55.82 | $ | 2.66 | $ | 20.50 | $ | 42.31 | ||||||||
Cash gains on derivative contracts | 11.79 | — | — | 7.73 | ||||||||||||
Realized revenues | $ | 67.61 | $ | 2.66 | $ | 20.50 | 50.04 | |||||||||
Less: cash production costs | 19.04 | |||||||||||||||
Cash operating margin | 31.00 | |||||||||||||||
Less: depreciation, depletion and amortization | 36.99 | |||||||||||||||
Less: impairment of oil and gas properties | 204.91 | |||||||||||||||
Less: accretion and other costs | 2.46 | |||||||||||||||
Plus: net noncash mark-to-market losses on derivative contracts | (7.26 | ) | ||||||||||||||
Plus: other net adjustments | 0.61 | |||||||||||||||
Gross loss | $ | (220.01 | ) | |||||||||||||
Reconciliation to Amounts Reported | ||||||||||||||||
(In millions) | Revenues | Production and Delivery | Depreciation, Depletion and Amortization | |||||||||||||
Totals presented above | $ | 555 | $ | 249 | $ | 485 | ||||||||||
Cash gains on derivative contracts | 101 | — | — | |||||||||||||
Net noncash mark-to-market losses on derivative contracts | (95 | ) | — | — | ||||||||||||
Accretion and other costs | — | 32 | — | |||||||||||||
Impairment of oil and gas properties | — | — | 2,686 | |||||||||||||
Other net adjustments | 8 | — | — | |||||||||||||
U.S. oil & gas operations | 569 | 281 | 3,171 | |||||||||||||
Total mininga | 3,679 | 2,565 | 402 | |||||||||||||
Corporate, other & eliminations | — | 2 | 3 | |||||||||||||
As reported in FCX's consolidated financial statements | $ | 4,248 | $ | 2,848 | $ | 3,576 | ||||||||||
a. | Represents the combined total for mining operations and the related eliminations, as presented in Note 10. |
86
U.S. Oil & Gas Product Revenues, Cash Production Costs and Realizations (continued) | ||||||||||||||||
Three Months Ended June 30, 2014 | ||||||||||||||||
Total | ||||||||||||||||
Natural | U.S. Oil | |||||||||||||||
(In millions) | Oil | Gas | NGLs | & Gas | ||||||||||||
Oil and gas revenues before derivatives | $ | 1,172 | $ | 96 | $ | 38 | $ | 1,306 | a | |||||||
Cash losses on derivative contracts | (57 | ) | (6 | ) | — | (63 | ) | |||||||||
Realized revenues | $ | 1,115 | $ | 90 | $ | 38 | 1,243 | |||||||||
Less: cash production costs | 314 | a | ||||||||||||||
Cash operating margin | 929 | |||||||||||||||
Less: depreciation, depletion and amortization | 616 | |||||||||||||||
Less: accretion and other costs | 15 | |||||||||||||||
Plus: net noncash mark-to-market losses on derivative contracts | (7 | ) | ||||||||||||||
Plus: other net adjustments | — | |||||||||||||||
Gross profit | $ | 291 | ||||||||||||||
Oil (MMBbls) | 11.7 | |||||||||||||||
Gas (Bcf) | 20.3 | |||||||||||||||
NGLs (MMBbls) | 1.0 | |||||||||||||||
Oil Equivalents (MMBOE) | 16.0 | |||||||||||||||
Oil | Natural Gas | NGLs | ||||||||||||||
(per barrel) | (per MMBtu) | (per barrel) | Per BOE | |||||||||||||
Oil and gas revenues before derivatives | $ | 100.46 | $ | 4.70 | $ | 38.79 | $ | 81.47 | a | |||||||
Cash losses on derivative contracts | (4.96 | ) | (0.26 | ) | — | (3.94 | ) | |||||||||
Realized revenues | $ | 95.50 | $ | 4.44 | $ | 38.79 | 77.53 | |||||||||
Less: cash production costs | 19.57 | a | ||||||||||||||
Cash operating margin | 57.96 | |||||||||||||||
Less: depreciation, depletion and amortization | 38.39 | |||||||||||||||
Less: accretion and other costs | 0.94 | |||||||||||||||
Plus: net noncash mark-to-market losses on derivative contracts | (0.44 | ) | ||||||||||||||
Plus: other net adjustments | 0.04 | |||||||||||||||
Gross profit | $ | 18.23 | ||||||||||||||
Reconciliation to Amounts Reported | ||||||||||||||||
(In millions) | Revenues | Production and Delivery | Depreciation, Depletion and Amortization | |||||||||||||
Totals presented above | $ | 1,306 | $ | 314 | $ | 616 | ||||||||||
Cash losses on derivative contracts | (63 | ) | — | — | ||||||||||||
Net noncash mark-to-market losses on derivative contracts | (7 | ) | — | — | ||||||||||||
Accretion and other costs | — | 15 | — | |||||||||||||
Other net adjustments | — | — | — | |||||||||||||
U.S. oil & gas operations | 1,236 | 329 | 616 | |||||||||||||
Total miningb | 4,286 | 2,754 | 394 | |||||||||||||
Corporate, other & eliminations | — | (1 | ) | 3 | ||||||||||||
As reported in FCX's consolidated financial statements | $ | 5,522 | $ | 3,082 | $ | 1,013 | ||||||||||
a.Following is a reconciliation of FM O&G's second-quarter 2014 cash production costs per BOE, excluding Eagle Ford:
Cash Production Costs (in millions) | Oil Equivalents (MMBOE) | Cash Production Costs Per BOE | ||||||||
Presented above | $ | 314 | 16.0 | $ | 19.57 | |||||
Less: Eagle Ford | 53 | 4.0 | 13.23 | |||||||
$ | 261 | 12.0 | $ | 21.66 | ||||||
b. | Represents the combined total for mining operations and the related eliminations, as presented in Note 10. |
87
U.S. Oil & Gas Product Revenues, Cash Production Costs and Realizations (continued)
Six Months Ended June 30, 2015 | ||||||||||||||||
(In millions) | Oil | Natural Gas | NGLs | Total U.S. Oil & Gas | ||||||||||||
Oil and gas revenues before derivatives | $ | 853 | $ | 125 | $ | 24 | $ | 1,002 | ||||||||
Cash gains on derivative contracts | 201 | — | — | 201 | ||||||||||||
Realized revenues | $ | 1,054 | $ | 125 | $ | 24 | 1,203 | |||||||||
Less: cash production costs | 503 | |||||||||||||||
Cash operating margin | 700 | |||||||||||||||
Less: depreciation, depletion and amortization | 1,015 | |||||||||||||||
Less: impairment of oil and gas properties | 5,790 | |||||||||||||||
Less: accretion and other costs | 61 | |||||||||||||||
Plus: net noncash mark-to-market losses on derivative contracts | (143 | ) | ||||||||||||||
Plus: other net adjustments | 9 | |||||||||||||||
Gross loss | $ | (6,300 | ) | |||||||||||||
Oil (MMBbls) | 17.0 | |||||||||||||||
Gas (Bcf) | 45.3 | |||||||||||||||
NGLs (MMBbls) | 1.1 | |||||||||||||||
Oil Equivalents (MMBOE) | 25.6 | |||||||||||||||
Oil (per barrel) | Natural Gas (per MMBtu) | NGLs (per barrel) | Per BOE | |||||||||||||
Oil and gas revenues before derivatives | $ | 50.25 | $ | 2.75 | $ | 21.71 | $ | 39.08 | ||||||||
Cash gains on derivative contracts | 11.88 | — | — | 7.87 | ||||||||||||
Realized revenues | $ | 62.13 | $ | 2.75 | $ | 21.71 | 46.95 | |||||||||
Less: cash production costs | 19.62 | |||||||||||||||
Cash operating margin | 27.33 | |||||||||||||||
Less: depreciation, depletion and amortization | 39.59 | |||||||||||||||
Less: impairment of oil and gas properties | 225.89 | |||||||||||||||
Less: accretion and other costs | 2.39 | |||||||||||||||
Plus: net noncash mark-to-market losses on derivative contracts | (5.60 | ) | ||||||||||||||
Plus: other net adjustments | 0.34 | |||||||||||||||
Gross loss | $ | (245.80 | ) | |||||||||||||
Reconciliation to Amounts Reported | ||||||||||||||||
(In Millions) | Revenues | Production and Delivery | Depreciation, Depletion and Amortization | |||||||||||||
Totals presented above | $ | 1,002 | $ | 503 | $ | 1,015 | ||||||||||
Cash gains on derivative contracts | 201 | — | — | |||||||||||||
Net noncash mark-to-market losses on derivative contracts | (143 | ) | — | — | ||||||||||||
Accretion and other costs | — | 61 | — | |||||||||||||
Impairment of oil and gas properties | — | — | 5,790 | |||||||||||||
Other net adjustments | 9 | — | — | |||||||||||||
U.S. oil & gas operations | 1,069 | 564 | 6,805 | |||||||||||||
Total mininga | 7,332 | 5,191 | 807 | |||||||||||||
Corporate, other & eliminations | — | 5 | 7 | |||||||||||||
As reported in FCX's consolidated financial statements | $ | 8,401 | $ | 5,760 | $ | 7,619 | ||||||||||
a. | Represents the combined total for mining operations and the related eliminations, as presented in Note 10. |
88
U.S. Oil & Gas Product Revenues, Cash Production Costs and Realizations (continued)
Six Months Ended June 30, 2014 | ||||||||||||||||
(In millions) | Oil | Natural Gas | NGLs | Total U.S. Oil & Gas | ||||||||||||
Oil and gas revenues before derivatives | $ | 2,334 | $ | 194 | $ | 88 | $ | 2,616 | a | |||||||
Cash losses on derivative contracts | (115 | ) | (13 | ) | — | (128 | ) | |||||||||
Realized revenues | $ | 2,219 | $ | 181 | $ | 88 | 2,488 | |||||||||
Less: cash production costs | 612 | a | ||||||||||||||
Cash operating margin | 1,876 | |||||||||||||||
Less: depreciation, depletion and amortization | 1,232 | |||||||||||||||
Less: accretion and other costs | 28 | |||||||||||||||
Plus: net noncash mark-to-market gains on derivative contracts | 8 | |||||||||||||||
Plus: other net adjustments | 1 | |||||||||||||||
Gross profit | $ | 625 | ||||||||||||||
Oil (MMBbls) | 23.5 | |||||||||||||||
Gas (Bcf) | 39.8 | |||||||||||||||
NGLs (MMBbls) | 2.1 | |||||||||||||||
Oil Equivalents (MMBOE) | 32.2 | |||||||||||||||
Oil (per barrel) | Natural Gas (per MMBtu) | NGLs (per barrel) | Per BOE | |||||||||||||
Oil and gas revenues before derivatives | $ | 99.54 | $ | 4.87 | $ | 42.35 | $ | 81.34 | a | |||||||
Cash losses on derivative contracts | (4.91 | ) | (0.32 | ) | — | (3.97 | ) | |||||||||
Realized revenues | $ | 94.63 | $ | 4.55 | $ | 42.35 | 77.37 | |||||||||
Less: cash production costs | 19.03 | a | ||||||||||||||
Cash operating margin | 58.34 | |||||||||||||||
Less: depreciation, depletion and amortization | 38.30 | |||||||||||||||
Less: accretion and other costs | 0.87 | |||||||||||||||
Plus: net noncash mark-to-market gains on derivative contracts | 0.23 | |||||||||||||||
Plus: other net adjustments | 0.04 | |||||||||||||||
Gross profit | $ | 19.44 | ||||||||||||||
Reconciliation to Amounts Reported for the Six Months Ended June 30, 2014 | ||||||||||||||||
(In millions) | Revenues | Production and Delivery | Depreciation, Depletion and Amortization | |||||||||||||
Totals presented above | $ | 2,616 | $ | 612 | $ | 1,232 | ||||||||||
Cash losses on derivative contracts | (128 | ) | — | — | ||||||||||||
Net noncash mark-to-market gains on derivative contracts | 8 | — | — | |||||||||||||
Accretion and other costs | — | 28 | — | |||||||||||||
Other net adjustments | 1 | — | — | |||||||||||||
U.S. oil & gas operations | 2,497 | 640 | 1,232 | |||||||||||||
Total miningb | 8,010 | 5,180 | 740 | |||||||||||||
Corporate, other & eliminations | — | (1 | ) | 7 | ||||||||||||
As reported in FCX's consolidated financial statements | $ | 10,507 | $ | 5,819 | $ | 1,979 | ||||||||||
a.Following is a reconciliation of FM O&G's cash production costs per BOE for the first six months of 2014, excluding Eagle Ford:
Cash Production Costs (in millions) | Oil Equivalents (MMBOE) | Cash Production Costs Per BOE | ||||||||
Presented above | $ | 612 | 32.2 | $ | 19.03 | |||||
Less: Eagle Ford | 113 | 8.7 | 12.97 | |||||||
$ | 499 | 23.5 | $ | 21.29 | ||||||
b. | Represents the combined total for mining operations and the related eliminations, as presented in Note 10. |
89
CAUTIONARY STATEMENT
Our discussion and analysis contains forward-looking statements in which we discuss factors we believe may affect our future performance. Forward-looking statements are all statements other than statements of historical facts, such as projections or expectations relating to ore grades and milling rates; production and sales volumes; unit net cash costs; cash production costs per BOE; operating cash flows; capital expenditures; exploration efforts and results; development and production activities and costs; liquidity; tax rates; the impact of copper, gold, molybdenum, cobalt, crude oil and natural gas price changes; the impact of derivative positions; the impact of deferred intercompany profits on earnings; reserve estimates; future dividend payments; debt reduction and share purchases. The words “anticipates,” “may,” “can,” “plans,” “believes,” “potential,” “estimates,” “expects,” “projects,” “targets,” “intends,” “likely,” “will,” “should,” “to be” and any similar expressions are intended to identify those assertions as forward-looking statements. The declaration of dividends is at the discretion of the Board and will depend on our financial results, cash requirements, future prospects, and other factors deemed relevant by the Board.
We caution readers that forward-looking statements are not guarantees of future performance and actual results may differ materially from those anticipated, projected or assumed in the forward-looking statements. In particular, on July 28, 2015, we announced that we are undertaking a comprehensive review of operating plans to target significant additional reductions in capital spending, and operating and administrative costs. As part of this process, on August 5, 2015, we announced revisions to our oil and gas capital expenditure and production outlook. We expect to report revised plans for our mining operations during third-quarter 2015.
Important factors that can cause our actual results to differ materially from those anticipated in the forward-looking statements include supply of and demand for, and prices of copper, gold, molybdenum, cobalt, crude oil and natural gas, mine sequencing, production rates, industry risks, regulatory changes, political risks, drilling results, potential additional oil and gas property impairment charges, potential LCM inventory adjustments, potential impairment of long-lived mining assets, the outcome of negotiations with the Indonesian government regarding PT-FI's COW, PT-FI's ability to obtain renewal of its export license after January 28, 2016, PT-FI's ability to renew its bi-annual labor agreement expiring in September 2015, PT Smelting's ability to restart smelter operations as expected in September 2015, the potential effects of violence in Indonesia, the resolution of administrative disputes in the DRC, weather- and climate-related risks, labor relations, environmental risks, litigation results and other factors described in more detail in Part I, Item 1A. “Risk Factors” of our annual report on Form 10-K for the year ended December 31, 2014, as updated by our subsequent filings with the SEC.
Investors are cautioned that many of the assumptions upon which our forward-looking statements are based are likely to change after the forward-looking statements are made, including for example commodity prices, which we cannot control, and production volumes and costs, some aspects of which we may not be able to control. Further, we may make changes to our business plans that could affect our results. We caution investors that, except for our expectation that we will report revised plans for our mining operations during third-quarter 2015, we do not intend to update forward-looking statements more frequently than quarterly notwithstanding any changes in our assumptions, changes in business plans, actual experience or other changes, and we undertake no obligation to update any forward-looking statements.
90
Item 3. | Quantitative and Qualitative Disclosures About Market Risk. |
There have been no material changes in our market risks during the three-month period ended June 30, 2015. For additional information on market risks, refer to “Disclosures About Market Risks” included in Part I, Item 2. of our annual report on Form 10-K for the year ended December 31, 2014. For projected sensitivities of our operating cash flow to changes in commodity prices, refer to “Outlook” in Part I, Item 2. of this quarterly report on Form 10-Q for the period ended June 30, 2015; for projected sensitivities of our provisionally priced copper sales and derivative instruments to changes in commodity prices refer to “Consolidated Results – Revenues” in Part I, Item 2. of this quarterly report on Form 10-Q for the period ended June 30, 2015.
Item 4. | Controls and Procedures. |
(a) | Evaluation of disclosure controls and procedures. Our chief executive officer and chief financial officer, with the participation of management, have evaluated the effectiveness of our “disclosure controls and procedures” (as defined in Rules 13a-15(e) and 15d-15(e) under the Securities Exchange Act of 1934) as of the end of the period covered by this quarterly report on Form 10-Q. Based on their evaluation, they have concluded that our disclosure controls and procedures are effective as of June 30, 2015. |
(b) | Changes in internal control over financial reporting. There has been no change in our internal control over financial reporting that occurred during the quarter ended June 30, 2015, that has materially affected, or is reasonably likely to materially affect, our internal control over financial reporting. |
Part II. | OTHER INFORMATION |
Item 1. | Legal Proceedings. |
We are involved in numerous legal proceedings that arise in the ordinary course of our business or that are associated with environmental issues arising from legacy operations conducted over the years by Freeport Minerals Corporation and its affiliates. We are also involved from time to time in other reviews, investigations and proceedings by government agencies, some of which may result in adverse judgments, settlements, fines, penalties, injunctions or other relief.
Management does not believe, based on currently available information, that the outcome of any proceeding reported in Note 12 and incorporated by reference into Part I, Item 3. “Legal Proceedings” of our annual report on Form 10-K for the year ended December 31, 2014, as updated in Note 9 to the financial statements included in this quarterly report on Form 10-Q for the quarter ended June 30, 2015, will have a material adverse effect on our financial condition; although individual outcomes could be material to our operating results for a particular period, depending on the nature and magnitude of the outcome and the operating results for the period.
Item 1A. Risk Factors.
There have been no material changes to our risk factors during the three-month period ended June 30, 2015 . For additional information on risk factors, refer to Part I, Item 1A. "Risk Factors" of our annual report on Form 10-K for the year ended December 31, 2014.
91
Item 2. | Unregistered Sales of Equity Securities and Use of Proceeds. |
(c) | The following table sets forth information with respect to shares of our common stock purchased by us during the three months ended June 30, 2015: |
Period | (a) Total Number of Shares Purchased | (b) Average Price Paid Per Share | (c) Total Number of Shares Purchased as Part of Publicly Announced Plans or Programsa | (d) Maximum Number of Shares That May Yet Be Purchased Under the Plans or Programsa | ||||||||||
April 1-30, 2015 | — | $ | — | — | 23,685,500 | |||||||||
May 1-31, 2015 | — | $ | — | — | 23,685,500 | |||||||||
June 1-30, 2015 | — | $ | — | — | 23,685,500 | |||||||||
Total | — | $ | — | — | 23,685,500 | |||||||||
a. | On July 21, 2008, our Board of Directors approved an increase in our open-market share purchase program for up to 30 million shares. There have been no purchases under this program since 2008. This program does not have an expiration date. |
Item 4. | Mine Safety Disclosure. |
The safety and health of all employees is our highest priority. Management believes that safety and health considerations are integral to, and compatible with, all other functions in the organization and that proper safety and health management will enhance production and reduce costs. Our approach towards the safety and health of our workforce is to continuously improve performance through implementing robust management systems and providing adequate training, safety incentive and occupational health programs. The information concerning mine safety violations or other regulatory matters required by Section 1503(a) of the Dodd-Frank Wall Street Reform and Consumer Protection Act and Item 104 of Regulation S-K is included in Exhibit 95.1 to this quarterly report on Form 10-Q.
Item 6. | Exhibits. |
The exhibits to this report are listed in the Exhibit Index beginning on Page E-1 hereof.
92
FREEPORT-McMoRan INC.
SIGNATURE
Pursuant to the requirements of the Securities Exchange Act of 1934, the registrant has duly caused this report to be signed on its behalf by the undersigned hereunto duly authorized.
FREEPORT-McMoRan INC. | ||
By: | /s/ C. Donald Whitmire, Jr. | |
C. Donald Whitmire, Jr. | ||
Vice President and | ||
Controller - Financial Reporting | ||
(authorized signatory | ||
and Principal Accounting Officer) | ||
Date: August 10, 2015
93
FREEPORT-McMoRan INC. | |||||
EXHIBIT INDEX | |||||
Filed | |||||
Exhibit | with this | Incorporated by Reference | |||
Number | Exhibit Title | Form 10-Q | Form | File No. | Date Filed |
3.1 | Composite Certificate of Incorporation of FCX | 10-Q | 001-11307-01 | 8/8/2014 | |
3.2 | Composite By-Laws of FCX as of July 14, 2014 | 8-K | 001-11307-01 | 7/2/2014 | |
4.1 | Indenture dated as of February 13, 2012, between FCX and U.S. Bank National Association, as Trustee (relating to the 2.15% Senior Notes due 2017, the 3.55% Senior Notes due 2022, the 2.30% Senior Notes due 2017, the 4.00% Senior Notes due 2021, the 4.55% Senior Notes due 2024, and the 5.40% Senior Notes due 2034). | 8-K | 001-11307-01 | 2/13/2012 | |
4.2 | Second Supplemental Indenture dated as of February 13, 2012, between FCX and U.S. Bank National Association, as Trustee (relating to the 2.15% Senior Notes due 2017). | 8-K | 001-11307-01 | 2/13/2012 | |
4.3 | Third Supplemental Indenture dated as of February 13, 2012, between FCX and U.S. Bank National Association, as Trustee (relating to the 3.55% Senior Notes due 2022). | 8-K | 001-11307-01 | 2/13/2012 | |
4.4 | Fourth Supplemental Indenture dated as of May 31, 2013, among FCX, Freeport-McMoRan Oil & Gas LLC and U.S. Bank National Association, as Trustee (relating to the 2.15% Senior Notes due 2017, and the 3.55% Senior Notes due 2022, the 2.30% Senior Notes due 2017, the 4.00% Senior Notes due 2021, the 4.55% Senior Notes due 2024, and the 5.40% Senior Notes due 2034). | 8-K | 001-11307-01 | 6/3/2013 | |
4.5 | Fifth Supplemental Indenture dated as of November 14, 2014 among FCX, Freeport-McMoRan Oil & Gas LLC and U.S. Bank National Association, as Trustee (relating to the 2.30% Senior Notes due 2017). | 8-K | 001-11307-01 | 11/14/2014 | |
4.6 | Sixth Supplemental Indenture dated as of November 14, 2014 among FCX, Freeport-McMoRan Oil & Gas LLC and U.S. Bank National Association, as Trustee (relating to the 4.00% Senior Notes due 2021). | 8-K | 001-11307-01 | 11/14/2014 | |
4.7 | Seventh Supplemental Indenture dated as of November 14, 2014 among FCX, Freeport-McMoRan Oil & Gas LLC and U.S. Bank National Association, as Trustee. (relating to the 4.55% Senior Notes due 2024). | 8-K | 001-11307-01 | 11/14/2014 | |
4.8 | Eighth Supplemental Indenture dated as of November 14, 2014 among FCX, Freeport-McMoRan Oil & Gas LLC and U.S. Bank National Association, as Trustee (relating to the 5.40% Senior Notes due 2034). | 8-K | 001-11307-01 | 11/14/2014 | |
4.9 | Indenture dated as of March 7, 2013, between FCX and U.S. Bank National Association, as Trustee (relating to the 2.375% Senior Notes due 2018, the 3.100% Senior Notes due 2020, the 3.875% Senior Notes due 2023, and the 5.450% Senior Notes due 2043). | 8-K | 001-11307-01 | 3/7/2013 | |
4.10 | Supplemental Indenture dated as of May 31, 2013, among FCX, Freeport-McMoRan Oil & Gas LLC and U.S. Bank National Association, as Trustee (relating to the 2.375% Senior Notes due 2018, the 3.100% Senior Notes due 2020, the 3.875% Senior Notes due 2023, and the 5.450% Senior Notes due 2043). | 8-K | 001-11307-01 | 6/3/2013 | |
E-1
FREEPORT-McMoRan INC. | |||||
EXHIBIT INDEX | |||||
Filed | |||||
Exhibit | with this | Incorporated by Reference | |||
Number | Exhibit Title | Form 10-Q | Form | File No. | Date Filed |
4.11 | Indenture dated as of March 13, 2007, among Plains Exploration & Production Company, the Subsidiary Guarantors parties thereto, and Wells Fargo Bank, N.A., as Trustee (relating to the 6.625% Senior Notes due 2021, the 6.75% Senior Notes due 2022, the 6.125% Senior Notes due 2019, the 6.5% Senior Notes due 2020, and the 6.875% Senior Notes due 2023). | 8-K | 001-31470 | 3/13/2007 | |
4.12 | Twelfth Supplemental Indenture dated as of March 29, 2011 to the Indenture dated as of March 13, 2007, among Plains Exploration & Production Company, the Subsidiary Guarantors parties thereto and Wells Fargo Bank, N.A., as Trustee (relating to the 6.625% Senior Notes due 2021). | 8-K | 001-31470 | 3/29/2011 | |
4.13 | Thirteenth Supplemental Indenture dated as of November 21, 2011 to the Indenture dated as of March 13, 2007, among Plains Exploration & Production Company, the Subsidiary Guarantors parties thereto and Wells Fargo Bank, N.A., as Trustee (relating to the 6.75% Senior Notes due 2022). | 8-K | 001-31470 | 11/22/2011 | |
4.14 | Fourteenth Supplemental Indenture dated as of April 27, 2012 to the Indenture dated as of March 13, 2007, among Plains Exploration & Production Company, the Subsidiary Guarantors parties thereto and Wells Fargo Bank, N.A., as Trustee (relating to the 6.125% Senior Notes due 2019). | 8-K | 001-31470 | 4/27/2012 | |
4.15 | Sixteenth Supplemental Indenture dated as of October 26, 2012 to the Indenture dated as of March 13, 2007, among Plains Exploration & Production Company, the Subsidiary Guarantors parties thereto and Wells Fargo Bank, N.A., as Trustee (relating to the 6.5% Senior Notes due 2020). | 8-K | 001-31470 | 10/26/2012 | |
4.16 | Seventeenth Supplemental Indenture dated as of October 26, 2012 to the Indenture dated as of March 13, 2007, among Plains Exploration & Production Company, the Subsidiary Guarantors parties thereto and Wells Fargo Bank, N.A., as Trustee (relating to the 6.875% Senior Notes due 2023). | 8-K | 001-31470 | 10/26/2012 | |
4.17 | Eighteenth Supplemental Indenture dated as of May 31, 2013 to the Indenture dated as of March 13, 2007, among Freeport-McMoRan Oil & Gas LLC, as Successor Issuer, FCX Oil & Gas Inc., as Co-Issuer, FCX, as Parent Guarantor, Plains Exploration & Production Company, as Original Issuer, and Wells Fargo Bank, N.A., as Trustee (relating to the 6.625% Senior Notes due 2021, the 6.75% Senior Notes due 2022, the 6.125% Senior Notes due 2019, the 6.5% Senior Notes due 2020, and the 6.875% Senior Notes due 2023). | 8-K | 001-11307-01 | 6/3/2013 | |
4.18 | Form of Indenture dated as of September 22, 1997, between Phelps Dodge Corporation and The Chase Manhattan Bank, as Trustee (relating to the 7.125% Senior Notes due 2027, the 9.50% Senior Notes due 2031, and the 6.125% Senior Notes due 2034). | S-3 | 333-36415 | 9/25/1997 | |
E-2
FREEPORT-McMoRan INC. | |||||
EXHIBIT INDEX | |||||
Filed | |||||
Exhibit | with this | Incorporated by Reference | |||
Number | Exhibit Title | Form 10-Q | Form | File No. | Date Filed |
4.19 | Form of 7.125% Debenture due November 1, 2027 of Phelps Dodge Corporation issued on November 5, 1997, pursuant to the Indenture dated as of September 22, 1997, between Phelps Dodge Corporation and The Chase Manhattan Bank, as Trustee (relating to the 7.125% Senior Notes due 2027). | 8-K | 01-00082 | 11/3/1997 | |
4.20 | Form of 9.5% Note due June 1, 2031 of Phelps Dodge Corporation issued on May 30, 2001, pursuant to the Indenture dated as of September 22, 1997, between Phelps Dodge Corporation and First Union National Bank, as successor Trustee (relating to the 9.50% Senior Notes due 2031). | 8-K | 01-00082 | 5/30/2001 | |
4.21 | Form of 6.125% Note due March 15, 2034 of Phelps Dodge Corporation issued on March 4, 2004, pursuant to the Indenture dated as of September 22, 1997, between Phelps Dodge Corporation and First Union National Bank, as successor Trustee (relating to the 6.125% Senior Notes due 2034). | 10-K | 01-00082 | 3/7/2005 | |
Amendment dated July 21, 2015, to the Restated Trust Agreement dated as of October 11, 1996, among PT Freeport Indonesia, PT Rio Tinto Indonesia (formerly P.T. RTZ-CRA Indonesia), U.S. Bank National Association, as trustee, JP Morgan Chase Bank, N.A., as depository, and the Secured Creditors. | X | ||||
Letter from Ernst & Young LLP regarding unaudited interim financial statements. | X | ||||
Certification of Principal Executive Officer pursuant to Rule 13a-14(a)/15d – 14(a). | X | ||||
Certification of Principal Financial Officer pursuant to Rule 13a-14(a)/15d – 14(a). | X | ||||
Certification of Principal Executive Officer pursuant to 18 U.S.C. Section 1350. | X | ||||
Certification of Principal Financial Officer pursuant to 18 U.S.C Section 1350. | X | ||||
Mine Safety and Health Administration Safety Data. | X | ||||
101.INS | XBRL Instance Document. | X | |||
101.SCH | XBRL Taxonomy Extension Schema. | X | |||
101.CAL | XBRL Taxonomy Extension Calculation Linkbase. | X | |||
101.DEF | XBRL Taxonomy Extension Definition Linkbase. | X | |||
101.LAB | XBRL Taxonomy Extension Label Linkbase. | X | |||
101.PRE | XBRL Taxonomy Extension Presentation Linkbase. | X | |||
Note: Certain instruments with respect to long-term debt of FCX have not been filed as exhibits to this Quarterly Report on Form 10-Q since the total amount of securities authorized under any such instrument does not exceed 10 percent of the total assets of FCX and its subsidiaries on a consolidated basis. FCX agrees to furnish a copy of each such instrument upon request of the Securities and Exchange Commission.
E-3