Attached files
| file | filename |
|---|---|
| EX-99.1 - EXHIBIT 99.1 - R1 RCM INC. | q2pr.htm |
| 8-K - 8-K - R1 RCM INC. | a8-28xk.htm |

Second Quarter 2017 Results Conference Call
August 2, 2017

2
Forward-Looking Statements and Non-GAAP Financial Measures
This presentation includes information that may constitute “forward-looking statements,” made pursuant to the safe harbor
provisions of the Private Securities Litigation Reform Act of 1995. Forward-looking statements relate to future, not past, events
and often address our expected future growth, plans and performance or forecasts. These forward-looking statements are often
identified by the use of words such as “anticipate,” “believe,” “designed,” “estimate,” “expect,” “forecast,” “intend,” “may,” “plan,”
“predict,” “project,” “target,” “will,” or “would,” and similar expressions or variations, although not all forward-looking statements
contain these identifying words. Such forward-looking statements are based on management’s current expectations about future
events as of the date hereof and involve many risks and uncertainties that could cause our actual results to differ materially from
those expressed or implied in our forward-looking statements. Subsequent events and developments, including actual results or
changes in our assumptions, may cause our views to change. We do not undertake to update our forward-looking statements
except to the extent required by applicable law. Readers are cautioned not to place undue reliance on such forward-looking
statements.
All forward-looking statements included herein are expressly qualified in their entirety by these cautionary statements. Our actual
results and outcomes could differ materially from those included in these forward-looking statements as a result of various factors,
including, but not limited to successful integration of transitioned Ascension employees, ability to achieve or maintain profitability
and retain existing customers or acquire new customers, implementation of our technologies or services with our customers or
implementation costs that exceed our expectations, fluctuations in our quarterly results of operations and cash flows, as well as
the factors discussed under the heading “Risk Factors” in our annual report on Form 10-K for the year ended December 31, 2016,
our 2017 quarterly reports on Form 10-Q and any other periodic reports that the Company files with the Securities and Exchange
Commission.
This presentation includes the following non-GAAP financial measures : Gross Cash Generated and Net Cash Generated from
Customer Contracting Activities (on a historical basis), and Adjusted EBITDA (on a projected basis). Please refer to the Appendix
located at the end of this presentation for a reconciliation of the non-GAAP financial measures to the most directly comparable
GAAP financial measure.

3
Second Quarter Highlights
Financial Results
Revenue of $99.4 million and adjusted EBITDA of ($3.3) million
RCM and PAS businesses executing well
2017 revenue guidance raised by $25 million, to $425 - $450 million
On track to generate positive adjusted EBITDA and positive free cash flow in 2H’17 and beyond
Ascension Deployment
Phase-1 Update:
Deployment largely complete
Transitioned 93% of work scheduled to move to shared services centers; deployed all R1 Hub
technology and rationalized 77% of targeted vendor spend
Now largely in execution mode at Phase-1 to drive steady improvement in margins
Phase-2 Update:
Onboarding started in late June; onboarded ~900 employees through July
Expect Indiana and Florida deployment to be completed in early 2018
Wisconsin onboarding scheduled to begin in Q4’17

4
Market Commentary and Update on Key Initiatives
Market Commentary
RCM market continues to be served by highly fragmented vendors who largely operate in silos
Lack of integration between vendors is a major source of inefficiency in the revenue cycle
We continue to feel bullish about our offering and competitive positioning:
End-to-end tech-enabled services model is ideal for managing the revenue cycle
Our technology, standardized processes and 13+ years of experience in complex environments are
significant assets and competitive advantage
Key Initiatives
Three pilots underway for transformation of front-end physician-patient experience (discussed on last call).
Selected two key technology partners in Q2, and expect rollout to broader customer base in 2018
Physician RCM is strategically important – our vision is to provide a holistic, integrated commercial
infrastructure to manage the revenue cycle that spans care settings and payment models. Key elements of
Physician RCM approach:
Further build out our physician capabilities through organic and/or inorganic investments
Drive smart process-integration between physician and inpatient environments
Build a leading platform for evolving payment models

5
Sales & Marketing
Gary Long - Chief Commercial Officer
More than 20 years of experience in healthcare, joins R1 from Premier Inc., where he was Senior Vice
President and Chief Sales Officer
Experience with enterprise sales with long sales cycles
Will be responsible for R1’s customer growth initiatives, including sales, marketing, product management
and solution development
• Expanded Portfolio of Modular Solutions:
• Five modules focused around key RCM performance outcomes where R1 is in a strong position to drive
meaningful value for customers
• New effort is proactive, versus historically reactive. Key decision drivers in pursuing a modular strategy:
• Existing R1 capabilities and presence in a market where health systems’ satisfaction with other
vendors is relatively low
• Opportunity to begin relationships and deepen them over time
• Favorable economic profile –ROI is higher due to lower upfront costs, margin rates are better than
end-to-end
• Signed on Central Maine Healthcare for Revenue Capture Solutions

6
2Q’17 non-GAAP Results – Q/Q and Y/Y Comparison
($ in millions) 2Q’17 1Q’17 2Q’16 Key change driver(s)
Revenue (for 2017); Gross
Cash Generated (for 2016)
$99.4 $86.9 $38.3
• Onboarding of Phase-1 Ascension
employees
• PAS growth q/q and y/y
Cost of Services $91.9 $76.8 $41.4
• Phase-1 ABM costs
• Staffing of shared services centers
• Upfront costs in Wisconsin
SG&A $10.8 $11.5 $14.3 • June 2016 restructuring
Adjusted EBITDA (for 2017);
Net Cash Generated (for 2016)
($3.3) ($1.4) ($17.4) • Combination of above reasons
A reconciliation of non-GAAP to GAAP measures is provided in the Appendix of this presentation

7
Additional Commentary
Cash balance of $134 million as of 6/30/17, incl. restricted cash
Declined $10 million from 3/31/17, driven by:
$7 million for capex related to expansion of our India footprint and IT investment
$7 million for the purchase of a contracting software technology
Above factors offset by an $11 million reduction in accounts receivable and other
working capital improvements

8
2017 Guidance
($ in millions) 2017
Revenue $425 - $450
GAAP Operating Income ($25) – ($30)
Adjusted EBITDA* $0 - $5
* Adjusted EBITDA is calculated as GAAP operating income plus depreciation and
amortization expense, share-based compensation expense, and severance and other costs.

9
Appendix

10
Use of Non-GAAP Financial Measures
In order to provide a more comprehensive understanding of the information used by R1’s management team in financial and operational
decision making, the Company supplements its GAAP consolidated financial statements with certain non-GAAP financial measures, which
are included in this presentation.
For the three and six months ended June 30, 2017: As of January 1, 2017, the Company adopted Accounting Standards Update ("ASU") No.
2014-09, Revenue from Contracts with Customers (Topic 606). Subsequent to adoption of Topic 606, the non-GAAP financial measure
referenced in the press release is adjusted EBITDA. Adjusted EBITDA is defined as GAAP net income before net interest income, income tax
provision, depreciation and amortization expense, share-based compensation expense, and severance & certain other items.
For the three and six months ended June 30, 2017 : Prior to the adoption of Topic 606, non-GAAP financial measures utilized by the
company included gross cash generated from customer contracting activities, and net cash generated from customer contacting activities.
Gross cash generated from customer contracting activities was defined as GAAP net services revenue, plus the change in deferred
customer billings. Accordingly, gross cash generated from customer contracting activities is the sum of (i) invoiced or accrued net operating
fees, (ii) cash collections on incentive fees and (iii) other services fees. Net cash generated from customer contracting activities was
defined as net income before net interest income, income tax provision, depreciation and amortization expense, share-based
compensation expense, and severance & certain other items. Deferred customer billings include the portion of both (i) invoiced or accrued
net operating fees and (ii) cash collections of incentive fees, in each case, that have not met our revenue recognition criteria. Deferred
customer billings are included in the detail of our customer liabilities and customer liabilities – related party balance in the condensed
consolidated balance sheets available in the Company’s Quarterly Report on Form 10-Q for the three months ended June 30, 2016.
Our Board and management team use non-GAAP measures as (i) one of the primary methods for planning and forecasting overall
expectations and for evaluating actual results against such expectations; and (ii) a performance evaluation metric in determining
achievement of certain executive incentive compensation programs, as well as for incentive compensation programs for employees.
These adjusted measures are non-GAAP and should be considered in addition to, but not as a substitute for, the information prepared in
accordance with GAAP.

11
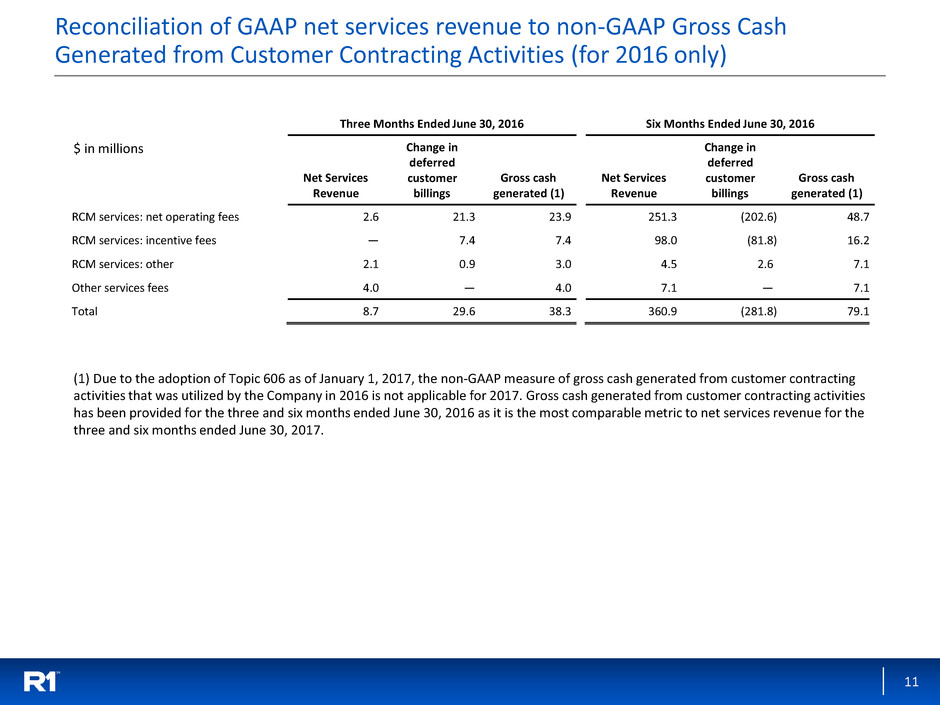
Reconciliation of GAAP net services revenue to non-GAAP Gross Cash
Generated from Customer Contracting Activities (for 2016 only)
(1) Due to the adoption of Topic 606 as of January 1, 2017, the non-GAAP measure of gross cash generated from customer contracting
activities that was utilized by the Company in 2016 is not applicable for 2017. Gross cash generated from customer contracting activities
has been provided for the three and six months ended June 30, 2016 as it is the most comparable metric to net services revenue for the
three and six months ended June 30, 2017.
$ in millions
Three Months Ended June 30, 2016 Six Months Ended June 30, 2016
Net Services
Revenue
Change in
deferred
customer
billings
Gross cash
generated (1)
Net Services
Revenue
Change in
deferred
customer
billings
Gross cash
generated (1)
RCM services: net operating fees 2.6 21.3 23.9 251.3 (202.6 ) 48.7
RCM services: incentive fees — 7.4 7.4 98.0 (81.8 ) 16.2
RCM services: other 2.1 0.9 3.0 4.5 2.6 7.1
Other services fees 4.0 — 4.0 7.1 — 7.1
Total 8.7 29.6 38.3 360.9 (281.8 ) 79.1

12
Three Months
Ended June 30,
2017 vs. 2016
Change
Six Months
Ended June 30,
2017 vs. 2016
Change
2017 2016 Amount % 2017 2016 Amount %
(In millions except percentages)
RCM services: net operating fees $ 80.1 $ 2.6 $ 77.5 n.m. 150.8 251.3 $ (100.5 ) (40.0 )%
RCM services: incentive fees 7.1 — 7.1 n.m. 12.7 98.0 (85.3 ) (87.0 )%
RCM services: other 4.1 2.1 2.0 95.2 % 7.0 4.5 2.5 55.6 %
Other services fees 8.1 4.0 4.1 102.5 % 15.8 7.1 8.7 122.5 %
Net services revenue 99.4 8.7 90.7 n.m. 186.3 360.9 (174.6 ) (48.4 )%
Change in deferred customer
billings (non-GAAP)
n.a. 29.6
n.m. n.m.
n.a
. (281.8 ) n.m. n.m.
Gross cash generated from customer
contracting activities (non-GAAP)
n.a. $ 38.3
n.m. n.m.
n.a.
79.1
n.m. n.m.
Net income (loss) (6.7 ) (40.8 ) $ 34.1 (83.6 )% (15.0 ) 126.6 $ (141.6 ) (111.8 )%
Net interest income — — — — % $ (0.1 ) 0.1 (0.2 ) (200.0 )%
Income tax provision (benefit) (3.5 ) (28.9 ) 25.4 (87.9 )% (3.6 ) 82.5 (86.1 ) (104.4 )%
Depreciation and amortization
3.8 2.4 1.4 58.3 % 7.0 4.6 2.4 52.2 %
Share-based compensation expense
2.1 11.8 (9.7 ) (82.2 )% 5.8 18.7 (12.9 ) (69.0 )%
Other 1.0 8.7 (7.7 ) (88.5 )% 1.2 19.5 (18.3 ) (93.8 )%
Adjusted EBITDA (non-GAAP) (3.3 ) (46.8 ) 43.5 (92.9 )% (4.7 ) 251.8 (256.5 ) (101.9 )%
Change in deferred customer billings (non-
GAAP) n.a. 29.6
n.m. n.m. n.a. (281.8 ) n.m. n.m.
Net cash generated from customer
contracting activities n.a $ (17.4 ) n.m. n.m. n.a $ (30.0 ) n.m. n.m.
Reconciliation of GAAP to non-GAAP Financials
n.m. - not meaningful
n.a. - Due to the adoption of Topic 606 as of January 1, 2017, the non-GAAP measure of gross and net cash generated from customer
contracting activities, that was utilized by the Company in 2016, is not applicable for 2017. Gross and net cash generated from customer
contracting activities has been provided for the three and six months ended June 30, 2016 as they are the most comparable metric to
net services revenue and adjusted EBTIDA for the three and six months ended June 30, 2017.
Due to rounding, numbers may not add up precisely to the totals provided.

13
Share-Based Compensation and D&A Expense included within Operating Expenses
Share-Based Compensation Expense Allocation Details
Depreciation and Amortization Expense Allocation Details
$ in millions
$ in millions
Three Months Ended June 30, Six Months Ended June 30,
2017 2016 2017 2016
Cost of services $ 3.5 $ 2.2 $ 6.4 $ 4.3
Selling, general and administrative 0.3 0.1 0.6 0.3
Total share-based compensation expense $ 3.8 $ 2.3 $ 7.0 $ 4.6
Three Months Ended June 30, Six Months Ended June 30,
2017 2016 2017 2016
Cost of services $ 1.0 $ 1.5 $ 2.1 $ 3.5
Selling, general and administrative 1.1 10.3 3.6 15.2
Other 0.1 1.8 0.1 1.8
Total share-based compensation expense $ 2.2 $ 13.6 $ 5.8 $ 20.5

14
Consolidated non-GAAP Financial Information
$ in millions
(1) Excludes share-based compensation, depreciation and amortization and other costs
(2) Due to the adoption of Topic 606 as of January 1, 2017, the non-GAAP measure of gross and net cash generated from customer
contracting activities that were utilized by the Company in 2016 are not applicable for 2017. Gross and net cash generated from customer
contracting activities have been provided for the three and six months ended June 30, 2016 as they are the most comparable metric to net
services revenue and adjusted EBITDA, respectively, for the three and six months ended June 30, 2017.
Three Months Ended June 30, Six Months Ended June 30,
2017 2016 2017 2016
(Unaudited) (Unaudited)
RCM services: net operating fees 80.1 23.9 150.8 48.7
RCM services: incentive fees 7.1 7.4 12.7 16.2
RCM services: other 4.1 3.0 7.0 7.1
Other services fees 8.1 4.0 15.8 7.1
Net services revenue (GAAP) (2017), Gross cash generated from customer
contracting activities (non-GAAP) (2016) (2) 99.4
38.3
186.3
79.1
Operating expenses (1) :
Cost of services (non-GAAP) 91.9 41.4 168.7 82.4
Selling, general and administrative (non-GAAP) 10.8 14.3 22.3 26.7
Sub-total 102.7 55.7 191.0 109.1
Adjusted EBITDA (non-GAAP) (2017), Net cash generated from customer
contracting activities (non-GAAP) (2016) (2) (3.3 ) (17.4 ) (4.7 ) (30.0 )

15
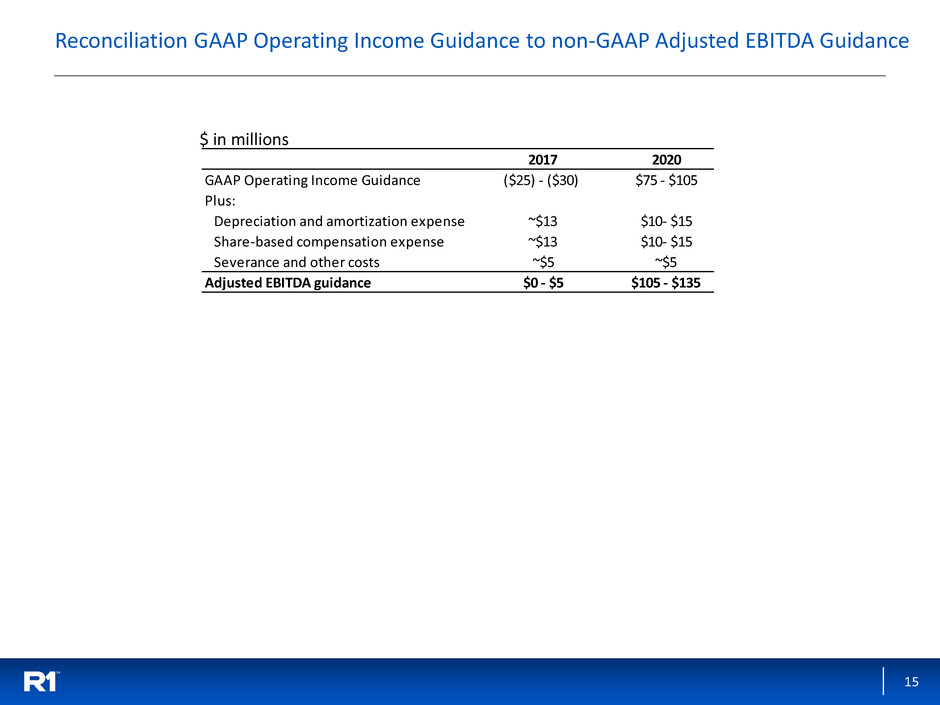
Reconciliation GAAP Operating Income Guidance to non-GAAP Adjusted EBITDA Guidance
$ in millions
2017 2020
GAAP Operating Income Guidance ($25) - ($30) $75 - $105
Plus:
Depreciation and amortization expense ~$13 $10- $15
Share-based compensation expense ~$13 $10- $15
Severance and other costs ~$5 ~$5
Adjusted EBITDA guidance $0 - $5 $105 - $135
