Attached files
| file | filename |
|---|---|
| EX-99.2 - EXHIBIT 99.2 - SEACOAST BANKING CORP OF FLORIDA | v471976_ex99-2.htm |
| EX-99.1 - EXHIBIT 99.1 - SEACOAST BANKING CORP OF FLORIDA | v471976_ex99-1.htm |
| 8-K - 8-K - SEACOAST BANKING CORP OF FLORIDA | v471976_8k.htm |
Exhibit 99.3

Q2 - 2017 Earnings Presentation Contact: (email) Chuck.Shaffer@SeacoastBank.com (phone) 772.221.7003 (web) www.SeacoastBanking.com
This presentation contains “forward - looking statements” within the meaning of Section 27 A of the Securities Act of 1933 and Section 21 E of the Securities Exchange Act of 1934 , including, without limitation, statements about future financial and operating results, ability to realized deferred tax assets, cost savings, enhanced revenues, economic and seasonal conditions in our markets, and improvements to reported earnings that may be realized from cost controls and for integration of banks that we have acquired, as well as statements with respect to Seacoast’s objectives, expectations and intentions and other statements that are not historical facts . Actual results may differ from those set forth in the forward - looking statements . Forward - looking statements include statements with respect to our beliefs, plans, objectives, goals, expectations, anticipations, estimates and intentions, and involve known and unknown risks, uncertainties and other factors, which may be beyond our control, and which may cause the actual results, performance or achievements of Seacoast to be materially different from future results, performance or achievements expressed or implied by such forward - looking statements . You should not expect us to update any forward - looking statements . You can identify these forward - looking statements through our use of words such as “may,” “will,” “anticipate,” “assume,” “should,” “support”, “indicate,” “would,” “believe,” “contemplate,” “expect,” “estimate,” “continue,” “further”, “point to,” “project,” “could,” “intend” or other similar words and expressions of the future . These forward - looking statements may not be realized due to a variety of factors, including, without limitation : the effects of future economic and market conditions, including seasonality ; governmental monetary and fiscal policies, as well as legislative, tax and regulatory changes ; changes in accounting policies, rules and practices ; the risks of changes in interest rates on the level and composition of deposits, loan demand, liquidity and the values of loan collateral, securities, and interest sensitive assets and liabilities ; interest rate risks, sensitivities and the shape of the yield curve ; the effects of competition from other commercial banks, thrifts, mortgage banking firms, consumer finance companies, credit unions, securities brokerage firms, insurance companies, money market and other mutual funds and other financial institutions operating in our market areas and elsewhere, including institutions operating regionally, nationally and internationally, together with such competitors offering banking products and services by mail, telephone, computer and the Internet ; and the failure of assumptions underlying the establishment of reserves for possible loan losses . The risks of mergers and acquisitions, include, without limitation : unexpected transaction costs, including the costs of integrating operations ; the risks that the businesses will not be integrated successfully or that such integration may be more difficult, time - consuming or costly than expected ; the potential failure to fully or timely realize expected revenues and revenue synergies, including as the result of revenues following the merger being lower than expected ; the risk of deposit and customer attrition ; any changes in deposit mix ; unexpected operating and other costs, which may differ or change from expectations ; the risks of customer and employee loss and business disruption, including, without limitation, as the result of difficulties in maintaining relationships with employees ; increased competitive pressures and solicitations of customers by competitors ; as well as the difficulties and risks inherent with entering new markets . All written or oral forward - looking statements attributable to us are expressly qualified in their entirety by this cautionary notice, including, without limitation, those risks and uncertainties described in our annual report on Form 10 - K for the year ended December 31 , 2016 under “Special Cautionary Notice Regarding Forward - Looking Statements” and “Risk Factors”, and otherwise in our SEC reports and filings . Such reports are available upon request from the Company, or from the Securities and Exchange Commission, including through the SEC’s Internet website at http : //www . sec . gov . Cautionary Notice Regarding Forward - Looking Statements 2
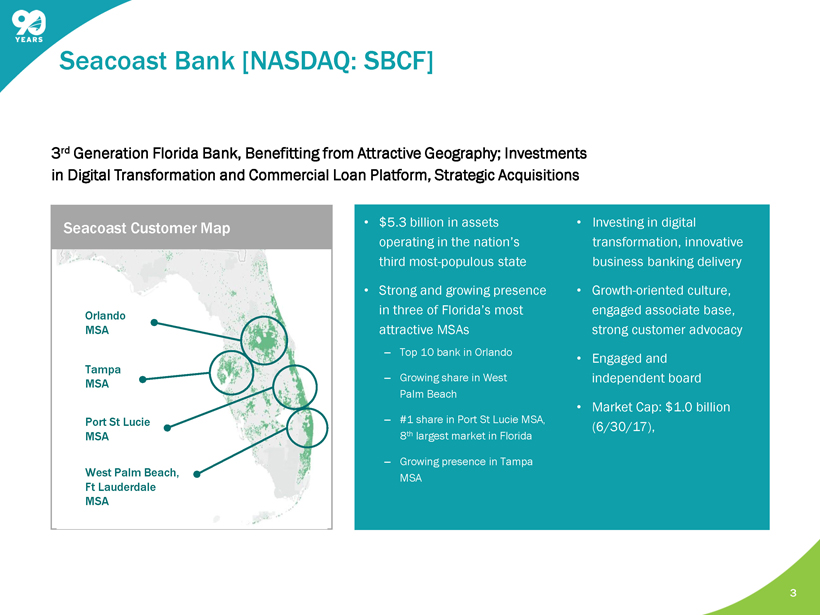
• $5.3 billion in assets operating in the nation’s third most - populous state • Strong and growing presence in three of Florida’s most attractive MSAs ‒ Top 10 bank in Orlando ‒ Growing share in West Palm Beach ‒ #1 share in Port St Lucie MSA, 8 th largest market in Florida ‒ Growing presence in Tampa MSA • Investing in digital transformation, innovative business banking delivery • Growth - oriented culture, engaged associate base, strong customer advocacy • Engaged and independent board • Market Cap: $1.0 billion ( 6 /30/17 ), 3 rd Generation Florida Bank, Benefitting from Attractive Geography; Investments in Digital Transformation and Commercial Loan Platform, Strategic Acquisitions 3 Seacoast Bank [NASDAQ: SBCF] Orlando MSA West Palm Beach, Ft Lauderdale MSA Port St Lucie MSA Tampa MSA Seacoast Customer Map
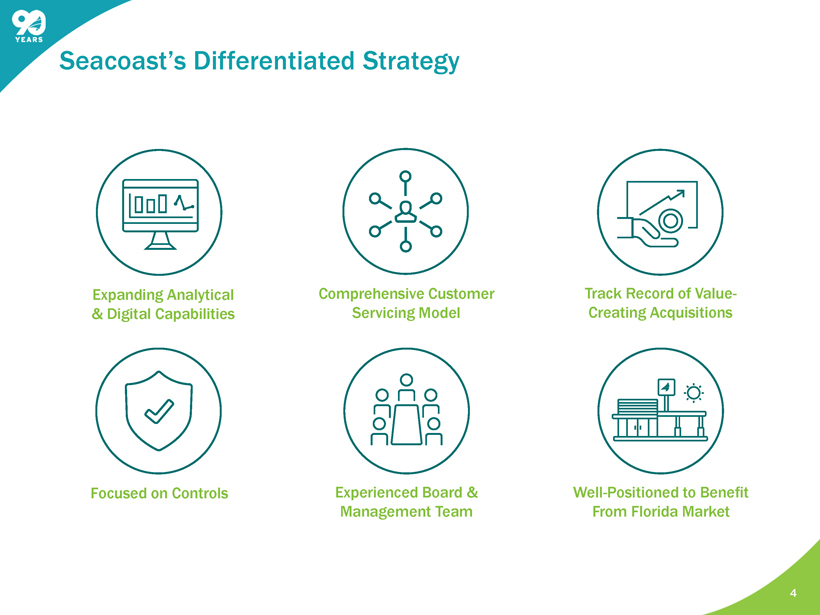
Experienced Board & Management Team Comprehensive Customer Servicing Model Track Record of Value - Creating Acquisitions Expanding Analytical & Digital Capabilities Well - Positioned to Benefit From Florida Market Focused on Controls Experienced Board & Management Team Comprehensive Customer Servicing Model Track Record of Value - Creating Acquisitions Expanding Analytical & Digital Capabilities Well - Positioned to Benefit From Florida Market Focused on Controls 4 Seacoast’s Differentiated Strategy

5 2Q’17 Highlights Our second quarter results highlight our continued success in balancing organic growth with select acquisitions that accelerate our position in key markets. Our performance also underlines our commitment to delivering on our Vision 2020 objectives • Net revenue increased 25% year - over - year to $54.6 million, net income up 44% to $7.7 million during the same period, adjusted net income up 38% to $12.7 million. • On a GAAP basis, we ended the quarter at 0.66% ROTA, 7.25% ROTCE, and 73.90% efficiency ratio. On an adjusted basis, second quarter results were 1.02% adjusted ROTA 1 , 11.22% adjusted ROTCE 1 , and 61.20% adjusted efficiency ratio 1 . • Strengthened our position in the attractive Tampa MSA through the completed acquisition of GulfShore Bank and announced agreement to purchase NorthStar Banking Corporation. • Announced an agreement to acquire Palm Beach Community Bank, broadening our presence in South Florida, the state’s largest MSA. • Reached another significant milestone, surpassing 100,000 households during the quarter. • Consumer and small business loans originated in digital channels or by our customer support center, i.e. out of branch, grew 25% over first quarter 2017 and by 9% year - over - year. • Mobile penetration increased to 32% of eligible primary consumer checking customers from 28% in June of last year. 1 Non - GAAP measure, see “Explanation of Certain Unaudited Non - GAAP Financial Measures” Effective in the first quarter of 2017, adjusted net income and adjusted noninterest expense exclude the effect of amortizati on of acquisition - related intangibles. Prior periods have been revised to conform with the current period presentation.

6 Notable Items Affecting Q2 Results As we continue to scale and invest in achieving our Vision 2020 objectives, certain items, many of which were introduced last quarter, aggregated to $8.2 million in noninterest expense in the second quarter. • GulfShore and other merger and acquisition - related charges totaled $5.1 million 1 , including $3.0 million of compensation - related expense • Expenses associated with the four previously announced branch closures, and one additional closure in the second quarter, totaled $1.9 million 1 . • During the first quarter 2017, the Company onboarded a commercial lending team focused on specialized equipment lending for lower middle market companies. The second quarter noninterest expense reflects the full $571,000 impact of this addition. • Recorded incentive expenses totaling $247,000 for one - time signing bonuses associated with investments in technology and audit talent as we staff our organization for growth. • Recognized $200,000 related to opening a second customer support center in Orlando, expanding our ability to support growth and our customers’ ever - increasing utilization of our 24/7 service model. • Net loss on other real estate owned and repossessed assets increased $ 507,000 compared to the prior quarter, with a $ 346,000 net gain in the first quarter, and losses of $161,000 in the quarter. 1 Excluded from the calculation of Adjusted Noninterest Expense, a Non - GAAP measure. See “Explanation of Certain Unaudited Non - GA AP Financial Measures.”

7 $34,801 $37,735 $37,628 $38,377 $44,320 3.63% 3.69% 3.56% 3.63% 3.84% $10,000 $15,000 $20,000 $25,000 $30,000 $35,000 $40,000 $45,000 Q2-16 Q3-16 Q4-16 Q1-17 Q2-17 Net Interest Income and Net Interest Margin* ($ in thousands) • Net interest income * totaled $44.3 million, up $5.9 million or 15% from the prior quarter and $ 9.5 million or 27% from the prior year quarter. • Net interest margin increased to 3.84% compared to 3.63% for both prior quarter and prior year quarter. The current quarter benefited from accretion on early payoffs of securities and acquired loans totaling 13bps. *Calculated on a fully taxable equivalent basis using amortized cost. Net Interest Income and Margin

8 $2,230 $2,698 $2,612 $2,422 $2,435 $2,370 $2,306 $2,334 $2,494 $2,671 $1,308 $1,283 $1,449 $1,257 $1,268 $1,364 $1,885 $1,616 $1,552 $1,272 $1,460 $1,210 $1,300 $1,447 $2,064 $ 382 $611 $733 $757 $0 $1,000 $2,000 $3,000 $4,000 $5,000 $6,000 $7,000 $8,000 $9,000 $10,000 $11,000 Q2-16 Q3-16 Q4-16 Q1-17 Q2-17 BOLI Other Income Mortgage Banking Fees Wealth Management Fees Interchange Income Service Charges Adjusted Noninterest Income (in thousands) $9,111 • Strong increases in deposit service charges and interchange income, up from the prior year quarter by 9% and 13%, respectively . • The decline in mortgage banking fees quarter over quarter was the result of lower salable originations in the second quarter, as we saw a bigger percentage of our originations transition to portfolio product. • Increases in other income largely reflect price changes implemented across the franchise on a number of services offered. $9,764 $9,922 $9,905 $10,467 $ 379 Adjusted Noninterest Income 1 1 Non - GAAP measure, see “Explanation of Certain Unaudited Non - GAAP Financial Measures” Effective in the first quarter of 2017, adjusted net income and adjusted noninterest expense exclude the effect of amortizati on of acquisition - related intangibles. Prior periods have been revised to conform with the current period presentation.

9 $15,245 $15,828 $14,799 $16,389 $18,225 $2,698 $3,223 $3,030 $3,267 $3,108 $4,184 $4,418 $4,463 $4,625 $4,750 $6,278 $6,645 $6,562 $6,641 $7,746 $0 $5,000 $10,000 $15,000 $20,000 $25,000 $30,000 $35,000 $40,000 Q2-16 Q3-16 Q4-16 Q1-17 Q2-17 Other Occupancy / Telephone Data Processing Cost Salaries and Benefits Adjusted Noninterest Expense (in thousands) $33,829 $28,405 $30,114 $28,854 $30,922 • As a percentage of average tangible assets , adjusted noninterest expense in the second quarter of 2017 was 2.73% compared to 2.71% for the prior quarter and 2.76% for the second quarter of 2016. • The increase quarter over quarter is related to the addition of ongoing headcount and expenses associated with our new Tampa market operations totaling $1.1 million, a $507 thousand impact of recording a net gain of $346 thousand on other real estate owned and repossessed assets in the prior quarter, and subsequently a loss of $161 thousand in the second quarter, the full impact of a commercial lending team acquired in the first quarter totaling $571 thousand during the second quarter, and other investments made in talent and professional services to scale the organization. 1 Non - GAAP measure, see “Explanation of Certain Unaudited Non - GAAP Financial Measures” Effective in the first quarter of 2017, adjusted net income and adjusted noninterest expense exclude the effect of amortizati on of acquisition - related intangibles. Prior periods have been revised to conform with the current period presentation. Adjusted Noninterest Expense 1
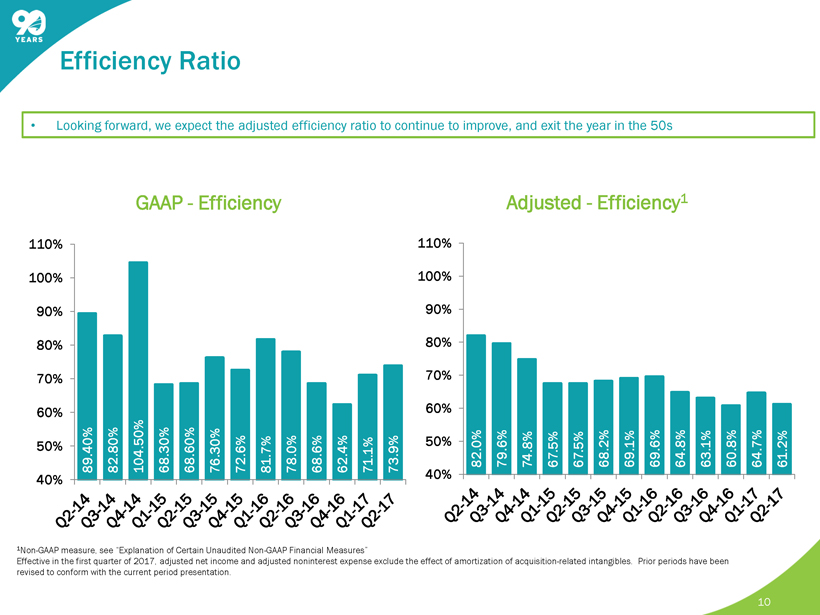
10 89.40% 82.80% 104.50% 68.30% 68.60% 76.30% 72.6% 81.7% 78.0% 68.6% 62.4% 71.1% 73.9% 40% 50% 60% 70% 80% 90% 100% 110% GAAP - Efficiency 82.0% 79.6% 74.8% 67.5% 67.5% 68.2% 69.1% 69.6% 64.8% 63.1% 60.8% 64.7% 61.2% 40% 50% 60% 70% 80% 90% 100% 110% Adjusted - Efficiency 1 1 Non - GAAP measure, see “Explanation of Certain Unaudited Non - GAAP Financial Measures” Effective in the first quarter of 2017, adjusted net income and adjusted noninterest expense exclude the effect of amortizati on of acquisition - related intangibles. Prior periods have been revised to conform with the current period presentation. • Looking forward, we expect the adjusted efficiency ratio to continue to improve, and exit the year in the 50s Efficiency Ratio

11 Total Loans Outstanding (in millions) • Loans grew $714 million or 27% from year - ago levels. Adjusting for acquisitions, loans grew $463 million or 18%. Quarter over quarter, loans grew organically 4%, or $105 million. • Pipelines remain strong, with the commercial pipeline at $146 million, residential at $72 million, and consumer/small business at $50 million. $2,616 $2,769 $2,879 $2,974 $3,330 4.64% 4.67% 4.49% 4.43% 4.69% 4.26% 4.39% 4.16% 4.10% 4.33% $0 $500 $1,000 $1,500 $2,000 $2,500 $3,000 $3,500 Q2-16 Q3-16 Q4-16 Q1-17 Q2-17 Loans Reported Yield Yield Excluding Purchased Non-Impaired and Purchased Credit Impaired Loan Growth Momentum Continues, Supported by a Strong Florida Economy, and Prudent Guardrails (Yields presented above do not reflect FTE adjustments)

12 • Total deposits increased 14% from the second quarter of 2016; Transaction accounts represent 56% of total deposits, and have increased 17% year over year. • Cost of deposits remains very attractive at 0.17 %. $1,923 $1,945 $2,022 $2,096 $2,243 $1,192 $1,200 $1,149 $1,185 $1,238 $386 $365 $352 $398 $494 $0 $500 $1,000 $1,500 $2,000 $2,500 $3,000 $3,500 $4,000 $4,500 Q2-16 Q3-16 Q4-16 Q1-17 Q2-17 Transaction Accounts Savings and Money Market Time Deposits Deposit Balances (in millions) $3,975 $3,501 $3,510 $ 3,523 56% $ 3,679 The Deposit Franchise Continues to Perform Well and Serves as a Source of Earnings Strength

13 Net Charge - offs Nonperforming Loans ALLL $20,725 $22,684 $23,400 $24,562 $26,000 0.99% 0.98% 0.96% 0.95% 0.95% 2Q 16 3Q 16 4Q 16 1Q 17 2Q 17 ALLL ALLL Ratio - Non Acquired $662 $550 $1,000 $1,304 $1,401 2Q 16 3Q 16 4Q 16 1Q 17 2Q 17 Provision Loan Loss Provision $(339) $(1,409) $283 $142 $(37) - 0.05% - 0.21% 0.04% 0.02% 0.00% 2Q 16 3Q 16 4Q 16 1Q 17 2Q 17 NCO NCO / Loans $10,919 $10,561 $11,023 $10,557 $10,541 $4,360 $7,876 $7,048 $6,428 $6,632 0.58% 0.66% 0.62% 0.57% 0.52% 0.00% 0.50% 1.00% 1.50% 2.00% $0 $5,000 $10,000 $15,000 $20,000 2Q 16 3Q 16 4Q 16 1Q 17 2Q 17 NPL - nonacquired NPL - acquired Total NPL Ratio Credit Quality ($ in thousands)

Capital Position 14 Tangible Book Value / Book Value Per Share $9.08 $9.35 $9.37 $10.41 $10.55 $11.20 $11.45 $11.45 $12.34 $13.29 2Q 16 3Q 16 4Q 16 1Q 17 2Q 17 Tangible Book Value Per Share Book Value Per Share 10.6% 12.6% 13.1% 10.7% 11.2% 2Q 16 3Q 16 4Q 16 1Q 17 2Q 17 Adjusted Return on Tangible Common Equity 1 13.5% 13.4% 13.3% 14.9% 14.5% 12.8% 12.6% 12.6% 14.2% 13.8% 2Q 16 3Q 16 4Q 16 1Q 17 2Q 17 Total Risk Based Capital Tier 1 Ratio Total Risk Based and Tier 1 Capital Tangible Common Equity / Tangible Assets 8.0% 8.0% 7.7% 9.0% 8.9% 2Q 16 3Q 16 4Q 16 1Q 17 2Q 17 1 Non - GAAP measure, see “Explanation of Certain Unaudited Non - GAAP Financial Measures” Effective in the first quarter of 2017, adjusted net income and adjusted noninterest expense exclude the effect of amortizati on of acquisition - related intangibles. Prior periods have been revised to conform with the current period presentation.

Investor Presentation Charles M. Shaffer Executive Vice President Chief Financial Officer (772) 221 - 7003 Chuck.Shaffer@seacoastbank.com INVESTOR RELATIONS www.SeacoastBanking.com NASDAQ: SBCF 15 15 Contact Details: Seacoast Banking Corporation of Florida

16
This presentation contains financial information determined by methods other than Generally Accepted Accounting Principles (“GAAP”) . The financial highlights provide reconciliations between GAAP net income and adjusted net income, GAAP income and adjusted pretax, preprovision income . Management uses these non - GAAP financial measures in its analysis of the Company’s performance and believes these presentations provide useful supplemental information, and a clearer understanding of the Company’s performance . The Company believes the non - GAAP measures enhance investors’ understanding of the Company’s business and performance and if not provided would be requested by the investor community . These measures are also useful in understanding performance trends and facilitate comparisons with the performance of other financial institutions . The limitations associated with operating measures are the risk that persons might disagree as to the appropriateness of items comprising these measures and that different companies might calculate these measures differently . The Company provides reconciliations between GAAP and these non - GAAP measures . These disclosures should not be considered an alternative to GAAP . Explanation of Certain Unaudited Non - GAAP Financial Measures 17

( Q2 16 – Q2 17) GAAP to Non - GAAP Reconciliation 18 (Dollars in thousands except per share data) Second Quarter: 2017 First Quarter: 2017 Fourth Quarter: 2016 Third Quarter: 2016Second Quarter: 2016 Net income (loss) $7,676 $7,926 $10,771 $9,133 $5,332 Boli Income 0 0 0 0 0 Security Gains -21 0 -7 -225 -47 Total Adjustments to Revenue -21 0 -7 -225 -47 Merger related charges 5,081 533 561 1,699 2,446 Amortization of intangibles 839 719 719 728 593 Branch reductions and other expense initiatives 1,876 2,572 163 894 1,587 Early redemption cost for FHLB advances 0 0 0 0 1777 Total Adjustments to Noninterest Expense 7,796 3,824 1,443 3,321 6,403 Effective tax rate on adjustments -2,786 -1,480 -404 -1,168 -2,532 Adjusted Net Income $12,665 $10,270 $11,803 $11,061 $9,156 Earnings per diluted share, as reported 0.18 0.20 0.28 0.24 0.14 Adjusted earnings per diluted share 0.29 0.26 0.31 0.29 0.24 Average shares outstanding (000) 43,556 39,499 38,252 38,170 38,142 Net Revenue $54,644 $48,070 $47,354 $47,437 $43,651 Total Adjustments to Revenue -21 0 -7 -225 -47 Adjusted Net Revenue 54,623 48,070 47,347 47,212 43,604 Noninterest Expense 41,625 34,746 30,297 33,435 34,808 Total Adjustments to Noninterest Expense 7,796 3,824 1,443 3,321 6,403 Adjusted Noninterest Expense 33,829 30,922 28,854 30,114 28,405 Foreclosed property expense and net (gain)/loss on sale 297 -293 -78 124 -41 Net Adjusted Noninterest Expense 33,532 31,215 28,932 29,990 28,446

GAAP to Non - GAAP Reconciliation ( Q2 16 – Q2 17) 19 (Dollars in thousands) Second Quarter: 2017 First Quarter: 2017 Fourth Quarter: 2016 Third Quarter: 2016Second Quarter: 2016 Adjusted Revenue 54,623 48,070 47,347 47,212 43,604 Impact of FTE adjustment 164 211 204 287 308 Adjusted Revenue on a fully taxable equivalent basis 54,787 48,281 47,551 47,499 43,912 Adjusted Efficiency Ratio 61.2% 64.7% 60.8% 63.1% 64.8% Average Assets $5,082,002 $4,699,745 $4,572,188 $4,420,438 $4,206,800 Less average goodwill and intangible assets -114,563 -78,878 -79,620 -80,068 -69,449 Average Tangible Assets 4,967,439 4,620,867 4,492,568 4,340,370 4,137,351 Return on Average Assets (ROA) 0.61% 0.68% 0.94% 0.82% 0.51% Impact of removing average intangible assets and related amortization 0.05% 0.06% 0.06% 0.06% 0.05% Return on Tangible Average Assets (ROTA) 0.66% 0.74% 1.00% 0.88% 0.56% Impact of other adjustments for Adjusted Net Income 0.36% 0.16% 0.05% 0.13% 0.33% Adjusted Return on Average Tangible Assets 1.02% 0.90% 1.05% 1.01% 0.89% Average Shareholders' Equity $567,448 $466,847 $437,077 $430,410 $416,748 Less average goodwill and intangible assets -114,563 -78,878 -79,620 -80,068 -69,449 Average Tangible Equity 452,885 387,969 357,457 350,342 347,299 Return on Average Shareholders' Equity 5.4% 6.9% 9.8% 8.4% 5.1% Impact of removing average intangible assets and related amortization 1.9% 1.9% 2.7% 2.5% 1.5% Return on Average Tangible Common Equity (ROTCE) 7.3% 8.8% 12.5% 10.9% 6.6% Impact of other adjustments for Adjusted Net Income 3.9% 1.9% 0.6% 1.7% 4.0% Adjusted Return on Average Tangible Common Equity 11.2% 10.7% 13.1% 12.6% 10.6%