Attached files
| file | filename |
|---|---|
| EX-99.1 - EXHIBIT 99.1 - Customers Bancorp, Inc. | a2q17pressrelease.htm |
| 8-K - 8-K - Customers Bancorp, Inc. | a8k063017.htm |

Highly Focused, Low Risk, Above Average Growth
Bank Holding Company
Investor Presentation
July, 2017
NYSE: CUBI
Member FDIC
2
Forward-Looking Statements
This presentation, as well as other written or oral communications made from time to time by us, contains forward-looking information within the meaning of the
safe harbor provisions of the U.S. Private Securities Litigation Reform Act of 1995. These statements relate to future events or future predictions, including events
or predictions relating to future financial performance, and are generally identifiable by the use of forward-looking terminology such as “believe,” “expect,” “may,”
“will,” “should,” “plan,” “intend,” or “anticipate” or the negative thereof or comparable terminology. Forward- looking statements in this presentation include,
among other matters, guidance for our financial performance, and our financial performance targets. Forward-looking statements reflect numerous assumptions,
estimates and forecasts as to future events. No assurance can be given that the assumptions, estimates and forecasts underlying such forward-looking statements
will accurately reflect future conditions, or that any guidance, goals, targets or projected results will be realized. The assumptions, estimates and forecasts
underlying such forward-looking statements involve judgments with respect to, among other things, future economic, competitive, regulatory and financial market
conditions and future business decisions, which may not be realized and which are inherently subject to significant business, economic, competitive and regulatory
uncertainties and known and unknown risks, including the risks described under “Risk Factors” in our Annual Report on Form 10-K for the year ended December 31,
2016 and subsequent Quarterly Reports on Form 10-Q, as such factors may be updated from time to time in our filings with the SEC. Our actual results may differ
materially from those reflected in the forward-looking statements.
In addition to the risks described under “Risk Factors” in our filings with the SEC, important factors to consider and evaluate with respect to our forward-looking
statements include:
• changes in external competitive market factors that might impact our results of operations;
• changes in laws and regulations, including without limitation changes in capital requirements under Basel III;
• changes in our business strategy or an inability to execute our strategy due to the occurrence of unanticipated events;
• our ability to identify potential candidates for, and consummate, acquisition or investment transactions;
• the timing of acquisition, investment or disposition transactions;
• constraints on our ability to consummate an attractive acquisition or investment transaction because of significant competition for these opportunities;
• local, regional and national economic conditions and events and the impact they may have on us and our customers;
• costs and effects of regulatory and legal developments, including the results of regulatory examinations and the outcome of regulatory or other governmental
inquiries and proceedings, such as fines or restrictions on our business activities;
• our ability to attract deposits and other sources of liquidity;
• changes in the financial performance and/or condition of our borrowers;
• changes in the level of non-performing and classified assets and charge-offs;
• changes in estimates of future loan loss reserve requirements based upon the periodic review thereof under relevant regulatory and accounting requirements;
• inflation, interest rate, securities market and monetary fluctuations;

3
Forward-Looking Statements
• timely development and acceptance of new banking products and services and perceived overall value of these products and services by users, including the
products and services being developed and introduced to the market by the BankMobile division of Customers Bank;
• changes in consumer spending, borrowing and saving habits;
• technological changes;
• our ability to increase market share and control expenses;
• continued volatility in the credit and equity markets and its effect on the general economy;
• effects of changes in accounting policies and practices, as may be adopted by the regulatory agencies, as well as the Public Company Accounting Oversight
Board, the Financial Accounting Standards Board and other accounting standard setters;
• the businesses of Customers Bank and any acquisition targets or merger partners and subsidiaries not integrating successfully or such integration being more
difficult, time-consuming or costly than expected;
• material differences in the actual financial results of merger and acquisition activities compared with our expectations, such as with respect to the full realization
of anticipated cost savings and revenue enhancements within the expected time frame;
• our ability to successfully implement our growth strategy, control expenses and maintain liquidity;
• Customers Bank's ability to pay dividends to Customers Bancorp;
• risks related to the sale of BankMobile including:
• our ability to successfully complete a sale and the timing of completion;
• the ability of Customers and a buyer to meet all of the conditions to completion of a sale;
• the impact of an announcement of a sale on the value of our securities, our business and our relationship with employees and customers;
• our use of the proceeds from a sale if any; and
• the effect on Customers' business if a sale is not completed and Customers is unable to sell or otherwise dispose of BankMobile.
• risks relating to BankMobile in the event Customers is unable to sell the BankMobile business, including:
• The execution of our BankMobile integration and business plan may be less successful, more difficult, time-consuming or costly than expected,
and that BankMobile may be unable to realize anticipated cost savings and revenue enhancements within the expected time frame or at all;
• material variances in the adoption rate of BankMobile's services by new students and/or the usage rate of BankMobile's services by current
student customers compared to our expectations;
4
Forward-Looking Statements
• the levels of usage of other BankMobile student customers following graduation of additional product and service offerings of BankMobile or
Customers Bank, including mortgages and consumer loans, and the mix of products and services used;
• our ability to implement changes to BankMobile's product and service offerings under current and future regulations and governmental policies;
• our ability to effectively manage revenue and expense fluctuations that may occur with respect to BankMobile's student-oriented business
activities, which result from seasonal factors related to the higher-education academic year;
• our ability to implement our strategy regarding BankMobile, including with respect to our intent to sell or otherwise dispose of the BankMobile
business in the future, depending upon market conditions and opportunities;
• BankMobile's ability to successfully implement its growth strategy and control expenses; and
• the effects on BankMobile’s results of operations in the event that Customers’ total assets exceed $10 billion at December 31, 2017;
You are cautioned not to place undue reliance on any forward-looking statements we make, which speak only as of the date they are made. We do not undertake
any obligation to release publicly or otherwise provide any revisions to any forward-looking statements we may make, including any forward-looking financial
information, to reflect events or circumstances occurring after the date hereof or to reflect the occurrence of unanticipated events, except as may be required
under applicable law.

5
Investment Proposition
Customers Bank’s BankMobile Division is Classified as Held for Sale in all
Customers’ Consolidated Financial Statements released since January 2017,
Including the January, April and July Earnings Releases, the Form 10K as of,
and for the Period Ending December 31, 2016, and the Form 10Q as of, and
for the Period Ended March 31, 2017. Amounts Included in this Investor
Presentation are “Combined”, Including Both Continuing and Discontinued
Operations, Unless Otherwise Indicated

6
Q2 2017 Highlights
Amounts presented are on a “Combined” basis unless otherwise noted.
(1) Non-GAAP measure calculated as GAAP net income, plus provisions for loan losses and income tax divided by average total assets.
(2) Non-GAAP measure calculated as GAAP net income available to common shareholders, plus provisions for loan losses and income tax expense divided by average common equity.
(3) Non-GAAP measure calculated as GAAP total shareholders equity less preferred stock, less goodwill and other intangibles divided by average total assets less average goodwill and other intangibles
• Q2 2017 Net Income to Common Shareholders of $20.1 million Up 15.4% Over Q2 2016
• Q2 2017 Diluted Earnings Per Common Share of $0.62, Up 5.1% from Q2 2016
• Q2 2017 Net Income from Continuing Operations to Common Shareholders was $25.3 million Up 28.5% Over Q2 2016
• Q2 2017 Diluted Earnings Per Common Share from Continuing Operations was $0.78 for Q2 2017 Up 16.4% from Q2 2016
• Q2 2017 Return on Average Assets of 0.93%
• Q2 2017 Return on Average Common Equity of 11.84%
• Pre-tax, pre-provision ROAA (1) and ROACE (2) for Q2 2017 was 1.43% and 19.42%, respectively
• June 30, 2017 Shareholders Equity of $910 million, up 33.8% from June 30, 2016 with Estimated Tier 1 Risk Based Capital of
10.94% and Tangible Common Equity to Average Tangible Assets (3) of 6.59% for Q2 2017
• Book Value Per Common Share of $22.54 Up 12.8% from Q2 2016
• Total assets of $10.9 billion as of June 30, 2017, up $1.0 billion from March 31, 2017
• Q2 2017 Total Loans Up 6.7% to $9.0 billion, and Total Deposits from Continuing Operations Up 7.8% to $7.0 billion from Q2
2016
• Q2 2017 Efficiency Ratio from Continuing Operations was 40.6% Compared to Q2 2016 Efficiency Ratio from Continuing
Operations of 46.5%
• BankMobile Classified as Held for Sale and Reported as Discontinued Operations in Financial Reports
• Non-Performing Loans to Total Loans only 0.21% and Reserves for Loan Losses 204.59% of Non-Performing Loans
• Customers Bancorp, Inc. issued $100 million five year senior debt bearing interest at 3.95% on June 30, 2017
7
Investment Proposition
Highly Focused, Innovative, Relationship Banking Based Commercial Bank Providing;
Strong Organic Growth, Well Capitalized, Branch Lite Bank in Attractive Markets
Highly skilled teams targeting privately held businesses and high net worth families
Robust risk management driven business strategy
Target market from Boston to Philadelphia along Interstate 95
Strong Profitability, Growth & Efficient Operations
Operating efficiencies offset tighter margins and generate sustainable profitability
Continuing operations efficiency ratio in the 40’s
Target above average ROA (~1%) and ROCE (~11%)
Strong Credit Quality & Low Interest Rate Risk
Unwavering underwriting standards
Loan portfolio performance consistently better than industry and peers
Somewhat asset sensitive
Attractive Valuation
July 19, 2017 share price of $27.95, 10.8x street estimated 2017 earnings and 1.2x book value
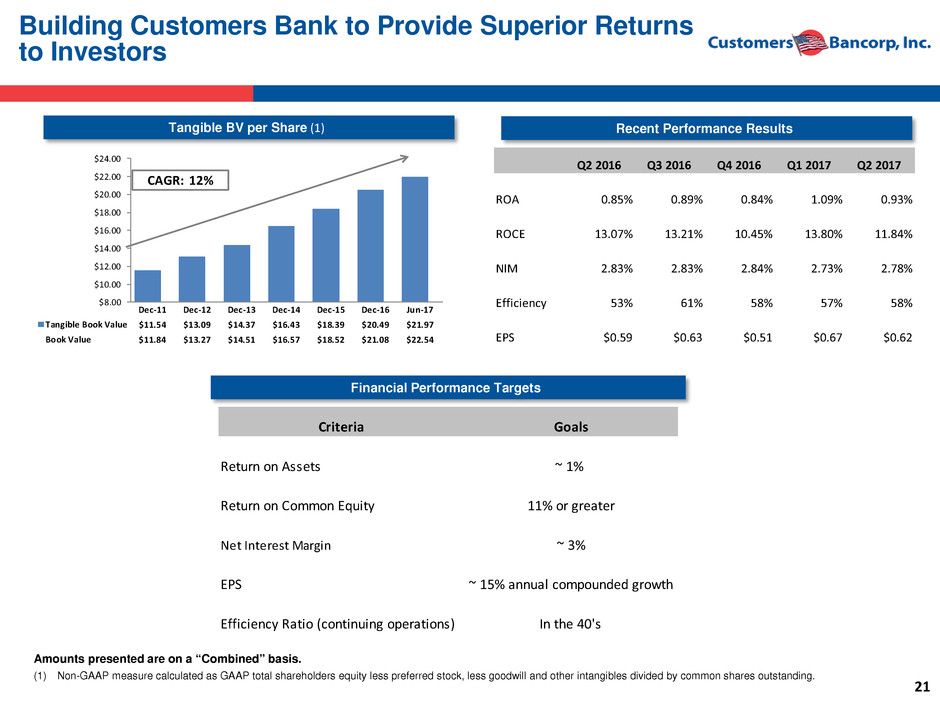
June 30, 2017 tangible book value(1) of $21.97, up 90% since Dec 2011 with a CAGR of 12%
Amounts presented are on a “Combined” basis unless otherwise noted.
(1) Non-GAAP measure calculated as GAAP total shareholders equity less preferred stock, less goodwill and other intangibles divided by common shares outstanding.

8
Customers
Bank =
Relationships
& Innovation
Innovator /
Disruptor
Experienced
Leadership
Branch Lite
Unique
“Single Point
of Contact”
Model
High Tech /
High Touch
Product
Dominance
Strong Asset
Quality
High Growth
/ Superior
Performer
Customers Business Model
Approach to Winning Model
Relationship driven but never deviate from following critical success factors
• Only focus on very strong credit quality niches
• Very strong risk management culture
• Operate at lower efficiency ratio than peers to deliver sustainable strong profitability and growth
• Always attract and retain top quality talent
• Culture of innovation and continuous improvement

9
Very Experienced Teams Exceptional Service Risk Based Incentive Compensation
Banking Strategy – Community Business Banking
Community Business Bank is Focused on the following businesses:
• Banking Privately Held Businesses – Commercial C&I loans are
40% of the portfolio
• Manufacturing, service, technology, wholesale,
equipment financing, private mid size mortgage
companies
• Banking High Net Worth Families – Multi Family loans are 40% of
the portfolio; New York and regional multi family lending
• Selected Commercial Real Estate loans are only 14% of portfolio
Amounts presented are on a continuing operations basis.
Non-Owner Occupied
CRE
14%
Commerical - Mortgage
Warehouse
24%
Commercial - C&I,
Owner Occupied
16%
Multi Family loans
40%
Consumer &
Residential
6%
Commercial
40%

10
Our Competitive Advantage: A Highly Experienced Management Team
Name Title
Years of Banking
Experience Background
Jay S. Sidhu Chairman & CEO 41 Chairman and CEO of Sovereign Bank & Sovereign Bancorp, Inc.
Richard A. Ehst President & COO 49 EVP, Commercial Middle Market, Regional President and Managing Director of Corporate Communications at Sovereign Bank
Robert E. Wahlman,
CPA
Chief Financial Officer 36 CFO of Doral Financial and Merrill Lynch Banks; various roles at Bank One, US GAO and KPMG.
Steve Issa
EVP, New England Market President, Chief
Lending Officer
40 EVP, Managing Director of Commercial and Specialty Lending at Flagstar and Sovereign Bank.
George Maroulis
EVP, Group Director of Private &
Commercial Banking - NY Metro
25 Group Director and SVP at Signature Bank; various positions at Citibank and Fleet/Bank of America's Global Commercial & Investment Bank
Timothy D. Romig
EVP, Group Director of Commercial
Banking - PA/NJ
33 SVP and Regional Executive for Commercial Lending (Berks and Montgomery County), VIST Financial; SVP at Keystone / M&T Bank
Ken Keiser
EVP, Director CRE and Multi-Family
Housing Lending
40 SVP and Market Manager, Mid-Atlantic CRE Lending at Sovereign Bank; SVP & Senior Real Estate Officer, Allfirst Bank / M&T Bank
Glenn Hedde
EVP, President Banking for Mortgage
Companies
30 President of Commercial Operations at Popular Warehouse Lending, LLC; various positions at GE Capital Mortgage Services and PNC Bank
James Collins EVP, Chief Administrative Officer 26 Various positions at Sovereign including Director of Small Business Banking
Thomas Jastrem EVP, Chief Credit Officer 39 Various positions at First Union Bank and First Fidelity Bank
Robert B. White EVP, Chief Risk Officer 30 President RBW Financial Consulting; various positions at Citizens Bank and GE Capital
Mary Lou Scalese EVP, Chief Auditor 41 Chief Auditor at Sovereign Bank and Chief Risk Officer at Customers Bank
Michael A. De Tommaso,
Esquire
VP, General Counsel and Corporate
Secretary
23 Former trial attorney and in-house counsel for Univest and National Penn Bank
Karen Kirchner SVP, Director Team Member Services 29 SVP, Human Resources/CoreStates Bank- various positions including Manager for HR Business Partners, Manager of Recruitment and generalist in compensation and training

11
Performance Trend
Amounts presented are on a “Combined” basis.
Source: SNL Financial
Note: Chart begins 2/21/2012, date of first public stock quote for CUBI
CUBI
KBW
Regional
Bank
$0.35
$1.57
$1.30
$1.55
$1.96
$2.31
$1.29
$0
$10
$20
$30
$40
$50
$60
$70
$80
2011 2012 2013 2014 2015 2016 YTD June
2017
Net Income & Earnings Per Share
Net Income Available to Common Shareholders Fully Diluted EPS

12
Customers Bank
Executing On Our Unique High Performing
Banking Model

13
Results in: Organic Growth of Deposits with Controlled Costs
Source: Company data.
Total Deposit Growth ($’s billions) Average DDA Growth ($mm)
Cost of Deposits Total Deposits per Branch ($mm)
Customers’ strategies of single point of contact and recruiting known teams in target markets produce
rapid deposit growth with low total cost
$124 $251
$500 $575
$657
$1,058 $1,044
$34
$42
$57
$75
$127
$353 $361
$0
$400
$800
$1,200
$1,600
Dec-11 Dec-12 Dec-13 Dec-14 Dec-15 Dec-16 Jun-17
$'s in millions
Non Interest Bearing DDA Interest Bearing DDA
CAGR: 49%
1.19%
0.87%
0.70% 0.66% 0.64%
0.76%
0.92%
0.25% 0.25% 0.25% 0.25% 0.26%
0.51%
0.97%
0.00%
0.25%
0.50%
0.75%
1.00%
1.25%
1.50%
Dec-11 Dec-12 Dec-13 Dec-14 Dec-15 Dec-16 Jun-17
Bank COD Average Fed FundsTarget Rate
CAGR: -4%
$0.7 $1.2 $1.1
$1.7 $2.3
$2.8 $2.4$0.7
$1.0 $1.3
$2.2
$2.8
$3.2 $3.6
$0.2
$0.3 $0.5
$0.6
$0.8
$1.3 $1.5
$0.0
$2.0
$4.0
$6.0
$8.0
Dec-11 Dec-12 Dec-13 Dec-14 Dec-15 Dec-16 Jun-17
$'s in billions
CD's Money Market & Savings DDA
CAGR: 33%
$112
$129
$152
$233
$319
$395 $403
$0
$50
$100
$150
$200
$250
$300
$350
$400
Dec-11 Dec-12 Dec-13 Dec-14 Dec-15 Dec-16 Jun-17
$'s in millions
CAGR: 26%
Amounts presented are on a “Combined” basis.

14
Lending Strategy
High Growth with Strong Credit Quality
Continuous recruitment and retention of high quality teams
Centralized credit committee approval for all loans
Loans are stress tested for higher rates and a slower economy
Insignificant delinquencies on loans originated since new management team took over
Creation of solid foundation for future earnings
Source: Company data. Includes deferred costs and fees.
$0.5 $0.6 $0.9 $1.0 $1.3 $1.3$0.1
$0.4
$1.1
$2.3
$2.9 $3.2
$3.5
$0.9
$1.6
$1.3
$2.1
$2.9 $3.5
$3.6
$0.2
$0.3
$0.3
$0.4
$0.4
$0.3 $0.6
$0
$2
$4
$6
$8
$10
Dec-11 Dec-12 Dec-13 Dec-14 Dec-15 Dec-16 Jun-17
Non-Owner Occupied CRE Multi Family loans
Commercial Consumer & Residential
CAGR: 38%
$'
s
in
B
ill
io
ns
Loan Growth

15
NPL
Source: SNL Financial, Company data. Peer data consists of Northeast and Mid-Atlantic banks and thrifts with comparable size in assets and loan portfolios (excluding banks with large
residential mortgage loan portfolios). Industry data includes all commercial and savings banks. Peer and Industry data as of March 31, 2017.
Demonstrate Outstanding Loan Quality
Charge Offs
3.33%
2.64%
2.06%
1.70% 1.70%
1.50%
1.83%
1.44%
1.09% 0.91% 0.89% 0.90%0.72% 0.60%
0.20% 0.15% 0.22% 0.21%
0.00%
0.50%
1.00%
1.50%
2.00%
2.50%
3.00%
3.50%
2012 2013 2014 2015 2016 Q2 2017
Industry Peer Customers Bancorp, Inc.
1.09%
0.68%
0.48% 0.42% 0.45% 0.47%0.48%
0.28%
0.15%
0.12% 0.12% 0.10%0.29% 0.22% 0.07%
0.19%
0.02% 0.02%
0.00%
0.20%
0.40%
0.60%
0.80%
1.00%
1.20%
2012 2013 2014 2015 2016 Q2 2017
Industry Peer Customers Bancorp, Inc.
Asset Quality Indicators Continue to be Strong
Note: Customers 2015 charge-offs includes 12 bps for a $9 million
fraudulent loan
Charge Off amounts presented are on a “Combined” basis and include $696 thousand of charge offs related to BankMobile in 2016 and $126 thousand
through June 30, 2017.
16
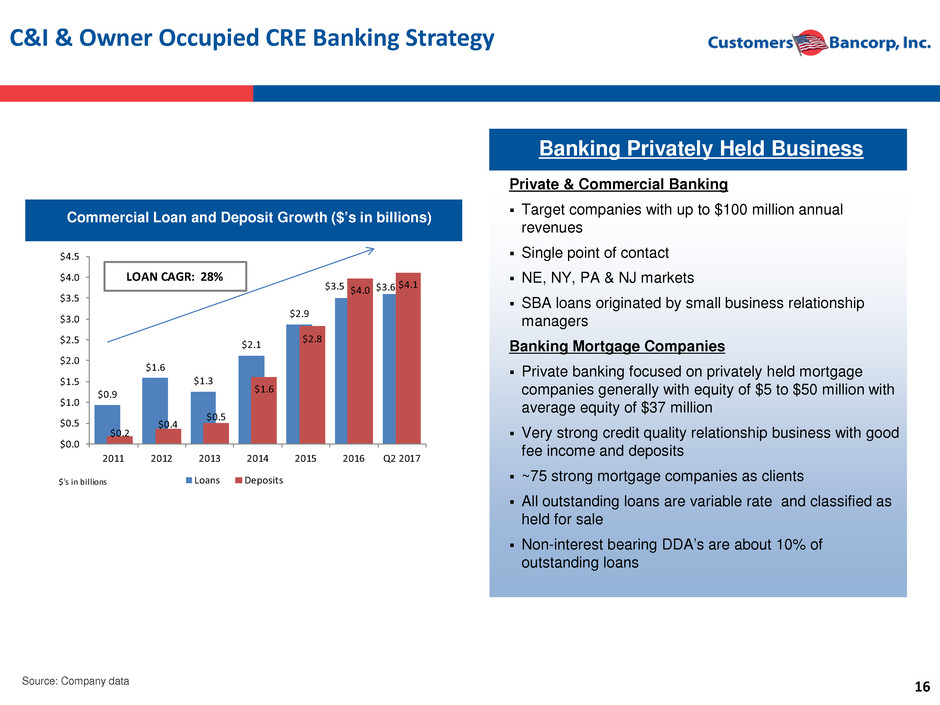
C&I & Owner Occupied CRE Banking Strategy
Private & Commercial Banking
Target companies with up to $100 million annual
revenues
Single point of contact
NE, NY, PA & NJ markets
SBA loans originated by small business relationship
managers
Banking Mortgage Companies
Private banking focused on privately held mortgage
companies generally with equity of $5 to $50 million with
average equity of $37 million
Very strong credit quality relationship business with good
fee income and deposits
~75 strong mortgage companies as clients
All outstanding loans are variable rate and classified as
held for sale
Non-interest bearing DDA’s are about 10% of
outstanding loans
Banking Privately Held Business
Commercial Loan and Deposit Growth ($’s in billions)
Source: Company data
$0.9
$1.6
$1.3
$2.1
$2.9
$3.5 $3.6
$0.2
$0.4
$0.5
$1.6
$2.8
$4.0 $4.1
$0.0
$0.5
$1.0
$1.5
$2.0
$2.5
$3.0
$3.5
$4.0
$4.5
2011 2012 2013 2014 2015 2016 Q2 2017
$'s in billions Loans Deposits
LOAN CAGR: 28%

17
Multi-Family Banking Strategy
Banking High Net Worth Families
Multi-Family Loan and Deposit Growth ($’s in billions)
Focus on families that have income
producing real estate in their portfolios
Private banking approach
Focus Markets: New York & Philadelphia
MSAs
Average Loan Size: $6.8 million
Remote banking for deposits and other
relationship based loans
Portfolio grown organically from a start up
with very experienced teams hired in the
past 4 years
Strong credit quality niche
Interest rate risk managed actively
Source: Company data
$0.1
$0.4
$1.1
$2.3
$2.9
$3.2
$3.5
$0.1 $0.3
$0.3 $0.3
$0.0
$1.0
$2.0
$3.0
$4.0
2011 2012 2013 2014 2015 2016 Q2 2017
$'s in billions Loans Deposits

18
Staff Expense Ratio
Build Efficient Operations
Source: SNL Financial, Company data based on continuing operations. Peer data consists of Northeast and Mid-Atlantic banks and thrifts with comparable size in assets and loan
portfolios (excluding banks with large residential mortgage loan portfolios). Industry data includes SEC reporting banks. Peer and Industry data as of March 31, 2017.
Occupancy Expense Ratio
Total Costs as a % of Assets
Total Revenue per Employee ($000s) Assets per Employee ($mm)
0.37% 0.38% 0.38% 0.36% 0.32%
0.28%
0.39% 0.39% 0.40% 0.38% 0.35% 0.37%0.22% 0.19% 0.15% 0.12% 0.11% 0.10%
0.00%
0.50%
2012 2013 2014 2015 2016 Q2 2017
Industry Peer Customers Bancorp, Inc.
$4.7 $4.7 $5.0 $5.3 $5.5 $5.2
$6.3 $6.5 $6.9 $7.4
$8.0 $8.2$9.3 $9.0
$13.3
$15.1
$17.6 $18.3
$0.0
$10.0
$20.0
2012 2013 2014 2015 2016 Q2 2017
Industry Peer Customers Bancorp, Inc.
1.71% 1.74% 1.71% 1.73% 1.73% 1.71%
1.45% 1.45% 1.43% 1.38% 1.36% 1.40%
1.03% 1.03%
0.83% 0.78% 0.75% 0.67%
0.00%
1.00%
2.00%
2012 2013 2014 2015 2016 Q2 2017
Industry Peer Customers Bancorp, Inc.
3.01% 3.06% 2.99% 2.98% 2.88% 2.51%
2.76% 2.83% 2.63% 2.58% 2.45% 2.53%
2.18% 2.13% 1.75% 1.48% 1.45% 1.23%
0.00%
2.00%
4.00%
2012 2013 2014 2015 2016 Q2 2017
Industry Peer Customers Bancorp, Inc.
$188 $187 $193 $204 $207 $199
$256 $259 $271 $289 $305
$310
$402
$330
$424 $465
$529 $532
$0
$200
$400
$600
2012 2013 2014 2015 2016 Q2 2017
Industry Peer Customers Bancorp, Inc.
Amounts presented are on a Continuing Operations basis.

19
Deposit, Lending and Efficiency Strategies Result in
Disciplined & Profitable Growth
Net Interest Income ($mm) (1)
$39.0
$72.1
$103.9
$151.9
$196.3
$57.6 $62.4
$63.2 $68.6
$64.6
$64.1
$0.0
$50.0
$100.0
$150.0
$200.0
$250.0
$300.0
2011 2012 2013 2014 2015 2016 YTD June
2017
CAGR: 41%
Q3
Q1
Q2
Q1
2Q '17 vs. 2Q '16
Growth
9%
Q2
Q4
$249.5
Q3
$131.0
Q4
(1) Source: Company data
(2) NII Simulation based on ALM model data and assumes a flat balance sheet with no volume increases or decline with the desired basis points increase ramped over 12 months.
(3) Non-GAAP measure calculated as GAAP net income less/plus securities gains and losses (including the impairment loss recognized on the equity investment) .
Amounts presented are on a Continuing Operations basis.
Net Interest Income Simulation (1)(2)
1.29%
2.22%
0.80%
1.59%
0.00%
0.50%
1.00%
1.50%
2.00%
2.50%
6/30/2017 6/30/2018
+200 basis points +100 basis points
Estimated Increase in Net Interest Income over
the Next Twelve Months
$9 $20 $22 $22 $28 $30 $14
$39
$72
$103
$152
$196
$250
$131
$37 $51
$74
$97 $108
$131
$61
2011 2012 2013 2014 2015 2016 YTD June
2017
0
50
100
150
200
250
300
1 2 3 4 5 6 7 8 9 10 11 12 13 14 15 16 17 18 19 20 21
Non-interest Income Net Interest Income Operating Expenses
Core Income / Expense Growth($mm) (1)
(3)

20
Deposit, Lending and Efficiency Strategies Result in
Disciplined & Profitable Growth
• Strategy execution has produced superior growth in revenues and earnings
Efficiency Ratio(1)
(1) Source: Company data
(2) Non-GAAP measure calculated as GAAP net income less/plus securities gains and losses (including the impairment loss recognized on the equity investment) .
Amounts presented are on a Continuing Operations basis.
78%
55%
59% 56%
48% 47%
42%
0%
10%
20%
30%
40%
50%
60%
70%
80%
90%
2011 2012 2013 2014 2015 2016 YTD June
2017
CAGR: -10%
Core Net Income ($mm) (1) (2) Total Revenue ($mm) (1)
$50.3
$101.0
$126.6
$177.0
$223.9
$62.9 $67.9
$69.0
$75.6
$75.7
$65.1
$0.0
$50.0
$100.0
$150.0
$200.0
$250.0
$300.0
2011 2012 2013 2014 2015 2016 YTD June
2017
CAGR: 37%
Q4
Q2
Q1 Q1
2Q '17 vs. 2Q '16
Growth
7%
Q3
$272.7
Q2
$143.5
Q3
Q4
$2.1
$17.9
$32.1
$42.7
$60.6
$18.0
$24.4
$19.7
$25.2
$20.7
$27.0
$0.0
$20.0
$40.0
$60.0
$80.0
$100.0
2011 2012 2013 2014 2015 2016 YTD June
2017
CAGR: 101%
Q1
Q2
2Q '17 vs. 2Q '16
Growth 24%
Q3
Q4
Q1
$85.4
Q2
Q3
$49.6
Q4
21
Tangible BV per Share (1)
Building Customers Bank to Provide Superior Returns
to Investors
Recent Performance Results
Financial Performance Targets
$8.00
$10.00
$12.00
$14.00
$16.00
$18.00
$20.00
$22.00
$24.00
Dec-11 Dec-12 Dec-13 Dec-14 Dec-15 Dec-16 Jun-17
Tangible Book Value $11.54 $13.09 $14.37 $16.43 $18.39 $20.49 $21.97
Book Value $11.84 $13.27 $14.51 $16.57 $18.52 $21.08 $22.54
CAGR: 12%
Q2 2016 Q3 2016 Q4 2016 Q1 2017 Q2 2017
ROA 0.85% 0.89% 0.84% 1.09% 0.93%
ROCE 13.07% 13.21% 10.45% 13.80% 11.84%
NIM 2.83% 2.83% 2.84% 2.73% 2.78%
Efficiency 53% 61% 58% 57% 58%
EPS $0.59 $0.63 $0.51 $0.67 $0.62
Criteria Goals
Return on Assets ~ 1%
Return on Common Equity 11% or greater
Net Interest Margin ~ 3%
EPS ~ 15% annual compounded growth
Efficiency Ratio (continuing operations) In the 40's
(1) Non-GAAP measure calculated as GAAP total shareholders equity less preferred stock, less goodwill and other intangibles divided by common shares outstanding.
Amounts presented are on a “Combined” basis.

22
Customers Bank
Community Business Banking and
BankMobile Business Segments

23
Business Segment Disclosures
• Customers Bank acquired the Disbursements Business of Higher One, Inc. on June 15,
2016
• The acquired Disbursements Business was combined with Customers Bank’s existing
BankMobile product line in Q2 2016
• Effective for the 2016 fourth quarter and year end financial reports, Customers begins
reporting BankMobile as discontinued operations/held for sale to the investor
community
• Q1 2017 Customers announces agreement to sell BankMobile
• Q2 2017 Customers announces buyer was not able to raise the capital required per the
contractual requirements, and that Customers had received an alternative proposal
from buyer and two unsolicited proposals, all subject to due diligence

24
History of BankMobile
• 2014 – Customers Bank began development of a consumer bank in alignment with the future model of
banking
– A completely branchless experience
– A fin-tech company with a bank charter
– 10X better customer acquisition and retention strategy than traditional players
– Better product than what exists today
– Sustainable business model
• 2015 (January) – Launched BankMobile app 1.0
– Keep it simple
– Best in class user experience
– App speaks with an authentic voice
• 2016 (June) – Acquired Disbursements Business
– Combined Disbursements and BankMobile
– Transform students into customers for life
– Leverage platform to extend services to white label partners
• 2016 (October) – Announced intent to divest BankMobile
• 2017 (March) – Announced agreement to sell BankMobile
• 2017 (April) – Launched new BankMobile mobile application
• 2017 (May) – Announced receipt of alternate unsolicited proposals
– initial buyer inability to meet contract requirements

25
Segment Financial Performance Results
• Comparable 2016 periods are not provided as BankMobile was not operating as a segment in the second quarter of 2016 and its operations
were not material.
• Segment results presented above include an internal allocation from Community Business Banking to BankMobile of $2.7 million in Q2 2017
for interest on deposits generated by the BankMobile segment used to fund the Community Business Banking Segment. The discontinued
operations loss disclosed in the income statement prepared in accordance with generally accepted accounting principles (“GAAP”) does not
consider the funds transfer pricing benefits of deposits.
• Direct operating revenues and costs are captured separately in the accounting records for each business segment. All corporate overhead
costs are assigned to the Community Business Banking segment as those costs are expected to stay with the segment following the sale of
the BankMobile segment, currently anticipated to occur within 6 to 12 months.
Amounts presented are on a “Combined” basis.
Three months ended June 30, 2017
Community
Business Banking BankMobile Consolidated
Interest income $ 91,107 $ 2,745 $ 93,852
Interest expense 25,228 18 25,246
Net interest income 65,879 2,727 68,606
Provision for loan losses 535 — 535
Non-interest income 6,971 11,420 18,391
Non-interest expense 30,567 19,846 50,413
Income (loss) before income tax expense (benefit) 41,748 (5,699 ) 36,049
Income tax expense (benefit) 14,493 (2,166 ) 12,327
Net income (loss) 27,255 (3,533 ) 23,722
Preferred stock dividends 3,615 — 3,615
Net income (loss) available to common shareholders $ 23,640 $ (3,533 ) $ 20,107
.
Six months ended June 30, 2017
Community
Business Banking BankMobile Consolidated
Interest income $ 169,938 $ 7,008 $ 176,946
Interest expense 45,883 39 45,922
Net interest income 124,055 6,969 131,024
Provision for loan losses 3,585 — 3,585
Non-interest income 12,398 28,746 41,144
Non-interest expense 60,714 39,064 99,778
Income (loss) before income tax expense (benefit) 72,154 (3,349 ) 68,805
Income tax expense (benefit) 20,609 (1,273 ) 19,336
Net income (loss) 51,545 (2,076 ) 49,469
Preferred stock dividends 7,229 — 7,229
Net income (loss) available to common shareholders $ 44,316 $ (2,076 ) $ 42,240
(dollars in thousands )

26
Other BankMobile Results
• Opened over 325,000 new checking accounts since June 16, 2016.
• Funds received from educational institutions and processed to students totaled $1.23 billion during Q2
2017.
• 33% of Title IV funds received by students at colleges to which BankMobile provided disbursement
services in Q2 2017 were deposited into accounts with BankMobile. Other students receiving Title IV
funds at these colleges requested the transfer of funds to existing accounts at other banks or received a
check.
• Signed contracts to provide disbursement services to an additional 13 educational institutions with
student enrollment totaling 88K during 2017, and 24 institutions with student enrollment totaling 147K
during the trailing four quarters. Also notable are 14 institutions totaling 100K student enrollment, which
signed in the first half of 2016 and were launched during the past year.
• Active student checking accounts serviced number 1.2 million as of June 30, 2017, with balances of $321.9
million on that date and $118.6 million non-student customers, including universities, deposits for a total
of $440.5 million deposits.
Amounts presented are on a “Combined” basis.

27
Contacts
Company:
Robert Wahlman, CFO
Tel: 610-743-8074
rwahlman@customersbank.com
www.customersbank.com
Jay Sidhu
Chairman & CEO
Tel: 610-301-6476
jsidhu@customersbank.com
www.customersbank.com
28
Appendix

29
Customers Bank
Risk Management

30
Elements of an Effective Risk Management Program

31
ERM Framework at Customers Bancorp, Inc.
Well Defined ERM Plan – ERM Integration into CAMELS +++++

32
Customers Bancorp, Inc.
Financial Statements

33
Income Statement
CUSTOMERS BANCORP, INC. AND SUBSIDIARIES
CONSOLIDATED STATEMENTS OF OPERATIONS FOR THE THREE MONTHS ENDED - UNAUDITED
(Dollars in thousands, except per share data)
Q2 Q1 Q2
2017 2017 2016
Interest income:
Loans receivable, including fees $ 67,036 $ 61,461 $ 59,013
Loans held for sale 17,524 13,946 17,429
Investment securities 7,823 5,887 3,638
Other 1,469 1,800 1,240
Total interest income 93,852 83,094 81,320
Interest expense:
Deposits 16,218 14,317 11,138
Other borrowings 1,993 1,608 1,620
FHLB advances 5,340 3,060 3,716
Subordinated debt 1,685 1,685 1,685
Total interest expense 25,236 20,670 18,159
Net interest income 68,616 62,424 63,161
Provision for loan losses 535 3,050 786
Net interest income after provision for loan losses 68,081 59,374 62,375
Non-interest income:
Mortgage warehouse transactional fees 2,523 2,221 3,074
Bank-owned life insurance 2,258 1,367 1,120
Gain on sale of SBA and other loans 573 1,328 285
Mortgage banking income 291 155 285
Deposit fees 258 324 278
Interchange and card revenue 126 203 160
Gains (losses) on investment securities 301 (1,703 ) —
Other 641 1,532 651
Total non-interest income 6,971 5,427 5,853
Non-interest expense:
Salaries and employee benefits 16,687 16,163 16,401
Professional services 2,834 2,993 2,750
Technology, communication and bank operations 2,542 3,319 2,448
Occupancy 2,536 2,586 2,363
FDIC assessments, taxes, and regulatory fees 2,320 1,632 4,289
Loan workout 408 521 487
Other real estate owned expense (income) 160 (55 ) 183
Advertising and promotion 153 180 194
Other 2,927 2,808 2,970
Total non-interest expense 30,567 30,147 32,085
Income from continuing operations before income tax expense 44,485 34,654 36,143
Income tax expense 15,533 7,730 14,369
Net income from continuing operations 28,952 26,924 21,774
Loss from discontinued operations (8,436 ) (1,898 ) (3,696 )
Income tax benefit from discontinued operations (3,206 ) (721 ) (1,405 )
Net loss from discontinued operations (5,230 ) (1,177 ) (2,291 )
Net income 23,722 25,747 19,483
Preferred stock dividends 3,615 3,615 2,062
Net income available to common shareholders $ 20,107 $ 22,132 $ 17,421
Basic earnings per common share from continuing operations $ 0.83 $ 0.77 $ 0.73
Basic earnings per common share $ 0.66 $ 0.73 $ 0.64
Diluted earnings per common share from continuing operations $ 0.78 $ 0.71 $ 0.67
Diluted earnings per common share $ 0.62 $ 0.67 $ 0.59

34
Income Statement
CUSTOMERS BANCORP, INC. AND SUBSIDIARIES
CONSOLIDATED STATEMENTS OF OPERATIONS FOR THE SIX MONTHS ENDED - UNAUDITED
(Dollars in thousands, except per share data)
June 30, June 30,
2017 2016
Interest income:
Loans receivable, including fees $ 128,497 $ 113,485
Loans held for sale 31,470 31,534
Investment securities 13,710 7,347
Other 3,269 2,352
Total interest income 176,946 154,718
Interest expense:
Deposits 30,535 21,347
Other borrowings 3,600 3,225
FHLB advances 8,401 5,984
Subordinated debt 3,370 3,370
Total interest expense 45,906 33,926
Net interest income 131,040 120,792
Provision for loan losses 3,585 2,766
Net interest income after provision for loan losses 127,455 118,026
Non-interest income:
Mortgage warehouse transactional fees 4,743 5,622
Bank-owned life insurance 3,624 2,243
Gain on sale of SBA and other loans 1,901 929
Deposit fees 582 531
Mortgage banking income 446 450
Interchange and card revenue 329 304
(Losses) gains on investment securities (1,402 ) 26
Other 2,175 1,016
Total non-interest income 12,398 11,121
Non-interest expense:
Salaries and employee benefits 32,850 32,799
Technology, communication and bank operations 5,861 4,833
Professional services 5,827 5,071
Occupancy 5,121 4,600
FDIC assessments, taxes, and regulatory fees 3,953 8,130
Loan workout 928 905
Advertising and promotion 334 337
Other real estate owned 105 470
Other 5,735 6,812
Total non-interest expense 60,714 63,957
Income from continuing operations before income tax expense 79,139 65,190
Income tax expense 23,263 24,108
Net income from continuing operations 55,876 41,082
Loss from discontinued operations (10,334 ) (5,508 )
Income tax benefit from discontinued operations (3,927 ) (2,093 )
Net loss from discontinued operations (6,407 ) (3,415 )
Net income 49,469 37,667
Preferred stock dividends 7,229 3,348
Net income available to common shareholders $ 42,240 $ 34,319
Basic earnings per common share from continuing operations $ 1.59 $ 1.40
Basic earnings per common share $ 1.38 $ 1.27
Diluted earnings per common share from continuing operations $ 1.49 $ 1.28
Diluted earnings per common share $ 1.29 $ 1.17
35
Balance Sheet
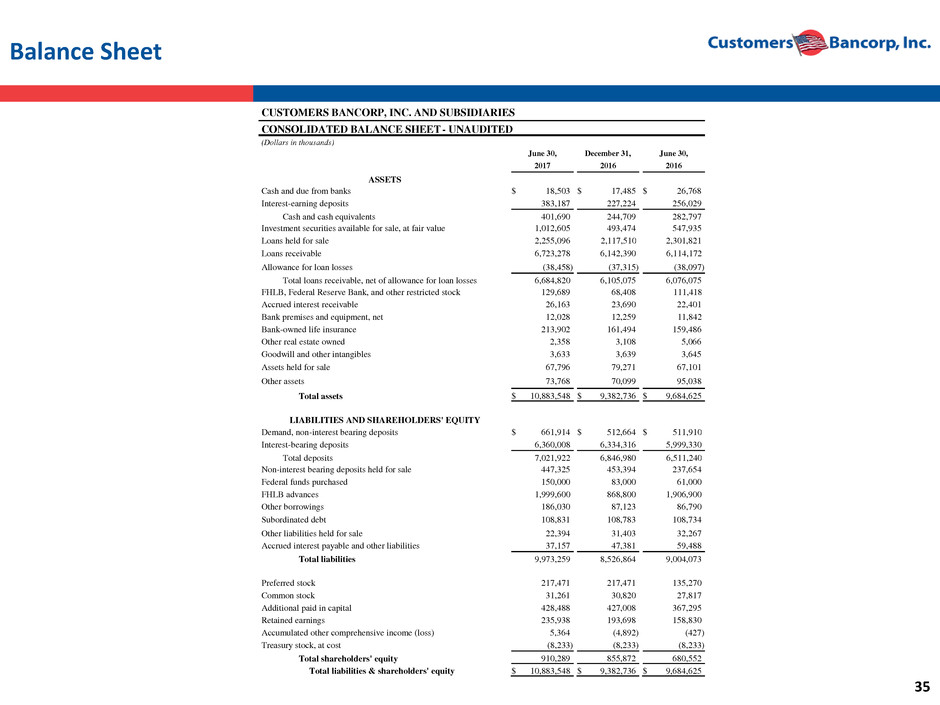
CUSTOMERS BANCORP, INC. AND SUBSIDIARIES
CONSOLIDATED BALANCE SHEET - UNAUDITED
(Dollars in thousands)
June 30, December 31, June 30,
2017 2016 2016
ASSETS
Cash and due from banks $ 18,503 $ 17,485 $ 26,768
Interest-earning deposits 383,187 227,224 256,029
Cash and cash equivalents 401,690 244,709 282,797
Investment securities available for sale, at fair value 1,012,605 493,474 547,935
Loans held for sale 2,255,096 2,117,510 2,301,821
Loans receivable 6,723,278 6,142,390 6,114,172
Allowance for loan losses (38,458 ) (37,315 ) (38,097 )
Total loans receivable, net of allowance for loan losses 6,684,820 6,105,075 6,076,075
FHLB, Federal Reserve Bank, and other restricted stock 129,689 68,408 111,418
Accrued interest receivable 26,163 23,690 22,401
Bank premises and equipment, net 12,028 12,259 11,842
Bank-owned life insurance 213,902 161,494 159,486
Other real estate owned 2,358 3,108 5,066
Goodwill and other intangibles 3,633 3,639 3,645
Assets held for sale 67,796 79,271 67,101
Other assets 73,768 70,099 95,038
Total assets $ 10,883,548 $ 9,382,736 $ 9,684,625
LIABILITIES AND SHAREHOLDERS' EQUITY
Demand, non-interest bearing deposits $ 661,914 $ 512,664 $ 511,910
Interest-bearing deposits 6,360,008 6,334,316 5,999,330
Total deposits 7,021,922 6,846,980 6,511,240
Non-interest bearing deposits held for sale 447,325 453,394 237,654
Federal funds purchased 150,000 83,000 61,000
FHLB advances 1,999,600 868,800 1,906,900
Other borrowings 186,030 87,123 86,790
Subordinated debt 108,831 108,783 108,734
Other liabilities held for sale 22,394 31,403 32,267
Accrued interest payable and other liabilities 37,157 47,381 59,488
Total liabilities 9,973,259 8,526,864 9,004,073
Preferred stock 217,471 217,471 135,270
Common stock 31,261 30,820 27,817
Additional paid in capital 428,488 427,008 367,295
Retained earnings 235,938 193,698 158,830
Accumulated other comprehensive income (loss) 5,364 (4,892 ) (427 )
Treasury stock, at cost (8,233 ) (8,233 ) (8,233 )
Total shareholders' equity 910,289 855,872 680,552
Total liabilities & shareholders' equity $ 10,883,548 $ 9,382,736 $ 9,684,625

36
Net Interest Margin
CUSTOMERS BANCORP, INC. AND SUBSIDIARIES
AVERAGE BALANCE SHEET / NET INTEREST MARGIN (UNAUDITED)
(Dollars in thousands)
Three months ended
June 30, March 31, June 30,
2017 2017 2016
Average
Balance
Average
yield or cost
(%)
Average
Balance
Average
yield or cost
(%)
Average
Balance
Average
yield or cost
(%)
Assets
Interest earning deposits $ 201,774 1.09% $ 498,364 0.79% $ 213,509 0.51%
Investment securities 1,066,277 2.94% 829,730 2.88% 550,130 2.65%
Loans held for sale 1,708,849 4.11% 1,426,701 3.96% 2,056,929 3.41%
Loans receivable 6,807,093 3.95% 6,427,682 3.88% 6,050,321 3.92%
Other interest-earning assets 105,908 3.48% 75,980 4.41% 102,599 3.79%
Total interest earning assets 9,889,901 3.81% 9,258,457 3.63% 8,973,488 3.64%
Non-interest earning assets 299,598 271,606 271,495
Assets held for sale 75,834 77,478 14,209
Total assets $ 10,265,333 $ 9,607,541 $ 9,259,192
Liabilities
Total interest bearing deposits (1) $ 6,252,293 1.04% $ 6,213,186 0.93% $ 5,770,969 0.78%
Borrowings 1,951,282 1.85% 1,130,490 2.28% 2,014,452 1.40%
Total interest bearing liabilities 8,203,575 1.23% 7,343,676 1.14% 7,785,421 0.94%
Non-interest bearing deposits (1) 556,947 524,211 475,968
Non-interest bearing deposits held for sale
(1) 525,853
790,983
283,405
Total deposits & borrowings 9,286,375 1.09% 8,658,870 0.97% 8,544,794 0.85%
Other non-interest bearing liabilities 46,819 50,351 51,854
Other liabilities held for sale 33,626 30,326 7,493
Total liabilities 9,366,820 8,739,547 8,604,141
Shareholders' equity 898,513 867,994 655,051
Total liabilities and shareholders'
equity $ 10,265,333
$ 9,607,541
$ 9,259,192
Net interest margin 2.78% 2.73% 2.83%
Net interest margin tax equivalent 2.78% 2.73% 2.83%
(1) Total costs of deposits (including interest bearing and non-interest bearing) were 0.89%, 0.77% and 0.68% for the three months ended June
30, 2017, March 31, 2017 and June 30, 2016, respectively.

37
Net Interest Margin
CUSTOMERS BANCORP, INC. AND SUBSIDIARIES
AVERAGE BALANCE SHEET / NET INTEREST MARGIN (UNAUDITED)
(Dollars in thousands)
Six months ended
June 30, June 30,
2017 2016
Average
Balance
Average
yield or cost
(%)
Average
Balance
Average
yield or cost
(%)
Assets
Interest earning deposits $ 349,250 0.88% $ 198,938 0.52%
Investment securities 948,657 2.91% 556,295 2.64%
Loans held for sale 1,568,555 4.05% 1,810,164 3.50%
Loans receivable 6,618,436 3.92% 5,864,596 3.89%
Other interest-earning assets 91,026 3.87% 91,367 4.03%
Total interest earning assets 9,575,924 3.73% 8,521,360 3.65%
Non-interest earning assets 285,609 281,916
Assets held for sale 76,722 8,436
Total assets $ 9,938,255 $ 8,811,712
Liabilities
Total interest bearing deposits (1) $ 6,232,847 0.99% $ 5,622,382 0.76%
Borrowings 1,543,154 2.01% 1,747,640 1.45%
Total interest-bearing liabilities 7,776,001 1.19% 7,370,022 0.93%
Non-interest-bearing deposits (1) 540,669 452,446
Non-interest bearing deposits held for sale (1) 657,686 316,027
Total deposits & borrowings 8,974,356 1.03% 8,138,495 0.84%
Other non-interest bearing liabilities 48,576 50,217
Other liabilities held for sale 31,985 2,470
Total liabilities 9,054,917 8,191,182
Shareholders' equity 883,338 620,530
Total liabilities and shareholders' equity $ 9,938,255
$ 8,811,712
Net interest margin 2.75% 2.85%
Net interest margin tax equivalent 2.76% 2.85%
(1) Total costs of deposits (including interest bearing and non-interest bearing) were 0.83% and 0.67% for the six months ended June 30,
2017 and 2016, respectively.

38
Loan Composition
Amounts presented are on a Continuing Operations basis.
CUSTOMERS BANCORP, INC. AND SUBSIDIARIES
PERIOD END LOAN COMPOSITION (UNAUDITED)
(Dollars in thousands)
June 30, December 31, June 30,
2017 2016 2016
Commercial:
Multi-family $ 3,550,375 $ 3,214,999 $ 3,336,083
Commercial & industrial (1) 3,607,128 3,487,668 3,464,567
Commercial real estate- non-owner occupied 1,216,012 1,193,715 1,139,711
Construction 61,226 64,789 99,615
Total commercial loans 8,434,741 7,961,171 8,039,976
Consumer:
Residential 447,150 194,197 264,968
Manufactured housing 96,148 101,730 107,874
Other consumer 2,561 2,726 2,873
Total consumer loans 545,859 298,653 375,715
Deferred (fees)/costs and unamortized (discounts)/premiums, net (2,226 ) 76 302
Total loans $ 8,978,374 $ 8,259,900 $ 8,415,993
(1) Commercial & industrial loans, including mortgage warehouse and owner occupied commercial real estate loans.
39
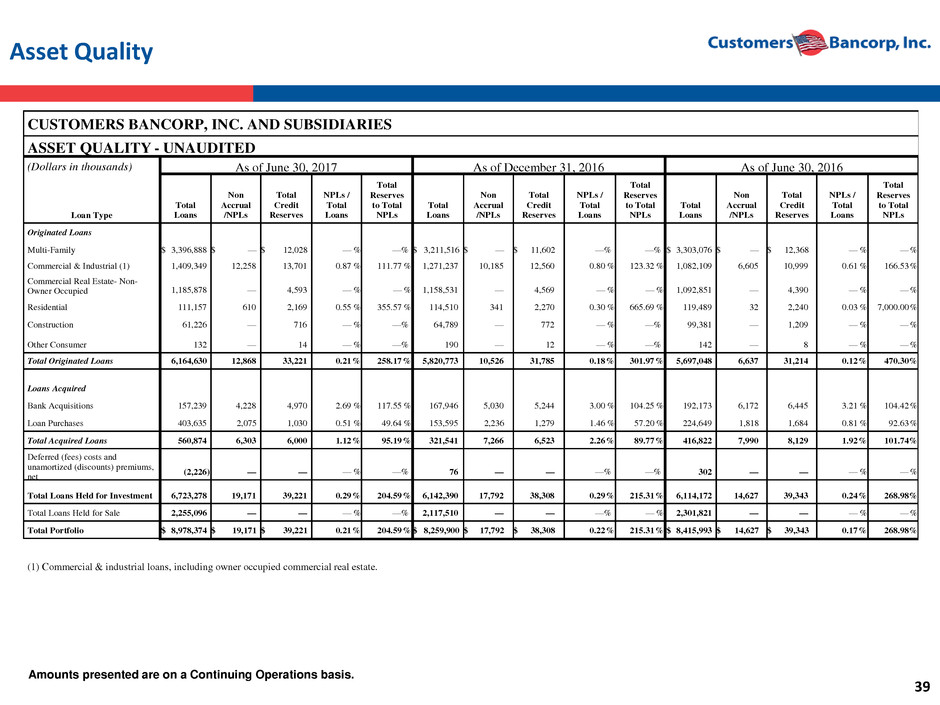
Asset Quality
Amounts presented are on a Continuing Operations basis.
CUSTOMERS BANCORP, INC. AND SUBSIDIARIES
ASSET QUALITY - UNAUDITED
(Dollars in thousands) As of June 30, 2017 As of December 31, 2016 As of June 30, 2016
Total
Loans
Non
Accrual
/NPLs
Total
Credit
Reserves
NPLs /
Total
Loans
Total
Reserves
to Total
NPLs
Total
Loans
Non
Accrual
/NPLs
Total
Credit
Reserves
NPLs /
Total
Loans
Total
Reserves
to Total
NPLs
Total
Loans
Non
Accrual
/NPLs
Total
Credit
Reserves
NPLs /
Total
Loans
Total
Reserves
to Total
NPLs Loan Type
Originated Loans
Multi-Family $ 3,396,888 $ — $ 12,028 — % —% $ 3,211,516 $ — $ 11,602 —% —% $ 3,303,076 $ — $ 12,368 — % — %
Commercial & Industrial (1) 1,409,349 12,258 13,701 0.87 % 111.77 % 1,271,237 10,185 12,560 0.80 % 123.32 % 1,082,109 6,605 10,999 0.61 % 166.53 %
Commercial Real Estate- Non-
Owner Occupied 1,185,878
—
4,593
— % — % 1,158,531
—
4,569
— % — % 1,092,851
—
4,390
— % — %
Residential 111,157 610 2,169 0.55 % 355.57 % 114,510 341 2,270 0.30 % 665.69 % 119,489 32 2,240 0.03 % 7,000.00 %
Construction 61,226 — 716 — % —% 64,789 — 772 — % —% 99,381 — 1,209 — % — %
Other Consumer 132 — 14 — % —% 190 — 12 — % —% 142 — 8 — % — %
Total Originated Loans 6,164,630 12,868 33,221 0.21 % 258.17 % 5,820,773 10,526 31,785 0.18 % 301.97 % 5,697,048 6,637 31,214 0.12 % 470.30 %
Loans Acquired
Bank Acquisitions 157,239 4,228 4,970 2.69 % 117.55 % 167,946 5,030 5,244 3.00 % 104.25 % 192,173 6,172 6,445 3.21 % 104.42 %
Loan Purchases 403,635 2,075 1,030 0.51 % 49.64 % 153,595 2,236 1,279 1.46 % 57.20 % 224,649 1,818 1,684 0.81 % 92.63 %
Total Acquired Loans 560,874 6,303 6,000 1.12 % 95.19 % 321,541 7,266 6,523 2.26 % 89.77 % 416,822 7,990 8,129 1.92 % 101.74 %
Deferred (fees) costs and
unamortized (discounts) premiums,
net
(2,226 ) —
—
— % —% 76
—
—
—% —% 302
—
—
— % — %
Total Loans Held for Investment 6,723,278
19,171
39,221
0.29 % 204.59 % 6,142,390
17,792
38,308
0.29 % 215.31 % 6,114,172
14,627
39,343
0.24 % 268.98 %
Total Loans Held for Sale 2,255,096 — — — % —% 2,117,510 — — —% — % 2,301,821 — — — % — %
Total Portfolio $ 8,978,374 $ 19,171 $ 39,221 0.21 % 204.59 % $ 8,259,900 $ 17,792 $ 38,308 0.22 % 215.31 % $ 8,415,993 $ 14,627 $ 39,343 0.17 % 268.98 %
(1) Commercial & industrial loans, including owner occupied commercial real estate.

40
Net Charge Offs
Amounts presented are on a “Combined” basis.
CUSTOMERS BANCORP, INC. AND SUBSIDIARIES
NET CHARGE-OFFS/(RECOVERIES) - UNAUDITED
(Dollars in thousands)
For the Quarter Ended
Q2 Q1 Q2
2017 2017 2016
Originated Loans
Commercial & Industrial (1) $ 1,840 $ (45 ) $ 41
Residential 69 31 —
Other Consumer 24 — 5
Total Net Charge-offs (Recoveries) from Originated Loans 1,933
(14 ) 46
Loans Acquired
Bank Acquisitions (121 ) 518 874
Loan Purchases — — —
Total Net Charge-offs (Recoveries) from Acquired Loans (121 ) 518
874
Total Net Charge-offs from Loans Held for Investment 1,812
504
920
Total Net Charge-offs (Recoveries) from BankMobile Loans (2) 148
(22 ) 140
Total Net Charge-offs $ 1,960 $ 482 $ 1,060
(1) Commercial & industrial loans, including owner occupied commercial real estate.
(2) Includes activity for BankMobile related loans, primarily overdrawn deposit accounts.

41
Reconciliation of Non-GAAP Measures - Unaudited
Amounts presented are on a “Combined” basis.
Pre-tax Pre-provision Return on Average Assets
Q2 2017 Q1 2017 Q4 2016 Q3 2016 Q2 2016
GAAP Net Income $ 23,722 $ 25,747 $ 19,828 $ 21,207 $ 19,483
Reconciling Items:
Provision for loan losses 535 3,050 187 88 786
Income tax expense 12,327 7,009 9,320 14,558 12,964
Pre-Tax Pre-provision Net Income $ 36,584
$ 35,806
$ 29,335
$ 35,853
$ 33,233
Average Total Assets $ 10,265,333 $ 9,607,541 $ 9,339,158 $ 9,439,573 $ 9,259,192
Pre-tax Pre-provision Return on Average Assets 1.43 % 1.51 % 1.25 % 1.51 % 1.44 %
Pre-tax Pre-provision Return on Average Common Equity
Q2 2017 Q1 2017 Q4 2016 Q3 2016 Q2 2016
GAAP Net Income Available to Common Shareholders $ 20,107
$ 22,132
$ 16,213
$ 18,655
$ 17,421
Reconciling Items:
Provision for loan losses 535 3,050 187 88 786
Income tax expense 12,327 7,009 9,320 14,558 12,964
Pre-tax Pre-provision Net Income Available to Common
Shareholders $ 32,969
$ 32,191
$ 25,720
$ 33,301
$ 31,171
Average Total Shareholders' Equity $ 898,513 $ 867,994 $ 834,480 $ 710,403 $ 655,051
Reconciling Item:
Average Preferred Stock (217,471 ) (217,471 ) (217,493 ) (148,690 ) (118,793 )
Average Common Equity $ 681,042 $ 650,523 $ 616,987 $ 561,713 $ 536,258
Pre-tax Pre-provision Return on Average Common Equity 19.42 % 20.07 % 16.58 % 23.59 % 23.38 %
(dollars in thousands except per share amounts)

42
Reconciliation of Non-GAAP Measures - Unaudited
Amounts presented are on a “Combined” basis.
Net Interest Margin, tax equivalent
Six months ended
June 30,
2017 2016 Q2 2017 Q1 2017 Q4 2016 Q3 2016 Q2 2016
GAAP Net interest income $ 131,040 $ 120,792 $ 68,616 $ 62,424 $ 64,134 $ 64,590 $ 63,161
Tax-equivalent adjustment 197 202 104 93 92 96 98
Net interest income tax equivalent $ 131,237 $ 120,994 $ 68,720 $ 62,517 $ 64,226 $ 64,686 $ 63,259
Average total interest earning assets $ 9,575,924 $ 8,521,360 $ 9,889,901 $ 9,258,457 $ 9,007,206 $ 9,103,560 $ 8,973,488
Net interest margin, tax equivalent 2.76 % 2.85 % 2.78 % 2.73 % 2.84 % 2.83 % 2.83 %

43
Reconciliation of Non-GAAP Measures - Unaudited
Tangible Common Equity to Average Tangible Assets
Q2 2017 Q1 2017 Q4 2016 Q3 2016 Q2 2016
GAAP - Total Shareholders' Equity $ 910,289 $ 879,817 $ 855,872 $ 789,811 $ 680,552
Reconciling Items:
Preferred Stock (217,471 ) (217,471 ) (217,471 ) (217,549 ) (135,270 )
Goodwill and Other Intangibles (17,615 ) (17,618 ) (17,621 ) (16,924 ) (17,197 )
Tangible Common Equity $ 675,203 $ 644,728 $ 620,780 $ 555,338 $ 528,085
Average Total Assets $ 10,265,333 $ 9,607,541 $ 9,339,158 $ 9,439,573 $ 9,259,192
Reconciling Items:
Average Goodwill and Other Intangibles (17,616 ) (17,620 ) (16,847 ) (17,101 ) (6,037 )
Average Tangible Assets $ 10,247,717 $ 9,589,921 $ 9,322,311 $ 9,422,472 $ 9,253,155
Tangible Common Equity to Average Tangible Assets 6.59 % 6.72 % 6.66 % 5.89 % 5.71 %
Tangible Book Value per Common Share
Q2 2017 Q1 2017 Q4 2016 Q3 2016 Q2 2016
GAAP - Total Shareholders' Equity $ 910,289 $ 879,817 $ 855,872 $ 789,811 $ 680,552
Reconciling Items:
Preferred Stock (217,471 ) (217,471 ) (217,471 ) (217,549 ) (135,270 )
Goodwill and Other Intangibles (17,615 ) (17,618 ) (17,621 ) (16,924 ) (17,197 )
Tangible Common Equity $ 675,203 $ 644,728 $ 620,780 $ 555,338 $ 528,085
Common shares outstanding 30,730,784 30,636,327 30,289,917 27,544,217 27,286,833
Tangible Book Value per Common Share $ 21.97 $ 21.04 $ 20.49 $ 20.16 $ 19.35

44
Reconciliation of Non-GAAP Measures - Unaudited
Tangible Book Value per Common Share
Q2 2017 2016 2015 2014 2013 2012 2011
GAAP - Total Shareholders' Equity $ 910,289 $ 855,872 $ 553,902 $ 443,145 $ 386,623 $ 269,475 $ 147,748
Reconciling Items:
Preferred Stock (217,471 ) (217,471 ) (55,569 ) — — — —
Goodwill and Other Intangibles (17,615 ) (17,621 ) (3,651 ) (3,664 ) (3,676 ) (3,689 ) (3,705 )
Tangible Common Equity $ 675,203 $ 620,780 $ 494,682 $ 439,481 $ 382,947 $ 265,786 $ 144,043
Common shares outstanding 30,730,784 30,289,917 26,901,801 26,745,529 26,646,566 20,305,452 12,482,451
Tangible Book Value per Common
Share $ 21.97
$ 20.49
$ 18.39
$ 16.43
$ 14.37
$ 13.09
$ 11.54

45
Reconciliation of Non-GAAP Measures - Unaudited
Core Net Income
Q2 2017 Q1 2017 Q4 2016 Q3 2016 Q2 2016 Q1 2016
GAAP Net Income from
continuing operations $ 28,952
$ 26,924
$ 23,337
$ 23,288
$ 21,774
$ 19,308
Preferred stock dividends
3,615 3,615 3,615 2,552 2,062 1,286
Net income from continuing
operations available to
common shareholders 25,337
23,309
19,722
20,736
19,712
18,022
Reconciling Items:
Impairment losses on
investment securities 2,882
1,703
7,262
—
—
—
(Gains) losses on sale of
investment securities (3,183 ) —
—
1
—
(26 )
Tax effect 114 (647 ) — — — 10
Core Net Income $ 25,150 $ 24,365 $ 26,984 $ 20,737 $ 19,712 $ 18,006
YTD June
2017 2016 2015 2014 2013 2012 2011
GAAP Net Income from
continuing operations $ 55,876
$ 87,707
$ 63,073
$ 44,532
$ 32,910
$ 23,818
3,990
Preferred stock dividends
7,229 9,515 2,493 — — — —
Net income from continuing
operations available to
common shareholders 48,647
78,192
60,580
44,532
32,910
23,818
3,990
Reconciling Items:
Impairment losses on
investment securities 4,585
7,262
—
—
—
—
—
(Gains) losses on sale of
investment securities (3,183 ) (25 ) 85
(3,191 ) (1,274 ) (9,017 ) (2,731 )
Tax effect (533 ) 10 (32 ) 1,323 446 3,065 854
Core Net Income $ 49,516 $ 85,439 $ 60,633 $ 42,664 $ 32,082 $ 17,866 $ 2,113
46
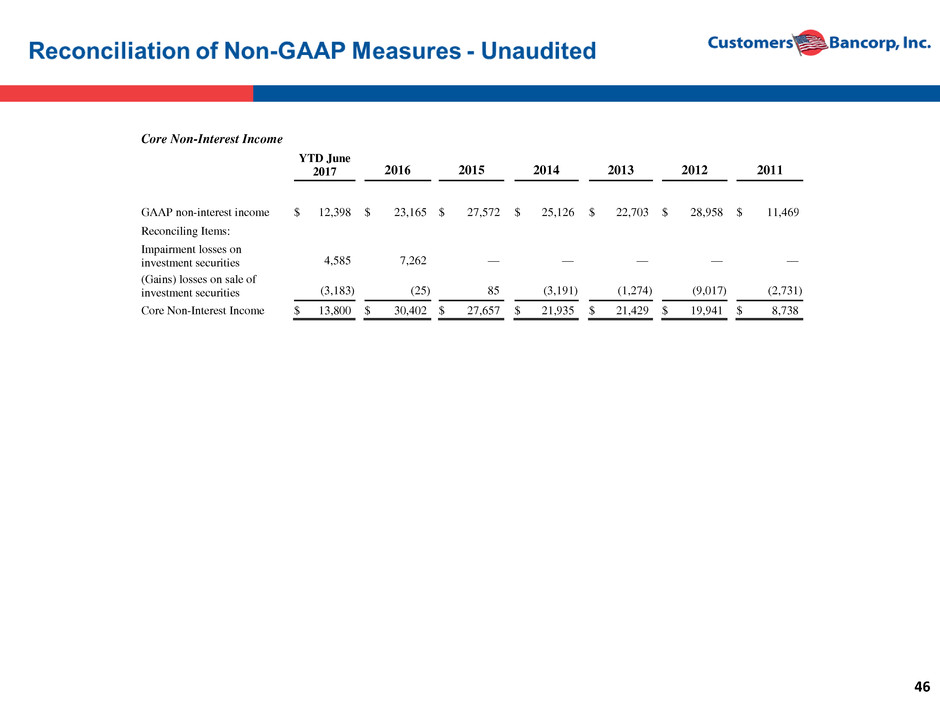
Core Non-Interest Income
YTD June
2017 2016 2015 2014 2013 2012 2011
GAAP non-interest income $ 12,398
$ 23,165
$ 27,572
$ 25,126
$ 22,703
$ 28,958
$ 11,469
Reconciling Items:
Impairment losses on
investment securities 4,585
7,262
—
—
—
—
—
(Gains) losses on sale of
investment securities (3,183 ) (25 ) 85
(3,191 ) (1,274 ) (9,017 ) (2,731 )
Core Non-Interest Income $ 13,800 $ 30,402 $ 27,657 $ 21,935 $ 21,429 $ 19,941 $ 8,738
