Attached files
| file | filename |
|---|---|
| 8-K - 8-K - Blackstone Group Inc | d426021d8k.htm |
Exhibit 99.1

Blackstone Reports Second Quarter 2017 Results
New York, July 20, 2017: Blackstone (NYSE:BX) today reported its second quarter 2017 results.
Stephen A. Schwarzman, Chairman and Chief Executive Officer, said, “Blackstone reported strong results for our shareholders in the second quarter, which also marked the end of our first decade as a public company. The firm remains in top form – revenue, earnings, and distributions all saw double-digit growth versus the prior year, and AUM reached a new all-time high of $371 billion, having grown fourfold since the IPO. Our LPs continue to entrust us with more of their capital to manage as we extend our expertise across more investment strategies. I’m confident that our culture of excellence, integrity and innovation will continue to serve our investors in the coming decades as well as it has in our last.”
Blackstone issued a full detailed presentation of its second quarter 2017 results, which can be viewed at www.blackstone.com.
Distribution
Blackstone has declared a quarterly distribution of $0.54 per common unit to record holders of common units at the close of business on July 31, 2017. This distribution will be paid on August 7, 2017.
Quarterly Investor Call Details
Blackstone will host a conference call on July 20, 2017 at 11:00 a.m. ET to discuss second quarter 2017 results. The conference call can be accessed via the Shareholders section of Blackstone’s website at www.blackstone.com or by dialing +1 (877) 391-6747 (U.S. domestic) or +1 (617) 597-9291 (international), pass code 149 943 55#. For those unable to listen to the live broadcast, a replay will be available on www.blackstone.com or by dialing +1 (888) 286-8010 (U.S. domestic) or +1 (617) 801-6888 (international), pass code 756 128 72#.
About Blackstone
Blackstone is one of the world’s leading investment firms. We seek to create positive economic impact and long-term value for our investors, the companies we invest in, and the communities in which we work. We do this by using extraordinary people and flexible capital to help companies solve problems. Our asset management businesses, with over $370 billion in assets under management, include investment vehicles focused on private equity, real estate, public debt and equity, non-investment grade credit, real assets and secondary funds, all on a global basis. Further information is available at www.blackstone.com. Follow Blackstone on Twitter @Blackstone.
The Blackstone Group L.P.
345 Park Avenue
New York, New York 10154
T 212 583 5000
Forward-Looking Statements
This release may contain forward-looking statements within the meaning of Section 27A of the Securities Act of 1933 and Section 21E of the Securities Exchange Act of 1934 which reflect Blackstone’s current views with respect to, among other things, Blackstone’s operations and financial performance. You can identify these forward-looking statements by the use of words such as “outlook,” “indicator,” “believes,” “expects,” “potential,” “continues,” “may,” “will,” “should,” “seeks,” “approximately,” “predicts,” “intends,” “plans,” “estimates,” “anticipates” or the negative version of these words or other comparable words. Such forward-looking statements are subject to various risks and uncertainties. Accordingly, there are or will be important factors that could cause actual outcomes or results to differ materially from those indicated in these statements. Blackstone believes these factors include but are not limited to those described under the section entitled “Risk Factors” in its Annual Report on Form 10-K for the fiscal year ended December 31, 2016, as such factors may be updated from time to time in its periodic filings with the Securities and Exchange Commission, which are accessible on the SEC’s website at www.sec.gov. These factors should not be construed as exhaustive and should be read in conjunction with the other cautionary statements that are included in this release and in the filings. Blackstone undertakes no obligation to publicly update or review any forward-looking statement, whether as a result of new information, future developments or otherwise.
This release does not constitute an offer of any Blackstone Fund.
Investor and Media Relations Contacts
| Joan Solotar Blackstone Tel: +1 (212) 583-5068 solotar@blackstone.com |
Weston Tucker Blackstone Tel: +1 (212) 583-5231 tucker@blackstone.com |
Christine Anderson Blackstone Tel: +1 (212) 583-5182 christine.anderson@blackstone.com |
2
 Blackstone’s Second Quarter 2017 Earnings July 20, 2017 |
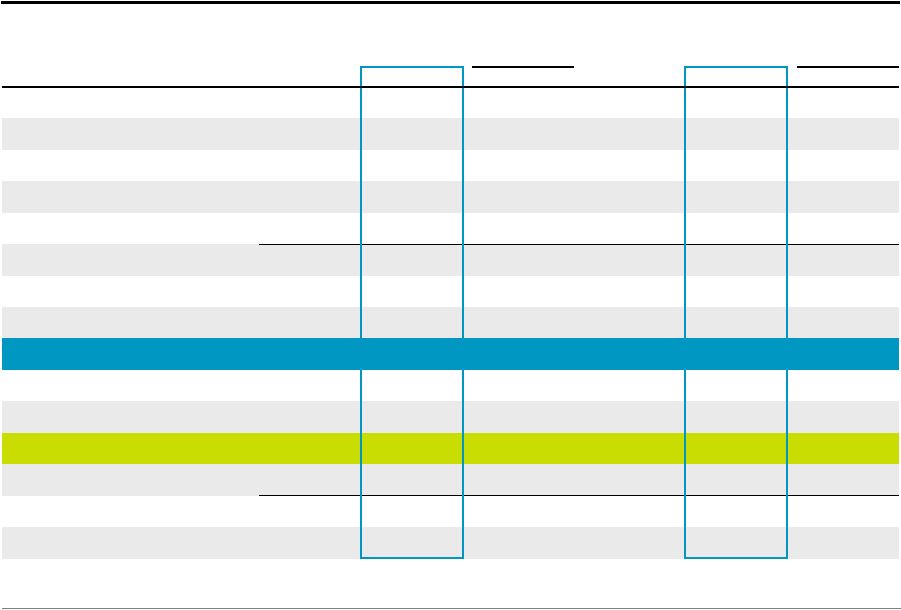
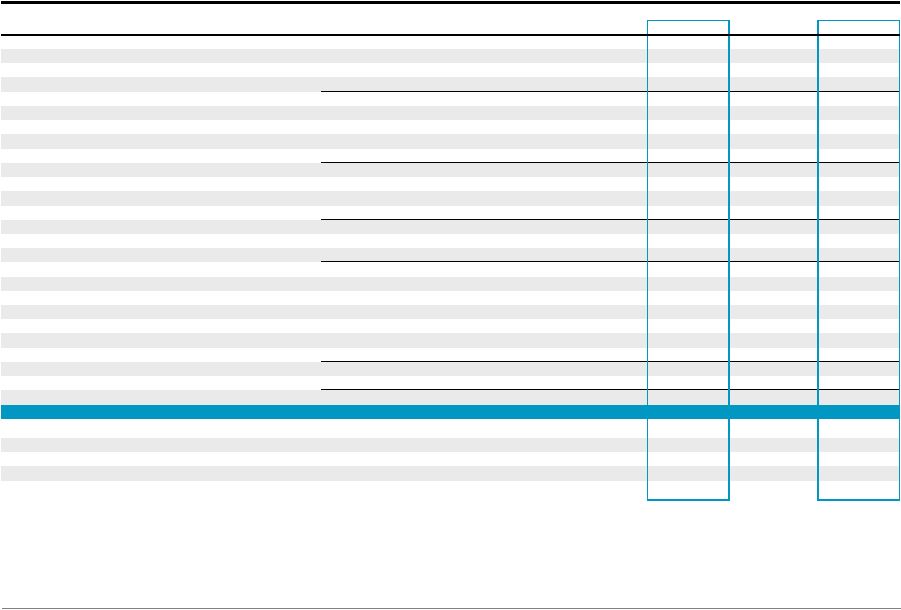
 Blackstone 1 % Change % Change (Dollars in Thousands, Except per Unit Data) (Unaudited) 2Q'16 2Q'17 vs. 2Q'16 2Q'16 YTD 2Q'17 YTD vs. 2Q'16 YTD Revenues Management and Advisory Fees, Net 607,823 $ 686,586 $
13% 1,216,729 $ 1,328,728 $ 9% Performance Fees Realized Carried Interest 323,734 602,160 86% 554,643 1,713,416 209% Realized Incentive Fees 29,441 40,805 39% 57,860 87,965 52% Unrealized Carried Interest 88,292 65,197 (26)% 135,878 (89,486) n/m Unrealized Incentive Fees 7,776 48,235 520% 15,355 107,644 601% Total Performance Fees 449,243 756,397 68% 763,736 1,819,539 138% Investment Income (Loss) Realized 65,037 125,058 92% 53,036 376,402 610% Unrealized 40,102 7,275 (82)% 43,595 (32,913) n/m Total Investment Income 105,139 132,333 26% 96,631 343,489 255% Interest and Dividend Revenue 22,286 33,703 51% 45,361 62,198 37% Other 7,935 (59,664) n/m 2,323 (63,876) n/m Total Revenues 1,192,426 1,549,355 30% 2,124,780 3,490,078 64% Expenses Compensation and Benefits Compensation 355,424 367,203 3% 701,427 718,792 2% Performance Fee Compensation Realized Carried Interest 87,580 195,289 123% 146,084 561,480 284% Realized Incentive Fees 15,250 21,481 41% 29,374 44,233 51% Unrealized Carried Interest 75,202 74,500 (1)% 105,203 70,113 (33)% Unrealized Incentive Fees 2,689 20,600 666% 6,137 43,739 613% Total Compensation and Benefits 536,145 679,073 27% 988,225 1,438,357 46% General, Administrative and Other 130,988 115,281 (12)% 254,033 221,325 (13)% Interest Expense 36,878 41,089 11% 74,234 81,335 10% Fund Expenses 8,592 49,669 478% 13,821 73,745 434% Total Expenses 712,603 885,112 24% 1,330,313 1,814,762 36% Other Income Net Gains from Fund Investment Activities 30,703 110,054 258% 49,845 176,186 253% Income Before Provision for Taxes 510,526 $ 774,297 $ 52% 844,312 $ 1,851,502 $ 119% Provision for Taxes 47,415 29,608 (38)% 56,561 87,045 54% Net Income 463,111 $ 744,689 $ 61% 787,751 $ 1,764,457 $ 124% Net Income (Loss) Attributable to Redeemable Non-Controlling Interests in Consolidated Entities
(2,049) 991 n/m (8,450) 2,991 n/m Net Income Attributable to Non-Controlling Interests in Consolidated Entities
64,729 112,944 74% 104,815 251,629 140% Net Income Attributable to Non-Controlling Interests in Blackstone Holdings
201,805 287,979 43% 333,007 705,237 112% Net Income Attributable to The Blackstone Group L.P. ("BX") 198,626 $ 342,775 $ 73% 358,379 $ 804,600 $ 125% Net Income per Common Unit, Basic 0.31 $ 0.52 $
68% 0.55 $
1.21 $
120% Net Income per Common Unit, Diluted 0.30 $ 0.51 $
70% 0.54 $
1.20 $
122% Blackstone’s Second Quarter 2017 GAAP Results GAAP Net Income was $745 million for the quarter, and $1.8 billion year-to-date. GAAP Net Income Attributable to The Blackstone Group L.P. was $343 million for the quarter and $805 million year-to-date. n/m = not meaningful. |
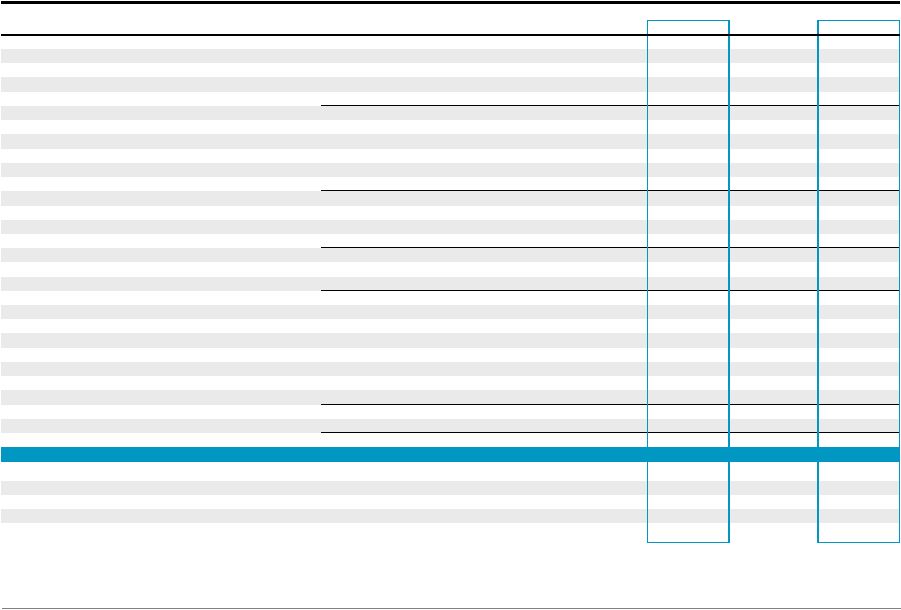
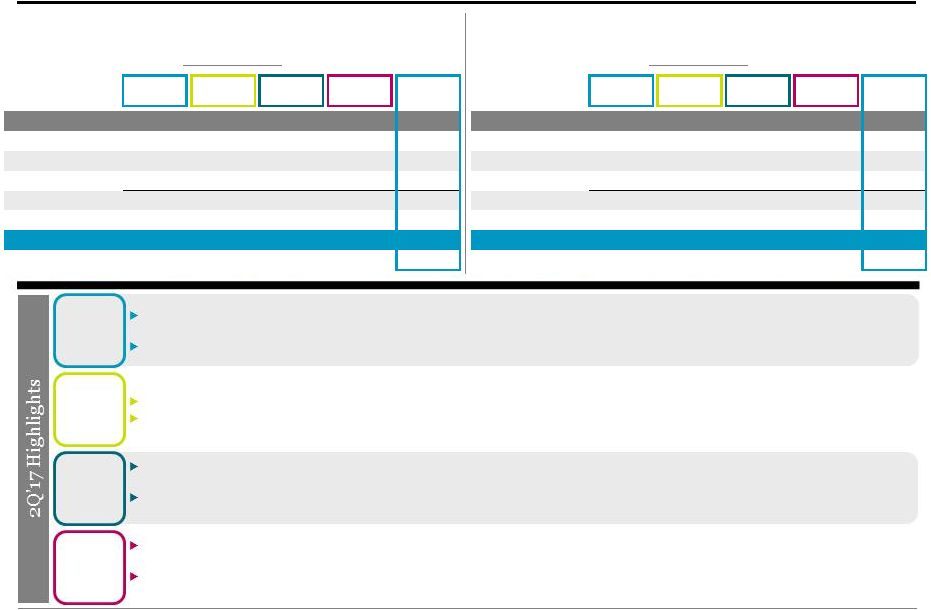
 Blackstone 2 Blackstone’s Second Quarter 2017 Segment Highlights Economic Net Income (“ENI”) was $705 million ($0.59/unit) in the quarter, up 36% year-over-year, on $1.5 billion of Total Segment Revenues from management fee growth and strong fund returns. • ENI was $1.7 billion ($1.41/unit) year-to-date on $3.4 billion of Total Segment Revenues. Distributable Earnings (“DE”) was $781 million ($0.63/unit) in the quarter, up 58% year-over-year, with realizations resulting in $643 million of Realized Performance Fees. • DE was $2.0 billion ($1.65/unit) year-to-date on $1.8 billion of Realized Performance Fees. Fee Related Earnings (“FRE”) was $311 million in the quarter, up 33% year-over-year, on $697 million of Net Management and Advisory Fees. • FRE was $602 million year-to-date, up 25% year-over-year, on $1.3 billion of Net Management and Advisory Fees. Total Assets Under Management (“AUM”) grew to a record $371.1 billion through a combination of continued fundraising, organic platform expansion and fund appreciation. • Inflows were $12.1 billion in the quarter, bringing the last twelve months (“LTM”) inflows to $57.4 billion. • Total AUM increased 4% year-over-year and Fee-Earning AUM was up 6% to $281.9 billion. Capital deployed of $8.4 billion in the quarter and $20.2 billion year-to-date across the businesses. Blackstone declared a second quarter distribution of $0.54 per common unit payable on August 7, 2017. The changes in carrying value, fund returns and composite returns presented throughout this presentation represent those of the
applicable Blackstone Funds and not those of The Blackstone Group
L.P. |
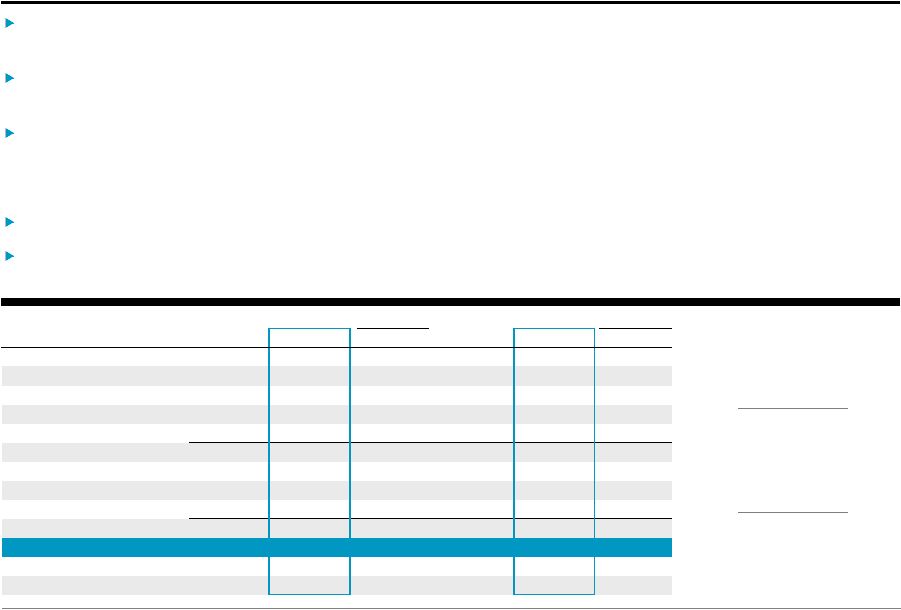
 Blackstone 3 Blackstone’s Second Quarter 2017 Segment Earnings % Change % Change (Dollars in Thousands, Except per Unit Data) 2Q'16 2Q'17 vs. 2Q'16 2Q'16 YTD 2Q'17 YTD vs. 2Q'16 YTD Management and Advisory Fees, Net 612,220 $ 696,836 $ 14% 1,225,421 $ 1,346,417 $ 10% Performance Fees 449,372 757,006 68% 763,437 1,820,734 138% Investment Income 59,771 67,720 13% 33,121 171,679 418% Interest Income and Dividend Revenue 35,233 53,255 51% 70,314 99,131 41% Other 8,546 (62,469) n/m 2,298 (70,756) n/m Total Revenues 1,165,142 1,512,348 30% 2,094,591 3,367,205 61% Total Expenses 624,132 782,811 25% 1,166,136 1,632,825 40% Taxes 21,234 24,168 14% 38,028 42,973 13% Economic Net Income 519,776 $ 705,369 $ 36% 890,427 $ 1,691,407 $ 90% ENI per Unit 0.44 $
0.59 $
34% 0.75 $
1.41 $
88% Fee Related Earnings 234,442 $ 311,183 $ 33% 481,109 $ 601,925 $ 25% Distributable Earnings 494,913 $ 781,365 $ 58% 889,128 $ 2,011,503 $ 126% DE per Common Unit 0.41 $
0.63 $
54% 0.74 $
1.65 $
123% Total AUM 356,281,669 $ 371,056,281 $ 4% 356,281,669 $ 371,056,281 $ 4% Fee-Earning AUM 266,006,713 $ 281,934,511 $ 6% 266,006,713 $ 281,934,511 $ 6% |
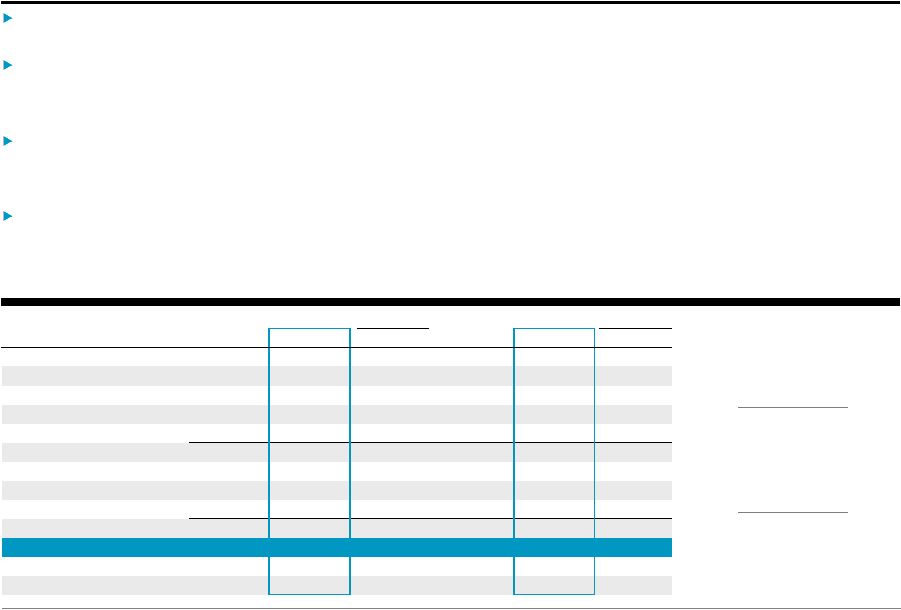
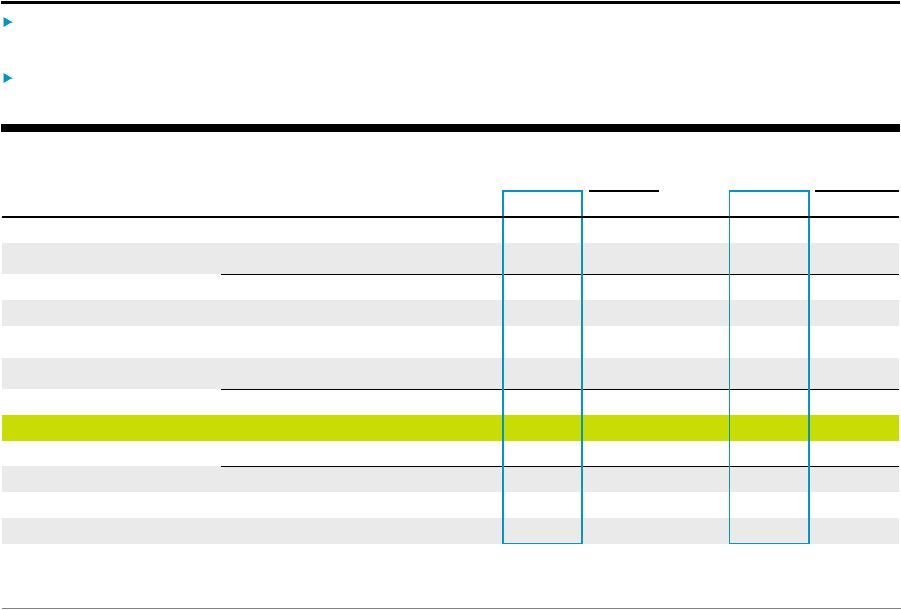
 Blackstone 4 Private Equity 2.8% 2Q’17 Increase in Corporate Private Equity Carrying Value $2.8 billion 2Q’17 Realizations $192 million Net Management and Advisory Fees up 39% YoY Corporate Private Equity carrying value increased 2.8% in the quarter, driven by appreciation in the public and private portfolios across multiple sectors and industries. Realizations of $2.8 billion in the quarter were primarily driven by public sales in Corporate Private Equity and Strategic Partners, bringing year-to-date realizations to $9.0 billion. Invested $4.2 billion in the quarter, including new Corporate Private Equity investments in Alight Solutions (formerly an Aon Hewitt business) and EagleClaw Midstream. • Committed an additional $1.1 billion during the quarter, mainly driven by Ascend Learning. Total AUM inflows of $1.8 billion and portfolio appreciation in the quarter drove Total AUM to $100.0 billion. Fee-Earning AUM of $68.0 billion, leading to strong Net Management and Advisory Fees of $192 million, up 39% year-over-year due to the commencement of the investment periods for flagship funds. % Change % Change (Dollars in Thousands) 2Q'16 2Q'17 vs. 2Q'16 2Q'16 YTD 2Q'17 YTD vs. 2Q'16 YTD Management and Advisory Fees, Net 138,371 $ 191,749 $ 39% 271,091 $ 374,223 $ 38% Performance Fees 142,103 197,857 39% 246,260 595,705 142% Investment Income 20,160 16,154 (20)% 20,243 56,219 178% Interest Income and Dividend Revenue 9,516 12,451 31% 19,365 23,373 21% Other 3,395 (16,124) n/m 1,808 (17,924) n/m Total Revenues 313,545 402,087 28% 558,767 1,031,596 85% Compensation 83,140 90,844 9% 163,414 174,586 7% Performance Fee Compensation 50,396 85,279 69% 75,119 227,556 203% Other Operating Expenses 48,371 47,665 (1)% 96,434 90,487 (6)% Total Expenses 181,907 223,788 23% 334,967 492,629 47% Economic Income 131,638 $ 178,299 $ 35% 223,800 $ 538,967 $ 141% Total AUM 99,685,655 $ 100,020,379 $ 0% 99,685,655 $ 100,020,379 $ 0% Fee-Earning AUM 69,467,174 $ 68,030,331 $ (2)% 69,467,174 $ 68,030,331 $ (2)% |
 Blackstone 5 Real Estate 5.4% 2Q’17 Increase in Opportunistic Funds’ Carrying Value $73.7 billion Fee-Earning AUM up 10% YoY
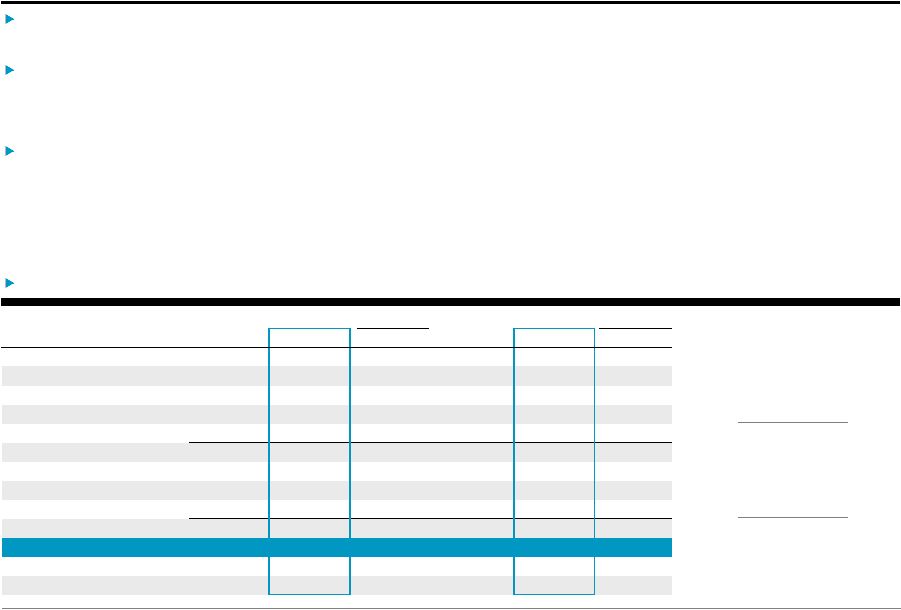
% Change % Change (Dollars in Thousands) 2Q'16 2Q'17 vs. 2Q'16 2Q'16 YTD 2Q'17 YTD vs. 2Q'16 YTD Management Fees, Net 220,897 $ 238,934 $ 8% 453,003 $ 454,542 $ 0% Performance Fees 193,548 494,127 155% 396,487 1,013,327 156% Investment Income 11,027 37,080 236% 21,865 72,806 233% Interest Income and Dividend Revenue 13,084 20,998 60% 26,272 39,165 49% Other 2,231 (22,965) n/m 322 (26,115) n/m Total Revenues 440,787 768,174 74% 897,949 1,553,725 73% Compensation 102,888 110,266 7% 203,466 212,968 5% Performance Fee Compensation 76,540 196,077 156% 153,610 397,673 159% Other Operating Expenses 52,201 55,373 6% 100,298 107,342 7% Total Expenses 231,629 361,716 56% 457,374 717,983 57% Economic Income 209,158 $ 406,458 $ 94% 440,575 $ 835,742 $ 90% Total AUM 103,197,060 $ 104,034,287 $ 1% 103,197,060 $ 104,034,287 $ 1% Fee-Earning AUM 66,744,550 $ 73,710,243 $ 10% 66,744,550 $ 73,710,243 $ 10% $4.6 billion 2Q’17 Realizations Opportunistic funds’ carrying value increased 5.4% in the quarter due to appreciation in both the private and public investment portfolios; core+ funds’ carrying value increased 3.0% in the quarter. Sustained strong level of realizations with $4.6 billion in the quarter driven by public stock sales of Hilton-related companies and Equity Office Properties asset sales, bringing the year-to-date total to $11.2 billion. • Announced sale of Logicor, the largest direct owner of logistics properties in Europe, for €12.25 billion. Invested $2.4 billion in the quarter, including in a 2.2 million square meter European urban logistics portfolio and two high quality U.S. apartment portfolios. • Committed an additional $1.8 billion during the quarter, including three public-to-private transactions. Total AUM inflows of $3.2 billion included €1.1 billion for the final closing of BREP Europe V, bringing total capital commitments to €7.8 billion, making it the largest dedicated European real estate fund ever; and $530 million raised for BREDS initial high grade strategy. • On July 1, Blackstone’s non-traded REIT reached $1.0 billion of equity raised since its launch in January. |
 Blackstone 6 Hedge Fund Solutions 1.3% 2Q’17 BPS Composite Gross Return The BPS Composite gross and net returns are based on the BAAM Principal Solutions (“BPS”) Composite, which does not include
BAAM's individual investor solutions (liquid alternatives), long-biased commodities, ventures (seeding and minority interests), strategic opportunities (co-invests), and advisory (non-discretionary) platforms, except for investments by
BPS funds directly into those platforms. BAAM-managed funds in liquidation are also excluded. The funds/accounts that comprise the BPS Composite are not managed within a single fund or account and are managed with different
mandates. There is no guarantee that BAAM would have made the same mix of
investments in a stand-alone fund/account. The BPS Composite
is not an investible product and, as such, the performance of the Composite does not represent the performance of an actual fund or account. $2.0 billion 2Q’17 Total AUM Inflows $72.5 billion Total AUM up 6% YoY
% Change % Change (Dollars in Thousands) 2Q'16 2Q'17 vs. 2Q'16 2Q'16 YTD 2Q'17 YTD vs. 2Q'16 YTD Management Fees, Net 130,118 $ 130,394 $ 0% 260,819 $ 259,121 $ (1)% Performance Fees 1,586 29,596 n/m 1,367 88,388 n/m Investment Income (Loss) 8,842 11,803 33% (8,194) 29,464 n/m Interest Income and Dividend Revenue 5,205 8,769 68% 10,501 16,323 55% Other 1,125 (10,720) n/m (263) (12,330) n/m Total Revenues 146,876 169,842 16% 264,230 380,966 44% Compensation 44,436 47,361 7% 98,605 94,965 (4)% Performance Fee Compensation 2,043 13,782 575% 2,711 36,312 n/m Other Operating Expenses 27,218 26,240 (4)% 53,364 52,040 (2)% Total Expenses 73,697 87,383 19% 154,680 183,317 19% Economic Income 73,179 $
82,459 $
13% 109,550 $ 197,649 $ 80% Total AUM 68,649,878 $ 72,476,444 $ 6% 68,649,878 $ 72,476,444 $ 6% Fee-Earning AUM 64,973,999 $ 67,824,464 $ 4% 64,973,999 $ 67,824,464 $ 4% The BPS Composite gross return was 1.3% in the quarter (1.1% net), and 4.0% (3.6% net) year-to-date, continuing positive momentum in returns. • Gross returns of 9.5% (8.6% net) for the LTM. Total inflows of $2.0 billion during the quarter and $5.6 billion year-to-date, driven by customized solutions, commingled products and individual investor and specialized solutions. • July 1 subscriptions of $457 million are not yet included in AUM. Total AUM increased 6% year-over-year to $72.5 billion, driven by continued platform diversification, growth in customized strategies and individual investor solutions, and appreciation across strategies. • Fee-Earning AUM up 4% year-over-year to $67.8 billion. |
 Blackstone 7 Credit Performing Credit Strategies include mezzanine lending funds, Business Development Companies (“BDCs”) and other performing
credit strategy funds. Distressed Strategies include hedge fund strategies, rescue lending funds and distressed energy strategies. The composite gross returns represent a weighted-average composite of the fee-earning funds exceeding $100 million of
fair value at each respective quarter end for each strategy. Composite gross returns exclude the Blackstone Funds that were contributed to GSO as part of Blackstone’s acquisition of GSO in March 2008. Performing Credit Strategies’ net composite
returns were 0.5%, 2.9% and 11.2% for 2Q’17, 2Q'17 YTD and 2Q'17 LTM. Distressed Strategies’ net composite returns were (1.6)%, 0.3% and 11.0% for 2Q’17, 2Q'17 YTD and 2Q'17 LTM. The breakdown of Total AUM for 2Q’17 is as follows: Distressed Strategies $21.2 billion (34% Incentive Fee, 66% Carried
Interest), Performing Credit Strategies $38.0 billion (49% Incentive
Fee, 51% Carried Interest), and Long Only $35.3
billion. The breakdown of Fee-Earning AUM for 2Q’17 is as follows:
Distressed Strategies $12.9 billion (50% Incentive Fee, 50% Carried Interest), Performing Credit Strategies $25.0 billion (74% Incentive Fee, 26% Carried Interest), and Long Only $34.5 billion. $2.7 billion 2Q’17 Total Capital Deployed or Committed $94.5 billion Total AUM up 12% YoY 2Q’17 Composite Gross Returns Performing Credit 1.5%
Distressed
(1.2)% Composite gross returns for the quarter were 1.5% and (1.2)% for Performing Credit and Distressed Strategies, respectively, with performance impacted by the decrease in commodity prices in the energy portfolio. Investment pace remained strong with $2.7 billion of capital deployed or committed during the quarter, capitalizing on investment opportunities predominantly in Europe and the energy sector. • Deployed a record $6.0 billion over the LTM, of which $4.0 billion was deployed year-to-date. Total AUM increased 12% year-over-year reaching a record $94.5 billion. • Raised $1.3 billion towards the first closing of the successor distressed flagship fund during the quarter, with an additional $2.9 billion closed subsequent to the quarter end. • Launched 10 CLOs (seven U.S. and three European) in the LTM totaling $5.7 billion, including $2.0 billion launched in the second quarter of 2017. Fee-Earning AUM increased 12% year-over-year reaching a record $72.4 billion. % Change % Change (Dollars in Thousands) 2Q'16 2Q'17 vs. 2Q'16 2Q'16 YTD 2Q'17 YTD vs. 2Q'16 YTD Management Fees, Net 122,834 $ 135,759 $ 11% 240,508 $ 258,531 $ 7% Performance Fees 112,135 35,426 (68)% 119,323 123,314 3% Investment Income (Loss) 19,742 2,683 (86)% (793) 13,190 n/m Interest Income and Dividend Revenue 7,428 11,037 49% 14,176 20,270 43% Other 1,795 (12,660) n/m 431 (14,387) n/m Total Revenues 263,934 172,245 (35)% 373,645 400,918 7% Compensation 55,691 56,786 2% 108,073 111,765 3% Performance Fee Compensation 51,744 16,732 (68)% 55,358 58,024 5% Other Operating Expenses 29,464 36,406 24% 55,684 69,107 24% Total Expenses 136,899 109,924 (20)% 219,115 238,896 9% Economic Income 127,035 $ 62,321 $
(51)% 154,530 $ 162,022 $ 5% Total AUM 84,749,076 $ 94,525,171 $ 12% 84,749,076 $ 94,525,171 $ 12% Fee-Earning AUM 64,820,990 $ 72,369,473 $ 12% 64,820,990 $ 72,369,473 $ 12% |
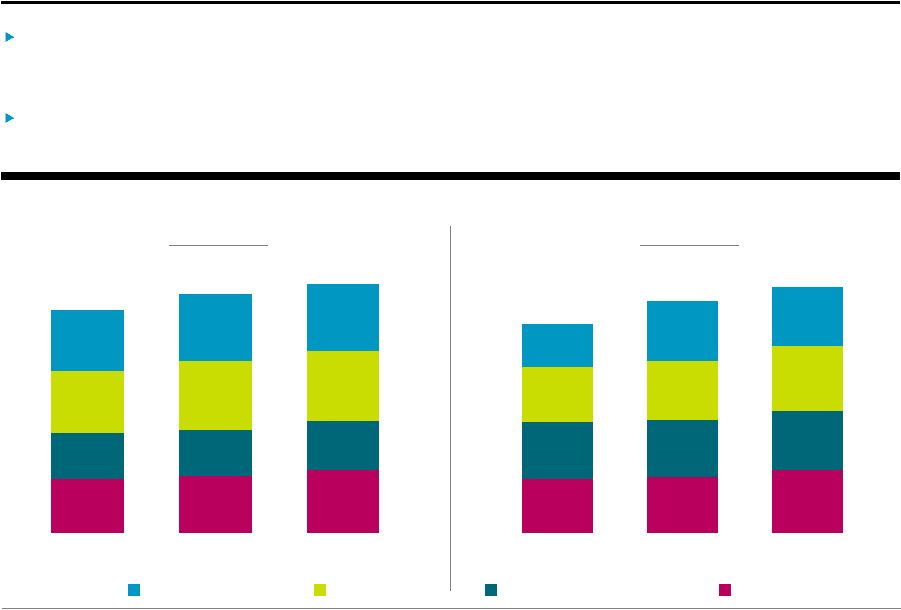 Blackstone 8 $81.3 $84.7 $94.5 $67.8 $68.6 $72.5 $91.6 $103.2 $104.0 $92.0 $99.7 $100.0 2Q'15 2Q'16 2Q'17 Fee-Earning AUM by Segment (Dollars in Billions) Total AUM by Segment (Dollars in Billions) $332.7 Private Equity Real Estate Hedge Fund Solutions Credit Assets Under Management $61.6 $64.8 $72.4 $65.5 $65.0 $67.8 $62.7 $66.7 $73.7 $49.5 $69.5 $68.0 2Q'15 2Q'16 2Q'17 $356.3 $371.1 $239.3 $266.0 $281.9 Total AUM increased 4% year-over-year to $371.1 billion driven by $57.4 billion of inflows.
• Total AUM increased despite returning $71.6 billion of capital to investors during the LTM.
Fee-Earning AUM of $281.9 billion up 6% year-over-year
as $54.6 billion of inflows outpaced $47.4 billion of
realizations and outflows. |
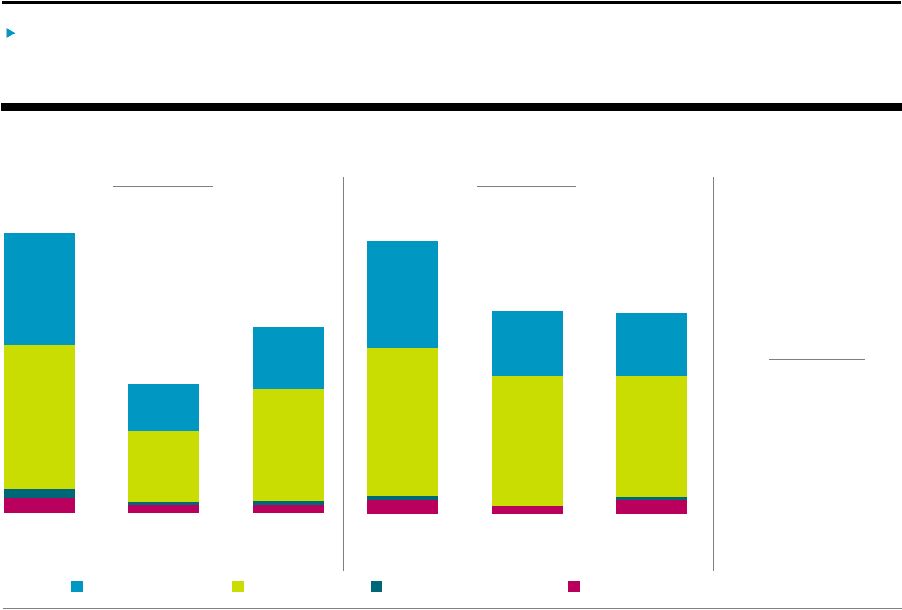
 Blackstone 9 $13.5 $2.2 $11.1 $13.2 Additional Capital Detail Undrawn capital (“Total Dry Powder”) was $90.0 billion, despite $32.8 billion of capital deployed in the LTM. • 76% of Total Dry Powder was raised since the beginning of 2015. Performance Fee Eligible AUM reached $274.7 billion at quarter end, up 2% year-over-year, despite significant realizations in the Real Estate and Private Equity segments. Uninvested Not Currently Earning Performance Fees Currently Earning Performance Fees Private Equity Real Estate Hedge Fund Solutions Credit $90 billion 2Q’17 Total Dry Powder $275 billion Performance Fee Eligible AUM $40 billion Not Currently Earning Management Fees $269.2 $274.7 $250.0 Credit Hedge Fund Solutions Real Estate Private Equity $40.1 $37.5 $31.7 $3.8 $17.0 $155.1 $129.0 $157.8 $16.2 $44.7 $25.3 $78.7 $95.5 $91.6 2Q'15 2Q'16 2Q'17 |
 Blackstone 10 2Q'15 2Q'16 2Q'17 At June 30, 2017, Blackstone had $5.0
billion
in
total
cash,
cash
equivalents,
and
corporate
treasury
investments
and
$10.
billion
of
cash
and
net
investments,
or
$8.
51
per
unit.
Blackstone
has
no
net
debt,
a
$1.5
billion
undrawn
credit
revolver
and
maintains
A+/A+
ratings.
Deconsolidated Balance Sheet Highlights
Balance Sheet Highlights are preliminary, and exclude the consolidated
Blackstone Funds. Investments include Blackstone investments in Private Equity, Real Estate, Hedge Fund Solutions, and Credit, which were $625 million, $789 million, $114 million, and $316 million, respectively, as of June 30, 2017, $782 million, $1.0 billion,
$123 million, and $267 million, respectively, as of June 30, 2016
and $1.0 billion, $1.1 billion, $133 million, and $232 million,
respectively, as of June 30, 2015. Cash and Net Investments per unit amounts are calculated using period end DE Units Outstanding. A+/A+ Rated by S&P and Fitch $1.5 billion Undrawn Credit Revolver with August 2021 Maturity $5.0 billion Total Cash and Corporate Treasury $8.51 $7.62 $9.43 Cash and Net Investments (Per Unit) (Dollars in Millions) 2Q’17 Cash and Cash Equivalents $ 1,746 Corporate Treasury Investments 3,300 GP/Fund Investments 1,844 Net Accrued Performance Fees 3,292 Cash and Net Investments $ 10,182 Outstanding Bonds (at par) $ 3,513 2 |
 Blackstone 11 $1,454 $718 $1,125 $1,138 $475 $629 2Q'15 LTM 2Q'16 LTM 2Q'17 LTM $2,424 $2,130 $1,997 $1,764 $1,064 $1,028 2Q'15 2Q'16 2Q'17 Performance Fees Net Realized Performance Fees (Dollars in Millions) $1,306 $1,881 $2,833 Net Accrued Performance Fees (Dollars in Millions) $3,321 $3,292 $4,472 Private Equity Real Estate Credit Hedge Fund Solutions $3.3 billion Net Accrued Performance Fees at 2Q’17 $2.75 per unit Net Accrued Performance Fees at 2Q’17 Net Accrued Performance Fees per unit is calculated using period end DE Units Outstanding (see page 30, Unit Rollforward).
Net
Accrued
Performance
Fees
were
$3.3
billion
($2.75/unit),
stable
over
the
last
twelve
months
with
strong
appreciation
generating
$1.9
billion
of
additional
Net
Accrued
Performance
Fees
that
offset
$1.9
billion
of
realizations. |
 Appendix |
 Blackstone 13 Total Segments Note: The amounts reported for LP and Total Capital Invested for the periods 3Q’16 through 1Q’17 reflect an adjustment in the
Hedge Fund Solutions segment from those previously reported. (Dollars in Thousands) 2Q'16 3Q'16 4Q'16 1Q'17 2Q'17 2Q'16 YTD 2Q'17 YTD Revenues Management and Advisory Fees, Net Base Management Fees 593,996 $
593,509 $
623,571 $
642,958 $
671,368 $
1,180,699 $ 1,314,326 $ Transaction, Advisory and Other Fees, Net 33,620 29,021 35,618 40,222 38,892 80,219 79,114 Management Fee Offsets (15,396) (20,850) (23,297) (33,599) (13,424) (35,497) (47,023) Total Management and Advisory Fees, Net 612,220 601,680 635,892 649,581 696,836 1,225,421 1,346,417 Performance Fees Realized Carried Interest 323,734 504,022 416,250 1,111,322 602,293 554,643 1,713,615 Realized Incentive Fees 29,363 30,295 83,993 47,137 41,106 57,813 88,243 Unrealized Carried Interest 88,268 106,157 239,210 (154,747) 65,080 135,874 (89,667) Unrealized Incentive Fees 8,007 32,172 2,450 60,016 48,527 15,107 108,543 Total Performance Fees 449,372 672,646 741,903 1,063,728 757,006 763,437 1,820,734 Investment Income (Loss) Realized 53,670 60,634 95,666 202,894 100,887 43,569 303,781 Unrealized 6,101 27,253 3,616 (98,935) (33,167) (10,448) (132,102) Total Investment Income 59,771 87,887 99,282 103,959 67,720 33,121 171,679 Interest Income and Dividend Revenue 35,233 33,081 42,488 45,876 53,255 70,314 99,131 Other 8,546 (425) 52,839 (8,287) (62,469) 2,298 (70,756) Total Revenues 1,165,142 1,394,869 1,572,404 1,854,857 1,512,348 2,094,591 3,367,205 Expenses Compensation 286,155 268,595 241,063 289,027 305,257 573,558 594,284 Performance Fee Compensation Realized Carried Interest 87,581 168,427 141,443 366,191 195,289 146,084 561,480 Realized Incentive Fees 15,251 15,436 33,286 22,752 21,481 29,374 44,233 Unrealized Carried Interest 75,202 70,044 137,591 (4,387) 74,500 105,203 70,113 Unrealized Incentive Fees 2,689 13,508 1,489 23,139 20,600 6,137 43,739 Total Compensation and Benefits 466,878 536,010 554,872 696,722 617,127 860,356 1,313,849 Other Operating Expenses 157,254 150,890 172,672 153,292 165,684 305,780 318,976 Total Expenses 624,132 686,900 727,544 850,014 782,811 1,166,136 1,632,825 Economic Income 541,010 $
707,969 $
844,860 $
1,004,843 $ 729,537 $
928,455 $
1,734,380 $ Economic Net Income 519,776 $
686,984 $
811,610 $
986,038 $
705,369 $
890,427 $
1,691,407 $ Fee Related Earnings 234,442 $
246,084 $
294,495 $
290,742 $
311,183 $
481,109 $
601,925 $
Distributable Earnings
494,913 $
593,453 $
638,994 $
1,230,138 $ 781,365 $
889,128 $
2,011,503 $ Total Assets Under Management 356,281,669 $ 361,040,173 $ 366,553,465 $ 368,196,917 $ 371,056,281 $ 356,281,669 $ 371,056,281 $ Fee-Earning Assets Under Management 266,006,713 $ 267,757,727 $ 277,092,672 $ 280,215,551 $ 281,934,511 $ 266,006,713 $ 281,934,511 $ Weighted Average Fee-Earning AUM 259,756,363 $ 268,503,412 $ 274,475,842 $ 279,582,971 $ 281,966,547 $ 255,511,902 $ 281,109,401 $ LP Capital Invested 3,795,171 $ 4,136,405 $ 7,974,603 $ 9,709,930 $ 7,799,624 $ 10,310,742 $ 17,509,554 $ Total Capital Invested 4,049,774 $ 4,310,564 $ 8,221,697 $ 11,840,913 $ 8,382,583 $ 10,743,149 $ 20,223,496 $ |
 Blackstone 14 Private Equity (Dollars in Thousands) 2Q'16 3Q'16 4Q'16 1Q'17 2Q'17 2Q'16 YTD 2Q'17 YTD Revenues Management and Advisory Fees, Net Base Management Fees 131,477 $
131,708 $
160,301 $
177,464 $
176,555 $
262,125 $
354,019 $
Transaction, Advisory and Other Fees, Net
11,089 12,892 8,972 17,200 18,947 20,009 36,147 Management Fee Offsets (4,195) (12,917) (10,850) (12,190) (3,753) (11,043) (15,943) Total Management and Advisory Fees, Net 138,371 131,683 158,423 182,474 191,749 271,091 374,223 Performance Fees Realized Carried Interest 57,056 26,398 131,532 582,681 197,257 87,338 779,938 Unrealized Carried Interest 85,047 144,597 121,262 (184,833) 600 158,922 (184,233) Total Performance Fees 142,103 170,995 252,794 397,848 197,857 246,260 595,705 Investment Income (Loss) Realized 22,926 15,469 50,339 80,889 41,168 7,569 122,057 Unrealized (2,766) 8,884 (26,401) (40,824) (25,014) 12,674 (65,838) Total Investment Income 20,160 24,353 23,938 40,065 16,154 20,243 56,219 Interest Income and Dividend Revenue 9,516 9,160 11,746 10,922 12,451 19,365 23,373 Other 3,395 411 18,239 (1,800) (16,124) 1,808 (17,924) Total Revenues 313,545 336,602 465,140 629,509 402,087 558,767 1,031,596 Expenses Compensation 83,140 73,889 73,154 83,742 90,844 163,414 174,586 Performance Fee Compensation Realized Carried Interest 30,946 13,741 50,768 181,633 63,060 46,373 244,693 Unrealized Carried Interest 19,450 69,300 65,891 (39,356) 22,219 28,746 (17,137) Total Compensation and Benefits 133,536 156,930 189,813 226,019 176,123 238,533 402,142 Other Operating Expenses 48,371 47,534 52,465 42,822 47,665 96,434 90,487 Total Expenses 181,907 204,464 242,278 268,841 223,788 334,967 492,629 Economic Income 131,638 $
132,138 $
222,862 $
360,668 $
178,299 $
223,800 $
538,967 $
Total Assets Under Management
99,685,655 $ 99,722,322 $ 100,192,950 $ 99,711,406 $ 100,020,379 $ 99,685,655 $ 100,020,379 $ Fee-Earning Assets Under Management 69,467,174 $ 69,347,910 $ 69,113,409 $ 68,231,620 $ 68,030,331 $ 69,467,174 $ 68,030,331 $ Weighted Average Fee-Earning AUM 63,363,932 $ 69,546,251 $ 69,616,781 $ 68,618,130 $ 68,196,699 $ 60,146,649 $ 68,733,312 $ LP Capital Invested 1,538,436 $ 1,683,747 $ 2,355,726 $ 4,736,388 $ 3,846,841 $ 3,404,134 $ 8,583,229 $ Total Capital Invested 1,637,601 $ 1,804,304 $ 2,495,215 $ 6,748,859 $ 4,221,479 $ 3,611,992 $ 10,970,338 $ |
 Blackstone 15 Real Estate (Dollars in Thousands) 2Q'16 3Q'16 4Q'16 1Q'17 2Q'17 2Q'16 YTD 2Q'17 YTD Revenues Management Fees, Net Base Management Fees 201,004 $
197,629 $
196,621 $
197,879 $
227,865 $
400,911 $
425,744 $
Transaction and Other Fees, Net
21,112 14,190 24,228 21,279 16,087 56,906 37,366 Management Fee Offsets
(1,219) (842) (1,666)
(3,550)
(5,018)
(4,814)
(8,568)
Total Management Fees,
Net 220,897
210,977
219,183
215,608
238,934
453,003
454,542
Performance Fees
Realized Carried Interest
266,382 461,980 274,495 519,841 389,004 467,009 908,845 Realized Incentive Fees
6,099 3,857 15,600 2,914 5,315 10,168 8,229 Unrealized Carried Interest
(84,875) (113,449) 58,849 (22,268) 77,200 (96,397) 54,932 Unrealized Incentive Fees
5,942 14,445 9,375 18,713 22,608 15,707 41,321 Total Performance Fees
193,548 366,833 358,319 519,200 494,127 396,487 1,013,327 Investment Income (Loss)
Realized 19,929 46,704 43,104 119,579 57,599 32,904 177,178 Unrealized (8,902) (6,725) 16,645 (83,853) (20,519) (11,039) (104,372) Total Investment Income
11,027 39,979 59,749 35,726 37,080 21,865 72,806 Interest Income and Dividend Revenue
13,084 12,460 15,508 18,167 20,998 26,272 39,165 Other 2,231 (548) 16,749
(3,150)
(22,965)
322
(26,115) Total Revenues 440,787 629,701 669,508 785,551 768,174 897,949 1,553,725 Expenses Compensation 102,888 99,886 82,000 102,702 110,266 203,466 212,968 Performance Fee Compensation
Realized Carried Interest
56,441 147,419 85,686 179,925 124,292 99,517 304,217 Realized Incentive Fees
3,300 1,764 4,888 1,364 2,931 5,433 4,295 Unrealized Carried Interest
14,257 (38,972) 41,787 11,798 59,174 41,960 70,972 Unrealized Incentive Fees
2,542 6,229 3,943 8,509 9,680 6,700 18,189 Total Compensation and Benefits
179,428 216,326 218,304 304,298 306,343 357,076 610,641 Other Operating Expenses
52,201 47,908 55,756 51,969 55,373 100,298 107,342 Total Expenses 231,629 264,234 274,060 356,267 361,716 457,374 717,983 Economic Income
209,158 $
365,467 $
395,448 $
429,284 $
406,458 $
440,575 $
835,742 $
Total Assets Under Management
103,197,060 $ 101,876,562 $ 101,963,652 $ 102,070,930 $ 104,034,287 $ 103,197,060 $ 104,034,287 $ Fee-Earning Assets Under Management 66,744,550 $ 65,785,083 $ 72,030,054 $ 71,904,741 $ 73,710,243 $ 66,744,550 $ 73,710,243 $ Weighted Average Fee-Earning AUM 67,215,301 $ 66,708,328 $ 68,688,082 $ 72,268,792 $ 73,320,319 $ 67,306,366 $ 72,769,703 $ LP Capital Invested 1,524,415 $ 1,719,764 $ 3,978,386 $ 2,590,419 $ 2,371,918 $ 5,271,596 $ 4,962,337 $ Total Capital Invested 1,557,192 $ 1,749,778 $ 4,048,827 $ 2,651,965 $ 2,379,922 $ 5,377,652 $ 5,031,887 $ |
 Blackstone 16 Hedge Fund Solutions Note: The amounts reported for LP and Total Capital Invested for the periods 3Q’16 through 1Q’17 reflect an adjustment from
those previously reported. (Dollars in Thousands)
2Q'16 3Q'16 4Q'16 1Q'17 2Q'17 2Q'16 YTD 2Q'17 YTD Revenues Management Fees, Net Base Management Fees 130,123 $
130,305 $
131,150 $
128,468 $
128,698 $
260,281 $
257,166 $
Transaction and Other Fees, Net
(5) 116 407 259 1,696 538 1,955 Total Management Fees, Net 130,118 130,421 131,557 128,727 130,394 260,819 259,121 Performance Fees Realized Incentive Fees (251) 4,572 35,172 14,684 6,995 2,433 21,679 Unrealized Carried Interest 801 (84) (245) 3,797 143 833 3,940 Unrealized Incentive Fees 1,036 12,038 (9,354) 40,311 22,458 (1,899) 62,769 Total Performance Fees 1,586 16,526 25,573 58,792 29,596 1,367 88,388 Investment Income (Loss) Realized (515) (1,211) (753) (632) 225 (5,260) (407) Unrealized 9,357 12,219 6,177 18,293 11,578 (2,934) 29,871 Total Investment Income (Loss) 8,842 11,008 5,424 17,661 11,803 (8,194) 29,464 Interest Income and Dividend Revenue 5,205 4,692 7,890 7,554 8,769 10,501 16,323 Other 1,125 (260) 8,680 (1,610) (10,720) (263) (12,330) Total Revenues 146,876 162,387 179,124 211,124 169,842 264,230 380,966 Expenses Compensation 44,436 47,206 39,509 47,604 47,361 98,605 94,965 Performance Fee Compensation Realized Incentive Fees 1,325 2,902 13,307 7,317 4,362 3,188 11,679 Unrealized Carried Interest 238 35 (92) 1,209 178 238 1,387 Unrealized Incentive Fees 480 4,557 (3,550) 14,004 9,242 (715) 23,246 Total Compensation and Benefits 46,479 54,700 49,174 70,134 61,143 101,316 131,277 Other Operating Expenses 27,218 27,432 27,840 25,800 26,240 53,364 52,040 Total Expenses 73,697 82,132 77,014 95,934 87,383 154,680 183,317 Economic Income 73,179 $
80,255 $
102,110 $
115,190 $
82,459 $
109,550 $
197,649 $
Total Assets Under Management
68,649,878 $ 70,113,508 $ 71,119,718 $ 73,303,381 $ 72,476,444 $ 68,649,878 $ 72,476,444 $ Fee-Earning Assets Under Management 64,973,999 $ 66,434,971 $ 66,987,553 $ 68,812,528 $ 67,824,464 $ 64,973,999 $ 67,824,464 $ Weighted Average Fee-Earning AUM 65,520,626 $ 66,600,260 $ 67,993,100 $ 68,406,531 $ 69,301,130 $ 65,436,771 $ 68,853,830 $ LP Capital Invested 32,804 $
144,505 $
260,482 $
121,857 $
89,985 $
348,561 $
211,842 $
Total Capital Invested
32,809 $
151,099 $
260,742 $
121,888 $
93,191 $
362,602 $
215,079 $ |
 Blackstone 17 Credit (Dollars in Thousands) 2Q'16 3Q'16 4Q'16 1Q'17 2Q'17 2Q'16 YTD 2Q'17 YTD Revenues Management Fees, Net Base Management Fees 131,392 $
133,867 $
135,499 $
139,147 $
138,250 $
257,382 $
277,397 $
Transaction and Other Fees, Net
1,424 1,823 2,011 1,484 2,162 2,766 3,646 Management Fee Offsets (9,982) (7,091) (10,781) (17,859) (4,653) (19,640) (22,512) Total Management Fees, Net 122,834 128,599 126,729 122,772 135,759 240,508 258,531 Performance Fees Realized Carried Interest 296 15,644 10,223 8,800 16,032 296 24,832 Realized Incentive Fees 23,515 21,866 33,221 29,539 28,796 45,212 58,335 Unrealized Carried Interest 87,295 75,093 59,344 48,557 (12,863) 72,516 35,694 Unrealized Incentive Fees 1,029 5,689 2,429 992 3,461 1,299 4,453 Total Performance Fees 112,135 118,292 105,217 87,888 35,426 119,323 123,314 Investment Income (Loss) Realized 11,330 (328) 2,976 3,058 1,895 8,356 4,953 Unrealized 8,412 12,875 7,195 7,449 788 (9,149) 8,237 Total Investment Income (Loss) 19,742 12,547 10,171 10,507 2,683 (793) 13,190 Interest Income and Dividend Revenue 7,428 6,769 7,344 9,233 11,037 14,176 20,270 Other 1,795 (28) 9,171 (1,727) (12,660) 431 (14,387) Total Revenues 263,934 266,179 258,632 228,673 172,245 373,645 400,918 Expenses Compensation 55,691 47,614 46,400 54,979 56,786 108,073 111,765 Performance Fee Compensation Realized Carried Interest 194 7,267 4,989 4,633 7,937 194 12,570 Realized Incentive Fees 10,626 10,770 15,091 14,071 14,188 20,753 28,259 Unrealized Carried Interest 41,257 39,681 30,005 21,962 (7,071) 34,259 14,891 Unrealized Incentive Fees (333) 2,722 1,096 626 1,678 152 2,304 Total Compensation and Benefits 107,435 108,054 97,581 96,271 73,518 163,431 169,789 Other Operating Expenses 29,464 28,016 36,611 32,701 36,406 55,684 69,107 Total Expenses 136,899 136,070 134,192 128,972 109,924 219,115 238,896 Economic Income 127,035 $
130,109 $
124,440 $
99,701 $
62,321 $
154,530 $
162,022 $
Total Assets Under Management
84,749,076 $ 89,327,781 $ 93,277,145 $ 93,111,200 $ 94,525,171 $ 84,749,076 $ 94,525,171 $ Fee-Earning Assets Under Management 64,820,990 $ 66,189,763 $ 68,961,656 $ 71,266,662 $ 72,369,473 $ 64,820,990 $ 72,369,473 $ Weighted Average Fee-Earning AUM 63,656,504 $ 65,648,573 $ 68,177,879 $ 70,289,518 $ 71,148,399 $ 62,622,116 $ 70,752,556 $ LP Capital Invested 699,516 $
588,389 $
1,380,009 $ 2,261,266 $ 1,490,880 $ 1,286,451 $ 3,752,146 $ Total Capital Invested 822,172 $
605,383 $
1,416,913 $ 2,318,201 $ 1,687,991 $ 1,390,903 $ 4,006,192 $ |
 Blackstone 18 Unitholder Distribution A detailed description of Blackstone’s distribution policy and the definition of Distributable Earnings can be found on page 31, Definitions and Distribution Policy. DE before Certain Payables represents Distributable Earnings before the deduction for the Payable Under Tax Receivable Agreement and tax expense (benefit) of wholly owned subsidiaries. Per
Unit calculations are based on end of period Total Common Units Outstanding (page 30, Unit Rollforward); actual distributions are paid to unitholders as of the applicable record date. Retained capital is withheld
pro-rata from common and Blackstone Holdings Partnership unitholders. Common unitholders’ share was $60 million for 2Q’17 and $159 million for 2Q’17 YTD. Generated $0.63 of Distributable Earnings per common unit during the quarter, up 54% from the prior year, bringing the year-to-date amount to $1.65 per common unit. Declared a quarterly distribution of $0.54 per common unit to record holders as of July 31, 2017; payable on August 7, 2017. % Change % Change (Dollars in Thousands, Except per Unit Data) 2Q'16 3Q'16 4Q'16 1Q'17 2Q'17 vs. 2Q'16 2Q'16 YTD 2Q'17 YTD vs. 2Q'16 YTD Distributable Earnings 494,913 $ 593,453 $ 638,994 $ 1,230,138 $ 781,365 $ 58% 889,128 $ 2,011,503 $ 126% Add: Other Payables Attributable to Common Unitholders 10,438 30,576 41,304 6,632 29,808 186% 10,438 36,440 249% DE before Certain Payables 505,351 624,029 680,298 1,236,770 811,173 61% 899,566 2,047,943 128% Percent to Common Unitholders 54% 54% 55% 55% 56% 54% 55% DE before Certain Payables Attributable
to Common Unitholders
274,711 340,069 373,655 683,473 451,302 64% 488,384 1,134,775 132% Less: Other Payables Attributable to Common Unitholders (10,438) (30,576) (41,304) (6,632) (29,808) 186% (10,438) (36,440) 249% DE Attributable to Common Unitholders 264,273 309,493 332,351 676,841 421,494 59% 477,946 1,098,335 130% DE per Common Unit 0.41 $ 0.48 $ 0.51 $ 1.02 $ 0.63 $
54% 0.74 $ 1.65 $
123% Less: Retained Capital per Common Unit (0.05) $ (0.07) $ (0.04) $ (0.15) $ (0.09) $
80% (0.10) $ (0.24) $
140% Actual Distribution per Common Unit 0.36 $ 0.41 $ 0.47 $ 0.87 $ 0.54 $
50% 0.64 $ 1.41 $
120% Record Date July 31, 2017 Payable Date Aug 7, 2017 |
 Blackstone 19 2Q’17 Total AUM Rollforward (Dollars in Millions) 2Q’17 LTM Total AUM Rollforward (Dollars in Millions) Inflows include contributions, capital raised, other increases in available capital, purchases and acquisitions. Outflows represent
redemptions, client withdrawals and other decreases in available
capital. Realizations represent realizations from the disposition of assets. Market Activity represents gains (losses) on portfolio investments and impact of foreign exchange rate fluctuations. Total Assets Under Management Private Equity Real Estate Hedge Fund Solutions Credit Inflows: BREP opportunistic funds ($1.3 billion); BREDS ($1.2 billion); BREIT ($417 million); core+ funds ($285 million).
Realizations: BREP opportunistic funds ($3.5 billion); BREP co-investment ($664 million); BREDS ($279 million); core+ funds ($127 million). Market Activity: Carrying value increases of 5.4% and 3.0% within the opportunistic and core+ funds, respectively.
Inflows: Individual investor and specialized solutions ($1.0 billion); customized solutions ($546 million); commingled products ($404
million). Outflows and Realizations: Individual investor and specialized solutions ($1.4 billion); commingled products ($1.3 billion); customized
solutions ($797 million).
Market Activity:
BAAM’s Principal Solutions Composite up 1.3% gross (1.1%
net) during the quarter. Inflows: Three new CLOs ($2.0 billion); distressed strategies ($1.5 billion); long only ($977 million); BDCs ($438 million). Outflows and Realizations: Capital returned to investors for CLOs outside investment periods ($2.6 billion); distressed strategies ($352 million); dividends from BDCs ($247 million). Inflows: Tactical Opportunities ($717 million); Core Private Equity ($626 million); Strategic Partners ($263
million). Realizations: Corporate Private Equity ($2.0 billion); Strategic Partners ($557 million); Tactical Opportunities ($187
million). Market Activity:
Carrying value increase of 2.8% within Corporate Private Equity
and 4.7% within Tactical Opportunities. Private
Real Hedge Fund Equity Estate Solutions 1Q'17 99,711 $ 102,071 $ 73,303 $ 93,111 $ 368,197 $ Inflows 1,754 3,200 1,969 5,149 12,071 Outflows (313) (867) (3,361) (1,110) (5,651) Realizations (2,796) (4,564) (186) (3,550) (11,096) Net Inflows (Outflows) (1,355) (2,232) (1,578) 489 (4,676) Market Activity 1,664 4,195 751 925 7,535 2Q'17 100,020 $ 104,034 $ 72,476 $ 94,525 $ 371,056 $ QoQ Increase (Decrease) 0% 2% (1)% 2% 1% Credit Total Private Real Hedge Fund Equity Estate Solutions 2Q'16 99,686 $ 103,197 $ 68,650 $ 84,749 $ 356,282 $ Inflows 10,924 12,077 11,186 23,251 57,438 Outflows (1,257) (1,164) (11,106) (6,674) (20,201) Realizations (17,251) (22,239) (943) (10,961) (51,395) Net Inflows (Outflows) (7,585) (11,326) (863) 5,616 (14,158) Market Activity 7,919 12,163 4,689 4,160 28,932 2Q'17 100,020 $ 104,034 $ 72,476 $ 94,525 $ 371,056 $ YoY Increase 0% 1% 6% 12% 4% Credit Total |
 Blackstone 20 Inflows include contributions, capital raised, other increases in available capital, purchases and acquisitions. Outflows represent
redemptions, client withdrawals and other decreases in available
capital. Realizations represent realizations from the disposition of assets. Market Activity represents gains (losses) on portfolio investments and impact of foreign exchange rate fluctuations. 2Q’17 Fee-Earning AUM Rollforward (Dollars in Millions) 2Q’17 LTM Fee-Earning AUM Rollforward (Dollars in Millions) Private Equity Real Estate Hedge Fund Solutions Credit Inflows: BREDS ($1.7 billion); BREP opportunistic funds ($776 million); core+ funds ($466 million); BREIT ($417 million). Realizations: BREP opportunistic funds ($1.2 billion); BREDS ($734 million); BREP co-investment ($347 million); core+ funds ($96 million).
Inflows: Individual investor and
specialized solutions ($982 million); customized solutions ($462 million); commingled products ($361 million). Outflows and Realizations: Commingled products ($1.4 billion); individual investor and specialized solutions ($1.3 billion); customized
solutions ($797 million).
Inflows: Three new CLOs ($2.0 billion); mezzanine funds ($1.2 billion); long only ($895 million); BDCs ($438 million); distressed
strategies
($373 million).
Outflows and Realizations:
Capital returned to investors for CLOs outside investment periods ($2.5 billion); dividends from BDCs
($247 million); distressed strategies ($221
million). Inflows:
Core Private Equity ($771 million); Tactical Opportunities ($615 million); Strategic
Partners ($470 million).
Realizations: Corporate Private
Equity ($697 million); Strategic Partners ($612 million).
Fee-Earning Assets Under Management
Private Real Hedge Fund Equity Estate Solutions 1Q'17 68,232 $ 71,905 $ 68,813 $ 71,267 $ 280,216 $ Inflows 2,242 3,376 1,805 4,924 12,348 Outflows (1,141) (99) (3,330) (904) (5,473) Realizations (1,400) (2,371) (177) (3,277) (7,225) Net Inflows (Outflows) (299) 906 (1,701) 744 (351) Market Activity 97 899 713 359 2,069 2Q'17 68,030 $ 73,710 $ 67,824 $ 72,369 $ 281,935 $ QoQ Increase (Decrease) (0)% 3% (1)% 2% 1% Credit Total Private Real Hedge Fund Equity Estate Solutions 2Q'16 69,467 $ 66,745 $ 64,974 $ 64,821 $ 266,007 $ Inflows 8,050 17,255 10,239 19,066 54,610 Outflows (1,656) (2,232) (10,768) (4,126) (18,783) Realizations (8,349) (9,665) (863) (9,744) (28,621) Net Inflows (Outflows) (1,955) 5,359 (1,393) 5,196 7,207 Market Activity 518 1,607 4,243 2,353 8,721 2Q'17 68,030 $ 73,710 $ 67,824 $ 72,369 $ 281,935 $ YoY Increase (Decrease) (2)% 10% 4% 12% 6% Credit Total |
 Blackstone 21 Net Accrued Performance Fees $3.3 billion Net Accrued Performance Fees at 2Q’17 $2.75 per unit Net Accrued Performance Fees at 2Q’17 Net Accrued Performance Fees are presented net of performance fee compensation and do not include clawback amounts, if any, which are
disclosed in the 10-K/Q. Net Realized Performance Fees are
included in DE. Net Realized Performance Fees represents Performance Fees realized, but not yet distributed as of the reporting date and included in the Net Accrued Performance Fee balance. When these fees are received, the receivable is reduced without further impacting DE. Per Unit
calculations are based on end of period DE Units Outstanding (see
page 30, Unit Rollforward).
Net Accrued Performance Fees
(Dollars in Millions, Except per Unit Data)
1Q'17 2Q'17 2Q'17 Per Unit QoQ Change Private Equity BCP IV Carried Interest 109 $
86
$
0.07 $
(23) $
BCP V Carried Interest
128 68 0.06 (60) BCP VI Carried Interest 560 579 0.48 19 BEP I Carried Interest 99 89 0.07 (10) BEP II Carried Interest 11 12 0.01 1 Tactical Opportunities Carried Interest 104 117 0.10 13 BTAS Carried Interest 21 27 0.02 6 Strategic Partners Carried Interest 38 46 0.04 8 Other Carried Interest 3 4 - 1 Total Private Equity 1,073 $
1,028 $
0.86 $
(45) $
Real Estate
BREP IV Carried Interest
7 8 0.01 1 BREP V Carried Interest 265 238 0.20 (27) BREP VI Carried Interest 316 229 0.19 (87) BREP VII Carried Interest 552 544 0.45 (8) BREP VIII Carried Interest 179 211 0.18 32 BREP Europe III Carried Interest 161 169 0.14 8 BREP Europe IV Carried Interest 289 367 0.31 78 BREP Asia Carried Interest 96 76 0.06 (20) BPP Carried Interest 64 70 0.06 6 BPP Incentive Fees 41 48 0.04 7 BREIT Incentive Fees - 3 - 3 BREDS Carried Interest 16 17 0.01 1 BREDS Incentive Fees 5 10 0.01 5 Asia Platform Incentive Fees 7 7 0.01 - Total Real Estate 1,998 $
1,997 $
1.67 $
(1) $
Hedge Fund Solutions
Incentive Fees
38 50 0.04 12 Total Hedge Fund Solutions 38 $
50
$
0.04 $
12 $
Credit
Carried Interest
195 192 0.16 (3) Incentive Fees 26 25 0.02 (1) Total Credit 221 $
217
$
0.18
$
(4)
$
Total Blackstone
Carried Interest
3,213 3,149 2.63 (64) Incentive Fees 117 143 0.12 26 Net Accrued Performance Fees 3,330 $
3,292 $
2.75 $
(38) $
Memo: Net Realized Performance Fees
91 $
42
$
0.04 $
(49) $
|
 Blackstone 22 Investment Records as of June 30, 2017 (a) Continued... Committed Available Unrealized Investments Realized Investments Total Investments Net IRRs (d) (Dollars in Thousands, Except Where Noted) Capital Capital (b) Value MOIC (c) % Public Value MOIC (c) Value MOIC (c) Realized Total Private Equity BCP I (Oct 1987 / Oct 1993) 859,081 $ - $
- $
n/a - 1,741,739 $ 2.6x 1,741,739 $ 2.6x 19% 19% BCP II (Oct 1993 / Aug 1997) 1,361,100 - - n/a - 3,256,819 2.5x 3,256,819 2.5x 32% 32% BCP III (Aug 1997 / Nov 2002) 3,967,422 - - n/a - 9,184,688 2.3x 9,184,688 2.3x 14% 14% BCOM (Jun 2000 / Jun 2006) 2,137,330 24,575 19,779 1.6x - 2,951,018 1.4x 2,970,797 1.4x 6% 6% BCP IV (Nov 2002 / Dec 2005) 6,773,182 212,516 1,114,368 1.1x 31% 20,289,732 3.1x 21,404,100 2.8x 41% 36% BCP V (Dec 2005 / Jan 2011) 21,024,923 1,246,134 2,697,056 1.2x 44% 35,301,800 2.0x 37,998,856 1.9x 9% 8% BCP VI (Jan 2011 / May 2016) 15,189,705 1,844,270 15,373,870 1.5x 23% 6,531,264 2.0x 21,905,134 1.6x 28% 13% BEP I (Aug 2011 / Feb 2015) 2,437,608 165,197 2,813,735 1.5x 33% 882,893 1.9x 3,696,628 1.5x 38% 13% BEP II (Feb 2015 / Feb 2021) 4,840,487 2,313,752 1,929,406 1.2x - - n/a 1,929,406 1.2x n/a 22% BCP VII (May 2016 / May 2022) 18,536,458 14,818,376 2,536,976 1.1x - 7,185 1.0x 2,544,161 1.1x n/a n/m Total Corporate Private Equity 77,127,296 $ 20,624,820 $ 26,485,190 $ 1.3x 22% 80,147,138 $ 2.2x 106,632,328 $ 1.9x 17% 15% Tactical Opportunities 13,958,437 6,023,018 8,990,106 1.2x 8% 2,633,301 1.5x 11,623,407 1.3x 25% 11% Tactical Opportunities Co-Investment and Other 3,616,700 1,122,199 2,480,339 1.2x - 341,923 1.4x 2,822,262 1.2x n/a 14% Strategic Partners I-V and Co-Investment (e) 12,832,966 2,443,900 2,732,918 n/m - 14,602,632 n/m 17,335,550 1.5x n/a 13% Strategic Partners VI LBO, RE and SMA (e) 7,402,171 2,418,015 3,591,899 n/m - 1,442,740 n/m 5,034,639 1.4x n/a 22% Strategic Partners VII (e) 7,489,970 5,318,682 1,008,618 n/m - 91,547 n/m 1,100,165 1.3x n/a n/m Strategic Partners RA II (e) 249,384 50,889 137,161 n/m - - n/m 137,161 1.0x n/a n/m BCEP (f) 4,755,133 4,150,911 604,222 1.0x - - n/a 604,222 1.0x n/a n/a Other Funds and Co-Investment (g) 1,502,885 353,556 45,120 0.8x 40% 636,117 0.9x 681,237 0.9x n/a n/a Real Estate Dollar Pre-BREP 140,714 $ - $
- $
n/a - 345,190 $ 2.5x 345,190 $ 2.5x 33% 33% BREP I (Sep 1994 / Oct 1996) 380,708 - - n/a - 1,327,708 2.8x 1,327,708 2.8x 40% 40% BREP II (Oct 1996 / Mar 1999) 1,198,339 - - n/a - 2,531,614 2.1x 2,531,614 2.1x 19% 19% BREP III (Apr 1999 / Apr 2003) 1,522,708 - - n/a - 3,330,406 2.4x 3,330,406 2.4x 21% 21% BREP IV (Apr 2003 / Dec 2005) 2,198,694 - 378,800 0.5x 29% 4,160,477 2.2x 4,539,277 1.7x 31% 12% BREP V (Dec 2005 / Feb 2007) 5,539,418 - 2,295,369 2.0x 18% 10,866,833 2.3x 13,162,202 2.3x 12% 11% BREP VI (Feb 2007 / Aug 2011) 11,060,444 557,693 2,631,405 2.1x 35% 24,422,587 2.5x 27,053,992 2.5x 14% 13% BREP VII (Aug 2011 / Apr 2015) 13,493,814 2,172,461 14,166,287 1.7x 17% 12,106,365 1.9x 26,272,652 1.8x 26% 18% BREP VIII (Apr 2015 / Oct 2020) 16,418,814 10,189,921 8,468,959 1.4x 1% 2,219,794 1.2x 10,688,753 1.3x 20% 19% Total Global BREP 51,953,653 $ 12,920,075 $ 27,940,820 $ 1.6x 14% 61,310,974 $ 2.2x 89,251,794 $ 2.0x 19% 16% Euro BREP Int'l (Jan 2001 / Sep 2005) 824,172 € - € - € n/a - 1,369,016 € 2.1x 1,369,016 € 2.1x 23% 23% BREP Int'l II (Sep 2005 / Jun 2008) 1,629,748 - 244,412 0.7x 39% 2,131,289 2.0x 2,375,701 1.7x 9% 6% BREP Europe III (Jun 2008 / Sep 2013) 3,205,140 465,159 2,886,818 1.9x - 3,238,060 2.2x 6,124,878 2.1x 22% 16% BREP Europe IV (Sep 2013 / Dec 2016) 6,707,621 1,480,234 8,603,484 1.6x 3% 1,401,874 1.6x 10,005,358 1.6x 25% 19% BREP Europe V (Dec 2016 / Jun 2022) 7,802,759 6,991,347 767,126 1.0x - - n/a 767,126 1.0x n/a n/m Total Euro BREP 20,169,440 € 8,936,740 € 12,501,840 € 1.6x 3% 8,140,239 € 2.0x 20,642,079 € 1.7x 16% 14% BREP Co-Investment (h) 6,819,065 $ 146,573 $ 2,568,442 $ 1.7x 59% 10,854,235 $ 2.1x 13,422,677 $ 2.0x 16% 16% BREP Asia (Jun 2013 / Dec 2017) 5,088,136 2,918,305 2,989,782 1.4x 1% 2,158,819 1.7x 5,148,601 1.5x 22% 17% Total BREP 88,557,606 $ 26,196,073 $ 48,710,260 $ 1.6x 12% 85,150,346 $ 2.2x 133,860,606 $ 1.9x 18% 16% BPP (i) 14,365,011 $ 3,271,785 $ 14,037,128 $ 1.2x - 107,286 $ 1.9x 14,144,414 $ 1.2x 36% 12% BREDS (j) 12,830,654 $ 6,332,716 $ 3,112,829 $ 1.2x - 7,058,499 $ 1.3x 10,171,328 $ 1.3x 12% 11% |
 Blackstone 23 Investment Records as of June 30, 2017 (a) – Continued The returns presented herein represent those of the applicable Blackstone Funds and not those of The Blackstone Group L.P.
n/m Not meaningful. n/a Not applicable. (a) Preliminary. (b) Available Capital represents total investable capital commitments, including side-by-side, adjusted for certain expenses and
expired or recallable capital and may include leverage, less
invested capital. This amount is not reduced by outstanding commitments to investments. (c) Multiple of Invested Capital (“MOIC”) represents carrying value, before management fees, expenses and Carried Interest, divided
by invested capital. (d)
Net Internal Rate of Return (“IRR”) represents the annualized
inception to June 30, 2017 IRR on total invested capital based on realized proceeds and unrealized value, as applicable, after management fees, expenses and Carried Interest.
(e) Realizations are treated as return of capital until fully recovered and therefore unrealized and realized MOICs are not meaningful. (f) BCEP, or Blackstone Core Equity Partners, is a core private equity fund which invests with a more modest risk profile and longer hold
period. (g)
Returns for Other Funds and Co-Investment are not meaningful as these funds
have limited transaction activity. (h)
BREP Co-Investment represents co-investment capital raised for various
BREP investments. The Net IRR reflected is calculated by aggregating each co- investment’s realized proceeds and unrealized value, as applicable, after management fees, expenses and Carried
Interest. (i)
BPP represents the core+ real estate funds which invest with a more modest risk
profile and lower leverage. Excludes BREIT. (j)
Excludes Capital Trust drawdown funds.
(k) BSCH, or Blackstone Strategic Capital Holdings, is a permanent capital vehicle focused on acquiring strategic minority positions in alternative asset managers. (l) Funds presented represent the flagship credit drawdown funds only. The Total Credit Net IRR is the combined IRR of the seven credit
drawdown funds presented.
Committed Available Unrealized Investments Realized Investments Total Investments Net IRRs (d) (Dollars in Thousands, Except Where Noted) Capital Capital (b) Value MOIC (c) % Public Value MOIC (c) Value MOIC (c) Realized Total Hedge Fund Solutions BSCH (Dec 2013 / Jun 2020) (k) 3,300,600 $ 2,640,212 $ 676,387 $ 1.0x - 143,817 $ n/a 820,204 $ 1.3x n/a 4% BSCH Co-Investment 75,500 31,237 42,270 0.9x - 4,298 n/a 46,568 1.0x n/a 1% Total Hedge Fund Solutions 3,376,100 $ 2,671,449 $ 718,657 $ 1.0x - 148,115 $ n/a 866,772 $ 1.2x n/a 4% Credit (l) Mezzanine I (Jul 2007 / Oct 2011) 2,000,000 $ 99,280 $
146,709 $ 1.2x - 4,679,765 $ 1.6x 4,826,474 $ 1.6x n/a 17% Mezzanine II (Nov 2011 / Nov 2016) 4,120,000 1,149,661 3,512,723 1.1x - 2,656,386 1.5x 6,169,109 1.3x n/a 13% Mezzanine III (Sep 2016 / Sep 2021) 6,639,133 4,615,989 1,602,966 1.1x - - n/a
1,602,966 1.1x n/a n/m Stressed / Distressed Investing I (Sep 2009 / May 2013) 3,253,143 275,335 814,905 1.1x - 5,120,819 1.5x 5,935,724 1.4x n/a 11% Stressed / Distressed Investing II (Jun 2013 / Jun 2018) 5,125,000 1,232,781 3,600,590 1.2x - 1,338,835 1.3x 4,939,425 1.2x n/a 15% Energy Select Opportunities (Nov 2015 / Nov 2018) 2,856,866 1,705,293 934,990 1.1x - 172,602 1.5x 1,107,592 1.2x n/a 20% Euro European Senior Debt Fund (Feb 2015 / Feb 2018) 1,964,689 € 1,994,714 € 1,537,353 € 1.0x - 215,224 € 1.2x 1,752,577 € 1.0x n/a 5% Total Credit 26,260,552 $ 11,353,411 $ 12,362,599 $ 1.1x - 14,206,434 $ 1.5x 26,569,033 $ 1.3x n/a 14% |
 Blackstone 24 Reconciliation of GAAP to Non-GAAP Measures Notes on page 25. (Dollars in Thousands) 2Q'16 3Q'16 4Q'16 1Q'17 2Q'17 2Q'16 YTD 2Q'17 YTD Net Income Attributable to The Blackstone Group L.P. 198,626 $ 312,905 $ 367,951 $ 461,825 $ 342,775 $ 358,379 $ 804,600 $ Net Income Attributable to Non-Controlling Interests in Blackstone Holdings
201,805 285,267 342,010 417,258 287,979 333,007 705,237 Net Income Attributable to Non-Controlling Interests in Consolidated Entities
64,729 82,653 58,684 138,685 112,944 104,815 251,629 Net Income (Loss) Attributable to Redeemable Non-Controlling Interests in Consolidated Entities (2,049) 10,764 1,663 2,000 991 (8,450) 2,991 Net Income 463,111 $ 691,589 $ 770,308 $ 1,019,768 $ 744,689 $ 787,751 $ 1,764,457 $ Provision for Taxes 47,415 27,714 48,087 57,437 29,608 56,561 87,045 Income Before Provision for Taxes 510,526 $ 719,303 $ 818,395 $ 1,077,205 $ 774,297 $ 844,312 $ 1,851,502 $ Transaction-Related Charges (a) 69,956 60,029 70,816 56,979 57,831 134,092 114,810 Amortization of Intangibles (b) 23,208 22,054 15,996 11,344 11,344 46,416 22,688 (Income) Associated with Non-Controlling Interests of Consolidated Entities
(c) (62,680) (93,417) (60,347) (140,685) (113,935) (96,365) (254,620) Economic Income 541,010 $ 707,969 $ 844,860 $ 1,004,843 $ 729,537 $ 928,455 $ 1,734,380 $ (Taxes) (d) (21,234) (20,985) (33,250) (18,805) (24,168) (38,028) (42,973) Economic Net Income 519,776 $ 686,984 $ 811,610 $ 986,038 $ 705,369 $ 890,427 $ 1,691,407 $ Taxes (d) 21,234 20,985 33,250 18,805 24,168 38,028 42,973 Performance Fee Adjustment (e) (449,372) (672,646) (741,903) (1,063,728) (757,006) (763,437) (1,820,734) Investment (Income) Adjustment (f) (59,771) (87,887) (99,282) (103,959) (67,720) (33,121) (171,679) Other Revenue (g) (8,546) 425 (52,839) 8,287 62,469 (2,298) 70,756 Net Interest Loss (h) 13,546 14,184 10,542 10,954 6,591 26,897 17,545 Performance Fee Compensation and Benefits Adjustment (i) 180,723 267,415 313,809 407,695 311,870 286,798 719,565 Equity-Based Compensation - Non-Incentive Fee Related (j) 16,852 16,624 19,308 26,650 25,442 37,815 52,092 Fee Related Earnings 234,442 $ 246,084 $ 294,495 $ 290,742 $ 311,183 $ 481,109 $ 601,925 $ Net Realized Performance Fees (k) 251,935 352,008 327,053 772,780 429,177 439,729 1,201,957 Realized Investment Income (l) 53,670 60,634 95,666 202,894 100,887 43,569 303,781 Net Interest (Loss) (h) (13,546) (14,184) (10,542) (10,954) (6,591) (26,897) (17,545) Taxes and Related Payables Including Payable Under Tax Receivable Agreement
(m) (31,588) (51,089) (67,678) (25,324) (53,291) (48,382) (78,615) Distributable Earnings 494,913 $ 593,453 $ 638,994 $ 1,230,138 $ 781,365 $ 889,128 $ 2,011,503 $ Interest Expense (n) 48,779 47,265 53,030 56,830 59,846 97,211 116,676 Taxes and Related Payables Including Payable Under Tax Receivable Agreement
(m) 31,588 51,089 67,678 25,324 53,291 48,382 78,615 Depreciation and Amortization 6,331 7,338 12,010 6,216 6,392 12,623 12,608 Adjusted EBITDA 581,611 $ 699,145 $ 771,712 $ 1,318,508 $ 900,894 $ 1,047,344 $ 2,219,402 $ (o) |
 Blackstone 25 Reconciliation of GAAP to Non-GAAP Measures – Notes Note: See page 31, Definitions and Distribution Policy. (a) This adjustment adds back to Income (Loss) Before Provision (Benefit) for Taxes amounts for Transaction-Related Charges which
include principally equity-based compensation charges
associated with Blackstone’s initial public offering and long-term retention programs outside of annual deferred compensation and other corporate actions.
(b) This adjustment adds back to Income (Loss) Before Provision (Benefit) for Taxes amounts for the Amortization of Intangibles which
are associated with Blackstone’s initial public offering and
other corporate actions. (c)
This adjustment adds back to Income (Loss) Before Provision (Benefit) for Taxes
the amount of (Income) Loss Associated with Non- Controlling
Interests of Consolidated Entities and includes the amount of Management Fee Revenues associated with Consolidated CLO Entities. (d) Taxes represent the total GAAP tax provision adjusted to include only the current tax provision (benefit) calculated on Income (Loss)
Before Provision for Taxes.
(e) This adjustment removes from EI the total segment amount of Performance Fees.
(f) This adjustment removes from EI the total segment amount of Investment Income (Loss).
(g) This adjustment removes from EI the total segment amount of Other Revenue.
(h) This adjustment represents Interest Income and Dividend Revenue less Interest Expense.
(i) This adjustment removes from expenses the compensation and benefit amounts related to Blackstone’s profit sharing plans related
to Performance Fees, including Incentive Fee Related
equity-based award expense. (j)
Represents Non-Incentive Fee Related equity-based award expense and
excludes all transaction-related equity-based charges.
(k) Represents the adjustment for realized Performance Fees net of corresponding actual amounts due under Blackstone’s profit
sharing plans related thereto. Equals the sum of Net Realized
Incentive Fees and Net Realized Carried Interest. (l)
Represents the adjustment for Blackstone’s Realized Investment Income
(Loss). (m)
Taxes and Related Payables Including Payable Under Tax Receivable Agreement
represent the total GAAP tax provision adjusted to
include only the current tax provision (benefit) calculated on Income (Loss) Before Provision for Taxes and the Payable Under Tax Receivable Agreement. (n) Represents Interest Expense, including inter-segment interest related expense.
(o) Effective January 1, 2017, Fee Related Earnings, a Total Segment measure, has been redefined to exclude all Equity-Based
Compensation and Other Revenue. Distributable Earnings, a Total
Segment measure, has been redefined to exclude Other Revenue. All
prior periods have been recast to reflect this definition. |
 Blackstone 26 Reconciliation of GAAP to Total Segment Measures Notes on page 27. Continued... (Dollars in Thousands) 2Q'16 3Q'16 4Q'16 1Q'17 2Q'17 2Q'16 YTD 2Q'17 YTD Management and Advisory Fees, Net GAAP 607,823 $ 596,154 $ 630,092 $ 642,142 $ 686,586 $ 1,216,729 $ 1,328,728 $ Elimination Adjustment (a) 4,397 5,526 5,800 7,439 10,250 8,692 17,689 Total Segment 612,220 $ 601,680 $ 635,892 $ 649,581 $ 696,836 $ 1,225,421 $ 1,346,417 $ Performance Fees GAAP 449,243 $ 671,032 $ 741,563 $ 1,063,142 $ 756,397 $ 763,736 $ 1,819,539 $ Elimination Adjustment (a) 129 1,614 340 586 609 (299) 1,195 Total Segment 449,372 $ 672,646 $ 741,903 $ 1,063,728 $ 757,006 $ 763,437 $ 1,820,734 $ Investment Income GAAP 105,139 $ 143,103 $ 116,317 $ 211,156 $ 132,333 $ 96,631 $ 343,489 $ Consolidation and Elimination Adjustment (b) (45,368) (55,216) (17,035) (107,197) (64,613) (63,510) (171,810) Total Segment 59,771 $ 87,887 $ 99,282 $ 103,959 $ 67,720 $ 33,121 $ 171,679 $ Interest and Dividend Revenue GAAP 22,286 $ 21,819 $ 28,544 $ 28,495 $ 33,703 $ 45,361 $ 62,198 $ Elimination Adjustment (c) 12,947 11,262 13,944 17,381 19,552 24,953 36,933 Total Segment 35,233 $ 33,081 $ 42,488 $ 45,876 $ 53,255 $ 70,314 $ 99,131 $ Other GAAP 7,935 $
(423) $
52,853 $ (4,212) $ (59,664) $ 2,323 $
(63,876) $ Elimination Adjustment (a) 611 (2) (14) (4,075) (2,805) (25) (6,880) Total Segment 8,546 $
(425) $
52,839 $ (8,287) $ (62,469) $ 2,298 $
(70,756) $ Total Revenues GAAP 1,192,426 $ 1,431,685 $ 1,569,369 $ 1,940,723 $ 1,549,355 $ 2,124,780 $ 3,490,078 $ Consolidation and Elimination Adjustment (d) (27,284) (36,816) 3,035 (85,866) (37,007) (30,189) (122,873) Total Segment 1,165,142 $ 1,394,869 $ 1,572,404 $ 1,854,857 $ 1,512,348 $ 2,094,591 $ 3,367,205 $ Compensation GAAP 355,424 $ 329,634 $ 304,347 $ 351,589 $ 367,203 $ 701,427 $ 718,792 $ Consolidation Adjustment (e) (69,269) (61,039) (63,284) (62,562) (61,946) (127,869) (124,508) Total Segment 286,155 $ 268,595 $ 241,063 $ 289,027 $ 305,257 $ 573,558 $ 594,284 $ |
 Blackstone 27 Reconciliation of GAAP to Total Segment Measures – Continued This analysis reconciles the summarized components of Total Segments (pages 3-7) to their respective Total Segment amounts (page 13)
and to their equivalent GAAP measures as reported on the
Consolidated Statements of Operations (page 1).
(a) Represents the add back of the management, performance, and other fees earned from consolidated Blackstone Funds which have been eliminated in consolidation. (b) Represents the add back of investment income, including general partner income, earned from consolidated Blackstone Funds which have been
eliminated in consolidation
and the inclusion of investment income on non-consolidated Blackstone Funds which in GAAP is recorded as Other Income (Loss) - Net Gains (Losses) from Fund Investment Activities. (c) Represents the elimination of inter-segment interest income and the related expense.
(d) Represents the total consolidation and elimination adjustments for Total Revenues and Total Expenses, respectively.
(e) Represents transaction-based equity compensation that is not recorded in the segments.
(f) Represents the add back for the amortization of transaction based intangibles, which is not recorded in the segments, and the elimination
of inter-segment interest expense.
(g) Represents the reversal of Fund Expenses which are attributable to consolidated Blackstone Funds and not a component of the
segments. (h)
Represents the inclusion of Other Income (Loss) which is a consolidation amount
not recorded in the segments. (i)
Represents the total consolidation and elimination adjustment between GAAP and
Total Segments. (Dollars in Thousands)
2Q'16 3Q'16 4Q'16 1Q'17 2Q'17 2Q'16 YTD 2Q'17 YTD Other Operating Expenses GAAP General, Administrative and Other 130,988 $ 124,322 $ 141,954 $ 106,044 $ 115,281 $ 254,033 $ 221,325 $ Interest Expense 36,878 37,278 41,142 40,246 41,089 74,234 81,335 GAAP 167,866 $ 161,600 $ 183,096 $ 146,290 $ 156,370 $ 328,267 $ 302,660 $ Consolidation and Elimination Adjustment (f) (10,612) (10,710) (10,424) 7,002 9,314 (22,487) 16,316 Total Segment 157,254 $ 150,890 $ 172,672 $ 153,292 $ 165,684 $ 305,780 $ 318,976 $ Total Expenses GAAP 712,603 $ 773,777 $ 824,484 $ 929,650 $ 885,112 $ 1,330,313 $ 1,814,762 $ Less: GAAP Fund Expenses (g) (8,592) (15,128) (23,232) (24,076) (49,669) (13,821) (73,745) Consolidation and Elimination Adjustment (d) (79,879) (71,749) (73,708) (55,560) (52,632) (150,356) (108,192) Total Segment 624,132 $ 686,900 $ 727,544 $ 850,014 $ 782,811 $ 1,166,136 $ 1,632,825 $ GAAP Income Before Provision for Taxes to Total Segment Economic Income GAAP Revenues Less Expenses 479,823 657,908 744,885 1,011,073 664,243 794,467 1,675,316 Other Income (h) 30,703 61,395 73,510 66,132 110,054 49,845 176,186 Income Before Provision for Taxes 510,526 719,303 818,395 1,077,205 774,297 844,312 1,851,502 Consolidation and Elimination Adjustment (i) 30,484 (11,334) 26,465 (72,362) (44,760) 84,143 (117,122) Total Segment 541,010 $ 707,969 $ 844,860 $ 1,004,843 $ 729,537 $ 928,455 $ 1,734,380 $ |
 Blackstone 28 Walkdown of Financial Metrics See page 29, Walkdown of Financial Metrics – Calculation of Certain Non-GAAP Financial Metrics for the calculation of the amounts presented herein that are not the respective
captions on page
13, Total Segments. 2Q’17 Fee Related Earnings per Unit is based on end of
period DE Units Outstanding; 2Q’17 DE per Unit is based on DE attributable to Common Unitholders (see page 18, Unitholder Distribution) and end of period Total Common Units Outstanding; and 2Q’17 ENI per Unit is based on Weighted-Average
ENI Adjusted Units. 2Q’17 YTD per Unit represents the sum of
the last two quarters. See page 30, Unit Rollforward.
(Dollars in Thousands, Except per Unit Data)
2Q'17 2Q'17 YTD Results Per Unit Results Per Unit Management and Advisory Fees, Net 696,836 $
1,346,417 $ Fee Related Compensation (279,815) (542,192) Non-Interest Operating Expenses (105,838) (202,300) Fee Related Earnings 311,183 $
0.26 $
601,925
$
0.50
$
Net Realized
Incentive Fees 22,173
49,822 Net Realized Carried Interest 407,004 1,152,135 Realized Investment Income 100,887 303,781 Net Interest (Loss) (6,591) (17,545) Taxes and Related Payables (53,291) (78,615) Distributable Earnings 781,365 $
0.63 $
2,011,503
$
1.65
$
Net Unrealized
Incentive Fees 27,927
64,804 Net Unrealized Carried Interest (9,420) (159,780) Unrealized Investment (Loss) (33,167) (132,102) Other Revenue (62,469) (70,756) Add Back: Related Payables 29,123 35,642 Less: Equity-Based Compensation (27,990) (57,904) Economic Net Income 705,369 $
0.59 $
1,691,407
$
1.41
$
|
 Blackstone 29 Walkdown of Financial Metrics – Calculation of Non-GAAP Financial Metrics Unless otherwise noted, all amounts are the respective captions from the Total Segment information.
(a) See page 24, Reconciliation of GAAP to Non-GAAP Measures for this adjustment.
(b) Represents tax-related payables including the Payable Under Tax Receivable Agreement, which is a component of Taxes and Related
Payables. (c)
Represents equity-based award expense included in Economic Income, which
excludes all transaction-related equity-based charges.
(Dollars in Thousands)
2Q'17 2Q'17 YTD Compensation (305,257) $ (594,284) $ Less: Equity-Based Compensation - Non-Incentive Fee Related 25,442 52,092 Fee Related Compensation
(279,815) $ (542,192) $ Other Operating Expenses 165,684 318,976 Less: Interest Expense (a) (59,846) (116,676) Non-Interest Operating Expenses 105,838 $ 202,300 $ Realized Incentive Fees 41,106 88,243 Less: Realized Incentive Fee Compensation
(21,481) (44,233) Plus: Equity-Based Compensation - Incentive Fee Related
2,548 5,812 Net Realized Incentive Fees
22,173 $ 49,822 $ Realized Carried Interest 602,293 1,713,615 Less: Realized Carried Interest Compensation (195,289) (561,480) Net Realized Carried Interest 407,004 $ 1,152,135 $ Interest Income and Dividend Revenue 53,255 99,131 Less: Interest Expense
(a) (59,846) (116,676) Net Interest (Loss) (6,591) $
(17,545) $ Taxes and Related Payables (a) (53,291) $ (78,615) $ Unrealized Incentive Fees 48,527 108,543 Less: Unrealized Incentive Fee Compensation (20,600) (43,739) Net Unrealized Incentive Fees
27,927 $ 64,804 $ Unrealized Carried Interest 65,080 (89,667) Less: Unrealized Carried Interest Compensation
(74,500) (70,113) Net Unrealized Carried Interest
(9,420) $
(159,780) $ Related Payables (b) 29,123 $ 35,642 $ Equity-Based Compensation - Non-Incentive Fee Related 25,442 52,092 Plus: Equity-Based Compensation - Incentive Fee Related
2,548 5,812 Equity-Based Compensation
(c) 27,990 $ 57,904 $ |
 Blackstone 30 Unit Rollforward Common Unitholders receive tax benefits from deductions taken by Blackstone’s corporate tax paying subsidiaries and bear
responsibility for the deduction from Distributable Earnings of
the Payable Under Tax Receivable Agreement and certain other tax-related payables. Distributable Earnings Units Outstanding excludes units which are not entitled to distributions. 2Q'16 3Q'16 4Q'16 1Q'17 2Q'17 Total GAAP Weighted-Average Common Units Outstanding - Basic 646,933,698 650,917,510 655,074,617 660,939,708 664,681,299 Adjustments: Weighted-Average Unvested Deferred Restricted Common Units 1,309,402 1,495,331 1,643,603 809,184 998,974 Weighted-Average Blackstone Holdings Partnership Units 546,235,112 543,392,474 539,139,078 537,758,091 534,326,066 Total GAAP Weighted-Average Units Outstanding - Diluted 1,194,478,212 1,195,805,315 1,195,857,298 1,199,506,983 1,200,006,339 Weighted-Average Economic Net Income Adjusted Units 1,194,478,212 1,195,805,315 1,195,857,298 1,199,506,983 1,200,006,339 Economic Net Income Adjusted Units, End of Period 1,194,567,513 1,195,797,124 1,196,223,079 1,199,565,618 1,199,890,628 Total Common Units Outstanding 645,810,990 649,587,761 654,833,530 661,126,963 665,503,840 Adjustments: Blackstone Holdings Partnership Units 542,206,078 542,410,515 537,393,402 535,206,716 530,678,056 Distributable Earnings Units Outstanding 1,188,017,068 1,191,998,276 1,192,226,932 1,196,333,679 1,196,181,896 |
 Blackstone 31 Definitions and Distribution Policy Blackstone discloses the following financial measures that are calculated and presented on the basis of methodologies other than in
accordance with generally accepted accounting principles in the
United States of America (“non-GAAP”) in this presentation: • Blackstone uses Economic Income, or “EI”, as a key measure of value creation, a benchmark of its performance and in making
resource deployment and compensation decisions across its four
segments. EI represents segment net income before taxes excluding transaction-related charges. Transaction-related charges arise from Blackstone’s initial public offering (“IPO”) and certain long-term
retention programs outside of annual deferred compensation and
other corporate actions, including acquisitions. Transaction-related charges include certain equity-based compensation charges, the amortization of intangible assets and contingent consideration associated with acquisitions. EI presents revenues and
expenses on a basis that deconsolidates the investment funds
Blackstone manages. • Economic Net Income, or “ENI”, represents EI adjusted to include current period taxes. Taxes represent the total GAAP tax
provision adjusted to include only the current tax provision
(benefit) calculated on Income (Loss) Before Provision for Taxes. • Blackstone uses Fee Related Earnings, or “FRE”, which is derived from EI, as a measure to highlight earnings from operations
excluding: (a) the income related to performance fees and related
performance fee compensation, (b) income earned from Blackstone’s investments in the Blackstone Funds, (c) net interest income (loss), (d) equity-based compensation, and (e) Other Revenue. Blackstone uses FRE as a
measure to assess whether recurring revenue from its businesses is
sufficient to adequately cover all of its operating expenses and generate profits. FRE equals contractual fee revenues less (a) compensation expenses (which excludes amortization of equity-based awards, Carried Interest and
Incentive Fee compensation), and (b) non-interest operating
expenses. • Distributable Earnings, or “DE”, which is derived from Blackstone’s segment reported results, is a supplemental measure to
assess performance and amounts available for distributions to
Blackstone unitholders, including Blackstone personnel and others who are limited partners of the Blackstone Holdings partnerships. DE is intended to show the amount of net realized earnings without the effects of the consolidation of the
Blackstone Funds. DE, which is a component of ENI, is the sum
across all segments of: (a) Total Management, Advisory and Other Fees, Net, (b) Interest and Dividend Revenue, (c) Realized Performance Fees, and (d) Realized Investment Income (Loss); less (a) Compensation, excluding the expense of
equity-based awards, (b) Realized Performance Fee
Compensation, (c) Other Operating Expenses, and (d) Taxes and Related Payables Under the Tax Receivable Agreement. DE is reconciled to Blackstone’s Consolidated Statement of Operations. • Blackstone uses Adjusted Earnings Before Interest, Taxes and Depreciation and Amortization, or “Adjusted EBITDA”, as a
supplemental non-GAAP measure derived from segment reported
results and may be used to assess its ability to service its borrowings. Adjusted EBITDA represents DE plus the addition of (a) Interest Expense (including inter-segment interest related expense), (b) Taxes and Related Payables Including
Payable Under Tax Receivable Agreement, and (c) Depreciation and
Amortization. Distribution Policy. Blackstone’s intention is to distribute quarterly to common unitholders approximately 85% of The Blackstone
Group L.P.’s share of Distributable Earnings, subject to
adjustment by amounts determined by Blackstone’s general partner to be necessary or appropriate to provide for the conduct of its business, to make appropriate investments in its business and funds, to comply with applicable law, any of its debt
instruments or other agreements, or to provide for future cash
requirements such as tax-related payments, clawback obligations and distributions to unitholders for any ensuing quarter. The amount to be distributed could also be adjusted upward in any one quarter. All of the foregoing is subject to
the qualification that the declaration and payment of any
distributions are at the sole discretion of Blackstone’s general partner and may change its distribution policy at any time, including, without limitation, to eliminate such distributions entirely. |
 Blackstone 32 Forward-Looking Statements This presentation may contain forward-looking statements within the meaning of Section 27A of the Securities Act of 1933 and
Section 21E of the Securities Exchange Act of 1934 which reflect
Blackstone’s current views with respect to, among other things,
Blackstone’s operations and financial performance. You can identify these
forward-looking statements by the use of words such as
“outlook,” “indicator,” “believes,”
“expects,” “potential,” “continues,” “may,” “will,” “should,” “seeks,” “approximately,” “predicts,”
“intends,” “plans,” “estimates,”
“anticipates” or the negative version of these words or other comparable words. Such forward-looking statements are subject to various risks and uncertainties. Accordingly, there are or will be important factors that could cause actual
outcomes
or results to differ materially from those indicated in these statements. Blackstone believes these factors include but are not limited to those described under the section entitled “Risk Factors” in its Annual Report on Form 10-K for the fiscal
year ended December 31, 2016, as such factors may be updated from
time to time in its periodic filings with the Securities and Exchange Commission, which are accessible on the SEC’s website at www.sec.gov. These factors should not be construed as exhaustive
and should be read in conjunction with the other cautionary
statements that are included in this presentation and in the filings. Blackstone undertakes no obligation to publicly update or review any forward-looking statement, whether as a result of new information, future
developments or otherwise.
This presentation does not constitute an offer of any Blackstone
Fund. |