Attached files
| file | filename |
|---|---|
| EX-99.1 - EX-99.1 - GMS Inc. | a17-15914_1ex99d1.htm |
| 8-K - 8-K - GMS Inc. | a17-15914_18k.htm |
Exhibit 99.2
GMS Quarterly Review Fiscal Q4 2017
Safe Harbor and Basis of Presentation Forward-Looking Statement Safe Harbor - This presentation includes "forward-looking statements" within the meaning of the Private Securities Litigation Reform Act of 1995. All of these forward-looking statements are based on estimates and assumptions made by our management that, although believed by us to be reasonable, are inherently uncertain. Forward-looking statements involve risks and uncertainties, including, but not limited to, economic, competitive, governmental and technological factors outside of our control, that may cause our business, strategy or actual results to differ materially from the forward-looking statements. These risks and uncertainties may include, among other things: changes in the prices, margin, supply, and/or demand for products which we distribute; general economic and business conditions in the United States; the activities of competitors; changes in significant operating expenses; changes in the availability of capital and interest rates; adverse weather patterns or conditions; acts of cyber intrusion; variations in the performance of the financial markets, including the credit markets; and other factors described in the "Risk Factors" section in our Annual Report on Form 10-K for the fiscal year ended April 30, 2017, and in our other periodic reports filed with the SEC. In addition, the statements in this presentation are made as of June 29, 2017. We undertake no obligation to update any of the forward looking statements made herein, whether as a result of new information, future events, changes in expectation or otherwise. These forward-looking statements should not be relied upon as representing our views as of any date subsequent to June 29, 2017. Use of Non-GAAP and Adjusted Financial Information - To supplement GAAP financial information, we use adjusted measures of operating results which are non-GAAP measures. This non-GAAP adjusted financial information is provided as additional information for investors. These adjusted results exclude certain costs, expenses, gains and losses, and we believe their exclusion can enhance an overall understanding of our past financial performance and also our prospects for the future. These adjustments to our GAAP results are made with the intent of providing both management and investors a more complete understanding of our operating performance by excluding non-recurring, infrequent or other non-cash charges that are not believed to be material to the ongoing performance of our business. The presentation of this additional information is not meant to be considered in isolation or as a substitute for GAAP measures of net income, diluted earnings per share or net cash provided by (used in) operating activities prepared in accordance with generally accepted accounting principles in the United States. 2
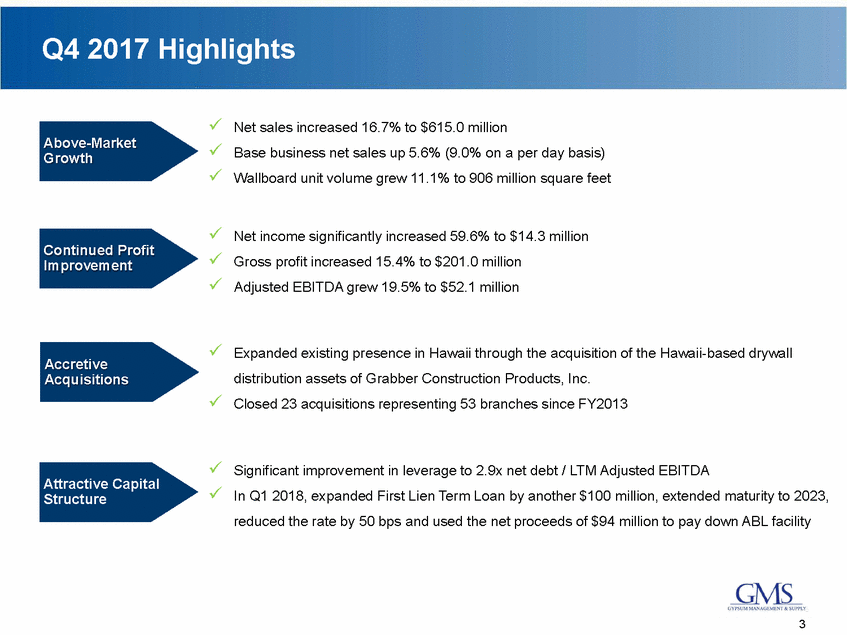
Q4 2017 Highlights Net sales increased 16.7% to $615.0 million Base business net sales up 5.6% (9.0% on a per day basis) Wallboard unit volume grew 11.1% to 906 million square feet Above-Market Growth Net income significantly increased 59.6% to $14.3 million Gross profit increased 15.4% to $201.0 million Adjusted EBITDA grew 19.5% to $52.1 million Continued Profit Improvement Expanded existing presence in Hawaii through the acquisition of the Hawaii-based drywall distribution assets of Grabber Construction Products, Inc. Closed 23 acquisitions representing 53 branches since FY2013 Accretive Acquisitions Significant improvement in leverage to 2.9x net debt / LTM Adjusted EBITDA In Q1 2018, expanded First Lien Term Loan by another $100 million, extended maturity to 2023, reduced the rate by 50 bps and used the net proceeds of $94 million to pay down ABL facility Attractive Capital Structure 3
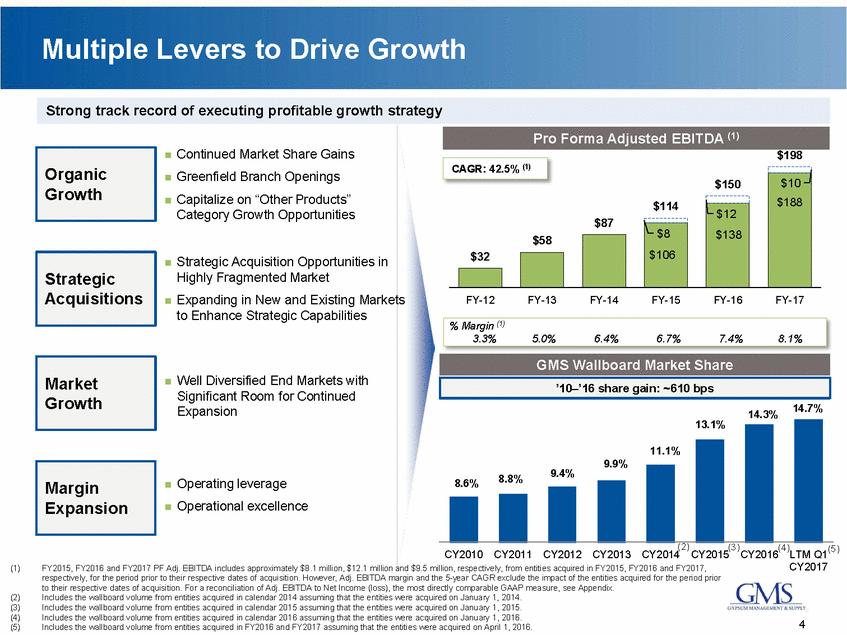
Multiple Levers to Drive Growth Continued Market Share Gains Greenfield Branch Openings Capitalize on “Other Products” Category Growth Opportunities $198 Strategic Acquisition Opportunities in Highly Fragmented Market Expanding in New and Existing Markets to Enhance Strategic Capabilities FY-12 FY-13 FY-14 FY-15 FY-16 FY-17 Well Diversified End Markets with Significant Room for Continued Expansion 14.7% 14.3% 13.1% 9.9% 8.8% Operating leverage Operational excellence 8.6% (2) (3) (4) (5) CY2010 CY2011 CY2012 CY2013 CY2014 CY2015 CY2016 LTM Q1 CY2017 (1) FY2015, FY2016 and FY2017 PF Adj. EBITDA includes approximately $8.1 million, $12.1 million and $9.5 million, respectively, from entities acquired in FY2015, FY2016 and FY2017, respectively, for the period prior to their respective dates of acquisition. However, Adj. EBITDA margin and the 5-year CAGR exclude the impact of the entities acquired for the period prior to their respective dates of acquisition. For a reconciliation of Adj. EBITDA to Net Income (loss), the most directly comparable GAAP measure, see Appendix. Includes the wallboard volume from entities acquired in calendar 2014 assuming that the entities were acquired on January 1, 2014. Includes the wallboard volume from entities acquired in calendar 2015 assuming that the entities were acquired on January 1, 2015. Includes the wallboard volume from entities acquired in calendar 2016 assuming that the entities were acquired on January 1, 2016. Includes the wallboard volume from entities acquired in FY2016 and FY2017 assuming that the entities were acquired on April 1, 2016. (2) (3) (4) (5) 4 Margin Expansion (5) 11.1% 9.4% GMS Wallboard Market Share ’10–’16 share gain: ~610 bps Market Growth % Margin (1) 3.3%5.0%6.4%6.7%7.4%8.1% Strategic Acquisitions $150 $10 $188 $114 $12 $138 $87 $8 $106 $58 $32 CAGR: 42.5% (1) Organic Growth Pro Forma Adjusted EBITDA (1) Strong track record of executing profitable growth strategy
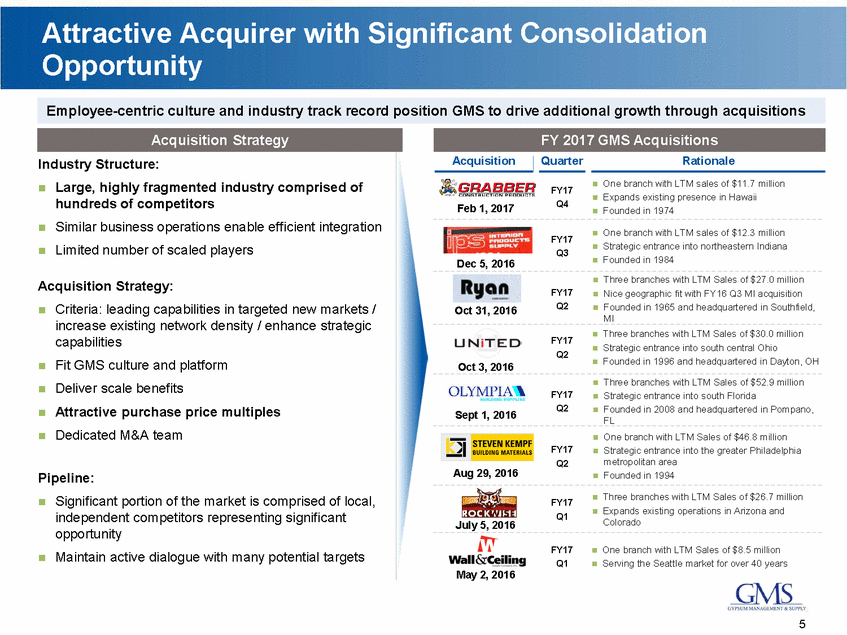
Attractive Acquirer with Significant Consolidation Opportunity Acquisition Quarter Rationale Industry Structure: Large, highly fragmented industry comprised of hundreds of competitors Similar business operations enable efficient integration Limited number of scaled players One branch with LTM sales of $11.7 million Expands existing presence in Hawaii Founded in 1974 FY17 Q4 Feb 1, 2017 One branch with LTM sales of $12.3 million Strategic entrance into northeastern Indiana Founded in 1984 FY17 Q3 Dec 5, 2016 Three branches with LTM Sales of $27.0 million Nice geographic fit with FY16 Q3 MI acquisition Founded in 1965 and headquartered in Southfield, Acquisition Strategy: Criteria: leading capabilities in targeted new markets / increase existing network density / enhance strategic capabilities Fit GMS culture and platform Deliver scale benefits Attractive purchase price multiples Dedicated M&A team FY17 Q2 Oct 31, 2016 MI Three branches with LTM Sales of $30.0 million Strategic entrance into south central Ohio FY17 Q2 Founded in 1996 and headquartered in Dayton, OH Oct 3, 2016 Three branches with LTM Sales of $52.9 million Strategic entrance into south Florida Founded in 2008 and headquartered in Pompano, FY17 Q2 Sept 1, 2016 FL One branch with LTM Sales of $46.8 million Strategic entrance into the greater Philadelphia metropolitan area Founded in 1994 FY17 Q2 Aug 29, 2016 Pipeline: Significant portion of the market is comprised of local, independent competitors representing significant opportunity Maintain active dialogue with many potential targets Three branches with LTM Sales of $26.7 million Expands existing operations in Arizona and Colorado FY17 Q1 July 5, 2016 FY17 Q1 One branch with LTM Sales of $8.5 million Serving the Seattle market for over 40 years May 2, 2016 5 FY 2017 GMS Acquisitions Acquisition Strategy Employee-centric culture and industry track record position GMS to drive additional growth through acquisitions
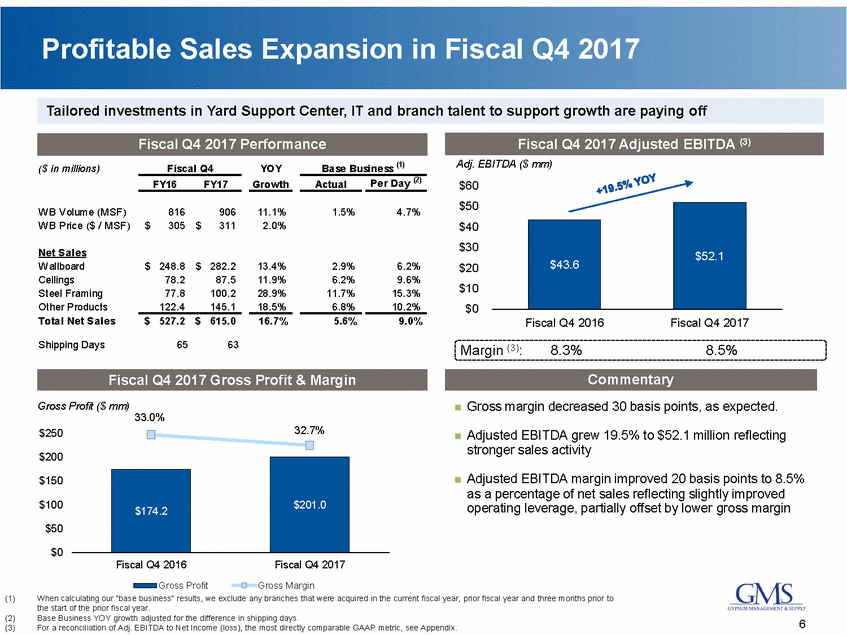
Profitable Sales Expansion in Fiscal Q4 2017 Adj. EBITDA ($ mm) $60 Base Business (1) ($ in millions) Fiscal Q4 YOY Grow th Per Day (2) FY16 FY17 Actual $50 $40 $30 $20 $10 $0 WB Volume (MSF) WB Price ($ / MSF) 816 305 906 311 11.1% 2.0% 1.5% 4.7% $ $ Net Sales Wallboard Ceilings Steel Framing Other Products Total Net Sales $ 248.8 78.2 77.8 122.4 $ 282.2 87.5 100.2 145.1 13.4% 11.9% 28.9% 18.5% 2.9% 6.2% 11.7% 6.8% 6.2% 9.6% 15.3% 10.2% $ 527.2 $ 615.0 16.7% 5.6% 9.0% Fiscal Q4 2016 Fiscal Q4 2017 Shipping Days 65 63 Margin (3): 8.3% 8.5% Gross margin decreased 30 basis points, as expected. Gross Profit ($ mm) 33.0% 33.5% 33.0% 32.5% 32.0% 31.5% 31.0% 30.5% 30.0% 29.5% 29.0% 32.7% $250 Adjusted EBITDA grew 19.5% to $52.1 million reflecting stronger sales activity $200 Adjusted EBITDA margin improved 20 basis points to 8.5% as a percentage of net sales reflecting slightly improved operating leverage, partially offset by lower gross margin $150 $100 $50 $0 Fiscal Q4 2016 Fiscal Q4 2017 Gross Margin Gross Profit (1) When calculating our “base business” results, we exclude any branches that were acquired in the current fiscal year, prior fiscal year and three months prior to the start of the prior fiscal year. Base Business YOY growth adjusted for the difference in shipping days. For a reconciliation of Adj. EBITDA to Net Income (loss), the most directly comparable GAAP metric, see Appendix. (2) (3) 6 $201.0 $174.2 Commentary Fiscal Q4 2017 Gross Profit & Margin $52.1 $43.6 Fiscal Q4 2017 Performance Fiscal Q4 2017 Adjusted EBITDA (3) Tailored investments in Yard Support Center, IT and branch talent to support growth are paying off
Profitable Sales Expansion in Fiscal 2017 Adj. EBITDA ($ mm) $200 Base Business (1) ($ in millions) Fiscal YOY Grow th Per Day (2) FY16 FY17 Actual WB Volume (MSF) WB Price ($ / MSF) 2,843 306 3,457 306 21.6% (0.1%) 8.5% 8.9% $150 $ $ $100 Net Sales Wallboard Ceilings Steel Framing Other Products Total Net Sales $ 871.0 297.1 281.3 408.8 $ 1,058.4 341.0 374.2 545.6 21.5% 14.8% 33.0% 33.5% 7.6% 7.9% 14.6% 13.9% 8.0% 8.3% 15.0% 14.4% $50 $0 1,858.2 2,319.1 24.8% 10.0% 10.5% Fiscal 2016 Fiscal 2017 Shipping Days 254 253 Margin (3): 7.4% 8.1% Gross margin increased 80 basis points, primarily driven by improved product costs and, to a lesser extent, product mix Gross Profit ($ mm) $900 32.7% 33.0% 31.9% $800 $700 $600 $500 $400 $300 $200 $100 $0 Adjusted EBITDA grew 36.2% to $188.2 million reflecting stronger sales activity and higher gross margin 32.0% 31.0% Adjusted EBITDA margin improved 70 basis points to 8.1% as a percentage of net sales reflecting better product margins 30.0% 29.0% 28.0% Fiscal 2016 Fiscal 2017 Gross Margin Gross Profit (1) When calculating our “base business” results, we exclude any branches that were acquired in the current fiscal year, prior fiscal year and three months prior to the start of the prior fiscal year. Base Business YOY growth adjusted for the difference in shipping days. For a reconciliation of Adj. EBITDA to Net Income (loss), the most directly comparable GAAP metric, see Appendix. (2) (3) 7 $758.6 $593.2 Commentary Fiscal 2017 Gross Profit & Margin $188.2 (5) $138.2 Fiscal 2017 Performance Fiscal 2017 Adjusted EBITDA (3) Tailored investments in Yard Support Center, IT and branch talent to support growth are paying off

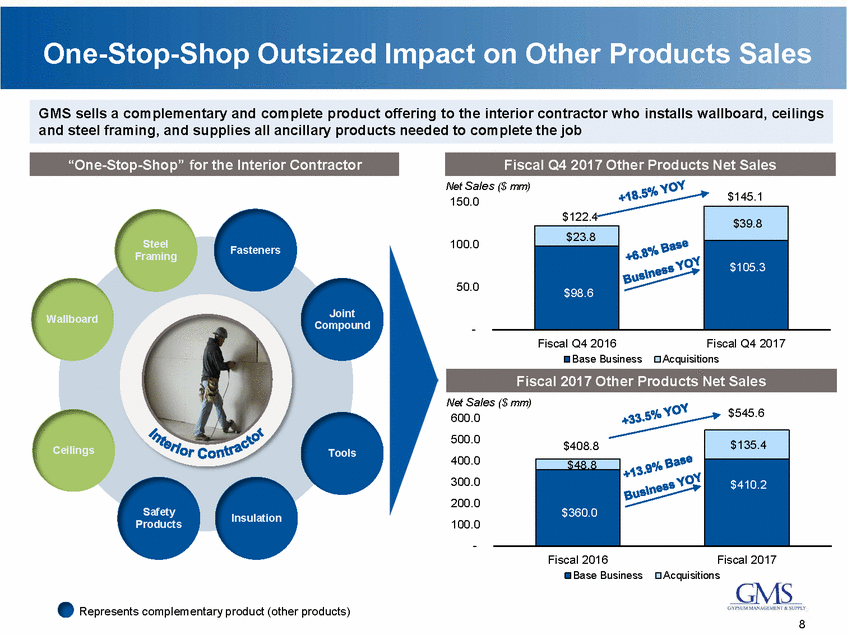
One-Stop-Shop Outsized Impact on Other Products Sales Net Sales ($ mm) $145.1 150.0 100.0 Steel Framing Fasteners 50.0 Joint Compound Wallboard - Fiscal Q4 2016 Fiscal Q4 2017 Acquisitions Base Business Net Sales ($ mm) 600.0 $545.6 500.0 400.0 300.0 200.0 100.0 - Ceilings Tools Safety Products Insulation Fiscal 2016 Fiscal 2017 Acquisitions Base Business Represents complementary product (other products) 8 $408.8 $135.4 $48.8 $410.2 $360.0 Fiscal 2017 Other Products Net Sales $122.4 $39.8 $23.8 $105.3 $98.6 Fiscal Q4 2017 Other Products Net Sales “One-Stop-Shop” for the Interior Contractor GMS sells a complementary and complete product offering to the interior contractor who installs wallboard, ceilings and steel framing, and supplies all ancillary products needed to complete the job
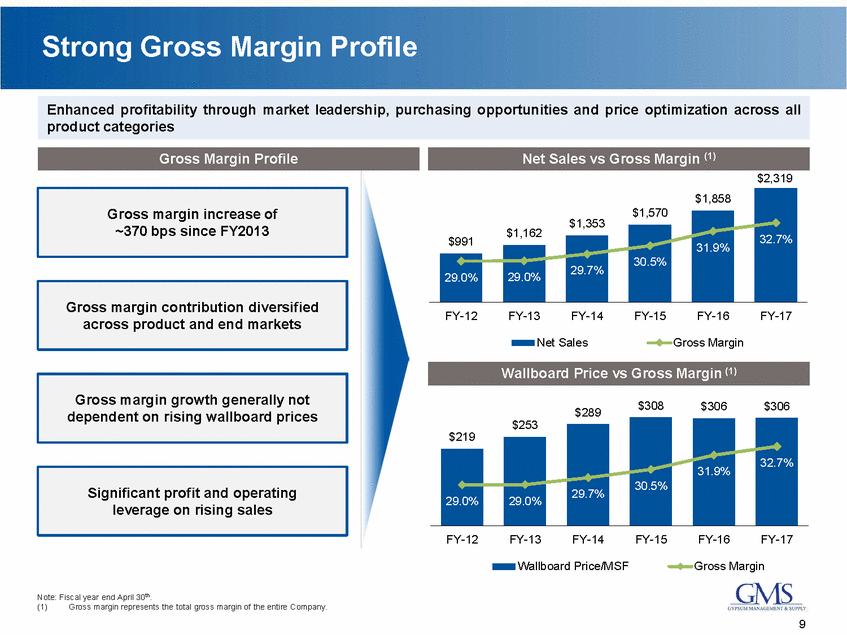
Strong Gross Margin Profile $2,319 $1,353 FY-12 FY-13 FY-14 FY-15 FY-16 FY-17 Net Sales Gross Margin $308 $306 $306 $289 $253 $219 leverage on rising sales FY-12 FY-13 FY-14 FY-15 FY-16 FY-17 Wallboard Price/MSF Gross Margin Note: Fiscal year end April 30th. (1) Gross margin represents the total gross margin of the entire Company. 9 Significant profit and operating 30.5% 31.9% 32.7% 29.7% 29.0% 29.0% Gross margin growth generally not dependent on rising wallboard prices Wallboard Price vs Gross Margin (1) Gross margin contribution diversified across product and end markets $1,858 32.7% $1,570 31.9% $1,162 30.5% $991 29.7% 29.0% 29.0% Gross margin increase of ~370 bps since FY2013 Net Sales vs Gross Margin (1) Gross Margin Profile Enhanced profitability through market leadership, purchasing opportunities and price optimization across all product categories
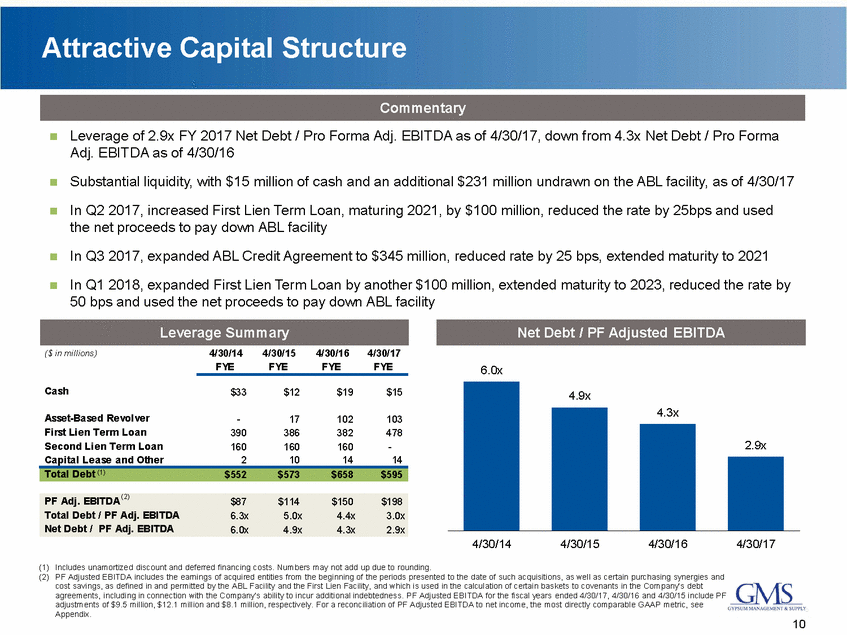
Attractive Capital Structure Leverage of 2.9x FY 2017 Net Debt / Pro Forma Adj. EBITDA as of 4/30/17, down from 4.3x Net Debt / Pro Forma Adj. EBITDA as of 4/30/16 Substantial liquidity, with $15 million of cash and an additional $231 million undrawn on the ABL facility, as of 4/30/17 In Q2 2017, increased First Lien Term Loan, maturing 2021, by $100 million, reduced the rate by 25bps and used the net proceeds to pay down ABL facility In Q3 2017, expanded ABL Credit Agreement to $345 million, reduced rate by 25 bps, extended maturity to 2021 In Q1 2018, expanded First Lien Term Loan by another $100 million, extended maturity to 2023, reduced the rate by 50 bps and used the net proceeds to pay down ABL facility ($ in millions) 4/30/14 FYE 4/30/15 FYE 4/30/16 FYE 4/30/17 FYE 6.0x Cash $33 $12 $19 $15 Asset-Based Revolver First Lien Term Loan Second Lien Term Loan Capital Lease and Other - 390 160 2 17 386 160 10 102 382 160 14 103 478 - 14 4/30/14 4/30/15 4/30/16 4/30/17 (1) Includes unamortized discount and deferred financing costs. Numbers may not add up due to rounding. (2) PF Adjusted EBITDA includes the earnings of acquired entities from the beginning of the periods presented to the date of such acquisitions, as well as certain purchasing synergies and cost savings, as defined in and permitted by the ABL Facility and the First Lien Facility, and which is used in the calculation of certain baskets to covenants in the Company’s debt agreements, including in connection with the Company’s ability to incur additional indebtedness. PF Adjusted EBITDA for the fiscal years ended 4/30/17, 4/30/16 and 4/30/15 include PF adjustments of $9.5 million, $12.1 million and $8.1 million, respectively. For a reconciliation of PF Adjusted EBITDA to net income, the most directly comparable GAAP metric, see Appendix. 10 PF Adj. EBITDA (2)$87$114$150$198 Total Debt / PF Adj. EBITDA6.3x5.0x4.4x3.0x Net Debt / PF Adj. EBITDA6.0x4.9x4.3x2.9x Total Debt (1)$552$573$658$595 4.9x 4.3x 2.9x Net Debt / PF Adjusted EBITDA Leverage Summary Commentary
Leading Specialty Distributor Poised for Continued Growth Market Leader with Significant Scale Advantages – #1 North American Distributor of Wallboard and Ceilings Differentiated Service Model Drives Market Leadership Multiple Levers to Drive Above-Market Growth – Market Share, Greenfields, M&A, Operating Leverage Capitalizing on Large, Diverse End Markets Poised for Continued Growth Entrepreneurial Culture with Dedicated Employees and Experienced Leadership Driving Superior Execution 11
Appendix 5 :4 2 / 4 1 0 /2 /6 2/ tn e m D oc u d ve
Summary Quarterly Financials Note: Fiscal year end April 30. 13 (In millions, except per share data) 1Q16 2Q16 3Q16 4Q16 (Unaudited) Wallboard Volume (MSF) 681 700 646 816 Wallboard Price ($ / '000 Sq. Ft.) $ 310 $ 306 $ 305 $ 305 Wallboard $ 211 $ 214 $ 197 $ 249 Ceilings 79 75 65 78 Steel framing 67 70 66 78 Other products 95 99 92 122 Net sales 452 458 420 527 Cost of sales 312 314 286 353 Gross profit 141 144 134 174 Gross margin 31.1% 31.4% 31.9% 33.0% Operating expenses: Selling, general and administrative expenses 110 114 112 133 Depreciation and amortization 16 15 16 17 Total operating expenses 126 130 128 150 Operating income (loss) 15 14 6 24 Other (expense) income: Interest expense (9) (9) (9) (9) Change in fair value of financial instruments - - - (0) Write-off of discount and deferred financing costs - - - - Other income, net 1 0 1 2 Total other (expense), net (9) (9) (9) (7) Income (loss) from continuing operations, before tax 6 5 (3) 17 Income tax expense (benefit) 3 3 (1) 8 Net income (loss) $ 3 $ 3 $ (2) $ 9 Weighted average shares outstanding: Basic 32,677 32,738 32,891 32,893 Diluted 32,831 32,898 32,891 33,155 Net income (loss) per share: Basic $ 0.09 $ 0.09 $ (0.07) $ 0.27 Diluted $ 0.09 $ 0.09 $ (0.07) $ 0.27 FY16 1Q17 2Q17 3Q17 4Q17 818 891 842 906 $ 307 $ 303 $ 303 $ 311 $ 251 $ 270 $ 255 $ 282 86 85 82 87 84 96 94 100 128 140 132 145 550 592 563 615 371 399 377 414 179 193 186 201 32.5% 32.6% 33.0% 32.7% 135 150 147 153 16 17 18 18 151 167 166 171 28 26 20 30 (8) (7) (7) (7) (0) - - (0) (5) (1) (0) - 1 0 1 2 (12) (8) (7) (6) 15 18 14 25 6 1 5 10 $ 9 $ 17 $ 8 $ 14 38,201 40,943 40,943 40,956 38,602 41,320 41,578 41,759 $ 0.24 $ 0.42 $ 0.20 $ 0.35 $ 0.24 $ 0.42 $ 0.20 $ 0.34 FY17 2,843 $ 306 $ 871 297 281 409 3,458 $ 306 $ 1,058 341 374 546 1,858 1,265 2,319 1,561 593 31.9% 470 64 759 32.7% 585 69 534 654 59 (37) (0) - 4 104 (29) (0) (7) 4 (34) (33) 25 13 72 23 $ 13 $ 49 32,799 33,125 $ 0.38 $ 0.38 40,260 41,070 $ 1.21 $ 1.19

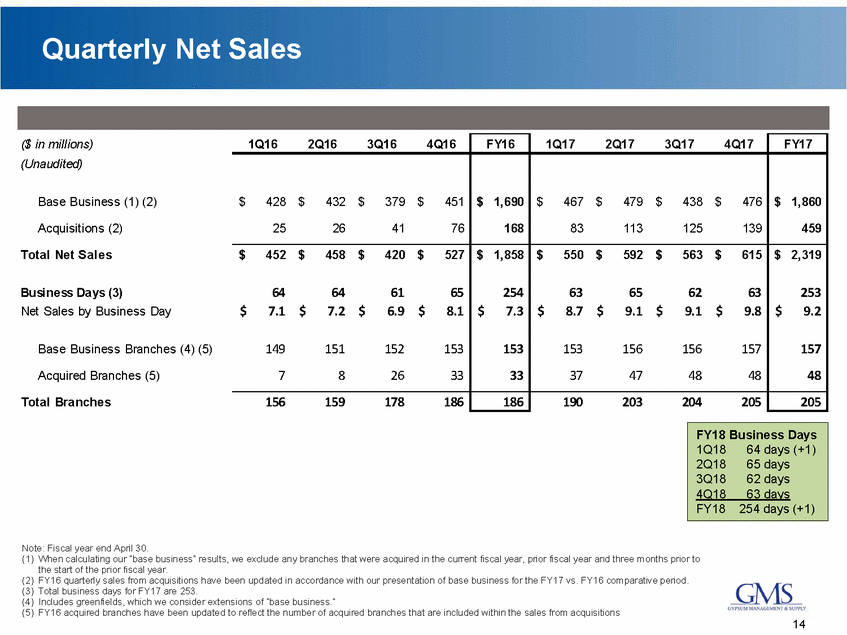
Quarterly Net Sales ($ in millions) (Unaudited) Base Business (1) (2) Acquisitions (2) Total Net Sales Business Days (3) Net Sales by Business Day Base Business Branches (4) (5) Acquired Branches (5) Total Branches Note: Fiscal year end April 30. (1) When calculating our “base business” results, we exclude any branches that were acquired in the current fiscal year, prior fiscal year and three months prior to the start of the prior fiscal year. (2) FY16 quarterly sales from acquisitions have been updated in accordance with our presentation of base business for the FY17 vs. FY16 comparative period. (3) Total business days for FY17 are 253. (4) Includes greenfields, which we consider extensions of “base business.” (5) FY16 acquired branches have been updated to reflect the number of acquired branches that are included within the sales from acquisitions 14 FY18 Business Days 1Q1864 days (+1) 2Q1865 days 3Q1862 days 4Q18 63 days FY18254 days (+1) 1Q162Q163Q164Q16 FY16 1Q172Q173Q174Q17 FY17 $428$432$379$451 25264176 $ 1,690 168 $467$479$438$476 83113125139 $ 1,860 459 $452$458$420$527 64646165 $7.1$7.2$6.9$8.1 149151152153 782633 $ 1,858 254 $7.3 153 33 $550$592$563$615 63656263 $8.7$9.1$9.1$9.8 153156156157 37474848 $ 2,319 253 $9.2 157 48 156159178186 186 190203204205 205
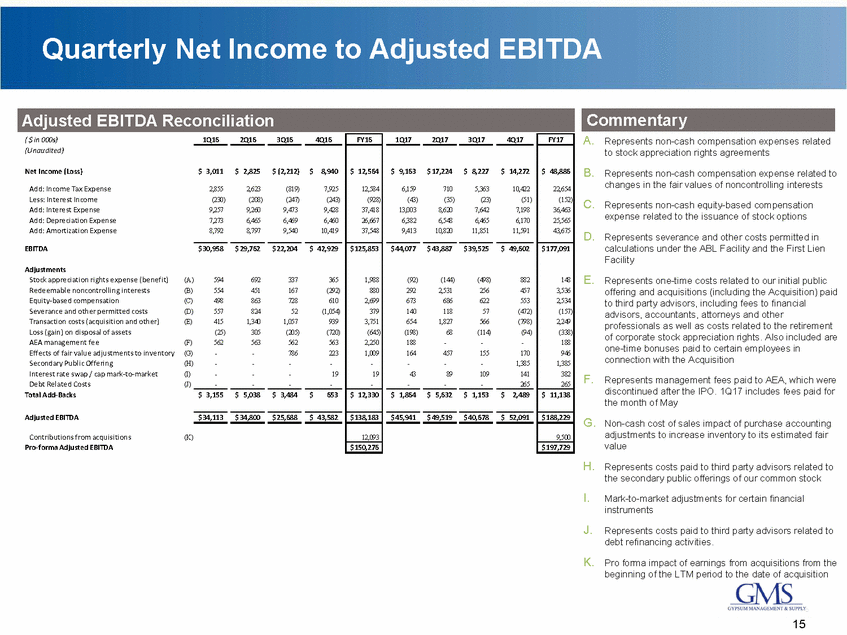
Quarterly Net Income to Adjusted EBITDA Commentary A. Represents non-cash compensation expenses related to stock appreciation rights agreements B. Represents non-cash compensation expense related to changes in the fair values of noncontrolling interests C. Represents non-cash equity-based compensation expense related to the issuance of stock options D. Represents severance and other costs permitted in calculations under the ABL Facility and the First Lien Facility E. Represents one-time costs related to our initial public offering and acquisitions (including the Acquisition) paid to third party advisors, including fees to financial advisors, accountants, attorneys and other professionals as well as costs related to the retirement of corporate stock appreciation rights. Also included are one-time bonuses paid to certain employees in connection with the Acquisition F. Represents management fees paid to AEA, which were discontinued after the IPO. 1Q17 includes fees paid for the month of May G. Non-cash cost of sales impact of purchase accounting adjustments to increase inventory to its estimated fair value H. Represents costs paid to third party advisors related to the secondary public offerings of our common stock I. Mark-to-market adjustments for certain financial instruments J. Represents costs paid to third party advisors related to debt refinancing activities. K. Pro forma impact of earnings from acquisitions from the beginning of the LTM period to the date of acquisition 15 Adjusted EBITDA Reconciliation ( $ in 000s) (Unaudited) Net Income (Loss) Add: Income Tax Expense Less: Interest Income Add: Interest Expense Add: Depreciation Expense Add: Amortization Expense EBITDA Adjustments Stock appreciation rights expense (benefit) (A) Redeemable noncontrolling interests (B) Equity-based compensation (C) Severance and other permitted costs (D) Transaction costs (acquisition and other) (E) Loss (gain) on disposal of assets AEA management fee (F) Effects of fair value adjustments to inventory (G) Secondary Public Offering (H) Interest rate swap / cap mark-to-market (I) Debt Related Costs (J) Total Add-Backs Adjusted EBITDA Contributions from acquisitions (K) Pro-forma Adjusted EBITDA 1Q16 2Q16 3Q16 4Q16 FY16 1Q17 2Q17 3Q17 4Q17 FY17 $ 3,011 $ 2,825 $ (2,212) $ 8,940 2,855 2,623 (819) 7,925 (230) (208) (247) (243) 9,257 9,260 9,473 9,428 7,273 6,465 6,469 6,460 8,792 8,797 9,540 10,419 $ 30,958 $ 29,762 $ 22,204 $ 42,929 594 692 337 365 554 451 167 (292) 498 863 728 610 557 824 52 (1,054) 415 1,340 1,057 939 (25) 305 (205) (720) 562 563 562 563 - - 786 223 - - - - - - - 19 - - - - $ 3,155 $ 5,038 $ 3,484 $ 653 $ 34,113 $ 34,800 $ 25,688 $ 43,582 $ 12,564 12,584 (928) 37,418 26,667 37,548 $ 9,163 $ 17,224 $ 8,227 $ 14,272 6,159 710 5,363 10,422 (43) (35) (23) (51) 13,003 8,620 7,642 7,198 6,382 6,548 6,465 6,170 9,413 10,820 11,851 11,591 $ 44,077 $ 43,887 $ 39,525 $ 49,602 (92) (144) (498) 882 292 2,531 256 457 673 686 622 553 140 118 57 (472) 654 1,827 566 (798) (198) 68 (114) (94) 188 - - - 164 457 155 170 - - - 1,385 43 89 109 141 - - - 265 $ 1,864 $ 5,632 $ 1,153 $ 2,489 $ 45,941 $ 49,519 $ 40,678 $ 52,091 $ 48,886 22,654 (152) 36,463 25,565 43,675 $ 125,853 1,988 880 2,699 379 3,751 (645) 2,250 1,009 - 19 - $ 177,091 148 3,536 2,534 (157) 2,249 (338) 188 946 1,385 382 265 $ 12,330 $ 11,138 $ 138,183 $ 188,229 12,093 9,500 $ 150,276 $ 197,729
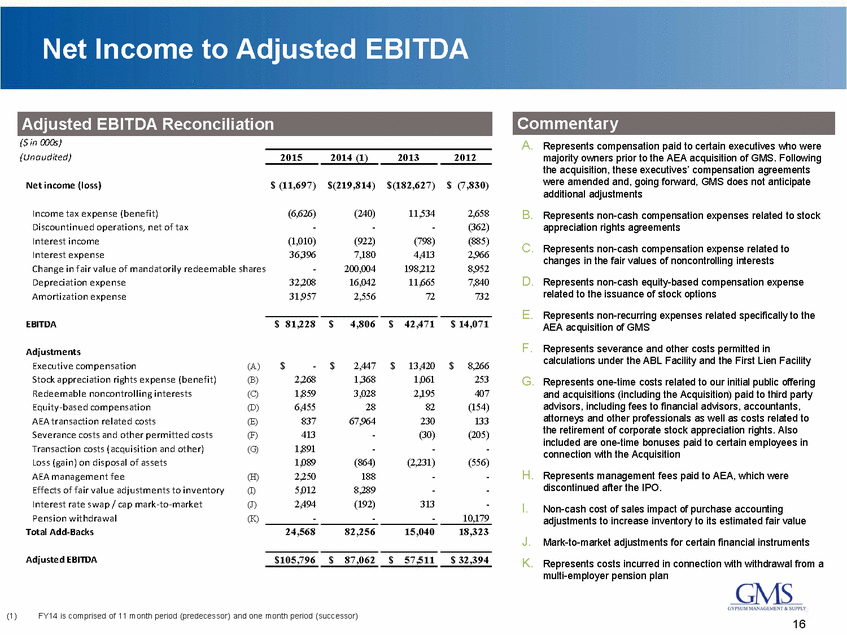
Net Income to Adjusted EBITDA Commentary ($ in 000s) (Unaudited) A. Represents compensation paid to certain executives who were majority owners prior to the AEA acquisition of GMS. Following the acquisition, these executives’ compensation agreements were amended and, going forward, GMS does not anticipate additional adjustments 2015 2014 (1) 2013 2012 $ (11,697) $(219,814) $(182,627) $ (7,830) Net income (loss) Income tax expense (benefit) Discountinued operations, net of tax Interest income Interest expense Change in fair value of mandatorily redeemable shares Depreciation expense Amortization expense (6,626) - (1,010) 36,396 - 32,208 31,957 (240) - (922) 7,180 200,004 16,042 2,556 11,534 - (798) 4,413 198,212 11,665 72 2,658 (362) (885) 2,966 8,952 7,840 732 B. Represents non-cash compensation expenses related to stock appreciation rights agreements C. Represents non-cash compensation expense related to changes in the fair values of noncontrolling interests D. Represents non-cash equity-based compensation expense related to the issuance of stock options E. Represents non-recurring expenses related specifically to the AEA acquisition of GMS $ 81,228 $ 4,806 $ 42,471 $ 14,071 EBITDA F. Represents severance and other costs permitted in calculations under the ABL Facility and the First Lien Facility Adjustments Executive compensation Stock appreciation rights expense (benefit) Redeemable noncontrolling interests Equity-based compensation AEA transaction related costs Severance costs and other permitted costs Transaction costs (acquisition and other) Loss (gain) on disposal of assets AEA management fee Effects of fair value adjustments to inventory Interest rate swap / cap mark-to-market Pension withdrawal Total Add-Backs $ - 2,268 1,859 6,455 837 413 1,891 1,089 2,250 5,012 2,494 - $ 2,447 1,368 3,028 28 67,964 - - (864) 188 8,289 (192) - $ 13,420 1,061 2,195 82 230 (30) - (2,231) - - 313 - $ 8,266 253 407 (154) 133 (205) - (556) - - - 10,179 (A) (B) (C) (D) (E) (F) (G) G. Represents one-time costs related to our initial public offering and acquisitions (including the Acquisition) paid to third party advisors, including fees to financial advisors, accountants, attorneys and other professionals as well as costs related to the retirement of corporate stock appreciation rights. Also included are one-time bonuses paid to certain employees in connection with the Acquisition H. Represents management fees paid to AEA, which were discontinued after the IPO. (H) (I) (J) (K) I. Non-cash cost of sales impact of purchase accounting adjustments to increase inventory to its estimated fair value 24,568 82,256 15,040 18,323 J. K. Mark-to-market adjustments for certain financial instruments Adjusted EBITDA $105,796 $ 87,062 $ 57,511 $ 32,394 Represents costs incurred in connection with withdrawal from a multi-employer pension plan (1) FY14 is comprised of 11 month period (predecessor) and one month period (successor) 16 Adjusted EBITDA Reconciliation
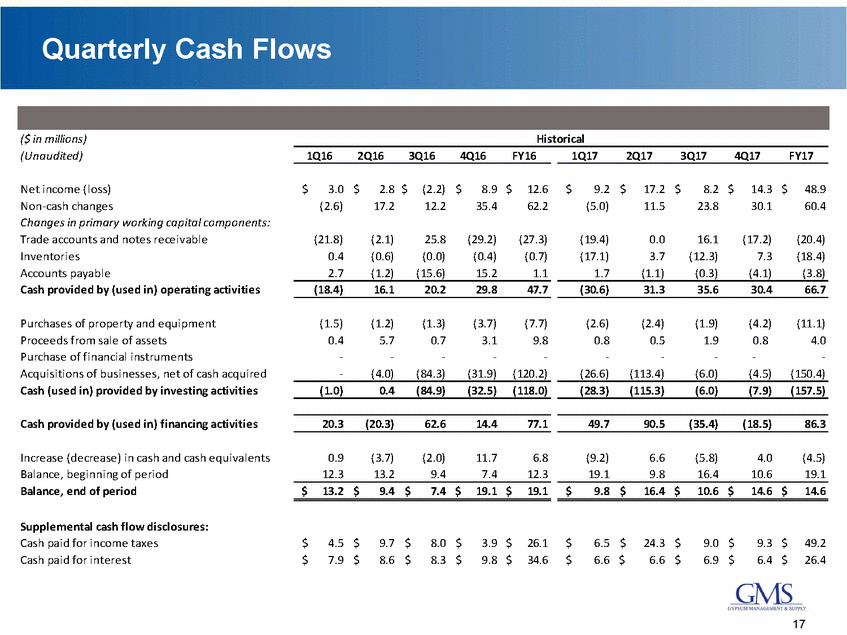
Quarterly Cash Flows ($ in millions) (Unaudited) Historical 1Q16 2Q16 3Q16 4Q16 FY16 1Q17 2Q17 3Q17 4Q17 FY17 Net income (loss) Non-cash changes Changes in primary working capital components: Trade accounts and notes receivable Inventories Accounts payable Cash provided by (used in) operating activities $ 3.0 (2.6) $ 2.8 17.2 $ (2.2) 12.2 $ 8.9 35.4 $ 12.6 62.2 $ 9.2 (5.0) $ 17.2 11.5 $ 8.2 23.8 $ 14.3 30.1 $ 48.9 60.4 (21.8) 0.4 2.7 (2.1) (0.6) (1.2) 25.8 (0.0) (15.6) (29.2) (0.4) 15.2 (27.3) (0.7) 1.1 (19.4) (17.1) 1.7 0.0 3.7 (1.1) 16.1 (12.3) (0.3) (17.2) 7.3 (4.1) (20.4) (18.4) (3.8) (18.4) 16.1 20.2 29.8 47.7 (30.6) 31.3 35.6 30.4 66.7 Purchases of property and equipment Proceeds from sale of assets Purchase of financial instruments Acquisitions of businesses, net of cash acquired Cash (used in) provided by investing activities (1.5) 0.4 - - (1.2) 5.7 - (4.0) (1.3) 0.7 - (84.3) (3.7) 3.1 - (31.9) (7.7) 9.8 - (120.2) (2.6) 0.8 - (26.6) (2.4) 0.5 - (113.4) (1.9) 1.9 - (6.0) (4.2) 0.8 - (4.5) (11.1) 4.0 - (150.4) (1.0) 0.4 (84.9) (32.5) (118.0) (28.3) (115.3) (6.0) (7.9) (157.5) Cash provided by (used in) financing activities 20.3 (20.3) 62.6 14.4 77.1 49.7 90.5 (35.4) (18.5) 86.3 Increase (decrease) in cash and cash equivalents Balance, beginning of period Balance, end of period 0.9 12.3 (3.7) 13.2 (2.0) 9.4 11.7 7.4 6.8 12.3 (9.2) 19.1 6.6 9.8 (5.8) 16.4 4.0 10.6 (4.5) 19.1 $ 13.2 $ 9.4 $ 7.4 $ 19.1 $ 19.1 $ 9.8 $ 16.4 $ 10.6 $ 14.6 $ 14.6 Supplemental cash flow disclosures: Cash paid for income taxes Cash paid for interest $ $ 4.5 7.9 $ $ 9.7 8.6 $ $ 8.0 8.3 $ $ 3.9 9.8 $ $ 26.1 34.6 $ $ 6.5 6.6 $ $ 24.3 6.6 $ $ 9.0 6.9 $ $ 9.3 6.4 $ $ 49.2 26.4 17
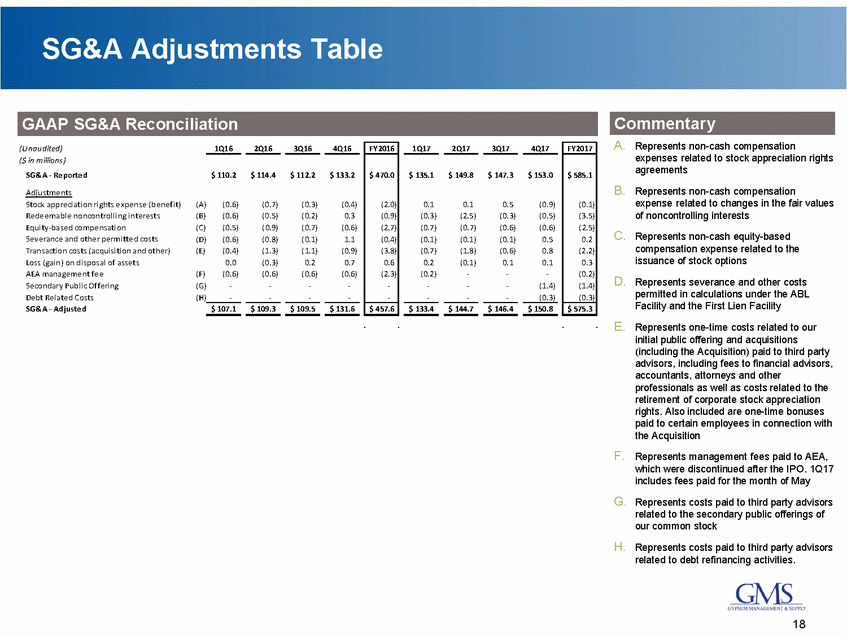
SG&A Adjustments Table Commentary A. Represents non-cash compensation expenses related to stock appreciation rights agreements (Unaudited) ($ in millions) SG&A - Reported Adjustments Stock appreciation rights expense (benefit) Redeemable noncontrolling interests Equity-based compensation Severance and other permitted costs Transaction costs (acquisition and other) Loss (gain) on disposal of assets AEA management fee Secondary Public Offering Debt Related Costs SG&A - Adjusted 1Q16 2Q16 3Q16 4Q16 1Q17 2Q17 3Q17 4Q17 $ 110.2 $ 114.4 $ 112.2 $ 133.2 $ 135.1 $ 149.8 $ 147.3 $ 153.0 B. Represents non-cash compensation expense related to changes in the fair values of noncontrolling interests (A) (B) (C) (D) (E) (0.6) (0.6) (0.5) (0.6) (0.4) 0.0 (0.6) - - (0.7) (0.5) (0.9) (0.8) (1.3) (0.3) (0.6) - - (0.3) (0.2) (0.7) (0.1) (1.1) 0.2 (0.6) - - (0.4) 0.3 (0.6) 1.1 (0.9) 0.7 (0.6) - - 0.1 (0.3) (0.7) (0.1) (0.7) 0.2 (0.2) - - 0.1 (2.5) (0.7) (0.1) (1.8) (0.1) - - - 0.5 (0.3) (0.6) (0.1) (0.6) 0.1 - - - (0.9) (0.5) (0.6) 0.5 0.8 0.1 - (1.4) (0.3) C. Represents non-cash equity-based compensation expense related to the issuance of stock options (F) (G) (H) D. Represents severance and other costs permitted in calculations under the ABL Facility and the First Lien Facility $ 107.1 $ 109.3 $ 109.5 $ 131.6 $ 133.4 $ 144.7 $ 146.4 $ 150.8 E. Represents one-time costs related to our initial public offering and acquisitions (including the Acquisition) paid to third party advisors, including fees to financial advisors, accountants, attorneys and other professionals as well as costs related to the retirement of corporate stock appreciation rights. Also included are one-time bonuses paid to certain employees in connection with the Acquisition F. Represents management fees paid to AEA, which were discontinued after the IPO. 1Q17 includes fees paid for the month of May G. Represents costs paid to third party advisors related to the secondary public offerings of our common stock H. Represents costs paid to third party advisors related to debt refinancing activities. 18 FY2017 $ 585.1 (0.1) (3.5) (2.5) 0.2 (2.2) 0.3 (0.2) (1.4) (0.3) $ 575.3 FY2016 $ 470.0 (2.0) (0.9) (2.7) (0.4) (3.8) 0.6 (2.3) - - $ 457.6 GAAP SG&A Reconciliation
www.gms.com Unsaved Document / 2/6/2014 / 22:45