Attached files
| file | filename |
|---|---|
| EX-99.1 - EX-99.1 - CENTERSPACE | ex-99d1.htm |
| 8-K - 8-K - CENTERSPACE | f8-k.htm |
Exhibit 99.2

Supplemental Financial and Operating Data
April 30, 2017
|
|
|
Page |
|
|
|
|
|
Company Background |
|
2 |
|
|
|
|
|
Property Cost by Segment and by State |
|
4 |
|
|
|
|
|
Key Financial Data |
|
|
|
Condensed Consolidated Balance Sheets |
|
5 |
|
Condensed Consolidated Statements of Operations |
|
6 |
|
Funds From Operations |
|
7 |
|
Adjusted EBITDA |
|
8 |
|
|
|
|
|
Capital Analysis |
|
|
|
Debt Analysis |
|
9 |
|
Debt Detail |
|
11 |
|
Capital Analysis |
|
13 |
|
|
|
|
|
Portfolio Analysis |
|
|
|
Net Operating Income Detail |
|
14-17 |
|
|
|
|
|
Tenant Analysis |
|
|
|
Multifamily Summary |
|
18 |
|
Healthcare Leasing Summary |
|
19-21 |
|
10 Largest Commercial Tenants |
|
22 |
|
|
|
|
|
Growth Analysis |
|
|
|
Development Summary |
|
23 |
|
|
|
|
|
Definitions |
|
24 |
1
Company Background
Fourth Quarter Fiscal 2017
We are a real estate investment trust (REIT) focused on the acquisition, development, redevelopment and management of multifamily communities located primarily in select growth markets throughout the Midwest. Our portfolio consists of multifamily and healthcare segments.
As of April 30, 2017, we held for investment a portfolio of 129 properties consisting of 87 multifamily properties, 29 healthcare properties, and 13 other commercial properties. As of April 30, 2017, our common shares and Series B preferred shares were publicly traded on the New York Stock Exchange (NYSE symbols: IRET and IRETPRB, respectively).
Company Snapshot
(as of April 30, 2017)
|
Company Headquarters |
Minot, North Dakota |
|
Fiscal Year-End |
April 30 |
|
Reportable Segments |
Multifamily and Healthcare |
|
Total Properties Held for Investment |
129 |
|
Total Units Held for Investment |
|
|
(multifamily properties) |
12,885 |
|
Total Square Feet Held for Investment |
|
|
(healthcare and other commercial properties) |
2.6 million |
|
Common Shares Outstanding (thousands) |
121,199(1) |
|
Limited Partnership Units Outstanding (thousands) |
15,617(1) |
|
Common Share Distribution - Quarter/Annualized |
$0.07/$0.28 |
|
Annualized Dividend Yield |
4.7% |
|
Total Capitalization (see p.12 for detail) |
$1.7 billion |
|
(1) |
Common Shares and Limited Partnership Units outstanding as of June 22, 2017 were 120,622,114 and 15,208,028, respectively. |
Investor Information
Board of Trustees
|
Jeffrey P. Caira |
Trustee and Chair |
|
John D. Stewart |
Trustee, Vice Chair, and Chair of the Audit Committee |
|
Linda J. Hall |
Trustee, Chair of Compensation Committee |
|
Jeffrey L. Miller |
Trustee, Chair of the Nominating and Governance Committee and Chair of the Executive Committee |
|
Michael T. Dance |
Trustee, Chair of the Investment Committee |
|
Terrance P. Maxwell |
Trustee |
|
John A. Schissel |
Trustee |
|
Mark O. Decker, Jr. |
Trustee, President and Chief Executive Officer |
Management
|
Mark O. Decker, Jr. |
President and Chief Executive Officer; Trustee |
|
John A. Kirchmann |
Executive Vice President |
|
Ted E. Holmes |
Chief Financial Officer |
|
Anne Olson |
Executive Vice President, General Counsel and Secretary |
|
Andrew Martin |
Executive Vice President – Asset Management |
|
Nancy B. Andersen |
Senior Vice President and Principal Accounting Officer |
|
Matthew M. Volpano |
Senior Vice President – Capital Markets |
|
Corporate Headquarters: |
Investor Relations Contact: |
|
1400 31st Avenue SW, Suite 60 |
Stephen Swett |
|
Post Office Box 1988 |
701-837-7104 |
|
Minot, North Dakota 58702-1988 |
IR@iret.com |
|
|
|
|
Trading Symbol for Common Shares: IRET |
|
|
Stock Exchange Listing: NYSE |
|
2
Common Share Data (NYSE: IRET)
|
|
|
|
|
4th Quarter |
|
3rd Quarter |
|
2nd Quarter |
|
1st Quarter |
|
4th Quarter |
|
3rd Quarter |
|
|||||
|
|
|
|
|
Fiscal Year 2017 |
|
Fiscal Year 2017 |
|
Fiscal Year 2017 |
|
Fiscal Year 2017 |
|
Fiscal Year 2016 |
|
Fiscal Year 2016 |
|
|||||
|
High Closing Price |
|
|
$ |
6.61 |
|
$ |
7.20 |
|
$ |
6.67 |
|
$ |
6.63 |
|
$ |
7.48 |
|
$ |
8.39 |
|
|
Low Closing Price |
|
|
$ |
5.67 |
|
$ |
5.81 |
|
$ |
5.67 |
|
$ |
6.01 |
|
$ |
5.97 |
|
$ |
6.24 |
|
|
Average Closing Price |
|
|
$ |
6.09 |
|
$ |
6.65 |
|
$ |
6.21 |
|
$ |
6.35 |
|
$ |
6.71 |
|
$ |
7.35 |
|
|
Closing Price at end of quarter |
|
|
$ |
5.91 |
|
$ |
6.44 |
|
$ |
6.07 |
|
$ |
6.62 |
|
$ |
6.02 |
|
$ |
6.52 |
|
|
Common Share Distributions—annualized |
|
|
$ |
0.28 |
|
$ |
0.28 |
|
$ |
0.52 |
|
$ |
0.52 |
|
$ |
0.52 |
|
$ |
0.52 |
|
|
Closing Dividend Yield - annualized |
|
|
|
4.7 |
% |
|
4.3 |
% |
|
8.6 |
% |
|
7.9 |
% |
|
8.6 |
% |
|
8.0 |
% |
|
Closing common shares outstanding (thousands) |
|
|
|
121,199 |
|
|
121,889 |
|
|
121,701 |
|
|
121,528 |
|
|
121,091 |
|
|
121,034 |
|
|
Closing limited partnership units outstanding (thousands) |
|
|
|
15,617 |
|
|
16,034 |
|
|
16,229 |
|
|
16,285 |
|
|
16,285 |
|
|
13,864 |
|
|
Closing market value of outstanding common shares, plus imputed closing market value of outstanding limited partnership units (thousands) |
|
|
$ |
808,583 |
|
$ |
888,224 |
|
$ |
837,235 |
|
$ |
912,322 |
|
$ |
827,004 |
|
$ |
879,535 |
|
This Supplemental Operating and Financial Data contains forward-looking statements within the meaning of Section 27A of the Securities Act of 1933, as amended, and Section 21E of the Securities Exchange Act of 1934, as amended. These forward-looking statements, which may be identified by the use of words such as “expects,” “plans,” “estimates,” “anticipates,” “projects,” “intends,” “believes,” “outlook” and similar expressions that do not relate to historical matters, specifically including our future plans, anticipated operating results, anticipated timing of development projects being placed into service, anticipated closings of the remaining senior housing sales, anticipated implementation and results of its value add program, and anticipated timing of properties becoming same-store properties, are based on our expectations, forecasts and assumptions at the time of this earnings release. Such statements involve known and unknown risks, uncertainties and other factors that may cause actual results to differ materially from those expressed or implied in such forward-looking statements.
Such risks, uncertainties and other factors that might cause such differences include, but are not limited to: intentions and expectations regarding future distributions on common shares and units; changes in operating costs; fluctuations in interest rates; adverse capital and credit market conditions that might affect our access to various sources of capital and cost of capital; our ability to manage our current debt levels and repay or refinance its indebtedness upon maturity or other payment dates; our ability to maintain financial covenant compliance under its debt agreements; adequate insurance coverage; the effect of government regulation; delays or inability to obtain necessary governmental permits and authorizations; changes in general and local economic and real estate market conditions; changes in demand for our properties that may result in lower than expected occupancy and/or rental rates; ability to acquire quality properties in targeted markets; ability to successfully dispose of certain assets; competition for tenants from similar competing properties; ability to attract and retain skilled personnel; cyber-intrusion; abandonment of development or redevelopment opportunities for which we have already incurred costs; delays in completing development, redevelopment and/or lease up of properties and increased costs; ability to maintain effective internal controls over financial reporting and disclosure controls and procedures; and those risks and uncertainties detailed from time to time in our filings with the Securities and Exchange Commission, including our Form 10-K for the fiscal year ended April 30, 2017 and subsequent quarterly reports on Form 10-Q. We assume no obligation to update or supplement forward-looking statements that become untrue because of subsequent events.
3
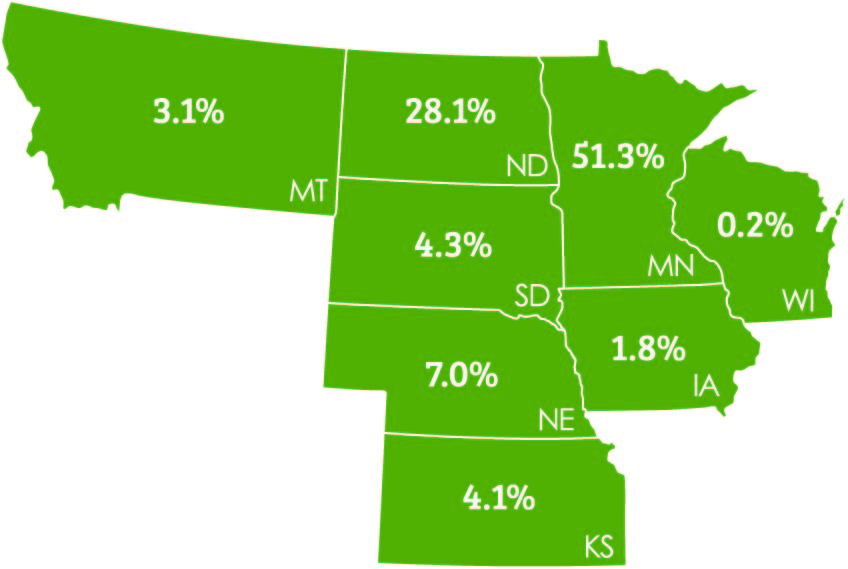
Fourth Quarter Fiscal 2017
Property Cost by Segment for Properties Held for Investment
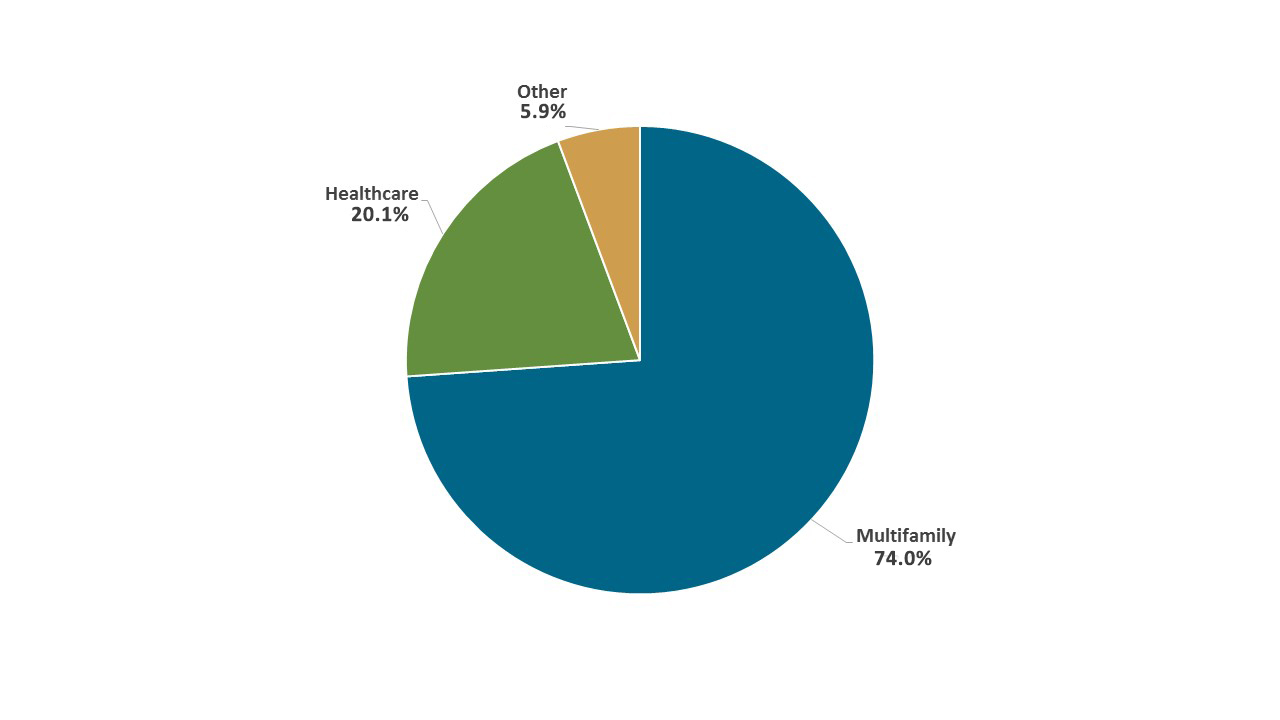
Percentage of Total Property Cost by State for Properties Held for Investment
4
INVESTORS REAL ESTATE TRUST AND SUBSIDIARIES
CONDENSED CONSOLIDATED BALANCE SHEETS (unaudited)
(in thousands)
|
|
|
4/30/2017 |
|
1/31/2017 |
|
|
10/31/2016 |
|
7/31/2016 |
|
4/30/2016 |
|
||||
|
ASSETS |
|
|
|
|
|
|
|
|
|
|
|
|
|
|
|
|
|
Real estate investments |
|
|
|
|
|
|
|
|
|
|
|
|
|
|
|
|
|
Property owned |
|
$ |
1,677,481 |
|
$ |
1,685,823 |
|
$ |
1,665,354 |
|
$ |
1,667,442 |
|
$ |
1,681,471 |
|
|
Less accumulated depreciation |
|
|
(340,417) |
|
|
(334,875) |
|
|
(321,790) |
|
|
(319,087) |
|
|
(312,889) |
|
|
|
|
|
1,337,064 |
|
|
1,350,948 |
|
|
1,343,564 |
|
|
1,348,355 |
|
|
1,368,582 |
|
|
Development in progress |
|
|
— |
|
|
11,531 |
|
|
20,921 |
|
|
27,454 |
|
|
51,681 |
|
|
Unimproved land |
|
|
18,455 |
|
|
19,076 |
|
|
19,069 |
|
|
18,933 |
|
|
20,939 |
|
|
Total real estate investments |
|
|
1,355,519 |
|
|
1,381,555 |
|
|
1,383,554 |
|
|
1,394,742 |
|
|
1,441,202 |
|
|
Assets held for sale and assets of discontinued operations |
|
|
37,708 |
|
|
140,226 |
|
|
191,233 |
|
|
215,817 |
|
|
220,537 |
|
|
Cash and cash equivalents |
|
|
28,819 |
|
|
56,999 |
|
|
68,729 |
|
|
54,438 |
|
|
66,698 |
|
|
Other investments |
|
|
— |
|
|
— |
|
|
— |
|
|
— |
|
|
50 |
|
|
Receivable arising from straight-lining of rents, net of allowance |
|
|
7,822 |
|
|
7,839 |
|
|
7,660 |
|
|
7,683 |
|
|
7,179 |
|
|
Accounts receivable, net of allowance |
|
|
2,600 |
|
|
3,878 |
|
|
9,815 |
|
|
3,018 |
|
|
1,524 |
|
|
Real estate deposits |
|
|
23,659 |
|
|
— |
|
|
1,370 |
|
|
— |
|
|
— |
|
|
Prepaid and other assets |
|
|
3,131 |
|
|
4,060 |
|
|
3,496 |
|
|
2,265 |
|
|
2,937 |
|
|
Intangible assets, net of accumulated amortization |
|
|
658 |
|
|
731 |
|
|
842 |
|
|
1,172 |
|
|
1,858 |
|
|
Tax, insurance, and other escrow |
|
|
5,050 |
|
|
5,724 |
|
|
4,786 |
|
|
4,752 |
|
|
5,450 |
|
|
Property and equipment, net of accumulated depreciation |
|
|
901 |
|
|
915 |
|
|
928 |
|
|
977 |
|
|
1,011 |
|
|
Goodwill |
|
|
1,572 |
|
|
1,645 |
|
|
1,645 |
|
|
1,680 |
|
|
1,680 |
|
|
Deferred charges and leasing costs, net of accumulated amortization |
|
|
7,075 |
|
|
5,517 |
|
|
5,261 |
|
|
4,999 |
|
|
4,896 |
|
|
TOTAL ASSETS |
|
$ |
1,474,514 |
|
$ |
1,609,089 |
|
$ |
1,679,319 |
|
$ |
1,691,543 |
|
$ |
1,755,022 |
|
|
|
|
|
|
|
|
|
|
|
|
|
|
|
|
|
|
|
|
LIABILITIES, REDEEMABLE NONCONTROLLING INTERESTS AND EQUITY |
|
|
|
|
|
|
|
|
|
|
|
|
|
|
|
|
|
LIABILITIES |
|
|
|
|
|
|
|
|
|
|
|
|
|
|
|
|
|
Liabilities held for sale and liabilities of discontinued operations |
|
$ |
30,062 |
|
$ |
54,291 |
|
$ |
69,326 |
|
$ |
76,195 |
|
$ |
77,488 |
|
|
Accounts payable and accrued expenses |
|
|
40,350 |
|
|
41,351 |
|
|
40,382 |
|
|
41,797 |
|
|
39,727 |
|
|
Revolving line of credit |
|
|
57,050 |
|
|
157,000 |
|
|
47,500 |
|
|
17,500 |
|
|
17,500 |
|
|
Mortgages payable, net of loan costs |
|
|
661,960 |
|
|
688,424 |
|
|
779,568 |
|
|
812,082 |
|
|
812,393 |
|
|
Construction debt and other |
|
|
41,817 |
|
|
39,524 |
|
|
82,742 |
|
|
78,481 |
|
|
82,130 |
|
|
TOTAL LIABILITIES |
|
|
831,239 |
|
|
980,590 |
|
|
1,019,518 |
|
|
1,026,055 |
|
|
1,029,238 |
|
|
|
|
|
|
|
|
|
|
|
|
|
|
|
|
|
|
|
|
REDEEMABLE NONCONTROLLING INTERESTS – CONSOLIDATED REAL ESTATE ENTITIES |
|
|
7,181 |
|
|
7,300 |
|
|
8,585 |
|
|
7,468 |
|
|
7,522 |
|
|
EQUITY |
|
|
|
|
|
|
|
|
|
|
|
|
|
|
|
|
|
Investors Real Estate Trust shareholders’ equity |
|
|
|
|
|
|
|
|
|
|
|
|
|
|
|
|
|
Series A Preferred Shares of Beneficial Interest |
|
|
— |
|
|
— |
|
|
27,317 |
|
|
27,317 |
|
|
27,317 |
|
|
Series B Preferred Shares of Beneficial Interest |
|
|
111,357 |
|
|
111,357 |
|
|
111,357 |
|
|
111,357 |
|
|
111,357 |
|
|
Common Shares of Beneficial Interest |
|
|
916,121 |
|
|
921,735 |
|
|
920,759 |
|
|
922,698 |
|
|
922,084 |
|
|
Accumulated distributions in excess of net income |
|
|
(466,541) |
|
|
(486,015) |
|
|
(489,356) |
|
|
(482,264) |
|
|
(442,000) |
|
|
Total Investors Real Estate Trust shareholders’ equity |
|
|
560,937 |
|
|
547,077 |
|
|
570,077 |
|
|
579,108 |
|
|
618,758 |
|
|
Noncontrolling interests – Operating Partnership |
|
|
73,233 |
|
|
72,007 |
|
|
71,994 |
|
|
73,071 |
|
|
78,484 |
|
|
Noncontrolling interests – consolidated real estate entities |
|
|
1,924 |
|
|
2,115 |
|
|
9,145 |
|
|
5,841 |
|
|
21,020 |
|
|
Total equity |
|
|
636,094 |
|
|
621,199 |
|
|
651,216 |
|
|
658,020 |
|
|
718,262 |
|
|
TOTAL LIABILITIES, REDEEMABLE NONCONTROLLING INTERESTS AND EQUITY |
|
$ |
1,474,514 |
|
$ |
1,609,089 |
|
$ |
1,679,319 |
|
$ |
1,691,543 |
|
$ |
1,755,022 |
|
5
INVESTORS REAL ESTATE TRUST AND SUBSIDIARIES
CONDENSED CONSOLIDATED STATEMENTS OF OPERATIONS (unaudited)
(in thousands, except per share data)
|
|
|
Twelve Months Ended |
|
Three Months Ended |
|
||||||||||||||||||
|
OPERATING RESULTS |
|
4/30/2017 |
|
4/30/2016 |
|
|
4/30/2017 |
|
1/31/2017 |
|
10/31/2016 |
|
7/31/2016 |
|
4/30/2016 |
|
|||||||
|
Real estate revenue |
|
$ |
205,738 |
|
$ |
188,320 |
|
|
$ |
54,344 |
|
$ |
51,174 |
|
$ |
50,609 |
|
$ |
49,611 |
|
$ |
48,523 |
|
|
Real estate expenses |
|
|
88,355 |
|
|
79,100 |
|
|
|
22,355 |
|
|
22,793 |
|
|
21,573 |
|
|
21,634 |
|
|
20,524 |
|
|
Net operating income |
|
|
117,383 |
|
|
109,220 |
|
|
|
31,989 |
|
|
28,381 |
|
|
29,036 |
|
|
27,977 |
|
|
27,999 |
|
|
Depreciation/amortization |
|
|
(55,009) |
|
|
(49,832) |
|
|
|
(13,736) |
|
|
(13,475) |
|
|
(13,531) |
|
|
(14,267) |
|
|
(13,517) |
|
|
Impairment of real estate investments |
|
|
(57,028) |
|
|
(5,543) |
|
|
|
(2,875) |
|
|
— |
|
|
— |
|
|
(54,153) |
|
|
(2,223) |
|
|
General and administrative expenses |
|
|
(12,075) |
|
|
(11,267) |
|
|
|
(3,637) |
|
|
(3,130) |
|
|
(2,702) |
|
|
(2,606) |
|
|
(2,951) |
|
|
Acquisition and investment related costs |
|
|
(3,276) |
|
|
(830) |
|
|
|
(3,224) |
|
|
(5) |
|
|
(4) |
|
|
(43) |
|
|
(397) |
|
|
Other expenses |
|
|
(3,796) |
|
|
(2,231) |
|
|
|
(1,091) |
|
|
(1,037) |
|
|
(816) |
|
|
(852) |
|
|
(950) |
|
|
Interest expense |
|
|
(41,127) |
|
|
(35,768) |
|
|
|
(9,457) |
|
|
(10,680) |
|
|
(10,626) |
|
|
(10,364) |
|
|
(10,062) |
|
|
Loss on extinguishment of debt |
|
|
(3,099) |
|
|
(106) |
|
|
|
(1,192) |
|
|
(1,907) |
|
|
— |
|
|
— |
|
|
— |
|
|
Interest and other income |
|
|
1,176 |
|
|
398 |
|
|
|
465 |
|
|
430 |
|
|
93 |
|
|
188 |
|
|
57 |
|
|
(Loss) income before income (loss) on sale of real estate and other investments and income (loss) from discontinued operations |
|
|
(56,851) |
|
|
4,041 |
|
|
|
(2,758) |
|
|
(1,423) |
|
|
1,450 |
|
|
(54,120) |
|
|
(2,044) |
|
|
Income (loss) on sale of real estate and other investments |
|
|
18,701 |
|
|
9,640 |
|
|
|
7,409 |
|
|
2,437 |
|
|
(103) |
|
|
8,958 |
|
|
8,369 |
|
|
Gain on bargain purchase |
|
|
— |
|
|
3,424 |
|
|
|
— |
|
|
— |
|
|
— |
|
|
— |
|
|
3,424 |
|
|
(Loss) income from continuing operations |
|
|
(38,150) |
|
|
17,105 |
|
|
|
4,651 |
|
|
1,014 |
|
|
1,347 |
|
|
(45,162) |
|
|
9,749 |
|
|
Income from discontinued operations |
|
|
68,675 |
|
|
59,497 |
|
|
|
28,989 |
|
|
24,175 |
|
|
10,943 |
|
|
4,568 |
|
|
2,006 |
|
|
Net income (loss) |
|
$ |
30,525 |
|
$ |
76,602 |
|
|
$ |
33,640 |
|
$ |
25,189 |
|
$ |
12,290 |
|
$ |
(40,594) |
|
$ |
11,755 |
|
|
|
|
|
|
|
|
|
|
|
|
|
|
|
|
|
|
|
|
|
|
|
|
|
|
|
Net (income) loss attributable to noncontrolling interest – Operating Partnership |
|
|
(4,059) |
|
|
(7,032) |
|
|
|
(3,656) |
|
|
(2,525) |
|
|
(1,174) |
|
|
3,296 |
|
|
(1,092) |
|
|
Net loss attributable to noncontrolling interests – consolidated real estate entities |
|
|
16,881 |
|
|
2,436 |
|
|
|
296 |
|
|
446 |
|
|
484 |
|
|
15,655 |
|
|
340 |
|
|
Net income (loss) attributable to Investors Real Estate Trust |
|
|
43,347 |
|
|
72,006 |
|
|
|
30,280 |
|
|
23,110 |
|
|
11,600 |
|
|
(21,643) |
|
|
11,003 |
|
|
Dividends to preferred shareholders |
|
|
(10,546) |
|
|
(11,514) |
|
|
|
(2,286) |
|
|
(2,503) |
|
|
(2,878) |
|
|
(2,879) |
|
|
(2,878) |
|
|
Redemption of Preferred Shares |
|
|
(1,435) |
|
|
— |
|
|
|
— |
|
|
(1,435) |
|
|
— |
|
|
— |
|
|
— |
|
|
NET INCOME (LOSS) AVAILABLE TO COMMON SHAREHOLDERS |
|
$ |
31,366 |
|
$ |
60,492 |
|
|
$ |
27,994 |
|
$ |
19,172 |
|
$ |
8,722 |
|
$ |
(24,522) |
|
$ |
8,125 |
|
|
|
|
|
|
|
|
|
|
|
|
|
|
|
|
|
|
|
|
|
|
|
|
|
|
|
Per Share Data |
|
|
|
|
|
|
|
|
|
|
|
|
|
|
|
|
|
|
|
|
|
|
|
|
(Loss) earnings per common share from continuing operations – Investors Real Estate Trust – basic & diluted |
|
$ |
(0.24) |
|
$ |
0.06 |
|
|
$ |
0.02 |
|
$ |
(0.02) |
|
$ |
(0.01) |
|
$ |
(0.23) |
|
$ |
0.06 |
|
|
Earnings per common share from discontinued operations – Investors Real Estate Trust – basic & diluted |
|
|
0.50 |
|
|
0.43 |
|
|
|
0.21 |
|
|
0.18 |
|
|
0.08 |
|
|
0.03 |
|
|
0.01 |
|
|
Net income (loss) per common share – basic & diluted |
|
$ |
0.26 |
|
$ |
0.49 |
|
|
$ |
0.23 |
|
$ |
0.16 |
|
$ |
0.07 |
|
$ |
(0.20) |
|
$ |
0.07 |
|
|
|
|
|
|
|
|
|
|
|
|
|
|
|
|
|
|
|
|
|
|
|
|
|
|
|
Percentage of Revenues |
|
|
|
|
|
|
|
|
|
|
|
|
|
|
|
|
|
|
|
|
|
|
|
|
Real estate expenses |
|
|
42.9 |
% |
|
42.0 |
% |
|
|
41.1 |
% |
|
44.5 |
% |
|
42.6 |
% |
|
43.6 |
% |
|
42.3 |
% |
|
Depreciation/amortization |
|
|
26.7 |
% |
|
26.5 |
% |
|
|
25.3 |
% |
|
26.3 |
% |
|
26.7 |
% |
|
28.8 |
% |
|
27.9 |
% |
|
General and administrative expenses |
|
|
5.9 |
% |
|
6.0 |
% |
|
|
6.7 |
% |
|
6.1 |
% |
|
5.3 |
% |
|
5.3 |
% |
|
6.1 |
% |
|
Interest |
|
|
20.0 |
% |
|
19.0 |
% |
|
|
17.4 |
% |
|
20.9 |
% |
|
21.0 |
% |
|
20.9 |
% |
|
20.7 |
% |
|
Income from discontinued operations |
|
|
33.4 |
% |
|
31.6 |
% |
|
|
53.3 |
% |
|
47.2 |
% |
|
21.6 |
% |
|
9.2 |
% |
|
4.1 |
% |
|
Net income |
|
|
14.8 |
% |
|
40.7 |
% |
|
|
61.9 |
% |
|
49.2 |
% |
|
24.3 |
% |
|
(81.8) |
% |
|
24.2 |
% |
|
|
|
|
|
|
|
|
|
|
|
|
|
|
|
|
|
|
|
|
|
|
|
|
|
|
Ratios |
|
|
|
|
|
|
|
|
|
|
|
|
|
|
|
|
|
|
|
|
|
|
|
|
Adjusted EBITDA(1)/Interest expense |
|
|
2.52 |
x |
|
2.54 |
x |
|
|
2.45 |
x |
|
2.47 |
x |
|
2.54 |
x |
|
2.52 |
x |
|
2.76 |
x |
|
Adjusted EBITDA(1)/Interest expense plus preferred distributions |
|
|
2.05 |
x |
|
2.10 |
x |
|
|
2.00 |
x |
|
2.04 |
x |
|
2.05 |
x |
|
2.03 |
x |
|
2.23 |
x |
|
(1) |
See Definitions on page 24. Adjusted EBITDA is a non-GAAP measure; see page 8 for a reconciliation of Adjusted EBITDA to net income. |
6
INVESTORS REAL ESTATE TRUST AND SUBSIDIARIES
FUNDS FROM OPERATIONS (unaudited)
(in thousands, except per share and unit data)
|
|
|
Twelve Months Ended |
|
|
Three Months Ended |
|
|||||||||||||||||
|
|
|
4/30/2017 |
|
4/30/2016 |
|
|
4/30/2017 |
|
1/31/2017 |
|
10/31/2016 |
|
7/31/2016 |
|
4/30/2016 |
|
|||||||
|
Funds From Operations(1) |
|
|
|
|
|
|
|
|
|
|
|
|
|
|
|
|
|
|
|
|
|
|
|
|
Net income (loss) attributable to Investors Real Estate Trust |
|
$ |
43,347 |
|
$ |
72,006 |
|
|
$ |
30,280 |
|
$ |
23,110 |
|
$ |
11,600 |
|
$ |
(21,643) |
|
$ |
11,003 |
|
|
Less dividends to preferred shareholders |
|
|
(10,546) |
|
|
(11,514) |
|
|
|
(2,286) |
|
|
(2,503) |
|
|
(2,878) |
|
|
(2,879) |
|
|
(2,878) |
|
|
Less redemption of preferred shares |
|
|
(1,435) |
|
|
— |
|
|
|
— |
|
|
(1,435) |
|
|
— |
|
|
— |
|
|
— |
|
|
Net income (loss) available to common shareholders |
|
|
31,366 |
|
|
60,492 |
|
|
|
27,994 |
|
|
19,172 |
|
|
8,722 |
|
|
(24,522) |
|
|
8,125 |
|
|
Adjustments: |
|
|
|
|
|
|
|
|
|
|
|
|
|
|
|
|
|
|
|
|
|
|
|
|
Noncontrolling interests – Operating Partnership |
|
|
4,059 |
|
|
7,032 |
|
|
|
3,656 |
|
|
2,525 |
|
|
1,174 |
|
|
(3,296) |
|
|
1,092 |
|
|
Depreciation and amortization of real property |
|
|
52,564 |
|
|
63,789 |
|
|
|
13,222 |
|
|
12,933 |
|
|
12,971 |
|
|
13,437 |
|
|
15,694 |
|
|
Impairment of real estate investments attributable to Investors Real Estate Trust |
|
|
42,065 |
|
|
5,983 |
|
|
|
2,875 |
|
|
— |
|
|
— |
|
|
39,189 |
|
|
2,223 |
|
|
(Gain) loss on depreciable property sales |
|
$ |
(74,847) |
|
$ |
(33,422) |
|
|
|
(37,517) |
|
|
(21,972) |
|
|
(6,400) |
|
|
(8,958) |
|
|
(7,910) |
|
|
FFO applicable to common shares and Units |
|
|
55,207 |
|
|
103,874 |
|
|
$ |
10,230 |
|
$ |
12,658 |
|
$ |
16,467 |
|
$ |
15,850 |
|
$ |
19,224 |
|
|
|
|
|
|
|
|
|
|
|
|
|
|
|
|
|
|
|
|
|
|
|
|
|
|
|
FFO per share and unit - basic and diluted(2) |
|
$ |
0.40 |
|
$ |
0.76 |
|
|
$ |
0.07 |
|
$ |
0.09 |
|
$ |
0.12 |
|
$ |
0.12 |
|
$ |
0.14 |
|
|
|
|
|
|
|
|
|
|
|
|
|
|
|
|
|
|
|
|
|
|
|
|
|
|
|
Adjusted funds from operations(1) |
|
|
|
|
|
|
|
|
|
|
|
|
|
|
|
|
|
|
|
|
|
|
|
|
FFO applicable to common shares and Units |
|
$ |
55,207 |
|
$ |
103,874 |
|
|
$ |
10,230 |
|
$ |
12,658 |
|
$ |
16,467 |
|
$ |
15,850 |
|
$ |
19,224 |
|
|
Adjustments: |
|
|
|
|
|
|
|
|
|
|
|
|
|
|
|
|
|
|
|
|
|
|
|
|
Tenant improvements at same-store(3) properties |
|
|
(2,600) |
|
|
(1,509) |
|
|
|
(526) |
|
|
(1,212) |
|
|
(362) |
|
|
(500) |
|
|
(778) |
|
|
Leasing costs at same-store properties(3) |
|
|
(1,072) |
|
|
(587) |
|
|
|
(72) |
|
|
(365) |
|
|
(464) |
|
|
(170) |
|
|
(89) |
|
|
Recurring capital expenditures(1)(3) |
|
|
(4,402) |
|
|
(5,553) |
|
|
|
(1,189) |
|
|
(989) |
|
|
(1,140) |
|
|
(1,141) |
|
|
(825) |
|
|
Straight-line rents |
|
|
(1,001) |
|
|
(859) |
|
|
|
(174) |
|
|
(292) |
|
|
162 |
|
|
(697) |
|
|
(238) |
|
|
Non-real estate depreciation |
|
|
305 |
|
|
354 |
|
|
|
78 |
|
|
69 |
|
|
69 |
|
|
88 |
|
|
93 |
|
|
Acquisition costs |
|
|
— |
|
|
253 |
|
|
|
— |
|
|
— |
|
|
— |
|
|
— |
|
|
91 |
|
|
Default interest |
|
|
— |
|
|
4,683 |
|
|
|
— |
|
|
— |
|
|
— |
|
|
— |
|
|
— |
|
|
(Gain) loss on extinguishment of debt |
|
|
4,889 |
|
|
(29,230) |
|
|
|
2,910 |
|
|
1,907 |
|
|
72 |
|
|
— |
|
|
— |
|
|
Gain on bargain purchase |
|
|
— |
|
|
(3,424) |
|
|
|
— |
|
|
— |
|
|
— |
|
|
— |
|
|
(3,424) |
|
|
Share-based compensation expense |
|
|
6 |
|
|
2,256 |
|
|
|
(1,421) |
|
|
563 |
|
|
603 |
|
|
262 |
|
|
864 |
|
|
Redemption of Preferred Shares |
|
|
1,435 |
|
|
— |
|
|
|
— |
|
|
1,435 |
|
|
— |
|
|
— |
|
|
— |
|
|
Severance |
|
|
2,612 |
|
|
— |
|
|
|
2,612 |
|
|
— |
|
|
— |
|
|
— |
|
|
— |
|
|
AFFO applicable to common shares and Units |
|
$ |
55,379 |
|
$ |
70,258 |
|
|
$ |
12,448 |
|
$ |
13,774 |
|
$ |
15,407 |
|
$ |
13,692 |
|
$ |
14,918 |
|
|
|
|
|
|
|
|
|
|
|
|
|
|
|
|
|
|
|
|
|
|
|
|
|
|
|
AFFO per share and unit - basic and diluted |
|
$ |
0.40 |
|
$ |
0.51 |
|
|
$ |
0.09 |
|
$ |
0.10 |
|
$ |
0.11 |
|
$ |
0.10 |
|
$ |
0.11 |
|
|
|
|
|
|
|
|
|
|
|
|
|
|
|
|
|
|
|
|
|
|
|
|
|
|
|
Weighted average shares and units |
|
|
137,299 |
|
|
137,372 |
|
|
|
136,952 |
|
|
137,375 |
|
|
137,418 |
|
|
137,402 |
|
|
136,438 |
|
|
(1) |
See Definitions on page 24. |
|
(2) |
Excluding income from a lease termination of $3.2 million; loss on extinguishment of debt of $4.9 million; redemption costs of preferred shares of $1.4 million; loss on write off of costs related to developments of $3.3 million; and expense related to stock based compensation and severance pay of $2.6 million, FFO would have been $64.2 million and $0.47 per Common Share and Unit for the twelve months ended April 30, 2017. Excluding gain or loss on extinguishment of debt of $29.2 million; gain on bargain purchase of $3.4 million; and default interest of $4.7 million, FFO would have been $75.9 million and $0.55 per Common Share and Unit for the twelve months ended April 30, 2016. Excluding income from a lease termination of $3.2 million; loss on extinguishment of debt of $2.9 million; loss on write off of costs related to developments of $3.2 million; and expense related to stock based compensation and severance pay of $1.2 million, FFO would have been $14.3 million and $0.11 per Common Share and Unit for the three months ended April 30, 2017. Excluding gain on bargain purchase of $3.4 million, FFO would have been $15.8 million and $0.12 per Common Share and Unit for the three months ended April 30, 2016. |
|
(3) |
Quarterly information is for properties in the same-store pool at that point in time; consequently, quarterly numbers may not total to year-to-date numbers. |
7
INVESTORS REAL ESTATE TRUST AND SUBSIDIARIES
ADJUSTED EARNINGS BEFORE INTEREST, TAXES, DEPRECIATION AND AMORTIZATION (ADJUSTED EBITDA) (unaudited)
(in thousands)
|
|
|
Twelve Months Ended |
|
|
Three Months Ended |
|
|||||||||||||||||
|
|
|
4/30/2017 |
|
4/30/2016 |
|
|
4/30/2017 |
|
1/31/2017 |
|
10/31/2016 |
|
7/31/2016 |
|
4/30/2016 |
|
|||||||
|
Adjusted EBITDA(1) |
|
|
|
|
|
|
|
|
|
|
|
|
|
|
|
|
|
|
|
|
|
|
|
|
Net income (loss) attributable to Investors Real Estate Trust |
|
$ |
43,347 |
|
$ |
72,006 |
|
|
$ |
30,280 |
|
$ |
23,110 |
|
$ |
11,600 |
|
$ |
(21,643) |
|
$ |
11,003 |
|
|
Adjustments: |
|
|
|
|
|
|
|
|
|
|
|
|
|
|
|
|
|
|
|
|
|
|
|
|
Noncontrolling interests – Operating Partnership |
|
|
4,059 |
|
|
7,032 |
|
|
|
3,656 |
|
|
2,525 |
|
|
1,174 |
|
|
(3,296) |
|
|
1,092 |
|
|
Income before noncontrolling interests – Operating Partnership |
|
|
47,406 |
|
|
79,038 |
|
|
|
33,936 |
|
|
25,635 |
|
|
12,774 |
|
|
(24,939) |
|
|
12,095 |
|
|
Add: |
|
|
|
|
|
|
|
|
|
|
|
|
|
|
|
|
|
|
|
|
|
|
|
|
Interest expense |
|
|
45,942 |
|
|
54,174 |
|
|
|
10,303 |
|
|
11,880 |
|
|
12,021 |
|
|
11,738 |
|
|
11,475 |
|
|
Loss (gain) loss on extinguishment of debt |
|
|
4,889 |
|
|
(29,230) |
|
|
|
2,910 |
|
|
1,907 |
|
|
72 |
|
|
— |
|
|
— |
|
|
Depreciation/amortization related to real estate investments |
|
|
52,774 |
|
|
63,998 |
|
|
|
13,280 |
|
|
12,983 |
|
|
13,014 |
|
|
13,497 |
|
|
15,765 |
|
|
Amortization related to real estate revenues(2) |
|
|
95 |
|
|
146 |
|
|
|
20 |
|
|
21 |
|
|
27 |
|
|
27 |
|
|
23 |
|
|
Impairment of real estate investments attributable to Investors Real Estate Trust |
|
|
42,065 |
|
|
5,983 |
|
|
|
2,875 |
|
|
— |
|
|
— |
|
|
39,190 |
|
|
2,223 |
|
|
Less: |
|
|
|
|
|
|
|
|
|
|
|
|
|
|
|
|
|
|
|
|
|
|
|
|
Interest income |
|
|
(2,545) |
|
|
(2,257) |
|
|
|
(557) |
|
|
(816) |
|
|
(600) |
|
|
(572) |
|
|
(570) |
|
|
Gain on sale of real estate and other investments |
|
|
(74,847) |
|
|
(34,193) |
|
|
|
(37,517) |
|
|
(21,972) |
|
|
(6,400) |
|
|
(8,958) |
|
|
(7,911) |
|
|
Adjusted EBITDA |
|
$ |
115,779 |
|
$ |
137,659 |
|
|
|
25,250 |
|
|
29,638 |
|
|
30,908 |
|
|
29,983 |
|
|
33,100 |
|
|
(1) |
See Definitions on page 24. |
|
(2) |
Included in real estate revenue in the Statement of Operations. |
8
INVESTORS REAL ESTATE TRUST AND SUBSIDIARIES
DEBT ANALYSIS
(in thousands)
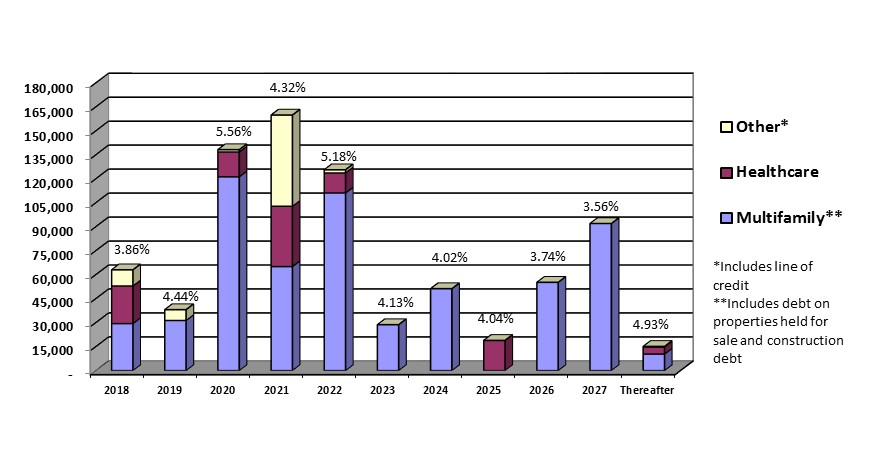
Debt Maturity Schedule
Annual Expirations
Total Debt
|
|
|
Future Maturities of Debt(1) |
|
|||||||||||||
|
|
|
|
|
|
|
|
|
|
|
|
|
|
|
|
|
|
|
Fiscal Year |
|
Fixed Debt |
|
Variable Debt |
|
Total Debt |
|
Weighted |
|
% of |
|
|||||
|
2018 |
|
$ |
15,715 |
|
$ |
47,321 |
|
$ |
63,036 |
|
|
3.86 |
% |
|
8.0 |
% |
|
2019 |
|
|
20,288 |
|
|
17,927 |
|
|
38,215 |
|
|
4.44 |
% |
|
4.9 |
% |
|
2020 |
|
|
105,702 |
|
|
32,503 |
|
|
138,205 |
|
|
5.56 |
% |
|
17.6 |
% |
|
2021 |
|
|
102,800 |
|
|
57,050 |
|
|
159,850 |
|
|
4.32 |
% |
|
20.3 |
% |
|
2022 |
|
|
123,925 |
|
|
1,694 |
|
|
125,619 |
|
|
5.18 |
% |
|
16.0 |
% |
|
2023 |
|
|
28,721 |
|
|
— |
|
|
28,721 |
|
|
4.13 |
% |
|
3.7 |
% |
|
2024 |
|
|
51,204 |
|
|
— |
|
|
51,204 |
|
|
4.02 |
% |
|
6.5 |
% |
|
2025 |
|
|
18,866 |
|
|
— |
|
|
18,866 |
|
|
4.04 |
% |
|
2.4 |
% |
|
2026 |
|
|
55,195 |
|
|
— |
|
|
55,195 |
|
|
3.74 |
% |
|
7.0 |
% |
|
2027 |
|
|
92,000 |
|
|
— |
|
|
92,000 |
|
|
3.56 |
% |
|
11.7 |
% |
|
Thereafter |
|
|
15,119 |
|
|
— |
|
|
15,119 |
|
|
4.93 |
% |
|
1.9 |
% |
|
Total maturities |
|
$ |
629,535 |
|
$ |
156,495 |
|
$ |
786,030 |
|
|
4.49 |
% |
|
100.0 |
% |
|
(1) |
Includes mortgages on properties held for sale, construction debt, and line of credit. |
|
(2) |
Weighted average interest rate of debt that matures in fiscal year. |
9
INVESTORS REAL ESTATE TRUST AND SUBSIDIARIES
DEBT ANALYSIS
(in thousands)
|
|
|
|
4/30/2017 |
|
1/31/2017 |
|
10/31/2016 |
|
7/31/2016 |
|
4/30/2016 |
|
||||
|
Debt Balances Outstanding(1) |
|
|
|
|
|
|
|
|
|
|
|
|
|
|
|
|
|
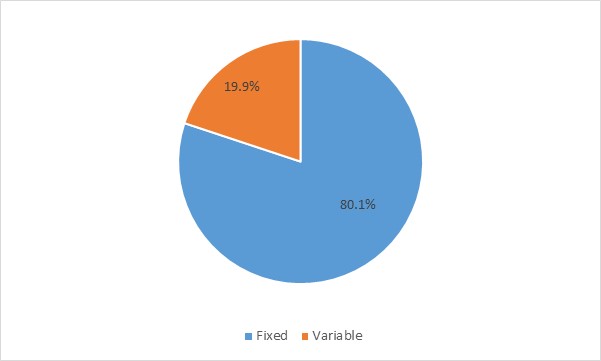
Fixed rate |
|
$ |
629,535 |
|
$ |
658,224 |
|
$ |
617,694 |
|
$ |
635,251 |
|
$ |
689,346 |
|
|
Variable rate |
|
|
99,445 |
|
|
81,314 |
|
|
226,891 |
|
|
249,169 |
|
|
196,801 |
|
|
Line of credit |
|
|
57,050 |
|
|
157,000 |
|
|
47,500 |
|
|
17,500 |
|
|
17,500 |
|
|
Debt total |
|
$ |
786,030 |
|
$ |
896,538 |
|
$ |
892,085 |
|
$ |
901,920 |
|
$ |
903,647 |
|
|
|
|
|
|
|
|
|
|
|
|
|
|
|
|
|
|
|
|
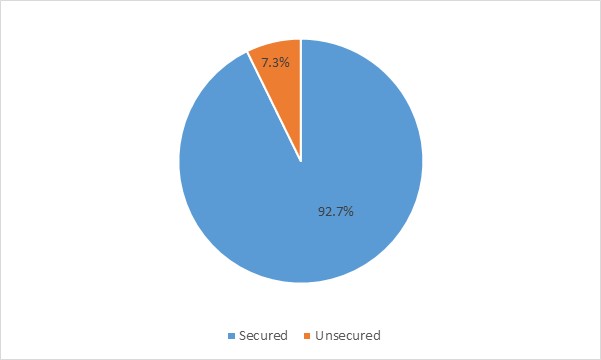
Weighted Average Interest Rates Secured |
|
|
4.63 |
% |
|
4.71 |
% |
|
4.52 |
% |
|
4.54 |
% |
|
4.54 |
% |
|
Line of Credit Rate |
|
|
2.74 |
% |
|
2.55 |
% |
|
4.75 |
% |
|
4.75 |
% |
|
4.75 |
% |
|
(1) |
Includes mortgages on properties held for sale. |
10
INVESTORS REAL ESTATE TRUST AND SUBSIDIARIES
DEBT DETAIL AS OF APRIL 30, 2017
(in thousands)
|
Property |
|
Maturity Date |
|
Fiscal 2018 |
|
Fiscal 2019 |
|
Fiscal 2020 |
|
Fiscal 2021 |
|
Thereafter |
|
Total(1) |
|
||||||
|
|
|
|
|
|
|
|
|
|
|
|
|
|
|
|
|
|
|
|
|
|
|
|
Multifamily |
|
|
|
|
|
|
|
|
|
|
|
|
|
|
|
|
|
|
|
|
|
|
Cardinal Point - Grand Forks, ND |
|
8/1/2017 |
|
|
23,810 |
|
|
— |
|
|
— |
|
|
— |
|
|
— |
|
|
23,810 |
|
|
Evergreen II – Isanti, MN |
|
11/1/2017 |
|
|
1,972 |
|
|
— |
|
|
— |
|
|
— |
|
|
— |
|
|
1,972 |
|
|
Ponds – Sartell, MN |
|
11/1/2017 |
|
|
3,641 |
|
|
— |
|
|
— |
|
|
— |
|
|
— |
|
|
3,641 |
|
|
Monticello Crossings - Monticello, MN |
|
5/4/2018 |
|
|
— |
|
|
17,927 |
|
|
— |
|
|
— |
|
|
— |
|
|
17,927 |
|
|
Homestead Gardens II - Rapid City, SD |
|
6/1/2018 |
|
|
— |
|
|
3,024 |
|
|
— |
|
|
— |
|
|
— |
|
|
3,024 |
|
|
Plaza - Minot, ND |
|
8/1/2018 |
|
|
— |
|
|
5,068 |
|
|
— |
|
|
— |
|
|
— |
|
|
5,068 |
|
|
Greenfield - Omaha, NE |
|
2/1/2019 |
|
|
— |
|
|
3,451 |
|
|
— |
|
|
— |
|
|
— |
|
|
3,451 |
|
|
Brooklyn Heights - Minot, ND(2) |
|
4/1/2019 |
|
|
— |
|
|
573 |
|
|
— |
|
|
— |
|
|
— |
|
|
573 |
|
|
Colton Heights - Minot, ND(2) |
|
4/1/2019 |
|
|
— |
|
|
323 |
|
|
— |
|
|
— |
|
|
— |
|
|
323 |
|
|
Pines - Minot, ND(2) |
|
4/1/2019 |
|
|
— |
|
|
92 |
|
|
— |
|
|
— |
|
|
— |
|
|
92 |
|
|
Summit Park - Minot, ND(2) |
|
4/1/2019 |
|
|
— |
|
|
795 |
|
|
— |
|
|
— |
|
|
— |
|
|
795 |
|
|
Terrace Heights - Minot, ND(2) |
|
4/1/2019 |
|
|
— |
|
|
133 |
|
|
— |
|
|
— |
|
|
— |
|
|
133 |
|
|
Monticello Village - Monticello, MN |
|
5/28/2019 |
|
|
— |
|
|
— |
|
|
2,853 |
|
|
— |
|
|
— |
|
|
2,853 |
|
|
Rimrock West - Billings, MT |
|
9/1/2019 |
|
|
— |
|
|
— |
|
|
3,160 |
|
|
— |
|
|
— |
|
|
3,160 |
|
|
Rocky Meadows - Billings, MT |
|
9/1/2019 |
|
|
— |
|
|
— |
|
|
4,899 |
|
|
— |
|
|
— |
|
|
4,899 |
|
|
Cimarron Hills - Omaha, NE |
|
10/1/2019 |
|
|
— |
|
|
— |
|
|
4,562 |
|
|
— |
|
|
— |
|
|
4,562 |
|
|
Cottonwood - Bismarck, ND |
|
10/1/2019 |
|
|
— |
|
|
— |
|
|
15,111 |
|
|
— |
|
|
— |
|
|
15,111 |
|
|
Forest Park - Grand Forks, ND |
|
10/1/2019 |
|
|
— |
|
|
— |
|
|
7,275 |
|
|
— |
|
|
— |
|
|
7,275 |
|
|
Renaissance Heights I - Williston, ND |
|
10/1/2019 |
|
|
— |
|
|
— |
|
|
23,439 |
|
|
— |
|
|
— |
|
|
23,439 |
|
|
Williston Garden - Williston, ND |
|
10/30/2019 |
|
|
— |
|
|
— |
|
|
7,316 |
|
|
— |
|
|
— |
|
|
7,316 |
|
|
Williston Garden - Williston, ND |
|
10/30/2019 |
|
|
— |
|
|
— |
|
|
225 |
|
|
— |
|
|
— |
|
|
225 |
|
|
Evergreen - Isanti, MN |
|
11/1/2019 |
|
|
— |
|
|
— |
|
|
1,913 |
|
|
— |
|
|
— |
|
|
1,913 |
|
|
Pinehurst - Billings, MT |
|
11/1/2019 |
|
|
— |
|
|
— |
|
|
121 |
|
|
— |
|
|
— |
|
|
121 |
|
|
Northridge - Bismarck, ND |
|
12/1/2019 |
|
|
— |
|
|
— |
|
|
5,986 |
|
|
— |
|
|
— |
|
|
5,986 |
|
|
Castlerock - Billings, MT |
|
1/1/2020 |
|
|
— |
|
|
— |
|
|
6,347 |
|
|
— |
|
|
— |
|
|
6,347 |
|
|
Thomasbrook - Lincoln, NE |
|
1/1/2020 |
|
|
— |
|
|
— |
|
|
5,687 |
|
|
— |
|
|
— |
|
|
5,687 |
|
|
Westwood Park - Bismarck, ND |
|
1/1/2020 |
|
|
— |
|
|
— |
|
|
1,879 |
|
|
— |
|
|
— |
|
|
1,879 |
|
|
Kirkwood Manor - Bismarck, ND |
|
2/1/2020 |
|
|
— |
|
|
— |
|
|
3,145 |
|
|
— |
|
|
— |
|
|
3,145 |
|
|
Brookfield Village - Topeka, KS |
|
3/1/2020 |
|
|
— |
|
|
— |
|
|
5,025 |
|
|
— |
|
|
— |
|
|
5,025 |
|
|
Crown Colony - Topeka, KS |
|
4/1/2020 |
|
|
— |
|
|
— |
|
|
7,780 |
|
|
— |
|
|
— |
|
|
7,780 |
|
|
Mariposa - Topeka, KS |
|
4/1/2020 |
|
|
— |
|
|
— |
|
|
2,816 |
|
|
— |
|
|
— |
|
|
2,816 |
|
|
Sherwood - Topeka, KS |
|
4/1/2020 |
|
|
— |
|
|
— |
|
|
11,686 |
|
|
— |
|
|
— |
|
|
11,686 |
|
|
Deer Ridge |
|
5/1/2020 |
|
|
— |
|
|
— |
|
|
— |
|
|
11,490 |
|
|
— |
|
|
11,490 |
|
|
Valley Park - Grand Forks, ND |
|
6/1/2020 |
|
|
— |
|
|
— |
|
|
— |
|
|
3,683 |
|
|
— |
|
|
3,683 |
|
|
Country Meadows II - Billings, MT |
|
10/1/2020 |
|
|
— |
|
|
— |
|
|
— |
|
|
3,355 |
|
|
— |
|
|
3,355 |
|
|
Olympic Village - Billings, MT |
|
11/1/2020 |
|
|
— |
|
|
— |
|
|
— |
|
|
10,158 |
|
|
— |
|
|
10,158 |
|
|
Villa West Apartments - Topeka, KS |
|
12/1/2020 |
|
|
— |
|
|
— |
|
|
— |
|
|
11,729 |
|
|
— |
|
|
11,729 |
|
|
Park Meadows - Waite Park, MN |
|
1/1/2021 |
|
|
— |
|
|
— |
|
|
— |
|
|
8,195 |
|
|
— |
|
|
8,195 |
|
|
Sunset Trail - Rochester, MN |
|
2/1/2021 |
|
|
— |
|
|
— |
|
|
— |
|
|
7,732 |
|
|
— |
|
|
7,732 |
|
|
Oxbow Park - Sioux Falls, SD(3) |
|
4/1/2021 |
|
|
— |
|
|
— |
|
|
— |
|
|
3,661 |
|
|
— |
|
|
3,661 |
|
|
Sierra Vista - Sioux Falls, SD(3) |
|
4/1/2021 |
|
|
— |
|
|
— |
|
|
— |
|
|
1,323 |
|
|
— |
|
|
1,323 |
|
|
Oakwood Estates - Sioux Falls, SD(3) |
|
4/29/2021 |
|
|
— |
|
|
— |
|
|
— |
|
|
3,749 |
|
|
— |
|
|
3,749 |
|
|
Summary of Debt due after Fiscal 2021 |
|
|
|
|
— |
|
|
— |
|
|
— |
|
|
— |
|
|
348,529 |
|
|
348,529 |
|
|
Sub-Total Multifamily |
|
|
|
$ |
29,423 |
|
$ |
31,386 |
|
$ |
121,225 |
|
$ |
65,075 |
|
$ |
348,529 |
|
$ |
595,638 |
|
|
|
|
|
|
|
|
|
|
|
|
|
|
|
|
|
|
|
|
|
|
|
|
|
|
|
|
|
|
|
|
|
|
|
|
|
|
|
|
|
|
|
|
|
|
|
|
Healthcare |
|
|
|
|
|
|
|
|
|
|
|
|
|
|
|
|
|
|
|
|
|
|
Edgewood Vista – Hermantown I, MN(2) |
|
5/28/2017 |
|
|
16,233 |
|
|
— |
|
|
— |
|
|
— |
|
|
— |
|
|
16,233 |
|
|
High Pointe Health Campus – Lake Elmo, MN |
|
4/1/2018 |
|
|
7,278 |
|
|
— |
|
|
— |
|
|
— |
|
|
— |
|
|
7,278 |
|
|
Denfeld Clinic - Duluth, MN |
|
8/1/2019 |
|
|
— |
|
|
— |
|
|
1,180 |
|
|
— |
|
|
— |
|
|
1,180 |
|
|
Gateway Clinic - Sandstone, MN |
|
8/1/2019 |
|
|
— |
|
|
— |
|
|
683 |
|
|
— |
|
|
— |
|
|
683 |
|
11
INVESTORS REAL ESTATE TRUST AND SUBSIDIARIES
DEBT DETAIL AS OF APRIL 30, 2017
(in thousands)
|
Property |
|
Maturity Date |
|
Fiscal 2018 |
|
Fiscal 2019 |
|
Fiscal 2020 |
|
Fiscal 2021 |
|
Thereafter |
|
Total (1) |
|
||||||
|
Mariner Clinic - Superior, WI |
|
8/1/2019 |
|
|
— |
|
|
— |
|
|
1,494 |
|
|
— |
|
|
— |
|
|
1,494 |
|
|
Pavilion I - Duluth, MN |
|
8/1/2019 |
|
|
— |
|
|
— |
|
|
3,937 |
|
|
— |
|
|
— |
|
|
3,937 |
|
|
Pavilion II - Duluth, MN |
|
8/1/2019 |
|
|
— |
|
|
— |
|
|
7,245 |
|
|
— |
|
|
— |
|
|
7,245 |
|
|
Wells Clinic - Hibbing, MN |
|
8/1/2019 |
|
|
— |
|
|
— |
|
|
1,042 |
|
|
— |
|
|
— |
|
|
1,042 |
|
|
Edina 6525 France SMC II - Edina, MN |
|
12/1/2020 |
|
|
— |
|
|
— |
|
|
— |
|
|
9,394 |
|
|
— |
|
|
9,394 |
|
|
Edina 6545 France - 2nd Mtg/Parking Ramp - Edina, MN |
|
12/1/2020 |
|
|
— |
|
|
— |
|
|
— |
|
|
886 |
|
|
— |
|
|
886 |
|
|
Edina 6545 France SMC I - Edina, MN |
|
12/1/2020 |
|
|
— |
|
|
— |
|
|
— |
|
|
27,445 |
|
|
— |
|
|
27,445 |
|
|
Summary of Debt due after Fiscal 2021 |
|
|
|
|
— |
|
|
— |
|
|
— |
|
|
— |
|
|
35,824 |
|
|
35,824 |
|
|
Sub-Total Healthcare |
|
|
|
$ |
23,511 |
|
$ |
— |
|
$ |
15,581 |
|
$ |
37,725 |
|
$ |
35,824 |
|
$ |
112,641 |
|
|
|
|
|
|
|
|
|
|
|
|
|
|
|
|
|
|
|
|
|
|
|
|
|
Other |
|
|
|
|
|
|
|
|
|
|
|
|
|
|
|
|
|
|
|
|
|
|
Urbandale 3900 106th Street – Urbandale, IA |
|
7/5/2017 |
|
|
10,102 |
|
|
— |
|
|
— |
|
|
— |
|
|
— |
|
|
10,102 |
|
|
Plaza 16 – Minot, ND |
|
8/1/2018 |
|
|
— |
|
|
6,726 |
|
|
— |
|
|
— |
|
|
— |
|
|
6,726 |
|
|
Lexington Commerce Center - Eagan, MN |
|
2/1/2020 |
|
|
— |
|
|
— |
|
|
1,399 |
|
|
— |
|
|
— |
|
|
1,399 |
|
|
Line of credit |
|
1/31/2021 |
|
|
— |
|
|
— |
|
|
— |
|
|
57,050 |
|
|
— |
|
|
57,050 |
|
|
Summary of Debt due after Fiscal 2021 |
|
|
|
|
— |
|
|
— |
|
|
— |
|
|
— |
|
|
2,371 |
|
|
2,371 |
|
|
Sub-Total All Other |
|
|
|
$ |
10,102 |
|
$ |
6,726 |
|
$ |
1,399 |
|
$ |
57,050 |
|
$ |
2,371 |
|
$ |
77,648 |
|
|
|
|
|
|
|
|
|
|
|
|
|
|
|
|
|
|
|
|
|
|
|
|
|
Total |
|
|
|
$ |
63,036 |
|
$ |
38,112 |
|
$ |
138,205 |
|
$ |
159,850 |
|
$ |
386,724 |
|
$ |
785,927 |
|
|
(1) |
Totals are principal balances of mortgages, construction debt and line of credit as of April 30, 2017. |
|
(2) |
Property is classified as held for sale at April 30, 2017. |
|
(3) |
Loan was paid off subsequent to April 30, 2017. |
12
INVESTORS REAL ESTATE TRUST AND SUBSIDIARIES
CAPITAL ANALYSIS
(in thousands, except per share and unit amounts)
|
|
|
|
Three Months Ended |
|||||||||||||
|
|
|
|
4/30/2017 |
|
1/31/2017 |
|
10/31/2016 |
|
7/31/2016 |
|
4/30/2016 |
|
||||
|
Equity Capitalization |
|
|
|
|
|
|
|
|
|
|
|
|
|
|
|
|
|
Common shares outstanding |
|
|
121,199 |
|
|
121,889 |
|
|
121,701 |
|
|
121,528 |
|
|
121,091 |
|
|
Operating partnership (OP) units outstanding |
|
|
15,617 |
|
|
16,034 |
|
|
16,229 |
|
|
16,285 |
|
|
16,285 |
|
|
Total common shares and OP units outstanding |
|
|
136,816 |
|
|
137,923 |
|
|
137,930 |
|
|
137,813 |
|
|
137,376 |
|
|
Market price per common share (closing price at end of period) |
|
$ |
5.91 |
|
$ |
6.44 |
|
$ |
6.07 |
|
$ |
6.62 |
|
$ |
6.02 |
|
|
Equity capitalization-common shares and OP units |
|
$ |
808,583 |
|
$ |
888,224 |
|
$ |
837,235 |
|
$ |
912,322 |
|
$ |
827,004 |
|
|
Recorded book value of preferred shares |
|
$ |
111,357 |
|
$ |
111,357 |
|
$ |
138,674 |
|
$ |
138,674 |
|
$ |
138,674 |
|
|
Total equity capitalization |
|
$ |
919,940 |
|
$ |
999,581 |
|
$ |
975,909 |
|
$ |
1,050,996 |
|
$ |
965,678 |
|
|
|
|
|
|
|
|
|
|
|
|
|
|
|
|
|
|
|
|
Debt Capitalization |
|
|
|
|
|
|
|
|
|
|
|
|
|
|
|
|
|
Total debt |
|
$ |
793,827 |
|
$ |
943,751 |
|
$ |
982,486 |
|
$ |
988,031 |
|
$ |
993,323 |
|
|
Total capitalization |
|
$ |
1,713,767 |
|
$ |
1,943,332 |
|
$ |
1,958,395 |
|
$ |
2,039,027 |
|
$ |
1,959,001 |
|
|
|
|
|
|
|
|
|
|
|
|
|
|
|
|
|
|
|
|
Total debt to total capitalization |
|
|
0.46:1 |
|
|
0.49:1 |
|
|
0.50:1 |
|
|
0.48:1 |
|
|
0.51:1 |
|
|
|
|
Twelve Months Ended |
|
|
Three Months Ended |
|
|||||||||||||||||
|
|
|
4/30/2017 |
|
4/30/2016 |
|
|
4/30/2017 |
|
1/31/2017 |
|
10/31/2016 |
|
7/31/2016 |
|
4/30/2016 |
|
|||||||
|
Earnings to fixed charges(1) |
|
|
(2) |
|
|
1.25 |
x |
|
|
1.48 |
x |
|
1.12 |
x |
|
1.14 |
x |
|
(5) |
|
|
1.80 |
x |
|
Earnings to combined fixed charges and preferred distributions(1) |
|
|
(2) |
|
|
1.05 |
|
|
|
1.21 |
|
|
(3) |
|
|
(4) |
|
|
(5) |
|
|
1.46 |
x |
|
Debt service coverage ratio(1) |
|
|
1.67 |
x |
|
1.75 |
x |
|
|
1.69 |
x |
|
1.67 |
x |
|
1.66 |
x |
|
1.62 |
x |
|
1.86 |
x |
|
|
|
|
|
|
|
|
|
|
|
|
|
|
|
|
|
|
|
|
|
|
|
|
|
|
Distribution Data |
|
|
|
|
|
|
|
|
|
|
|
|
|
|
|
|
|
|
|
|
|
|
|
|
Common shares and units outstanding at record date |
|
|
137,723 |
|
|
134,897 |
|
|
|
137,723 |
|
|
137,944 |
|
|
137,934 |
|
|
137,376 |
|
|
134,897 |
|
|
Total common distribution paid |
|
$ |
63,360 |
|
$ |
71,290 |
|
|
$ |
9,641 |
|
$ |
17,929 |
|
$ |
17,931 |
|
$ |
17,859 |
|
$ |
17,536 |
|
|
Common distribution per share and unit |
|
$ |
0.40 |
|
$ |
0.52 |
|
|
$ |
0.07 |
|
$ |
0.07 |
|
$ |
0.13 |
|
$ |
0.13 |
|
$ |
0.13 |
|
|
Payout ratio (FFO per share and unit basis)(1) |
|
|
100.0 |
% |
|
68.4 |
% |
|
|
100.0 |
% |
|
77.8 |
% |
|
108.3 |
% |
|
108.3 |
% |
|
92.9 |
% |
|
Payout ratio (AFFO per share and unit basis)(1) |
|
|
100.0 |
% |
|
102.0 |
% |
|
|
77.8 |
% |
|
70.0 |
% |
|
118.2 |
% |
|
130.0 |
% |
|
118.2 |
% |
|
(1) |
See Definitions on page 24. |
|
(2) |
Earnings were inadequate to cover (a) fixed charges and (b) combined fixed charges and preferred distributions by $21.5 million and $32.0 million, respectively. Excluding non-cash asset impairment charges of $57.1 million in the twelve months ended April 30, 2017, the ratio of earnings to fixed charges and of earnings to combined fixed charges and preferred distributions would have been 1.77x and 1.44x, respectively, for the twelve months ended April 30, 2017. |
|
(3) |
Earnings were inadequate to cover combined fixed charges and preferred distributions by $1.1 million. The ratio of earnings to combined fixed charges and preferred distributions was .92x for the three months ended January 31, 2017. |
|
(4) |
Earnings were inadequate to cover combined fixed charges and preferred distributions by $1.1 million. The ratio of earnings to combined fixed charges and preferred distributions was .92x for the three months ended October 31, 2016. |
|
(5) |
Earnings were inadequate to cover (a) fixed charges and (b) combined fixed charges and preferred distributions by $29.6 million and $32.5 million, respectively. Excluding non-cash asset impairment charges of $54.2 million in the three months ended July 31, 2016, the ratio of earnings to fixed charges and of earnings to combined fixed charges and preferred distributions would have been 3.06x and 2.47x, respectively, for the three months ended July 31, 2016. |
13
INVESTORS REAL ESTATE TRUST AND SUBSIDIARIES
NET OPERATING INCOME DETAIL
(in thousands)
|
|
|
Three Months Ended April 30, 2017 |
|
|||||||||||||
|
|
|
Reporting Segments |
|
|||||||||||||
|
|
|
|
|
|
|
|
|
|
|
|
Corporate and |
|
|
|
|
|
|
|
|
Multifamily |
|
Healthcare |
|
All Other |
|
Other |
|
Total |
|
|||||
|
Real estate rental revenue |
|
|
|
|
|
|
|
|
|
|
|
|
|
|
|
|
|
Same-store |
|
$ |
27,792 |
|
$ |
9,355 |
|
$ |
2,139 |
|
$ |
— |
|
$ |
39,286 |
|
|
Non-same-store |
|
|
9,393 |
|
|
5,199 |
|
|
466 |
|
|
— |
|
|
15,058 |
|
|
Total |
|
|
37,185 |
|
|
14,554 |
|
|
2,605 |
|
|
— |
|
|
54,344 |
|
|
|
|
|
|
|
|
|
|
|
|
|
|
|
|
|
|
|
|
Real estate expenses(1) |
|
|
|
|
|
|
|
|
|
|
|
|
|
|
|
|
|
Same-store |
|
|
12,492 |
|
|
3,417 |
|
|
587 |
|
|
955 |
|
|
17,451 |
|
|
Non-same-store |
|
|
4,019 |
|
|
443 |
|
|
142 |
|
|
300 |
|
|
4,904 |
|
|
Total |
|
|
16,511 |
|
|
3,860 |
|
|
729 |
|
|
1,255 |
|
|
22,355 |
|
|
|
|
|
|
|
|
|
|
|
|
|
|
|
|
|
|
|
|
Net operating income (NOI) |
|
|
|
|
|
|
|
|
|
|
|
|
|
|
|
|
|
Same-store |
|
|
15,300 |
|
|
5,938 |
|
|
1,552 |
|
|
(955) |
|
|
21,835 |
|
|
Non-same-store |
|
|
5,374 |
|
|
4,756 |
|
|
324 |
|
|
(300) |
|
|
10,154 |
|
|
Net operating income (loss) |
|
$ |
20,674 |
|
$ |
10,694 |
|
$ |
1,876 |
|
$ |
(1,255) |
|
$ |
31,989 |
|
|
|
|
|
|
|
|
|
|
|
|
|
|
|
|
|
|
|
|
Reconciliation of NOI to net income (loss) available to common shareholders |
|
|
|
|
|
|
|
|
|
|
|
|
|
|
|
|
|
Depreciation/amortization |
|
$ |
(10,030) |
|
$ |
(2,774) |
|
$ |
(854) |
|
$ |
(78) |
|
$ |
(13,736) |
|
|
Impairment of real estate investments |
|
|
(2,119) |
|
|
— |
|
|
— |
|
|
(756) |
|
|
(2,875) |
|
|
General and administrative expenses |
|
|
— |
|
|
— |
|
|
— |
|
|
(3,637) |
|
|
(3,637) |
|
|
Acquisition and investment related costs |
|
|
— |
|
|
— |
|
|
— |
|
|
(3,224) |
|
|
(3,224) |
|
|
Other expenses |
|
|
— |
|
|
— |
|
|
— |
|
|
(1,091) |
|
|
(1,091) |
|
|
Interest expense |
|
|
(7,027) |
|
|
(1,206) |
|
|
(313) |
|
|
(911) |
|
|
(9,457) |
|
|
Loss on debt extinguishment |
|
|
(1,183) |
|
|
— |
|
|
(9) |
|
|
— |
|
|
(1,192) |
|
|
Interest and other income |
|
|
— |
|
|
— |
|
|
— |
|
|
465 |
|
|
465 |
|
|
Income (loss) before gain on sale of real estate and other investments and income from discontinued operations |
|
|
315 |
|
|
6,714 |
|
|
700 |
|
|
(10,487) |
|
|
(2,758) |
|
|
Gain on sale of real estate and other investments |
|
|
809 |
|
|
6,600 |
|
|
— |
|
|
— |
|
|
7,409 |
|
|
Income (loss) from continuing operations |
|
|
1,124 |
|
|
13,314 |
|
|
700 |
|
|
(10,487) |
|
|
4,651 |
|
|
Income from discontinued operations |
|
|
— |
|
|
28,989 |
|
|
— |
|
|
— |
|
|
28,989 |
|
|
Net income (loss) |
|
|
1,124 |
|
|
42,303 |
|
|
700 |
|
|
(10,487) |
|
|
33,640 |
|
|
Net income attributable to noncontrolling interests – Operating Partnership |
|
|
— |
|
|
— |
|
|
— |
|
|
(3,656) |
|
|
(3,656) |
|
|
Net loss attributable to noncontrolling interests – consolidated real estate entities |
|
|
— |
|
|
— |
|
|
— |
|
|
296 |
|
|
296 |
|
|
Net income (loss) attributable to Investors Real Estate Trust |
|
|
1,124 |
|
|
42,303 |
|
|
700 |
|
|
(13,847) |
|
|
30,280 |
|
|
Dividends to preferred shareholders |
|
|
— |
|
|
— |
|
|
— |
|
|
(2,286) |
|
|
(2,286) |
|
|
NET INCOME (LOSS) AVAILABLE TO COMMON SHAREHOLDERS |
|
$ |
1,124 |
|
$ |
42,303 |
|
$ |
700 |
|
$ |
(16,133) |
|
$ |
27,994 |
|
|
(1) |
Offsite costs associated with property management and casualty-related amounts are included in the Corporate and Other column. |
14
INVESTORS REAL ESTATE TRUST AND SUBSIDIARIES
NET OPERATING INCOME DETAIL
(in thousands)
|
|
|
Three Months Ended April 30, 2016 |
|
|||||||||||||
|
|
|
Reporting Segments |
|
|||||||||||||
|
|
|
|
|
|
|
|
|
|
|
|
Corporate and |
|
|
|
|
|
|
|
|
Multifamily |
|
Healthcare |
|
All Other |
|
Other |
|
Total |
|
|||||
|
Real estate rental revenue |
|
|
|
|
|
|
|
|
|
|
|
|
|
|
|
|
|
Same-store |
|
$ |
27,658 |
|
$ |
9,698 |
|
$ |
2,186 |
|
$ |
— |
|
$ |
39,542 |
|
|
Non-same-store |
|
|
6,458 |
|
|
1,934 |
|
|
589 |
|
|
— |
|
|
8,981 |
|
|
Total |
|
|
34,116 |
|
|
11,632 |
|
|
2,775 |
|
|
— |
|
|
48,523 |
|
|
|
|
|
|
|
|
|
|
|
|
|
|
|
|
|
|
|
|
Real estate expenses(1) |
|
|
|
|
|
|
|
|
|
|
|
|
|
|
|
|
|
Same-store |
|
|
11,837 |
|
|
3,685 |
|
|
502 |
|
|
686 |
|
|
16,710 |
|
|
Non-same-store |
|
|
3,098 |
|
|
467 |
|
|
136 |
|
|
113 |
|
|
3,814 |
|
|
Total |
|
|
14,935 |
|
|
4,152 |
|
|
638 |
|
|
799 |
|
|
20,524 |
|
|
|
|
|
|
|
|
|
|
|
|
|
|
|
|
|
|
|
|
Net operating income (NOI) |
|
|
|
|
|
|
|
|
|
|
|
|
|
|
|
|
|
Same-store |
|
|
15,821 |
|
|
6,013 |
|
|
1,684 |
|
|
(686) |
|
|
22,832 |
|
|
Non-same-store |
|
|
3,360 |
|
|
1,467 |
|
|
453 |
|
|
(113) |
|
|
5,167 |
|
|
Net operating income (loss) |
|
$ |
19,181 |
|
$ |
7,480 |
|
$ |
2,137 |
|
$ |
(799) |
|
$ |
27,999 |
|
|
|
|
|
|
|
|
|
|
|
|
|
|
|
|
|
|
|
|
Reconciliation of NOI to net income (loss) available to common shareholders |
|
|
|
|
|
|
|
|
|
|
|
|
|
|
|
|
|
Depreciation/amortization |
|
$ |
(9,418) |
|
$ |
(3,109) |
|
$ |
(913) |
|
$ |
(77) |
|
$ |
(13,517) |
|
|
Impairment of real estate investments |
|
|
— |
|
|
(1,898) |
|
|
— |
|
|
(325) |
|
|
(2,223) |
|
|
General and administrative expenses |
|
|
— |
|
|
— |
|
|
— |
|
|
(2,951) |
|
|
(2,951) |
|
|
Acquisition and investment related costs |
|
|
— |
|
|
— |
|
|
— |
|
|
(397) |
|
|
(397) |
|
|
Other expenses |
|
|
— |
|
|
— |
|
|
— |
|
|
(950) |
|
|
(950) |
|
|
Interest expense |
|
|
(7,365) |
|
|
(2,115) |
|
|
(368) |
|
|
(214) |
|
|
(10,062) |
|
|
Interest and other income |
|
|
— |
|
|
— |
|
|
— |
|
|
57 |
|
|
57 |
|
|
Income (loss) before gain (loss) on sale of real estate and other investments and (loss) income from discontinued operations |
|
|
2,398 |
|
|
358 |
|
|
856 |
|
|
(5,656) |
|
|
(2,044) |
|
|
(Loss) gain on sale of real estate and other investments |
|
|
(32) |
|
|
7,982 |
|
|
420 |
|
|
(1) |
|
|
8,369 |
|
|
Gain on bargain purchase |
|
|
3,424 |
|
|
— |
|
|
— |
|
|
— |
|
|
3,424 |
|
|
Income (loss) from continuing operations |
|
|
5,790 |
|
|
8,340 |
|
|
1,276 |
|
|
(5,657) |
|
|
9,749 |
|
|
Income from discontinued operations |
|
|
— |
|
|
1,863 |
|
|
143 |
|
|
— |
|
|
2,006 |
|
|
Net income (loss) |
|
|
5,790 |
|
|
10,203 |
|
|
1,419 |
|
|
(5,657) |
|
|
11,755 |
|
|
Net income attributable to noncontrolling interests – Operating Partnership |
|
|
— |
|
|
— |
|
|
— |
|
|
(1,092) |
|
|
(1,092) |
|
|
Net loss attributable to noncontrolling interests – consolidated real estate entities |
|
|
— |
|
|
— |
|
|
— |
|
|
340 |
|
|
340 |
|
|
Net income (loss) attributable to Investors Real Estate Trust |
|
|
5,790 |
|
|
10,203 |
|
|
1,419 |
|
|
(6,409) |
|
|
11,003 |
|
|
Dividends to preferred shareholders |
|
|
— |
|
|
— |
|
|
— |
|
|
(2,878) |
|
|
(2,878) |
|
|
NET INCOME (LOSS) AVAILABLE TO COMMON SHAREHOLDERS |
|
$ |
5,790 |
|
$ |
10,203 |
|
$ |
1,419 |
|
$ |
(9,287) |
|
$ |
8,125 |
|
|
(1) |
Offsite costs associated with property management and casualty-related amounts are included in the Corporate and Other column. |
15
INVESTORS REAL ESTATE TRUST AND SUBSIDIARIES
NET OPERATING INCOME DETAIL
(in thousands)
|
|
|
Twelve Months Ended April 30, 2017 |
|
|||||||||||||
|
|
|
Reporting Segments |
|
|||||||||||||
|
|
|
|
|
|
|
|
|
|
|
|
Corporate and |
|
|
|
|
|
|
|
|
Multifamily |
|
Healthcare |
|
All Other |
|
Other |
|
Total |
|
|||||
|
Real estate rental revenue |
|
|
|
|
|
|
|
|
|
|
|
|
|
|
|
|
|
Same-store |
|
$ |
110,019 |
|
$ |
38,648 |
|
$ |
8,893 |
|
$ |
— |
|
$ |
157,560 |
|
|
Non-same-store |
|
|
34,724 |
|
|
11,208 |
|
|
2,246 |
|
|
— |
|
|
48,178 |
|
|
Total |
|
|
144,743 |
|
|
49,856 |
|
|
11,139 |
|
|
— |
|
|
205,738 |
|
|
|
|
|
|
|
|
|
|
|
|
|
|
|
|
|
|
|
|
Real estate expenses(1) |
|
|
|
|
|
|
|
|
|
|
|
|
|
|
|
|
|
Same-store |
|
|
48,896 |
|
|
14,672 |
|
|
2,487 |
|
|
4,553 |
|
|
70,608 |
|
|
Non-same-store |
|
|
14,396 |
|
|
1,747 |
|
|
537 |
|
|
1,067 |
|
|
17,747 |
|
|
Total |
|
|
63,292 |
|
|
16,419 |
|
|
3,024 |
|
|
5,620 |
|
|
88,355 |
|
|
|
|
|
|
|
|
|
|
|
|
|
|
|
|
|
|
|
|
Net operating income (NOI) |
|
|
|
|
|
|
|
|
|
|
|
|
|
|
|
|
|
Same-store |
|
|
61,123 |
|
|
23,976 |
|
|
6,406 |
|
|
(4,553) |
|
|
86,952 |
|
|
Non-same-store |
|
|
20,328 |
|
|
9,461 |
|
|
1,709 |
|
|
(1,067) |
|
|
30,431 |
|
|
Net operating income (loss) |
|
$ |
81,451 |
|
$ |
33,437 |
|
$ |
8,115 |
|
$ |
(5,620) |
|
$ |
117,383 |
|
|
|
|
|
|
|
|
|
|
|
|
|
|
|
|
|
|
|
|
Reconciliation of NOI to net (loss) income available to common shareholders |
|
|
|
|
|
|
|
|
|
|
|
|
|
|
|
|
|
Depreciation/amortization |
|
$ |
(39,801) |
|
$ |
(11,318) |
|
$ |
(3,600) |
|
$ |
(290) |
|
$ |
(55,009) |
|
|
Impairment of real estate investments |
|
|
(53,520) |
|
|
— |
|
|
— |
|
|
(3,508) |
|
|
(57,028) |
|
|
General and administrative expenses |
|
|
— |
|
|
— |
|
|
— |
|
|
(12,075) |
|
|
(12,075) |
|
|
Acquisition and investment related costs |
|
|
— |
|
|
— |
|
|
— |
|
|
(3,276) |
|
|
(3,276) |
|
|
Other expenses |
|
|
— |
|
|
— |
|
|
— |
|
|
(3,796) |
|
|
(3,796) |
|
|
Interest expense |
|
|
(30,239) |
|
|
(7,171) |
|
|
(1,522) |
|
|
(2,195) |
|
|
(41,127) |
|
|
Loss on extinguishment of debt |
|
|
(1,432) |
|
|
(1,455) |
|
|
(136) |
|
|
(76) |
|
|
(3,099) |
|
|
Interest and other income |
|
|
— |
|
|
— |
|
|
— |
|
|
1,176 |
|
|
1,176 |
|
|
(Loss) income before (loss) gain on sale of real estate and income from discontinued operations |
|
|
(43,541) |
|
|
13,493 |
|
|
2,857 |
|
|
(29,660) |
|
|
(56,851) |
|
|
Gain (loss) on sale of real estate and other investments |
|
|
809 |
|
|
6,498 |
|
|
11,419 |
|
|
(25) |
|
|
18,701 |
|
|
(Loss) income from continuing operations |
|
|
(42,732) |
|
|
19,991 |
|
|
14,276 |
|
|
(29,685) |
|
|
(38,150) |
|
|
Income from discontinued operations |
|
|
— |
|
|
68,362 |
|
|
313 |
|
|
— |
|
|
68,675 |
|
|
Net (loss) income |
|
|
(42,732) |
|
|
88,353 |
|
|
14,589 |
|
|
(29,685) |
|
|
30,525 |
|
|
Net income attributable to noncontrolling interests – Operating Partnership |
|
|
— |
|
|
— |
|
|
— |
|
|
(4,059) |
|
|
(4,059) |
|
|
Net loss attributable to noncontrolling interests – consolidated real estate entities |
|
|
— |
|
|
— |
|
|
— |
|
|
16,881 |
|
|
16,881 |
|
|
Net (loss) income attributable to Investors Real Estate Trust |
|
|
(42,732) |
|
|
88,353 |
|
|
14,589 |
|
|
(16,863) |
|
|
43,347 |
|
|
Dividends to preferred shareholders |
|
|
— |
|
|
— |
|
|
— |
|
|
(10,546) |
|
|
(10,546) |
|
|
Redemption of Preferred Shares |
|
|
— |
|
|
— |
|
|
— |
|
|
(1,435) |
|
|
(1,435) |
|
|
NET (LOSS) INCOME AVAILABLE TO COMMON SHAREHOLDERS |
|
$ |
(42,732) |
|
$ |
88,353 |
|
$ |
14,589 |
|
$ |
(28,844) |
|
$ |
31,366 |
|
|
(1) |
Offsite costs associated with property management and casualty-related amounts are included in the Corporate and Other column. |
16
INVESTORS REAL ESTATE TRUST AND SUBSIDIARIES
NET OPERATING INCOME DETAIL
(in thousands)
|
|
|
Twelve Months Ended April 30, 2016 |
|
|||||||||||||
|
|
|
Reporting Segments |
|
|||||||||||||
|
|
|
|
|
|
|
|
|
|
|
|
Corporate and |
|
|
|
|
|
|
|
|
Multifamily |
|
Healthcare |
|
All Other |
|
Other |
|
Total |
|
|||||
|
Real estate rental revenue |
|
|
|
|
|
|
|
|
|
|
|
|
|
|
|
|
|
Same-store |
|
$ |
111,644 |
|
$ |
38,550 |
|
$ |
9,247 |
|
$ |
— |
|
$ |
159,441 |
|
|
Non-same-store |
|
|
19,505 |
|
|
7,071 |
|
|
2,303 |
|
|
— |
|
|
28,879 |
|
|
Total |
|
|
131,149 |
|
|
45,621 |
|
|
11,550 |
|
|
— |
|
|
188,320 |
|
|
|
|
|
|
|
|
|
|
|
|
|
|
|
|
|
|
|
|
Real estate expenses(1) |
|
|
|
|
|
|
|
|
|
|
|
|
|
|
|
|
|
Same-store |
|
|
47,746 |
|
|
13,892 |
|
|
2,069 |
|
|
3,672 |
|
|
67,379 |
|
|
Non-same-store |
|
|
9,384 |
|
|
1,547 |
|
|
431 |
|
|
359 |
|
|
11,721 |
|
|
Total |
|
|
57,130 |
|
|
15,439 |
|
|
2,500 |
|
|
4,031 |
|
|
79,100 |
|
|
|
|
|
|
|
|
|
|
|
|
|
|
|
|
|
|
|
|
Net operating income (NOI) |
|
|
|
|
|
|
|
|
|
|
|
|
|
|
|
|
|
Same-store |
|
|
63,898 |
|
|
24,658 |
|
|
7,178 |
|
|
(3,672) |
|
|
92,062 |
|
|
Non-same-store |
|
|
10,121 |
|
|
5,524 |
|
|
1,872 |
|
|
(359) |
|
|
17,158 |
|
|
Net operating income (loss) |
|
$ |
74,019 |
|
$ |
30,182 |
|
$ |
9,050 |
|
$ |
(4,031) |
|
$ |
109,220 |
|
|
|
|
|
|
|
|
|
|
|
|
|
|
|
|
|
|
|
|
Reconciliation of NOI to net income (loss) available to common shareholders |
|
|
|
|
|
|
|
|
|
|
|
|
|
|
|
|
|
Depreciation/amortization |
|
$ |
(34,396) |
|
$ |
(11,496) |
|
$ |
(3,648) |
|
$ |
(292) |
|
$ |
(49,832) |
|
|
Impairment of real estate investments |
|
|
(1,873) |
|
|
(1,898) |
|
|
— |
|
|
(1,772) |
|
|
(5,543) |
|
|
General and administrative expenses |
|
|
— |
|
|
— |
|
|
— |
|
|
(11,267) |
|
|
(11,267) |
|
|
Acquisition and investment related costs |
|
|
— |
|
|
— |
|
|
— |
|
|
(830) |
|
|
(830) |
|
|
Other expenses |
|
|
— |
|
|
— |
|
|
— |
|
|
(2,231) |
|
|
(2,231) |
|
|
Interest expense |
|
|
(26,742) |
|
|
(8,607) |
|
|
(1,584) |
|
|
1,165 |
|
|
(35,768) |
|
|
Loss on debt extinguishment |
|
|
(93) |
|
|
— |
|
|
(13) |
|
|
— |
|
|
(106) |
|
|
Interest and other income |
|
|
— |
|
|
— |
|
|
— |
|
|
398 |
|
|
398 |
|
|
Income (loss) before gain on sale of real estate and other investments and income from discontinued operations |
|
|
10,915 |
|
|
8,181 |
|
|
3,805 |
|
|
(18,860) |
|
|
4,041 |
|
|
(Loss) gain on sale of real estate and other investments |
|
|
(32) |
|
|
7,982 |
|
|
1,705 |
|
|
(15) |
|
|
9,640 |
|
|
Gain on bargain purchase |
|
|
3,424 |
|
|
— |
|
|
— |
|
|
— |
|
|
3,424 |
|
|
Income (loss) from continuing operations |
|
|
14,307 |
|
|
16,163 |
|
|
5,510 |
|
|
(18,875) |
|
|
17,105 |
|
|
Income from discontinued operations |
|
|
— |
|
|
8,131 |
|
|
51,366 |
|
|
— |
|
|
59,497 |
|
|
Net income (loss) |
|
|
14,307 |
|
|
24,294 |
|
|
56,876 |
|
|
(18,875) |
|
|
76,602 |
|
|
Net income attributable to noncontrolling interests – Operating Partnership |
|
|
— |
|
|
— |
|
|
— |
|
|
(7,032) |
|
|
(7,032) |
|
|
Net loss attributable to noncontrolling interests – consolidated real estate entities |
|
|
— |
|
|
— |
|
|
— |
|
|
2,436 |
|
|
2,436 |
|
|
Net income (loss) attributable to Investors Real Estate Trust |
|
|
14,307 |
|
|
24,294 |
|
|
56,876 |
|
|
(23,471) |
|
|
72,006 |
|
|
Dividends to preferred shareholders |
|
|
— |
|
|
— |
|
|
— |
|
|
(11,514) |
|
|
(11,514) |
|
|
NET INCOME (LOSS) AVAILABLE TO COMMON SHAREHOLDERS |
|
$ |
14,307 |
|
$ |
24,294 |
|
$ |
56,876 |
|
$ |
(34,985) |
|
$ |
60,492 |
|
|
(1) |
Offsite costs associated with property management and casualty-related amounts are included in the Corporate and Other column. |
17
INVESTORS REAL ESTATE TRUST AND SUBSIDIARIES
MULTIFAMILY SUMMARY(1)
|
|
|
Three Months Ended |
|
|||||||||||||
|
|
|
04/30/17 |
|
01/31/17 |
|
|
10/31/16 |
|
|
07/31/16 |
|
|
04/30/16 |
|
||
|
Number of Units |
|
|
|
|
|
|
|
|
|
|
|
|
|
|
|
|
|
Same-Store |
|
|
10,512 |
|
|
10,513 |
|
|
10,513 |
|
|
10,840 |
|
|
9,853 |
|
|
Non-Same-Store |
|
|
2,693 |
|
|
2,652 |
|
|
2,589 |
|
|
2,196 |
|
|
3,121 |
|
|
All Properties |
|
|
13,205 |
|
|
13,165 |
|
|
13,102 |
|
|
13,036 |
|
|
12,974 |
|
|
|
|
|
|
|
|
|
|
|
|
|
|
|
|
|
|
|
|
Average Investment Per Unit |
|
|
|
|
|
|
|
|
|
|
|
|
|
|
|
|
|
Same-Store |
|
$ |
78,996 |
|
$ |
78,499 |
|
$ |
77,814 |
|
$ |
77,371 |
|
$ |
72,986 |
|
|
Non-Same-Store |
|
|
164,715 |
|
|
165,367 |
|
|
164,515 |
|
|
196,164 |
|
|
161,851 |
|
|
All Properties |
|
$ |
96,485 |
|
$ |
95,998 |
|
$ |
94,946 |
|
$ |
97,382 |
|
$ |
94,092 |
|
|
|
|
|
|
|
|
|
|
|
|
|
|
|
|
|
|
|
|
Average Scheduled Rent(2) per Unit |
|
|
|
|
|
|
|
|
|
|
|
|
|
|
|
|
|
Same-Store |
|
$ |
906 |
|
$ |
902 |
|
$ |
902 |
|
$ |
888 |
|
$ |
871 |
|
|
Non-Same-Store |
|
|
1,267 |
|
|
1,289 |
|
|
1,336 |
|
|
1,458 |
|
|
1,244 |
|
|
All Properties |
|
$ |
980 |
|
$ |
980 |
|
$ |
988 |
|
$ |
984 |
|
$ |
960 |
|
|
|
|
|
|
|
|
|
|
|
|
|
|
|
|
|
|
|
|
Average Revenue per Unit(3) |
|
|
|
|
|
|
|
|
|
|
|
|
|
|
|
|
|
Same-Store |
|
$ |
955 |
|
$ |
941 |
|
$ |
950 |
|
$ |
928 |
|
$ |
912 |
|
|
Non-Same-Store |
|
|
1,334 |
|
|
1,325 |
|
|
1,376 |
|
|
1,462 |
|
|
1,276 |
|
|
All Properties |
|
$ |
1,032 |
|
$ |
1,019 |
|
$ |
1,035 |
|
$ |
1,020 |
|
$ |
1,000 |
|
|
|
|
|
|
|
|
|
|
|
|
|
|
|
|
|
|
|
|
Occupancy |
|
|
|
|
|
|
|
|
|
|
|
|
|
|
|
|
|
Same-Store |
|
|
94.2 |
% |
|
92.7 |
% |
|
92.9 |
% |
|
93.0 |
% |
|
94.8 |
% |
|
Non-Same-Store |
|
|
88.8 |
% |
|
86.9 |
% |
|
84.4 |
% |
|
77.5 |
% |
|
78.4 |
% |
|
All Properties |
|
|
93.1 |
% |
|
91.5 |
% |
|
91.2 |
% |
|
90.4 |
% |
|
90.8 |
% |
|
|
|
|
|
|
|
|
|
|
|
|
|
|
|
|
|
|
|
Operating Expenses as a % of Scheduled Rent |
|
|
|
|
|
|
|
|
|
|
|
|
|
|
|
|
|
Same-Store |
|
|
46.6 |
% |
|
47.7 |
% |
|
44.9 |
% |
|
47.0 |
% |
|
44.4 |
% |
|
Non-Same-Store |
|
|
42.1 |
% |
|
39.2 |
% |
|
36.4 |
% |
|
31.2 |
% |
|
36.6 |
% |
|
All Properties |
|
|
45.4 |
% |
|
45.5 |
% |
|
42.7 |
% |
|
43.0 |
% |
|
42.0 |
% |
|
|
|
|
|
|
|
|
|
|
|
|
|
|
|
|
|
|
|
Capital Expenditures |
|
|
|
|
|
|
|
|
|
|
|
|
|
|
|
|
|
Total Recurring Capital Expenditures(2) per Unit |
|
$ |
113 |
|
$ |
94 |
|
$ |
108 |
|
$ |
105 |
|
$ |
84 |
|
|
|
|
|
|
|
|
|
|
|
|
|
|
|
|
|
|
|
|
Total Non-Recurring Capital Expenditures per Unit - Same-Store |
|
$ |
168 |
|
$ |
201 |
|
$ |
188 |
|
$ |
200 |
|
$ |
85 |
|
|
|
|
|
|
|
|
|
|
|
|
|
|
|
|
|
|
|
|
Revenue Generating Expenditures per Unit(4) |
|
$ |
8,213 |
|
$ |
10,224 |
|
$ |
13,998 |
|
$ |
8,102 |
|
|
7,632 |
|
|
(1) |
Previously reported amounts are not revised for discontinued operations or changes in the composition of the same-store properties pool. |
|
(2) |
See Definitions on page 24. |
|
(3) |
Total revenues divided by the weighted average occupied units for the period. |
|
(4) |
Cost per unit represents the average amount spent on completed and in-progress units during the period and also includes common area redevelopment costs at properties in the value add program. |
18
INVESTORS REAL ESTATE TRUST AND SUBSIDIARIES
HEALTHCARE LEASING SUMMARY (Same-Store Properties)
Healthcare Leasing Activity
The total leasing activity for our same-store healthcare properties, expressed in square feet of leases signed during the period, and the resulting occupancy levels, are as follows:
Three Months Ended April 30, 2017 and 2016
|
|
|
|
|
|
|
|
|
|
|
Total |
|
|
|
|
|
||
|
|
|
Square Feet of |
|
Square Feet of |
|
Square Feet of |
|
|
|
|
|
||||||
|
|
|
New Leases(1) |
|
Leases Renewed(1) |
|
Leases Executed(1) |
|
Occupancy |
|
||||||||
|
|
|
2017 |
|
2016 |
|
2017 |
|
2016 |
|
2017 |
|
2016 |
|
2017 |
|
2016 |
|
|
Healthcare |
|
2,082 |
|
361 |
|
14,037 |
|
33,424 |
|
16,119 |
|
33,785 |
|
92.1 |
% |
95.6 |
% |
|
(1) |
The leasing activity presented is based on leases signed or executed for our same-store rental properties during the period and is not intended to coincide with the commencement of rental revenue in accordance with US GAAP. Prior periods reflect amounts previously reported and exclude retroactive adjustments for properties reclassified to discontinued operations or non-same-store in the current period. |
Twelve Months Ended April 30, 2017 and 2016
|
|
|
|
|
|
|
|
|
|
|
Total |
|
|
|
|
|
||
|
|
|
Square Feet of |
|
Square Feet of |
|
Square Feet of |
|
|
|
|
|
||||||
|
|
|
New Leases(1) |
|
Leases Renewed(1) |
|
Leases Executed(1) |
|
Occupancy |
|
||||||||
|
|
|
2017 |
|
2016 |
|
2017 |
|
2016 |
|
2017 |
|
2016 |
|
2017 |
|
2016 |
|
|
Healthcare |
|
20,001 |
|
45,446 |
|
118,076 |
|
156,543 |
|
138,077 |
|
201,989 |
|
92.1 |
% |
95.6 |
% |
|
(1) |
The leasing activity presented is based on leases signed or executed for our same-store rental properties during the period and is not intended to coincide with the commencement of rental revenue in accordance with US GAAP. Prior periods reflect amounts previously reported and exclude retroactive adjustments for properties reclassified to discontinued operations or non-same-store in the current period. |
Healthcare New Leases
The following table sets forth the average effective rents and the estimated costs of tenant improvements and leasing commissions, on a per square foot basis, that we are obligated to fulfill under the new leases signed for our same-store healthcare properties:
Three Months Ended April 30, 2017 and 2016
|
|
|
|
|
|
|
|
|
|
|
|
|
|
|
|
|
Estimated Tenant |
|
Leasing |
|
||||||||
|
|
|
Square Feet of |
|
Average Term |
|
Average |
|
Improvement Cost per |
|
Commissions per |
|
||||||||||||||||
|
|
|
New Leases(1 |
|
in Years |
|
Effective Rent(2) |
|
Square Foot(1) |
|
Square Foot(1) |
|
||||||||||||||||
|
|
|
2017 |
|
2016 |
|
2017 |
|
2016 |
|
|
2017 |
|
|
2016 |
|
|
2017 |
|
|
2016 |
|
|
2017 |
|
|
2016 |
|
|
Healthcare |
|
2,082 |
|
361 |
|
6.2 |
|
0.5 |
|
$ |
5.62 |
|
$ |
19.28 |
|
$ |
— |
|
$ |
— |
|
$ |
5.50 |
|
$ |
— |
|
|
(1) |
The leasing activity presented is based on leases signed or executed for our same-store rental properties during the period and is not intended to coincide with the commencement of rental revenue in accordance with US GAAP. Prior periods reflect amounts previously reported and exclude retroactive adjustments for properties reclassified to discontinued operations or non-same-store in the current period. Tenant improvements and leasing commissions presented are based on square feet leased during the period. |
|
(2) |
Effective rents represent average annual base rental payments, on a straight-line basis for the term of each lease, excluding operating expense reimbursements. The underlying leases contain various expense structures including gross, modified gross, net and triple net. |
19
INVESTORS REAL ESTATE TRUST AND SUBSIDIARIES
HEALTHCARE LEASING SUMMARY (Same-Store Properties)
Twelve Months Ended April 30, 2017 and 2016
|
|
|
|
|
|
|
|
|
|
|
|
|
|
|
|
|
Estimated Tenant |
Leasing |
|
|||||||||
|
|
|
Square Feet of |
Average Term |
Average |
Improvement Cost per |
Commissions per |
|
||||||||||||||||||||
|
|
|
New Leases(1) |
in Years |
Effective Rent(2) |
Square Foot(1) |
Square Foot(1) |
|
||||||||||||||||||||
|
|
|
2017 |
|
2016 |
|
2017 |
|
2016 |
|
|
2017 |
|
|
2016 |
|
|
2017 |
|
|
2016 |
|
|
2017 |
|
|
2016 |
|
|
Healthcare |
|
20,001 |
|
45,446 |
|
7.6 |
|
6.6 |
|
$ |
19.42 |
|
$ |
19.97 |
|
$ |
36.58 |
|
$ |
12.99 |
|
$ |
6.17 |
|
$ |
3.24 |
|
|
(1) |
The leasing activity presented is based on leases signed or executed for our same-store rental properties during the period and is not intended to coincide with the commencement of rental revenue in accordance with US GAAP. Prior periods reflect amounts previously reported and exclude retroactive adjustments for properties reclassified to discontinued operations or non-same-store in the current period. Tenant improvements and leasing commissions presented are based on square feet leased during the period. |
|
(2) |
Effective rents represent average annual base rental payments, on a straight-line basis for the term of each lease, excluding operating expense reimbursements. The underlying leases contain various expense structures including gross, modified gross, net and triple net. |
Healthcare Lease Renewals
The following table summarizes our lease renewal activity within our same-store healthcare segment (square feet data in thousands):
Three Months Ended April 30, 2017 and 2016
|
|
|
|
|
|
|
|
|
|
|
|
|
|
|
|
|
|
|
Estimated |
|
|
|
|
|
|
|
||||
|
|
|
|
|
|
|
|
|
|
|
|
|
|
|
Weighted Average |
|
Tenant Improvement |
|
Leasing |
|
||||||||||
|
|
|
Square Feet of Leases |
|
Percent of Expiring |
|
Average Term |
|
Growth (Decline) |
|
Cost per Square |
|
Commissions per |
|
||||||||||||||||
|
|
|
Renewed(1) |
|
Leases Renewed(2) |
|
in Years |
|
in Effective Rents(3) |
|
Foot(1) |
|
Square Foot(1) |
|
||||||||||||||||
|
|
|
2017 |
|
2016 |
|
2017 |
|
2016 |
|
2017 |
|
2016 |
|
2017 |
|
2016 |
|
2017 |
|
2016 |
|
2017 |
|
2016 |
|
||||
|
Healthcare |
|
14,037 |
|
33,424 |
|
92.1 |
% |
95.8 |
% |
2.8 |
|
4.2 |
|
(1.4) |
% |
5.4 |
% |
$ |
— |
|
$ |
10.20 |
|
$ |
1.04 |
|
$ |
1.97 |
|
|
(1) |
The leasing activity presented is based on leases signed or executed for our same-store rental properties during the period and is not intended to coincide with the commencement of rental revenue in accordance with US GAAP. Prior periods reflect amounts previously reported and exclude retroactive adjustments for properties reclassified to discontinued operations or non-same-store in the current period. Tenant improvements and leasing commissions are based on square feet leased during the period. |
|
(2) |
Renewal percentage of expiring leases is based on square footage of renewed leases and not the number of leases renewed. The category of renewed leases does not include leases that have become month-to-month leases, as the month-to-month leases are considered lease amendments. |
|
(3) |
Represents the percentage change in effective rent between the original leases and the renewal leases. Effective rents represent average annual base rental payments, on a straight-line basis for the term of each lease, excluding operating expense reimbursements. The underlying leases contain various expense structures including gross, modified gross, net and triple net. |
Twelve Months Ended April 30, 2017 and 2016
|
|
|
|
|
|
|
|
|
|
|
|
|
|
|
|
|
|
|
Estimated |
|
|
|
|
|
|
|
||||
|
|
|
|
|
|
|
|
|
|
|
|
|
|
|
Weighted Average |
|
Tenant Improvement |
|
Leasing |
|
||||||||||
|
|
|
Square Feet of Leases |
|
Percent of Expiring |
|
Average Term |
|
Growth (Decline) |
|
Cost per Square |
|
Commissions per |
|
||||||||||||||||
|
|
|
Renewed(1) |
|
Leases Renewed(2) |
|
in Years |
|
in Effective Rents(3) |
|
Foot(1) |
|
Square Foot(1) |
|
||||||||||||||||
|
|
|
2017 |
|
2016 |
|
2017 |
|
2016 |
|
2017 |
|
2016 |
|
2017 |
|
2016 |
|
2017 |
|
2016 |
|
2017 |
|
2016 |
|
||||
|
Healthcare |
|
118,076 |
|
156,543 |
|
87.8 |
% |
92.2 |
% |
5.5 |
|
4.7 |
|
1.5 |
% |
5.7 |
% |
$ |
2.10 |
|
$ |
9.40 |
|
$ |
3.69 |
|
$ |
2.65 |
|
|
(1) |
The leasing activity presented is based on leases signed or executed for our same-store rental properties during the period and is not intended to coincide with the commencement of rental revenue in accordance with US GAAP. Prior periods reflect amounts previously reported and exclude retroactive adjustments for properties reclassified to discontinued operations or non-same-store in the current period. Tenant improvements and leasing commissions are based on square feet leased during the period. |
|
(2) |
Renewal percentage of expiring leases is based on square footage of renewed leases and not the number of leases renewed. The category of renewed leases does not include leases that have become month-to-month leases, as the month-to-month leases are considered lease amendments. |
|
(3) |
Represents the percentage change in effective rent between the original leases and the renewal leases. Effective rents represent average annual base rental payments, on a straight-line basis for the term of each lease, excluding operating expense reimbursements. The underlying leases contain various expense structures including gross, modified gross, net and triple net. |
20
Healthcare Lease Expirations
Our ability to maintain and improve occupancy rates, and base rents, primarily depends upon our continuing ability to re-lease expiring space. The following table reflects the in-service portfolio lease expiration schedule of our healthcare properties, including square footage and annualized base rent for expiring leases, as of April 30, 2017.
|
|
|
|
|
|
|
Percentage of Total |
|
Annualized Base |
|
|
|
|
Percentage of Total |
|
|
|
|
|
|
|
Square Footage of |
|
Healthcare |
|
Rent of Expiring |
|
|
Average |
|
Healthcare |
|
|
|
Fiscal Year of Lease Expiration |
|
# of Leases |
|
Expiring Leases(2) |
|
Leased Square Footage |
|
Leases at Expiration(3) |
|
|
Rental Rate |
|
Annualized Base Rent |
|
|
|
2018(1) |
|
26 |
|
96,307 |
|
7.8 |
% |
$ |
1,826,287 |
|
$ |
18.96 |
|
6.8 |
% |
|
2019 |
|
16 |
|
70,862 |
|
5.8 |
% |
|
1,551,836 |
|
|
21.90 |
|
5.8 |
% |
|
2020 |
|
16 |
|
93,521 |
|
7.6 |
% |
|
1,922,802 |
|
|
20.56 |
|
7.2 |
% |
|
2021 |
|
20 |
|
95,575 |
|
7.8 |
% |
|
2,059,840 |
|
|
21.55 |
|
7.7 |
% |
|
2022 |
|
16 |
|
75,819 |
|
6.2 |
% |
|
1,380,789 |
|
|
18.21 |
|
5.2 |
% |
|
2023 |
|
15 |
|
65,379 |
|
5.3 |
% |
|
1,239,754 |
|
|
18.96 |
|
4.6 |
% |
|
2024 |
|
29 |
|
179,460 |
|
14.6 |
% |
|
4,178,414 |
|
|
23.28 |
|
15.6 |
% |
|
2025 |
|
5 |
|
76,691 |
|
6.2 |
% |
|
1,688,381 |
|
|
22.02 |
|
6.3 |
% |
|
2026 |
|
8 |
|
84,368 |
|
6.9 |
% |
|
1,509,909 |
|
|
17.90 |
|
5.6 |
% |
|
2027 |
|
13 |
|
176,652 |
|
14.4 |
% |
|
3,797,245 |
|
|
21.50 |
|
14.2 |
% |
|
Thereafter |
|
14 |
|
216,299 |
|
17.6 |
% |
|
5,656,970 |
|
|
26.15 |
|
21.1 |
% |
|
Totals |
|
178 |
|
1,230,933 |
|
100.0 |
% |
$ |
26,812,228 |
|
$ |
21.78 |
|
100.0 |
% |
|
(1) |
Includes month-to-month leases. As of April 30, 2017, month-to-month leases accounted for 11,916 square feet. |
|
(2) |
Assuming that none of the tenants exercise renewal or termination options, and including leases renewed prior to expiration. Also excludes 1,361 square feet of space occupied by us. |
|
(3) |
Annualized base rent is monthly scheduled rent as of April 1, 2017, multiplied by 12. |
21
INVESTORS REAL ESTATE TRUST AND SUBSIDIARIES
10 LARGEST COMMERCIAL TENANTS – BASED ON ANNUALIZED BASE RENT(1)
as of April 30, 2017
|
|
|
|
|
|
|
|
|
|
|
|
|
|
|
|
|
|
Average |
|
% of Total |
|
|
|
% of Aggregate |
|
|
|
|
|
|
Remaining |
|
Commercial |
|
Aggregate |
|
Occupied |
|
|
|
|
Number of |
|
Lease Term |
|
Minimum |
|
Rentable |
|
Square |
|
|
Tenant |
|
Properties |
|
in Months |
|
Rents |
|
Square Feet |
|
Feet |
|
|
Fairview Health Services |
|
8 |
|
48 |
|
11.9 |
% |
239,203 |
|
8.8 |
% |
|
St. Luke’s Hospital of Duluth, Inc. |
|
5 |
|
106 |
|
8.7 |
% |
186,331 |
|
6.8 |
% |
|
Affiliates of Edgewood Vista |
|
2 |
|
56 |
|
8.5 |
% |
279,834 |
|
10.3 |
% |
|
PrairieCare Medical LLC |
|
2 |
|
120 |
|
7.5 |
% |
104,714 |
|
3.8 |
% |
|
Quality Manufacturing Corp |
|
1 |
|
69 |
|
3.3 |
% |
427,798 |
|
15.7 |
% |
|
Children’s Hospitals & Clinics |
|
3 |
|
55 |
|
2.7 |
% |
54,378 |
|
2.0 |
% |
|
Allina Health |
|
4 |
|
39 |
|
2.7 |
% |
53,132 |
|
2.0 |
% |
|
Noran Neurological Clinic |
|
1 |
|
76 |
|
2.4 |
% |
38,506 |
|
1.4 |
% |
|
Amerada Hess |
|
1 |
|
111 |
|
2.3 |
% |
50,610 |
|
1.9 |
% |
|
Obstetrics and Gynecology Assc |
|
3 |
|
157 |
|
2.2 |
% |
39,363 |
|
1.4 |
% |
|
Total/Weighted Average |
|
30 |
|
67 |
|
52.2 |
% |
1,473,869 |
|
54.1 |
% |
(1)Annualized base rent is calculated as monthly base rent (cash basis) per the lease, as of the reporting period, multiplied by 12.
22
INVESTORS REAL ESTATE TRUST AND SUBSIDIARIES
FISCAL 2017 DEVELOPMENT SUMMARY
as of April 30, 2017
(dollars in thousands)
Development Placed in Service
|
|
|
|
|
|
|
|
|
|
|
Occupancy at |
|
Occupancy |
|
Development |
|
|
|
|
|
|
|
|
|
Date Placed in |
|
|
|
Date Placed in |
|
as of |
|
Cost as of |
|
|
|
Property |
|
Location |
|
Segment |
|
Service |
|
Number of Units |
|
Service |
|
April 30, 2017 |
|
April 30, 2017 |
|
|
|
71 France(1) |
|
Edina, MN |
|
Multifamily |
|
5/1/16 |
|
241 |
|
54.0 |
% |
90.5 |
% |
$ |
72,362 |
|
|
Monticello Crossings |
|
Monticello, MN |
|
Multifamily |
|
3/1/17 |
|
202 |
|
82.7 |
% |
87.6 |
% |
|
30,516 |
|
|
|
|
|
|
|
|
|
|
|
|
|
|
|
|
$ |
102,878 |
|
|
(1) |
We are currently an approximately 52.6% partner in the joint venture entity constructing this project. The anticipated total cost amount given is the total cost to the joint venture entity. |
23
Definitions
April 30, 2017
Adjusted EBITDA is earnings before interest, taxes, depreciation, amortization, gain/loss on sale of real estate and other investments, impairment of real estate investments, gain/loss on extinguishment of debt and gain/loss from involuntary conversion. We consider Adjusted EBITDA to be an appropriate supplemental performance measure because it permits investors to view income from operations without the effect of depreciation, the cost of debt, or non-operating gains and losses. Adjusted EBITDA is a non-GAAP measure. Adjusted EBITDA as calculated by us is not comparable to Adjusted EBITDA reported by other REITs that do not define Adjusted EBITDA exactly as we do.
Adjusted funds from operations (AFFO) is calculated by subtracting from Funds from operations (FFO) (1) tenant improvements and leasing costs at same-store properties, and recurring capital expenditures that are capitalized and amortized and are necessary to maintain our properties and revenue stream and (2) straight line rents, then adding (3) non-real estate depreciation and amortization and (4) share-based compensation expense. We may also adjust FFO for certain unusual non-recurring items that are not representative of our ongoing operating performance. Our calculation subtracts from FFO leasing commissions and tenant improvements at same-store properties only, since we consider tenant improvement and leasing cost levels at non-same-store properties unrepresentative of expected levels at same-store properties. Non-same-store properties, which are composed primarily of recent acquisitions and developments/redevelopments, generally have leasing commission and tenant improvement activity that is contemplated prior to the acquisition or development/redevelopment and which we identify as necessary to bring the property to our operational standards. These costs are not comparable from period to period and are not typical of the normalized recurring activity at same-store properties which maintains the quality of the underlying assets and the revenue stream. The non-same-store leasing commissions and tenant improvements are not representative of our ongoing operating performance and accordingly are not factored into the calculation of AFFO on a consolidated basis. Previously-reported AFFO amounts are not revised for changes in the composition of the same-store properties pool. We believe AFFO is helpful in understanding our operating performance between periods in that it removes certain items that by their nature are not comparable over periods and therefore tend to obscure actual operating performance. AFFO measures the ability to control revenues, expenses and recurring capital expenditures. AFFO should not be considered as an alternative to net income as an indication of financial performance, or as an alternative to cash flows from operations as a measure of liquidity, nor is it indicative of funds available to fund our cash needs, including our ability to make distributions to shareholders. AFFO is a non-GAAP and non-standardized measure, and may be calculated differently by other REITs.
Debt to total market capitalization is total debt from the balance sheet divided by the sum of total debt from the balance sheet plus the market value of shares outstanding at the end of the period.
Debt service coverage ratio is computed by dividing Adjusted EBITDA by interest expense and principal amortization.
Funds from operations (FFO) - The National Association of Real Estate Investment Trusts, Inc. (NAREIT) defines FFO as “net income (computed in accordance with generally accepted accounting principles, excluding gains (or losses) from sales of property, plus real estate depreciation and amortization, and adjustments for unconsolidated partnerships and joint ventures. Adjustments for unconsolidated partnerships and joint ventures will be calculated to reflect funds from operations on the same basis.” In addition, in October 2011 NAREIT clarified its computation of FFO to exclude impairment charges for all periods presented. FFO is a non-GAAP measure. We consider FFO, which is a standard supplemental measure for equity real estate investment trusts, helpful to investors because it facilitates an understanding of the operating performance of properties without giving effect to impairment write-downs and to real estate depreciation and amortization, which assumes that the value of real estate assets diminishes predictably over time. Since real estate values instead historically rise or fall with market conditions, we believe that FFO provides investors and management with a more accurate indication of our financial and operating results.
Net Operating Income (NOI) is total real estate revenues less real estate expenses (which consist of utilities, maintenance, real estate taxes, insurance and property management expenses). We believe that NOI is an important supplemental measure of operating performance for a REIT’s operating real estate because it provides a measure of core operations that is unaffected by depreciation, amortization, financing and general and administrative expense. NOI does not represent cash generated by operating activities in accordance with GAAP and should not be considered an alternative to net income, net income available for common shareholders or cash flow from operating activities as a measure of financial performance.
Payout ratio (FFO per share and unit basis) - The ratio of the current quarterly or annual distribution rate per common share and unit divided by quarterly or annual FFO per share and unit.
Ratio of earnings to fixed charges - The ratio of earnings to fixed charges is computed by dividing earnings by fixed charges. For this purpose, earnings consist of income from continuing operations plus fixed charges and preferred distributions, less adjustments for
24
noncontrolling interests - consolidated real estate entities, capitalized interest and preferred distributions. Fixed charges consist of mortgage and loan interest expense, whether expensed or capitalized, the amortization of debt expense and capitalized interest.
Ratio of earnings to combined fixed charges and preferred distributions - The ratio of earnings to combined fixed charges and preferred distributions is computed by dividing earnings by combined fixed charges and preferred distributions. For this purpose, earnings consist of income from continuing operations plus fixed charges and preferred distributions, less adjustments for noncontrolling interests - consolidated real estate entities, capitalized interest and preferred distributions. Combined fixed charges and preferred distributions consist of fixed charges (mortgage and loan interest expense, whether expensed or capitalized, the amortization of debt expense and capitalized interest) and preferred distributions.
Recurring capital expenditures are expenditures (excluding capital expenditures recoverable from tenants and capital expenditures at properties sold during the period) made on a regular or recurring basis to maintain a property’s competitive position within its market, generally with a depreciable life of 5 to 12 years, but excluding (a) capital expenditures made in the year of acquisition and in subsequent periods until the property is classified as same-store (i.e., excluding capital expenditures on non-same-store properties), (b) improvements associated with the expansion or re-development of a building, (c) renovations to a building which change the underlying classification of the building (for example, from industrial to office or Class C office to Class A office) or (d) capital improvements that represent the addition of something new to a property, rather than the replacement of an existing item.
Scheduled rent revenue is the total possible revenue from all leasable units and square footage, with occupied space valued at contract rates pursuant to leases and vacant units or square footage at market rates.
Same-store properties are properties owned or in service for the entirety of the periods being compared (except for properties for which significant redevelopment or expansion occurred during either of the periods being compared, and properties sold or classified as held for sale), and, in the case of development or re-development properties, which have achieved a target level of occupancy of 90% for multifamily properties and 85% for office, healthcare, industrial and retail properties.
US GAAP – Accounting principles generally accepted in the United States of America.
25