Attached files
| file | filename |
|---|---|
| 8-K - FORM 8-K - SPIRIT REALTY CAPITAL, INC. | d408987d8k.htm |
Exhibit 99.1

SPIRIT
REALTY
NAREIT REITWEEK
New York, NY June 2017
Forward Looking Statements Statements contained in these slides and any accompanying oral presentation by Spirit Realty Capital, Inc. (“Spirit,” the “Company,” “we,” “us,” or “our”) that are not strictly historical are forward-looking statements within the meaning of the Private Securities Litigation Reform Act of 1995 and other federal securities laws. These forward-looking statements can be identified by the use of words such as “expects,” “plans,” “targets,” “estimates,” “projects,” “intends,” “believes,” “guidance,” and other similar expressions that do not relate to historical matters. These forward-looking statements are subject to known and unknown risks and uncertainties that can cause actual results to differ materially from those currently anticipated due to a number of factors which include, but are not limited to, Spirit’s continued ability to source new investments, risks associated with using debt and equity financing to fund Spirit’s business activities (including refinancing and interest rate risks, changes in interest rates and/or credit spreads, changes in the price of our common stock, conditions of the debt and equity capital markets generally, and changes in the real estate markets), unknown liabilities acquired in connection with acquired properties, portfolios of properties or interests in real-estate related entities, general risks affecting the real estate industry and local real estate markets (including, without limitation, the market value of our properties, the inability to enter into or renew leases at favorable rates, portfolio occupancy varying from our expectations, dependence on our tenants’ financial condition and operating performance (particularly our main tenant, Shopko), and competition from other developers, owners and operators of real estate), potential fluctuations in the consumer price index, risks associated with our failure to maintain our status as a real estate investment trust (“REIT”) under the Internal Revenue Code of 1986, as amended, and additional risks discussed in Spirit’s most recent filings with the Securities and Exchange Commission from time to time, including Spirit’s Annual Report on Form 10-K for the year ended December 31, 2016. Spirit expressly disclaims any responsibility to update or revise forward-looking statements, whether as a result of new information, future events or otherwise, except as required by law. 2
Investment Highlights
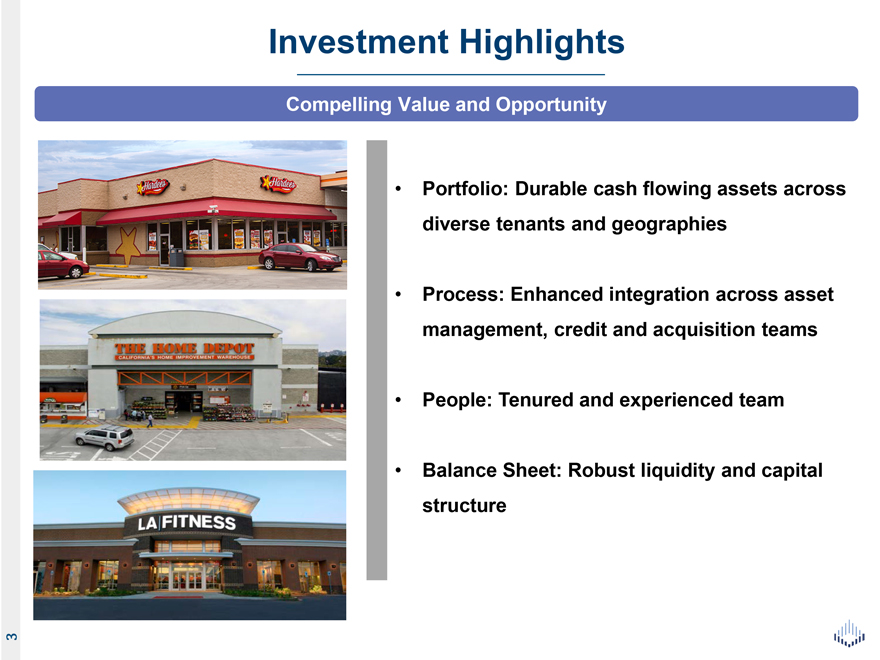
Compelling Value and Opportunity
• Portfolio: Durable cash flowing
assets across diverse tenants and geographies
• Process: Enhanced integration across asset management, credit and acquisition teams
• People: Tenured and experienced team
• Balance Sheet: Robust liquidity and capital
structure 3
Broad, Diverse Portfolio of Assets
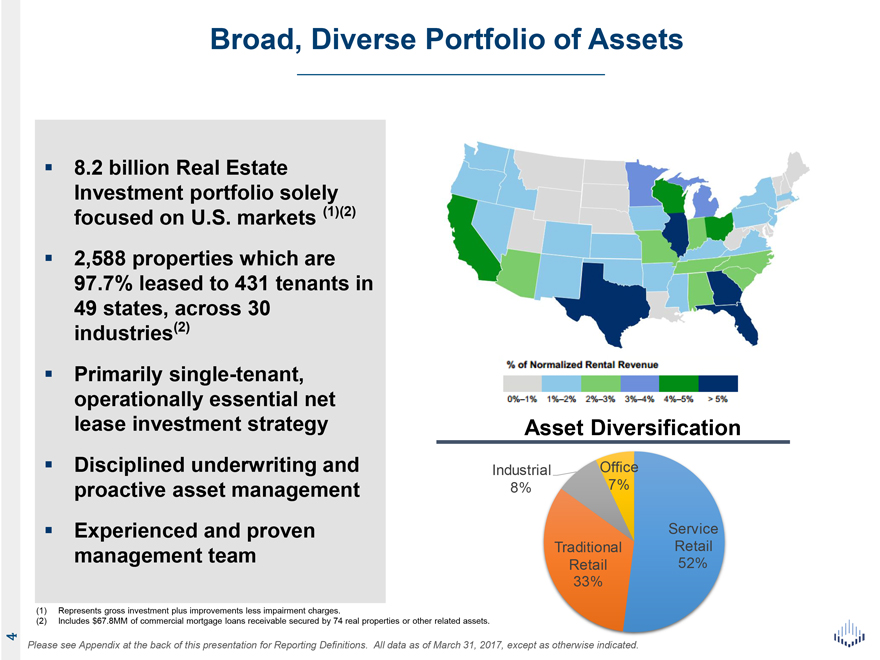
8.2 billion Real Estate Investment portfolio solely focused on U.S. markets (1)(2) 2,588 properties which are 97.7% leased to 431 tenants in 49 states, across 30 industries(2)
Primarily single-tenant, operationally essential net lease investment strategy Asset Diversification Disciplined underwriting and Industrial Office proactive asset management 8% 7% Experienced and proven Service
management team Traditional Retail Retail 52% 33%
(1) Represents gross investment plus
improvements less impairment charges.
(2) Includes $67.8MM of commercial mortgage loans receivable secured by 74 real properties or other related assets.
Please see Appendix at the back of this presentation for Reporting Definitions. All data as of March 31, 2017, except as otherwise indicated. 4
Portfolio Diversification
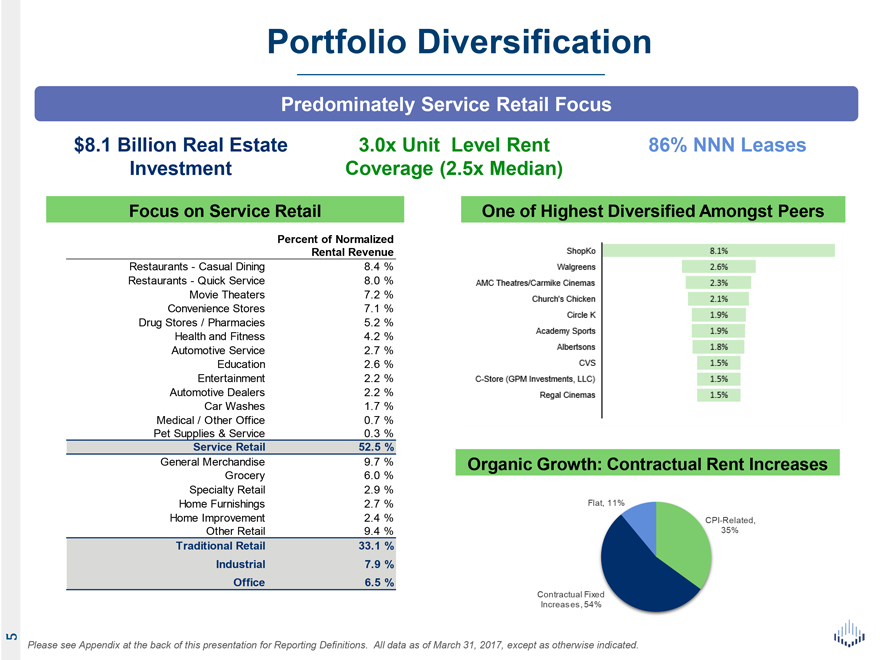
Predominately Service Retail Focus $8.1 Billion Real Estate 3.0x Unit Level Rent 86% NNN Leases Investment Coverage (2.5x Median)
Focus on Service Retail One of Highest Diversified Amongst Peers
Percent of Normalized Rental
Revenue
Restaurants—Casual Dining 8.4 % Restaurants—Quick Service 8.0 % Movie Theaters 7.2 % Convenience Stores 7.1 % Drug Stores /
Pharmacies 5.2 % Health and Fitness 4.2 % Automotive Service 2.7 % Education 2.6 % Entertainment 2.2 % Automotive Dealers 2.2 % Car Washes 1.7 % Medical / Other Office 0.7 % Pet Supplies & Service
0.3 %
Service Retail 52.5 %
General Merchandise 9.7 % Organic
Growth: Contractual Rent Increases
Grocery 6.0 % Specialty Retail 2.9 %
Home Furnishings 2.7 % Flat, 11%
Home Improvement 2.4 % CPI-Related, Other Retail 9.4 % 35%
Traditional Retail 33.1 % Industrial 7.9 % Office 6.5 %
Contractual Fixed Increases, 54%
Please see Appendix at the back of this presentation for
Reporting Definitions. All data as of March 31, 2017, except as otherwise indicated. 5
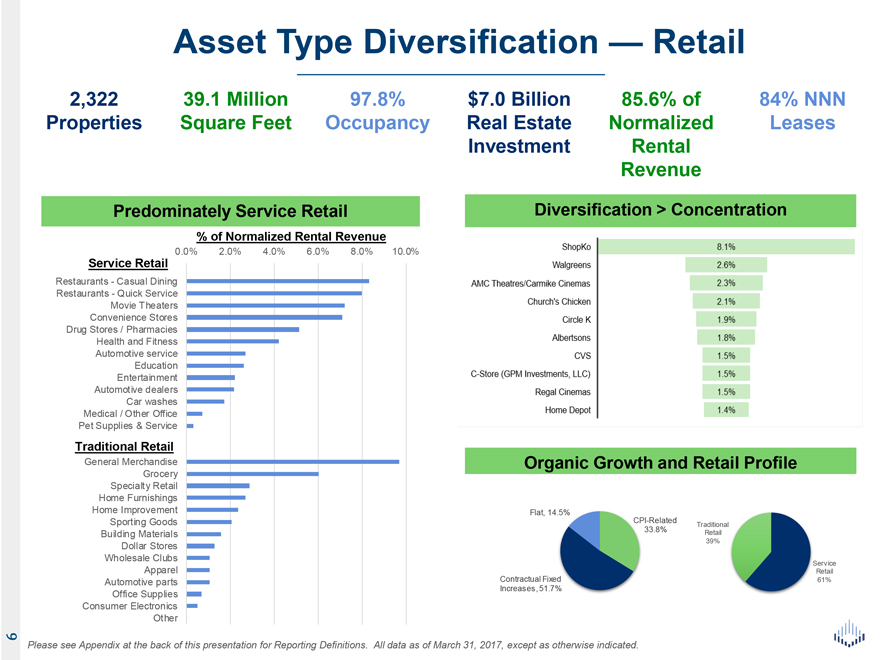
Asset Type Diversification — Retail
2,322 39.1 Million 97.8% $7.0 Billion 85.6% of 84% NNN Properties Square Feet Occupancy Real Estate Normalized Leases Investment Rental Revenue
Predominately Service Retail Diversification > Concentration
% of Normalized Rental Revenue
Service Retail 0.0% 2.0% 4.0% 6.0% 8.0% 10.0% Restaurants—Casual Dining Restaurants—Quick Service Movie Theaters Convenience Stores Drug Stores / Pharmacies Health and Fitness Automotive service Education Entertainment Automotive dealers
Car washes Medical / Other Office Pet Supplies & Service
Traditional Retail
General Merchandise Organic Growth and Retail Profile
Grocery Specialty Retail Home
Furnishings
Home Improvement Flat, 14.5%
Sporting Goods CPI-Related
Traditional
Building Materials
33.8% Retail Dollar Stores 39% Wholesale Clubs
Service
Apparel Contractual
Fixed Retail
Automotive parts 61%
Increases, 51.7%
Office Supplies Consumer Electronics Other
Please see Appendix at the back of this
presentation for Reporting Definitions. All data as of March 31, 2017, except as otherwise indicated. 6
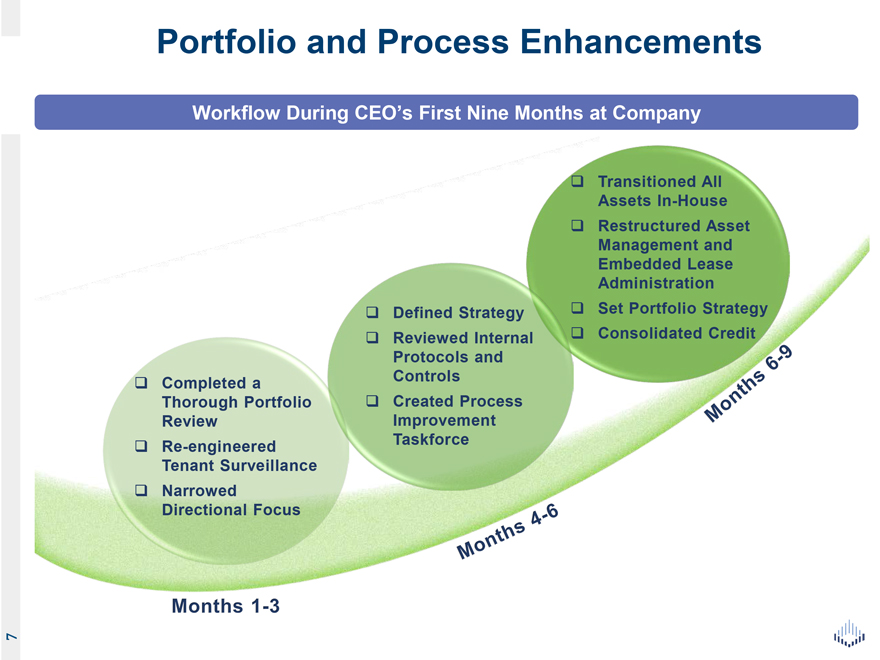
Portfolio and Process Enhancements
Workflow During CEO’s First Nine Months at Company
Transitioned All Assets In-House
Restructured Asset Management and Embedded Lease Administration Defined Strategy Set Portfolio Strategy Reviewed Internal Consolidated Credit Protocols and Completed a Controls Thorough
Portfolio Created Process Review Improvement Re-engineered Taskforce Tenant Surveillance Narrowed Directional Focus 7
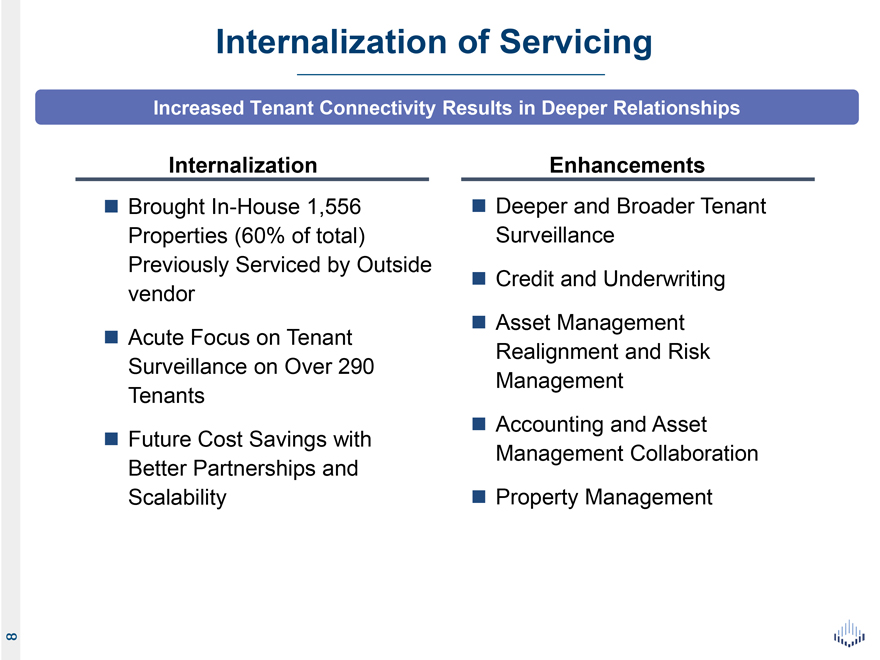
Internalization of Servicing
Increased Tenant Connectivity Results in Deeper Relationships
Internalization Enhancements
Brought In-House 1,556 Deeper and Broader Tenant Properties (60% of total) Surveillance Previously
Serviced by Outside Credit and Underwriting vendor Asset Management Acute Focus on Tenant Realignment and Risk Surveillance on Over 290 Management Tenants Accounting and
Asset Future Cost Savings with Management Collaboration Better Partnerships and Scalability Property Management 8
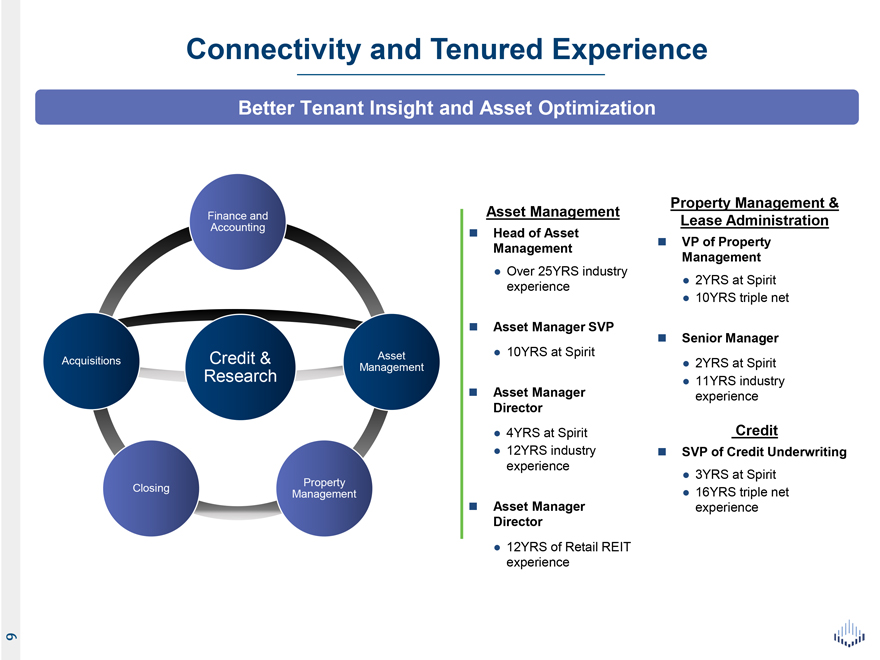
Connectivity and Tenured Experience
Better Tenant Insight and Asset Optimization
Property Management & Finance and Asset
Management Accounting Lease Administration
Head of Asset
Management VP of
Property
• Over 25YRS industry Management experience • 2YRS at Spirit
• 10YRS triple net
? Asset Manager SVP?
• 10YRS at Spirit Senior Manager
Acquisitions Credit & Asset
Management • 2YRS at Spirit Research • 11YRS industry
Asset Manager experience
Director
• 4YRS at Spirit Credit
• 12YRS
industry SVP of Credit Underwriting experience
• 3YRS at Spirit
Closing Property
Management • 16YRS triple net
Asset Manager experience Director
• 12YRS of Retail REIT experience 9
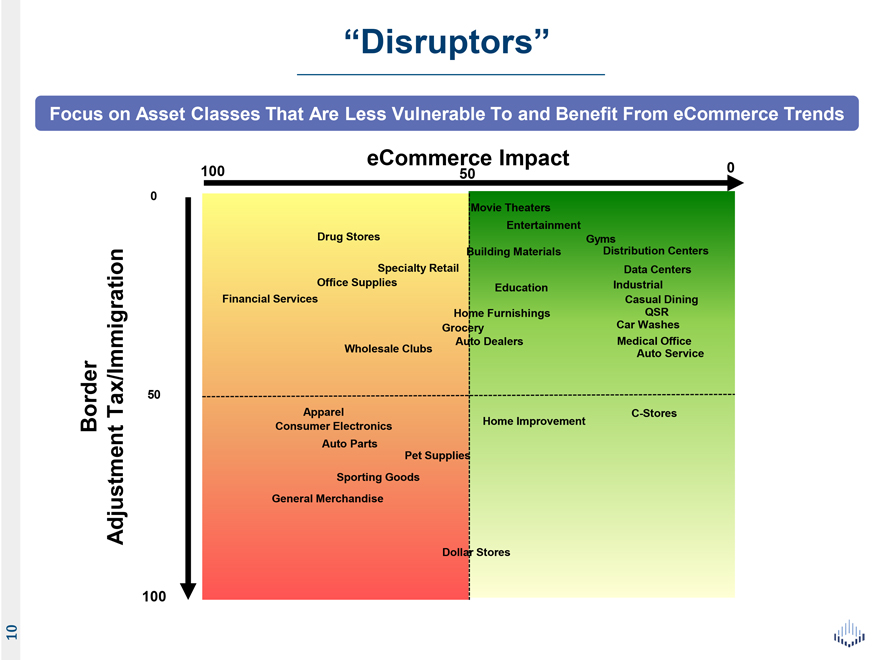
“Disruptors”
Focus on Asset Classes That Are Less Vulnerable To and Benefit From eCommerce Trends
eCommerce Impact 0
100 50
0 Movie Theaters Drug Stores Entertainment
Gyms Distribution Centers Building Materials
Specialty Retail Data Centers Office Supplies Education Industrial Financial Services Casual Dining Home Furnishings QSR
Grocery Car Washes Auto Dealers Medical
Office Wholesale Clubs Auto Service
50
Tax/Immigration Apparel C-Stores
Border Consumer Electronics Home Improvement Auto Parts Pet Supplies Sporting Goods Adjustment General Merchandise
Dollar Stores
100 10
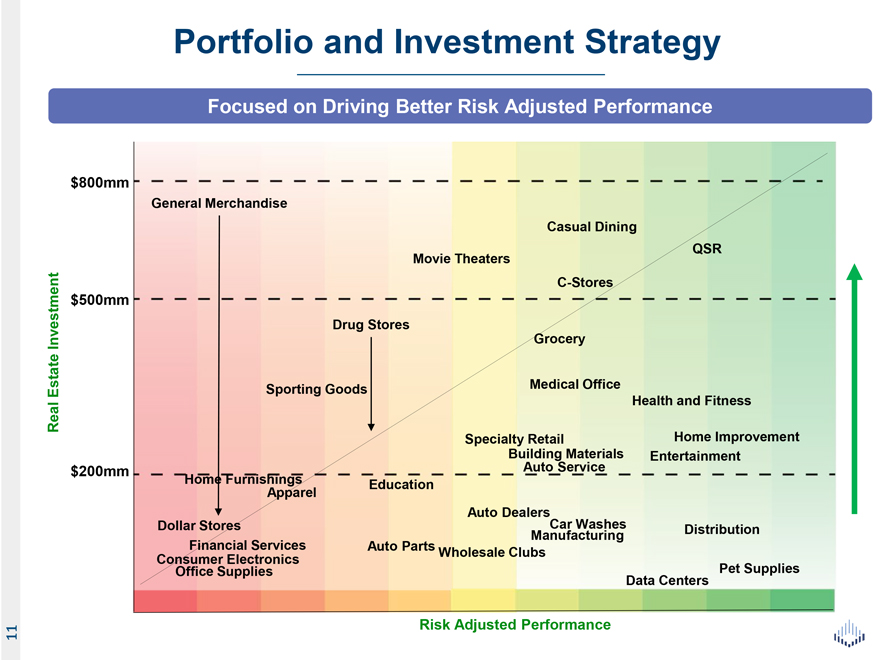
Portfolio and Investment Strategy
Focused on Driving Better Risk Adjusted Performance
$800mm
General Merchandise
Casual Dining
QSR Movie Theaters C-Stores $500mm Investment Drug Stores Grocery Estate Sporting Goods Medical Office Real Health and Fitness Specialty
Retail Home Improvement Building Materials Entertainment $200mm Auto Service Home Furnishings Education Apparel Auto Dealers Dollar Stores Car Washes Distribution Manufacturing Consumer Financial Electronics Services Auto Parts Wholesale Clubs
Office Supplies Pet Supplies Data Centers
Risk Adjusted Performance 11
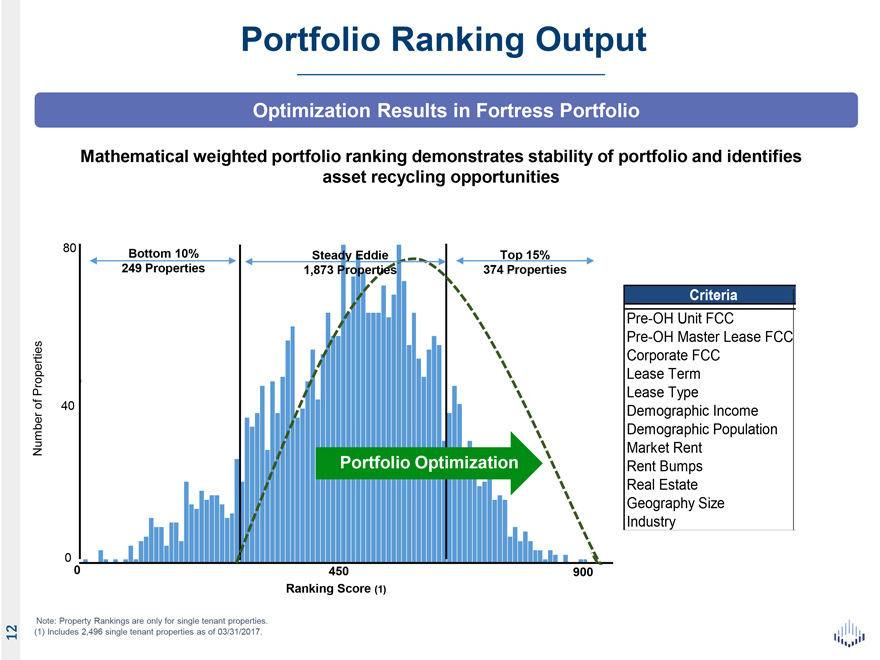
Portfolio Ranking Output
Optimization Results in Fortress Portfolio
Mathematical weighted portfolio
ranking demonstrates stability of portfolio and identifies asset recycling opportunities
80 Bottom 10%
249 Properties Steady Eddie Top 15% 1,873 Properties 374 Properties
Criteria
Pre-OH Unit FCC Pre-OH Master Lease FCC Corporate FCC
Properties Lease Term
Lease Type
of 40
Demographic Income Demographic Population Number Market Rent
Portfolio Optimization Rent Bumps Real Estate Geography Size Industry
0
0 450 900 Ranking Score (1)
Note: Property Rankings are only for single tenant properties.
(1) Includes 2,496 single tenant properties as of 03/31/2017. 12
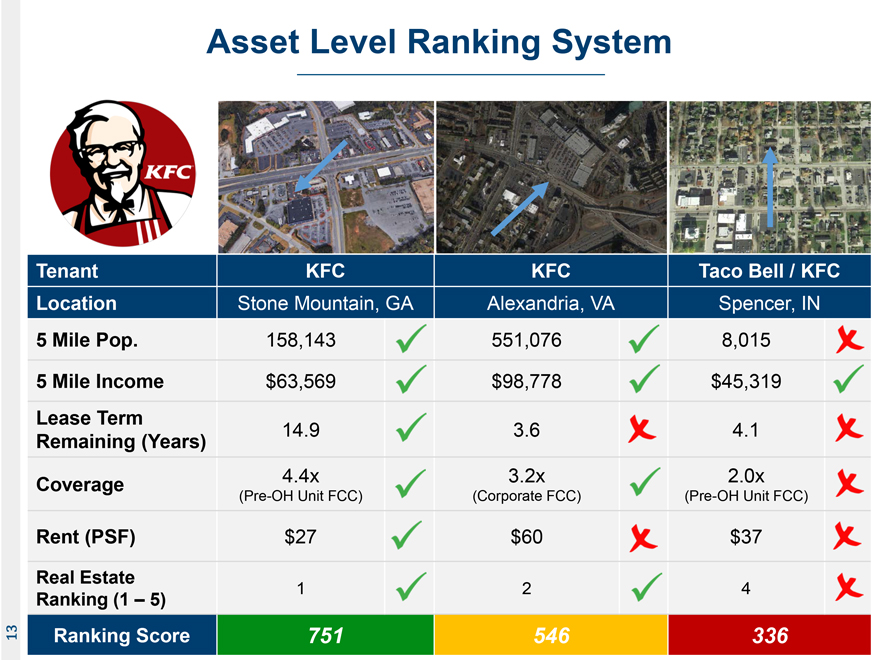
Asset Level Ranking System
Tenant KFC KFC Taco Bell / KFC Location Stone Mountain, GA Alexandria, VA Spencer, IN
5 Mile Pop. 158,143 551,076 8,015
5 Mile Income $63,569 $98,778 $45,319
Lease Term
14.9 3.6 4.1
Remaining (Years)
Coverage 4.4x 3.2x 2.0x
(Pre-OH Unit FCC) (Corporate FCC) (Pre-OH Unit FCC)
Rent (PSF) $27 $60 $37
Real Estate
1 2 4
Ranking (1 – 5)
Ranking Score 751 546 336 13
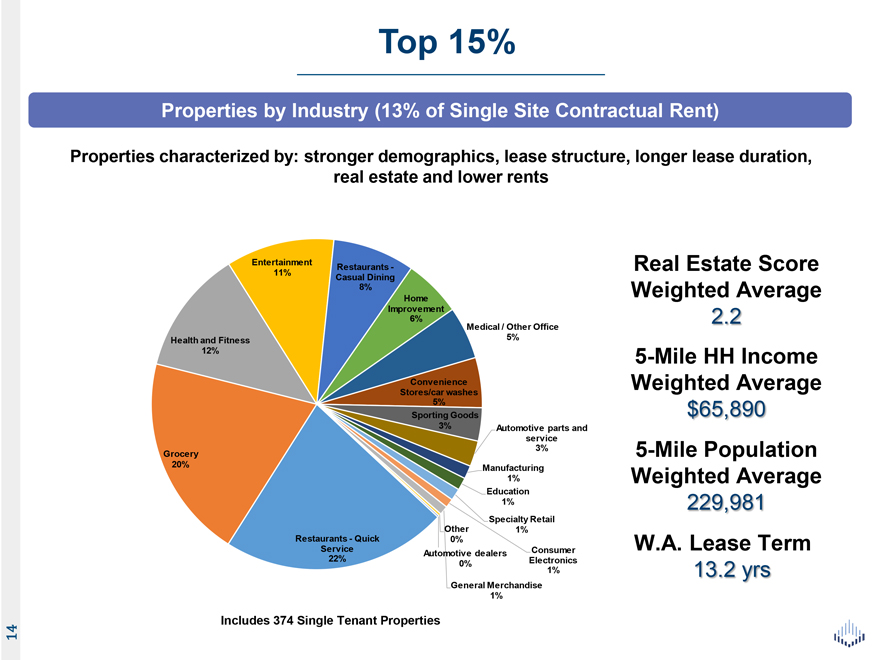
Top 15%
Properties by
Industry (13% of Single Site Contractual Rent)
Properties characterized by: stronger demographics, lease structure, longer lease duration, real estate and lower
rents
Entertainment
Restaurants—Real Estate Score
11%
Casual 8% Dining Weighted Average Home Improvement 6% 2.2 Medical / Other Office Health
and Fitness 5%
12% 5-Mile HH Income Convenience Weighted Average
Stores/car 5% washes
Sporting Goods 65,890
3% Automotive parts and
service 3% 5-Mile Population
Grocery
20% Manufacturing
1% Weighted Average
Education
1% 229,981
Other Specialty Retail
Restaurants—Quick 0% 1% W.A. Lease Term Service 22% Automotive dealers Consumer
0%
Electronics 1% 13. yrs General Merchandise 1%
Includes 374 Single Tenant Properties 14
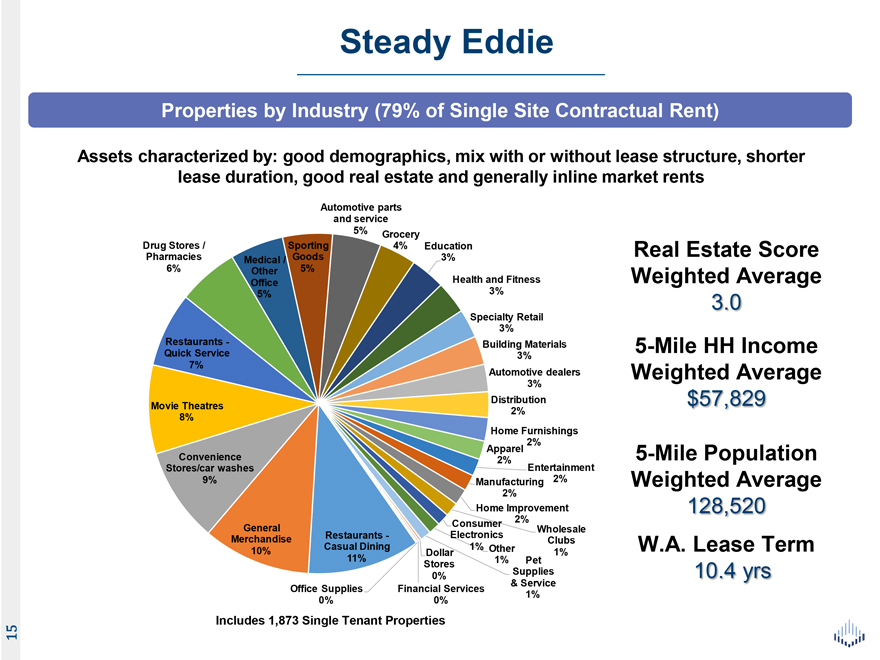
Steady Eddie
Properties
by Industry (79% of Single Site Contractual Rent)
Assets characterized by: good demographics, mix with or without lease structure, shorter lease duration, good
real estate and generally inline market rents
Automotive parts and service
5%
Grocery
Drug Stores / Sporting 4% Education Real Estate Score Pharmacies Medical / Goods 3%
6% Other 5%
Office Health and Fitness Weighted Average
5% 3% 3.0 Specialty Retail 3%
Restaurants—Building Materials 5-Mile HH Income Quick Service 3% 7% Automotive dealers Weighted Average 3% Distribution 57,829 Movie Theatres 2% 8% Home Furnishings 2% Apparel Convenience 2% Entertainment
5-Mile Population Stores/car washes 2%
9% Manufacturing Weighted Average 2% Home Improvement 128,520 Consumer 2% General
Wholesale Merchandise Restaurants—Electronics Clubs 10% Casual Dining 1% Other W.A. Lease Term Dollar 1% 11% 1% Pet Stores
0% Supplies 10. yrs
& Service Office Supplies Financial Services 1%
0% 0%
Includes 1,873 Single Tenant Properties 15
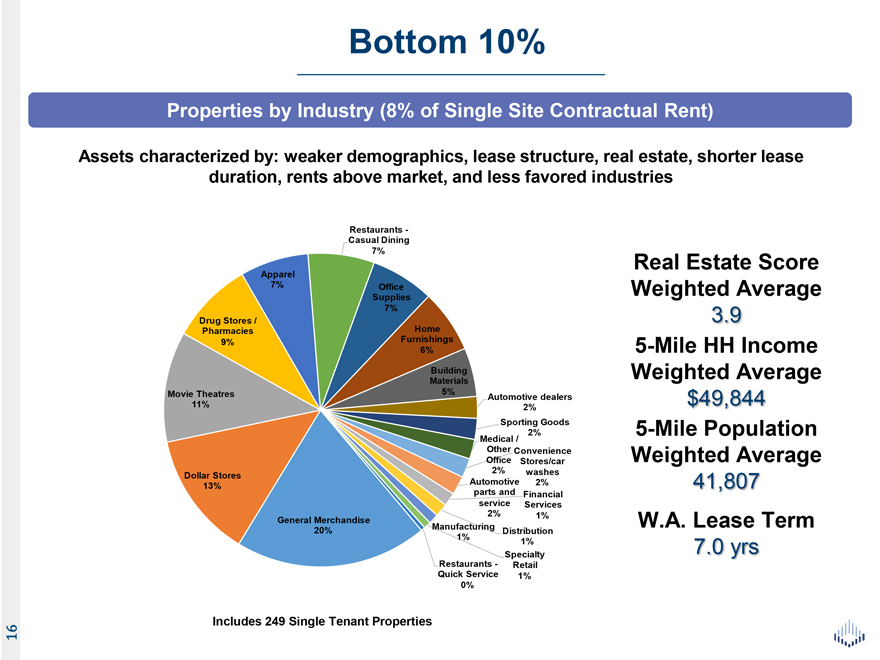
Bottom 10%
Properties by
Industry (8% of Single Site Contractual Rent)
Assets characterized by: weaker demographics, lease structure, real estate, shorter lease duration, rents above
market, and less favored industries
Restaurants -Casual Dining
7% Real Estate
Score
Apparel
7% Office Weighted Average
Supplies
7% 3.9
Drug Stores /
Pharmacies Home
9% Furnishings 5-Mile HH Income
6%
Building Weighted Average
Materials Movie Theatres 5%
Automotive dealers $49,844 11% 2% Sporting Goods
2%
5-Mile Population
Medical /
Other
Convenience Weighted Average Office Stores/car 2% washes Dollar Stores 13% Automotive 2% 41,807 parts and Financial service Services
2% 1%
General Merchandise W.A. Lease Term 20% Manufacturing Distribution
1% 1% 7. yrs
Restaurants—Specialty Quick Service Retail
0% 1%
Includes 249 Single Tenant Properties 16
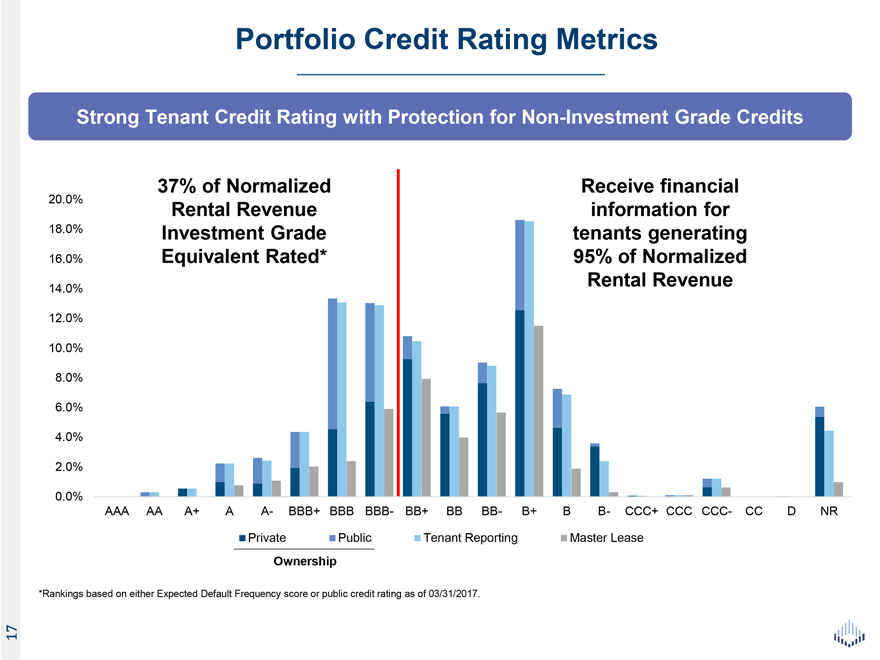
Portfolio Credit Rating Metrics
Strong Tenant Credit Rating with Protection for Non-Investment Grade Credits
37% of Normalized Receive financial 20.0% Rental Revenue information for 18.0% Investment Grade tenants generating 16.0% Equivalent Rated* 95% of Normalized 14.0% Rental Revenue
12.0% 10.0% 8.0% 6.0% 4.0% 2.0%
0.0%
AAA AA A+ A A- BBB+ BBB BBB- BB+ BB BB- B+ B B- CCC+ CCC CCC- CC D NR Private Public Tenant Reporting Master Lease
Ownership
*Rankings based on either Expected Default Frequency score or public credit rating
as of 03/31/2017. 17
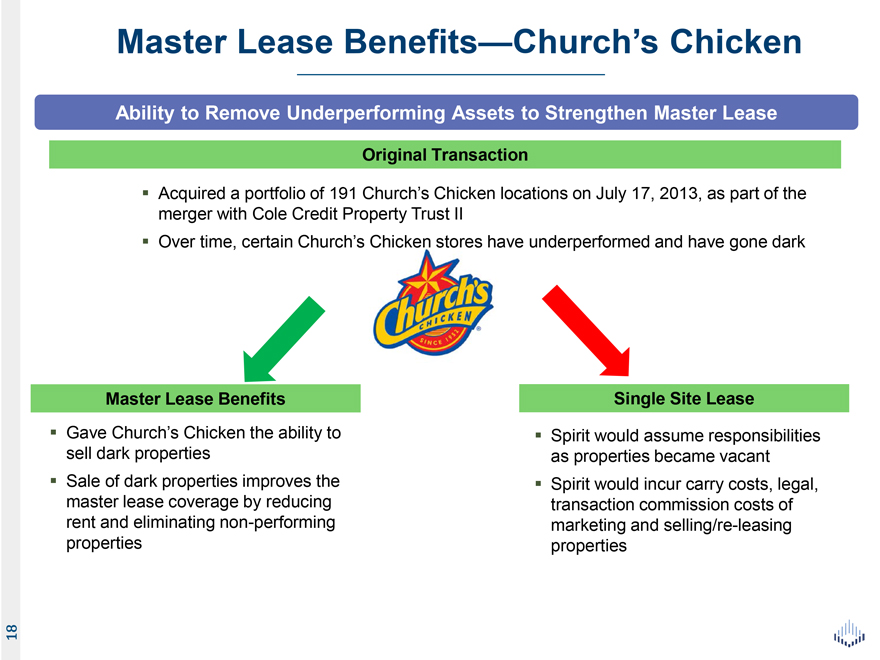
Master Lease Benefits—Church’s Chicken
Ability to Remove Underperforming Assets to Strengthen Master Lease
Original Transaction
Acquired a portfolio of 191 Church’s Chicken locations on July 17, 2013, as part of the merger with Cole Credit Property Trust II
Over time, certain Church’s Chicken stores have underperformed and have gone dark
Master
Lease Benefits Single Site Lease
Gave Church’s Chicken the ability to Spirit would assume responsibilities sell dark properties as
properties became vacant Sale of dark properties improves the Spirit would incur carry costs, legal, master lease coverage by reducing transaction commission costs of rent and eliminating
non-performing marketing and selling/re-leasing properties properties 18
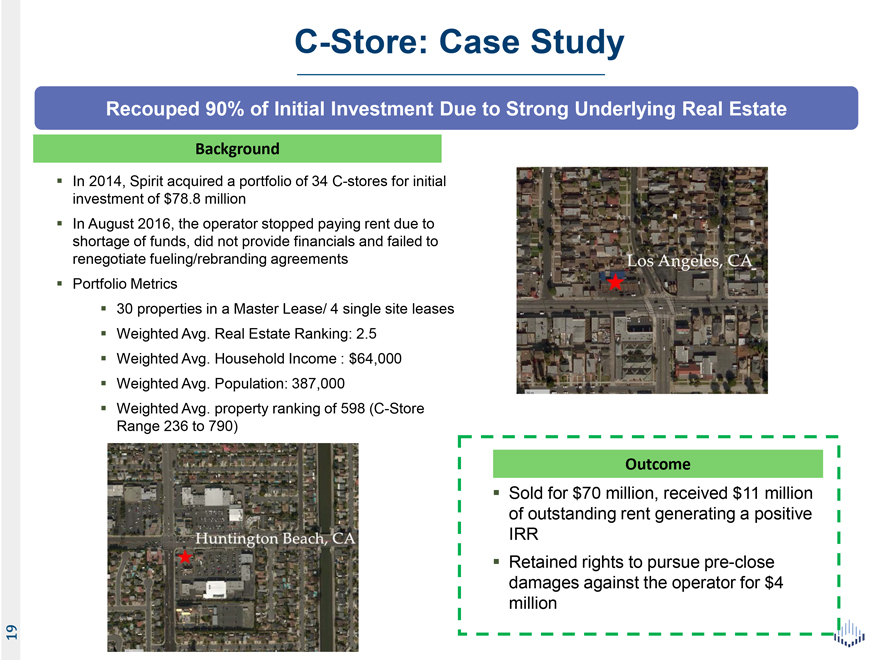
C-Store: Case Study
Recouped 90% of Initial Investment Due to Strong Underlying Real Estate
Background
In 2014, Spirit acquired a portfolio of 34 C-stores for initial investment of $78.8 million In August 2016, the operator stopped paying
rent due to shortage of funds, did not provide financials and failed to renegotiate fueling/rebranding agreements Portfolio Metrics 30 properties in a Master Lease/ 4 single site leases Weighted Avg. Real Estate Ranking: 2.5 Weighted Avg. Household
Income : $64,000 Weighted Avg. Population: 387,000 Weighted Avg. property ranking of 598 (C-Store Range 236 to 790)
Outcome
Sold for $70 million, received $11 million of outstanding rent generating a positive IRR
Retained rights to pursue pre-close damages against the operator for $4 million 19
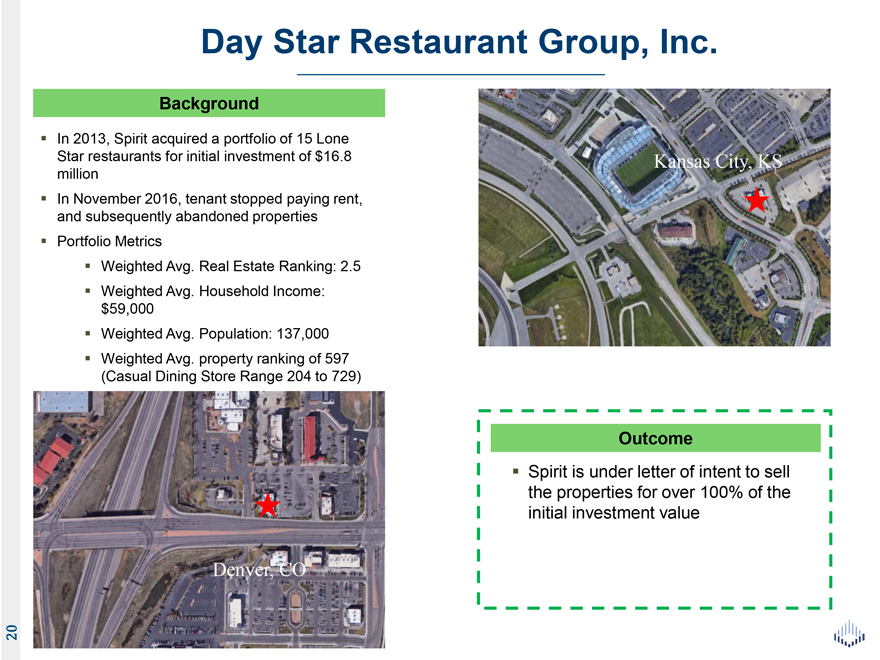
Day Star Restaurant Group, Inc.
Background
In 2013, Spirit acquired a portfolio of 15 Lone
Star restaurants for initial investment of $16.8 Kansas City, KS million In November 2016, tenant stopped paying rent, and subsequently abandoned properties Portfolio Metrics
Weighted Avg. Real Estate Ranking: 2.5 Weighted Avg. Household Income: $59,000 Weighted Avg. Population: 137,000 Weighted Avg. property ranking of 597 (Casual Dining Store Range 204 to 729)
Outcome
Spirit is under letter of intent to sell the properties for over 100% of the initial
investment value
Denver, CO 20
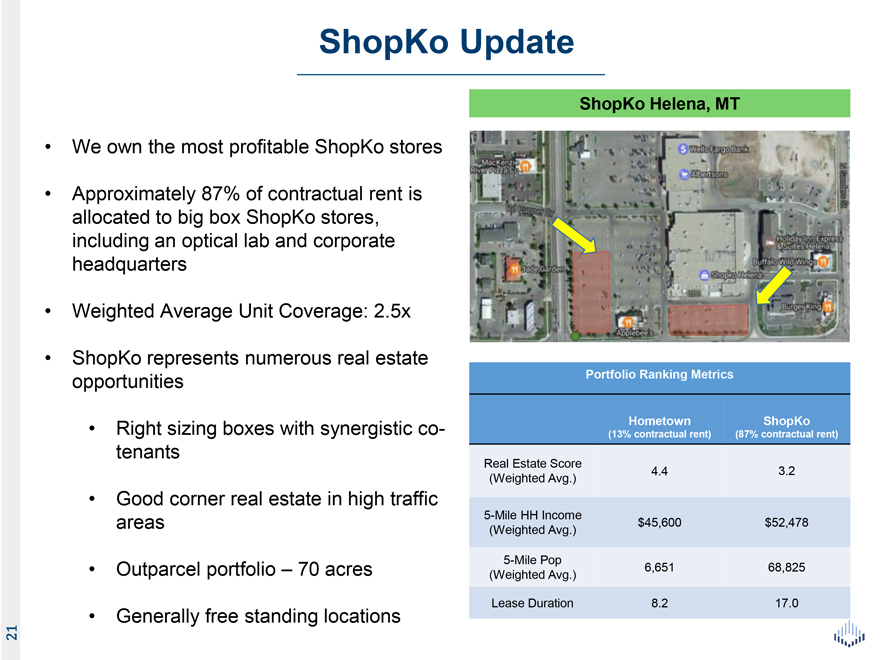
ShopKo Update
ShopKo
Helena, MT
• We own the most profitable ShopKo stores
•
Approximately 87% of contractual rent is allocated to big box ShopKo stores, including an optical lab and corporate headquarters
• Weighted Average Unit
Coverage: 2.5x
• ShopKo represents numerous real estate
opportunities
Portfolio Ranking Metrics
• Right sizing boxes with synergistic co- Hometown ShopKo
(13% contractual rent) (87% contractual rent)
tenants
Real Estate Score
4.4 3.2 (Weighted Avg.)
• Good corner real estate in high traffic
5-Mile
HH Income areas $45,600 $52,478 (Weighted Avg.)
5-Mile Pop
• Outparcel portfolio – 70 acres 6,651 68,825
(Weighted Avg.)
Lease Duration 8.2 17.0
• Generally free standing locations 21
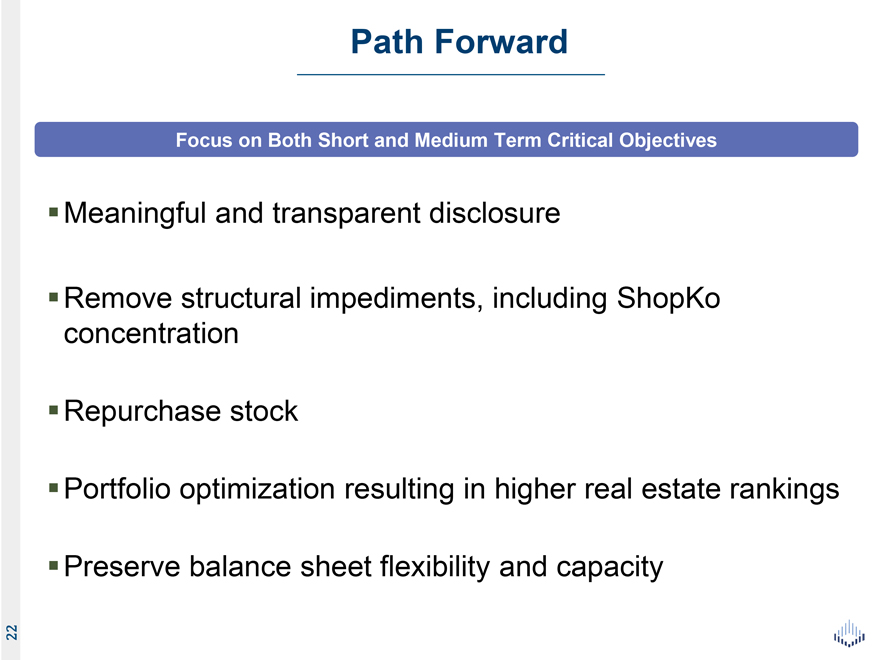
Path Forward
Focus on
Both Short and Medium Term Critical Objectives
Meaningful and transparent disclosure
Remove structural impediments, including ShopKo concentration
Repurchase stock
Portfolio optimization resulting in higher real estate rankings
Preserve balance sheet
flexibility and capacity 22
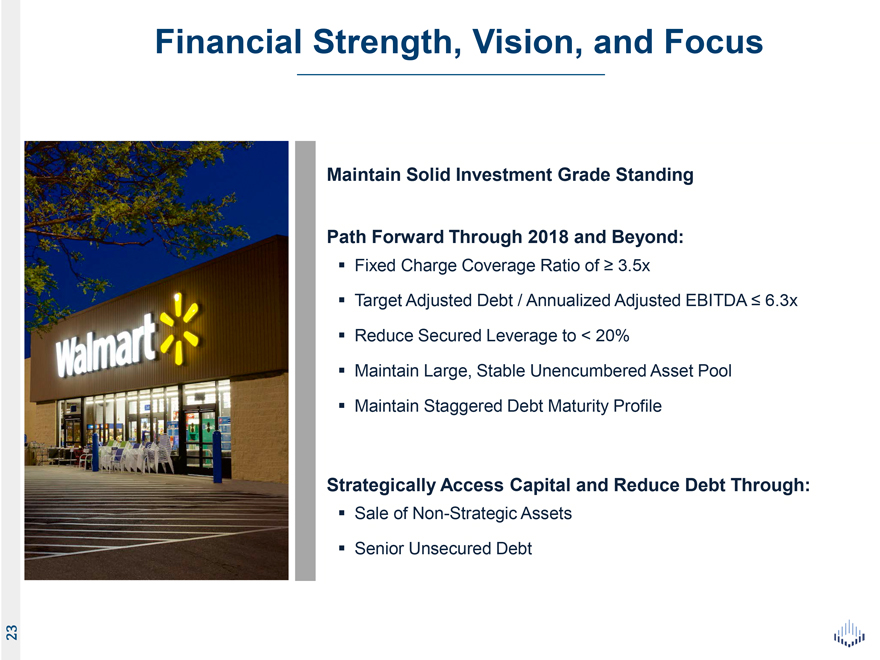
Financial Strength, Vision, and Focus
Maintain Solid Investment Grade Standing
Path Forward Through 2018 and Beyond:
Fixed Charge Coverage Ratio of ³ 3.5x
Target
Adjusted Debt / Annualized Adjusted EBITDA £ 6.3x
Reduce Secured Leverage to < 20%
Maintain Large, Stable Unencumbered Asset Pool Maintain Staggered Debt Maturity Profile
Strategically Access Capital and Reduce Debt Through:
Sale of Non-Strategic Assets Senior Unsecured Debt 23
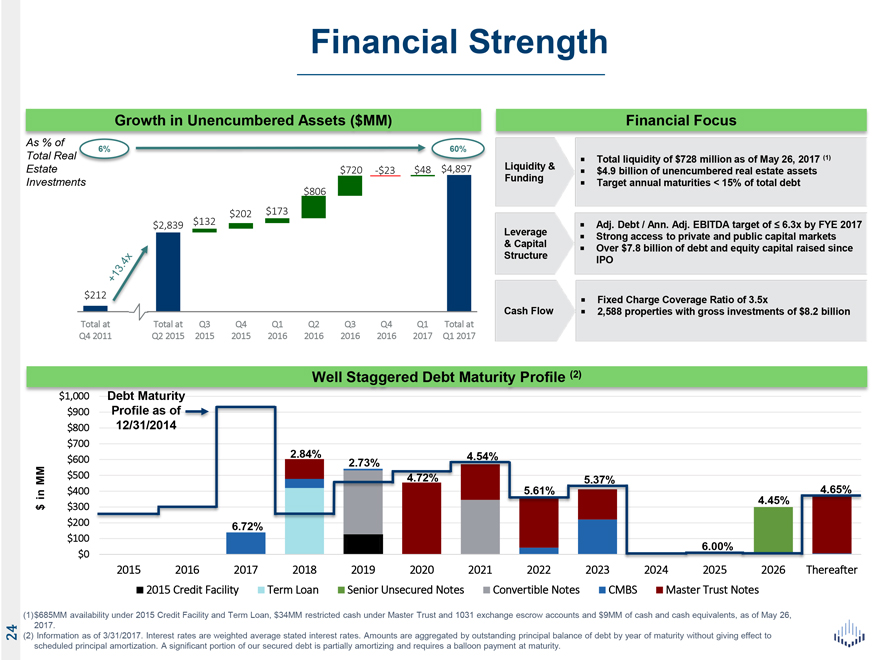
Financial Strength
Growth
in Unencumbered Assets ($MM) Financial Focus
As % of
6% 60%
Total Real Liquidity & ? Total liquidity of $728 million as of May 26, 2017 (1) Estate $720 -$23 $48 $4,897 $4.9 billion of unencumbered real estate assets
Investments Funding Target annual < 15% of maturities total debt $806 $132 $202 $173 $2,839 Adj. Debt / Ann. Adj. EBITDA target of £ 6.3x by FYE 2017 Leverage Strong access to
private and public capital markets
& Capital Over $7.8 billion of debt and equity capital raised since
Structure IPO
$212 Fixed Coverage Ratio of 3.5x Charge
Cash Flow 2,588 properties with gross investments of $8.2 billion
Total at Total at Q3 Q4
Q1 Q2 Q3 Q4 Q1 Total at Q4 2011 Q2 2015 2015 2015 2016 2016 2016 2016 2017 Q1 2017
Well Staggered Debt Maturity Profile (2)
Debt Maturity $900 Profile as of $800 12/31/2014 $700 $600 2.84% 4.54% 2.73%
MM $500 5.37% in
$400 5.61% 4.65% $300 4.45% $ $200 6.72% $100
6.00% $0
2015 2016 2017 2018
2019 2020 2021 2022 2023 2024 2025 2026 Thereafter 2015 Credit Facility Term Loan Senior Unsecured Notes Convertible Notes CMBS Master Trust Notes
(1)$685MM
availability under 2015 Credit Facility and Term Loan, $34MM restricted cash under Master Trust and 1031 exchange escrow accounts and $9MM of cash and cash equivalents, as of May 26, 2017.
(2) Information as of 3/31/2017. Interest rates are weighted average stated interest rates. Amounts are aggregated by outstanding principal balance of debt by year of maturity
without giving effect to scheduled principal amortization. A significant portion of our secured debt is partially amortizing and requires a balloon payment at maturity. 24
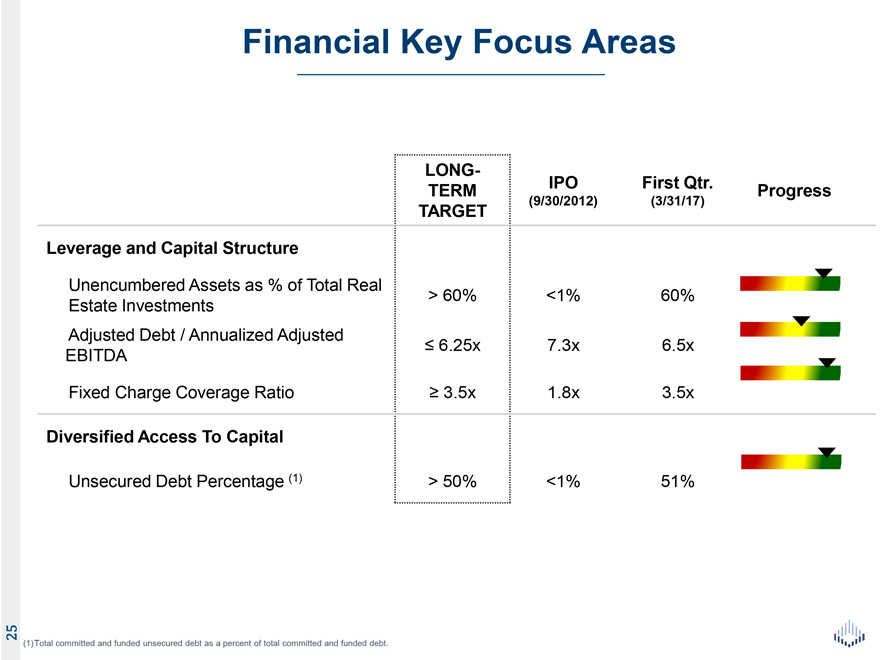
Financial Key Focus Areas
LONG-
TERM IPO First Qtr. Progress
(9/30/2012) (3/31/17)
TARGET Leverage and Capital Structure
Unencumbered Assets as % of Total Real
> 60% <1% 60% Estate Investments Adjusted Debt /
Annualized Adjusted £ 6.25x 7.3x 6.5x __EBITDA
Fixed Charge Coverage Ratio
³ 3.5x 1.8x 3.5x
Diversified Access To Capital
Unsecured Debt Percentage (1) > 50% <1% 51%
(1)Total committed and funded unsecured debt
as a percent of total committed and funded debt. 25

Investment Highlights
Compelling Value and Opportunity
• Portfolio: Durable cash flowing
assets across diverse tenants and geographies
• Process: Enhanced integration across asset management, credit and acquisition teams
• People: Tenured and experienced team
• Balance Sheet: Robust liquidity and capital
structure 26

SPIRIT
REALTY Appendix
Reporting Definitions
Adjusted EBITDA represents EBITDA, or earnings before interest, taxes, depreciation and amortization, modified to include other adjustments to GAAP net income
(loss) attributable to common stockholders for real estate acquisition costs, impairment losses, gains.1 losses from the sale of real estate and debt transactions and other items that we do not consider to be indicative of our on-going operating
performance. We focus our business plans to enable us to sustain increasing shareholder value. Accordingly, we believe that excluding these items, which are not key drivers of our investment dectsons and may cause short-term fluctuations in net
income, prov ides a useful supplemental measure to investors and analysts in assessing the net earnings contribution of our real estate portfolio. Because these measures do not represent net income (loss) that is computed in accordance with GAAP,
they should not be considered alternatives to net income {loss} or as an indicator of financial performance. A reconciliation of net income (loss) attributable to common stockholders {computed in accordance with GAAP) to EBITDA and Adjusted EBITDA
is included in the Appendix found at the end of this presentation.
Annualized Adjusted EBITDA ts calculated by multiplying Adjusted EBITDA of a quarter by four.
Our computation of Adjusted EBITDA and Annualized Adjusted EBITDA may differ from the methodology used by other equity REITs to calculate these measures and, therefore, may not be comparable to such other REITs. A reconciliation of Annualized
Adjusted EBITDA is included in the Appendix found at the end of this presentation.
Adjusted Debt represents interest bearing debt {reported in accordance with
GAAP) adjusted to exclude unamortized debt discount*’premium, deferred financing costs, cash and cash equivalents and cash reserves on deposit with lenders as additional security. By excluding these amounts, the result prov ides an estimate of
the contractual amount of borrowed capital to be repad, net of cash available to repay it. We believe this calculation constitutes a beneficial supplemental non-GAAP financial disclosure to investors in understanding our financial condrtion. A
reconciliation of interest beanng debt {reported in accordance with GAAP) to Adjusted Debt is included in the Appendix found at the end of this presentation.
Adjusted Debt to Annualized Adjusted EBITDA is a
supplemental non-GAAP
financial measure we use to evaluate the level of borrowed capital being used to increase the potential return of our real estate investments and a proxy for a measure we believe is used by many lenders and ratings agencies to evaluate our ability
to repay and serv ice our debt obligations over time. We believe this ratio is a beneficial disclosure to investors as a supplemental means of evaluating our ability to meet obligations senior to those of our equity holders. Our computation of this
ratio may differ from the methodology used by other equity REITs and, therefore, may not be comparable to such other REITs. ‘
CMBS are those notes secured by
commercial real estate and rents therefrom under which certain indirect wholly-owned special purpose entity subsidiaries of the Company are the borrowers.
These
liabilities are discussed in greater detail in our financial statements and the notes thereto included in our periodic reports filed with the SEC.
Fixed Charge
Coverage Ratio (FCCR) is the ratio of Annualized Adjusted EBITDA to Annualized Fixed Charges, a ratio derived from non-GAAP measures that we use to evaluate our liquidity and ability to obtain financing. Fixed charges consist of interest expense,
reported in accordance with GAAP, less non-cash interest expense. Annualized Fixed Charges is calculated by multiplying fixed charges for the quarter by four.
GAAP
are the Generally Accepted Accounting Principles in the United States.
Gross Investment represents the gross acquisition cost including the contracted purchase
price and related capitalized transaction costs.
Master Trust Notes are net-lease mortgage notes issued under the Spirit Master Funding Program and the
securitization trusts established thereunder. Indirect special purpose entity subsidiaries of the Company are the borrowers. These liabilities are discussed in greater detail in our financial statements and the notes thereto included in our periodic
reports filed with the SEC.
Normalized Rental Revenue Represents monthly GAAP rentals and earned income from direct financing leases from our Owned Properties
recogn zed during the final month of the reporting period, adjusted to exclude GAAP rentals and earned income from direct financing leases contributed from properties sold during that period and adjusted to include a full month of GAAP rentals for
properties acquired during that period. We use Normalized Rental Revenue when calculating certain metrics that are useful to evaluate portfolio credit, asset type, industry and geographic diversity and to manage risk.
Occupancy is calculated by dividing the number of economically yielding Owned Properties in the portfolio as of the measurement date by the number of total Owned Properties on said
date.
Owned Properties refers to properties owned fee-simple or ground leased by Company subsidiaries as lessee.
Real Estate Investment represents the Gross Investment plus improvements less impairment charges.
Senior Unsecured Notes refers to the $300 million aggregate principal amount of 4.450% senior unsecured notes due 2026.
Tenant represents the legal entity ultimately responsible for obligations under the lease agreement or an affiliated entity. Other tenants may operate the same or similar business
concept or brand.
Tenant Reporting consists of one or more of sales, income statement or similar data generated by the leased property. We
either receive property level financials with varied frequency or we receive corporate level financials. Includes publicly listed companies with publicly available financial
statements.
Term Loan refers to a $420.0 million unsecured term facility which includes an accordion feature which allows the facility © be increased to up to
IOOO.O million, subject to obtaining additional lender commitments. Borrowings may be repaid without premium or penalty, and may be re-borrowed within 30 days up to the then available loan commitment.
Total Debt represents the sum of the principal balances outstanding on interest-bearing debt on the Company’s balance sheet as of the date indicated .
Unencumbered Assets represents the assets in our portfolio that are not subject to mortgage indebtedness, which we use to evaluate our potential access to capital and in our
management of financial risk. The asset value attributed to these assets is the Real Estate Investment.
Unsecured Debt represents components of Total Debt that are
not secured by liens, mortgages or deeds of trust on Company assets,
Unit Level Rent Coverage is used as an indicator of individual asset profitability, as well as
signaling the property’s importance to our tenants’ financial viability. We calculate this ratio by dividing our reporting tenants* trailing 12-month EBITDAR {earnings before interest, tax, depreciation, amortization and rent) by annual
contractual rent.
Weighted Average Stated Interest Rate is calculated by dividing the sum product of {a} coupon interest rate of each note and (b) the principal
balance outstanding of each note by (c) the sum of the total principal balances outstanding for all notes in the sample.
2015 Credit Facility refers to the $300
million unsecured credit facility which matures on March 31,2019. The 2015 Credit Facility includes sublimrts for swingline loans and letter of credit issuances. Swingline loans and letters of credit reduce availability under the 2015 Credit
Facility. The ability to borrow under the 2015 Credit Facility is subject to the ongoing compliance with customary financial covenants.
28