Attached files
| file | filename |
|---|---|
| 8-K - 8-K - FORD MOTOR CREDIT CO LLC | sales8-kdated06x01x2017.htm |

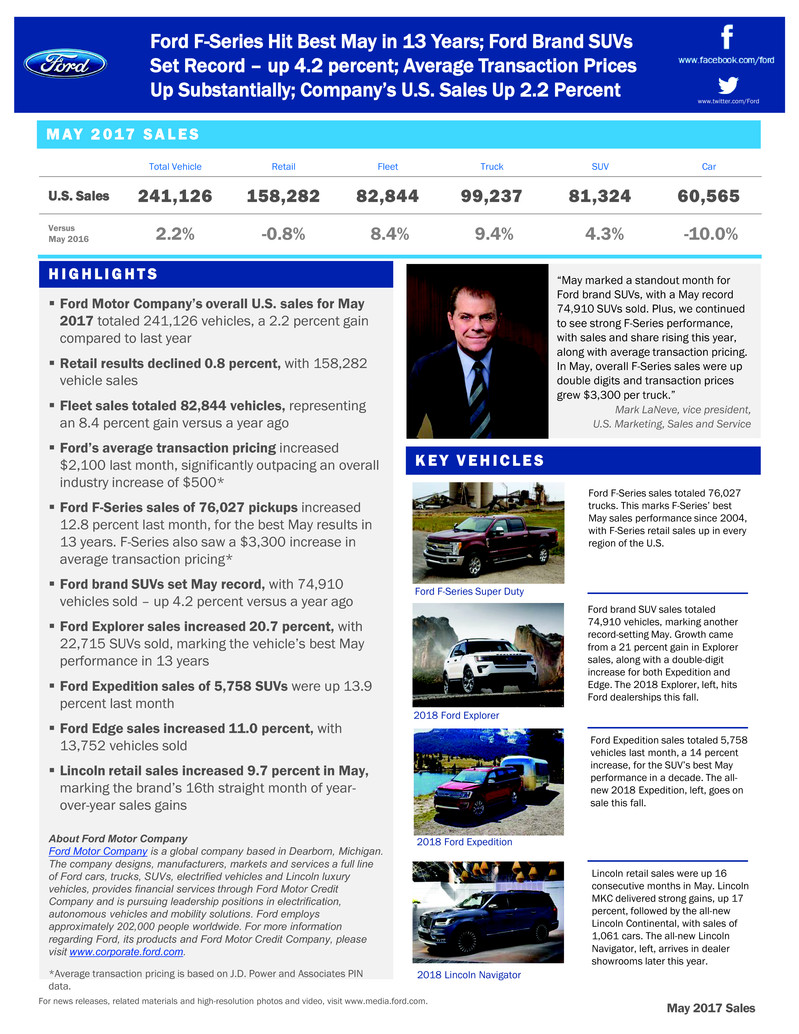
§ Ford Motor Company’s overall U.S. sales for May
2017 totaled 241,126 vehicles, a 2.2 percent gain
compared to last year
§ Retail results declined 0.8 percent, with 158,282
vehicle sales
§ Fleet sales totaled 82,844 vehicles, representing
an 8.4 percent gain versus a year ago
§ Ford’s average transaction pricing increased
$2,100 last month, significantly outpacing an overall
industry increase of $500*
§ Ford F-Series sales of 76,027 pickups increased
12.8 percent last month, for the best May results in
13 years. F-Series also saw a $3,300 increase in
average transaction pricing*
§ Ford brand SUVs set May record, with 74,910
vehicles sold – up 4.2 percent versus a year ago
§ Ford Explorer sales increased 20.7 percent, with
22,715 SUVs sold, marking the vehicle’s best May
performance in 13 years
§ Ford Expedition sales of 5,758 SUVs were up 13.9
percent last month
§ Ford Edge sales increased 11.0 percent, with
13,752 vehicles sold
§ Lincoln retail sales increased 9.7 percent in May,
marking the brand’s 16th straight month of year-
over-year sales gains
About Ford Motor Company
Ford Motor Company is a global company based in Dearborn, Michigan.
The company designs, manufacturers, markets and services a full line
of Ford cars, trucks, SUVs, electrified vehicles and Lincoln luxury
vehicles, provides financial services through Ford Motor Credit
Company and is pursuing leadership positions in electrification,
autonomous vehicles and mobility solutions. Ford employs
approximately 202,000 people worldwide. For more information
regarding Ford, its products and Ford Motor Credit Company, please
visit www.corporate.ford.com.
*Average transaction pricing is based on J.D. Power and Associates PIN
data.
M A Y 2 0 17 S A L E S
May 2017 Sales
“May marked a standout month for
Ford brand SUVs, with a May record
74,910 SUVs sold. Plus, we continued
to see strong F-Series performance,
with sales and share rising this year,
along with average transaction pricing.
In May, overall F-Series sales were up
double digits and transaction prices
grew $3,300 per truck.”
Mark LaNeve, vice president,
U.S. Marketing, Sales and Service
Ford F-Series Hit Best May in 13 Years; Ford Brand SUVs
Set Record – up 4.2 percent; Average Transaction Prices
Up Substantially; Company’s U.S. Sales Up 2.2 Percent
Total Vehicle Retail Fleet Truck SUV Car
U.S. Sales 241,126 158,282 82,844 99,237 81,324 60,565
Versus
May 2016 2.2% -0.8% 8.4% 9.4% 4.3% -10.0%
H I G H L I G H T S
K E Y V E H I C L E S
Ford F-Series sales totaled 76,027
trucks. This marks F-Series’ best
May sales performance since 2004,
with F-Series retail sales up in every
region of the U.S.
Ford F-Series Super Duty
2018 Ford Explorer
2018 Ford Expedition
2018 Lincoln Navigator
Ford brand SUV sales totaled
74,910 vehicles, marking another
record-setting May. Growth came
from a 21 percent gain in Explorer
sales, along with a double-digit
increase for both Expedition and
Edge. The 2018 Explorer, left, hits
Ford dealerships this fall.
Ford Expedition sales totaled 5,758
vehicles last month, a 14 percent
increase, for the SUV’s best May
performance in a decade. The all-
new 2018 Expedition, left, goes on
sale this fall.
Lincoln retail sales were up 16
consecutive months in May. Lincoln
MKC delivered strong gains, up 17
percent, followed by the all-new
Lincoln Continental, with sales of
1,061 cars. The all-new Lincoln
Navigator, left, arrives in dealer
showrooms later this year.
For news releases, related materials and high-resolution photos and video, visit www.media.ford.com.
www.twitter.com/Ford

M A Y 2 0 17 I N V E N T O R Y / F L E E T R E S U LT S
2
May 2017 Sales
C O N TA C T
Erich Merkle
313.806.4562
emerkle2@ford.com
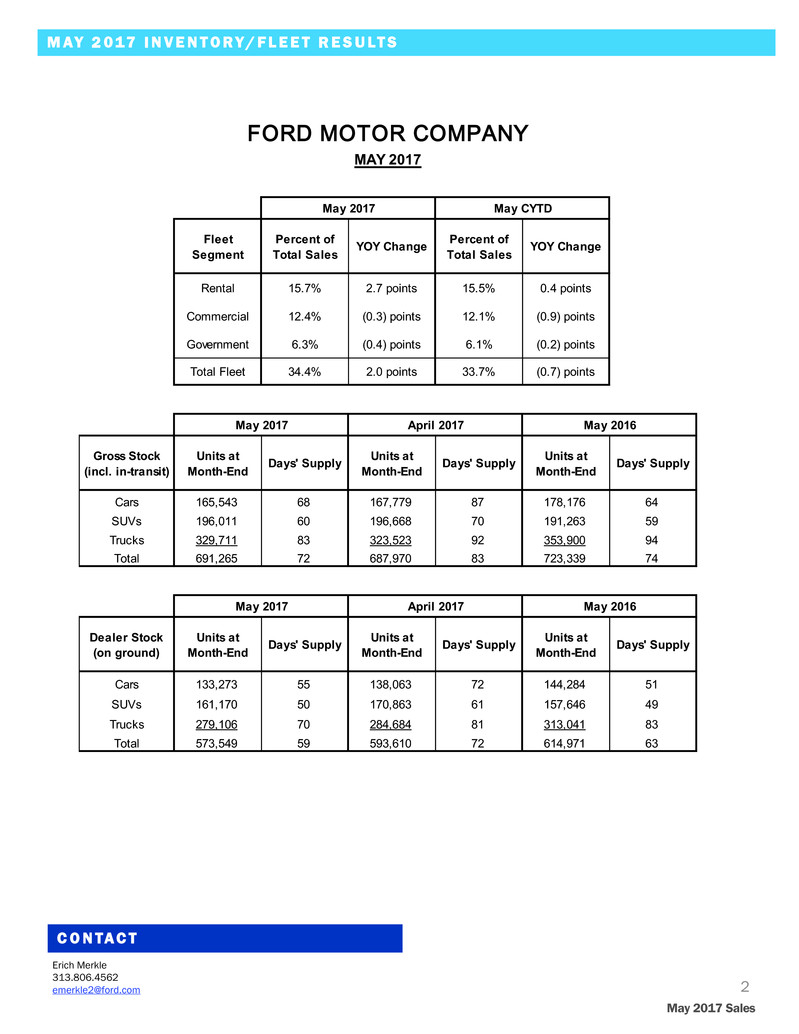
Fleet
Segment
Percent of
Total Sales
YOY Change Percent of
Total Sales
YOY Change
Rental 15.7% 2.7 points 15.5% 0.4 points
Commercial 12.4% (0.3) points 12.1% (0.9) points
Government 6.3% (0.4) points 6.1% (0.2) points
Total Fleet 34.4% 2.0 points 33.7% (0.7) points
Gross Stock
(incl. in-transit)
Units at
Month-End
Days' Supply Units at
Month-End
Days' Supply Units at
Month-End
Days' Supply
Cars 165,543 68 167,779 87 178,176 64
SUVs 196,011 60 196,668 70 191,263 59
Trucks 329,711 83 323,523 92 353,900 94
Total 691,265 72 687,970 83 723,339 74
Dealer Stock
(on ground)
Units at
Month-End
Days' Supply Units at
Month-End
Days' Supply Units at
Month-End
Days' Supply
Cars 133,273 55 138,063 72 144,284 51
SUVs 161,170 50 170,863 61 157,646 49
Trucks 279,106 70 284,684 81 313,041 83
Total 573,549 59 593,610 72 614,971 63
May 2017 April 2017 May 2016
??????????????????
MAY 2017
May 2017 May CYTD
May 2017 April 2017 May 2016
