Attached files
| file | filename |
|---|---|
| EX-3.2 - EX-3.2 - CORTLAND BANCORP INC | d405037dex32.htm |
| 8-K - FORM 8-K - CORTLAND BANCORP INC | d405037d8k.htm |
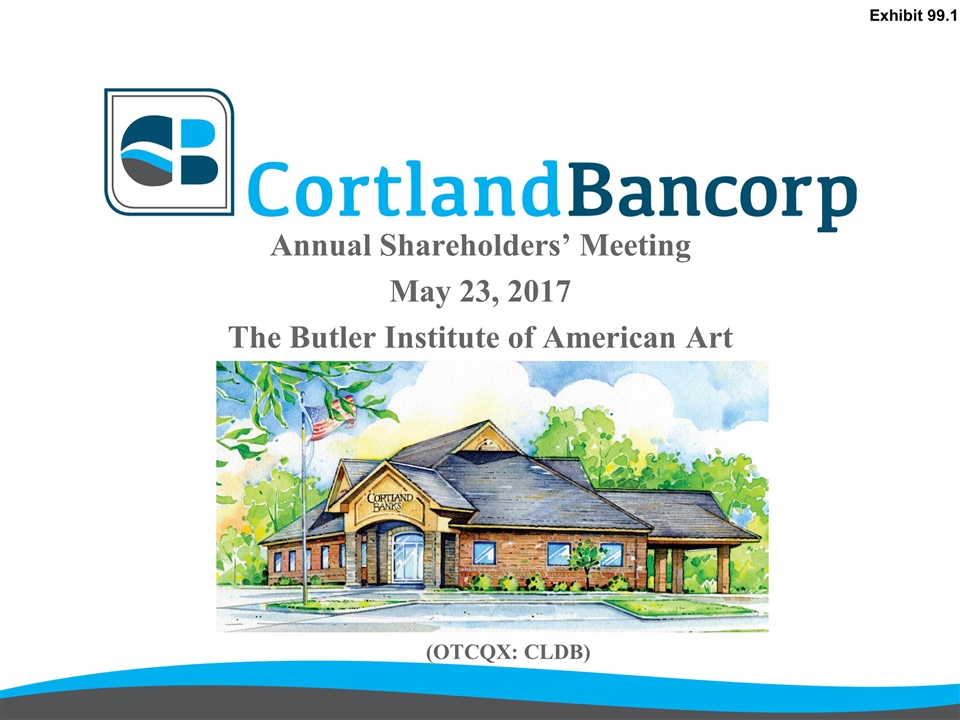
Annual Shareholders’ Meeting May 23, 2017 The Butler Institute of American Art (OTCQX: CLDB) Exhibit 99.1
Forward-Looking Statement The Private Securities Litigation Reform Act of 1995 provides a “safe harbor” for forward-looking statements. Any forward-looking statement is not a guarantee of future performance and actual future results could differ materially from those contained in forward-looking information. Factors that could cause or contribute to such differences include, without limitation, risks and uncertainties detailed from time to time in the Company’s filings with the Securities and Exchange Commission, including, without limitation, the risk factors disclosed in Item 1A, “Risk Factors.” In the Company’s Annual Report on Form 10-K for the fiscal year ended December 31, 2016. Many of these factors are beyond the Company’s ability to control or predict, and readers are cautioned not to put undue reliance on these forward-looking statements. The following list, which is not intended to be an all-encompassing list of risks and uncertainties affecting the Company, summarizes several factors that could cause the Company’s results to differ materially from those anticipated or expected in these forward-looking statements: Conditions in the financial markets, the real estate markets and economic conditions generally. Enactment of new legislation and increased regulatory oversight. Changes in interest rates. Future expansions including new branch openings, acquisition of other financial institutions and new business lines or new product or service offerings. Increased competition with other banks, savings and loan associations, credit unions, mortgage banking, insurance companies, securities brokerage and asset management firms. Changes in accounting standards Other factors not currently anticipated may also materially and adversely affect the Company’s results of operations, cash flows and financial position. There can be no assurance that future results will meet expectations. While the Company believes that the forward-looking statements in this presentation are reasonable, you should not place undue reliance on any forward-looking statement. In addition, these statements speak only as of the date made. The Company does not undertake, and expressly disclaims, any obligation to update or alter any statements whether as a result of new information, future events or otherwise, except as may be required by applicable law. 1
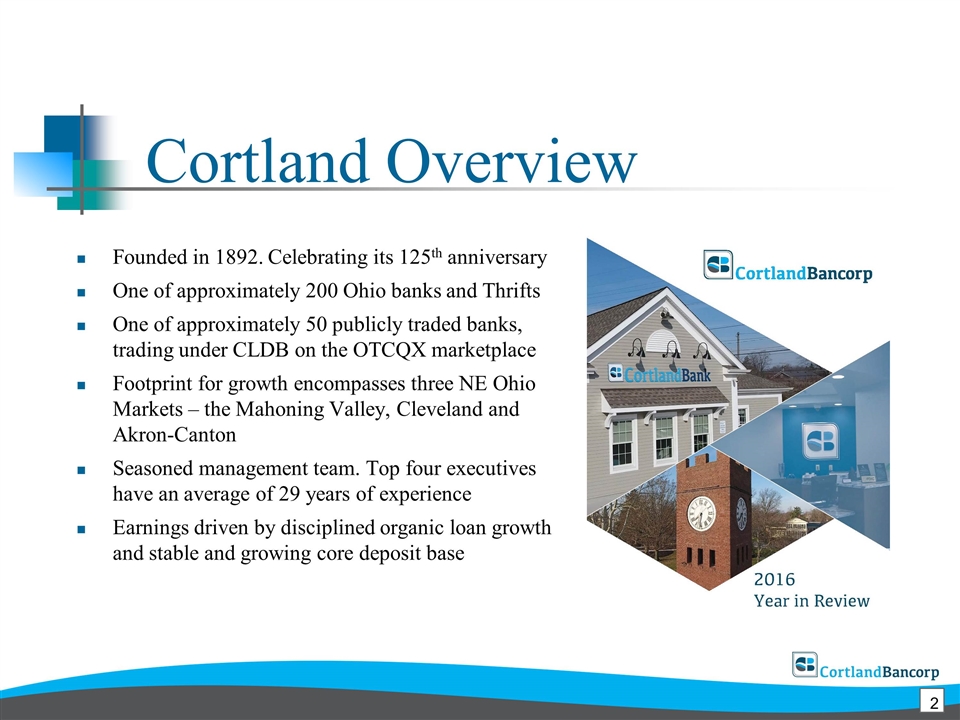
Founded in 1892. Celebrating its 125th anniversary One of approximately 200 Ohio banks and Thrifts One of approximately 50 publicly traded banks, trading under CLDB on the OTCQX marketplace Footprint for growth encompasses three NE Ohio Markets – the Mahoning Valley, Cleveland and Akron-Canton Seasoned management team. Top four executives have an average of 29 years of experience Earnings driven by disciplined organic loan growth and stable and growing core deposit base Cortland Overview 2
Key Strengths Relationship-based philosophy generates referrals between business units Successfully competes against other community banks and larger regional banks Complete business lending solutions offering Treasury Management and CRE, C&I and SBA loans Broad-based mortgage lending program provides in-house and secondary market products with specialties in residential real estate, construction and medical businesses Stable and growing core deposit base. Core deposits represent 92% of total deposits (excluding brokered and CD’s > $250K) 3
Key Strengths cont. Interest and noninterest income generated from diversified business lines which include: Commercial Consumer Mortgage Private Bank Wealth Management Recruitment and retention of top talent viewed as “top” priority Community reinvestment goals supported through investment in affordable housing and diversified sponsorship initiatives 4
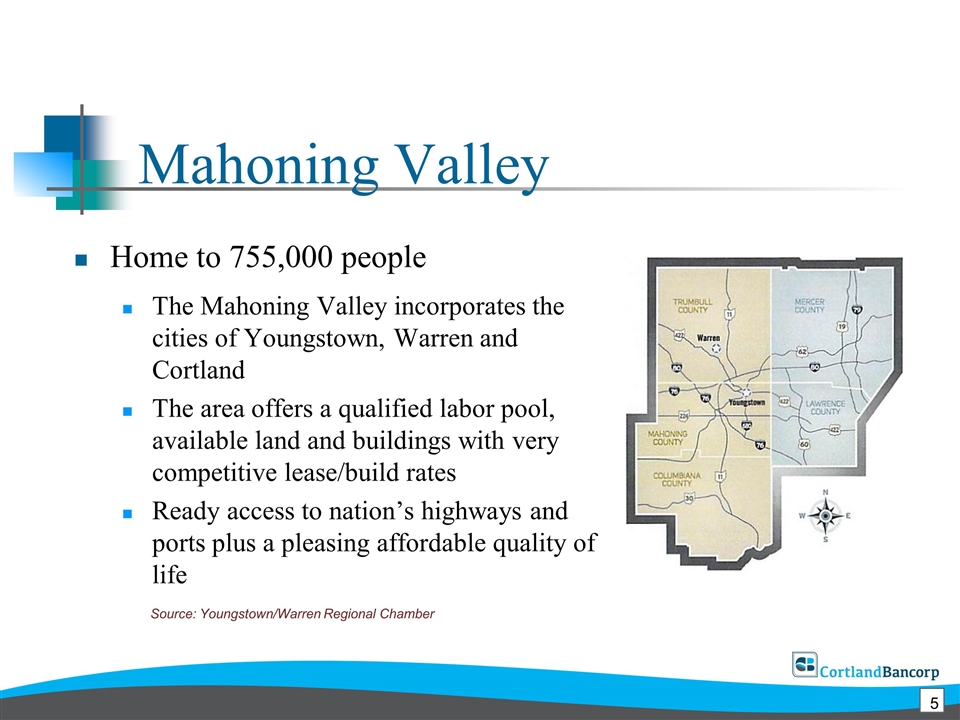
Mahoning Valley Home to 755,000 people The Mahoning Valley incorporates the cities of Youngstown, Warren and Cortland The area offers a qualified labor pool, available land and buildings with very competitive lease/build rates Ready access to nation’s highways and ports plus a pleasing affordable quality of life Source: Youngstown/Warren Regional Chamber 5
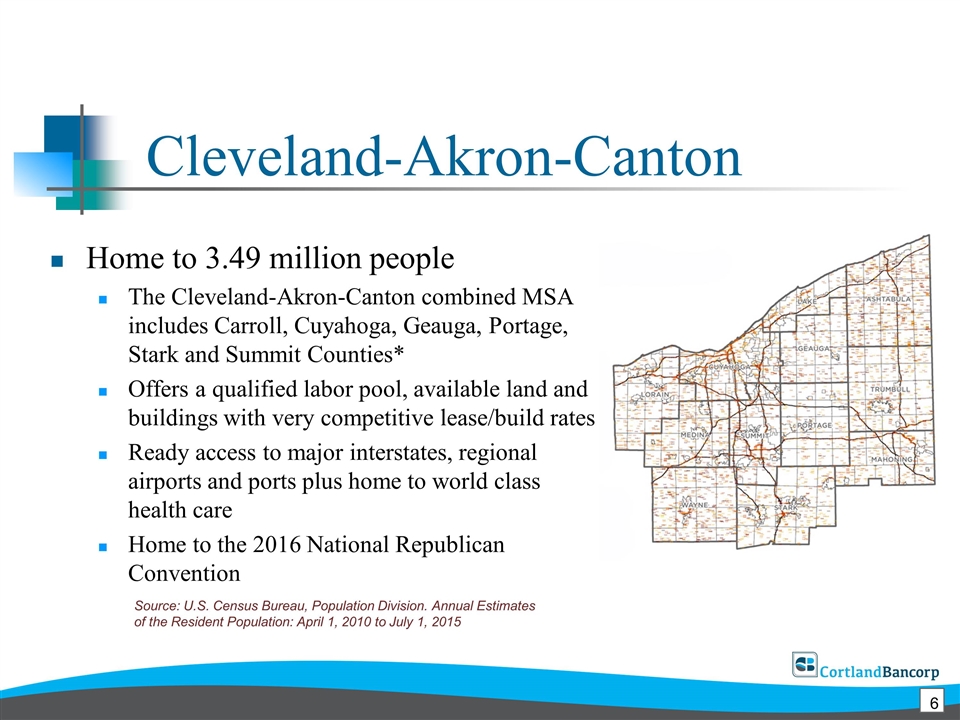
Cleveland-Akron-Canton Home to 3.49 million people The Cleveland-Akron-Canton combined MSA includes Carroll, Cuyahoga, Geauga, Portage, Stark and Summit Counties* Offers a qualified labor pool, available land and buildings with very competitive lease/build rates Ready access to major interstates, regional airports and ports plus home to world class health care Home to the 2016 National Republican Convention Source: U.S. Census Bureau, Population Division. Annual Estimates of the Resident Population: April 1, 2010 to July 1, 2015 6
Over 1,000 Employers Source: Youngstown/Warren Regional Chamber Many notable employers are headquartered in Ohio, or have various locations in and around Ohio Economy anchored by manufacturing and related trade Significant growth in education and health sectors http://www.cleveland.com/datacentral/index.ssf/2016/10/ohios_100_largest_employers.html anchores leading clinical and research institutions such as the Cleveland Clinic, University Hospitals, Akron Children’s Hospital, MetroHealth Medical Center and the Louis Stokes Cleveland VA Medical Center. AT&T DELPHI General Motors Panera Walmart Windsor House Youngstown State University 7
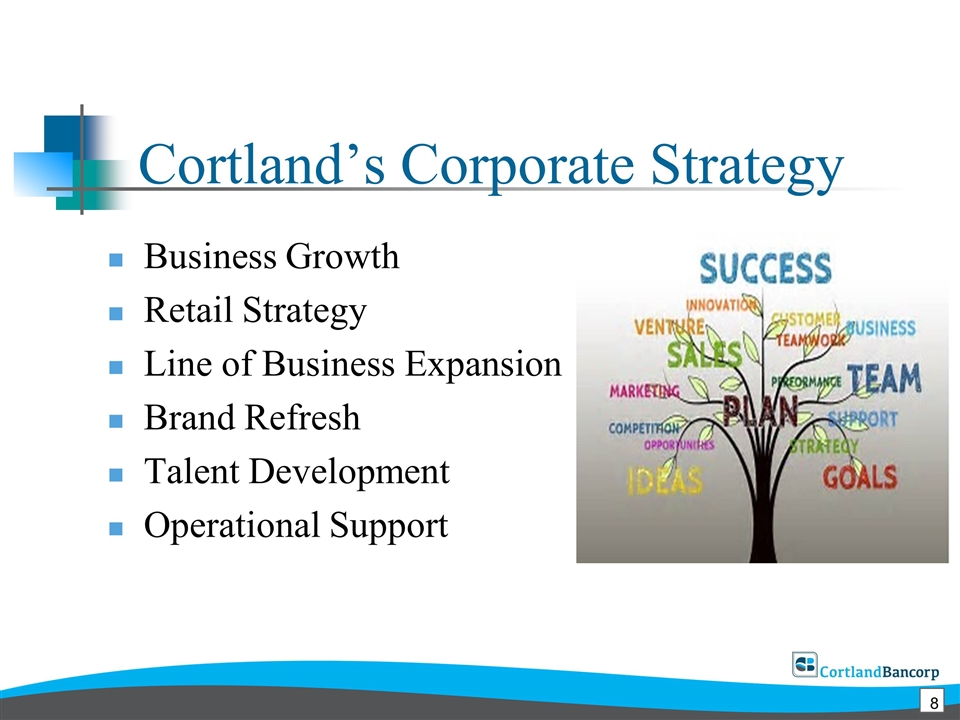
Business Growth Retail Strategy Line of Business Expansion Brand Refresh Talent Development Operational Support Cortland’s Corporate Strategy 8
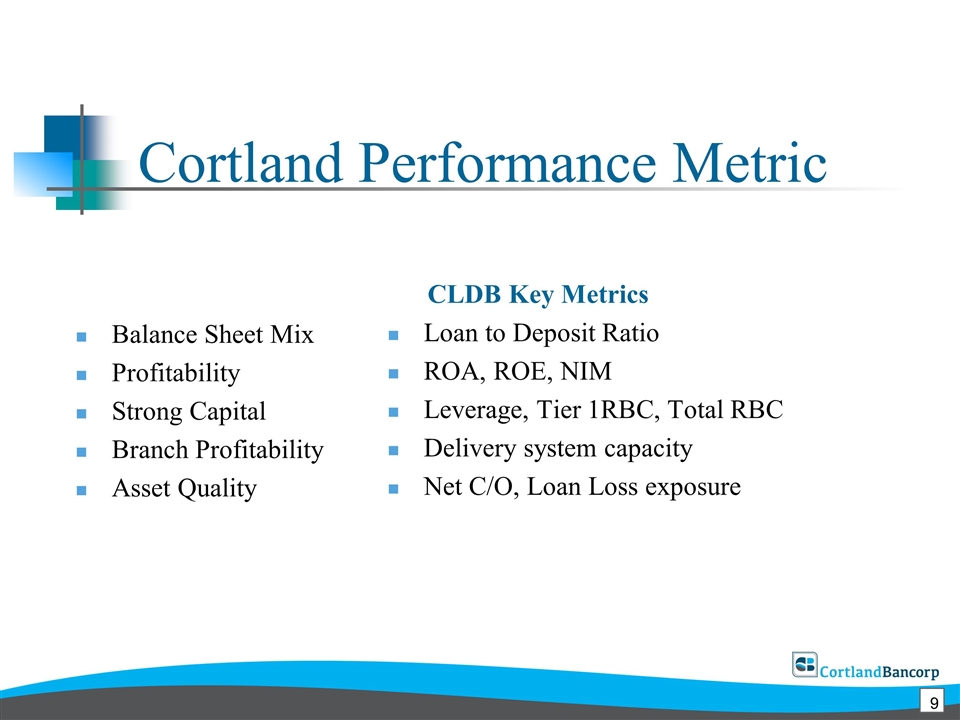
Balance Sheet Mix Profitability Strong Capital Branch Profitability Asset Quality Cortland Performance Metric CLDB Key Metrics Loan to Deposit Ratio ROA, ROE, NIM Leverage, Tier 1RBC, Total RBC Delivery system capacity Net C/O, Loan Loss exposure 9
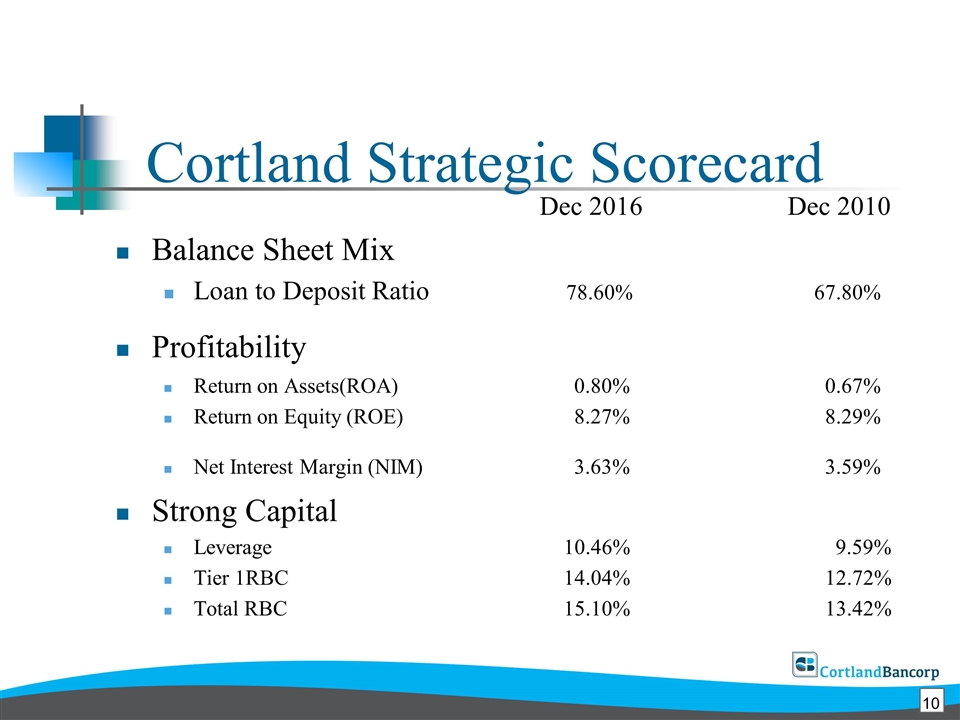
Dec 2016Dec 2010 Balance Sheet Mix Loan to Deposit Ratio 78.60% 67.80% Profitability Return on Assets(ROA) 0.80% 0.67% Return on Equity (ROE) 8.27% 8.29% Net Interest Margin (NIM) 3.63% 3.59% Strong Capital Leverage 10.46% 9.59% Tier 1RBC 14.04% 12.72% Total RBC 15.10% 13.42% Cortland Strategic Scorecard 10
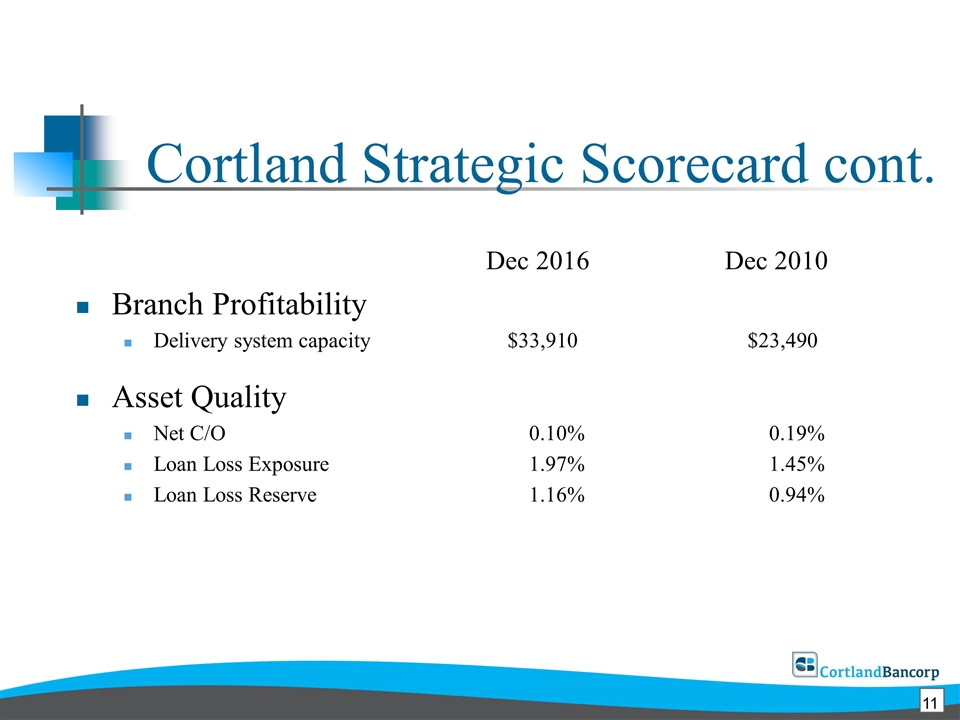
Dec 2016 Dec 2010 Branch Profitability Delivery system capacity $33,910 $23,490 Asset Quality Net C/O 0.10% 0.19% Loan Loss Exposure 1.97% 1.45% Loan Loss Reserve 1.16% 0.94% Cortland Strategic Scorecard cont. 11
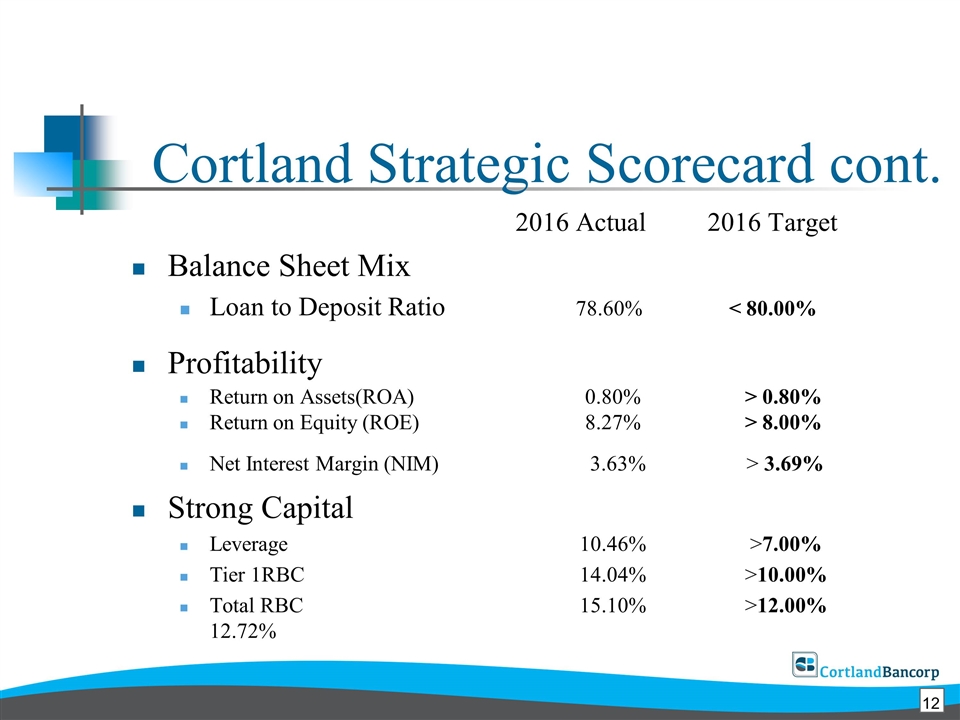
2016 Actual2016 Target Balance Sheet Mix Loan to Deposit Ratio 78.60% < 80.00% Profitability Return on Assets(ROA) 0.80% > 0.80% Return on Equity (ROE) 8.27% > 8.00% Net Interest Margin (NIM) 3.63% > 3.69% Strong Capital Leverage 10.46% >7.00% Tier 1RBC 14.04% >10.00% Total RBC 15.10% >12.00% 12.72% Cortland Strategic Scorecard cont. 12
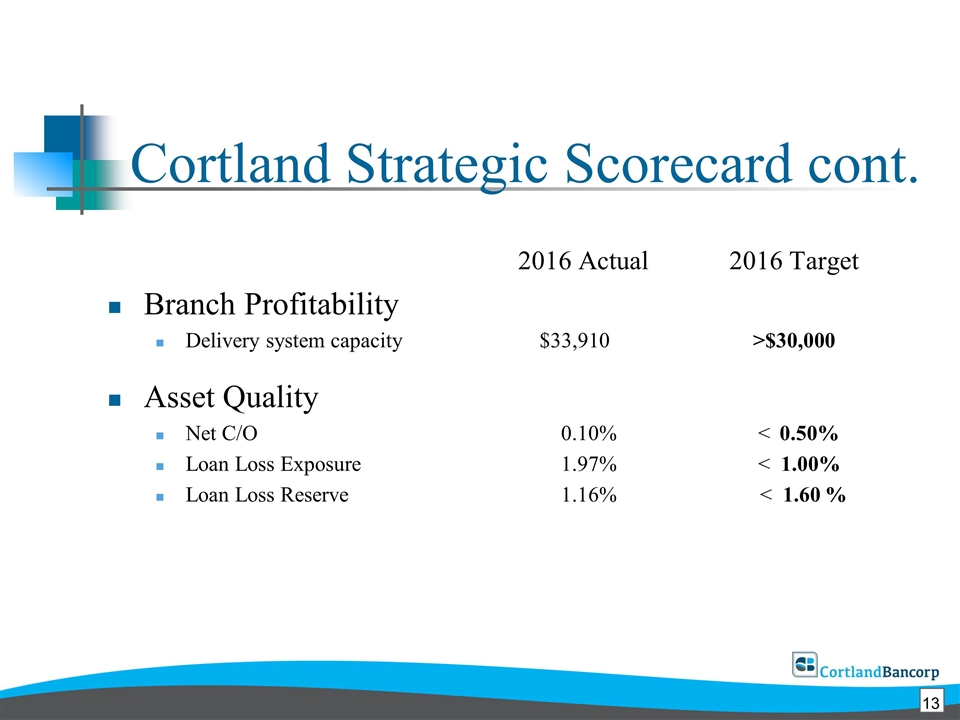
2016 Actual 2016 Target Branch Profitability Delivery system capacity $33,910 >$30,000 Asset Quality Net C/O 0.10% <0.50% Loan Loss Exposure 1.97% < 1.00% Loan Loss Reserve 1.16% < 1.60 % Cortland Strategic Scorecard cont. 13
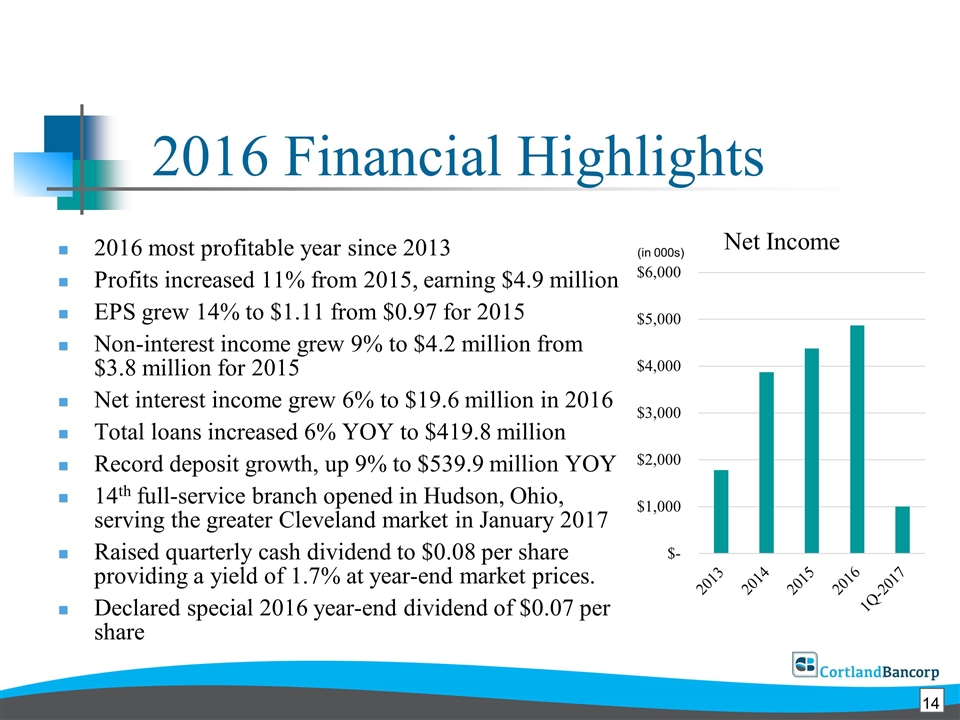
2016 Financial Highlights 2016 most profitable year since 2013 Profits increased 11% from 2015, earning $4.9 million EPS grew 14% to $1.11 from $0.97 for 2015 Non-interest income grew 9% to $4.2 million from $3.8 million for 2015 Net interest income grew 6% to $19.6 million in 2016 Total loans increased 6% YOY to $419.8 million Record deposit growth, up 9% to $539.9 million YOY 14th full-service branch opened in Hudson, Ohio, serving the greater Cleveland market in January 2017 Raised quarterly cash dividend to $0.08 per share providing a yield of 1.7% at year-end market prices. Declared special 2016 year-end dividend of $0.07 per share (in 000s) 14
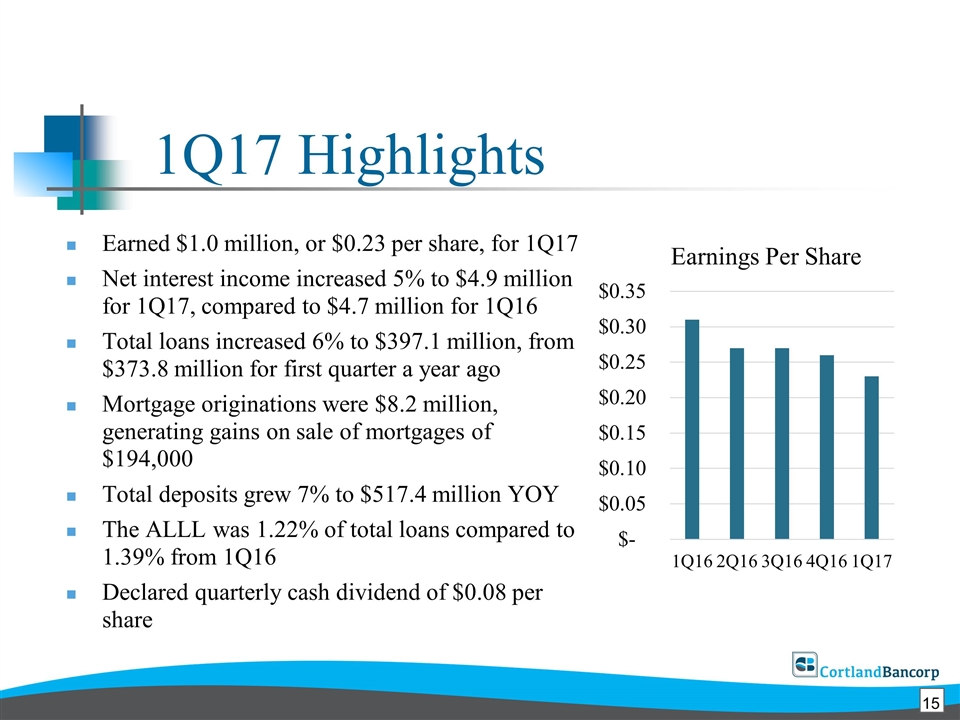
1Q17 Highlights Earned $1.0 million, or $0.23 per share, for 1Q17 Net interest income increased 5% to $4.9 million for 1Q17, compared to $4.7 million for 1Q16 Total loans increased 6% to $397.1 million, from $373.8 million for first quarter a year ago Mortgage originations were $8.2 million, generating gains on sale of mortgages of $194,000 Total deposits grew 7% to $517.4 million YOY The ALLL was 1.22% of total loans compared to 1.39% from 1Q16 Declared quarterly cash dividend of $0.08 per share 15
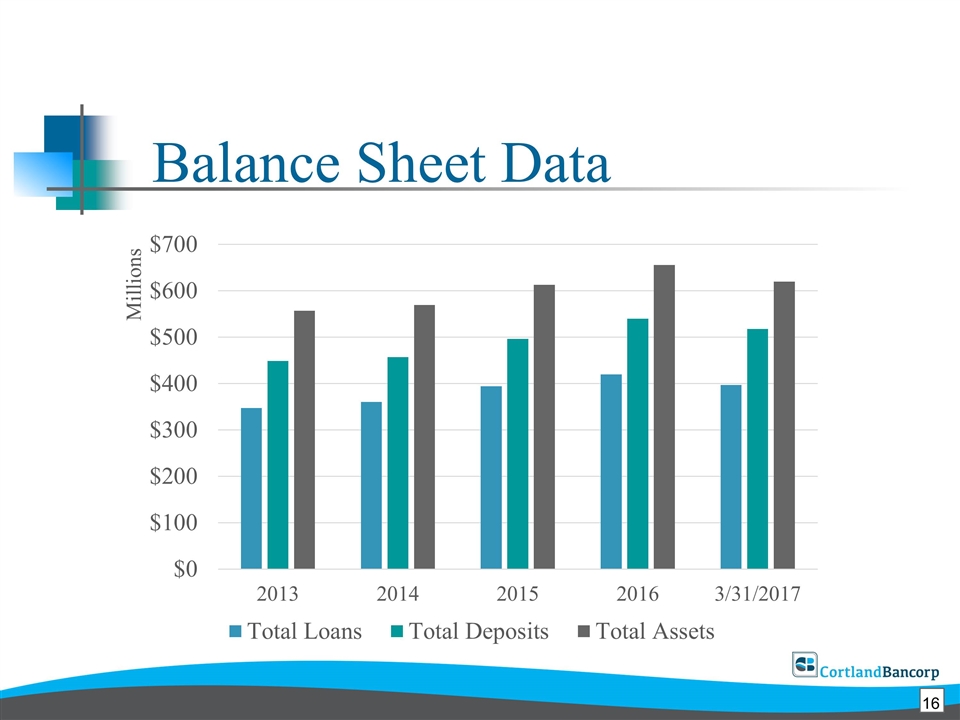
Balance Sheet Data 16
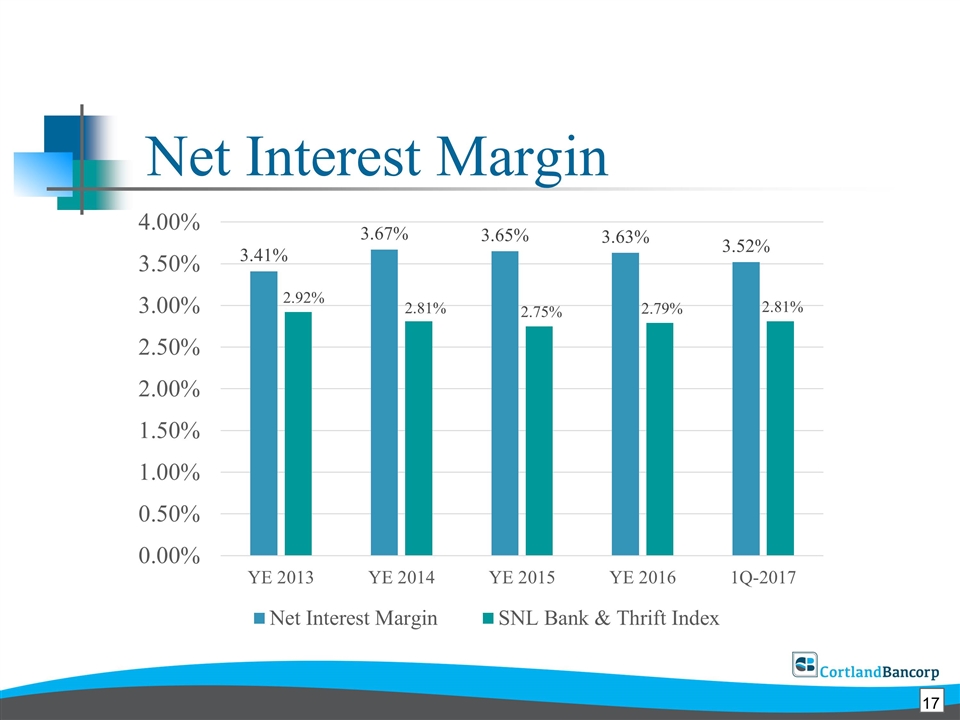
Net Interest Margin Slide 7 17
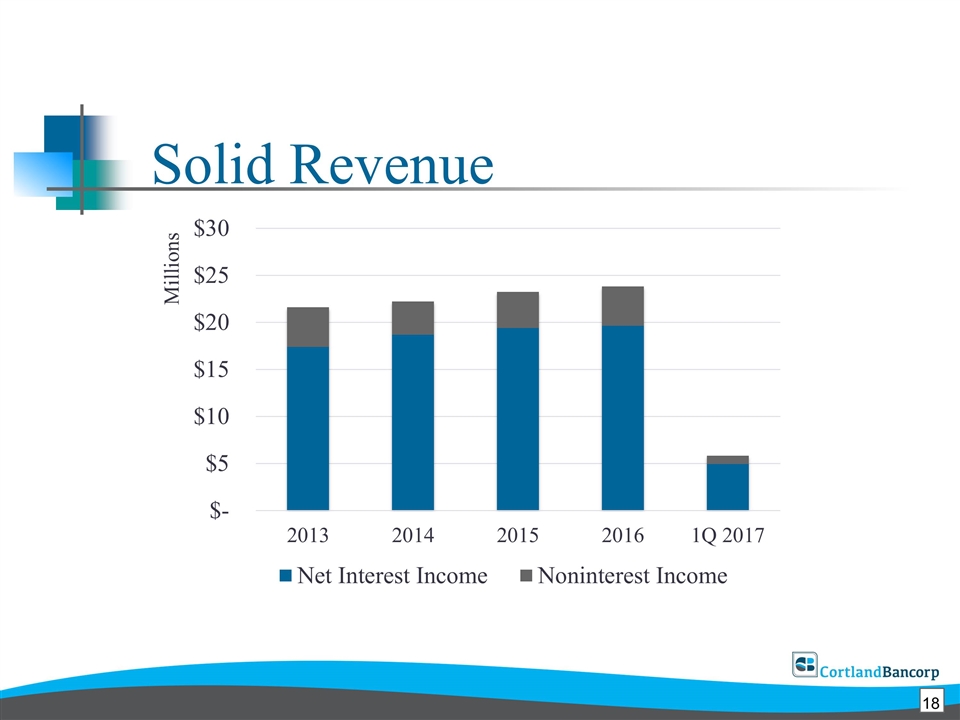
Solid Revenue 18
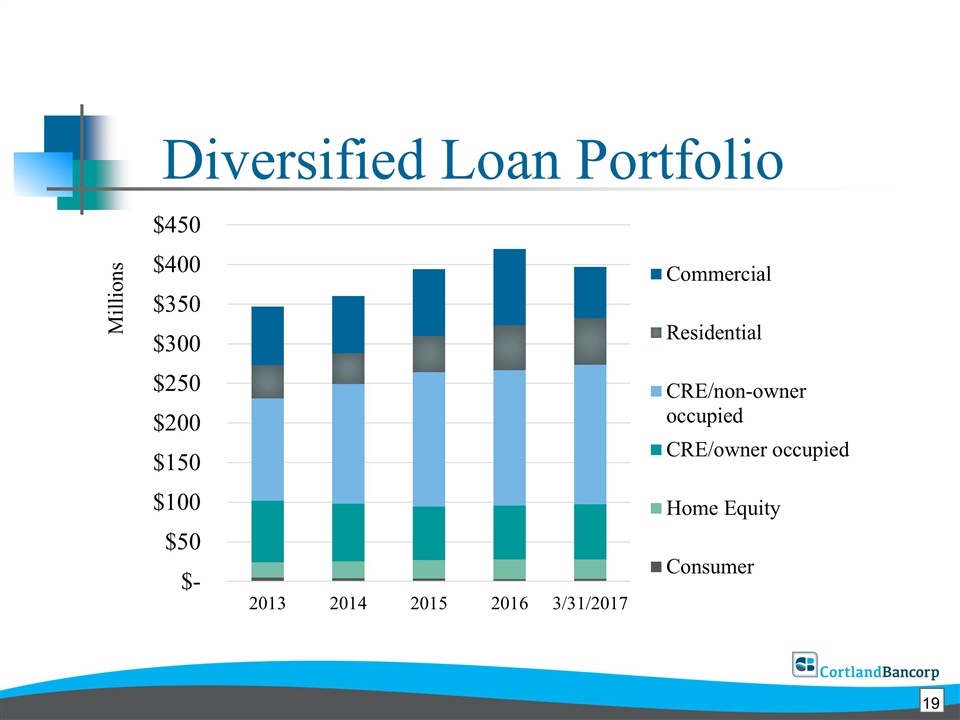
Diversified Loan Portfolio Millions 19
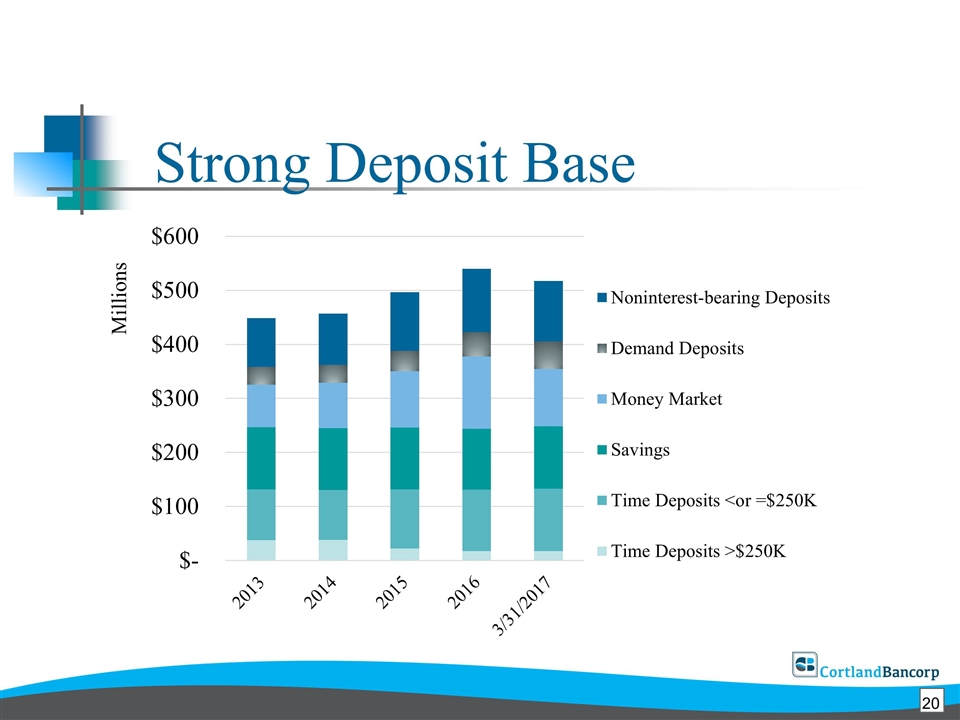
Strong Deposit Base Millions 20
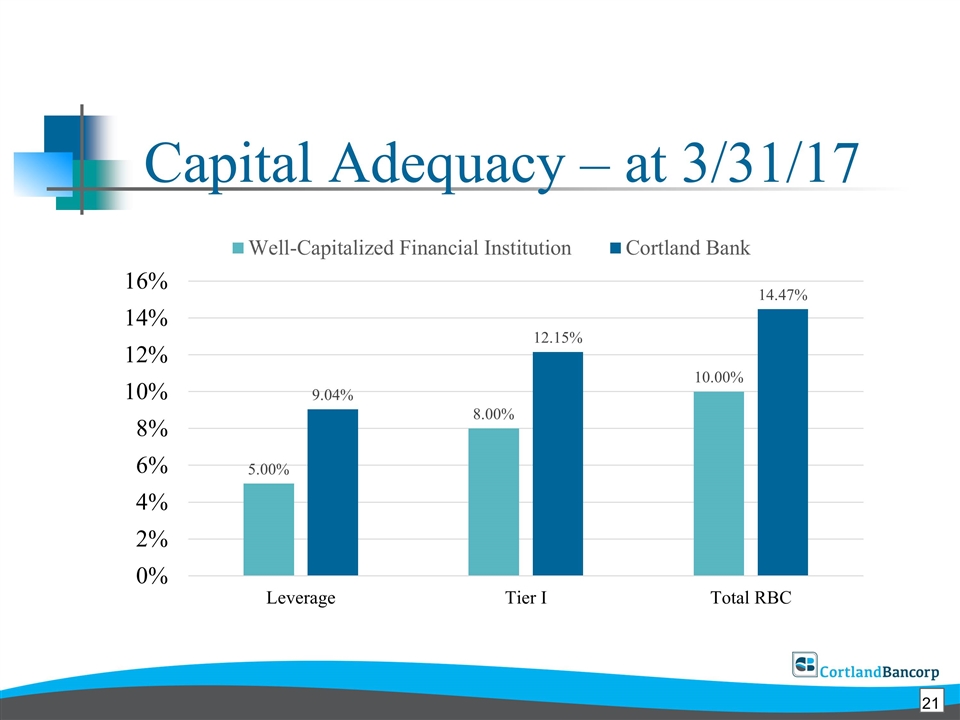
Capital Adequacy – at 3/31/17 21
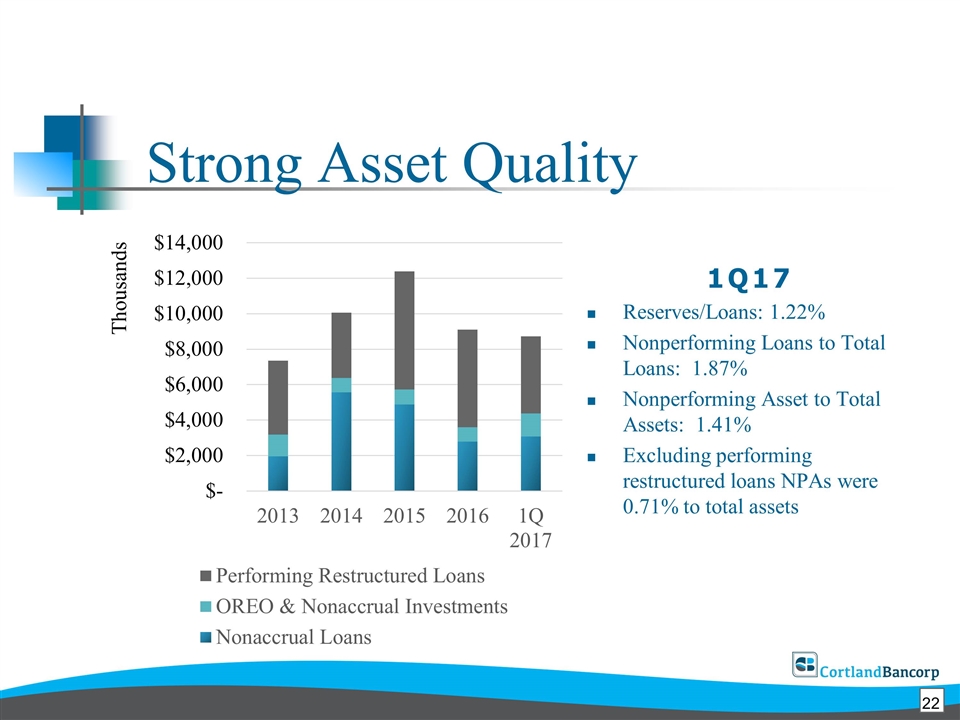
Strong Asset Quality 1Q17 Reserves/Loans: 1.22% Nonperforming Loans to Total Loans: 1.87% Nonperforming Asset to Total Assets: 1.41% Excluding performing restructured loans NPAs were 0.71% to total assets Thousands 22
2017 Focus Organic Balance Sheet Growth Market Expansion Implementation of Optimal Branch Configuration Increase Consumer Lending Production Grow Private Bank and Private Wealth Management Complete BRAND Refresh. Design a Marketing Plan around the BRAND Recruit and Retain “A” players for each market team Develop efficient processes and back-office to support line of business growth 23
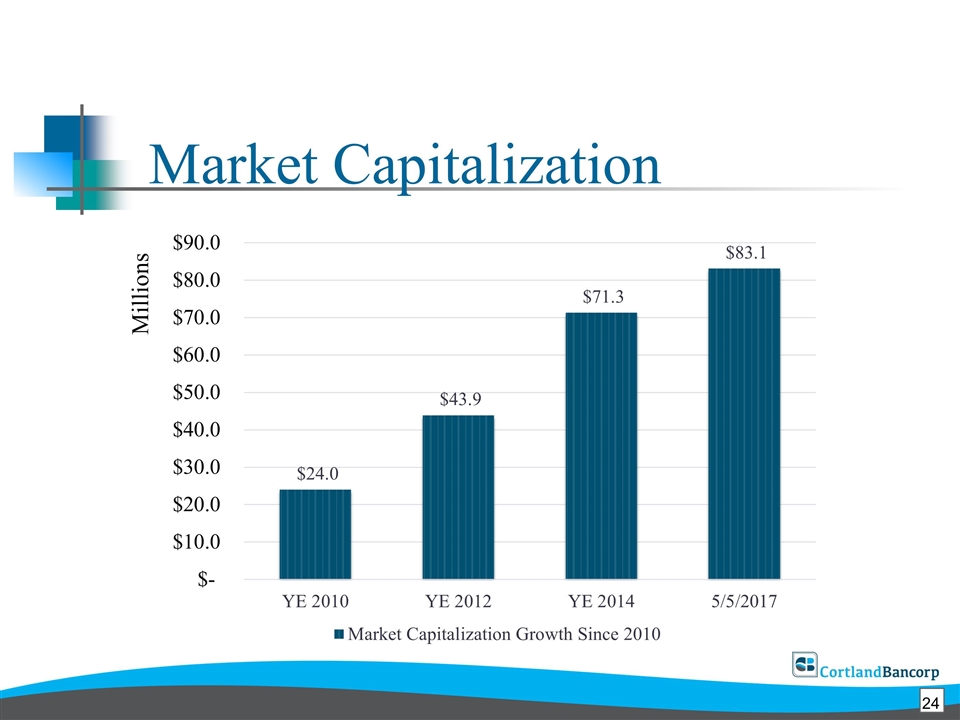
Market Capitalization Millions 24
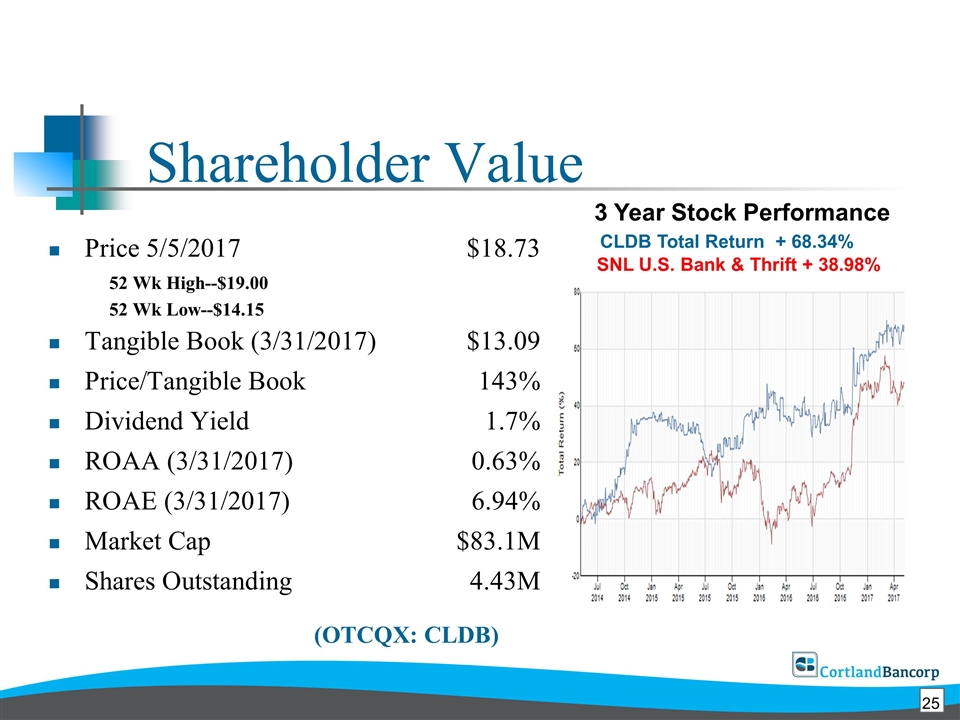
Price 5/5/2017 $18.73 52 Wk High--$19.00 52 Wk Low--$14.15 Tangible Book (3/31/2017)$13.09 Price/Tangible Book143% Dividend Yield1.7% ROAA (3/31/2017)0.63% ROAE (3/31/2017)6.94% Market Cap$83.1M Shares Outstanding4.43M Shareholder Value CLDB Total Return + 68.34% SNL U.S. Bank & Thrift + 38.98% 3 Year Stock Performance (OTCQX: CLDB) 25
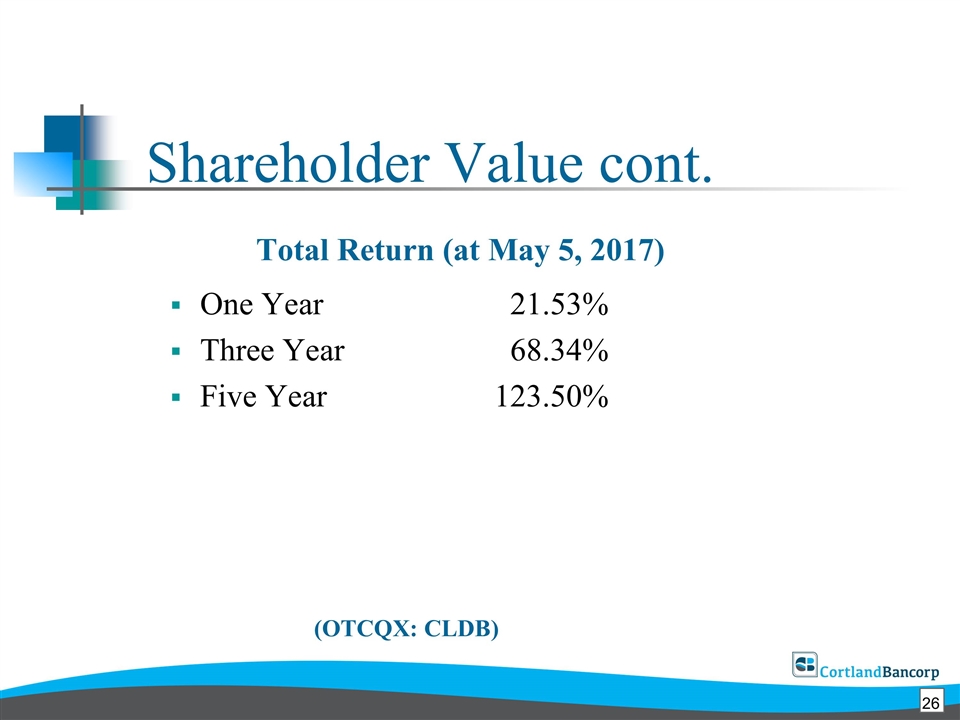
Shareholder Value cont. Total Return (at May 5, 2017) One Year21.53% Three Year68.34% Five Year123.50% (OTCQX: CLDB) 26
We care about your security, Latest security updates. (OTCQX: CLDB) For more information, call us at 800.366.2334 or visit our website: www.cortlandbank.com/invest
