Attached files
| file | filename |
|---|---|
| 8-K - FORM 8-K - Bison Merger Sub I, LLC | d392261d8k.htm |
 Investor Presentation MAY 2017 Exhibit 99.1 |
 1 Forward-Looking Statements This presentation contains forward-looking statements. These statements can be identified by the use of forward-looking
terminology including “will,” “may,”
“believe,” “expect,” “anticipate,” “estimate,” “continue,” or other similar words. These statements discuss future expectations including company growth expectations, demand for our products, expectations regarding future prices, capacity
expansion plans, market trends, liquidity, transportation
services, commercial product launches and research and development plans and may contain projections of financial condition or of results of operations, or state other “forward-looking” information. These
forward-looking statements involve risks and
uncertainties. Many of these risks are beyond management’s control. When considering these forward-looking statements, you should keep in mind the risk factors, Management’s Discussion and Analysis of Financial Condition and Results of
Operations, and other
cautionary statements in the company’s SEC filings.
Forward-looking statements are not guarantees of future performance or an assurance that our current assumptions or projections are valid. Our actual results and plans could differ materially from those
expressed in any forward-
looking statements. We undertake no obligation to publicly update any
forward-looking statements, whether as a result of new information or future events, except as required by law. This presentation includes certain non-GAAP financial measures, including EBITDA and Adjusted EBITDA. These non-GAAP
financial measures are used as supplemental financial
measures by our management to evaluate our operating performance and compare the results of our operations from period to period without regard to the impact of our financing methods, capital structure or
non-operating income and expenses. Adjusted EBITDA is
also used by our lenders to evaluate our compliance with covenants. We believe that these measures are meaningful to our investors to enhance their understanding of our financial performance. These measures should be considered
supplemental to and not a substitute for financial
information prepared in accordance with GAAP and may differ from similarly titled measures used by other companies. For a reconciliation of such measures to the most directly comparable GAAP term, please see the appendix
of this presentation.
FORWARD LOOKING INFORMATION
NON-GAAP FINANCIAL MEASURES |
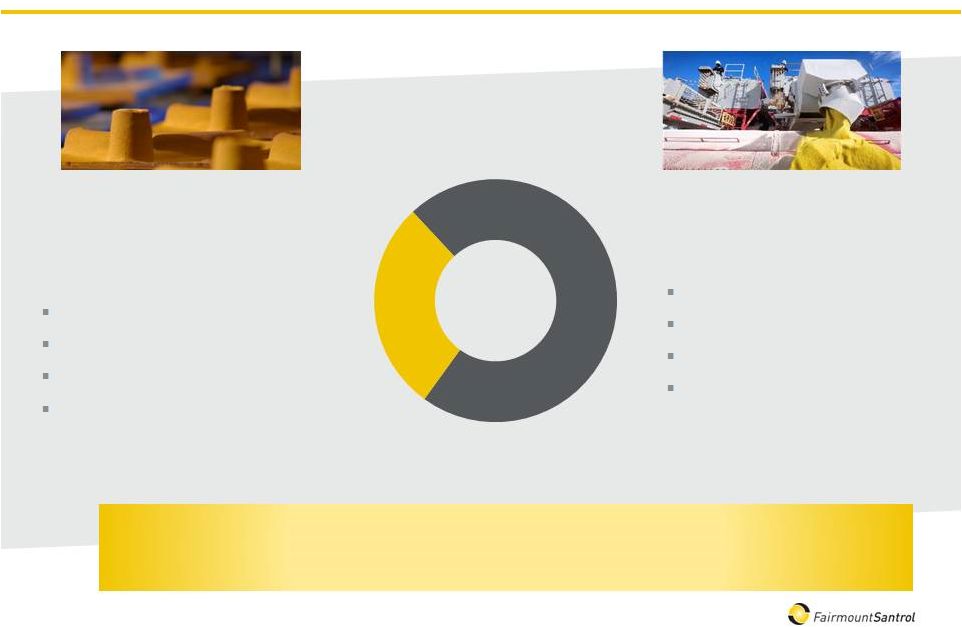 2 Two Complementary Business Segments Proppant Solutions Oil & Gas Markets Resin-Coated Proppants Propel SSP ® Tier 1 Northern White Sand Tier 2 Texas Gold Sand Industrial & Recreational (I&R) Foundry, Glass, Sports & Recreation, Building and Filtration Markets Resin-Coated Sand Custom Blending High-Purity Sand Enhanced Resin Complementary markets throughout business cycles Complementary products to leverage asset base 6.4 72% 2.5 28% 2016 VOLUMES (million tons) |
 Core Differentiators for Long-Term Value Creation |
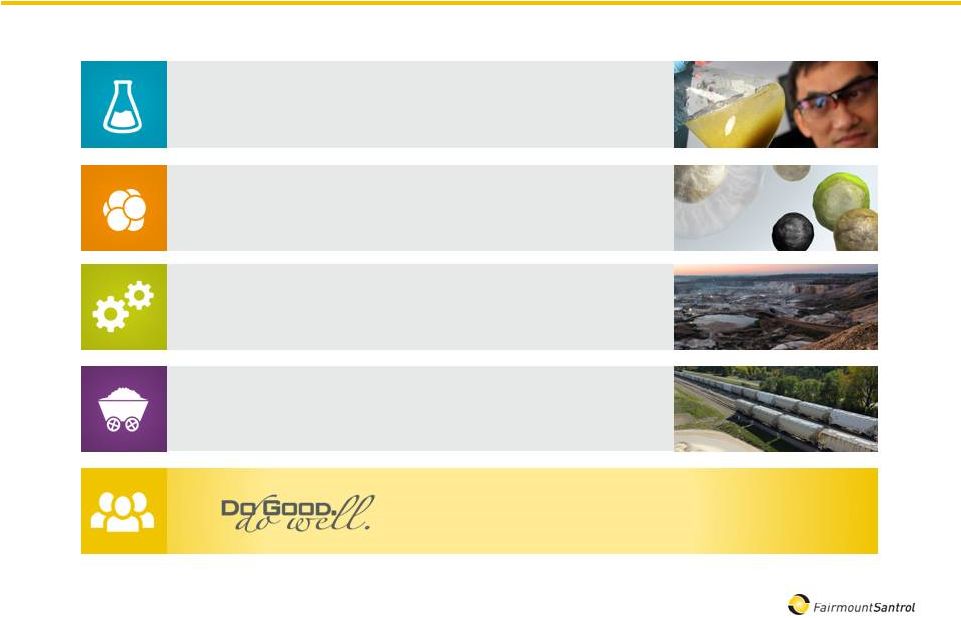 4 Commitment to People, Planet & Prosperity Technology & Innovation Broad Product Portfolio Operational Scale & Efficiencies Extensive Distribution and Unit Train Capabilities Core Differentiators for Long-Term Value Creation FAIRMOUNT SANTROL |
 “Staying True” to All 3 Pillars of Sustainable Development
5 FAIRMOUNT SANTROL 334 Connections profiles completed AI / Communi- cations 973 Course offerings completed Empower U 9,826 Total hours paid volunteer time Social Resp. Team 1.2 Total Case Incident Rate 4% reduction Safety 27 Zero- waste-to- landfill facilities, 3R Team |
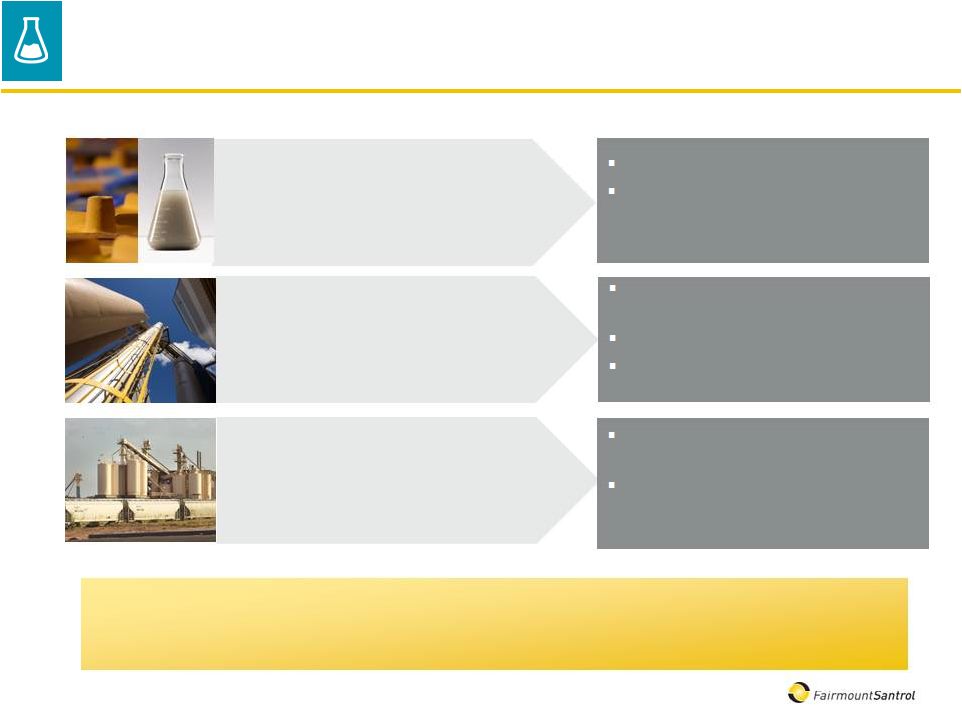 PRODUCT PORTFOLIO Deliver value to most technically demanding customers 6 Innovation Throughout Our Organization TECHNOLOGY & INNOVATION OPERATIONS Leveraging proprietary manufacturing processes ADMINISTRATION & TECHNICAL SERVICES Using innovation across both Proppant Solutions and I&R Continual innovation in all aspects of organization is core to Fairmount Santrol
Patented & proprietary resins
Innovative and cost-effective coated
products to address downhole completion
challenges
Proprietary coating processes for Resin-
Coated Sands and Propel SSP®
Proprietary mining & sand processing
Vertical integration enabling manufacturing
of proprietary resins
Continuous improvement and tech support
of existing products
Origin-destination pairing optimization to
reduce logistics costs, including the
utilization of unit trains |
 Propel SSP ® – Enhanced Productivity Driven by Design Optimization 7 Field Trial Stats 100+ wells 20+ E&Ps Field Trial Stats 100+ wells 20+ E&Ps Bakken/ Three Forks Canadian Bakken Codell/ Niobrara Mississippian Lime Utica Marcellus Eagle Ford Escondido Uinta Permian Pinedale Future Growth via Propel SSP 350 ® (brackish & produced water markets) Field Trial Areas Case Study Eagle Ford +45% TECHNOLOGY & INNOVATION +21% Months Months |
 -50% -50% -20% 0% -100% -20% -20% -80% -100% -100% -100% -90% -80% -70% -60% -50% -40% -30% -20% -10% 0% Water Usage Pumping Time Additive Usage Water Heating Screenouts Slickwater Crosslinked Gel 8 Propel SSP ® – Operational Efficiency and Flexibility TECHNOLOGY & INNOVATION Significant operational efficiency and flexibility compared to traditional well designs:
Allows service companies to increase utilization of their own
resources; important as completion resources
tighten Propel SSP 350
®
product line extension allows for flexibility in water usage, including
brackish and produced water
|
 99.9% pure silica 9 Only Integrated I&R Sand and Resin Solutions Provider CHARACTERISTICS TARGET MARKETS Construction Foundries Glass manufacturing Golf courses Colored play sand Sports turf Water filtration +200 engineered sand- based resin products Construction Foundries Expert custom blends of minerals, aggregates, colorants, epoxies and polymers Construction Specialty products Sports & recreation HIGHER VALUE-ADD High-quality traditional foundry resin systems and proprietary resin development for advanced resin-coated proppants Foundries HIGH-PURITY SANDS ENGINEERED RESIN-COATED SANDS CUSTOM BLENDING HIGH-PERFORMANCE RESIN SYSTEMS BROAD PRODUCT PORTFOLIO – INDUSTRIAL & RECREATIONAL PRODUCTS/ |
 High-Purity Northern White Silica Sands Tier 2 regional sand Precured Resin- Coated Sand Highest strength Increased flowback protection Curable Resin- Coated Sand Highest flowback protection Increased strength Texas Gold ® Frac Sand Tier 1 99.8% pure silica 10 Products to Address All Well Environments BROAD PRODUCT PORTFOLIO – Proppant coating that enhances well productivity and operational efficiency through improved proppant transport and frac geometry optimization PRODUCTS/ APPLICATIONS Lower-cost, API-certified sand applications High-temperature / high-pressure wells where the proppant needs extra strength & fines encapsulation Wells where flowback is a challenge Medium cost, delivers higher productivity versus regional sands In any well to optimize water, chemical and horsepower required to place the targeted proppant volume and mesh size RAW SAND Propel SSP ® HIGHER PRODUCTIVITY RESIN-COATED SAND TRANSPORT TECHNOLOGY HIGHER CRUSH STRENGTH WELL PRESSURE¹ (1) – Based on 40/70 substrate Up to 6,000 psi Up to 9,000 psi Up to 14,000 psi Up to 16,000 psi Dependent on underlying proppant PROPPANT SOLUTIONS CHARACTERISTICS |
 11 Broad Asset Base Provides Flexibility and Efficiency Nearly 750 million tons of proven reserves, allowing for long-term organic growth Locations, grade mixes and logistic capabilities provide flexibility Low-cost Wedron facility represents over 60% of active frac sand capacity Ability to reopen idled facilities quickly and with minimal investment to add roughly 2 million tons of annual frac sand capacity 1.6 million tons of active annual coating capacity Evaluating options to add capacity through either greenfield or brownfield expansion FAIRMOUNT SANTROL STATED ANNUAL RAW FRAC SAND CAPACITY (in millions of tons) Wedron Voca Menomonie Maiden Rock Brewer Idled Facilities (3 plants) 2.0 4.0 6.0 8.0 10.0 12.0 14.0 Total Stated Capacity 13.9 OPERATIONAL SCALE & EFFICIENCIES - |
 12 Logistics Footprint in All Key Basins OPERATIONAL SCALE & EXTENSIVE DISTRIBUTION Canada FMSA Terminal FMSA Mining & Processing Unit Train Destination Unit Train Origin (Mining & Processing) 10 unit train capable terminals Over 40 terminals in heart of completions activity Terminals closer to wells reduce last-mile costs Coating Operation |
 13 Leveraging Our Unit Train Capabilities 10 unit-train capable terminals One additional unit train terminal in process Unit trains can lower delivered cost by $6-$10/ton and increase delivery speed
Unit trains increase rail car turns and overall efficiency of rail car
fleet EXTENSIVE DISTRIBUTION AND UNIT TRAIN
CAPABILITIES 0%
20% 40% 60% 80% 2014 2015 2016 1Q 2017 PERCENTAGE OF NORTHERN WHITE SAND SHIPPED VIA UNIT TRAIN |
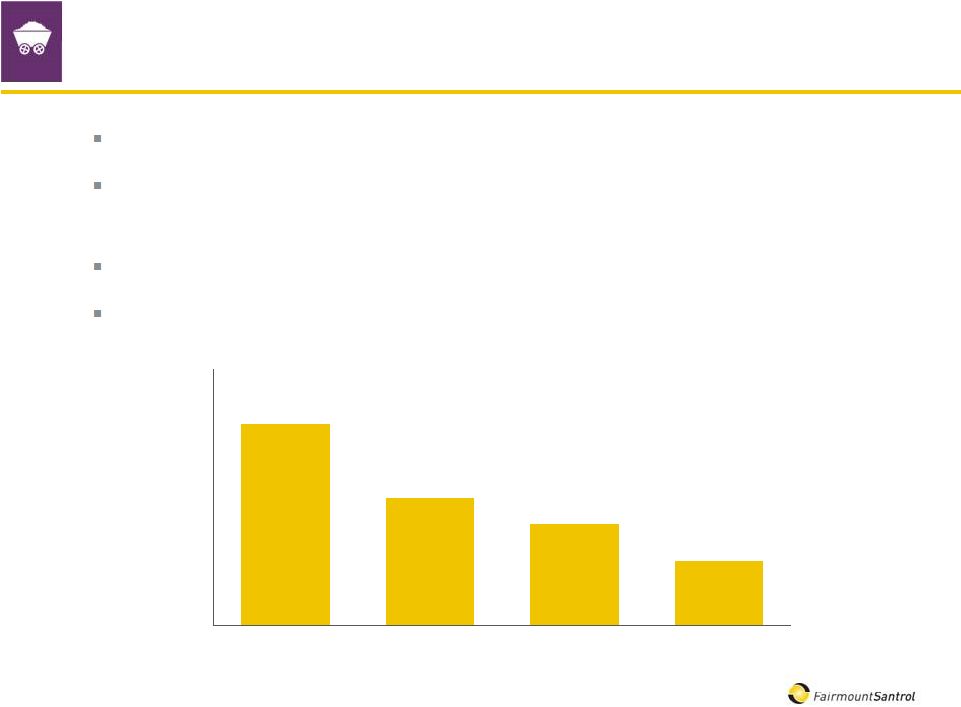 14 Rail Car Update Currently less than 800 cars in storage Expect all cars to be out of storage by end of 2Q 2017; excess rail car costs expected to
be zero in 3Q 2017
Deliveries deferred until 2020 and 2021 can be pulled forward if
necessary Will leverage customer cars and unit trains to
increase efficiency of fleet EXTENSIVE DISTRIBUTION AND
UNIT TRAIN CAPABILITIES $6.29
$3.99 $3.16 $2.01 $0 $2 $4 $6 $8 2Q 2016 3Q 2016 4Q 2016 1Q 2017 EXCESS RAIL CAR COSTS PER TON |
 Performance Update |
 16 Strong Start to 2017 for I&R VOLUMES 0.6 0.6 0.0 0.3 0.5 0.8 1Q-16 In Millions of Tons REVENUES 1Q-16 28.0 31.6 $0 $5 $10 $15 $20 $25 $30 $35 In Millions GROSS PROFIT 1Q-16 10.4 13.5 $0 $2 $4 $6 $8 $10 $12 $14 In Millions Focus on value-added products led to strong year-over-year profitability growth
1Q-17
1Q-17
1Q-17
+1% +13% +30% PERFORMANCE UPDATE INDUSTRIAL & RECREATIONAL |
 17 Good Proppant Solutions Growth in 1Q Despite Capacity Constraints
VOLUMES
1.8 2.1 0.0 0.6 1.1 1.7 2.2 4Q-16 In Millions of Tons REVENUES 4Q-16 113.4 141.0 $0 $50 $100 $150 In Millions GROSS PROFIT 4Q-16 17.1 27.3 $0 $7 $14 $21 $28 In Millions Capacity constraints limited volume growth, but pricing improvements and mix shift
to coated proppants contributed to strong profitability
growth 1Q-17
1Q-17
1Q-17
+13% +24% +60% PERFORMANCE UPDATE PROPPANT SOLUTIONS |
 18 Improving Financial Results in 1Q 2017 VOLUMES 2.4 2.7 0.0 0.6 1.1 1.7 2.2 2.8 4Q-16 In Millions of Tons REVENUES 4Q-16 140.5 172.6 $0 $60 $120 $180 In Millions GROSS PROFIT 4Q-16 28.3 40.8 $0 $14 $28 $42 In Millions Increased value-added sales across both segments along with improved pricing in
Proppant Solutions contributed to strong revenue and profitability
growth 1Q-17
1Q-17
1Q-17
+10% +23% +44% PERFORMANCE UPDATE FMSA TOTAL ADJUSTED EBITDA 4Q-16 11.7 21.7 $0 $5 $10 $15 $20 1Q-17 +85% In Millions |
 Lower Net Debt as Free Cash Flow Increases 19 Dec. 31, 2016 Mar. 31, 2017 Cash $194.1 $210.7 Debt 2015 B-1 Extended Due Sept. 2019 $117.6 $117.3 B-2 Due Sept. 2019 $719.6 $717.9 Other, net $5.8 $9.9 Total Long Term Debt $843.0 $845.1 Net Debt $648.9 $634.4 Capitalization Summary ($ in Millions) All significant debt matures in Sep. 2019 Ability to take advantage of improving market conditions Improved free cash flow in 1Q 2017 reduced net debt Recent actions by debt ratings agencies: Moody’s Caa1 rating affirmed with revised outlook to positive from negative S&P B- rating affirmed with revised outlook to neutral from negative Fitch initial rating of B- with stable outlook PERFORMANCE UPDATE |
 Looking Ahead |
 Improving proppant market with continued positive tailwinds Current rig count roughly 75% above 2016 average Increasing proppant intensity per well, driven by longer laterals and more proppant per stage
In addition to industry tailwinds, FMSA also experiencing:
Higher demand for coated proppants, driven by higher rig counts and
increased focus on flowback control and operational
efficiency Increasing demand for coarser grade
sands LOOKING AHEAD
Positive Tailwinds for the Proppant Market
21 Sources: (1) Baker Hughes (2) FMSA estimates based on public E&P presentations and internal estimates + PacWest Consulting Partners
~ +30%
4,600 -
5,000
5,600 -
6,000
~ +20%
3,600 -
4,000
300 350 400 450 500 550 650 700 750 2015 2016 2017 Est. 600 AVERAGE PROPPANT TONS PER U.S. HORIZONTAL WELL U.S. HORIZONTAL LAND RIG COUNT (1) (2) |
 22 Financial Outlook Second-quarter 2017 outlook Total expected volumes of 3.2 million to 3.5 million tons Proppant Solutions volumes expected to be driven by continued strong demand and additional
capacity coming online at Brewer and Maiden Rock locations
Proppant
solutions volumes to shift moderately toward FOB mine due to contract
structure for Maiden Rock and Brewer volumes and customer
preference I&R volumes expected to increase
moderately over 2Q 2016 levels Raw frac
sand pricing expected to increase $7 to $9 per ton on
average Further pricing increases expected in 3Q
2017 Proppant
Solutions cost per ton in 2Q 2017 expected to remain relatively flat to
up slightly from 1Q 2017 levels
Improved fixed cost leverage and lower excess rail car costs are
expected to offset increased production costs from Maiden
Rock and Brewer PERFORMANCE UPDATE
|
 23 Industry Leader Well-Positioned for Growth WHY INVEST IN FMSA? Technology & innovation Broad product portfolio Operational scale & efficiencies Distribution & unit train capabilities Higher rig counts Increased proppant intensity per well More focus on flowback protection and operational efficiency Continued solid demand in I&R STRONG MARKET DRIVERS KEY LONG-TERM DIFFERENTIATORS AND VALUE CREATORS Commitment to People, Planet & Prosperity |
 Appendix |
 25 Appendix: Reconciliation of Non-GAAP Financial Measures Adjusted EBITDA Three Months Ended, (in thousands) Mar. 31, 2017 Dec. 31, 2016 Net loss $(11,588) $(19,905) Interest expense, net 12,537 15,324 Provision (benefit) for income taxes (1,148) (655) Depreciation, depletion, and amortization expense 19,442 17,875 EBITDA $19,243 $12,639 Non-cash stock compensation expense 2,416 1,504 Asset Impairments 0 2,494 Write-off of deferred financing costs 0 2,618 Gain on repurchase of debt 0 (8,178) Transaction expenses associated with term loan repurchases 0 450 Other impairment charges 0 180 Adjusted EBITDA $21,659 $11,707 |
 26 Appendix: Total Facility Map Coating Operations Mining & Processing Oil & Gas Terminals Unit Train Destination U.S. OPERATIONS LOGISTICS NETWORK Industrial & Recreational Terminals Unit Train Origin Headquarters Research & Development Specialty Products Resin Manufacturing Administrative/Sales Offices On Demand Terminals |