Attached files
| file | filename |
|---|---|
| EX-99.1 - EX-99.1 - Bison Merger Sub I, LLC | d121619dex991.htm |
| EX-23.1 - EX-23.1 - Bison Merger Sub I, LLC | d121619dex231.htm |
| EX-21.1 - EX-21.1 - Bison Merger Sub I, LLC | d121619dex211.htm |
| EX-95.1 - EX-95.1 - Bison Merger Sub I, LLC | d121619dex951.htm |
| EX-31.1 - EX-31.1 - Bison Merger Sub I, LLC | d121619dex311.htm |
| EX-32.2 - EX-32.2 - Bison Merger Sub I, LLC | d121619dex322.htm |
| EX-31.2 - EX-31.2 - Bison Merger Sub I, LLC | d121619dex312.htm |
| EX-10.30 - EX-10.30 - Bison Merger Sub I, LLC | d121619dex1030.htm |
| EX-32.1 - EX-32.1 - Bison Merger Sub I, LLC | d121619dex321.htm |
Table of Contents
UNITED STATES
SECURITIES AND EXCHANGE COMMISSION
Washington, D.C. 20549
FORM 10-K
| x | ANNUAL REPORT PURSUANT TO SECTION 13 OR 15(d) OF THE SECURITIES EXCHANGE ACT OF 1934 |
For the fiscal year ended December 31, 2015
or
| ¨ | TRANSITION REPORT PURSUANT TO SECTION 13 OR 15(d) OF THE SECURITIES EXCHANGE ACT OF 1934 |
Commission File Number 001-36670
FAIRMOUNT SANTROL HOLDINGS INC.
(Exact name of registrant as specified in its charter)
| Delaware | 34-1831554 | |
| (State or Other Jurisdiction of Incorporation or Organization) |
(I.R.S. Employer Identification No.) |
8834 Mayfield Road
Chesterland, Ohio 44026
(Address of Principal Executive Offices) (Zip Code)
(800) 255-7263
(Registrant’s Telephone Number, Including Area Code)
Securities registered pursuant to Section 12(g) of the Securities Act:
| Title of each class: |
Name of each exchange on which registered: | |
| Common Stock, par value $0.01 per share | New York Stock Exchange |
Securities registered pursuant to Section 12(g) of the Securities Act: None
Indicate by check mark if the registrant is a well-known seasoned issuer, as defined in Rule 405 of the Securities Act. Yes ¨ No x
Indicate by check mark if the registrant is not required to file report pursuant to Section 13 or Section 15(d) of the Act. Yes ¨ No x
Indicate by check mark whether the registrant (1) has filed all reports required to be filed by Section 13 or 15(d) of the Securities Exchange Act of 1934 during the preceding 12 months (or for such shorter period that the registrant was required to file such reports), and (2) has been subject to such filing requirements for the past 90 days. Yes x No ¨
Indicate by check mark whether the registrant has submitted electronically and posted on its corporate Web site, if any, every Interactive Data File required to be submitted and posted pursuant to Rule 405 of Regulation S-T (§232.405 of this chapter) during the preceding 12 months (or for such shorter period that the registrant was required to submit and post such files). Yes x No ¨
Indicate by check mark if disclosure of delinquent filers pursuant to Item 405 of Regulation S-K (§229.405 of this chapter) is not contained herein, and will not be contained, to the best of the registrant’s knowledge, in definitive proxy or information statements incorporated by reference in Part III of this Form 10-K or any amendment to this Form 10-K. ¨
Indicate by check mark whether the registrant is a large accelerated filer, an accelerated filer, a non-accelerated filer, or a smaller reporting company. See the definitions of “large accelerated filer,” “accelerated filer” and “smaller reporting company” in Rule 12b-2 of the Exchange Act (Check one):
| Large accelerated filer | ¨ | Accelerated filer | x | |||
| Non-accelerated filer | ¨ | Smaller reporting company | ¨ |
Indicate by check mark whether the registrant is a shell company (as defined in Rule 12b-2 of the Exchange Act). Yes ¨ No x
The aggregate market value of common stock held by non-affiliates of the registrant computed by reference to the last sales price, $8.19 as reported on the New York Stock Exchange, of such common stock as of the closing of trading on June 30, 2015: $1,322,138,301
Number of shares of Common Stock outstanding, par value $0.01 per share, as of March 6, 2016: 161,433,248
DOCUMENTS INCORPORATED BY REFERENCE
| Part III of Form 10-K |
Certain sections of the Proxy Statement for the 2016 Annual Meeting of Stockholders of Fairmount Santrol Holdings Inc. |
Table of Contents
Fairmount Santrol Holdings Inc. and Subsidiaries
Annual Report on Form 10-K
For the Fiscal Year Ended December 31, 2015
Table of Contents
Introduction to Part I, Item 1A and Item 3, and Part II, Item 7
We define various terms to simplify the presentation of information in this Annual Report on Form 10-K (this “Report”). Unless we state otherwise or the context otherwise requires, the terms “we,” “us,” “our,” “Fairmount Santrol,” “our business” and “our company” refer to Fairmount Santrol Holdings Inc. and its consolidated subsidiaries and predecessor companies. We use Adjusted EBITDA herein as a non-GAAP measure of our financial performance. See further discussion of Adjusted EBITDA at Item 7 – Management’s Discussion and Analysis.
FORWARD-LOOKING STATEMENTS
This Report contains forward-looking statements that are subject to risks and uncertainties. All statements other than statements of historical fact included in this Report are forward-looking statements. Forward-looking statements give our current expectations and projections relating to our financial condition, results of operations, plans, objectives, future performance and business. You can identify forward-looking statements by the fact that they do not relate strictly to historical or current facts. These statements may include words such as “anticipate,” “estimate,” “expect,” “project,” “plan,” “intend,” “believe,” “may,” “will,” “should,” “can have,” “likely” and other words and terms of similar meaning in connection with any discussion of the timing or nature of future operating or financial performance or other events. For example, all statements we make relating to our estimated and projected costs, expenditures, cash flows, growth rates and financial results, our plans and objectives for future operations, growth or initiatives, strategies or the expected outcome or impact of pending or threatened litigation are forward-looking statements. All forward-looking statements are subject to risks and uncertainties that may cause actual results to differ materially from those that we expected, including:
| • | the level of activity in the oil and gas industries; |
| • | the level of cash flows generated to provide adequate liquidity to meet our debt obligations; |
| • | increasing costs or a lack of dependability or availability of transportation services or infrastructure and geographic shifts in demand; |
| • | our rights and ability to mine our properties and our renewal or receipt of the required permits and approvals from governmental authorities and other third parties; |
| • | decreased demand for sand-based proppants or the development of either effective alternative proppants or new processes to replace hydraulic fracturing; |
| • | fluctuations in and continuing pressure on market-based pricing; |
| • | our ability to complete greenfield development or expansion projects, or our ability to realize the benefits if we do complete them; |
| • | our ability to protect our intellectual property rights; |
| • | our ability to successfully develop and market Propel SSP; |
| • | our ability to succeed in competitive markets; |
| • | loss of, or reduction in, business from our largest customers; |
| • | our exposure to the credit risk of our customers and any potential material nonpayment or nonperformance by our customers; |
| • | fluctuations in demand for industrial and recreational sand; |
| • | operating risks that are beyond our control, such as changes in the price and availability of transportation, natural gas or electricity; unusual or unexpected geological formations or pressures; cave-ins, pit wall failures or rock falls; or unanticipated ground, grade or water conditions; |
| • | our dependence on our Wedron Silica sand-mining facility for a significant portion of our sales; |
1
Table of Contents
| • | the availability of raw materials to support our manufacturing of resin-coated proppants; |
| • | diminished access to water; |
| • | challenges to our title to our mineral properties and water rights; |
| • | our ability to successfully complete acquisitions or integrate acquired businesses; |
| • | our ability to make capital expenditures to maintain, develop and increase our asset base and our ability to obtain needed capital or financing on satisfactory terms, including financing for existing commitments such as future railcar deliveries; |
| • | substantial indebtedness and pension obligations; |
| • | restrictions imposed by our indebtedness on our current and future operations; |
| • | the accuracy of our estimates of our mineral reserves; |
| • | substantial costs of mine closures; |
| • | a shortage of skilled labor and rising labor costs in the mining industry; |
| • | increases in the prices of, or interruptions in the supply of, natural gas and electricity, or any other energy sources; |
| • | our ability to attract and retain key personnel; |
| • | our ability to maintain satisfactory labor relations; |
| • | silica-related health issues and corresponding litigation; |
| • | our ability to maintain effective quality control systems at our mining, processing and production facilities; |
| • | fluctuations in our sales and results of operations due to seasonality and other factors; |
| • | interruptions or failures in our information technology systems; |
| • | failure to comply with the provisions of the Foreign Corrupt Practices Act (FCPA); |
| • | significant impairment losses related to goodwill in relation to our acquisition of assets from FTS International Services, LLC (FTSI); |
| • | the impact of a terrorist attack or armed conflict; |
| • | cybersecurity breaches; |
| • | our failure to maintain adequate internal controls; |
| • | extensive and evolving environmental, mining, health and safety, licensing, reclamation and other regulation (and changes in their enforcement or interpretation); |
| • | our ability to acquire, maintain or renew financial assurances related to the reclamation and restoration of mining property; and |
| • | other factors disclosed in the section entitled “Risk Factors” and elsewhere in this Report. |
We derive many of our forward-looking statements from our operating budgets and forecasts, which are based on many detailed assumptions. While we believe that our assumptions are reasonable, we caution that it is very difficult to predict the impact of known factors, and it is impossible for us to anticipate all factors that could affect our actual results. Important factors that could cause actual results to differ materially from our expectations, or cautionary statements, are disclosed under the sections entitled “Risk Factors” and “Management’s Discussion and Analysis of Financial Condition and Results of Operations” in this Report. All written and oral forward-looking statements attributable to us, or persons acting on our behalf, are expressly
2
Table of Contents
qualified in their entirety by these cautionary statements as well as other cautionary statements that are made from time to time in our other SEC filings and public communications. You should evaluate all forward-looking statements made in this Report in the context of these risks and uncertainties.
We caution you that the important factors referenced above may not contain all of the factors that are important to you. In addition, we cannot assure you that we will realize the results or developments we expect or anticipate or, even if substantially realized, that they will result in the consequences or affect us or our operations in the way we expect. The forward-looking statements included in this Report are made only as of the date hereof. We undertake no obligation to update or revise any forward-looking statement as a result of new information, future events or otherwise, except as otherwise required by law.
Our Company
Business Overview
As of December 31, 2015, we are one of the world’s largest providers of sand-based proppant solutions and for nearly 40 years have been a pioneer in the development of high performance proppants used by Exploration & Production (“E&P”) companies to enhance the productivity of their oil and gas wells. We offer the broadest range of proppants available in the market today, including high quality sand and a variety of resin-coated products. All of our frac sand exceeds American Petroleum Institute (“API”) specifications. Additionally, for more than 120 years, we and our predecessor companies have provided high quality sand-based products, strong technical leadership and applications knowledge to end users in the Industrial & Recreational (“I&R”) markets.
As one of the industry leaders, our asset base includes 798 million tons of proven and probable mineral reserves, which we believe is one of the largest reserve bases in the industry. Due to the continuing challenging conditions in the oil and gas markets, we continue to adjust our operational footprint to minimize our costs and consolidate into the lowest-cost footprint possible. As of March 2016, we have 11 sand processing facilities (7 of which are active) with 14.8 million tons of annual sand processing capacity. In 2015, we closed our sand processing facility in Readfield, Wisconsin and Wexford, Michigan and idled our facilities in Brewer, Missouri, Shakopee, Minnesota, and Hager City, Wisconsin. We also have 10 coating facilities (6 of which are active) with 2.3 million tons of annual coating capacity. Our coating facilities include operations in Mexico, Denmark and China, through which we serve international oil and gas markets. In 2015, we closed our resin-coating facility in Bridgman, Michigan and idled resin-coating facilities in Voca, Texas and Cutler, Illinois and an SSP-coating facility in Fresno, Texas.
As one of the nation’s longest continuously operating mining organizations, we have developed a strong commitment to environmental stewardship and to the three pillars of Sustainable Development: People, Planet and Prosperity. Our strong commitment to safety is reflected in the health and safety of our employees and is illustrated by our achieving a consistently low recordable incident rate among our similarly sized industrial sand competitors as well as one of the lowest rates for all those reporting in the Industrial Mining Association of North America. Since 2011, our employees have demonstrated our commitment to our communities by donating nearly 67,000 hours of company-paid volunteer hours, as well as significant personal volunteer hours, into the communities in which we live and operate. We are focused on environmental stewardship, and 30 of our facilities now generate zero waste to landfills. Additionally, we executed upon annual initiatives to reduce our carbon emissions and have planted over 395,000 trees since 2011 in order to offset our remaining Tier I and Tier 2 emissions. We believe adhering to sustainable development principles is not only the right thing to do, but also results in a higher level of engagement and commitment from our employees, better relationships with our communities and, as a result, a stronger base from which to pursue profitable growth over the long-term. Abiding by these guiding principles, our corporate motto is “Do Good. Do Well.”
In the early 1980s, we pioneered investment in large scale proppant production capacity, leveraging our early industry relationships with Halliburton and a predecessor company to Baker Hughes. Since then, our business,
3
Table of Contents
and particularly our Proppant Solutions segment, has grown significantly. Over a period of nearly 40 years, Fairmount Santrol has built a vertically integrated operation that combines mining, sand processing, resin manufacturing and coating operations with a broad logistics network and state-of-the-art research and development capabilities. In the past few years, we also have invested nearly $500 million to acquire mineral reserves, raw and resin-coated sand processing capacity, additional distribution terminals, a long-term supply agreement, and a new coated proppant technology. Our ability to integrate and leverage our asset base to provide comprehensive proppant solutions has allowed us to become a long-term, trusted partner to our customers.
We are capable of Class I railroad deliveries to each of North America’s major oil and gas producing basins and also have the flexibility to ship our product via barge, marine terminals and trucks to reach our customers as needed. We operate an integrated logistics platform consisting of 43 proppant distribution terminals and a fleet of approximately 10,100 railcars (net of subleases). We have expanded our unit train capabilities to now include two production facilities and seven in-basin terminals, which reduce freight costs and improve cycle times for our railcar fleet. In order to better align our logistics network with customer demand and to reduce costs, we discontinued activity at ten transloading terminals and opened seven new terminals in 2015.
Our operations are organized into two segments based on the primary end markets we serve: (i) Proppant Solutions and (ii) Industrial & Recreational (I&R) Products. Our Proppant Solutions segment predominantly provides sand-based proppants for use in hydraulic fracturing operations throughout the U.S. and Canada, Argentina, Mexico, China, northern Europe and the United Arab Emirates. Our I&R segment provides raw, coated, and custom blended sands to the foundry, building products, glass, turf and landscape and filtration industries primarily in North America. We believe our two market segments are complementary. Our ability to sell to a wide range of customers across multiple end markets allows us to maximize the recovery of our reserve base within our mining operations and to reduce the cyclicality of our earnings.
In 2015, our Proppant Solutions segment sold 6.2 million tons of proppant with revenues of $710 million (86% of total company revenues) and contribution margin of $71 million, which represent decreases of 14%, 42%, and 84%, respectively, from 2014. Proppants represented approximately 91% and 87% of total company revenues for 2014 and 2013, respectively. For 2015, our I&R Products segment had sales volume of 2.3 million tons with revenues of $119 million and contribution margin of $25 million, which represent decreases of 5%, 5%, and 27%, respectively, from 2014.
Corporate History
We were incorporated as a Delaware corporation in 1986. Our predecessor companies began operations over 120 years ago. In August 2010, we partnered with American Securities LLC (“American Securities”) when affiliated funds managed by American Securities (collectively with American Securities, the “AS Group”) acquired indirect control over ASP FML Holdings, LLC (“ASP FML”), who acquired 51% of our stock (the “AS Group Acquisition”).
On October 3, 2014, we completed an Initial Public Offering of 25 million shares of our common stock at an offering price of $16.00 per share for aggregate proceeds of $400 million (the “IPO”). Our shareholders received net proceeds of approximately $379 million after deducting $21 million of underwriting discounts and commissions. We are listed under the ticker symbol “FMSA” on the New York Stock Exchange.
Our corporate headquarters is located at 8834 Mayfield Road, Chesterland, Ohio 44026. Our telephone number is (800) 255-7263. Our company website is www.fairmountsantrol.com. We make available free of charge our annual report on Form 10-K, quarterly reports on Form 10-Q, current reports on Form 8-K, and amendments to those reports as soon as reasonably practicable after we file or furnish such reports to the Securities and Exchange Commission (the “SEC”). The information on our website is not incorporated by reference in or considered to be a part of this Annual Report on Form 10-K.
4
Table of Contents
Our Competitive Strengths
We believe we distinguish ourselves from other proppant providers through the following capabilities:
Industry-Leading Asset Base. Our industry-leading asset base includes 798 million tons of proven mineral reserves, 11 sand processing facilities (7 of which are active) with 14.8 million tons of annual sand processing capacity, and 10 coating facilities (6 of which are active) with 2.3 million tons of annual coating capacity. We serve international markets through our coating facilities in Mexico, Denmark, and China.
Leading Proppant Producer; Broadest Product Suite. We have a broad suite of products that address a vast majority of the proppant market. We are one of the largest producers of API-spec raw frac sand and we believe we have among the largest production capacities of both raw frac sand and resin-coated sand. Our raw sand product suite includes all mesh sizes of high performing Northern White frac sand and our branded Texas Gold API-spec brown frac sand, which has a delivered cost advantage to certain basins, including the Eagle Ford, Permian Basin and East Texas. Our portfolio of resin-coated products provides a range of strength, flowback, and conductivity characteristics, the strongest of which offers characteristics similar to lightweight ceramic proppant. Our product breadth allows us to offer a comprehensive proppant solution across a broad range of well characteristics and our scale provides us with the flexibility to fill large individual orders, often on short notice. As proppant consumption per well has increased through 2015, we believe that our scale and product breadth allow us to be more flexible than our competitors and provides us with a competitive advantage.
Efficient Operations and Economies of Scale. Our vertically integrated operations, low production costs and low maintenance capital expenditures have enabled us to generate strong margins and cash flows over an extended period. We own a substantial majority of our reserves (royalties were less than 0.2% of sales in 2015), and our processing plants are located on or in close proximity to rail access, reducing the need for on-road transportation and minimizing product movement costs. Our integrated logistics management expertise and geographically-advantaged facility network enables us to reliably ship products by the most cost-effective method available.
One of the Industry’s Largest Captive Terminal Footprint and Broadest Logistics Capabilities. In recent years, oilfield service companies increasingly sought proppant suppliers with logistics capabilities to deliver product in-basin. We sell our proppants directly to customers in all of North America’s major oil and gas producing basins through our 43 active proppant distribution terminals, which collectively comprise one of the largest logistics networks in the sector. In 2015, approximately 75% of our North American proppant volume was sold at one of our distribution terminals. We ship our products via all of North America’s Class I railroads in our fleet of more than 10,100 railcars (net of subleases), which includes approximately 1,200 railcars made available to us from our customers. We have expanded our unit train capabilities to two of our processing facilities and seven of our in-basin terminals. We expect that these unit train capabilities will significantly reduce freight costs and improve cycle times for our railcar fleet. We also have the flexibility to ship our product via barge and trucks to multiple basins. Importantly, approximately 75% of our terminals are exclusive to us. In contrast to commingled terminals, which support proppant logistics for multiple vendors, our captive terminals enable us to better ensure timely delivery of proppants to our customers and position us to capture incremental spot demand at the terminal site. Taken together, we believe the significant scale our distribution network, its geographic scope, and our captive terminal strategy provide us with a competitive advantage.
Trusted Partner to our Customers. We are a trusted partner and have significant long-term relationships with each of the four largest oilfield service companies, as well as many small and mid-sized service companies. These customer relationships are driven by our ability to enhance our customers’ operations and profitability by delivering a full suite of high-quality proppant products, where, when and as-needed. These benefits also extend to the E&P companies serviced by our service company customers, who directly benefit from the enhanced well productivity that our products offer. We believe our customers value the ability of our substantial scale, product diversity and extensive logistics network to meet their evolving proppant needs.
5
Table of Contents
Focus on Innovation and New Product Development. We have a history of collaborating with our customers to develop innovative solutions to enhance the effectiveness of well completions, from conventional wells to the most complex, multi-stage, horizontal wells. Our vertically-integrated model allows us to participate in each phase of proppant development, manufacturing, and delivery and provides us with a unique perspective into the current and future needs of our customers. These developments include value-added products such as OptiProp, SLC, THS, PowerProp and CoolSet, each with uniquely tailored down-hole performance characteristics. After acquiring the technology that underlies Propel SSP in April 2013, our team has refined the technology and manufacturing techniques, and received patent protection for a portion of the technology in early 2016. We now are capable of producing Propel SSP in two manufacturing plants. Propel SSP is currently undergoing field trials with wells in seven domestic basins, as well as our first export transport outside North America. Using data supporting enhanced hydrocarbon recoveries, our technical sales team works closely with market participants to demonstrate the value proposition of our performance proppants in order to stimulate market demand.
Experienced Management Team Aligned with Shareholders. We have an experienced leadership team with extensive industry knowledge and a proven track record of profitable growth. Many members of our executive management team have been at Fairmount Santrol for 20 years or more. Our founders remain active advisors to our management and are members of our Board of Directors. Our management, employees, founders, and Board of Directors currently own nearly 60% our outstanding common stock. Accordingly, our executive management team and our employees are aligned with our investors and highly incentivized to pursue long-term, profitable growth and a high return on capital deployed.
Our Strategy
Our objective is to create long-term and sustainable value for our stakeholders. We intend to pursue this objective through the execution of the following strategies:
| • | Proactively maintain low cost operations. We have significant experience in operating sand mines and processing and coating plants and believe that our costs of production compare very favorably to our competition. In recent years, we have made investments in unit train-capable destinations at two production facilities and seven in-basin terminals in order to reduce delivery costs and improve the efficiency of our railcar fleet. We have invested in operating and logistics technology and processes to enable us to reduce costs and optimize the sourcing from our various plants to our network of terminals in order to maximize profitability and better serve our customers. Further, as demand for proppants declined in 2015, we proactively closed or idled higher-cost, excess capacity in order to consolidate our operations into a more cost-effective footprint. In addition, we have taken actions to reduce selling, general and administrative costs, balancing cost reductions with maintaining capabilities to capture growth when demand for proppant recovers. We will continue to take actions as market conditions warrant to improve our low cost operating position. |
| • | Prudently Increase Reserves and Processing Capacity. We have historically grown our reserves and mining and processing capacities by developing greenfield sites, expanding existing facilities and acquiring operating assets and reserves. In 2014, we undertook a project of ensuring that adequate productive capacity would be available to meet the then-projected customer demand and expanded the annual production capacity at our Wedron, Illinois facility by 0.5 million tons and the effective capacity of our Voca, Texas (which produces our Texas Gold frac sand) by 0.5 million tons. In order to leverage our low cost capacity and to secure unit train capability, we substantially completed expansion of our Wedron, Illinois facility by 3 million tons in 2015 and we expect it to become fully operational in the second quarter of 2016. In addition to these expansions, we control, or have an option to control, additional reserves on several properties that produce both Northern White and Texas Gold raw frac sand. |
| • | Logistics Capabilities. We believe that our market-leading delivery infrastructure and capabilities provide significant value to our customers as certain of our customers lack effective delivery |
6
Table of Contents
| infrastructures for getting proppant to the basin. As of December 31, 2015, we have 43 active proppant distribution terminals located in all major oil and gas producing basins in the U.S. Our unit train capabilities allow us to deliver product to our terminals efficiently and, subject to market conditions, we will continue to enhance our unit train capabilities to reduce freight costs and improve cycle times for our rail car fleet. For customers with their own delivery infrastructure, our unit train capabilities allow us to deliver product to their terminals cost-effectively. As of December 31, 2015, we have a total fleet of approximately 10,100 railcars (net of subleases) to support our delivery capabilities. During 2015, declining demand coupled with the delivery of previously ordered railcars has caused us to have more railcars than we need to operate the business. As of December 31, 2015, we had approximately 4,500 railcars in storage. In order to proactively manage our railcar inventory, we reached an agreement in 2015 with railcar suppliers to defer all of the 2016-scheduled deliveries to 2017 and 2018 in exchange for an acceleration of approximately 600 railcars into 2015 in order to take advantage of certain lease financing commitments. We also continue to sublease railcars and have approximately 2,900 railcar leases scheduled to expire during 2016 and 2017. |
| • | Increase Market Penetration of Our Resin-Coated Proppants. We believe that resin-coated proppants offer compelling performance advantages relative to other proppants. Our field data indicates that high quality resin-coated proppants enhance oil and gas reservoir conductivity compared to raw frac sand and is a cost-effective alternative to light weight ceramic proppants. Field data also indicates that resin-coated proppants reduce proppant flow back. Our resin-coating capacity is the largest in the industry, providing our customers assurance of supply. Due to its superior performance and value-added processing, our resin-coated products continue to generate a higher per ton profit as compared to our raw frac sand. We will continue to work with market participants by hosting technical sales meetings, obtaining field data, and producing scientific papers which highlight the value proposition of resin-coated proppant. Through these efforts, we will seek to increase overall market penetration of our resin-coated proppant and to displace competing resin-coated proppants. In 2015, we experienced a decline in demand for resin-coated proppants, as customers attempted to lower well completion costs. |
| • | Develop and Commercialize High Performance Proprietary Proppants. We have a history of developing innovative technologies that increase the effectiveness of well completions, from conventional wells to the most complex, multi-stage horizontal wells. We have a new state-of-the-art research and development facility and a team of scientists, material engineers and process engineers focused on developing innovative and proprietary proppants. As a result of our commitment, our new product development record is strong. For example, we successfully developed and commercialized CoolSet, a curable resin-coated sand proppant that bonds at low temperatures with no chemical activators. We also are currently conducting an increasing number of field trials for Propel SSP, a self-suspending proppant. We have established commercial processing capability for this product. A patent for certain of the Propel SSP technology was received in early 2016. We are maintaining a regular dialogue with our customers regarding evolving product needs and maintain a robust pipeline of new products in various stages of development. |
| • | Execute all of our Corporate Initiatives with a Commitment to Customers, Employees and Communities. Our corporate culture emphasizes People, Planet and Prosperity, and our strategy of sustainable development defines our approach to operations and community engagement. We work to minimize our environmental impact and continue to find ways to reduce waste while also reducing operating costs. We are honored to receive recognition from our communities for our focus on sustainable mining practices, reclamation and community investment. We believe that positive community engagement is both a privilege and a responsibility, and that it enhances our ability to recruit and retain employees, obtain mining and other operating permits and strengthen relationships with our customers. Our corporate motto is “Do Good. Do Well” and we intend to continue to execute our growth strategy with a focus on sustainable development. |
7
Table of Contents
INDUSTRY
Overview
The silica sand industry consists of businesses that are involved in the mining, processing, and sale of silica sand and silica sand-based products. Monocrystalline silica, also referred to as “silica,” “industrial sand and gravel,” “silica sand,” and “quartz sand,” is a term applied to sands and gravels containing a high percentage of silica (also known as silicon dioxide or SiO2) in the form of quartz. Monocrystalline silica deposits with widely varying physical characteristics occur throughout the United States, but mines and processing facilities are typically developed near rail infrastructure which facilitates access to markets. Other factors affecting the feasibility of monocrystalline silica production include deposit composition, product quality specifications, land-use, environmental regulation, permitting requirements, access to electricity, gas and water, and production expertise and know-how.
The low relative cost and special properties of monocrystalline silica—chemistry, purity, grain size, color, inertness, hardness, and resistance to high temperatures—make it critical to a variety of industries and end-use markets, including the production of molds and cores for metal castings, glass production, and the manufacturing of building products. In particular, monocrystalline silica is a key input in the hydraulic fracturing techniques used in the development of oil and gas resource basins.
Frac Sand Extraction, Processing, and Distribution
Raw frac sand is a naturally occurring mineral that is mined and processed. While the specific extraction method utilized depends primarily on the geologic conditions, most raw frac sand is mined using conventional open-pit extraction methods. The composition, depth, and chemical purity of the sand also dictate the processing method and equipment utilized. For example, broken rock from a sandstone deposit may require one, two, or three stages of crushing to produce sand grains that meet API specifications. In contrast, unconsolidated deposits may require little or no crushing during the excavation process. After extraction, raw frac sand is washed with water to remove fine impurities such as clay and organic particles, with additional procedures used when contaminants are not easily removable. The final steps in the production process involve the drying and screening of the raw frac sand according to mesh size.
Most frac sand is shipped in bulk from the processing facility to customers by truck, rail or barge. Because transportation costs represent a significant portion of the overall delivered product cost, shipping in large quantities, particularly when shipping over long distances, provides a significant cost advantage to the suppliers, which highlights the importance of rail or barge access for low cost delivery. As a result, facility location and logistics capabilities are an important consideration for suppliers and customers. In addition, we believe that, over time, the largest proppant customers would prefer to consolidate their purchases across a smaller group of suppliers with robust logistics capabilities and a broad offering of high performance proppants.
Oil and Gas Proppant Market
Advances in oil and gas extraction techniques, such as horizontal drilling and hydraulic fracturing, have allowed for significantly greater extraction of oil and gas trapped within shale formations. The hydraulic fracturing process consists of pumping fluids down a well at pressures sufficient to create fractures in the targeted hydrocarbon-bearing rock formation in order to increase the flow rate of hydrocarbons from the well. A granular material, called proppant, is suspended and transported in the fluid and fills the fracture, “propping” it open once high-pressure pumping stops. The proppant-filled fracture creates a conductive channel through which the hydrocarbons can flow more freely from the formation into the wellbore and then to the surface. Proppants therefore perform the vital function of promoting the flow, or conductivity, of hydrocarbons over a well’s productive life. In fracturing a well, operators select a proppant that is transportable into the fracture, is compatible with frac and wellbore fluids, permits acceptable cleanup of frac fluids and can resist proppant flowback. In addition, the proppant must be resistant to crushing under the earth’s closure stress and reservoir temperature.
8
Table of Contents
There are three primary types of proppant that are utilized in the hydraulic fracturing process: raw frac sand, resin-coated sand and manufactured ceramic beads. Customers choose among these proppant types based on the geology of the reservoir, expected well pressures, proppant flowback concerns, and product cost. Given the price differences between the various proppant products and well-specific considerations, E&P companies are continually evaluating the optimal mix of lower-cost, lower-conductivity frac sand and higher-cost, higher-conductivity resin-coated sand and ceramics in order to best address the geology of the well and to maximize well productivity and economic returns.
Proppant Characteristics
Proppants must meet stringent technical specifications set forth by the API including, among others, coarseness, crush resistance, sphericity, roundness, acid solubility, purity, and turbidity. These characteristics are of particular importance because they have a significant impact on hydrocarbon conductivity, and ultimately the production rate and profitability of a well. Conductivity is a function of the permeability of the proppant and the width of the fracture, which dictates the proppant’s ability to prop open a fracture and allow hydrocarbons to flow. Some of the key characteristics impacting conductivity are:
Coarseness. Proppant grain size is critical to hydraulic fracturing operations in order to satisfy down-hole conditions and well-completion design. Mesh size is used to describe proppant grain size and is determined by sieving the proppant through screens with uniform openings corresponding to the desired grain size. The vast majority of products range from 12 to 100 mesh (representing the number of openings per linear inch on a sizing screen) and include standard sizes, such as 12/20, 16/30, 20/40, 30/50 and 40/70. In general, notwithstanding strength characteristics, a larger and more uniformly distributed proppant size will result in higher permeability and conductivity.
Crush Resistance. Crush resistance is an important factor in fracturing applications where downhole pressures intensify. Proppant crush results in finer particles, or “fines,” which reduce permeability in the proppant pack and narrow the fracture width, all leading to reduced conductivity. Generally, the more pure the grain and the smaller its size, the better the proppant’s crush resistance. Resin-coated sand proppants have a higher resistance to crush and are suitable for intermediate to high pressure closure stress of up to 12,000 psi, and ceramics have the greatest resistance to crush and are suitable for intermediate to the highest pressure closure stress of up to 15,000 psi.
Proppant Shape and Uniformity. Proppant shape influences proppant pack space, permeability, and conductivity. For optimal long-term conductivity, the proppant particles should have an optimized spherical shape and roundness (roundness is a measure of the relative sharpness of corners and curvatures), as well as uniform size and shape distribution.
Low Acid Solubility. There are various frac-related applications wherein the proppant may come into contact with acid. Therefore, proppant stability in acidic environments can be an important attribute.
Purity. The greater the monocrystalline silica composition in a grain of silica sand, the stronger the grain and the lower instances of chemical reactions.
Turbidity. Turbidity is a measure of the level of particles or fines in the proppant, such as silt and clay. High turbidity can be an indication of poor proppant manufacturing, transportation or handling practices, or inherent geological characteristics of the ultimate sand reserves. High-turbidity proppants can interfere with fractures, negatively impacting conductivity.
9
Table of Contents
Proppant Types
Comparison of Key Proppant Characteristics
The following table sets forth what we believe to be the key comparative characteristics of our products and the three primary types of proppant:
| Raw Frac Sand | Resin-coated | Ceramics | ||||
| Products and Characteristics |
• Natural Resource |
• Raw frac sand substrate with resin coating |
• Manufactured product | |||
| • Primary Types include Northern White, Brown |
• Coating increases crush resistance |
• Typically highest crush resistance | ||||
| • Quality of sand varies widely depending on source |
• Bond together to prevent proppant flowback |
|||||
| Relative Crush Resistance(1) |
Up to 6,000 psi | Up to 10,000 psi | Up to 15,000 psi | |||
| Fairmount Santrol Product(2) |
Yes | Yes | No(2) | |||
| (1) | Crush resistance within a product category will vary by differing proppant characteristics including, size, roundness, purity, type of coating, etc. For purposes of relative comparability, we are showing recommended well pressures for 20/40 Northern White raw frac sand, 20/40 THS and OptiProp (Fairmount’s resin-coated sand products), and 20/40 high strength ceramics. |
| (2) | Fairmount Santrol’s PowerProp product competes with lightweight ceramics offered by competitors. |
Raw Frac Sand
Of the three primary types of proppant, raw frac sand represents the lowest cost and largest volume of proppant supplied to oilfield service providers and operators. Raw frac sand is ideally suited for wells with relatively lower levels of closure pressure. Generally, raw frac sand is produced and sold in whole grain (unground) form. There are two broad types of API spec raw frac sand: Northern White and brown, both of which are produced by Fairmount Santrol.
Northern White frac sand is considered to be the highest quality raw frac sand available and is known for its high crush resistance, roundness and sphericity and monocrystalline grain structure. Northern White frac sand exists predominantly in the upper Midwest region of the United States (including Wisconsin, Illinois and Minnesota). Fairmount Santrol’s Northern White sand is a spherical monocrystalline that is 99.8%+ pure-quartz and has superior conductivity and crush resistance compared to other types of raw frac sand.
Brown sand is less monocrystalline in nature and more angular than Northern White sand. Brown sand consists of both API and non-API spec material. API-spec brown sand, such as Fairmount Santrol’s Texas Gold sand, is mined from the Hickory Formation near Brady, Texas. Brown sand typically has lower crush resistance than Northern White, but is often sufficient for lower pressure wells. Due to its proximity to the well, Fairmount’s Texas Gold has a meaningful delivered cost advantage into key basins in South and West Texas, including the Eagle Ford Shale and the Permian Basin.
Resin-coated Sand
Resin-coated frac sand consists of raw frac sand that is coated with a resin that increases the sand’s crush resistance and reduces the likelihood of crushed sand dispersing throughout the fracture. Resin-coated sand withstands significant reservoir pressures and results in higher conductivity than raw frac sand. Consequently,
10
Table of Contents
resin-coated sand is ideally suited for wells with intermediate to high levels of closure stress, or for wells where reducing proppant flowback is a key consideration. By reducing proppant flowback, resin-coated sand reduces the potential downtime and cost of a well as well as increasing long-term productivity of the well.
Manufactured Ceramic Proppant
Manufactured ceramic proppant is a product of comparatively consistent size and spherical shape that typically offers the highest crush resistance relative to other types of proppants.
Proppant Industry Demand Trends
Over the past decade, E&P companies increasingly focused on exploiting the vast hydrocarbon reserves contained in North America’s oil and gas reservoirs. Using advanced techniques, such as horizontal drilling and hydraulic fracturing, North American production of oil and gas has grown rapidly as the development of horizontal drilling technologies has evolved. More recently, E&P companies increased their focus on optimizing the use of proppant as a critical component of these efforts to improve well productivity and maximize their returns on invested capital.
This focus on efficiency and profitability led to new development techniques, such as increased use of pad drilling which resulted in a greater number of wells drilled per rig, and incorporated longer lateral lengths and shorter intervals between frac stages, which resulted in more fracturing stages per well. In addition, the amount of proppant used per stage increased dramatically, compounding the increase in total demand for proppant.
As a result of these trends, North American demand for all proppants increased rapidly over the past ten years. This growth was fueled by the continued increase in both wells drilled and proppant used per well. Individual wells were being completed with as much as 20,000 tons of proppant, or 60 to 100 railcars. This represented a significant increase in the usage of proppant per well over just a few years ago and was driven by improved recovery rates for E&P companies at higher levels of proppant intensity.
Starting in the fourth quarter of 2014 and continuing through 2015, increasing global supply of oil, in conjunction with decline in global oil demand, has created downward pressure on crude oil prices. As a result, various operators have cut back on drilling and capital programs, resulting in significantly reduced rig counts. Therefore, according to Baker Hughes rig count data, North American rig counts have fallen considerably from 2,360 in September 2014 to 826 in December 2015, which has resulted in reduced drilling activity and negatively impacted the demand for proppants. Further, lower crude oil prices have caused E&P companies to seek ways to reduce operating costs, which has further reduced demand for our value-added products such as resin-coated proppants. We believe that the completion of wells that have been drilled and increased proppant usage per well will continue to help partially offset reduced demand for proppants from lower drilling activity in 2015 and beyond. It is unclear when global oil prices will begin to recover, leading to increased drilling activity and demand for proppants, but we believe that North American drilling activity and demand for proppants will grow over the long term.
Proppant Industry Supply Trends
To keep pace with rapidly growing demand, the available supply of proppant increased in 2014 through new entrants and capacity expansions of existing suppliers. However, according to the U.S. Energy Information Administration, as a result of the increasing global supply of oil, the world supply of liquid fuels now exceeds demand. This has resulted in downward pressure on the selling price of proppants, as well as the closing or idling of industry capacity in 2015. However, a portion of market supply consists of lower quality (“Tier 3”) sand, the demand for which will likely fall before demand for higher quality Northern White (“Tier 1”) and API Brown (“Tier 2”) sands. All of our reserves consist of Tiers 1 and 2 sands. The effectiveness of additional market supply also will be impacted by the suppliers’ ability to deliver product cost effectively where customers want it. To the
11
Table of Contents
extent that effective supply exceeds demand in the near term, there may be downward pressure on the selling price of proppants.
Other Proppant Products
We offer proppant products in each of the most common API-specified proppant categories, which we believe address a vast majority of the proppant market.
Northern White Frac Sand. Our Northern White frac sand is mined from deposits located in our Illinois, Wisconsin and Minnesota facilities. These reserves are generally characterized by high purity, significant roundness and sphericity, and low turbidity. All of our Northern White raw sand proppant products meet the standards set by the API.
API-Spec Brown Frac Sand. Our API-spec brown sand reserves are located in Texas and marketed under the name “Texas Gold.” Our Texas Gold frac sand has lower crush resistance than our Northern White frac sand, but it is an effective solution for low pressure wells. These reserves are in close proximity to major oil and gas producing basins in Texas, including the Eagle Ford Shale and the Permian Basin, which provides them with a significant transportation cost advantage relative to API-spec frac sand sourced from more distant locations.
Resin-coated Proppant. We coat a portion of our API-spec produced sand with resin to enhance its performance as a proppant using proprietary resin formulations and coating technologies. Our resin-coated proppants are generally used in higher temperature and higher pressure well environments and are marketed to end users who require increased conductivity in higher pressure wells, high crush resistance, and/or enhanced flow back control in order to enhance the productivity of their wells.
Our resin-coated sand products are sold as both tempered (or pre-cured) and curable (or bonding) products. Curable resin-coated sand bonds down hole as the formation heat causes neighboring resin-coated sand grains to polymerize with one another locking proppant into place. This prevents proppant from flowing back out of the fracture when the oil or natural gas well is turned on. For certain resin products, the resin’s chemical properties are triggered by the introduction of an activator into the frac fluid. Tempered products do not require activation because they are not intended to bond, rather bring additional strength to the proppant. We formulate, manufacture, and sell activators which work with the specific chemistry of our resins.
We manufacture proprietary coatings designed to address the evolving needs of our customers, and have recently invested significantly in our research and development and technical marketing capabilities to maximize the sales of our coated products. We also coat ceramic product purchased from third-party suppliers. This product is marketed as HyperProp and has the strength characteristics of ceramic and the flowback performance characteristics of resin-coated sand.
Proprietary Performance Products
Propel SSP. Our patented Propel SSP product utilizes a polymer coating applied to a proppant substrate. Upon contact with water, the coating hydrates and swells rapidly to create a hydrogel around the proppant substrate. The hydrogel layer, which is primarily water, is attached to the proppant particle and provides a nearly threefold increase in the hydrostatic radius of the proppant. Initial test results indicate that the lower specific gravity allows greater volumes of proppant and/or coarser mesh sizes coated with Propel SSP to be carried deep into the fracture, which in turn allow more hydrocarbons to escape into the wellbore. This technology reduces or eliminates the need for certain frac fluid additives, including guar, which are used to enhance the transport of proppants into the geologic formation.
12
Table of Contents
Our Product Delivery
We have established an oil and gas logistics network that we believe is highly responsive to our customers’ needs. One of the most important purchasing criteria of our proppant customers is our ability to deliver the products our customers demand at their desired time and location. We believe we have one of the industry’s largest distribution footprints with 43 active oil and gas distribution terminals. We also have a railcar fleet of approximately 10,100 railcars as of December 31, 2015, providing us the flexibility for delivering product to our locations in-basin when customers require it. We believe we are one of the few proppant producers capable of Class I railroad deliveries to each of North America’s major oil and gas-producing basins. In 2015, we shipped approximately 75% of our North American proppant volume through our terminal network. However, customers have recently shown a shift from in-basin deliveries to FOB plant purchases; the percentage of in-basin deliveries declined from over 85% in the first quarter of 2015 to approximately 65% in the fourth quarter of 2015.
The ability to ship proppant through unit trains is becoming increasingly important in order to cost-effectively provide the large quantities of product required by evolving well completion methods. We have unit train capabilities at two of our production facilities and seven of our terminals and shipped over 200 unit trains of product in 2015. The production unit train capability allows our customers that prefer to purchase the product FOB plant to efficiently ship the proppant to their own facilities. As a result the weakened demand for proppant in the declining oil and gas market, we have approximately 4,500 railcars in storage.
I&R Industry Trends
Demand in the I&R end markets is relatively stable and is primarily influenced by key macroeconomic drivers such as housing starts, light vehicle sales, repair and remodel activity, and industrial production. The economic downturn beginning in 2008 decreased demand in the foundry, building products, and glassmaking end markets, however, the recent economic recovery has significantly increased demand in these same end markets. The primary end markets served by our I&R segment are foundry, building products, sports and recreation, glassmaking, and filtration.
Our I&R Products
Foundry. We currently supply the foundry industry with multiple grades of high purity, round, angular, and sub-angular sands for molding and core-making applications, with products sold primarily in the U.S., Canada, Mexico, Japan, and China. Foundry sands are characterized by high purity, round and sub-angular sands precisely screened to perform under a variety of metal casting conditions. These factors dictate the refractory level and physical characteristics of the mold and core, which have a significant effect on the quality of the castings produced in the foundry. Our resin binders provide the necessary bonding of molds and cores in casting applications and are designed to improve overall productivity and environment conditions in the workplace.
Our extensive production experience and technical knowledge of the foundry industry have driven several industry advances. For example, we have developed our Signature Series of low smoke, low odor resin-coated sands that provide lower overall emissions while providing a safer and more favorable work environment. Our expertise with resin-coated sands enables us to provide coated sand for molds and cores where exceptional dimensional accuracy and surface finish are required.
We believe we were the first sand operator to blend sands, which has proven extremely successful for specialty iron and aluminum applications. As foundries continue to utilize higher cost binders to improve the quality of their castings, minimize the use of binders which also reduces overall environmental impact, the industry continues to demand higher quality sands to realize the value of these binders. Our chemists and technicians support these applications with customized products that minimize binder usage, resulting in lower costs to foundries and higher prices for our products.
13
Table of Contents
Glass. We provide a wide variety of high purity, low iron silica sands to the glass market. The glass industry uses industrial sand consumption for the production of windows, electronic display screens, photovoltaic panels, glass bottles, and other glass products.
Building Products. Various grades and types of our sands are used for roofing shingles, asphalt, industrial flooring ballast sand, bridge decking, pipe lining, and tank underlayment. We also work with our customers to blend minerals and chemicals to create colored flooring aggregates, concrete countertops, grout and plaster.
Sports and Recreation. We are a leading supplier of various turf and landscape infill products to contractors, municipalities, nurseries, and mass merchandisers. Our turf products are used in multiple major sporting venues, including First Energy Stadium, PNC Park, Notre Dame Stadium, and Progressive Field. In addition, we are a significant supplier of bunker sand, top dressing sands, and all-purpose sands to golf clubs and landscape contractors throughout North America. Our sands are also supplied to horse tracks and training facilities. We also provide colored sand to a variety of major retailers for use as play sand and arts and crafts.
Filtration. We provide high-quality industrial sands and gravels in a wide variety of water and wastewater filtration applications. Over the past several years, we increased our focus on the filtration market. Our full range of products are monitored with an active statistical process control program to ensure compliance with all government and customer specifications, including the American Water Works and National Sanitation Foundation standards. Due to our efforts, we have emerged as a leader in sand and gravel products for private, public, and institutional water filtration systems.
Our Customers
Since our inception, we have remained focused on developing and sustaining a loyal, diversified customer base. Currently, we maintain long-term contracts with many of the largest North American oilfield service companies. We believe the strength of our customer base is driven by our collaborative approach to product innovation and development, reputation for high-quality products, and extensive logistics network. Certain of our top customer relationships date back over 30 years. We have approximately 80 customers for our oil and gas proppants and over 850 customers across all our end markets. For the years ended December 31, 2015 and 2014, our top two customers, Halliburton and FTSI, collectively, accounted for approximately 43% and 36%, respectively, of our total sales revenues.
We primarily sell products under supply agreements with terms that vary by contract. Certain of the agreements require the customer to purchase a specified percentage of its proppant requirements from us. Other agreements require the customer to purchase a minimum volume of proppant from us. These minimum volume contracts typically include a “take-or-pay” or “take-or-penalty” provision which triggers certain penalties if the purchased volume does not meet the required minimums.
Research and Development and Technical Innovation
We have a history of partnering with our customers to develop innovative solutions to enhance the effectiveness of well completions, from conventional shallow wells to the most complex, multi-stage, horizontal wells. The nature of our vertically integrated model allows us to participate in each phase of proppant manufacturing and delivery and provides us a unique perspective into the current and future needs of our customers. Our technical sales team works closely with market participants to demonstrate the value proposition our proppants offer and stimulate market demand using data indicating enhanced hydrocarbon recoveries.
14
Table of Contents
The table below summarizes some of our most significant product innovations:
| Innovation |
Year | Result | ||
| CoolSet | 2014 | Eliminates need for an activator for well temperatures as low as 100°F | ||
| Self-Suspending Proppant | 2013 | Improves hydraulic fracturing efficiency by allowing proppant to transport further into the fracture, substantially increasing fracture length and improving productivity of well performance | ||
| PowerProp | 2010 | Technology that delivers strength and performance characteristics similar to a light-weight ceramic (patent-pending) | ||
| Bio-based Binder System | 2010 | Technology for use in metal casting industry (patent-pending) | ||
| Bio-Balls | 2006 | Water soluble ball sealers that are environmentally safe and do not require retrieval after treatment | ||
| Encapsulated Curable Proppant | 1997 | High performance resin-coated proppant used in flow-back control | ||
| Dual Coat Technology | 1995 | Dual coat curable resin-coated sand for enhanced conductivity and flowback control | ||
Our research and development team consists of 22 scientists, engineers, and technicians, with seven of them holding Ph.D.’s located at three locations in Sugar Land, Texas, Ottawa, Illinois, and Detroit, Michigan. During 2015, 2014, and 2013, we spent $5 million, $6 million, and $5 million, respectively, on research and development.
After acquiring the technology that underlies Propel SSP in April 2013, our team has worked to further develop the technology and manufacturing techniques of our Propel SSP product with robust storage and handling characteristics. Propel SSP continues to undergo extensive field trials with key customers with successful results (increased productivity and reduced operating costs). Propel SSP relies on a hydrogel polymer coating attached to a proppant substrate. When mixed with water, the coating hydrates and swells rapidly to create a hydrogel around the proppant substrate, which provides a nearly threefold increase in the hydrostatic radius of the proppant. Lab results show that the lower specific gravity, while maintaining crush strength, allows greater volumes of proppant and/or coarser mesh sizes coated with Propel SSP to be carried deep into the fractures, in turn allowing more hydrocarbons to flow into the wellbore. This technology reduces or eliminates the need for certain frac fluid additives, including friction reducer, guar gum, and crosslinkers, which are used to enhance the transport of proppants into the geologic formation. Based on lab and field tests, we believe Propel SSP technology is applicable at a wide range of well temperatures.
In 2014, we commercialized CoolSet, a new proppant product that provides effective flowback resistance without using any activator at temperatures as low as 100°F. This type of proppant is particularly suitable for low-temperature wells found in shale plays such as Permian, MidCon, and Canada.
Acquisitions
Throughout our history, we have made and successfully integrated strategic acquisitions in order to strengthen our market leadership position. In 2013 we acquired certain assets of FTSI, SSP LLC, and Great Plains and have completed over 20 acquisitions over the past 20 years.
15
Table of Contents
Competition
There are numerous large and small producers in all sand producing regions of the United States with whom we compete. Our main competitors in the raw frac sand market include Badger Mining Corporation, CARBO Ceramics, Inc., Emerge Energy Services LP, Hi-Crush Partners LP, Preferred Sands LLC, Unimin Corporation, and U.S. Silica Holdings, Inc. Many new entrants to the raw frac sand market compete on an FOB-plant basis and lack comparable transportation infrastructure to meet customer demands in-basin. Our main competitors in the coated products market include Momentive Performance Materials Inc., Unimin Corporation, Atlas Resin Proppants LLC, Preferred Sands LLC, CARBO Ceramics, and U.S. Silica Holdings, Inc. The most important factors on which we compete in both markets are product quality, performance, sand and proppant characteristics, transportation capabilities, proximity of supply to well site, reliability of supply, and price. Our substantial competitors across both markets are U.S. Silica Holdings, Inc., Unimin Corporation, and Badger Mining Corporation (which owns Atlas Resin Proppants LLC). We believe we are uniquely positioned to utilize our scale of raw sand production to supply high-quality substrate for coated products and leverage our transportation infrastructure for reliable delivery in-basin.
Due to increased demand for sand based proppants in the years leading up to 2015, there had been an increase in the number of frac sand producers. Moreover, as a result of this increased demand, existing frac sand producers have added to or expanded their frac sand production capacity, thereby increasing competition. Demand for sand-based proppants is closely linked to proppant consumption patterns for the completion of oil and natural gas wells in North America. These consumption patterns in a particular basin are influenced by numerous factors, including the price of hydrocarbons, the drilling rig count, and hydraulic fracturing activity levels, including the number of stages completed and the amount of proppant used per stage. Further, these consumption patterns are also influenced by the location, quality, selling price and availability of sand-based proppants and other types of proppants such as ceramic proppant. Selling prices for sand-based proppants vary by basin and are determined based on supply and demand dynamics within each basin.
As a result of increasing global supply of oil, the demand for proppant has decreased since the end of 2014 and through 2015, resulting in proppant oversupply and downward pressure on proppant selling prices. It is unclear when the oil and gas markets and proppant markets will recover. This has caused some proppant producers to exit the market and others, including us, to adjust operations and minimize costs.
Competitors in the I&R markets include some of our larger proppant competitors such as Unimin Corporation and U.S. Silica Holdings, Inc. but also typically include smaller, local or regional producers of sand and gravel.
Employees
As of December 31, 2015, we employed a workforce of 821 employees. We believe our culture of “People, Planet and Prosperity” has enabled us to achieve a long-tenured workforce and good relations with our workforce.
We maintain an active dialogue with employees and provide salaried and hourly employees a comprehensive benefits package including medical, life, and accident insurance, incentive bonus programs, a 401(k) plan with an employer match and discretionary employer contribution, as well as educational assistance. Certain employees are also eligible for stock-based compensation programs that are designed to encourage long-term performance aligned with Company objectives.
As of December 31, 2015, approximately 126 of our domestic employees are parties to collective bargaining contracts. We believe we have strong relationships with and maintain an active dialogue with union representatives. We have historically been able to successfully extend and renegotiate collective bargaining agreements as they expire.
16
Table of Contents
Seasonality
Our business is affected to some extent by seasonal fluctuations in weather that impact our production levels and our customers’ business needs. For example, our proppant sales levels are lower in the first and fourth quarters due to lower market demand as adverse weather tends to slow oil and gas operations to varying degrees depending on the severity of the weather. Our inability to mine and process frac sand year round at our surface mines in northern states results in a seasonal build-up of inventory as we excavate excess sand to build a stockpile that will feed our drying facilities during the winter months. Additionally, in the second and third quarters, we sell more sand to our customers in the I&R end markets due to the seasonal rise in demand driven by more favorable weather conditions.
Intellectual Property
Our intellectual property consists primarily of patents, trade secrets, know-how, trademarks, including our name “Fairmount Santrol,” and products such as “PowerProp,” “Propel SSP,” “HyperProp,” and “CoolSet.” We hold numerous U.S. and foreign-granted patents that are still in force as well as many U.S. and foreign patent applications that are still pending. We own patents in each of our major, differentiated proppant product lines, except CoolSet and HyperProp. We have not granted any third-party rights with respect to our patents. The majority of our patents have an expiration date after 2025. We have not yet filed a patent for CoolSet and our patents for HyperProp have recently expired. In early 2016, we received a patent on certain of the Propel SSP technology and have additional patents pending. With respect to trade secrets and know-how, our extensive experience with a variety of different products enables us to offer our customers a wide range of proppants for their particular application.
An investment in our securities involves significant risks. You should carefully consider the risks described below, together with the financial and other information contained in this Report, as well as the information discussed under the section entitled, “Management’s Discussion and Analysis of Financial Conditions and Results of Operations” in evaluating us, our business and your investment in us. If any of the following risks actually occurs, our business, financial condition, results of operations, cash flows, and prospects could be materially and adversely affected. As a result, the trading price of our common stock could decline and you could lose all or part of your investment in our common stock.
Risks Related to Our Business
Our business and financial performance depend on the level of activity in the oil and gas industries.
Approximately 86% of our revenues for the year ended December 31, 2015 were derived from sales to companies in the oil and gas industry. As a result, our operations are materially dependent on the levels of activity in oil and gas exploration, development, and production. More specifically, the demand for the proppants we produce is closely related to the number of oil and gas wells completed in geological formations where sand-based proppants are used in fracturing activities. These activity levels are affected by both short- and long-term trends in oil and gas prices, among other factors.
In recent years, oil and gas prices and, therefore, the level of exploration, development, and production activity, have experienced significant fluctuations. Worldwide economic, political, and military events, including war, terrorist activity, events in the Middle East, and initiatives by the Organization of the Petroleum Exporting Countries (“OPEC”) and other large non-OPEC producers have contributed, and are likely to continue to contribute, to price and volume volatility. For example, beginning in September 2014 and continuing through 2015, increasing global supply of oil, in conjunction with weakened demand from slowing economic growth in the Eurozone and China, has created downward pressure on crude oil prices resulting in reduced demand for our
17
Table of Contents
products and pressure to reduce our product prices. If these conditions persist, this may adversely impact our ability to meeting our debt obligations. Furthermore, the availability of key resources that impact drilling activity has experienced significant fluctuations and could impact product demand.
A prolonged reduction in oil and gas prices would generally depress the level of oil and gas exploration, development, production, and well completion activity and may result in a corresponding decline in the demand for the proppants we produce. Such a decline would have a material adverse effect on our business, results of operations, and financial condition, and we may not be able to meet our debt obligations. The commercial development of economically-viable alternative energy sources could have a similar effect. In addition, certain U.S. federal income tax deductions currently available with respect to oil and gas exploration and development, including the repeal of the percentage depletion allowance for oil and gas properties, may be eliminated as a result of proposed legislation. Any future decreases in the rate at which oil and gas reserves are discovered or developed, whether due to the passage of legislation, increased governmental regulation leading to limitations, or prohibitions on exploration and drilling activity, including hydraulic fracturing, or other factors, could have a material adverse effect on our business and financial condition, even in a stronger oil and natural gas price environment.
Our substantial indebtedness could adversely affect our financial flexibility and our competitive position.
Our substantial level of indebtedness increases the risk that we may be unable to generate cash sufficient to pay amounts due in respect of our indebtedness, or refinance that indebtedness on favorable terms. As of December 31, 2015, we had approximately $1.24 billion of outstanding long-term debt (including the current portion of long-term debt) with a portion of this debt ($156 million) due at March 17, 2017. Our substantial indebtedness could have other important consequences to you and significant effects on our business. For example, it could:
| • | increase our vulnerability to adverse changes in general economic, industry and competitive conditions; |
| • | require us to dedicate a substantial portion of our cash flow from operations to make payments on our indebtedness, thereby reducing the availability of our cash flow to fund working capital, capital expenditures and other general corporate purposes; |
| • | limit our flexibility in planning for, or reacting to, changes in our business and the industry in which we operate; |
| • | restrict us from exploiting business opportunities; |
| • | make it more difficult to satisfy our financial obligations, including payments on our indebtedness; |
| • | place us at a disadvantage compared to our competitors that have less debt; and |
| • | limit our ability to borrow additional funds for working capital, capital expenditures, railcar or other future purchase commitments, acquisitions, debt service requirements, execution of our business strategy, or other general corporate purposes. |
Increasing logistics costs, a lack of dependability or availability of transportation services or infrastructure, and geographic shifts in demand could have a material adverse effect on our business.
Transportation and handling costs are a significant component of the total delivered cost of our products. In many instances, transportation costs can represent 70 to 80% of the delivered cost of frac sand. The high relative cost of transportation could favor suppliers located in close proximity to the customer. In addition, as we continue to expand our sand-based proppant production, we will need increased investment in transportation infrastructure, including terminals and railcars. We contract with truck, rail, ship, and barge services to move sand-based proppants from our production facilities to distribution terminals. Labor disputes, derailments, adverse weather conditions or other environmental events, increased railcar congestion, and other changes to rail freight systems
18
Table of Contents
could interrupt or limit available transportation services or result in a significant increase in transportation service rates. Increased costs resulting from these types of events that we are not able to pass on to our customers could impair our ability to deliver our products economically to our customers or to expand our markets. Accordingly, because we are so dependent on rail infrastructure, if there are disruptions of the rail transportation services utilized by us or our customers, and we or our customers are unable to find alternative transportation providers to transport our products, our business and results of operations could be adversely affected. Further, declining volumes could result in additional railcar over-capacity, which would lead to railcar storage fees while, at the same time, we would continue to incur lease costs for those railcars in storage.
A portion of our distribution infrastructure is located in or near oil and gas producing areas. A shift in demand away from areas where we have significant distribution infrastructure or relocation of our customers’ businesses to areas farther from our plants or distribution infrastructure could have a material adverse effect on our business, financial condition, and results of operations.
Our operations are dependent on timely securing and maintaining various permits and approvals from governmental authorities and other third parties.
We hold numerous governmental, environmental, mining and other permits, water rights and approvals authorizing operations at each of our facilities. A decision by a governmental agency or other third party to deny or delay issuing a new or renewed permit or approval, or to revoke or substantially modify an existing permit or approval, could have a material adverse effect on our ability to continue operations at the affected facility. Furthermore, state and local governments could impose a moratorium on mining operations in certain areas. Expansion of our existing operations is also predicated on securing the necessary environmental or other permits, including air permits for our resin-coated manufacturing, and water rights or approvals, which we may not receive in a timely manner or at all. In addition, our facilities are located near existing and proposed third-party industrial operations that could affect our ability to fully extract, or the manner in which we extract, the mineral reserves to which we have mining rights.
We may be adversely affected by decreased or shifted demand for sand-based proppants or the development of either effective alternative proppants or new processes to replace hydraulic fracturing.
Frac sand and resin-coated sand are proppants used in the completion and re-completion of oil and gas wells through the process of hydraulic fracturing. A significant shift in demand from sand-based proppants to other proppants, or a shift in demand from higher-margin sand-based proppants to lower-margin sand-based proppants, could have a material adverse effect on our business, financial condition, and results of operations. The development and use of new technology for effective alternative proppants, or the development of new processes to replace hydraulic fracturing altogether, could also cause a decline in demand for the sand-based proppants we produce and could have a material adverse effect on our business, financial condition, and results of operations.
Our proppant sales are subject to fluctuations in market pricing.
Substantially all of our supply agreements involving the sale of sand-based proppants have market-based pricing mechanisms. Accordingly, in periods with decreasing prices, our results of operations may be lower than if our agreements had fixed prices. In periods with increasing prices, our agreements permit us to increase prices; however, our customers may elect to cease purchasing our sand-based proppants if they do not agree with our price increases or are able to find alternative, cheaper sources of supply. Furthermore, certain volume-based supply agreements may influence the ability to fully capture current market pricings. These pricing provisions may result in significant variability in our results of operations and cash flows from period to period.
Changes in supply and demand dynamics could also impact market pricing for proppants. A number of existing frac sand providers and new market entrants have recently announced reserve acquisitions, processing capacity expansions and greenfield projects. In periods where sources of supply of raw frac sand exceed market demand,
19
Table of Contents
market prices for frac sand may decline and our results of operations and cash flows may continue to decline, be volatile, or otherwise be adversely affected.
We may not be able to complete greenfield development or expansion projects or, if we do, we may not realize the expected benefits.
Any greenfield development or expansion project requires us to raise substantial capital and obtain numerous state and local permits. A decision by any governmental agency not to issue a required permit or substantial delays in the permitting process could prevent us from pursuing the development or expansion project. In addition, if the demand for our products declines during the period we experience delays in raising capital or completing the permitting process, we may not realize the expected benefits from our greenfield facility or expansion project. Furthermore, our new or modified facilities may not operate at designed capacity or may cost more to operate than we expect. The inability to complete greenfield development or expansion projects or to complete them on a timely basis and in turn grow our business could adversely affect our business and results of operations.
We rely upon trade secrets, contractual restrictions and patents to protect our proprietary rights. Failure to protect our intellectual property rights may undermine our competitive position, and protecting our rights or defending against third-party allegations of infringement may be costly.
Our commercial success depends on our proprietary information and technologies, know-how and other intellectual property. Because of the technical nature of our business, we rely on patents, trade secrets, trademarks, and contractual restrictions to protect our intellectual property rights, particularly with respect to our resin-coated products. The measures we take to protect our trade secrets and other intellectual property rights may be insufficient. Failure to protect, monitor, and control the use of our existing intellectual property rights could cause us to lose our competitive advantage and incur significant expenses. It is possible that our competitors or others could independently develop the same or similar technologies or otherwise obtain access to our unpatented technologies. In such case, our trade secrets would not prevent third parties from competing with us. As a result, our results of operations may be adversely affected. Furthermore, third parties or our employees may infringe or misappropriate our proprietary technologies or other intellectual property rights, which could also harm our business and results of operations. Policing unauthorized use of intellectual property rights can be difficult and expensive, and adequate remedies may not be available.
In addition, third parties may claim that our products infringe or otherwise violate their patents or other proprietary rights and seek corresponding damages or injunctive relief. Defending ourselves against such claims, with or without merit, could be time-consuming and result in costly litigation. An adverse outcome in any such litigation could subject us to significant liability to third parties (potentially including treble damages) or temporary or permanent injunctions prohibiting the manufacture or sale of our products, the use of our technologies or the conduct of our business. Any adverse outcome could also require us to seek licenses from third parties (which may not be available on acceptable terms, or at all) or to make substantial one-time or ongoing royalty payments. Protracted litigation could also result in our customers or potential customers deferring or limiting their purchase or use of our products until resolution of such litigation. In addition, we may not have insurance coverage in connection with such litigation and may have to bear all costs arising from any such litigation to the extent we are unable to recover them from other parties. Any of these outcomes could have a material adverse effect on our business, financial condition and results of operations.
The development and marketing of Propel SSP may prove to be unsuccessful.
In April 2013, we acquired intellectual property rights to self-suspending proppant technology which led to the development of Propel SSP. We are currently conducting field trials on Propel SSP. The technology supporting Propel SSP is still unproven. Although the results of field trials have been encouraging, additional testing ultimately may demonstrate that the product is ineffective or not commercially viable. A prolonged decline in the
20
Table of Contents
oil and gas market may make the adoption of higher-value products, such as Propel SSP, more difficult. A failure to successfully develop Propel SSP for commercial application would result in a significant unrecouped investment and the failure to realize certain anticipated benefits from this product launch, each of which could have a material adverse effect on our business, financial condition, and results of operations. For more information on Propel SSP, please read “Management’s Discussion and Analysis of Financial Condition and Results of Operations – Acquisitions.”
Our future performance will depend on our ability to succeed in competitive markets, and on our ability to appropriately react to potential fluctuations in demand for and supply of sand-based proppants.
We operate in a highly competitive market that is characterized by several large, national producers and a larger number of small, regional or local producers. Competition in the industry is based on price, consistency and quality of product, site location, distribution capability, customer service, reliability of supply, breadth of product offering, and technical support. In the proppant business, we compete with producers such as Badger Mining Corporation, CARBO Ceramics Inc., Emerge Energy Services LP, Hi-Crush Partners, LP, Momentive Performance Materials Inc., Preferred Sands LLC, Unimin Corporation, and U.S. Silica Holdings, Inc. Certain of our large competitors may have greater financial and other resources than we do, may develop technology superior to ours or may have production facilities that are located closer to key customers than ours.
We also compete with smaller, regional or local producers. In recent years there has been an increase in the number of small producers servicing the sand-based proppants market which could result in increased competition and pricing pressure in certain market conditions. In addition, oil and gas exploration and production companies and other providers of hydraulic fracturing services could acquire their own sand reserves, expand their existing sand-based proppant production capacity or otherwise fulfill their own proppant requirements and existing or new sand-based proppant producers could add to or expand their sand-based proppants production capacity, which could increase competition in the proppant industry. We may not be able to compete successfully against either our larger or smaller competitors in the future, and competition could have a material adverse effect on our business, financial condition and results of operations.
A large portion of our sales is generated by a limited number of customers, and the loss of, or a significant reduction in purchases by, our largest customers could adversely affect our operations.
For the year ended December 31, 2015 and 2014, our top two proppant customers, Halliburton and FTSI, collectively accounted for approximately 43% and 36% of our sales, respectively. These customers may not continue to purchase the same levels of our sand-based proppants in the future due to a variety of reasons. Over the course of our relationships, we have sold proppant to Halliburton and FTSI on a purchase order basis and pursuant to supply agreements. We currently have supply agreements with both customers that contain customary termination provisions for bankruptcy related events and uncured breaches of the applicable agreement. The Halliburton supply agreement may also be terminated for unresolved pricing disputes. If any of our major customers substantially reduces or altogether ceases purchasing our sand-based proppants and we are not able to generate replacement sales of sand-based proppants into the market, our business, financial condition, and results of operations could be adversely affected for a short-term period until such time as we generate replacement sales in the market.
We are exposed to the credit risk of our customers, and any material nonpayment or nonperformance by our customers could adversely affect our financial results.
We are subject to the risk of loss resulting from nonpayment or nonperformance by our customers, many of whose operations are concentrated solely in the global oilfield services industry which, as described above, is subject to volatility and therefore credit risk. Our credit procedures and policies may not be adequate to fully reduce customer credit risk. If we fail to adequately assess the creditworthiness of existing or future customers or unanticipated deterioration in their creditworthiness, any resulting increase in nonpayment or nonperformance by
21
Table of Contents
them and our inability to re-market or otherwise use the production could have a material adverse effect on our business, financial condition, and results of operations.
The demand for industrial and recreational sand fluctuates, which could adversely affect our results of operations.
A portion of our sales are to customers in industries that have historically been cyclical, such as glassmaking, building products and foundry. During periods of economic slowdown, our customers often reduce their production rates and also reduce capital expenditures and defer or cancel pending projects. Such developments occur even among customers that are not experiencing financial difficulties.
Demand in many of the end markets for industrial and recreational sand is driven by the construction and automotive industries. For example, the flat glass market depends on the automotive and commercial and residential construction and remodeling markets. The market for industrial sand used to manufacture building products is driven primarily by demand in the construction markets. The demand for foundry silica substantially depends on the rate of automobile, light truck and heavy equipment production. Other factors influencing the demand for industrial and recreational sand include (i) the substitution of plastic or other materials for glass, (ii) competition from offshore producers of glass products, (iii) changes in demand for our products due to technological innovations, and (iv) prices, availability, and other factors relating to our products.
We cannot predict or control the factors that affect demand for our products. Negative developments in the above factors, among others, could cause the demand for industrial and recreational sand to decline, which could adversely affect our business, financial condition, results of operations, cash flows, and prospects.
Our operations are subject to operating risks that are often beyond our control and could adversely affect production levels and costs, and such risks may not be covered by insurance.
Our mining, processing and production facilities are subject to risks normally encountered in the proppant and industrial and recreational sand industries. These risks include:
| • | changes in the price and availability of transportation; |
| • | changes in the price and availability of natural gas or electricity; |
| • | unusual or unexpected geological formations or pressures; |
| • | cave-ins, pit wall failures, or rock falls, particularly in underground mines; |
| • | unanticipated ground, grade, or water conditions; |
| • | extreme seasonal weather conditions; |
| • | hazardous or catastrophic weather conditions or events, including flooding, tornadoes, and hurricanes, and the physical impacts of climate change; |
| • | environmental hazards; |
| • | industrial accidents; |
| • | changes in laws and regulations (or the interpretation thereof) or increased public scrutiny related to the mining and the drilling and well completion industries, silica dust exposure or the environment; |
| • | inability to acquire or maintain necessary permits or mining or water rights; |
| • | restrictions on blasting and mining operations, including potential moratoriums on mining as result of local activism or complaints; |
| • | inability to obtain necessary production equipment or replacement parts; |
| • | reduction in the amount of water available for processing; |
22
Table of Contents
| • | labor disputes; |
| • | cybersecurity breaches; |
| • | late delivery of supplies; |
| • | fires, explosions, or other accidents; and |
| • | facility shutdowns in response to environmental regulatory actions |
Any of these risks could result in damage to, or destruction of, our mining properties or production facilities, personal injury, environmental damage, delays in mining or processing, losses, or possible legal liability. Any prolonged downtime or shutdowns at our mining properties or production facilities could have a material adverse effect on us.
Not all of these risks are reasonably insurable, and our insurance coverage contains limits, deductibles, exclusions, and endorsements. Our insurance coverage may not be sufficient to meet our needs in the event of loss and any such loss may have a material adverse effect on us.
A significant portion of our sales is generated at our Wedron Silica facility. Any adverse developments at this plant could have a material adverse effect on our business, financial condition, and results of operations.
For the year ended December 31, 2015, approximately 58% of our total volumes were produced at our Wedron Silica Facility and this percentage may increase in the future. As of March 2016, this facility accounts for approximately 47% of our annual sand processing capacity and approximately 25% of our annual coating capacity. A casualty event or other adverse event affecting the production at this plant, including adverse developments due to catastrophic events or weather (including floods), adverse government regulatory impacts, private actions by residents of Wedron or surrounding communities, decreased demand for the products this plant produces, adverse developments affecting this plant’s customers, or transportation-related constraints, could have a material adverse effect on our business, financial condition, and results of operations.
The manufacture of resin-coated proppants is an important process for us and is dependent on the availability of raw materials.
If we are unable to secure adequate, cost effective supply commitments for the raw materials associated with resin-coated proppants our ability to sell this product to the marketplace at profitable margins may be adversely impacted. Decreased sales of resin-coated proppants or the inability to control the costs associated with manufacturing and distribution of these products could have a material adverse effect on our business, financial condition, and results from operations.
Diminished access to water may adversely affect our operations or the operations of our customers.
The mining and processing activities in which we engage at a number of our facilities require significant amounts of water, and some of our facilities are located in areas that are water-constrained. Additionally, the development of oil and gas properties through fracture stimulation likewise requires significant water use. We have obtained water rights that we currently use to service the activities on our various properties, and we plan to obtain all required water rights to service other properties we may develop or acquire in the future. However, the amount of water that we and our customers are entitled to use pursuant to our water rights must be determined by the appropriate regulatory authorities in the jurisdictions in which we and our customers operate. Such regulatory authorities may amend the regulations regarding such water rights, increase the cost of maintaining such water rights or eliminate our current water rights, and we and our customers may be unable to retain all or a portion of such water rights. These new regulations, which could also affect local municipalities and other industrial operations, could have a material adverse effect on our operating costs and effectiveness if implemented. Such changes in laws, regulations or government policy and related interpretations pertaining to water rights may alter
23
Table of Contents
the environment in which we and our customers do business, which may negatively affect our financial condition and results of operations.
Title to our mineral properties and water rights, and royalties related to our production of sand may be disputed.
Title to, and the area of, mineral properties and water rights, and royalties related to our production of sand, may be disputed. Even though we obtain title guarantees on properties that we purchase, a successful claim that we lack appropriate mineral and water rights on one or more of our properties could cause us to lose any rights to explore, develop and operate mines on that property. Any decrease or disruption in our mineral rights may adversely affect our operations. In some instances, we have received access rights or easements from third parties, which allow for a more efficient operation than would exist without the access or easement. A third party could take action to suspend the access or easement, and any such action could be materially adverse to our results of operations or financial condition.
If we cannot successfully complete acquisitions or integrate acquired businesses, our growth may be limited and our financial condition may be adversely affected.
Our business strategy includes supplementing internal growth by pursuing acquisitions. Any acquisition may involve potential risks, including, among other things:
| • | the validity of our assumptions about mineral reserves and future production, sales, capital expenditures, operating expenses and costs, including synergies; |
| • | an inability to successfully integrate the businesses we acquire; |
| • | the use of a significant portion of our available cash or borrowing capacity to finance acquisitions and the subsequent decrease in our liquidity; |
| • | a significant increase in our interest expense or financial leverage if we incur additional debt to finance acquisitions; |
| • | the assumption of unknown liabilities, losses or costs for which we are not indemnified or for which our indemnity is inadequate; |
| • | the diversion of management’s attention from other business concerns; |
| • | an inability to hire, train or retain qualified personnel both to manage and to operate our growing business and assets; |
| • | the incurrence of other significant charges, such as impairment of goodwill or other intangible assets, asset devaluation, or restructuring charges; |
| • | unforeseen difficulties encountered in operating in new geographic areas; |
| • | customer or key employee losses at the acquired businesses; and |
| • | the accuracy of data obtained from production reports and engineering studies, geophysical and geological analyses, and other information used when deciding to acquire a property, the results of which are often inconclusive and subject to various interpretations. |
If we cannot successfully complete acquisitions or integrate acquired businesses, our growth may be limited and our financial condition may be adversely affected.
24
Table of Contents
We will be required to make substantial capital expenditures to maintain, develop and increase our asset base. The inability to obtain needed capital or financing on satisfactory terms, or at all, could have a material adverse effect on our growth and profitability.
Although we currently use a significant amount of our cash reserves and cash generated from our operations to fund the maintenance and development of our existing mineral reserves and production capacity and our acquisitions of new mineral reserves and production capacity, we may depend on the availability of credit to fund future capital expenditures and capital leases. Our ability to obtain financing or to access the capital markets for future equity or debt offerings may be limited by our financial condition at the time of any such financing or offering, the covenants contained in our existing credit facility, term loans or future debt agreements, adverse market conditions or other contingencies and uncertainties that are beyond our control. Our failure to obtain the funds necessary to maintain, develop, and increase our asset base, including our substantial railcar fleet, could adversely impact our growth and profitability.
Even if we are able to obtain financing or access the capital markets, incurring additional debt may significantly increase our interest expense and financial leverage, and our level of indebtedness could restrict our ability to fund future development and acquisition activities. In addition, the issuance of additional common stock in an equity offering may result in significant stockholder dilution.
Our revolving credit facility and term loans contain financial covenants and substantial restrictions that may restrict our business and financing activities.
Our revolving credit facility and term loans contain, and any future financing agreements that we may enter into will likely contain operating and financial restrictions and covenants that may restrict our ability to finance future operations or capital needs or to engage in, expand, or pursue our business activities.
Our ability to comply with these restrictions and covenants is uncertain and will be affected by the levels of cash flow from our operations and events or circumstances beyond our control. If market or other economic conditions deteriorate, our ability to comply with these covenants may be impaired. If we violate any of the restrictions, covenants, ratios or tests in our debt agreements, a significant portion of our indebtedness may become immediately due and payable and our lenders’ commitment to make further loans to us may terminate. We might not have, or be able to obtain, sufficient funds to make these accelerated payments. In addition, our obligations under our debt agreements are secured by substantially all of our assets, and if we are unable to repay our indebtedness under these agreements, the lenders could seek to foreclose on our assets.
We may have the need to incur substantial debt in the future to enable us to maintain or increase our production levels and to otherwise pursue our business plan. We may not be able to borrow funds successfully or, if we do, this debt may impair our ability to operate our business.
Our business plan requires a significant amount of capital expenditures to maintain and grow our production capacity. If prices for the products we produce were to decline for an extended period of time, if the costs of our acquisition and development opportunities were to increase substantially or if other events were to occur which reduced our sales or increased our costs, we may be required to borrow in the future to enable us to finance the expenditures necessary to replace the reserves we extract. The cost of the borrowings and our obligations to repay the borrowings could have important consequences to us, because:
| • | our ability to obtain additional financing, if necessary, for working capital, capital expenditures, acquisitions, or other purposes may be impaired or such financing may not be available on favorable terms, or at all; |
| • | covenants contained in our existing and future credit and debt arrangements will require us to meet financial tests that may affect our flexibility in planning for, and reacting to, changes in our business, including possible acquisition opportunities; |
25
Table of Contents
| • | we will need a substantial portion of our cash flow to make principal and interest payments on our indebtedness, reducing the funds that would otherwise be available for operations and future business opportunities; and |
| • | our debt level will make us more vulnerable than our less leveraged competitors to competitive pressures or a downturn in our business or the economy generally. |
Our ability to service our indebtedness will depend on, among other things, our future financial and operating performance, which will be affected by prevailing economic conditions and financial, business, regulatory and other factors, some of which are beyond our control. If our operating results are not sufficient generate cash flows in order to service our current or future indebtedness, we will be forced to take actions such as reducing or delaying business activities, acquisitions, investments and/or capital expenditures; selling assets; restructuring or refinancing our indebtedness; or seeking additional equity capital or bankruptcy protection. We may not be able to effect any of these remedies on satisfactory terms or at all.
Inaccuracies in our estimates of mineral reserves could result in lower than expected sales and higher than expected costs.
We base our mineral reserve estimates on engineering, economic and geological data assembled and analyzed by our engineers and geologists, which are reviewed by outside firms. However, sand reserve estimates are necessarily imprecise and depend to some extent on statistical inferences drawn from available drilling data, which may prove unreliable. There are numerous uncertainties inherent in estimating quantities and qualities of mineral reserves and costs to mine recoverable reserves, including many factors beyond our control. Estimates of economically recoverable mineral reserves necessarily depend on a number of factors and assumptions, all of which may vary considerably from actual results, such as:
| • | geological and mining conditions and/or effects from prior mining that may not be fully identified by available data or that may differ from experience; |
| • | assumptions concerning future prices of sand-based products, operating costs, mining technology improvements, development costs, and reclamation costs; and |
| • | assumptions concerning future effects of regulation, including the issuance of required permits and taxes by governmental agencies. |
Any inaccuracy in our estimates related to our mineral reserves could result in lower than expected sales and higher than expected costs.
Mine closures entail substantial costs, and if we close one or more of our mines sooner than anticipated, our results of operations may be adversely affected.
We base our assumptions regarding the life of our mines on detailed studies that we perform from time to time, but our studies and assumptions do not always prove to be accurate. If we close any of our mines sooner than expected, sales will decline unless we are able to increase production at any of our other mines, which may not be possible. The closure of an open pit mine also involves significant fixed closure costs, including accelerated employment legacy costs, severance-related obligations, reclamation and other environmental costs, and the costs of terminating long-term obligations, including energy contracts and equipment leases. We accrue for the costs of reclaiming open pits, stockpiles, tailings ponds, roads, and other mining support areas over the estimated mining life of our property. If we were to reduce the estimated life of any of our mines, the fixed mine closure costs would be applied to a shorter period of production, which would increase production costs per ton produced and could materially and adversely affect our results of operations and financial condition.
Applicable statutes and regulations require that mining property be reclaimed following a mine closure in accordance with specified standards and an approved reclamation plan. The plan addresses matters such as
26
Table of Contents
removal of facilities and equipment, regrading, prevention of erosion and other forms of water pollution, re-vegetation, and post-mining land use. We may be required to post a surety bond or other form of financial assurance equal to the cost of reclamation as set forth in the approved reclamation plan. The establishment of the final mine closure reclamation liability is based on permit requirements and requires various estimates and assumptions, principally associated with reclamation costs and production levels. If our accruals for expected reclamation and other costs associated with mine closures for which we will be responsible were later determined to be insufficient, our business, results of operations, and financial condition would be adversely affected.
A shortage of skilled labor together with rising labor costs in the mining industry may further increase operating costs, which could adversely affect our results of operations.
Efficient mining using modern techniques and equipment requires skilled laborers, preferably with several years of experience and proficiency in multiple mining tasks, including processing of mined minerals. If the shortage of experienced labor continues or worsens or if we are unable to train the necessary number of skilled laborers, there could be an adverse impact on our labor productivity and costs and our ability to expand production.
Our production process consumes large amounts of natural gas and electricity. An increase in the price or a significant interruption in the supply of these or any other significant raw material costs could have a material adverse effect on our business, financial condition, or results of operations.
Natural gas is the primary fuel source used for drying sand in the production process and, as such, our profitability is impacted by the price and availability of natural gas we purchase from third parties. The price and supply of natural gas are unpredictable and can fluctuate significantly based on international, political and economic circumstances, as well as other events outside our control, such as changes in supply and demand due to weather conditions, actions by OPEC and other oil and gas producers, regional production patterns, and environmental concerns. Furthermore, utility companies could enforce natural gas curtailments which affect our operations. In addition, potential climate change regulations or carbon or emissions taxes could result in higher production costs for energy, which may be passed on to us in whole or in part. In the past, the price of natural gas has been extremely volatile, and we expect this volatility to continue. For example, during the year ended December 31, 2015, the monthly closing price of natural gas on the New York Mercantile Exchange ranged from a high of $3.19 per million British Thermal Units (“BTUs”) to a low of $2.03 per million BTUs.
Phenol is the primary component of the resins we buy, and our resin supply agreements contain market-based pricing provisions based on the cost of phenol. As a result, we are exposed to fluctuations in the prices for phenol.
We have occasionally hedged natural gas prices through the use of derivative financial instruments, such as forwards, swaps, and futures, although we do not do at the present. A significant increase in the price of phenol or of energy that is not recovered through an increase in the price of our products or an extended interruption in the supply of natural gas or electricity to our production facilities could have a material adverse effect on our business, financial condition, and results of operations.
Our business may suffer if we lose, or are unable to attract and retain, key personnel.
We depend to a large extent on the services of our senior management team and other key personnel. Members of our senior management and other key employees have extensive experience and expertise in evaluating and analyzing industrial mineral properties, maximizing production from such properties, marketing industrial mineral production, and developing and executing financing and hedging strategies. Competition for management and key personnel is intense, and the pool of qualified candidates is limited. Further, we have not entered into employment agreements with any of our named executive officers. The loss of any of these individuals or the failure to attract additional personnel, as needed, could have a material adverse effect on our operations and could lead to higher labor costs or the use of less-qualified personnel. In addition, due to the broad
27
Table of Contents
base of shares and options owned by our current employee base, a significant amount of readily-accessible wealth and liquidity may be generated in favorable market conditions. If any of our executives or other key employees were to retire as a result of this potential wealth creation, join a competitor, or form a competing company, we could lose customers, suppliers, know-how, and key personnel. We do not maintain key-man life insurance with respect to any of our employees. Our success is dependent on our ability to continue to attract, employ, and retain highly-skilled personnel.
Our profitability could be negatively affected if we fail to maintain satisfactory labor relations.
As of December 31, 2015, various labor unions represented 16% of our domestic employees. If we are unable to renegotiate acceptable collective bargaining agreements with these labor unions in the future, we could experience, among other things, strikes, work stoppages, or other slowdowns by our workers and increased operating costs as a result of higher wages, health care costs, or benefits paid to our employees. An inability to maintain good relations with our workforce could cause a material adverse effect on our business, financial condition, and results of operations.
Silica-related health issues and litigation could have a material adverse effect on our business, reputation, or results of operations.
The inhalation of respirable crystalline silica can lead to the lung disease silicosis. There is disputed evidence of an association between respirable silica exposure and lung cancer as well as a possible association with other diseases, including immune system disorders such as scleroderma. These health risks have been, and may continue to be, a significant issue confronting the silica industry. Concerns over silicosis and other potential adverse health effects, as well as concerns regarding potential liability from the use of silica, may have the effect of discouraging our customers’ use of our silica products. The actual or perceived health risks of mining, processing, and handling silica could materially and adversely affect silica producers, including us, through reduced use of silica products, the threat of product liability or employee lawsuits, increased scrutiny by federal, state and local regulatory authorities of us and our customers, or reduced financing sources available to the silica industry.
We and/or our predecessors have been named as a defendant, usually among many defendants, in numerous products liability lawsuits brought by or on behalf of current or former employees of our customers alleging damages caused by silica exposure. As of December 31, 2015, we were subject to approximately 6 active silica exposure claims. Almost all of the claims pending against us arise out of the alleged use of our silica products in foundries or as an abrasive blast media and have been filed in the states of Texas, Mississippi, and Illinois, although cases have been brought in many other jurisdictions over the years. In accordance with our insurance obligations, these claims are being defended by our subsidiaries’ insurance carriers, subject to our payment of approximately 7% of the defense costs. If the litigants prevail and our insurance coverage or indemnities prove to be insufficient or unavailable, it could have a material adverse effect on our business, financial condition, and results of operation.
Failure to maintain effective quality control systems at our mining, processing and production facilities could have a material adverse effect on our business, financial condition, and operations.
The performance, quality and safety of our products are critical to the success of our business. These factors depend significantly on the effectiveness of our quality control systems, which, in turn, depends on a number of factors, including the design of our quality control systems, our quality-training program, and our ability to ensure that our employees adhere to the quality control policies and guidelines. Any significant failure or deterioration of our quality control systems could have a material adverse effect on our business, financial condition, results of operations, and reputation.
28
Table of Contents
Seasonal factors may impact our ability to process sand and our customers’ demand for our products.
Because raw sand cannot be wet-processed during extremely cold temperatures, frac sand is typically washed only eight months out of the year at our surface mines in Wisconsin and our Minnesota and Ohio operations. Our inability to mine and process frac sand year round in these surface mines results in a seasonal build-up of inventory as we excavate excess sand to build a stockpile that will feed our drying facilities during the winter months. Unexpected winter weather conditions may result in our having an insufficient sand stockpile to supply feedstock for our drying plants for the winter months and result in our being unable to satisfy customer requirements during these periods. As a result of these seasonal supply impacts, the cash flows of our North American operations can fluctuate if plant operations must remain shut down due to harsh winter weather conditions.
In addition to supply considerations, severe weather conditions may curtail our customers’ drilling activities and impair rail shipment and transportation services and, as a result, our sales volumes to customers may similarly be adversely affected. Unexpected winter weather conditions may compound these seasonal impacts, and could result in a material adverse effect on our business, financial condition, and results of operation.
We may be subject to interruptions or failures in our information technology systems.
We rely on sophisticated information technology systems and infrastructure to support our business, including process control technology. Any of these systems may be susceptible to outages due to fire, floods, power loss, telecommunications failures, usage errors by employees, computer viruses, cyber-attacks or other security breaches, or similar events. The failure of any of our information technology systems may cause disruptions in our operations, which could adversely affect our sales and profitability.
Our international operations expose us to risks inherent in doing business abroad.
We conduct business in many parts of the world, including Argentina, Mexico, China, northern Europe, and the United Arab Emirates. Our ability to comply with the Foreign Corrupt Practices Act (“FCPA”) is dependent on the success of our ongoing compliance program, including our ability to continue to manage our agents and business partners, and supervise, train, and retain competent employees. We could be subject to sanctions and civil and criminal prosecution as well as fines and penalties in the event of a finding of a violation of the FCPA in the current investigation by us or any of our employees.
In December 2015, we were notified by the Securities and Exchange Commission (the “SEC”) that the Company was being investigated for possible violations of the FCPA and other securities laws relating to matters concerning certain of our international operations. We had previously retained outside legal counsel to investigate the subject matter of the SEC’s investigation, and at that time, determined that no further action was necessary. We cannot predict what, if any, further action the SEC may take regarding its investigation, and cannot provide an estimate of the potential costs of the SEC’s investigation or any possible fines, penalties or other remedial actions that might result, if any, at this time.
In addition, our international operations are subject to the various laws and regulations of those respective countries as well as various risks peculiar to each country, which may include, but are not limited to:
| • | global economic conditions; |
| • | political actions and requirements of national governments including trade restrictions, embargoes, seizure, detention, nationalization, and expropriations of assets; |
| • | interpretation of tax statutes and requirements of taxing authorities worldwide, routine examination by taxing authorities, and assessment of additional taxes, penalties, and/or interest; |
| • | civil unrest; |
| • | acts of terrorism; |
29
Table of Contents
| • | fluctuations and changes in currency exchange rates; |
| • | the impact of inflation; and |
| • | difficulty in repatriating foreign currency received in excess of the local currency requirements. |
Significant impairment losses related to goodwill and intangibles could have a material adverse effect on our business, financial condition, and results of operation.
We assess the impairment of goodwill and intangibles at least annually and also whenever events or changes in circumstances indicate that these assets may be impaired. In the fourth quarter of 2015, we recorded an impairment of goodwill in our Proppant Solutions segment of $69.2 million. Any significant impairment of the goodwill or intangibles could have a material adverse effect on our business, financial condition, and results of operations.
A terrorist attack or armed conflict could harm our business.
Terrorist activities, anti-terrorist efforts and other armed conflicts involving the United States or other countries in which we operate could adversely affect the U.S. and global economies and could prevent us from meeting financial and other obligations. We could experience loss of business, delays or defaults in payments from payors or disruptions of fuel supplies and markets if pipelines, production facilities, processing plants or refineries are direct targets or indirect casualties of an act of terror or war. Such activities could reduce the overall demand for oil and gas, which, in turn, could also reduce the demand for our products and services. Terrorist activities and the threat of potential terrorist activities and any resulting economic downturn could adversely affect our results of operations, impair our ability to raise capital or otherwise adversely impact our ability to realize certain business strategies.
Risks Related to Environmental, Mining, and Other Regulation
Federal, state and local legislative and regulatory initiatives relating to hydraulic fracturing and the potential for related litigation could result in increased costs and additional operating restrictions or delays for our customers, which could cause a decline in the demand for our sand-based proppants and negatively impact our business, financial condition, and results of operations.
Federal, state and local legislative and regulatory initiatives relating to hydraulic fracturing and the potential for related litigation could result in increased costs and additional operating restrictions or delays for our customers, which could cause a decline in the demand for our sand-based proppants and negatively impact our business, financial condition, and results of operations.
We supply proppants to oilfield service companies. Hydraulic fracturing is a widely used industry production technique that is used to recover natural gas and/or oil from dense subsurface rock formations. The process involves the injection of water, sand and chemicals, under pressure, into the formation to fracture the surrounding rock and stimulate production. The hydraulic fracturing process is typically regulated by state or local governmental authorities. However, the practice of hydraulic fracturing has become controversial in some areas and is undergoing increased scrutiny. Several federal agencies, regulatory authorities, and legislative entities are investigating the potential environmental impacts of hydraulic fracturing and whether additional regulation may be necessary. The U.S. Environmental Protection Agency (“EPA”) has asserted limited federal regulatory authority over hydraulic fracturing and has indicated it may seek to further expand its regulation of hydraulic fracturing. The Bureau of Land Management has proposed regulations applicable to hydraulic fracturing conducted on federal and Indian oil and gas leases. Congress has from time to time considered the adoption of legislation to provide for federal regulation of hydraulic fracturing. In addition, various state, local and foreign governments have implemented, or are considering, increased regulatory oversight of hydraulic fracturing through additional permitting requirements, operational restrictions, disclosure requirements and temporary or permanent bans on hydraulic fracturing in certain areas such as environmentally sensitive watersheds. For example, many states – including the major oil and gas producing states of North Dakota, Ohio, Oklahoma,
30
Table of Contents
Pennsylvania, Texas, and West Virginia – have imposed disclosure requirements on hydraulic fracturing well owners and operators. Some local governments have adopted and others may seek to adopt ordinances prohibiting or regulating the time, place and manner of drilling activities in general or hydraulic fracturing activities within their jurisdictions.
Although we do not conduct hydraulic fracturing, the adoption of new laws or regulations at the federal, state, local or foreign levels imposing reporting obligations on, or otherwise limiting or delaying, the hydraulic fracturing process could make it more difficult to complete oil and gas wells, increase our customers’ costs of compliance and doing business, and otherwise adversely affect the hydraulic fracturing services they perform, which could negatively impact demand for our sand-based proppants. In addition, heightened political, regulatory and public scrutiny of hydraulic fracturing practices, including nuisance lawsuits, could expose us or our customers to increased legal and regulatory proceedings, which could be time-consuming, costly or result in substantial legal liability or significant reputational harm. We could be directly affected by adverse litigation involving us, or indirectly affected if the cost of compliance limits the ability of our customers to operate. Such costs and scrutiny could directly or indirectly, through reduced demand for our sand-based proppants, have a material adverse effect on our business, financial condition, and results of operations.
We and our customers are subject to extensive environmental and health and safety regulations that impose, and will continue to impose, significant costs and liabilities. In addition, future regulations, or more stringent enforcement of existing regulations, could increase those costs and liabilities, which could adversely affect our results of operations.
We are subject to a variety of federal, state and local regulatory environmental requirements affecting the mining and mineral processing industry, including among others, those relating to employee health and safety, environmental permitting and licensing, air and water emissions, greenhouse gas emissions, water pollution, waste management, remediation of soil and groundwater contamination, land use, reclamation and restoration of properties, hazardous materials, and natural resources. Some environmental laws impose substantial penalties for noncompliance, and others, such as the federal Comprehensive Environmental Response, Compensation, and Liability Act (“CERCLA”), impose strict, retroactive and joint and several liability for the remediation of releases of hazardous substances. Liability under CERCLA, or similar state and local laws, may be imposed as a result of conduct that was lawful at the time it occurred or for the conduct of, or conditions caused by, prior operators or other third parties. Failure to properly handle, transport, store or dispose of hazardous materials or otherwise conduct our operations in compliance with environmental laws could expose us to liability for governmental penalties, cleanup costs and civil or criminal liability associated with releases of such materials into the environment, damages to property or natural resources and other damages, as well as potentially impair our ability to conduct our operations. In addition, future environmental laws and regulations could restrict our ability to expand our facilities or extract our mineral reserves or could require us to acquire costly equipment or to incur other significant expenses in connection with our business. Future events, including changes in any environmental requirements (or their interpretation or enforcement) and the costs associated with complying with such requirements, could have a material adverse effect on us.
Any failure by us to comply with applicable environmental laws and regulations may cause governmental authorities to take actions that could adversely impact our operations and financial condition, including:
| • | issuance of administrative, civil, and criminal penalties; |
| • | denial, modification, or revocation of permits or other authorizations; |
| • | imposition of injunctive obligations or other limitations on our operations, including cessation of operations; and |
| • | requirements to perform site investigatory, remedial, or other corrective actions. |
Moreover, environmental requirements, and the interpretation and enforcement thereof, change frequently and have tended to become more stringent over time. For example, greenhouse gas emission regulation is becoming
31
Table of Contents
more rigorous. We expect to be required to report annual greenhouse gas emissions from our operations to the EPA, and additional greenhouse gas emission related requirements at the supranational, federal, state, regional and local levels are in various stages of development. The U.S. Congress has considered, and may adopt in the future, various legislative proposals to address climate change, including a nationwide limit on greenhouse gas emissions. In addition, the EPA has issued regulations, including the “Tailoring Rule,” that subject greenhouse gas emissions from certain stationary sources to the Prevention of Significant Deterioration and Title V provisions of the federal Clean Air Act. Any such regulations could require us to modify existing permits or obtain new permits, implement additional pollution control technology, curtail operations or increase significantly our operating costs. Any regulation of greenhouse gas emissions, including, for example, through a cap-and trade system, technology mandate, emissions tax, reporting requirement or other program, could adversely affect our business, financial condition, reputation, operating performance, and product demand.
In addition to environmental regulation, we are subject to laws and regulations relating to human exposure to crystalline silica. Several federal and state regulatory authorities, including the U.S. Mining Safety and Health Administration and the U.S. Occupational Safety and Health Administration (“OSHA”), may continue to propose changes in their regulations regarding workplace exposure to crystalline silica, such as permissible exposure limits and required controls and personal protective equipment. For instance, in August 2013, OSHA proposed regulations that would reduce permissible exposure limits to 50 micrograms of respirable crystalline silica per cubic meter of air, averaged over an 8-hour day. Both the North American Industrial Mining Association and the National Industrial Sand Association, both of which we are a member, track silicosis related issues and aim to work with government policymakers in crafting such regulations.
We may not be able to comply with any new laws and regulations that are adopted, and any new laws and regulations could have a material adverse effect on our operating results by requiring us to modify our operations or equipment or shut down some or all of our plants. Additionally, our customers may not be able to comply with any new laws and regulations, and any new laws and regulations could have a material adverse effect on our customers by requiring them to shut down old plants or to relocate plants to locations with less stringent regulations farther away from our facilities. We cannot at this time reasonably estimate our costs of compliance or the timing of any costs associated with any new laws and regulations, or any material adverse effect that any new standards will have on our customers and, consequently, on our operations.
We are subject to the Federal Mine Safety and Health Act of 1977, which imposes stringent health and safety standards on numerous aspects of our operations.
Our operations are subject to the Federal Mine Safety and Health Act of 1977, as amended by the Mine Improvement and New Emergency Response Act of 2006, which imposes stringent health and safety standards on numerous aspects of mineral extraction and processing operations, including the training of personnel, operating procedures, operating equipment, and other matters. Our failure to comply with such standards, or changes in such standards or the interpretation or enforcement thereof, could have a material adverse effect on our business, financial condition, and results of operation or otherwise impose significant restrictions on our ability to conduct mineral extraction and processing operations.
We and our customers are subject to other extensive regulations, including licensing, plant and wildlife protection, and reclamation regulation, that impose, and will continue to impose, significant costs and liabilities. In addition, future regulations, or more stringent enforcement of existing regulations, could increase those costs and liabilities, which could adversely affect our results of operations.
In addition to the regulatory matters described above, we and our customers are subject to extensive governmental regulation on matters such as permitting and licensing requirements, plant and wildlife protection, wetlands protection, reclamation and restoration of mining properties after mining is completed. Our future success depends, among other things, on the quantity of our mineral reserves and our ability to extract these reserves profitably, and our customers being able to operate their businesses as they currently do.
32
Table of Contents
In order to obtain permits and renewals of permits in the future, we may be required to prepare and present data to governmental authorities pertaining to the impact that any proposed exploration or production activities, individually or in the aggregate, may have on the environment. Certain approval procedures may require preparation of archaeological surveys, endangered species studies and other studies to assess the environmental impact of new sites or the expansion of existing sites. Compliance with these regulatory requirements is expensive and significantly lengthens the time needed to develop a site. Finally, obtaining or renewing required permits is sometimes delayed or prevented due to community opposition, including nuisance lawsuits, and other factors beyond our control. The denial of a permit essential to our operations or the imposition of conditions with which it is not practicable or feasible to comply could impair or prevent our ability to develop or expand a site. New legal requirements, including those related to the protection of the environment, or the identification of certain species as “threatened” or “endangered” could be adopted that could materially adversely affect our mining operations (including our ability to extract mineral reserves), our cost structure or our customers’ ability to use our sand-based proppants. Such current or future regulations could have a material adverse effect on our business and we may not be able to obtain or renew permits in the future.
Our inability to acquire, maintain or renew financial assurances related to the reclamation and restoration of mining property could have a material adverse effect on our business, financial condition, and results of operations.
We are generally obligated to restore property in accordance with regulatory standards and our approved reclamation plan after it has been mined. We are required under federal, state and local laws to maintain financial assurances, such as surety bonds, to secure such obligations. The inability to acquire, maintain or renew such assurances, as required by federal, state and local laws, could subject us to fines and penalties as well as the revocation of our operating permits. Such inability could result from a variety of factors, including:
| • | the lack of availability, higher expense, or unreasonable terms of such financial assurances; |
| • | the ability of current and future financial assurance counterparties to increase required collateral; and |
| • | the exercise by financial assurance counterparties of any rights to refuse to renew the financial assurance instruments. |
Our inability to acquire, maintain or renew necessary financial assurances related to the reclamation and restoration of mining property could have a material adverse effect on our business, financial condition, and results of operations.
Risks Related to Ownership of Our Common Stock
The concentration of our capital stock ownership among our largest stockholders and their affiliates will limit your ability to influence corporate matters.
The AS Group indirectly owns approximately 44.1% of our outstanding common stock, and management and other employees own a substantial portion of the remainder of our stock. As a result, the portion of our stock held by the investing public taken as a whole is approximately 15% as of March 6, 2016. Consequently, the AS Group and our management and employees will continue to have significant influence over all matters that require approval by our stockholders, including the election of directors and approval of significant corporate transactions. This concentration of ownership will limit your ability to influence corporate matters, and as a result, actions may be taken that you may not view as beneficial.
Furthermore, conflicts of interest could arise in the future between us, on the one hand, and American Securities and its affiliates, including its portfolio companies, on the other hand, concerning among other things, potential competitive business activities or business opportunities. American Securities is a private equity firm in the business of making investments in entities in a variety of industries. As a result, American Securities’ existing and future portfolio companies which it controls may compete with us for investment or business opportunities. These conflicts of interest may not be resolved in our favor.
33
Table of Contents
We have also renounced our interest in certain business opportunities. See “– Our amended and restated certificate of incorporation contains a provision renouncing our interest and expectancy in certain corporate opportunities, which could adversely affect our business or prospects.”
Our stock price could be volatile, and you may not be able to resell shares of your common stock at or above the price you paid.
The stock markets in general have experienced extreme volatility that has often been unrelated to the operating performance of particular companies. These broad market fluctuations may adversely affect the trading price of our common stock. Volatility in the market price of our common stock may prevent you from being able to sell your common stock at or above the price at which you purchased the stock. As a result, you may suffer a loss on your investment. Securities class action litigation has often been instituted against companies following periods of volatility in the overall market and in the market price of a company’s securities. Such litigation, if instituted against us, could result in very substantial costs, divert our management’s attention and resources and harm our business, operating results and financial condition.
In addition to the risks described in this section, the market price of our common stock may fluctuate significantly in response to a number of factors, most of which we cannot control, including:
| • | our operating and financial performance; |
| • | quarterly variations in the rate of growth of our financial indicators, such as revenues, EBITDA, net income, and net income per share; |
| • | the public reaction to our press releases, our other public announcements, and our filings with the SEC; |
| • | strategic actions by our competitors; |
| • | our failure to meet revenue or earnings estimates by research analysts or other investors; |
| • | changes in revenue or earnings estimates, or changes in recommendations or withdrawal of research coverage, by equity research analysts; |
| • | speculation in the press or investment community; |
| • | the failure of research analysts to cover our common stock; |
| • | sales of our common stock by us, the selling stockholders, or other stockholders, or the perception that such sales may occur; |
| • | changes in accounting principles, policies, guidance, interpretations, or standards; |
| • | additions or departures of key management personnel; |
| • | actions by our stockholders; |
| • | general market conditions, including fluctuations in commodity prices, sand-based proppants, or industrial and recreational sand-based products; |
| • | domestic and international economic, legal and regulatory factors unrelated to our performance; and |
| • | the realization of any risks described under this “Risk Factors” section. |
Our amended and restated certificate of incorporation contains a provision renouncing our interest and expectancy in certain corporate opportunities.
Our amended and restated certificate of incorporation provides for the allocation of certain corporate opportunities between us and American Securities. Under these provisions, neither American Securities, its affiliates and subsidiaries, nor any of their officers, directors, agents, stockholders, members, or partners will have any duty to refrain from engaging, directly or indirectly, in the same business activities or similar business
34
Table of Contents
activities or lines of business in which we operate, other than opportunities related to hydraulic fracturing proppants. For instance, a director of our company who also serves as a director, officer or employee of American Securities or any of its subsidiaries or affiliates may pursue certain acquisitions or other opportunities that may be complementary to our business and, as a result, such acquisition or other opportunities may not be available to us. These potential conflicts of interest could have a material adverse effect on our business, financial condition and results of operations if attractive corporate opportunities are allocated by American Securities to itself or its subsidiaries or affiliates instead of to us.
Our amended and restated certificate of incorporation and amended and restated bylaws, as well as Delaware law, contain provisions that could discourage acquisition bids or merger proposals, which may adversely affect the market price of our common stock.
Our amended and restated certificate of incorporation authorizes our board of directors to issue preferred stock without stockholder approval. If our Board of Directors elects to issue preferred stock, it could be more difficult for a third party to acquire us. In addition, some provisions of our amended and restated certificate of incorporation and amended and restated bylaws could make it more difficult for a third party to acquire control of us, even if the change of control would be beneficial to our stockholders, including:
| • | a classified board of directors; |
| • | limitations on the removal of directors; |
| • | limitations on the ability of our stockholders to call special meetings; |
| • | advance notice provisions for stockholder proposals and nominations for elections to the Board of Directors to be acted upon at meetings of stockholders; |
| • | providing that the board of directors is expressly authorized to adopt, or to alter or repeal our bylaws; |
| • | establishing advance notice and certain information requirements for nominations for election to our Board of Directors or for proposing matters that can be acted upon by stockholders at stockholder meetings; |
| • | giving the Board of Directors the power to authorize the issuance of one or more classes or series of preferred stock having such designations, preferences, limitations and relative rights, including preferences over our common stock respecting dividends and distributions; and |
| • | providing that the Court of Chancery of the State of Delaware shall be the sole and exclusive forum for certain stockholder actions involving the Company. |
We currently do not intend to pay dividends on our common stock, and our debt agreements place certain restrictions on our ability to do so. Consequently, your only opportunity to achieve a return on your investment is if the price of our common stock appreciates.
We do not plan to declare dividends on shares of our common stock in the foreseeable future. Additionally, our existing revolving credit facility and our term loan both place certain restrictions on our ability to pay cash dividends. Consequently, unless we revise our dividend policy, your only opportunity to achieve a return on your investment in us will be if you sell your common stock at a price greater than you paid for it.
Future sales of our common stock, or the perception in the public markets that these sales may occur, may depress our stock price.
Sales of substantial amounts of our common stock in the public market or the perception that these sales could occur, could adversely affect the price of our common stock and could impair our ability to raise capital through the sale of additional shares. As of March 6, 2016, we had 161,433,248 shares of common stock outstanding. A substantial number of these shares of common stock are freely tradable without restriction under the Securities
35
Table of Contents
Act. However, any shares of our common stock that may be held or acquired by our directors, executive officers and other affiliates, as that term is defined in the Securities Act, will be considered restricted or control shares under the Securities Act. Restricted or control shares may not be sold in the public market unless the sale is registered under the Securities Act or an exemption from registration is available. If a large number of these shares are sold on the open market, the price of our common stock could decline.
In the future, we may also issue securities if we need to raise capital in connection with a capital raise, acquisition, or to meet our debt obligations. The amount of shares of our common stock issued in connection with a capital raise or acquisition could constitute a material portion of our then outstanding shares of common stock.
If securities or industry analysts do not publish research or reports about our business, if they adversely change their recommendations regarding our common stock or if our operating results do not meet their expectations, our stock price could decline.
The trading market for our common stock is influenced by the research and reports that industry or securities analysts publish about us or our business. If one or more of these analysts cease coverage of our company or fail to publish reports on us regularly, we could lose visibility in the financial markets, which in turn could cause our stock price or trading volume to decline. Moreover, if one or more of the analysts who cover our company downgrades our common stock or if our operating results do not meet their expectations, our stock price could decline.
ITEM 1B. UNRESOLVED STAFF COMMENTS
None.
Our Reserves
We control one of the largest bases of silica sand reserves in the United States. From our reserves, we are able to produce a large selection of high-purity silica sand, lake sand, resin-coated sand, silica gravel, and other specialty sands. According to the Securities and Exchange Commission (SEC) Industry Guide 7, reserves are defined as that part of a mineral deposit which could be economically and legally extracted or produced at the time of the reserve determination. Reserves are categorized into proven (measured) reserves and probable (indicated) reserves. In accordance with SEC Industry Guide 7, our reserves are categorized as proven or probable.
We estimate that the company has approximately 797.7 million tons of proven recoverable mineral reserves as of December 31, 2015. Additional probable but not proven reserves are considered immaterial. Mineral reserve estimated quantities and characteristics at our properties are overseen by our internal geologists and engineers and validated by third party consulting company, GZA GeoEnvironmental, Inc.
36
Table of Contents
Summary of Reserves
The following table provides information on each of our sand mining facilities. Included is the location and area of the facility; the type, amount, and ownership status of its reserves and whether or not they meet API standards; and the primary end markets that it serves:
| Active Mines |
Acres Owned /Leased | API |
Proven Reserves In-Situ (Thousand Tons) |
Estimated Recovery Percentages |
Primary End Markets | |||||||||
| API White |
||||||||||||||
| Wedron, IL |
1,992 | O | API White | 240,391 | 80% | proppant, glass, foundry, specialty products | ||||||||
| 0 | L | |||||||||||||
| Maiden Rock, WI |
987 | O | API White | 25,595 | 70% | proppant, glass, foundry | ||||||||
| 576 | OM | |||||||||||||
| 377 | L | |||||||||||||
| Menomonie, WI |
2 | O | API White | 24,146 | 75% | proppant, glass, foundry, specialty products | ||||||||
| 366 | L | |||||||||||||
| API Brown |
||||||||||||||
| Voca, TX |
1,962 | O | API Brown | 191,949 | 50% | proppant, glass, foundry | ||||||||
| 0 | L | |||||||||||||
| Non-API |
||||||||||||||
| Chardon, OH [3] |
623 0 |
O L |
Non-API | 17,581 | 80% | glass, turf, landscaping, construction, filler/extender, foundry, industrial, proppant, | ||||||||
| Beaver, OH |
91 | O | Non-API | 12,604 | 75% | turf, landscaping, industrial | ||||||||
| 216 | L | |||||||||||||
| Development Stage |
||||||||||||||
| Katemcy, TX |
848 | O | API Brown | 113,278 | 50% | potential to serve proppant, glass, foundry | ||||||||
| 0 | L | |||||||||||||
| Diamond Bluff, WI |
10 | O | API White | 44,539 | 70% | potential to serve proppant, glass, foundry | ||||||||
| 2,674 | L | |||||||||||||
| Arcadia, WI |
438 | O | API White | 43,770 | 85% | potential to serve proppant, glass, foundry | ||||||||
| 0 | L | |||||||||||||
| Inactive |
||||||||||||||
| Bay City, WI |
40 | O | API White | 19,251 | 70% | |||||||||
| 322 | OM | proppant, glass, foundry | ||||||||||||
| 1,131 | L | |||||||||||||
| Shakopee, MN |
93 | O | API White | 14,439 | 80% | proppant, glass, foundry, specialty products | ||||||||
| 115 | L | |||||||||||||
| Brewer, MO |
353 | O | API White | 32,541 | 80% | proppant, glass, foundry | ||||||||
| 0 | L | |||||||||||||
| Harrietta, MI |
255 | O | Non-API | 11,087 | 75% | foundry, construction | ||||||||
| 86 | L | |||||||||||||
| Grand Haven, MI |
143 | O | Non-API | 6,555 | 85% | N/A | ||||||||
| 0 | L | |||||||||||||
|
|
|
|||||||||||||
| Total |
797,724 | |||||||||||||
|
|
|
|||||||||||||
37
Table of Contents
Descriptions of Sand Facilities
As of December 31, 2015, we had seven active sand mining and processing operations facilities located in Illinois, Wisconsin, Texas, and Ohio. We also have a processing facility located in Ontario, Canada that does not have any sand reserves but has an annual processing capacity of approximately 336,000 tons per year. We have inactive mines in Michigan, Missouri, and Wisconsin and undeveloped mines in Texas and Wisconsin.
The mineral rights and access to mineral reserves for the majority of our facilities are secured through land that is owned. There are no underlying agreements and/or royalties associated with these properties. Where there are agreements and/or royalties associated related to our properties, we have provided more information in the facility descriptions below. We are required to pay production royalties on a per ton basis pursuant to our mineral reserve leases.
API White
Wedron, Illinois. Our Wedron, Illinois facility is located in Wedron, LaSalle County, Illinois and consists of owned real property. The facility, which is approximately 6 miles northeast of Ottawa, Illinois, is accessible via County Highway 21 off of State Highway 71 and State Highway 23. The site utilizes natural gas and electricity to process sand. Mining methods include mechanical removal of glacial overburden followed by drilling, blasting, and hydraulic mining. Hydraulically mined sand is pumped to the wash plant to be hydraulically sized and sent to the dry plant where it is dried and screened.
Our Wedron facility was originally opened in 1890 by the Garden City Sand Co. and was sold in 1894 to the Wedron White Sand Co., which became Wedron Silica Co. in 1916. Martin Marietta acquired the company in 1979. In 1984, Best Sand and the Wedron management group purchased the operation. Our company was formed from the merger of Wedron Silica and Best Sand in 1986. The washing and drying operations at our Wedron facility were upgraded in 2012, 2013, and 2014 in conjunction with significant capacity and reserve base increases. Significant railyard expansions in 2014 and 2015 facilitated greater flexibility and provided for unit train capabilities. Processed sand is shipped from the facility via truck or rail on the Burlington Northern Santa Fe (“BNSF”) and CSX Railroads via the Illinois Railnet. Our Wedron facility utilizes approximately 50,000 linear feet of rail. A portion of the sand is transferred by conveyor or trucked from our Wedron facility and is resin-coated at our Technisand Wedron and/or Troy Grove, Illinois resin-coating facilities. The total net book value of the Wedron facility’s real property as of December 31, 2015 was $157.9 million.
The sand reserve mined from the open-pit mine at the Wedron facility is the St. Peter Sandstone formation. The Wedron facility produces high purity, round grain silica sand that meets the API requirements for proppant application. The Wedron facility production capacity is approximately 5.4 million tons per year. An additional expansion project currently under construction will provide an additional 1.5 million tons per year beginning later in 2016. The surface deposit at the Wedron facility is a high purity, round grain sand with a minimum silica content of 99%, which meets API requirements for proppant application. The controlling attributes are iron and grain size. Iron is concentrated near the surface, where orange iron staining is evident and also increases where the bottom contact becomes concentrated in iron pyrite. Maximum average full face iron content is 0.020%. The deposit tends to exhibit a coarser grain size distribution in the top half of the deposit.
Maiden Rock, Wisconsin. Our Maiden Rock, Wisconsin facility is located in Maiden Rock, Pierce County, Wisconsin and consists of owned and leased real property. The mineral reserves at the Maiden Rock facility are secured under mineral leases that, with the exercise of renewal options, expire between 2021 and 2046. The facility is within the Village and Town of Maiden Rock along State Highway 35. The Maiden Rock facility utilizes natural gas and electricity to process sand. This is an underground mine and mining methods include drilling and blasting. The reserves are located at a depth of 230 feet. The sand is removed from the face of the tunnels with a front end loader and deposited into a container where it is combined with water to form a slurry. The slurry is pumped to the surface wash plant to be hydraulically sized and sent to the dry plant where it is dried and screened.
38
Table of Contents
The Maiden Rock facility was originally developed in the 1920s. We acquired a 50% equity interest in the facility from Wisconsin Industrial Sand in 1997, and acquired the remaining equity interest in 1999. The washing and drying operations at the Maiden Rock facility were upgraded in 2012 in conjunction with a significant capacity increase. Processed sand is shipped from the Maiden Rock facility via truck or rail on the BNSF Railroad. The Maiden Rock facility utilizes a new rail loadout facility and approximately 5,000 linear feet of rail constructed in 2012. This plant is unit train capable, utilizing the new unit train railyard at the Bay City facility. The total net book value of the Maiden Rock facility’s real property as of December 31, 2015 was $39.4 million.
The sand reserve mined from the underground mine at the Maiden Rock facility is the Jordan Sandstone formation. The Maiden Rock facility produces high purity, round grain silica that meets API requirements for proppant application. The mining capacity is approximately 1.3 million tons per year.
The underground deposit at this facility is a high purity, round grain sand with a minimum silica content of 99%, which meets API requirements for proppant application. The controlling attributes are turbidity, acid solubility, and grain size. The deposit tends to exhibit a coarser grain size distribution near the top of the deposit. Grain size distribution is maintained through control of mine horizon. Turbidity and acid solubility are controlled though the use of hydrosizers during wet processing.
Menomonie, Wisconsin. Our Menomonie, Wisconsin facility is located in Menomonie, Dunn County, Wisconsin and consists of owned and leased real property. The mineral reserves at our Menomonie facility are secured under mineral subleases that expire in 2044. We constructed the Menomonie facility in 2007 approximately 2 miles east of Menomonie and it is accessible via US Highway 12 / State Highway 16. The Menomonie facility utilizes natural gas and electricity to process sand. Mining methods include the mechanical removal of glacial overburden followed by drilling, blasting and mechanical mining. Mined sand is processed and shipped by truck or rail. A remote transload facility adjacent to the Union Pacific (UP) Railroad is located approximately one mile north of the site. The total net book value of the Menomonie facility’s real property as of December 31, 2015 was $10.5 million.
The sand reserve mined from the open-pit at the Menomonie facility is the Wonewoc Sandstone formation. The Menomonie facility produces high purity, round grain silica sand that meets the API requirements for proppant application. The mining capacity is approximately 750,000 tons per year. The surface deposit at the Menomonie facility is a high purity, round grain sand with a minimum silica content of 99% which meets API requirements for proppant application. The controlling attributes are turbidity, iron, and grain size. Maximum average full face iron content is 0.080%. The deposit tends to exhibit a coarser grain size distribution in top half of deposit. Turbidity is controlled though the use of attrition scrubbers during wet processing. Iron is controlled during processing through the use of magnetic separators.
Bay City, Wisconsin. Our Bay City, Wisconsin facility is located in Isabelle and Hartland Township, Pierce County, Wisconsin and consists of owned and leased real property. The mineral reserves at the Bay City facility are secured under mineral leases that, with the exercise of renewal terms, expire between 2045 and 2106. The Bay City facility was opened in 1919 and operated continuously until 1989. We acquired the mine through the acquisition of Wisconsin Specialty Sand and constructed the associated Hager City processing (drying) plant in 2007. This underground mine is approximately 1.5 miles northeast of Bay City on State Highway 35. The reserves are located at a depth of 230 feet. The mine utilizes electricity to process sand. Mining methods include drilling and blasting. As a result of the challenging conditions in the global oil and gas markets, these operations were idled in 2015. Although the processing facility was idled, the railyard remains active and provides unit train capabilities for the Maiden Rock facility.
Mined sand is shipped approximately five miles to the Hager City plant for further processing and eventual shipment via truck or rail on the BNSF Railroad. The Hager City plant, constructed by Wisconsin Industrial Sand Company, LLC in 2007, was expanded in 2013 and 2014 with the addition of a new rail yard containing
39
Table of Contents
approximately 19,000 linear feet of rail for assembling unit trains. The total net book value of the Bay City facility’s real property as of December 31, 2015 was $24.4 million.
The sand reserve mined from the underground mine at the Bay City facility is the Jordan Sandstone formation. The Bay City facility produces high purity, round grain silica that meets API requirements for proppant application. The mining capacity is approximately 780,000 tons per year. The underground deposit at the Bay City facility is a high purity, round grain sand with a minimum silica content of 99% which meets API requirements for proppant application. The controlling attributes are turbidity, acid solubility, and grain size. The deposit tends to exhibit a coarser grain size distribution near the top of the deposit. Grain size distributions are maintained through control of mine horizon. Turbidity and acid solubility are controlled though the use of hydrosizers during wet processing.
Shakopee, Minnesota. Our Shakopee, Minnesota facility is located in Shakopee, Scott County, Minnesota and consists of owned and leased real property. The mineral reserves at our mine are secured by fee ownership and a lease agreement that, with the exercise of renewal options, expires in 2030. The facility is approximately four miles south of Shakopee, Minnesota and is accessible via US Highway 169. The Shakopee facility utilizes natural gas and electricity to process sand. Mining methods include the mechanical removal of glacial overburden followed by drilling, blasting and mechanical mining. As a result of the challenging conditions in the global oil and gas markets, these operations were idled in 2015.
Mining occurred at the Shakopee facility for a short time in the 1980s by others until the property was reclaimed. The mine was permitted by Great Plains Sand in 2012 and acquired by us in 2013, at which time we changed the name to Shakopee Sand LLC. We upgraded the washing and drying operations at the facility following the acquisition. Processed sand is shipped from the Shakopee facility via truck or by rail on the UP. The total net book value of the Shakopee facility’s real property as of December 31, 2015 was $24.0 million.
The sand reserve mined from the open-pit mine at the Shakopee facility is the Jordan Sandstone formation. The deposit produces high purity, round grain silica sand which meets API requirements for proppant application. The mining capacity is approximately 718,000 tons per year. This surface deposit at the Shakopee facility is a high purity, round grain sand with a minimum silica content of 99% which meets API requirements for proppant application. The controlling attributes are turbidity and grain size. The deposit tends to exhibit a coarser grain size distribution in the top half of deposit. Turbidity is controlled through the use of hydrosizers and attrition scrubbers during wet processing. Fine and coarse areas are blended to meet the grain size average.
Brewer, Missouri. Our Brewer, Missouri mine is located in Brewer, Perry County, Missouri and consists of owned real property. The facility, approximately one-half mile northwest of Brewer, Missouri, is accessible via State Highway M. We acquired the inactive mine in August 2014. The operation was reactivated and began production in December 2014 but was idled in 2015 due to the challenging conditions in the global oil and gas markets. Mining methods include the mechanical removal of overburden followed by drilling, blasting and mechanical mining. The total net book value of the facility’s real property as of December 31, 2015 was $19.3 million.
The sand reserve mined from the open-pit mine at the Brewer facility is the St. Peter Sandstone formation. The deposit produces high purity, round grain silica that meets API requirements for proppant application. The mining capacity is approximately 1.0 million tons per year. The surface deposit at the Brewer facility is a high purity, round grain sand with a minimum silica content of 99% which meets API requirements for proppant application. The controlling attributes are turbidity and grain size. The deposit tends to exhibit a coarser grain size distribution in top half of deposit. Turbidity is controlled through the use of hydrosizers and attrition scrubbers during wet processing.
40
Table of Contents
API Brown
Voca, Texas. Our Voca, Texas facility is located in Voca, Mason and McCulloch Counties, Texas and consists of owned real property. The facility, which is approximately 1.5 miles southeast of Voca, is accessible via County Highway 1851, south of State Highway 71. Sand mining and processing operations were developed at the facility during 2008, with the construction of existing plants completed in 2012. We acquired the operations in 2013. The Voca facility utilizes propane and electricity to process sand. Mining methods include the mechanical removal of thin overburden followed by drilling, blasting, and mechanical mining. The total net book value of the Voca facility’s real property as of December 31, 2015 was $36.7 million.
The sand reserve mined at our Voca property is the Hickory Sandstone Member of the Riley formation. The Voca facility produces high purity, round grain silica which meets API requirements for proppant application. The mining capacity is approximately 1.5 million tons per year. The surface deposit at the Voca facility is a high purity, round grain sand with a minimum silica content of 98% which meets API requirements for proppant application. The controlling attributes are turbidity and grain size. Turbidity is controlled through the use of hydrosizers and attrition scrubbers during wet processing. Grain size is controlled through the use of hydrosizers and wet screening.
Non-API
Chardon, Ohio. Our Chardon, Ohio facility is located in Geauga County, Ohio and consists of owned real property. The facility, which is approximately two miles south of Chardon, is accessible via State Route 44. The site utilizes natural gas and electricity to process sand. Mining methods include the mechanical removal of glacial overburden followed by drilling, blasting and mechanical mining.
The mine was opened in 1938 and acquired by Best Sand in 1978. We acquired the mine as a result of the merger of Wedron Silica and Best Sand in 1986. Upgrades were made to the wash plant in 2009, the fluid bed dryer in 2012 and the rotary dryer circuit in 2012. The reserve base was increased by 950,000 tons in 2014 and 1.2 million tons in 2015. The total net book value of the Chardon facility’s real property as of December 31, 2015 was $5.5 million.
The sand reserve mined from the open-pit mine at the Chardon facility is the Sharon Conglomerate formation. This plant produces high purity, sub-angular grain silica sand and gravel used for industrial and recreational markets. The mining capacity is approximately 1.1 million tons per year. The surface deposit at the Chardon facility is a high purity, sub-round grain silica sand/gravel. The deposit has a minimum silica content of 99% ideal for glass and foundry applications. The contributing attributes are iron and grain size distribution. The mine’s iron averages 0.084%.
Beaver, Ohio. Our Beaver, Ohio facility, acquired in 1994 from Schrader Sand and Gravel, is located in Jackson Township, Pike County, Ohio and consists of owned and leased real property. The mineral reserves at this facility are secured under mineral leases that, with the exercise of renewal options, expire in 2024. The facility, which is approximately six miles northeast of Beaver, Ohio, is accessible via County Road 521. The facility utilizes electricity to process sand. Mining methods include the mechanical removal of glacial overburden followed by drilling, blasting and mechanical mining. The total net book value of the Beaver facility’s real property as of December 31, 2015 was $0.6 million.
The sand reserve mined from the open-pit mine at the Beaver facility is the Sharon Conglomerate formation. The Beaver facility produces high purity, sub-angular grain silica sand and gravel. The mining capacity is approximately 425,000 tons per year. The surface deposit at the Beaver facility is a high purity, sub-angular grain silica sand/gravel. The deposit has a minimum silica content of 99% and is ideal for turf/landscaping and industrial applications. The controlling attribute is cleanliness. Cleanliness is controlled through wet processing.
41
Table of Contents
Harrietta, Michigan. Our Harrietta, Michigan facility is located in Slagle Township, Wexford County, Michigan and consists of owned and leased real property. The facility, which is approximately three miles northeast of Harrietta, Michigan, is accessible via West 28th Road and State Highway 37. As a result of challenging conditions in end markets, this facility was closed in 2015.
Development
Katemcy, Texas. Our Katemcy, Texas reserves are located in Katemcy, Mason County, Texas and consist of owned real property. The mine property was purchased in September 2013 and is accessed via County Road 1222 and State Highway 87. The mine has not yet been developed and the property is currently used as agricultural land. This deposit is capable of producing high purity, round grain silica sand that meets API requirements for proppant application. Plans to develop the mine property are under review. The sand reserve at this proposed open-pit mine is the Hickory Sandstone Member of the Riley formation.
The surface reserve is a high purity, round grain sand with a minimum silica content of 98% which meets API requirements for proppant application. The controlling attributes will be turbidity and grain size.
Diamond Bluff, Wisconsin. Our Diamond Bluff, Wisconsin reserves are located in Diamond Bluff and Oak Grove Townships, Pierce County, Wisconsin and consist of owned and leased real property. The mineral reserves are secured under mineral leases that expire between 2063 and 2064. The mine access property was purchased in 2014 and is undeveloped. The mine was permitted by the Diamond Bluff Township in 2012 and by the Oak Grove Township in 2014. The facility, which is located approximately one mile northwest of the unincorporated community of Diamond Bluff, is accessible off of 1005th Street via State Highway 35. The proposed underground mine site will be at a depth of 230 feet and will utilize electricity to process sand through drilling, blasting, mechanical, and hydraulic mining methods. Mined sand will be shipped approximately eight miles to the Hager City plant for further processing and eventual shipment via truck or rail on the BNSF Railroad. The total net book value of the facility’s real property as of December 31, 2015 is included in the net book value of the Bay City facility.
The sand reserve at this proposed underground mine is the Jordan Sandstone formation. This deposit is capable of producing high purity, round grain silica sand which meets API requirements for proppant application. This underground reserve is a high purity, round grain sand with a minimum silica content of 99% which meets API requirements for proppant application. The controlling attributes are turbidity, acid solubility, and grain size. The deposit tends to exhibit a coarser grain size distribution near the top of the deposit.
Arcadia, Wisconsin. Our Arcadia, Wisconsin reserves are located in Arcadia, Trempealeau County, Wisconsin and consist of owned real property. The mine property, which was purchased in September 2013, is located approximately 1.5 miles northeast of Arcadia and is accessed via State Highway 95. This deposit is capable of producing high purity, round grain silica sand that meets API requirements for proppant application. The mine has not been developed and is utilized as agricultural land. Currently there are no plans to develop the mine property. The sand reserve at this proposed open-pit mine at the facility is the Wonewoc Sandstone formation.
The surface reserve is a high purity, round grain sand with a minimum silica content of 99% which meets API requirements for proppant application. The controlling attributes are turbidity and grain size. The deposit tends to exhibit a coarser grain size distribution in the top half of deposit. Turbidity will be controlled though the use of attrition scrubbers during wet processing. Fine and coarse areas will be blended to meet the grain size average.
Coating, Resin Manufacturing, Specialty Blending, and Research and Development Facilities
We have six strategically located coating facilities in North America near our mining operations in Wisconsin, Illinois, and Texas. These facilities are on a combination of leased as well as owned land and buildings. As of March 2016, four of the domestic facilities were inactive or closed. We also have three international coating facilities located in Mexico, Denmark, and China.
42
Table of Contents
We have three specialty blending facilities, located in Ohio, Illinois, and Texas. These operations make custom blends of aggregates for use in industrial and commercial flooring, polymer cements, grouts and performance mortars. An additional specialty facility, Mineral Visions, located in Illinois, produces specialty colored quartz. We have a manufacturing facility in Michigan, Alpha Resins, which produces resins primarily for our own use. These properties are all on owned land and buildings. We have research and development facilities also located in Texas and Illinois. These facilities are leased.
The following map reflects the location of our mining and processing, resin manufacturing, coating, specialty blending and R&D facilities and our administrative offices:
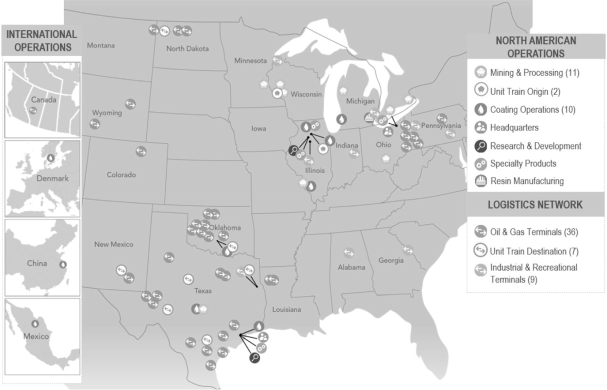
Product Delivery
We have established an oil and gas logistics network that we believe is highly responsive to our customers’ needs. Our terminal network includes 43 active oil and gas terminals and 9 industrial and recreational terminals. These terminals are a combination of facilities that we own or lease, as well as properties that are owned and operated by third parties. They generally consist of rail and transload operations, plus in some cases additional storage and handling facilities.
We are subject to various legal proceedings, claims and governmental inspections, audits, or investigations arising out of our business which cover matters such as general commercial, governmental regulations, FCPA requirements, antitrust and trade regulations, product liability, environmental, intellectual property, employment, and other actions. Although the outcomes of these claims cannot be predicted with certainty, in the opinion of management, the ultimate resolution of these matters will not have a material adverse effect on our financial position or results of operations.
43
Table of Contents
Regulation and Legislation
Mining and Workplace Safety
Federal Regulation
The U.S. Mine Safety and Health Administration (“MSHA”) is the primary regulatory organization governing the commercial silica industry. Accordingly, MSHA regulates quarries, surface mines, underground mines, and the industrial mineral processing facilities associated with quarries and mines. The mission of MSHA is to administer the provisions of the Federal Mine Safety and Health Act of 1977 and to enforce compliance with mandatory safety and health standards. MSHA works closely with the Industrial Minerals Association, a trade association, in pursuing this mission. As part of MSHA’s oversight, representatives perform at least two unannounced inspections annually for each above-ground facility. To date these inspections have not resulted in any citations for material violations of MSHA standards.
We also are subject to the requirements of the U.S. Occupational Safety and Health Act (“OSHA”) and comparable state statutes that regulate the protection of the health and safety of workers. In addition, the OSHA Hazard Communication Standard requires that information be maintained about hazardous materials used or produced in operations and that this information be provided to employees, state and local government authorities and the public. OSHA regulates users of commercial silica and provides detailed regulations requiring employers to protect employees from overexposure to silica through the enforcement of permissible exposure limits.
Internal Controls
We adhere to a strict occupational health program aimed at controlling exposure to silica dust, which includes dust sampling, a respiratory protection program, medical surveillance, training, and other components. Our safety program is designed to ensure compliance with the standards of our Occupational Health and Safety Manual and MSHA regulations. For both health and safety issues, extensive training is provided to employees. We have safety committees at our plants made up of salaried and hourly employees. We perform annual internal health and safety audits and conduct semi-annual crisis management drills to test our plants’ abilities to respond to various situations. Health and safety programs are administered by our corporate health and safety department with the assistance of plant Environmental, Health and Safety Coordinators.
Environmental Matters
We and the proppant industry are subject to extensive governmental regulation on, among other things, matters such as permitting and licensing requirements, plant and wildlife protection, hazardous materials, air and water emissions, and environmental contamination and reclamation. A variety of federal, state, and local agencies implement and enforce these regulations.
Federal Regulation
At the federal level, we may be required to obtain permits under Section 404 of the Clean Water Act from the U.S. Army Corps of Engineers for the discharge of dredged or fill material into waters of the United States, including wetlands and streams, in connection with our operations. We also may be required to obtain permits under Section 402 of the Clean Water Act from the EPA (or the relevant state environmental agency in states where the permit program has been delegated to the state) for discharges of pollutants into waters of the United States, including discharges of wastewater or storm water runoff associated with construction activities. Failure to obtain these required permits or to comply with their terms could subject us to administrative, civil and criminal penalties as well as injunctive relief.
The U.S. Clean Air Act and comparable state laws regulate emissions of various air pollutants through air emissions permitting programs and the imposition of other requirements, such as monitoring and reporting
44
Table of Contents
requirements. These regulatory programs may require us to install expensive emissions abatement equipment, modify our operational practices and obtain permits for our existing operations, and before commencing construction on a new or modified source of air emissions, such laws may require us to obtain pre-approval for the construction or modification of certain projects or facilities extended to produce or significantly increase air emissions. In addition, air permits are required for our processing and terminal operations, and our frac sand mining operations that result in the emission of regulated air contaminants. Obtaining air emissions permits has the potential to delay the development or continued performance of our operations. As a result, we may be required to incur increased capital and operating costs because of these regulations. We could be subject to administrative, civil, and criminal penalties as well as injunctive relief for noncompliance with air permits or other requirements of the U.S. Clean Air Act and comparable state laws and regulations.
Methane, a primary component of natural gas, and carbon dioxide, a byproduct of the burning of natural gas, are examples of greenhouse gases (“GHGs”). In recent years, the U.S. Congress has considered legislation to reduce emissions of GHGs. It presently appears unlikely that comprehensive climate legislation will be passed by either house of Congress in the near future, although energy legislation and other regulatory initiatives may be proposed that may be relevant to GHG emissions issues.
Independent of Congress, the EPA has adopted regulations controlling GHG emissions under its existing authority under the CAA. In 2009, the EPA officially published its findings that emissions of carbon dioxide, methane and other GHGs present an endangerment to human health and the environment because emissions of such gases are, according to the EPA, contributing to warming of the earth’s atmosphere and other climatic changes. These findings by the EPA allow the agency to proceed with the adoption and implementation of regulations that would restrict emissions of GHGs under existing provisions of the CAA. In 2010, the EPA published a final rule expanding its existing GHG emissions reporting rule for certain petroleum and natural gas facilities that emit 25,000 metric tons or more of carbon dioxide equivalent per year. We are subject to annual GHG reporting obligations for our operations in Wedron, Illinois.
Although it is not currently possible to predict how any proposed or future GHG legislation or regulation by Congress, the EPA, the states, or multi-state regions will impact our business, any legislation or regulation of GHG emissions that may be imposed in areas in which we conduct business could result in increased compliance costs or additional operating restrictions or reduced demand for our services, and could have a material adverse effect on our business, financial condition, and results of operations.
As part of our operations, we utilize or store petroleum products and other substances such as diesel fuel, lubricating oils, and hydraulic fluid. We are subject to regulatory programs pertaining to the storage, use, transportation, and disposal of these substances, including Spill Prevention, Control and Countermeasure planning requirements. Spills or releases may occur in the course of our operations, and we could incur substantial costs and liabilities as a result of such spills or releases, including those relating to claims for damage or injury to property and persons. Additionally, some of our operations are located on properties that historically have been used in ways that resulted in the release of contaminants, including hazardous substances, into the environment, and we could be held liable for the remediation of such historical contamination. The Comprehensive Environmental Response, Compensation, and Liability Act (“CERCLA,” also known as the Superfund law) and comparable state laws impose joint and several liability, without regard to fault or legality of conduct, on classes of persons who are considered to be responsible for the release of hazardous substances into the environment. These persons include the owner or operator of the site where the release occurred and anyone who disposed or arranged for the disposal of a hazardous substance released at the site. Under CERCLA, such persons may be subject to liability for the costs of cleaning up the hazardous substances, for damages to natural resources, and for the costs of certain health studies. In addition, it is not uncommon for neighboring landowners and other third parties to file claims for personal injury and property damage allegedly caused by the hazardous substances released into the environment.
45
Table of Contents
In the course of our operations, we generate industrial solid wastes that may be regulated as hazardous wastes. The Resource Conservation and Recovery Act (“RCRA”) and comparable state statutes regulate the generation, transportation, treatment, storage, disposal, and cleanup of hazardous and non-hazardous wastes. The EPA and the individual states, to which the EPA has delegated portions of the RCRA program for local implementation, administer the RCRA program.
In September 2013, the EPA issued RCRA consent orders to several companies, including us, in connection with historic contamination of residential drinking water wells near our Wedron, Illinois facility. The EPA identified benzene and other volatile organic compounds in some drinking water wells, some (including benzene) in excess of established standards. The consent orders required the companies to analyze conditions at their sites to determine whether operations at their sites are potential sources of groundwater contamination. We completed the study for our site, and our consultant submitted a site conditions report to the EPA in August 2014, which report concluded that our operations at the site are not a source of groundwater impacts in the Wedron community. The report recommended that no further work should be required under the consent order. In March 2015, the EPA issued a letter to us stating that we have completed all work required under the consent order to the EPA’s satisfaction, and our obligations under the consent order have now been satisfied. We have also performed environmental investigation and remediation activities under oversight of the Illinois Environmental Protection Agency (IEPA) at a removed underground storage tank (UST) system at the Wedron facility south of residential areas of the community. The investigation report approved by the IEPA concluded that the petroleum constituents reported in the groundwater in the Wedron community are not related to the former UST system. We have performed limited soil removal at the location of the former UST system pursuant to a Corrective Action Plan approved by the IEPA. The IEPA has approved the closure of this site, which is documented through a No Further Remediation Letter issued by the Agency. The No Further Remediation Letter has been recorded with the local County Recorder of Deeds and includes deed restrictions which will limit this portion of the Wedron property to industrial use in perpetuity.
Although we do not directly engage in hydraulic fracturing activities, we supply sand-based proppants to hydraulic fracturing operators in the oil and natural gas industry. Hydraulic fracturing involves the injection of water, sand, and chemicals, under pressure, into the formation to fracture the surrounding rock and stimulate production. The hydraulic fracturing process is typically regulated by state or local governmental authorities. However, the practice of hydraulic fracturing has become controversial in some areas and is undergoing increased scrutiny. Several federal agencies and regulatory authorities are investigating the potential environmental impacts of hydraulic fracturing and whether additional regulation may be necessary. The U.S. Environmental Protection Agency has asserted limited federal regulatory authority over hydraulic fracturing and has indicated it may seek to further expand its regulation of hydraulic fracturing. The Bureau of Land Management has proposed regulations applicable to hydraulic fracturing conducted on federal and Indian oil and gas leases. Congress has from time to time considered the adoption of legislation to provide for federal regulation of hydraulic fracturing. In addition, various state, local, and foreign governments have implemented, or are considering, increased regulatory oversight of hydraulic fracturing through additional permitting requirements, operational restrictions, disclosure requirements, and temporary or permanent bans on hydraulic fracturing in certain areas such as environmentally sensitive watersheds. Numerous states have imposed disclosure requirements on hydraulic fracturing well owners and operators. Some local governments have adopted and others may seek to adopt ordinances prohibiting or regulating the time, place, and manner of drilling activities in general or hydraulic fracturing activities within their jurisdictions.
The adoption of new laws or regulations at the federal, state, local, or foreign levels imposing reporting obligations on, or otherwise limiting or delaying, the hydraulic fracturing process could make it more difficult to complete oil and natural gas wells, increase our customers’ costs of compliance and doing business, and otherwise adversely affect the hydraulic fracturing services they perform, which could negatively impact demand for our sand-based proppants.
46
Table of Contents
Our operations may also be subject to broad environmental review under the National Environmental Policy Act (“NEPA”). NEPA requires federal agencies to evaluate the environmental impact of all “major federal actions” significantly affecting the quality of the human environment. The granting of a federal permit for a major development project, such as a mining operation, may be considered a “major federal action” that requires review under NEPA. Therefore, our projects may require review and evaluation under NEPA. As part of this evaluation, the federal agency considers a broad array of environmental impacts, including, among other things, impacts on air quality, water quality, wildlife (including threatened and endangered species), historical and archeological resources, geology, socioeconomics and aesthetics. NEPA also requires the consideration of alternatives to the project. The NEPA review process, especially the preparation of a full environmental impact statement, can be time consuming and expensive. The purpose of the NEPA review process is to inform federal agencies’ decision-making on whether federal approval should be granted for a project and to provide the public with an opportunity to comment on the environmental impacts of a proposed project. Though NEPA requires only that an environmental evaluation be conducted and does not mandate a result, a federal agency could decide to deny a permit, or impose certain conditions on its approval, based on its environmental review under NEPA, or a third party may challenge the adequacy of a NEPA review and thereby delay the issuance of a federal permit or approval.
Federal agencies granting permits for our operations also must consider impacts to endangered and threatened species and their habitat under the Endangered Species Act. We also must comply with and are subject to liability under the Endangered Species Act, which prohibits and imposes stringent penalties for the harming of endangered or threatened species and their habitat. Some of our operations are conducted in areas where protected species or their habitats are known to exist. In these areas, we may be obligated to develop and implement plans to avoid potential adverse effects to protected species and their habitats, and we may be prohibited from conducting operations in certain locations or during certain times, such as breeding and nesting seasons, when our operations could have an adverse effect on the species. Federal agencies also must consider a project’s impacts on historic or archeological resources under the National Historic Preservation Act, and we may be required to conduct archeological surveys of project sites and to avoid or preserve historical areas or artifacts.
State and Local Regulation
Because our operations are located in numerous states, we are also subject to a variety of different state and local environmental review and permitting requirements. Some states in which our projects are located or are being developed have state laws similar to NEPA; thus our development of new sites or the expansion of existing sites may be subject to comprehensive state environmental reviews even if it is not subject to NEPA. In some cases, the state environmental review may be more stringent than the federal review. Our operations may require state law-based permits in addition to federal permits, requiring state agencies to consider a range of issues, many the same as federal agencies, including, among other things, a project’s impact on wildlife and their habitats, historic and archaeological sites, aesthetics, agricultural operations, and scenic areas. Some states also have specific permitting and review processes for commercial silica mining operations, and states may impose different or additional monitoring or mitigation requirements than federal agencies. The development of new sites and our existing operations also are subject to a variety of local environmental and regulatory requirements, including land use, zoning, building, and transportation requirements.
Some local communities have expressed concern regarding silica sand mining operations. These concerns have generally included exposure to ambient silica sand dust, truck traffic, water usage, and blasting. In response, certain state and local communities have developed or are in the process of developing regulations or zoning restrictions intended to minimize dust from getting airborne, control the flow of truck traffic, significantly curtail the amount of practicable area for mining activities, require compensation to local residents for potential impacts of mining activities and, in some cases, ban issuance of new permits for mining activities. To date, we have not experienced any material impact to our existing mining operations or planned capacity expansions as a result of these types of concerns. We are not aware of any proposals for significant increased scrutiny on the part of state
47
Table of Contents
or local regulators in the jurisdictions in which we operate or community concerns with respect to our operations that would reasonably be expected to have a material adverse effect on our business, financial condition, or results of operations going forward.
Planned expansion of our mining and production capacity or construction and operation of related facilities in new communities could be more significantly impacted by increased regulatory activity. Difficulty or delays in obtaining or inability to obtain new mining permits or increased costs of compliance with future state and local regulatory requirements could have a material negative impact on our ability to grow our business. In an effort to minimize these risks, we continue to be engaged with local communities in order to grow and maintain strong relationships with residents and regulators.
Costs of Compliance
We may incur significant costs and liabilities as a result of environmental, health, and safety requirements applicable to our activities. Failure to comply with environmental laws and regulations may result in the assessment of administrative, civil and criminal penalties, imposition of investigatory, cleanup and site restoration costs and liens, the denial or revocation of permits or other authorizations, and the issuance of injunctions to limit or cease operations. Compliance with these laws and regulations may also increase the cost of the development, construction and operation of our projects and may prevent or delay the commencement or continuance of a given project. In addition, claims for damages to persons or property may result from environmental and other impacts of our activities. In addition, the clear trend in environmental regulation is to place more restrictions on activities that may affect the environment, and thus, any changes in, or more stringent enforcement of, these laws and regulations that result in more stringent and costly pollution control equipment, waste handling, storage, transport, disposal, or remediation requirements could have a material adverse effect on our operations and financial position.
The process for performing environmental impact studies and reviews for federal, state, and local permits for our operations involves a significant investment of time and monetary resources. We cannot control the permit approval process. We cannot predict whether all permits required for a given project will be granted or whether such permits will be the subject of significant opposition. The denial of a permit essential to a project or the imposition of conditions with which it is not practicable or feasible to comply could impair or prevent our ability to develop a project. Significant opposition by neighboring property owners, members of the public or other third parties, as well as any delay in the environmental review and permitting process, could impair or delay our ability to develop or expand a project. Additionally, the passage of more stringent environmental laws could impair our ability to develop new operations and have an adverse effect on our financial condition and results of operations.
ITEM 4. MINE SAFETY DISCLOSURES
The Fairmount Santrol Safety & Health Management System (“SHMS”) establishes the system for promoting a safety culture that encourages incident prevention and continually strives to improve its safety and health performance.
The SHMS includes as its domain all established safety and health specific programs and initiatives for the Company’s compliance with all local, state and federal legislation, standards, and regulations and SHMS Policy as they apply to a safe and healthy employee, stakeholder and work environment.
The SHMS has the ultimate goal for the identification, elimination or control of all risks to personnel, stakeholders, and facilities, that can be controlled and directly managed, and those it does not control or directly manage, but can expect to have an influence upon.
The operation of our U.S. based mines is subject to regulation by the Federal Mine Safety and Health Administration (“MSHA”) under the Federal Mine Safety and Health Act of 1977 (the “Mine Act”). MSHA
48
Table of Contents
inspects our mines on a regular basis and issues various citations and orders when it believes a violation has occurred under the Mine Act. Following passage of The Mine Improvement and New Emergency Response Act of 2006, MSHA significantly increased the numbers of citations and orders charged against mining operations. The dollar penalties assessed for citations issued has also increased in recent years.
Fairmount Santrol is required to report certain mine safety violations or other regulatory matters required by Section 1503(a) of the Dodd-Frank Wall Street Reform and Consumer Protection Act and Item 104 of Regulation S-K, and that required information is included in Exhibit 95.1 and is incorporated by reference into this Annual Report.
49
Table of Contents
ITEM 5. MARKET FOR REGISTRANT’S COMMON EQUITY, RELATED STOCKHOLDER MATTERS, AND ISSUER PURCHASES OF EQUITY SECURITIES
Market Information
Shares of our common stock, traded under the symbol “FMSA,” have been publicly traded since October 3, 2014, when our common stock was listed and began trading on the New York Stock Exchange (“NYSE”). Prior to that date, there was no public market for our common stock.
The following table sets forth, for the reporting period indicated, the high and low market prices per share for our common stock, as reported on the New York Stock Exchange composite tape:
| Sales Price | ||||||||
| High | Low | |||||||
| Fiscal 2014 |
||||||||
| October 3, 2014 – December 31, 2014 |
$ | 16.98 | $ | 6.43 | ||||
| Fiscal 2015 |
||||||||
| January 1, 2015 – March 31, 2015 |
$ | 7.48 | $ | 4.91 | ||||
| April 1, 2015 – June 30, 2015 |
9.49 | 7.14 | ||||||
| July 1, 2015 – September 30, 2015 |
8.25 | 2.60 | ||||||
| October 1, 2015 – December 31, 2015 |
3.45 | 2.21 | ||||||
Holders of Record
On March 6, 2016, there were 161,433,248 shares of our common stock outstanding, which were held by approximately 71 stockholders of record. Because many of our shares of common stock are held by brokers and other institutions on behalf of stockholders, we are unable to estimate the total number of stockholders represented by these record holders.
Fairmount Santrol Holdings Inc. Comparative Stock Performance Graph
The information contained in this Fairmount Santrol Holdings Inc. Comparative Stock Performance Graph section shall not be deemed to be “soliciting material” or “filed” or incorporated by reference in future filings with the SEC, or subject to the liabilities of Section 18 of the Exchange Act, except to the extent that we specifically incorporate it by reference into a document filed under the Securities Act or the Exchange Act.
The graph below compares the cumulative total shareholder return on our common stock, the cumulative total return on the Russell 3000 Index, the Standard and Poor’s Small Cap 600 GICS Oil & Gas Equipment & Services Sub-Industry index, and a composite average of publicly traded proppant peer companies (U.S. Silica Holdings, Inc., Hi-Crush Partners LP, CARBO Ceramics, Inc., and Emerge Energy Services LP) since October 3, 2014, the first day our stock traded on the NYSE.
50
Table of Contents
The graph assumes $100 was invested on October 3, 2014, the first day our stock was traded on the NYSE, in our common stock, the Russell 3000, the Standard and Poor’s Small Cap 600 GICS Oil & Gas Equipment & Services Sub-Industry Index, and a composite of publicly-traded proppant peer companies. The cumulative total return assumes the reinvestment of all dividends. We elected to include the stock performance of a composite of our publicly-traded peers as we believe it is an appropriate benchmark for our line of business/industry.
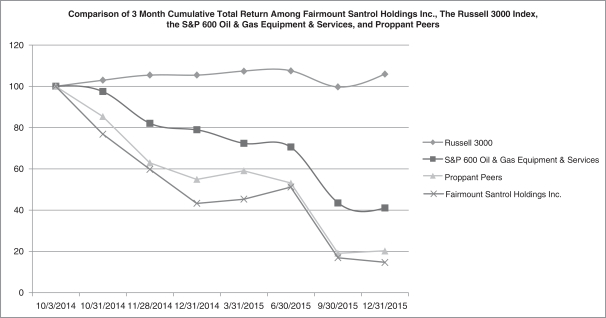
TOTAL RETURN
| Russell 3000 | S&P Oil & Gas Equipment & Services |
Proppant Peers | Fairmount Santrol Holdings Inc. |
|||||||||||||
| 10/3/2014 |
100.00 | 100.00 | 100.00 | 100.00 | ||||||||||||
| 10/31/2014 |
102.93 | 97.44 | 85.36 | 76.81 | ||||||||||||
| 11/28/2014 |
105.42 | 82.06 | 62.96 | 59.75 | ||||||||||||
| 12/31/2014 |
105.42 | 78.93 | 54.87 | 43.25 | ||||||||||||
| 3/31/2015 |
107.32 | 72.34 | 59.06 | 45.25 | ||||||||||||
| 6/30/2015 |
107.47 | 70.55 | 53.10 | 51.19 | ||||||||||||
| 9/30/2015 |
99.68 | 43.49 | 19.11 | 16.88 | ||||||||||||
| 12/31/2015 |
105.94 | 41.07 | 20.23 | 14.69 | ||||||||||||
51
Table of Contents
ITEM 6. SELECTED FINANCIAL DATA
The following table presents our consolidated statement of operations and certain operating data. The results of operations by segment are discussed in further detail following the consolidated overview.
| Year Ended December 31, | ||||||||||||||||||||
| 2015 | 2014 | 2013 | 2012 | 2011 | ||||||||||||||||
| (in thousands) | ||||||||||||||||||||
| Statement of Income Data: |
||||||||||||||||||||
| Revenue |
$ | 828,709 | $ | 1,356,458 | $ | 988,386 | $ | 885,190 | $ | 909,742 | ||||||||||
| Income (loss) from operations |
(30,135 | ) | 311,664 | 227,956 | 278,426 | 296,903 | ||||||||||||||
| Income (loss) before provision for income taxes |
(93,869 | ) | 248,036 | 149,876 | 219,842 | 217,855 | ||||||||||||||
| Net income (loss) |
(91,930 | ) | 170,623 | 104,657 | 149,473 | 146,098 | ||||||||||||||
| Net income (loss) attributable to Fairmount Santrol Holdings Inc. |
(92,135 | ) | 170,450 | 103,961 | 148,886 | 145,183 | ||||||||||||||
| Earnings per share: |
||||||||||||||||||||
| Basic |
$ | (0.57 | ) | $ | 1.08 | $ | 0.67 | $ | 0.96 | $ | 0.95 | |||||||||
| Diluted |
$ | (0.57 | ) | $ | 1.03 | $ | 0.63 | $ | 0.91 | $ | 0.90 | |||||||||
| Statement of Cash Flows Data: |
||||||||||||||||||||
| Net cash provided by (used in): |
||||||||||||||||||||
| Operating activities |
$ | 235,994 | $ | 205,276 | $ | 174,635 | $ | 186,433 | $ | 167,861 | ||||||||||
| Investing activities |
(114,000 | ) | (138,331 | ) | (579,517 | ) | (107,366 | ) | (102,572 | ) | ||||||||||
| Financing activities |
(25,091 | ) | (7,677 | ) | 410,515 | (119,070 | ) | (49,202 | ) | |||||||||||
| Other Financial Data: |
||||||||||||||||||||
| Capital expenditures |
$ | 113,750 | $ | 143,491 | $ | 111,514 | $ | 109,016 | $ | 77,827 | ||||||||||
| EBITDA |
34,922 | 368,084 | 248,877 | 303,659 | 303,227 | |||||||||||||||
| Adjusted EBITDA |
138,100 | 397,291 | 292,584 | 318,650 | 335,110 | |||||||||||||||
| Operating Data: |
||||||||||||||||||||
| Proppant Solutions |
||||||||||||||||||||
| Total tons sold |
6,204 | 7,188 | 5,117 | 3,765 | 3,402 | |||||||||||||||
| Revenue |
$ | 710,083 | $ | 1,232,232 | $ | 856,212 | $ | 757,851 | $ | 807,848 | ||||||||||
| Segment contribution margin |
70,810 | 430,779 | 296,320 | 316,251 | 339,050 | |||||||||||||||
| Industrial & Recreational Products |
||||||||||||||||||||
| Total tons sold |
2,301 | 2,426 | 2,462 | 2,375 | 2,296 | |||||||||||||||
| Revenue |
$ | 118,626 | $ | 124,226 | $ | 132,174 | $ | 127,339 | $ | 101,893 | ||||||||||
| Segment contribution margin |
25,249 | 34,473 | 34,765 | 37,837 | 29,142 | |||||||||||||||
| Balance Sheet Data (at period end): |
||||||||||||||||||||
| Cash and cash equivalents |
$ | 171,486 | $ | 76,923 | $ | 17,815 | $ | 11,866 | $ | 51,765 | ||||||||||
| Total assets |
1,368,959 | 1,514,016 | 1,283,431 | 679,601 | 646,176 | |||||||||||||||
| Long-term debt (including current portion) |
1,237,816 | 1,252,639 | 1,262,146 | 831,195 | 947,447 | |||||||||||||||
| Total liabilities |
1,429,327 | 1,480,542 | 1,448,789 | 965,529 | 1,094,168 | |||||||||||||||
| Total equity (deficit) |
(60,368 | ) | 33,474 | (165,358 | ) | (285,928 | ) | (447,992 | ) | |||||||||||
52
Table of Contents
ITEM 7. MANAGEMENT’S DISCUSSION AND ANALYSIS OF FINANCIAL CONDITION AND RESULTS OF OPERATIONS
The following discussion and analysis summarizes the significant factors affecting the consolidated operating results, financial condition, liquidity and cash flows of our company as of and for the periods presented below. The following discussion and analysis should be read in conjunction with our description of the business in Item 1, “Business” in this report, and our consolidated financial statements in Item 8 of this Annual Report on Form 10-K. This discussion contains forward-looking statements that are based on the beliefs of our management, as well as assumptions made by, and information currently available to, our management. Actual results could differ materially from those discussed in or implied by forward-looking statements as a result of various factors, including those discussed herein, particularly in the section entitled “Risk Factors.”
Overview
As of December 31, 2015, we are one of the world’s largest providers of sand-based proppant solutions and for nearly 40 years have been a pioneer in the development of high performance proppants used by Exploration & Production (“E&P”) companies to enhance the productivity of their oil and gas wells. We offer the broadest range of proppants available in the market today, including high quality sand and a variety of resin-coated products. All of our frac sand exceeds API specifications. Additionally, for more than 120 years, we and our predecessor companies have provided high quality sand-based products, strong technical leadership and applications knowledge to end users in the Industrial & Recreational (“I&R”) markets.
As one of the industry leaders, our asset base includes 798 million tons of proven and probable mineral reserves, which we believe is one of the largest reserve bases in the industry. Due to the continuing challenging conditions in the oil and gas markets, we continue to adjust our operational footprint to minimize our costs. As of March 2016, we have 11 sand processing facilities (7 of which are active) with 14.8 million tons of annual sand processing capacity. In 2015, we closed our sand processing facilities in Readfield, Wisconsin and Wexford, Michigan and idled our facilities in Brewer, Missouri, Shakopee, Minnesota, and Hager City, Wisconsin. We also have 10 coating facilities (6 of which are active) with 2.3 million tons of annual coating capacity. Our coating facilities include operations in Mexico, Denmark and China, through which we serve international oil and gas markets. In 2015, we closed our resin-coating facility in Bridgman, Michigan and idled resin-coating facilities in Voca, Texas and Cutler, Illinois and SSP-coating facilities in Fresno, Texas.
We are capable of Class I railroad deliveries to each of North America’s major oil and gas producing basins and also have the flexibility to ship our product via barge, marine terminals and trucks to reach our customers as needed. We operate an integrated logistics platform consisting of 43 active proppant distribution terminals and a fleet of approximately 10,100 railcars (net of subleases). We have recently expanded our unit train destinations to two production facilities and seven in-basin terminals, which reduce freight costs and improve cycle times for our rail car fleet. In order to better align our logistics network with customer demand and to reduce costs, we discontinued activity at ten transloading terminals and opened seven new terminals in 2015.
Our operations are organized into two segments based on the primary end markets we serve: (i) Proppant Solutions and (ii) Industrial & Recreational (I&R) Products. Our Proppant Solutions segment predominantly provides sand-based proppants for use in hydraulic fracturing operations throughout the U.S. and Canada, Argentina, Mexico, China, northern Europe and the United Arab Emirates. Our I&R segment provides raw, coated, and custom blended sands to the foundry, building products, glass, turf and landscape and filtration industries primarily in North America. We believe our two market segments are complementary. Our ability to sell to a wide range of customers across multiple end markets allows us to maximize the recovery of our reserve base within our mining operations and to reduce the cyclicality of our earnings.
53
Table of Contents
Recent Trends and Outlook
Recent trends driving demand for our proppants and commercial silica include:
| • | Level of drilling activity and demand for proppants. Through 2014, the growth in the use of horizontal drilling utilizing hydraulic fracturing as a means to extract hydrocarbons from shale formations dramatically increased the number of oil and gas rigs operating in North America. This increased drilling activity contributed to substantial growth in demand for proppants from 2009 to 2014. However, during the fourth quarter of 2014, increasing global supply of oil, in conjunction with slowing growth of global oil demand, created downward pressure on crude oil prices, which has continued through 2015. As a result, various E&P companies reduced drilling and capital programs, resulting in significantly reduced rig counts. North American rig counts have fallen significantly from September 2014 to December 2015, which has resulted in reduced drilling activity and has negatively impacted the demand for proppants in 2015. During the same period, however, E&P companies, in partnership with oilfield service companies, are continuing to refine their well designs and hydraulic fracturing techniques to maximize hydrocarbon recovery from each well. These techniques vary based on formation and well geology, but some of the more pervasive recent trends include longer lateral drilling lengths coupled with an increased number of hydraulic fracturing stages per well. E&P and oilfield service companies have also been increasing the amount of proppant used per frac stage and, together, these techniques have greatly increased the volume of proppant used in the completion of each well (referred to as “proppant intensity”). The trend of increasing proppant intensity has offset, to some extent, the decrease in demand for proppants resulting from reduced rig counts and drilling activity. |
| • | Shift in drilling activity and demand mix. The level of drilling activity for oil and gas can have an impact on the demand for proppant and the mix of proppant we sell. In 2014, with the rapid growth of drilling deep wells in regions such as the Permian region, and drilling wells in regions that were prone to the flowback of proppant, we saw a rapid increase in demand for our resin-coated proppants. In late 2014 and 2015, lower crude oil prices have caused E&P companies to seek ways to reduce short-term operating costs, and, as a result, we have seen reduced demand for our resin-coated proppants. Further, lower crude oil prices have caused many operators to drill fewer of the deeper and more expensive wells in an effort to reduce production costs, which has also had an adverse impact on the demand for resin-coated proppants, particularly those designed to add strength for higher closer pressures. There can be ongoing shifts in grade sizes that impact the demand for our raw sand proppants. |
| • | Volatility in selling prices for proppants. The rapid growth in demand for proppants in 2014 driven by relatively high oil and gas prices and high levels of drilling activity caused selling prices for proppants to increase as the market for proppants was generally undersupplied. This imbalance of supply and demand caused many proppant suppliers to expand production capacity in anticipation of continued growth in demand. However, the rapid decline in oil and gas prices that occurred later in 2014 and in 2015 led to reduced drilling activity and reduced demand for proppants. As a result, the proppant market is in a position of oversupply, which has caused selling prices for all proppants to decline significantly in 2015. It is unclear when global oil and gas prices and increased drilling activity will begin to increase the demand for proppants, or when industry production capacity will contract enough to bring supply and demand more into balance and put upward pressure on selling prices. |
| • | Demand for in-basin delivery of proppant. In recent years, many customers sought to outsource proppant logistics and to purchase proppant at the basin, allowing them to focus on their core competencies, minimize inventory costs, and maximize flexibility. In 2015, approximately 75% of our proppant sales volume was sold in-basin, down from approximately 85% in 2014. In the second half of 2015, we saw an increase in demand from larger oilfield service customers for large volume shipments that can be taken directly from our plants. With our increasing capability to provide low-cost unit train shipments directly to large customers while also shipping unit trains to certain of our own in-basin terminals, we are well-equipped to take advantage of shifting demand. |
| • | Increased demand for unit train deliveries. With the shift of larger oilfield services customers toward shipments taken directly from our plants, there is also a greater demand for shipments via unit trains to |
54
Table of Contents
| enhance the economics of deliveries. During the fourth quarter of 2015, we shipped 68 unit trains representing approximately 74% of Northern White sand volumes with a total of 208 unit trains shipped during the year. We are well-positioned to help our customers lower their costs and improve delivery, as we now have seven unit train-capable destinations. |
| • | Continued stable demand in industrial end markets. Sales in our I&R Products segment are driven by macroeconomic factors such as housing starts, light vehicle sales, repair and remodel activity and industrial production. To the extent these demand drivers continue on their current trends, we expect that demand for our commercial silica products will remain relatively stable. |
How We Generate Our Sales
We derive our sales by mining, processing and transporting sand-based proppants and silica sand products that our customers purchase for use in a wide variety of applications. In our Proppant Solutions business for the year ended December 31, 2015, we sold approximately 75% of our North American proppant volume through our network of terminals at selling prices that are set by local market dynamics. The remaining volume in the Proppant Solutions business is sold to customers directly from our mining and production facilities. The average selling prices for products sold through our terminals are higher than the average selling prices for comparable products sold from our production facilities due to costs incurred to handle and transport the products from the production facilities to the terminals. Generally, logistics costs can comprise 70-80% of the delivered cost of Northern White frac sand, depending on the basin into which the product is delivered. Due to the closer proximity of distribution terminals to our production facility, the amount of logistics costs included in the total delivered cost of our Texas Gold frac sand generally will be lower than that for our Northern White frac sand.
We primarily sell products under supply agreements with terms that vary by contract. Generally, the selling prices specified in our contracts are based on market prices. We believe that this approach to contract pricing allows us to reduce prices and retain or gain volume in market downcycles and capture higher prices in market upcycles. Our contracts have a variety of volume provisions. While certain of our contracts have no minimum volume requirements, certain of the agreements require the customer to purchase a specified percentage of its proppant requirements or a minimum volume of proppant from us. Certain of these minimum volume contracts include a provision which may trigger penalties if the purchased volume does not meet the required minimums.
Our Proppant Solutions segment represented 86% of our revenues for the year ended December 31, 2015. A large portion of our sales is generated by our top customers, and the loss of, or significant reduction in, purchases by our largest customers could adversely affect our operations. During the years ended December 31, 2015 and 2014, our top ten proppant customers collectively represented 70% and 66% of our revenues, respectively. During the same periods, sales in the aggregate to our top two customers, Halliburton Company (“Halliburton”) and FTS International Services, LLC (“FTSI”), collectively accounted for 43% and 36% of our revenues, respectively.
Our I&R business segment has over 770 customers and represented 14% of our revenues for the year ended December 31, 2015. In our I&R business, we use our network of I&R distribution terminals to sell products from our production facilities to distributors which sell the product to the end user.
The Costs of Conducting Our Business
The principal costs involved in operating our business are logistics costs associated with transporting products from our production facilities to our terminals; payroll costs for personnel at our production, terminal and administrative facilities; resin and other raw materials and supplies used in the production of our products; and maintenance and repair costs at our production facilities. We own or lease most of our sand reserves, the combination of which, we believe, helps us maintain a very competitive cost position.
55
Table of Contents
Logistics costs, including freight, railcar leases, demurrage and handling, represented approximately 37% and 33% of our revenues during the year ended December 31, 2015 and 2014, respectively. Freight costs primarily represent charges to transport our product by rail, but we also ship product by truck and barge. In order to move product by rail, we lease a substantial number of railcars under operating leases with durations ranging from three to seven years. We currently have approximately 8,900 railcars under lease and 1,200 railcars made available to us from our customers, giving us a total fleet of approximately 10,100 railcars (net of 200 cars currently subleased). Demurrage costs are charged by the railroads based on the time a railcar spends on the rail in excess of the allotted time. These costs can vary significantly from period to period driven by high levels of rail activity at a terminal and changes in the timing of fulfilling customer orders. Handling costs are incurred at our distribution and terminal facilities to move product from one mode of transportation to another (e.g., truck to railcar) and to move product into storage facilities. Storage costs are incurred when railcars are temporarily taken out of service and stored at a rail yard or storage facility.
Labor costs, including wages and benefits, represented approximately 13% and 10% of revenues during the year ended December 31, 2015 and 2014, respectively. Approximately 16% of our workforce was party to collective bargaining contracts as of December 31, 2015.
We use a significant amount of resins and additives in the production of our coated products in both our Proppant Solutions and I&R businesses. We purchase these resins under supply agreements that contain annual pricing adjustments based on the cost of phenol, the primary component of the resins we buy. We also supply a portion of our resin requirements from our resin manufacturing facility located in Michigan. The cost of resins and additives represented approximately 8% and 11% of revenues during the years ended December 31, 2015 and 2014, respectively.
Our selling, general and administrative costs, which include the wages and benefits costs noted above, represented approximately 10% and 8% of revenues during the years ended December 31, 2015 and 2014, respectively. These costs are related to our corporate operations, including costs for the sales and marketing; research and development; finance; legal; and environmental, health and safety functions of our organization. Since becoming a public company, we incur additional legal, accounting, insurance and other expenses that we did not incur as a private company, including costs associated with public company reporting requirements. These requirements include compliance with the Sarbanes-Oxley Act as well as other rules implemented by the SEC, and applicable stock exchange rules.
We capitalize the costs of our mining and processing equipment and depreciate it over its expected useful life. We also capitalize the costs to remove overburden on our sand reserves for our surface mines and amortize them based on the actual tons mined. Depreciation, depletion, and amortization costs represented approximately 8% and 4% of revenues during the years ended December, 2015 and 2014, respectively. Repair and maintenance costs that do not involve the replacement of major components of our equipment and facilities are expensed as incurred. These repair and maintenance costs can be significant due to the abrasive nature of our products and represented approximately 3% and 2% of revenues during the years ended December 31, 2015 and 2014, respectively.
How We Evaluate Our Business
Our management uses a variety of financial and operational metrics to analyze our performance across our Proppant Solutions and I&R Products segments. This segmentation is based on the primary end markets we serve, our management structure and the financial information that is reviewed by the Chief Executive Officer in deciding how to allocate resources and assess performance. We evaluate the performance of these segments based on their volumes sold, average selling price and segment contribution margin. We do not evaluate the performance of the segments on a margin percentage basis, as that is a function of the channel in which a given product is sold (for example, in-basin sales generate higher selling price but comparable per ton margin, resulting in reduced margin percentage) and product mix. Additionally, we consider a number of factors in evaluating the
56
Table of Contents
performance of the business as a whole, including total volumes sold and Adjusted EBITDA. We view these metrics as important factors in evaluating our profitability and review these measurements frequently to analyze trends and make decisions.
Segment Contribution Margin
Segment contribution margin is a key metric that management uses to evaluate our operating performance and to determine resource allocation between segments. Segment contribution margin is defined as total revenues less the cost of goods sold to produce and deliver the products, less selling, general and administrative expenses that are directly attributable to each segment. The definition excludes certain corporate costs not associated with the operations of the segment. These unallocated costs include costs related to corporate functional areas such as administration, accounting, information technology, human resources, research and development, business development and sustainable development.
EBITDA and Adjusted EBITDA
EBITDA and Adjusted EBITDA are supplemental non-GAAP financial measures that are used by management and external users of our financial statements, such as lenders and rating agencies.
We define EBITDA as net income before interest expense, income tax expense, depreciation, depletion and amortization. We define Adjusted EBITDA as EBITDA before non-cash stock-based compensation, management fees and reimbursement of expenses to our financial sponsor, transaction expenses, impairment of assets, loss on extinguishment of debt, gain or loss on disposal of certain assets, and other non-cash or non-recurring income or expenses.
Management believes EBITDA and Adjusted EBITDA are useful because they allow us to more effectively evaluate our operating performance and compare the results of our operations from period to period without regard to our financing methods, capital structure or non-recurring or non-operating expenses. EBITDA and Adjusted EBITDA have limitations as analytical tools and should not be considered as alternatives to, or more meaningful than, net income or cash flows from operating activities as determined in accordance with GAAP as indicators of our operating performance or liquidity. Certain items excluded from EBITDA and Adjusted EBITDA are significant components in understanding and assessing a company’s financial performance, such as a company’s cost of capital and tax structure, as well as the historic costs of depreciable assets, none of which are components of EBITDA or Adjusted EBITDA. Although we attempt to determine EBITDA and Adjusted EBITDA in a manner that is consistent with other companies in our industry, our computations of EBITDA and Adjusted EBITDA may not be comparable to other similarly titled measures of other companies. We believe that EBITDA and Adjusted EBITDA are widely followed measures of operating performance and may also be used by investors to measure our ability to meet debt service requirements.
57
Table of Contents
The following table sets forth a reconciliation of net income, the most directly comparable GAAP financial measure, to EBITDA and Adjusted EBITDA:
| Year Ended December 31, | ||||||||||||
| 2015 | 2014 | 2013 | ||||||||||
| (in thousands) | ||||||||||||
| Reconciliation of adjusted EBITDA |
||||||||||||
| Net income (loss) attributable to Fairmount Santrol Holdings Inc. |
$ | (92,135 | ) | $ | 170,450 | $ | 103,961 | |||||
| Interest expense, net |
62,242 | 60,842 | 61,926 | |||||||||
| Provision (benefit) for income taxes |
(1,939 | ) | 77,413 | 45,219 | ||||||||
| Depreciation, depletion, and amortization expense |
66,754 | 59,379 | 37,771 | |||||||||
|
|
|
|
|
|
|
|||||||
| EBITDA |
34,922 | 368,084 | 248,877 | |||||||||
| Non-cash stock compensation expense(1) |
4,525 | 16,571 | 10,133 | |||||||||
| Management fees & expenses paid to sponsor(2) |
— | 864 | 2,928 | |||||||||
| Loss on disposal of assets(3) |
7,915 | 1,921 | 6,424 | |||||||||
| Transaction expenses(4) |
— | 638 | 12,462 | |||||||||
| Impairment of long-lived assets(5) |
2,635 | — | — | |||||||||
| Restructuring and other charges(6) |
17,528 | — | — | |||||||||
| Write-off of deferred financing costs(7) |
864 | — | — | |||||||||
| Impairment of goodwill(8) |
69,246 | — | — | |||||||||
| Other non-recurring charges(9) |
465 | — | — | |||||||||
| Loss on extinguishment of debt(10) |
— | — | 11,760 | |||||||||
| Initial Public Offering fees & expenses |
— | 9,213 | — | |||||||||
|
|
|
|
|
|
|
|||||||
| Adjusted EBITDA |
$ | 138,100 | $ | 397,291 | $ | 292,584 | ||||||
|
|
|
|
|
|
|
|||||||
| (1) | Represents the cost in the period for stock-based awards issued to our employees. |
| (2) | Includes fees and expenses paid to American Securities LLC for consulting and management services pursuant to a management consulting agreement. The agreement was terminated upon the Initial Public Offering of the Company in October 2014. |
| (3) | Includes losses related to the sale and disposal of certain assets in property, plant, and equipment. |
| (4) | Expenses associated with evaluation of potential acquisitions of businesses, some of which were completed. |
| (5) | Expenses associated with the impairment of a foreign production facility. |
| (6) | Expenses associated with restructuring activities and plant closures, including pension withdrawal and other liablities, asset impairments and severance payments. |
| (7) | Represents the write-off of deferred financing fees in relation to the amendment of our Revolving Credit Facility. |
| (8) | Expenses associated with the impairment of goodwill in the Proppant Solutions segment. |
| (9) | Expenses associated with an audit of our Employee Stock Bonus Plan. |
| (10) | Represents the loss on a portion of the remaining unamortizaed deferred financing fees upon entering a new credit facility. |
58
Table of Contents
Results of Operations
The following table presents our consolidated statement of operations and certain operating data. The results of operating by segment are discussed in further detail following the consolidated overview.
| Year Ended December 31, | ||||||||||||
| 2015 | 2014 | 2013 | ||||||||||
| (in thousands) | ||||||||||||
| Statement of Income Data |
||||||||||||
| Revenue |
$ | 828,709 | $ | 1,356,458 | $ | 988,386 | ||||||
| Cost of sales (excluding depreciation, depletion, amortization, and stock compensation expense) |
608,845 | 851,454 | 627,842 | |||||||||
| Selling, general, and administrative expenses |
80,666 | 114,227 | 81,858 | |||||||||
| Depreciation, depletion, and amortization expense |
66,754 | 59,379 | 37,771 | |||||||||
| Stock compensation expense |
4,525 | 16,571 | 10,133 | |||||||||
| Restructuring and other charges |
27,451 | — | — | |||||||||
| Goodwill impairment |
69,246 | — | — | |||||||||
| Other operating expense (income) |
1,357 | 3,163 | 2,826 | |||||||||
|
|
|
|
|
|
|
|||||||
| Income (loss) from operations |
(30,135 | ) | 311,664 | 227,956 | ||||||||
| Interest expense, net |
62,242 | 60,842 | 61,926 | |||||||||
| Loss on extinguishment of debt |
— | — | 11,760 | |||||||||
| Other non-operating expense |
1,492 | 2,786 | 4,394 | |||||||||
|
|
|
|
|
|
|
|||||||
| Income (loss) before provision for income taxes |
(93,869 | ) | 248,036 | 149,876 | ||||||||
| Provision (benefit) for income taxes |
(1,939 | ) | 77,413 | 45,219 | ||||||||
|
|
|
|
|
|
|
|||||||
| Net income (loss) |
(91,930 | ) | 170,623 | 104,657 | ||||||||
| Less: Net income attributable to the non-controlling interest |
205 | 173 | 696 | |||||||||
|
|
|
|
|
|
|
|||||||
| Net income (loss) attributable to Fairmount Santrol Holdings Inc. |
$ | (92,135 | ) | $ | 170,450 | $ | 103,961 | |||||
|
|
|
|
|
|
|
|||||||
| Other Financial Data |
||||||||||||
| EBITDA |
$ | 34,922 | $ | 368,084 | $ | 248,877 | ||||||
| Adjusted EBITDA |
$ | 138,100 | $ | 397,291 | $ | 292,584 | ||||||
| Operating Data |
||||||||||||
| Proppant Solutions |
||||||||||||
| Total tons sold |
6,204 | 7,188 | 5,117 | |||||||||
| Revenue |
$ | 710,083 | $ | 1,232,232 | $ | 856,212 | ||||||
| Segment contribution margin |
$ | 70,810 | $ | 430,779 | $ | 296,320 | ||||||
| Industrial & Recreational Products |
||||||||||||
| Total tons sold |
2,301 | 2,426 | 2,462 | |||||||||
| Revenue |
$ | 118,626 | $ | 124,226 | $ | 132,174 | ||||||
| Segment contribution margin |
$ | 25,249 | $ | 34,473 | $ | 34,765 | ||||||
Year Ended December 31, 2015 Compared to Year Ended December 31, 2014
Revenues
Revenues decreased $527.8 million, or 39%, to $828.7 million for the year ended December 31, 2015 compared to $1,356.5 million for the year ended December 31, 2014, due to decreased volumes, pricing compression, and product mix primarily in the Proppant Solutions segment.
Revenues in the Proppant Solutions segment decreased $522.1 million, or 42%, to $710.1 million for the year ended December 31, 2015 compared to $1,232.2 million for the year ended December 31, 2014. Total volumes decreased 14% to 6.2 million tons in the year ended December 31, 2015 compared to the year ended
59
Table of Contents
December 31, 2014. Raw frac sand volumes decreased slightly to 5.4 million tons in the year ended December 31, 2015 compared to 5.7 million tons in the year ended December 31, 2014. The average selling price for raw frac sand in 2015 decreased approximately 19% from 2014. Coated proppant volumes decreased 48% to 0.8 million tons in the year ended December 31, 2015 compared to 1.5 million tons in the year ended December 31, 2014. The average selling price for resin-coated proppants in 2015 decreased approximately 18% from 2014. The decrease in Proppant Solutions revenue was due to pricing declines, a shift in sales toward FOB plant shipments, and declines in resin-coated proppant volumes primarily in the second half of the year.
Revenues in the I&R Products segment decreased $5.6 million, or 5%, to $118.6 million for the year ended December 31, 2015 compared to $124.2 million for the year ended December 31, 2014. Volumes declined slight to 2.3 million tons in the year ended December 31, 2015 compared to 2.4 million tons in the year ended December 31, 2014. I&R segment revenue for the year ended December 31, 2015 was impacted by downward pressure in the U.S. foundry market as well as a shift in customer and product mix in the business.
Segment Contribution Margin
Contribution margin in the Proppant Solutions segment decreased $360.0 million, or 84%, to $70.8 million for the year ended December 31, 2015 compared to $430.8 million for the year ended December 31, 2014. The decrease in segment contribution margin was primarily driven by lower volumes, changes in product mix, decreased selling prices, higher operating costs per ton due to lower volumes over which to absorb fixed costs such as railcars and logistics, and non-recurring impairment and restructuring charges in the year ended December 31, 2015. The Proppant Solutions segment contribution margin includes non-recurring impairment and restructuring charges of $82.4 million for the year ended December 31, 2015.
Contribution margin in the I&R Products segment decreased $9.2 million, or 27%, to $25.2 million for the year ended December 31, 2015 compared to $34.5 million for the year ended December 31, 2014. The decrease was primarily driven by non-recurring restructuring charges associated with plant closures, such as impairment of property, plant, and equipment, and liabilities associated with pension withdrawal and land reclamation. The Industrial & Recreational Products segment contribution margin includes non-recurring impairment and restructuring charges of $13.5 million for the year ended December 31, 2015.
Selling, General and Administrative Expenses
Selling, general and administrative expenses decreased $33.6 million, or 29%, to $80.7 million for the year ended December 31, 2015 compared to $114.2 million for the year ended December 31, 2014. SG&A attributable to our segments decreased $8.8 million. Corporate SG&A costs decreased $24.8 million primarily due to lower costs associated with incentive plans, pension contributions, and reduced workforce this year as well as non-recurring costs in the prior year associated with the October 2014 Initial Public Offering.
Depreciation, Depletion and Amortization
Depreciation, depletion and amortization increased $7.4 million, or 12%, to $66.8 million for the year ended December 31, 2015 compared to $59.4 million for the year ended December 31, 2014. The increase in depreciation is due to more assets placed in service primarily related to the Wedron plant expansion.
Income (Loss) from Operations
Income (loss) from operations decreased $341.8 million, or 110%, to a loss of $30.1 million for the year ended December 31, 2015 compared to income of $311.7 million for the year ended December 31, 2014. Earnings in 2015 were largely impacted by non-recurring impairment and restructuring charges of $96.7 million as well as declines in contribution margins due to lower volumes and decreased selling prices.
60
Table of Contents
Interest Expense
Interest expense increased $1.4 million, or 2%, to $62.2 million for the year ended December 31, 2015 compared to $60.8 million for the year ended December 31, 2014 primarily due to interest rate swap agreements, entered into in 2013, that became effective October 2015.
Provision (Benefit) for Income Taxes
The provision (benefit) for income taxes decreased $79.4 million, or 103%, to arrive at a benefit of $1.9 million for the year ended December 31, 2015 compared to a provision of $77.4 million for the year ended December 31, 2014. Income before income taxes decreased $341.9 million or 138% to a loss of $93.9 million for the year ended December 31, 2015 compared to income of $248.0 million for the year ended December 31, 2014. The primary items impacting the tax provision include an increase in the valuation allowance primarily related to U.S. alternative minimum tax credits and U.S. research credits; a goodwill impairment charge with no corresponding income tax benefit; and the accrual of deferred taxes on our accumulated foreign undistributed earnings resulting from a change in our indefinite reinvestment assertion. These unfavorable items were partially offset by a 9.7% effective income tax benefit related to depletion.
Net Income (Loss)
Net income (loss) decreased $262.6 million, or 154%, to a loss of $92.1 million for the year ended December 31, 2015 compared to income of $170.5 million for the year ended December 31, 2014 due to the factors noted above.
Adjusted EBITDA
Adjusted EBITDA decreased $259.2 million, or 65%, to $138.1 million for the year ended December 31, 2015 compared to $397.3 million for the year ended December 31, 2014. The decline in Adjusted EBITDA was largely due to declines in proppant pricing and volumes.
Year Ended December 31, 2014 Compared to Year Ended December 31, 2013
Revenues
Revenues increased $368.1 million, or 37%, to $1,356.5 million for the year ended December 31, 2014 compared to $988.4 million for the year ended December 31, 2013, primarily due to increased raw and resin-coated frac sand volumes in our Proppant Solutions segment and, to a lesser extent, increases in the selling price of certain grades of raw frac sand during the year.
Revenues in the Proppant Solutions segment increased $376.0 million, or 44%, to $1,232.2 million for the year ended December 31, 2014 compared to $856.2 million for the year ended December 31, 2013. Total volumes increased 40% to 7.2 million tons in 2014 compared to 5.1 million tons in 2013. Raw frac sand volumes increased 1.6 million tons, or 40%, to 5.7 million tons compared to 4.1 million tons during this period. The average selling price for raw sand increased 7%, which was primarily the result of an increase in the proportion of raw sand sold through our terminal network and an increase in the selling price of certain grades of sand during the year, partially offset by a shift in volumes sold toward finer grades of raw sand (which generally carry lower selling prices than coarser grades) and increases in sales of Texas Gold brown sand since the acquisition of the Voca facility as part of the acquisition of the proppant assets from FTSI in September 2013. Coated proppant volumes increased 43% to 1.5 million tons in 2014 compared to 1.0 million tons in 2013. The average selling price for resin-coated proppants decreased 2%, which was primarily the result of customer mix and the full year impact of selling price declines taken in 2013, partially offset by a shift in volumes sold towards higher-priced products.
61
Table of Contents
Revenues in the I&R Products segment decreased $8.0 million, or 6%, to $124.2 million for the year ended December 31, 2014 compared to $132.2 million for the year ended December 31, 2013. Volumes decreased 30,776 tons, or 1%, to 2.4 million tons in 2014 compared to 2.5 million tons in 2013. The average selling priced decreased 5% as a result of no longer pre-paying and adding freight to our invoices for a customer in our glass-end market.
Segment Contribution Margin
Contribution margin in the Proppant Solutions segment increased $134.4 million, or 45%, to $430.8 million for the year ended December 31, 2014 compared to $296.3 million for the year ended December 31, 2013. The increase was driven by the increase in sales volume for resin-coated proppants, and the increase in volume for raw frac sand noted above.
Contribution margin in the I&R Products segment was relatively flat, decreasing $0.3 million, or 1%, to $34.5 million for the year ended December 31, 2014 compared to $34.8 million for the year ended December 31, 2013.
Selling, General, and Administrative Expenses
Selling, general, and administrative expenses increased $32.3 million, or 39%, to $114.2 million for the year ended December 31, 2014 compared to $81.9 million for the year ended December 31, 2013. SG&A attributable to our segments increased $4.9 million due to increased sales and marketing costs for our Proppant Solutions segment (included in Segment Contribution Margin noted above). Corporate SG&A costs increased $27.0 million primarily due to $9.2 million of IPO costs, increased costs associated with our incentive bonus plans, increased costs associated with implementing logistics planning tools, and other increased corporate costs to support the growth of our business, partially offset by non-recurring business development costs associated with our acquisition activity in 2013.
Depreciation, Depletion, and Amortization
Depreciation, depletion, and amortization increased $21.6 million, or 57%, to $59.4 million for the year ended December 31, 2014 compared to $37.8 million for the year ended December 31, 2013 due to the increase in fixed and intangible assets arising from the FTSI transaction and capital expenditures primarily due to increased production and logistics capacities.
Income from Operations
Income from operations increased $83.6 million, or 37%, to $311.6 million for the year ended December 31, 2014 compared to $228.0 million for the year ended December 31, 2013, primarily as a result of increased gross margins, partially offset by increased selling, general, and administrative expenses, both described above.
Interest Expense
Interest expense decreased $1.1 million, or 2%, to $60.8 million for the year ended December 31, 2014 compared to $61.9 million for the year ended December 31, 2013. Additional interest expense from additional borrowings to finance the Great Plains and FTSI transactions was offset by an increase in interest capitalized on construction projects in 2014.
Provision for Income Taxes
Provision for income taxes increased $32.2 million, or 71%, to $77.4 million for the year ended December 31, 2014 compared to $45.2 million for the year ended December 31, 2013. Income before income
62
Table of Contents
taxes increased $98.1 million or 65% to $248.0 million in 2014 compared to $149.9 million in 2013. The effective tax rate for the year ended December 31, 2014 was 31.2% compared to 30.2% for the year ended December 31, 2013. The increase in the effective tax rate was primarily due to a reduction in the impact of the depletion deduction due to the high growth of our resin-coated business and a reduction in the amount of the manufacturers’ deduction due to lower taxable income resulting from the exercise of stock options in 2014.
Net Income
Net income increased $65.7 million, or 63%, to $170.4 million for the year ended December 31, 2014 compared to $104.7 million for the year ended December 31, 2013 due to the factors noted above.
Adjusted EBITDA
Adjusted EBITDA increased $104.7 million, or 36%, to $397.3 million for the year ended December 31, 2014 compared to $292.6 million for the year ended December 31, 2013, due primarily to an increase in segment contribution margin.
Liquidity and Capital Resources
Overview
Our principal liquidity requirements historically have been to service our debt, to meet our working capital and capital expenditure needs, to finance acquisitions and to occasionally pay dividends to our stockholders. We have met our liquidity and capital investment needs with funds generated through operations and through incremental borrowings. We also have the ability to raise capital through the issuance of shares of our common stock.
As of December 31, 2015, we had outstanding term loan borrowing of $1.24 billion. A term loan payment in the amount of $156.1 million is due in March 2017. As of the date of this report, we believe that our cash on hand and cash generated through operations will be sufficient to meet cash obligations, such as working capital requirements, anticipated capital expenditures, and scheduled debt payments, over the next twelve months. In addition, we have a revolving credit facility that can provide additional liquidity, if needed. As of December 31, 2015 we had $31.25 million of availability under our revolving credit facility with $11.5 million committed to letters of credit, leaving net availability at $19.7 million. See “Credit Facilities” below for more information regarding our Revolving Credit Facility.
A continued sustained downturn in our business’s key markets could significantly impact our forecasts. While we believe that our operations forecasts are reasonable, the forecasts are based on assumptions, and market conditions impacting the industry, primarily the proppant business, are uncertain. In the event the operating results are significantly worse than projected or we are unsuccessful in generating sufficient liquidity, we may not be able to satisfy our debt obligations and would be forced to restructure these obligations. In order to address this risk, we are implementing reductions in operating costs, selling, general, and administrative costs, reduced planned capital spending, working capital improvements, and permitted asset sales.
63
Table of Contents
Working Capital
Working capital is the amount by which current assets exceed current liabilities and is a measure of our ability to pay our liabilities as they become due. Our working capital was $274.0 million and $318.7 million at December 31, 2015 and 2014, respectively. The following table presents the components of our working capital as of December 31, 2015 and 2014, respectively:
| December 31, 2015 |
December 31, 2014 |
|||||||
| (in thousands) | ||||||||
| Current assets |
||||||||
| Cash and cash equivalents |
$ | 171,486 | $ | 76,923 | ||||
| Accounts receivable, net |
73,566 | 206,094 | ||||||
| Inventories |
70,494 | 131,613 | ||||||
| Deferred income taxes |
— | 5,158 | ||||||
| Prepaid expenses and other assets |
39,910 | 40,766 | ||||||
| Current assets classified as held-for-sale (includes cash, accounts receivable, inventories, and property, plant, and equipment) |
4,218 | — | ||||||
|
|
|
|
|
|||||
| Total current assets |
359,674 | 460,554 | ||||||
| Current liabilities |
||||||||
| Current portion of long-term debt |
17,536 | 17,274 | ||||||
| Accounts payable |
40,421 | 88,542 | ||||||
| Accrued expenses |
26,785 | 36,025 | ||||||
| Current liabilities directly related to current assets classified as held-for-sale (includes accounts payable and accrued expenses) |
934 | — | ||||||
|
|
|
|
|
|||||
| Total current liabilities |
85,676 | 141,841 | ||||||
|
|
|
|
|
|||||
| Net working capital |
$ | 273,998 | $ | 318,713 | ||||
|
|
|
|
|
|||||
Accounts Receivable
Accounts receivable decreased $132.5 million to $73.6 million at December 31, 2015 compared to $206.1 million at December 31, 2014. The decrease relates to the collection of higher 2014 receivables and a decline in the balance driven from the decline in sales volumes and selling prices during 2015.
Inventory
Inventory consists of raw materials, work-in-process and finished goods at plants and terminals. The cost of finished goods includes processing costs and transportation costs to terminals. The decrease in inventory to $70.5 million at December 31, 2015 compared to $131.6 million at December 31, 2014 relates to lower sales and is also due to efforts to decrease inventory levels to match projected decreasing demand, particularly for resin-coated products.
Prepaid Expenses and Other Assets
Prepaid expenses and other assets decreased $0.9 million to $39.9 million at December 31, 2015 from $40.8 million at December 31, 2014, primarily due to the collection of refundable income taxes in 2015.
64
Table of Contents
Accounts Payable
Accounts payable decreased $48.1 million to $40.4 million at December 31, 2015 compared to $88.5 million at December 31, 2014. The decrease in accounts payable is due to reduced purchasing activity driven by lower sales volumes.
Accrued Expenses
The decrease in accrued expenses to $26.8 million at December 31, 2015 compared to $36.0 million at December 31, 2014 was primarily due to the payout of accrued bonuses related to the year ended December 31, 2014, reduced incentive and pension contribution costs in 2015, and a reduction in accrued taxes from the tax benefit position in 2015.
Cash Flow Analysis
| Year Ended December 31, | ||||||||||||
| 2015 | 2014 | 2013 | ||||||||||
| (amounts in millions) | ||||||||||||
| Net cash provided by (used in): |
||||||||||||
| Operating activities |
$ | 236.0 | $ | 205.3 | $ | 174.6 | ||||||
| Investing activities |
(114.0 | ) | (138.3 | ) | (579.5 | ) | ||||||
| Financing activities |
(25.1 | ) | (7.7 | ) | 410.5 | |||||||
Net Cash Provided by Operating Activities
Net cash provided by operating activities consist primarily of net income adjusted for non-cash items, including depreciation, depletion, and amortization and the effect of changes in working capital.
Net cash provided by operating activities was $236.0 million for the year ended December 31, 2015 compared to $205.3 million in the year ended December 31, 2014. This $30.7 million increase was primarily the result of changes in working capital, particularly a decrease in receivables and inventory.
Net cash provided by operating activities was $205.3 million for the year ended December 31, 2014 compared to $174.6 million in the year ended December 31, 2013. This $30.7 million increase was primarily the result of a $65.3 million increase in net income, partially offset by an increase in working capital for 2014 compared to 2013.
Net Cash Used in Investing Activities
Investing activities consist primarily of capital expenditures for growth and maintenance, and in certain periods, investments to acquire strategic assets or businesses. Growth capital expenditures generally are for expansions of production or terminal capacities or new greenfield development of production capacity. Maintenance capital expenditures generally are for asset replacement and health, safety and quality improvements.
Net cash used in investing activities was $114.0 million for the year ended December 31, 2015 compared to $138.3 million for the year ended December 31, 2014. The $24.3 million decrease was primarily the result of a decrease in capital expenditures as declining volumes of sand sold in the oil and gas markets have reduced the rate at which we needed to expand production capacity.
Capital expenditures of $113.8 million, including stripping costs, in the year ended December 31, 2015 were primarily focused on expansion of our sand processing capacities at our Wedron facility. Capital expenditures of $143.5 million in the year ended December 31, 2014 were associated with the expansion of our terminal
65
Table of Contents
infrastructure, enhancing our unit train capabilities, and expansion of Propel SSP coating capacities. We believe that cash flows from operations will be sufficient to fund our anticipated capital expenditures in 2016, but financial results below our expectations could limit our ability to fund these expenditures.
Net cash used in investing activities was $138.3 million in the year ended December 31, 2014, compared to $579.5 million for the year ended December 31, 2013. In the year ended December 31, 2013, $468.0 million was used for the acquisition of sand reserves and processing capacity in Minnesota (Great Plains), the acquisition of the rights to Propel SSP technology, and the acquisition of the proppant assets of FTSI. Capital expenditures increased $32.0 million for the year ended December 31, 2014 compared to the year ended December 31, 2013.
Capital expenditures were $143.5 million for 2014 and were primarily focused on continued development of self-suspending proppant (“SSP”) production facilities, construction of distribution terminals, continued expansion of rail logistics, and expansion of our sand processing capacities.
Net Cash Provided by (Used in) Financing Activities
Financing activities consist primarily of repayments under our Term Loans, capital leases, and other long-term debt reductions.
Net cash used in financing activities was $25.1 million in the year ended December 31, 2015 compared to $7.7 million in the year ended December 31, 2014 primarily due payments on our Term Loans and capital leases, the decreases in tax benefits compared to the prior year for the exercise of stock options in the October 2014 Initial Public Offering, and refinancing fees in the current year associated with the extension of our B-1 Term Loan and amendment of our Revolving Credit Facility. We made payments of approximately $6.0 million against capital lease obligations.
In order to improve liquidity, we borrowed $41.0 million under our term loans in February 2014 to repay a similar amount outstanding under our revolving credit facility. In May 2015, we paid fees to extend the maturity dates of $161.5 million of our Term B-1 Loan from March 2017 to September 2019 to further improve near-term liquidity. In September 2015, we amended the terms of our Revolving Credit Facility. Please see further detail of our credit facilities in the “Credit Facilities” section below.
Net cash used in financing activities was $7.7 million in the year ended December 31, 2014. Net cash provided by financing activities for the year ended December 31, 2013 was $410.5 million, which primarily related to borrowings used to acquire Great Plains and the FTSI assets. We also made payments of approximately $3.9 million against capital lease obligations in 2014.
Credit Facilities
On September 5, 2013, we entered into the Second Amended and Restated Credit Agreement (our “Credit Agreement”). Our Credit Agreement contains a revolving credit facility (“Revolving Credit Facility”) and two tranches of term loans (“Term B-1 Loans” and “Term B-2 Loans”). The Revolving Credit Facility and the Term B-1 and B-2 Loans are secured by a first priority lien on substantially all of our domestic assets.
In February 2014, we executed a joinder agreement to borrow $41 million in aggregate principal amount of additional Term B-2 Loans, bringing the total outstanding Term B-2 loans to $923.8 million. The proceeds of this borrowing were used to repay then outstanding amounts under the Revolving Credit Facility.
Initially, the Term B-1 Loans matured on March 15, 2017 and required quarterly principal repayments of $0.8 million (1% annually) with the balance due at maturity. The Term B-2 Loans mature on September 5, 2019 and require quarterly principal repayments of $2.2 million (1% annually) with the balance due at maturity. Borrowings under the Revolving Credit Facility mature on September 5, 2018. In April and May 2015, we
66
Table of Contents
extended the maturity of $46.0 million and $115.5 million, respectively, of Term B-1 Loans (“Extended Loans”) until September 2019 (the same date as our Term B-2 Loans). The Extended Term B-1 Loans effectively were converted to Term B-2 Loans, and are treated as Term B-2 Loans, under the Credit Agreement for all purposes (including pricing), except for certain minor administrative differences and except that, prior to the Stated B-1 Maturity Date, the Extended Loans shall continue to amortize as Term B-1 Loans. Upon giving effect to the April 2015 and May 2015 Amendments, the maturity date of approximately $161.5 million in principal amount of outstanding Term B-1 Loans was extended, leaving approximately $156.6 million in principal amount of outstanding Term B-1 Loans (not including Extended Loans) maturing on the March 15, 2017. We paid fees of approximately $4.0 million to the lenders as a consent fee for the April and May 2015 Amendments.
In March 2014, we amended our Credit Agreement to reduce the applicable margin for Term B-1 and B-2 Base Rate loans to 2.50% and for Term B-1 and B-2 Eurodollar Rate loans to 3.50%. The Base Rate is the greater of prime rate, federal funds rate (subject to a 1.0% floor) plus 0.5%, 2%, or one-month LIBOR plus 1.0%. The adjusted Eurodollar Rate is subject to a 1.0% floor. With respect to borrowings under the Term B-1 Loans and Revolving Credit Facility, the 2% minimum for Base Rate borrowings and 1% for Eurodollar Rate borrowings did not apply. The applicable margin on the loans will be reduced by 0.25% if our leverage ratio falls below 2.75. As of December 31, 2015, Term B-1 Loans, Term B-2 Loans, Extended Term Loans and the borrowings under Revolving Credit Facility bore interest at 4.1%, 4.5%, 4.5% and 4.3%, respectively.
The terms of our Credit Agreement provide for customary representations and warranties and affirmative covenants. The Revolving Credit Facility also contains customary negative covenants setting forth limitations on further indebtedness, liens, investments, disposition of assets, acquisitions, junior payments and restrictions on subsidiary distributions.
Our Revolving Credit Facility was increased from $75 million to $125 million after executing joinder agreements in August 2014 and September 2014, both of which increased the capacity of the Revolving Credit Facility. As of September 30, 2015, we entered into an amendment to the Credit Agreement that modified the terms surrounding the Revolving Credit Facility. These modifications consisted primarily of (i) a reduction in the U.S. revolving commitments from $124 million to $99 million (while the aggregate Canadian revolving commitment remained at $1 million) and (ii) changes in the financial covenant governing the availability of amounts under the Revolving Credit Facility if, and only if, we have drawn, including letters of credit, more than $31.25 million on the Revolving Credit Facility. Generally, if our leverage ratio is greater than 4.75:1.00 during the period from the effective date of the Revolving Credit Facility amendment in the third quarter of 2015 through the fourth quarter of 2016, so long as the stated quarterly adjusted EBITDA thresholds are exceeded, the amount available to borrow under the Revolving Credit Facility is increased from $31.25 million to $40 million. Commencing with the end of the first quarter of 2017, the quarterly adjusted EBITDA thresholds are discontinued and the full amount of the revolving commitment ($100 million) is available so long as our quarterly leverage ratio does not exceed a revised limit (6.50:1.00 for the first quarter of 2017 declining to 4.75:1.00 for the fourth quarter of 2017). As of December 31, 2015, our leverage ratio was 8.96.
As of December 31, 2015, there were no borrowings on the Revolving Credit Facility. However, there were $11.5 million of letters of credit outstanding, reducing the amount available to borrow under the Revolving Credit Facility to $19.72 million. We believe that the amount available under the Revolving Credit Facility, along with cash generated from operations and our substantial cash balance at December 31, 2015, provide adequate liquidity to allow us to meet our cash obligations over the next twelve months.
Off-Balance Sheet Arrangements
We have no off-balance sheet arrangements that have or are likely to have a current or future material effect on our financial condition, changes in financial condition, revenues, expenses, results of operations, liquidity, capital expenditures or capital resources.
67
Table of Contents
Contractual Obligations
As of December 31, 2015, we have contractual obligations for long-term debt, capital leases, operating leases, purchase obligations, and other long-term liabilities. The purchase obligations include approximately 3,000 railcars with future delivery dates in 2017 and 2018. We intend to satisfy these purchase obligations through leasing arrangements with third-party lessors. Substantially all of the operating lease obligations are for railcars.
| Payments Due by Period | ||||||||||||||||||||
| (in thousands) | ||||||||||||||||||||
| Total | Less than 1 Year | 1-3 Years | 3-5 Years | More than 5 Years | ||||||||||||||||
| Contractual Obligations |
||||||||||||||||||||
| Long-term debt |
$ | 1,228,515 | $ | 12,525 | $ | 176,387 | $ | 1,029,565 | $ | 10,038 | ||||||||||
| Capital lease obligations |
9,651 | 5,253 | 4,219 | 179 | — | |||||||||||||||
| Operating lease obligations |
266,509 | 65,551 | 99,687 | 47,143 | 54,128 | |||||||||||||||
| Purchase obligations |
181,968 | — | 181,968 | — | — | |||||||||||||||
| Other long-term liabilities reflected on the registrant’s balance sheet under GAAP; deferred income taxes and other |
123,371 | — | 119,082 | — | 4,289 | |||||||||||||||
|
|
|
|
|
|
|
|
|
|
|
|||||||||||
| Total contractual cash obligations |
$ | 1,810,014 | $ | 83,329 | $ | 581,343 | $ | 1,076,887 | $ | 68,455 | ||||||||||
|
|
|
|
|
|
|
|
|
|
|
|||||||||||
Environmental Matters
We are subject to various federal, state and local laws and regulations governing, among other things, hazardous materials, air and water emissions, environmental contamination and reclamation and the protection of the environment and natural resources. We have made, and expect to make in the future, expenditures to comply with such laws and regulations, but cannot predict the full amount of such future expenditures. We may also incur fines and penalties from time to time associated with noncompliance with such laws and regulations.
In 2015, we recorded an additional $1.1 million in future reclamation costs associated with a closed facility. There have been no other significant changes to environmental liabilities or future reclamation costs since December 31, 2014.
We discuss certain environmental matters relating to our various production and other facilities, certain regulatory requirements relating to human exposure to crystalline silica and our mining activity and how such matters may affect our business in the future under “Regulation and Legislation” in this Annual Report on Form 10-K.
Critical Accounting Policies and Estimates
Our discussion and analysis of our financial condition and results of operations are based upon our consolidated financial statements, which have been prepared in accordance with GAAP. The preparation of these financial statements requires us to make estimates and assumptions that affect the reported amounts of assets and liabilities and the disclosure of contingent assets and liabilities at the dates of the financial statements and the reported revenues and expenses during the reporting periods. We evaluate these estimates and assumptions on an ongoing basis and base our estimates on historical experience, current conditions and various other assumptions that are believed to be reasonable under the circumstances. The results of these estimates form the basis for making judgments about the carrying values of assets and liabilities as well as identifying and assessing the accounting treatment with respect to commitments and contingencies. Our actual results may materially differ from these estimates. These critical accounting policies and estimates should be read in conjunction with our consolidated financial statements as filed in this Annual Report on Form 10-K.
68
Table of Contents
Listed below are the accounting policies we believe are critical to our financial statements due to the degree of uncertainty regarding the estimates or assumptions involved, and that we believe are critical to the understanding of our operations.
Impairment of Long-Lived Assets
We periodically evaluate whether current events or circumstances indicate that the carrying value of our long-lived assets, including property, plant and equipment, mineral reserves or mineral rights, goodwill, trade names and customer relationships, may not be recoverable. If such circumstances are determined to exist, an estimate of future cash flows produced by the long-lived assets, or the appropriate grouping of assets, is compared to the carrying value to determine whether an impairment exists. If an asset is determined to be impaired, the loss is measured based on quoted market prices in active markets, if available. If quoted market prices are not available, the estimate of fair value is based on various valuation techniques, including a discounted value of estimated future cash flows. A detailed determination of the fair value may be carried forward from one year to the next if certain criteria have been met. We report an asset to be disposed of at the lower of its carrying value or its estimated net realizable value.
Factors we generally consider important in our evaluation and that could trigger an impairment review of the carrying value of long-lived assets include expected operating trends, significant changes in the way assets are used, underutilization of our tangible assets, discontinuance of certain products by us or by our customers, and significant negative industry or economic trends.
The recoverability of the carrying value of our development stage mineral properties is dependent upon the successful development, start-up and commercial production of our mineral deposits and related processing facilities. Our evaluation of mineral properties for potential impairment primarily includes assessing the existence or availability of required permits and evaluating changes in our mineral reserves, or the underlying estimates and assumptions, including estimated production costs. Assessing the economic feasibility requires certain estimates, including the prices of products to be produced and processing recovery rates, as well as operating and capital costs.
We review definite-lived intangible assets, such as our supply agreements and acquired technology, for impairment whenever events or changes in circumstances indicate that the carrying amount of a definite-lived intangible asset may not be recoverable from the estimated future cash flows expected to result from its use and eventual disposition. In cases where undiscounted expected future cash flows are less than the carrying value, an impairment loss is recognized equal to an amount by which the carrying value exceeds the fair value of the assets or asset groups.
The evaluation of goodwill or other intangible assets for possible impairment includes estimating fair value using one or a combination of valuation techniques, such as discounted cash flows or based on comparable companies or transactions. These valuations require us to make estimates and assumptions regarding future operating results, cash flows, changes in working capital and capital expenditures, selling prices, profitability, and the cost of capital. These judgments are particularly difficult given the recent industry environment, although we believe its assumptions and estimates are reasonable, deviations from the assumptions and estimates could produce a materially different result.
Accounts Receivable and Allowance for Doubtful Accounts
Trade accounts receivable are recognized at their invoiced amounts and do not bear interest. Credit is extended based on evaluation of a customer’s financial condition and, generally, collateral is not required. Accounts receivable are generally due within 30 days, and are stated at amounts due from customers net of an allowance for doubtful accounts. Accounts outstanding longer than the payment terms are considered past due. We determine our allowance by considering a number of factors, including the length of time trade accounts
69
Table of Contents
receivable are past due, our previous loss history, the customer’s current ability to pay its obligation to us, and the condition of the general economy and the industry as a whole. Given the present industry environment in the oil and gas solutions segment, we may not have adequate warning of a potential credit and collection issue, and deviations from these estimates could produce additional credit losses. Ongoing credit evaluations are performed. We write-off accounts receivable when they are deemed uncollectible, and payments subsequently received on such receivables are credited to the allowance for doubtful accounts.
Equity Awards
We recognize stock based compensation expense using a fair value method. Fair value methods use a valuation model to theoretically value stock option grants even though they are not available for trading and are of longer duration. The Black-Scholes-Merton option-pricing model that we use includes the input of certain variables that are dependent on future expectations, including the expected lives of our options from grant date to exercise date, the volatility of a peer group of companies underlying common shares, and our expected dividend rate of zero. Our estimates of these variables are made for the purpose of using the valuation model to determine an expense for each reporting period and are not subsequently adjusted. We also estimate a forfeiture rate based on our historical experience, which could change over time. We value our restricted stock units at the closing price of our stock as of the date of issuance.
Fair Value of Derivatives
We record derivative instruments used to hedge interest rate exposure on the variable-rate debt obligations at their fair values. Changes in the fair value of derivatives are recorded each period in current earnings or in other comprehensive income, depending on whether a derivative is designated as part of a hedging relationship and, if it is, depending on the type of hedging relationship. For cash flow hedges in which we are hedging the variability of cash flows related to a variable-rate liability, the effective portion of the gain or loss on the derivative instrument is reported in other comprehensive income in the periods during which earnings are impacted by the variability of the cash flows of the hedged item. The ineffective portion of all hedges is recognized in current period earnings. As interest expense is accrued on the debt obligation, amounts in accumulated other comprehensive income (loss) related to the interest rate swaps are reclassified into income to obtain a net cost on the debt obligation equal to the effective yield of the fixed rate of each swap. In the event that an interest rate swap is terminated prior to maturity, gains or losses in accumulated other comprehensive income (loss) remain deferred and are reclassified into earnings in the periods during which the hedged forecasted transaction affects earnings.
The fair values and effectiveness testing of our derivatives are based on prevailing market data and derived from proprietary models based on well recognized financial principles and reasonable estimates about relevant future market conditions including interest rates, counterparty risk, and credit risk. These assumptions could cause material changes in the fair value or effectiveness of our derivative instruments.
Taxes
Deferred taxes are provided on the liability method whereby deferred tax assets are recognized for deductible temporary differences and operating loss and tax credit carry-forwards and deferred tax liabilities are recognized for taxable temporary differences. This approach requires recognition of deferred tax liabilities and assets for the expected future tax consequences of events that have been included in the financial statements or tax returns. Under this method, deferred tax liabilities and assets are determined based upon the difference between the financial statement and tax basis of assets and liabilities using enacted tax rates in effect for the year in which the expenses are expected to reverse. Valuation allowances are provided if, based on the weight of available evidence, it is more likely than not that some or all of the deferred tax assets will not be realized.
We recognize a tax benefit associated with an uncertain tax position when, in our judgment, it is more likely than not that the position will be sustained upon examination by a taxing authority. For a tax position that meets
70
Table of Contents
the more-likely-than-not recognition threshold, we initially and subsequently measure the tax benefit as the largest amount that we judge to have a greater than 50% likelihood of being realized upon ultimate settlement with a taxing authority. The liability associated with unrecognized tax benefits is adjusted periodically due to changing circumstances, such as the progress of tax audits, case law developments and new or emerging legislation. Such adjustments are recognized entirely in the period in which they are identified. The effective tax rate includes the net impact of changes in the liability for unrecognized tax benefits and subsequent adjustments as considered appropriate by management.
We evaluate quarterly the realizability of our deferred tax assets by assessing the need for a valuation allowance and by adjusting the amount of such allowance, if necessary. The factors used to assess the likelihood of realization are our forecast of future taxable income in the appropriate jurisdiction to utilize the asset, and available tax planning strategies that could be implemented to realize the net deferred tax assets. Failure to achieve forecasted taxable income might affect the ultimate realization of the net deferred tax assets. Factors that may affect our ability to achieve sufficient forecasted taxable income include, but are not limited to, the following: a decline in sales or margins, increased competition or loss of market share.
In addition, we operate within multiple taxing jurisdictions and are subject to audit in these jurisdictions. These audits can involve complex issues, which may require an extended time to resolve. We believe that adequate provisions for income taxes have been made for all years.
The largest permanent items in computing both our effective rate and taxable income are the deduction for statutory depletion and the manufacturers’ deduction for manufacturers’ products. The depletion deduction is dependent upon a mine-by-mine computation of both gross income from mining and taxable income.
ITEM 7A. QUANTITATIVE AND QUALITATIVE DISCLOSURES ABOUT MARKET RISK
Interest Rate Swaps
Due to our variable-rate indebtedness, we are exposed to fluctuations in interest rates. We use interest rate swaps to manage this exposure. These derivative instruments are recorded on the balance sheet at their fair values. Changes in the fair value of derivatives are recorded each period in current earnings or in other comprehensive income, depending on whether a derivative is designated as part of a hedging relationship and, if it is, depending on the type of hedging relationship. For cash flow hedges in which we are hedging the variability of cash flows related to a variable-rate liability, the effective portion of the gain or loss on the derivative instrument is reported in other comprehensive income in the periods during which earnings are impacted by the variability of the cash flows of the hedged item. The ineffective portion of all hedges is recognized in current period earnings.
We do not use derivative financial instruments for trading or speculative purposes. By their nature, all such instruments involve risk, including the possibility that a loss may occur from the failure of another party to perform according to the terms of a contract (credit risk) or the possibility that future changes in market price may make a financial instrument less valuable or more onerous (market risk). As is customary for these types of instruments, we do not require collateral or other security from other parties to these instruments. In management’s opinion, there is no significant risk of loss in the event of nonperformance of the counterparties to these financial instruments.
We formally designate and document instruments at inception that qualify for hedge accounting of underlying exposures in accordance with GAAP. We assess, both at inception and for each reporting period, whether the financial instruments used in hedging transactions are effective in offsetting changes in cash flows of the related underlying exposure.
As of December 31, 2015, the fair value of the interest rate swaps was a liability of $12.0 million due to a change in interest rates.
71
Table of Contents
A hypothetical increase or decrease in interest rates by 1.0% would have had a maximum $1.7 million impact on our interest expense in the year ended December 31, 2015.
Market Risk
We are exposed to various market risks, including changes in interest rates. Market risk related to interest rates is the potential loss arising from adverse changes in interest rates. We do not believe that inflation has a material impact on our financial position or results of operations during periods covered by the financial statements included in this Annual Report on Form 10-K.
Credit Risk
We are subject to risks of loss resulting from nonpayment or nonperformance by our customers. For the year ended December 31, 2015, our top two proppant customers, Halliburton and FTSI, accounted for approximately 43% of our sales. Approximately 35% of our accounts receivable balance at December 31, 2015, was outstanding from one customer. We examine the creditworthiness of third-party customers to whom we extend credit and manage our exposure to credit risk through credit analysis, credit approval, credit limits and monitoring procedures, and for certain transactions, we may request letters of credit, prepayments or guarantees, although collateral is generally not required.
72
Table of Contents
ITEM 8. FINANCIAL STATEMENTS AND SUPPLEMENTARY DATA
The following consolidated financial statements are filed as part of this Annual Report on Form 10-K:
73
Table of Contents
Report of Independent Registered Public Accounting Firm
To the Board of Directors and Shareholders of Fairmount Santrol Holdings Inc.:
In our opinion, the accompanying consolidated balance sheets and the related consolidated statements of income (loss), comprehensive income (loss), equity and cash flows present fairly, in all material respects, the financial position of Fairmount Santrol Holdings Inc. and its subsidiaries (“the Company”) at December 31, 2015 and 2014, and the results of their operations and their cash flows for each of the three years in the period ended December 31, 2015 in conformity with accounting principles generally accepted in the United States of America. In addition, in our opinion, the financial statement schedule listed in the accompanying index presents fairly, in all material respects, the information set forth therein when read in conjunction with the related consolidated financial statements. Also in our opinion, the Company maintained, in all material respects, effective internal control over financial reporting as of December 31, 2015, based on criteria established in Internal Control – Integrated Framework (2013) issued by the Committee of Sponsoring Organizations of the Treadway Commission (COSO). The Company’s management is responsible for these financial statements and financial statement schedule, for maintaining effective internal control over financial reporting and for its assessment of the effectiveness of internal control over financial reporting, included in the accompanying Management’s Report on Internal Control over Financial Reporting. Our responsibility is to express opinions on these financial statements, on the financial statement schedule, and on the Company’s internal control over financial reporting based on our audits (which was an integrated audit in 2015). We conducted our audits in accordance with the standards of the Public Company Accounting Oversight Board (United States). Those standards require that we plan and perform the audits to obtain reasonable assurance about whether the financial statements are free of material misstatement and whether effective internal control over financial reporting was maintained in all material respects. Our audits of the financial statements included examining, on a test basis, evidence supporting the amounts and disclosures in the financial statements, assessing the accounting principles used and significant estimates made by management, and evaluating the overall financial statement presentation. Our audit of internal control over financial reporting included obtaining an understanding of internal control over financial reporting, assessing the risk that a material weakness exists, and testing and evaluating the design and operating effectiveness of internal control based on the assessed risk. Our audits also included performing such other procedures as we considered necessary in the circumstances. We believe that our audits provide a reasonable basis for our opinions.
A company’s internal control over financial reporting is a process designed to provide reasonable assurance regarding the reliability of financial reporting and the preparation of financial statements for external purposes in accordance with generally accepted accounting principles. A company’s internal control over financial reporting includes those policies and procedures that (i) pertain to the maintenance of records that, in reasonable detail, accurately and fairly reflect the transactions and dispositions of the assets of the company; (ii) provide reasonable assurance that transactions are recorded as necessary to permit preparation of financial statements in accordance with generally accepted accounting principles, and that receipts and expenditures of the company are being made only in accordance with authorizations of management and directors of the company; and (iii) provide reasonable assurance regarding prevention or timely detection of unauthorized acquisition, use, or disposition of the company’s assets that could have a material effect on the financial statements.
Because of its inherent limitations, internal control over financial reporting may not prevent or detect misstatements. Also, projections of any evaluation of effectiveness to future periods are subject to the risk that controls may become inadequate because of changes in conditions, or that the degree of compliance with the policies or procedures may deteriorate.
/s/ PricewaterhouseCoopers LLP
Cleveland, Ohio
March 15, 2016
74
Table of Contents
Fairmount Santrol Holdings Inc. and Subsidiaries
Consolidated Statements of Income (Loss)
Years Ended December 31, 2015, 2014, and 2013
| Year Ended December 31, | ||||||||||||
| 2015 | 2014 | 2013 | ||||||||||
| (in thousands, except share and per share amounts) |
||||||||||||
| Revenue |
$ | 828,709 | $ | 1,356,458 | $ | 988,386 | ||||||
| Cost of sales (excluding depreciation, depletion, |
608,845 | 851,454 | 627,842 | |||||||||
| Operating expenses |
||||||||||||
| Selling, general and administrative expenses |
80,666 | 114,227 | 81,858 | |||||||||
| Depreciation, depletion and amortization expense |
66,754 | 59,379 | 37,771 | |||||||||
| Stock compensation expense |
4,525 | 16,571 | 10,133 | |||||||||
| Restructuring and other charges |
27,451 | — | — | |||||||||
| Goodwill impairment |
69,246 | — | — | |||||||||
| Other operating expense |
1,357 | 3,163 | 2,826 | |||||||||
|
|
|
|
|
|
|
|||||||
| Income (loss) from operations |
(30,135 | ) | 311,664 | 227,956 | ||||||||
| Interest expense, net |
62,242 | 60,842 | 61,926 | |||||||||
| Loss on extinguishment of debt |
— | — | 11,760 | |||||||||
| Other non-operating expense |
1,492 | 2,786 | 4,394 | |||||||||
|
|
|
|
|
|
|
|||||||
| Income (loss) before provision for income taxes |
(93,869 | ) | 248,036 | 149,876 | ||||||||
| Provision (benefit) for income taxes |
(1,939 | ) | 77,413 | 45,219 | ||||||||
|
|
|
|
|
|
|
|||||||
| Net income (loss) |
(91,930 | ) | 170,623 | 104,657 | ||||||||
| Less: Net income attributable to the non-controlling interest |
205 | 173 | 696 | |||||||||
|
|
|
|
|
|
|
|||||||
| Net income (loss) attributable to Fairmount Santrol Holdings Inc. |
$ | (92,135 | ) | $ | 170,450 | $ | 103,961 | |||||
|
|
|
|
|
|
|
|||||||
| Earnings per share |
||||||||||||
| Basic |
$ | (0.57 | ) | $ | 1.08 | $ | 0.67 | |||||
| Diluted |
$ | (0.57 | ) | $ | 1.03 | $ | 0.63 | |||||
| Weighted average number of shares outstanding |
||||||||||||
| Basic |
161,296,933 | 157,949,664 | 156,008,218 | |||||||||
| Diluted |
161,296,933 | 166,277,124 | 164,637,554 | |||||||||
The accompanying notes are an integral part of these consolidated financial statements.
75
Table of Contents
Fairmount Santrol Holdings Inc. and Subsidiaries
Consolidated Statements of Comprehensive Income (Loss)
Years Ended December 31, 2015, 2014, and 2013
| Year Ended December 31, | ||||||||||||
| 2015 | 2014 | 2013 | ||||||||||
| (in thousands) | ||||||||||||
| Net income (loss) |
$ | (91,930 | ) | $ | 170,623 | $ | 104,657 | |||||
| Other comprehensive income (loss), net of tax |
||||||||||||
| Foreign currency translation adjustment |
(3,733 | ) | (2,353 | ) | (2 | ) | ||||||
| Pension obligations |
97 | (950 | ) | 914 | ||||||||
| Change in fair value of derivative agreements |
(1,248 | ) | (5,970 | ) | 4,751 | |||||||
|
|
|
|
|
|
|
|||||||
| Total other comprehensive income (loss), net of tax |
(4,884 | ) | (9,273 | ) | 5,663 | |||||||
|
|
|
|
|
|
|
|||||||
| Comprehensive income (loss) |
(96,814 | ) | 161,350 | 110,320 | ||||||||
| Comprehensive income attributable to the non-controlling interest |
205 | 173 | 696 | |||||||||
|
|
|
|
|
|
|
|||||||
| Comprehensive income (loss) attributable to Fairmount Santrol Holdings Inc. |
$ | (97,019 | ) | $ | 161,177 | $ | 109,624 | |||||
|
|
|
|
|
|
|
|||||||
The accompanying notes are an integral part of these consolidated financial statements.
76
Table of Contents
Fairmount Santrol Holdings Inc. and Subsidiaries
Consolidated Balance Sheets
December 31, 2015 and 2014
| December 31, 2015 | December 31, 2014 | |||||||
| (in thousands, except share and per share amounts) |
||||||||
| Assets |
||||||||
| Current assets |
||||||||
| Cash and cash equivalents |
$ | 171,486 | $ | 76,923 | ||||
| Accounts receivable, net |
73,566 | 206,094 | ||||||
| Inventories |
70,494 | 131,613 | ||||||
| Deferred income taxes |
— | 5,158 | ||||||
| Prepaid expenses and other assets |
39,910 | 40,766 | ||||||
| Current assets classified as held-for-sale (includes cash, accounts receivable, inventories, and property, plant, and equipment) |
4,218 | — | ||||||
|
|
|
|
|
|||||
| Total current assets |
359,674 | 460,554 | ||||||
| Property, plant and equipment, net |
870,997 | 841,274 | ||||||
| Deferred income taxes |
834 | — | ||||||
| Goodwill |
15,301 | 84,677 | ||||||
| Intangibles, net |
96,482 | 100,769 | ||||||
| Other assets |
25,671 | 26,742 | ||||||
|
|
|
|
|
|||||
| Total assets |
$ | 1,368,959 | $ | 1,514,016 | ||||
|
|
|
|
|
|||||
| Liabilities and Equity |
||||||||
| Current liabilities |
||||||||
| Current portion of long-term debt |
$ | 17,536 | $ | 17,274 | ||||
| Accounts payable |
40,421 | 88,542 | ||||||
| Accrued expenses |
26,785 | 36,025 | ||||||
| Current liabilities directly related to current assets classified as held-for-sale (includes accounts payable and accrued expenses) |
934 | — | ||||||
|
|
|
|
|
|||||
| Total current liabilities |
85,676 | 141,841 | ||||||
| Long-term debt |
1,220,280 | 1,235,365 | ||||||
| Deferred income taxes |
89,569 | 74,351 | ||||||
| Other long-term liabilities |
33,802 | 28,985 | ||||||
|
|
|
|
|
|||||
| Total liabilities |
1,429,327 | 1,480,542 | ||||||
| Commitments and contingent liabilities |
||||||||
| Equity |
||||||||
| Common stock: $0.01 par value, 1,850,000,000 authorized shares |
||||||||
| Shares outstanding: 161,433,248 and 160,913,266 at December 31, 2015 and December 31, 2014, respectively |
2,391 | 2,387 | ||||||
| Preferred stock: $0.01 par value, 100,000,000 authorized shares |
||||||||
| Shares outstanding: 0 at December 31, 2015 and December 31, 2014, respectively |
— | — | ||||||
| Additional paid-in capital |
776,705 | 771,888 | ||||||
| Retained earnings |
405,044 | 497,179 | ||||||
| Accumulated other comprehensive income (loss) |
(17,693 | ) | (12,809 | ) | ||||
|
|
|
|
|
|||||
| Total equity attributable to Fairmount Santrol Holdings Inc. before treasury stock |
1,166,447 | 1,258,645 | ||||||
| Less: Treasury stock at cost |
||||||||
| Shares in treasury: 77,765,480 at December 31, 2015 and December 31, 2014, respectively |
(1,227,663 | ) | (1,227,663 | ) | ||||
|
|
|
|
|
|||||
| Total equity (deficit) attributable to Fairmount Santrol Holdings Inc. |
(61,216 | ) | 30,982 | |||||
| Non-controlling interest |
848 | 2,492 | ||||||
|
|
|
|
|
|||||
| Total equity (deficit) |
(60,368 | ) | 33,474 | |||||
|
|
|
|
|
|||||
| Total liabilities and equity |
$ | 1,368,959 | $ | 1,514,016 | ||||
|
|
|
|
|
|||||
The accompanying notes are an integral part of these consolidated financial statements.
77
Table of Contents
Fairmount Santrol Holdings Inc. and Subsidiaries
Consolidated Statements of Equity
Years Ended December 31, 2015, 2014, and 2013
| Equity (deficit) attributable to Fairmount Santrol Holdings Inc. | ||||||||||||||||||||||||||||||||||||||||||||||||
| Common Stock |
Common Stock Units |
Preferred Stock |
Preferred Stock Units |
Additional Paid-in Capital |
Retained Earnings |
Other Comprehensive Income (Loss) |
Treasury Stock |
Treasury Stock Units |
Subtotal | Non- Controlling Interest |
Total | |||||||||||||||||||||||||||||||||||||
| (in thousands) | ||||||||||||||||||||||||||||||||||||||||||||||||
| Balances at December 31, 2012 |
$ | 2,334 | 155,877 | $ | — | — | $ | 719,858 | $ | 222,768 | $ | (9,199 | ) | $ | (1,225,299 | ) | 77,546 | $ | (289,538 | ) | $ | 3,610 | $ | (285,928 | ) | |||||||||||||||||||||||
| Purchase of treasury stock |
— | (160 | ) | — | — | — | — | — | (1,702 | ) | 160 | (1,702 | ) | — | (1,702 | ) | ||||||||||||||||||||||||||||||||
| Stock options exercised |
7 | 745 | — | — | 1,270 | — | — | — | — | 1,277 | — | 1,277 | ||||||||||||||||||||||||||||||||||||
| Stock compensation expense |
— | — | — | — | 10,133 | — | — | — | — | 10,133 | — | 10,133 | ||||||||||||||||||||||||||||||||||||
| Tax effect of stock options exercised |
— | — | — | — | 1,827 | — | — | — | — | 1,827 | — | 1,827 | ||||||||||||||||||||||||||||||||||||
| Transactions with non-controlling interest |
— | — | — | — | — | — | — | — | — | — | (1,285 | ) | (1,285 | ) | ||||||||||||||||||||||||||||||||||
| Net income |
— | — | — | — | — | 103,961 | — | — | — | 103,961 | 696 | 104,657 | ||||||||||||||||||||||||||||||||||||
| Other comprehensive income |
— | — | — | — | — | — | 5,663 | — | — | 5,663 | — | 5,663 | ||||||||||||||||||||||||||||||||||||
|
|
|
|
|
|
|
|
|
|
|
|
|
|
|
|
|
|
|
|
|
|
|
|
|
|||||||||||||||||||||||||
| Balances at December 31, 2013 |
$ | 2,341 | 156,462 | $ | — | — | $ | 733,088 | $ | 326,729 | $ | (3,536 | ) | $ | (1,227,001 | ) | 77,706 | $ | (168,379 | ) | $ | 3,021 | $ | (165,358 | ) | |||||||||||||||||||||||
| Purchase of treasury stock |
— | (59 | ) | — | — | — | — | — | (662 | ) | 59 | (662 | ) | — | (662 | ) | ||||||||||||||||||||||||||||||||
| Stock options exercised |
46 | 4,510 | — | — | 6,494 | — | — | — | — | 6,540 | — | 6,540 | ||||||||||||||||||||||||||||||||||||
| Stock compensation expense |
— | — | — | — | 16,571 | — | — | — | — | 16,571 | — | 16,571 | ||||||||||||||||||||||||||||||||||||
| Tax effect of stock options exercised |
— | — | — | — | 15,735 | — | — | — | — | 15,735 | — | 15,735 | ||||||||||||||||||||||||||||||||||||
| Transactions with non-controlling interest |
— | — | — | — | — | — | — | — | — | — | (702 | ) | (702 | ) | ||||||||||||||||||||||||||||||||||
| Net income |
— | — | — | — | — | 170,450 | — | — | — | 170,450 | 173 | 170,623 | ||||||||||||||||||||||||||||||||||||
| Other comprehensive income (loss) |
— | — | — | — | — | — | (9,273 | ) | — | — | (9,273 | ) | — | (9,273 | ) | |||||||||||||||||||||||||||||||||
|
|
|
|
|
|
|
|
|
|
|
|
|
|
|
|
|
|
|
|
|
|
|
|
|
|||||||||||||||||||||||||
| Balances at December 31, 2014 |
$ | 2,387 | 160,913 | $ | — | — | $ | 771,888 | $ | 497,179 | $ | (12,809 | ) | $ | (1,227,663 | ) | 77,765 | $ | 30,982 | $ | 2,492 | $ | 33,474 | |||||||||||||||||||||||||
| Purchase of treasury stock |
— | — | — | — | — | — | — | — | — | — | — | — | ||||||||||||||||||||||||||||||||||||
| Stock options exercised |
4 | 520 | — | — | 1,763 | — | — | — | — | 1,767 | — | 1,767 | ||||||||||||||||||||||||||||||||||||
| Stock compensation expense |
— | — | — | — | 4,525 | — | — | — | — | 4,525 | — | 4,525 | ||||||||||||||||||||||||||||||||||||
| Tax effect of stock options exercised |
— | — | — | — | (1,471 | ) | — | — | — | — | (1,471 | ) | — | (1,471 | ) | |||||||||||||||||||||||||||||||||
| Transactions with non-controlling interest |
— | — | — | — | — | — | — | — | — | — | (1,849 | ) | (1,849 | ) | ||||||||||||||||||||||||||||||||||
| Net income (loss) |
— | — | — | — | — | (92,135 | ) | — | — | — | (92,135 | ) | 205 | (91,930 | ) | |||||||||||||||||||||||||||||||||
| Other comprehensive income (loss) |
— | — | — | — | — | — | (4,884 | ) | — | — | (4,884 | ) | — | (4,884 | ) | |||||||||||||||||||||||||||||||||
|
|
|
|
|
|
|
|
|
|
|
|
|
|
|
|
|
|
|
|
|
|
|
|
|
|||||||||||||||||||||||||
| Balances at December 31, 2015 |
$ | 2,391 | 161,433 | $ | — | — | $ | 776,705 | $ | 405,044 | $ | (17,693 | ) | $ | (1,227,663 | ) | 77,765 | $ | (61,216 | ) | $ | 848 | $ | (60,368 | ) | |||||||||||||||||||||||
|
|
|
|
|
|
|
|
|
|
|
|
|
|
|
|
|
|
|
|
|
|
|
|
|
|||||||||||||||||||||||||
The accompanying notes are an integral part of these consolidated financial statements.
78
Table of Contents
Fairmount Santrol Holdings Inc. and Subsidiaries
Consolidated Statements of Cash Flows
Years Ended December 31, 2015, 2014, and 2013
| Year Ended December 31, | ||||||||||||
| 2015 | 2014 | 2013 | ||||||||||
| (in thousands) | ||||||||||||
| Net income (loss) |
$ | (91,930 | ) | $ | 170,623 | $ | 104,657 | |||||
| Adjustments to reconcile net income to net cash provided by operating activities: |
||||||||||||
| Depreciation and depletion |
62,218 | 54,111 | 35,917 | |||||||||
| Amortization |
11,416 | 11,991 | 8,446 | |||||||||
| Write-off of deferred financing costs |
864 | — | 11,358 | |||||||||
| Write-off and impairment of long-lived assets |
7,954 | 200 | — | |||||||||
| Impairment of goodwill |
69,246 | — | — | |||||||||
| Inventory reserve adjustment |
1,591 | — | — | |||||||||
| (Gain) loss on sale of fixed assets |
8,712 | 854 | — | |||||||||
| Unrealized loss on interest rate swaps |
49 | 208 | 3,009 | |||||||||
| Deferred income taxes and taxes payable |
20,983 | 37,810 | 826 | |||||||||
| Stock compensation expense |
4,525 | 16,571 | 10,133 | |||||||||
| Change in operating assets and liabilities, net of acquired balances: |
||||||||||||
| Accounts receivable |
129,686 | (66,406 | ) | (22,097 | ) | |||||||
| Inventories |
59,527 | (13,264 | ) | 158 | ||||||||
| Prepaid expenses and other assets |
(3,272 | ) | (23,454 | ) | (11,698 | ) | ||||||
| Accounts payable |
(38,698 | ) | (1,456 | ) | 46,542 | |||||||
| Accrued expenses |
(6,877 | ) | 17,488 | (12,616 | ) | |||||||
|
|
|
|
|
|
|
|||||||
| Net cash provided by operating activities |
235,994 | 205,276 | 174,635 | |||||||||
|
|
|
|
|
|
|
|||||||
| Cash flows from investing activities |
||||||||||||
| Proceeds from sale of fixed assets |
— | 5,160 | — | |||||||||
| Capital expenditures |
(113,750 | ) | (143,491 | ) | (111,514 | ) | ||||||
| Purchase of business and assets |
(250 | ) | — | (468,003 | ) | |||||||
|
|
|
|
|
|
|
|||||||
| Net cash used in investing activities |
(114,000 | ) | (138,331 | ) | (579,517 | ) | ||||||
|
|
|
|
|
|
|
|||||||
| Cash flows from financing activities |
||||||||||||
| Proceeds from issuance of term loans |
— | 41,000 | 1,226,950 | |||||||||
| Payments on term debt |
(13,532 | ) | (12,512 | ) | (841,025 | ) | ||||||
| Change in other long-term debt and capital leases |
(6,975 | ) | (4,830 | ) | (2,356 | ) | ||||||
| Proceeds from borrowing on revolving credit facility |
— | 32,267 | 148,100 | |||||||||
| Payments on revolving credit facility |
— | (73,000 | ) | (107,100 | ) | |||||||
| Settlement of contingent consideration |
— | (9,600 | ) | — | ||||||||
| Proceeds from option exercises |
1,767 | 6,540 | 1,277 | |||||||||
| Purchase of treasury stock |
— | (662 | ) | (1,702 | ) | |||||||
| Tax effect of stock options exercised and dividend equivalents |
(1,472 | ) | 15,735 | 1,827 | ||||||||
| Distributions to non-controlling interest |
(301 | ) | (702 | ) | (1,285 | ) | ||||||
| Financing costs |
(4,578 | ) | (1,913 | ) | (14,171 | ) | ||||||
|
|
|
|
|
|
|
|||||||
| Net cash provided by (used in) financing activities |
(25,091 | ) | (7,677 | ) | 410,515 | |||||||
|
|
|
|
|
|
|
|||||||
| Change in cash and cash equivalents related to assets classified as held-for-sale |
(1,376 | ) | — | — | ||||||||
| Foreign currency adjustment |
(964 | ) | (160 | ) | 316 | |||||||
|
|
|
|
|
|
|
|||||||
| Increase in cash and cash equivalents |
94,563 | 59,108 | 5,949 | |||||||||
|
|
|
|
|
|
|
|||||||
| Cash and cash equivalents: |
||||||||||||
| Beginning of period |
76,923 | 17,815 | 11,866 | |||||||||
|
|
|
|
|
|
|
|||||||
| End of period |
$ | 171,486 | $ | 76,923 | $ | 17,815 | ||||||
|
|
|
|
|
|
|
|||||||
| Supplemental disclosure of cash flow information: |
||||||||||||
| Interest paid |
$ | 61,395 | $ | 62,167 | $ | 57,694 | ||||||
| Income taxes paid (refunded) |
(19,898 | ) | 32,203 | 56,319 | ||||||||
| Non-cash investing activities: |
||||||||||||
| Equipment purchased under capital leases |
$ | 4,552 | $ | 6,558 | $ | 5,989 | ||||||
The accompanying notes are an integral part of these consolidated financial statements.
79
Table of Contents
Fairmount Santrol Holdings Inc. and Subsidiaries
Notes to Consolidated Financial Statements
Years Ended December 31, 2015, 2014, and 2013
(in thousands, except share and per share data)
| 1. | Organization |
Fairmount Santrol Holdings Inc. (formerly “FMSA Holdings Inc.”) and its consolidated subsidiaries (collectively, the “Company”) is a supplier of proppants and sand products. The Company is organized into two segments: Proppant Solutions and Industrial & Recreational Products. This segmentation is based on the end markets served, management structure, and the financial information that is reviewed by the chief operating decision maker in deciding how to allocate resources and assess performance.
The Proppant Solutions business serves the oil and gas recovery markets in the United States, Canada, Argentina, Mexico, China, northern Europe, and the United Arab Emirates, providing raw and coated proppants primarily for use in hydraulic fracturing. The raw sand and substrate for coated sand generally consists of high-purity silica sands produced at facilities in Illinois, Wisconsin, and Texas.
The Industrial & Recreational Products (“I&R”) business provides raw and coated sands to the foundry, building products, glass, turf and landscape, and filtration industries. Raw sand for the I&R business is produced at facilities in Ohio, Wisconsin, and Illinois.
In addition to its wholly-owned subsidiaries, the Company owns 90% of a holding company, Technimat LLC, which owns 70% of Santrol (Yixing) Proppant Co., a manufacturer of resin-based proppants located in China. The non-controlling interests in both entities are presented as “non-controlling interest” on the balance sheet.
| 2. | Summary of Significant Accounting Policies |
Principal of Consolidation
The consolidated financial statements include the accounts of Fairmount Santrol Holdings Inc. and its wholly-owned and majority-owned subsidiaries. All significant intercompany balances and transactions have been eliminated in consolidation.
Use of Estimates
The preparation of financial statements in conformity with generally accepted accounting principles requires management to make estimates and assumptions that affect the reported amounts of assets and liabilities and disclosures of contingent assets and liabilities at the date of the financial statements and the reported amounts of revenue and expenses during the reporting period. Actual results could differ from those estimates.
Liquidity and Debt Obligations
Given the current volatility in the oil and gas market, upon which the Company depends for a majority of its revenues, as well as its upcoming term loan payments in the amount of $156,134 due in March 2017, these conditions could raise substantial doubt about the Company’s ability to satisfy its obligations on a current basis. Management has evaluated its plans to ensure adequate liquidity to meet its obligations in the coming year. In addition to reductions in operating costs, and selling, general, and administrative costs, management believes it has the ability to manage liquidity and meet its obligations throughout 2016, as well as the time the term loan payment is due in March 2017, through capital spending reductions, working capital improvements, permitted asset sales, current Revolving Credit Facility availability, and permitted borrowing under the terms of its credit agreement (see Note 10).
80
Table of Contents
Fairmount Santrol Holdings Inc. and Subsidiaries
Notes to Consolidated Financial Statements
Years Ended December 31, 2015, 2014, and 2013
(in thousands, except share and per share data)
Meeting the forecast is depending upon management executing on its current plan and assumes there will not be significant further deterioration in the markets. A continued sustained downturn in the Company’s key markets could significantly impact its forecasts. While the Company believes its operations forecasts are reasonable, the forecasts are based on assumptions, and market conditions impacting the industry, primarily the proppant business, are uncertain. In the event the operating results are significantly worse than projected or the Company is unsuccessful in generating sufficient liquidity, the Company may not be able to satisfy its debt obligations and would be forced to restructure these obligations,
Revenue Recognition
Revenue is recognized when delivery of products has occurred, the selling price is fixed or determinable, collectability is reasonably assured and title and risk of loss have transferred to the customer. This generally occurs when products leave a distribution terminal or, in the case of direct shipments, when products leave a production facility. In a majority of cases, transportation costs to move product from a production facility to a storage terminal are borne by the Company and capitalized into the cost of inventory. These costs are included in the cost of sales as the product is sold. The Company derives its revenue by mining and processing minerals that its customers purchase for various uses. Its net sales are primarily a function of the price per ton realized and the volumes sold. In a number of instances, its net sales also include a separate charge for transportation services it provides to its customers.
In the Proppant Solutions segment, the Company primarily sells its products under market rate contracts with terms typically ranging from two to ten years. The Company invoices the majority of its customers on a per shipment basis when the customer takes possession of the product.
Cash and Cash Equivalents
The Company considers all highly liquid debt instruments purchased with a maturity of three months or less to be cash equivalents. At various times, the Company maintains funds on deposit at its banks in excess of FDIC insurance limits.
Accounts Receivable
Trade accounts receivable are stated at the amount management expects to collect, and do not bear interest. Management provides for uncollectible amounts based on its assessment of the current status of individual accounts. Accounts receivable are net of allowance for doubtful accounts of $2,470 and $4,255 as of December 31, 2015 and 2014, respectively.
Inventories
Inventories are stated at the lower of cost or market. Certain subsidiaries determine cost using the last-in, first-out (LIFO) method. If the first-in, first-out (FIFO) method of inventory accounting had been used, inventories would have been higher by $2,912 and $2,960 at December 31, 2015 and 2014, respectively.
LIFO inventories comprise 18% and 16% of inventories reflected in the accompanying Consolidated Balance Sheets as of December 31, 2015 and 2014, respectively. The cost of inventories of all other subsidiaries is determined using the FIFO method. In 2013, the Company recognized $4,958 permanent write-down in the value of finished goods inventory, net of expected recoveries from suppliers. The inventory write-down is included in cost of sales. In the year ended December 31, 2014, the Company
81
Table of Contents
Fairmount Santrol Holdings Inc. and Subsidiaries
Notes to Consolidated Financial Statements
Years Ended December 31, 2015, 2014, and 2013
(in thousands, except share and per share data)
recorded a write-down of $908 of certain inventory to recognize a permanent decline in the value of the inventory, which is included in other operating expense. In the year ended December 31, 2015, the Company recorded $1,590 of adjustments to increase the inventory reserve to recognize the decline in value of work-in-process and finished goods inventory, which is recorded in cost of sales.
Property, Plant, and Equipment
Property, plant, and equipment are stated at cost. Expenditures, including interest, for property, plant, and equipment and items that substantially increase the useful lives of existing assets are capitalized, while expenditures for repairs and maintenance are expensed as incurred.
Depreciation on property, plant, and equipment is computed on a straight-line basis over the estimated useful lives of the related assets. Amortization of leasehold improvements is computed using the straight-line method over the shorter of the remaining lease term or the estimated useful lives of the improvements. Depletion expense calculated for depletable land and mineral rights is based on cost multiplied by a depletion factor. The depletion factor varies based on production and other factors, but is generally equal to annual tons mined divided by total estimated remaining reserves for the mine.
The estimated service lives of property and equipment are principally as follows:
| Land improvements |
10-40 years | |||
| Machinery and equipment |
3-20 years | |||
| Buildings and improvements |
10-40 years | |||
| Furniture, fixtures, and other |
3-10 years |
Construction in progress is stated at cost, which includes the cost of construction and other direct costs attributable to the construction. No provision for depreciation is made on construction in progress until such time as the relevant assets are completed and put into use. Construction in progress at December 31, 2015, represents machinery and facilities under installation.
The Company capitalizes interest cost incurred on funds used to construct property, plant, and equipment. The capitalized interest is recorded as part of the asset to which it relates and is amortized over the asset’s estimated useful life. Interest cost capitalized was $4,903 and $6,765 in 2015 and 2014, respectively.
Depreciation and depletion expense was $62,218, $54,111, and $35,917 in years ended December 31, 2015, 2014, and 2013, respectively.
Included in land and improvements are occupancy rights in China of $354 that are held for a term of 50 years until December 2057. As of December 31, 2015, these assets are further classified as held-for-sale.
The Company reviews property, plant, and equipment for impairment whenever events or changes in circumstances indicate that the carrying amount of property, plant, and equipment may not be recoverable from the estimated future cash flows expected to result from its use and eventual disposition. In cases where undiscounted expected future cash flows are less than the carrying value, an impairment loss is recognized equal to an amount by which the carrying value exceeds the fair value of assets or asset groups. The factors considered by management in performing this assessment include current operating results, trends, and prospects, as well as the effects of obsolescence, demand, competition, and other economic factors.
Deferred Financing Costs
Deferred financing costs are amortized over the terms of the related debt obligations and are included in other assets. In connection with the refinancing of the Company’s debt in September 2013 (see Note 10), the
82
Table of Contents
Fairmount Santrol Holdings Inc. and Subsidiaries
Notes to Consolidated Financial Statements
Years Ended December 31, 2015, 2014, and 2013
(in thousands, except share and per share data)
Company incurred financing costs of $15,132 of which $14,171 were capitalized. In connection with the refinancing, the Company wrote off $11,358 of costs that were previously capitalized. In 2014, the Company incurred additional deferred financing charges in connection with the amendment of the existing credit agreement whereby the applicable margin for B-1 and B-2 base rate and Eurodollar loans was reduced (refer to Note 10). In connection with the amendment to the Revolving Credit Facility in 2015, the Company wrote off $864 of costs that were previously capitalized.
The following table presented deferred financing costs as of December 31, 2015 and 2014:
| December 31, 2015 |
December 31, 2014 |
|||||||
| Deferred financing costs |
$ | 42,541 | $ | 37,936 | ||||
| Accumulated amortization |
(24,145 | ) | (17,510 | ) | ||||
|
|
|
|
|
|||||
| Deferred financing costs, net |
$ | 18,396 | $ | 20,426 | ||||
|
|
|
|
|
|||||
Goodwill and Intangible Assets
Goodwill and indefinite-lived intangible assets are reviewed for impairment by applying a fair-value based test on an annual basis or more frequently if circumstances indicate that impairment may have occurred. The Company evaluates qualitative factors such as economic performance, industry conditions, and other factors to determine if it is more-likely-than-not that the fair value of the reporting unit is less than its carrying amount. The first step of the goodwill impairment test, used to identify potential impairment, compares the fair value of a reporting unit with its carrying amount, including goodwill. If the carrying amount of a reporting unit exceeds its fair value, an indication of goodwill impairment exists. The second step of the goodwill impairment test is performed to measure the amount of the impairment loss, if any. If the carrying amount of goodwill exceeds its implied fair value, an impairment loss is recognized equal to the excess. The implied fair value of goodwill is determined by allocating the fair value of the reporting unit in a manner similar to a purchase price allocation, and the residual fair value after this allocation is the implied fair value of the reporting unit goodwill.
The Company reviews definite-lived intangible assets for impairment whenever events or changes in circumstances indicate that the carrying amount of a definite-lived intangible asset may not be recoverable from the estimated future cash flows expected to result from its use and eventual disposition. In cases where undiscounted expected future cash flows are less than the carrying value, an impairment loss is recognized equal to an amount by which the carrying value exceeds the fair value of the assets or asset groups.
The evaluation of goodwill or other intangible assets for possible impairment includes estimating fair value using one or a combination of valuation techniques, such as discounted cash flows or based on comparable companies or transactions. These valuations require the Company to make estimates and assumptions regarding future operating results, cash flows, changes in working capital and capital expenditures, selling prices, profitability, and the cost of capital. Although the Company believes its assumptions and estimates are reasonable, deviations from the assumptions and estimates could produce a materially different result.
Earnings per Share
Basic and diluted earnings per share is presented for net income attributable to Fairmount Santrol Holdings Inc. Basic earnings per share is computed by dividing income available to Fairmount Santrol Holdings Inc. common stockholders by the weighted-average number of outstanding common shares for the period.
83
Table of Contents
Fairmount Santrol Holdings Inc. and Subsidiaries
Notes to Consolidated Financial Statements
Years Ended December 31, 2015, 2014, and 2013
(in thousands, except share and per share data)
Diluted earnings per share is computed by increasing the weighted-average number of outstanding common shares to include the additional common shares that would be outstanding after exercise of outstanding stock options and restricted stock units. Potential common shares in the diluted earnings per share calculation are excluded to the extent that they would be anti-dilutive.
Derivatives and Hedging Activities
Due to its variable-rate indebtedness, the Company is exposed to fluctuations in interest rates. The Company uses interest rate swaps to manage this exposure. These derivative instruments are recorded on the balance sheet at their fair values. Changes in the fair value of derivatives are recorded each period in current earnings or in other comprehensive income, depending on whether a derivative is designated as part of a hedging relationship and, if it is, depending on the type of hedging relationship. For cash flow hedges in which the Company is hedging the variability of cash flows related to a variable-rate liability, the effective portion of the gain or loss on the derivative instrument is reported in other comprehensive income in the periods during which earnings are impacted by the variability of the cash flows of the hedged item. The ineffective portion of all hedges is recognized in current period earnings. As interest expense is accrued on the debt obligation, amounts in accumulated other comprehensive income (loss) related to the interest rate swaps are reclassified into income to obtain a net cost on the debt obligation equal to the effective yield of the fixed rate of each swap. In the event that an interest rate swap is terminated prior to maturity, gains or losses in accumulated other comprehensive income (loss) remain deferred and are reclassified into earnings in the periods during which the hedged forecasted transaction affects earnings.
The Company formally designates and documents instruments at inception that qualify for hedge accounting of underlying exposures in accordance with GAAP. Both at inception and for each reporting period, the Company assesses whether the financial instruments used in hedging transactions are effective in offsetting changes in cash flows of the related underlying exposure.
Foreign Currency Translation
Assets and liabilities of all foreign operations are translated at the rate of exchange in effect on the balance sheet date; income and expenses are translated at the average rates of exchange prevailing during the year. The related translation adjustments are reflected as accumulated other comprehensive income (loss) in equity.
Concentration of Labor
Approximately 16% of the Company’s domestic labor force is covered under two union agreements that expire in 2016 and one union agreement that expires in 2018. The Company is in the process of negotiating new union agreements for those that expire in 2016.
Concentration of Credit Risk
At December 31, 2015, the Company had one customer whose receivable balance exceeded 10% of total receivables. Approximately, 35% of the Company’s accounts receivable balance is from this customer. At December 31, 2014, the Company had two customers whose receivable balances exceeded 10% of its total receivables. Approximately, 21% and 18% of the accounts receivable balance were from these two customers, respectively.
84
Table of Contents
Fairmount Santrol Holdings Inc. and Subsidiaries
Notes to Consolidated Financial Statements
Years Ended December 31, 2015, 2014, and 2013
(in thousands, except share and per share data)
Income Taxes
The Company uses the asset and liability method to account for deferred income taxes. Deferred tax assets and liabilities are recognized for the anticipated future tax consequences attributable to differences between financial statement amounts and their respective tax bases. Management reviews the Company’s deferred tax assets to determine whether their value can be realized based upon available evidence. A valuation allowance is established if management believes it is more likely than not that some portion of the deferred tax assets will not be realized.
Changes in valuation allowances from period to period are included in the Company’s tax provision in the period of change.
The Company recognizes a tax benefit associated with an uncertain tax position when the tax position is more-likely-than-not to be sustained upon examination by taxing authorities. The amount recognized is measured as the amount of benefit that is greater than 50% likely of being realized upon ultimate settlement. The Company recognizes interest and penalties accrued related to unrecognized tax uncertainties in income tax expense.
Asset Retirement Obligation
The Company estimates the future cost of dismantling, restoring, and reclaiming operating excavation sites and related facilities in accordance with federal, state, and local regulatory requirements. The Company records the initial estimated present value of reclamation costs as an asset retirement obligation and increases the carrying amount of the related asset by a corresponding amount. The Company allocates reclamation costs to expense over the life of the related assets and adjusts the related liability for changes resulting from the passage of time and revisions to either the timing or amount of the original present value estimate. If the asset retirement obligation is settled for more or less than the carrying amount of the liability, a loss or gain will be recognized, respectively.
Research and Development (R&D)
The Company’s research and development expenses consist of personnel and other direct and indirect costs for internally-funded project development. Total expenses for R&D for the years ended December 31, 2015, 2014, and 2013 were $5,036, $6,286, and $5,364, respectively. Total research and development expenditures represented 0.61%, 0.46%, and 0.54% of revenues in 2015, 2014, and 2013, respectively.
Change in Classification
During 2014, the Company modified the presentation of certain recoverable value-added taxes and other taxes remitted in Mexico to more appropriately reflect the nature of the underlying tax-related receivables. The consolidated statements of cash flows were modified to reflect the reclassification and resulted in $1,366 being reclassified from the change in accounts receivable to the change in prepaids and other assets for the year ended December 31, 2013. There was no net effect to cash flows provided by operating activities for the period.
In accordance with Accounting Standards Update No. 2015-17 – Income Taxes (Topic 740) – Balance Sheet Classification of Deferred Taxes, the Company has elected to early adopt the Standard on a prospective basis and classify deferred income tax assets and liabilities as non-current. See Note 3 for further detail.
85
Table of Contents
Fairmount Santrol Holdings Inc. and Subsidiaries
Notes to Consolidated Financial Statements
Years Ended December 31, 2015, 2014, and 2013
(in thousands, except share and per share data)
Accumulated Other Comprehensive Income (Loss)
Accumulated other comprehensive income (loss) is a separate line within equity that reports the Company’s cumulative income that has not been reported as part of net income. Items that are included in this line are the income or loss from foreign currency translation, actuarial gains and losses and prior service cost related to pension liabilities, and the unrealized gains and losses on certain investments or hedges, net of taxes. The components of accumulated other comprehensive income (loss) attributable to Fairmount Santrol Holdings Inc. at December 31, 2015 and 2014 were as follows:
| December 31, 2015 | ||||||||||||
| Gross | Tax Effect | Net Amount | ||||||||||
| Foreign currency translation |
$ | (10,030 | ) | $ | 1,318 | $ | (8,712 | ) | ||||
| Additional pension liability |
(4,014 | ) | 1,464 | (2,550 | ) | |||||||
| Unrealized gain (loss) on interest rate hedges |
(10,128 | ) | 3,697 | (6,431 | ) | |||||||
|
|
|
|
|
|
|
|||||||
| $ | (24,172 | ) | $ | 6,479 | $ | (17,693 | ) | |||||
|
|
|
|
|
|
|
|||||||
| December 31, 2014 | ||||||||||||
| Gross | Tax Effect | Net Amount | ||||||||||
| Foreign currency translation |
$ | (4,979 | ) | $ | — | $ | (4,979 | ) | ||||
| Additional pension liability |
(4,236 | ) | 1,588 | (2,648 | ) | |||||||
| Unrealized gain (loss) on interest rate hedges |
(8,292 | ) | 3,110 | (5,182 | ) | |||||||
|
|
|
|
|
|
|
|||||||
| $ | (17,507 | ) | $ | 4,698 | $ | (12,809 | ) | |||||
|
|
|
|
|
|
|
|||||||
The following table presents the changes in accumulated other comprehensive income by component for the year ended December 31, 2015:
| Year Ended December 31, 2015 | ||||||||||||||||
| Unrealized gain (loss) on interest rate hedges |
Additional pension liability |
Foreign currency translation |
Total | |||||||||||||
| Beginning balance |
$ | (5,182 | ) | $ | (2,648 | ) | $ | (4,979 | ) | $ | (12,809 | ) | ||||
| Other comprehensive income (loss) before reclassifications |
(3,231 | ) | (174 | ) | (3,733 | ) | (7,138 | ) | ||||||||
| Amounts reclassified from accumulated other comprehensive income (loss) |
1,982 | 272 | — | 2,254 | ||||||||||||
|
|
|
|
|
|
|
|
|
|||||||||
| Ending balance |
$ | (6,431 | ) | $ | (2,550 | ) | $ | (8,712 | ) | $ | (17,693 | ) | ||||
|
|
|
|
|
|
|
|
|
|||||||||
86
Table of Contents
Fairmount Santrol Holdings Inc. and Subsidiaries
Notes to Consolidated Financial Statements
Years Ended December 31, 2015, 2014, and 2013
(in thousands, except share and per share data)
The following table presents the reclassifications out of accumulated other comprehensive income during the year ended December 31, 2015:
| Details about accumulated other comprehensive income |
Amount reclassified from accumulated other comprehensive income |
Affected line item on the | ||||
| Change in fair value of derivative swap agreements |
||||||
| Interest rate hedging contracts |
$ | 3,320 | Interest expense | |||
| Tax effect |
(1,337 | ) | Tax expense (benefit) | |||
|
|
|
|||||
| $ | 1,983 | Net of tax | ||||
| Amortization of pension obligations |
||||||
| Prior service cost |
$ | 16 | Cost of sales | |||
| Actuarial losses |
280 | Cost of sales | ||||
|
|
|
|||||
| 296 | Total before tax | |||||
| Tax effect |
(25 | ) | Tax expense | |||
|
|
|
|||||
| 271 | Net of tax | |||||
|
|
|
|||||
| Total reclassifications for the period |
$ | 2,254 | Net of tax | |||
|
|
|
|||||
| 3. | Recent Accounting Pronouncements |
In July 2015, the FASB issued Accounting Standards Update No. 2015-11 – Inventory (Topic 330) – Simplifying the Measurement of Inventory. An entity should measure inventory within the scope of this update at the lower of cost or net realizable value. Net realizable value is the estimated selling prices in the ordinary course of business, less reasonably predictable costs of completion, disposal, and transportation. Subsequent measurement is unchanged for inventory measured using LIFO or the retail inventory method. The amendments in this update more closely align the measurement of inventory in GAAP with the measurement of inventory in International Financial Reporting Standards (IFRS). The amendment is effective for fiscal years beginning after December 15, 2016, including interim periods within those fiscal years. The Company is in the process of evaluating the effect of the new guidance on its financial statements and disclosures.
In August 2015, the FASB issued Accounting Standards Update No. 2015-14, which deferred the application of ASU 2014-09 to annual reporting periods beginning after December 15, 2017, and the interim periods within that year. In May 2014, the Financial Accounting Standards Board (FASB) issued Accounting Standards Update No. 2014-09 – Revenue from Contracts with Customers (ASU 2014-09). Under ASU 2014-09, companies recognize revenue in a manner that depicts the transfer of promised goods or services to customers in an amount that reflects the consideration to which the entity expects to be entitled, in exchange for those goods or services (ASC Topic 606). The new requirements significantly enhance comparability of revenue recognition practices across entities, industries, jurisdictions, and capital markets. Additionally, the guidance requires improved disclosures to help users of financial statements better understand the nature, amount, timing, and uncertainty of revenue that is recognized. As such, for a public business entity with a calendar year-end, the ASU would be effective on January 1, 2018, for both its interim and annual reporting periods. This proposal represents a one-year deferral from the original effective date. The Company is in the process of evaluating the effect of the new guidance on its financial statements and disclosures.
87
Table of Contents
Fairmount Santrol Holdings Inc. and Subsidiaries
Notes to Consolidated Financial Statements
Years Ended December 31, 2015, 2014, and 2013
(in thousands, except share and per share data)
In August 2015, the FASB issued Accounting Standards Update No. 2015-15 – Interest – Imputation of Interest (Subtopic 835-30), which provides guidance on debt issuance costs related to line-of-credit agreements and notes that the SEC would not object to an entity deferring and presenting debt issuance costs as an asset and subsequently amortizing the deferred debt issuance costs ratably over the term of the line-of-credit agreement, regardless of whether there are any outstanding borrowings on the line-of-credit agreement. The Company does not believe this Standard has any impact on the treatment of its debt issuance cost, as it currently follows this treatment for costs associated with its Revolving Credit Facility.
In November 2015, the FASB issued Accounting Standards Update No. 2015-17 – Income Taxes – Balance Sheet Classification of Deferred Taxes (Topic 740), which provides guidance on the simplification of balance sheet presentation of deferred taxes and requires that deferred tax assets and liabilities be classified as non-current in a classified statement of financial position based on an analysis of each taxpaying component within a jurisdiction. The Update would be effective for the fiscal year beginning January 1, 2017, however, the Company has elected early adoption of this guidance, as is permitted under the Standard, and has applied it on a prospective basis for the fiscal year ended December 31, 2015. Due to this prospective treatment, prior periods presented have not been adjusted. The adoption of this Standard does not have an impact on the Company’s financial position, however, it does impact the classification of the Consolidated Balance Sheets and certain ratios.
In February 2016, the FASB issued Accounting Standards Update No. 2016-02 – Leases (ASC 842), which sets out the principles for the recognition, measurement, presentation, and disclosure of leases for both parties to a contract (i.e. lessees and lessors). The new standard requires lessees to apply a dual approach, classifying leases as either finance or operating leases based on the principle of whether or not the lease is effectively a financed purchase by the lessee. This classification will determine whether lease expense is recognized based on an effective interest method or on a straight line basis over the term of the lease, respectively. A lessee is also required to record a right-of-use asset and a lease liability for all leases with a term of greater than 12 months regardless of their classification. Leases with a term of 12 months or less will be accounted for similar to existing guidance for operating leases today. The new standard requires lessors to account for leases using an approach that is substantially equivalent to existing guidance for sales-type leases, direct financing leases and operating leases. The Update is expected to impact the Company’s consolidated financial statements as the Company has certain operating and land lease arrangements for which it is the lessee. ASC 842 supersedes the previous leases standard, ASC 840 – Leases. The standard is effective on January 1, 2019, with early adoption permitted. The Company is in the process of evaluating the impact of this new guidance on its financial statements and disclosures.
| 4. | Inventories |
At December 31, 2015 and 2014, inventories consisted of the following:
| December 31, 2015 |
December 31, 2014 |
|||||||
| Raw materials |
$ | 10,813 | $ | 19,803 | ||||
| Work-in-process |
14,613 | 23,568 | ||||||
| Finished goods |
47,980 | 91,202 | ||||||
|
|
|
|
|
|||||
| 73,406 | 134,573 | |||||||
| Less: LIFO reserve |
(2,912 | ) | (2,960 | ) | ||||
|
|
|
|
|
|||||
| Inventories |
$ | 70,494 | $ | 131,613 | ||||
|
|
|
|
|
|||||
88
Table of Contents
Fairmount Santrol Holdings Inc. and Subsidiaries
Notes to Consolidated Financial Statements
Years Ended December 31, 2015, 2014, and 2013
(in thousands, except share and per share data)
| 5. | Property, Plant, and Equipment |
At December 31, 2015 and 2014, property, plant, and equipment consisted of the following:
| December 31, 2015 |
December 31, 2014 |
|||||||
| Land and improvements |
$ | 82,966 | $ | 63,800 | ||||
| Mineral reserves and mine development |
323,691 | 303,804 | ||||||
| Machinery and equipment |
575,034 | 478,225 | ||||||
| Buildings and improvements |
171,791 | 146,165 | ||||||
| Furniture, fixtures, and other |
3,609 | 3,604 | ||||||
| Construction in progress |
37,047 | 110,677 | ||||||
|
|
|
|
|
|||||
| 1,194,138 | 1,106,275 | |||||||
| Accumulated depletion and depreciation |
(323,141 | ) | (265,001 | ) | ||||
|
|
|
|
|
|||||
| Property, plant, and equipment, net |
$ | 870,997 | $ | 841,274 | ||||
|
|
|
|
|
|||||
| 6. | Accrued Expenses |
At December 31, 2015 and 2014, accrued expenses consisted of the following:
| December 31, 2015 |
December 31, 2014 |
|||||||
| Accrued payroll and fringe benefits |
$ | 13,285 | $ | 21,845 | ||||
| Accrued income taxes |
1,042 | 627 | ||||||
| Other accrued expenses |
12,458 | 13,553 | ||||||
|
|
|
|
|
|||||
| Accrued expenses |
$ | 26,785 | $ | 36,025 | ||||
|
|
|
|
|
|||||
| 7. | Other Long-Term Liabilities |
At December 31, 2015 and 2014, other long-term liabilities consisted of the following:
| December 31, 2015 |
December 31, 2014 |
|||||||
| Interest rate swaps |
$ | 12,107 | $ | 11,696 | ||||
| Accrued asset retirement obligations |
4,288 | 3,122 | ||||||
| Accrued compensation and benefits |
6,784 | 7,081 | ||||||
| Other |
10,623 | 7,086 | ||||||
|
|
|
|
|
|||||
| Other long-term liabilities |
$ | 33,802 | $ | 28,985 | ||||
|
|
|
|
|
|||||
| 8. | Acquisitions |
The Company made no acquisitions in 2015 and 2014, respectively. In 2013, the Company made three acquisitions. On April 30, 2013, the Company acquired 100% of Self-Suspending Proppant LLC (“SSP”) for total consideration of $56,320 plus contingent consideration. The Company accounted for this transaction as an acquisition of a group of assets. SSP owned the exclusive rights to certain intellectual property related to providing proppant with enhanced performance attributes through proprietary coating technology. The contingent consideration is a fixed percentage of the cumulative product margin, less
89
Table of Contents
Fairmount Santrol Holdings Inc. and Subsidiaries
Notes to Consolidated Financial Statements
Years Ended December 31, 2015, 2014, and 2013
(in thousands, except share and per share data)
certain adjustments, generated by Propel SSP sales and any other product incorporating SSP technology for the five years commencing on October 1, 2015. Because the earnout is dependent on future sales and the related cost of sales, the amounts of which are highly uncertain, it is not possible to estimate the amount that will be paid. The Company entered into an Amendment to this agreement on December 17, 2015. This Amendment (a) extends the period during which the aggregate earnout payments must equal or exceed $45,000 from the two-year period ending October 1, 2017 until the three-year period ending October 1, 2018; and (b) provides that the aggregate earnout payments during the two-year period ending October 1, 2017 must equal or exceed $15,000 and granted the Seller a security interest in 51% of the equity interests in the Company to secure such $15,000. The Amendment does not alter the final threshold earnout amount, which continues to be $195,000 (inclusive of the prior earnout amounts, if any) by October 1, 2020. The contingent consideration will be capitalized, and the associated amortization expense will be recognized, at the time a payment is probable and reasonably estimable.
On June 12, 2013, the Company purchased Great Plains Sands, LLC (“Great Plains”), located in Minnesota, for total purchase consideration of $73,579. The Company accounted for this acquisition under ASC 805 as a business combination. Included in the purchase amount is contingent consideration of $9,600 for additional payments due to the seller based on the acquired plant meeting certain operating targets. The contingent consideration was paid in July 2014. The goodwill of $3,887 is primarily attributable to the synergies expected to arise after the acquisition. The Company expects that all of the goodwill generated in this acquisition will be deductible for tax purposes. The production facilities were not complete at the time of the acquisition, and accordingly there were no pre-acquisition revenues or cost of sales. As a result, pro forma results would not be meaningful in evaluating the financial effect of this acquisition. It is not practicable to determine revenue and net income included in the Company’s operating results relating to Great Plains since the date of acquisition because Great Plains has been fully integrated into the Company’s operations, and the operating results of Great Plains can therefore not be separately identified.
On September 6, 2013, the Company purchased certain assets and assumed certain liabilities from FTS International Services, LLC (“FTSI”) and affiliates. The Company acquired sand reserves, frac sand production capacity, resin-coating capacity, and logistics assets consisting of terminals and railcars. The assets are located in various states, including Texas, Wisconsin, Missouri, Alabama, and Illinois. In connection with this acquisition, the Company also entered into a ten year supply agreement with FTSI. In April 2014, the agreed upon quantities of certain raw sand required under the supply agreement were lowered to 80% of the original quantity. The total consideration was $347,704. The Company accounted for this acquisition under ASC 805 as a business combination. The goodwill of $49,456 is primarily attributable to the synergies expected to arise after the acquisition. The Company expects that all of the goodwill generated in this acquisition will be deductible for tax purposes. The historical financial information for the assets acquired was impracticable to obtain, and inclusion of pro forma information would require the Company to make estimates and assumptions regarding these assets’ historical financial results that may not be reasonable or accurate. As a result, pro forma results are not presented. It is not practicable to determine revenue and net income included in the Company’s operating results relating to FTSI since the date of acquisition because FTSI has been fully integrated into the Company’s operations, and the operating results of FTSI can therefore not be separately identified.
The purchase price for each of these acquisitions was assigned to the fair value of the assets acquired. Such determination of fair value is based on valuation models that incorporate the present value of expected future cash flows and profitability projections. There are many assumptions and estimates underlying the determination of the fair value. Although the Company believes its assumptions and estimates are reasonable, deviations from the assumptions and estimates could produce a materially different result.
90
Table of Contents
Fairmount Santrol Holdings Inc. and Subsidiaries
Notes to Consolidated Financial Statements
Years Ended December 31, 2015, 2014, and 2013
(in thousands, except share and per share data)
The purchase price for the three transactions in 2013 has been allocated to the fair value of the assets acquired and liabilities assumed as follows:
| SSP | Great Plains Sands |
FTSI | ||||||||||
| Land and buildings |
$ | — | $ | 7,623 | $ | 2,428 | ||||||
| Inventory |
— | 1,085 | 25,990 | |||||||||
| Machinery and equipment |
— | 13,200 | 125,239 | |||||||||
| Mineral reserves |
— | 48,100 | 95,500 | |||||||||
| Other assets |
— | 1,568 | — | |||||||||
| Acquired technology |
56,320 | — | — | |||||||||
| Supply agreement |
— | — | 50,700 | |||||||||
| Other intangibles |
— | — | 687 | |||||||||
| Goodwill |
— | 3,887 | 49,456 | |||||||||
| Liabilities assumed |
— | (1,884 | ) | (2,296 | ) | |||||||
|
|
|
|
|
|
|
|||||||
| Net assets acquired |
$ | 56,320 | $ | 73,579 | $ | 347,704 | ||||||
|
|
|
|
|
|
|
|||||||
| Cash consideration |
$ | 56,320 | $ | 63,979 | $ | 347,704 | ||||||
| Contingent consideration |
— | 9,600 | — | |||||||||
|
|
|
|
|
|
|
|||||||
| Total purchase consideration |
$ | 56,320 | $ | 73,579 | $ | 347,704 | ||||||
|
|
|
|
|
|
|
|||||||
The Company capitalized $1,320 of transaction related expenses in connection with the SSP transaction. The Company recognized $7,113 of transaction related expenses in connection with the Great Plains and FTSI acquisitions, which is included in selling, general and administrative expenses.
| 9. | Goodwill and Other Intangible Assets |
The following table summarizes the activity in goodwill for the years ended December 31, 2015 and 2014:
| Beginning Balance |
Acquisitions | Dispositions | Impairment | Currency Translation/ Other |
Ending Balance |
|||||||||||||||||||
| Year Ended December 31, 2015: |
||||||||||||||||||||||||
| Proppant Solutions |
$ | 68,216 | $ | — | $ | — | $ | (69,246 | ) | $ | 1,030 | $ | — | |||||||||||
| Industrial & Recreational Products |
16,461 | — | — | — | (1,160 | ) | 15,301 | |||||||||||||||||
|
|
|
|
|
|
|
|
|
|
|
|
|
|||||||||||||
| Total goodwill |
$ | 84,677 | $ | — | $ | — | $ | (69,246 | ) | $ | (130 | ) | $ | 15,301 | ||||||||||
|
|
|
|
|
|
|
|
|
|
|
|
|
|||||||||||||
| Year Ended December 31, 2014: |
||||||||||||||||||||||||
| Proppant Solutions |
$ | 70,991 | $ | — | $ | — | $ | — | $ | (2,775 | ) | $ | 68,216 | |||||||||||
| Industrial & Recreational Products |
16,461 | — | — | — | — | 16,461 | ||||||||||||||||||
|
|
|
|
|
|
|
|
|
|
|
|
|
|||||||||||||
| Total goodwill |
$ | 87,452 | $ | — | $ | — | $ | — | $ | (2,775 | ) | $ | 84,677 | |||||||||||
|
|
|
|
|
|
|
|
|
|
|
|
|
|||||||||||||
Goodwill represents the excess of purchase price over the fair value of net assets acquired. The Company evaluates goodwill on an annual basis in the fourth quarter and when management believes indicators of impairment exist. Due to the significant changes in the oil and gas business climate during 2015 and the declines in the Company’s stock price and debt fair values, the Company assessed qualitative factors and determined that it could not conclude it was more likely than not that the fair value of its goodwill exceeded its carrying value for the goodwill recorded in the Proppant Solutions reporting unit.
91
Table of Contents
Fairmount Santrol Holdings Inc. and Subsidiaries
Notes to Consolidated Financial Statements
Years Ended December 31, 2015, 2014, and 2013
(in thousands, except share and per share data)
Accordingly, the Company proceeded to a quantitative evaluation of potential impairment of its goodwill. This evaluation was based on the income (or discounted cash flows) approach. Key assumptions include future growth or recovery rates in the business, the long-term discount rate, and expected terminal values of a business exit. The Company estimated the value of its two goodwill reporting units based on management’s best current available estimates of the future cash flows to arrive at the income approach estimate of fair value. Based on these estimates, the Company has concluded there has been an impairment loss in the goodwill attributable to the Proppant Solutions segment in the three months ended December 31, 2015.
The Company then estimated the fair values of all tangible and intangible assets in the segments as of December 31, 2015 and concluded that the fair value of the Proppant Solutions segment goodwill has declined to zero. An impairment charge of $69,246 was recorded in the three months ended December 31, 2015. The Company did not recognize any impairment losses for goodwill or other intangible assets in the years ended December 31, 2014 and 2013.
Currency translation and other relates to the impact of the change in foreign currency exchange rates from international entities on goodwill, an adjustment to the initial FTSI purchase price allocation from exercising an option to acquire an additional mining facility, and an adjustment recorded to goodwill related to the post-acquisition settlement of escrow proceeds. Goodwill on a certain property was originally recorded in the Proppant Solutions segment. When the property transitioned to Industrial & Recreational Products usage, it was transferred to that segment. In 2015, the property was idled and returned to the Proppant Solutions segment, where the write-off of goodwill related to that property was recorded.
Information regarding acquired intangible assets as of December 31, 2015 and 2014 is as follows:
| December 31, 2015 | ||||||||||||
| Gross Carrying Amount |
Accumulated Amortization |
Intangible Assets, net |
||||||||||
| Acquired technology and patents |
$ | 56,320 | $ | — | $ | 56,320 | ||||||
| Supply agreement |
50,700 | (11,154 | ) | 39,546 | ||||||||
| Other intangible assets |
1,190 | (574 | ) | 616 | ||||||||
|
|
|
|
|
|
|
|||||||
| Intangible assets |
$ | 108,210 | $ | (11,728 | ) | $ | 96,482 | |||||
|
|
|
|
|
|
|
|||||||
| December 31, 2014 | ||||||||||||
| Gross Carrying Amount |
Accumulated Amortization |
Intangible Assets, net |
||||||||||
| Acquired technology and patents |
$ | 56,928 | $ | (608 | ) | $ | 56,320 | |||||
| Supply agreement |
50,700 | (6,760 | ) | 43,940 | ||||||||
| Other intangible assets |
687 | (178 | ) | 509 | ||||||||
|
|
|
|
|
|
|
|||||||
| Intangible assets |
$ | 108,315 | $ | (7,546 | ) | $ | 100,769 | |||||
|
|
|
|
|
|
|
|||||||
The acquired technology from the SSP acquisition will be amortized ratably over its estimated useful life once product using the technology is fully commercialized. The supply agreement was previously amortized ratably over the life of the agreement, which was 10 years. However, in May 2015, the supply agreement was amended, extending the maturity date from September 2023 to December 2024. The supply agreement is now being amortized over the amended life.
92
Table of Contents
Fairmount Santrol Holdings Inc. and Subsidiaries
Notes to Consolidated Financial Statements
Years Ended December 31, 2015, 2014, and 2013
(in thousands, except share and per share data)
Estimated future amortization expense related to intangible assets at December 31, 2015 is as follows:
| Amortization | ||||
| 2016 |
$ | 4,534 | ||
| 2017 |
4,516 | |||
| 2018 |
4,471 | |||
| 2019 |
4,420 | |||
| 2020 |
4,394 | |||
| Thereafter |
18,263 | |||
|
|
|
|||
| Total |
$ | 40,598 | ||
|
|
|
|||
| 10. | Long-Term Debt |
At December 31, 2015 and 2014, long-term debt consisted of the following:
| December 31, 2015 |
December 31, 2014 |
|||||||
| Term B-1 Loans |
$ | 156,134 | $ | 319,917 | ||||
| Term B-2 Loans |
902,402 | 910,900 | ||||||
| Extended Term B-1 Loans |
159,878 | — | ||||||
| Industrial Revenue bond |
10,000 | 10,000 | ||||||
| Revolving credit facility and other |
101 | 1,098 | ||||||
| Capital leases, net |
9,301 | 10,724 | ||||||
|
|
|
|
|
|||||
| 1,237,816 | 1,252,639 | |||||||
| Less: current portion |
(17,536 | ) | (17,274 | ) | ||||
|
|
|
|
|
|||||
| Long-term debt including leases |
$ | 1,220,280 | $ | 1,235,365 | ||||
|
|
|
|
|
|||||
On September 5, 2013, the Company entered into the Second Amended and Restated Credit Agreement (the “2013 Amended Credit Agreement”). The 2013 Amended Credit Agreement initially contained a revolving credit facility (“Revolving Credit Facility”) and two tranches of term loans, a term B-1 facility (“Term B-1 Loans”) and a term B-2 facility (“Term B-2 Loans”). The Revolving Credit Facility and the Term B-1 and B-2 Loans are secured by a first priority lien on substantially all of the Company’s domestic assets.
As of April 30, 2015, the Company entered into the Third Amendment to the Second Amended and Restated Credit Agreement (the “April 2015 Amendment”) to the 2013 Amended Credit Agreement. The April 2015 Amendment provides for the extension of the maturity date of $46,036 of outstanding Term B-1 Loans from March 15, 2017 (the “Stated B-1 Maturity Date”) to September 5, 2019 (the “Extended Maturity Date,” which is the same maturity date applicable to Term B-2 Loans under the 2013 Amended Credit Agreement). The Company paid a fee of approximately $1,151 to the lender as a consent fee.
As of May 15, 2015, the Company entered into the Fourth Amendment to the Second Amended and Restated Credit Agreement (the “May 2015 Amendment”). The May 2015 Amendment provides for the extension of the maturity date of $115,458 of outstanding Term B-1 Loans from the Stated B-1 Maturity Date to the Extended Maturity Date. Such loans (together with the other loans whose maturity dates were extended under the April 2015 Amendment, Extended Term B-1 Loans) effectively will be converted to Term B-2 Loans, and will be treated as Term B-2 Loans under the Credit Agreement for all purposes
93
Table of Contents
Fairmount Santrol Holdings Inc. and Subsidiaries
Notes to Consolidated Financial Statements
Years Ended December 31, 2015, 2014, and 2013
(in thousands, except share and per share data)
(including pricing), except for certain minor administrative differences and except that, prior to the Stated B-1 Maturity Date, Extended Term B-1 Loans shall continue to amortize as Term B-1 Loans. Upon giving effect to the April and May 2015 Amendments, the maturity date of approximately $161,495 in principal amount of outstanding Term B-1 Loans was so extended. The Company paid a fee of approximately $2,886 to the lender as a consent fee for the May 2015 Amendment.
After the April and May 2015 Amendments, $156,619 in principal amount of outstanding Term B-1 Loans mature on March 15, 2017 and $1,073,706 in principal amount of outstanding Term B-2 Loans (including Extended Term B-1 Loans) mature on September 5, 2019.
As of September 30, 2015, the Company entered into an amendment to the 2013 Amended Credit Agreement that modified the Revolving Credit Facility. These modifications consisted primarily of (i) a reduction in the U.S. revolving commitments from $124,000 to $99,000 (while the aggregate Canadian revolving commitment remained at $1,000) and (ii) changes in the financial covenant governing the availability of amounts under the Revolving Credit Facility if, and only if, the Company has drawn, including letters of credit, more than $31,250 on the Revolving Credit Facility. Generally, if the Company’s leverage ratio is greater than 4.75:1.00 during the period from the third quarter of 2015 through the fourth quarter of 2016, so long as the stated quarterly adjusted EBITDA thresholds are exceeded, the amount available to borrow under the Revolving Credit Facility is increased from $31,250 to $40,000. Commencing with the end of the first quarter of 2017, the quarterly adjusted EBITDA thresholds are discontinued and the full amount of the revolving commitment ($100,000) is available so long as the Company’s leverage ratio does not exceed a revised limit (6.50:1.00 for the first quarter of 2017 declining quarterly to 4.75:1.00 for the fourth quarter of 2017). As of December 31, 2015, the Company’s leverage ratio was 8.96:1.00.
As of December 31, 2015, there was $19,717 available capacity remaining on the Revolving Credit Facility and $11,533 committed to outstanding letters of credit since the quarterly cumulative EBITDA threshold was not met at December 31, 2015.
The Company has a $10,000 Industrial Revenue Bond outstanding related to the construction of manufacturing facility in Wisconsin. The bond bears interest, which is payable monthly, at a variable rate. The rate was 0.02% at December 31, 2015. The bond matures on September 1, 2027 and is collateralized by a letter of credit of $10,000.
Maturities of long-term debt are as follows:
| Capital Lease Obligations | Other Long-Term Debt |
Total Principal Payments |
||||||||||||||||||
| Lease Payment |
Less Interest |
Present Value |
||||||||||||||||||
| Year Ended: |
||||||||||||||||||||
| 2016 |
$ | 5,253 | $ | 241 | $ | 5,012 | $ | 12,525 | $ | 17,537 | ||||||||||
| 2017 |
3,530 | 90 | 3,440 | 165,460 | 168,900 | |||||||||||||||
| 2018 |
689 | 16 | 673 | 10,927 | 11,600 | |||||||||||||||
| 2019 |
179 | 3 | 176 | 1,029,565 | 1,029,741 | |||||||||||||||
| 2020 |
— | — | — | — | — | |||||||||||||||
| Thereafter |
— | — | — | 10,038 | 10,038 | |||||||||||||||
|
|
|
|
|
|
|
|
|
|
|
|||||||||||
| $ | 9,651 | $ | 350 | $ | 9,301 | $ | 1,228,515 | $ | 1,237,816 | |||||||||||
|
|
|
|
|
|
|
|
|
|
|
|||||||||||
94
Table of Contents
Fairmount Santrol Holdings Inc. and Subsidiaries
Notes to Consolidated Financial Statements
Years Ended December 31, 2015, 2014, and 2013
(in thousands, except share and per share data)
Information pertaining to assets and related accumulated depreciation in the balance sheet for capital lease items is as follows:
| December 31, 2015 |
December 31, 2014 |
|||||||
| Cost |
$ | 22,684 | $ | 18,131 | ||||
| Accumulated depreciation |
(8,812 | ) | (5,111 | ) | ||||
|
|
|
|
|
|||||
| Net book value |
$ | 13,872 | $ | 13,020 | ||||
|
|
|
|
|
|||||
| 11. | Earnings per Share |
The table below shows the computation of basic and diluted earnings per share for the years ended December 31, 2015, 2014, and 2013:
| Year Ended December 31, | ||||||||||||
| 2015 | 2014 | 2013 | ||||||||||
| Numerator: |
||||||||||||
| Net income (loss) attributable to Fairmount Santrol Holdings Inc. |
$ | (92,135 | ) | $ | 170,450 | $ | 103,961 | |||||
| Denominator: |
||||||||||||
| Basic weighted average shares outstanding |
161,296,933 | 157,949,664 | 156,008,218 | |||||||||
| Dilutive effect of employee stock options & RSU’s |
— | 8,327,460 | 8,629,336 | |||||||||
|
|
|
|
|
|
|
|||||||
| Diluted weighted average shares outstanding |
161,296,933 | 166,277,124 | 164,637,554 | |||||||||
|
|
|
|
|
|
|
|||||||
| Earnings per common share—basic |
$ | (0.57 | ) | $ | 1.08 | $ | 0.67 | |||||
| Earnings per common share—diluted |
$ | (0.57 | ) | $ | 1.03 | $ | 0.63 | |||||
Because the Company experienced a loss in the year ended December 31, 2015, the calculation of diluted weighted average shares outstanding is not appropriate because the effect of including these potential common shares would be antidilutive. The calculation of diluted weighted average shares outstanding for the years ended December 31, 2014 and 2013 excludes 715,068 and 1,112,038 potential common shares because the effect of including these potential common shares would be antidilutive.
| 12. | Derivative Instruments |
The Company enters into interest rate swap agreements as a means to partially hedge its variable interest rate risk on debt instruments. The current notional value of these swap agreements is $525,225 at December 31, 2015 and effectively fixes the variable rate in a range of 0.83% to 3.115%. The total notional amount of these instruments is scheduled to increase over time to provide a partial hedge against variable interest rate debt. The interest rate swap agreements mature at various dates between March 15, 2017 and September 5, 2019.
The derivative instruments are recorded on the balance sheet at their fair values. Changes in the fair value of derivatives are recorded each period in current earnings or in other comprehensive income, depending on whether a derivative is designated as part of a hedging relationship and, if it is, depending on the type of hedging relationship. For cash flow hedges in which the Company is hedging the variability of cash flows
95
Table of Contents
Fairmount Santrol Holdings Inc. and Subsidiaries
Notes to Consolidated Financial Statements
Years Ended December 31, 2015, 2014, and 2013
(in thousands, except share and per share data)
related to a variable-rate liability, the effective portion of the gain or loss on the derivative instrument is reported in other comprehensive income in the periods during which earnings are impacted by the variability of the cash flows of the hedged item. The ineffective portion of all hedges is recognized in current period earnings. As interest expense is accrued on the debt obligation, amounts in accumulated other comprehensive income (loss) related to the interest rate swaps are reclassified into income to obtain a net cost on the debt obligation equal to the effective yield of the fixed rate of each swap. In the event that an interest rate swap is terminated prior to maturity, gains or losses in accumulated other comprehensive income (loss) remain deferred and are reclassified into earnings in the periods in which the hedged forecasted transaction affects earnings.
The Company formally designates and documents instruments at inception that qualify for hedge accounting of underlying exposures in accordance with GAAP. Both at inception and for each reporting period, the Company assesses whether the financial instruments used in hedging transactions are effective in offsetting changes in cash flows of the related underlying exposure.
Certain of the interest rate swaps qualify for cash flow hedge accounting treatment. The following table summarizes the fair values and the respective classification in the Consolidated Balance Sheets as of December 31, 2015 and 2014:
| Assets (Liabilities) | ||||||||||
| Interest Rate Swap Agreements |
Balance Sheet Classification |
December 31, 2015 |
December 31, 2014 |
|||||||
| Designated as hedges |
Other long-term liabilities | $ | (12,107 | ) | $ | (10,253 | ) | |||
| Not designated as hedges |
Other long-term liabilities | — | (1,443 | ) | ||||||
| Designated as hedges |
Other assets | 118 | 333 | |||||||
|
|
|
|
|
|||||||
| $ | (11,989 | ) | $ | (11,363 | ) | |||||
|
|
|
|
|
|||||||
The Company recognized $21 in interest expense, representing the ineffective portion of interest rate swap agreements designated as hedges, in the year ended December 31, 2014. In the years ended December 31, 2015 and 2013, respectively, the Company recognized $51 and $15 in interest income, representing the ineffective portion of interest rate swap agreements designated as hedges. The Company expects $5,063 to be reclassified from accumulated other comprehensive income into interest expense in the year ending December 31, 2016.
| 13. | Fair Value Measurements |
Financial instruments held by the Company include cash equivalents, accounts receivable, accounts payable, long-term debt (including the current portion thereof) and interest rate swaps. The Company is also liable for contingent consideration from an acquisition that is subject to fair value measurement. Fair value is defined as the price that would be received to sell an asset, or paid to transfer a liability, in an orderly transaction between market participants at the measurement date. In determining fair value, the Company utilizes certain assumptions that market participants would use in pricing the asset or liability, including assumptions about risk and/or the risks inherent in the inputs to the valuation technique.
Based on the examination of the inputs used in the valuation techniques, the Company is required to provide the following information according to the fair value hierarchy. The fair value hierarchy ranks the quality
96
Table of Contents
Fairmount Santrol Holdings Inc. and Subsidiaries
Notes to Consolidated Financial Statements
Years Ended December 31, 2015, 2014, and 2013
(in thousands, except share and per share data)
and reliability of the information used to determine fair values. Financial assets and liabilities carried at fair value will be classified and disclosed in one of the following three categories:
Level 1 Quoted market prices in active markets for identical assets or liabilities
Level 2 Observable market based inputs or unobservable inputs that are corroborated by market data
Level 3 Unobservable inputs that are not corroborated by market data
A financial instrument’s categorization within the valuation hierarchy is based upon the lowest level of input that is significant to the fair value measurement.
The book value of cash equivalents, accounts receivable and accounts payable are considered to be representative of their fair values because of their short maturities. The carrying value of the Company’s long-term debt (including the current portion thereof) is recognized at amortized cost. The value of the Company’s Term B-1, Extended Term, and Term B-2 loans differs from amortized costs and is valued at prices obtained from a readily-available source for trading non-public debt, which represent quoted prices for identical or similar assets in markets that are not active, and therefore is considered Level 2. The fair value of the Company’s Term B-1 loan was $106,360 and $295,750, Extended Term loan was $76,922 and $0, and Term B-2 loan was $443,580 and $796,500 at December 31, 2015 and 2014, respectively.
As a result of the downturn in end markets in 2015, and in accordance with ASC 360-10, the fair value of certain of the Company’s long-lived assets held and used with a carrying value of $165,389 was written down to fair value of $79,385 and the fair value of certain of the Company’s long-lived assets held-for-sale with a carrying value of $2,635 was written down to fair value of $0. The resulting impairment charges of $86,004 and $2,635, respectively, were based on management’s estimate of the disposed value of the assets and were recognized in restructuring and other charges in income from operations in the current period.
The following table presents the amounts carried at fair value as of December 31, 2015 and 2014 for the Company’s other financial instruments.
| Recurring Fair Value Measurements |
Quoted Prices in Active Markets (Level 1) |
Other Observable Inputs (Level 2) |
Unobservable Inputs (Level 3) |
Total | ||||||||||||
| December 31, 2015 |
||||||||||||||||
| Interest rate swap agreeements |
$ | — | $ | (11,989 | ) | $ | — | $ | (11,989 | ) | ||||||
|
|
|
|
|
|
|
|
|
|||||||||
| $ | — | $ | (11,989 | ) | $ | — | $ | (11,989 | ) | |||||||
|
|
|
|
|
|
|
|
|
|||||||||
| December 31, 2014 |
||||||||||||||||
| Interest rate swap agreeements |
$ | — | $ | (11,363 | ) | $ | — | $ | (11,363 | ) | ||||||
|
|
|
|
|
|
|
|
|
|||||||||
| $ | — | $ | (11,363 | ) | $ | — | $ | (11,363 | ) | |||||||
|
|
|
|
|
|
|
|
|
|||||||||
97
Table of Contents
Fairmount Santrol Holdings Inc. and Subsidiaries
Notes to Consolidated Financial Statements
Years Ended December 31, 2015, 2014, and 2013
(in thousands, except share and per share data)
The following table shows assets measured at fair value on a non-recurring basis. The fair value of goodwill and the SSP intangible asset are determined using Level 3 inputs. Please refer to Notes 9 and 22 for further discussion.
| Non-Recurring Fair Value Measurements |
Quoted Prices in Active Markets (Level 1) |
Other Observable Inputs (Level 2) |
Unobservable Inputs (Level 3) |
Total | ||||||||||||
| December 31, 2015 |
||||||||||||||||
| Long-lived assets held and used |
$ | — | $ | — | $ | 79,385 | $ | 79,385 | ||||||||
| Long-lived assets held for sale |
— | — | — | — | ||||||||||||
|
|
|
|
|
|
|
|
|
|||||||||
| $ | — | $ | — | $ | 79,385 | $ | 79,385 | |||||||||
|
|
|
|
|
|
|
|
|
|||||||||
| December 31, 2014 |
||||||||||||||||
| Long-lived assets held and used |
$ | — | $ | — | $ | 165,389 | $ | 165,389 | ||||||||
| Long-lived assets held for sale |
— | — | 2,635 | 2,635 | ||||||||||||
|
|
|
|
|
|
|
|
|
|||||||||
| $ | — | $ | — | $ | 168,024 | $ | 168,024 | |||||||||
|
|
|
|
|
|
|
|
|
|||||||||
| 14. | Income Taxes |
Income (loss) before provision (benefit) for income taxes includes the following components:
| 2015 | 2014 | 2013 | ||||||||||
| United States |
$ | (94,746 | ) | $ | 238,332 | $ | 137,456 | |||||
| Foreign |
877 | 9,704 | 12,420 | |||||||||
|
|
|
|
|
|
|
|||||||
| Total |
$ | (93,869 | ) | $ | 248,036 | $ | 149,876 | |||||
|
|
|
|
|
|
|
|||||||
The components of the provision (benefit) for income taxes are as follows:
| 2015 | 2014 | 2013 | ||||||||||
| Federal |
$ | (23,515 | ) | $ | 30,656 | $ | 34,578 | |||||
| State and local |
359 | 3,754 | 3,329 | |||||||||
| Foreign |
1,396 | 5,193 | 6,486 | |||||||||
|
|
|
|
|
|
|
|||||||
| Subtotal |
(21,760 | ) | 39,603 | 44,393 | ||||||||
| Change in deferred taxes |
19,821 | 37,810 | 826 | |||||||||
|
|
|
|
|
|
|
|||||||
| Total |
$ | (1,939 | ) | $ | 77,413 | $ | 45,219 | |||||
|
|
|
|
|
|
|
|||||||
98
Table of Contents
Fairmount Santrol Holdings Inc. and Subsidiaries
Notes to Consolidated Financial Statements
Years Ended December 31, 2015, 2014, and 2013
(in thousands, except share and per share data)
The effective tax rate for 2014 and 2013, respectively, was a provision on income, while 2015 was a provision on a loss. A reconciliation of the statutory federal income tax rate to the Company’s effective tax rate is as follows:
| 2015 | 2014 | 2013 | ||||||||||
| U.S. statutory rate |
35.0 | % | 35.0 | % | 35.0 | % | ||||||
| Increase (decrease) resulting from: |
||||||||||||
| State income taxes, net |
0.2 | 1.2 | 2.2 | |||||||||
| Foreign tax rate differential and adjustment |
0.1 | 0.6 | 1.4 | |||||||||
| U.S. statutory depletion |
9.7 | (5.8 | ) | (6.9 | ) | |||||||
| Manufacturers’ deduction |
(4.0 | ) | (0.9 | ) | (2.1 | ) | ||||||
| Unremitted foreign earnings |
(4.1 | ) | 0.0 | 0.0 | ||||||||
| Goodwill impairment |
(6.2 | ) | 0.0 | 0.0 | ||||||||
| Valuation allowance |
(27.6 | ) | 0.5 | 0.0 | ||||||||
| Other items, net |
(1.0 | ) | 0.6 | 0.6 | ||||||||
|
|
|
|
|
|
|
|||||||
| Effective rate |
2.1 | % | 31.2 | % | 30.2 | % | ||||||
|
|
|
|
|
|
|
|||||||
The differences between the statutory U.S. tax rate and the Company’s effective tax rate in 2015 is due to the accrual of deferred taxes on the cumulative amount of foreign undistributed earnings resulting from a change in the Company’s indefinite reinvestment assertion; an increase in the valuation allowance primarily related to U.S. alternative minimum tax credits and U.S. research credits; a goodwill impairment charge for which the Company could not record an income tax benefit; tax depletion; and the manufacturers’ deduction. The difference between the statutory U.S. tax rate and the Company’s effective tax rate in 2014 and 2013 is primarily due to tax depletion and nondeductible expenses.
99
Table of Contents
Fairmount Santrol Holdings Inc. and Subsidiaries
Notes to Consolidated Financial Statements
Years Ended December 31, 2015, 2014, and 2013
(in thousands, except share and per share data)
Significant components of deferred tax assets and liabilities as of December 31, 2015 and 2014 are as follows:
| 2015 | 2014 | |||||||
| Deferred tax assets |
||||||||
| Accrued liabilities |
$ | 1,088 | $ | 1,924 | ||||
| Inventory |
3,168 | 3,435 | ||||||
| Stock compensation |
19,213 | 19,702 | ||||||
| Deferred compensation |
1,161 | 1,274 | ||||||
| Interest rate derivatives |
4,373 | 4,221 | ||||||
| Pension |
3,425 | 1,590 | ||||||
| Intangibles |
13,791 | — | ||||||
| Foreign tax credit carryforwards |
1,196 | 1,309 | ||||||
| Alternative minimum tax credit carryforwards |
24,463 | — | ||||||
| Research and experimentation tax credit carryforwards |
971 | — | ||||||
| Net operating loss carryforwards |
965 | — | ||||||
| Other assets |
2,027 | 1,383 | ||||||
|
|
|
|
|
|||||
| Total deferred tax assets before valuation allowance |
75,841 | 34,838 | ||||||
| Valuation allowance |
(27,230 | ) | (1,309 | ) | ||||
|
|
|
|
|
|||||
| Total deferred tax assets after valuation allowance |
48,611 | 33,529 | ||||||
| Deferred tax liabilities |
||||||||
| Property, plant, and equipment |
(131,278 | ) | (99,352 | ) | ||||
| Intangibles |
— | (3,370 | ) | |||||
| Unremitted foreign earnings |
(2,553 | ) | — | |||||
| Other liabilities |
(3,515 | ) | — | |||||
|
|
|
|
|
|||||
| Total deferred tax liabilities |
(137,346 | ) | (102,722 | ) | ||||
|
|
|
|
|
|||||
| Net deferred tax assets (liabilities) |
$ | (88,735 | ) | $ | (69,193 | ) | ||
|
|
|
|
|
|||||
As of December 31, 2015 and 2014, the Company had a gross deferred tax asset of $24,463 and $0, respectively, related to U.S. alternative minimum tax credits that can be carried forward indefinitely.
As of December 31, 2015 and 2014, the Company had deferred tax assets relating to foreign tax credit carryforwards of $1,196 and $1,309, respectively, state net operating loss carryforwards of $965 and $0, respectively, and research and experimentation tax credit carryforwards of $971 and $0, respectively. The foreign tax credit carryforwards are available to be utilized through 2024. The state net operating loss carryforwards and the research and experimentation tax credit carryforwards are available to be utilized through 2035. The Company has provided a valuation allowance to reduce the carrying value of certain of these deferred tax assets, as management has concluded that, based on available evidence, it is more likely than not that the deferred tax assets will not be fully realized.
Prior to 2015, the Company asserted under ASC 740-30 (formerly APB 23) that the unremitted earnings of its foreign subsidiaries were permanently invested. Accordingly, no provision was made for U.S. deferred taxes related to future repatriation of these earnings. At December 31, 2014, and 2013, cumulative undistributed earnings of foreign subsidiaries included in consolidated retained earnings amounted to $14,003, and $12,368, respectively. In 2015, as a result of the economic downturn and the Company’s upcoming debt service requirements, the Company withdrew its indefinite reinvestment assertion for foreign
100
Table of Contents
Fairmount Santrol Holdings Inc. and Subsidiaries
Notes to Consolidated Financial Statements
Years Ended December 31, 2015, 2014, and 2013
(in thousands, except share and per share data)
subsidiaries’ unremitted earnings and provided deferred taxes of $2,553 representing the amount of the expected residual U.S. tax that will be payable upon repatriation of unremitted foreign earnings.
The Company or its subsidiaries file income tax returns in the United States, Canada, China, Mexico, and Denmark. The Company is subject to income tax examinations for its U.S. Federal income taxes for the preceding three fiscal years and, in general, is subject to state and local income tax examinations for the same periods. The Company has tax years that remain open and subject to examination by tax authorities in the following major taxing jurisdictions: Canada for years after 2010, Mexico for years after 2009, and China and Denmark for years after 2011.
A reconciliation of the beginning and ending amount of unrecognized tax benefits is as follows:
| 2015 | 2014 | 2013 | ||||||||||
| Unrecognized tax benefits balance—January 1 |
$ | 5,327 | $ | 3,038 | $ | 3,366 | ||||||
| Increases (decreases) for tax positions in prior years |
(222 | ) | 2,201 | — | ||||||||
| Increases (decreases) for tax positions in current year |
95 | 88 | 143 | |||||||||
| Lapses in statutes of limitations |
— | — | (471 | ) | ||||||||
|
|
|
|
|
|
|
|||||||
| Unrecognized tax benefits balance—December 31 |
$ | 5,200 | $ | 5,327 | $ | 3,038 | ||||||
|
|
|
|
|
|
|
|||||||
Interest and penalty amounts previously included in the reconciliation have been removed.
At December 31, 2015 and 2014, the Company had $5,200 and $5,327, respectively, of unrecognized tax benefits. If the $5,200 were recognized, $3,499 would affect the effective tax rate. Within the next twelve months, it is reasonably possible that certain statute of limitations periods would expire, which could result in a decrease of up to $2,686 in the Company’s unrecognized tax benefits. Interest and penalties are recorded in provision for income taxes. At December 31, 2015 and 2014, the Company had $1,752 and $1,365, respectively, of accrued interest and penalties related to unrecognized tax benefits recorded.
| 15. | Common Stock and Stock-Based Compensation |
The Company has a single class of par value $0.01 per share common stock. Each share of common stock has identical rights and privileges and is entitled to one vote per share. The Company has authorized, but not issued, a single class of par value $0.01 per share preferred stock.
The Company has several stock plans that allow for granting of options to acquire common shares to employees and key non-employees. As of December 31, 2013, the plans consisted of the FML Holdings, Inc. Non-Qualified Stock Option Plan (the “1997 Plan”), the Long Term Incentive Compensation Plan (the “2006 Plan”), and the FML Holdings, Inc. Stock Option Plan (the “2010 Plan”). At December 31, 2014, the 1997 Plan, the 2006 Plan, and the 2010 Plan were still in existence, and a new plan, the FMSA Holdings Inc. 2014 Long Term Incentive Plan (the “LTIP”) was added as of September 11, 2014. The LTIP authorized and issued both non-qualified stock options as well as restricted stock units (“RSU’s”).
For all stock plans, the options are exercisable for a ten year period. Options are exercisable at times determined by the compensation committee of the Company and, as set forth in each individual option agreement. The options may become exercisable over a period of years or become exercisable only if performance or other goals set by the Board are attained, or may be a combination of both. Options may be exercised, in whole or in part, at any time after becoming exercisable, but not later than the date the option expires, which is typically 10 years from the grant date. Options granted after 2009 contain a 7-year vesting period that may be shortened to five years upon attainment of certain Company performance, except for
101
Table of Contents
Fairmount Santrol Holdings Inc. and Subsidiaries
Notes to Consolidated Financial Statements
Years Ended December 31, 2015, 2014, and 2013
(in thousands, except share and per share data)
stock issued under the LTIP Plan, which has a 5-year vesting period that may be shortened to three years upon attainment of certain Company performance goals as determined by the compensation committee. The stock plans also contain a change in control provision that provides for immediate vesting upon certain changes of ownership of the company. All options granted prior to 2010 are fully vested. RSU’s granted under the LTIP vest after a 6-year period and vesting can be accelerated to four years upon attainment of certain Company performance goals as determined by the compensation committee.
The weighted-average fair value of RSU’s granted during the years ended December 31, 2015 and 2014 was $8.80 and $13.19, respectively, based on the closing price of the underlying share as of the grant date. The weighted-average fair value of options granted during the years ended December 31, 2015, 2014, and 2013 was $8.79, $8.49, and $5.35, respectively, based on the Black-Scholes-Merton options-pricing model, with the following assumptions:
| 2015 | 2014 | 2013 | ||||||||||
| Dividend yield |
0.00 | % | 0.00 | % | 0.00 | % | ||||||
| Expected volatility |
45.61 | % | 48.72 | % | 46.38 | % | ||||||
| Risk-free interest rate |
1.65 - 2.03 | % | 1.94 - 2.03 | % | 1.12 - 2.00 | % | ||||||
| Expected option life |
6.5 years | 6.5 years | 6.5 years | |||||||||
The Company has no current plans to declare a dividend that would require a dividend yield assumption other than zero. Expected volatility is based on the volatilities of various comparable companies’ common stock. Although the Company has been publicly traded since October 3, 2014, the Company does not believe the expected volatility of options can yet be computed based solely on the price of the Company’s common stock. The comparable companies were selected by analyzing public companies in the industry based on various factors including, but not limited to, company size, financial data availability, active trading volume, and capital structure. The risk-free interest rate is an interpolated rate from the U.S. constant maturity treasury rate for a term corresponding to the expected option life. Because the Company does not have sufficient historical data to provide a reasonable basis to estimate the expected life of the options, the Company uses the simplified method, which assumes the expected life is the mid-point between the vesting date and the end of the contractual term.
In determining the underlying value of the Company’s stock prior to the commencement of public trading on October 3, 2014, the company used a combination of the guideline company approach and a discounted cash flow analysis. The key assumptions in this estimate include management’s projections of future cash flows, the Company-specific cost of capital used as a discount rate, lack of marketability discount, and qualitative factors to compare the Company to comparable guideline companies. Following the Company’s IPO on October 3, 2014, the shares were valued at the closing price as of the date of issuance.
102
Table of Contents
Fairmount Santrol Holdings Inc. and Subsidiaries
Notes to Consolidated Financial Statements
Years Ended December 31, 2015, 2014, and 2013
(in thousands, except share and per share data)
The Company recorded $4,525, $16,571 and $10,133 of stock compensation expense related to these options and RSU’s, which is included in additional paid-in capital, for the years ended December 31, 2015, 2014, and 2013, respectively. Option activity during 2015 is as follows:
| Restricted Stock Units |
Weighted Average Price at RSU Issue Date |
Options | Weighted Average Exercise Price, Options |
|||||||||||||
| Outstanding at December 31, 2014 |
258,536 | $ | 13.19 | 16,106,718 | $ | 6.17 | ||||||||||
| Granted |
363,126 | 8.80 | 1,630,952 | 8.79 | ||||||||||||
| Exercised |
— | — | (519,982 | ) | 3.41 | |||||||||||
| Forfeited |
(42,278 | ) | 13.07 | (474,434 | ) | 11.04 | ||||||||||
| Expired |
— | — | (466,752 | ) | 9.53 | |||||||||||
|
|
|
|
|
|
|
|
|
|||||||||
| Outstanding at December 31, 2015 |
579,384 | $ | 10.45 | 16,276,502 | $ | 6.28 | ||||||||||
| Exercisable at December 31, 2015 |
— | $ | — | 10,695,632 | $ | 4.36 | ||||||||||
Options outstanding as of December 31, 2015 and 2014, respectively, have an aggregate intrinsic value of $4,129 and $44,094 and a weighted average remaining contractual life of 5.7 years and 6.6 years. Options that are exercisable as of December 31, 2015 and 2014, respectively, have an aggregate intrinsic value of $4,129 and $39,653 and a weighted average remaining contractual life of 4.6 years and 5.9 years. The aggregate intrinsic value represents the difference between the fair value of the Company’s shares of $2.35 per share and $6.92 per share at December 31, 2015 and 2014, respectively, and the exercise price of the dilutive options, multiplied by the number of dilutive options outstanding at that date.
The aggregate intrinsic value of stock options exercised during the years ended December 31, 2015, 2014, and 2013 was $1,839, $51,410, and $6,564, respectively.
Net cash proceeds from the exercise of stock options were $1,775, $6,540 and $1,277 in the years ended December 31, 2015, 2014, and 2013, respectively.
There was $656, $16,143, and $2,461 of income tax benefits realized from stock option exercises in the years ended December 31, 2015, 2014, and 2013, respectively.
At December 31, 2015, options to purchase 16,276,502 common shares were outstanding at a range of exercise prices of $1.43 to $20.52 per share. At December 31, 2014, options to purchase 16,106,728 common shares were outstanding at a range of exercise prices of $1.43 to $20.52 per share. As of December 31, 2015, $17,272 of unrecognized compensation cost related to non-vested stock options and RSU’s is expected to be recognized over a weighted-average period of approximately 4.2 remaining years. As of December 31, 2014, $19,874 of unrecognized compensation cost related to non-vested stock options and RSU’s is expected to be recognized over a weighted-average period of approximately 4.0 remaining years.
| 16. | Defined Benefit Plans |
The Company maintained two defined benefit pension plans covering union employees at certain facilities that provide benefits based upon years of service or a combination of employee earnings and length of service. The plans were underfunded by $2,199 and $2,249 as of December 31, 2015 and 2014, respectively.
103
Table of Contents
Fairmount Santrol Holdings Inc. and Subsidiaries
Notes to Consolidated Financial Statements
Years Ended December 31, 2015, 2014, and 2013
(in thousands, except share and per share data)
The following assumptions were used to determine the Company’s obligations under the plans:
| Wedron Pension | Troy Grove Pension | |||||||||||||||
| 2015 | 2014 | 2015 | 2014 | |||||||||||||
| Discount rate |
3.75 | % | 3.75 | % | 4.00 | % | 4.00 | % | ||||||||
| Long-term rate of return on plan assets |
7.50 | % | 9.00 | % | 7.50 | % | 9.00 | % | ||||||||
The difference in the discount rates used for the Wedron Pension and the Troy Grove Pension is due to the differing characteristics of the two plans, including employee characteristics and plan size. The Company uses a cash flow matching approach to determine its discount rate using each plan’s projected cash flows and the Citigroup Discount Curve.
The long term rate of return on assets is based on management’s estimate of future long term rates of return on similar assets and is consistent with historical returns on such assets.
The written investment policy for the pension plans includes a target allocation of about 70% in equities and 30% in fixed income investments. Only high-quality diversified securities similar to stocks and bonds are used. Higher-risk securities or strategies (such as derivatives) are not currently used but could be used incidentally by mutual funds held by the plan. The pension plans’ obligations are long-term in nature and the investment policy is therefore focused on the long-term. Goals include achieving gross returns at least equal to relevant indices. Management and the plans’ investment advisor regularly review and discuss investment performance, adherence to the written investment policy, and the investment policy itself.
Benefits under the Wedron plan were frozen effective December 31, 2012. The following relates to the defined benefit plans as of December 31, 2015 and 2014:
| 2015 | 2014 | |||||||
| Change in benefit obligation |
||||||||
| Benefit obligation at beginning of year |
$ | 9,146 | $ | 7,418 | ||||
| Service cost |
108 | 74 | ||||||
| Interest cost |
340 | 332 | ||||||
| Actuarial (gain) loss |
(525 | ) | 1,568 | |||||
| Benefit payments |
(257 | ) | (246 | ) | ||||
|
|
|
|
|
|||||
| Benefit obligation at end of year |
$ | 8,812 | $ | 9,146 | ||||
| Change in plan assets |
||||||||
| Fair value of plan assets at beginning of year |
$ | 6,897 | $ | 6,492 | ||||
| Actual return on plan assets |
(90 | ) | 454 | |||||
| Employer contributions |
63 | 197 | ||||||
| Benefit payments |
(257 | ) | (246 | ) | ||||
|
|
|
|
|
|||||
| Fair value of plan assets at end of year |
$ | 6,613 | $ | 6,897 | ||||
|
|
|
|
|
|||||
| Accrued benefit cost |
$ | (2,199 | ) | $ | (2,249 | ) | ||
|
|
|
|
|
|||||
The accrued benefit cost is included in the Consolidated Balance Sheets in other long-term liabilities.
104
Table of Contents
Fairmount Santrol Holdings Inc. and Subsidiaries
Notes to Consolidated Financial Statements
Years Ended December 31, 2015, 2014, and 2013
(in thousands, except share and per share data)
The following relates to the defined benefit plans for the years ended December 31, 2015, 2014, and 2013, respectively:
| Year Ended December 31, | ||||||||||||
| 2015 | 2014 | 2013 | ||||||||||
| Components of net periodic benefit cost |
||||||||||||
| Service cost |
$ | 108 | $ | 74 | $ | 86 | ||||||
| Interest cost |
340 | 332 | 300 | |||||||||
| Expected return on plan assets |
(508 | ) | (585 | ) | (503 | ) | ||||||
| Amortization of prior service cost |
16 | 19 | 19 | |||||||||
| Amortization of net actuarial loss |
280 | 159 | 253 | |||||||||
|
|
|
|
|
|
|
|||||||
| Net periodic benefit cost |
$ | 236 | $ | (1 | ) | $ | 155 | |||||
|
|
|
|
|
|
|
|||||||
| Year Ended December 31, | ||||||||||||
| 2015 | 2014 | 2013 | ||||||||||
| Changes in other comprehensive income (loss) |
||||||||||||
| Net actuarial gain (loss) |
$ | (75 | ) | $ | (1,699 | ) | $ | 1,189 | ||||
| Amortization of prior service cost |
16 | 16 | 19 | |||||||||
| Amortization of net actuarial loss |
280 | 164 | 253 | |||||||||
| Deferred tax asset |
(124 | ) | 569 | (565 | ) | |||||||
|
|
|
|
|
|
|
|||||||
| Other comprehensive income (loss) |
$ | 97 | $ | (950 | ) | $ | 896 | |||||
|
|
|
|
|
|
|
|||||||
Pension expense for such plans totaled $236 and $155 for the years ended December 31, 2015 and 2013, respectively. Pension income for such plans totaled $1 for the year ended December 31, 2014.
The net actuarial loss and prior service cost that the Company expects will be amortized from accumulated other comprehensive loss into periodic benefit cost in the year ending December 31, 2016, are $267 and $1, respectively.
Benefits expected to be paid out over the next ten years:
| Year Ending |
Benefit Payment |
|||
| 2016 |
$ | 336 | ||
| 2017 |
373 | |||
| 2018 |
411 | |||
| 2019 |
437 | |||
| 2020 |
470 | |||
| 2021-2025 |
2,625 | |||
105
Table of Contents
Fairmount Santrol Holdings Inc. and Subsidiaries
Notes to Consolidated Financial Statements
Years Ended December 31, 2015, 2014, and 2013
(in thousands, except share and per share data)
Fair value measurements for assets held in the benefit plans as of December 31, 2015 are as follows:
| Quoted Prices in Active Markets (Level 1) |
Other Observable Inputs (Level 2) |
Unobservable Inputs (Level 3) |
Balance at December 31, 2015 |
|||||||||||||
| Cash |
$ | 100 | $ | — | $ | — | $ | 100 | ||||||||
| Fixed income |
1,881 | — | — | 1,881 | ||||||||||||
| Mutual funds |
4,633 | — | — | 4,633 | ||||||||||||
|
|
|
|
|
|
|
|
|
|||||||||
| $ | 6,614 | $ | — | $ | — | $ | 6,614 | |||||||||
|
|
|
|
|
|
|
|
|
|||||||||
| 17. | Other Benefit Plans |
Certain union employees participate in a multiemployer defined benefit pension plan under which monthly contributions are made by the Company based upon payroll costs as governed by the collective bargaining agreement. The risks of participating in a multiemployer plan are different from a single-employer plan in the following aspects (a) assets contributed to the multiemployer plan by one employer may be used to provide benefits to employees of other participating employers; (b) if a participating employer stops contributing to the plan, the unfunded obligations of the plan may be borne by the remaining participating employers; and (c) if the Company chooses to stop participating in the multiemployer plan, the Company may be required to pay the multiemployer plan an amount based on the underfunded status of the multiemployer plan, referred to as a withdrawal liability. As part of its recent efficiency and cost-reduction initiatives, the Company has closed these facilities and has recorded its estimated withdrawal liability from the plans in the amount of $5,276 in the year ended December 31, 2015.
The Company has a defined contribution plan (401(k) Plan) covering substantially all employees. Under the provisions of the 401(k) Plan, the Company matches 50% of each employee’s contribution up to 5% of an employee’s annual salary. Company match contributions were $1,191, $1,179, and $965 for the years ended December 31, 2015, 2014, and 2013, respectively. Included in these contributions are Company contributions to the 401(k) Plan for Wedron Silica union members, which were $352, $315, and $266 for the years ended December 31, 2015, 2014, and 2013 respectively.
The Company previously maintained an Employee Stock Bonus Plan (ESBP). This plan covered substantially all non-union employees. Discretionary contributions accrued at December 31, 2014 were $4,295. Participant accounts in the Employee Stock Bonus Plan held 6,903,326 of common stock shares of the Company as of December 31, 2014. The Company, as plan sponsor, merged the ESBP with the 401(K) Plan as of January 1, 2015. All of the assets of the ESBP were rolled over and credited to plan accounts in the 401(k) Plan. The Company may, at its discretion, make additional contributions, which are determined in part based on the Company’s return on investable assets, to the Plan. Discretionary contributions accrued at December 31, 2015 were $1,223. Participant accounts in the 401(k) Plan held 6,433,727 of common stock shares of the Company as of December 31, 2015.
Effective January 1, 1999, the Company adopted a Supplemental Executive Retirement Plan (SERP) for certain employees who participate in the Company’s 401(k) Plan and/or the Employee Stock Bonus Plan (ESBP). The purpose of the SERP is to provide an opportunity for the participants of the SERP to defer compensation and to receive their pro rata share of former ESBP contributions. Due to income restrictions imposed by the IRS code, such contributions were formerly made to the ESBP but, in some instances, were forfeited by these employees to the remaining ESBP participant accounts. Accrued Company contributions to the SERP were $60 and $151 for the years ended December 31, 2015 and 2014, respectively.
106
Table of Contents
Fairmount Santrol Holdings Inc. and Subsidiaries
Notes to Consolidated Financial Statements
Years Ended December 31, 2015, 2014, and 2013
(in thousands, except share and per share data)
The Company has deferred compensation agreements with various management employees that provide for supplemental payments upon retirement. These amounts are being accrued for over the estimated employment periods of these individuals.
| 18. | Self-Insured Plans |
Certain subsidiaries, located in Illinois and Michigan, are self-insured for workers’ compensation up to $1,000 per occurrence and $3,000 in the aggregate. The Company has an accrued liability of $463 and $388 as of December 31, 2015 and 2014, respectively, for anticipated future payments on claims incurred to date. Management believes these amounts are adequate to cover all required payments.
The Company is also self-insured for medical benefits. The Company has an accrued liability of $4,048 and $3,506 as of December 31, 2015 and 2014, respectively, for anticipated future payments on claims incurred to date. Management believes this amount is adequate to cover all required payments.
| 19. | Commitments and Contingencies |
The Company has entered into numerous mineral rights agreements, in which payments under the agreements are expensed as incurred. Certain agreements require annual payments while other agreements require payments based upon annual tons mined and others a combination thereof. Total royalty expense associated with these agreements was $1,899, $3,786, and $1,818 for the years ended December 31, 2015, 2014, and 2013, respectively.
The Company leases certain machinery, equipment (including railcars), buildings, and office space under operating lease arrangements. Total rent expense associated with these leases was $67,745, $56,247, and $34,195 for the years ended December 31, 2015, 2014, and 2013, respectively.
Minimum lease payments, primarily for railcars, equipment, and office leases, due under the long-term operating lease obligations are shown below. The table below includes railcar leases, which comprise substantially all of the Company’s equipment lease obligations, as well as purchase commitments for guaranteed minimum payments for certain third party terminal operators:
| Equipment | Real Estate | Total | ||||||||||
| 2016 |
$ | 57,536 | $ | 8,015 | $ | 65,551 | ||||||
| 2017 |
47,402 | 7,222 | 54,624 | |||||||||
| 2018 |
39,610 | 5,453 | 45,063 | |||||||||
| 2019 |
25,408 | 4,480 | 29,888 | |||||||||
| 2020 |
13,291 | 3,964 | 17,255 | |||||||||
| Thereafter |
46,579 | 7,549 | 54,128 | |||||||||
|
|
|
|
|
|
|
|||||||
| Total |
$ | 229,826 | $ | 36,683 | $ | 266,509 | ||||||
|
|
|
|
|
|
|
|||||||
The Company is subject to a contingent consideration arrangement related to the purchase of Self-Suspending Proppant LLC (“SSP”), which was accounted for as an acquisition of a group of assets. The contingent consideration is based on a fixed percentage of the cumulative product margin, less certain adjustments, generated by sales of Propel SSP and other products incorporating SSP technology for the five years commencing on October 1, 2015. Because the earnout is dependent on future sales and the related cost of sales, the amounts of which are highly uncertain, it is not currently possible to estimate the amounts that will be paid. Therefore, the Company entered into an Amendment to this agreement on December 17, 2015.
107
Table of Contents
Fairmount Santrol Holdings Inc. and Subsidiaries
Notes to Consolidated Financial Statements
Years Ended December 31, 2015, 2014, and 2013
(in thousands, except share and per share data)
This Amendment (a) extends the period during which the aggregate earnout payments must equal or exceed $45,000 from the two-year period ending October 1, 2017 until the three-year period ending October 1, 2018; and (b) provides that the aggregate earnout payments during the two-year period ending October 1, 2017 must equal or exceed $15,000 and granted the Seller a security interest in 51% of the equity interests in the Company to secure such $15,000. The Amendment does not alter the final threshold earnout amount, which continues to be $195,000 (inclusive of the $45,000 payment, if any) by October 1, 2020. The contingent consideration will be accrued and capitalized as part of the cost of the SSP assets at the time a payment is probable and reasonably estimable.
Certain subsidiaries are defendants in lawsuits in which the alleged injuries are claimed to be silicosis-related and to have resulted, in whole or in part, from exposure to silica-containing products, allegedly including those sold by certain subsidiaries. In the majority of cases, there are numerous other defendants. The defense of these actions has been tendered to and the cases are being defended by the subsidiaries’ insurance carriers, although the Company does retain a small portion of the defense costs. Management believes that the Company’s substantial level of existing and available insurance coverage combined with various open indemnities is more than sufficient to cover any exposure to silicosis-related expenses. An estimate of the possible loss, if any, cannot be made at this time.
In December 2015, the Company was notified by the Securities and Exchange Commission (the “SEC”) that it was being investigated for possible violations of the Foreign Corrupt Practices Act (the “FCPA”) and other securities laws relating to matters concerning certain of our international operations. The Company had previously retained outside legal counsel to investigate the subject matter of the SEC’s investigation, and at that time, the Company determined that no further action was necessary. The Company cannot predict what, if any, further action the SEC may take regarding its investigation, and cannot provide an estimate of the potential costs of the SEC’s investigation or any possible fines, penalties, or other remedial actions that might result, if any, at this time.
| 20. | Transactions with Related Parties |
The Company had purchases from an affiliated entity for freight, logistic services and consulting services related to its operations in China of $288, $2,902, and $1,382 in the years ended December 31, 2015, 2014, and 2013, respectively. The Company had purchases from an affiliated entity for material purchases related to its operations in China of $62, $44, and $32 in the years ended December 31, 2015, 2014, and 2013 respectively.
The Company paid management fees of $0, $825, and $2,821 in the years ended December 31, 2015, 2014, and 2013, respectively. Concurrent with the Company’s initial public offering on October 3, 2014, the Company no longer pays a management fee to American Securities LLC.
| 21. | Segment Reporting |
The Company organizes its business into two reportable segments, Proppant Solutions and Industrial & Recreational Products. The reportable segments are consistent with how management views the markets served by the Company and the financial information reviewed by the chief operating decision maker in deciding how to allocate resources and assess performance.
The chief operating decision maker primarily evaluates an operating segment’s performance based on segment contribution margin, which excludes certain corporate costs not associated with the operations of the segment. These corporate costs are separately stated below and include costs that are related to
108
Table of Contents
Fairmount Santrol Holdings Inc. and Subsidiaries
Notes to Consolidated Financial Statements
Years Ended December 31, 2015, 2014, and 2013
(in thousands, except share and per share data)
functional areas such as operations management, corporate purchasing, accounting, treasury, information technology, legal and human resources.
Included in segment contribution margin for the year ended December 31, 2015 are Proppant Solutions restructuring and other charges of $12,325, Industrial & Recreational Products restructuring and other charges of $13,508, and Proppant Solutions goodwill impairment of $69,246. There were no such charges for the years ended December 31, 2014 and 2013, respectively.
| Year Ended December 31, | ||||||||||||
| 2015 | 2014 | 2013 | ||||||||||
| Revenue |
||||||||||||
| Proppant Solutions |
$ | 710,083 | $ | 1,232,232 | $ | 856,212 | ||||||
| Industrial & Recreational Products |
118,626 | 124,226 | 132,174 | |||||||||
|
|
|
|
|
|
|
|||||||
| Total revenue |
828,709 | 1,356,458 | 988,386 | |||||||||
| Segment contribution margin |
||||||||||||
| Proppant Solutions |
70,810 | 430,779 | 296,320 | |||||||||
| Industrial & Recreational Products |
25,249 | 34,473 | 34,765 | |||||||||
|
|
|
|
|
|
|
|||||||
| Total segment contribution margin |
96,059 | 465,252 | 331,085 | |||||||||
| Operating expenses excluded from segment contribution margin |
||||||||||||
| Cost of sales |
— | — | 4,959 | |||||||||
| Selling, general, and administrative |
53,118 | 74,475 | 47,440 | |||||||||
| Depreciation, depletion, and amortization |
66,754 | 59,379 | 37,771 | |||||||||
| Stock compensation expense |
4,525 | 16,571 | 10,133 | |||||||||
| Corporate restructuring charges and other operating expense |
2,299 | 3,163 | 2,826 | |||||||||
| Interest expense, net |
62,242 | 60,842 | 61,926 | |||||||||
| Loss on extinguishment of debt |
— | — | 11,760 | |||||||||
| Other non-operating expense |
990 | 2,786 | 4,394 | |||||||||
|
|
|
|
|
|
|
|||||||
| Income (loss) before provision for income taxes |
$ | (93,869 | ) | $ | 248,036 | $ | 149,876 | |||||
|
|
|
|
|
|
|
|||||||
Total assets reported in the Proppant Solutions segment were $1,152,110 and $1,271,700 as of December 31, 2015 and 2014, respectively. Total assets reported in the I&R segment were $116,825 and $63,270 as of December 31, 2015 and 2014, respectively.
The Company’s two largest customers, Halliburton and FTSI, accounted for 25% and 18%, 19% and 16%, and 19% and 11% of consolidated net sales in the years ended December 31, 2015, 2014, and 2013, respectively. These customers are part of the Company’s Proppant Solutions segment.
| 22. | Restructuring and Other Charges |
As a result of recent challenging conditions in the energy market, the Company has taken actions to adjust its overall operational footprint and reduce selling, general and administrative costs. The restructuring program primarily consists of workforce reductions and idling and closing of surplus facilities. The expected completion date of these activities is December 31, 2015, although a continued sustained downturn in the oil and gas market could extend the duration of this restructuring process. A summary of the
109
Table of Contents
Fairmount Santrol Holdings Inc. and Subsidiaries
Notes to Consolidated Financial Statements
Years Ended December 31, 2015, 2014, and 2013
(in thousands, except share and per share data)
restructuring and other costs recognized for the year ended December 31, 2015 is presented in the table below. There were no such charges in the years ended December 31, 2014 and 2013, respectively.
| Year Ended December 31, |
||||
| 2015 | ||||
| Restructuring and other charges |
||||
| Workforce reduction costs, including one-time severance payments |
$ | 1,682 | ||
| Write-down to net realizable value of exited facilities and other capitalized costs |
19,393 | |||
| Other exit costs, including multiemployer pension plan withdrawal liability and additional cash costs to exit facilities |
6,376 | |||
|
|
|
|||
| Total restructuring and other charges |
$ | 27,451 | ||
|
|
|
|||
As a result of these actions, the Company has determined that certain of the impacted facilities in the Proppant Solutions segment will not be necessary for ongoing operations and management has made the decision to offer the facilities for sale. The assets and liabilities of these facilities have been reclassified in the Consolidated Balance Sheets as assets held-for-sale.
While these restructuring activities primarily were driven by the decline in proppant demand in 2015, certain plants supporting the Industrial & Recreational Products segment have been adversely impacted as well. A summary of the restructuring and other costs by operating segment for the year ended December 31, 2015 is as follows:
| Year Ended December 31, |
||||
| 2015 | ||||
| Restructuring and other charges |
||||
| Proppant Solutions |
$ | 12,325 | ||
| Industrial & Recreational Products |
13,508 | |||
| Corporate |
1,618 | |||
|
|
|
|||
| Total restructuring and other charges |
$ | 27,451 | ||
|
|
|
|||
As a result of challenging conditions in the proppant market, the Company has made the decision to sell certain of its operations in the Proppant Solutions segment that it views as surplus to its business. These assets are classified as held-for-sale and have been marked down to their estimated fair values as of December 31, 2015.
110
Table of Contents
Fairmount Santrol Holdings Inc. and Subsidiaries
Notes to Consolidated Financial Statements
Years Ended December 31, 2015, 2014, and 2013
(in thousands, except share and per share data)
| 23. | Geographic Information |
The following tables show total Company revenues and long-lived assets. Revenues are attributed to geographic regions based on the selling location. Long-lived assets are located in the respective geographic regions.
| Year Ended December 31, | ||||||||||||
| 2015 | 2014 | 2013 | ||||||||||
| Revenue |
||||||||||||
| Domestic |
$ | 798,750 | $ | 1,254,071 | $ | 920,636 | ||||||
| International |
29,959 | 102,387 | 67,750 | |||||||||
|
|
|
|
|
|
|
|||||||
| Total revenue |
$ | 828,709 | $ | 1,356,458 | $ | 988,386 | ||||||
|
|
|
|
|
|
|
|||||||
| December 31, 2015 |
December 31, 2014 |
|||||||
| Long-lived assets |
||||||||
| Domestic |
$ | 867,352 | $ | 832,280 | ||||
| International |
3,645 | 8,994 | ||||||
|
|
|
|
|
|||||
| Long-lived assets |
$ | 870,997 | $ | 841,274 | ||||
|
|
|
|
|
|||||
| 24. | Quarterly Financial Data (Unaudited) |
The following tables set forth the Company’s unaudited quarterly consolidated statements of operations for each of the last four quarters for the periods ended December 31, 2015 and 2014. This unaudited quarterly information has been prepared on the same basis as the Company’s annual audited financial statements and includes all adjustments, consisting only of normal recurring adjustments that are necessary to present fairly the financial information for the fiscal quarters presented.
| First Quarter | Second Quarter | Third Quarter | Fourth Quarter | |||||||||||||
| 2015: |
||||||||||||||||
| Revenue |
$ | 301,490 | $ | 221,323 | $ | 170,950 | $ | 134,946 | ||||||||
| Cost of sales |
202,548 | 165,130 | 131,679 | 109,488 | ||||||||||||
| Operating expenses |
41,813 | 53,835 | 39,828 | 114,199 | ||||||||||||
| Interest expense, net |
15,308 | 14,894 | 15,963 | 16,077 | ||||||||||||
| Other non-operating expense (income) |
324 | — | 1,492 | — | ||||||||||||
| Provision (benefit) for income taxes |
10,617 | (26,677 | ) | 28,117 | (13,996 | ) | ||||||||||
|
|
|
|
|
|
|
|
|
|||||||||
| Net income (loss) |
30,880 | 14,141 | (46,129 | ) | (90,822 | ) | ||||||||||
| Less: Net income attributable to the non-controlling interest |
121 | 4 | 71 | 9 | ||||||||||||
|
|
|
|
|
|
|
|
|
|||||||||
| Net income (loss) attributable to Fairmount Santrol Holdings Inc. |
30,759 | 14,137 | (46,200 | ) | (90,831 | ) | ||||||||||
|
|
|
|
|
|
|
|
|
|||||||||
| Earnings per share, basic |
$ | 0.19 | $ | 0.09 | $ | (0.29 | ) | $ | (0.56 | ) | ||||||
| Earnings per share, diluted |
$ | 0.18 | $ | 0.08 | $ | (0.29 | ) | $ | (0.56 | ) | ||||||
| Weighted average number of shares outstanding, basic |
160,948,858 | 161,368,468 | 161,413,045 | 161,433,248 | ||||||||||||
| Weighted average number of shares outstanding, diluted |
166,330,707 | 166,866,817 | 161,413,045 | 161,433,248 | ||||||||||||
111
Table of Contents
Fairmount Santrol Holdings Inc. and Subsidiaries
Notes to Consolidated Financial Statements
Years Ended December 31, 2015, 2014, and 2013
(in thousands, except share and per share data)
| First Quarter | Second Quarter | Third Quarter | Fourth Quarter | |||||||||||||
| 2014: |
||||||||||||||||
| Revenue |
$ | 294,932 | $ | 334,291 | $ | 373,479 | $ | 353,756 | ||||||||
| Cost of sales |
191,112 | 211,190 | 228,583 | 220,569 | ||||||||||||
| Operating expenses |
36,745 | 43,930 | 50,525 | 62,140 | ||||||||||||
| Interest expense, net |
17,906 | 16,572 | 16,567 | 9,797 | ||||||||||||
| Other non-operating expense |
291 | 250 | 2,206 | 39 | ||||||||||||
| Provision for income taxes |
14,266 | 18,146 | 21,436 | 23,565 | ||||||||||||
|
|
|
|
|
|
|
|
|
|||||||||
| Net income |
34,612 | 44,203 | 54,162 | 37,646 | ||||||||||||
| Less: Net income (loss) attributable to the non-controlling interest |
73 | 282 | 85 | (267 | ) | |||||||||||
|
|
|
|
|
|
|
|
|
|||||||||
| Net income attributable to Fairmount Santrol Holdings Inc. |
34,539 | 43,921 | 54,077 | 37,913 | ||||||||||||
|
|
|
|
|
|
|
|
|
|||||||||
| Earnings per share, basic |
$ | 0.22 | $ | 0.28 | $ | 0.34 | $ | 0.24 | ||||||||
| Earnings per share, diluted |
$ | 0.21 | $ | 0.27 | $ | 0.32 | $ | 0.23 | ||||||||
| Weighted average number of shares outstanding, basic |
156,462,356 | 156,684,036 | 158,049,782 | 160,542,636 | ||||||||||||
| Weighted average number of shares outstanding, diluted |
165,082,614 | 165,642,288 | 166,911,474 | 167,025,422 | ||||||||||||
Operating expenses include restructuring and other charges of $324, $14,824, $4,453, and $7,850 for the three months ended March 31, June 30, September 30, and December 31, 2015, respectively. Also included in operating expenses is goodwill impairment of $69,246 for the three months ended December 31, 2015. There were no such expenses in the year ended December 31, 2014.
During the fourth quarter of 2015, the Company recorded $2,124 of depreciation that should have been recorded in prior periods. The depreciation expense in the second and third quarters of 2015 should have been $623 and $1,473 higher, respectively. These amounts are not considered material to the individual periods and have no impact on the full year.
112
Table of Contents
ITEM 9. CHANGES IN AND DISAGREEMENTS WITH ACCOUNTANTS ON ACCOUNTING AND FINANCIAL DISCLOSURE
None.
ITEM 9A. CONTROLS AND PROCEDURES
Evaluation of Disclosure of Controls and Procedures
Our management, with the participation of our Chief Executive Officer and Interim Chief Financial Officer, evaluated the effectiveness of our disclosure controls and procedures (as defined in Rules 13a-15(e) and 15d-15(e) under the Exchange Act of 1934, as amended). Based on such evaluation, our Chief Executive Officer and Interim Chief Financial Officer have concluded that our disclosure controls and procedures were effective as December 31, 2015.
Management’s Report on Internal Control over Financial Reporting
Management is responsible for establishing and maintaining adequate internal control over financial reporting as such term is defined in Exchange Act Rule 13a-15(f). Under the supervision and with the participation of the Chief Executive Office and the Interim Chief Financial Officer, we conducted an evaluation of the system of internal control over financial reporting based on criteria specified in Internal Control – Integrated Framework (2013) issued by the Committee of Sponsoring Organizations of the Treadway Commission (“COSO”). Based upon the evaluation under the COSO framework, management concluded that our internal control over financial reporting was effective as of December 31, 2015.
The effectiveness of our internal control over financial reporting has been audited by PricewaterhouseCoopers LLP, an independent registered public accounting firm, as stated in their report which appears herein.
Changes in Internal Control over Financial Reporting
There have been no changes in internal control over financial reporting during the quarter ended December 31, 2015 that have materially affected, or are reasonably likely to materially affect, our internal control over financial reporting.
None.
113
Table of Contents
Except as set forth below, the information required by Items 10, 11, 12, 13 and 14 will appear in the Company’s Proxy Statement for the Annual Meeting of Stockholders to be held on May 5, 2016, which will be filed on April 7, 2016 pursuant to Regulation 14A under the Securities Exchange Act of 1934 and is incorporated by reference in this Report pursuant to General Instruction G(3) of Form 10-K (other than the portions thereof not deemed to be “filed” for the purpose of Section 18 of the Securities Exchange Act of 1934).
The information set forth below is provided as required by Item 10 and the listing standards of the NYSE.
The following table sets forth information with respect to our current executive officers, including their ages, as of March 10, 2016. There are no family relationships between any of our executive officers.
| Name |
Age | Position | ||||
| Jenniffer D. Deckard |
50 | President and Chief Executive Officer | ||||
| Mark E. Barrus |
54 | Interim Chief Financial Officer | ||||
| Gerald L. Clancey |
46 | Executive Vice President, Chief Commercial Officer | ||||
| Joseph D. Fodo |
59 | Executive Vice President, Chief Operating Officer | ||||
| Brian J. Richardson |
43 | Executive Vice President, Chief People Officer | ||||
| George Magaud |
52 | Executive Vice President, Chief Strategy & Innovation Officer | ||||
| David J. Crandall |
49 | Senior Vice President, General Counsel and Secretary | ||||
Executive Officers of the Registrant
Jenniffer D. Deckard, age 50, has served as President, Chief Executive Officer, and Director of Fairmount Santrol since 2013. Previously, Ms. Deckard served as President from January 2011 until May 2013, Vice President of Finance and Chief Financial Officer from 1999 until 2011, Corporate Controller from 1996 to 1999, and Accounting Manager from 1994 until 1996. In her local community, Ms. Deckard serves on the boards of the Cleveland Foundation, the Chardon Healing Fund, and the First Tee of Cleveland. She also serves on the Case Western Weatherhead School of Management’s Visiting Committee and the Board of Directors for the Fairmount Santrol Foundation. Ms. Deckard received a B.S. from the University of Tulsa and an M.B.A. from Case Western Reserve University.
Mark E. Barrus, age 54, has served as Interim Chief Financial Officer since October 20, 2015. In this role, he serves as the Company’s interim principal financial officer and interim principal accounting officer. Mr. Barrus joined the Company in 2014 as Vice President of Accounting and Controls, where he was responsible for external reporting, internal controls, compliance, and taxation. Prior to joining the Company, he was Vice President, Controller, and Principal Accounting Officer at NACCO Industries from 2013 to 2014. Before joining NACCO, Mr. Barrus was with KPMG LLP where he had been a partner since 2002. Mr. Barrus earned both his B.S. and M. Acc. degrees with honors from Case Western Reserve University. He is a Certified Public Accountant in the State of Ohio.
Gerald L. Clancey, age 46, has served as Executive Vice President, Chief Commercial Officer since 2015. In this role, he has responsibility for Domestic and International Sales into the Proppant and Industrial & Recreation channels as well as leadership for Supply Chain and Logistics. Previously, Mr. Clancey served as Executive Vice President of Supply Chain and I&R since 2011 and Vice President of Sales for I&R from 2002 to 2011. He served as General Sales Manager for the Company’s TechniSand resin-coated foundry division from 1998 to 2002. He was President for the Foundry Educational Foundation and served several terms on the Board of Directors. Mr. Clancey received a B.S. from Kent State University and an M.B.A. from the University of Notre Dame.
Joseph D. Fodo, age 59, has served as Executive Vice President and Chief Operating Officer since January 2011. Previously, Mr. Fodo served as Vice President of Operations from January 2002 until January 2011 and Director of Operations and Vice President of Operations within the Industrial Sand Division, from October 1999 until
114
Table of Contents
January 2002. Prior to joining the Company, Mr. Fodo was Vice President of Operations for Oglebay Norton. He currently serves as the Chairman of the Sustainable Development Task Force for The Industrial Minerals Association of North America. Mr. Fodo received a B.S. in mining engineering from The Ohio State University.
Brian J. Richardson, age 43, has served as Executive Vice President, Chief People Officer since 2015. Prior to joining the Company, Mr. Richardson worked for The Sherwin-Williams Company and held various management positions from 2003 to 2015, most recently Sr. Vice President of Human Resources for the Global Finishes Group. Mr. Richardson serves on the National Board of Directors of the Alzheimer’s Association. In his local community, he serves on the board of the United Way of Greater Cleveland, where he is a member of the Executive Committee and Chair of the Human Resources Committee. Mr. Richardson received a B.A. in Business Administration from Baldwin-Wallace College and M.B.A. from The Ohio State University.
George Magaud, age 52, has served as Executive Vice President, Chief Strategy & Innovation Officer since 2015. In this role, he leads the Company’s Strategic Development efforts as well as the Marketing and R&D organizations. Prior to this, he served as Executive Vice President, Strategic Development since joining the Company in 2014. Previously, Mr. Magaud worked for Lafarge S.A. (now LafargeHolcim) from 1996 to 2014, where he held both domestic and international positions in Strategy and Business Development, Marketing, Product Development, and Operations, most recently Vice President of Strategy and Development for North America. Mr. Magaud received his undergraduate degree from Yale University and a business degree from Institut d’Etudes Politiques de Paris.
David J. Crandall, age 49, has served as a vice president and General Counsel and Secretary since he joined the company in 2011. Previously, he was a partner at Calfee, Halter & Griswold, L.L.P, where he practiced general corporate and merger and acquisition law. Mr. Crandall serves on the Board of Directors of the Cleveland Rape Crisis Center. He graduated Phi Beta Kappa, magna cum laude, with a B.S. in economics from Allegheny College, and graduated cum laude from the Syracuse University College of Law.
Michael F. Biehl, age 60; on March 3, 2016, the Company announced that Michael F. Biehl will join the Company as Executive Vice President and Chief Financial Officer, effective no later than May 1, 2016. Mr. Biehl has served since 2001 as the Chief Financial Officer of Chart Industries, Inc. (“Chart”), a diversified global manufacturer of equipment for the industrial gas, energy and biomedical industries. Mr. Biehl also served as Chart’s Executive Vice President since April 2006, Chief Accounting Officer from October 2002 until March 2006, and Treasurer from July 2001 until December 2008 and from August 2010 until May 2014. Prior to joining Chart, Mr. Biehl was Vice President, Finance and Treasurer at the former Oglebay Norton Company, an industrial minerals mining, processing and transportation company. Prior to his service at the Oglebay Norton Company, Mr. Biehl worked in the audit practice of Ernst & Young LLP in Cleveland, Ohio from 1978 to 1992. Mr. Biehl received a B.B.A. in Accounting from Ohio University and M.B.A. from Northwestern University. He is a Certified Public Accountant in the State of Ohio.
115
Table of Contents
| ITEM 15. | EXHIBITS AND FINANCIAL STATEMENT SCHEDULES |
The following documents are filed as part of this Annual Report on Form 10-K:
| A) | The consolidated financial statements of Fairmount Santrol Holdings Inc. and Subsidiaries contained in Part II, Item 8 of the Annual Report on Form 10-K: |
| • | Consolidated Statements of Income (Loss) for the years ended December 31, 2015, 2014, and 2013 |
| • | Consolidated Statements of Comprehensive Income (Loss) for the years ended December 31, 2015, 2014, and 2013 |
| • | Consolidated Balance Sheets as of December 31, 2015 and 2014 |
| • | Consolidated Statements of Equity for the years ended December 31, 2015, 2014, and 2013 |
| • | Consolidated Statements of Cash Flows for the years ended December 31, 2015, 2014, and 2013 |
| B) | Schedule II – Valuation and Qualifying Accounts and Reserves for the years ended December 31, 2015, 2014, and 2013, contained on page 118 of this Annual Report on Form 10-K |
| C) | The exhibits listed in the Exhibit Index beginning on page 119 of this Annual Report on Form 10-K |
116
Table of Contents
Pursuant to the requirements of Section 13 or 15(d) of the Securities Exchange Act of 1934, the registrant has duly caused this report to be signed on its behalf by the undersigned, thereunto duly authorized on March 15, 2016.
| FAIRMOUNT SANTROL HOLDINGS INC. | ||
| By: | /s/ Jenniffer D. Deckard | |
| Jenniffer D. Deckard | ||
| President, Chief Executive Officer | ||
Pursuant to the requirements of the Exchange Act of 1934, this report has been signed below by the following persons on behalf of the registrant and in the capacities and on the dates indicated.
| Name |
Title |
Date | ||
| /s/ Jenniffer D. Deckard Jenniffer D. Deckard |
President, Chief Executive Officer, and Director (Principal Executive Officer) |
March 15, 2016 | ||
| /s/ Mark E. Barrus Mark E. Barrus |
Interim Chief Financial Officer and Principal Accounting Officer (Principal Financial and Accounting Officer) |
March 15, 2016 | ||
| /s/ William E. Conway William E. Conway |
Director | March 15, 2016 | ||
| /s/ Michael G. Fisch Michael G. Fisch |
Director | March 15, 2016 | ||
| /s/ Charles D. Fowler Charles D. Fowler |
Director | March 15, 2016 | ||
| /s/ Stephen J. Hadden Stephen J. Hadden |
Director | March 15, 2016 | ||
| /s/ Michael C. Kearney Michael C. Kearney |
Director | March 15, 2016 | ||
| /s/ William P. Kelly William P. Kelly |
Director | March 15, 2016 | ||
| /s/ Matthew F. LeBaron Matthew F. LeBaron |
Director | March 15, 2016 | ||
| /s/ Michael E. Sand Michael E. Sand |
Director | March 15, 2016 | ||
| /s/ Lawrence N. Schultz Lawrence N. Schultz |
Director | March 15, 2016 | ||
117
Table of Contents
Fairmount Santrol Holdings Inc. and Subsidiaries
Schedule II – Valuation and Qualifying Accounts and Reserves
Years Ended December 31, 2015, 2014, and 2013
(in thousands, except share and per share data)
| Beginning Balance |
Charged to Cost and Expenses |
Charged to Other Accounts |
Deductions | Ending Balance | ||||||||||||||||
| Allowance for Doubtful Accounts: |
||||||||||||||||||||
| Year ended December 31, 2015 |
$ | 4,255 | $ | 1,968 | $ | — | $ | (3,753 | ) | $ | 2,470 | |||||||||
| Year ended December 31, 2014 |
796 | 3,605 | — | (146 | ) | 4,255 | ||||||||||||||
| Year ended December 31, 2013 |
1,189 | 1,741 | — | (2,134 | ) | 796 | ||||||||||||||
| Valuation Allowance for Net Deferred Tax Assets: |
||||||||||||||||||||
| Year ended December 31, 2015 |
$ | 1,309 | $ | 25,921 | $ | — | $ | — | $ | 27,230 | ||||||||||
| Year ended December 31, 2014 |
— | 1,309 | — | — | 1,309 | |||||||||||||||
| Year ended December 31, 2013 |
— | — | — | — | — | |||||||||||||||
118
Table of Contents
FAIRMOUNT SANTROL HOLDINGS INC.
EXHIBIT INDEX
The following Exhibits are filed with this Annual Report on Form 10-K or are incorporated by reference to a prior filing in accordance with Rule 12b-32 under the Securities and Exchange Act of 1934. Exhibits included in this filing are designated by an asterisk (*). All Exhibits not so designated are incorporated by reference to a prior filing as indicated.
| Exhibit No. |
Description | |
| 2.1 | Interests Purchase Agreement, dated as of April 30, 2013, by and among Fairmount Minerals, Ltd., Soane Energy LLC and Self-Suspending Proppant LLC (incorporated by reference to Exhibit 2.1 on Form S-1, filed on September 18, 2014). | |
| 3.1 | Form of Third Amended and Restated Certificate of Incorporation of FMSA Holdings Inc. (incorporated by reference to Exhibit 3.1 on Form S-1, filed on September 18, 2014). | |
| 3.2 | Form of Fourth Amended and Restated Bylaws of FMSA Holdings Inc. (incorporated by reference to Exhibit 3.2 on Form S-1, filed on September 18, 2014). | |
| 3.3 | Certificate of Amendment of the Third Amended and Restated Certificate of Incorporation of FMSA Holdings Inc., filed July 17, 2015 (incorporated by reference to Exhibit 3.1 on Form 8-K, filed July 21, 2015). | |
| 4.1 | Specimen Common Stock Certificate (incorporated by reference to Exhibit 4.1 on Form S-1, filed on September 26, 2014). | |
| 10.1 | Second Amended and Restated Credit and Guaranty Agreement dated as of September 5, 2013 by and among Fairmount Minerals, Ltd., Fairmount Minerals Holdings, Inc., certain subsidiaries of Fairmount Minerals, Ltd., Lake Shore Sand Company (Ontario) Ltd., the Lenders party thereto from time to time, Barclays Bank PLC, as Administrative Agent, as Collateral Agent and as Revolving Administrative Agent and the other agents referred to therein (incorporated by reference to Exhibit 10.1 on Form S-1, filed on August 22, 2014). | |
| 10.2 | Amendment Agreement dated as of September 5, 2013 by and among Fairmount Minerals, Ltd., Fairmount Minerals Holdings, Inc., certain subsidiaries of Fairmount Minerals, Ltd., Lake Shore Sand Company (Ontario) Ltd., the Lenders party thereto from time to time, Barclays Bank PLC, as Administrative Agent and as Collateral Agent and the other agents referred to therein (incorporated by reference to Exhibit 10.2 on Form S-1, filed on August 22, 2014). | |
| 10.3 | First Amendment to Second Amended and Restated Credit and Guaranty Agreement dated as of March 27, 2014 by and among Fairmount Minerals, Ltd., Fairmount Minerals Holdings, Inc., certain subsidiaries of Fairmount Minerals, Ltd., Lake Shore Sand Company (Ontario) Ltd., the Lenders party thereto from time to time, Barclays Bank PLC, as Administrative Agent, as Collateral Agent and as Revolving Administrative Agent and the other agents referred to therein (incorporated by reference to Exhibit 10.3 on Form S-1, filed on August 22, 2014). | |
| 10.4 | Joinder Agreement, dated as of February 14, 2014 by and among Barclays Bank PLC, Fairmount Minerals, Ltd., as borrower representative and Barclays Bank PLC, as administrative agent (incorporated by reference to Exhibit 10.4 on Form S-1, filed on August 22, 2014). | |
119
Table of Contents
FAIRMOUNT SANTROL HOLDINGS INC.
EXHIBIT INDEX
(continued)
| Exhibit No. |
Description | |
| 10.5 | Joinder Agreement, dated as of August 29, 2014 by and among Barclays Bank PLC, Morgan Stanley Bank, N.A., Wells Fargo Bank, National Association, Goldman Sachs Bank USA, Jefferies Finance LLC, Keybank National Association and Royal Bank of Canada (collectively, the “Incremental Revolving Loan Lenders”), Fairmount Santrol Inc., as borrower representative and Barclays Bank PLC, as administrative agent (incorporated by reference to Exhibit 10.5 on Form S-1, filed on September 15, 2014). | |
| 10.6 | Joinder Agreement, dated as of September 18, 2014 by and among JPMorgan Chase Bank, N.A. (the “Incremental Revolving Loan Lender”), Fairmount Santrol Inc., as borrower representative and Barclay’s Bank PLC, as administrative agent (incorporated by reference to Exhibit 10.6 on Form S-1, filed on September 22, 2014). | |
| 10.7 | Form of Fourth Amended and Restated Stockholders Agreement (incorporated by reference to Exhibit 10.7 on Form S-1, filed on September 18, 2014). | |
| 10.8 | Form of Indemnification Agreement (incorporated by reference to Exhibit 10.8 on Form S-1, filed on September 18, 2014). | |
| 10.9 | Form of FMSA Holdings Inc. Non-Qualified Stock Option Plan (incorporated by reference to Exhibit 10.9 on Form S-1, filed on September 18, 2014). | |
| 10.10 | Form of Stock Option Agreement for FMSA Holdings Inc. Non-Qualified Stock Option Plan (incorporated by reference to Exhibit 10.9 on Form S-1, filed on September 18, 2014). | |
| 10.11 | Amendment I to the FMSA Holdings Inc. Non-Qualified Stock Option Plan Stock Option Agreement (incorporated by reference to Exhibit 10.10 on Form S-1, filed on September 18, 2014). | |
| 10.12 | Form of FMSA Holdings Inc. Long Term Incentive Compensation Plan (incorporated by reference to Exhibit 10.11 on Form S-1, filed on September 18, 2014). | |
| 10.13 | Form of Stock Option Agreement for FMSA Holdings Inc. Long Term Incentive Compensation Plan (incorporated by reference to Exhibit 10.12 on Form S-1, filed on September 18, 2014). | |
| 10.14 | Amendment I to the FMSA Holdings Inc. Long Term Incentive Compensation Plan Stock Option Agreement (incorporated by reference to Exhibit 10.13 on Form S-1, filed on September 18, 2014). | |
| 10.15 | Form of FMSA Holdings Inc. Stock Option Plan (incorporated by reference to Exhibit 10.14 on Form S-1, filed on September 18, 2014). | |
| 10.16 | Form of Stock Option Agreement for FMSA Holdings Inc. Stock Option Plan (incorporated by reference to Exhibit 10.15 on Form S-1, filed on September 18, 2014). | |
| 10.17 | Amendment I to the FMSA Holdings Inc. Stock Option Agreement (incorporated by reference to Exhibit 10.16 on Form S-1, filed on September 18, 2014). | |
| 10.18 | Form of FMSA Holdings Inc. 2014 Long Term Incentive Plan (incorporated by reference to Exhibit 10.17 on Form S-1, filed on September 18, 2014). | |
| 10.19 | Form of Stock Option Agreement for FMSA Holdings Inc. 2014 Long Term Incentive Plan (incorporated by reference to Exhibit 10.18 on Form S-1, filed on September 18, 2014). | |
120
Table of Contents
FAIRMOUNT SANTROL HOLDINGS INC.
EXHIBIT INDEX
(continued)
| Exhibit No. |
Description | |
| 10.20 | Form of Notice of Grant of Stock Option for FMSA Holdings Inc. 2014 Long Term Incentive Plan (incorporated by reference to Exhibit 10.19 on Form S-1, filed on September 18, 2014). | |
| 10.21 | Form of Restricted Stock Unit Agreement for FMSA Holdings Inc. 2014 Long Term Incentive Plan (incorporated by reference to Exhibit 10.21 on Form S-1, filed on September 18, 2014). | |
| 10.22 | Form of Notice of Grant of Restricted Stock Unit for FMSA Holdings Inc. 2014 Long Term Incentive Plan (incorporated by reference to Exhibit 10.22 on Form S-1, filed on September 18, 2014). | |
| 10.23 | Third Amendment to Second Amended and Restated Credit and Guaranty Agreement, dated as of April 30, 2015, among Fairmount Santrol Inc., the signatories thereto, and Barclays Bank plc, as administrative agent (incorporated by reference to Exhibit 10.1 on Form 8-K, filed on May 5, 2015). | |
| 10.24 | Fourth Amendment to the Second Amended and Restated Credit and Guaranty Agreement, dated as of May 15, 2015, among Fairmount Santrol Inc., the lenders party thereto, and Barclays Bank plc as administrative agent (incorporated by reference to Exhibit 10.1 on Form 8-K, filed on May 20, 2015). | |
| 10.25 | Fifth Amendment to Second Amended and Restated Credit and Guaranty Agreement, dated as of September 30, 2015, among Fairmount Santrol Inc., the Revolving Lenders party hereto, and Barclays Bank plc, as administrative agent and revolving administrative agent (incorporated by reference to Exhibit 10.1 on Form 8-K, filed on October 1, 2015). | |
| 10.26 | Form of Executive Change in Control Severance Plan (incorporated by reference to Exhibit 10.1 on Form 8-K, filed on December 16, 2015). | |
| 10.27 | Omnibus Amendment to Outstanding Stock Option Agreements under the FMSA Holdings Inc. 2014 Long Term Incentive Plan (incorporated by reference to Exhibit 10.2 on Form 8-K, filed on December 16, 2015). | |
| 10.28 | Omnibus Amendment to Outstanding Restricted Stock Unit Agreements under the FMSA Holdings Inc. 2014 Long Term Incentive Plan (incorporated by reference to Exhibit 10.3 on Form 8-K, filed on December 16, 2015). | |
| 10.29 | Amendment No. 1 to the Interests Purchase Agreement dated April 30, 2013, by and among Fairmount Minerals Ltd. (n/k/a Fairmount Santrol Inc.), Soane Energy LLC and Self-Suspending Proppant LLC, dated December 17, 2015 (incorporated by reference to Exhibit 10.1 on Form 8-K, filed on December 18, 2015). | |
| 10.30* | Form of Separation Agreement, dated December 30, 2015, by and among Fairmount Santrol Holdings Inc. and Van T. Smith. | |
| 21.1* | List of Subsidiaries of Fairmount Santrol Holdings Inc. | |
| 23.1* | Consent of Independent Registered Public Accounting Firm, PricewaterhouseCoopers LLP. | |
| 31.1* | Certification pursuant to Rule 13a-14(a) or 15d-14(a) of the Principal Executive Officer. | |
| 31.2* | Certification pursuant to Rule 13a-14(a) or 15d-14(a) of the Principal Financial Officer. | |
| 32.1* | Statement Required by 18 U.S.C. Section 1350 by the Principal Executive Officer. | |
121
Table of Contents
FAIRMOUNT SANTROL HOLDINGS INC.
EXHIBIT INDEX
(continued)
| Exhibit No. |
Description | |
| 32.2* | Statement Required by 18 U.S.C. Section 1350 by the Principal Financial Officer. | |
| 95.1* | Mine Safety Disclosure Exhibit | |
| 99.1* | Consent of GZA GeoEnvironmental, Inc. | |
| 101.INS* | XBRL Instance Document | |
| 101.SCH* | XBRL Taxonomy Extension Schema Document | |
| 101.CAL* | XBRL Taxonomy Extension Calculation Linkbase Document | |
| 101.DEF* | XBRL Taxonomy Extension Definition Linkbase Document | |
| 101.LAB* | XBRL Taxonomy Extension Label Linkbase Document | |
| 101.PRE* | XBRL Taxonomy Extension Presentation Linkbase Document | |
122