Attached files
| file | filename |
|---|---|
| 8-K - 8-K - W R GRACE & CO | gra8-kx051517conferencepre.htm |
1 W. R. Grace & Co. | Confidential Goldman Sachs Conference | May 16, 2017
Company Overview
May 16, 2017
Conference
2 W. R. Grace & Co. | Confidential Goldman Sachs Conference | May 16, 2017
Disclaimer
Statement Regarding Safe Harbor For Forward-Looking Statements
This presentation contains forward-looking statements, that is, information related to future, not past, events. Such statements generally include
the words ―believes,‖ ―plans,‖ ―intends,‖ ―targets,‖ ―will,‖ ―expects,‖ ―suggests,‖ ―anticipates,‖ ―outlook,‖ ―continues,‖ or similar expressions.
Forward-looking statements include, without limitation, expected financial positions; results of operations; cash flows; financing plans; business
strategy; operating plans; capital and other expenditures; competitive positions; growth opportunities for existing products; benefits from new
technology and cost reduction initiatives, plans and objectives; and markets for securities. For these statements, Grace claims the protections
of the safe harbor for forward-looking statements contained in Section 27A of the Securities Act and Section 21E of the Exchange Act. Like
other businesses, Grace is subject to risks and uncertainties that could cause its actual results to differ materially from its projections or that
could cause other forward-looking statements to prove incorrect. Factors that could cause actual results to differ materially from those
contained in the forward-looking statements include, without limitation: risks related to foreign operations, especially in emerging regions; the
cost and availability of raw materials and energy; the effectiveness of its research and development and growth investments; acquisitions and
divestitures of assets and gains and losses from dispositions; developments affecting Grace’s outstanding indebtedness; developments
affecting Grace's funded and unfunded pension obligations; its legal and environmental proceedings; uncertainties related to Grace’s ability to
realize the anticipated benefits of the separation transaction; the inability to establish or maintain certain business relationships and
relationships with customers and suppliers or the inability to retain key personnel; costs of compliance with environmental regulation; and those
additional factors set forth in Grace's most recent Annual Report on Form 10-K, quarterly report on Form 10-Q and current reports on Form 8-K,
which have been filed with the Securities and Exchange Commission and are readily available on the Internet at www.sec.gov. Reported results
should not be considered as an indication of future performance. Readers are cautioned not to place undue reliance on Grace's projections and
forward-looking statements, which speak only as the date thereof. Grace undertakes no obligation to publicly release any revision to the
projections and forward-looking statements contained in this announcement, or to update them to reflect events or circumstances occurring
after the date of this presentation.
Non-GAAP Financial Terms
In this presentation, Grace presents financial information in accordance with U.S. generally accepted accounting principles (U.S. GAAP), as
well as the non-GAAP financial information described in the Appendix. Grace believes that this non-GAAP financial information provides useful
supplemental information about the performance of its businesses, improves period-to-period comparability and provides clarity on the
information management uses to evaluate the performance of its businesses. In the Appendix, Grace has provided reconciliations of these non-
GAAP financial measures to the most directly comparable financial measure calculated and presented in accordance with U.S. GAAP. These
non-GAAP financial measures should not be considered as a substitute for financial measures calculated in accordance with U.S. GAAP, and
the financial results calculated in accordance with U.S. GAAP and reconciliations from those results should be evaluated carefully.
3 W. R. Grace & Co. | Confidential Goldman Sachs Conference | May 16, 2017
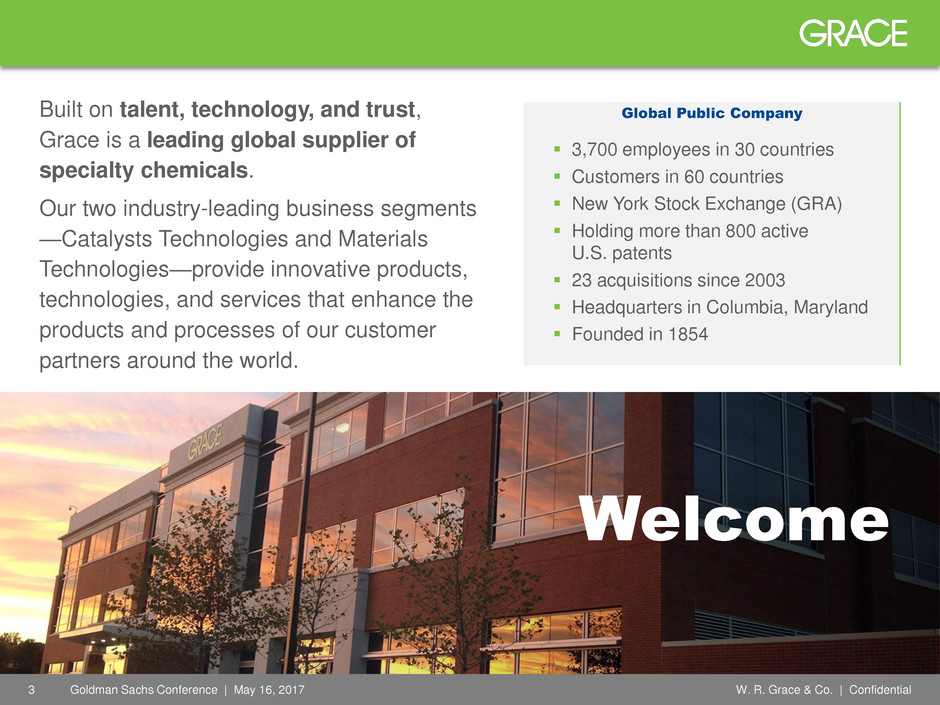
Global Public Company Built on talent, technology, and trust,
Grace is a leading global supplier of
specialty chemicals.
Our two industry-leading business segments
—Catalysts Technologies and Materials
Technologies—provide innovative products,
technologies, and services that enhance the
products and processes of our customer
partners around the world.
3,700 employees in 30 countries
Customers in 60 countries
New York Stock Exchange (GRA)
Holding more than 800 active
U.S. patents
23 acquisitions since 2003
Headquarters in Columbia, Maryland
Founded in 1854
Welcome
4 W. R. Grace & Co. | Confidential Goldman Sachs Conference | May 16, 2017
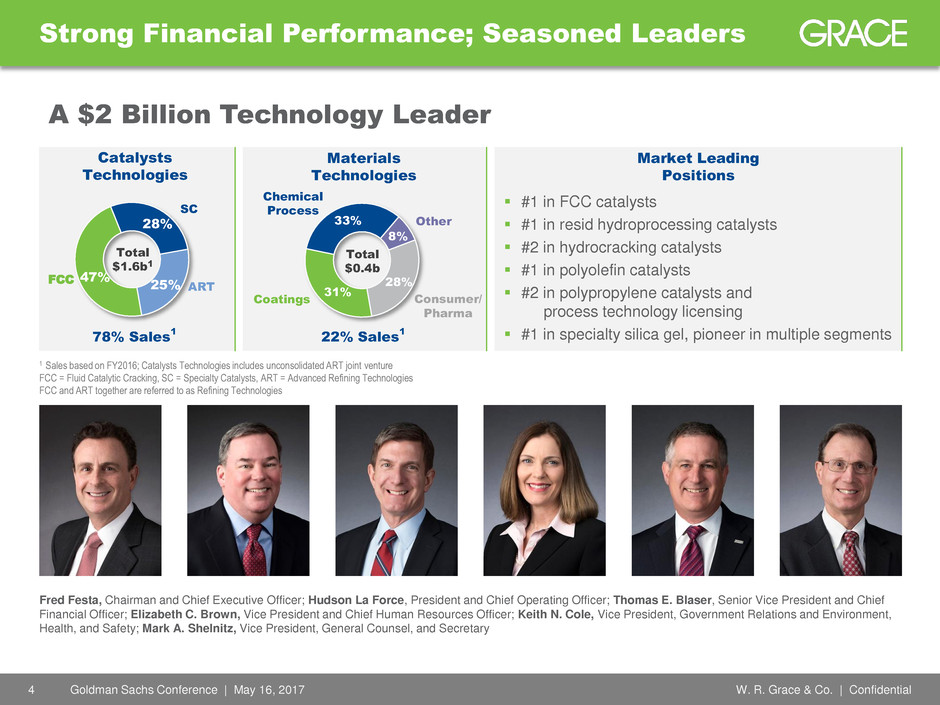
Strong Financial Performance; Seasoned Leaders
SC
FCC
28%
47%
25%
Total
$1.6b1
Catalysts
Technologies
78% Sales
1
ART
31%
33%
8%
28%
Total
$0.4b
Coatings Consumer/
Pharma
Chemical
Process
Materials
Technologies
22% Sales
1
Other
#1 in FCC catalysts
#1 in resid hydroprocessing catalysts
#2 in hydrocracking catalysts
#1 in polyolefin catalysts
#2 in polypropylene catalysts and
process technology licensing
#1 in specialty silica gel, pioneer in multiple segments
Market Leading
Positions
Fred Festa, Chairman and Chief Executive Officer; Hudson La Force, President and Chief Operating Officer; Thomas E. Blaser, Senior Vice President and Chief
Financial Officer; Elizabeth C. Brown, Vice President and Chief Human Resources Officer; Keith N. Cole, Vice President, Government Relations and Environment,
Health, and Safety; Mark A. Shelnitz, Vice President, General Counsel, and Secretary
A $2 Billion Technology Leader
1 Sales based on FY2016; Catalysts Technologies includes unconsolidated ART joint venture
FCC = Fluid Catalytic Cracking, SC = Specialty Catalysts, ART = Advanced Refining Technologies
FCC and ART together are referred to as Refining Technologies
5 W. R. Grace & Co. | Confidential Goldman Sachs Conference | May 16, 2017
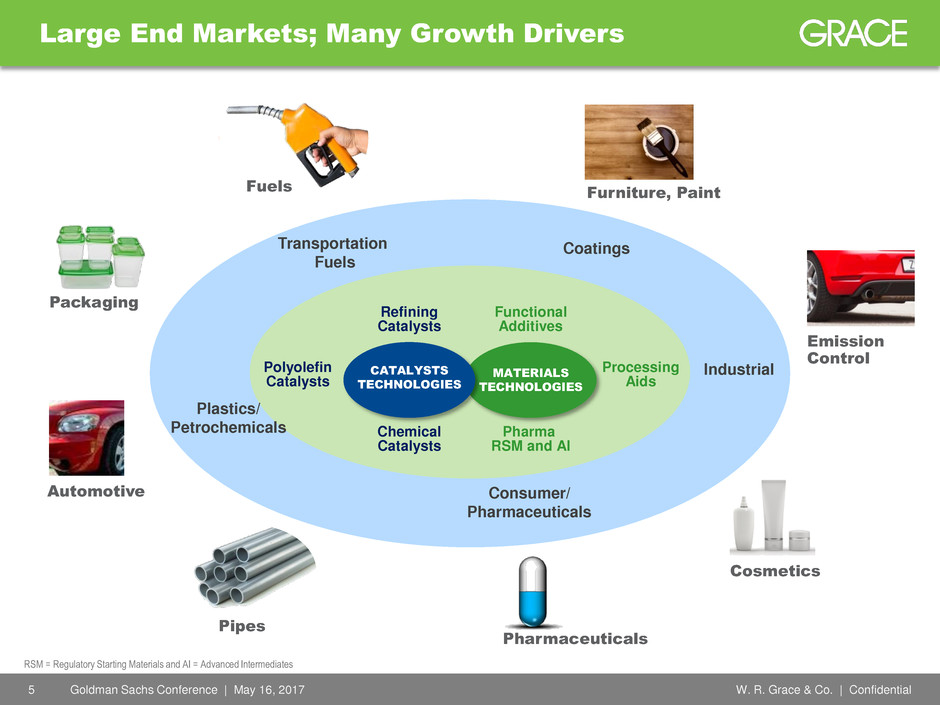
Polyolefin
Catalysts
MATERIALS
TECHNOLOGIES
CATALYSTS
TECHNOLOGIES
Refining
Catalysts
Polyolefin
Catalysts
Chemical
Catalysts
Functional
Additives
Processing
Aids
Pharma
RSM and AI
Plastics/
Petrochemicals
Transportation
Fuels
Industrial
Coatings
Consumer/
Pharmaceuticals
Large End Markets; Many Growth Drivers
Fuels
Automotive
Pipes
Cosmetics
Pharmaceuticals
Furniture, Paint
Emission
Control
Packaging
RSM = Regulatory Starting Materials and AI = Advanced Intermediates
6 W. R. Grace & Co. | Confidential Goldman Sachs Conference | May 16, 2017
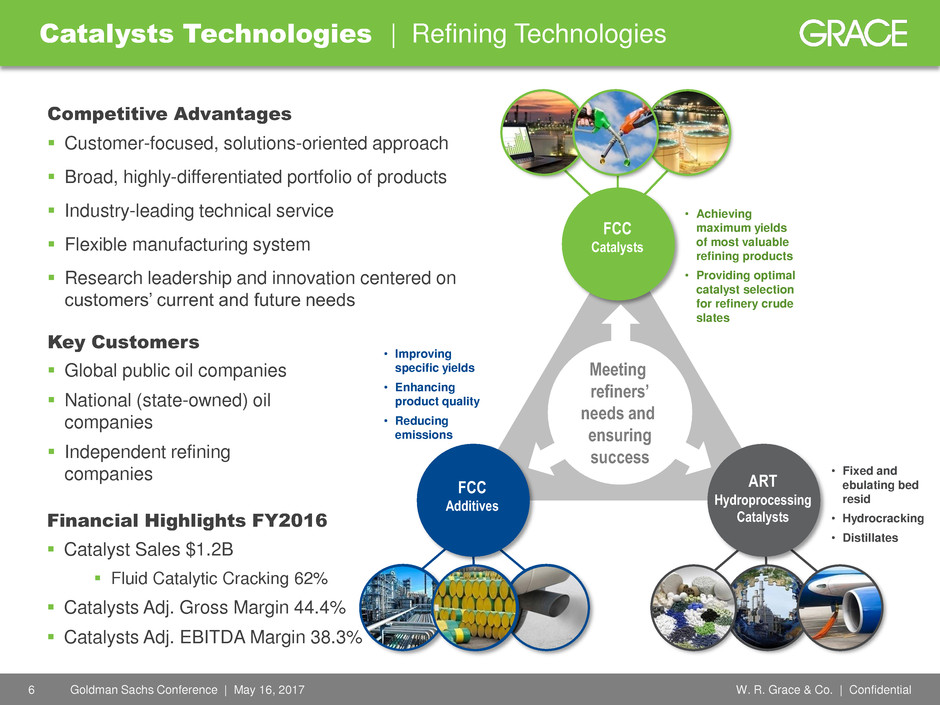
Meeting
refiners’
needs and
ensuring
success
FCC
Catalysts
ART
Hydroprocessing
Catalysts
FCC
Additives
Customer-focused, solutions-oriented approach
Broad, highly-differentiated portfolio of products
Industry-leading technical service
Flexible manufacturing system
Research leadership and innovation centered on
customers’ current and future needs
Key Customers
Competitive Advantages
Global public oil companies
National (state-owned) oil
companies
Independent refining
companies • Fixed and
ebulating bed
resid
• Hydrocracking
• Distillates
• Improving
specific yields
• Enhancing
product quality
• Reducing
emissions
• Achieving
maximum yields
of most valuable
refining products
• Providing optimal
catalyst selection
for refinery crude
slates
Catalysts Technologies | Refining Technologies
Financial Highlights FY2016
Catalyst Sales $1.2B
Fluid Catalytic Cracking 62%
Catalysts Adj. Gross Margin 44.4%
Catalysts Adj. EBITDA Margin 38.3%
7 W. R. Grace & Co. | Confidential Goldman Sachs Conference | May 16, 2017
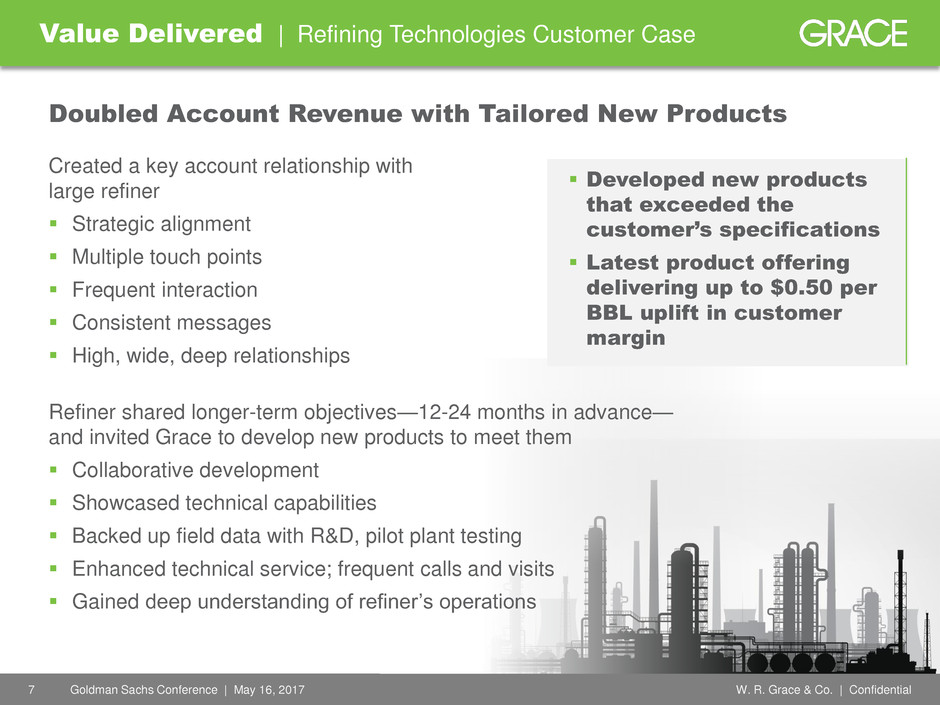
Value Delivered | Refining Technologies Customer Case
Doubled Account Revenue with Tailored New Products
Created a key account relationship with
large refiner
Strategic alignment
Multiple touch points
Frequent interaction
Consistent messages
High, wide, deep relationships
Refiner shared longer-term objectives—12-24 months in advance—
and invited Grace to develop new products to meet them
Collaborative development
Showcased technical capabilities
Backed up field data with R&D, pilot plant testing
Enhanced technical service; frequent calls and visits
Gained deep understanding of refiner’s operations
Developed new products
that exceeded the
customer’s specifications
Latest product offering
delivering up to $0.50 per
BBL uplift in customer
margin
8 W. R. Grace & Co. | Confidential Goldman Sachs Conference | May 16, 2017
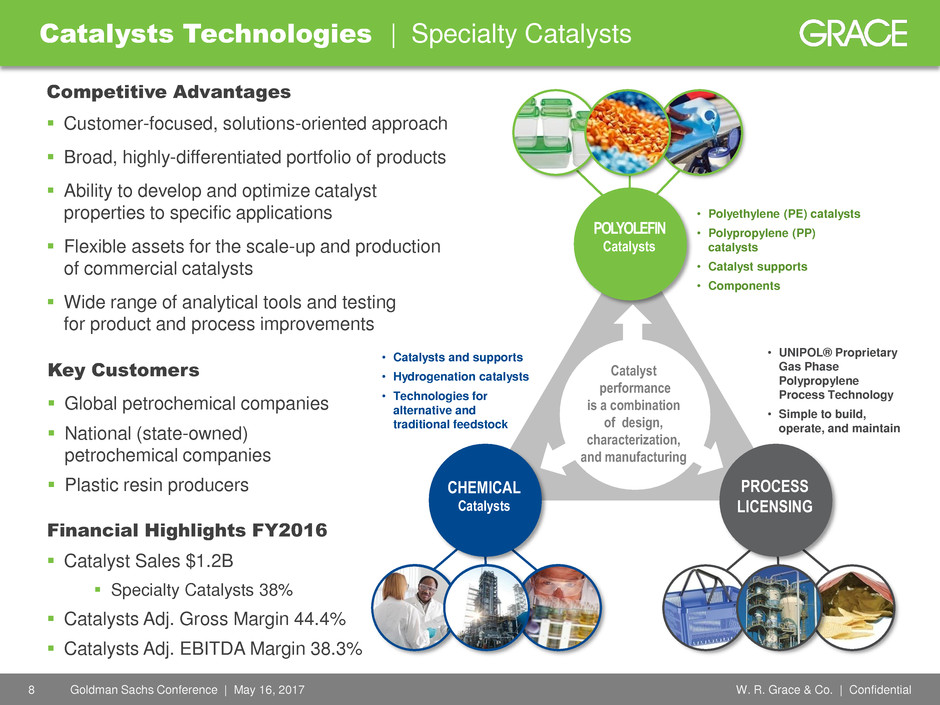
POLYOLEFIN
Catalysts
PROCESS
LICENSING
CHEMICAL
Catalysts
Customer-focused, solutions-oriented approach
Broad, highly-differentiated portfolio of products
Ability to develop and optimize catalyst
properties to specific applications
Flexible assets for the scale-up and production
of commercial catalysts
Wide range of analytical tools and testing
for product and process improvements
Key Customers
Competitive Advantages
Global petrochemical companies
National (state-owned)
petrochemical companies
Plastic resin producers
• UNIPOL® Proprietary
Gas Phase
Polypropylene
Process Technology
• Simple to build,
operate, and maintain
• Catalysts and supports
• Hydrogenation catalysts
• Technologies for
alternative and
traditional feedstock
• Polyethylene (PE) catalysts
• Polypropylene (PP)
catalysts
• Catalyst supports
• Components
Catalyst
performance
is a combination
of design,
characterization,
and manufacturing
Catalysts Technologies | Specialty Catalysts
Financial Highlights FY2016
Catalyst Sales $1.2B
Specialty Catalysts 38%
Catalysts Adj. Gross Margin 44.4%
Catalysts Adj. EBITDA Margin 38.3%
9 W. R. Grace & Co. | Confidential Goldman Sachs Conference | May 16, 2017
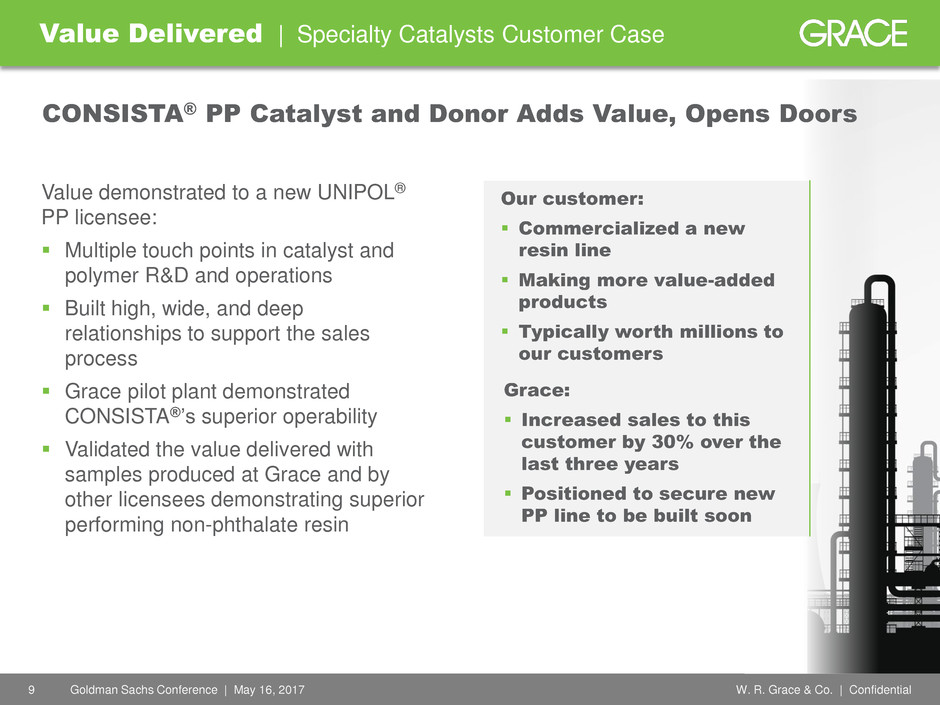
Value Delivered | Specialty Catalysts Customer Case
CONSISTA® PP Catalyst and Donor Adds Value, Opens Doors
Our customer:
Commercialized a new
resin line
Making more value-added
products
Typically worth millions to
our customers
Grace:
Increased sales to this
customer by 30% over the
last three years
Positioned to secure new
PP line to be built soon
Value demonstrated to a new UNIPOL®
PP licensee:
Multiple touch points in catalyst and
polymer R&D and operations
Built high, wide, and deep
relationships to support the sales
process
Grace pilot plant demonstrated
CONSISTA®’s superior operability
Validated the value delivered with
samples produced at Grace and by
other licensees demonstrating superior
performing non-phthalate resin
10 W. R. Grace & Co. | Confidential Goldman Sachs Conference | May 16, 2017
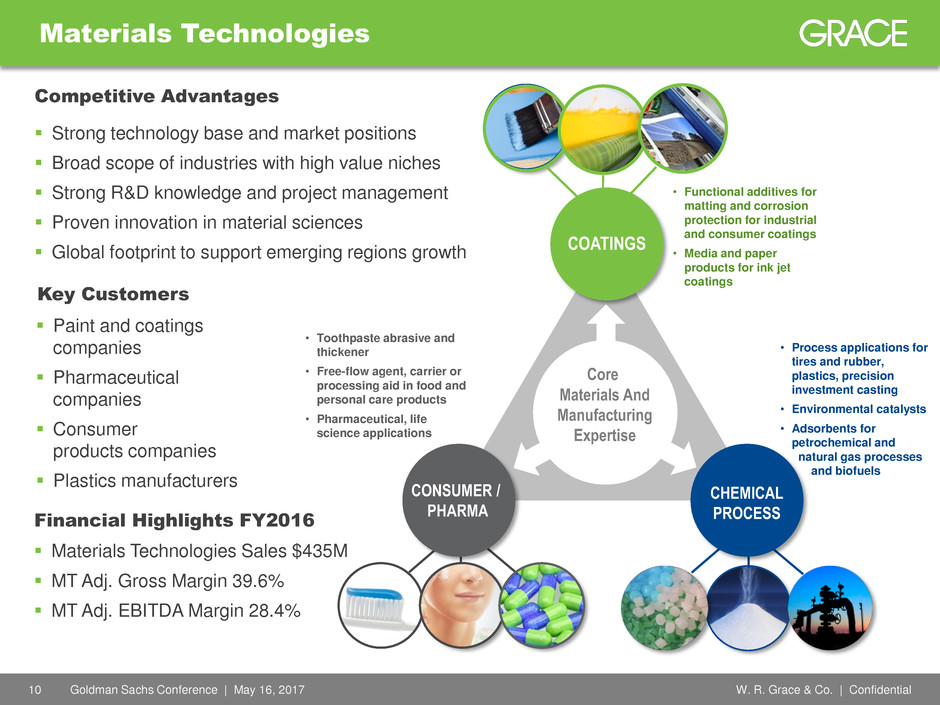
Core
Materials And
Manufacturing
Expertise
COATINGS
CHEMICAL
PROCESS
Strong technology base and market positions
Broad scope of industries with high value niches
Strong R&D knowledge and project management
Proven innovation in material sciences
Global footprint to support emerging regions growth
Key Customers
Competitive Advantages
Paint and coatings
companies
Pharmaceutical
companies
Consumer
products companies
Plastics manufacturers
• Process applications for
tires and rubber,
plastics, precision
investment casting
• Environmental catalysts
• Adsorbents for
petrochemical and
natural gas processes
and biofuels
• Toothpaste abrasive and
thickener
• Free-flow agent, carrier or
processing aid in food and
personal care products
• Pharmaceutical, life
science applications
Materials Technologies
CONSUMER /
PHARMA
• Functional additives for
matting and corrosion
protection for industrial
and consumer coatings
• Media and paper
products for ink jet
coatings
Financial Highlights FY2016
Materials Technologies Sales $435M
MT Adj. Gross Margin 39.6%
MT Adj. EBITDA Margin 28.4%
11 W. R. Grace & Co. | Confidential Goldman Sachs Conference | May 16, 2017
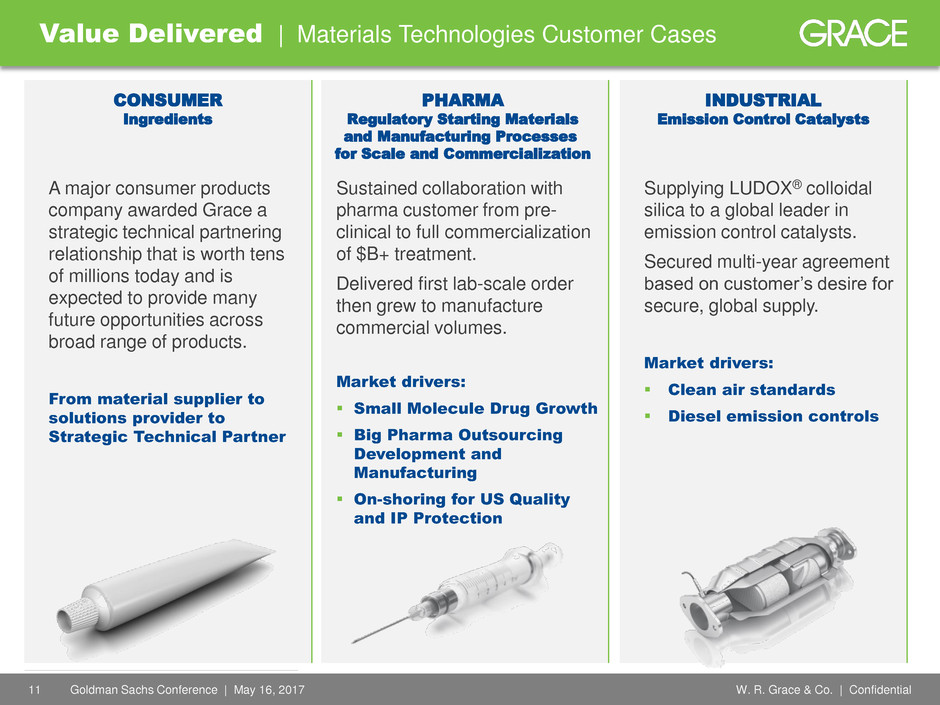
Value Delivered | Materials Technologies Customer Cases
A major consumer products
company awarded Grace a
strategic technical partnering
relationship that is worth tens
of millions today and is
expected to provide many
future opportunities across
broad range of products.
From material supplier to
solutions provider to
Strategic Technical Partner
Sustained collaboration with
pharma customer from pre-
clinical to full commercialization
of $B+ treatment.
Delivered first lab-scale order
then grew to manufacture
commercial volumes.
Market drivers:
Small Molecule Drug Growth
Big Pharma Outsourcing
Development and
Manufacturing
On-shoring for US Quality
and IP Protection
Supplying LUDOX® colloidal
silica to a global leader in
emission control catalysts.
Secured multi-year agreement
based on customer’s desire for
secure, global supply.
Market drivers:
Clean air standards
Diesel emission controls
PHARMA
Regulatory Starting Materials
and Manufacturing Processes
for Scale and Commercialization
CONSUMER
Ingredients
INDUSTRIAL
Emission Control Catalysts
12 W. R. Grace & Co. | Confidential Goldman Sachs Conference | May 16, 2017
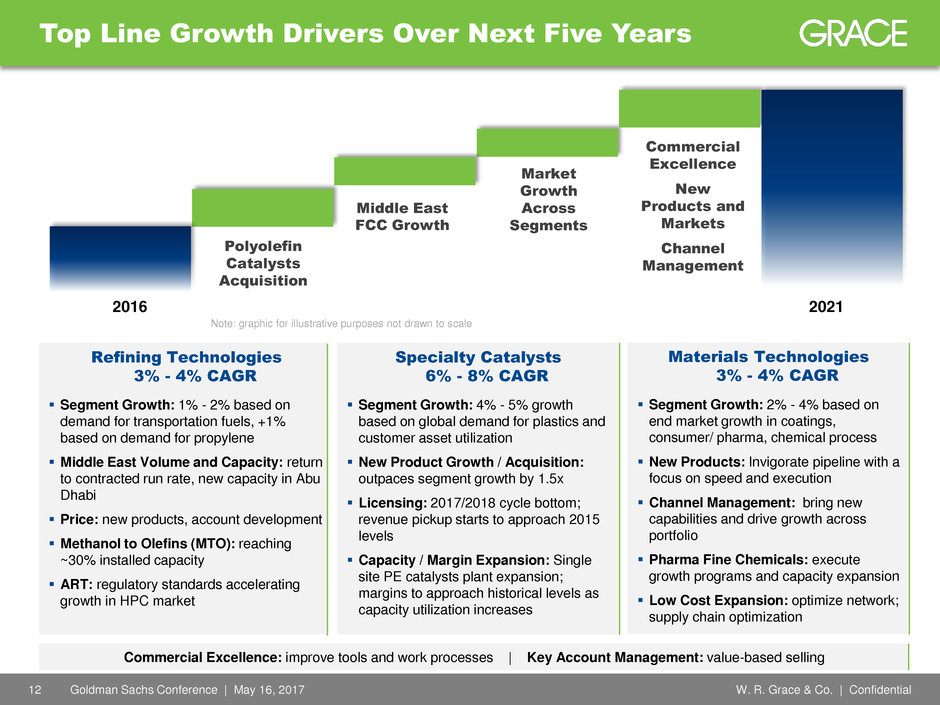
Top Line Growth Drivers Over Next Five Years
Materials Technologies
3% - 4% CAGR
Segment Growth: 2% - 4% based on
end market growth in coatings,
consumer/ pharma, chemical process
New Products: Invigorate pipeline with a
focus on speed and execution
Channel Management: bring new
capabilities and drive growth across
portfolio
Pharma Fine Chemicals: execute
growth programs and capacity expansion
Low Cost Expansion: optimize network;
supply chain optimization
Refining Technologies
3% - 4% CAGR
Segment Growth: 1% - 2% based on
demand for transportation fuels, +1%
based on demand for propylene
Middle East Volume and Capacity: return
to contracted run rate, new capacity in Abu
Dhabi
Price: new products, account development
Methanol to Olefins (MTO): reaching
~30% installed capacity
ART: regulatory standards accelerating
growth in HPC market
Middle East
FCC Growth
Commercial
Excellence
New
Products and
Markets
Channel
Management
2016 2021
Market
Growth
Across
Segments
Polyolefin
Catalysts
Acquisition
Specialty Catalysts
6% - 8% CAGR
Segment Growth: 4% - 5% growth
based on global demand for plastics and
customer asset utilization
New Product Growth / Acquisition:
outpaces segment growth by 1.5x
Licensing: 2017/2018 cycle bottom;
revenue pickup starts to approach 2015
levels
Capacity / Margin Expansion: Single
site PE catalysts plant expansion;
margins to approach historical levels as
capacity utilization increases
Note: graphic for illustrative purposes not drawn to scale
Commercial Excellence: improve tools and work processes | Key Account Management: value-based selling
13 W. R. Grace & Co. | Confidential Goldman Sachs Conference | May 16, 2017
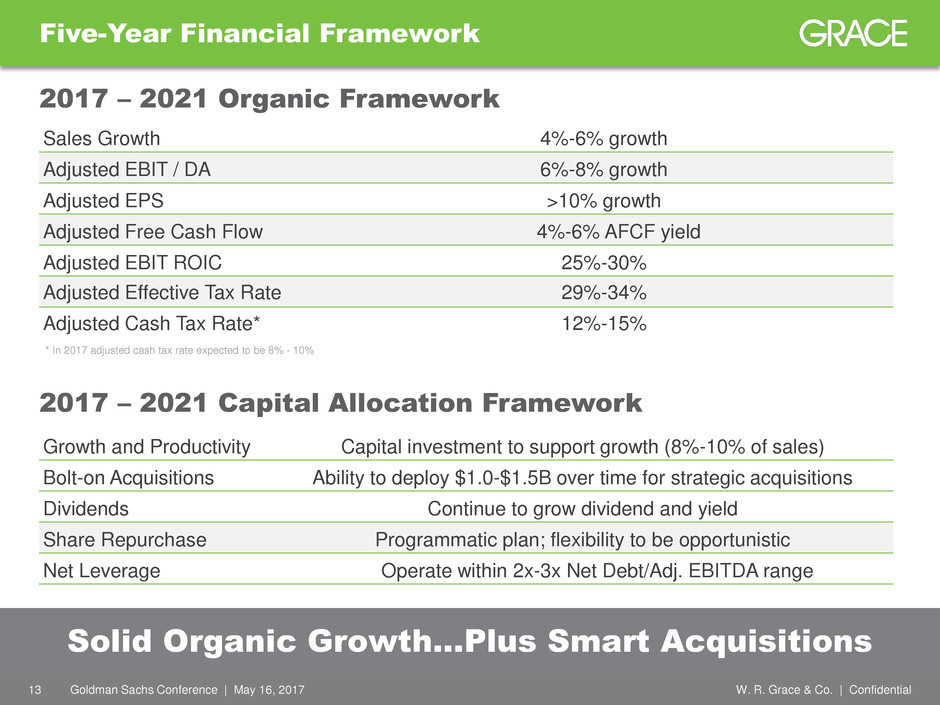
Five-Year Financial Framework
Sales Growth 4%-6% growth
Adjusted EBIT / DA 6%-8% growth
Adjusted EPS >10% growth
Adjusted Free Cash Flow 4%-6% AFCF yield
Adjusted EBIT ROIC 25%-30%
Adjusted Effective Tax Rate 29%-34%
Adjusted Cash Tax Rate* 12%-15%
2017 – 2021 Organic Framework
* In 2017 adjusted cash tax rate expected to be 8% - 10%
2017 – 2021 Capital Allocation Framework
Growth and Productivity Capital investment to support growth (8%-10% of sales)
Bolt-on Acquisitions Ability to deploy $1.0-$1.5B over time for strategic acquisitions
Dividends Continue to grow dividend and yield
Share Repurchase Programmatic plan; flexibility to be opportunistic
Net Leverage Operate within 2x-3x Net Debt/Adj. EBITDA range
Solid Organic Growth…Plus Smart Acquisitions
14 W. R. Grace & Co. | Confidential Goldman Sachs Conference | May 16, 2017
Thank you.
Tania Almond
Investor Relations Officer
+1 410.531.4590 | tania.almond@grace.com
15 W. R. Grace & Co. | Confidential Goldman Sachs Conference | May 16, 2017
Our Businesses
16 W. R. Grace & Co. | Confidential Goldman Sachs Conference | May 16, 2017 16 © 2017 W. R. Grace & Co.
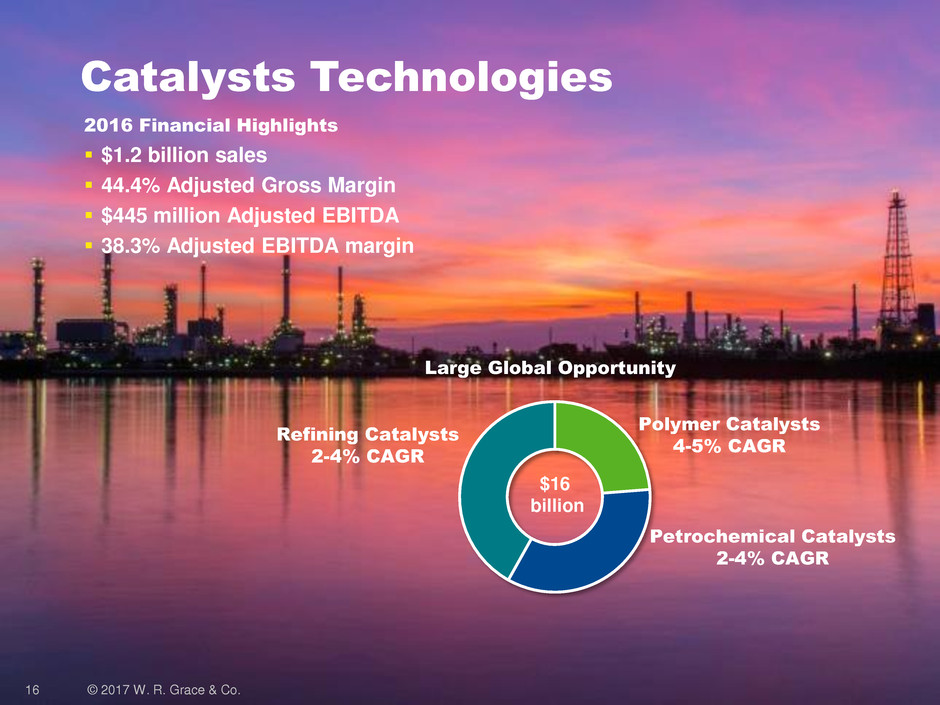
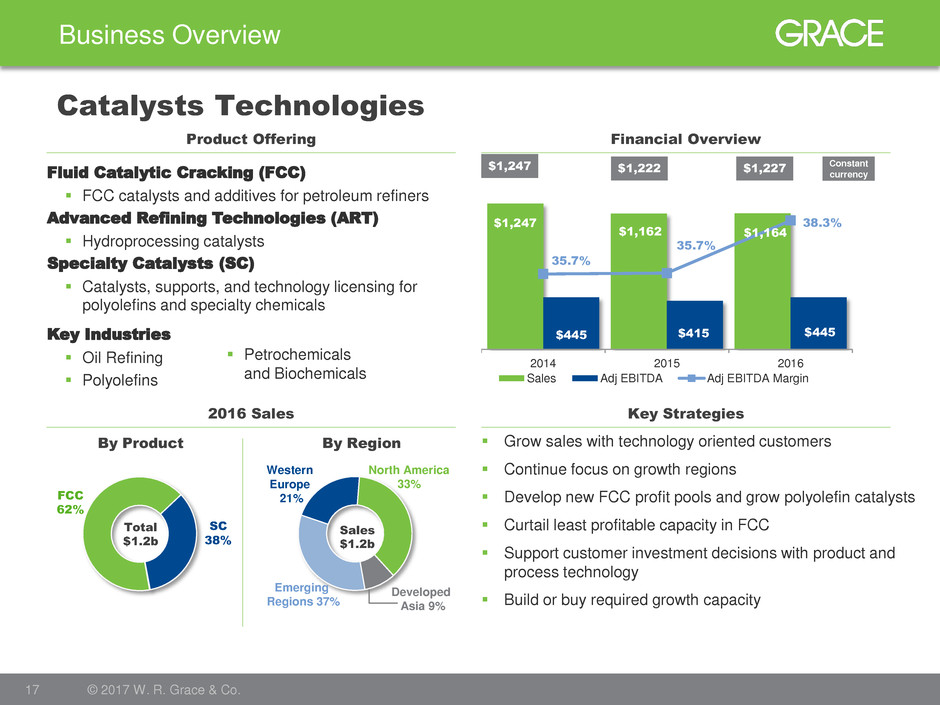
Catalysts Technologies
Polymer Catalysts
4-5% CAGR
Refining Catalysts
2-4% CAGR
Petrochemical Catalysts
2-4% CAGR
$16
billion
2016 Financial Highlights
$1.2 billion sales
44.4% Adjusted Gross Margin
$445 million Adjusted EBITDA
38.3% Adjusted EBITDA margin
Large Global Opportunity
17 W. R. Grace & Co. | Confidential Goldman Sachs Conference | May 16, 2017
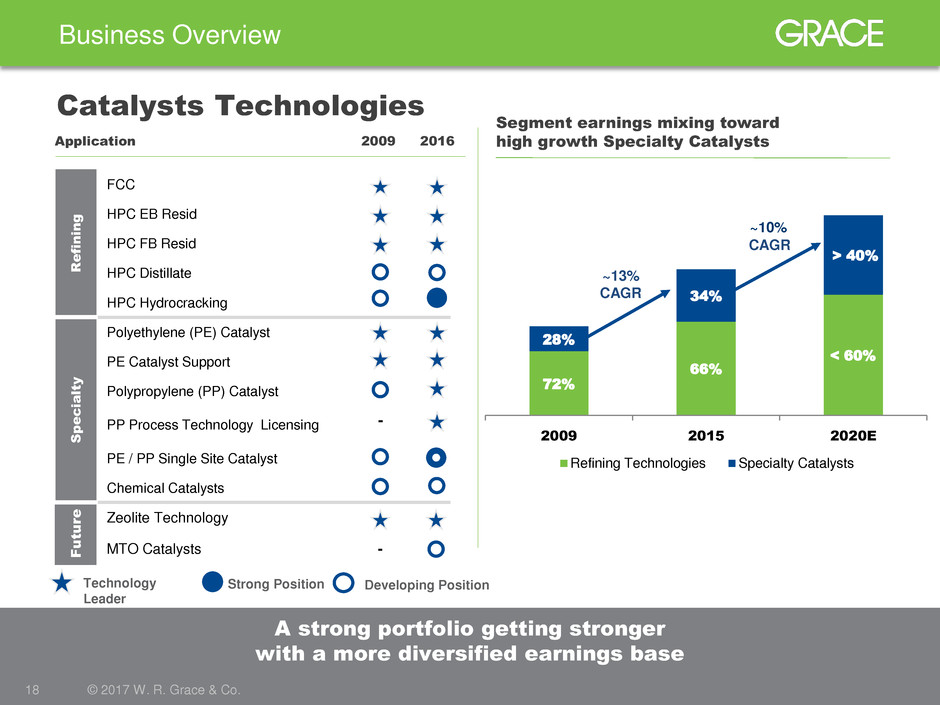
$1,247
$1,162 $1,164
$445 $415 $445
35.7%
35.7%
38.3%
2014 2015 2016
Sales Adj EBITDA Adj EBITDA Margin
$1,247 $1,227
Key Industries
Oil Refining
Polyolefins
SC
38%
FCC
62%
North America
33%
Emerging
Regions 37%
Developed
Asia 9%
Western
Europe
21%
Business Overview
17 © 2017 W. R. Grace & Co.
Catalysts Technologies
Financial Overview Product Offering
2016 Sales Key Strategies
Grow sales with technology oriented customers
Continue focus on growth regions
Develop new FCC profit pools and grow polyolefin catalysts
Curtail least profitable capacity in FCC
Support customer investment decisions with product and
process technology
Build or buy required growth capacity
By Product By Region
Total
$1.2b
Fluid Catalytic Cracking (FCC)
FCC catalysts and additives for petroleum refiners
Advanced Refining Technologies (ART)
Hydroprocessing catalysts
Specialty Catalysts (SC)
Catalysts, supports, and technology licensing for
polyolefins and specialty chemicals
Petrochemicals
and Biochemicals
Sales
$1.2b
$1,222
Constant
currency
18 W. R. Grace & Co. | Confidential Goldman Sachs Conference | May 16, 2017
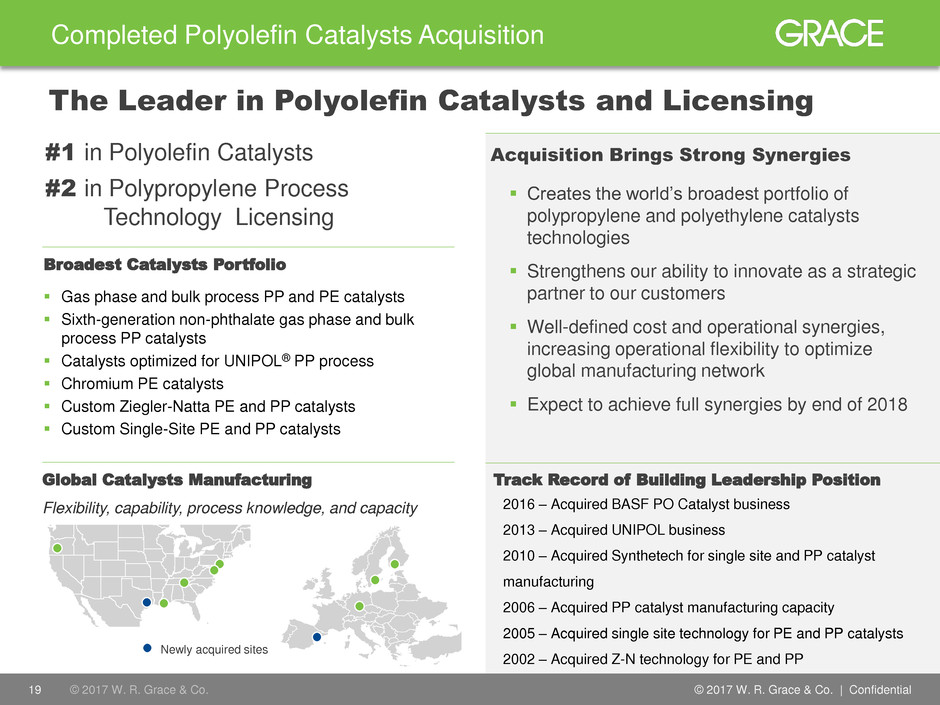
72%
66%
< 60%
28%
34%
> 40%
2009 2015 2020E
Refining Technologies Specialty Catalysts
~10%
CAGR
A strong portfolio getting stronger
with a more diversified earnings base
Business Overview
18 © 2017 W. R. Grace & Co.
Catalysts Technologies
Application 2009 2016
R
e
fi
n
in
g
FCC
HPC EB Resid
HPC FB Resid
HPC Distillate
HPC Hydrocracking
S
p
e
c
ia
lt
y
Polyethylene (PE) Catalyst
PE Catalyst Support
Polypropylene (PP) Catalyst
PP Process Technology Licensing -
PE / PP Single Site Catalyst
Chemical Catalysts
F
u
tur
e
Zeolite Technology
MTO Catalysts -
Technology
Leader
Developing Position Strong Position
Segment earnings mixing toward
high growth Specialty Catalysts
~13%
CAGR
19 W. R. Grace & Co. | Confidential Goldman Sachs Conference | May 16, 2017
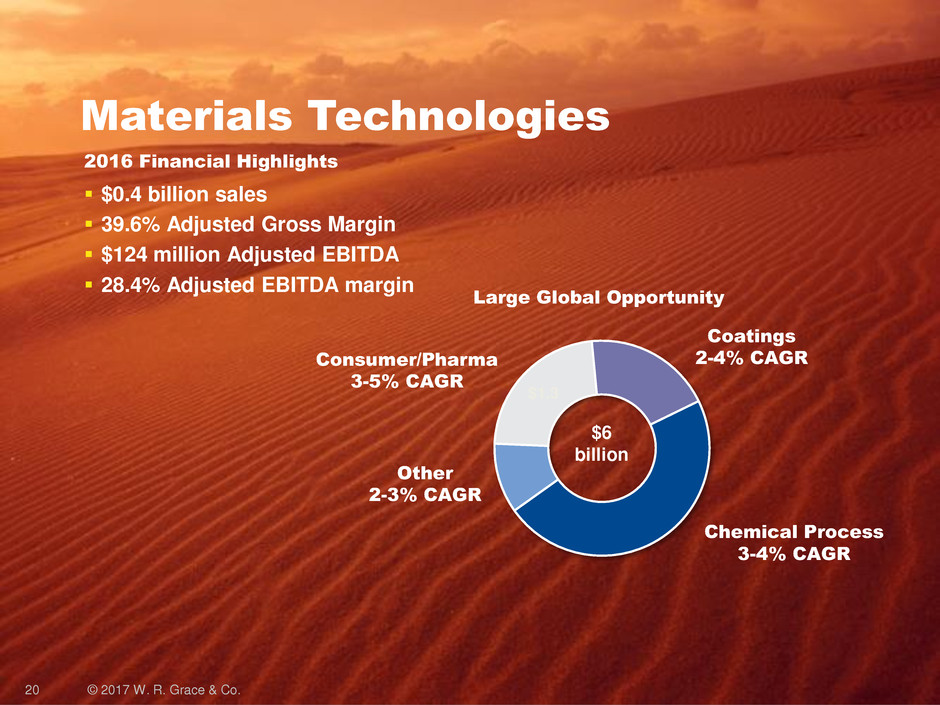
Completed Polyolefin Catalysts Acquisition
Global Catalysts Manufacturing
Creates the world’s broadest portfolio of
polypropylene and polyethylene catalysts
technologies
Strengthens our ability to innovate as a strategic
partner to our customers
Well-defined cost and operational synergies,
increasing operational flexibility to optimize
global manufacturing network
Expect to achieve full synergies by end of 2018
Flexibility, capability, process knowledge, and capacity
Newly acquired sites
© 2017 © 2017 W. R. Grace & Co.
Acquisition Brings Strong Synergies #1 in Polyolefin Catalysts
#2 in Polypropylene Process
Technology Licensing
The Leader in Polyolefin Catalysts and Licensing
Gas phase and bulk process PP and PE catalysts
Sixth-generation non-phthalate gas phase and bulk
process PP catalysts
Catalysts optimized for UNIPOL® PP process
Chromium PE catalysts
Custom Ziegler-Natta PE and PP catalysts
Custom Single-Site PE and PP catalysts
Broadest Catalysts Portfolio
2016 – Acquired BASF PO Catalyst business
2013 – Acquired UNIPOL business
2010 – Acquired Synthetech for single site and PP catalyst
manufacturing
2006 – Acquired PP catalyst manufacturing capacity
2005 – Acquired single site technology for PE and PP catalysts
2002 – Acquired Z-N technology for PE and PP
Track Record of Building Leadership Position
20 W. R. Grace & Co. | Confidential Goldman Sachs Conference | May 16, 2017 20 © 2017 W. R. Grace & Co.
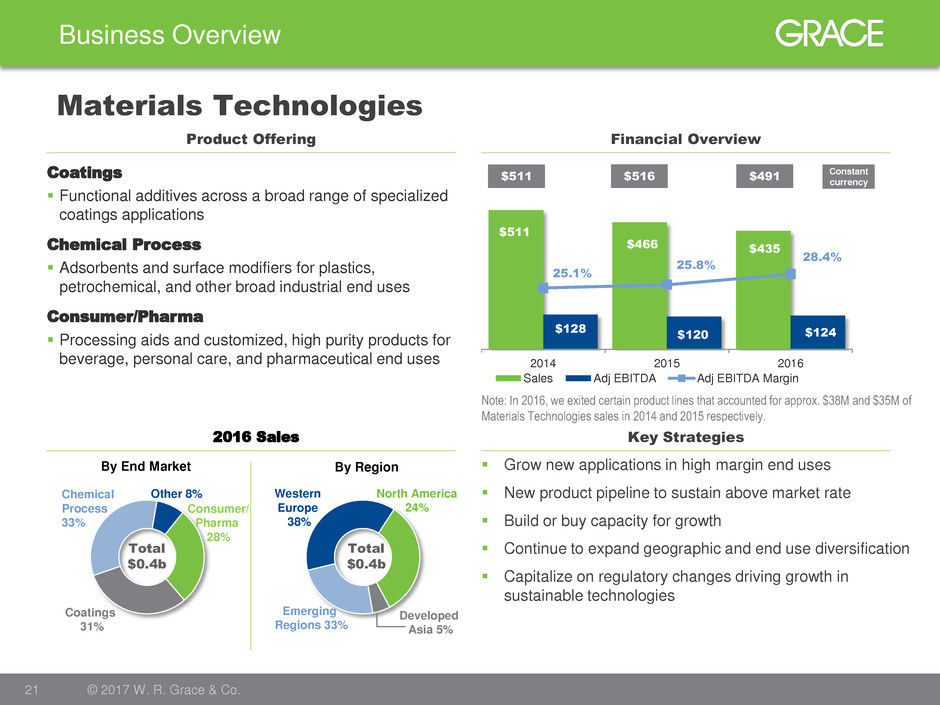
Materials Technologies
Consumer/Pharma
3-5% CAGR
Chemical Process
3-4% CAGR
2016 Financial Highlights
$0.4 billion sales
39.6% Adjusted Gross Margin
$124 million Adjusted EBITDA
28.4% Adjusted EBITDA margin
$1.3
$6
billion
Other
2-3% CAGR
Coatings
2-4% CAGR
Large Global Opportunity
21 W. R. Grace & Co. | Confidential Goldman Sachs Conference | May 16, 2017
$511
$466 $435
$128
$120 $124
25.1%
25.8%
28.4%
2014 2015 2016
Sales Adj EBITDA Adj EBITDA Margin
$516 $491
Coatings
31%
Chemical
Process
33%
Consumer/
Pharma
28%
Other 8%
North America
24%
Emerging
Regions 33%
Developed
Asia 5%
Western
Europe
38%
Business Overview
21 © 2017 W. R. Grace & Co.
Materials Technologies
Financial Overview Product Offering
Key Strategies
Grow new applications in high margin end uses
New product pipeline to sustain above market rate
Build or buy capacity for growth
Continue to expand geographic and end use diversification
Capitalize on regulatory changes driving growth in
sustainable technologies
Coatings
Functional additives across a broad range of specialized
coatings applications
Chemical Process
Adsorbents and surface modifiers for plastics,
petrochemical, and other broad industrial end uses
Consumer/Pharma
Processing aids and customized, high purity products for
beverage, personal care, and pharmaceutical end uses
2016 Sales
By End Market By Region
Total
$0.4b
Total
$0.4b
$511
Constant
currency
Note: In 2016, we exited certain product lines that accounted for approx. $38M and $35M of
Materials Technologies sales in 2014 and 2015 respectively.
22 W. R. Grace & Co. | Confidential Goldman Sachs Conference | May 16, 2017
Business Overview
22 © 2017 W. R. Grace & Co.
Materials Technologies
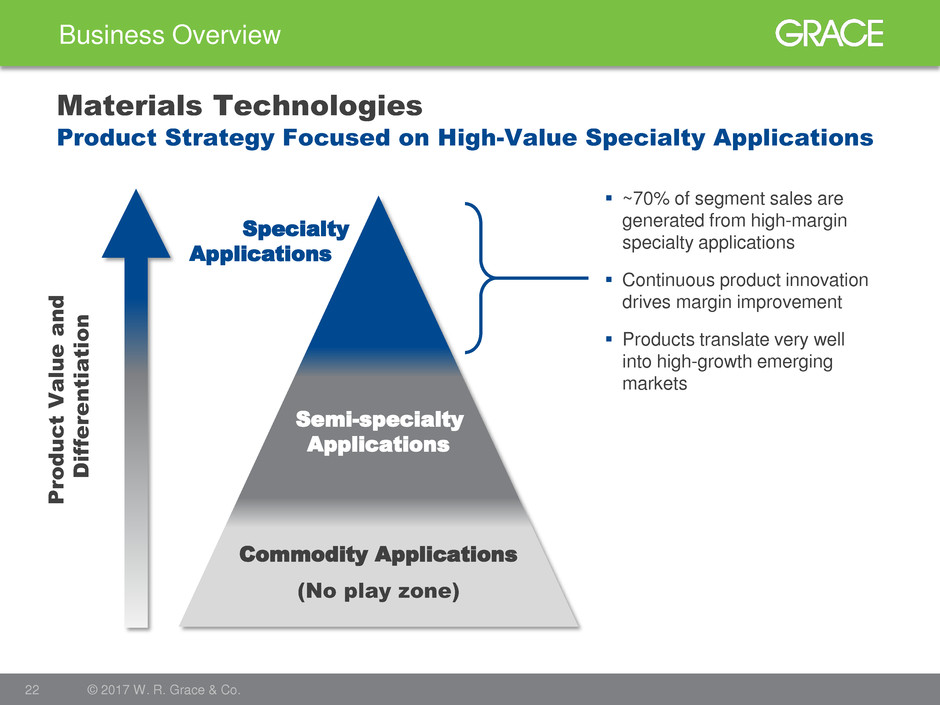
Specialty
Applications
Semi-specialty
Applications
Commodity Applications
Pro
d
u
c
t
V
alu
e
a
n
d
D
iff
e
re
n
tiatio
n
~70% of segment sales are
generated from high-margin
specialty applications
Continuous product innovation
drives margin improvement
Products translate very well
into high-growth emerging
markets
(No play zone)
Product Strategy Focused on High-Value Specialty Applications
23 W. R. Grace & Co. | Confidential Goldman Sachs Conference | May 16, 2017
Business Overview
23 © 2017 W. R. Grace & Co.
Materials Technologies
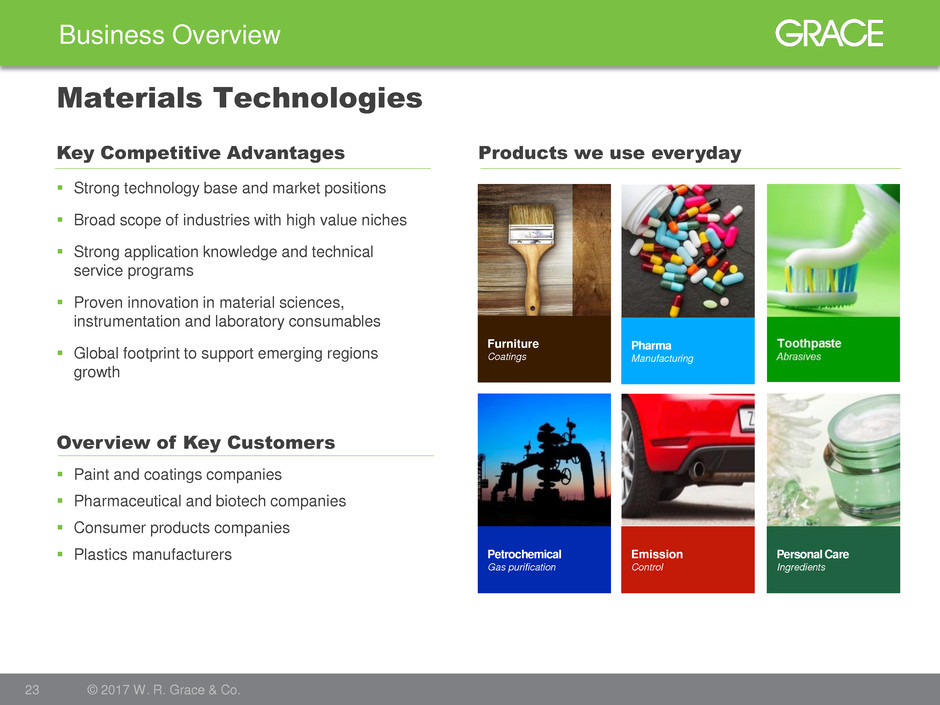
Strong technology base and market positions
Broad scope of industries with high value niches
Strong application knowledge and technical
service programs
Proven innovation in material sciences,
instrumentation and laboratory consumables
Global footprint to support emerging regions
growth
Overview of Key Customers
Key Competitive Advantages Products we use everyday
Paint and coatings companies
Pharmaceutical and biotech companies
Consumer products companies
Plastics manufacturers
Furniture
Coatings
Emission
Control
Petrochemical
Gas purification
Personal Care
Ingredients
Pharma
Manufacturing
24 W. R. Grace & Co. | Confidential Goldman Sachs Conference | May 16, 2017
Business Overview
24 © 2017 W. R. Grace & Co.
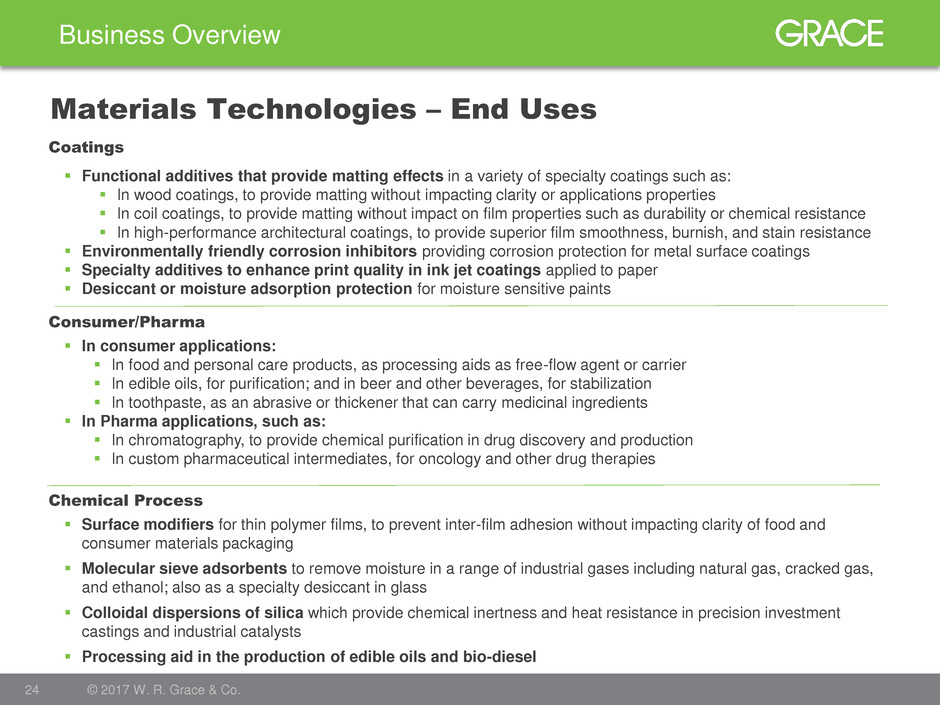
Materials Technologies – End Uses
Functional additives that provide matting effects in a variety of specialty coatings such as:
In wood coatings, to provide matting without impacting clarity or applications properties
In coil coatings, to provide matting without impact on film properties such as durability or chemical resistance
In high-performance architectural coatings, to provide superior film smoothness, burnish, and stain resistance
Environmentally friendly corrosion inhibitors providing corrosion protection for metal surface coatings
Specialty additives to enhance print quality in ink jet coatings applied to paper
Desiccant or moisture adsorption protection for moisture sensitive paints
In consumer applications:
In food and personal care products, as processing aids as free-flow agent or carrier
In edible oils, for purification; and in beer and other beverages, for stabilization
In toothpaste, as an abrasive or thickener that can carry medicinal ingredients
In Pharma applications, such as:
In chromatography, to provide chemical purification in drug discovery and production
In custom pharmaceutical intermediates, for oncology and other drug therapies
Surface modifiers for thin polymer films, to prevent inter-film adhesion without impacting clarity of food and
consumer materials packaging
Molecular sieve adsorbents to remove moisture in a range of industrial gases including natural gas, cracked gas,
and ethanol; also as a specialty desiccant in glass
Colloidal dispersions of silica which provide chemical inertness and heat resistance in precision investment
castings and industrial catalysts
Processing aid in the production of edible oils and bio-diesel
Coatings
Chemical Process
Consumer/Pharma
25 W. R. Grace & Co. | Confidential Goldman Sachs Conference | May 16, 2017
Business Overview
25 © 2017 W. R. Grace & Co.
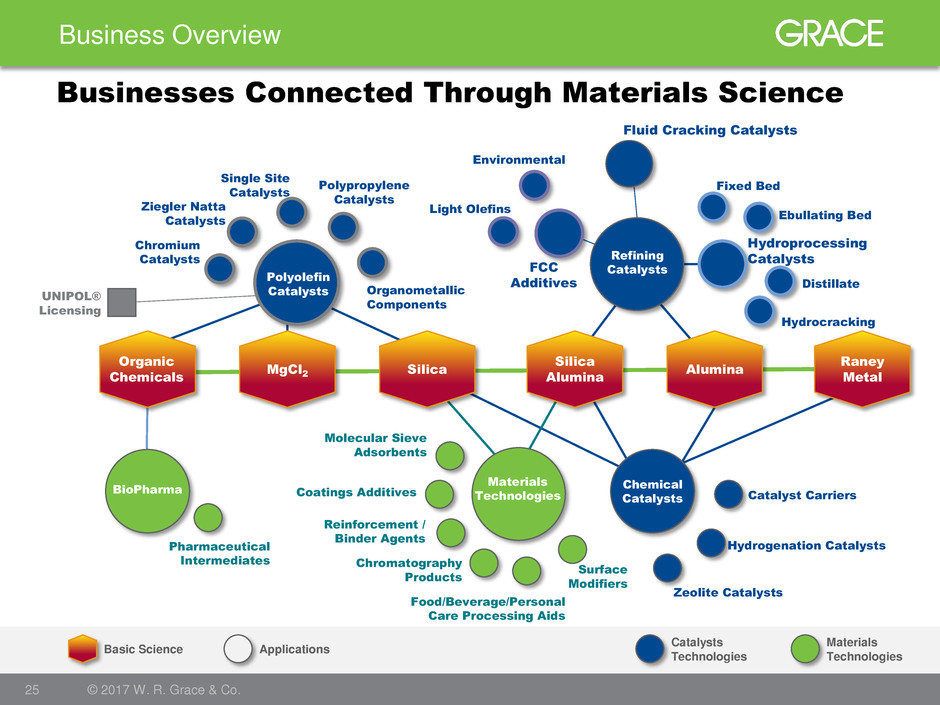
Applications Basic Science
Organic
Chemicals
MgCl2 Silica
Silica
Alumina
Alumina
Raney
Metal
BioPharma Chemical
Catalysts
Materials
Technologies
Polyolefin
Catalysts
Refining
Catalysts
Pharmaceutical
Intermediates
Molecular Sieve
Adsorbents
Coatings Additives
Reinforcement /
Binder Agents
Chromatography
Products
Food/Beverage/Personal
Care Processing Aids
Surface
Modifiers
Catalyst Carriers
Hydrogenation Catalysts
Zeolite Catalysts
Ebullating Bed
Distillate
Hydroprocessing
Catalysts
Fixed Bed
Hydrocracking
Fluid Cracking Catalysts
FCC
Additives
Light Olefins
Environmental
UNIPOL®
Licensing
Chromium
Catalysts
Ziegler Natta
Catalysts
Single Site
Catalysts
Organometallic
Components
Polypropylene
Catalysts
Catalysts
Technologies
Materials
Technologies
Businesses Connected Through Materials Science

26 W. R. Grace & Co. | Confidential Goldman Sachs Conference | May 16, 2017
Capital Allocation and Structure
27 W. R. Grace & Co. | Confidential Goldman Sachs Conference | May 16, 2017
Capital Allocation and Structure
27 © 2017 W. R. Grace & Co.
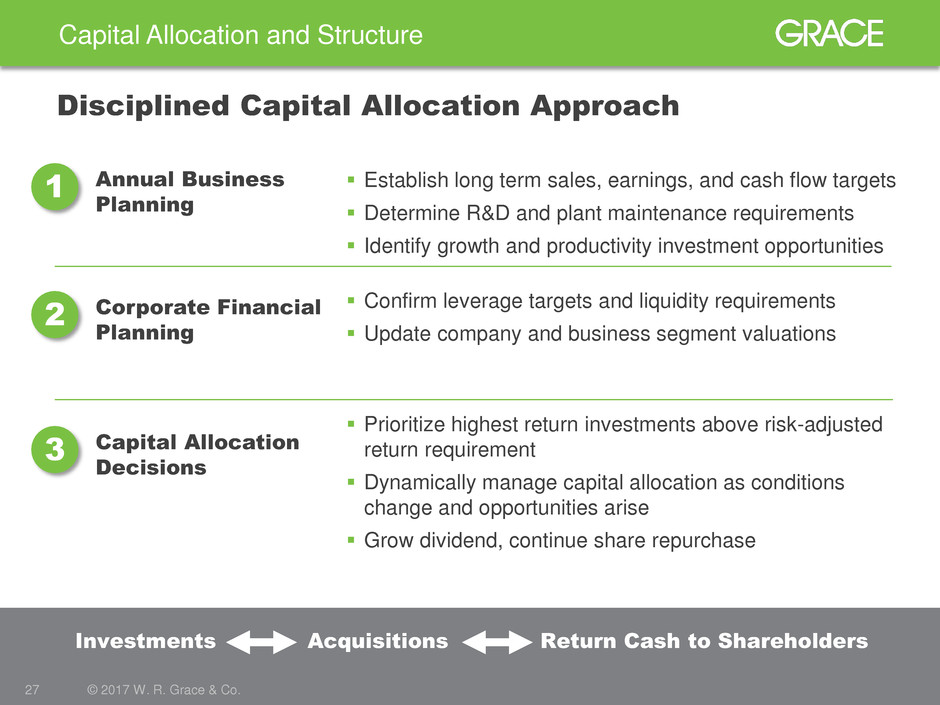
Disciplined Capital Allocation Approach
Annual Business
Planning
Corporate Financial
Planning
Capital Allocation
Decisions
Confirm leverage targets and liquidity requirements
Update company and business segment valuations
Establish long term sales, earnings, and cash flow targets
Determine R&D and plant maintenance requirements
Identify growth and productivity investment opportunities
Prioritize highest return investments above risk-adjusted
return requirement
Dynamically manage capital allocation as conditions
change and opportunities arise
Grow dividend, continue share repurchase
Investments Acquisitions Return Cash to Shareholders
1
2
3
28 W. R. Grace & Co. | Confidential Goldman Sachs Conference | May 16, 2017
Capital Allocation and Structure
28 © 2017 W. R. Grace & Co.
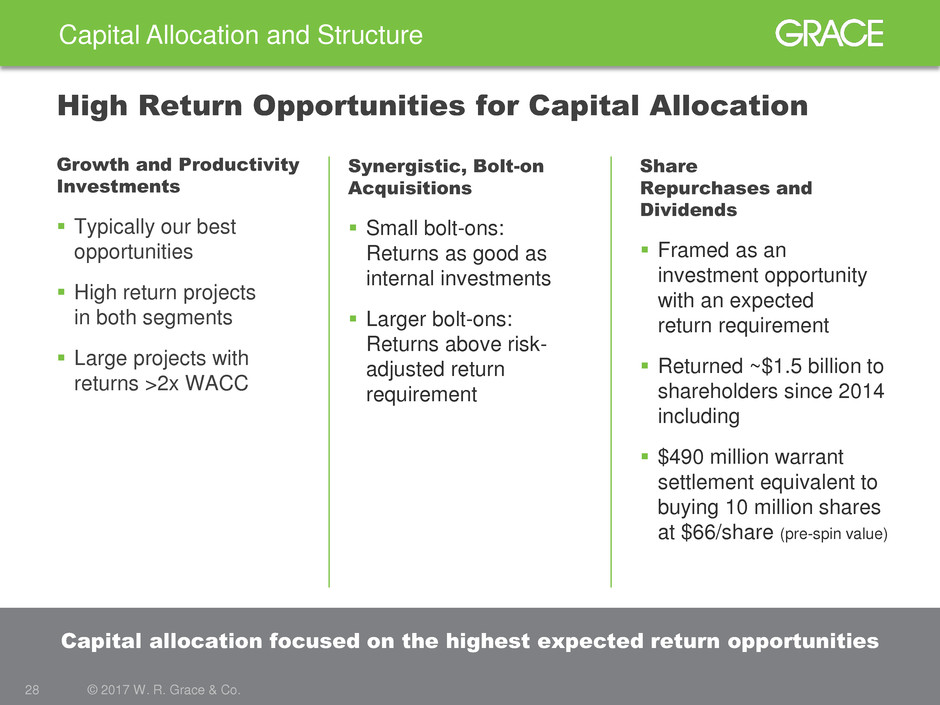
Capital allocation focused on the highest expected return opportunities
High Return Opportunities for Capital Allocation
Synergistic, Bolt-on
Acquisitions
Small bolt-ons:
Returns as good as
internal investments
Larger bolt-ons:
Returns above risk-
adjusted return
requirement
Share
Repurchases and
Dividends
Framed as an
investment opportunity
with an expected
return requirement
Returned ~$1.5 billion to
shareholders since 2014
including
$490 million warrant
settlement equivalent to
buying 10 million shares
at $66/share (pre-spin value)
Growth and Productivity
Investments
Typically our best
opportunities
High return projects
in both segments
Large projects with
returns >2x WACC
29 W. R. Grace & Co. | Confidential Goldman Sachs Conference | May 16, 2017
Capital Allocation and Structure
29 © 2017 W. R. Grace & Co.
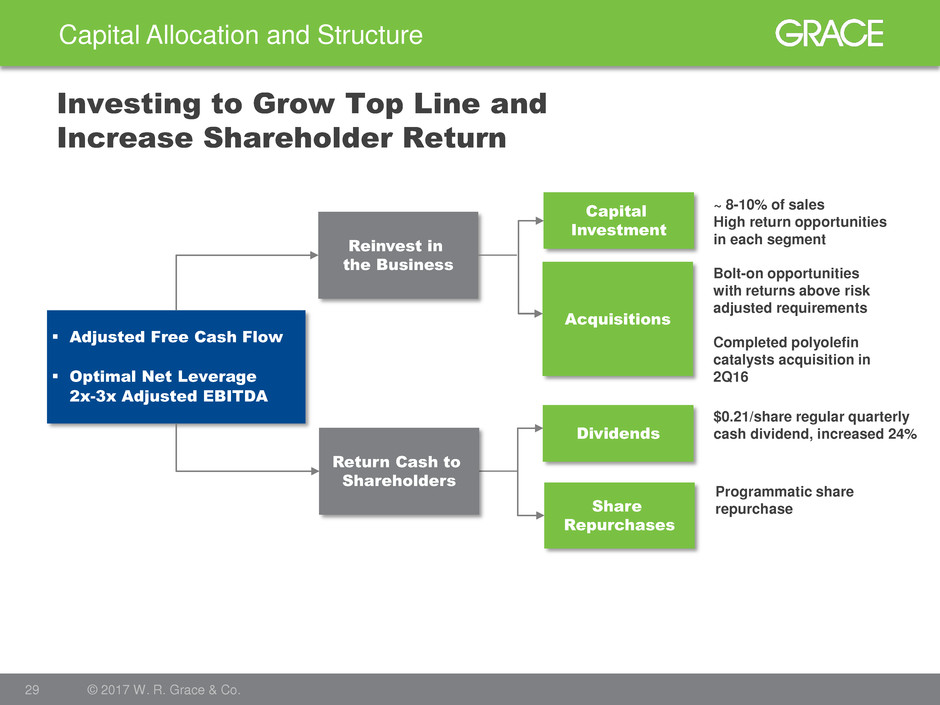
Investing to Grow Top Line and
Increase Shareholder Return
Adjusted Free Cash Flow
Optimal Net Leverage
2x-3x Adjusted EBITDA
Reinvest in
the Business
Capital
Investment
Acquisitions
Share
Repurchases
Dividends
~ 8-10% of sales
High return opportunities
in each segment
Bolt-on opportunities
with returns above risk
adjusted requirements
Completed polyolefin
catalysts acquisition in
2Q16
Return Cash to
Shareholders
Programmatic share
repurchase
$0.21/share regular quarterly
cash dividend, increased 24%
30 W. R. Grace & Co. | Confidential Goldman Sachs Conference | May 16, 2017
Capital Allocation and Structure
30 © 2017 W. R. Grace & Co.
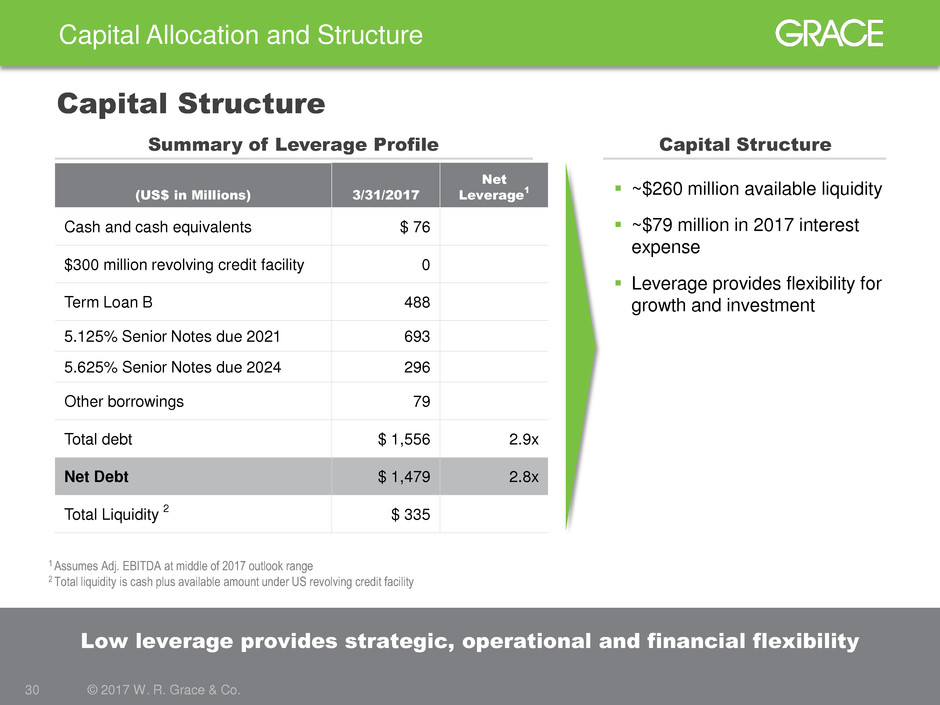
Low leverage provides strategic, operational and financial flexibility
Capital Structure
Summary of Leverage Profile
~$260 million available liquidity
~$79 million in 2017 interest
expense
Leverage provides flexibility for
growth and investment
Capital Structure
1 Assumes Adj. EBITDA at middle of 2017 outlook range
2 Total liquidity is cash plus available amount under US revolving credit facility
(US$ in Millions) 3/31/2017
Net
Leverage
1
Cash and cash equivalents $ 76
$300 million revolving credit facility 0
Term Loan B 488
5.125% Senior Notes due 2021 693 X
5.625% Senior Notes due 2024 296 X
Other borrowings 79 x
Total debt $ 1,556 2.9x
Net Debt $ 1,479 2.8x
Total Liquidity
2
$ 335
31 W. R. Grace & Co. | Confidential Goldman Sachs Conference | May 16, 2017
Appendix
32 W. R. Grace & Co. | Confidential Goldman Sachs Conference | May 16, 2017
Appendix – Additional Information
32 © 2017 W. R. Grace & Co.
Trademark Notices
GRACE®, ACHIEVE®, MIDAS® GOLD, MAGNAPORE®, CONSISTA®, SmART Catalyst System® (Stylized),
SYLOID®, SYLOBLOC®, LUDOX®, SYLOBEAD®, CBA®, ADVA®, HEA2®, DCI®, are trademarks, registered in
the United States and/or other countries, of W. R. Grace & Co.-Conn.
TALENT | TECHNOLOGY | TRUST™ is a trademark of W. R. Grace & Co.-Conn.
UNIPOL® is a trademark of The Dow Chemical Company or an affiliated company of Dow. W. R. Grace & Co.-
Conn. and/or its affiliates are licensed to use the UNIPOL trademark in the area of polypropylene.
SIX SIGMA® is a trademark, registered in the United States and/or other countries, of Motorola, Inc.
This trademark list has been compiled using available published information as of the publication date of this
brochure and may not accurately reflect current trademark ownership or status. © Copyright 2017 W. R. Grace
& Co.-Conn. All rights reserved.
33 W. R. Grace & Co. | Confidential Goldman Sachs Conference | May 16, 2017 © 2017 W. R. Grace & Co. 33
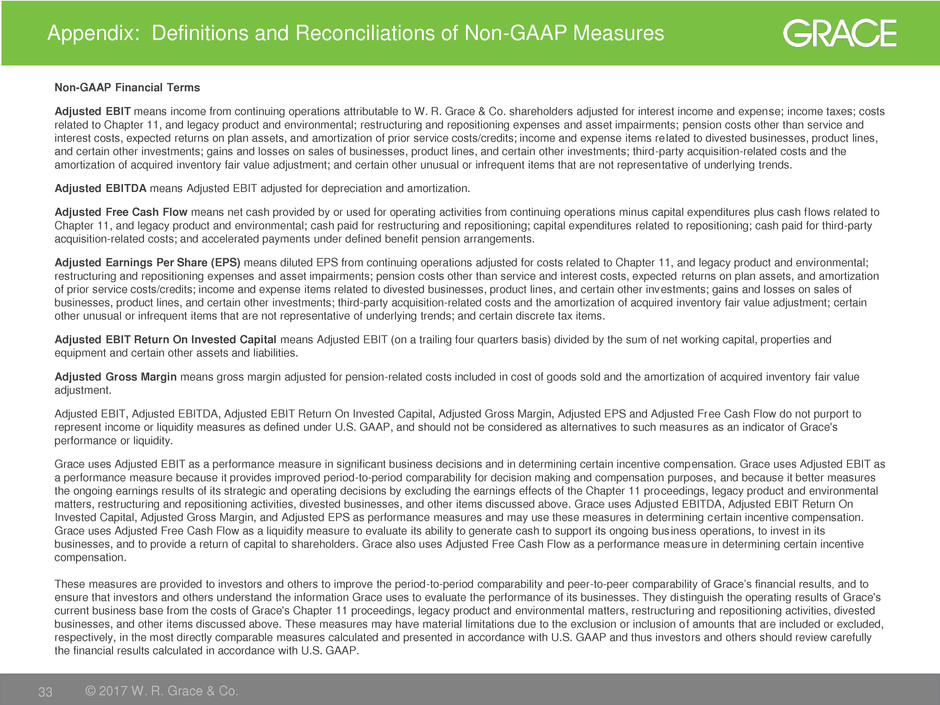
Appendix: Definitions and Reconciliations of Non-GAAP Measures
Non-GAAP Financial Terms
Adjusted EBIT means income from continuing operations attributable to W. R. Grace & Co. shareholders adjusted for interest income and expense; income taxes; costs
related to Chapter 11, and legacy product and environmental; restructuring and repositioning expenses and asset impairments; pension costs other than service and
interest costs, expected returns on plan assets, and amortization of prior service costs/credits; income and expense items related to divested businesses, product lines,
and certain other investments; gains and losses on sales of businesses, product lines, and certain other investments; third-party acquisition-related costs and the
amortization of acquired inventory fair value adjustment; and certain other unusual or infrequent items that are not representative of underlying trends.
Adjusted EBITDA means Adjusted EBIT adjusted for depreciation and amortization.
Adjusted Free Cash Flow means net cash provided by or used for operating activities from continuing operations minus capital expenditures plus cash flows related to
Chapter 11, and legacy product and environmental; cash paid for restructuring and repositioning; capital expenditures related to repositioning; cash paid for third-party
acquisition-related costs; and accelerated payments under defined benefit pension arrangements.
Adjusted Earnings Per Share (EPS) means diluted EPS from continuing operations adjusted for costs related to Chapter 11, and legacy product and environmental;
restructuring and repositioning expenses and asset impairments; pension costs other than service and interest costs, expected returns on plan assets, and amortization
of prior service costs/credits; income and expense items related to divested businesses, product lines, and certain other investments; gains and losses on sales of
businesses, product lines, and certain other investments; third-party acquisition-related costs and the amortization of acquired inventory fair value adjustment; certain
other unusual or infrequent items that are not representative of underlying trends; and certain discrete tax items.
Adjusted EBIT Return On Invested Capital means Adjusted EBIT (on a trailing four quarters basis) divided by the sum of net working capital, properties and
equipment and certain other assets and liabilities.
Adjusted Gross Margin means gross margin adjusted for pension-related costs included in cost of goods sold and the amortization of acquired inventory fair value
adjustment.
Adjusted EBIT, Adjusted EBITDA, Adjusted EBIT Return On Invested Capital, Adjusted Gross Margin, Adjusted EPS and Adjusted Free Cash Flow do not purport to
represent income or liquidity measures as defined under U.S. GAAP, and should not be considered as alternatives to such measures as an indicator of Grace's
performance or liquidity.
Grace uses Adjusted EBIT as a performance measure in significant business decisions and in determining certain incentive compensation. Grace uses Adjusted EBIT as
a performance measure because it provides improved period-to-period comparability for decision making and compensation purposes, and because it better measures
the ongoing earnings results of its strategic and operating decisions by excluding the earnings effects of the Chapter 11 proceedings, legacy product and environmental
matters, restructuring and repositioning activities, divested businesses, and other items discussed above. Grace uses Adjusted EBITDA, Adjusted EBIT Return On
Invested Capital, Adjusted Gross Margin, and Adjusted EPS as performance measures and may use these measures in determining certain incentive compensation.
Grace uses Adjusted Free Cash Flow as a liquidity measure to evaluate its ability to generate cash to support its ongoing business operations, to invest in its
businesses, and to provide a return of capital to shareholders. Grace also uses Adjusted Free Cash Flow as a performance measure in determining certain incentive
compensation.
These measures are provided to investors and others to improve the period-to-period comparability and peer-to-peer comparability of Grace’s financial results, and to
ensure that investors and others understand the information Grace uses to evaluate the performance of its businesses. They distinguish the operating results of Grace's
current business base from the costs of Grace's Chapter 11 proceedings, legacy product and environmental matters, restructuring and repositioning activities, divested
businesses, and other items discussed above. These measures may have material limitations due to the exclusion or inclusion of amounts that are included or excluded,
respectively, in the most directly comparable measures calculated and presented in accordance with U.S. GAAP and thus investors and others should review carefully
the financial results calculated in accordance with U.S. GAAP.
34 W. R. Grace & Co. | Confidential Goldman Sachs Conference | May 16, 2017 © 2017 W. R. Grace & Co. 34
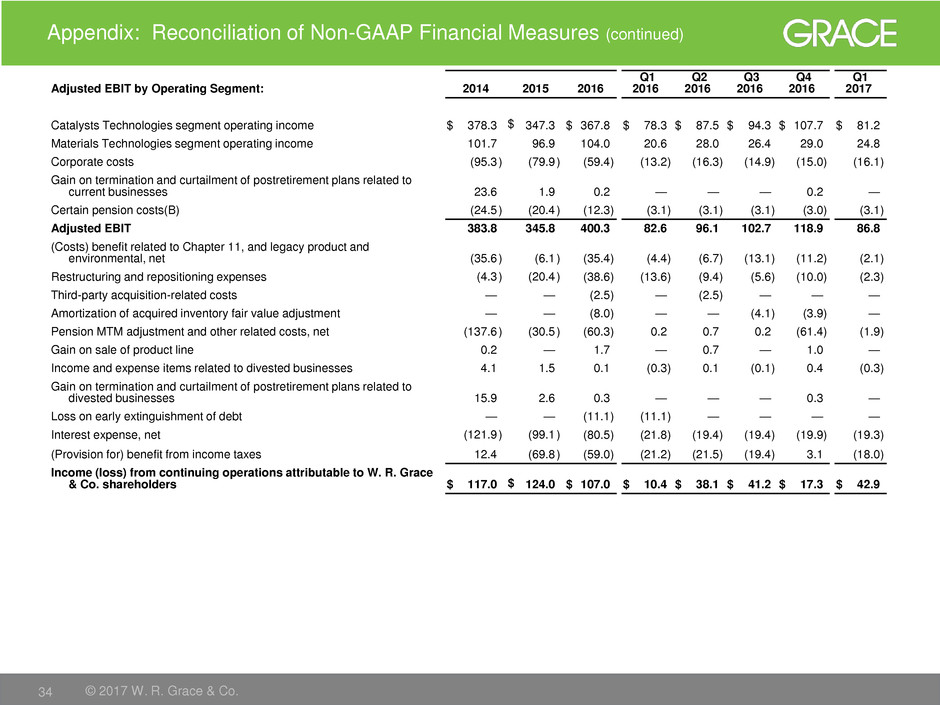
Appendix: Reconciliation of Non-GAAP Financial Measures (continued)
Adjusted EBIT by Operating Segment: 2014 2015 2016
Q1
2016
Q2
2016
Q3
2016
Q4
2016
Q1
2017
Catalysts Technologies segment operating income $ 378.3 $
347.3 $ 367.8 $ 78.3 $ 87.5 $ 94.3 $ 107.7 $ 81.2
Materials Technologies segment operating income 101.7 96.9 104.0 20.6 28.0 26.4 29.0 24.8
Corporate costs (95.3 ) (79.9 ) (59.4 ) (13.2 ) (16.3 ) (14.9 ) (15.0 ) (16.1 )
Gain on termination and curtailment of postretirement plans related to
current businesses 23.6 1.9 0.2 — — — 0.2 —
Certain pension costs(B) (24.5 ) (20.4 ) (12.3 ) (3.1 ) (3.1 ) (3.1 ) (3.0 ) (3.1 )
Adjusted EBIT 383.8 345.8 400.3 82.6 96.1 102.7 118.9 86.8
(Costs) benefit related to Chapter 11, and legacy product and
environmental, net (35.6 ) (6.1 ) (35.4 ) (4.4 ) (6.7 ) (13.1 ) (11.2 ) (2.1 )
Restructuring and repositioning expenses (4.3 ) (20.4 ) (38.6 ) (13.6 ) (9.4 ) (5.6 ) (10.0 ) (2.3 )
Third-party acquisition-related costs — — (2.5 ) — (2.5 ) — — —
Amortization of acquired inventory fair value adjustment — — (8.0 ) — — (4.1 ) (3.9 ) —
Pension MTM adjustment and other related costs, net (137.6 ) (30.5 ) (60.3 ) 0.2 0.7 0.2 (61.4 ) (1.9 )
Gain on sale of product line 0.2 — 1.7 — 0.7 — 1.0 —
Income and expense items related to divested businesses 4.1 1.5 0.1 (0.3 ) 0.1 (0.1 ) 0.4 (0.3 )
Gain on termination and curtailment of postretirement plans related to
divested businesses 15.9 2.6 0.3 — — — 0.3 —
Loss on early extinguishment of debt — — (11.1 ) (11.1 ) — — — —
Interest expense, net (121.9 ) (99.1 ) (80.5 ) (21.8 ) (19.4 ) (19.4 ) (19.9 ) (19.3 )
(Provision for) benefit from income taxes 12.4 (69.8 ) (59.0 ) (21.2 ) (21.5 ) (19.4 ) 3.1 (18.0 )
Income (loss) from continuing operations attributable to W. R. Grace
& Co. shareholders $ 117.0 $
124.0 $ 107.0 $ 10.4 $ 38.1 $ 41.2 $ 17.3 $ 42.9
35 W. R. Grace & Co. | Confidential Goldman Sachs Conference | May 16, 2017 © 2017 W. R. Grace & Co. 35
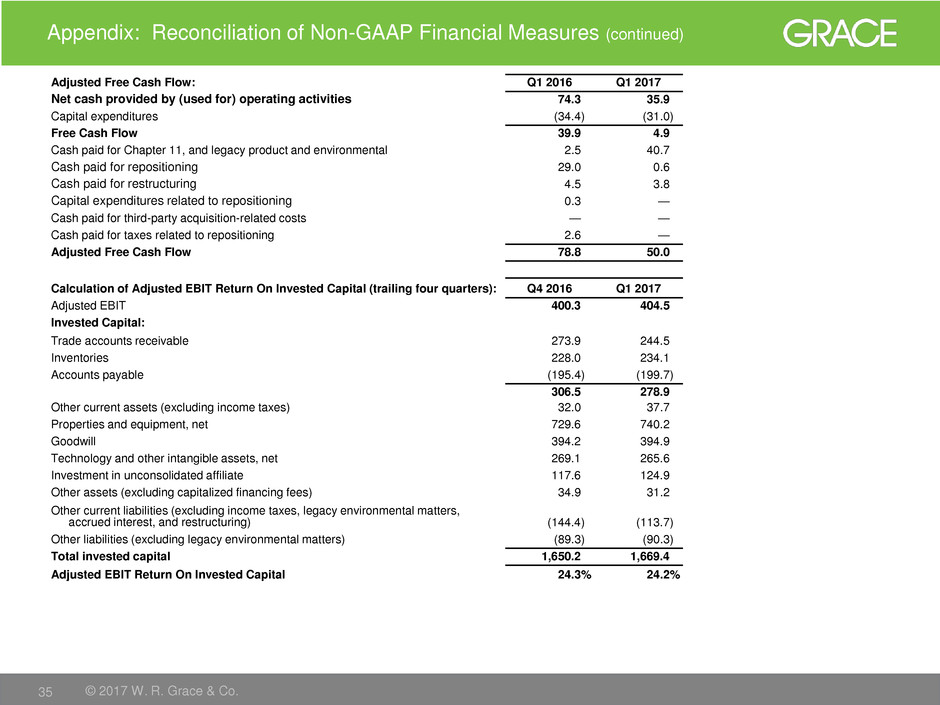
Appendix: Reconciliation of Non-GAAP Financial Measures (continued)
Adjusted Free Cash Flow: Q1 2016 Q1 2017
Net cash provided by (used for) operating activities 74.3 35.9
Capital expenditures (34.4 ) (31.0 )
Free Cash Flow 39.9 4.9
Cash paid for Chapter 11, and legacy product and environmental 2.5 40.7
Cash paid for repositioning 29.0 0.6
Cash paid for restructuring 4.5 3.8
Capital expenditures related to repositioning 0.3 —
Cash paid for third-party acquisition-related costs — —
Cash paid for taxes related to repositioning 2.6 —
Adjusted Free Cash Flow 78.8 50.0
Calculation of Adjusted EBIT Return On Invested Capital (trailing four quarters): Q4 2016 Q1 2017
Adjusted EBIT 400.3 404.5
Invested Capital:
Trade accounts receivable 273.9 244.5
Inventories 228.0 234.1
Accounts payable (195.4 ) (199.7 )
306.5 278.9
Other current assets (excluding income taxes) 32.0 37.7
Properties and equipment, net 729.6 740.2
Goodwill 394.2 394.9
Technology and other intangible assets, net 269.1 265.6
Investment in unconsolidated affiliate 117.6 124.9
Other assets (excluding capitalized financing fees) 34.9 31.2
Other current liabilities (excluding income taxes, legacy environmental matters,
accrued interest, and restructuring) (144.4 ) (113.7 )
Other liabilities (excluding legacy environmental matters) (89.3 ) (90.3 )
Total invested capital 1,650.2 1,669.4
Adjusted EBIT Return On Invested Capital 24.3 % 24.2 %
36 W. R. Grace & Co. | Confidential Goldman Sachs Conference | May 16, 2017 © 2017 W. R. Grace & Co. 36
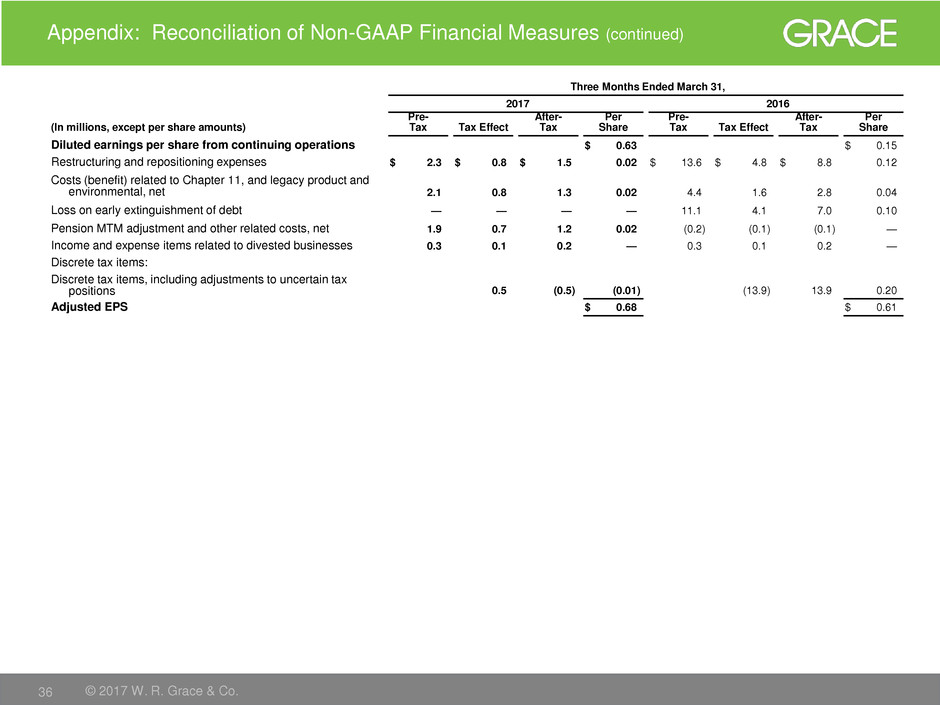
Appendix: Reconciliation of Non-GAAP Financial Measures (continued)
Three Months Ended March 31,
2017 2016
(In millions, except per share amounts)
Pre-
Tax Tax Effect
After-
Tax
Per
Share
Pre-
Tax Tax Effect
After-
Tax
Per
Share
Diluted earnings per share from continuing operations $ 0.63 $ 0.15
Restructuring and repositioning expenses $ 2.3 $ 0.8 $ 1.5 0.02 $ 13.6 $ 4.8 $ 8.8 0.12
Costs (benefit) related to Chapter 11, and legacy product and
environmental, net 2.1 0.8 1.3 0.02 4.4 1.6 2.8 0.04
Loss on early extinguishment of debt — — — — 11.1 4.1 7.0 0.10
Pension MTM adjustment and other related costs, net 1.9 0.7 1.2 0.02 (0.2 ) (0.1 ) (0.1 ) —
Income and expense items related to divested businesses 0.3 0.1 0.2 — 0.3 0.1 0.2 —
Discrete tax items:
Discrete tax items, including adjustments to uncertain tax
positions 0.5 (0.5 ) (0.01 ) (13.9 ) 13.9 0.20
Adjusted EPS $ 0.68 $ 0.61
