Attached files
| file | filename |
|---|---|
| EX-21 - EXHIBIT 21 - W R GRACE & CO | a2196633zex-21.htm |
| EX-24 - EXHIBIT 24 - W R GRACE & CO | a2196633zex-24.htm |
UNITED STATES
SECURITIES AND EXCHANGE COMMISSION
Washington, D.C. 20549
FORM 10-K
ANNUAL REPORT PURSUANT TO SECTION 13 OR 15(d) OF
THE SECURITIES EXCHANGE ACT OF 1934
| For the fiscal year ended December 31, 2009 | Commission file number 1-13953 |
W. R. GRACE & CO.
| Incorporated under the Laws of the State of Delaware |
I.R.S. Employer Identification No. 65-0773649 |
7500 Grace Drive, Columbia, Maryland 21044-4098
(410) 531-4000
Securities registered pursuant to Section 12(b) of the Exchange Act:
| Title of each class | Name of each exchange on which registered | |
|---|---|---|
| Common Stock, $.01 par value Preferred Stock Purchase Rights |
New York Stock Exchange, Inc. |
Securities registered pursuant to Section 12(g) of the Exchange Act:
None
Indicate by check mark if the registrant is a well-known seasoned issuer, as defined in Rule 405 of the Securities Act. Yes o No ý
Indicate by check mark if the registrant is not required to file reports pursuant to Section 13 or 15(d) of the Exchange Act. Yes o No ý
Indicate by check mark whether the registrant (1) has filed all reports required to be filed by Section 13 or 15(d) of the Securities Exchange Act of 1934 during the preceding 12 months and (2) has been subject to such filing requirements for the past 90 days. Yes ý No o
Indicate by check mark if disclosure of delinquent filers pursuant to Item 405 of Regulations S-K is not contained herein and will not be contained, to the best of registrant's knowledge, in definitive proxy or information statements incorporated by reference in Part III of this Form 10-K or any amendment to this Form 10-K. ý
Indicate by check mark whether the registrant has submitted electronically and posted on its corporate Web site, if any, every Interactive Data File required to be submitted and posted pursuant to Rule 405 of Regulation S-T (§232.405 of this chapter) during the preceding 12 months (or for such shorter period that the registrant was required to submit and post such files). Yes o No o
Indicate by check mark whether the registrant is a large accelerated filer, an accelerated filer, a non-accelerated filer, or a smaller reporting company. See the definitions of "large accelerated filer," "accelerated filer," and "smaller reporting company" in Rule 12b-2 of the Exchange Act.
| Large accelerated filer ý | Accelerated filer o | Non-accelerated filer o (Do not check if a smaller reporting company) |
Smaller reporting company o |
Indicate by check mark whether the registrant is a shell company (as defined in Rule 12b-2 of the Exchange Act). Yes o No ý
The aggregate market value of W. R. Grace & Co. voting and non-voting common equity held by non-affiliates as of June 30, 2009 (the last business day of the registrant's most recently completed second fiscal quarter) based on the closing sale price of $12.37 as reported on the New York Stock Exchange was $617,329,093.*
At January 31, 2010, 72,322,118 shares of W. R. Grace & Co. Common Stock, $.01 par value, were outstanding.
DOCUMENTS INCORPORATED BY REFERENCE
None.
- *
- Based on 49,905,343 shares of W. R. Grace & Co. ("Grace") Common Stock, $.01 par value, held by non-affiliates (72,160,218 shares outstanding as of June 30, 2009 less 22,254,875 shares held by stockholders, whose beneficial ownership exceeds 10% of the outstanding shares of Grace Common Stock, as listed in the Grace 2008 Annual Report on Form 10-K as filed with the SEC on March 2, 2009, directors and named executive officers). Exclusion of shares held by any person should not be construed to indicate that such person possesses the power, direct or indirect, to direct or cause the direction of the management or policies of Grace, or that such person is controlled by or under common control with Grace.
Grace®, Grace® logo and, except as otherwise indicated, the other trademarks, service marks or trade names used in the text of this report are trademarks, service marks or trade names of operating units of W. R. Grace & Co. or its affiliates and/or subsidiaries. Responsible Care® is a trademark, registered in the United States and/or other countries, of the American Chemistry Council. OCR® is a trademark, registered in the United States and/or other countries, of Chevron Intellectual Property, LLC.
Unless the context otherwise indicates, in this document the terms "Grace," "we," "us," "our" or "the company" mean W. R. Grace & Co. and/or its consolidated subsidiaries and affiliates. Unless otherwise indicated, the contents of websites mentioned in this report are not incorporated by reference or otherwise made a part of this report.
BUSINESS OVERVIEW
W. R. Grace & Co. is engaged in the production and sale of specialty chemicals and specialty materials on a global basis through its two operating segments, Grace Davison and Grace Construction Products. We entered the specialty chemicals industry in 1954, when we acquired both the Dewey and Almy Chemical Company and the Davison Chemical Company. During the 1980s and 1990s, we divested a substantial number of businesses that were not then consistent with our business strategy. Grace is the successor to a company that originated in 1854 and originally became a public company in 1953.
In 2001, Grace and 61 of its United States subsidiaries and affiliates filed voluntary petitions for reorganization under Chapter 11 of the United States Bankruptcy Code and, since then, has been subject to the jurisdiction of the United States Bankruptcy Court for the District of Delaware.
In the fourth quarter of 2007, we realigned our reportable operating segments to reflect the transfer of our packaging technologies product line to the Grace Davison operating segment. Our previous Grace Performance Chemicals operating segment was renamed "Grace Construction Products" as a result of the transfer. All segment information contained herein reflects this realignment.
On November 30, 2009, we completed the sale of a 5% interest in Advanced Refining Technologies LLC, or ART, to our partner Chevron Products Company. We reduced our 55% interest to 50% to achieve a balanced ownership structure with Chevron. We deconsolidated ART's results from our consolidated financial statements on a prospective basis effective December 1, 2009. Previously, we reported 100% of ART's sales and 55% of ART's income, with the remaining 45% of ART's income reported as income attributable to noncontrolling interests.
Grace Davison markets its products primarily to a wide range of industrial customers, including those in the energy and refining industry, consumer, industrial and packaging industries, petro-/bio- chemical industries and the pharmaceutical and life sciences industries. Grace Davison includes the following product groups:
- •
- Refining Technologies, which includes:
- •
- fluid catalytic cracking, or FCC, catalysts, that help to "crack" the hydrocarbon chain in distilled crude oil to produce
transportation fuels, such as gasoline and diesel fuels, and other petroleum-based products; and FCC additives used to reduce sulfur in gasoline, maximize propylene production from refinery FCC units,
and reduce emissions of sulfur oxides, nitrogen oxides and carbon monoxide from refinery FCC units, and
- •
- hydroprocessing catalysts, marketed through our ART joint venture with Chevron, in which Grace holds a 50% economic
interest, that are used in process reactors to upgrade heavy oils into lighter, more useful products by removing impurities such as nitrogen, sulfur and heavy metals, allowing less expensive
feedstocks to be used in the petroleum refining process;
- •
- Materials Technologies which includes:
- •
- silica-based and silica-alumina-based engineered materials used in:
- •
- industrial applications, such as rubber and tires, precision investment casting, refractory, insulating glass windows, and drying applications, fulfilling various functions such as reinforcement, high temperature binding and moisture scavenging,
1
- •
- consumer applications, as a free-flow agent, carrier or processing aid in food and personal care products; as
a toothpaste abrasive; and for the processing and stabilization of edible oils and beverages,
- •
- coatings and print media applications, consisting of functional additives that provide matting effects and corrosion
protection for industrial coatings, enable enhanced media and paper quality in ink jet coatings, and act as a functional filler and retention aid in paper,
- •
- sealants and coatings used in rigid food and beverage packaging, including can and closure sealants used to seal and
enhance the shelf life of can and bottle contents, and coatings for cans and closures that prevent metal corrosion, protect package contents from the influence of metal and ensure proper adhesion of
sealing compounds and technologies designed to reduce off-taste effects and extend the shelf-life of packaged products; and
- •
- Specialty Technologies, which includes:
- •
- polyolefin catalysts and catalyst supports that are essential components in the manufacture of polyethylene and
polypropylene resins, and other chemical catalysts and process technologies used in a variety of industrial, environmental and consumer applications,
- •
- catalysts and adsorbents for the efficient conversion of renewable feedstocks to fuels and chemicals,
- •
- silica-based separation media and complementary purification products including chromatography columns and consumables
used in the pharmaceutical, life science and related industries, silica excipients used in pharmaceutical formulations and CO2 adsorbents used in anesthesiology and mine safety
applications, and
- •
- instrumentation and reference standards used in the pharmaceutical, life science and related industries.
Grace Davison accounted for approximately 68.5% of our 2009 sales.
Grace Construction Products, or GCP, produces and sells specialty construction chemicals and specialty building materials, including:
- •
- concrete admixtures and fibers used to modify the rheology, improve the durability and enhance various other properties of
concrete, mortar, masonry and other cementitious construction materials;
- •
- additives used in cement processing to improve energy efficiency in manufacturing, enhance the characteristics of finished
cement and improve ease of use;
- •
- building materials used in commercial and residential construction and renovation to protect buildings and civil
engineering structures from water, vapor and air penetration; and
- •
- fireproofing materials used to retard the spread of fire in buildings.
Grace Construction Products accounted for approximately 31.5% of our 2009 sales.
Our principal executive offices are located at 7500 Grace Drive, Columbia, Maryland 21044, telephone (410) 531-4000. As of December 31, 2009, we had approximately 5,940 global employees.
2
Global Scope
We operate our business on a global scale with approximately 69% of our 2009 sales outside the United States. We conduct business in over 40 countries and in more than 30 currencies. We manage our operating segments on a global basis, to serve global markets. Currency fluctuations in relation to the U.S. dollar affect our reported results of operations, cash flows, and financial position.
Strategy Overview
Our strategy is to seek increased enterprise value by profitably growing our specialty chemicals and specialty materials businesses in the global marketplace and achieving high levels of efficiency. To achieve these objectives, we plan to:
- •
- invest in research and development activities, with the goal of introducing new high-performance, technically
differentiated products and services while continuing to enhance manufacturing processes and operations;
- •
- expand sales and manufacturing into emerging economies, including China, India, Eastern Europe, the Middle East and Latin
America;
- •
- pursue selected acquisitions and alliances that complement our current product offerings or provide opportunities for
faster penetration of desirable market or geographic segments; and
- •
- continue our commitment to process and productivity improvements and cost-management, such as rigorous controls on working capital and capital spending, integration of functional support services worldwide, and programs for supply chain management, which include both procurement and materials management.
CHAPTER 11 FILING
On April 2, 2001, Grace, along with 61 of our United States subsidiaries and affiliates, filed voluntary petitions for reorganization under Chapter 11 of the United States Bankruptcy Code in the United States Bankruptcy Court for the District of Delaware. The cases are being jointly administered under case number 01-01139. Our non-U.S. subsidiaries and certain of our U.S. subsidiaries were not included in the bankruptcy filing.
Background of Chapter 11
A bankruptcy filing under Chapter 11 of the United States Bankruptcy Code is generally a voluntary action taken by a debtor to resolve financial problems such as major liabilities. Chapter 11 gives a debtor the chance to restructure its finances so that it may continue to operate, provide its employees with jobs and pay its creditors. Chapter 11 can be used by debtors that are faced with large numbers of product liability lawsuits in multiple jurisdictions to provide a practical way to address the potential liabilities under the supervision of one court. A Chapter 11 filing generally stops all lawsuits against a debtor and prevents creditors from taking action to enforce claims or collect any monies or property that might be owed at the time of filing.
Chapter 11 permits a debtor to define and resolve its liabilities under a court-supervised process generally referred to as a reorganization. Unlike a Chapter 7, or liquidation bankruptcy, which results in the sale or distribution of all of the assets of a business, Chapter 11 reorganization permits a debtor to continue its normal business operations. Existing management may continue to manage the debtor's operations during the reorganization. As a debtor-in-possession, a debtor is able to do business with suppliers and customers in a routine manner. Certain other activities, including transactions outside the ordinary course of business, generally require specific approval of the bankruptcy court.
3
After a debtor files Chapter 11, one or more official committees that represent the interests of general unsecured creditors, other creditors and stockholders may be appointed. Normally these committees and their respective advisors are actively involved in the process to monitor the bankruptcy and protect the interests of their respective constituencies. The fees and expenses of these committees and advisors are paid by the debtor.
The Chapter 11 process generally ends when the bankruptcy court approves a plan of reorganization for the debtor. In cases similar to ours with complex asbestos liabilities, debtors have taken several years to complete the Chapter 11 process.
Grace Chapter 11 Filing
We voluntarily entered Chapter 11 to resolve comprehensively the nearly 130,000 asbestos personal injury and property damage claims against us, as well as any future demands which may be asserted. These claims and demands relate to past products and processes that involved asbestos, a mineral formerly used widely for many decades in building and other commercial products. Prior to 2000, we were able to resolve asbestos-related claims through direct negotiations and litigation, paying over $2 billion in claims and legal costs over a 20-year period. In most of the personal injury lawsuits, we are one of many defendants. In 2000 and the first quarter of 2001, the litigation environment changed with an unexpected 81% increase in personal injury claims filed against us, which we believe was caused by a surge in unmeritorious claims. We also became a defendant in class action lawsuits alleging damages from Zonolite® Attic Insulation, or ZAI, a former attic insulation product. Trends in claims filing and settlement demands showed no sign of returning to historic levels and these unfavorable trends were exacerbated by the bankruptcy filings of several of our co-defendants in asbestos personal injury litigation. These trends greatly increased the risk that we would not be able to resolve our pending and future asbestos-related claims under the state court system.
After a thorough review of these developments, our Board of Directors concluded that a federal court-supervised bankruptcy process provided the best forum available to achieve fairness in resolving these claims and demands. On April 2, 2001, we, along with 61 of our United States subsidiaries and affiliates, filed voluntary petitions for reorganization under Chapter 11 of the United States Bankruptcy Code in the United States Bankruptcy Court for the District of Delaware, referred to herein as the Bankruptcy Court. Since that time, we have been subject to the jurisdiction of the Bankruptcy Court.
We are currently operating as a debtor-in-possession under court protection from creditors and claimants. We believe that our bankruptcy filing will permit a comprehensive resolution of the claims against us, while preserving the inherent value of our businesses. As a consequence of our bankruptcy filing, litigation against us as of the petition date is generally stayed (subject to certain exceptions in the case of governmental authorities), and no party may take any action to realize its pre-petition claims except pursuant to an order of the Bankruptcy Court. Since our bankruptcy filing, the Bankruptcy Court has approved all motions necessary for us to conduct normal business activities.
Four committees have been appointed in the bankruptcy cases, two representing asbestos claimants, a third representing other unsecured creditors and a fourth representing shareholders. These committees, a legal representative of future asbestos personal injury claimants and a legal representative of future asbestos property damage claimants, have the right to be heard on all matters that come before the Bankruptcy Court and are playing important roles in the bankruptcy cases. We are required to bear certain costs of the committees and of the representatives of future asbestos claimants, including those of their counsel and financial advisors.
4
See disclosure in this Report in Item 8 (Financial Statements and Supplementary Data) in the Financial Supplement under Note 2 (Chapter 11 Information) and Note 3 (Asbestos-Related Litigation) to the Consolidated Financial Statements for a description of our proposed joint plan of reorganization and the current status of our Chapter 11 cases.
PRODUCTS AND MARKETS
Specialty Chemicals and Materials Industry Overview
Specialty chemicals and specialty materials are high-value-added products used as catalysts, intermediates, components, protectants or additives in a wide variety of products and applications. They are generally produced in relatively small volumes (compared with commodity chemicals) and must satisfy well-defined performance requirements and specifications. Specialty chemicals and specialty materials are often critical components of end products, catalysts for the production of end products or components used in end products. Consequently, they are tailored to meet customer needs, which generally results in a close relationship between the producer and the customer.
We focus our business on the following, which we believe are important competitive factors in the specialty chemicals and specialty materials industry:
- •
- value-added products and services, sold at competitive prices;
- •
- customer service, including rapid response to changing customer needs;
- •
- technological leadership (resulting from investment in research and development and technical customer service); and
- •
- reliability of product and supply.
We believe that our focus on these competitive factors enables us to deliver increased value to customers and competitive operating margins notwithstanding the increased customer service and research and development costs that this focus entails.
Grace Davison Operating Segment
Grace Davison principally applies silica, alumina, zeolite and rubber and lattice technology in the design and manufacture of products to create significant value for our diverse customer base. Our customers include major oil refiners, plastics and chemical manufacturers, producers of rigid food and beverage packaging, coatings manufacturers, consumer product manufacturers and pharmaceutical companies. We believe that our technological expertise provides a competitive advantage, allowing us to quickly design products and materials that help our customers create value in their markets.
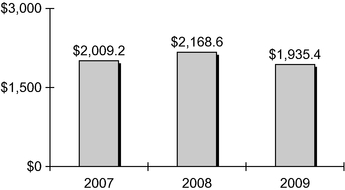
The following table sets forth Grace Davison sales of similar products as a percentage of Grace total revenue.
| |
2009 | 2008 | 2007 | ||||||||||||||||
|---|---|---|---|---|---|---|---|---|---|---|---|---|---|---|---|---|---|---|---|
| |
Sales | % of Grace Revenue |
Sales | % of Grace Revenue |
Sales | % of Grace Revenue |
|||||||||||||
| |
(In millions) |
||||||||||||||||||
Refining Technologies |
$ | 992.1 | 35.1 | % | $ | 1,099.1 | 33.1 | % | $ | 971.1 | 31.2 | % | |||||||
Materials Technologies |
606.0 | 21.5 | % | 694.8 | 20.9 | % | 663.5 | 21.3 | % | ||||||||||
Specialty Technologies |
337.3 | 11.9 | % | 374.7 | 11.3 | % | 374.6 | 12.0 | % | ||||||||||
Total Grace Davison Revenue |
$ | 1,935.4 | 68.5 | % | $ | 2,168.6 | 65.3 | % | $ | 2,009.2 | 64.5 | % | |||||||
5
The following table sets forth Grace Davison sales by region as a percentage of Grace Davison total revenue.
| |
2009 | 2008 | 2007 | ||||||||||||||||
|---|---|---|---|---|---|---|---|---|---|---|---|---|---|---|---|---|---|---|---|
| |
Sales | % of Grace Davison Revenue |
Sales | % of Grace Davison Revenue |
Sales | % of Grace Davison Revenue |
|||||||||||||
| |
(In millions) |
||||||||||||||||||
North America |
$ | 563.1 | 29.1 | % | $ | 645.9 | 29.8 | % | $ | 578.4 | 28.8 | % | |||||||
Europe Middle East Africa |
802.1 | 41.4 | % | 913.4 | 42.1 | % | 915.6 | 45.6 | % | ||||||||||
Asia Pacific |
378.4 | 19.6 | % | 434.7 | 20.0 | % | 362.7 | 18.0 | % | ||||||||||
Latin America |
191.8 | 9.9 | % | 174.6 | 8.1 | % | 152.5 | 7.6 | % | ||||||||||
Total Grace Davison Revenue |
$ | 1,935.4 | 100.0 | % | $ | 2,168.6 | 100.0 | % | $ | 2,009.2 | 100.0 | % | |||||||
Refining Technologies
FCC Catalysts
We are a global leader in developing and manufacturing fluid catalytic cracking, or FCC, catalysts and additives that enable petroleum refiners to increase profits by improving product yields and quality. Our FCC products also enable refiners to reduce emissions from their FCC units and reduce sulfur content in the gasoline that they produce.
Oil refining is a highly specialized discipline, and FCC catalysts must be tailored to meet local variations in crude oil and a refinery's product mix. We work regularly with our customers to identify the most appropriate catalyst formulations for their changing needs. We are dependent on the economics of the petroleum industry, specifically, the impacts of demand for transportation fuels and petrochemical products and crude oil supply, which affect the extent to which our customers utilize the available capacity of their refinery FCC units. In general, as a refinery utilizes more of its capacity, it needs a disproportionately greater amount of FCC catalyst. In recent years, global economic growth, especially in emerging markets, has increased the demand for transportation fuels, and our FCC catalysts and additives. Other factors may reduce the demand for petroleum-based transportation fuels such as weak economic conditions and high retail gasoline and diesel fuel prices. In addition, government policy that encourages the use of non-petroleum-based fuels, discourages the use of diesel fuel or encourages greater vehicular fuel economy may negatively affect demand for our FCC catalysts and additives.
Refinery feedstocks vary in quality from sweet to heavy crude oil. Sweet crude feedstocks are typically more expensive than heavy crude and yield a greater proportion of high-value petroleum products. They also yield a lower proportion of residual oil, or "resid," which is generally the lowest-value feedstock contained in crude oil. Although heavy crude feedstocks with high resid content are typically less expensive than higher quality feedstocks, the processing of high-resid feedstocks is more difficult because of their relatively high metals, nitrogen and sulfur contamination and higher boiling points. We have designed our MIDAS®, IMPACT®, NEKTOR™, and NOMUS™ product portfolios to enable our customers to increase the efficiency and yield of high-resid feedstock refining.
As a result of volatility in the price of diesel fuel as compared to gasoline, refiners desire the flexibility to adjust the yield of light cycle oil, a component of diesel fuel, from their FCC units. We have designed our MIDAS® 300 and DieseliseR™ products to increase the yield of light cycle oil from refinery FCC units.
6
Many U.S. petroleum refiners have entered into consent decrees with the U.S. Environmental Protection Agency under which the refiners have agreed to reduce emissions of nitrogen oxides and sulfur oxides. The European Union has also imposed requirements on refineries with respect to nitrogen oxides and sulfur oxides emissions. FCC units are generally the largest emitters of these pollutants in a refinery. Our additives are designed to assist refineries in meeting their obligations to reduce these pollutants. Our Super DESOX® additive reduces sulfur oxides emissions from commercial FCC units. Our XNOx® and DENOX® additives are designed to achieve reductions in nitrogen oxides emissions comparable to those obtained from the capital-intensive alternatives available to a refinery.
Global economic growth, especially in emerging markets, has increased the demand for plastics. As a result, our refinery customers have sought increased profits from petrochemicals by increasing the yield of propylene from their FCC units. Our ZSM-5-based technology, including our OlefinsMax® and OlefinsUltra® products, is designed to maximize the propylene output of FCC units.
In recent years, many countries and regions, including the U.S., European Union, Russia, India and China have imposed or increased the regulatory limitations on the sulfur content of gasoline and diesel fuel. We have developed a portfolio of products designed to assist refiners in meeting their gasoline sulfur reduction targets including our D-PriSM® and GSR® 5 additives and our SuRCA® and Neptune™ catalyst families.
Competition in FCC catalysts and additives is based on technology, product performance, customer service and price. Our principal FCC catalyst competitors are Albemarle and BASF which, with Intercat, are also principal competitors in FCC additives. We also have multiple regional competitors for FCC catalysts and additives.
Hydroprocessing Catalysts
We market hydroprocessing catalysts through ART, our joint venture with Chevron. We established ART to combine our technology with that of Chevron and to develop, market and sell hydroprocessing catalysts to customers in the petroleum refining industry worldwide.
As discussed above, our business is dependent on the economics of the petroleum industry. Refineries increasingly use feedstocks that have high resid content. We are a leading supplier of hydroprocessing catalysts designed for processing these feedstocks. We offer products for fixed-bed resid hydrotreating, on-stream catalyst replacement, ebullating-bed high-resid feedstock hydrocracking and distillate hydrotreating processes.
We also offer a full line of catalysts, customized for individual refiners, used in processing ultra-low sulfur content gasoline and diesel fuel, including our SmART Catalyst System® and ApART™ catalyst system. As discussed above, regulatory limitations on the sulfur content of gasoline and diesel fuel are becoming more common. These products are designed to help refiners to reduce the sulfur content of their products.
Competition in the hydroprocessing catalyst industry is based on technology, product performance, customer service and price. Albemarle and Criterion are our leading global competitors in hydroprocessing catalysts. We also have multiple regional competitors.
Materials Technologies
We provide enabling technologies that are silica- and silica-alumina-based functional additives and process aids, such as silica gel, colloidal silica, zeolitic adsorbents, precipitated silica and silica-aluminas, for a wide variety of applications. We are a global leader in can and closure sealants that,
7
along with our specialized can, Al-monoblock and closure coatings, we supply to the packaging industry. Or product portfolio includes:
Application
|
Use | Key Brands | ||
|---|---|---|---|---|
| Industrial | Reinforcing agents for rubber and tires | PERKASIL® | ||
Inorganic binders and surface smoothening aids for precision investment casting and refractory applications |
LUDOX® |
|||
Adsorbents for dual pane windows and industrial applications, desiccant granules, beads, powders and bags and polyurethane moisture scavengers |
PHONOSORB®, PHONOSORB MTX®, SYLOBEAD®, SYLOSIV®, CRYOSIV®, SAFETYSORB® |
|||
Chemical metal polishing aids and formulations for chemical mechanical planarization/electronics applications |
LUDOX®, PoliEdge® |
|||
Consumer |
Toothpaste abrasives and thickening agents, free-flow agents, anticaking agents, tabletting aids, cosmetic additives and flavor carriers |
SYLODENT®, SYLOID® FP™, SYLOBLANC®, ELFADENT®, SYLOID®, SYLOSIV® |
||
Edible oil refining agents, beer stabilizers and clarification aids for beer, juices and other beverages |
DARACLAR®, TriSyl® |
|||
Coatings and Print Media |
Matting agents, anticorrosion pigments, TiO2 extenders and moisture scavengers for paints and lacquers |
SYLOID®, SHIELDEX®, SYLOSIV®, SYLOWHITE™ |
||
Additives and formulations for matte, semi-glossy and glossy ink receptive coatings on high performance ink jet papers, photo paper, and commercial wide-format print media |
SYLOJET®, DURAFILL®, LUDOX® |
|||
Paper retention aids, functional fillers, paper frictionizers |
DURAFILL®, LUDOX® |
|||
Packaging |
Can sealants for rigid containers, that ensure a hermetic seal between the lid and the body of beverage, food, aerosol and other cans |
DAREX® |
||
Sealants for metal and plastic bottle closures that are used on pry-off and twist-off metal crowns, as well as roll-on pilfer-proof and plastic closures to seal and enhance the shelf life of food and beverages in glass and plastic bottles and jars |
DAREX®, DARAFORM®, DARASEAL®, DARABLEND®, Sincera®, Celox® |
|||
Coatings for metal packaging that are used in the manufacture of cans and closures to protect the metal against corrosion, protect the contents against the influences of metal, ensure proper adhesion of sealing compounds to metal surfaces, and provide base coats for inks and for decorative purposes |
DAREX®, Apperta®, Sistiaga® |
|||
Active packaging including oxygen scavenging closure sealants and moisture scavenging silica sachets, polymeric desiccants and desiccants for bottlestopper applications |
Celox®, SYLOSORB®, SAFETYSORB® |
8
Our products are integrated into our customers' manufacturing processes and, when combined with our technical support, increase the efficiency and performance of their products. By working closely with our customers, we help them to respond quickly to the changing needs of brand owners and consumers. We focus on high-growth segments and seek to develop and introduce new products that add additional value to the current and future needs of our customers. For example, our customers have incorporated our products into higher resolution print media, active packaging with oxygen or moisture scavenging functionality, less abrasive high cleaning toothpastes and technologies that are friendly to the environment such as water-based and VOC-compliant coatings, green tires with lower roll resistance and non-toxic anticorrosion protection.
Our packaging products are designed to address major industry trends such as lighter weight packaging, lower energy consumption, personal convenience, and highly individualized packaging. Our growth is driven by innovation of higher performing products, continuous discovery of new applications, the need for sustainability and rising disposable income in emerging markets. We seek to capitalize upon our technical customer service, global infrastructure and expertise in global regulatory compliance (including food law compliance) to enhance our growth, especially in emerging markets.
Our Materials Technologies product group is global. Our major competitors include PQ/INEOS, Evonik, UOP and Altana, all of which market their products on a global basis. Competition is generally based on product performance, technical service and reliability, as well as additional value-added features to address the needs of our customers, end-users and brand owners.
Specialty Technologies
Specialty Catalysts and Process Technologies
We are a leading provider of catalyst systems and catalyst supports to the polyolefins industry for a variety of polyethylene and polypropylene process technologies. These types of catalysts are used for the manufacture of polyethylene and polypropylene resins used in products such as plastic film, high-performance plastic pipe, automobile parts, household appliances and household containers. We use a combination of proprietary catalyst and support technology, as well as technology licensed from third parties, to provide unique catalyst-based solutions to industry, and to provide a broad technology portfolio for enhancing collaboration opportunities with technology leaders.
Our Magnapore® polymerization catalyst is used to produce high performance polyethylene in the slurry loop process for pipe and film applications. Our POLYTRAK® polymerization catalyst is designed to achieve improved polymer performance, particularly for impact-resistant applications such as automobile bumpers and household appliances.
Our Sylobloc® polymer additives for producers and processors of plastic products prevent layers of polymer film from sticking together, improve dispersement of pigments and ease removal from molds.
Our renewables product line draws upon our expertise in catalysis and separations to develop and provide technologies for purification, drying, and biofeedstock conversion, including our EnSieve® desiccants for ethanol dehydration and EnPure® adsorbents for biodiesel purification. Growth in our renewables business is driven by sales into ethanol dehydration and bio-diesel purification applications as a result of government mandates and escalating fuel prices.
Our Davicat® standard and customized catalysts offer a wide range of chemical and physical properties based on our material science technology for supported catalysts and biotechnology applications such as nylon and artificial sweeteners. Our Raney® nickel, cobalt and copper hydrogenation and dehydrogenation catalysts are used for the synthesis of organic compounds for the fibers, pharmaceuticals, plastics, perfumes, soaps, color couplers and petroleum industries.
9
Our Sylobead® process adsorbents are used in petrochemical and natural gas processes for such applications as ethylene-cracked-gas-drying, natural gas drying and sulfur removal.
The specialty catalyst industry is technology-intensive and suppliers must provide products formulated to meet customer specifications. There are many manufacturers of polyolefin and other specialty catalysts including PQ/INEOS, Albemarle, LyondellBasell, Univation and BASF, and most sell their products worldwide.
Discovery Sciences
We market chromatography and related purification products, pharmaceutical excipients and CO2 adsorbents including:
Products
|
Key Brands | |
|---|---|---|
| Flash chromatography systems and consumables | Reveleris®, RevealX™, GraceResolv™ | |
Analytical scale high performance liquid chromatograph (HPLC) columns and detectors |
VisionHT™, Vydac®, Alltech®, Alltima™ |
|
Preparative scale purification products including media, column hardware, and equipment |
Davisil®, Vydac®, MODcol®, Spring®, Multipacker® |
|
Pharmaceutical excipients |
Syloid® FP |
|
CO2 adsorbents for anesthesiology and re-breathing applications |
Sodasorb® |
Our products are used in a wide range of applications, including drug discovery and purification, for the pharmaceutical and biotechnology industries, environmental analysis, forensics, petrochemical analysis and the manufacture of food, cosmetics, vitamins and biofuels. We also market chromatography consumables and analytical and preparative columns packed with our specialty media. We can modify the base silica and surface chemistry for analytical, preparative and process-scale customers in order to enhance our product performance for their unique applications.
Our products compete on the basis of product quality, distinct technology and customer support. Competition for these products is highly fragmented with a large number of companies that sell their products on a global and regional basis, although a number of companies, such as Waters Corporation, Agilent Technologies and Thermo-Fisher, have a substantial global position and a relatively large installed customer base.
Manufacturing
Our Grace Davison products are manufactured by a network of globally-coordinated plants that are positioned to service our customers regionally. Our packaging products are manufactured in both large facilities to permit economies of scale and a network of smaller operations that enable customization to local market conditions. Our integrated planning organization is responsible for the effective utilization of our manufacturing capabilities. Our Discovery Sciences product line has its own integrated planning organization.
Marketing and Sales
We use a global organization of technical professionals with extensive experience in refining processes, catalyst development, and catalyst applications to market our Refining Technologies catalysts and additives. These professionals work to tailor our technology to the needs of each specific customer. We generally negotiate prices for our refining catalysts because our formulations are specific to the needs of each customer and each customer receives individual attention and
10
technical service. We generally sell our hydroprocessing catalysts through multiple-year supply agreements with our geographically diverse customer base.
We use country-based direct sales forces that are dedicated to each product line and backed by application-specific technical customer service teams to market our Materials Technologies and Discovery Sciences products. Our sales force seeks to develop long-term relationships with our customers and focuses on consultative sales, technical support and key account growth programs. To ensure full geographic coverage, our direct sales organization is further supplemented, especially with respect to our Discovery Sciences products, by a network of agents and distributors.
We use a global direct sales force for our other Specialty Catalysts and Process Technologies products that seeks to maintain close working relationships with our customers. These relationships enable us to cooperate with major polymer and chemical producers to develop catalyst technologies that complement their process developments. We have geographically distributed our sales and technical service professionals to make them responsive to the needs of our geographically diverse customers. We typically operate under long-term contracts with our customers.
Our marketing and research and development functions operate globally. We offer web-based support, including technical service, literature access, customer feedback tools, and process design formulas to assist our specialty catalysts and process technologies customers in determining their needs for our products.
Seasonality does not have a significant overall effect on our Grace Davison operating segment. However, sales of FCC catalysts tend to be lower in the first calendar quarter prior to the shift in production by refineries from home heating oil for the winter season to gasoline production for the summer season. FCC catalysts and ebullating-bed hydroprocessing catalysts are consumed at a relatively steady rate and are replaced regularly. Fixed-bed hydroprocessing catalysts are consumed over a period of years and are replaced in bulk in an irregular pattern. Since our customers periodically shut down their refining processes to replace fixed-bed hydroprocessing catalysts in bulk, our hydroprocessing catalyst sales to any customer can vary substantially over the course of a year and between years based on that customer's catalyst replacement schedule. Our packaging products and some of our construction-related products such as insulated glass desiccants are affected by seasonal and weather-related factors including the consumption of beverages, the size and quality of food crops and the level of construction activity. These impacts are mitigated by the global nature of this product line.
Raw Materials
The principal raw materials for Grace Davison products include caustic soda, alumina, rare earths, nickel, aluminum, cobalt, kaolin, molybdenum, sodium aluminate, sodium silicate, resins, rubber and lattices (including certain food-grade raw materials). Multiple suppliers are generally available for each of these materials; however some of our raw materials may be provided by single sources of supply. We seek to mitigate the risk of using single source suppliers by identifying and qualifying alternative suppliers or, for unique materials, by using alternative formulations from other suppliers or by passing price increases on to customers. In some instances, we produce our own raw materials and intermediates.
Prices for many of our raw materials, including metals and petroleum-based specialty and commodity materials such as resins and solvents, have been volatile in recent years. As in many chemical businesses, we consume significant quantities of natural gas in the production of Grace Davison products. World events and other economic factors have caused volatility in the price of natural gas. Increases or decreases in the cost of natural gas and raw materials can have a significant impact on our operating margins. Since we manufacture a substantial portion of our packaging products in developing countries using raw materials from suppliers in the U.S., Europe
11
and other developed economies, changes in the values of the currencies of these developing countries versus the U.S. dollar and the Euro may adversely affect our raw material costs and the prices we may charge for our products.
Grace Construction Products Operating Segment
Our Grace Construction Products, or GCP, products include specialty construction chemicals and specialty building materials. GCP manages its business under a geographic organizational structure that focuses on the following regions:
- •
- GCP Americas includes products sold to customers in North, Central and
South America;
- •
- GCP Europe includes products sold to customers in Eastern and Western
Europe, the Middle East, Africa and India; and
- •
- GCP Asia Pacific includes products sold to customers in Asia (excluding India), Australia and New Zealand.
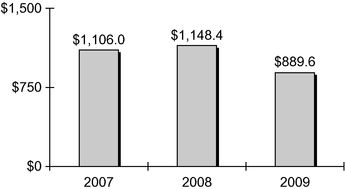
The following table sets forth GCP sales by region as a percentage of GCP total revenue.
| |
2009 | 2008 | 2007 | ||||||||||||||||
|---|---|---|---|---|---|---|---|---|---|---|---|---|---|---|---|---|---|---|---|
| |
Sales | % of GCP Revenue |
Sales | % of GCP Revenue |
Sales | % of GCP Revenue |
|||||||||||||
| |
(In millions) |
||||||||||||||||||
GCP Americas |
$ | 458.4 | 51.5 | % | $ | 595.0 | 51.8 | % | $ | 587.1 | 53.1 | % | |||||||
GCP Europe* |
296.6 | 33.3 | % | 407.1 | 35.5 | % | 380.6 | 34.4 | % | ||||||||||
GCP Asia Pacific |
134.6 | 15.2 | % | 146.3 | 12.7 | % | 138.3 | 12.5 | % | ||||||||||
Total GCP Revenue |
$ | 889.6 | 100.0 | % | $ | 1,148.4 | 100.0 | % | $ | 1,106.0 | 100.0 | % | |||||||
- *
- Includes the Middle East, Africa and India.
The following table sets forth GCP sales of similar products as a percentage of Grace total revenue.
| |
2009 | 2008 | 2007 | ||||||||||||||||
|---|---|---|---|---|---|---|---|---|---|---|---|---|---|---|---|---|---|---|---|
| |
Sales | % of Grace Revenue |
Sales | % of Grace Revenue |
Sales | % of Grace Revenue |
|||||||||||||
| |
(In millions) |
||||||||||||||||||
Specialty Construction Chemicals |
$ | 578.1 | 20.5 | % | $ | 741.3 | 22.4 | % | $ | 744.3 | 23.9 | % | |||||||
Specialty Building Materials |
311.5 | 11.0 | % | 407.1 | 12.3 | % | 361.7 | 11.6 | % | ||||||||||
Total GCP Revenue |
$ | 889.6 | 31.5 | % | $ | 1,148.4 | 34.7 | % | $ | 1,106.0 | 35.5 | % | |||||||
We are a supplier to the nonresidential (commercial and infrastructure) construction industry, and to a lesser extent, the residential construction and repair and restoration industries. The
12
following table shows our principal specialty construction chemicals and specialty building materials products:
Products
|
Uses | Customers | Key Brands | |||
|---|---|---|---|---|---|---|
| Concrete admixtures | Concrete admixtures and polymeric fibers are used to reduce the production and in-place costs of concrete, increase the performance of concrete and improve the life cycle cost of the structure. | Ready-mix and precast concrete producers, engineers and specifiers | ADVA®, STRUX®, PolarSet®, Eclipse® | |||
Additives for cement processing |
Cement additives added to the grinding stage of the cement manufacturing process improve the energy efficiency of the plant and enhance the performance of the finished cement. Chromium reducing additives help cement manufacturers in Europe meet environmental regulations. |
Cement manufacturers |
CBA®, Synchro®, HEA2®, TDA® |
|||
Products for architectural concrete |
Products for architectural concrete include surface retarders, coatings, pigments and release agents used by concrete producers and contractors to enhance the surface appearance and aesthetics of concrete. |
Precast concrete producers and architects |
Pieri® |
|||
Admixtures for masonry concrete |
Products for masonry concrete are used by block and paver producers for process efficiency and to improve the appearance, durability and water resistance of finished concrete masonry units. |
Masonry block manufacturers |
Dry-Block®, Optec®, Quantec® |
|||
Specialty vermiculite products |
Specialty vermiculite products are used in a wide range of applications making use of vermiculite's insulating properties and its ability to absorb nutrients, primarily in the horticultural, construction, and automotive industries. |
Manufacturers of a variety of products, including potting soils, animal feeds, brakes, clutches and fire-rated products |
MicroLite®, Verxite™, FRSV™ |
|||
Structural waterproofing, vapor and air barrier systems |
Structural waterproofing and air barrier systems prevent water, vapor and/or air infiltration in commercial structures. Products include self-adhered sheet and liquid membranes, joint sealing materials, drainage composites and waterstops. |
Architects and structural engineers; specialty waterproofing and general contractors; specialty waterproofing distributors |
Bituthene®, Procor®, Preprufe®, Perm-A-Barrier®, Adprufe® |
13
Products
|
Uses | Customers | Key Brands | |||
|---|---|---|---|---|---|---|
| Residential building materials | Specialty roofing membranes and flexible flashings for windows, doors, decks and detail areas include fully-adhered roofing underlayments, synthetic underlayments and self-adhered flashing. | Roofing contractors, home builders and remodelers; specialty roofing distributors, lumberyards and home centers; homeowners; architects and specifiers | Ice & Water Shield®, Tri-Flex®, Bondera®, Vycor® | |||
Fire protection |
Fire protection products are spray-applied to the structural steel frame, encasing and insulating the steel and protecting the building in the event of fire. |
Local contractors and specialty subcontractors and applicators; building materials distributors; industrial manufacturers; architects and structural engineers |
Monokote® |
In view of this diversity of customers and customer requirements, and because specialty construction chemicals and specialty building materials require intensive sales and customer service efforts, we maintain a direct sales and technical support team with sales personnel based in more than 35 countries worldwide. This sales and support team sells products under global contracts, under U.S. or regional contracts, and on a job-by-job basis. We also use distributors in both domestic and overseas markets. We compete globally with several large construction materials suppliers, and regionally and locally with numerous smaller competitors. In recent years, the cement and concrete industry has experienced some consolidation, thereby increasing the importance of serving well our global customers. For some customer groups, such as producers and contractors, operational efficiency and total applied cost are key factors in making purchasing decisions, while for others, such as architects and engineers, product performance and design versatility are more important.
Competition for our construction products is based on product performance, technical support and service, brand name recognition in the construction industry and price. Our major global specialty construction chemicals competitors are BASF and Sika.
We seek to improve our products, adapt them for new applications and add new products through our growth and innovation processes that focus on understanding the needs of our customers, key performance indicators and research and development. We also seek to extend our product portfolio and geographic reach through acquisitions.
In addition to new product introductions, product enhancements and acquisitions, we look for growth opportunities in developing countries where increasing construction activity, improvement in building codes, and sophistication of construction practices can accelerate demand for our construction products. We continue to expand our commercial and manufacturing capabilities in these geographic areas.
The key raw materials used in our specialty construction products are obtained from a variety of suppliers, including commodity chemical producers, petroleum companies and paper manufacturers. The majority of our raw materials are olefins and organic chemicals; we also make significant
14
purchases of inorganic materials such as gypsum, as well as specialty materials including specialty films, papers, membranes and fibers. In most instances, these materials are available from multiple sources. Global supply and demand factors, changes in currency valuations against the U.S. dollar and petroleum prices significantly impacted the price and availability of key raw materials in recent years.
The construction business is cyclical in response to economic conditions and construction demand. The construction business is also seasonal and dependent on favorable weather conditions, with a decrease in construction activity during the winter months. Demand for our specialty construction products is primarily impacted by global non-residential construction activity and U.S. residential construction activity. We seek to increase profitability and minimize the impact of cyclical downturns in regional economies by introducing technically advanced high-performance products and expanding geographically. Although in recent years these strategies have been successful in reducing the impact of cyclicality, a decline in U.S. and European construction activity in 2007 through 2009 has had a negative impact on our sales in North America and Western Europe.
FINANCIAL INFORMATION ABOUT INDUSTRY SEGMENTS AND GEOGRAPHIC AREAS
Disclosure of financial information about industry segments and geographic areas for 2009, 2008 and 2007 is provided in this Report in Item 8 (Financial Statements and Supplementary Data) in the Financial Supplement under Note 21 (Operating Segment Information) to the Consolidated Financial Statements which disclosure is incorporated herein by reference. Disclosure of risks attendant to our foreign operations is provided in this Report in Item 1A (Risk Factors).
INTELLECTUAL PROPERTY; RESEARCH ACTIVITIES
Competition in the specialty chemicals and specialty materials industry is often based on technological superiority and innovation. Our ability to maintain our margins and effectively compete with other suppliers depends on our ability to introduce new products based on innovative technology, as well as our ability to obtain patent or other intellectual property protection. Our research and development programs emphasize development of new products and processes, improvement of existing products and processes and application of existing products and processes to new industries and uses. We conduct research in all regions, with North America and Europe accounting for the most activity.
We routinely file applications to obtain world-wide patents to protect our investments in innovation, research, and product development. Numerous patents and patent applications protect our products, formulations, manufacturing processes, equipment, and improvements. We also benefit from the use of trade secret information, including know-how and other proprietary information relating to many of our products and processing technologies. There can be no assurance, however, that our patents, patent applications and precautions to protect trade secrets and know-how will provide sufficient protection for our intellectual property. In addition, other companies may independently develop systems or processes that could circumvent our patents or may acquire patent rights applicable to our business.
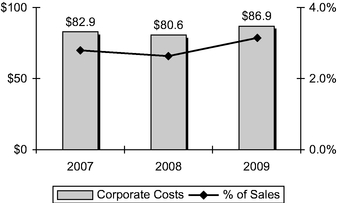
Research and development expenses were approximately $70 million, $83 million, and $80 million in 2009, 2008, and 2007, respectively. These amounts include depreciation and amortization expenses related to research and development and expenses incurred in funding external research projects. The amount of research and development expenses relating to government- and customer-sponsored projects (rather than projects that we sponsor) was not material during these periods.
15
ENVIRONMENT, HEALTH AND SAFETY MATTERS
We are subject, along with other manufacturers of specialty chemicals, to stringent regulations under numerous U.S. federal, state and local and foreign environment, health and safety laws and regulations relating to the generation, storage, handling, discharge, disposition and stewardship of hazardous wastes and other materials. Environmental laws require that certain responsible parties, as defined in the relevant statute, fund remediation actions regardless of legality of original disposal or ownership of a disposal site. We are involved in remediation actions to address hazardous wastes or other materials as required by U.S. federal, state and local and foreign laws. During the Chapter 11 proceeding, we generally are not participating in the funding of investigation and remediation at sites that we do not own. Our ultimate liability with respect to many of these sites will be determined as part of the Chapter 11 proceeding.
We have expended substantial funds to comply with environmental laws and regulations and expect to continue to do so in the future. The following table sets forth our expenditures in the past three years, and our estimated expenditures in 2010 and 2011, for (i) the operation and maintenance of manufacturing facilities and the disposal of wastes; (ii) capital expenditures for environmental control facilities; and (iii) site remediation:
Year
|
Operation of Facilities and Waste Disposal |
Capital Expenditures |
Site Remediation |
|||||||
|---|---|---|---|---|---|---|---|---|---|---|
| |
(In $ millions) |
|||||||||
2007 |
62 | 9 | 9 | |||||||
2008 |
51 | 5 | 257 | (a) | ||||||
2009 |
47 | 7 | 8 | |||||||
2010 |
47 | 6 | 16 | (b) | ||||||
2011 |
49 | 6 | 8 | (b) | ||||||
- (a)
- Includes
$252 million payment to the U.S. Government to satisfy all past and future response costs related to the Libby, Montana Superfund Site
(excluding the Grace-owned Libby vermiculite mine, see disclosure provided in this Report in Item 8 (Financial Statements and Supplementary Data) in the Financial Supplement under
Note 13 (Commitments and Contingent Liabilities) to the Consolidated Financial Statements).
- (b)
- For 2010 and 2011, amounts are current estimates of ongoing site remediation costs and exclude payments of claims in our Chapter 11 proceeding.
Additional information about our environmental remediation activities is provided in this Report in Item 3 (Legal Proceedings).
We continuously seek to improve our environmental, health and safety performance. To the extent applicable, we extend the basic elements of the American Chemistry Council's Responsible Care® program to all our locations worldwide, embracing specific performance objectives in the key areas of management systems, product stewardship, employee health and safety, community awareness and emergency response, distribution, process safety and pollution prevention. We have implemented key elements of the new Responsible Care® Security Code for our operations and systems. We have completed a review of our existing security (including cyber-security) vulnerability and have taken actions to enhance our security systems and protect our assets. We have undertaken certain activities to comply with the Department of Homeland Security (DHS) Chemical Facility Anti-Terrorism Standards, including identifying facilities subject to the standards, conducting security vulnerability assessments and developing site security plans, as necessary.
16
EMPLOYEE RELATIONS
As of December 31, 2009, we employed approximately 5,940 persons, of whom approximately 2,650 were employed in the United States. Of our total employees, approximately 3,615 work in Grace Davison facilities, approximately 1,565 work in Grace Construction Products facilities, and approximately 760 are dedicated to corporate activities and/or are shared through globally managed professional groups such as finance, legal services, human resources, information technology, supply chain and environment, health and safety.
Approximately 755 of our manufacturing employees in the United States are represented for collective bargaining purposes by nine different local collective bargaining groups. We have operated without a labor work stoppage for more than 10 years.
We have works councils representing the majority of our European sites serving approximately 1,765 employees.
RISK MANAGEMENT
We have programs in place to address the following significant risks to Grace:
- •
- Disasters—We have disaster recovery plans in effect at key
sites, and we have built a certain amount of redundancy into our production plants where feasible. We also have a formalized risk management program, which includes several types and layers of
insurance. We are advised by risk management professionals and brokers who are familiar with recent trends in the insurance markets worldwide. The level of insurance carried, and other related aspects
such as deductibles, self-insurance levels and policy terms, are monitored by management on a regular basis.
- •
- Environmental—We are committed to the heath and safety of all
employees and to protecting the environment from damage through the use or production of our products. Our Environment, Health and Safety (EH&S) organization is global in scope and is charged with
assuring that we live up to our commitments in this important area. The group performs EH&S audits of our facilities and regularly monitors local laws and regulations. Where appropriate, we use
outside consultants and experts to augment our in-house staff. We continue to implement our EHS management system in our facilities worldwide. Our EHS management system is designed to
enable us to apply "best practices" and "continual improvement" principles across our business.
- •
- Ethics and Fraud—We insist that our employees maintain the
highest standards of ethical behavior. We have preventative and investigatory programs in place to maintain these standards, as follows:
- •
- We have established online ethics and compliance training programs in several languages.
- •
- All U.S. employees and many employees outside the U.S. must sign an annual ethics statement in which they renew their
commitment to operate ethically and according to the Grace code of conduct. They must also report any actual or potential conflicts of interest for evaluation by management and, if necessary,
remediation.
- •
- We have an anonymous toll-free telephone line to report fraudulent or unethical behavior to our Chief Ethics Officer. The direct line is available to all employees worldwide where local law allows such a facility. Any allegation of fraud is required to be reported to the Audit Committee of the Board of Directors.
17
- •
- Our Internal Audit Department is independent of management and reports functionally to the Chairman of the Audit Committee
of the Board of Directors. The department conducts investigations in collaboration with the Chief Ethics Officer when alleged frauds have accounting, financial reporting or fiscal aspects.
- •
- We provide training to personnel in key positions covering topics such as the U.S. Foreign Corrupt Practices Act, the Sarbanes Oxley Act of 2002, and other laws and regulations relating to ethical or legal matters.
AVAILABILITY OF REPORTS AND OTHER DOCUMENTS
We maintain an Internet website at www.grace.com. Our annual reports on Form 10-K, quarterly reports on Form 10-Q, current reports on Form 8-K, and amendments to those reports, filed or furnished pursuant to Section 13(a) or 15(d) of the Securities Exchange Act of 1934, as amended, are available, free of charge, on our website as soon as reasonably practicable after such reports are electronically filed with, or furnished to, the Securities and Exchange Commission, or SEC. These reports may be accessed through our website's investor information page.
In addition, the charters for the Audit, Compensation, Nominating and Governance, and Corporate Responsibility Committees of our Board of Directors, our corporate governance guidelines and code of ethics are available, free of charge, on our website at www.grace.com/About/Leadership/Governance/. Printed copies of the charters, governance guidelines and code of ethics may be obtained free of charge by contacting Grace Shareholder Services at 410-531-4167.
The information on our website is not, and shall not be deemed to be, a part of this report or incorporated into any other filings we make with the SEC.
Our Chief Executive Officer and Chief Financial Officer have submitted certifications to the SEC pursuant to the Sarbanes Oxley Act of 2002 as exhibits to this Report.
EXECUTIVE OFFICERS
See Part III, Item 10 of this Report for information about our Executive Officers.
This Report, including the Financial Supplement, contains, and our other public communications may contain, projections or other "forward-looking" information, that is, information related to future, not past, events. Such information generally includes the words "believes," "plans," "intends," "targets," "will," "expects," "anticipates," or similar expressions and includes all statements regarding our Chapter 11 proceeding, expected financial position, results of operations, cash flows, financing plans, business strategy, budgets, capital and other expenditures, competitive positions, growth opportunities for existing products, benefits from new technology and cost reduction initiatives, plans and objectives of management and markets for securities. For these statements, we claim the protection of the safe harbor for forward-looking statements contained in the Private Securities Litigation Reform Act of 1995. Like other businesses, we are subject to risks and uncertainties that could cause our actual results to differ materially from our projections or that could cause other forward-looking information to prove incorrect. Factors that could cause actual events to materially differ from those contained in the forward-looking statements include those factors set forth below and elsewhere in this Annual Report on Form 10-K. Further, our reported results should not be considered as an indication of our future performance. Readers are cautioned not to place undue reliance on our projections and forward-looking information, which speak only as of the date thereof. We undertake no obligation to publicly release any revisions to the projections and forward-
18
looking information contained in this document, or to update them to reflect events or circumstances occurring after the date of this document.
In addition to general economic, business and market conditions, we are subject to other risks and uncertainties, including, without limitation, the following:
COMPANY RISKS
Our proposed joint plan of reorganization, if confirmed and effective, may substantially impact the value of currently outstanding shares of Grace common stock.
On February 27, 2009, supported by the Official Committee of Equity Security Holders, the Official Committee of Asbestos Personal Injury Claimants and the legal representative of future asbestos personal injury claimants, as co-proponents, we filed an amended proposed joint plan of reorganization, as further amended, the Joint Plan, with the bankruptcy court that is designed to address all pending and future asbestos-related claims and all other pre-petition claims as outlined therein. The Joint Plan may, if confirmed and effective, substantially impact the value of the ownership interests of holders of currently outstanding Grace common stock. Although it is supported by the parties thereto, other parties-in-interest in our Chapter 11 case have objected to several provisions of the Joint Plan. As a result, it is possible that the Joint Plan will not be confirmed by the bankruptcy court or the district court or become effective. Further, the effectiveness of the Joint Plan is subject to the fulfillment of numerous conditions that may not ultimately be fulfilled. One of these conditions is that we raise sufficient funds to pay certain claims in cash. We expect to require up to $850 million in new financing to fund the Joint Plan. If we are unable to obtain the necessary financing on acceptable terms, our emergence from Chapter 11 may be delayed. Until an ultimate plan of reorganization is confirmed and effective, the interests of the holders of Grace common stock remain subject to substantial dilution or cancellation. Accordingly, the value of Grace common stock is highly speculative and any investment in Grace common stock poses a high degree of risk.
If our proposed joint plan of reorganization is not confirmed or does not become effective, the outcome of our Chapter 11 cases could result in the substantial dilution or cancellation of Grace's currently outstanding common stock.
If our proposed joint plan of reorganization is not confirmed or does not become effective, the outcome of our Chapter 11 cases would depend primarily upon the resolution of our asbestos-related and other contingent liabilities. We would likely return to the bankruptcy court estimation trial that was suspended in April 2008 due to the personal injury settlement. We expect that the estimate resulting from this process would form the basis for a plan of reorganization that would provide for the funding of one or more trusts to which all pending and future asbestos-related claims would be channeled. If the amount of asbestos-related liabilities, as determined through estimation or otherwise, and other liabilities exceeded the assets available for funding, then we likely would issue additional shares of Grace common stock to satisfy such liabilities. The number of shares to be issued could substantially dilute the interests of current shareholders or result in a recapitalization of Grace that would cancel the shares of current shareholders and issue new shares to asbestos and other creditors. Because of this risk of substantial dilution or cancellation, the value of Grace common stock is highly speculative and any investment in Grace common stock poses a high degree of risk.
19
If objections to the Joint Plan are resolved adversely to Grace and the other proponents of the Joint Plan or if rulings resolving objections favorably to the proponents of the Joint Plan are appealed, conditions to the effectiveness of the Joint Plan may not be satisfied and the timing and terms of our emergence from Chapter 11 could be materially affected.
The Bankruptcy Court required parties-in-interest who object to the Joint Plan to submit their objections by May 20, 2009. The objections filed generally relate to demands for interest at rates higher than provided for in the Joint Plan, assertions that the Joint Plan impairs insurers' contractual rights, assertions that the Joint Plan discriminates against Libby, Montana personal injury claimants, and the classification and treatment of claims under the Joint Plan. We believe that the Joint Plan complies with the requirements for confirmation under the Bankruptcy Code and we intend to vigorously defend the Joint Plan against these and all other objections. If certain objections were resolved adversely to the Joint Plan proponents, or if rulings by the Bankruptcy Court resolving certain objections favorably to the Joint Plan proponents were appealed, certain conditions to the effectiveness of the Joint Plan, including for example, payments pursuant to the Sealed Air Settlement and the Fresenius Settlement, might not be satisfied and potential lenders might not be willing to provide the new financing that Grace expects to require to fund the Joint Plan. The resolution of these objections and any related appeals could have a material effect on the terms and timing of our emergence from Chapter 11.
The bankruptcy process may disrupt our business.
We have attempted to minimize the adverse effect of our Chapter 11 reorganization on our relationships with our employees, suppliers, customers and other parties. Nonetheless, our relationships with our customers, suppliers and employees may be adversely impacted and our operations could be materially and adversely affected. In addition, the continuation of our reorganization could negatively affect our ability to attract new employees and retain existing high performing employees.
Chapter 11 limits the flexibility of our management team in running our business.
While we operate our businesses as debtor-in-possession under supervision by the bankruptcy court, we are required to obtain the approval of the bankruptcy court prior to engaging in activities or transactions outside the ordinary course of business. For example, our strategic plan includes the acquisition of businesses in the specialty chemicals and specialty building materials industries. Such acquisitions generally require bankruptcy court approval if made by the company or its U.S. subsidiaries and affiliates that are parties to the Chapter 11 cases. Bankruptcy court approval of non-ordinary course activities entails preparation and filing of appropriate motions with the bankruptcy court, negotiation with the various creditors' committees and other parties in interest and one or more hearings. The various creditors' committees and other parties in interest may be heard at any bankruptcy court hearing and may raise objections with respect to these motions. This process delays major decisions and limits our ability to respond quickly to opportunities and events in the marketplace. Furthermore, in the event the bankruptcy court does not approve a proposed activity or transaction, we would be prevented from engaging in activities and transactions that we believe are beneficial to Grace.
20
Our financial statements do not reflect the terms of the proposed Joint Plan.
Our financial statements include estimates of asbestos-related liabilities that are based on the conditions precedent to the amended plan of reorganization that we filed in 2005, the Prior Plan, rather than the Joint Plan. The Prior Plan and the Joint Plan would result in substantially different amounts of the asbestos-related liabilities in our financial statements. When we adjust our financial statements based on the Joint Plan or another plan that is filed and/or confirmed, such adjustments could be material to our consolidated financial position and results of operations.
The proforma and prospective financial information that we filed with the bankruptcy court as an exhibit to the Joint Plan has not been and may not be fully updated to reflect events that occur after that filing and is subject to numerous assumptions.
We provided proforma and prospective financial information in the exhibits to the Joint Plan filed with the bankruptcy court in compliance with the requirements of the U.S. Bankruptcy Code. That information is not included in or incorporated into this Report. Though we have and may continue from time to time to update some of the information set forth in the proforma and prospective financial information to reflect events that occur after the filing of the Joint Plan with the bankruptcy court, we would not expect to fully update all such information unless required to do so by the U.S. Bankruptcy Code or the bankruptcy court. Further, this information is prepared in a format that may not be comparable to information in our financial statements included in this Report or other Reports filed with the SEC and is subject to numerous assumptions that may not be correct. As a result, investors in Grace common stock should not rely upon the proforma and prospective financial information filed with the bankruptcy court in connection with the Joint Plan.
We may not be able to collect all asbestos-related insurance payments that may be due to us.
We have insurance coverage for a portion of the asbestos-related claims against us. Under the Joint Plan, insurance policies that provide coverage for asbestos-related claims and proceeds, including interest, received after the date of the personal injury settlement, would be assigned to the personal injury trust established under the Joint Plan. We estimate that, assuming an ultimate payout of asbestos-related claims equal to the $1,700 million of asbestos-related liabilities recorded on our balance sheet, we should be entitled to approximately $500 million of insurance recovery. Accordingly, our December 31, 2009 balance sheet includes a long-term asset for estimated asbestos-related insurance of $500 million. Although this amount pertains only to insurance carriers with which we have asbestos settlement agreements, and/or which are currently solvent, we cannot be sure that all these amounts will be collected. We have entered into a settlement agreement with an underwriter of a portion of our excess insurance coverage. The insurer funded an escrow account for the benefit of the holders of claims that holds approximately $93.5 million, including interest earned on the account as of December 31, 2009. The settlement agreement, as amended in July 2009, provides that unless we confirm a plan of reorganization by December 31, 2013, at the option of the underwriter, exercisable at any time prior to April 30, 2014, the escrow amount with interest must be returned to the underwriter. The timing and amount of future payments from our insurers depends on their continued solvency and the resolution of disputes regarding coverage under the insurance policies as well as the nature and timing of actual claims paid. Because of the significance of our future asbestos-related payments, the receipt of timely and complete payments from our insurers will be important to the success of our reorganization. Under the Joint Plan, insurance policies that provide coverage for asbestos-related claims and proceeds from those policies, including interest, received after the date of the personal injury settlement, would be assigned to the personal injury trust established under the Joint Plan.
21
We are subject to environmental clean-up fines, penalties and damage claims that have been and continue to be costly.
Grace is subject to lawsuits and regulatory actions, in connection with current and former operations (including divested businesses), for breaches of environmental laws that seek clean-up or other remedies. Grace is also subject to lawsuits and investigations by public and private parties under various environmental laws in connection with our current and former operations in various states, including with respect to off-site disposal at facilities where Grace has been identified as a potentially responsible party under the Comprehensive Environmental Response, Compensation and Liability Act of 1980, as amended, commonly referred to as CERCLA.
We have established accounting accruals for all environmental matters for which sufficient information is available. As we receive new information, our estimated liability may change materially. We do not have sufficient information to accrue for all of Grace's environmental risks, and we cannot be sure that our actual costs will be equal to or less than our current estimates and accruals. Furthermore, it is reasonably possible that costs associated with those environmental matters for which we have established accruals may exceed our current accruals by material amounts. Some or all of our liability in connection with alleged violations of environmental laws may not be discharged upon confirmation of a plan of reorganization.
We are subject to liabilities with respect to businesses that we have divested in the past.
Over the years, particularly during the 1980s and 1990s, we divested a substantial number of businesses that were not then consistent with our business strategy. With respect to many of these former businesses, we have contractually agreed to indemnify the buyer against liabilities arising prior to the closing of the transaction, including environmental liabilities. In many cases, we have also retained pension liabilities for the current and former employees of these businesses. These obligations would not be discharged under the Joint Plan. We have recorded liabilities with respect to indemnification obligations that we believe are probable and estimable and retained pension liabilities. As we receive additional information or new claims, our recorded liabilities may change materially.
We have unfunded and underfunded pension plan liabilities. We will likely require current and future operating cash flow to fund the shortfall. We have no assurance that we will generate sufficient cash flow to satisfy these obligations.
We maintain U.S. and non-U.S. defined benefit pension plans covering employees who meet age and service requirements. Our net pension liability and cost is materially affected by the discount rate used to measure pension obligations, the longevity and actuarial profile of our workforce, the level of plan assets available to fund those obligations and the expected long-term rate of return on plan assets. Significant changes in investment performance or a change in the portfolio mix of invested assets can result in corresponding increases and decreases in the valuation of plan assets, particularly equity securities, or in a change in the expected rate of return on plan assets. For example, our U.S. advance-funded pension plans, which collectively have the largest asset base of our advance-funded plans and a targeted asset allocation of 60% equities and 40% bonds, experienced an overall decline of 26% in 2008 and an overall increase of 23% in 2009. Assets available to fund the pension benefit obligation of the U.S. advance-funded pension plans at December 31, 2009 were approximately $658 million, or approximately $359 million less than the measured pension benefit obligation. In addition, any changes in the discount rate could result in a significant increase or decrease in the valuation of pension obligations, affecting the reported funded status of our pension plans as well as the net periodic pension cost in the following years. Similarly, changes in the expected return on plan assets can result in significant changes in the net periodic pension cost in the following years.
22
The global scope of our operations subjects us to the risks of doing business in foreign countries, which could adversely affect our business, financial condition and results of operations.
We conduct a substantial portion of our business outside of the United States, with approximately 69% of our 2009 sales to non-U.S. customers. We currently have many production facilities, research and development facilities and administrative and sales offices located outside North America, including facilities and offices located in Europe, the Middle East, Africa, Asia and Latin America. We expect non-U.S. sales to continue to represent a significant portion of our revenue. Accordingly, our business is subject to risks related to the differing legal, political, social and regulatory requirements and economic conditions of many jurisdictions. Risks inherent in non-U.S. operations include the following:
- •
- agreements may be more difficult to enforce and receivables more difficult to collect;
- •
- foreign countries may impose additional withholding taxes or adopt other restrictions on foreign trade or investment,
including currency exchange controls;
- •
- we may have difficulty transferring our profits or capital from foreign operations to the United States or other countries
where such funds could be more profitably deployed;
- •
- foreign governments may nationalize private enterprises;
- •
- we may experience unexpected adverse changes in export duties, quotas and tariffs and difficulties in obtaining export
licenses;
- •
- intellectual property rights may be more difficult to enforce;
- •
- our business and profitability in a particular country could be affected by political or economic repercussions on a
domestic, country specific or global level from terrorist activities and the response to such activities;
- •
- we may be affected by unexpected adverse changes in foreign laws or regulatory requirements; and
- •
- unanticipated events, such as geopolitical changes, could adversely affect these operations.
Our success as a global business will depend, in part, upon our ability to succeed in differing legal, regulatory, economic, social and political conditions by developing, implementing and maintaining policies and strategies that are effective in each location where we do business.
We are exposed to currency exchange rate changes that impact our profitability.
We are exposed to currency exchange rate risk through our U.S. and non-U.S. operations. Fluctuations in currencies of other countries, especially the Euro, may materially affect our operating results. For example, changes in currency exchange rates may affect the relative prices at which we and our competitors sell products in the same region and the cost of materials used in our operations. A substantial portion of our net sales and assets are denominated in currencies other than the U.S. dollar. When the U.S. dollar strengthens against non-U.S. currencies, at a constant level of business, our reported non-U.S. sales, earnings, assets and liabilities are reduced because the non-U.S. currencies translate into fewer U.S. dollars.
We incur a currency transaction risk whenever one of our operating subsidiaries enters into either a purchase or a sales transaction using a currency different from the operating subsidiary's functional currency. Given the volatility of exchange rates, we may not be able to manage our currency transaction risks effectively, or volatility in currency exchange rates may expose our financial condition or results of operations to a significant additional risk.
23
Our ability to use tax deductions to reduce future tax payments may be limited if there is a change in ownership of Grace or if Grace does not generate sufficient U.S. taxable income.
Our ability to use future tax deductions, including net operating losses and deductions for the payments contemplated in the Joint Plan (including the deferred payments), may be limited by Section 382 of the Internal Revenue Code of 1986, as amended, if we undergo an ownership change as a result of future changes in the ownership of outstanding Grace common stock. In addition, our ability to use future tax deductions is dependant on our ability to generate sufficient future taxable income in the U.S. In order to preserve these future tax deductions, the bankruptcy court has approved trading restrictions on Grace common stock until the effective date of a plan of reorganization. These restrictions prohibit (without the consent of Grace) a person from acquiring more than 4.75% of the outstanding Grace common stock or, for any person already holding more than 4.75%, from increasing such person's holdings. The Joint Plan provides that under certain circumstances, the Board of Directors would have the authority to impose restrictions on the transfer of Grace stock with respect to certain 5% shareholders in order to preserve these future tax deductions.
We may be subject to claims of infringement of the intellectual property rights of others, which could hurt our business.
From time to time, we face infringement claims from our competitors or others alleging that our processes or products infringe on their proprietary technologies. Any claims that our products or processes infringe the intellectual property rights of others, regardless of the merit or resolution of the claims, could cause us to incur significant costs in responding to, defending and resolving the claims, and may divert the efforts and attention of our management and technical personnel from our business. If we are found to be infringing on the proprietary technology of others, we may be liable for damages, and we may be required to change our processes, redesign our products, pay others to use the technology or stop using the technology or producing the infringing product. Even if we ultimately prevail, the existence of the lawsuit could prompt our customers to switch to products that are not the subject of infringement suits.
While Grace is in bankruptcy, we are not permitted to pay dividends on Grace common stock.
We are not permitted to pay dividends on Grace common stock while we are in bankruptcy. Following emergence from bankruptcy, we may be subject to covenants in connection with our financing arrangements that limit or prevent us from paying dividends for the foreseeable future. Furthermore, it is likely that following our emergence from bankruptcy, our board of directors will decide to reinvest our operating cash flow in our business rather than paying dividends. Accordingly, for the foreseeable future, investors in Grace common stock, in all likelihood, will obtain an economic benefit from their shares only by selling them.
INDUSTRY RISKS
The length and depth of product and industry business cycles in our segments may result in periods of reduced sales, operating margins and operating losses.
Our operating segments are sensitive to the cyclical nature of the industries they serve. Our hydroprocessing catalyst product line and other hydroprocessing catalyst suppliers have experienced alternating periods of inadequate capacity and excess capacity for their products. Periods of inadequate capacity, including some due to raw material shortages, have usually resulted in increased selling prices and operating margins. This has often been followed by periods of capacity additions, which have resulted in declining capacity utilization rates, selling prices and operating margins. Our construction business is cyclical in response to economic conditions and construction
24
demand and is also seasonal and dependent on favorable weather conditions, with a decrease in construction activity during the winter months.
Prices for certain raw materials and energy are volatile; we may not be able to pass through increases in costs and expenses for raw materials and energy or maintain our current pricing levels which may hurt our profitability.
We use metals, significant amounts of natural gas and petroleum-based materials, including both specialty and commodity materials such as resins and solvents, in the manufacture of our products. Prices for these materials have fluctuated significantly in recent years. To the extent raw material and energy prices increase and we are unable to pass through such price increases to our customers, our operating profit and results of operations may decline.
A substantial portion of our raw materials are commodities whose prices fluctuate as market supply and demand fundamentals change.
We attempt to manage exposure to price volatility of major commodities through:
- •
- long-term supply contracts;
- •
- contracts with customers that permit adjustments for changes in prices of commodity-based materials and energy;
- •
- forward buying programs that layer in our expected requirements systematically over time; and
- •
- limited use of financial instruments.
Although we regularly assess our exposure to raw material price volatility, we cannot always predict the prospects of volatility and we cannot always cover the risk in a cost effective manner.
We have a policy of maintaining, when available, multiple sources of supply for raw materials. However, certain of our raw materials may be provided by single sources of supply. We may not be able to obtain sufficient raw materials due to unforeseen developments that would cause an interruption in supply. Even if we have multiple sources of supply for raw materials, these sources may not make up for the loss of a major supplier.
We spend large amounts of money for environmental compliance in connection with our current and former operations.
As a manufacturer of specialty chemicals and specialty materials, we are subject to stringent regulations under numerous U.S. federal, state, local and foreign environmental, health and safety laws and regulations relating to the generation, storage, handling, discharge, disposition and stewardship of hazardous wastes and other materials. We have expended substantial funds to comply with such laws and regulations and have established a policy to minimize our emissions to the environment. Nevertheless, legislative, regulatory and economic uncertainties (including existing and potential laws and regulations pertaining to climate change) make it difficult for us to project future spending for these purposes and if there is an acceleration in new regulatory requirements, we may be required to expend substantial additional funds to remain in compliance.
We work with dangerous materials that can injure our employees, damage our facilities and disrupt our operations.
Some of our operations involve the handling of hazardous materials that may pose the risk of fire, explosion, or the release of hazardous substances. Such events could result from terrorist attacks, natural disasters, or operational failures, and might cause injury or loss of life to our
25
employees and others, environmental contamination, and property damage. These events might cause a temporary shutdown of an affected plant, or portion thereof, and we could be subject to penalties or claims as a result. A disruption of our operations caused by these or other events could have a material adverse effect on our results of operations.
Some of our employees are unionized, represented by workers' councils or employed subject to local laws that are less favorable to employers than the laws in the United States.
As of December 31, 2009, we had approximately 5,940 global employees. Approximately 750 of our approximately 2,650 U.S. employees are unionized. In addition, a large number of our employees are employed in countries in which employment laws provide greater bargaining or other rights to employees than the laws in the United States. Such employment rights require us to work collaboratively with the legal representatives of the employees to effect any changes to labor arrangements. For example, most of our employees in Europe are represented by workers' councils that have co-determination rights on any changes in conditions of employment, including salaries and benefits and staff changes, and may impede efforts to restructure our workforce. Collective bargaining agreements with unions representing employees at several of our facilities are scheduled to expire during 2010 and we expect that they will require renegotiation. A strike, work stoppage or slowdown by our employees or significant dispute with our employees, whether or not related to these negotiations, could result in a significant disruption of our operations or higher ongoing labor costs.
Item 1B. UNRESOLVED STAFF COMMENTS
None.
We operate manufacturing plants and other facilities (including office, warehouse, and other service facilities) throughout the world. Some of these plants and facilities are shared by both of our operating segments. We own all of our major manufacturing plants. We consider our major operating properties to be in good operating condition and suitable for their current use. We believe that, after taking planned expansion into account, the productive capacity of our plants and other facilities is generally adequate for current operations and foreseeable growth.
Our Grace Davison operating segment operates out of 38 facilities in the following regions:
Region
|
Number of Facilities |
|||
|---|---|---|---|---|
North America |
13 | |||
Europe Middle East Africa |
12 | |||
Asia Pacific |
11 | |||
Latin America |
2 | |||
Our largest Grace Davison facilities are located in Baltimore, Maryland; Lake Charles, Louisiana; and Worms, Germany.
26
Our Grace Construction Products operating segment operates out of 55 facilities in the following regions:
Region
|
Number of Facilities |
|||
|---|---|---|---|---|
North America |
22 | |||
Europe Middle East Africa |
14 | |||
Asia Pacific |
16 | |||
Latin America |
3 | |||
Our largest GCP facilities are located in Cambridge, Massachusetts and Chicago, Illinois. Because of the nature of our GCP products, GCP requires a greater number of facilities to service our customers than Grace Davison. Also, these facilities are generally smaller and less capital intensive than our Grace Davison facilities. For information on our net properties and equipment by region and country, see disclosure set forth in Item 8 (Financial Statements and Supplementary Data) in the Financial Supplement under Note 21 (Operating Segment Information) to our Consolidated Financial Statements which disclosure is incorporated herein by reference.
CHAPTER 11 PROCEEDINGS
Disclosure provided in this Report in Item 1 (Business) under the caption "Chapter 11 Filing" and in Item 8 (Financial Statements and Supplementary Data) in the Financial Supplement under Note 1 (Basis of Presentation and Summary of Significant Accounting and Financial Reporting Policies), under the caption "Voluntary Bankruptcy Filing," Note 2 (Chapter 11 Information) and Note 3 (Asbestos-Related Litigation) to the Consolidated Financial Statements is incorporated herein by reference.
ASBESTOS LITIGATION
Disclosure provided in this Report in Item 8 (Financial Statements and Supplementary Data) in the Financial Supplement under Note 2 (Chapter 11 Information) and Note 3 (Asbestos-Related Litigation) to the Consolidated Financial Statements is incorporated herein by reference.
ENVIRONMENTAL INVESTIGATIONS, CLAIMS AND CIVIL PROCEEDINGS
Disclosure provided in this Report in Item 1 (Business) under the caption "Environmental, Health and Safety Matters" and Item 8 (Financial Statements and Supplementary Data) in the Financial Supplement under Note 13 (Commitments and Contingent Liabilities), under the caption "Environmental Remediation," to the Consolidated Financial Statements is incorporated herein by reference.
The Environmental Protection Agency, EPA, has compiled an investigation list of over 250 sites, Vermiculite Sites, that at one time used, stored, or expanded vermiculite concentrate that originated from the Grace vermiculite mine in Libby, Montana. Grace currently operates or formerly operated 53 of these sites, Grace Vermiculite Sites, and never owned or operated the remaining sites, non-Grace Vermiculite Sites. Prior to 2009, EPA identified 17 of the 53 Grace Vermiculite Sites as requiring remedial action. Grace, EPA and/or other potentially responsible parties have conducted investigations and/or remedial actions at all 17 of these sites. Also prior to 2009, EPA made claims against Grace with respect to 11 of the 17 Grace Vermiculite Sites and three non-Grace Vermiculite Sites. Ten of EPA's 11 Grace Vermiculite Site claims and the three EPA non-Grace Vermiculite Site claims are resolved by the Multi-Site Agreement. Grace is negotiating a settlement agreement in cooperation with EPA at the Grace Vermiculite Site that is not resolved by the Multi-Site Agreement.
27
During 2009, EPA notified Grace with respect to an additional Grace Vermiculite Site, not included in the 17 sites described above, at which EPA has conducted remediation. Grace has reached a tentative settlement with EPA for its remediation costs for this site and the tentative settlement amount is included in Grace's recorded environmental liability. Also during 2009, Grace learned that EPA may reinvestigate approximately 100 former or currently operating expansion plants included in the investigation list described above. Of these expansion plants, seven are currently owned by Grace. Grace is unable to determine the possible results of any reinvestigation and whether it may result in additional claims by EPA.
In addition, the Agency for Toxic Substances and Disease Registry ("ATSDR") of the Centers for Disease Control and Prevention, an agency of the U.S. Department of Health and Human Services, has conducted health consultations at: (i) 23 of the 53 Grace Vermiculite Sites; and (ii) an additional five non-Grace Vermiculite Sites. ATSDR has conducted health screenings for current and former Grace employees and their household contacts at four of these locations. The cost of the health consultations are resolved through the Multi-Site Agreement. Grace's estimate of the cost of the health screenings is included in Grace's recorded environmental liability. Although these health consultations and screenings may result in asbestos-related personal injury claims, the proposed joint plan of reorganization provides that all future asbestos-related personal injury claims would be channeled for resolution to an asbestos trust to be established under Section 524(g) of the U.S. Bankruptcy Code.
LITIGATION RELATED TO FORMER PACKAGING AND MEDICAL CARE BUSINESSES
Disclosure provided in this Report in Item 8 (Financial Statements and Supplementary Data) in the Financial Supplement under Note 2 (Chapter 11 Information), under the caption "Litigation Proceedings in Bankruptcy Court," to the Consolidated Financial Statements is incorporated herein by reference.
TAX CLAIMS
Disclosure provided in this Report in Item 8 (Financial Statements and Supplementary Data) in the Financial Supplement under Note 10 (Income Taxes) to the Consolidated Financial Statements is incorporated herein by reference.
OTHER CLAIMS RECEIVED PRIOR TO THE CHAPTER 11 BAR DATE
Disclosure provided in this Report in Item 8 (Financial Statements and Supplementary Data) in the Financial Supplement under Note 2 (Chapter 11 Information) under the caption "Plans of Reorganization" to the Consolidated Financial Statements is incorporated herein by reference.
Item 4. SUBMISSION OF MATTERS TO A VOTE OF SECURITY HOLDERS
This Item is inapplicable, as no matters were submitted to a vote of our security holders during the fourth quarter of 2009.
28
Item 5. MARKET FOR REGISTRANT'S COMMON EQUITY, RELATED SHAREHOLDER MATTERS AND ISSUER PURCHASES OF EQUITY SECURITIES
Except as provided below, the disclosure required by this Item appears in the Financial Supplement, under the heading "Selected Financial Data" opposite the caption "Other Statistics—Common shareholders of record," and in this Report in Item 8 (Financial Statements and Supplementary Data) in the Financial Supplement in Note 17 (Shareholders' Equity (Deficit)) and Note 24 (Quarterly Summary and Statistical Information (Unaudited)), opposite the caption "Market price of common stock," to the Consolidated Financial Statements and is incorporated herein by reference.
SHAREHOLDER RIGHTS AGREEMENT
On March 31, 1998, we paid a dividend of one Preferred Stock Purchase Right on each share of Grace common stock. Subject to our prior redemption for $.01 per right, rights will become exercisable on the earlier of:
- •
- 10 days after an acquiring person, comprised of an individual or group, has acquired beneficial ownership of 20% or
more of the outstanding Grace common stock or
- •
- 10 business days (or a later date fixed by the Board of Directors) after an acquiring person commences (or announces the intention to commence) a tender offer or exchange offer for beneficial ownership of 20% or more of the outstanding Grace common stock.
Until these events occur, the rights will automatically trade with the Grace common stock, and separate certificates for the rights will not be distributed. The rights do not have voting or dividend rights.
Generally, each right not owned by an acquiring person:
- •
- will initially entitle the holder to buy from Grace one hundredth of a share of the Grace Junior Participating Preferred
Stock, at an exercise price of $100, subject to adjustment;
- •
- will entitle such holder to receive upon exercise, in lieu of shares of Grace junior preferred stock, that number of
shares of Grace common stock having a market value of two times the exercise price of the right; and
- •
- may be exchanged by Grace for one share of Grace common stock or one hundredth of a share of Grace junior preferred stock, subject to adjustment.
Generally, if there is an acquiring person and we are acquired, each right not owned by an acquiring person will entitle the holder to buy a number of shares of common stock of the acquiring company having a market value equal to twice the exercise price of the right.
Each share of Grace junior preferred stock will be entitled to a minimum preferential quarterly dividend payment of $1.00 per share but will be entitled to an aggregate dividend equal to 100 times the dividend declared per share of Grace common stock whenever such dividend is declared. In the event of liquidation, holders of Grace junior preferred stock will be entitled to a minimum preferential liquidation payment of $100 per share but will be entitled to an aggregate payment equal to 100 times the payment made per share of Grace common stock. Each share of Grace junior preferred stock will have 100 votes, voting together with the Grace common stock. Finally, in the event of any business combination, each share of Grace junior preferred stock will be entitled to receive an amount equal to 100 times the amount received per share of Grace common stock. These rights are protected by customary antidilution provisions.
29
The terms of the rights may be amended by the Board of Directors without the consent of the holders of the rights. The rights, which will remain outstanding under the proposed joint plan of reorganization, expire on March 30, 2018.
This summary of the rights does not purport to be complete and is qualified in its entirety by reference to the Rights Agreement, which has been filed with the SEC.
DIVIDENDS ON GRACE COMMON STOCK
We are not permitted to pay dividends on Grace common stock while we are in bankruptcy and have not done so since the filing of our bankruptcy petitions in 2001. Following emergence from bankruptcy, we may be subject to covenants in connection with our financing arrangements that limit or prevent us from paying dividends for the foreseeable future. Furthermore, it is likely that following our emergence from bankruptcy, our board of directors will decide to reinvest our operating cash flow in our business rather than paying dividends.
STOCK TRANSFER RESTRICTIONS
In order to preserve significant tax benefits which are subject to elimination or limitation in the event of a change in control (as defined by the Internal Revenue Code) of Grace, the Bankruptcy Court has approved trading restrictions on Grace common stock until the effective date of a plan of reorganization. These restrictions prohibit (without the consent of Grace) a person from acquiring more than 4.75% of the outstanding Grace common stock or, for any person already holding more than 4.75%, from increasing such person's holdings. This summary of the stock transfer restrictions does not purport to be complete and is qualified in its entirety by reference to the order of the Bankruptcy Court, which has been filed with the SEC.
Also, in order to preserve these tax assets in the event of a change in control (as defined by the Internal Revenue Code) of Grace after emergence from Chapter 11, the Joint Plan provides that under certain circumstances, the Board of Directors would have the authority to impose restrictions on the transfer of Grace stock with respect to certain 5% shareholders. These restrictions would generally not limit the ability of a person that holds less than 5% of Grace stock after emergence to either buy or sell stock on the open market.
Item 6. SELECTED FINANCIAL DATA
The disclosure required by this Item appears in the Financial Supplement under the heading "Selected Financial Data" which disclosure is incorporated herein by reference.
Item 7. MANAGEMENT'S DISCUSSION AND ANALYSIS OF FINANCIAL CONDITION AND RESULTS OF OPERATIONS
The disclosure required by this Item appears in the Financial Supplement under the heading "Management's Discussion and Analysis of Financial Condition and Results of Operations" which disclosure is incorporated herein by reference.
Item 7A. QUANTITATIVE AND QUALITATIVE DISCLOSURES ABOUT MARKET RISK
Market Risk
Our debt obligations, global operations, and our raw materials and energy requirements expose us to various market risks. We use derivative financial instruments to mitigate certain market risks. The following is a discussion of our primary market risk exposures, how those exposures are managed, and certain quantitative data pertaining to our market risk sensitive instruments.
30
Interest Rate Risk
Interest rate fluctuations directly affect interest expense and cash to be paid out in the form of interest payments on variable-rate debt, and can potentially lead to changes in the market value of the associated variable-rate debt.
We have $500.0 million of outstanding pre-petition variable-rate borrowings under bank credit agreements, and interest is accrued on this debt based on the prime rate. Due to our Chapter 11 filing, interest accrued on pre-petition debt is added to the principal balance. As of December 31, 2009 and 2008, total interest accrued on this debt and added to the $500.0 million principal was $350.6 million and $323.5 million, respectively. If the prime rate were to vary in the near-term by one percentage point, the effect would be to increase or decrease interest expense and accrued interest on outstanding principal by approximately $8.7 million over the twelve-month period ending December 31, 2010.
We do not currently use derivative instruments to mitigate interest rate risk.
Currency Exchange Rate Risk
Because we do business in over 40 countries, our results of operations are exposed to fluctuations in currency exchange rates. We seek to minimize exposure to these fluctuations by matching revenue streams in volatile currencies with expenditures in the same currencies, but it is not always possible to do so. From time to time, we use financial instruments such as currency forward contracts, options, or combinations of the two to reduce the risk of certain specific transactions. However, we do not have a policy of hedging all exposures, because management does not believe that such a level of hedging would be cost-effective. We do not hedge translation exposures that are not expected to affect cash flows in the near-term. Significant uses of derivatives to mitigate the effects of changes in currency exchange rates are as follows:
In November 2007, we executed intercompany loans in the aggregate amount of €250 million (Euros) between our principal U.S. operating subsidiary and a newly established German subsidiary as part of a legal restructuring. In conjunction with the loans, our U.S. subsidiary entered into a series of currency forward contracts in order to fix the dollar/euro exchange rate that will apply to convert euro principal payments under loans to dollars. The forward contracts are aligned with the anticipated payment dates of the intercompany loans, which extend from June 2010 through November 2013. The total amount outstanding under the intercompany loans was €247.8 million as of December 31, 2009 (approximately $355.5 million). Currency fluctuations on these loans and the related forward contracts are recorded as components of operating results.
The following tables provide information about our significant currency forward exchange agreements as of December 31, 2009 and 2008, specifically, the notional, or contract, amounts (in millions of U.S. dollars), and weighted average exchange rates (U.S. dollars to Euros) by expected (contractual) maturity dates. These notional amounts generally are used to calculate the contractual payments to be exchanged under the contract. The fair values represent the fair value of the derivative contracts, and are presented as other assets or other liabilities and allocated between current and non-current, as appropriate, in the Consolidated Balance Sheets.
| |
Euro Forward Contracts—December 31, 2009 Expected Maturity Date |
||||||||||||||||||
|---|---|---|---|---|---|---|---|---|---|---|---|---|---|---|---|---|---|---|---|
Currency Forward Exchange Agreements
|
2010 | 2011 | 2012 | 2013 | Total | Fair Value |
|||||||||||||
Contract amount |
143.2 | 72.5 | 72.6 | 72.9 | 361.2 | 4.2 | |||||||||||||
Average contractual exchange rate |
1.46 | 1.45 | 1.45 | 1.46 | 1.46 | N/A | |||||||||||||
31
| |
Euro Forward Contracts—December 31, 2008 Expected Maturity Date |
|||||||||||||||||||||
|---|---|---|---|---|---|---|---|---|---|---|---|---|---|---|---|---|---|---|---|---|---|---|
Currency Forward Exchange Agreements
|
2009 | 2010 | 2011 | 2012 | 2013 | Total | Fair Value |
|||||||||||||||
Contract amount |
72.7 | 72.5 | 72.5 | 72.6 | 72.9 | 363.2 | 21.0 | |||||||||||||||
Average contractual exchange rate |
1.45 | 1.45 | 1.45 | 1.45 | 1.46 | 1.45 | N/A | |||||||||||||||
Commodity Price Risk
We operate in markets where the prices of raw materials and energy are commonly affected by cyclical movements of the economy and other economic factors. The principal raw materials used in our products include caustic, alumina, rare earths, nickel, aluminum, cobalt carbonate, kaolin, molybdenum, sodium aluminate, sodium silicate, olefins, gypsum, resins, rubber and latices. Natural gas is the largest single energy source that we purchase. These commodities are generally available to be purchased from more than one supplier. In order to minimize the risk of increasing prices on certain raw materials and energy, we use a centralized supply chain organization for procurement in order to improve purchasing activities. We have a risk management committee to review proposals to hedge purchases of raw materials, energy and currency.
We have implemented a risk management program under which our goal is to hedge natural gas and aluminum supply in a way that provides protection against price volatility of the natural gas and aluminum markets. In order to mitigate volatile natural gas and aluminum prices, we have entered into fixed price swaps to hedge a portion of our natural gas and aluminum requirements.
The following tables provide information about our commodity derivatives. For natural gas commodity derivatives, contract volumes, or notional amounts, are presented in millions of British thermal units (MMBtu), weighted average contract prices are presented in U.S. dollars per MMBtu, and the total contract amount and fair value are presented in millions of U.S. dollars. For aluminum commodity derivatives, contract volumes, or notional amounts, are presented in millions of pounds, weighted average contract prices are presented in U.S. dollars per pound, and the total contract amount and fair value are presented in millions of U.S. dollars. The fair values represent the fair value of the derivative contracts. The fair value for swaps represents the excess of the variable price (market price) over the fixed price (pay price) multiplied by the nominal contract volumes. All commodity derivative instruments mature within twelve months.
| |
Commodity Derivatives—December 31, 2009 | ||||||||||||
|---|---|---|---|---|---|---|---|---|---|---|---|---|---|
Type of Contract
|
Contract Volumes |
Weighted Average Price |
Total Contract Amount |
Fair Value |
|||||||||
Natural Gas Swaps |
3.1 | 5.62 | 17.4 | 0.1 | |||||||||
Aluminum Swaps |
3.1 | 0.96 | 3.0 | 0.3 | |||||||||
| |
Commodity Derivatives—December 31, 2008 | ||||||||||||
|---|---|---|---|---|---|---|---|---|---|---|---|---|---|
Type of Contract
|
Contract Volumes |
Weighted Average Price |
Total Contract Amount |
Fair Value |
|||||||||
Natural Gas Swaps |
4.7 | 8.36 | 39.5 | (10.8 | ) | ||||||||
The fair value of commodity swaps derivative contracts are presented as other assets or other liabilities and allocated between current and non-current, as appropriate, in the Consolidated Balance Sheets. Our forward contracts for natural gas and aluminum qualify for the normal purchases and normal sales exception from ASC 815, as they do not contain net settlement provisions, and result in physical delivery of natural gas and aluminum from suppliers. Therefore, the fair values of these contracts are not recorded in our Consolidated Balance Sheets.
32
Item 8. FINANCIAL STATEMENTS AND SUPPLEMENTARY DATA
The disclosure required by this Item appears in the Financial Supplement which disclosure is incorporated herein by reference.
Item 9. CHANGES IN AND DISAGREEMENTS WITH ACCOUNTANTS ON ACCOUNTING AND FINANCIAL DISCLOSURE
None.
Item 9A. CONTROLS AND PROCEDURES
Except as provided below, the disclosure required by this Item appears in the Financial Supplement under the heading "Management's Report on Financial Information and Internal Controls" which disclosure is incorporated herein by reference.
There was no change in Grace's internal control over financial reporting during the quarter ended December 31, 2009 that has materially affected, or is reasonably likely to materially affect, Grace's internal control over financial reporting.
None.
33
Item 10. DIRECTORS, EXECUTIVE OFFICERS AND CORPORATE GOVERNANCE
Our current directors and executive officers are listed below. Our Certificate of Incorporation provides for the division of the Board of Directors into three classes, each to serve for a three-year term or until their respective successors are elected. In view of the Chapter 11 filing, the directors are continuing to serve beyond the expiration of their respective terms. Executive officers are elected to serve until the next annual meeting of the Board of Directors or until their respective successors are elected.
Name and Age
|
Office | First Elected |
||||
|---|---|---|---|---|---|---|
John F. Akers (75) |
Class II Director | 05/09/97 | ||||
H. Furlong Baldwin (78) |
Class I Director | 01/16/02 | ||||
Ronald C. Cambre (71) |
Class III Director | 09/01/98 | ||||
Alfred E. Festa (50) |
Class II Director | 09/08/04 | ||||
|
Chairman of the Board | 01/01/08 | ||||
|
President and Chief Executive Officer | 06/01/05 | ||||
Marye Anne Fox (62) |
Class I Director | 05/10/96 | ||||
John J. Murphy (78) |
Class II Director | 05/09/97 | ||||
Christopher J. Steffen (68) |
Class I Director | 11/01/06 | ||||
Mark E. Tomkins (54) |
Class III Director | 09/06/06 | ||||
Thomas A. Vanderslice (78) |
Class I Director and Lead Independent Director | 05/10/96 | ||||
D. Andrew Bonham (49) |
Vice President & President, Grace Construction Products | 09/11/07 | ||||
William M. Corcoran (60) |
Vice President, Public and Regulatory Affairs | 06/01/99 | ||||
Hudson La Force III (45) |
Senior Vice President & Chief Financial Officer | 04/01/08 | ||||
W. Brian McGowan (60) |
Senior Vice President | 07/09/98 | ||||
Gregory E. Poling (54) |
Vice President & President, Grace Davison | 03/03/05 | ||||
Mark A. Shelnitz (51) |
Vice President, General Counsel & Secretary | 04/27/05 | ||||
Pamela K. Wagoner (46) |
Vice President & Chief Human Resources Officer | 07/13/09 | ||||
Paul J. Norris resigned as a director of Grace effective February 5, 2010.
Mr. Akers served as Chairman of the Board and Chief Executive Officer of International Business Machines Corporation from 1985 until his retirement in 1993. He is also a director of Lehman Brothers Holdings, Inc.
Mr. Baldwin served as a director of Mercantile Bankshares Corporation from 1970 to 2003, as Chairman of the Board from 1984 to 2003 and as President and Chief Executive Officer from 1976 to 2001. Mr. Baldwin is Chairman of NASDAQ OMX Group, Inc., and is a director of Platinum Underwriters Holdings, Ltd. and Allegheny Energy Inc.
Mr. Cambre is retired Chairman of the Board and Chief Executive Officer of Newmont Mining Corporation. He joined Newmont as Vice Chairman and CEO in 1993 and retired as CEO in 2000 and as Chairman in 2001. Mr. Cambre is Chairman of the Board of McDermott International, Inc. He is also a director of Cliffs Natural Resources Inc.
Mr. Festa joined Grace in 2003 as President and Chief Operating Officer. He was elected Chief Executive Officer in 2005 and Chairman in January 2008. Prior to joining Grace, Mr. Festa was a partner of Morganthaler Private Equity Partners, a venture capital and buyout firm from 2002 to 2003. From 2000 to 2002, he was with ICG Commerce, Inc., a private company providing on-line procurement services, where he last served as President and Chief Executive Officer. Prior to that,
34
he served as Vice President and General Manager of AlliedSignal's (now Honeywell) performance fibers business. Mr. Festa is a director of NVR, Inc., a publicly held home builder.
Dr. Fox has been Chancellor of the University of California San Diego and Distinguished Professor of Chemistry at that institution since 2004. She was Chancellor of North Carolina State University from 1998 to 2004. She is also a director of Boston Scientific Corporation and Red Hat, Inc.
Mr. Murphy served as Chairman of the Board of Dresser Industries, Inc., a supplier of products and technical services to the energy industry, until 1996. From 1997 to 2000, he was a Managing Director of SMG Management L.L.C., a privately owned investment group.
Mr. Steffen most recently served as Vice Chairman of Citicorp and its principal subsidiary, Citibank N.A. Since his retirement in 1996, he has been a consultant to a number of companies and public accounting firms and served on committees advising the Financial Accounting Standards Board. Mr. Steffen is also a director of Accelrys, Inc., ViaSystems, Inc. and several private companies in which he has an ownership stake.
Mr. Tomkins served as Senior Vice President and Chief Financial Officer of Innovene, a petrochemical and oil refining company that is now part of the INEOS Group, from 2005 until January 2006. He served as CFO of Vulcan Materials Company from 2001 to 2005. Mr. Tomkins is a member of the Board of Directors of CVR Energy, Inc., a publicly held oil refining company and Elevance Renewable Sciences Inc.
Mr. Vanderslice served as Chairman and Chief Executive Officer of M/A-COM, Inc., a designer and manufacturer of radio frequency and microwave components, devices and subsystems for commercial and defense applications, from 1989 until 1995. He is currently a private investor. As Lead Independent Director, Mr. Vanderslice presides at all executive sessions of the Board.
Messrs. Corcoran, McGowan, Poling and Shelnitz have been actively engaged in Grace's business for the past five years. Mr. Poling served as a director of Foamex International, Inc until January 2010.
Mr. Bonham joined Grace in 2005 as Vice President and General Manager of Grace Construction Products' European operations. Prior to joining Grace, he was President and General Manager, from 2004 to 2005, and Vice President and General Manager, from 2002 to 2004, of Invensys Controls Americas. Before joining Invensys Controls, Mr. Bonham held positions of increasing responsibility at General Electric and Honeywell.
Mr. La Force joined Grace in 2008 as Senior Vice President and Chief Financial Officer. Prior to joining Grace, he was Chief Operating Officer and Senior Counselor to the Secretary at the U.S. Department of Education. Prior to entering public service in 2005, Mr. La Force held general management and financial management positions of increasing responsibility at Dell Inc. and AlliedSignal, Inc. (now Honeywell). Mr. La Force is a member of the advisory board of Madison Capital Partners, a Chicago-based private equity firm.
Ms. Wagoner joined Grace in 2009 as Vice President and Chief Human Resources Officer. Prior to joining Grace, she was Senior Vice President, Human Resources at Host Hotels & Resorts, Inc. since 2003.
Audit Committee
We have a standing Audit Committee established in accordance with the provisions of the Securities Exchange Act of 1934, as amended. The Committee members are John F. Akers, H. Furlong Baldwin, Ronald C. Cambre, Marye Anne Fox, John J. Murphy, Christopher J. Steffen, Mark E. Tomkins and Thomas A. Vanderslice, each of whom meets the independence standards of the
35
SEC and New York Stock Exchange. Mr. Tomkins serves as Chair of the Audit Committee. The Board of Directors has determined that all Audit Committee members are audit committee financial experts as defined by SEC regulations. A complete description of the responsibilities of the Audit Committee is set forth in the Grace Audit Committee Charter which is available on the Internet at www.grace.com/About/Leadership/Governance/.
Other Committees
We have standing Nominating and Governance, Compensation and Corporate Responsibility Committees. The members of each of these committees are John F. Akers, H. Furlong Baldwin, Ronald C. Cambre, Marye Anne Fox, John J. Murphy, Christopher J. Steffen, Mark E. Tomkins and Thomas A. Vanderslice, each of whom meets the independence standards of the New York Stock Exchange. Mr. Vanderslice serves as Chair of the Nominating and Governance Committee, Mr. Akers serves as Chair of the Compensation Committee and Dr. Fox serves as Chair of the Corporate Responsibility Committee. A complete description of the responsibilities of the Board committees is set forth in their respective committee charters which are available on the Internet at www.grace.com/About/Leadership/Governance/.
Section 16(a) Beneficial Ownership Reporting Compliance
Under Section 16 of the Securities Exchange Act of 1934, as amended, our directors, certain of our officers, and beneficial owners of more than 10% of the outstanding Grace common stock are required to file reports with the SEC concerning their ownership of and transactions in Grace common stock or other Grace securities; these persons are also required to furnish us with copies of these reports. Based upon the reports and related information furnished to us, we believe that all such filing requirements were complied with in a timely manner during and with respect to 2009.
Code of Ethics for Principal Officers
The Board of Directors and the Audit Committee have adopted Business Ethics and Conflicts of Interest policies, which apply to all of our directors, officers, and employees, including our principal officers. These policies are accessible through our Internet website, www.grace.com/About/Leadership/Governance/, and are available in hard copy, free of charge, by contacting Grace Shareholder Services at 410-531-4167. We granted no waivers to these policies during 2009. We intend to promptly post on our website any amendments or waivers to these policies affecting any principal executive officer, principal financial officer, principal accounting officer or controller, or persons performing similar functions.
Item 11. EXECUTIVE COMPENSATION
Compensation Discussion and Analysis
Overview
The Board of Directors has designated eight Grace officers (including the five executive officers named in the Summary Compensation Table) as "executive officers." The executive officers include the Chief Executive Officer (CEO), Chief Financial Officer and vice presidents who are in charge of operating segments or principal functions or who have policy-making authority for Grace. The Board of Directors has delegated authority for administering the compensation program for executive officers and other members of senior management to the Compensation Committee. The Board has appointed all of the independent members of the Board to serve as members of the Compensation Committee.
36
A complete description of the responsibilities of the Compensation Committee is set forth in the Grace Compensation Committee Charter, which is available on the Internet at www.grace.com/About/Leadership/Governance/. The Compensation Committee and the Board review and revise the charter as necessary. In this Compensation Discussion and Analysis, unless the context otherwise requires, the terms "we", "our" and "the committee" refer to the Compensation Committee.
We are responsible for reviewing and approving all executive officers' compensation, including:
- •
- base salary;
- •
- annual incentive compensation;
- •
- long-term incentive compensation;
- •
- employment agreements;
- •
- severance arrangements;
- •
- change-in-control agreements; and
- •
- any special or supplemental benefits not generally available to salaried employees.
We also review and approve all corporate goals and objectives used in determining the incentive compensation of each executive officer. We evaluate each executive officer's performance in light of those goals and objectives and we approve each executive officer's incentive compensation based on this evaluation. In determining the long-term incentive component of an executive officer's compensation, we consider the value of similar incentive awards to executive officers with similar titles at comparable companies and the awards given to the executive officer in previous years. We also approve the annual and long-term incentive programs applicable to other salaried personnel in which the executive officers participate.
We receive advice and legal and administrative assistance from the Grace human resources department and legal services group in meeting our responsibilities. We also have authority to retain advisors from outside of Grace. During 2009, we used the services of Towers Watson, a human resources consulting firm, and we expect to continue working with Towers Watson during 2010. We instructed Towers Watson to compile competitive compensation data and, based upon such data, to recommend ranges of annual and long-term compensation that are consistent with our compensation philosophy and objectives as discussed below. We also asked Towers Watson to provide suggestions and alternatives regarding the form of various elements of executive compensation. We expect Towers Watson and Grace executive officers, including the CEO, General Counsel and Chief Human Relations Officer, and their respective subordinates, to meet, exchange information and otherwise cooperate in the performance of their respective duties outside committee meetings. During 2009, Towers Watson provided consulting services to Grace in connection with employee benefit plans.
37
Overview of Compensation Elements
The following table outlines the major elements of compensation in 2009 for the executive officers named in the Summary Compensation Table:
Compensation Element
|
Definition | Rationale | ||
|---|---|---|---|---|
| Base Salary | Fixed cash compensation paid twice monthly | Payment for completion of day-to-day responsibilities | ||
Annual Incentive Compensation Program |
Variable cash compensation earned by annual personal performance and Grace's achievement of pre-established annual performance goals |
Builds accountability for annual goals for Grace and individual executives |
||
Long-Term Incentive Compensation Program (Cash-Based) |
Variable, cash compensation that is earned when pre-established three-year financial goals are achieved |
Aligns long-term interests of executive officers and shareholders |
||
Forfeiture provisions encourage retention |
||||
Long-Term Incentive Compensation Program (Equity-Based) |
Equity compensation with staggered vesting that increases in value with increases in share price |
Aligns long-term interests of executive officers and shareholders |
||
Forfeiture provisions encourage retention |
||||
U. S. Defined Contribution Retirement Plans |
Savings and Investment (S&I) Plan (401(k)) |
Qualified defined contribution plan is a standard tax-qualified benefit generally offered to U.S. employees subject to limitations on compensation and benefits under the Internal Revenue Code |
||
S&I Plan Replacement Payment Program (nonqualified) |
Restores benefits that are limited by the Internal Revenue Code in the qualified plan for most highly-paid executives |
|||
U. S. Defined Benefit Retirement Plans |
Qualified Pension Plan |
Qualified pension plan is a standard tax-qualified benefit generally offered to U. S. employees subject to limitations on compensation and benefits under the Internal Revenue Code |
||
Supplemental Executive Retirement Plan |
Restores benefits that are limited by the Internal Revenue Code in the qualified plan for most highly-paid executives |
38
Executive Compensation Philosophy and Objectives
General
The key objective of the Grace executive compensation program is to enable Grace to compete effectively with other firms in attracting, motivating and retaining the executives that Grace needs to ensure its future growth and business success. We intend the incentive compensation portion of the program to align closely the financial interests of Grace executives with those of Grace's stakeholders (including creditors, security holders and others with an interest in the Chapter 11 proceedings as required by the Bankruptcy Code). Because senior executives have a substantial ability to influence business success, we believe that the portion of compensation that is at-risk based on corporate performance should increase as the level of responsibility of the executive increases. We also expect the executive compensation programs to be consistent with a culture of ethical conduct, personal integrity and compliance with Grace policies and applicable law. We require executives to set an example for employees and other Grace business associates in emphasizing the Grace Core Values in their daily business conduct. The Grace Core Values consist of a commitment to teamwork, performance, integrity, speed and innovation, and are the foundation of the Grace corporate culture.
The Grace executive compensation program is designed to reward executives for the achievement of corporate goals and objectives, taking into account both individual performance and contributions to the overall success of Grace. The individual performance evaluation is based on our assessment of an executive officer's leadership, technical skill, management and operational performance, and potential to contribute to Grace's future success. In evaluating executive officers other than the CEO, we receive substantial input from the CEO. The CEO proposes compensation levels for the other executive officers and, although not a member of the committee, attends our meetings and participates in our deliberations regarding compensation levels for the other executive officers. The CEO is excused from deliberations regarding his own compensation and executive sessions. At the request of the CEO, we would very likely hold a special meeting of the committee.
Once we have completed an evaluation of an executive's overall performance, we review the executive's existing compensation and compensation potentially payable to the executive. Due to the modest value of outstanding stock options held by Grace executives prior to 2009 (we did not grant stock options from the time of Grace's entry into Chapter 11 in April 2001 until 2008), we have not considered an executive's outstanding equity-based awards in setting future compensation. We then consult with Towers Watson for an assessment of the competitiveness of Grace executive officer compensation relative to certain benchmark companies in the chemicals, materials and specialty chemicals industry that we deem our peer group for compensation purposes, and relative to certain broad industry data. We selected the benchmark companies as our compensation peer group based upon our judgment regarding the likelihood that they would compete with us for executive talent and the availability of public information regarding their compensation practices. We periodically review the composition of our compensation peer group to ensure that it remains relevant. For 2009, the compensation peer group consisted of:
| Albemarle | Hercules | |
| Cabot | International Flavors & Fragrances | |
| Eastman Chemical | PPG Industries | |
| EcoLab | Rohm & Haas | |
| Fuller (H.B.) | Sigma-Aldrich |
The broad industry data that we generally review is included in studies produced by Towers Watson and Mercer, Hewitt for any given compensation year. The chemicals and non-durable goods sections of these surveys were used, in each case, adjusted to reflect Grace's sales. This data is
39
used as a secondary reference for executive officer compensation, largely as a check on the compensation peer group levels, as well as to determine if there are any identifiable non-industry trends in compensation.
For 2009, we intend that the annual compensation paid to Grace executives (consisting of salary plus annual incentive compensation) and long-term incentive compensation fall within a range that approximates the 50th percentile of the practices of the compensation peer group companies and broad industry data when performance objectives are achieved. We selected this percentile target because it is generally consistent with the historical practices of the compensation peer group. For 2009, we reduced the target for long-term incentive compensation from the 60th percentile to the 50th percentile as part of our effort to reduce costs in the face of the broad economic slowdown. We intend to reevaluate our targets for annual and long-term compensation for 2010. In applying these targets, we do not base our decision on a mathematical analysis of the available data; rather, we use our judgment after considering all available information. If performance objectives are exceeded, we believe that incentive compensation should be above these levels, and when performance objectives are not achieved, incentive compensation should be below these levels.
Following the Grace Chapter 11 filing in 2001, we discontinued the use of equity-based compensation that had been a traditional element of the Grace long-term incentive programs and granted solely cash-based awards. In April 2008, due to developments in the Grace Chapter 11 case, culminating in Grace's proposal of a joint plan of reorganization that contemplates outstanding Grace Common Stock will remain outstanding and holders of outstanding Grace Common Stock will control Grace following emergence, we decided to once again grant equity-based incentive compensation as part of the 2008-2010 Long-Term Incentive Program, or LTIP. As the Grace Chapter 11 case continued to progress through 2008 and into 2009, we determined to also include equity-based compensation in the 2009-2011 LTIP. While we have used equity compensation to directly align the interests of our management team with the interests of Grace shareholders, we recognize that the stock of any company in Chapter 11 is highly speculative and may reflect developments in the company's bankruptcy case rather than the operating performance of its business, accordingly, we retained performance-based awards payable in cash as a significant portion of the 2009-2011 LTIP. We have requested that the Corporate Secretary inform the committee if an executive officer wishes to enter into any transaction involving Grace securities.
For purposes of the cash portion of the Grace annual and long-term incentive compensation programs, we believe that income before interest and taxes is generally the best indicator of the performance of the Grace business. Income before interest and taxes includes the factors that the executive team generally has the ability to affect and excludes the cost of capital and tax rates that we believe are generally unrelated to business performance or management control. However, this income measure is significantly affected by other factors that Grace executives are generally unable to influence such as the substantial costs of the Chapter 11 cases, legacy liabilities, and pension income and expense. As a result, our performance metric for cash incentive compensation purposes is Core EBIT (calculated as described in this Report in Item 7 (Management's Discussion and Analysis of Financial Condition and Results of Operations) in the Financial Supplement) adjusted to eliminate the effect of: changes in pension expense (related to core operations) and LTIP expense from year to year; and, for the LTIP, the effect of major acquisitions or divestments. We generally refer to this performance metric as Core EBIT, as adjusted. Grace core operations are comprised of the financial results of Grace Davison, Grace Construction Products, and the costs of corporate activities that directly or indirectly support their business operations.
Chief Executive Officer
Our process for determining the compensation of the CEO is similar to the process we apply to other executive officers. We review and approve corporate goals and objectives used in determining
40
the compensation of the CEO. We evaluate the CEO's performance in light of those goals and objectives and have sole authority to determine the CEO's compensation based on this evaluation subject to the terms of his employment agreement. The terms of the CEO's employment agreement are discussed below in this Compensation Discussion and Analysis and under the Summary Compensation Table and Potential Payments Upon Termination or Change-In-Control Table. The CEO plays no part in our deliberations or approval of his compensation.
We believe the CEO's compensation should be higher than the compensation of other executive officers because the CEO is uniquely positioned to influence all aspects of Grace's operations and performance and the resulting return to our shareholders. In addition, we believe there exists a robust competition for effective CEO talent among companies the size of Grace and, in this environment, a competitive compensation package is essential for retention. Our view is consistent with the practices of the compensation peer group companies and the broad industry data that we have reviewed.
Base Salary
To ensure comparability with other companies, as well as consistency and uniformity within Grace, all management positions have been assigned to salary ranges based upon broad industry data. Individual salaries and salary increases for executive officers are set within the salary ranges based on the median annual base salaries paid to individuals who hold comparable positions at the compensation peer group companies, salary levels of peers and subordinates within Grace, individual performance and the amount budgeted for salary increases. Although these factors apply to Mr. Festa, his base salary is also subject to the terms of his employment agreement. Grace executives are generally eligible for annual salary reviews.
For 2009, Grace established a guideline for base salary merit increases applicable to Grace U.S. salaried employees. As a cost control measure due to the broad economic slowdown in 2009, we imposed a freeze in base salary on senior executives, including the named executive officers, and certain other highly compensated employees. We made an exception to this policy for Mr. Bonham, who received a base salary increase of 6.7% in order to align his base salary to competitive market rates based on comparable positions at the compensation peer group companies and additional data applicable to geographic regions relevant to Grace's operations.
Annual Incentive Compensation
The Annual Incentive Compensation Program, or AICP, is a cash-based pay-for-performance incentive program. Its purpose is to motivate and reward executive officers, and other upper- and middle-level employees, for their contributions to Grace performance and align their financial interests with those of Grace shareholders by making a significant portion of their annual compensation variable and dependent upon Grace's annual financial performance. The amount of an individual incentive award payment under the AICP is based upon:
- •
- the individual's annual incentive target amount;
- •
- the funding of the AICP incentive pool based on Grace performance and any changes we make in the exercise of our
discretion; and
- •
- the individual's personal performance.
The AICP targets for the named executive officers (other than Mr. Festa) for 2009 range from 65% to 80% of base salary and actual awards may range from $-0- to an amount equal to twice the target amount, based on the factors described above. The AICP targets for executive officers are generally set within the target range based on the median annual bonus paid to individuals who hold comparable positions at the compensation peer group companies. Although these factors also apply
41
to Mr. Festa, his AICP target is also subject to the terms of his employment agreement, which requires a minimum AICP target of 100% of base salary. For 2009, Mr. Festa's AICP target was 100% of base salary.
Due to the broad economic slowdown in 2008 and 2009 and Grace's progress toward emergence from Chapter 11, we reevaluated the AICP for 2009 and modified its structure from the AICP that has been in place for the last few years. In order to support the Board of Directors' dual objectives of raising cash to implement the provisions of the Joint Plan and maintaining earnings under difficult conditions, we included both an earnings measure and a cash generation measure as the performance measures for the 2009 AICP. For the earnings performance measure, we continued to use Core EBIT, as adjusted, as we have in previous AICPs. We generally refer to the related AICP objective as the Core EBIT Target. For the cash generation measure, we use Adjusted Operating Cash Flow, the metric Grace management generally uses to measure Grace's performance in generating cash (calculated as described in this Report in Item 7 (Management's Discussion and Analysis of Financial Condition and Results of Operations) in the Financial Supplement). We generally refer to the related AICP objectives as Cash Flow Targets. For 2009, we adjusted downward the calculation of Adjusted Operating Cash Flow, solely for the AICP calculation, to eliminate the effect of certain events. Included in these events was the cash flow effect of the restructuring and deconsolidation of Advanced Refining Technologies LLC, Grace's joint venture with Chevron Products Company.
For 2009, we apply the performance measures to determine the size of the AICP incentive pool as follows:
Core EBIT Target (in millions) |
Cash Flow Targets (in millions) | Portion of AICP Incentive Pool Earned | ||||
|---|---|---|---|---|---|---|
| Less than $239.8* | N/A | 0 | % | |||
Equal to or Greater than $239.8 |
Less than $300 |
0 |
% |
|||
Equal to or Greater than $239.8 |
$300 |
25 |
% |
|||
Equal to or Greater than $239.8 |
$400 |
100 |
% |
|||
Equal to or Greater than $239.8 |
$540 |
200 |
% |
|||
- *
- Eighty percent of 2008 Core EBIT of $299.7 million.
The actual amount of the AICP incentive pool earned was determined by interpolating Grace's 2009 Adjusted Operating Cash Flow (as adjusted for the 2009 AICP calculation) between the Cash Flow Targets specified above. We determined the EBIT Target in light of our collective expectation that, based on the business environment existing in early 2009 and our review of Grace's 2009 operating plan, Grace 2009 Core EBIT would be substantially below the 2008 level, and that a 2009 Core EBIT threshold equal to at least 80% of the 2008 level would represent good performance for 2009. The Cash Flow Targets reflect our collective view of good to outstanding cash generation performance by Grace based on maximizing Core EBIT and executing on working capital and other cash generation initiatives such as reducing inventory levels, improving collection of accounts receivable and renegotiating terms with suppliers. Based on our mid-year review of general economic conditions and conditions prevailing in Grace's industry, we raised the Cash Flow Target for achieving the maximum AICP incentive pool of 200% from $500 million to $540 million. The 2009 AICP incentive pool would generally not be funded if Grace did not meet the Core EBIT Target or $300 million Cash Flow Target; provided however, we have discretion to adjust the performance objectives or establish or increase the size of the AICP incentive pool even if performance objectives are not achieved.
42
Based on 2009 operating performance, the aggregate AICP pool was established at 129% of the targeted awards. The 2009 AICP payments to the named executive officers were as follows:
Name
|
AICP Payment ($) |
Percentage of AICP Target (%) |
|||||
|---|---|---|---|---|---|---|---|
A. E. Festa |
1,370,000 | 146.4 | |||||
H. La Force III |
475,000 | 154.5 | |||||
G. E. Poling |
600,000 | 170.5 | |||||
D. A. Bonham |
475,000 | 161.4 | |||||
M. A. Shelnitz |
335,000 | 143.2 | |||||
The AICP payments reflect our view of the performance of the named executive officers during 2009. In particular, the payments recognize their collective performance in meeting and exceeding strategic objectives established for the year by the Board of Directors and moving Grace toward emergence from bankruptcy notwithstanding the difficult business and economic environment faced by Grace during 2009.
Long-Term Incentive Compensation
The LTIPs are designed to motivate and reward approximately 200 eligible upper-level Grace employees, including the executive officers, for their contributions to Grace performance over a multi-year period and align their financial interests with those of Grace shareholders by making a significant portion of their total compensation variable and dependent upon Grace's sustained financial performance. The LTIP targets for eligible employees are based on the 50th percentile of long-term compensation opportunities of individuals who hold comparable positions at the compensation peer group companies (in the case of the executive officers) and broad industry data for other participants.
The Bankruptcy Court has approved the LTIPs for each of the 2007-2009, 2008-2010 and 2009-2011 performance periods. Awards under the 2007 LTIP are payable solely in cash and awards under the 2008 and 2009 LTIPs are payable in cash and options to purchase Grace common stock. Stock options awarded as part of the 2008 and 2009 LTIPs were issued on the terms and conditions of the Grace 2000 Stock Incentive Plan.
Awards under cash-based LTIPs are payable based on the extent to which Grace achieves certain performance targets. These LTIP payouts are based on the compound annual growth in our Core EBIT, as adjusted, over the performance period using results for the year prior to the first year of the performance period as the baseline. We generally refer to this growth objective as a CAGR. For cash-based LTIPs, the CAGR objective is 6% and the maximum compensable CAGR objective is 25%. The CAGR objective reflects our collective view of good performance by Grace based upon Grace's historical performance and the long-term historical performance of the compensation peer group. The LTIP award payouts may range from $-0- to an amount equal to twice the target amount, based on Grace's performance. No award payouts are earned under the cash-based LTIPs if the CAGR for the performance period is zero or negative.
In determining the value of stock option awards, we considered an analysis of stock option value calculated by Towers Watson and based, in part, on the Black-Scholes option pricing model. We approved the stock option grants included in the 2009 LTIP on May 7, 2009, after approval of the 2009 LTIP by the Bankruptcy Court on April 22, 2009. The exercise price of the options was $9.79, which was the average of the high and low trading prices of Grace common stock on the New York Stock Exchange on May 7, 2009. The stock option component of the 2009-2011 LTIP represented 50% of the total target LTIP award value for the named executive officers.
43
We believe that the cash-based LTIP awards encourage executive retention because the right to any pending payment under an LTIP is generally subject to forfeiture if the executive ceases employment with us prior to age 62. We generally grant LTIP awards during the first year of the performance period.
Pension Plan/Supplemental Executive Retirement Plan
As described below under "Pension Benefits," payments under Grace's tax-qualified pension plan are calculated using annual compensation, including base salary and AICP awards, and years of credited Grace service. We believe that retirement compensation that increases with increases in years of service and annual compensation is an effective recruiting and retention tool for our employees, including our executive officers. For 2009, federal income tax law limits to $245,000 the annual compensation on which benefits under the tax-qualified pension plan may be based. As a result, we have implemented a Supplemental Executive Retirement Plan, generally referred to as a SERP, that currently applies to approximately 70 upper-level employees, including the executive officers, whose annual compensation exceeds that amount, under which each such employee will receive the full pension to which that employee would be entitled in the absence of the limitations described above and other limitations imposed under federal income tax law. The SERP is unfunded and is not qualified for tax purposes.
Savings and Investment Plan/Replacement Payment Program
We generally offer a tax-qualified 401(k)-type Savings and Investment Plan, or S&I Plan, to employees under which they may save a portion of their annual compensation in investment accounts on a pre- or post- tax basis. Grace currently matches 100% of employee savings under the S&I Plan up to six percent of the employee's base salary and annual incentive compensation. We believe that a 401(k)-type plan with a substantial company match that increases (in dollar amount, not percentage of compensation) with the level of participation in the plan and increases in the employee's annual compensation is an effective recruiting and retention tool for our employees, including our executive officers. For 2009, federal income tax law limits the total contributions, which include an employee's contribution plus the employer's matching contributions, that can be made to an employee's 401(k) plan account to $49,000 and qualifying annual compensation for 401(k) plan purposes to $245,000. As a result, we have implemented an S&I Plan Replacement Payment Program that currently applies to approximately 50 of our employees, including our executive officers, whose annual compensation exceeds $245,000, under which each such employee will receive the full Grace matching payments to which that employee would be entitled in the absence of the limitations described above and other limitations imposed under federal income tax law.
Executive Personal Benefits
We believe that executives generally should not be treated differently than the general employee population when it comes to personal benefits and therefore, we have limited executive personal benefits. Mr. Festa has access to corporate aircraft at Grace expense for reasonable personal travel, though he is responsible for paying income taxes on the value of such travel as determined by the Internal Revenue Service. Due to his overseas assignment in Belgium, Mr. Bonham received certain expatriate benefits that are generally available to all executives that are on overseas assignments. We intend that these benefits compensate Grace's expatriate executives for the additional economic costs they face as a result of their foreign service, including foreign income taxes and increases in U.S. taxes caused by such benefits. Mr. Bonham also received certain benefits related to his relocation, at Grace's request, from his former home in Virginia to Massachusetts that are generally available to all employees who relocate at Grace's request.
44
Change-In-Control Severance Agreements
As described below under "Termination and Change-in-Control Arrangements—Other Executive Officer Severance Arrangements," Grace has entered into change-in-control severance agreements with each of the named executive officers. The provisions in these agreements are based on competitive practice and are designed to ensure that the executive officers' interests remain aligned with the interests of the Grace shareholders if a potential change in control occurs. Payments under these agreements are triggered by the involuntary termination of the executive officer's employment without cause (including constructive termination caused by a material reduction in his or her authority or responsibility or by certain other circumstances) following a "change in control." A change in control situation often undermines an executive officer's job security, and it is to Grace's and its shareholders' benefit to encourage the Grace executive officers to seek out beneficial transactions and to remain employed through the closing of any transaction, even though their future employment at Grace may be uncertain. The change-in-control severance agreements are designed to reinforce and encourage the continued attention and dedication of the executive officers to their assigned duties without distraction in the face of potentially adverse circumstances arising from the possibility of a change in control of Grace. Certain terms of these agreements are described below under the Potential Payments Upon Termination or Change-In-Control Table.
Severance Arrangements
As described below under ""Termination and Change-in-Control Arrangements—Change-In-Control Severance Agreements,"," we have entered into severance agreements with each of the named executive officers, other than Mr. Festa, whose severance arrangements are included in his employment agreement, and Mr. Bonham, whose severance arrangements were established by committee approval. Payments under these arrangements are triggered by involuntary termination of employment under most circumstances. The Grace severance arrangements are designed to encourage and reinforce the continued attention and dedication of our executive officers to their assigned duties without undue concern regarding their job security. Certain terms of these agreements are described below under the Potential Payments Upon Termination or Change-In-Control Table.
Executive Salary Protection Plan
As described below under "Termination and Change-in-Control Arrangements—Executive Salary Protection Plan," our Executive Salary Protection Plan provides payments to our named executive officers, or their respective beneficiaries, in the event of their disability or death prior to age 70 while employed by Grace. The plan is designed to encourage the continued attention and dedication of our executive officers to their assigned duties without undue concern regarding their ability to earn a living and support their families in the event of death or disability. Certain terms of this plan are described below under the Potential Payments Upon Termination or Change-In-Control Table.
Employment Agreements
Grace has entered into an employment agreement with Mr. Festa pursuant to which he serves as CEO of Grace. Certain terms of this employment agreement are described below under the Summary Compensation Table and Potential Payments Upon Termination or Change-In-Control Table. This agreement was approved by the Bankruptcy Court and was designed to encourage Mr. Festa to continue as CEO of Grace, remain with Grace and work diligently in pursuit of corporate objectives. Mr. Festa's employment agreement includes a minimum salary and AICP target that were negotiated with Mr. Festa and are based on his business experience, his past performance as CEO of Grace and a competitive analysis of the base salary and annual bonus paid to CEOs at the compensation peer group companies. The agreement also provides for severance payments that
45
are designed to encourage and reinforce Mr. Festa's continued attention and dedication to his assigned duties without undue concern regarding his job security.
Grace has also entered into an employment agreement with Mr. La Force pursuant to which he serves as CFO of Grace. Certain terms of this employment agreement are described below under the Summary Compensation Table and Potential Payments Upon Termination or Change-In-Control Table. This agreement provides for salary and AICP and LTIP targets and provisions regarding severance payments. This agreement was negotiated on an arms-length basis prior to the time Mr. La Force joined Grace. The payments required by this agreement were designed to encourage Mr. La Force to join and remain with Grace in lieu of other employment opportunities available to him.
Deductibility of Executive Compensation
Under the Omnibus Budget Reconciliation Act of 1993, provisions were added to the Internal Revenue Code of 1986, as amended, under Section 162(m) that limit the tax deduction for compensation expense in excess of $1 million paid to executive officers unless such compensation is "performance-based" and satisfies certain other conditions. We believe that compensation payable to executive officers should generally meet the conditions required for full deductibility under Section 162(m). Tax deductibility is one criterion we consider when establishing compensation programs. The AICP and LTIPs are structured with the intention that the compensation payable thereunder, with the exception of any discretionary AICP payments or other non-performance-based payments, will qualify as deductible "performance-based" compensation. While we believe that it is important to preserve the ability to structure compensation programs to meet a variety of corporate objectives even if the compensation is not deductible, due to our focus on performance-based compensation plans, we expect that the vast majority of compensation paid to the named executive officers will be tax deductible.
Compensation Committee Report
We, the undersigned members of the Compensation Committee of the Board of Directors of Grace, have reviewed Grace's Compensation Discussion and Analysis for 2009 and have discussed it with Grace management. Based on our review and this discussion, we recommend to the Board that the Compensation Discussion and Analysis be included in Grace's Annual Report on Form 10-K.
COMPENSATION COMMITTEE
John
F. Akers, Chair
H. Furlong Baldwin
Ronald C. Cambre
Marye Anne Fox
John J. Murphy
Christopher J. Steffen
Mark E. Tomkins
Thomas A. Vanderslice
46
Summary Compensation Table
The following table sets forth the compensation we paid for services rendered during the fiscal year ended December 31, 2009 to our Chief Executive Officer and our Chief Financial Officer and each of our other three most highly compensated executive officers who were executive officers as of December 31, 2009, determined by reference to total compensation (reduced by the amount set forth in the table below under the caption "Change in Pension Value and Nonqualified Deferred Compensation Earnings") earned by such individuals for 2009.
| |
|
|
|
|
|
|
|
Change in Pension Value and Nonqualified Deferred Compensation Earnings ($)(c) |
|
|
|||||||||||||||||||||||
|---|---|---|---|---|---|---|---|---|---|---|---|---|---|---|---|---|---|---|---|---|---|---|---|---|---|---|---|---|---|---|---|---|---|
| |
|
|
|
|
|
Non-Equity Incentive Plan Compensation ($) |
|
|
|||||||||||||||||||||||||
| |
|
Salary ($) |
Bonus ($) |
Stock Awards ($) |
Option Awards ($)(a) |
All Other Compensation ($)(d) |
Total ($) |
||||||||||||||||||||||||||
Name and Principal Position |
Year | AICP | LTIP(b) | ||||||||||||||||||||||||||||||
A. E. Festa |
2009 | 936,000 | -0- | -0- | 1,022,065 | 1,370,000 | 1,751,967 | 377,000 | 163,956 | 5,620,988 | |||||||||||||||||||||||
Chairman, |
2008 | 921,000 | 1,000,000 | -0- | 145,023 | 725,000 | 2,433,600 | 188,000 | 166,965 | 5,579,588 | |||||||||||||||||||||||
President & Chief Executive Officer |
2007 | 862,500 | 750,000 | -0- | -0- | 1,375,000 | 2,399,800 | 326,000 | 166,470 | 5,879,770 | |||||||||||||||||||||||
H. La Force III |
2009 |
410,000 |
-0- |
-0- |
249,090 |
475,000 |
336,855 |
62,000 |
40,017 |
1,572,962 |
|||||||||||||||||||||||
Senior Vice President & Chief Financial Officer |
2008 | 307,500 | 250,000 | -0- | 59,357 | 225,000 | 242,500 | -0- | 15,769 | 1,100,126 | |||||||||||||||||||||||
G. E. Poling |
2009 |
440,000 |
-0- |
-0- |
365,756 |
600,000 |
673,833 |
600,000 |
45,262 |
2,724,851 |
|||||||||||||||||||||||
Vice President & |
2008 | 434,667 | -0- | -0- | 90,097 | 275,000 | 880,667 | 460,000 | 58,418 | 2,198,849 | |||||||||||||||||||||||
President Grace Davison |
2007 | 412,667 | -0- | -0- | -0- | 500,000 | 743,333 | 560,000 | 53,342 | 2,269,342 | |||||||||||||||||||||||
D. A. Bonham |
2009 |
392,292 |
-0- |
-0- |
240,356 |
475,000 |
518,333 |
74,000 |
419,549 |
2,119,530 |
|||||||||||||||||||||||
Vice President & |
2008 | 370,870 | -0- | -0- | 51,484 | 250,000 | 498,667 | 53,000 | 893,683 | 2,117,704 | |||||||||||||||||||||||
President Grace |
2007 | 311,667 | -0- | -0- | -0- | 360,000 | 301,765 | 33,000 | 488,537 | 1,494,969 | |||||||||||||||||||||||
M. A. Shelnitz |
2009 |
360,000 |
-0- |
-0- |
214,238 |
335,000 |
336,917 |
341,000 |
34,980 |
1,622,135 |
|||||||||||||||||||||||
Vice President, |
2008 | 354,667 | -0- | -0- | 53,632 | 200,000 | 440,333 | 172,000 | 43,173 | 1,263,805 | |||||||||||||||||||||||
Secretary & General Counsel |
2007 | 336,000 | -0- | -0- | -0- | 335,000 | 453,167 | 237,000 | 39,957 | 1,401,124 | |||||||||||||||||||||||
- (a)
- Amount
represents the dollar amount recognized for financial reporting purposes related to grants of options, without any reduction for risk of forfeiture,
calculated in accordance with the provisions of ASC 718. We calculate compensation expense related to stock options using the Black-Scholes option pricing model. We amortize compensation
expense over the service period and do not adjust the expense based on actual gains or losses or changes in the price of Grace common stock after the grant date. The assumptions used to calculate the
compensation expense reported for 2009 are described in this Report in Item 8 (Financial Statements and Supplementary Data) in the Financial Supplement under Note 18 (Stock Incentive
Plans) to the Consolidated Financial Statements and are incorporated herein by reference.
- (b)
- The 2009 amount consists of the following payments that we expect to make in March 2010 pursuant to the 2007-2009 and 2008-2010 Long-Term Incentive Programs, or LTIPs, as follows:
Name
|
Final Payment 2007-2009 LTIP ($) |
Initial Payment 2008-2010 LTIP ($) |
Total ($) |
|||||||
|---|---|---|---|---|---|---|---|---|---|---|
A. E. Festa |
1,751,967 | -0- | 1,751,967 | |||||||
H. La Force III |
336,855 | -0- | 336,855 | |||||||
G. E. Poling |
673,833 | -0- | 673,833 | |||||||
D. A. Bonham |
518,333 | -0- | 518,333 | |||||||
M. A. Shelnitz |
336,917 | -0- | 336,917 | |||||||
- (c)
- The 2009 amount consists of the aggregate change in the actuarial present value of the individual's accumulated benefit under the Grace Pension Plan and Grace Supplemental Executive Retirement Plan (SERP) from December 31, 2008 to December 31, 2009, assuming a 5.75% discount rate and retirement at age 62 with benefits payable on a straight life annuity basis and other assumptions used for financial reporting purposes under generally accepted accounting principles as described in this Report in Item 8 (Financial Statements
47
and Supplementary Data) in the Financial Supplement under Note 11 (Pension Plans and Other Postretirement Benefits Plans) to the Consolidated Financial Statements as follows:
Name
|
Change in Pension Plan Value ($) |
Change In SERP Value ($) |
Total Change in Pension Value ($) |
|||||||
|---|---|---|---|---|---|---|---|---|---|---|
A. E. Festa |
34,000 | 343,000 | 377,000 | |||||||
H. La Force III |
26,000 | 36,000 | 62,000 | |||||||
G. E. Poling |
134,000 | 466,000 | 600,000 | |||||||
D. A. Bonham |
32,000 | 42,000 | 74,000 | |||||||
M. A. Shelnitz |
105,000 | 236,000 | 341,000 | |||||||
- (d)
- The 2009 amount consists of the following:
Name
|
Personal Benefits ($)* |
S&I Plan Matching Payments ($) |
S&I Plan Replacement Payments ($) |
Liability Insurance ($) |
Life Insurance ($) |
Total ($) |
|||||||||||||
|---|---|---|---|---|---|---|---|---|---|---|---|---|---|---|---|---|---|---|---|
A. E. Festa |
59,359 | 14,700 | 84,960 | 1,200 | 3,737 | 163,956 | |||||||||||||
H. La Force III |
-0- | 14,700 | 23,400 | 900 | 1,017 | 40,017 | |||||||||||||
G. E. Poling |
-0- | 14,700 | 28,200 | 900 | 1,462 | 45,262 | |||||||||||||
D. A. Bonham |
379,464 | 14,700 | 23,838 | 900 | 647 | 419,549 | |||||||||||||
M. A. Shelnitz |
-0- | 14,100 | 18,900 | 900 | 1,080 | 34,980 | |||||||||||||
- *
- Consists of our aggregate incremental cost of providing personal benefits if the aggregate amount of personal benefits
provided to the individual equaled or exceeded $10,000. The following additional personal benefits exceeded the greater of $25,000 or 10% of the total amount of personal benefits for that individual
and we are required to separately report them under SEC rules:
- (A)
- for Mr. Festa, personal use of Grace-provided aircraft; and
- (B)
- for Mr. Bonham:
- (i)
- certain benefits related to his overseas assignment in Belgium consisting of: tax gross up payments designed to
reimburse Mr. Bonham for any increase in his U.S. federal and state income tax obligations resulting from his overseas assignment—$315,035, foreign tax payments—$47,626
(paid in Euros and converted at exchange rates prevailing in the month such tax payments were made) and tax preparation fees; and
- (ii)
- certain benefits related to his permanent relocation from Virginia to Massachusetts consisting of: reimbursement of residential closing costs and related gross-up for U.S. income taxes.
CEO Employment Agreement
Grace and Mr. Festa entered into an employment agreement, effective as of June 1, 2009, pursuant to which Mr. Festa continued in service as President and Chief Executive Officer of Grace. Under the agreement, Mr. Festa also continues to serve as Chairman of the Board of Directors of Grace. Mr. Festa is entitled to an initial base annual salary of $936,000. His targeted award under the AICP for 2009 and each calendar year thereafter is 100% of his base salary earned during the applicable year (or greater, as determined by the Board). Under the agreement, Mr. Festa continues to participate in the Grace LTIPs. His 2009 award is described below under "Grants of Plan-Based Awards in 2009." Grace is obligated to indemnify Mr. Festa for all liabilities that he may incur as a result of his performance of his duties as a director, officer or employee of Grace. The agreement also provides for certain payments in the event that Mr. Festa's employment is involuntarily terminated. These severance payments are discussed below under "Potential Payments Upon Termination or Change-In-Control." The description of Mr. Festa's employment agreement in Item 11 of this Report does not purport to be complete and is qualified in its entirety by reference to the agreement, which has been filed with the SEC.
CFO Employment Agreement
Grace has entered into an employment agreement with Mr. La Force. Under the terms of this agreement, Mr. La Force received a "sign-on" bonus of $250,000. He is entitled to an initial base salary of $410,000 and to participate in the AICP at an initial target award of 75% of base salary. In
48
addition, this agreement provides for targeted awards of $500,000 under each of the 2008-2010 and 2007-2009 LTIPs, prorated, in each case, to reflect the actual time during the respective performance period that Mr. La Force was a Grace employee. Mr. La Force's actual award under the 2009-2011 LTIP is described below in the "Grants of Plan-Based Awards in 2009" table. The agreement also provides for certain payments in the event that Mr. La Force's employment is involuntarily terminated. These severance payments are discussed below under "Potential Payments Upon Termination or Change-In-Control." The description of Mr. La Force's employment agreement in Item 11 of this Report does not purport to be complete and is qualified in its entirety by reference to the agreement, which has been filed with the SEC.
Grants of Plan-Based Awards in 2009
The following table provides information regarding grants under our Annual Incentive Compensation Program, or AICP, and Long Term Incentive Program, or LTIP, to the executive officers named in the Summary Compensation Table during 2009.
| |
|
|
|
|
|
All Other Option Awards: Number of Securities Underlying Options (#) |
|
|
|||||||||||
|---|---|---|---|---|---|---|---|---|---|---|---|---|---|---|---|---|---|---|---|
| |
|
|
Estimated Future Payouts Under Non-Equity Incentive Plan Awards(a) |
|
|
||||||||||||||
| |
|
|
Exercise or Base Price of Option Awards ($/Sh)(c) |
Grant Date Fair Value of Option Awards ($)(d) |
|||||||||||||||
Name
|
Plan | Option Grant Date |
Threshold ($) |
Target ($)(b) |
Maximum ($)(b) |
||||||||||||||
A. E. Festa |
2009 AICP | n/a | 234,000 | 936,000 | 1,872,000 | n/a | n/a | n/a | |||||||||||
|
2009-2011 LTIP (Cash) | n/a | -0- | 1,600,000 | 3,200,000 | n/a | n/a | n/a | |||||||||||
|
2009-2011 LTIP (Option)(e) | 05/07/09 | n/a | n/a | n/a | 324,710 | 9.785 | 1,114,838 | |||||||||||
H. La Force III |
2009 AICP | n/a | 76,875 | 307,500 | 615,000 | n/a | n/a | n/a | |||||||||||
|
2009-2011 LTIP (Cash) | n/a | -0- | 250,000 | 500,000 | n/a | n/a | n/a | |||||||||||
|
2009-2011 LTIP (Option)(e) | 05/07/09 | n/a | n/a | n/a | 50,740 | 9.785 | 174,207 | |||||||||||
G. E. Poling |
2009 AICP | n/a | 88,000 | 352,000 | 704,000 | n/a | n/a | n/a | |||||||||||
|
2009-2011 LTIP (Cash) | n/a | -0- | 350,000 | 700,000 | n/a | n/a | n/a | |||||||||||
|
2009-2011 LTIP (Option)(e) | 05/07/09 | n/a | n/a | n/a | 71,030 | 9.785 | 243,870 | |||||||||||
D. A. Bonham |
2009 AICP | n/a | 73,555 | 294,219 | 588,438 | n/a | n/a | n/a | |||||||||||
|
2009-2011 LTIP (Cash) | n/a | -0- | 275,000 | 550,000 | n/a | n/a | n/a | |||||||||||
|
2009-2011 LTIP (Option)(e) | 05/07/09 | n/a | n/a | n/a | 55,810 | 9.785 | 191,614 | |||||||||||
M. A. Shelnitz |
2009 AICP | n/a | 58,500 | 234,000 | 468,000 | n/a | n/a | n/a | |||||||||||
|
2009-2011 LTIP (Cash) | n/a | -0- | 200,000 | 400,000 | n/a | n/a | n/a | |||||||||||
|
2009-2011 LTIP (Option)(e) | 05/07/09 | n/a | n/a | n/a | 40,590 | 9.785 | 139,359 | |||||||||||
- (a)
- Actual
payments pursuant to the 2009 AICP, final payments pursuant to the 2007-2009 LTIP and initial payments pursuant to the
2008-2010 LTIP that we expect to pay in March 2010 have been determined and are reflected in the Summary Compensation Table.
- (b)
- For
AICP, amounts are based upon base salary actually paid during 2009.
- (c)
- The
exercise price was determined based on the average of the high and low trading prices of Grace common stock on the New York Stock Exchange on the grant
date.
- (d)
- The
grant date fair value is generally the amount that Grace would expense in its financial statements over the award's service period, but does not include
a reduction for forfeitures.
- (e)
- Options are exercisable in 33% increments on May 7, 2010, May 6, 2011 and May 7, 2012.
2009 Annual Incentive Compensation Program (AICP)
Our Annual Incentive Compensation Program, or AICP, is a cash-based pay-for-performance incentive program. Awards under the AICP are allocated from the incentive pool that is determined by the extent to which business performance objectives are achieved. The Compensation Committee has discretion to establish or increase the size of the incentive pool even if performance targets are not achieved. Once the incentive pool is established, an executive officer's award payment is determined based on the individual's target award, performance and other factors determined by the Compensation Committee.
49
In order to receive an AICP award payment for a specific calendar year, employees generally must be actively employed by Grace through the payout date, which is typically in March of the following year. See "Potential Payments Upon Termination or Change-In-Control—Termination and Change-in-Control Arrangements" for a description of the circumstances under which AICP payments would be made upon termination of an executive's employment with Grace.
Long-Term Incentive Program (LTIP)
Our long-term incentive programs are multi-year, pay-for-performance incentive programs. Awards under our 2008-2010 and 2009-2011 LTIPs consist of a cash-based award and an award of stock options under our 2000 Stock Incentive Plan. Awards under our 2007-2009 LTIP consist entirely of a cash-based award.
Cash-Based LTIP. Cash-based awards under the LTIPs are payable based on the extent to which we achieve a specified compound annual growth in our Core EBIT, as adjusted, over the three-year performance period using results for the year prior to the first year of the performance period as the baseline. We generally refer to this growth objective as a CAGR. In order to earn the target award, our CAGR must be 6% and, to earn the maximum of two times the target award, our CAGR must be 25%. No awards are earned if the CAGR is zero or negative.
LTIP Compound Annual Growth (Decline) Rate (CAGR) as of December 31, 2009
LTIP
|
CAGR | |||
|---|---|---|---|---|
2007-2009 LTIP (full 3-year period) |
13.17 | % | ||
2008-2010 LTIP (partial 2-year period) |
(3.06 | )% | ||
2009-2011 LTIP (partial 1-year period) |
(9.10 | )% | ||
Employees who become entitled to cash payments under an LTIP are paid in two installments: one in March of the third year of the performance period (as partial payment based on the first two years of the performance period but limited to 50% of the LTIP target for those two years); and the other in March of the year following the performance period (as final payment based on the complete three-year performance period but offset by the prior partial payment).
Based on 2007-2009 operating performance, final payments under the 2007 LTIP are calculated based upon 137% of the target for each participant. Based on 2008-2009 operating performance, there will be no partial payments to participants under the 2008 LTIP.
In order to receive a cash LTIP award payment, employees generally must be actively employed by Grace through the payout date, which is in March following the second and third years of the LTIP performance period. See "Potential Payments Upon Termination or Change-In-Control—Contractual Termination Provisions" for a description of the circumstances under which LTIP payments would be made upon termination of an executive's employment with Grace.
Equity-Based LTIP. Stock options awarded as part of the 2008 LTIP are exercisable in 50% annual increments beginning on March 1, 2010. Stock options awarded as part of the 2009 LTIP are exercisable in 33% annual increments on May 7, 2010, May 6, 2011 and May 7, 2012.
50
Outstanding Equity Awards at Fiscal Year-End
The following table provides information regarding outstanding stock options held by the executive officers named in the Summary Compensation Table as of December 31, 2009.
| |
Option Awards | ||||||||||||
|---|---|---|---|---|---|---|---|---|---|---|---|---|---|
Name
|
Number of Securities Underlying Unexercised Options (#) Exercisable |
Number of Securities Underlying Unexercised Options (#) Unexercisable |
Option Exercise Price ($) |
Option Expiration Date |
|||||||||
A. E. Festa |
-0- | 324,710 | (a) | 9.785 | 5/07/14 | ||||||||
|
-0- | 171,490 | (b) | 19.7100 | 9/11/13 | ||||||||
H. La Force III |
-0- | 50,740 | (a) | 9.785 | 5/07/14 | ||||||||
|
-0- | 70,190 | (b) | 19.7100 | 9/11/13 | ||||||||
G. E. Poling |
-0- | 71,030 | (a) | 9.785 | 5/07/14 | ||||||||
|
-0- | 106,540 | (b) | 19.7100 | 9/11/13 | ||||||||
|
16,500 | -0- | 2.4000 | 3/07/11 | |||||||||
|
35,000 | -0- | 13.4688 | 5/09/10 | |||||||||
D. A. Bonham |
-0- | 55,810 | (a) | 9.785 | 5/07/14 | ||||||||
|
-0- | 60,880 | (b) | 19.7100 | 9/11/13 | ||||||||
M. A. Shelnitz |
-0- | 40,590 | (a) | 9.785 | 5/07/14 | ||||||||
|
-0- | 63,420 | (b) | 19.7100 | 9/11/13 | ||||||||
|
8,200 | -0- | 2.4000 | 3/07/11 | |||||||||
|
25,000 | -0- | 13.4688 | 5/09/10 | |||||||||
- (a)
- Options
are exercisable in 33% increments on May 7, 2010, May 6, 2011 and May 7, 2012.
- (b)
- Options are exercisable in 50% annual increments beginning on March 1, 2010.
Option Exercises and Stock Vested
The following table provides information regarding the exercise of options held by the executive officers named in the Summary Compensation Table during 2009.
| |
Option Awards | Stock Awards | |||||||||||
|---|---|---|---|---|---|---|---|---|---|---|---|---|---|
Name
|
Number of Shares Acquired on Exercise (#) |
Value Realized on Exercise ($) |
Number of Shares Acquired on Vesting (#) |
Value Realized on Vesting ($) |
|||||||||
A. E. Festa |
-0- | -0- | -0- | -0- | |||||||||
H. La Force III |
-0- | -0- | -0- | -0- | |||||||||
G. E. Poling |
-0- | -0- | -0- | -0- | |||||||||
D. A. Bonham |
-0- | -0- | -0- | -0- | |||||||||
M. A. Shelnitz |
-0- | -0- | -0- | -0- | |||||||||
Pension Benefits
The following table provides information regarding benefits under our Retirement Plan for Salaried Employees, or Pension Plan, our Supplemental Executive Retirement Plan, or SERP, and
51
any supplemental pension arrangements under employment agreements for the executive officers named in the Summary Compensation Table.
Name
|
Plan Name | Number of Years Credited Service (years) |
Present Value of Accumulated Benefit* ($) |
Payments During Last Fiscal Year ($) |
||||||||
|---|---|---|---|---|---|---|---|---|---|---|---|---|
A. E. Festa |
Pension Plan | 6.08 | 111,000 | -0- | ||||||||
|
SERP | 6.08 | 921,000 | -0- | ||||||||
H. La Force III |
Pension Plan | 1.75 | 26,000 | -0- | ||||||||
|
SERP | 1.75 | 36,000 | -0- | ||||||||
G. E. Poling |
Pension Plan | 30.42 | 702,000 | -0- | ||||||||
|
SERP | 30.42 | 1,982,000 | -0- | ||||||||
D. A. Bonham |
Pension Plan | 4.25 | 75,000 | -0- | ||||||||
|
SERP | 4.25 | 121,000 | -0- | ||||||||
M. A. Shelnitz |
Pension Plan | 26.17 | 517,000 | -0- | ||||||||
|
SERP | 26.17 | 961,000 | -0- | ||||||||
- *
- Amounts comprise the actuarial present value of the executive officer's accumulated benefit under the Pension Plan and SERP as of December 31, 2009, assuming a 5.75% discount rate and retirement at age 62 with benefits payable on a straight life annuity basis and other assumptions used for financial reporting purposes under generally accepted accounting principles as described in this Report in Item 8 (Financial Statements and Supplementary Data) in the Financial Supplement under Note 11 (Pension Plans and Other Postretirement Benefits Plans) to the Consolidated Financial Statements. The Pension Plan and SERP provide for a reduction in pension benefits to employees that elect early retirement ranging from a 17% reduction for retirement at age 55 to no reduction for retirement at age 62.
Retirement Plan for Salaried Employees
Full-time salaried employees who are 21 or older and who have one or more years of service are eligible to participate in our Retirement Plan for Salaried Employees, or Pension Plan. Under this basic retirement plan, pension benefits are based upon (a) the employee's average annual compensation for the 60 consecutive months in which his or her compensation is highest during the last 180 months of continuous participation, and (b) the number of years of the employee's credited Grace service. At age 62, a participant is entitled to an unreduced benefit under the Pension Plan but a participant may elect reduced payments upon early retirement beginning at age 55. For purposes of the Pension Plan, compensation generally includes base salary and AICP awards; however, for 2009, federal income tax law limits to $245,000 the annual compensation on which benefits under the Pension Plan may be based. At age 62, a participant is entitled to full payments under the Pension Plan.
Supplemental Executive Retirement Plan
We also have a Supplemental Executive Retirement Plan, or SERP, under which an employee will receive the full pension to which he or she would be entitled in the absence of the limitations described above and other limitations imposed under federal income tax law. In addition, the SERP recognizes deferred base salary, deferred annual incentive compensation awards and, in some cases, periods of employment during which an employee was ineligible to participate in the basic retirement plan. Since 2001, we have not permitted deferrals of base salary or incentive compensation.
52
Non-Qualified Deferred Compensation Plan
The following table summarizes the compensation deferred by the named executive officer pursuant to the provisions of Grace's incentive compensation program in 1998, under which certain employees were permitted to voluntarily defer receipt of shares of Grace common stock. Such deferred shares were contributed to a "rabbi trust" held for the benefit of the deferred compensation plan participants. Shares held in the plan are fully vested and may be distributed to the plan beneficiary upon retirement or termination of service with us. Since 1998, executives may no longer defer receipt of shares under the plan, although existing balances remain in place.
Fiscal Year 2009 Non-Qualified Deferred Compensation
Name
|
Executive Contributions in Fiscal Year 2009 ($) |
Registrant Contributions in Fiscal Year 2009 ($) |
Aggregate Earnings in Fiscal Year 2009 ($) |
Aggregate Withdrawals/ Distributions in Fiscal Year 2009 ($) |
Aggregate Balance at Fiscal Year 2009 End ($) |
|||||||||||
|---|---|---|---|---|---|---|---|---|---|---|---|---|---|---|---|---|
M. A. Shelnitz |
-0- | -0- | 182,577 | (a) | -0- | 238,819 | (b) | |||||||||
- (a)
- Amount
represents the increase in value of 9,420.8496 shares of Grace common stock held in the plan based on the closing prices of Grace common stock on
December 31, 2008 and December 31, 2009. Amounts reflected are not included in the "Summary Compensation Table" because the earnings are not "above-market."
- (b)
- Amount represents the value of 9,420.8496 shares of Grace common stock held in the plan based on the closing price of Grace common stock on December 31, 2009.
Potential Payments Upon Termination or Change-In-Control
The following table sets forth potential payments to executive officers named in the Summary Compensation Table in the event of the listed events calculated under the assumption that employment terminated on the last business day of 2009. The following table does not include payments pursuant to contracts, agreements, plans and arrangements that do not discriminate in scope, terms or operation, in favor of executive officers and that are available generally to all salaried employees. The value of payments to be made following termination of employment pursuant to the Grace Retirement Plan and the Grace SERP are described above under the caption "Pension Benefits." The value of payments to be made following termination of employment pursuant to Mr. Shelnitz's deferred shares arrangement are described above under the caption "Non-Qualified Deferred Compensation Plan."
Name
|
Involuntary Termination Without Cause(a) ($) |
Involuntary Termination Without Cause Following Change-in- Control(b)(c) ($) |
Death (c)(d) ($) |
Disability (c)(f) ($) |
|||||||||
|---|---|---|---|---|---|---|---|---|---|---|---|---|---|
A. E. Festa |
3,276,000 | 8,464,633 | 4,992,073 | (e) | 4,437,673 | (e) | |||||||
H. La Force III |
615,000 | 2,739,355 | 996,855 | 744,026 | |||||||||
G. E. Poling |
880,000 | 3,383,166 | 1,447,166 | 1,095,168 | |||||||||
D. A. Bonham |
600,000 | 2,876,667 | 1,176,667 | 909,997 | |||||||||
M. A. Shelnitz |
720,000 | 2,293,917 | 871,917 | 583,917 | |||||||||
- (a)
- Consists: (i) in the case of Mr. Festa, minimum severance payments pursuant to his employment agreement as described below under "—CEO Severance Arrangements;" and
53
(ii) minimum severance payments pursuant to severance agreements in the case of the other executive officers as described below under "—Termination and Change-in-Control Arrangements." Amount excludes AICP and/or LTIP payments executive officers may receive under certain circumstances in the discretion of the Compensation Committee as described below under "—Termination and Change-in-Control Arrangements."
- (b)
- Includes
actual LTIP payments (as included in the Summary Compensation Table) and estimated LTIP payments calculated as described below under
"—Termination and Change-in-Control Arrangements—Long Term Incentive Program."
- (c)
- Includes
contractual payments pursuant to each executive's respective Change-in-Control Severance Agreement calculated under the
assumption that no excise tax will apply.
- (d)
- Includes
the sum of payments under the Grace Executive Salary Protection Plan during the first year following death. During subsequent years after death
until the specified termination year (reflecting the executive officer's age as of December 31, 2009), the sum of payments each year would be as follows: Mr. Festa—$468,000,
Mr. La Force—$205,000, Mr. Poling—$220,000, Mr. Bonham—$200,000 and Mr. Shelnitz—$180,000. For Mr. Festa, amount
includes AICP payment pursuant to his employment agreement. For other executive officers, amount excludes AICP payments they may receive under certain circumstances in the discretion of the
Compensation Committee as described below under "—Termination and Change-in-Control Arrangements."
- (e)
- Includes
2009 AICP payment calculated solely on the basis of Grace's 2009 financial performance.
- (f)
- Includes sum of payments under the Grace Executive Salary Protection Plan during the first year following disability, assuming the executive officer remains disabled for at least 12 consecutive months. Amounts reflect the offset of expected payments under Grace's long-term and short-term disability programs that are based, in part, on the duration of the executive officer's employment. During subsequent years after disability, the sum of payments each year to Mr. Festa would be $216,000 until the earlier of the month he was no longer deemed disabled or until he attained age 65 in 2024. Due to the offset of expected payments under Grace's long-term and short-term disability programs, Grace expects that the other executive officers would not receive any additional payments under the plan after the first year of disability. For Mr. Festa, amount includes AICP payment pursuant to his employment agreement. For other executive officers, amount excludes AICP payments they may receive under certain circumstances in the discretion of the Compensation Committee as described below under "—Termination and Change-in-Control Arrangements."
Termination and Change-in-Control Arrangements
Change-in-Control Severance Agreements. We have entered into severance agreements with all of our executive officers, which renew automatically unless the Board elects not to renew them. These agreements generally provide that in the event of the involuntary termination of the individual's employment without cause (including constructive termination caused by a material reduction in his or her authority or responsibility or by certain other circumstances) following a "change in control," he or she will generally receive a severance payment equal to three times the sum of his or her annual base salary plus target annual incentive compensation, subject to reduction, pro rata in the case of an executive officer who is within 36 months of normal retirement age (65) or, under certain circumstances, to minimize the effect of certain excise taxes if applicable. For purposes of the severance agreements, "change in control" means the acquisition of 20% or more of the outstanding Grace common stock (but not if such acquisition is the result of the sale of common stock by Grace that has been approved by the Board), the failure of Board-nominated
54
directors to constitute a majority of any class of the Board of Directors, the occurrence of a transaction in which the Grace shareholders immediately preceding such transaction do not own more than 50% of the combined voting power of the entity resulting from such transaction, or the liquidation or dissolution of Grace. As a result of Grace's Chapter 11 filing, the following events will not constitute a "change in control": (i) the acquisition of Grace common stock by a trust established for purposes of administering asbestos-related claims pursuant to a plan of reorganization; and (ii) a corporate transaction pursuant to Section 363 of the U.S. Bankruptcy Code or a plan of reorganization. The description of the severance agreements in Item 11 of this Report does not purport to be complete and is qualified in its entirety by reference to the form of such agreement, which has been filed with the SEC.
CEO Severance Arrangements. Grace and Mr. Festa entered into an employment agreement, effective as of June 1, 2009, pursuant to which Mr. Festa continued in service as President and Chief Executive Officer of Grace. Under the agreement, Mr. Festa also continues to serve as Chairman of the Board of Directors of Grace. The term of this agreement is four years ending on May 31, 2013. Under the terms of this agreement, Mr. Festa will not be entitled to any unpaid award under the AICP or any LTIP if his employment with Grace terminates prior to the date that the award is paid to active Grace employees, except that Mr. Festa would be entitled to a pro-rated portion (based, in the case of the AICP, solely on Grace financial results for that calendar year) of such an unpaid award in the event that his employment is terminated by Grace without cause or he terminates his employment as a result of constructive discharge after Grace emerges from Chapter 11, or his employment terminates as a result of his death or disability, in each case, before the applicable payment date. Assuming Mr. Festa's employment was terminated as of December 31, 2009 under any of the above listed circumstances, Mr. Festa would be eligible to receive LTIP payments as described below under the caption "Termination and Change-in-Control Arrangements—Long Term Incentive Program." Also, under the terms of this agreement, if we terminate Mr. Festa's employment without cause, or he terminates his employment as a result of constructive discharge, prior to the expiration of the agreement, he would be entitled to a severance payment equal to two times a dollar amount equal to 175% of his annual base salary at the time of his termination. The description of Mr. Festa's employment agreement in Item 11 of this Report does not purport to be complete and is qualified in its entirety by reference to the agreement, which has been filed with the SEC.
Other Executive Officer Severance Arrangements. We have entered into severance agreements that establish severance arrangements with Messrs. La Force (included in his employment agreement), Poling and Shelnitz. Mr. Bonham's severance arrangements were established by Compensation Committee approval. Under the terms of the severance arrangements applicable to these named executive officers, in the event of the involuntary termination of the executive officer's employment under circumstances that would qualify the executive officer for severance pay under the severance plan that generally covers our salaried employees, the executive officer would be entitled to severance pay equal to two times his or her annual base salary, in the case of Messrs. Poling and Shelnitz, or one and one-half times his annual base salary, in the case of Messrs. La Force and Bonham. Other than with respect to the amount of severance, the severance arrangements for these named executive officers are the same. The description of the severance arrangements in Item 11 of this Report does not purport to be complete and is qualified in its entirety by reference to Mr. La Force's employment agreement, the form of executive severance agreement and the Grace Severance Pay Plan for Salaried Employees, each of which has been filed with the SEC.
Executive Salary Protection Plan. All executive officers participate in the Executive Salary Protection Plan which provides that, in the event of a participant's disability or death prior to age 70, we will continue to pay all or a portion of base salary to the participant or a beneficiary for a period
55
based on the participant's age at the time of disability or death. Payments under the plan may not exceed 100% of base salary for the first year and 60% thereafter in the case of disability (50% in the case of death). Any payment under the plan as a result of disability would be reduced by the amount of disability income received under Grace's long-term and short-term disability plans that are generally applicable to U.S. salaried employees. The description of the plan in Item 11 of this Report does not purport to be complete and is qualified in its entirety by reference to the text of the Executive Salary Protection Plan, as amended, which is filed with the SEC.
Annual Incentive Compensation Program. An employee whose employment terminates prior to an AICP payout date will generally not receive an AICP payment. However, in the discretion of the Compensation Committee, an employee whose employment terminates prior to the payout date may receive an AICP award payment if the employee has more than three months' service under the AICP and employment terminates for any of the following reasons: retirement under a Grace retirement plan; death; disability; divestment; or other termination of employment by Grace that is not for cause. If such an employee receives an AICP payment, the amount of the AICP payment will generally be prorated for the period of the employee's service during the year. See "—CEO Severance Arrangements" for a description of the circumstances under which AICP payments would be made to Mr. Festa in the event his employment with Grace is terminated. The description of the AICP in Item 11 of this Report does not purport to be complete and is qualified in its entirety by reference to the text of the AICP which is filed with the SEC.
Long Term Incentive Program (Cash Awards). An employee whose employment terminates prior to the payout date will forfeit any unpaid LTIP award payment if employment terminates for any of the following reasons:
- •
- voluntary termination without the consent of the Compensation Committee;
- •
- retirement under a Grace retirement plan prior to age 62 without the consent of the Compensation Committee; or
- •
- termination for cause.
An employee whose employment terminates prior to the payout date will receive an LTIP award payment if employment terminates for any of the following reasons:
- •
- retirement under a Grace retirement plan either at or after age 62;
- •
- death or disability; or
- •
- involuntary termination after a change in control of Grace ("change in control" means that a person beneficially owns 20% or more of the outstanding Grace common stock (but not if such ownership is the result of the sale of Grace common stock by Grace that has been approved by the Board or pursuant to a plan of reorganization that is confirmed and effective), the failure of Board-nominated directors to constitute a majority of any class of the Board of Directors, the occurrence of a corporate transaction (other than a corporate transaction pursuant to Section 363 of the U.S. Bankruptcy Code or a plan of reorganization that is confirmed and effective) in which the Grace shareholders immediately preceding such transaction do not own more than 50% of the combined voting power of the entity resulting from such transaction, or the liquidation or dissolution of Grace)
In the discretion of the Compensation Committee, an employee whose employment terminates for a reason that is not described above (i.e. involuntary termination not for cause or transfer to the buyer of a Grace business unit) prior to the payout date may receive an LTIP award payment.
56
See "—CEO Severance Arrangements" above for a description of the circumstances under which LTIP payments would be made to Mr. Festa in the event his employment with Grace is terminated. The description of the LTIPs in Item 11 of this Report does not purport to be complete and is qualified in its entirety by reference to the text of the LTIPs, which are filed with the SEC.
If an employee whose employment terminates prior to the end of an LTIP performance period receives an LTIP award payment for that performance period, the amount of the LTIP award payment will be prorated for the period of the employee's service during the performance period. Assuming the employment of the executive officers named in the Summary Compensation Table was terminated as of December 31, 2009 and the 2008 and 2009 LTIPs pay out at the target amounts, under any of the above-listed circumstances, the executive officers would be eligible for payments under their outstanding LTIPs as follows:
Name
|
2007-2009 LTIP ($) |
2008-2010 LTIP ($) |
2009-2011 LTIP ($) |
Total ($) |
|||||||||
|---|---|---|---|---|---|---|---|---|---|---|---|---|---|
A. E. Festa |
1,751,967 | 563,333 | 533,333 | 2,848,633 | |||||||||
H. La Force III |
336,855 | 166,667 | 83,333 | 586,855 | |||||||||
G. E. Poling |
673,833 | 216,667 | 116,666 | 1,007,166 | |||||||||
D. A. Bonham |
518,333 | 166,667 | 91,667 | 776,667 | |||||||||
M. A. Shelnitz |
336,917 | 108,333 | 66,667 | 511,917 | |||||||||
Long Term Incentive Program (2000 Stock Incentive Plan Awards). Any stock option held by an employee whose employment terminates prior to exercise will:
- •
- terminate when employment terminates, if employment terminates voluntarily, without the consent of the Compensation
Committee, or for cause;
- •
- terminate three years after employment terminates, if employment terminates due to death, incapacity or retirement under a
Grace retirement plan; or
- •
- terminate three months (subject to extension by the Compensation Committee for up to three years) after employment terminates, if employment terminates for another reason; provided however, if the holder dies or becomes incapacitated during the three-month period (or such longer period as the Compensation Committee approves) the option shall terminate three years after employment termination.
In the event of a Change in Control, any stock options outstanding under the 2000 Stock Incentive Plan, that are not exercisable and vested, shall become fully exercisable and vested to the full extent of the original grant. For purposes of the 2000 Stock Incentive Plan, "change in control" means the acquisition of 20% or more of the outstanding Grace Common Stock (but not if such acquisition is the result of the sale of Grace common stock by Grace that has been approved by the Board), the failure of Board-nominated directors to constitute a majority of any class of the Board of Directors, the occurrence of a transaction in which the Grace shareholders immediately preceding such transaction do not own more than 50% of the combined voting power of the entity resulting from such transaction, or the liquidation or dissolution of Grace. The description of the 2000 Stock Incentive Plan in Item 11 of this Report does not purport to be complete and is qualified in its entirety by reference to the text of the 2000 Stock Incentive Plan, which is filed with the SEC.
Director Compensation
Under the compensation program for nonemployee directors in effect during 2009, each nonemployee director received an annual retainer of $105,000 in cash, 50% of which was paid in January and 50% of which was paid in December. In addition, directors received $6,000 (plus $3,000 for the lead independent director and the Audit Committee chair and $2,000 for other
57
committee chairs) in cash for each meeting date in respect of the Board meeting and all committee meetings held on that date. We reimburse directors for expenses they incur in attending Board and committee meetings and other activities incidental to their service as directors. Our directors, and all Grace employees, are entitled to participate in the Grace Foundation's Matching Grants Program. We also maintain business travel accident insurance coverage for our directors. Mr. Festa's compensation is described above in the Summary Compensation Table and he receives no additional compensation for serving as a member of the Board of Directors.
The following table sets forth amounts that we paid to our nonemployee directors in connection with their services to Grace during 2009.
Name
|
Fees Earned or Paid in Cash ($)(a) |
Stock Awards ($) |
Option Awards ($) |
Non-Equity Incentive Plan Compensation ($) |
Change in Pension Value and Nonqualified Deferred Compensation Earnings ($) |
All Other Compensation ($)(b) |
Total ($) |
|||||||||||||||
|---|---|---|---|---|---|---|---|---|---|---|---|---|---|---|---|---|---|---|---|---|---|---|
J. F. Akers |
153,000 | -0- | -0- | (c) | -0- | -0- | -0- | 153,000 | ||||||||||||||
H. F. Baldwin |
141,000 | -0- | -0- | -0- | -0- | -0- | 141,000 | |||||||||||||||
R. C. Cambre |
135,000 | -0- | -0- | -0- | -0- | 2,500 | (d) | 137,500 | ||||||||||||||
M. A. Fox |
153,000 | -0- | -0- | -0- | -0- | 2,200 | (d) | 155,200 | ||||||||||||||
J. J. Murphy |
141,000 | -0- | -0- | (c) | -0- | -0- | -0- | 141,000 | ||||||||||||||
P. J. Norris (e) |
141,000 | -0- | -0- | -0- | -0- | 48,000 | (f) | 189,000 | ||||||||||||||
C. J. Steffen |
141,000 | -0- | -0- | -0- | -0- | -0- | 141,000 | |||||||||||||||
M. E. Tomkins |
159,000 | -0- | -0- | -0- | -0- | -0- | 159,000 | |||||||||||||||
T. A. Vanderslice |
171,000 | -0- | -0- | (c) | -0- | -0- | -0- | 171,000 | ||||||||||||||
- (a)
- Amount
consists of annual retainer in the amount of $105,000, meeting fees in the amount of $36,000 (other than Mr. Cambre who received meeting fees
of $30,000) and additional payments to: Mr. Akers for serving as Chair of the Compensation Committee and Dr. Fox for serving as Chair of the Corporate Responsibility Committee in the
amount of $12,000; Mr. Tomkins for serving as Chair of the Audit Committee in the amount of $18,000; and Mr. Vanderslice for serving as Chair of the Nominating and Governance Committee
and Lead Independent Director in the amount of $30,000.
- (b)
- Grace
paid an aggregate of $350 in premiums for business travel accident insurance coverage for all directors during 2009.
- (c)
- The
following directors hold options to purchase shares of Grace common stock all of which are currently vested and exercisable in the following amounts:
Mr. Akers—74,535, Mr. Murphy—15,528 and Mr. Vanderslice—69,876.
- (d)
- Consists
of charitable contributions paid to academic institutions at the request of the director pursuant to the Grace Foundation's Matching Grants
Program.
- (e)
- Mr. Norris
resigned as a director of Grace effective February 5, 2010.
- (f)
- Includes payments to Mr. Norris in the amount of $48,000 pursuant to his consulting agreement.
Norris Consulting Agreement
The Compensation Committee and the Bankruptcy Court have approved a consulting agreement between Grace and Mr. Norris dated January 19, 2005, under which Mr. Norris monitors our Chapter 11 proceedings and provides consulting services and advice to our CEO, certain of our employees and the Board of Directors, regarding those proceedings and other matters. During 2009, Mr. Norris' retainer under the agreement was $4,000 per month. This agreement was terminated effective December 31, 2009. This description of Mr. Norris' consulting agreement does not purport to be complete and is qualified in its entirety by reference to the agreement that has been filed with the SEC.
58
Compensation Committee Interlocks And Insider Participation
During 2009, the Compensation Committee of the Board was comprised of Messrs. Akers (Chair), Baldwin, Cambre, Murphy, Vanderslice, Tomkins and Steffen and Dr. Fox. None of these persons is our current or former officer or employee, nor did we have any reportable transactions with any of these persons. None of our executive officers serves or in the past has served as a member of the board of directors or compensation committee of any entity that has one or more of its executive officers serving on our Board of Directors or our Compensation Committee.
Item 12. SECURITY OWNERSHIP OF CERTAIN BENEFICIAL OWNERS AND MANAGEMENT AND RELATED STOCKHOLDER MATTERS
SECURITY OWNERSHIP
The following table sets forth the amount of Grace common stock beneficially owned, directly or indirectly, as of January 31, 2010 by:
- •
- each person that we know is the beneficial owner of more than 5% of the outstanding shares of Grace common stock;
- •
- each current director;
- •
- each of the executive officers named in the Summary Compensation Table set forth in Item 11 above;
and
- •
- all directors and all named executive officers as a group
Name and Address of Beneficial Owner(1)
|
Shares of Common Stock Beneficially Owned |
Percent | |||||
|---|---|---|---|---|---|---|---|
| Peninsula Partners, L.P.(2) | 10,765,600 | 14.9 | % | ||||
|
404B East Main Street 2nd Floor Charlottesville, VA 22902 |
|||||||
FMR LLC(3) |
10,426,017 |
14.4 |
% |
||||
| Fidelity Management & Research Company Edward C. Johnson 3d 82 Devonshire Street Boston, Massachusetts 02109 |
|||||||
BlackRock Inc.(4) |
3,719,146 |
5.1 |
% |
||||
|
40 East 52nd Street New York, NY 10022 |
|||||||
Adage Capital Partners, L.P.(5) |
3,661,356 |
5.1 |
% |
||||
| Robert Atchinson Phillip Gross 200 Clarendon Street 52nd floor Boston, Massachusetts 02116 |
|||||||
J. F. Akers |
38,966 |
* |
|||||
| 74,535 | (O) | ||||||
| 15,196 | (T) | ||||||
| 128,697 | |||||||
H. F. Baldwin |
21,918 |
* |
|||||
| 15,000 | (T) | ||||||
| 36,918 | |||||||
59
Name and Address of Beneficial Owner(1)
|
Shares of Common Stock Beneficially Owned |
Percent | |||||
|---|---|---|---|---|---|---|---|
R. C. Cambre |
28,494 |
* |
|||||
A. E. Festa |
100,000 |
* |
|||||
| 85,745 | (O) | ||||||
| 185,745 | |||||||
M. A. Fox |
55,346 |
* |
|||||
| 8,942 | (T) | ||||||
| 64,288 | |||||||
J. J. Murphy |
38,930 |
* |
|||||
| 15,528 | (O) | ||||||
| 18,629 | (T) | ||||||
| 73,087 | |||||||
C. J. Steffen |
10,000 |
* |
|||||
M. E. Tomkins |
12,000 |
* |
|||||
T. A. Vanderslice |
39,522 |
* |
|||||
| 69,876 | (O) | ||||||
| 14,932 | (T) | ||||||
| 124,330 | |||||||
D. A. Bonham |
30,440 |
(O) |
* |
||||
H. La Force III |
50,000 |
* |
|||||
| 35,095 | (O) | ||||||
| 85,095 | |||||||
G. E. Poling |
104,770 |
(O) |
* |
||||
| 18,000 | (T) | ||||||
| 122,770 | |||||||
M. A. Shelnitz |
53,500 |
* |
|||||
| 64,910 | (O) | ||||||
| 9,421 | (T) | ||||||
| 127,831 | |||||||
Directors and named executive officers as a group |
448,676 |
1.4 |
% |
||||
| 480,899 | (O) | ||||||
| 100,120 | (T) | ||||||
| 1,029,695 | |||||||
- *
- Indicates
less than 1%
- (O)
- Shares
covered by stock options exercisable on or within 60 days after January 31, 2010.
- (T)
- Shares
owned by trusts and other entities as to which the person has the power to direct voting and/or investment.
- (1)
- The address of each of our directors and executive officers is c/o Secretary, W. R. Grace & Co., 7500 Grace Drive, Columbia, MD 21044.
60
- (2)
- The
ownership information set forth is based in its entirety on material contained in a Form 4 report dated September 10, 2001 filed with the
SEC.
- (3)
- The
ownership information set forth is based in its entirety on material contained in a Schedule 13G/A filed with the SEC jointly by FMR LLC
("FMR"), Fidelity Management & Research Company ("Fidelity") and Edward C. Johnson 3d ("Mr. Johnson") on February 16, 2010. FMR and Mr. Johnson have sole voting power with
respect to 467,750 shares and sole dispositive power with respect to all 10,426,017 shares. Mr. Johnson is Chairman of FMR and members of Mr. Johnson's family may be deemed a controlling
group with respect to FMR due to their ownership of FMR voting shares and their entry into a voting agreement with respect to such shares. Fidelity is a wholly-owned subsidiary of FMR.
Mr. Johnson and FMR, through its control of Fidelity, each has sole dispositive power over 9,878,087 shares owned by various investment companies for which Fidelity serves as investment
advisor. Pyramis Global Advisors Trust Company ("PGATC"), 900 Salem Street, Smithfield, Rhode Island 02917, is a wholly-owned indirect subsidiary of FMR. Mr. Johnson and FMR, through its
control of PGATC, each has sole dispositive power over 527,030 shares and sole voting power over 446,850 shares of Common Stock owned by institutional accounts managed by PGATC. Mr. Johnson is
Chairman of FIL Limited ("FIL"), Pembroke Hall, 42 Crow Lane, Hamilton, Bermuda, and partnerships controlled predominantly by members of Mr. Johnson's family, or trusts for their
benefit, own FIL shares representing approximately 47% of the total votes which may be cast by all holders of FIL voting stock. FMR and FIL disclaim that they are acting as a "group" for purposes of
Section 13(d) under the Securities Exchange Act of 1934. FIL and various foreign-based subsidiaries provide investment advisory and management services to a number of non-U.S.
investment companies and certain institutional investors. FIL is the beneficial owner of 20,900 shares.
- (4)
- The
ownership information set forth is based in its entirety on material contained in a Schedule 13G filed with the SEC by BlackRock, Inc. on
January 29, 2010. Blackrock, Inc. is a parent holding company and holds the sole power to vote or dispose of shares held by its subsidiaries BlackRock Asset Management Japan Limited,
BlackRock Institutional Trust Company, N.A., BlackRock Fund Advisors, BlackRock Asset Management Australia Limited, BlackRock Investment Management, LLC and BlackRock International Ltd.
- (5)
- The ownership information set forth is based in its entirety on material contained in a Schedule 13G/A filed with the SEC jointly by Adage Capital Partners, L.P. ("ACP"), Adage Capital Partners GP, L.L.C. ("ACPGP"), Adage Capital Advisors, L.L.C. ("ACA"), Robert Atchinson and Phillip Gross on February 16, 2010. The shared power to vote or dispose of the shares beneficially owned by ACP may be exercised by ACP, ACPGP, as general partner of ACP, ACA and managing member of ACPGP or Messrs. Atchinson and Gross as managing members of ACA.
EQUITY COMPENSATION PLAN INFORMATION
The following table sets forth information as of December 31, 2009 with respect to our compensation plans under which shares of Grace common stock are authorized for issuance upon the exercise of options, warrants or other rights. The only such compensation plans in effect are stock incentive plans providing for the issuance of stock options and restricted stock.
Plan category
|
Number of securities to be issued upon exercise of outstanding options |
Weighted-average exercise price of outstanding options ($) |
Number of securities remaining available for future issuance under equity compensation plans (excluding securities to be issued upon exercise of outstanding options) |
|||||||
|---|---|---|---|---|---|---|---|---|---|---|
Equity compensation plans approved by security holders |
4,172,206 | 14.1911 | 1,359,207 | |||||||
61
Item 13. CERTAIN RELATIONSHIPS, RELATED TRANSACTIONS AND DIRECTOR INDEPENDENCE
BOARD INDEPENDENCE
The Board has determined that all directors, other than Mr. Festa (who is also Chief Executive Officer) are independent under New York Stock Exchange rules because none of such directors has any direct or indirect material relationship with Grace or our affiliates, other than through his or her service as a director and as an owner of less than 1% of Grace common stock. In addition to the application of the New York Stock Exchange rules, this determination was based on a number of factors, principal among them were the following:
- •
- none of these directors, nor any member of their immediate families is (or at any time during the last three years was) a
Grace executive officer or employee and none of these directors is an employee, and no member of their immediate families is an executive officer of any other entity with whom we do any material
amount of business;
- •
- none of these directors or any member of their immediate families has, during the last three years, received more than
$50,000 in direct compensation from Grace (other than director and committee fees); and
- •
- none of these directors serve, or within the last three years served, as an executive officer, director, trustee or fiduciary of any charitable organization to which we made any material charitable donation.
Only independent directors serve on our Audit, Nominating and Governance, Compensation and Corporate Responsibility Committees. Mr. Vanderslice has been appointed Lead Independent Director and, in this capacity, presides at executive sessions of independent directors. Interested parties may communicate with Mr. Vanderslice by writing him at the following address: Thomas A. Vanderslice—Lead Independent Director, c/o W. R. Grace & Co., 7500 Grace Drive, Columbia, Maryland 21044.
REVIEW, APPROVAL OR RATIFICATION OF TRANSACTIONS WITH RELATED PARTIES
The Board recognizes that transactions involving related persons in which Grace is a participant can present conflicts of interest, or the appearance thereof, so the Board has adopted a written policy as part of the Grace Corporate Governance Guidelines (which are available on our website at www.grace.com/About/Leadership/Governance/) with respect to related person transactions. The policy applies to transactions involving related persons that are required to be disclosed pursuant to SEC regulations, which are generally transactions in which:
- •
- Grace is a participant;
- •
- the amount involved exceeds $120,000; and
- •
- any related person, such as a Grace executive officer, director, director nominee, 5% stockholder or any of their respective family members, has a direct or indirect material interest.
62
Each such related person transaction shall be reviewed, determined to be in, or not inconsistent with, the best interests of Grace and its stockholders and approved or ratified by:
- •
- the disinterested members of the Audit Committee, if the disinterested members of the Audit Committee constitute a
majority of the members of the Audit Committee; or
- •
- the disinterested members of the Board.
In the event a related person transaction is entered into without prior approval and, after review by the Audit Committee or the Board, as the case may be, the transaction is not ratified, we will make all reasonable efforts to cancel the transaction.
Item 14. PRINCIPAL ACCOUNTANT FEES AND SERVICES
The Audit Committee of the Board of Directors selected PricewaterhouseCoopers LLP, or PwC, to act as our principal independent accountants for 2009. The following table sets forth the fees that we incurred for the services of PwC for the year ended December 31, 2008 and our estimate of the fees that we incurred for the year ended December 31, 2009:
| |
2009* | 2008 | |||||
|---|---|---|---|---|---|---|---|
Audit Fees |
$ | 4,566,100 | $ | 4,682,300 | |||
Audit-Related Fees |
195,900 | 214,100 | |||||
Tax Fees |
46,700 | 45,500 | |||||
All Other Fees |
159,400 | 1,500 | |||||
Total Fees |
$ | 4,968,100 | $ | 4,943,400 | |||
- *
- For 2009, amounts are current estimates in respect of services received for which final invoices have not been submitted.
Audit Services consisted of the audit of our Consolidated Financial Statements and our internal controls over financial reporting (as required under Section 404 of the Sarbanes-Oxley Act of 2002), the review of our consolidated quarterly financial statements and statutory audits of certain of Grace's non-U.S. subsidiaries and affiliates.
Audit-Related Services primarily consisted of an audit of Grace's 401(k) plan and audits of subsidiary benefit plans as required.
Tax Services consisted of tax advice and compliance for non-U.S. subsidiaries, including preparation of tax returns, and advice relating to Grace's transfer pricing policies.
All Other Fees for 2009 consisted of advice regarding finance productivity initiatives and software license fees and for 2008, software license fees.
Additionally, not included in the tables above, we incurred audit-related fees for ART, an unconsolidated affiliate, in the amount of $64,500 for the year ended December 31, 2008 and estimate fees of $81,300 for the year ended December 31, 2009.
The Audit Committee has adopted a preapproval policy that requires the Audit Committee to specifically preapprove the annual engagement of the independent accountants for the audit of our Consolidated Financial Statements and internal controls. The policy also provides for preapproval of certain audit-related, tax and other services provided by the independent accountants. Any other services must be specifically preapproved by the Audit Committee. However, the Chair of the Audit Committee has the authority to preapprove services requiring immediate engagement between scheduled meetings of the Audit Committee. The Chair must report any such preapproval decisions to the full Audit Committee at its next scheduled meeting. During 2009, no audit-related, tax, or other services were performed by PwC without specific or general approval as described above.
63
Item 15. EXHIBITS AND FINANCIAL STATEMENT SCHEDULES
Financial Statements and Schedules. The required information is set forth in the Financial Supplement under the heading "Index to Consolidated Financial Statements and Financial Statement Schedule and Exhibit" which is incorporated herein by reference.
Exhibits. The exhibits to this Report are listed below. Other than exhibits that are filed herewith, all exhibits listed below are incorporated by reference. Exhibits indicated by an asterisk (*) are the management contracts and compensatory plans, contracts or arrangements required to be filed as exhibits to this Report.
For purposes of describing these exhibits, "Old Grace" means W. R. Grace & Co., a Delaware corporation (subsequently renamed Sealed Air Corporation), a predecessor to the Company, and "Grace New York" means W. R. Grace & Co., a New York corporation (subsequently renamed Fresenius Medical Care Holdings, Inc.), a predecessor to Old Grace.
In reviewing the agreements included as exhibits to this and other Reports filed by Grace with the Securities and Exchange Commission, please remember they are included to provide you with information regarding their terms and are not intended to provide any other factual or disclosure information about Grace or other parties to the agreements. The agreements generally contain representations and warranties by each of the parties to the applicable agreement. These representations and warranties have been made solely for the benefit of the other parties to the applicable agreement. These representations and warranties:
- •
- are not statements of fact, but rather are used to allocate risk to one of the parties if the statements prove to be
inaccurate;
- •
- may have been qualified by disclosures that were made to the other parties in connection with the negotiation of the
applicable agreement, which disclosures are not necessarily reflected in the agreement;
- •
- may apply standards of materiality in a way that is different from what may be viewed as material to you or other
investors; and
- •
- were made only as of the date of the applicable agreement or such other date or dates as may be specified in the agreement and do not reflect more recent developments.
Accordingly, these representations and warranties may not describe the actual state of affairs as of the date they were made or at any other time. Additional information about Grace may be found elsewhere in this report and Grace's other public filings, which are available without charge through the Securities and Exchange Commission's website at http://www.sec.gov.
| EXHIBIT NO. |
EXHIBIT | WHERE LOCATED | ||
|---|---|---|---|---|
| 2.1 | Form of Distribution Agreement, by and among Old Grace, W. R. Grace & Co.-Conn. and Grace Specialty Chemicals, Inc. (now named W. R. Grace & Co.) | Annex B to the Joint Proxy Statement/Prospectus dated February 13, 1998 of Old Grace and Sealed Air Corporation included in Form S-4 (filed 2/13/98) | ||
2.2 |
Proposed Joint Plan of Reorganization of W. R. Grace & Co. and its debtor subsidiaries dated February 27, 2009 |
Exhibit 2.2 to Form 10-K (filed 3/02/09) |
64
| EXHIBIT NO. |
EXHIBIT | WHERE LOCATED | ||
|---|---|---|---|---|
| 3.1 | Restated Certificate of Incorporation of W. R. Grace & Co. | Exhibit 3.1 to Form 8-K (filed 4/8/98) | ||
3.2 |
Amended and Restated By-laws of W. R. Grace & Co. |
Exhibit 3.1 to Form 8-K (filed 2/27/09) |
||
4.1 |
Amended and Restated Rights Agreement dated as of March 25, 2008 between W. R. Grace & Co. and Mellon Investor Services LLC, as Rights Agent |
Exhibit 4.1 to Form 10/A (filed 3/25/08) |
||
4.2 |
Order of Delaware Bankruptcy Court limiting certain transfers of Grace equity securities |
Exhibit 4.2 to Form 10-K (filed 3/02/09) |
||
4.3 |
Credit Agreement dated as of May 14, 1998, among W. R. Grace & Co.-Conn., W. R. Grace & Co., the several banks parties thereto; the co-agents signatories thereto; The Chase Manhattan Bank, as administrative agent for such banks; and Chase Securities Inc., as arranger |
Exhibit 4.1 to Form 10-Q (filed 8/14/98) |
||
4.4 |
364-Day Credit Agreement, dated as of May 5, 1999, among W. R. Grace & Co.-Conn.; W. R. Grace & Co.; the several banks parties thereto; the co-agents signatories thereto; Bank of America National Trust and Savings Association, as documentation agent; The Chase Manhattan Bank, as administrative agent for such banks; and Chase Securities Inc., as book manager |
Exhibit 4.1 to Form 10-Q (filed 8/3/99) |
||
4.5 |
First Amendment to 364-Day Credit Agreement dated as of May 5, 1999 among W. R. Grace & Co.-Conn.; W. R. Grace & Co.; the several banks parties thereto; Bank of America National Trust and Savings Association, as document agent; The Chase Manhattan Bank, as administrative agent for such banks; and Chase Securities, Inc., as bank manager |
Exhibit 4 to Form 10-Q (filed 8/15/00) |
||
4.6 |
Post-Petition Loan and Security Agreement dated as of April 1, 2001 among the financial institutions named therein, as Lenders, Bank of America, N.A. as Agent, and W. R. Grace & Co. and its subsidiaries named therein as Debtors and Debtors-in-Possession, as Borrowers |
Exhibit 4 to Form 10-Q (filed 8/14/01) |
||
4.7 |
Amendment No. 1 and Limited Waiver to Post-Petition Loan and Security Agreement |
Exhibit 4 to Form 10-Q (filed May 13, 2003) |
||
4.8 |
Amendment No. 2 and Limited Waiver to Post-Petition Loan and Security Agreement |
Exhibit 4.1 to Form 10-Q (filed May 9, 2006) |
||
4.9 |
Amendment No. 3 and Limited Waiver to Post-Petition Loan and Security Agreement |
Exhibit 4.2 to Form 10-Q (filed May 9, 2006) |
||
4.10 |
Amendment No. 4 and Limited Waiver to Post-Petition Loan and Security Agreement |
Exhibit 4.3 to Form 10-Q (filed May 9, 2006) |
||
4.11 |
Amendment No. 5 and Limited Waiver to Post-Petition Loan and Security Agreement |
Exhibit 4.1 to Form 8-K (filed April 2, 2008) |
65
| EXHIBIT NO. |
EXHIBIT | WHERE LOCATED | ||
|---|---|---|---|---|
| 4.12 | Amendment No. 6 and Limited Waiver to Post-Petition Loan and Security Agreement | Exhibit 4.2 to Form 8-K (filed April 2, 2008) | ||
4.13 |
Amendment No. 7 and Limited Waiver to Post-Petition Loan and Security Agreement |
Exhibit 4.13 to Form 10-K (filed 2/27/2009) |
||
4.14 |
Receivables Purchase agreement dated as of January 23, 2007 between Grace GmbH & Co. KG and Coface Finanz GmbH |
Exhibit 4.10 to Form 10-K (filed 3/02/07) |
||
10.1 |
Form of Employee Benefits Allocation Agreement, by and among Old Grace, W. R. Grace & Co.-Conn. and Grace Specialty Chemicals, Inc. (now named W. R. Grace & Co.) |
Exhibit 10.1 to Form 10-K (filed March 13, 2003) |
||
10.2 |
Form of Tax Sharing Agreement, by and among Old Grace, W. R. Grace & Co.-Conn. and Grace Specialty Chemicals, Inc. (now named W. R. Grace & Co.) |
Exhibit 10.2 to Form 10-K (filed 3/13/03) |
||
10.3 |
W. R. Grace & Co. 2000 Stock Incentive Plan, as amended |
Exhibit 10 to Form 10-Q (filed 8/14/00)* |
||
10.4 |
W. R. Grace & Co. Supplemental Executive Retirement Plan, as amended |
Exhibit 10.7 to Form 10-K (filed 3/28/02)* |
||
10.5 |
W. R. Grace & Co. Executive Salary Protection Plan, as amended |
Exhibit 10.8 to Form 10-K (filed 3/28/02)* |
||
10.6 |
Form of Stock Option Agreements |
Exhibit 10.5 to Form 10-Q (filed 5/15/98)* |
||
10.7 |
Form of 2006-2008 Long-Term Incentive Program Cash Award |
Exhibit 10.1 to Form 8-K (filed 11/06/06)* |
||
10.8 |
Form of 2007-2009 Long-Term Incentive Program Cash Award |
Exhibit 10.1 to Form 10-Q (filed 11/08/07)* |
||
10.9 |
Form of 2008-2010 Long-Term Incentive Program Cash Award |
Exhibit 10.12 to Form 10-K (filed 3/02/09)* |
||
10.10 |
Form of 2009-2011 Long-Term Incentive Program Cash Award |
Exhibit 10.1 to Form 8-K (filed 4/28/09)* |
||
10.11 |
Form of Executive Severance Agreement between Grace and certain officers |
Exhibit 10.17 to Form 10-K (filed 3/13/03)* |
||
10.12 |
Severance Pay Plan for Salaried Employees |
Exhibit 10.17 to Form 10-K (filed 3/02/07)* |
||
10.13 |
Letter Agreement dated May 7, 1999 between Paul J. Norris, on behalf of Grace, and William M. Corcoran |
Exhibit 10.24 to Form 10-K (filed 4/16/01)* |
||
10.14 |
Form of Indemnification Agreement between Grace and certain officers and directors |
Exhibit 10.27 to Form 10-K (filed 4/16/01)* |
||
10.15 |
Form of Retention Agreement between Grace and certain officers (includes enhanced severance provision) |
Exhibit 10.28 to Form 10-K (filed 4/16/01)* |
66
| EXHIBIT NO. |
EXHIBIT | WHERE LOCATED | ||
|---|---|---|---|---|
| 10.16 | Annual Incentive Compensation Program | Exhibit 10 to Form 10-Q (filed 5/08/09)* | ||
10.17 |
Letter Agreement dated May 27, 2009 between John F. Akers, on behalf of Grace, and Fred Festa |
Exhibit 10.1 to Form 8-K (filed 5/29/09)* |
||
10.18 |
Letter Agreement dated January 19, 2005 between Thomas A. Vanderslice, on behalf of Grace, and Paul J. Norris |
Exhibit 10.2 to Form 8-K (filed 4/29/05)* |
||
10.19 |
Letter Agreement dated February 28, 2008 between Fred Festa, on behalf of Grace, and Hudson La Force III (includes enhanced severance provision) |
Exhibit 10.1 to Form 8-K (filed 3/07/08)* |
||
10.20 |
Settlement Agreement dated March 11, 2008 between Grace and the U.S. Government (EPA Cost Recovery Settlement) |
Exhibit 10.1 to Form 8-K (filed 3/11/08) |
||
12 |
Computation of Ratio of Earnings to Fixed Charges and Combined Fixed Charges and Preferred Stock Dividends |
Filed herewith in this Report in Item 8 (Financial Statements and Supplementary Data) in the Financial Supplement |
||
21 |
List of Subsidiaries of W. R. Grace & Co. |
Filed herewith |
||
23 |
Consent of Independent Accountants |
Filed herewith in this Report in Item 8 (Financial Statements and Supplementary Data) in the Financial Supplement |
||
24 |
Powers of Attorney |
Filed herewith |
||
31(i).1 |
Certification of Periodic Report by Chief Executive Officer under Section 302 of the Sarbanes-Oxley Act of 2002 |
Filed herewith in this Report in Item 8 (Financial Statements and Supplementary Data) in the Financial Supplement |
||
31(i).2 |
Certification of Periodic Report by Chief Financial Officer under Section 302 of the Sarbanes-Oxley Act of 2002 |
Filed herewith in this Report in Item 8 (Financial Statements and Supplementary Data) in the Financial Supplement |
||
32 |
Certification of Periodic Report by Chief Executive Officer and Chief Financial Officer under Section 906 of the Sarbanes-Oxley Act of 2002 |
Filed herewith in this Report in Item 8 (Financial Statements and Supplementary Data) in the Financial Supplement |
67
Pursuant to the requirements of Section 13 or 15(d) of the Securities Exchange Act of 1934, the registrant has duly caused this Report to be signed on its behalf by the undersigned, thereto duly authorized.
| W. R. GRACE & CO. | |||
By: |
/s/ ALFRED E. FESTA Alfred E. Festa (President, Chairman and Chief Executive Officer) |
||
By: |
/s/ HUDSON LA FORCE III Hudson La Force III (Senior Vice President and Chief Financial Officer) |
||
Dated: February 25, 2010
Pursuant to the requirements of the Securities Exchange Act of 1934, this Report has been signed below by the following persons on behalf of the registrant and in the capacities indicated on February 25, 2010.
| Signature | |
Title | |||
|---|---|---|---|---|---|
| J. F. Akers* | } | ||||
| H. F. Baldwin* | } | ||||
| R. C. Cambre* | } | ||||
| M. A. Fox* | } | ||||
| J. J. Murphy* | } | Directors | |||
| C. J. Steffen* | } | ||||
| M. E. Tomkins* | } | ||||
| T. A. Vanderslice* | } | ||||
| /s/ ALFRED E. FESTA (Alfred E. Festa) |
President, Chairman, Chief Executive Officer and Director (Principal Executive Officer) |
|
/s/ HUDSON LA FORCE III (Hudson La Force III) |
Senior Vice President and Chief Financial Officer (Principal Financial Officer and Principal Accounting Officer) |
- *
- By signing his name hereto, Mark A. Shelnitz is signing this document on behalf of each of the persons indicated above pursuant to powers of attorney duly executed by such persons and filed with the Securities and Exchange Commission.
| By: | /s/ MARK A. SHELNITZ Mark A. Shelnitz (Attorney-in-Fact) |
68
Financial Supplement
W. R. GRACE & CO.
ANNUAL REPORT ON FORM 10-K
FOR THE YEAR ENDED DECEMBER 31, 2009
FINANCIAL SUPPLEMENT
to
Annual Report on Form 10-K for the Year Ended December 31, 2009
W. R. GRACE & CO. AND SUBSIDIARIES
Index to Consolidated Financial Statements
and Financial Statement Schedule and Exhibit
The financial data listed above appearing in this Financial Supplement are incorporated by reference herein. The Financial Statement Schedule should be read in conjunction with the Consolidated Financial Statements and Notes thereto. Financial statements of less than majority-owned persons and other persons accounted for by the equity method have been omitted as provided in Rule 3-09 of the United States Securities and Exchange Commission's (SEC) Regulation S-X. Financial Statement Schedules not included have been omitted because they are not applicable or the required information is shown in the Consolidated Financial Statements or Notes thereto.
Management's Report on Financial Information and Internal Controls
Responsibility For Financial Information—We are responsible for the preparation, accuracy, integrity and objectivity of the Consolidated Financial Statements and the other financial information included in this report. Such information has been prepared in conformity with accounting principles generally accepted in the United States of America and accordingly, includes certain amounts that represent management's best estimates and judgments. Actual amounts could differ from those estimates.
Responsibility for Internal Controls—We are also responsible for establishing and maintaining adequate internal controls over financial reporting. These internal controls consist of policies and procedures that are designed to assess and monitor the effectiveness of the control environment including risk identification, governance structure, delegations of authority, information flow, communications and control activities. A chartered Disclosure Committee oversees Grace's public financial reporting process and key managers are required to confirm their compliance with Grace's policies and internal controls quarterly. While no system of internal controls can ensure elimination of all errors and irregularities, Grace's internal controls, which are reviewed and modified in response to changing conditions, have been designed to provide reasonable assurance that assets are safeguarded, policies and procedures are followed, transactions are properly executed and reported, and appropriate disclosures are made. The concept of reasonable assurance is based on the recognition that there are limitations in all systems of internal control and that the costs of such systems should be balanced with their benefits. The Audit Committee of the Board of Directors, which is comprised solely of independent directors, meets regularly with Grace's senior financial management, internal auditors and independent registered public accounting firm to review audit plans and results, as well as the actions taken by management in discharging its responsibilities for accounting, financial reporting and internal controls. The Audit Committee is responsible for the selection and compensation of the independent registered public accounting firm. Grace's financial management, internal auditors and independent registered public accounting firm have direct and confidential access to the Audit Committee at all times.
Report On Internal Control Over Financial Reporting—We and our management have evaluated Grace's internal control over financial reporting as of December 31, 2009. This evaluation was based on criteria for effective internal control over financial reporting set forth in Internal Control—Integrated Framework issued by the Committee of Sponsoring Organizations of the Treadway Commission. Based on this evaluation, we and our management have concluded that Grace's internal control over financial reporting is effective as of December 31, 2009. Grace's independent registered public accounting firm that audited our financial statements included in Item 15 has also audited the effectiveness of Grace's internal control over financial reporting as of December 31, 2009, as stated in their report, which appears on the following page.
Report On Disclosure Controls And Procedures—As of December 31, 2009, we carried out an evaluation of the effectiveness of the design and operation of Grace's disclosure controls and procedures pursuant to Rule 13a-15 under the Securities Exchange Act of 1934, as amended (the "Exchange Act"). Based upon that evaluation, we concluded that Grace's disclosure controls and procedures are effective in ensuring that information required to be disclosed in Grace's periodic filings under the Exchange Act is accumulated and communicated to us to allow timely decisions regarding required disclosures, and such information is recorded, processed, summarized and reported within the time periods specified in the Securities and Exchange Commission's rules and forms.
| /s/ A. E. Festa A. E. Festa President and Chief Executive Officer |
/s/ Hudson La Force III Hudson La Force III Senior Vice President and Chief Financial Officer |
|
February 25, 2010 |
F-2
Report of Independent Registered Public Accounting Firm
To the Shareholders and Board of Directors of W. R. Grace & Co.:
In our opinion, the accompanying consolidated financial statements present fairly, in all material respects, the financial position of W. R. Grace & Co. and its subsidiaries (the "Company") at December 31, 2009 and December 31, 2008, and the results of their operations and their cash flows for each of the three years in the period ended December 31, 2009 in conformity with accounting principles generally accepted in the United States of America. In addition, in our opinion, the financial statement schedule listed in the accompanying index presents fairly, in all material respects, the information set forth therein when read in conjunction with the related consolidated financial statements. Also in our opinion, the Company maintained, in all material respects, effective internal control over financial reporting as of December 31, 2009 based on criteria established in Internal Control—Integrated Framework issued by the Committee of Sponsoring Organizations of the Treadway Commission (COSO). The Company's management is responsible for these financial statements and financial statement schedule, for maintaining effective internal control over financial reporting and for its assessment of the effectiveness of internal control over financial reporting, included in the accompanying management's Report On Internal Control Over Financial Reporting. Our responsibility is to express opinions on these financial statements, on the financial statement schedule, and on the Company's internal control over financial reporting based on our integrated audits. We conducted our audits in accordance with the standards of the Public Company Accounting Oversight Board (United States). Those standards require that we plan and perform the audits to obtain reasonable assurance about whether the financial statements are free of material misstatement and whether effective internal control over financial reporting was maintained in all material respects. Our audits of the financial statements included examining, on a test basis, evidence supporting the amounts and disclosures in the financial statements, assessing the accounting principles used and significant estimates made by management, and evaluating the overall financial statement presentation. Our audit of internal control over financial reporting included obtaining an understanding of internal control over financial reporting, assessing the risk that a material weakness exists, and testing and evaluating the design and operating effectiveness of internal control based on the assessed risk. Our audits also included performing such other procedures as we considered necessary in the circumstances. We believe that our audits provide a reasonable basis for our opinions.
The accompanying consolidated financial statements have been prepared assuming that the Company will continue as a going concern. As discussed in Note 1 to the consolidated financial statements, on April 2, 2001, the Company and substantially all of its domestic subsidiaries voluntarily filed for protection under Chapter 11 of the United States Bankruptcy Code, which raises substantial doubt about the Company's ability to continue as a going concern in its present form. Management's intentions with respect to this matter are described in Note 2. The accompanying consolidated financial statements do not include any adjustments that might result from the outcome of this uncertainty.
As discussed in Note 1 to the accompanying consolidated financial statements, the Company retrospectively changed the manner in which it accounts for noncontrolling interests in 2009. Also, as discussed in Note 10 to the accompanying consolidated financial statements, the Company changed the manner in which it accounts for income tax uncertainties effective January 1, 2007.
A company's internal control over financial reporting is a process designed to provide reasonable assurance regarding the reliability of financial reporting and the preparation of financial statements for external purposes in accordance with generally accepted accounting principles. A company's internal control over financial reporting includes those policies and procedures that (i) pertain to the maintenance of records that, in reasonable detail, accurately and fairly reflect the
F-3
transactions and dispositions of the assets of the company; (ii) provide reasonable assurance that transactions are recorded as necessary to permit preparation of financial statements in accordance with generally accepted accounting principles, and that receipts and expenditures of the company are being made only in accordance with authorizations of management and directors of the company; and (iii) provide reasonable assurance regarding prevention or timely detection of unauthorized acquisition, use, or disposition of the Company's assets that could have a material effect on the financial statements.
Because of its inherent limitations, internal control over financial reporting may not prevent or detect misstatements. Also, projections of any evaluation of effectiveness to future periods are subject to the risk that controls may become inadequate because of changes in conditions, or that the degree of compliance with the policies or procedures may deteriorate.
/s/
PricewaterhouseCoopers LLP
PricewaterhouseCoopers LLP
McLean, Virginia
February 25, 2010
Consent of Independent Registered Public Accounting Firm
We hereby consent to the incorporation by reference in the Registration Statement on Form S-8 (No. 333-37024) of W. R. Grace & Co. of our report dated February 25, 2010 relating to the financial statements, financial statement schedule and the effectiveness of internal control over financial reporting, which appears in this Form 10-K.
/s/
PricewaterhouseCoopers LLP
PricewaterhouseCoopers LLP
McLean, Virginia
February 25, 2010
F-4
W. R. Grace & Co. and Subsidiaries
Consolidated Statements of Operations
(In millions, except per share amounts)
| |
Year Ended December 31, | ||||||||||
|---|---|---|---|---|---|---|---|---|---|---|---|
| |
2009 | 2008 | 2007 | ||||||||
Net sales |
$ | 2,825.0 | $ | 3,317.0 | $ | 3,115.2 | |||||
Cost of goods sold |
1,900.7 | 2,333.5 | 2,128.5 | ||||||||
Gross profit |
924.3 | 983.5 | 986.7 | ||||||||
Selling, general and administrative expenses |
570.8 | 589.7 | 600.6 | ||||||||
Restructuring expenses and related asset impairments |
33.4 | 5.2 | — | ||||||||
(Gains) loss on sales of product lines and gain related to the sale of interest in an unconsolidated affiliate |
(33.9 | ) | — | 1.0 | |||||||
Research and development expenses |
70.1 | 82.7 | 79.5 | ||||||||
Defined benefit pension expense |
85.6 | 56.8 | 52.6 | ||||||||
Interest expense and related financing costs |
38.3 | 54.2 | 72.1 | ||||||||
Provision for environmental remediation |
4.4 | 14.6 | 17.0 | ||||||||
Chapter 11 expenses, net of interest income |
48.0 | 65.8 | 86.4 | ||||||||
Equity in earnings of unconsolidated affiliates |
(1.7 | ) | (0.6 | ) | — | ||||||
Other (income) expense, net |
16.6 | (26.1 | ) | (34.7 | ) | ||||||
|
831.6 | 842.3 | 874.5 | ||||||||
Income before income taxes |
92.7 | 141.2 | 112.2 | ||||||||
Benefit from (provision for) income taxes |
(11.5 | ) | (4.3 | ) | 1.1 | ||||||
Net income |
81.2 | 136.9 | 113.3 | ||||||||
Less: Net income attributable to noncontrolling interests |
(10.0 | ) | (15.4 | ) | (24.5 | ) | |||||
Net income attributable to W. R. Grace & Co. shareholders |
$ | 71.2 | $ | 121.5 | $ | 88.8 | |||||
Earnings Per Share Attributable to W. R. Grace & Co. Shareholders |
|||||||||||
Basic earnings per share: |
|||||||||||
Net income |
$ | 0.99 | $ | 1.69 | $ | 1.27 | |||||
Weighted average number of basic shares |
72.2 | 72.0 | 70.1 | ||||||||
Diluted earnings per share: |
|||||||||||
Net income |
$ | 0.98 | $ | 1.68 | $ | 1.24 | |||||
Weighted average number of diluted shares |
72.6 | 72.5 | 71.6 | ||||||||
The Notes to Consolidated Financial Statements are an integral part of these statements.
F-5
W. R. Grace & Co. and Subsidiaries
Consolidated Statements of Cash Flows
(In millions)
| |
Year Ended December 31, | ||||||||||
|---|---|---|---|---|---|---|---|---|---|---|---|
| |
2009 | 2008 | 2007 | ||||||||
OPERATING ACTIVITIES |
|||||||||||
Net income |
$ | 81.2 | $ | 136.9 | $ | 113.3 | |||||
Reconciliation to net cash provided by operating activities: |
|||||||||||
Depreciation and amortization |
113.0 | 118.7 | 113.4 | ||||||||
Equity in earnings of unconsolidated affiliates |
(1.7 | ) | (0.6 | ) | — | ||||||
Chapter 11 expenses, net of interest income |
48.0 | 65.8 | 86.4 | ||||||||
(Benefit from) provision for income taxes |
11.5 | 4.3 | (1.1 | ) | |||||||
Income taxes (paid), net of refunds |
28.2 | (42.4 | ) | (51.1 | ) | ||||||
Interest accrued on pre-petition liabilities subject to compromise |
36.2 | 49.4 | 70.9 | ||||||||
(Gains) loss on sales of product lines and gain related to the sale of interest in an unconsolidated affiliate |
(33.9 | ) | — | 1.0 | |||||||
Net gain on disposals of assets |
(1.5 | ) | (14.1 | ) | (2.9 | ) | |||||
Restructuring expenses and related asset impairments |
33.4 | 5.2 | — | ||||||||
Payments for restructuring expenses and related asset impairments |
(17.5 | ) | (4.5 | ) | — | ||||||
Defined benefit pension expense |
85.6 | 56.8 | 52.6 | ||||||||
Payments under defined benefit pension arrangements |
(61.4 | ) | (67.7 | ) | (105.7 | ) | |||||
Payments under postretirement benefit plans |
(3.6 | ) | (6.6 | ) | (5.0 | ) | |||||
Net income from life insurance policies |
(1.2 | ) | (3.0 | ) | (5.4 | ) | |||||
Provision for (recovery of) uncollectible receivables |
4.3 | 2.2 | (0.4 | ) | |||||||
Provision for environmental remediation |
4.4 | 14.6 | 17.0 | ||||||||
Expenditures for environmental remediation |
(7.7 | ) | (4.9 | ) | (9.5 | ) | |||||
Expenditures for retained obligations of divested businesses |
(0.3 | ) | (1.1 | ) | (1.0 | ) | |||||
Changes in assets and liabilities, excluding effect of currency translation: |
|||||||||||
Trade accounts receivable |
96.8 | 13.8 | (44.6 | ) | |||||||
Inventories |
84.8 | (2.3 | ) | (28.7 | ) | ||||||
Accounts payable |
(32.1 | ) | 40.0 | 16.1 | |||||||
Due from unconsolidated affiliate |
3.0 | — | — | ||||||||
Other accruals and non-cash items |
18.1 | (24.2 | ) | (12.7 | ) | ||||||
Net cash provided by operating activities before Chapter 11 expenses and settlements |
487.6 | 336.3 | 202.6 | ||||||||
Cash paid to resolve contingencies subject to Chapter 11 |
— | (252.0 | ) | (10.3 | ) | ||||||
Chapter 11 expenses paid |
(54.2 | ) | (69.3 | ) | (92.1 | ) | |||||
Net cash provided by operating activities |
433.4 | 15.0 | 100.2 | ||||||||
INVESTING ACTIVITIES |
|||||||||||
Capital expenditures |
(93.8 | ) | (132.2 | ) | (136.9 | ) | |||||
Business acquired, net of cash acquired |
— | — | (5.5 | ) | |||||||
Purchases of equity investments |
(2.5 | ) | (4.0 | ) | (6.3 | ) | |||||
Proceeds from sales of product lines and the interest in an unconsolidated affiliate |
40.6 | — | 21.8 | ||||||||
Cash impact from deconsolidation of business |
(17.5 | ) | — | — | |||||||
Proceeds from disposals of assets |
8.6 | 21.8 | 6.1 | ||||||||
Investments in short term debt securities |
— | — | (124.7 | ) | |||||||
Proceeds from sales of investment securities and debt securities |
22.5 | 70.7 | 25.0 | ||||||||
Net investment in life insurance policies |
(0.6 | ) | (0.1 | ) | (1.2 | ) | |||||
Proceeds from termination of life insurance policies |
68.8 | 12.7 | 14.8 | ||||||||
Net cash provided by (used for) investing activities |
26.1 | (31.1 | ) | (206.9 | ) | ||||||
FINANCING ACTIVITIES |
|||||||||||
Dividends paid to noncontrolling interests in consolidated entities |
(40.4 | ) | (13.4 | ) | (12.0 | ) | |||||
Net (repayments) borrowings under credit arrangements |
(0.4 | ) | 6.7 | 8.2 | |||||||
Fees paid under debtor-in-possession credit facility |
(1.9 | ) | (2.3 | ) | (2.6 | ) | |||||
Proceeds from exercise of stock options |
1.4 | 9.6 | 40.1 | ||||||||
Net cash provided by (used for) financing activities |
(41.3 | ) | 0.6 | 33.7 | |||||||
Effect of currency exchange rate changes on cash and cash equivalents |
14.7 | (4.9 | ) | 17.2 | |||||||
Increase (decrease) in cash and cash equivalents |
432.9 | (20.4 | ) | (55.8 | ) | ||||||
Cash and cash equivalents, beginning of period |
460.1 | 480.5 | 536.3 | ||||||||
Cash and cash equivalents, end of period |
$ | 893.0 | $ | 460.1 | $ | 480.5 | |||||
The Notes to Consolidated Financial Statements are an integral part of these statements.
F-6
W. R. Grace & Co. and Subsidiaries
Consolidated Balance Sheets
(In millions, except par value and shares)
| |
December 31, 2009 |
December 31, 2008 |
||||||
|---|---|---|---|---|---|---|---|---|
ASSETS |
||||||||
Current Assets |
||||||||
Cash and cash equivalents |
$ | 893.0 | $ | 460.1 | ||||
Investment securities |
— | 21.6 | ||||||
Cash value of life insurance policies, net of policy loans |
— | 67.2 | ||||||
Trade accounts receivable (including $17.9 from an unconsolidated affiliate), less allowance of $7.9 (2008—$5.0) |
383.7 | 462.6 | ||||||
Inventories |
220.6 | 354.8 | ||||||
Deferred income taxes |
61.5 | 45.8 | ||||||
Other current assets |
69.9 | 86.1 | ||||||
Total Current Assets |
1,628.7 | 1,498.2 | ||||||
Properties and equipment, net of accumulated depreciation and amortization of $1,611.3 (2008—$1,545.3) |
690.1 | 710.6 | ||||||
Goodwill |
118.6 | 117.1 | ||||||
Deferred income taxes |
843.4 | 851.7 | ||||||
Asbestos-related insurance |
500.0 | 500.0 | ||||||
Overfunded defined benefit pension plans |
36.7 | 48.6 | ||||||
Investments in unconsolidated affiliates |
45.7 | 7.9 | ||||||
Other assets |
105.0 | 141.4 | ||||||
Total Assets |
$ | 3,968.2 | $ | 3,875.5 | ||||
LIABILITIES AND EQUITY (DEFICIT) |
||||||||
Liabilities Not Subject to Compromise |
||||||||
Current Liabilities |
||||||||
Debt payable within one year (including $1.8 due to an unconsolidated affiliate) (2008-$0.0) |
$ | 12.6 | $ | 11.2 | ||||
Accounts payable (including $4.1 due to an unconsolidated affiliate) (2008-$0.0) |
174.2 | 207.6 | ||||||
Other current liabilities |
307.9 | 314.3 | ||||||
Total Current Liabilities |
494.7 | 533.1 | ||||||
Debt payable after one year (including $10.5 due to an unconsolidated affiliate) (2008-$0.0) |
10.9 | 0.6 | ||||||
Deferred income taxes |
34.2 | 7.1 | ||||||
Underfunded defined benefit pension plans |
372.2 | 392.3 | ||||||
Unfunded pay-as-you-go defined benefit pension plans |
158.2 | 136.7 | ||||||
Other liabilities |
41.4 | 46.6 | ||||||
Total Liabilities Not Subject to Compromise |
1,111.6 | 1,116.4 | ||||||
Liabilities Subject to Compromise—Note 2 |
||||||||
Pre-petition bank debt plus accrued interest |
850.6 | 823.5 | ||||||
Drawn letters of credit plus accrued interest |
31.4 | 30.0 | ||||||
Income tax contingencies |
117.9 | 121.0 | ||||||
Asbestos-related contingencies |
1,700.0 | 1,700.0 | ||||||
Environmental contingencies |
148.4 | 152.2 | ||||||
Postretirement benefits |
171.2 | 169.7 | ||||||
Other liabilities and accrued interest |
127.6 | 116.5 | ||||||
Total Liabilities Subject to Compromise |
3,147.1 | 3,112.9 | ||||||
Total Liabilities |
4,258.7 | 4,229.3 | ||||||
Commitments and Contingencies |
||||||||
Equity (Deficit) |
||||||||
Common stock issued, par value $0.01; 300,000,000 shares authorized; outstanding: 2009—72,283,318 (2008—72,157,518) |
0.8 | 0.8 | ||||||
Paid-in capital |
445.8 | 436.6 | ||||||
Accumulated deficit |
(175.4 | ) | (246.6 | ) | ||||
Treasury stock, at cost: shares: 2009—4,696,442; (2008—4,822,242) |
(55.9 | ) | (57.4 | ) | ||||
Accumulated other comprehensive income (loss) |
(514.5 | ) | (560.3 | ) | ||||
Total W. R. Grace & Co. Shareholders' Equity (Deficit) |
(299.2 | ) | (426.9 | ) | ||||
Noncontrolling interests |
8.7 | 73.1 | ||||||
Total Equity (Deficit) |
(290.5 | ) | (353.8 | ) | ||||
Total Liabilities and Equity (Deficit) |
$ | 3,968.2 | $ | 3,875.5 | ||||
The Notes to Consolidated Financial Statements are an integral part of these statements.
F-7
W. R. Grace & Co. and Subsidiaries
Consolidated Statements of Equity (Deficit)
(In millions)
| |
Common Stock and Paid-in Capital |
Accumulated Deficit |
Treasury Stock |
Accumulated Other Comprehensive Income (Loss) |
Noncontrolling Interests |
Total Equity (Deficit) |
|||||||||||||
|---|---|---|---|---|---|---|---|---|---|---|---|---|---|---|---|---|---|---|---|
Balance, December 31, 2006 |
$ | 424.6 | $ | (459.1 | ) | $ | (96.0 | ) | $ | (390.8 | ) | $ | 61.1 | $ | (460.2 | ) | |||
Cumulative effect of adoption of ASC 740-10 |
— | 2.2 | — | — | — | 2.2 | |||||||||||||
Balance, January 1, 2007 |
424.6 | (456.9 | ) | (96.0 | ) | (390.8 | ) | 61.1 | (458.0 | ) | |||||||||
Net income |
— | 88.8 | — | — | 24.5 | 113.3 | |||||||||||||
Stock plan activity |
7.7 | — | 32.3 | — | — | 40.0 | |||||||||||||
Other comprehensive income (loss) |
— | — | — | 40.7 | (0.4 | ) | 40.3 | ||||||||||||
Dividends paid |
— | — | — | — | (12.0 | ) | (12.0 | ) | |||||||||||
Balance, December 31, 2007 |
432.3 | (368.1 | ) | (63.7 | ) | (350.1 | ) | 73.2 | (276.4 | ) | |||||||||
Net income |
— | 121.5 | — | — | 15.4 | 136.9 | |||||||||||||
Stock plan activity |
5.1 | — | 6.3 | — | — | 11.4 | |||||||||||||
Other comprehensive income (loss) |
— | — | — | (210.2 | ) | (2.1 | ) | (212.3 | ) | ||||||||||
Dividends paid |
— | — | — | — | (13.4 | ) | (13.4 | ) | |||||||||||
Balance, December 31, 2008 |
437.4 | (246.6 | ) | (57.4 | ) | (560.3 | ) | 73.1 | (353.8 | ) | |||||||||
Net income |
— | 71.2 | — | — | 10.0 | 81.2 | |||||||||||||
Stock plan activity |
9.2 | — | 1.5 | — | — | 10.7 | |||||||||||||
Other comprehensive income (loss) |
— | — | — | 45.8 | 1.6 | 47.4 | |||||||||||||
Dividends paid |
— | — | — | — | (40.4 | ) | (40.4 | ) | |||||||||||
Deconsolidation of business |
— | — | — | — | (35.6 | ) | (35.6 | ) | |||||||||||
Balance, December 31, 2009 |
$ | 446.6 | $ | (175.4 | ) | $ | (55.9 | ) | $ | (514.5 | ) | $ | 8.7 | $ | (290.5 | ) | |||
The Notes to Consolidated Financial Statements are an integral part of these statements.
F-8
W. R. Grace & Co. and Subsidiaries
Consolidated Statements of Comprehensive Income (Loss)
(In millions)
| |
Year Ended December 31, | ||||||||||
|---|---|---|---|---|---|---|---|---|---|---|---|
| |
2009 | 2008 | 2007 | ||||||||
Net income |
$ | 81.2 | $ | 136.9 | $ | 113.3 | |||||
Other comprehensive income (loss): |
|||||||||||
Currency translation adjustments |
38.1 | (58.7 | ) | 44.6 | |||||||
Gain (loss) from hedging activities, net of income taxes |
7.5 | (6.6 | ) | 0.8 | |||||||
Defined benefit pension and other postretirement plans, net of income taxes |
1.0 | (144.9 | ) | (4.7 | ) | ||||||
Unrealized loss on investment |
(0.8 | ) | — | — | |||||||
Total other comprehensive income (loss) attributable to W. R. Grace & Co. shareholders |
45.8 | (210.2 | ) | 40.7 | |||||||
Total other comprehensive income (loss) attributable to noncontrolling interests |
1.6 | (2.1 | ) | (0.4 | ) | ||||||
Total other comprehensive income (loss) |
47.4 | (212.3 | ) | 40.3 | |||||||
Comprehensive income (loss) |
$ | 128.6 | $ | (75.4 | ) | $ | 153.6 | ||||
The Notes to Consolidated Financial Statements are an integral part of these statements.
F-9
Notes to Consolidated Financial Statements
1. Basis of Presentation and Summary of Significant Accounting and Financial Reporting Policies
W. R. Grace & Co., through its subsidiaries, is engaged in specialty chemicals and specialty materials businesses on a global basis through two operating segments: Grace Davison, which includes specialty catalysts and specialty materials used in a wide range of energy, refining, consumer, industrial, packaging and life sciences applications; and Grace Construction Products, which includes specialty chemicals and specialty materials used in commercial, infrastructure and residential construction.
W. R. Grace & Co. conducts substantially all of its business through a direct, wholly-owned subsidiary, W. R. Grace & Co.-Conn. ("Grace-Conn."). Grace-Conn. owns substantially all of the assets, properties and rights of W. R. Grace & Co. on a consolidated basis, either directly or through subsidiaries.
As used in these notes, the term "Company" refers to W. R. Grace & Co. The term "Grace" refers to the Company and/or one or more of its subsidiaries and, in certain cases, their respective predecessors.
Voluntary Bankruptcy Filing During 2000 and the first quarter of 2001, Grace experienced several adverse developments in its asbestos-related litigation, including: a significant increase in personal injury claims, higher than expected costs to resolve personal injury and certain property damage claims, and class action lawsuits alleging damages from Zonolite® Attic Insulation ("ZAI"), a former Grace attic insulation product.
After a thorough review of these developments, Grace's Board of Directors concluded that a federal court-supervised bankruptcy process provided the best forum available to achieve fairness in resolving these claims and on April 2, 2001 (the "Filing Date"), Grace and 61 of its United States subsidiaries and affiliates, (collectively, the "Debtors"), filed voluntary petitions for reorganization (the "Filing") under Chapter 11 of the United States Bankruptcy Code in the United States Bankruptcy Court for the District of Delaware (the "Bankruptcy Court"). The cases were consolidated and are being jointly administered under case number 01-01139 (the "Chapter 11 Cases"). Grace's non-U.S. subsidiaries and certain of its U.S. subsidiaries were not included in the Filing.
Under Chapter 11, the Debtors have continued to operate their businesses as debtors-in-possession under court protection from creditors and claimants, while using the Chapter 11 process to develop and implement a plan for addressing the asbestos-related claims. Since the Filing, all motions necessary to conduct normal business activities have been approved by the Bankruptcy Court. (See Note 2 for Chapter 11 Information.)
Principles of Consolidation The Consolidated Financial Statements include the accounts of Grace and entities as to which Grace exercises control over operating and financial policies. Grace consolidates the activities of variable interest entities in circumstances where management determines that Grace is the primary beneficiary of the variable interest entity. Intercompany transactions and balances are eliminated in consolidation. Investments in affiliated companies in which Grace can significantly influence operating and financial policies are accounted for under the equity method, unless Grace's investment is deemed to be temporary, in which case the investment is accounted for under the cost method.
Operating Segments Grace reports financial results of each of its operating segments that engage in business activities that generate revenues and expenses, and whose operating results are
F-10
Notes to Consolidated Financial Statements (Continued)
1. Basis of Presentation and Summary of Significant Accounting and Financial Reporting Policies (Continued)
regularly reviewed by Grace's Chief Executive Officer. Grace reports two operating segments: Grace Davison, which includes specialty catalysts and specialty materials used in a wide range of energy, refining, consumer, industrial, packaging and life sciences applications; and Grace Construction Products, which includes specialty chemicals and specialty materials used in commercial, infrastructure and residential construction.
Noncontrolling Interests in Consolidated Entities Grace conducts certain of its business through joint ventures with unaffiliated third parties. For joint ventures in which Grace has a controlling financial interest, Grace consolidates the results of such joint ventures in the Consolidated Financial Statements. Grace recognizes a liability for cumulative amounts due to the third parties based on the financial results of the joint ventures, and deducts the amount of income attributable to noncontrolling interests in the measurement of its consolidated net income.
Reclassifications Certain amounts in prior years' Consolidated Financial Statements have been reclassified to conform to the 2009 presentation. Such reclassifications have not materially affected previously reported amounts in the Consolidated Financial Statements.
Use of Estimates The preparation of financial statements in conformity with U.S. generally accepted accounting principles (U.S. GAAP) requires management to make estimates and assumptions that affect the reported amount of assets and liabilities and disclosure of contingent assets and liabilities at the date of the Consolidated Financial Statements, and the reported amounts of revenues and expenses for the periods presented. Actual amounts could differ from those estimates, and the differences could be material. Changes in estimates are recorded in the period identified. Grace's accounting measurements that are most affected by management's estimates of future events are:
- •
- Contingent liabilities, which depend on an assessment of the probability of loss and an estimate of ultimate resolution
cost, such as asbestos-related matters (see Notes 2 and 3), income taxes (see Note 10), environmental remediation (see Note 13), and litigation (see Note 13);
- •
- Pension and postretirement liabilities that depend on assumptions regarding participant life spans, future inflation,
discount rates and total returns on invested funds (see Note 11); and
- •
- Realization values of net deferred tax assets and insurance receivables, which depend on projections of future income and cash flows and assessments of insurance coverage and insurer solvency.
The accuracy of management's estimates may be materially affected by the uncertainties arising under Grace's Chapter 11 proceeding.
Revenue Recognition Grace recognizes revenue when all of the following criteria are satisfied: risk of loss and title transfer to the customer; the price is fixed and determinable; and collectability is reasonably assured. Certain customer arrangements include conditions for volume rebates. Grace accrues a rebate allowance and reduces recorded sales for anticipated selling price adjustments at the time of sale. Grace regularly reviews rebate accruals based on actual and anticipated sales patterns.
F-11
Notes to Consolidated Financial Statements (Continued)
1. Basis of Presentation and Summary of Significant Accounting and Financial Reporting Policies (Continued)
Cash Equivalents Cash equivalents consist of liquid instruments and investments with maturities of three months or less when purchased. The recorded amounts approximate fair value.
Investment Securities Investment securities consist of direct and indirect investments in debt securities and are classified as available-for-sale securities. These investments are reported at fair value as determined by independent pricing sources with temporary unrealized gains and losses included in other comprehensive income. Losses that are deemed to be other than temporary are considered impairments and are recorded in earnings. Grace reflected these securities as current assets in prior years as they were actively being liquidated. The securities were fully liquidated as of December 31, 2009.
Inventories Inventories are stated at the lower of cost or market. The method used to determine cost is first-in/first-out, or "FIFO." Market values for raw materials are based on current cost and, for other inventory classifications, net realizable value. Inventories are evaluated regularly for salability, and slow moving and/or obsolete items are adjusted to expected salable value. Inventory values include direct and certain indirect costs of materials and production. Abnormal costs of production are expensed as incurred.
Properties and Equipment Properties and equipment are stated at cost. Depreciation of properties and equipment is generally computed using the straight-line method over the estimated useful life of the asset. Estimated useful lives range from 20 to 40 years for buildings, 3 to 7 years for information technology equipment, 3 to 10 years for machinery and equipment and 5 to 10 years for furniture and fixtures. Interest is capitalized in connection with major project expenditures. Fully depreciated assets are retained in properties and equipment and related accumulated depreciation accounts until they are removed from service. In the case of disposals, assets and related accumulated depreciation are removed from the accounts and the net amount, less any proceeds from disposal, is charged or credited to earnings. Obligations for costs associated with asset retirements, such as requirements to restore a site to its original condition, are accrued at net present value and amortized along with the related asset. Grace reviews long-lived assets for impairment whenever events or changes in circumstances indicate that the carrying amount of an asset may not be fully recoverable.
Goodwill Goodwill arises from certain business combinations. Grace reviews its goodwill for impairment on an annual basis at November 30 and whenever events or changes in circumstances indicate that the carrying amount may not be fully recoverable. Recoverability is assessed at the reporting unit level most directly associated with the business combination that generated the goodwill. For the purpose of measuring impairment under the provisions of ASC 350, Grace has identified its reporting units as the product groups at one level below its operating segments. Grace has evaluated its goodwill annually with no impairment charge required in any of the periods presented.
Income Taxes Deferred tax assets and liabilities are recognized with respect to the expected future tax consequences of events that have been recorded in the Consolidated Financial Statements. If it is more likely than not that all or a portion of deferred tax assets will not be realized, a valuation allowance is provided against such deferred tax assets. The assessment of realization of deferred tax assets is performed under scenarios of future taxable income and tax planning alternatives that are considered reasonable in the circumstances.
F-12
Notes to Consolidated Financial Statements (Continued)
1. Basis of Presentation and Summary of Significant Accounting and Financial Reporting Policies (Continued)
We record a liability for income tax contingencies when it is more likely than not that a tax position we have taken will not be sustained upon audit. We evaluate such likelihood based on relevant facts and tax law. We adjust our recorded liability for income tax matters due to changes in circumstances or new uncertainties, such as amendments to existing tax law. Our ultimate tax liability depends upon many factors, including negotiations with taxing authorities in the jurisdictions in which we operate, outcomes of tax litigation, and resolution of disputes arising from federal, state, and foreign tax audits. Due to the varying tax laws in each jurisdiction senior management, with the assistance of local tax advisors as necessary, assesses individual matters in each jurisdiction on a case-by-case basis. We research and evaluate our income tax positions, including why we believe they are compliant with income tax regulations, and these positions are documented internally.
Tax benefits from an uncertain tax position are recognized only if it is more likely than not that the tax position will be sustained upon examination by the taxing authorities based on the technical merits of the position. Tax benefits recognized in the financial statements from such a position are measured based on the largest benefit that has a greater than fifty percent likelihood of being realized upon ultimate settlement.
Currency Translation Assets and liabilities of foreign subsidiaries (other than those located in countries with highly inflationary economies) are translated into U.S. dollars at current exchange rates, while revenues, costs and expenses are translated at average exchange rates during each reporting period. The resulting translation adjustments are included in the "accumulated other comprehensive income (loss)" caption of the Consolidated Balance Sheets. The financial statements of any subsidiaries located in countries with highly inflationary economies are remeasured as if the functional currency were the U.S. dollar; the remeasurement creates translation adjustments that are reflected in net income in the Consolidated Statements of Operations.
Financial Instruments Grace uses commodity forward, swap and/or option contracts and currency forward and/or option contracts to manage exposure to fluctuations in commodity prices and currency exchange rates. Grace does not hold or issue derivative financial instruments for trading purposes. Derivative instruments are recorded in the Consolidated Balance Sheets as either assets or liabilities at their fair value. For derivative instruments designated as fair value hedges, changes in the fair values of the derivative instruments closely offset changes in the fair values of the hedged items in other income (expense) in the Consolidated Statements of Operations. For derivative instruments designated as cash flow hedges, if the derivative instruments qualify for hedge accounting pursuant to ASC 815, "Derivatives and Hedging", the effective portion of any hedge is reported as accumulated other comprehensive income (loss) in the Consolidated Balance Sheets until it is cleared to earnings during the same period in which the hedged item affects earnings. The ineffective portion of all hedges, and changes in the fair values of derivative instruments that are not designated as hedges, are recorded in current period earnings. Cash flows from derivative instruments are reported in the same category as the cash flows from the items being hedged.
Effect of New Accounting Standards—In June 2009, the Financial Accounting Standards Board ("FASB") issued FASB Accounting Standards Codification ("ASC") No. 105 and the Hierarchy of Generally Accepted Accounting Principles which is effective for financial statements issued for interim and annual periods ending after September 15, 2009. The Codification does not change current U.S. GAAP, but is intended to simplify user access by providing all of the authoritative literature related to a particular topic in one place, and as of the effective date, all existing United
F-13
Notes to Consolidated Financial Statements (Continued)
1. Basis of Presentation and Summary of Significant Accounting and Financial Reporting Policies (Continued)
States accounting standard documents were superseded. Grace has included the references to the Codification, as appropriate, in these financial statements.
In June 2009, the FASB issued SFAS No. 167, "Amendments to FASB Interpretation No. 46(R)." The objective of this Statement is to improve financial reporting by enterprises involved with variable interest entities. The Statement is effective as of the beginning of each reporting entity's first annual reporting period that begins after November 15, 2009, for interim periods within that first annual reporting period, and for interim and annual reporting periods thereafter. Grace will adopt this standard in 2010 and does not expect it to have a material effect on its Consolidated Financial Statements.
In May 2009, the FASB issued SFAS No. 165, "Subsequent Events", which was subsequently codified as ASC 855. The objective of this Statement is to establish general standards of accounting for and disclosure of events that occur after the balance sheet date but before financial statements are issued or are available to be issued. This Statement is effective for interim or annual financial periods ending after June 15, 2009. Grace has adopted this Standard in 2009. ASC 855 requires that public entities evaluate subsequent events through the date that the financial statements are issued. We have evaluated subsequent events through the time of filing these financial statements with the SEC on February 25, 2010.
In April 2009, the FASB issued FASB Staff Position ("FSP") No. FAS 107-1 and APB 28-1, "Interim Disclosures about Fair Value of Financial Instruments", which was subsequently codified as ASC 825. ASC 825 amends FASB Statement No. 107 (subsequently codified ASC 825), Disclosures about Fair Value of Financial Instruments, to require disclosures about fair value of financial instruments for interim reporting periods of publicly traded companies as well as for annual financial statements. ASC 825 also amends APB Opinion No. 28 (subsequently codified as ASC 270), Interim Financial Reporting, to require those disclosures in summarized financial information at interim reporting periods. ASC 825 is effective for interim reporting periods ending after June 15, 2009. Grace has adopted this standard in 2009.
In April 2009, the FASB issued FSP No. FAS 115-2 and FAS 124-2, "Recognition and Presentation of Other-Than-Temporary Impairments", which was subsequently codified as ASC 320. ASC 320 changed the method for determining whether an other-than-temporary impairment exists for debt securities and the amount of an impairment charge to be recorded in earnings. ASC 320 is effective for interim and annual periods ending after June 15, 2009. Grace has adopted this standard in 2009.
In December 2007, the FASB issued SFAS No. 141(R), "Business Combinations", which was subsequently codified as ASC 805. ASC 805 requires the acquirer in a business combination to recognize the assets acquired, the liabilities assumed, and any noncontrolling interest in the acquiree at the acquisition date, measured at their fair values as of that date, with acquisition-related costs recognized separately from the acquisition. In March 2009, the FASB issued FSP No. FAS 141(R)-1, "Accounting for Assets Acquired and Liabilities Assumed in a Business Combination That Arise from Contingencies", which was subsequently codified as ASC 805. This standard addresses application issues on initial recognition and measurement, subsequent measurement and accounting, and disclosure of assets and liabilities arising from contingencies in a business combination. This standard is effective for assets or liabilities arising from contingencies in business combinations for
F-14
Notes to Consolidated Financial Statements (Continued)
1. Basis of Presentation and Summary of Significant Accounting and Financial Reporting Policies (Continued)
which the acquisition date is on or after the beginning of the first annual reporting period beginning on or after December 15, 2008. Grace has adopted this standard in 2009.
In December 2007, the FASB issued SFAS No. 160, "Noncontrolling Interests in Consolidated Financial Statements"' which was subsequently codified as ASC 810. ASC 810 establishes new accounting and reporting standards for the noncontrolling interest in a subsidiary and for the deconsolidation of a subsidiary. ASC 810 is effective for fiscal years beginning on or after December 15, 2008. Grace has adopted this standard, and has modified its Consolidated Financial Statements where applicable.
In September 2006, the FASB issued SFAS No. 157, "Fair Value Measurements", which was subsequently codified as ASC 820. ASC 820 defines fair value, establishes a framework for measuring fair value, and expands disclosures about fair value measurements. In February 2008, the FASB delayed the effective date of ASC 820 for all non-financial assets and non-financial liabilities, except for items that are recognized or disclosed at fair value in the financial statements on a recurring basis (at least annually), until fiscal years beginning after November 15, 2008. Grace adopted ASC 820 in the first quarter of 2008 for its financial assets and liabilities, and the adoption did not have a material impact on its Consolidated Financial Statements. Grace adopted ASC 820 in 2009 for its non-financial assets and non-financial liabilities, and the adoption did not have a material impact on its Consolidated Financial Statements. In April 2009, the FASB issued FSP No. FAS 157-4 "Determining Fair Value When the Volume and Level of Activity for the Asset or Liability Have Significantly Decreased and Identifying Transactions That Are Not Orderly", which was subsequently codified as ASC 820. This standard provides additional guidance and expands on the factors that should be considered in estimating fair value when there has been a significant decrease in market activity for a financial asset. This standard is effective for interim and annual periods ending after June 15, 2009, with early adoption permitted for periods ending after March 15, 2009. Grace has adopted this standard, and it has not had a material impact on its Consolidated Financial Statements. See Note 9 for further discussion of ASC 820.
2. Chapter 11 Information
Official Parties to Grace's Chapter 11 Cases Three creditors' committees, two representing asbestos claimants, the Official Committee of Asbestos Personal Injury Claimants (the "PI Committee") and the Official Committee of Asbestos Property Damage Claimants (the "PD Committee"), and the third representing other unsecured creditors, and the Official Committee of Equity Security Holders (the "Equity Committee"), have been appointed in the Chapter 11 Cases. These committees, a legal representative of future asbestos personal injury claimants (the "PI FCR") and a legal representative of future asbestos property damage claimants (the "PD FCR"), have the right to be heard on all matters that come before the Bankruptcy Court and have important roles in the Chapter 11 Cases. The Debtors are required to bear certain costs and expenses of the committees and the representatives of future asbestos claimants, including those of their counsel and financial advisors.
As discussed below, the Debtors, the Equity Committee, the PI Committee and the PI FCR have filed a joint plan of reorganization, subsequently amended, with the Bankruptcy Court that is designed to address all pending and future asbestos-related claims and all other pre-petition claims
F-15
Notes to Consolidated Financial Statements (Continued)
2. Chapter 11 Information (Continued)
as outlined therein. The committee representing general unsecured creditors, the PD Committee and the PD FCR are not co-proponents of this joint plan.
Plans of Reorganization On November 13, 2004, Grace filed a proposed plan of reorganization, as well as several associated documents, including a disclosure statement, trust distribution procedures, exhibits and other supporting documents, with the Bankruptcy Court. On January 13, 2005, Grace filed an amended plan of reorganization (the "Prior Plan") and related documents to address certain objections of creditors and other interested parties. At the time it was filed, the Prior Plan was supported by the committee representing general unsecured creditors and the Equity Committee, but was not supported by the PI Committee, the PD Committee or the PI FCR. At the time of filing of the Prior Plan, the PD FCR had not been appointed.
On July 26, 2007, the Bankruptcy Court terminated Grace's exclusive rights to propose a plan of reorganization and solicit votes thereon. As a result of the termination of these rights, any party-in-interest may propose a competing plan of reorganization. On November 5, 2007, the PI Committee and the PI FCR filed a proposed plan of reorganization (the "PI Plan") with the Bankruptcy Court.
On April 6, 2008, the Debtors reached an agreement in principle with the PI Committee, the PI FCR, and the Equity Committee designed to resolve all present and future asbestos-related personal injury claims (the "PI Settlement").
Prior to the PI Settlement, the Bankruptcy Court entered a case management order for estimating liability for pending and future asbestos personal injury claims. A trial for estimating liability for such claims began in January 2008 but was suspended in April 2008 as a result of the PI Settlement.
As contemplated by the PI Settlement, on September 19, 2008, the Debtors, supported by the Equity Committee, the PI Committee and the PI FCR, as co-proponents, filed a joint plan of reorganization with the Bankruptcy Court to reflect the terms of the PI Settlement.
On October 17, 2008, the Ontario Superior Court of Justice, in the Grace Canada, Inc. proceeding pending under the Companies' Creditors Arrangement Act, approved an agreement (the "Minutes of Settlement"), entered into by the Company, Grace Canada, Inc. and legal representatives of Canadian ZAI property damage claimants on September 2, 2008, that would settle all Canadian ZAI property damage claims and demands. Under the Minutes of Settlement, all Canadian ZAI property damage claims and demands would be paid through a separate Canadian ZAI property damage claims fund of CDN$6.5 million. The Minutes of Settlement were subject to the confirmation and effectiveness of the Joint Plan (as defined below). Because the Bankruptcy Court did not issue a confirmation order with respect to the Joint Plan by October 31, 2009, the Minutes of Settlement became null and void according to their terms. On November 16, 2009, Grace entered into the Amended and Restated Canadian ZAI Minutes of Settlement (the "Amended Settlement"). The Amended Settlement retains the basic structure of the prior settlement, but requires the Debtors to fund the Canadian ZAI property damage claims fund with CDN$8.2 million or CDN$8.7 million, depending on when the Bankruptcy Court's confirmation order is issued. The Ontario Superior Court of Justice approved the Amended Settlement on December 13, 2009. The Crown has filed objections to the terms of the Joint Plan based on the provisions of, and their treatment under, the Amended Settlement. The Bankruptcy Court is considering those confirmation objections. The effectiveness of the Amended Settlement also is subject to the approval of the Bankruptcy Court.
F-16
Notes to Consolidated Financial Statements (Continued)
2. Chapter 11 Information (Continued)
On November 21, 2008, the Debtors reached an agreement in principle (the "ZAI PD Term Sheet") with the Putative Class Counsel to the U.S. ZAI claimants, the PD FCR, and the Equity Committee designed to resolve all present and future U.S. ZAI property damage claims and demands as described below.
As contemplated by the PI Settlement and the ZAI PD Term Sheet, the Debtors, supported by the Equity Committee, the PI Committee and the PI FCR, as co-proponents, amended the joint plan of reorganization and several associated documents, including a disclosure statement, trust distribution procedures, exhibits and other supporting documents on December 18, 2008, February 3, 2009 and February 27, 2009 through filings with the Bankruptcy Court. The Debtors and co-proponents filed technical modifications to the joint plan and certain exhibits on September 4, 2009, October 12, 2009, and December 16, 2009. The joint plan of reorganization (as amended and modified, the "Joint Plan") is designed to address all pending and future asbestos-related claims and all other pre-petition claims as outlined therein. The Joint Plan supersedes the Prior Plan and the PI Plan.
Under the Joint Plan, two asbestos trusts would be established under Section 524(g) of the Bankruptcy Code. All asbestos-related personal injury claims would be channeled for resolution to one asbestos trust (the "PI Trust") and all asbestos-related property damage claims, including U.S and Canadian ZAI property damage claims, would be channeled to a separate asbestos trust (the "PD Trust").
The Joint Plan assumes that Cryovac, Inc. ("Cryovac"), a wholly-owned subsidiary of Sealed Air Corporation ("Sealed Air"), will fund the PI Trust and the PD Trust with an aggregate of: (i) $512.5 million in cash (plus interest at 5.5% compounded annually from December 21, 2002); and (ii) 18 million shares (reflecting a two-for-one stock split) of common stock of Sealed Air, pursuant to the terms of a settlement agreement resolving asbestos-related, successor liability and fraudulent transfer claims against Sealed Air and Cryovac, as further described below (the "Sealed Air Settlement"). The value of the Sealed Air Settlement changes daily with the accrual of interest and the trading value of Sealed Air common stock. The Joint Plan also assumes that Fresenius AG ("Fresenius") will fund the PI Trust and the PD Trust with an aggregate of $115.0 million pursuant to the terms of a settlement agreement resolving asbestos-related, successor liability and fraudulent transfer claims against Fresenius, as further described below (the "Fresenius Settlement"). The Sealed Air Settlement and the Fresenius Settlement have been approved by the Bankruptcy Court but remain subject to the fulfillment of specified conditions.
Any plan of reorganization, including the Joint Plan and any plan of reorganization that may be filed in the future by a party-in-interest, will become effective only after a vote of eligible creditors and with the approval of the Bankruptcy Court and the U.S. District Court for the District of Delaware (the "District Court"). On March 9, 2009, the Bankruptcy Court approved the disclosure statement associated with the Joint Plan. On March 31, 2009, Grace distributed the Joint Plan, exhibits and disclosure statement along with voting materials to all creditors entitled to vote on the Joint Plan. The Bankruptcy Court required all creditors eligible to vote on the Joint Plan to submit their votes, and all parties-in-interest who object to the Joint Plan to submit their objections, by May 20, 2009. All classes of creditors entitled to vote accepted the Joint Plan. The class of general unsecured creditors, who voted on a provisional basis pending a determination by the Bankruptcy Court as to whether the class is impaired and therefore entitled to a vote, voted to reject the Joint Plan. The objections filed generally relate to demands for interest at rates higher than provided for in the Joint
F-17
Notes to Consolidated Financial Statements (Continued)
2. Chapter 11 Information (Continued)
Plan, assertions that the Joint Plan may impair insurers' contractual rights, assertions that the Joint Plan discriminates against Libby, Montana personal injury claimants and the classification and treatment of claims under the Joint Plan.
Hearings to determine whether the Bankruptcy Court will approve the Joint Plan were held on June 22-23, 2009, September 8-17, 2009, and October 13-14, 2009. The parties submitted post-hearing briefs in November and December 2009. Closing arguments on confirmation of the Joint Plan were held on January 4-6, 2010 and January 25, 2010.
Grace believes that the Joint Plan complies with the requirements for confirmation under the Bankruptcy Code and Grace intends to vigorously defend the Joint Plan against these and all other objections. If certain objections were resolved adversely to Grace and the other Joint Plan proponents, or if rulings by the Bankruptcy Court resolving certain objections favorably to the Joint Plan proponents were appealed, certain conditions to the Joint Plan, including for example, payments pursuant to the Sealed Air Settlement and the Fresenius Settlement, might not be satisfied and potential lenders might not be willing to provide the new financing that Grace requires to fund the Joint Plan. The resolution of these objections and any related appeals could have a material effect on the terms and timing of Grace's emergence from Chapter 11.
The Joint Plan is designed to address all pending and future asbestos-related claims and demands and all other pre-petition claims as outlined respectively therein. However, it is possible that the Joint Plan will not be confirmed by the Bankruptcy Court, or become effective if it is confirmed. If the Joint Plan is not confirmed by the Bankruptcy Court or the District Court or does not become effective, the Debtors would expect to resume the estimation trial, which was suspended in April 2008 due to the PI Settlement, to determine the amount of its asbestos-related liabilities. Under those circumstances, a different plan of reorganization may ultimately be confirmed and become effective. Under a different plan of reorganization, the interests of holders of Company common stock could be substantially diluted or cancelled. The value of Company common stock following the effective date of any plan of reorganization and the extent of any recovery by non-asbestos-related creditors would depend principally on the amount of Debtors' asbestos-related liability under such effective plan of reorganization.
Joint Plan of Reorganization Under the terms of the Joint Plan, claims under the Chapter 11 Cases would be satisfied as follows:
Asbestos-Related Personal Injury Claims
All pending and future asbestos-related personal injury claims and demands ("PI Claims") would be channeled to the PI Trust for resolution. The PI Trust would use specified trust distribution procedures to satisfy allowed PI Claims.
The PI Trust would be funded with:
- •
- $250 million in cash plus interest thereon from January 1, 2009 to the effective date of the Joint Plan to
be paid by Grace;
- •
- Cash in the amount of the PD Initial Payment (as described below) and the ZAI Initial Payment (as described below) to be
paid by Grace;
- •
- A warrant to acquire 10 million shares of Company common stock at an exercise price of $17.00 per share, expiring one year from the effective date of the Joint Plan;
F-18
Notes to Consolidated Financial Statements (Continued)
2. Chapter 11 Information (Continued)
- •
- Rights to all proceeds under all of the Debtors' insurance policies that are available for payment of PI Claims;
- •
- Cash in the amount of $512.5 million plus interest thereon from December 21, 2002 to the effective date of
the Joint Plan at a rate of 5.5% per annum to be paid by Cryovac reduced by the amount of Cryovac's contribution to the PD Initial Payment and the ZAI Initial Payment (as described below) and
18 million shares of Sealed Air common stock to be paid by Cryovac pursuant to the Sealed Air Settlement;
- •
- Cash in the amount of $115 million to be paid by Fresenius pursuant to the Fresenius Settlement reduced by the
amount of Fresenius' contribution to the PD Initial Payment and ZAI Initial Payment (as described below); and
- •
- Deferred payments by Grace of $110 million per year for five years beginning in 2019, and $100 million per year for 10 years beginning in 2024, that would be subordinate to any bank debt or bonds outstanding, guaranteed by the Company and secured by the Company's obligation to issue 50.1% of its outstanding common stock (measured as of the effective date of the Joint Plan) to the PI Trust in the event of default.
Asbestos-Related Property Damage Claims
All pending and future asbestos-related property damage claims and demands ("PD Claims") would be channeled to the PD Trust for resolution. The PD Trust would contribute CDN$8.2 million or CDN$8.7 million (depending on when the Bankruptcy Court' confirmation order is issued) to a separate Canadian ZAI PD Claims fund through which Canadian ZAI PD Claims would be resolved. The PD Trust would generally resolve U.S. ZAI PD Claims that qualify for payment by paying 55% of the claimed amount, but in no event would the PD Trust pay more per claim than 55% of $7,500 (as adjusted for inflation each year after the fifth anniversary of the effective date of the Joint Plan). The PD Trust would satisfy other allowed PD Claims pursuant to specified trust distribution procedures with cash payments in the allowed settlement amount. Unresolved PD Claims and future PD claims would be litigated pursuant to procedures to be approved by the Bankruptcy Court and, to the extent such claims were determined to be allowed claims, would be paid in cash by the PD Trust in the amount determined by the Bankruptcy Court.
The PD Trust would contain two accounts, the PD account and the ZAI PD account. U.S. ZAI PD Claims would be paid from the ZAI PD account and other PD Claims would be paid from the PD account. The separate Canadian ZAI PD Claims would be paid by a separate fund established in Canada. Each account would have a separate trustee and the assets of the accounts would not be commingled. The two accounts would be funded as follows:
The PD account would be funded with:
- •
- Approximately $147 million in cash plus cash in the amount of the estimated first six months of PD Trust expenses,
to be paid by Cryovac and Fresenius (the "PD Initial Payment"), and either CDN$8.2 million or CDN$8.7 million in cash to be paid by Grace pursuant to the Amended Settlement.
- •
- A Grace obligation (the "PD Obligation") providing for a payment to the PD Trust every six months in the amount of the non-ZAI PD Claims allowed during the preceding six months plus interest and, except for the first six months, the amount of PD Trust expenses for the
F-19
Notes to Consolidated Financial Statements (Continued)
2. Chapter 11 Information (Continued)
preceding six months. The aggregate amount to be paid under the PD Obligation would not be capped.
The ZAI PD account would be funded as follows (the "ZAI Assets"):
- •
- $30 million in cash plus interest from April 1, 2009 to the effective date, to be paid by Cryovac and
Fresenius (the "ZAI Initial Payment").
- •
- $30 million in cash on the third anniversary of the effective date of the Joint Plan, to be paid by
Grace.
- •
- A Grace obligation providing for the payment of up to 10 contingent deferred payments of $8 million per year during the 20-year period beginning on the fifth anniversary of the effective date of the Joint Plan, with each such payment due only if the ZAI Assets fall below $10 million during the preceding year.
All payments to the PD Trust that were not to be paid on the effective date of the Joint Plan would be secured by the Company's obligation to issue 50.1% of its outstanding common stock (measured as of the effective date of the Joint Plan) to the PD Trust in the event of default. Grace would have the right to conduct annual audits of the books, records and claim processing procedures of the PD Trust.
Other Claims
All allowed administrative claims would be paid in cash and all allowed priority claims would be paid in cash with interest. Secured claims would be paid in cash with interest or by reinstatement. Allowed general unsecured claims would be paid in cash, including any post-petition interest as follows: (i) for holders of pre-petition bank credit facilities, post-petition interest at the rate of 6.09% from the Filing Date through December 31, 2005 and thereafter at floating prime, in each case compounded quarterly; and (ii) for all other unsecured claims that are not subject to a settlement agreement providing otherwise, interest at 4.19% from the Filing Date, compounded annually, or if pursuant to an existing contract, interest at the non-default contract rate. The general unsecured creditors that hold pre-petition bank debt have asserted that they are entitled to post-petition interest at the default rate specified under the terms of the underlying credit agreements which, if paid, would be approximately $100 million. Grace has asserted that such creditors are not entitled to interest at the default rate and has requested the Bankruptcy Court to determine the appropriate rate at which interest would be payable. Unsecured employee-related claims such as pension, retirement medical obligations and workers compensation claims, would be reinstated.
Effect on Company Common Stock
The Joint Plan assumes that Company common stock will remain outstanding at the effective date of the Joint Plan, but that the interests of existing shareholders would be subject to dilution by additional shares of Company common stock issued under the warrant or in the event of default in respect of the deferred payment obligations to the PI Trust or the PD Trust under the Company's security obligation.
F-20
Notes to Consolidated Financial Statements (Continued)
2. Chapter 11 Information (Continued)
In order to preserve significant tax benefits which are subject to elimination or limitation in the event of a change in control (as defined by the Internal Revenue Code) of Grace, the Joint Plan provides that under certain circumstances, the Board of Directors would have the authority to impose restrictions on the transfer of Grace stock with respect to certain 5% shareholders. These restrictions will generally not limit the ability of a person that holds less than 5% of Grace stock after emergence to either buy or sell stock on the open market. In addition, the Bankruptcy Court has approved trading restrictions on Grace common stock until the effective date of a plan of reorganization. These restrictions prohibit (without the consent of Grace) a person from acquiring more than 4.75% of the outstanding Grace common stock or, for any person already holding more than 4.75%, from increasing such person's holdings. This summary of the stock transfer restrictions does not purport to be complete and is qualified in its entirety by reference to the order of the Bankruptcy Court, which has been filed with the SEC.
Claims Filings The Bankruptcy Court established a bar date of March 31, 2003 for claims of general unsecured creditors, PD Claims (other than ZAI PD Claims) and medical monitoring claims related to asbestos. The bar date did not apply to PI Claims or claims related to ZAI PD Claims.
Approximately 14,900 proofs of claim were filed by the March 31, 2003 bar date. Of these claims, approximately 9,400 were non-asbestos related, approximately 4,300 were PD Claims, and approximately 1,000 were for medical monitoring. The medical monitoring claims were made by individuals who allege exposure to asbestos through Grace's products or operations. Under the Joint Plan, these claims would be channeled to the PI Trust for resolution. In addition, approximately 800 proofs of claim were filed after the bar date.
Approximately 7,000 of the non-asbestos related claims involve claims by employees or former employees for future retirement benefits such as pension and retiree medical coverage. Pursuant to certain orders entered by the Bankruptcy Court, upon commencement of the chapter 11 cases, Grace received permission to continue to honor and pay its obligations under its various employee benefit programs other than certain voluntary supplemental pension program benefits. Grace has continued to pay its obligations under its various employee benefit programs during the chapter 11 cases and intends to do so for the remainder of the chapter 11 cases and thereafter. Pursuant to the Joint Plan, Grace is assuming its obligations under the Grace benefit programs and will continue to pay all such obligations pursuant to the terms and conditions of the applicable Grace benefit programs. As a result, the bankruptcy court has approved a motion filed by Grace approving a protocol by which the filed employee related claims would be disallowed.
The remaining non-asbestos claims include claims for payment of goods and services, taxes, product warranties, principal and interest under pre-petition credit facilities, amounts due under leases and other contracts, leases and other executory contracts rejected in the Chapter 11 Cases, environmental remediation, pending non-asbestos-related litigation, and non-asbestos-related personal injury. The Debtors analyzed the claims filed pursuant to the March 31, 2003 bar date and found that many are duplicates, represent the same claim filed against more than one of the Debtors, lack any supporting documentation, or provide insufficient supporting documentation. As of December 31, 2009, of the approximately 4,335 non-ZAI PD Claims filed, approximately 395 claims have been resolved, approximately 3,905 claims have been expunged, reclassified by the Debtors or withdrawn by claimants, leaving approximately 35 claims to be addressed through the property damage case management order approved by the Bankruptcy Court and/or the Joint Plan or another plan of reorganization. The claims remaining to be addressed include 16 asbestos property damage
F-21
Notes to Consolidated Financial Statements (Continued)
2. Chapter 11 Information (Continued)
claims that had been expunged by a bankruptcy court order that was reversed by an order of the District Court on September 29, 2009. As of December 31, 2009, of the approximately 3,290 non-asbestos claims filed, approximately 1,910 have been expunged or withdrawn by claimants, approximately 1,175 have been resolved, and an additional approximately 210 claims are to be addressed through the claim objection process and the dispute resolution procedures approved by the Bankruptcy Court.
Additionally, by order dated June 17, 2008, the Bankruptcy Court established October 31, 2008 as the bar date for ZAI PD Claims related to property located in the U.S. As of December 31, 2009, approximately 19,260 US ZAI PD Claims have been filed. In addition, on October 21, 2008, the Bankruptcy Court entered an order establishing August 31, 2009 as the bar date for ZAI PD Claims related to property located in Canada. Under the Amended Settlement, notwithstanding the Canadian ZAI PD Claims Bar Date of August 31, 2009, all Canadian ZAI PD Claimants who have filed a proof of claim by December 31, 2009, shall be entitled to seek compensation from the Canadian ZAI PD Claims Fund to be established pursuant to the Amended Settlement. As of December 31, 2009, approximately 14,100 Canadian ZAI PD Claims have been filed. The Joint Plan provides for the channeling of US ZAI PD Claims and Canadian ZAI PD Claims to the Asbestos PD Trust created under the Joint Plan, and the subsequent transfer of Canadian ZAI PD Claims to a Canadian fund. No bar date has been set for personal injury claims related to ZAI. The Joint Plan provides that ZAI PI Claims would be channeled to the Asbestos PI Trust created under the Joint Plan.
Grace is continuing to analyze and review unresolved claims in relation to the Joint Plan. Grace believes that its recorded liabilities for claims subject to the March 31, 2003 bar date represent a reasonable estimate of the ultimate allowable amount for claims that are not in dispute or have been submitted with sufficient information to both evaluate the merit and estimate the value of the claim. The PD Claims are considered as part of Grace's overall asbestos liability and are being accounted for in accordance with the conditions precedent under the Prior Plan, as described in Note 3.
Debt Capital All of the Debtors' pre-petition debt is in default due to the Filing. The accompanying Consolidated Balance Sheets reflect the classification of the Debtors' pre-petition debt within "liabilities subject to compromise."
The Debtors have entered into a debtor-in-possession post-petition loan and security agreement, or DIP facility, with a syndicate of lenders that provides for up to $165 million of revolving loans and face amount of letters of credit. The DIP facility is secured by a priority lien on substantially all assets of the Debtors with the exclusion of the capital stock of non-U.S. subsidiaries, and bears interest based on LIBOR. On February 16, 2010, the Bankruptcy Court granted Grace authority to terminate the DIP facility and replace it with a $100 million cash-collateralized letter of credit facility with a commercial bank to support current outstanding and new letters of credit.
Accounting Impact The accompanying Consolidated Financial Statements have been prepared in accordance with FASB Accounting Standards Codification 852 ("ASC 852"), "Financial Reporting by Entities in Reorganization Under the Bankruptcy Code". ASC 852 requires that financial statements of debtors-in-possession be prepared on a going concern basis, which contemplates continuity of operations and realization of assets and liquidation of liabilities in the ordinary course of business. However, as a result of the Filing, the realization of certain of the Debtors' assets and the liquidation of certain of the Debtors' liabilities are subject to significant uncertainty. While operating as debtors-in-possession, the Debtors may sell or otherwise dispose of
F-22
Notes to Consolidated Financial Statements (Continued)
2. Chapter 11 Information (Continued)
assets and liquidate or settle liabilities for amounts other than those reflected in the Consolidated Financial Statements. Further, the ultimate plan of reorganization could materially change the amounts and classifications reported in the Consolidated Financial Statements.
Pursuant to ASC 852, Grace's pre-petition and future liabilities that are subject to compromise are required to be reported separately on the balance sheet at an estimate of the amount that will ultimately be allowed by the Bankruptcy Court. As of December 31, 2009, such pre-petition liabilities include fixed obligations (such as debt and contractual commitments), as well as estimates of costs related to contingent liabilities (such as asbestos-related litigation, environmental remediation and other claims). Obligations of Grace subsidiaries not covered by the Filing continue to be classified on the Consolidated Balance Sheets based upon maturity dates or the expected dates of payment. ASC 852 also requires separate reporting of certain expenses, realized gains and losses, and provisions for losses related to the Filing as reorganization items. Grace presents reorganization items as "Chapter 11 expenses, net of interest income," a separate caption in its Consolidated Statements of Operations.
As discussed in Note 3, Grace has not adjusted its accounting for asbestos-related assets or liabilities to reflect the Joint Plan.
Grace has not recorded the benefit of any assets that may be available to fund asbestos-related and other liabilities under the Fresenius Settlement and the Sealed Air Settlement, as under the Joint Plan, these assets will be transferred to the PI Trust and the PD Trust. The estimated fair value available under the Fresenius Settlement and the Sealed Air Settlement as measured at December 31, 2009, was $1,255.3 million comprised of $115.0 million in cash from Fresenius and $1,140.3 million in cash and stock from Cryovac under the Joint Plan. Payments under the Sealed Air Settlement will be made directly to the PI Trust and the PD Trust by Cryovac.
Grace's Consolidated Balance Sheets separately identify the liabilities that are "subject to compromise" as a result of the Chapter 11 proceedings. In Grace's case, "liabilities subject to compromise" represent both pre-petition and future liabilities as determined under U.S. GAAP. Changes to pre-petition liabilities subsequent to the Filing Date reflect: (1) cash payments under approved court orders; (2) the terms of the Prior Plan, as discussed above and in Note 3, including the accrual of interest on pre-petition debt and other fixed obligations; (3) accruals for employee-related programs; and (4) changes in estimates related to other pre-petition contingent liabilities. The accounting for the asbestos-related liability component of "liabilities subject to compromise" is described in Note 3.
F-23
Notes to Consolidated Financial Statements (Continued)
2. Chapter 11 Information (Continued)
Components of liabilities subject to compromise are as follows:
| |
December 31, 2009 |
December 31, 2008 |
Filing Date (Unaudited) |
|||||||
|---|---|---|---|---|---|---|---|---|---|---|
| |
(In millions) |
|||||||||
Pre-petition bank debt plus accrued interest |
$ | 850.6 | $ | 823.5 | $ | 511.5 | ||||
Drawn letters of credit plus accrued interest |
31.4 | 30.0 | — | |||||||
Asbestos-related contingencies |
1,700.0 | 1,700.0 | 1,002.8 | |||||||
Income tax contingencies |
117.9 | 121.0 | 242.1 | |||||||
Environmental contingencies |
148.4 | 152.2 | 164.8 | |||||||
Postretirement benefits other than pension |
69.3 | 73.2 | 185.4 | |||||||
Unfunded special pension arrangements |
111.0 | 106.0 | 70.8 | |||||||
Retained obligations of divested businesses |
29.1 | 29.8 | 43.5 | |||||||
Accounts payable |
31.2 | 31.2 | 43.0 | |||||||
Other accrued liabilities |
67.3 | 55.5 | 102.1 | |||||||
Reclassification to current liabilities(1) |
(9.1 | ) | (9.5 | ) | — | |||||
Total Liabilities Subject to Compromise |
$ | 3,147.1 | $ | 3,112.9 | $ | 2,366.0 | ||||
- (1)
- As of December 31, 2009 and 2008, approximately $9.1 million and $9.5 million, respectively, of certain pension and postretirement benefit obligations subject to compromise have been presented in other current liabilities in the Consolidated Balance Sheets in accordance with ASC 715.
Note that the unfunded special pension arrangements reflected above exclude non-U.S. pension plans and qualified U.S. pension plans that became underfunded subsequent to the Filing. Contributions to qualified U.S. pension plans are subject to Bankruptcy Court approval.
F-24
Notes to Consolidated Financial Statements (Continued)
2. Chapter 11 Information (Continued)
Change in Liabilities Subject to Compromise
The following table is a reconciliation of the changes in pre-filing date liability balances for the period from the Filing Date through December 31, 2009.
| |
Cumulative Since Filing |
||||
|---|---|---|---|---|---|
| |
(In millions) (Unaudited) |
||||
Balance, Filing Date April 2, 2001 |
$ | 2,366.0 | |||
Cash disbursements and/or reclassifications under Bankruptcy Court orders: |
|||||
Payment of environmental settlement liability (see Note 13) |
(252.0 | ) | |||
Freight and distribution order |
(5.7 | ) | |||
Trade accounts payable order |
(9.1 | ) | |||
Resolution of contingencies subject to Chapter 11 |
(130.0 | ) | |||
Other court orders including employee wages and benefits, sales and use tax, and customer programs |
(333.2 | ) | |||
Expense/(income) items: |
|||||
Interest on pre-petition liabilities |
433.0 | ||||
Employee-related accruals |
79.2 | ||||
Provision for asbestos-related contingencies |
744.8 | ||||
Provision for environmental contingencies |
331.1 | ||||
Provision for income tax contingencies |
(42.2 | ) | |||
Balance sheet reclassifications |
(34.8 | ) | |||
Balance, end of period |
$ | 3,147.1 | |||
Additional liabilities subject to compromise may arise due to the rejection of executory contracts or unexpired leases, or as a result of the Bankruptcy Court's allowance of contingent or disputed claims.
For the holders of pre-petition bank credit facilities, beginning January 1, 2006, Grace agreed to pay interest on pre-petition bank debt at the prime rate, adjusted for periodic changes, and compounded quarterly. The effective rates for the twelve months ended December 31, 2009 and 2008 were 3.25% and 5.09%, respectively. From the Filing Date through December 31, 2005, Grace accrued interest on pre-petition bank debt at a negotiated fixed annual rate of 6.09%, compounded quarterly. The general unsecured creditors that hold pre-petition bank credit facilities have asserted that they are entitled to post-petition interest at the default rate specified under the terms of the underlying credit agreements which, if paid, would be approximately $100 million. Grace has asserted that such creditors are not entitled to interest at the default rate and has requested the Bankruptcy Court to determine the appropriate rate at which interest would be payable.
For the holders of claims who, but for the Filing, would be entitled under a contract or otherwise to accrue or be paid interest on such claim in a non-default (or non-overdue payment) situation under applicable non-bankruptcy law, Grace accrues interest at the rate provided in the contract between the Grace entity and the claimant or such rate as may otherwise apply under applicable non-bankruptcy law.
F-25
Notes to Consolidated Financial Statements (Continued)
2. Chapter 11 Information (Continued)
For all other holders of allowed general unsecured claims, Grace accrues interest at a rate of 4.19% per annum, compounded annually, unless otherwise negotiated during the claim settlement process.
Chapter 11 Expenses
| |
2009 | 2008 | 2007 | |||||||
|---|---|---|---|---|---|---|---|---|---|---|
| |
(In millions) |
|||||||||
Legal and financial advisory fees |
$ | 49.1 | $ | 63.6 | $ | 95.1 | ||||
Interest (income) expense |
(1.1 | ) | 2.2 | (8.7 | ) | |||||
Chapter 11 expenses, net of interest income |
$ | 48.0 | $ | 65.8 | $ | 86.4 | ||||
Pursuant to ASC 852, interest income earned on the Debtors' cash balances must be offset against Chapter 11 expenses. During 2008, interest income was reduced by a $6.0 million charge related to the change in fair value of investment securities held by the Debtors.
Condensed financial information of the Debtors
W. R. Grace & Co.—Chapter 11 Filing Entities
Debtor-in-Possession Statements of Operations
| |
Year Ended December 31, | |||||||||
|---|---|---|---|---|---|---|---|---|---|---|
| |
2009 | 2008 | 2007 | |||||||
| |
(In millions) (Unaudited) |
|||||||||
Net sales, including intercompany |
$ | 1,383.1 | $ | 1,559.6 | $ | 1,497.9 | ||||
Cost of goods sold, including intercompany, exclusive of depreciation and amortization shown separately below |
958.6 | 1,154.2 | 1,066.8 | |||||||
Selling, general and administrative expenses |
293.5 | 295.2 | 314.0 | |||||||
Restructuring expenses |
12.0 | 2.9 | — | |||||||
(Gains) loss on sales of product lines and gain related to the sale of interest in an unconsolidated affiliate |
(27.0 | ) | — | 1.0 | ||||||
Research and development expenses |
36.1 | 43.3 | 43.9 | |||||||
Depreciation and amortization |
55.9 | 57.1 | 55.5 | |||||||
Defined benefit pension expense |
69.4 | 37.4 | 38.8 | |||||||
Interest expense and related financing costs |
37.3 | 53.3 | 71.1 | |||||||
Provision for environmental remediation |
4.4 | 14.6 | 17.0 | |||||||
Chapter 11 expenses, net of interest income |
48.0 | 65.8 | 86.6 | |||||||
Other (income) expense, net |
(72.2 | ) | (118.5 | ) | (82.4 | ) | ||||
|
1,416.0 | 1,605.3 | 1,612.3 | |||||||
Loss before income taxes and equity in net income of non-filing entities |
(32.9 | ) | (45.7 | ) | (114.4 | ) | ||||
Benefit from (provision for) income taxes |
17.1 | 11.4 | 57.2 | |||||||
Loss before equity in net income of non-filing entities |
(15.8 | ) | (34.3 | ) | (57.2 | ) | ||||
Equity in net income of non-filing entities |
87.0 | 155.8 | 146.0 | |||||||
Net income attributable to W. R. Grace & Co. shareholders |
$ | 71.2 | $ | 121.5 | $ | 88.8 | ||||
F-26
Notes to Consolidated Financial Statements (Continued)
2. Chapter 11 Information (Continued)
Debtor-in-Possession Statements of Cash Flows
| |
Year Ended December 31, | ||||||||||
|---|---|---|---|---|---|---|---|---|---|---|---|
| |
2009 | 2008 | 2007 | ||||||||
| |
(In millions) (Unaudited) |
||||||||||
Operating Activities |
|||||||||||
Net income attributable to W. R. Grace & Co. shareholders |
$ | 71.2 | $ | 121.5 | $ | 88.8 | |||||
Reconciliation to net cash provided by (used for) operating activities: |
|||||||||||
Chapter 11 expenses, net of interest income |
48.0 | 65.8 | 86.6 | ||||||||
(Benefit from) provision for income taxes |
(17.1 | ) | (11.4 | ) | (57.2 | ) | |||||
Equity in net income of non-filing entities |
(87.0 | ) | (155.8 | ) | (146.0 | ) | |||||
Depreciation and amortization |
55.9 | 57.1 | 55.5 | ||||||||
Interest on pre-petition liabilities subject to compromise |
36.2 | 49.4 | 70.9 | ||||||||
Provision for environmental remediation |
4.4 | 14.6 | 17.0 | ||||||||
Other non-cash items, net |
(36.6 | ) | (17.1 | ) | (7.3 | ) | |||||
Contributions to defined benefit pension plans |
(43.1 | ) | (54.2 | ) | (81.1 | ) | |||||
Cash paid to resolve contingencies subject to Chapter 11 |
— | (252.0 | ) | (10.3 | ) | ||||||
Chapter 11 expenses paid |
(54.2 | ) | (69.3 | ) | (92.1 | ) | |||||
Restructuring expenses |
12.0 | 2.9 | — | ||||||||
Payments related to restructuring expenses |
(7.4 | ) | (1.8 | ) | — | ||||||
Repatriation of cash from foreign entities |
170.6 | — | — | ||||||||
Income taxes paid, net of refunds |
35.6 | 17.3 | (5.4 | ) | |||||||
Changes in other assets and liabilities, excluding the effect of businesses acquired/divested |
132.8 | 122.8 | 1.7 | ||||||||
Net cash provided by (used for) operating activities |
321.3 | (110.2 | ) | (78.9 | ) | ||||||
Investing Activities |
|||||||||||
Capital expenditures |
(51.6 | ) | (74.3 | ) | (86.3 | ) | |||||
Other |
198.2 | 188.5 | 100.8 | ||||||||
Net cash provided by investing activities |
146.6 | 114.2 | 14.5 | ||||||||
Net cash provided by (used for) financing activities |
(0.5 | ) | 7.3 | 37.4 | |||||||
Net increase (decrease) in cash and cash equivalents |
467.4 | 11.3 | (27.0 | ) | |||||||
Cash and cash equivalents, beginning of period |
218.1 | 206.8 | 233.8 | ||||||||
Cash and cash equivalents, end of period |
$ | 685.5 | $ | 218.1 | $ | 206.8 | |||||
F-27
Notes to Consolidated Financial Statements (Continued)
2. Chapter 11 Information (Continued)
W. R. Grace & Co.—Chapter 11 Filing Entities
Debtor-in-Possession Balance Sheets
| |
December 31, | ||||||
|---|---|---|---|---|---|---|---|
| |
2009 | 2008 | |||||
| |
(In millions) (Unaudited) |
||||||
ASSETS |
|||||||
Current Assets |
|||||||
Cash and cash equivalents |
$ | 685.5 | $ | 218.1 | |||
Investment securities |
— | 21.6 | |||||
Cash value of life insurance policies, net of policy loans |
— | 67.2 | |||||
Trade accounts receivable, net (including $16.9 from an unconsolidated affiliate) (2008-$0.0) |
91.5 | 115.0 | |||||
Receivables from non-filing entities, net |
64.5 | 69.9 | |||||
Inventories |
86.5 | 122.1 | |||||
Other current assets |
50.6 | 57.4 | |||||
Total Current Assets |
978.6 | 671.3 | |||||
Properties and equipment, net |
399.6 | 417.1 | |||||
Deferred income taxes |
808.5 | 834.4 | |||||
Asbestos-related insurance |
500.0 | 500.0 | |||||
Loans receivable from non-filing entities, net |
388.9 | 399.1 | |||||
Investment in non-filing entities |
254.0 | 492.0 | |||||
Overfunded defined benefit pension plans |
0.2 | 0.2 | |||||
Investment in unconsolidated affiliates |
45.7 | 0.9 | |||||
Other assets |
70.3 | 96.9 | |||||
Total Assets |
$ | 3,445.8 | $ | 3,411.9 | |||
LIABILITIES AND EQUITY (DEFICIT) |
|||||||
Liabilities Not Subject to Compromise |
|||||||
Current liabilities (including $2.1 due to an unconsolidated affiliate) (2008-$0.0) |
$ | 196.8 | $ | 239.5 | |||
Underfunded defined benefit pension plans |
359.6 | 380.6 | |||||
Other liabilities (including $10.5 due to an unconsolidated affiliate) (2008-$0.0) |
41.4 | 41.6 | |||||
Total Liabilities Not Subject to Compromise |
597.8 | 661.7 | |||||
Liabilities Subject to Compromise |
3,147.1 | 3,112.9 | |||||
Total Liabilities |
3,744.9 | 3,774.6 | |||||
Total W. R. Grace & Co. Shareholders' Equity (Deficit) |
(299.2 | ) | (426.9 | ) | |||
Noncontrolling interests in Chapter 11 filing entities |
0.1 | 64.2 | |||||
Total Equity (Deficit) |
(299.1 | ) | (362.7 | ) | |||
Total Liabilities and Equity (Deficit) |
$ | 3,445.8 | $ | 3,411.9 | |||
In addition to Grace's financial reporting obligations as prescribed by the SEC, the Debtors are also required, under the rules and regulations of the Bankruptcy Code, to periodically file certain statements and schedules and a monthly operating report with the Bankruptcy Court. This information is available to the public through the Bankruptcy Court. This information is prepared in a
F-28
Notes to Consolidated Financial Statements (Continued)
2. Chapter 11 Information (Continued)
format that may not be comparable to information in Grace's quarterly and annual financial statements as filed with the SEC. The monthly operating reports are not audited, do not purport to represent the financial position or results of operations of Grace on a consolidated basis, and should not be relied on for such purposes.
3. Asbestos-Related Litigation
Grace is a defendant in property damage and personal injury lawsuits relating to previously sold asbestos-containing products. As of the Filing Date, Grace was a defendant in 65,656 asbestos-related lawsuits, 17 involving claims for property damage (one of which has since been dismissed), and the remainder involving 129,191 claims for personal injury. Due to the Filing, holders of asbestos-related claims are stayed from continuing to prosecute pending litigation and from commencing new lawsuits against the Debtors. The PI and PD Committees, representing the interests of asbestos personal injury and asbestos property damage claimants, respectively, and the PI FCR and PD FCR, representing the interests of future asbestos personal injury and property damage claimants, respectively, have been appointed in the Chapter 11 Cases. Grace's obligations with respect to present and future claims will be determined through the Chapter 11 process.
Property Damage Litigation The plaintiffs in asbestos property damage lawsuits generally seek to have the defendants pay for the cost of removing, containing or repairing the asbestos-containing materials in the affected buildings. Various factors can affect the merit and value of PD Claims, including legal defenses, product identification, the amount and type of product involved, the age, type, size and use of the building, the legal status of the claimant, the jurisdictional history of prior cases, the court in which the case is pending, and the difficulty of asbestos abatement, if necessary.
Out of 380 asbestos property damage cases (which involved thousands of buildings) filed prior to the Filing Date, 140 were dismissed without payment of any damages or settlement amounts; judgments after trial were entered in favor of Grace in nine cases; judgments after trial were entered in favor of the plaintiffs in eight cases for a total of $86.1 million; 207 property damage cases were settled for a total of $696.8 million; and 16 cases remain outstanding (including the one on appeal). Of the 16 remaining cases, eight relate to ZAI and eight relate to a number of former asbestos-containing products (two of which also are alleged to involve ZAI).
Approximately 4,300 additional PD claims were filed prior to the March 31, 2003 claims bar date established by the Bankruptcy Court. (The bar date did not apply to ZAI claims.) Grace objected to virtually all PD claims on a number of different bases, including: no authorization to file a claim; the claim was previously settled or adjudicated; no or insufficient documentation; failure to identify a Grace product; the expiration of the applicable statute of limitations and/or statute of repose, and/or laches; and a defense that the product in place is not hazardous. As of December 31, 2009, following the reclassification, withdrawal or expungement of claims, approximately 430 PD Claims subject to the March 31, 2003 bar date remain outstanding. The Bankruptcy Court has approved settlement agreements covering approximately 375 of such claims for an aggregate allowed amount of $144 million.
Eight of the ZAI cases were filed as purported class action lawsuits in 2000 and 2001. In addition, 10 lawsuits were filed as purported class actions in 2004 and 2005 with respect to persons and homes in Canada. These cases seek damages and equitable relief, including the removal, replacement and/or disposal of all such insulation. The plaintiffs assert that this product is in millions
F-29
Notes to Consolidated Financial Statements (Continued)
3. Asbestos-Related Litigation (Continued)
of homes and that the cost of removal could be several thousand dollars per home. As a result of the Filing, the eight U.S. cases have been stayed.
Based on Grace's investigation of the claims described in these lawsuits, and testing and analysis of this product by Grace and others, Grace believes that ZAI was and continues to be safe for its intended purpose and poses little or no threat to human health. The plaintiffs in the ZAI lawsuits dispute Grace's position on the safety of ZAI. In October, 2004, the Bankruptcy Court held a hearing on motions filed by the parties to address a number of important legal and factual issues regarding the ZAI claims. In December, 2006, the Bankruptcy Court issued an opinion and order holding that, although ZAI is contaminated with asbestos and can release asbestos fibers when disturbed, there is no unreasonable risk of harm from ZAI. The ZAI claimants sought an interlocutory appeal of the opinion and order with the District Court, but that request was denied. In the event the Joint Plan is not confirmed, the ZAI claimants have reserved their right to appeal such opinion and order if and when it becomes a final order.
At the Debtors' request, in July 2008, the Bankruptcy Court established a bar date for U.S. ZAI PD Claims and approved a related notice program that required any person with a U.S. ZAI PD Claim to submit an individual proof of claim no later than October 31, 2008. Approximately 17,960 U.S. ZAI PD Claims were filed prior to the October 31, 2008 claims bar date and, as of December 31, 2009 an additional 1,300 U.S. ZAI PD Claims were filed. As described above, on December 13, 2009, the Ontario Superior Court of Justice, in the Grace Canada, Inc. proceeding pending under the Companies' Creditors Arrangement Act, approved the Amended Settlement that would settle all Canadian ZAI PD Claims on the terms of the Joint Plan. On October 20, 2008, the Bankruptcy Court established August 31, 2009 as the bar date for Canadian ZAI PD Claims. Approximately 13,100 Canadian ZAI PD Claims were filed prior to the bar date and, as of December 31, 2009, an additional 1,000 Canadian ZAI PD Claims were filed. Under the Amended Settlement, all Canadian ZAI PD Claims filed before December 31, 2009 would be eligible to seek compensation from the Canadian ZAI property damage claims fund.
As described in Note 2, on November 21, 2008, the Debtors, the Putative Class Counsel to the U.S. ZAI property damage claimants, the PD FCR, and the Equity Committee reached an agreement in principle designed to resolve all present and future U.S. ZAI PD Claims. The terms of the U.S. and Canadian ZAI agreements in principle have been incorporated into the terms of the Joint Plan and related documents. As described below, Grace's recorded asbestos related liability does not include the agreements in principle to settle the ZAI liability that is part of the Joint Plan. The asbestos related liability at December 31, 2009, which is based on the Prior Plan, assumes the risk of loss from ZAI litigation is not probable. If the Joint Plan or another plan of reorganization reflecting the agreements in principle is not confirmed or does not become effective and Grace's view as to risk of loss from ZAI litigation is not sustained, Grace believes the cost to resolve the U.S. ZAI litigation may be material.
Personal Injury Litigation Asbestos personal injury claimants allege adverse health effects from exposure to asbestos-containing products formerly manufactured by Grace. Historically, Grace's cost to resolve such claims has been influenced by numerous variables, including the nature of the disease alleged, product identification, proof of exposure to a Grace product, negotiation factors, the solvency of other former producers of asbestos containing products, cross-claims by co-defendants, the rate at which new claims are filed, the jurisdiction in which the claims are filed, and the defense and disposition costs associated with these claims.
F-30
Notes to Consolidated Financial Statements (Continued)
3. Asbestos-Related Litigation (Continued)
Cumulatively through the Filing Date, 16,354 asbestos personal injury lawsuits involving approximately 35,720 PI Claims were dismissed without payment of any damages or settlement amounts (primarily on the basis that Grace products were not involved) and approximately 55,489 lawsuits involving approximately 163,698 PI Claims were disposed of (through settlements and judgments) for a total of $645.6 million. As of the Filing Date, 129,191 PI Claims were pending against Grace. Grace believes that a substantial number of additional PI Claims would have been received between the Filing Date and December 31, 2009 had such PI Claims not been stayed by the Bankruptcy Court.
The Bankruptcy Court has entered a case management order for estimating liability for pending and future PI Claims. A trial for estimating liability for PI Claims began in January 2008 but was suspended in April 2008 as a result of the PI Settlement.
Asbestos-Related Liability The total recorded asbestos-related liability as of December 31, 2009 and December 31, 2008, including pre-Filing Date and post-Filing Date settlements, was $1,700 million and is included in "liabilities subject to compromise" in the accompanying Consolidated Balance Sheets. Grace adjusted its asbestos-related liability in the fourth quarter of 2004 based on the filing of the Prior Plan. The Prior Plan contained a condition precedent that the Bankruptcy Court determine that $1,613 million (this amount, plus $87 million of prepetition settlements and judgments, "the Funding Amount") was sufficient to pay, on a net present value basis, all PI Claims and PD Claims entitled to payment and related trust administration costs and expenses. Therefore, prior to the PI Settlement, the U.S. and Canadian ZAI agreements in principle and the filing of the Joint Plan, Grace was prepared to settle its asbestos-related claims at the Funding Amount as part of a consensual plan of reorganization and recorded its asbestos-related liability on that basis. The treatment of asbestos-related liabilities is significantly different under the Joint Plan than under the Prior Plan. Grace has not adjusted its accounting for asbestos-related liabilities to reflect the Joint Plan. At this time, Grace is unable to determine a reasonable estimate of the value of certain consideration payable to the PI Trust and the PD Trust under the Joint Plan. These values will ultimately be determined on the effective date of the Joint Plan. Grace expects to adjust its accounting for the Joint Plan when the consideration can be measured and material conditions to the Joint Plan are satisfied. Grace expects that such adjustments may be material to Grace's consolidated financial position and results of operations.
If the Joint Plan is not confirmed by the Bankruptcy Court, the Debtors would expect to resume the estimation trial, which was suspended in April 2008 due to the PI Settlement, to determine the amount of its asbestos-related liabilities. Through the PI Claim estimation process and the continued adjudication of PD Claims, Grace would seek to demonstrate that most claims have no value because they fail to establish any significant property damage, health impairment or occupational exposure to asbestos from Grace's operations or products. If the Bankruptcy Court agreed with Grace's position on the number of, and the amounts to be paid in respect of, allowed PI Claims and PD Claims, then Grace believes that the Funding Amount could be lower than $1,700 million. However, this outcome would be highly uncertain and would depend on a number of Bankruptcy Court rulings favorable to Grace's position. Conversely, the PI and PD Committees and the PI FCR have asserted that Grace's asbestos-related liabilities are substantially higher than $1,700 million, and in fact are in excess of Grace's business value. If the Bankruptcy Court accepted the position of the PI and PD Committees and the PI FCR, then any plan of reorganization likely would result in the loss of all or substantially all equity value by current shareholders.
F-31
Notes to Consolidated Financial Statements (Continued)
3. Asbestos-Related Litigation (Continued)
Insurance Rights Grace holds insurance policies that provide coverage for 1962 to 1985 with respect to asbestos-related lawsuits and claims. For the most part, coverage for years 1962 through 1972 has been exhausted, leaving coverage for years 1973 through 1985 available for pending and future asbestos claims. Since 1985, insurance coverage for asbestos-related liabilities has not been commercially available to Grace. As discussed in Note 2, pursuant to the Joint Plan, insurance policies that provide coverage for asbestos-related claims and proceeds, including interest, received after the date of the PI Settlement, would be assigned to the PI Trust.
For each insurance year, Grace's coverage consists of both primary and excess coverage. Primary coverage for an insurance year generally reimburses Grace for the portion of paid claims allocated to that year starting at the first dollar paid (after any deductible) through the coverage limit. With one exception, coverage disputes regarding Grace's primary insurance policies have been settled, and the settlement amounts have been paid in full. Excess insurance generally reimburses Grace for claims paid above a specified policy threshold through the coverage limit. For each insurance year, Grace's insurance program includes multiple layers of excess coverage. A layer of excess coverage, which may include multiple insurers, is triggered once claim payments that can be assigned to that insurance year are paid up to the threshold of that layer.
Grace has entered into settlement agreements with various excess insurance carriers. These settlements involve amounts paid and to be paid to Grace. The unpaid maximum aggregate amount available under these settlement agreements is approximately $440 million. With respect to asbestos-related personal injury claims, the settlement agreements generally require that the claims be spread over the claimant's exposure period and that each insurer pay a pro rata portion of each claim based on the amount of coverage provided during each year of the total exposure period.
Presently, Grace has no agreements in place with insurers with respect to approximately $483 million of excess coverage. Such policies are at layers of coverage that have not yet been triggered, but certain layers would be triggered if the Prior Plan were approved at the recorded asbestos-related liability of $1,700 million. In estimating its ultimate insurance recovery, Grace has assumed that its unsettled excess coverage will be available on terms that are substantially similar to the existing settlement agreements described above. Grace believes that any allowed ZAI claims also would be covered under the policies discussed above to the extent they relate to installations of ZAI occurring after July 1, 1973.
In addition, Grace has approximately $253 million of excess coverage with insolvent or non-paying insurance carriers. Non-paying carriers are those that, although technically solvent, are not currently meeting their obligations to pay claims. Grace has filed and continues to file claims in the insolvency proceedings of these carriers. Grace periodically receives distributions from some of these insolvent carriers.
In November 2006, Grace entered into a settlement agreement with an underwriter of a portion of its excess insurance coverage. The insurer paid a settlement amount of $90 million directly to an escrow account in respect of claims for which Grace was provided coverage under the affected policies. The settlement agreement, as amended in July 2009, provides that: unless Grace confirms a plan of reorganization by December 31, 2013, at the option of the underwriter, exercisable at any time prior to April 30, 2014, the escrow amount with interest must be returned to the underwriter; funds in the escrow account will be distributed from the account to the PI Trust as set forth in the Joint Plan; 52% of the interest accrued on the settlement amount as of March 31, 2009 will be transferred to an agent of the underwriter; and the underwriter has certain indemnification rights against Grace and the PI Trust with respect to certain claims. In October 2009, in compliance with the settlement agreement, Grace transferred approximately $3.7 million of the accrued interest to an
F-32
Notes to Consolidated Financial Statements (Continued)
3. Asbestos-Related Litigation (Continued)
agent of the underwriter. Due to the open contingencies for the release of the amount in the escrow account, Grace has not recorded this amount or reduced its asbestos insurance receivable balance. Under the Joint Plan, the amount in the escrow account would be assigned to the PI Trust. The escrow account balance at December 31, 2009 was approximately $93.5 million, including interest earned on the account.
As of December 31, 2009, including the settlement discussed above and after subtracting previous reimbursements by insurers and allowing for discounts pursuant to certain settlement agreements, there remains approximately $923 million of excess coverage from 53 presently solvent insurers. Grace estimates that eligible claims would have to exceed $4 billion to access total coverage. Grace further estimates that, assuming the resolution value of asbestos-related claims is equal to the recorded liability of $1,700 million (which should fund claim payments in excess of $2 billion), it should be entitled to approximately $500 million of insurance recovery, including the escrow described above. This amount was determined by estimating the aggregate and per year payout for claims over time and applying the expected insurance recovery factor to such claims. However, the ultimate amount of insurance recovered on such claims will depend on a number of factors that will only be determined at the time claims are paid including: the nature of the claim (PI Claim, PD Claim or ZAI PD Claim), the relevant exposure years, the timing of payment, the solvency of insurers and the legal status of policy rights. Accordingly, Grace's estimate of insurance recovery may differ materially from actual amounts received by Grace, or, if the Joint Plan is confirmed and becomes effective, the PI Trust.
4. Inventories
Inventories are stated at the lower of cost or market, and cost is determined using FIFO. Inventories consisted of the following at December 31, 2009 and December 31, 2008:
| |
December 31, | ||||||
|---|---|---|---|---|---|---|---|
| |
2009 | 2008 | |||||
| |
(In millions) |
||||||
Raw materials |
$ | 48.8 | $ | 63.6 | |||
In process |
36.8 | 42.1 | |||||
Finished products |
104.6 | 212.1 | |||||
Other |
30.4 | 37.0 | |||||
|
$ | 220.6 | $ | 354.8 | |||
5. Properties and Equipment
| |
2009 | 2008 | |||||
|---|---|---|---|---|---|---|---|
| |
(In millions) |
||||||
Land |
$ | 19.5 | $ | 21.5 | |||
Buildings |
467.1 | 460.8 | |||||
Information technology and equipment |
135.9 | 131.0 | |||||
Machinery, equipment and other |
1,616.6 | 1,577.9 | |||||
Projects under construction |
62.3 | 64.7 | |||||
Properties and equipment, gross |
2,301.4 | 2,255.9 | |||||
Accumulated depreciation and amortization |
(1,611.3 | ) | (1,545.3 | ) | |||
Properties and equipment, net |
$ | 690.1 | $ | 710.6 | |||
F-33
Notes to Consolidated Financial Statements (Continued)
5. Properties and Equipment (Continued)
Capitalized interest costs amounted to $0.5 million in 2009 and $0.3 million in 2008. Depreciation and lease amortization expense relating to properties and equipment amounted to $103.0 million in 2009, $109.0 million in 2008, and $104.4 million in 2007. Grace's rental expense for operating leases amounted to $20.2 million in 2009, $23.8 million in 2008, and $20.8 million in 2007.
At December 31, 2009, minimum future non-cancelable payments for operating leases were:
Minimum Future Payments Under Operating Leases
| |
(In millions) |
|||
|---|---|---|---|---|
2010 |
$ | 19.8 | ||
2011 |
15.0 | |||
2012 |
11.3 | |||
2013 |
9.1 | |||
2014 |
4.3 | |||
Thereafter |
7.8 | |||
Total minimum lease payments |
$ | 67.3 | ||
The above minimum non-cancelable lease payments are net of anticipated sublease income of $0.8 million in 2010, $0.3 million in 2011, $0.2 million in 2012, $0.2 million in 2013, $0.2 million in 2014 and $0.3 million thereafter.
6. Goodwill and Other Intangible Assets
The carrying amount of goodwill attributable to each operating segment and the changes in those balances during the year ended December 31, 2009 are as follows:
| |
Grace Davison |
Grace Construction Products |
Total Grace |
|||||||
|---|---|---|---|---|---|---|---|---|---|---|
| |
(In millions) |
|||||||||
Balance as of December 31, 2008 |
$ | 54.4 | $ | 62.7 | $ | 117.1 | ||||
Goodwill acquired during the year |
— | — | — | |||||||
Goodwill related to sales of product lines |
— | (1.3 | ) | (1.3 | ) | |||||
Currency translation / other adjustments |
0.1 | 2.6 | 2.7 | |||||||
Balance as of December 31, 2009 |
$ | 54.5 | $ | 64.0 | $ | 118.5 | ||||
F-34
Notes to Consolidated Financial Statements (Continued)
6. Goodwill and Other Intangible Assets (Continued)