Attached files
| file | filename |
|---|---|
| EX-99.1 - EXHIBIT 99.1 - Impax Laboratories, LLC | ipxl-5x10x2017xex991.htm |
| 8-K - 8-K - Impax Laboratories, LLC | ipxl-5x10x2017x8k.htm |

1
First Quarter 2017 Results
and Business Update
May 10, 2017
2
Impax Cautionary Statement Regarding
Forward Looking Statements
"Safe Harbor" statement under the Private Securities Litigation Reform Act of 1995:
To the extent any statements made in this presentation contain information that is not historical; these statements are forward-looking in nature
and express the beliefs and expectations of management. Such statements are based on current expectations and involve a number of known
and unknown risks and uncertainties that could cause the Company’s future results, performance, or achievements to differ significantly from
the results, performance, or achievements expressed or implied by such forward-looking statements. Such risks and uncertainties include, but
are not limited to, fluctuations in the Company’s operating results and financial condition, the volatility of the market price of the Company’s
common stock, the Company’s ability to successfully develop and commercialize pharmaceutical products in a timely manner, the impact of
competition, the effect of any manufacturing or quality control problems, the Company’s ability to manage its growth, risks related to
acquisitions of or investments in technologies, products or businesses, risks relating to goodwill and intangibles, the reduction or loss of
business with any significant customer, the substantial portion of the Company’s total revenues derived from sales of a limited number of
products, the impact of consolidation of the Company’s customer base, the Company’s ability to sustain profitability and positive cash flows, the
impact of any valuation allowance on the Company’s deferred tax assets, the restrictions imposed by the Company’s credit facility and
indenture, the Company’s level of indebtedness and liabilities and the potential impact on cash flow available for operations, the availability of
additional funds in the future, any delays or unanticipated expenses in connection with the operation of the Company’s manufacturing facilities,
the effect of foreign economic, political, legal and other risks on the Company’s operations abroad, the uncertainty of patent litigation and other
legal proceedings, the increased government scrutiny on the Company’s agreements to settle patent litigations, product development risks and
the difficulty of predicting FDA filings and approvals, consumer acceptance and demand for new pharmaceutical products, the impact of market
perceptions of the Company and the safety and quality of the Company’s products, the Company’s determinations to discontinue the
manufacture and distribution of certain products, the Company’s ability to achieve returns on its investments in research and development
activities, changes to FDA approval requirements, the Company’s ability to successfully conduct clinical trials, the Company’s reliance on third
parties to conduct clinical trials and testing, the Company’s lack of a license partner for commercialization of Numient® (IPX066) outside of the
United States, impact of illegal distribution and sale by third parties of counterfeits or stolen products, the availability of raw materials and
impact of interruptions in the Company’s supply chain, the Company’s policies regarding returns, rebates, allowances and chargebacks, the use
of controlled substances in the Company’s products, the effect of current economic conditions on the Company’s industry, business, results of
operations and financial condition, disruptions or failures in the Company’s information technology systems and network infrastructure caused
by third party breaches or other events, the Company’s reliance on alliance and collaboration agreements, the Company’s reliance on licenses
to proprietary technologies, the Company’s dependence on certain employees, the Company’s ability to comply with legal and regulatory
requirements governing the healthcare industry, the regulatory environment, the effect of certain provisions in the Company’s government
contracts, the Company’s ability to protect its intellectual property, exposure to product liability claims, changes in tax regulations, uncertainties
involved in the preparation of the Company’s financial statements, the Company’s ability to maintain an effective system of internal control over
financial reporting, the effect of terrorist attacks on the Company’s business, the location of the Company’s manufacturing and research and
development facilities near earthquake fault lines, expansion of social media platforms and other risks described in the Company’s periodic
reports filed with the Securities and Exchange Commission. Forward-looking statements speak only as to the date on which they are made,
and the Company undertakes no obligation to update publicly or revise any forward-looking statement, regardless of whether new information
becomes available, future developments occur or otherwise.
Trademarks referenced herein are the property of their respective owners.
©2017 Impax Laboratories, Inc. All Rights Reserved.

3
Presentation Overview
Paul Bisaro – President & Chief Executive Officer
1Q 2017 Results
Consolidation and Improvement Plan (“CIP”)
Pipeline Update
Bryan Reasons – Senior Vice President, Chief Financial Officer
1Q 2017 Financial Review
Capital Structure
Paul Bisaro
Updated 2017 Financial Guidance
Path Forward

4
Paul Bisaro
President & CEO

5
1Q 2017 Results
$226
$198
$184
1Q16 4Q16 1Q17
$64
$37
$32
1Q16 4Q16 1Q17
$0.43
$0.16
$0.11
1Q16 4Q16 1Q17
Revenues
$ millions
Adjusted EBITDA
$ millions
Adjusted EPS
Year over year results primarily impacted by significant reduction in sales of
diclofenac sodium gel – down $49 million
Solid growth from epinephrine auto-injector, oxymorphone ER and Rytary®
Experienced price erosion on certain products, in-line with expectations
Refer to the GAAP to non-GAAP reconciliation tables in the appendix for a reconciliation of non-GAAP results
6
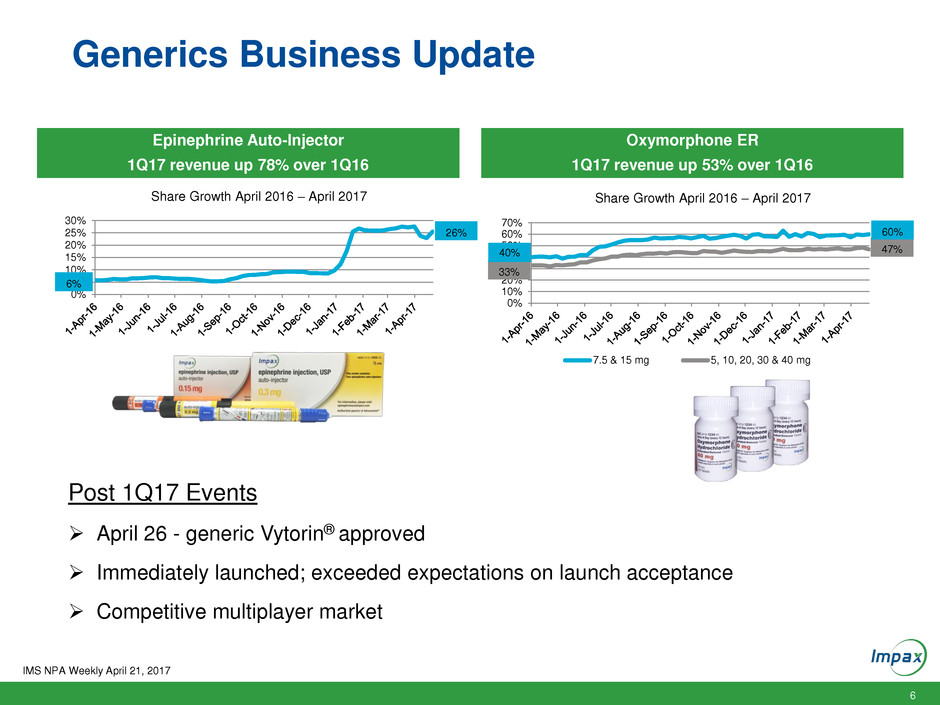
Post 1Q17 Events
April 26 - generic Vytorin® approved
Immediately launched; exceeded expectations on launch acceptance
Competitive multiplayer market
Generics Business Update
IMS NPA Weekly April 21, 2017
0%
5%
10%
15%
20%
25%
30%
Share Growth April 2016 – April 2017
6%
26%
0%
10%
20%
30%
40%
50%
60%
70%
Share Growth April 2016 – April 2017
7.5 & 15 mg 5, 10, 20, 30 & 40 mg
33%
47% 40%
60%
Oxymorphone ER
1Q17 revenue up 53% over 1Q16
Epinephrine Auto-Injector
1Q17 revenue up 78% over 1Q16

7
• 1Q Albenza revenue
impacted by higher mix of
government contracting
sales and prior year
supply issue**
• Combined anthelmintic
share holding in the 42%-
45% range
• Continuing to pursue
Managed Medicaid
contracting opportunities
• 1Q revenue and TRx’s
impacted by timing and
seasonality
• Favorable district court
decision on patent challenge
• Patents expire May 2021
• 36% growth in TRx’s 1Q17
over 1Q16
• 4% growth in TRx’s and 6%
growth in NRx’s 1Q17 over
4Q16 in spite of Managed
Care Resets
• Picked up United Medicare
PDP coverage March 1,
Kaiser (Medicare and
Commercial) and CVS
Commercial in April
Specialty Business Update
** Higher sales in 4Q16 as a resulting of restocking following a supply shortage in 3Q16
Source: IMS NPA March 2017; PDP =Prescription Drug Plan
Launching tele-detailing program for Zomig and
Emverm to select high prescribing pediatric and
primary care offices

8
Consolidation and Improvement Plan
Consolidating all of Generic R&D, U.S. manufacturing and packaging
operations to Hayward facility
Continuing previously announced closure of Middlesex
manufacturing site; now includes closure of the Generic R&D site
Reorganizing certain functions including quality, engineering and
supply chain operations
Reviewing strategic alternatives for Taiwan manufacturing site
including sale of the facility or in the alternative, closure of the facility
Rationalizing generic portfolio to eliminate low-value products and
streamline operations
Actions designed to improve efficiencies and profitability; provide
resources to support growth initiatives
9
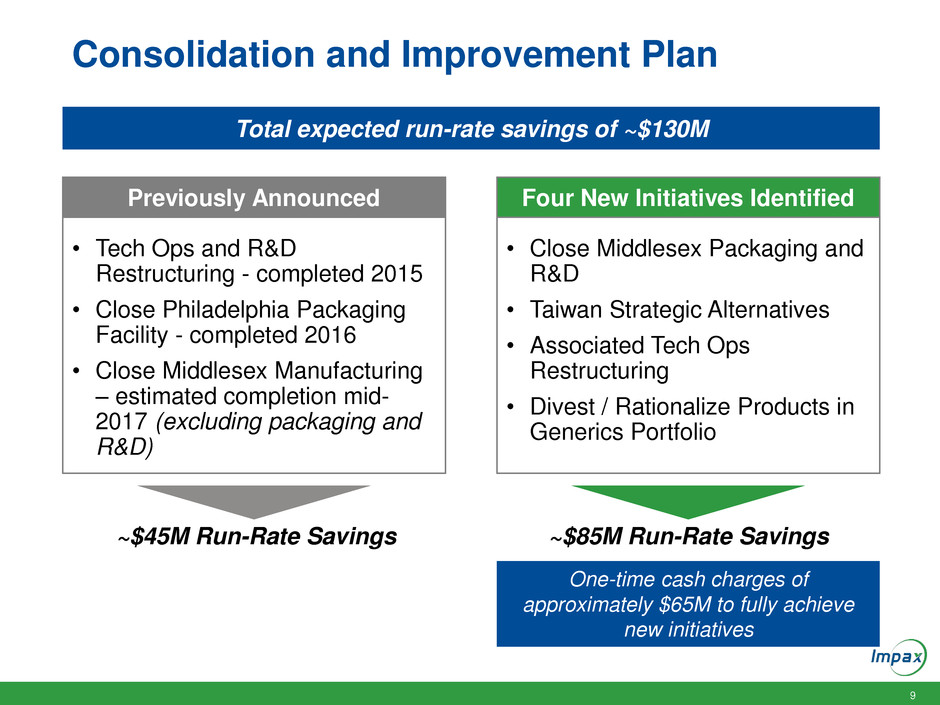
Consolidation and Improvement Plan
Previously Announced Four New Initiatives Identified
~$45M Run-Rate Savings ~$85M Run-Rate Savings
• Tech Ops and R&D
Restructuring - completed 2015
• Close Philadelphia Packaging
Facility - completed 2016
• Close Middlesex Manufacturing
– estimated completion mid-
2017 (excluding packaging and
R&D)
• Close Middlesex Packaging and
R&D
• Taiwan Strategic Alternatives
• Associated Tech Ops
Restructuring
• Divest / Rationalize Products in
Generics Portfolio
Total expected run-rate savings of ~$130M
One-time cash charges of
approximately $65M to fully achieve
new initiatives

10
Previously Announced Initiatives ~45M Run-Rate
Realized ~$20M of cost savings in 2016
Additional $12M by year-end 2017 (which annualizes to $24M)
Full run-rate of ~$45M in 2018
New Initiatives ~$85M Run-Rate
Limited savings impact in 2017
Full run-rate of ~$85M by year-end 2019
Total run-rate savings and timing dependent on Taiwan strategic
alternatives
Consolidation and Improvement Plan
Total expected run-rate savings of ~$130M

11
Continuing to Expand Pipeline Opportunities
Generic R&D
16
14
6
5
Pending at FDA
$17B
Under Development
$6B
Solid Oral Dose Alternative Dose
22
19
# of Potential
Products
FTF or FTM
9 17
Specialty Pharma R&D
Portfolio of 41 Products
Current U.S. Brand/Generic Market of $23B
IPX203 Carbidopa-Levodopa
Ongoing Phase 2b study
Multiple dose study in patients with
advanced Parkinson’s disease
Interim results expected during the
second half of 2017
Pipeline provides solid platform for growth
Source of sales data: IMS NSP March 2017; *U.S. Brand/Generic market sales; Pipeline data as of Apr 30, 2017
12
Bryan Reasons
Chief Financial Officer
13
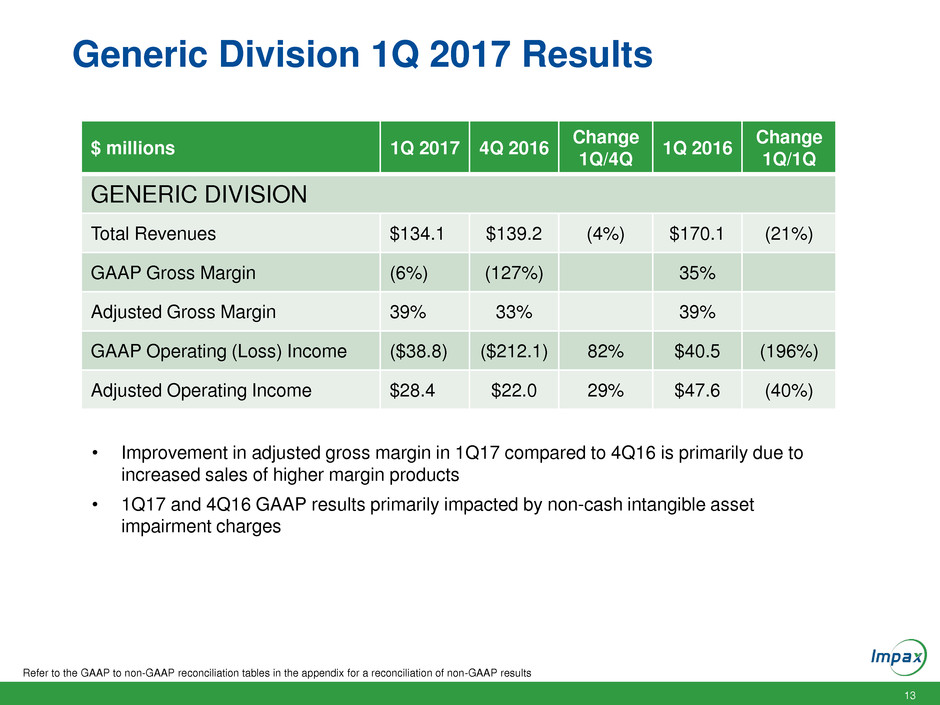
Generic Division 1Q 2017 Results
Refer to the GAAP to non-GAAP reconciliation tables in the appendix for a reconciliation of non-GAAP results
$ millions 1Q 2017 4Q 2016
Change
1Q/4Q
1Q 2016
Change
1Q/1Q
GENERIC DIVISION
Total Revenues $134.1 $139.2 (4%) $170.1 (21%)
GAAP Gross Margin (6%) (127%) 35%
Adjusted Gross Margin 39% 33% 39%
GAAP Operating (Loss) Income ($38.8) ($212.1) 82% $40.5 (196%)
Adjusted Operating Income $28.4 $22.0 29% $47.6 (40%)
• Improvement in adjusted gross margin in 1Q17 compared to 4Q16 is primarily due to
increased sales of higher margin products
• 1Q17 and 4Q16 GAAP results primarily impacted by non-cash intangible asset
impairment charges
14
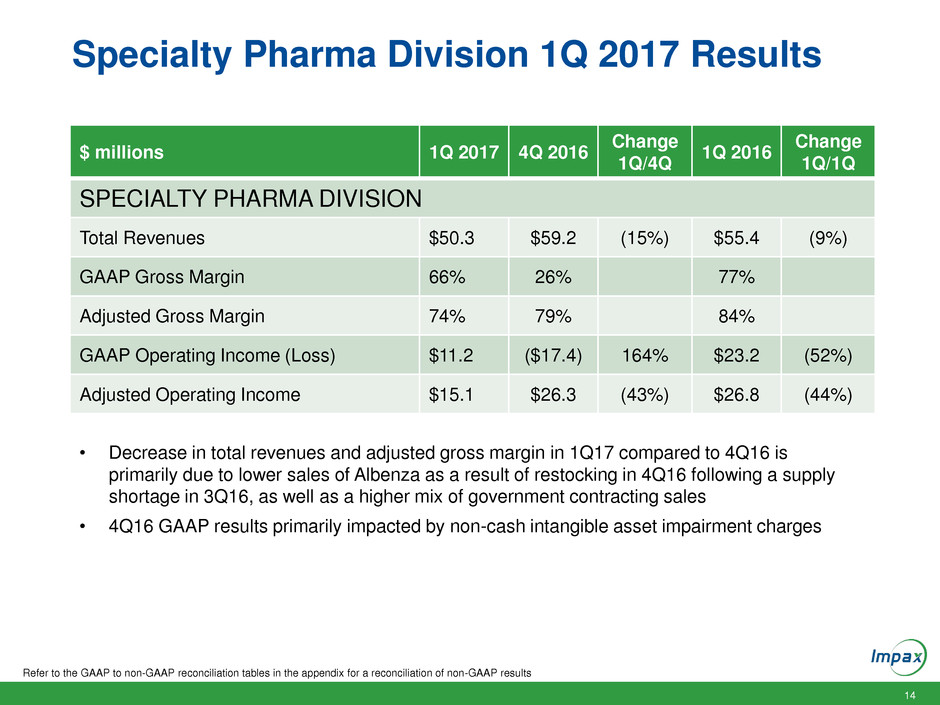
Specialty Pharma Division 1Q 2017 Results
Refer to the GAAP to non-GAAP reconciliation tables in the appendix for a reconciliation of non-GAAP results
$ millions 1Q 2017 4Q 2016
Change
1Q/4Q
1Q 2016
Change
1Q/1Q
SPECIALTY PHARMA DIVISION
Total Revenues $50.3 $59.2 (15%) $55.4 (9%)
GAAP Gross Margin 66% 26% 77%
Adjusted Gross Margin 74% 79% 84%
GAAP Operating Income (Loss) $11.2 ($17.4) 164% $23.2 (52%)
Adjusted Operating Income $15.1 $26.3 (43%) $26.8 (44%)
• Decrease in total revenues and adjusted gross margin in 1Q17 compared to 4Q16 is
primarily due to lower sales of Albenza as a result of restocking in 4Q16 following a supply
shortage in 3Q16, as well as a higher mix of government contracting sales
• 4Q16 GAAP results primarily impacted by non-cash intangible asset impairment charges

15
Consolidated 1Q 2017 Results
Refer to the GAAP to non-GAAP reconciliation tables in the appendix for a reconciliation of non-GAAP results
$ millions, except per share
amounts
1Q 2017 4Q 2016
Change
1Q/4Q
1Q 2016
Change
1Q/1Q
EBITDA ($30.2) ($234.0) 87% $5.6 (639%)
Adjusted EBITDA $31.9 $37.3 (14%) $63.6 (50%)
GAAP EPS ($1.37) ($3.91) 65% ($0.15) (813%)
Adjusted Diluted EPS $0.11 $0.16 (31%) $0.43 (74%)
GAAP Tax Rate (45.8%) (3.2%) 40.5%
Adjusted Tax Rate 30.8% 22.8% 34.7%
• 1Q17 and 4Q16 GAAP results primarily impacted by non-cash intangible asset
impairment charges

16
Capital Structure ($ millions)
Cash and Cash Equivalents $ 157
Revolver ($200) $ 0
2022 Convertible Senior Notes 600
Senior Secured Term Loan 340
Total Debt $ 940
Total Net Debt $ 783
Capital Structure as of March 31, 2017
Revised debt covenants provides additional operating flexibility
Previous Maintenance Covenant
Based on
March 31
Data
5x Net Debt to Trailing 12 Months
Pro-forma EBITDA
3.8x
Revised
2.5x Secured Net Debt to
Trailing 12 Months Pro-
forma EBITDA
1.0x
Covenant calculation: Net debt less up to $125 million of cash and cash equivalents allowed.
Trailing 12 months pro-forma EBITDA includes the products acquired in the Teva Transaction prior to closing the transaction in August 2016.
• Voluntarily pre-paid $50M of the Term Loan in February
• Revised debt covenants at minimal cost

17
Paul Bisaro
President & CEO

18
Updated 2017 Financial Guidance Summary
Previous Guidance
March 1
Updated Guidance
May 10**
Adjusted Gross Margin as a % of
Revenues
~ 47% to 49% No Change
Adjusted R&D & Patent Litigation
Expense
~ $90M to $95M No Change
Adjusted Selling, General &
Administrative Expense
~ $190M to $195M No Change
Adjusted Interest Expense ~ $30M ~ $28M
Adjusted EPS N/A ~ $0.55 to $0.70
Tax Rate ~ 34% to 35% ~33% to 34%
Capital Expenditures ~ $25M to $30M No Change
**Excludes new cost savings initiatives as outlined on slide 9.
The Company’s full year 2017 estimates are based on management’s current expectations, including with respect to prescription trends,
pricing levels, inventory levels, and the anticipated timing of future product launches and events. These statements are forward-looking, and
actual results could differ materially depending on market conditions and the factors set forth under our “Safe Harbor” statement above.
19
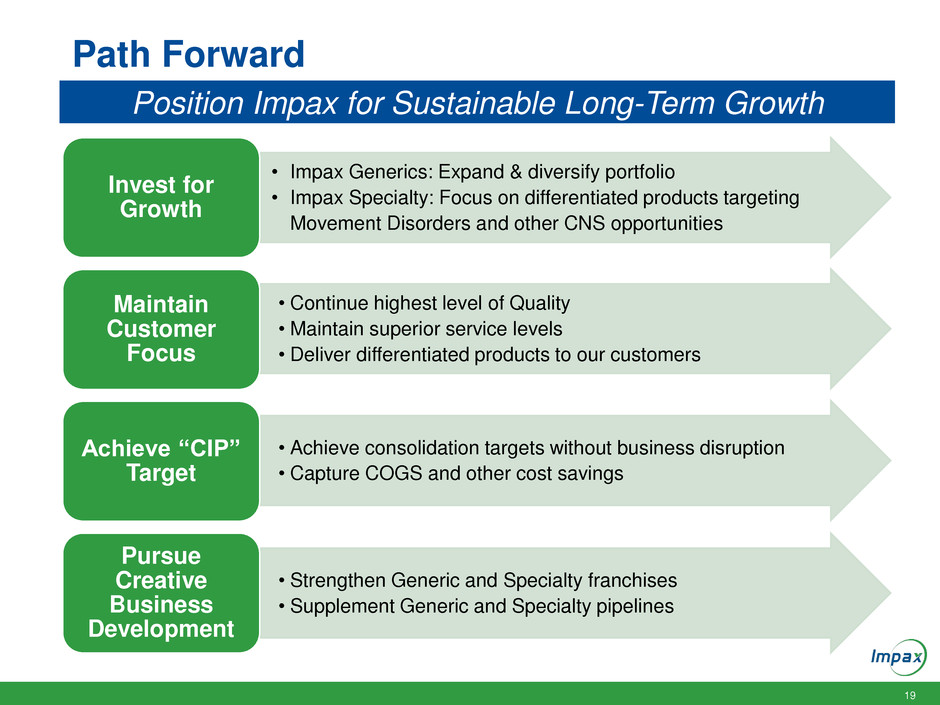
Path Forward
• Impax Generics: Expand & diversify portfolio
• Impax Specialty: Focus on differentiated products targeting
Movement Disorders and other CNS opportunities
Invest for
Growth
• Continue highest level of Quality
• Maintain superior service levels
• Deliver differentiated products to our customers
Maintain
Customer
Focus
• Achieve consolidation targets without business disruption
• Capture COGS and other cost savings
Achieve “CIP”
Target
• Strengthen Generic and Specialty franchises
• Supplement Generic and Specialty pipelines
Pursue
Creative
Business
Development
Position Impax for Sustainable Long-Term Growth
20
Q&A

21
ANDA Pipeline Includes Several Potential High-Value
First-to-Market Opportunities
Source of sales data: IMS NPS Mar 2017; Pipeline data as of Apr 30, 2017; TA = tentative approval
1 Launched authorized generic in April 2016
2 Assuming final FDA approval, earliest potential launch date/timing based on settlement or patent expiration date
Disclosed Pending ANDAs and Tentative Approval Products
Generic Product Name Brand
IMS
Sales
Potential Launch
Timing
FTM
Opportunity
Apixaban IR tablet Eliquis® $3.6M Pending litigation
Oxycodone ER tablet (new formulation) 1 OxyContin® $2.2B Settled, not disclosed
Sevelamer Carbonate IR tablet Renvela® $1.9B Approval
Methylphenidate HCI ER tablet Concerta® $1.8B Approval
Teriflunomide IR tablet Aubagio® $1.2B Settled, not disclosed
Colesevelam IR tablet Welchol® $615M Approval
Oxymorphone ER tablet (new
formulation)
Opana ER® $290M Pending litigation
Carvedilol ER capsule Coreg CR® $224M Approval
Fentanyl Buccal IR tablet Fentora® $134M Settled, not disclosed
Dexmethylphenidate ER capsule
25, 35mg – TA2
Focalin XR® $94M July 2017
Dutasteride/Tamsulosin IR capsule Jalyn® $42M Approval
Risedronate Sodium DR tablet Atelvia® $27M Approval

22
GAAP to Adjusted Results Reconciliation
The following table reconciles total Company reported cost of revenues to adjusted cost of revenues, adjusted gross profit,
adjusted gross margin, adjusted research and development expenses, and adjusted selling, general and administrative expenses.
(Unaudited, In thousands)
Refer to the First Quarter 2017 Earnings Release for an explanation of adjusted items. The sum of the individual amounts may not equal due to rounding.
(a) Adjusted gross profit is calculated as total revenues less adjusted cost of revenues. Adjusted gross margin is calculated as adjusted gross profit divided by
total revenues.
March 31, December March 31,
2017 2016 2016
Cost of revenues 120,232$ 129,047$ 122,918$
Cost of revenues impairment charges 39,280 230,625 -
Adjusted to deduct:
Amortization 17,232 16,886 8,768
Intangible asset impairment charges 39,280 230,625 -
Business development 8 - -
Restructuring and severance charges 6,139 6,414 1,733
Middlesex plant closure 1,636 - -
Adjusted cost of revenues 95,217$ 105,747$ 112,417$
Adjusted gross profit (a) 89,186$ 92,675$ 113,091$
Adjusted gross margin (a) 48.4% 46.7% 50.1%
Research and development expenses 22,489$ 20,530$ 19,022$
In-process research and development impairment charges 6,079 23,248 -
Adjusted to deduct:
Intangible asset impairment charges 6,079 23,248 -
Other 650 600 300
Adjusted research and development expenses 21,839$ 19,930$ 18,722$
Selling, general and administrative expenses 47,055$ 57,586$ 44,298$
Adjusted to deduct:
Business development expenses 42 251 768
Turing legal expenses (495) 2,111 -
Restructuring and severance charges - 5,291 10
Adjusted selling, general and administrative expenses 47,508$ 49,933$ 43,520$
Three Months Ended

23
GAAP to Adjusted Net Income Reconciliation
The following table reconciles reported net loss to adjusted net income.
(Unaudited, In thousands, except per share and per share data)
Refer to the First Quarter 2017 Earnings Release for an explanation of adjusted items. The sum of the individual amounts may not equal
due to rounding.
March 31, December 31, March 31,
2017 2016 2016
Net loss (98,431)$ (279,585)$ (10,408)$
Adjusted to add (deduct):
Amortization 17,232 16,886 8,768
Non-cash interest expense 6,312 6,241 5,305
Business development expenses 50 251 768
Intangible asset impairment charges 45,359 253,873 -
Reserve for Turing receivable 317 (7,731) 48,043
Turing legal expenses (495) 2,111 -
Restructuring and severance charges 6,139 11,705 1,568
Fixed asset impairment charges - 1,644 -
Loss on debt extinguishment 1,215 - -
Middlesex plant closure 1,636 - -
Other 931 1,118 300
Income tax effect 27,463 5,136 (23,490)
Adju ted net income 7,728$ 11,649$ 30,854$
Adjusted net income per diluted share 0.11$ 0.16$ 0.43$
Net loss per diluted share (1.37)$ (3.91)$ (0.15)$
Diluted weighted-average common shares outstanding 71,600 71,489 71,649
Three Months Ended

24
GAAP to Adjusted EBITDA Reconciliation
Refer to the First Quarter 2017 Earnings Release for an explanation of adjusted items. The sum of the individual amounts may not equal
due to rounding.
The following table reconciles reported net loss to adjusted EBITDA.
(Unaudited, In thousands)
March 31, December 31, March 31,
2017 2016 2016
Net loss (98,431)$ (279,585)$ (10,408)$
Adjusted to add (deduct):
Interest expense 13,380 13,567 8,331
Interest income (154) (127) (333)
Income taxes 30,901 8,572 (7,086)
Depreciation and amortization 24,098 23,573 15,098
EBITDA (30,206) (234,000) 5,602
Adjusted to add (deduct):
Share-based compensation expense 6,957 8,334 7,278
Business development expenses 50 251 768
Intangible asset impairment charges 45,359 253,873 -
Reserve for Turing receivable 317 (7,731) 48,043
Turing legal expenses (495) 2,111 -
Restructuring and severance charges 6,139 11,705 1,568
Fixed asset impairment charges - 1,644 -
Loss on debt extinguishment 1,215 - -
Middlesex plant closure 1,636 - -
Other 931 1,118 300
Adjusted EBITDA 31,903$ 37,305$ 63,559$
Three Months Ended
25
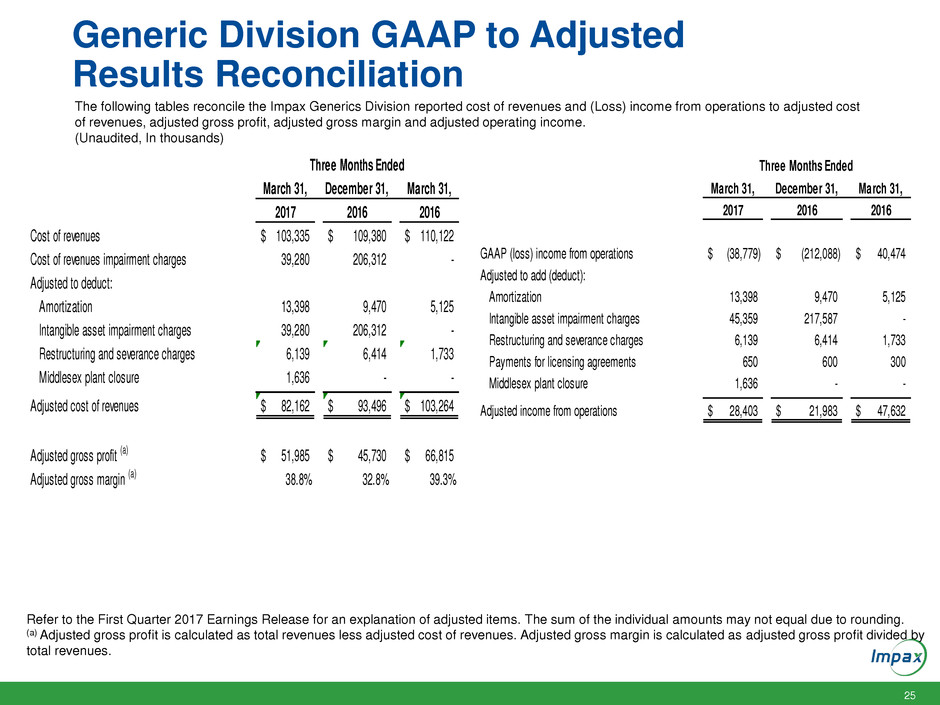
Generic Division GAAP to Adjusted
Results Reconciliation
The following tables reconcile the Impax Generics Division reported cost of revenues and (Loss) income from operations to adjusted cost
of revenues, adjusted gross profit, adjusted gross margin and adjusted operating income.
(Unaudited, In thousands)
Refer to the First Quarter 2017 Earnings Release for an explanation of adjusted items. The sum of the individual amounts may not equal due to rounding.
(a) Adjusted gross profit is calculated as total revenues less adjusted cost of revenues. Adjusted gross margin is calculated as adjusted gross profit divided by
total revenues.
March 31, December 31, March 31,
2017 2016 2016
Cost of revenues 103,335$ 109,380$ 110,122$
Cost of revenues impairment charges 39,280 206,312 -
Adjusted to deduct:
Amortization 13,398 9,470 5,125
Intangible asset impairment charges 39,280 206,312 -
R tructuring and sev rance charges 6,139 6,414 1,733
Middlesex plant closure 1,636 - -
Adjusted cost of revenues 82,162$ 93,496$ 103,264$
Adjusted gross profit (a) 51,985$ 45,730$ 66,815$
Adjusted gross margin (a) 38.8% 32.8% 39.3%
Three Months Ended
March 31, December 31, March 31,
2017 2016 2016
GAAP (loss) income from operations (38,779)$ (212,088)$ 40,474$
Adjusted to add (deduct):
Amortization 13,398 9,470 5,125
Int ngible asset impairment charges 45, 59 217,587 -
Re tructuring nd everance charges ,139 6,414 1,733
Payments for licensing agreements 650 600 300
Middlesex plant closure 1,636 - -
Adjusted income from operations 28,403$ 21,983$ 47,632$
Three Months Ended

26
Specialty Pharma Division GAAP to
Adjusted Results Reconciliation
The following tables reconcile the Impax Specialty Pharma Division reported cost of revenues and (Loss) income from operations
to adjusted cost of revenues, adjusted gross profit, adjusted gross margin and adjusted income from operations.
(Unaudited, In thousands)
Refer to the First Quarter 2017 Earnings Release for an explanation of adjusted items. The sum of the individual amounts may not equal due to rounding.
(a) Adjusted gross profit is calculated as total revenues less adjusted cost of revenues. Adjusted gross margin is calculated as adjusted gross profit divided by
total revenues.
March 31, December 31, March 31,
2017 2016 2016
GAAP income (loss) from operations 11,232$ (17,437)$ 23,183$
Adjusted to add:
Amortization 3,834 7,416 3,643
Intangible asset impairment charges - 36,286 -
Adjusted income from operations 15,066$ 26,265$ 26,826$
Three Months Ended
March 31, December 31, March 31,
2017 2016 2016
Cost of revenues 16,897$ 19,667$ 12,796$
Cost of revenues impairment charges - 24,313 -
Adjusted to deduct:
A ortiz ti n 3,834 7,416 3,643
Intangible asset impairment charges - 24,313 -
Adjusted cost of revenues 13,063$ 12,251$ 9,153$
Adjusted gross profit (a) 7,193$ 46,945$ 46,276$
Adjusted gross margin (a) 74.0% 79.3% 83.5%
Three Months Ended
