Attached files
| file | filename |
|---|---|
| EX-99.1 - EXHIBIT 99.1 - R1 RCM INC. | pressrelease.htm |
| 8-K - 8-K - R1 RCM INC. | a5-9x178xk.htm |

First Quarter 2017 Results Conference Call
May 9, 2017
2
Forward Looking Statements and Non-GAAP Financial Measures
This presentation contains forward-looking statements, including statements regarding future growth, plans and performance. All forward-
looking statements contained in this presentation involve risks and uncertainties. The Company’s actual results and outcomes could differ
materially from those anticipated in these forward-looking statements as a result of various factors, including the factors set forth under the
heading “Risk Factors” in its Annual Report on Form 10-K for the year ended December 31, 2016, filed with the SEC on March 1, 2017. The
words “strive,” “objective,” “anticipates,” “believes,” “estimates,” “expects,” “intends,” “may,” “plans,” “projects,” “vision,” “would,” and
similar expressions are intended to identify forward-looking statements, although not all forward-looking statements contain these identifying
words. The Company has based these forward-looking statements on its current expectations and projections about future events. Although
the Company believes that the expectations underlying any of its forward-looking statements are reasonable, these expectations may prove to
be incorrect and all of these statements are subject to risks and uncertainties. Should one or more of these risks and uncertainties materialize,
or should underlying assumptions, projections, or expectations prove incorrect, actual results, performance, financial condition, or events may
vary materially and adversely from those anticipated, estimated, or expected.
All forward-looking statements included in this presentation are expressly qualified in their entirety by these cautionary statements. The
Company cautions readers not to place undue reliance on any forward-looking statement that speaks only as of the date made and to
recognize that forward-looking statements are predictions of future results, which may not occur as anticipated. Actual results could differ
materially from those anticipated in the forward-looking statements and from historical results, due to the uncertainties and factors described
above, as well as others that the Company may consider immaterial or does not anticipate at this time. Although the Company believes that
the expectations reflected in its forward-looking statements are reasonable, the Company does not know whether its expectations may prove
correct. The Company’s expectations reflected in its forward-looking statements can be affected by inaccurate assumptions it might make or
by known or unknown uncertainties and factors, including those described above. The risks and uncertainties described above are not
exclusive, and further information concerning the Company and its business, including factors that potentially could materially affect its
financial results or condition or relationships with customers and potential customers, may emerge from time to time. The Company assumes
no, and it specifically disclaims any, obligation to update, amend, or clarify forward-looking statements to reflect actual results or changes in
factors or assumptions affecting such forward-looking statements. The Company advises investors, however, to consult any further disclosures
it makes on related subjects in our periodic reports that it files with or furnishes to the SEC.
This presentation includes the following non-GAAP financial measures : Gross Cash Generated and Net Cash Generated from Customer
Contracting Activities (on a historical basis), and Adjusted EBITDA (on a projected basis). Please refer to the Appendix located at the end of this
presentation for a reconciliation of the non-GAAP financial measures to the most directly comparable GAAP financial measure.
3
First Quarter Highlights
Financial Results
1Q’17 Results ahead of internal expectations
Significant top-line and bottom-line improvement compared to 1Q’16
Company re-launch
Listed on Nasdaq March 15th; all major elements of re-launch completed in Q1
Ascension deployment
Phase-1 Update:
Employee transitions largely complete. Onboarded 1,700 employees year-to-date; 3,500 contract-to-date
Transitioned 88% of work scheduled to move to shared services centers; deployed 92% of required
technology and rationalized 70% of targeted vendor spend
Expect to complete balance of Phase-1 deployment activities by end of May
Phase-2 Update:
Deployment planning well underway. Onboarding to begin in July / October
Leveraging learnings from Phase-1 to accelerate onboarding process for Phase-2
4
Technology Initiatives Update
1. R1 Decision (manages payer billing and follow-up)
Next Generation platform launched in 2Q’16
New platform extended to 80% of installed base. Starting to see performance improvement:
Up to 30% productivity improvement compared to manual follow-up activities
99.6% performance on follow-up yield across current Ascension base
In a recent pilot, consistently exceeded our internal benchmark of 0.5 days of A/R overdue for work
2. Patient and Physician Revenue Cycle Experience
Current platform, R1 Access, already delivers differentiated performance at scale across front-end
processes such as patient registration and insurance verification
New initiative is aimed at transforming the patient and physician experience with the revenue cycle:
Modernize and simplify patient scheduling and intake/registration
Reduce non-value-added work
Integrate the physician and acute environments from patient’s perspective
Initiated three pilots, expect results by year-end; rollout across customer base in 2018
We are uniquely positioned to drive this transformation due to extensive operating experience, a proven
technology platform, and control of customers’ operations
5
Expansion of Agreement with Ascension
• Amended agreement includes Physician Group RCM services at select health systems
• Expands net patient revenue (NPR) managed by the company by approximately $1.5 billion
• Onboarding of $2.2 billion in NPR scheduled to begin in the 4Q’17
• Key elements:
• New ~$500 million in NPR related to Physician Group RCM services
• New ~$1 billion in NPR from a health system acquired by Ascension that was not included in
the scope of committed business under the 2016 agreement.
• Accelerate the onboarding of approximately $700 million in NPR from Phase-3 to Phase-2
(onboarding to begin in the fourth quarter of 2017)
6
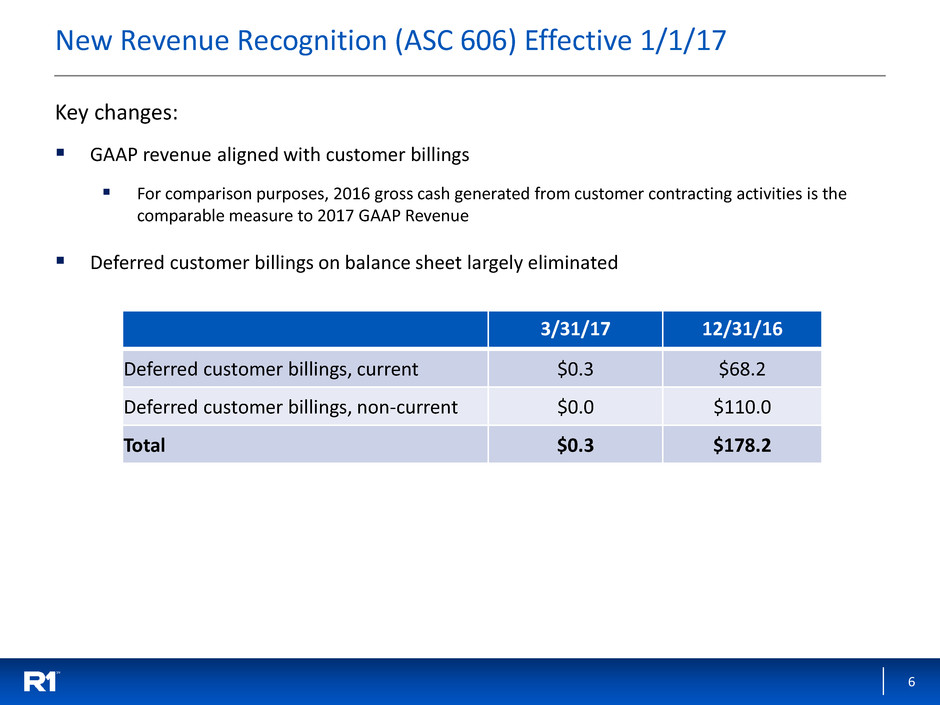
New Revenue Recognition (ASC 606) Effective 1/1/17
Key changes:
GAAP revenue aligned with customer billings
For comparison purposes, 2016 gross cash generated from customer contracting activities is the
comparable measure to 2017 GAAP Revenue
Deferred customer billings on balance sheet largely eliminated
3/31/17 12/31/16
Deferred customer billings, current $0.3 $68.2
Deferred customer billings, non-current $0.0 $110.0
Total $0.3 $178.2
7
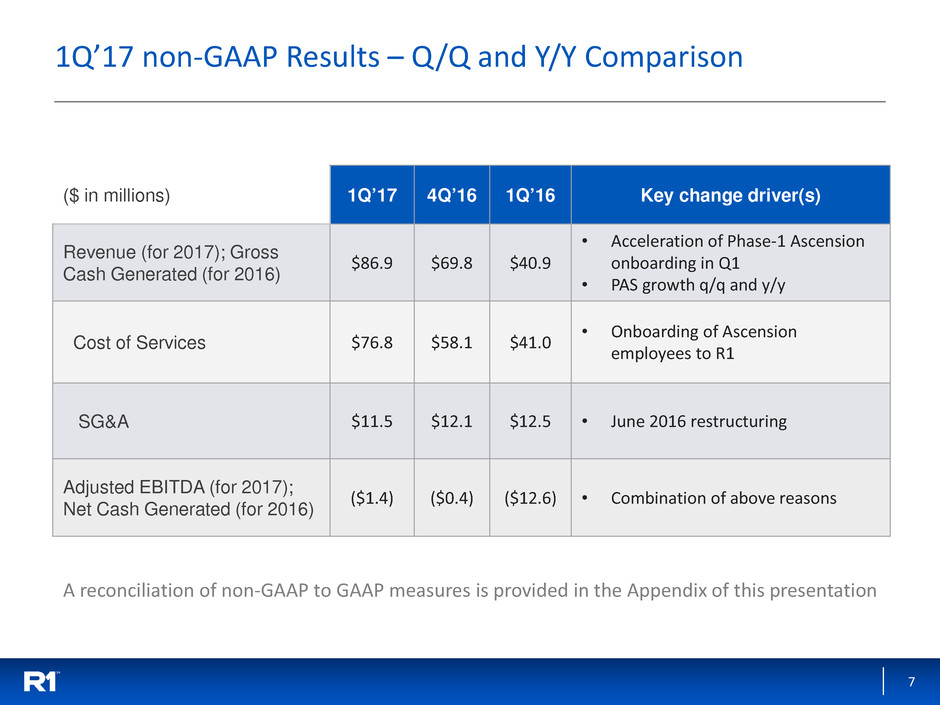
1Q’17 non-GAAP Results – Q/Q and Y/Y Comparison
($ in millions) 1Q’17 4Q’16 1Q’16 Key change driver(s)
Revenue (for 2017); Gross
Cash Generated (for 2016)
$86.9 $69.8 $40.9
• Acceleration of Phase-1 Ascension
onboarding in Q1
• PAS growth q/q and y/y
Cost of Services $76.8 $58.1 $41.0
• Onboarding of Ascension
employees to R1
SG&A $11.5 $12.1 $12.5 • June 2016 restructuring
Adjusted EBITDA (for 2017);
Net Cash Generated (for 2016)
($1.4) ($0.4) ($12.6) • Combination of above reasons
A reconciliation of non-GAAP to GAAP measures is provided in the Appendix of this presentation
8
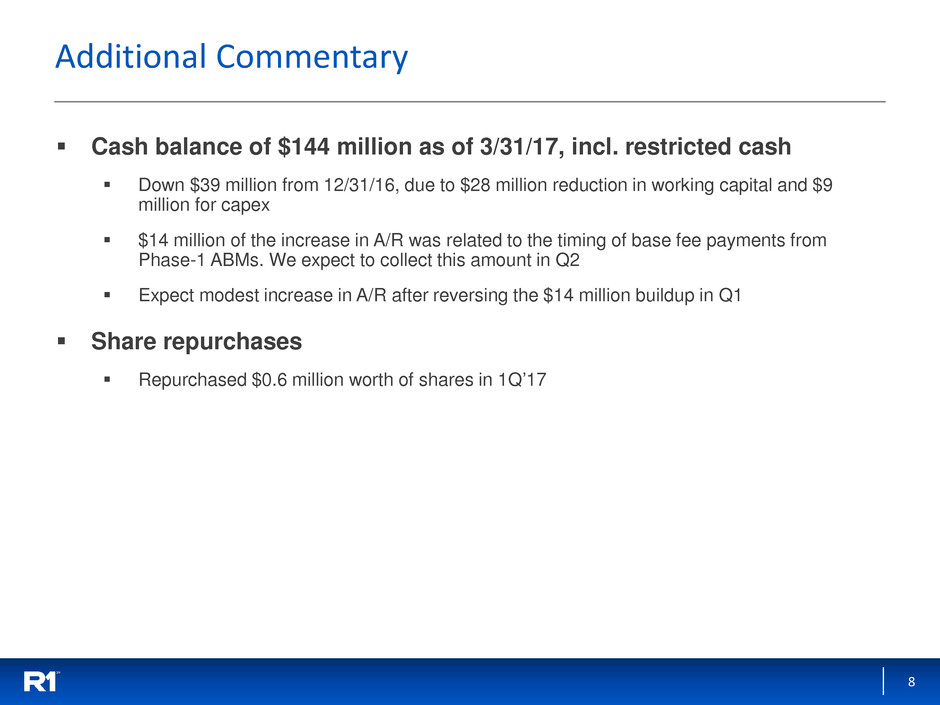
Additional Commentary
Cash balance of $144 million as of 3/31/17, incl. restricted cash
Down $39 million from 12/31/16, due to $28 million reduction in working capital and $9
million for capex
$14 million of the increase in A/R was related to the timing of base fee payments from
Phase-1 ABMs. We expect to collect this amount in Q2
Expect modest increase in A/R after reversing the $14 million buildup in Q1
Share repurchases
Repurchased $0.6 million worth of shares in 1Q’17
9
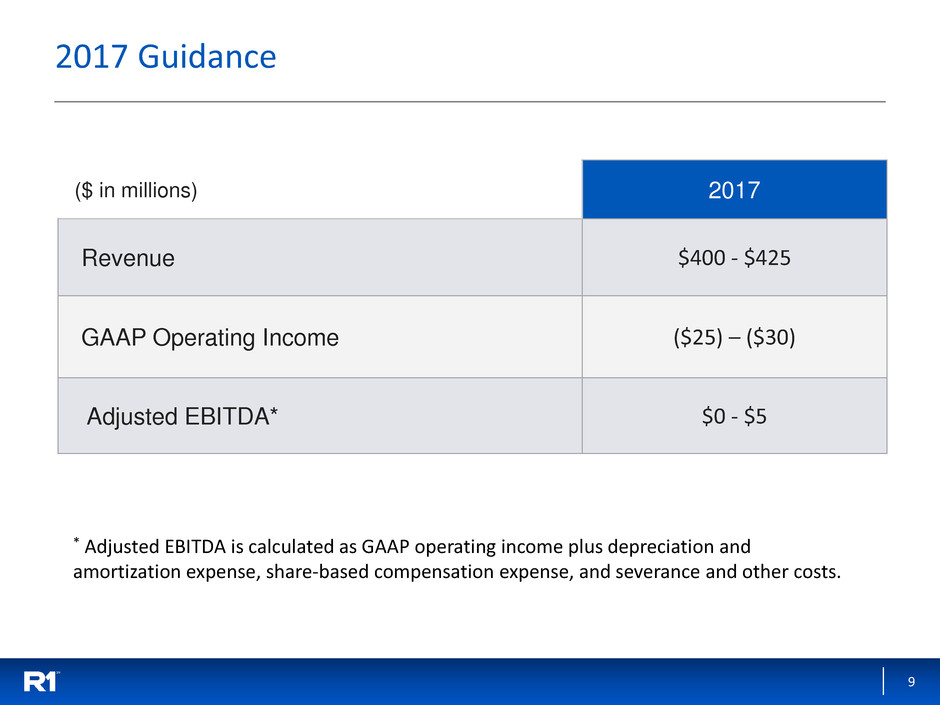
2017 Guidance
($ in millions) 2017
Revenue $400 - $425
GAAP Operating Income ($25) – ($30)
Adjusted EBITDA* $0 - $5
* Adjusted EBITDA is calculated as GAAP operating income plus depreciation and
amortization expense, share-based compensation expense, and severance and other costs.
10
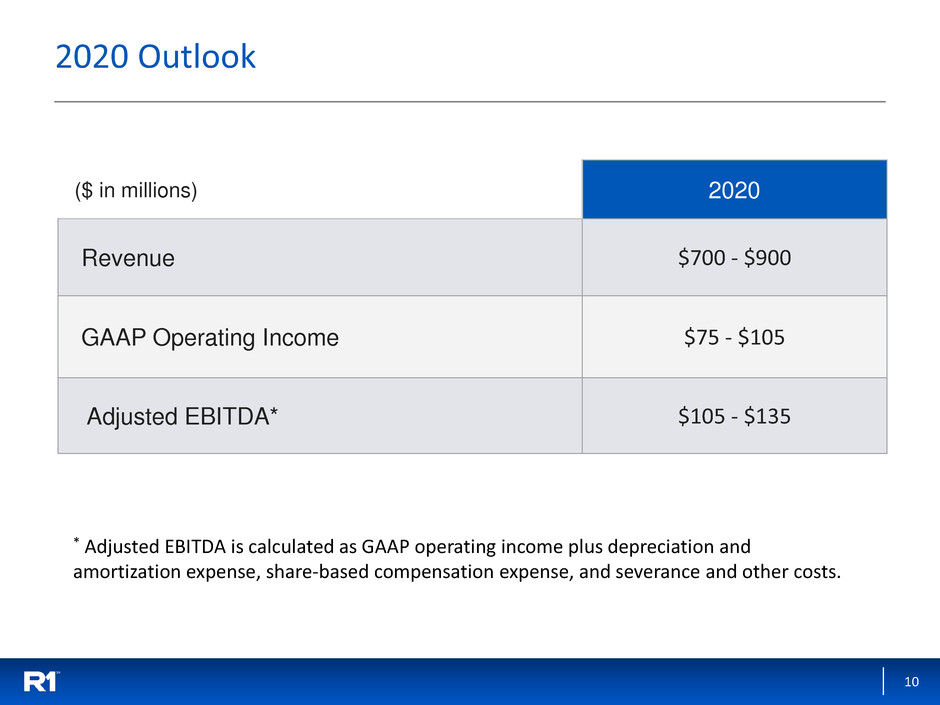
2020 Outlook
($ in millions) 2020
Revenue $700 - $900
GAAP Operating Income $75 - $105
Adjusted EBITDA* $105 - $135
* Adjusted EBITDA is calculated as GAAP operating income plus depreciation and
amortization expense, share-based compensation expense, and severance and other costs.
11
Appendix
12
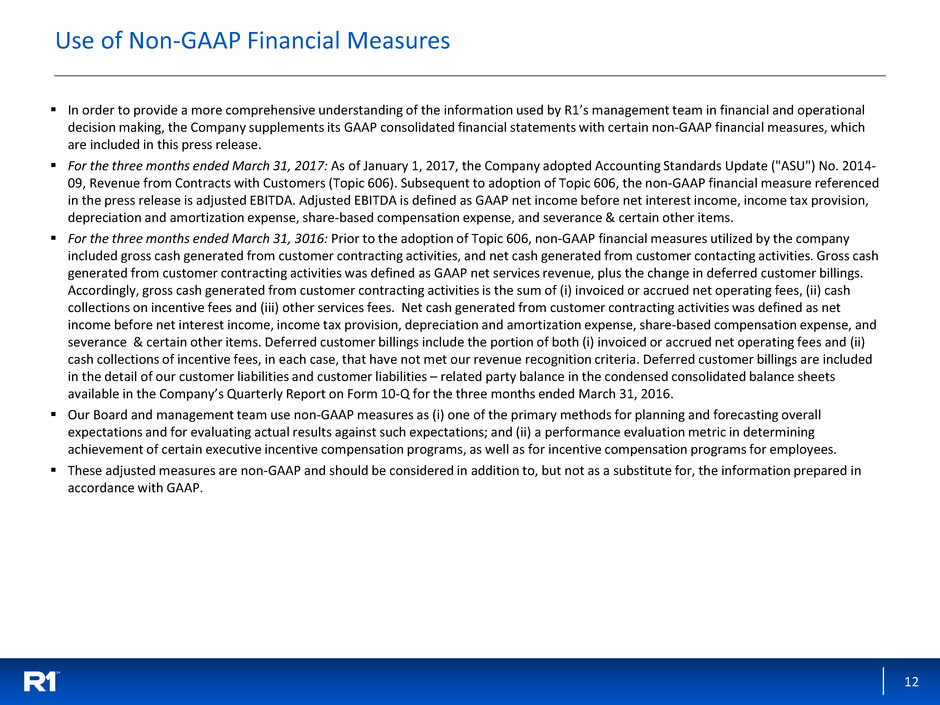
Use of Non-GAAP Financial Measures
In order to provide a more comprehensive understanding of the information used by R1’s management team in financial and operational
decision making, the Company supplements its GAAP consolidated financial statements with certain non-GAAP financial measures, which
are included in this press release.
For the three months ended March 31, 2017: As of January 1, 2017, the Company adopted Accounting Standards Update ("ASU") No. 2014-
09, Revenue from Contracts with Customers (Topic 606). Subsequent to adoption of Topic 606, the non-GAAP financial measure referenced
in the press release is adjusted EBITDA. Adjusted EBITDA is defined as GAAP net income before net interest income, income tax provision,
depreciation and amortization expense, share-based compensation expense, and severance & certain other items.
For the three months ended March 31, 3016: Prior to the adoption of Topic 606, non-GAAP financial measures utilized by the company
included gross cash generated from customer contracting activities, and net cash generated from customer contacting activities. Gross cash
generated from customer contracting activities was defined as GAAP net services revenue, plus the change in deferred customer billings.
Accordingly, gross cash generated from customer contracting activities is the sum of (i) invoiced or accrued net operating fees, (ii) cash
collections on incentive fees and (iii) other services fees. Net cash generated from customer contracting activities was defined as net
income before net interest income, income tax provision, depreciation and amortization expense, share-based compensation expense, and
severance & certain other items. Deferred customer billings include the portion of both (i) invoiced or accrued net operating fees and (ii)
cash collections of incentive fees, in each case, that have not met our revenue recognition criteria. Deferred customer billings are included
in the detail of our customer liabilities and customer liabilities – related party balance in the condensed consolidated balance sheets
available in the Company’s Quarterly Report on Form 10-Q for the three months ended March 31, 2016.
Our Board and management team use non-GAAP measures as (i) one of the primary methods for planning and forecasting overall
expectations and for evaluating actual results against such expectations; and (ii) a performance evaluation metric in determining
achievement of certain executive incentive compensation programs, as well as for incentive compensation programs for employees.
These adjusted measures are non-GAAP and should be considered in addition to, but not as a substitute for, the information prepared in
accordance with GAAP.
13
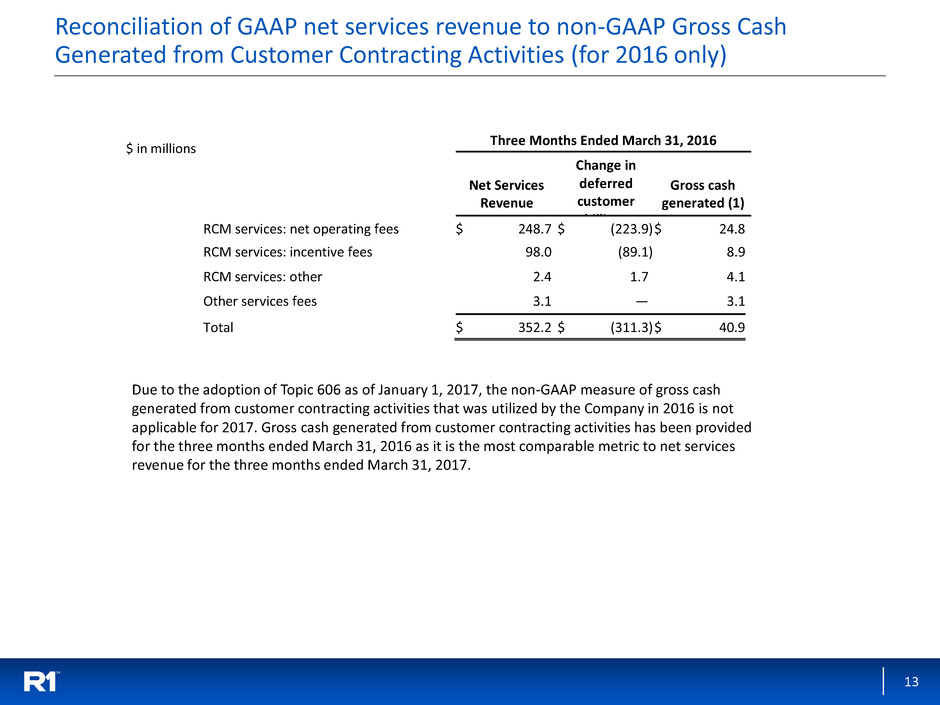
Reconciliation of GAAP net services revenue to non-GAAP Gross Cash
Generated from Customer Contracting Activities (for 2016 only)
Three Months Ended March 31, 2016
Net Services
Revenue
Change in
deferred
customer
billi
Gross cash
generated (1)
RCM services: net operating fees $ 248.7 $ (223.9 ) $ 24.8
RCM services: incentive fees 98.0 (89.1 ) 8.9
RCM services: other 2.4 1.7 4.1
Other services fees 3.1 — 3.1
Total $ 352.2 $ (311.3 ) $ 40.9
Due to the adoption of Topic 606 as of January 1, 2017, the non-GAAP measure of gross cash
generated from customer contracting activities that was utilized by the Company in 2016 is not
applicable for 2017. Gross cash generated from customer contracting activities has been provided
for the three months ended March 31, 2016 as it is the most comparable metric to net services
revenue for the three months ended March 31, 2017.
$ in millions
14
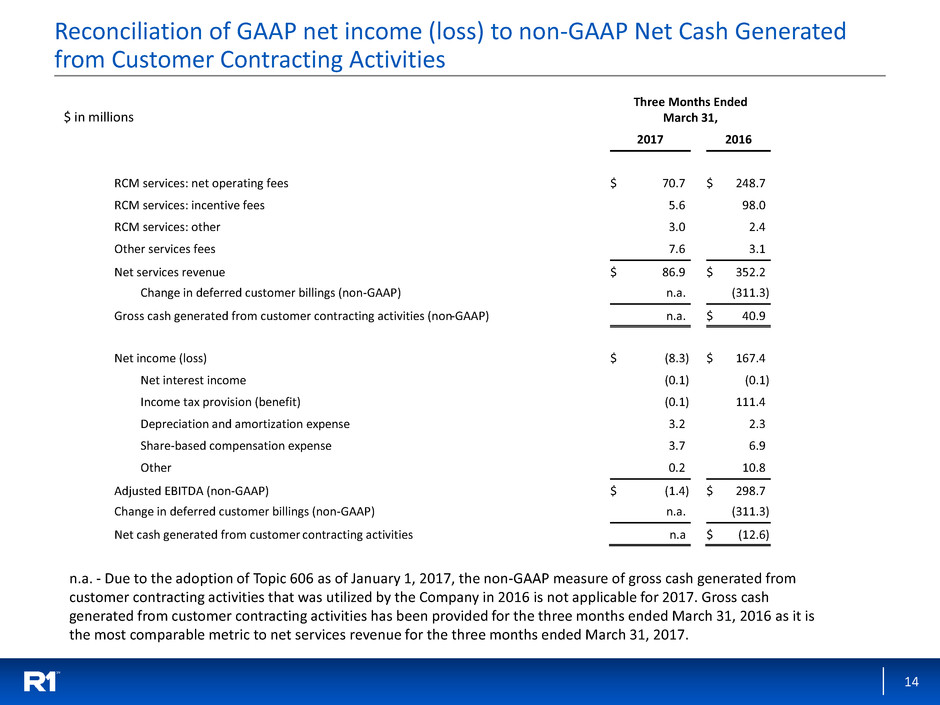
Reconciliation of GAAP net income (loss) to non-GAAP Net Cash Generated
from Customer Contracting Activities
$ in millions
Three Months Ended
March 31,
2017 2016
RCM services: net operating fees $ 70.7 $ 248.7
RCM services: incentive fees 5.6 98.0
RCM services: other 3.0 2.4
Other services fees 7.6 3.1
Net services revenue $ 86.9 $ 352.2
Change in deferred customer billings (non-GAAP) n.a. (311.3 )
Gross cash generated from customer contracting activities (non-GAAP) n.a. $ 40.9
Net income (loss) $ (8.3 ) $ 167.4
Net interest income (0.1 ) (0.1 )
Income tax provision (benefit) (0.1 ) 111.4
Depreciation and amortization expense 3.2 2.3
Share-based compensation expense 3.7 6.9
Other 0.2 10.8
Adjusted EBITDA (non-GAAP) $ (1.4 ) $ 298.7
Change in deferred customer billings (non-GAAP) n.a. (311.3 )
Net cash generated from customer contracting activities n.a $ (12.6 )
n.a. - Due to the adoption of Topic 606 as of January 1, 2017, the non-GAAP measure of gross cash generated from
customer contracting activities that was utilized by the Company in 2016 is not applicable for 2017. Gross cash
generated from customer contracting activities has been provided for the three months ended March 31, 2016 as it is
the most comparable metric to net services revenue for the three months ended March 31, 2017.
15
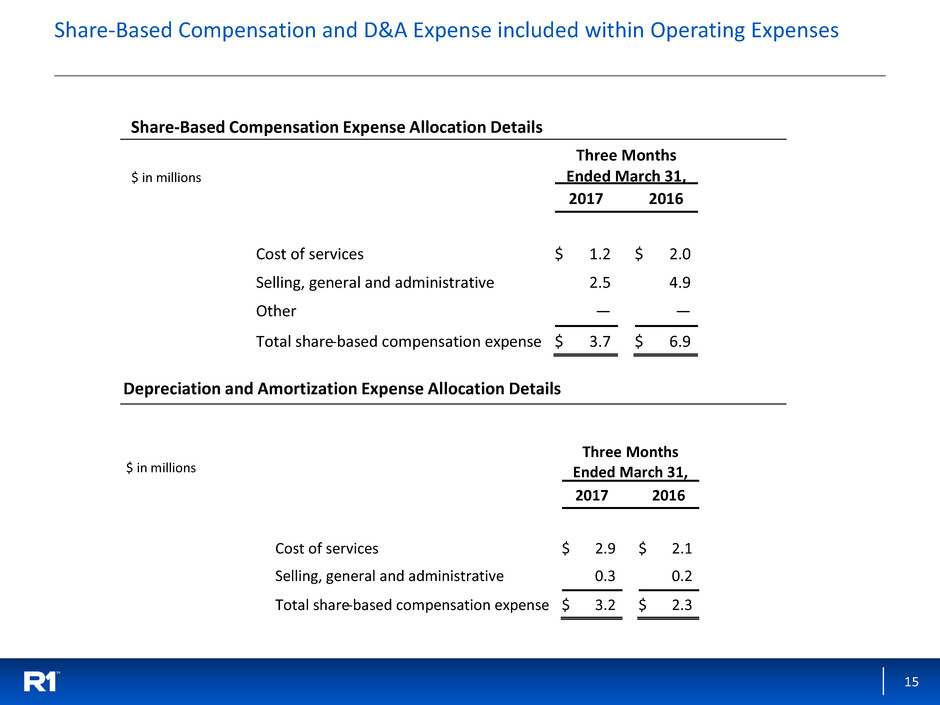
Three Months
Ended March 31,
2017 2016
Cost of services $ 2.9 $ 2.1
Selling, general and administrative 0.3 0.2
Total share-based compensation expense $ 3.2 $ 2.3
Share-Based Compensation and D&A Expense included within Operating Expenses
Share-Based Compensation Expense Allocation Details
Depreciation and Amortization Expense Allocation Details
$ in millions
$ in millions
Three Months
Ended March 31,
2017 2016
Cost of services $ 1.2 $ 2.0
Selling, general and administrative 2.5 4.9
Other — —
Total share-based compensation expense $ 3.7 $ 6.9
16
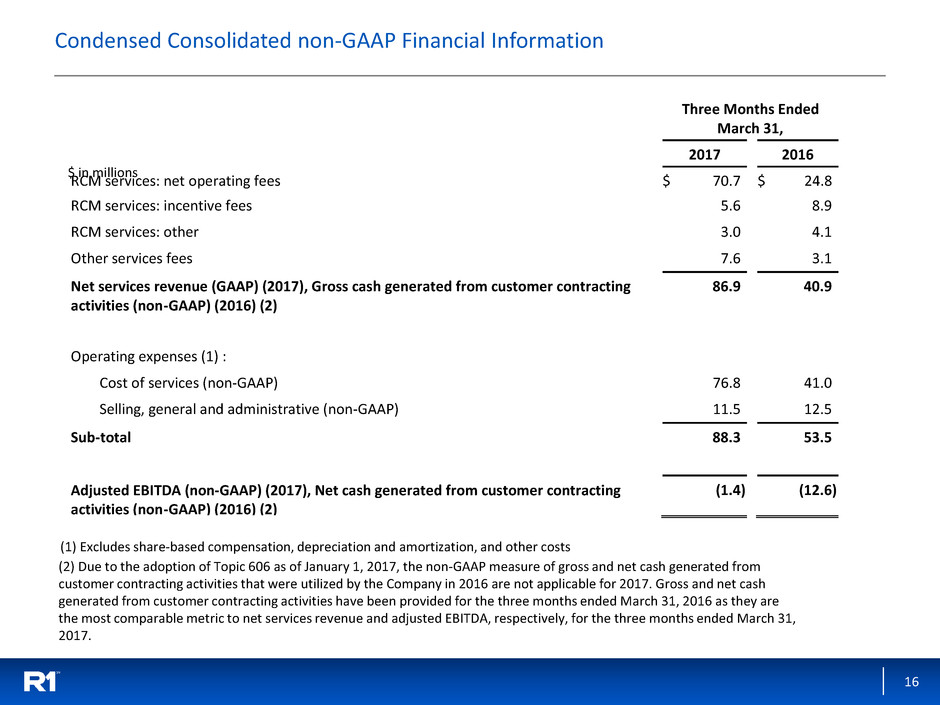
Condensed Consolidated non-GAAP Financial Information
$ in millions
(1) Excludes share-based compensation, depreciation and amortization, and other costs
Three Months Ended
March 31,
2017 2016
RCM services: net operating fees $ 70.7 $ 24.8
RCM services: incentive fees 5.6 8.9
RCM services: other 3.0 4.1
Other services fees 7.6 3.1
Net services revenue (GAAP) (2017), Gross cash generated from customer contracting
activities (non-GAAP) (2016) (2)
86.9 40.9
Operating expenses (1) :
Cost of services (non-GAAP) 76.8 41.0
Selling, general and administrative (non-GAAP) 11.5 12.5
Sub-total 88.3 53.5
Adjusted EBITDA (non-GAAP) (2017), Net cash generated from customer contracting
activities (non-GAAP) (2016) (2)
(1.4 ) (12.6 )
(2) Due to the adoption of Topic 606 as of January 1, 2017, the non-GAAP measure of gross and net cash generated from
customer contracting activities that were utilized by the Company in 2016 are not applicable for 2017. Gross and net cash
generated from customer contracting activities have been provided for the three months ended March 31, 2016 as they are
the most comparable metric to net services revenue and adjusted EBITDA, respectively, for the three months ended March 31,
2017.
17
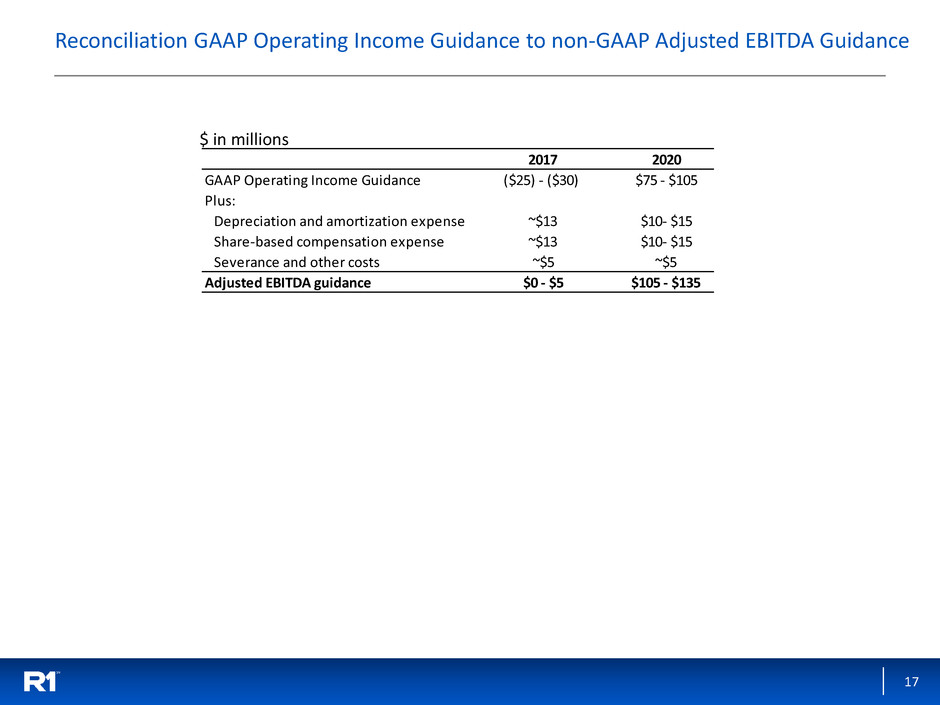
Reconciliation GAAP Operating Income Guidance to non-GAAP Adjusted EBITDA Guidance
$ in millions
2017 2020
GAAP Operating Income Guidance ($25) - ($30) $75 - $105
Plus:
Depreciation and amortization expense ~$13 $10- $15
Share-based compensation expense ~$13 $10- $15
Severance and other costs ~$5 ~$5
Adjusted EBITDA guidance $0 - $5 $105 - $135
