Attached files
| file | filename |
|---|---|
| EX-99.1 - EXHIBIT 99.1 - BROADWIND, INC. | exh_991.htm |
| 8-K - FORM 8-K - BROADWIND, INC. | f8k_050217.htm |
EXHIBIT 99.2

Q1 2017 Earnings Call May 2, 2017

Industry Data and Forward - Looking Statements Disclaimer ▪ Broadwind obtained the industry and market data used throughout this presentation from our own research, internal surveys and st udies conducted by third parties, independent industry associations or general publications and other publicly available informatio n. Independent industry publications and surveys generally state that they have obtained information from sources believed to be reliable, but do not gu arantee the accuracy or completeness of such information. Forecasts are particularly likely to be inaccurate, especially over long periods of time. W e a re not aware of any misstatements in the industry data we have presented herein, but estimates involve risks and uncertainties and a re subject to change based on various factors beyond our control. ▪ This presentation contains “forward - looking statements ”, as defined in Section 21E of the Securities Exchange Act of 1934, as amended. Forward - looking statements include any statement that does not directly relate to a current or historical fact. Our forward - look ing statements may include or relate to our beliefs, expectations, plans and/or assumptions with respect to the following: (i ) state, local and federal regulatory frameworks affecting the industries in which we compete, including the wind energy industry, and the related extension, conti nua tion or renewal of federal tax incentives and grants and state renewable portfolio standards; (ii) our customer relationships and efforts to div ers ify our customer base and sector focus and leverage customer relationships across business units; (iii) our ability to continue to grow our busines s o rganically and through acquisitions; (iv) the sufficiency of our liquidity and alternate sources of funding, if necessary; (v) our ability t o r ealize revenue from customer orders and backlog; (vi) our ability to operate our business efficiently, manage capital expenditures and costs effe cti vely, and generate cash flow; (vii) the economy and the potential impact it may have on our business, including our customers; (viii) the state of the wind energy market and other energy and industrial markets generally and the impact of competition and economic volatility in those marke ts; (ix) the effects of market disruptions and regular market volatility, including fluctuations in the price of oil, gas and other commodities; (x) the effects of the recent change of administrations in the U.S. federal government; (xi) our ability to successfully integrate and operate the business of Red Wolf Company, LLC and to identify, negotiate and execute future acquisitions; and (xii) the potential loss of tax benefits if we experience an “ownership change” under Section 382 of the Internal Revenue Code of 1986, as amended. These statements are based on information currently available to us and are subject to various risks, uncertainties and other factors. We are under no duty to update any of these statements. You sh oul d not consider any list of such factors to be an exhaustive statement of all of the risks, uncertainties or other factors that could cause our c urr ent beliefs, expectations, plans and/or assumptions to change. ▪ This presentation contains non - GAAP financial information. We believe that certain non - GAAP financial measures may provide users of this financial information with meaningful comparisons between current results and results in prior operating periods. We believe tha t these non - GAAP financial measures can provide additional meaningful reflection of underlying trends of the business because they provide a c omp arison of historical information that excludes certain infrequently occurring or non - operational items that impact the overall comparabili ty. Non - GAAP financial measures should be viewed in addition to, and not as an alternative to, our reported results prepared in accordance wi th GAAP. Please see our earnings release dated May 2, 2017 for a reconciliation of certain non - GAAP measures presented in this presentation. May 2, 2017

Q1 2017 Highlights May 2, 2017 • Completed Red Wolf acquisition — provides new growth platform and exposure to gas - fired utility scale turbine market • Q1 revenue up 20%; strong results from Towers — volume, productivity and overhead absorption all favorable • Gross Profit rose ~300 basis points to 11.4% • $.43 EPS – incl. one - time $.34 income tax benefit • EBITDA of $3.9M, 7% of sales • Initial evidence of recovery in Gearing markets
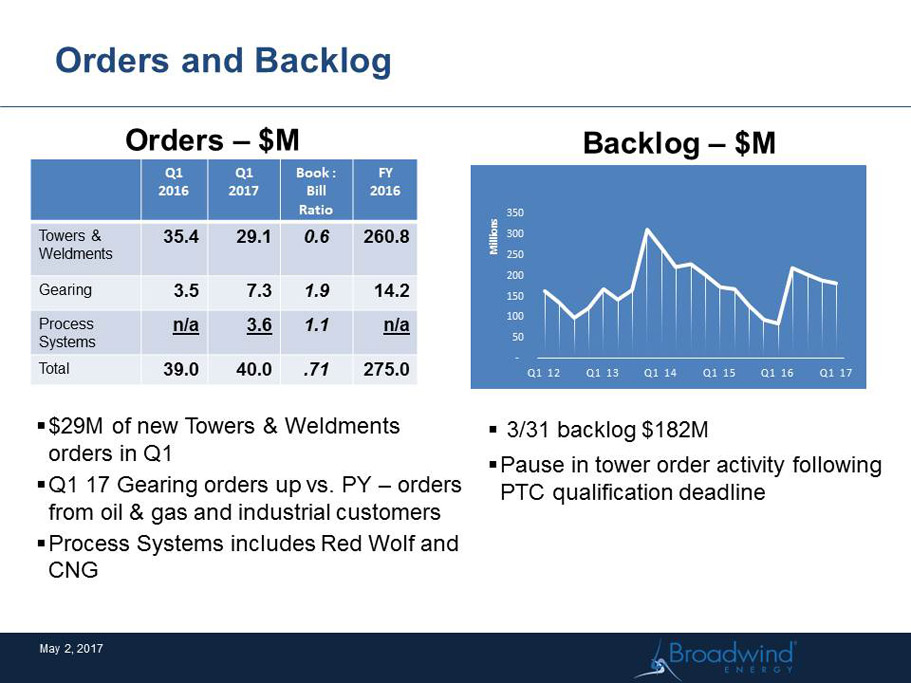
Orders and Backlog Orders – $M ▪ $29M of new Towers & Weldments orders in Q1 ▪ Q1 17 Gearing orders up vs. PY – orders from oil & gas and industrial customers ▪ Process Systems includes Red Wolf and CNG Backlog – $M ▪ 3/31 backlog $182M ▪ Pause in tower order activity following PTC qualification deadline Q1 2016 Q1 2017 Book : Bill Ratio FY 2016 Towers & Weldments 35.4 29.1 0.6 260.8 Gearing 3.5 7.3 1.9 14.2 Process Systems n/a 3.6 1.1 n/a Total 39.0 40.0 .71 275.0 May 2, 2017 - 50 100 150 200 250 300 350 Q1 12 Q1 13 Q1 14 Q1 15 Q1 16 Q1 17 Millions
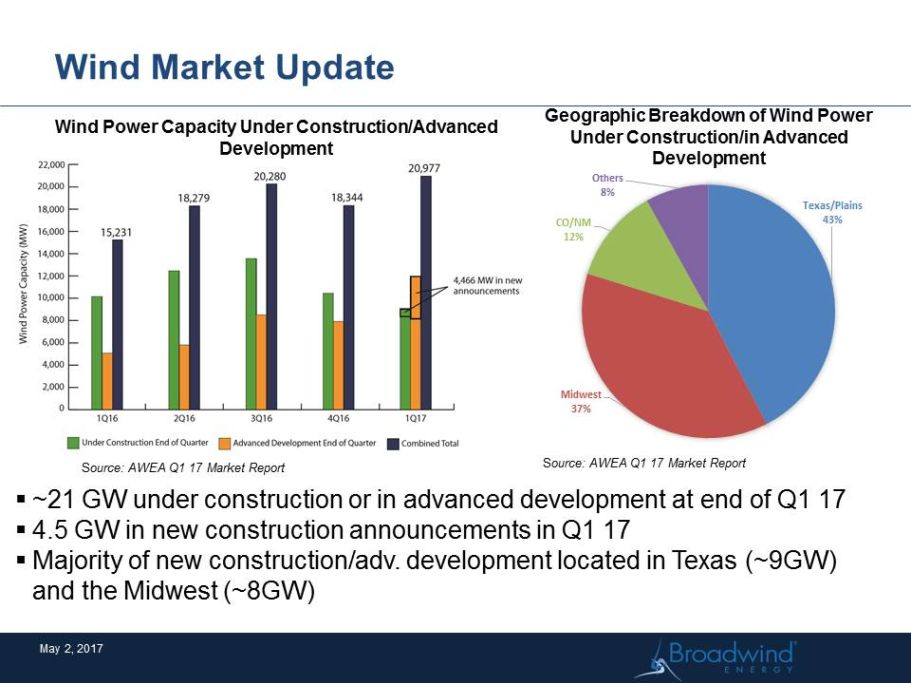
Wind Market Update May 2, 2017 Texas/Plai ns 43% Midwest 37% CO/NM 12% Others 8% ▪ ~21 GW under construction or in advanced development at end of Q1 17 ▪ 4.5 GW in new construction announcements in Q1 17 ▪ Majority of new construction/adv. development located in Texas (~9GW) and the Midwest (~8GW) Wind Power Capacity Under Construction/Advanced Development Geographic Breakdown of Wind Power Under Construction/in Advanced Development S ource: AWEA Q1 17 Market Report S ource: AWEA Q1 17 Market Report
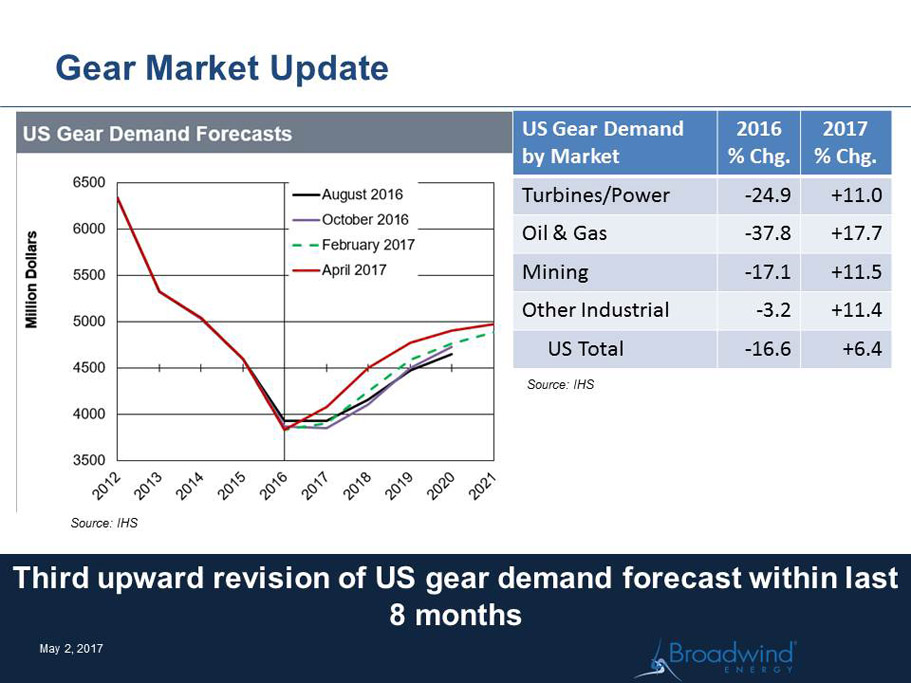
Gear Market Update May 2, 2017 Source: IHS US Gear Demand by Market 2016 % Chg. 2017 % Chg. Turbines/Power - 24.9 +11.0 Oil & Gas - 37.8 +17.7 Mining - 17.1 +11.5 Other Industrial - 3.2 +11.4 US Total - 16.6 +6.4 Source: IHS Third upward revision of US gear demand forecast within last 8 months
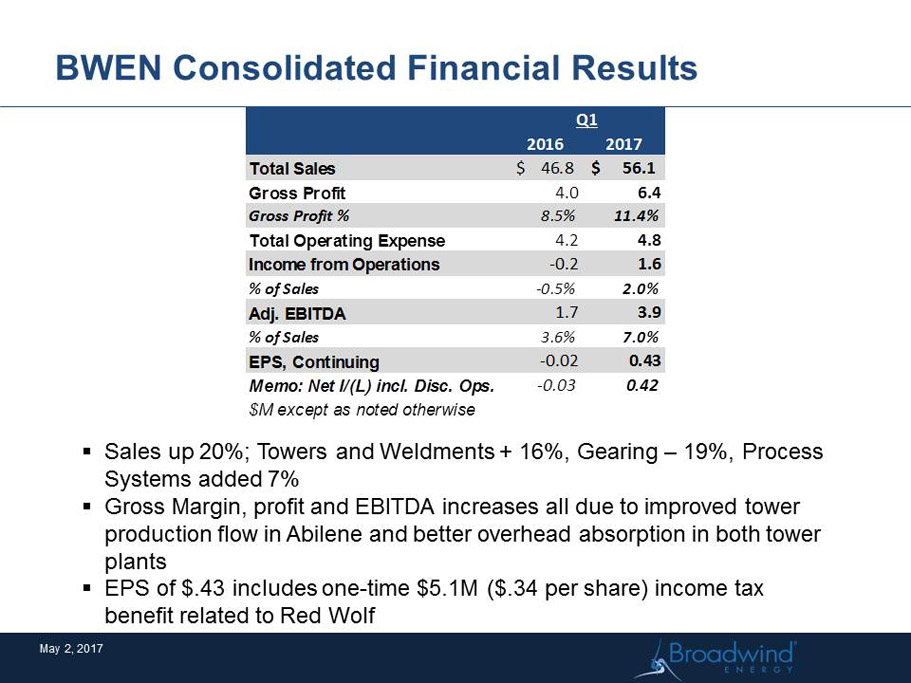
BWEN Consolidated Financial Results May 2, 2017 ▪ Sales up 20%; Towers and Weldments + 16%, Gearing – 19%, Process Systems added 7% ▪ Gross Margin, profit and EBITDA increases all due to improved tower production flow in Abilene and better overhead absorption in both tower plants ▪ EPS of $.43 includes one - time $5.1M ($.34 per share) income tax benefit related to Red Wolf 2016 2017 Total Sales 46.8$ 56.1$ Gross Profit 4.0 6.4 Gross Profit % 8.5% 11.4% Total Operating Expense 4.2 4.8 Income from Operations -0.2 1.6 % of Sales -0.5% 2.0% Adj. EBITDA 1.7 3.9 % of Sales 3.6% 7.0% EPS, Continuing -0.02 0.43 Memo: Net I/(L) incl. Disc. Ops. -0.03 0.42 $M except as noted otherwise Q1
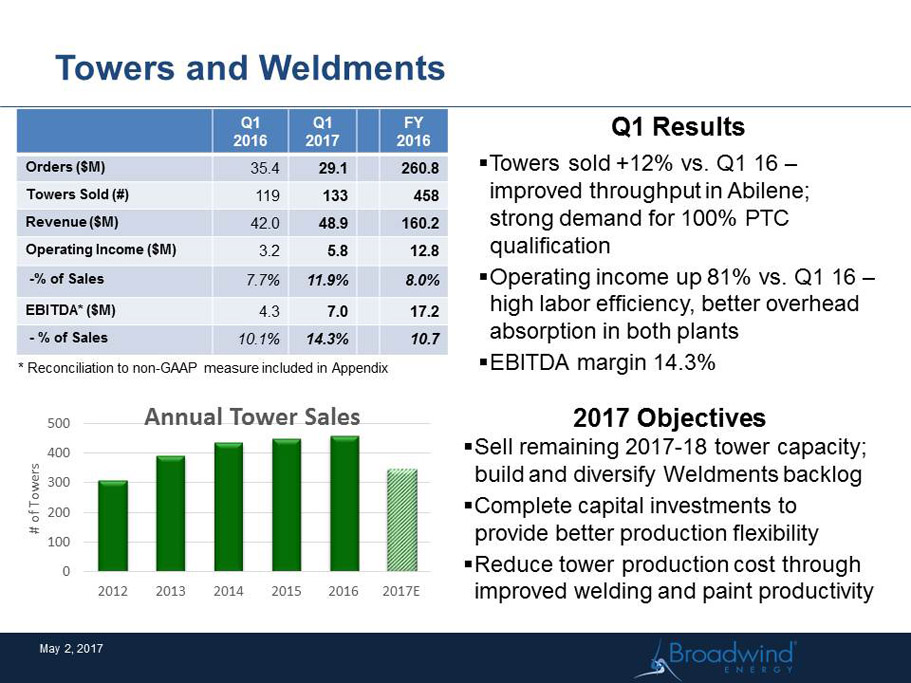
Towers and Weldments Q1 2016 Q1 2017 FY 2016 Orders ($M) 35.4 29.1 260.8 Towers Sold (#) 119 133 458 Revenue ($M) 42.0 48.9 160.2 Operating Income ($M) 3.2 5.8 12.8 - % of Sales 7.7% 11.9% 8.0% EBITDA* ($M) 4.3 7.0 17.2 - % of Sales 10.1% 14.3% 10.7 Q1 Results ▪ Towers sold +12% vs. Q1 16 – improved throughput in Abilene; strong demand for 100% PTC qualification ▪ Operating income up 81% vs. Q1 16 – high labor efficiency, better overhead absorption in both plants ▪ EBITDA margin 14.3% 2017 Objectives ▪ Sell remaining 2017 - 18 tower capacity; build and diversify Weldments backlog ▪ Complete capital investments to provide better production flexibility ▪ Reduce tower production cost through improved welding and paint productivity May 2, 2017 0 100 200 300 400 500 2012 2013 2014 2015 2016 2017E # of Towers Annual Tower Sales * Reconciliation to non - GAAP measure included in Appendix
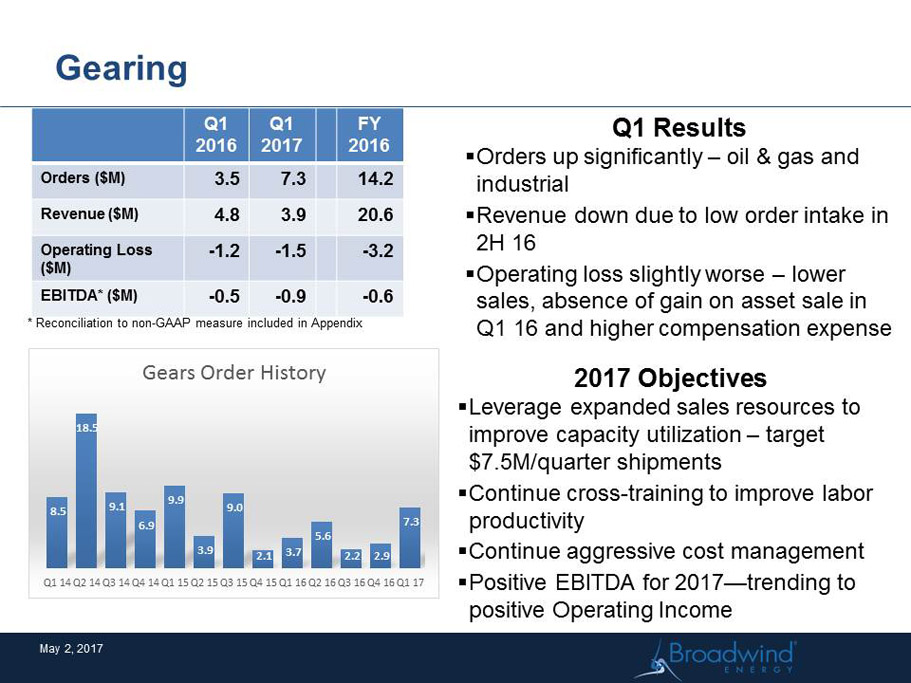
Gearing Q1 2016 Q1 2017 FY 2016 Orders ($M) 3.5 7.3 14.2 Revenue ($M) 4.8 3.9 20.6 Operating Loss ($M) - 1.2 - 1.5 - 3.2 EBITDA* ($M) - 0.5 - 0.9 - 0.6 Q1 Results ▪ Orders up significantly – oil & gas and industrial ▪ Revenue down due to low order intake in 2H 16 ▪ Operating loss slightly worse – lower sales, absence of gain on asset sale in Q1 16 and higher compensation expense May 2, 2017 2017 Objectives ▪ Leverage expanded sales resources to improve capacity utilization – target $7.5M/quarter shipments ▪ Continue cross - training to improve labor productivity ▪ Continue aggressive cost management ▪ Positive EBITDA for 2017 — trending to positive Operating Income * Reconciliation to non - GAAP measure included in Appendix 8.5 18.5 9.1 6.9 9.9 3.9 9.0 2.1 3.7 5.6 2.2 2.9 7.3 Q1 14 Q2 14 Q3 14 Q4 14 Q1 15 Q2 15 Q3 15 Q4 15 Q1 16 Q2 16 Q3 16 Q4 16 Q1 17 Gears Order History
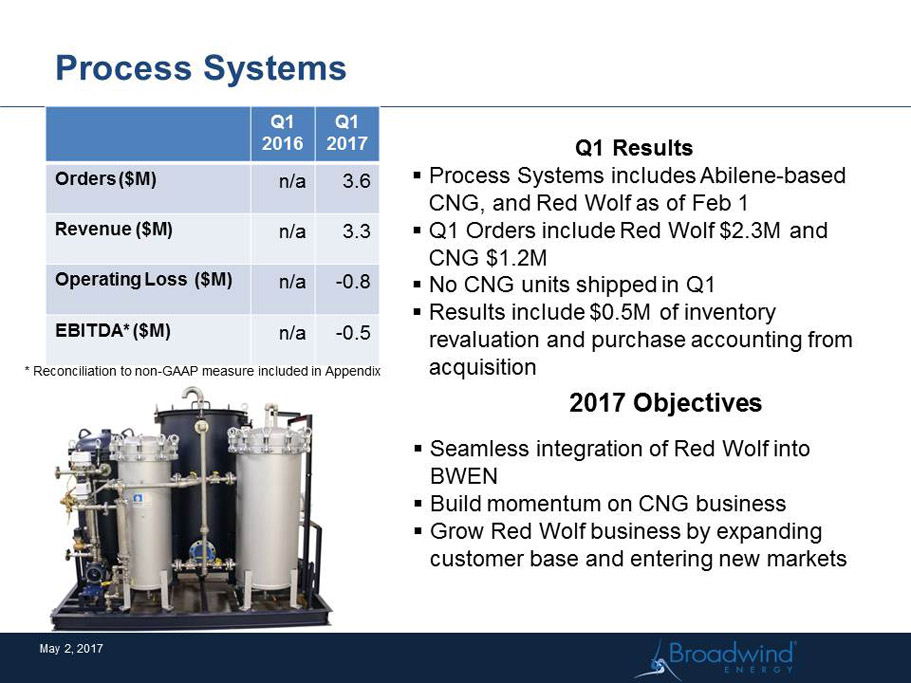
May 2, 2017 Process Systems Q1 2016 Q1 2017 Orders ($M) n/a 3.6 Revenue ($M) n/a 3.3 Operating Loss ($M) n/a - 0.8 EBITDA* ($M) n/a - 0.5 * Reconciliation to non - GAAP measure included in Appendix Q1 Results ▪ Process Systems includes Abilene - based CNG, and Red Wolf as of Feb 1 ▪ Q1 Orders include Red Wolf $2.3M and CNG $1.2M ▪ No CNG units shipped in Q1 ▪ Results include $0.5M of inventory revaluation and purchase accounting from acquisition 2017 Objectives ▪ Seamless integration of Red Wolf into BWEN ▪ Build momentum on CNG business ▪ Grow Red Wolf business by expanding customer base and entering new markets

Operating Working Capital (OWC) May 2, 2017 ▪ Q1 OWC back in “normal” range -- $.07/ dollar sales ▪ OWC increase driven by addition of Red Wolf and higher A/R — surge of March shipments ▪ 2017 OWC expected to rise with expansion of Gears and addition of Red Wolf * Operating Working Capital = Trade A/R + Inventories – Trade Payables – Customer Deposits 12/31/16 3/31/17 DSO 22 39 Inv. Turns 8.2 7.7 DPO 33 36 Cash Conv. (days) 0 28 $- $0.02 $0.04 $0.06 $0.08 $0.10 $0.12 $0.14 $0.16 $0.18 $0.20 OWC* Historical Trend – cents/$ sales OWC* Management

Balance Sheet and Capital Expenditures May 2, 2017 1% 1% 2% 1% 2.0% 2.3% 4.8% 5.4% 5.8% Q1 15 Q2 15 Q3 15 Q4 15 Q1 16 Q2 16 Q3 16 Q4 16 Q1 17 Cap Ex - % of Revenue Typically ~ 2% of revenue Abilene Expansion and Coatings Improvements ▪ Cash Assets dropped as expected - Red Wolf acquisition $16.5M + rebound in working capital ▪ PrivateBank line of credit increased to $ 25M to include Red Wolf -- $6.5M drawn at quarter - end ▪ Capex remains elevated for Abilene expansion and other tower plant improvements – FY capex estimate $8M 12/31/2016 3/31/2017 Cash Assets 21.9$ 0.3$ Accounts Receivable 11.9 23.7 Inventory 21.2 25.8 PPE 54.6 56.0 Other 8.1 25.9 Total Assets 117.7 131.7 Accounts Payable 15.9 19.5 Customer Deposits 18.0 13.6 Debt + Cap. Leases 4.1 10.5 Other 11.1 13.0 Total Liabilities 49.1 56.6 Equity 68.6 75.1 (In Millions)
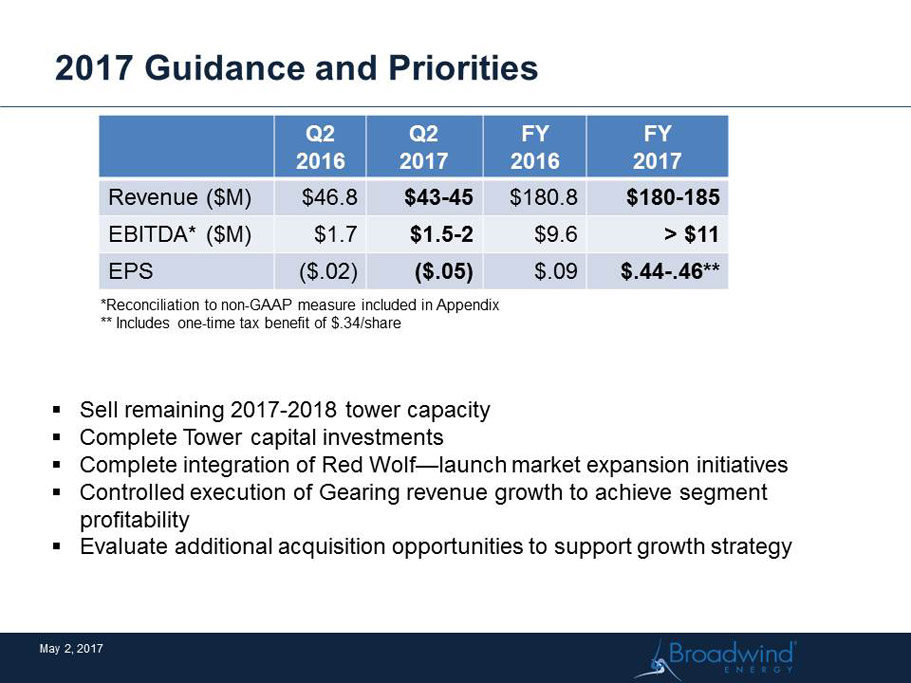
2017 Guidance and Priorities Q2 2016 Q2 2017 FY 2016 FY 2017 Revenue ($M) $46.8 $43 - 45 $180.8 $180 - 185 EBITDA* ($M) $1.7 $1.5 - 2 $9.6 > $11 EPS ($.02) ($.05) $.09 $.44 - .46** May 2, 2017 ▪ Sell remaining 2017 - 2018 tower capacity ▪ Complete T ower capital investments ▪ Complete integration of Red Wolf — launch market expansion initiatives ▪ Controlled execution of Gearing revenue growth to achieve segment profitability ▪ Evaluate additional acquisition opportunities to support growth strategy *Reconciliation to non - GAAP measure included in Appendix ** Includes one - time tax benefit of $.34/share
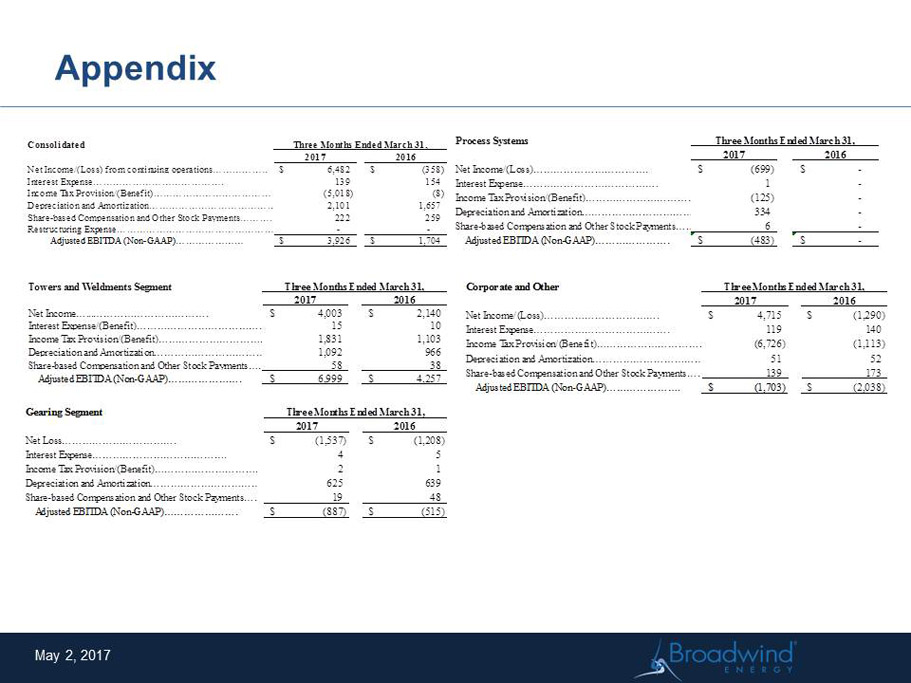
Appendix May 2, 2017 Consolidated 2017 2016 Net Income/(Loss) from continuing operations…………………………….6,482$ (358)$ Interest Expense…………………………………. 139 154 Income Tax Provision/(Benefit)……………………………… (5,018) (8) Depreciation and Amortization………………………………………………………………2,101 1,657 Share-based Compensation and Other Stock Payments………………………………………………………………222 259 Restructuring Expense…………………………………………………... - - Adjusted EBITDA (Non-GAAP)………………… 3,926$ 1,704$ Three Months Ended March 31, Towers and Weldments Segment 2017 2016 Net Income…...……………………………. 4,003$ 2,140$ Interest Expense/(Benefit)…………………………………. 15 10 Income Tax Provision/(Benefit)……………………………… 1,831 1,103 Depreciation and Amortization………………………………………………………………1,092 966 Share-based Compensation and Other Stock Payments………………………………………………………………58 38 Adjusted EBITDA (Non-GAAP)…………………. 6,999$ 4,257$ Three Months Ended March 31, Gearing Segment 2017 2016 Net Loss……………………………. (1,537)$ (1,208)$ Interest Expense…………………………………. 4 5 Income Tax Provision/(Benefit)……………………………… 2 1 Depreciation and Amortization………………………………………………………………625 639 Share-based Compensation and Other Stock Payments………………………………………………………………19 48 Adjusted EBITDA (Non-GAAP)…………………. (887)$ (515)$ Three Months Ended March 31, Process Systems 2017 2016 Net Income/(Loss)……………………………. (699)$ -$ Interest Expense…………………………………. 1 - Income Tax Provision/(Benefit)……………………………… (125) - Depreciation and Amortization………………………………………………………………334 - Share-based Compensation and Other Stock Payments………………………………………………………………6 - Adjusted EBITDA (Non-GAAP)…………………. (483)$ -$ Three Months Ended March 31, Corporate and Other 2017 2016 Net Income/(Loss)……………………………. 4,715$ (1,290)$ Interest Expense…………………………………. 119 140 Income Tax Provision/(Benefit)……………………………… (6,726) (1,113) Depreciation and Amortization………………………………………………………………51 52 Share-based Compensation and Other Stock Payments………………………………………………………………139 173 Adjusted EBITDA (Non-GAAP)…………………. (1,703)$ (2,038)$ Three Months Ended March 31,

Broadwind Energy is a precision manufacturer of structures, equipment
& components for clean tech and other specialized applications . www.BWEN.com May 2, 2017