Attached files
| file | filename |
|---|---|
| 8-K - FORM 8-K - HOME BANCORP, INC. | v465478_8k.htm |
Exhibit 99.1

First Quarter 2017 Investor Presentation

FORWARD LOOKING STATEMENTS Certain comments in this presentation contain certain forward looking statements (as defined in the Securities Exchange Act of 1934 and the regulations thereunder) . Forward looking statements are not historical facts but instead represent only the beliefs, expectations or opinions of Home Bancorp, Inc . and its management regarding future events, many of which, by their nature, are inherently uncertain . Forward looking statements may be identified by the use of such words as : “believe”, “expect”, “anticipate”, “intend”, “plan”, “estimate”, or words of similar meaning, or future or conditional terms such as “will”, “would”, “should”, “could”, “may”, “likely”, “probably”, or “possibly . ” Forward looking statements include, but are not limited to, financial projections and estimates and their underlying assumptions ; statements regarding plans, objectives and expectations with respect to future operations, products and services ; and statements regarding future performance . Such statements are subject to certain risks, uncertainties and assumption, many of which are difficult to predict and generally are beyond the control of Home Bancorp, Inc . and its management, that could cause actual results to differ materially from those expressed in, or implied or projected by, forward looking statements . The following factors, among others, could cause actual results to differ materially from the anticipated results or other expectations expressed in the forward looking statements : ( 1 ) economic and competitive conditions which could affect the volume of loan originations, deposit flows and real estate values ; ( 2 ) the levels of noninterest income and expense and the amount of loan losses ; ( 3 ) competitive pressure among depository institutions increasing significantly ; ( 4 ) the low interest rate environment causing reduced interest margins ; ( 5 ) general economic conditions, either nationally or in the markets in which Home Bancorp, Inc . is or will be doing business, being less favorable than expected ; ( 6 ) political and social unrest, including acts of war or terrorism ; ( 7 ) we may not fully realize all the benefits we anticipated in connection with our acquisitions of other institutions or our assumptions made in connection therewith may prove to be inaccurate ; or ( 8 ) legislation or changes in regulatory requirements adversely affecting the business of Home Bancorp, Inc . Home Bancorp, Inc . undertakes no obligation to update these forward looking statements to reflect events or circumstances that occur after the date on which such statements were made . As used in this report, unless the context otherwise requires, the terms “we,” “our,” “us,” or the “Company” refer to Home Bancorp, Inc . and the term the “Bank” refers to Home Bank, N . A . , a national bank and wholly owned subsidiary of the Company . In addition, unless the context otherwise requires, references to the operations of the Company include the operations of the Bank . For a more detailed description of the factors that may affect Home Bancorp’s operating results or the outcomes described in these forward - looking statements, we refer you to our filings with the Securities and Exchange Commission, including our annual report on Form 10 - K for the year ended December 31 , 2016 . Home Bancorp assumes no obligation to update the forward - looking statements made during this presentation . For more information, please visit our website www . home 24 bank . com . Non - GAAP Information This presentation contains financial information determined by methods other than in accordance with generally accepted accounting principles (“GAAP”) . The Company's management uses this non - GAAP financial information in its analysis of the Company's performance . In this news release, information is included which excludes acquired loans, intangible assets, impact of the gain on the sale of a banking center and the impact of merger - related expenses . Management believes the presentation of this non - GAAP financial information provides useful information that is helpful to a full understanding of the Company’s financial position and core operating results . This non - GAAP financial information should not be viewed as a substitute for financial information determined in accordance with GAAP, nor is it necessarily comparable to non - GAAP financial information presented by other companies .

Our Company ▪ Headquartered in Lafayette, Louisiana ▪ Founded in 1908 ▪ IPO completed in October 2008 ▪ Ticker symbol: HBCP (NASDAQ Global) ▪ Market Cap = $ 259MM as of April 26, 2017 ▪ Added to Russell 3000 Index in 2016 ▪ Assets = $ 1.6 billion as of March 31, 2017 ▪ Acquisition of Bank of New Orleans completed on September 15, 2015 ▪ Ownership (SNL as of April 26, 2017): ▪ Institutional = 42% ▪ Insider/ESOP = 22% 3
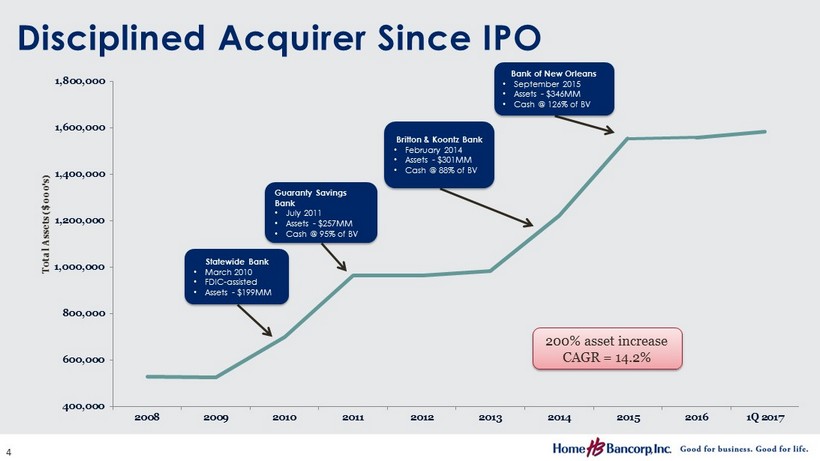
200% asset increase CAGR = 14.2% Statewide Bank • March 2010 • FDIC - assisted • Assets - $199MM Britton & Koontz Bank • February 2014 • Assets - $301MM • Cash @ 88% of BV Guaranty Savings Bank • July 2011 • Assets - $257MM • Cash @ 95% of BV Bank of New Orleans • September 2015 • Assets - $346MM • Cash @ 126% of BV 400,000 600,000 800,000 1,000,000 1,200,000 1,400,000 1,600,000 1,800,000 2008 2009 2010 2011 2012 2013 2014 2015 2016 1Q 2017 Total Assets ($000's) Disciplined Acquirer Since IPO 4

Tangible Common Equity Ratio (1) Peers = BHCs $1 - $3 billion in assets. Peer data as of 12/31/2016. Source: SNL.com (1) Non - GAAP ratio (see tables 3 & 4 in appendix) 5

$0.00 $0.10 $0.20 $0.30 $0.40 $0.50 $0.60 $0.70 $0.80 $0 $5 $10 $15 $20 $25 $30 $35 $40 $45 1Q 2009 2Q 2009 3Q 2009 4Q 2009 1Q 2010 2Q 2010 3Q 2010 4Q 2010 1Q 2011 2Q 2011 3Q 2011 4Q 2011 1Q 2012 2Q 2012 3Q 2012 4Q 2012 1Q 2013 2Q 2013 3Q 2013 4Q 2013 1Q 2014 2Q 2014 3Q 2014 4Q 2014 1Q 2015 2Q 2015 3Q 2015 4Q 2015 1Q 2016 2Q 2016 3Q 2016 4Q 2016 1Q 2017 EPS Price per Share Reported Diluted EPS HBCP Stock Price Paid First Dividend – 4Q 2014 Improving Shareholder Returns 6

Total Return Since 2008 Source: SNL.com. Data as of 4/26/2017 -100 -50 0 50 100 150 200 250 300 350 Dec-08 Feb-09 Apr-09 Jun-09 Aug-09 Oct-09 Dec-09 Feb-10 Apr-10 Jun-10 Aug-10 Oct-10 Dec-10 Feb-11 Apr-11 Jun-11 Aug-11 Oct-11 Dec-11 Feb-12 Apr-12 Jun-12 Aug-12 Oct-12 Dec-12 Feb-13 Apr-13 Jun-13 Aug-13 Oct-13 Dec-13 Feb-14 Apr-14 Jun-14 Aug-14 Oct-14 Dec-14 Feb-15 Apr-15 Jun-15 Aug-15 Oct-15 Dec-15 Feb-16 Apr-16 Jun-16 Aug-16 Oct-16 Dec-16 Feb-17 Total Return (%) HBCP SNL U.S. Bank S&P 500 7
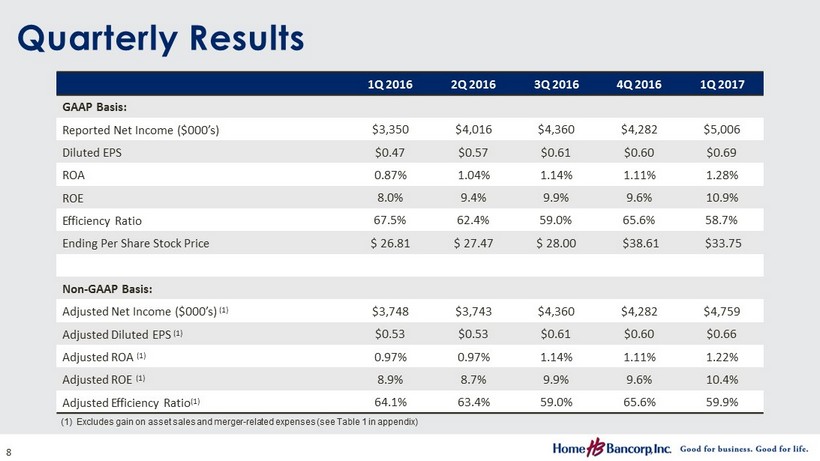
Quarterly Results (1) Excludes gain on asset sales and merger - related expenses (see Table 1 in appendix) 1Q 2016 2Q 2016 3Q 2016 4Q 2016 1Q 2017 GAAP Basis: Reported Net Income ($000’s) $3,350 $4,016 $4,360 $4,282 $5,006 Diluted EPS $0.47 $0.57 $0.61 $0.60 $0.69 ROA 0.87% 1.04% 1.14% 1.11% 1.28% ROE 8.0% 9.4% 9.9% 9.6% 10.9% Efficiency Ratio 67.5% 62.4% 59.0% 65.6% 58.7% Ending Per Share Stock Price $ 26.81 $ 27.47 $ 28.00 $38.61 $33.75 Non - GAAP Basis: Adjusted Net Income ($000’s) (1) $3,748 $3,743 $4,360 $4,282 $4,759 Adjusted Diluted EPS (1) $0.53 $0.53 $0.61 $0.60 $0.66 Adjusted ROA (1) 0.97% 0.97% 1.14% 1.11% 1.22% Adjusted ROE (1) 8.9% 8.7% 9.9% 9.6% 10.4% Adjusted Efficiency Ratio (1) 64.1% 63.4% 59.0% 65.6% 59.9% 8

Effective Balance Sheet Management % of assets • Steady organic loan growth • Relatively small investment portfolio • Core deposit growth has offset capital deployment (1) Excludes loans held for sale 2009 2010 2011 2012 2013 2014 2015 2016 1Q 2017 Cash and Equivalents 5% 6% 4% 4% 4% 3 % 2% 2% 3% Investments 23% 18% 16% 17% 16% 15% 12% 13% 13% Total Loans, net (1) 64% 63% 69% 70% 71% 74% 78% 78% 77% Other Assets 8% 13% 11% 9% 9% 8% 8% 7% 7% Non Maturity Deposits 41% 47% 46% 54% 56% 63% 62% 63% 62% CDs 30% 32% 30% 26% 19% 18% 18% 17% 18% Borrowings and Other Liabilities 4% 2% 10% 5% 11% 6% 9% 8% 8% Shareholders’ Equity 25% 19% 14% 15% 14% 13% 11% 12% 12% 9

Steady Organic Loan Growth (excludes acquisition accounting adjustments) Originated Loan CAGR = 13% 10

In 2008, virtually 100% of loans were located in the Lafayette market. Loan Portfolio as of March 31, 2017 Balance: $ 1.2 billion 1 st Q 2017 average yield = 5.29% CRE 36% 1 - 4 Family 28% C&I 11% Const/Land 11% Home Equity 7% Multi - family 4% Consumer 3% New Orleans 36% Lafayette 26% Northshore 17% Baton Rouge 13% Mississippi 4% Admin 3% Other 1% 11

Commercial Real Estate Portfolio as of March 31, 2017 Balance: $ 444 million 12

C&I Portfolio as of March 31, 2017 Balance: $ 134 million 13

Construction and Land Portfolio as of March 31, 2017 Balance: $ 132 million 14
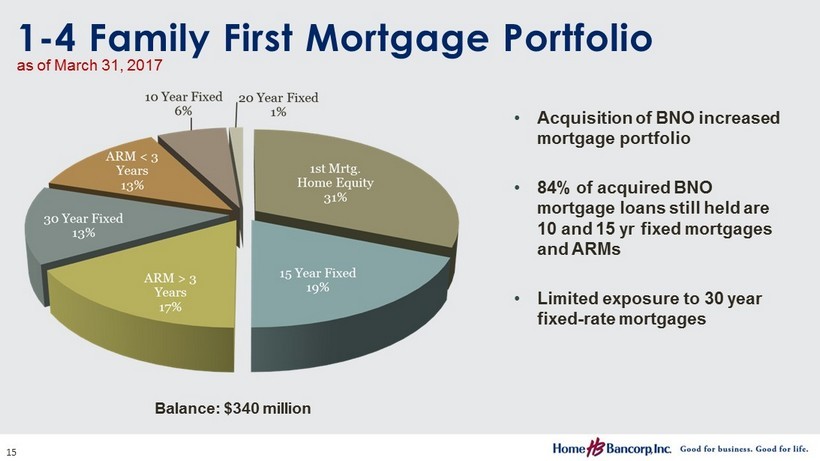
• Acquisition of BNO increased mortgage portfolio • 84% of acquired BNO mortgage loans still held are 10 and 15 yr fixed mortgages and ARMs • Limited exposure to 30 year fixed - rate mortgages 1 - 4 Family First Mortgage Portfolio as of March 31, 2017 Balance: $ 340 million 15

Energy Loans • No shared national credits • Unfunded loan commitments to energy companies = $5.7MM • Energy ALLL = 3.3% as of March 31, 2017 16 CRE $12,845 39% 1.0% Construction and Land 1,068 3% 0.1% Total Real Estate $13,913 42% 1.1% Equipment $5,037 15% 0.4% Marine Vessels 5,974 18% 0.5% Accounts Receivable 5,834 17% 0.5% Unsecured 1,228 4% 0.1% Other 1,218 4% 0.1% Total C&I $19,291 58% 1.6% Total Energy Loans $33,204 100% 2.7% Loans Outstanding % 0f Energy Loans % 0f Total Loans Balance in ($000's)

• Originated NPAs historically low • Aggressively reducing acquired NPAs • Credit discounts on acquired loans Non Performing Assets / Assets Peers = BHCs $1 - $3 billion in assets. Peer data as of 12/31//2016 . Source: SNL.com 17
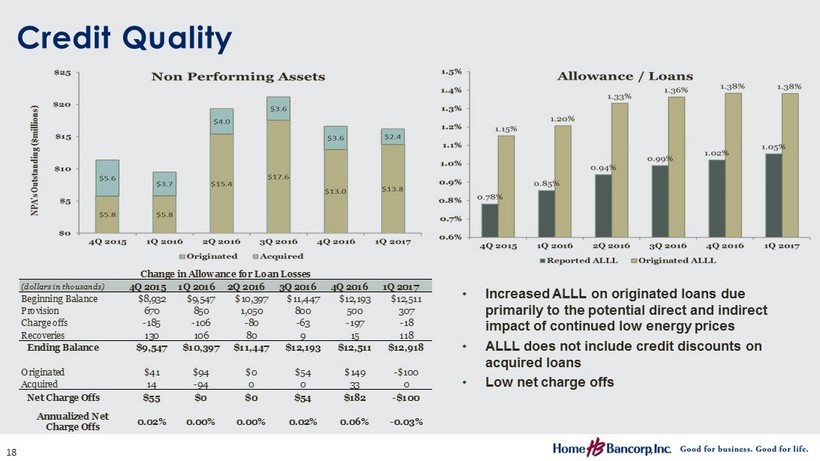
• Increased ALLL on originated loans due primarily to the potential direct and indirect impact of continued low energy prices • ALLL does not include credit discounts on acquired loans • Low net charge offs Credit Quality (dollars in thousands) 4Q 2015 1Q 2016 2Q 2016 3Q 2016 4Q 2016 1Q 2017 Beginning Balance $8,932 $9,547 $10,397 $11,447 $12,193 $12,511 Provision 670 850 1,050 800 500 307 Charge offs -185 -106 -80 -63 -197 -18 Recoveries 130 106 80 9 15 118 Ending Balance $9,547 $10,397 $11,447 $12,193 $12,511 $12,918 Originated $41 $94 $0 $54 $149 -$100 Acquired 14 -94 0 0 33 0 Net Charge Offs $55 $0 $0 $54 $182 -$100 -0.03% Change in Allowance for Loan Losses 0.06%0.02%0.00% Annualized Net Charge Offs 0.02% 0.00% 18

• $ 205 MM, or 13% of Assets • 2.4 Year Effective Duration • 2.23% TE yield in 1 st Q 2017 • 14% of investments are variable rate Investment Portfolio as of March 31, 2017 Current +100 +200 +300 Market Value / Book 0.1% -3.0% -6.3% -9.7% Avg Life / Reprice Term 3.2 3.6 3.9 4.2 Avg Life 3.8 4.2 4.5 4.9 19

Deposit Mix • 1Q 2017 average cost on interest - bearing deposits = 0.42% • No non - relationship brokered deposits • Loan/Deposit ratio increased from 89% (June 30, 2015) to 96% (March 31, 2017) mostly due to acquired BNO loans and deposits 0% 5% 10% 15% 20% 25% 30% 35% 40% 45% 50% - 200,000 400,000 600,000 800,000 1,000,000 1,200,000 1,400,000 2008 2009 2010 2011 2012 2013 2014 2015 2016 1Q 2017 % of Deposits Deposits ($000's) Total Deposits % Non Interest % CDs 20 as of March 31, 2017

Net Interest Margin (TE) Peers = BHCs $1 - $3 billion in assets. Peer data as of 12/31/2016 . Source: SNL.com Outperformed peers by 86 basis points 21

Net Interest Margin Drivers 5 basis point spread Peer = BHCs $1 - $3 billion in assets. Peer data as of 12/31/2016 . Source: SNL.com 76 basis point spread • Favorable asset mix – Gross Loans = 77% of assets (75th percentile) – Investments = 13% of assets ( 31st percentile) • Average loan yield of 5.29% ( 86th percentile) – Loan discount accretion – Higher level of construction loans • Maintained lower costs than peers even after capital was deployed • Slight increase in COF due to LT borrowings from FHLB • Favorable funding mix – Strong non interest deposits, 19% of assets (61st percentile) 22
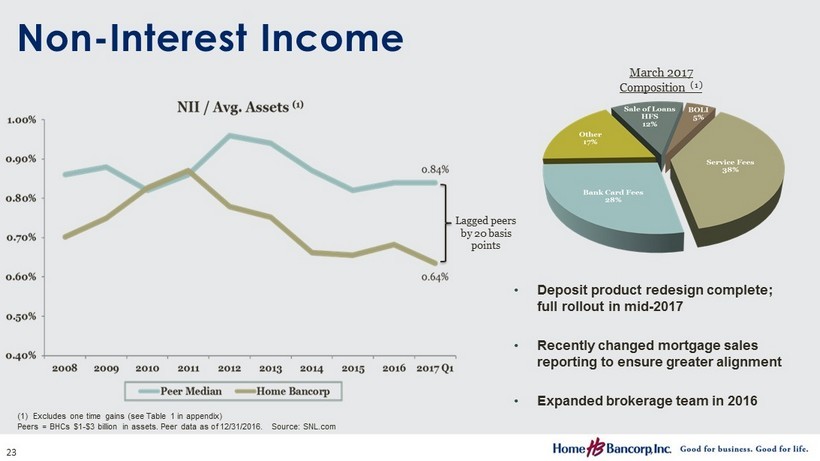
• Deposit product redesign complete; full rollout in mid - 2017 • Recently changed mortgage sales reporting to ensure greater alignment • Expanded brokerage team in 2016 Non - Interest Income (1) Excludes one time gains ( see Table 1 in appendix) Peers = BHCs $1 - $3 billion in assets. Peer data as of 12/31/2016 . Source: SNL.com March 2017 Composition (1) Lagged peers by 20 basis points 23
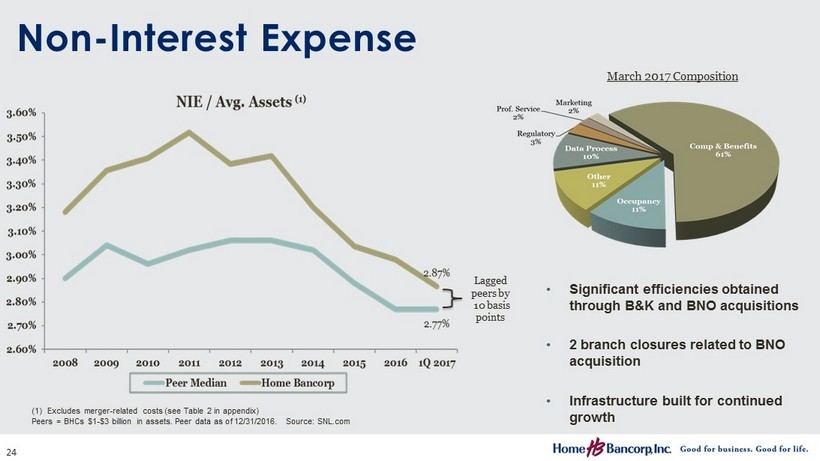
Non - Interest Expense (1) Excludes merger - related costs (see Table 2 in appendix) Peers = BHCs $1 - $3 billion in assets. Peer data as of 12/31/2016 . Source: SNL.com • Significant efficiencies obtained through B&K and BNO acquisitions • 2 branch closures related to BNO acquisition • Infrastructure built for continued growth March 2017 Composition Lagged peers by 10 basis points 24

Change in Interest Rates (1) % Change in NII at 3/31/17 (2) +100 0.7% +200 0.9% +300 1.0% Interest Rate Risk as of March 31, 2017 1) Assumes an instantaneous and parallel shift in interest rates. 2) The actual impact of changes in interest rates will depend on many factors including but not limited to: the Company’s ability to maintain desired mix of interest - earning assets and interest - bearing liabilities, actual timing of asset and liability repricing, and competitor reaction to deposit and loan pricing. • Rate shifts have minimal impact to NII • Low beta deposit growth • Long - term FHLB advances offset interest rate risk from acquired BNO balance sheet 25

Share Information (1) Excludes one - time gains and merger - related costs (see Table 1 in appendix) (2) Non - GAAP ratio (see Table 4 in appendix) 2Q 2016 3Q 2016 4Q 2016 1Q 2017 12 Months Diluted EPS (GAAP) $0.57 $0.61 $0.60 $0.69 $2.47 Adjusted Diluted EPS (Non - GAAP) (1) $0.53 $0.61 $0.60 $0.66 $2.40 Ending Share Price $27.47 $28.00 $38.61 $33.75 Dividend Yield 1.5% 1.4% 1.2% 1.5% P/ BV 116% 116% 158% 135% P/TBV (2) 125% 125% 170% 145% Home Bancorp Price / Earnings Share price as of 4/26/2017 $35.09 Next 4 quarters median analyst earnings estimate (adjusted) $2.49 Forward P/E based on estimates 14.1x 26
Capital Deployment Strategy • Acquisitions – Prior acquisitions have been cash transactions • Immediate ROE and EPS Impact (excluding merger costs) • Steady Organic Loan Growth • Cash Dividends – Announced company’s first dividend ($0.07/share) in November 2014 – Raised dividend to $0.14/share in April 2017 • Share Repurchases – New share repurchase program approved in April 2016. The Company may purchase up to 368,654 as of March 31, 2017. 27

Investment Perspective Consistently superior organic asset quality Deep customer relationships – 108 years EPS - focused acquirer; experienced deal team Strong capital base - Disciplined deployment & well positioned for additional acquisitions Low direct energy exposure 28

MEET OUR TEAM 29

Appendix Non - GAAP Reconciliation 30 (dollars in thousands) 1Q 2016 2Q 2016 3Q 2016 4Q 2016 1Q 2017 Reported non-interest expense 12,341$ 11,856$ 10,643$ 11,957$ 11,031$ Less: Merger-related expenses 613 214 - - - Non-GAAP non-interest expense 11,728$ 11,642$ 10,643$ 11,957$ 11,031$ Reported non-interest income 2,567$ 3,448$ 2,515$ 2,628$ 2,826$ Less: Gain on sale of assets - 641 - - 380 Non-GAAP non-interest income 2,567$ 2,807$ 2,515$ 2,628$ 2,446$ Reported Net Income 3,350$ 4,016$ 4,360$ 4,282$ 5,006$ Less: Gain on sale of assets, net tax - 416 - - 247 Add: Merger-related expenses, net tax 398 143 - - - Non-GAAP Net Income 3,748$ 3,743$ 4,360$ 4,282$ 4,759$ Diluted EPS 0.47$ 0.57$ 0.61$ 0.60$ 0.69$ Less: Gain on sale of assets - 0.06 - - 0.03 Add: Merger-related expenses 0.06 0.02 - - - Non-GAAP Diluted EPS 0.53$ 0.53$ 0.61$ 0.60$ 0.66$ ROA (GAAP) 0.87% 1.04% 1.14% 1.11% 1.28% Effect of sale of assets and merger-related expenses 0.10% -0.07% - - -0.06% Non-GAAP ROA 0.97% 0.97% 1.14% 1.11% 1.22% ROE (GAAP) 8.0% 9.4% 9.9% 9.6% 11.0% Effect of sale of assets and merger-related expenses 0.9% -0.7% - - -0.6% Non-GAAP ROE 8.9% 8.7% 9.9% 9.6% 10.4% Efficiency Ratio (GAAP) 67.5% 62.4% 59.0% 65.6% 58.7% Effect of sale of assets and merger-related expenses -3.4% 1.0% - - 1.2% Non-GAAP Efficiency Ratio 64.1% 63.4% 59.0% 65.6% 59.9% TABLE 1

Appendix Non - GAAP Reconciliation As of December 31st (dollars in thousands) 2010 2011 2012 2013 2014 2015 2016 Total Shareholders' Equity 131,530$ 134,285$ 141,574$ 141,910$ 154,144$ 165,046$ 179,843$ Less: Intangibles 1,781 2,676 2,241 1,909 4,266 15,304 12,762 Non-GAAP tangible shareholders' equity 129,749$ 131,609$ 139,333$ 140,001$ 149,878$ 149,742$ 167,081$ Total Assets 700,423$ 963,789$ 962,926$ 984,241$ 1,221,415$ 1,551,912$ 1,556,732$ Less: Intangibles 1,781 2,676 2,241 1,909 4,266 15,304 12,762 Non-GAAP tangible assets 698,642$ 961,113$ 960,685$ 982,332$ 1,217,149$ 1,536,608$ 1,543,970$ Common Equity Ratio 18.8% 13.9% 14.7% 14.4% 12.6% 10.6% 11.6% Less: Intangibles 0.2% 0.2% 0.2% 0.1% 0.3% 0.9% 0.8% Non-GAAP tangible common equity ratio 18.6% 13.7% 14.5% 14.3% 12.3% 9.7% 10.8% TABLE 3 31 (dollars in thousands) 2010 2011 2012 2013 2014 2015 2016 1Q 2017 Reported non-interest expense 24,373$ 31,002$ 32,763$ 33,205$ 41,772$ 42,022$ 46,797$ 11,031$ Less: Merger-related expenses 1,000 2,053 - 307 2,286 1,411 856 - Non-GAAP non-interest expense 23,373$ 28,949$ 32,763$ 32,898$ 39,486$ 40,611$ 45,941$ 11,031$ TABLE 2

Appendix Non - GAAP Reconciliation (dollars in thousands) 2Q 2016 3Q 2016 4Q 2016 1Q 2017 Total Shareholders' Equity 173,567$ 177,362$ 179,843$ 184,720$ Less: Intangibles 13,524 12,956 12,762 12,577 Non-GAAP tangible shareholders' equity 160,043$ 164,406$ 167,081$ 172,143$ Total Assets 1,545,049$ 1,549,542$ 1,556,732$ 1,583,497$ Less: Intangibles 13,542 12,956 12,762 12,577 Non-GAAP tangible assets 1,531,507$ 1,536,586$ 1,543,970$ 1,570,920$ Common Equity Ratio 11.2% 11.4% 11.6% 11.7% Less: Intangibles 0.8% 0.7% 0.8% 0.7% Non-GAAP tangible common equity ratio 10.5% 10.7% 10.8% 11.0% Book Value Per Share 23.75$ 24.22$ 24.47$ 25.05$ Less: Intangibles 1.85 1.77 1.74 1.70 Non-GAAP tangible book value per share 21.90$ 22.45$ 22.73$ 23.35$ TABLE 4 32
