Attached files
| file | filename |
|---|---|
| EX-21.1 - EX-21.1 - RED HAT INC | d293614dex211.htm |
| EX-32.1 - EX-32.1 - RED HAT INC | d293614dex321.htm |
| EX-31.2 - EX-31.2 - RED HAT INC | d293614dex312.htm |
| EX-31.1 - EX-31.1 - RED HAT INC | d293614dex311.htm |
| EX-23.1 - EX-23.1 - RED HAT INC | d293614dex231.htm |
| EX-10.48 - EX-10.48 - RED HAT INC | d293614dex1048.htm |
| EX-10.47 - EX-10.47 - RED HAT INC | d293614dex1047.htm |
| EX-10.46 - EX-10.46 - RED HAT INC | d293614dex1046.htm |
| EX-10.45 - EX-10.45 - RED HAT INC | d293614dex1045.htm |
| EX-10.44 - EX-10.44 - RED HAT INC | d293614dex1044.htm |
Table of Contents
Index to Financial Statements
UNITED STATES
SECURITIES AND EXCHANGE COMMISSION
Washington, D.C. 20549
FORM 10-K
| ☒ | Annual Report Pursuant to Section 13 or 15(d) of the Securities Exchange Act of 1934 |
For the fiscal year ended February 28, 2017
OR
| ☐ | Transition Report Pursuant to Section 13 or 15(d) of the Securities Exchange Act of 1934 |
For the transition period from to .
Commission File Number: 001-33162
RED HAT, INC.
(Exact name of registrant as specified in its charter)
Delaware
(State of Incorporation)
06-1364380
(I.R.S. Employer Identification No.)
100 East Davie Street, Raleigh, North Carolina 27601
(Address of principal executive offices, including zip code)
(919) 754-3700
(Registrant’s telephone number, including area code)
Securities registered pursuant to Section 12(b) of the Act:
| Title of each class |
Name of each exchange on which registered | |
| Common Stock, $0.0001 par value | New York Stock Exchange |
Securities registered pursuant to Section 12(g) of the Act: None
Indicate by check mark if the registrant is a well-known seasoned issuer, as defined in Rule 405 of the Securities Act. Yes ☒ No ☐
Indicate by check mark if the registrant is not required to file reports pursuant to Section 13 or Section 15(d) of the Act. Yes ☐ No ☒
Indicate by check mark whether the registrant (1) has filed all reports required to be filed by Section 13 or 15(d) of the Securities Exchange Act of 1934 during the preceding 12 months (or for such shorter period that the registrant was required to file such reports), and (2) has been subject to such filing requirements for the past 90 days. Yes ☒ No ☐
Indicate by check mark whether the registrant has submitted electronically and posted on its corporate Web site, if any, every Interactive Data File required to be submitted and posted pursuant to Rule 405 of Regulation S-T (§232.405 of this chapter) during the preceding 12 months (or for such shorter period that the registrant was required to submit and post such files). Yes ☒ No ☐
Indicate by check mark if disclosure of delinquent filers pursuant to Item 405 of Regulation S-K (§229.405 of this chapter) is not contained herein, and will not be contained, to the best of registrant’s knowledge, in definitive proxy or information statements incorporated by reference in Part III of this Form 10-K or any amendment to this Form 10-K. ☒
Indicate by check mark whether the registrant is a large accelerated filer, an accelerated filer, a non-accelerated filer, smaller reporting company or an emerging growth company. See the definitions of “large accelerated filer,” “accelerated filer,” “smaller reporting company” and “emerging growth company” in Rule 12b-2 of the Exchange Act.
| Large accelerated filer ☒ |
Accelerated filer ☐ | |
| Non-accelerated filer ☐ | Smaller reporting company ☐ | |
| (Do not check if a smaller reporting company) | Emerging growth company ☐ |
If an emerging growth company, indicate by check mark if the registrant has elected not to use the extended transition period for complying with any new or revised financial accounting standards provided pursuant to Section 13(a) of the Exchange Act. ☐
Indicate by check mark whether the registrant is a shell company (as defined in Rule 12b-2 of the Act). Yes ☐ No ☒
The aggregate market value of the common equity held by non-affiliates of the registrant as of August 31, 2016 was approximately $11.1 billion based on the closing price of $72.98 of our common stock as reported by the New York Stock Exchange on August 31, 2016. For purposes of the immediately preceding sentence, the term “affiliate” consists of each director, executive officer and greater than 10% stockholder of the registrant. There were 177,776,853 shares of common stock outstanding as of April 19, 2017.
DOCUMENTS INCORPORATED BY REFERENCE
Portions of Red Hat, Inc.’s Definitive Proxy Statement to be filed with the Securities and Exchange Commission and delivered to stockholders in connection with its annual meeting of stockholders to be held on August 10, 2017 are incorporated by reference into Part III of this Form 10-K. With the exception of the portions of the Proxy Statement expressly incorporated into this Annual Report on Form 10-K by reference, such document shall not be deemed filed as part of this Annual Report on Form 10-K.
Table of Contents
Index to Financial Statements
| Page No. | ||||||
| PART I | ||||||
| Item 1. | 3 | |||||
| Item 1A. | 18 | |||||
| Item 1B. | 41 | |||||
| Item 2. | 41 | |||||
| Item 3. | 41 | |||||
| Item 4. | 41 | |||||
| PART II | ||||||
| Item 5. | 42 | |||||
| Item 6. | 45 | |||||
| Item 7. | Management’s Discussion and Analysis of Financial Condition and Results of Operations |
46 | ||||
| Item 7A. | 69 | |||||
| Item 8. | 71 | |||||
| Item 9. | Changes in and Disagreements With Accountants on Accounting and Financial Disclosure |
118 | ||||
| Item 9A. | 118 | |||||
| Item 9B. | 118 | |||||
| PART III | ||||||
| Item 10. | 119 | |||||
| Item 11. | 119 | |||||
| Item 12. | Security Ownership of Certain Beneficial Owners and Management and Related Stockholder Matters |
119 | ||||
| Item 13. | Certain Relationships and Related Transactions, and Director Independence |
119 | ||||
| Item 14. | 119 | |||||
| PART IV | ||||||
| Item 15. | 120 | |||||
| Item 16. | 124 | |||||
2
Table of Contents
Index to Financial Statements
CAUTIONARY NOTE ON FORWARD-LOOKING STATEMENTS
Certain statements contained in this report and the documents incorporated by reference in this report, including in Management’s Discussion and Analysis of Financial Condition and Results of Operations, constitute “forward-looking statements” within the meaning of the Private Securities Litigation Reform Act of 1995. Forward-looking statements provide current expectations of future events based on certain assumptions, and any statement that is not strictly a historical statement could be deemed to be a forward-looking statement (for example, statements regarding current or future financial performance, management’s plans and objectives for future operations, product plans and performance, management’s expectations regarding market risk and market penetration, management’s assessment of market factors, or strategies, objectives and plans of Red Hat, Inc. together with its subsidiaries (“Red Hat”) and its partners). Words such as “anticipate,” “believe,” “estimate,” “expect,” “intend,” “outlook,” “plan,” “project,” “will,” and similar expressions, may also identify such forward-looking statements. Red Hat may also make forward-looking statements in other filings made with the Securities and Exchange Commission (“SEC”), press releases, materials delivered to stockholders and oral statements made by management. Investors are cautioned that these forward-looking statements are inherently uncertain, are not guarantees of Red Hat’s future performance and are subject to a number of risks and uncertainties that could cause Red Hat’s actual results to differ materially from those found in the forward-looking statements and from historical trends. These risks and uncertainties include the risks and cautionary statements detailed in Part I, Item 1A, “Risk Factors” and elsewhere in this report as well as in Red Hat’s other filings with the SEC, copies of which may be accessed through the SEC’s web site at http://www.sec.gov. Readers are urged to carefully review these risks and cautionary statements. Moreover, Red Hat operates in a rapidly changing and highly competitive environment. It is impossible to predict all risks and uncertainties or assess the impact of any new risk or uncertainty on our business or any forward-looking statement. The forward-looking statements included in this report represent our views as of the date of this report. We specifically disclaim any obligation to update these forward-looking statements in the future. These forward-looking statements should not be relied upon as representing our views as of any date subsequent to the date of this report.
| ITEM 1. | BUSINESS |
OVERVIEW
Red Hat is a leading global provider of open source software solutions, using a community-powered approach to develop and offer reliable and high-performing operating system, virtualization, management, middleware, cloud, mobile and storage technologies.
Our business model
Development. We employ an open source development model. The open source development model allows us to use the collective input, resources and knowledge of a global community of contributors who can collaborate to develop, maintain and enhance software because the human-readable source code for that software is publicly available and licenses permit modification.
Licensing. We typically distribute our software offerings under open source licenses that permit access to the software’s human-readable source code.
Subscriptions. We provide our software offerings primarily under annual or multi-year subscriptions as well as on-demand through our certified cloud and service providers (“CCSPs”).
Our offerings
Our offerings are designed to provide customers with high-performing, scalable, flexible, reliable and secure infrastructure technologies that meet the information technology (“IT”) needs of enterprises and service providers. Our offerings enable our customers to optimize their IT environments to increase agility and flexibility
3
Table of Contents
Index to Financial Statements
while adding and managing hybrid cloud infrastructures and building modern applications. Hybrid cloud infrastructures enable customers to deploy their applications using off-premise (public cloud) and on-premise (private cloud, virtual or physical server) IT resources to create a hybrid cloud environment that is designed to enhance efficiency while providing increased security. Our offerings are designed to perform consistently across hybrid cloud environments to offer greater choices to our customers when deploying their applications.
Our offerings include:
Infrastructure-related Offerings
| • | Red Hat Enterprise Linux—an operating system platform that runs applications on a broad range of hardware and is used in hybrid cloud environments. |
| • | Red Hat Satellite—a system management offering that is designed to make Red Hat infrastructure easier to deploy, scale and manage across hybrid cloud environments. |
| • | Red Hat Enterprise Virtualization—software that allows customers to utilize and manage a common hardware infrastructure to run multiple operating systems and applications. |
Application Development-related and Other Emerging Technology Offerings
| • | Red Hat JBoss Middleware—a suite of offerings used to develop, deploy and manage applications; integrate applications, data and devices; and automate business processes across hybrid cloud environments. |
| • | Red Hat cloud offerings—software that enables customers to build and manage various cloud computing environments (virtualized and container-based), including Red Hat OpenStack Platform, Red Hat Cloud Infrastructure, Red Hat OpenShift, Red Hat CloudForms and Ansible Tower. |
| • | Red Hat Mobile Application Platform—a software development platform that enables customers to develop, integrate, deploy and manage mobile applications for the enterprise. |
| • | Red Hat Storage—software that enables customers to manage large, unstructured or semi-structured data at large scale using commodity hardware in hybrid cloud environments. |
We also offer a wide range of services that are designed to help customers derive additional value from Red Hat technologies. Our consulting services assist customers to enable infrastructure, application integration, middleware, cloud, mobile and storage solutions. Our support services provide customers with technical support to assist with implementing, configuring and using Red Hat technologies. Our training services provide customers and partners with skilled Red Hat certified professionals.
Red Hat, Inc. was incorporated in Connecticut in March 1993 as ACC Corp., Inc., which subsequently changed its name to Red Hat Software, Inc. Red Hat Software, Inc. reincorporated in Delaware in September 1998 and changed its name to Red Hat, Inc. in June 1999. Except as otherwise indicated, all references in this report to “we”, “us”, “our”, the “Company”, the “registrant” or “Red Hat” refer to Red Hat, Inc. and its subsidiaries. Our fiscal year ends on the last day of February, and we identify our fiscal years by the calendar years in which they end. For example, we refer to the fiscal year ended February 28, 2017 as “fiscal 2017.”
OUR BUSINESS
We use the open source software development and licensing model to provide our offerings to customers primarily on a subscription basis. Subscriptions for our offerings are marketed and sold to customers directly and through business partners.
4
Table of Contents
Index to Financial Statements
Development and licensing of Red Hat’s open source offerings
The open source software development model allows us to use the collective input, resources and knowledge of a global community of contributors who collaborate to develop, maintain and enhance software. We believe this model offers advantages to Red Hat because we are able to develop our offerings by integrating information and knowledge from this global community. We develop our offerings by working with open source development communities, often in a leadership role. Red Hat sponsors a number of open source communities, including the CentOS project, the Ceph community project, the Fedora Project, GlusterFS, the JBoss community projects and OpenShift Origin. We are also an active contributor in other communities such as Apache Camel, the Cloud Native Computing Foundation, Kubernetes, the Linux kernel, the Open Container Initiative, the OpenDaylight Project, Open Platform for NFV and OpenStack. Our role helps us to benefit from the efforts of these communities, which we believe enhances acceptance and support of our offerings and technologies. Additionally, the open and transparent nature of these communities provides our customers and potential customers, who may also be part of these open source communities, with access and insights into, and the ability to influence, the future direction of our offerings.
Under the open source licensing model, a software developer distributes the software under an open source license, such as the GNU General Public License (“GPL”), GNU Lesser General Public License or Apache License. Open source licenses provide relatively broad rights for recipients of the software to use, copy, modify and redistribute the software. These rights afford significant latitude for recipients to inspect, suggest changes to, customize or enhance the software.
The open source model provides an inherent level of transparency and choice that contrasts with the proprietary software model. Under the proprietary software model, a software vendor generally develops the software itself or acquires components from other vendors, without the input from a wider community of participants. The vendor generally licenses to the user only the machine-readable binary (or object) code version of the software, with no or limited rights to copy, modify or redistribute the software, and does not make the underlying source code available to the user or other developers. Moreover, peer review and collaborative enhancements are more difficult because of the lack of access to the source code.
The scale and efficiency of open source software development has greatly increased through the availability of collaborative technologies and cloud-based tools, such as email lists, websites and code repositories. These technologies have enabled a global community of developers to collaborate on more complex open source projects, many of which are commercially funded.
We believe that open source software is a viable and arguably superior alternative to traditional proprietary software. Open source software, as compared to proprietary software, offers a number of benefits to customers, including:
| • | enabling a customer’s in-house development team to collaborate and innovate with a global community of independent developers and testers; |
| • | providing a customer’s in-house development team access to both binary and source code, and broader rights to copy, modify and redistribute the software; |
| • | offering a customer greater flexibility through open rather than proprietary protocols and formats; |
| • | enabling ongoing, quicker access to improvements and fixes; and |
| • | allowing a customer to inspect and help diagnose problems more easily and customize the software to suit its particular needs. |
Subscription business model
We provide our software offerings to our customers primarily under annual or multi-year subscriptions as well as on-demand through CCSPs. Our subscription business model is designed to provide customers with a
5
Table of Contents
Index to Financial Statements
comprehensive technology solution for the duration of their subscription. A subscription generally entitles a customer to, among other things, a specified level of support, as well as security updates, fixes, functionality enhancements, upgrades to the technologies, each if and when available, and compatibility with an ecosystem of certified hardware and software. A subscription also includes access to the Red Hat Customer Portal, which provides customers with services such as our knowledge base, product usage documentation and account management tools. We offer customers subscription options that provide varying levels of customer support. In addition, our customers are eligible to participate in Red Hat’s Open Source Assurance program, which provides certain protections in the event of an intellectual property infringement claim based on our offerings.
Our subscription business model contrasts with the typical proprietary software license model from a revenue recognition perspective. Under a proprietary software license model, the vendor typically recognizes license revenue in the period that the software is initially licensed. In contrast, under our subscription model, we generally defer revenue when we bill the customer and recognize revenue over the life of the subscription term.
Distribution of Red Hat offerings
We make Red Hat offerings available directly to customers and indirectly through various channels of distribution. Our direct sales channels include our sales force and our web store. Our indirect sales channels include CCSPs (such as public cloud providers and managed service providers), distributors, embedded technology partners, independent software vendors (“ISVs”), systems integrators (“SIs”) and value added resellers (“VARs”). In addition, hardware original equipment manufacturers (“OEMs”) pre-load and support Red Hat offerings on their hardware products and sell their hardware together with Red Hat offerings as part of pre-configured solutions.
With the support and tools we make available, many of these companies have engineered and certified that their technologies run on or with Red Hat offerings, and, in some cases, independent hardware vendors (“IHVs”) and ISVs have built their products and solutions using our offerings. Our offerings can also be used on an on-demand basis through our CCSPs, allowing our customers to utilize their subscriptions with increased flexibility. We believe widespread support from these companies helps to increase the level of market acceptance and adoption of our offerings.
Support by leading technology providers
To facilitate the widespread deployment of Red Hat offerings, we have focused on gaining broad support for our offerings from technology providers that are critical to enterprises. For example, leading ISVs with applications that run on, or with, our technologies include BMC Software, Inc. (“BMC”), CA, Inc. (“CA”), Cerner Corporation (“Cerner”), EMC Corporation (“EMC”), Hewlett Packard Enterprise Company (“HPE”), International Business Machines Corporation (“IBM”), Microsoft Corporation (“Microsoft”), Oracle Corporation (“Oracle”), SAP SE (“SAP”), SAS Institute Inc. (“SAS”), Symantec Corporation (“Symantec”) and VMware, Inc. (“VMware”). In addition, we have certification and pre-load arrangements with leading hardware vendors including Cisco Systems, Inc. (“Cisco”), Dell Inc. (“Dell”), Fujitsu Limited (“Fujitsu”), HPE, Hitachi, Ltd (“Hitachi”), IBM, Lenovo Group Limited (“Lenovo”), and NEC Corporation (“NEC”). We also have certification agreements with leading networking, storage and telecommunication companies including Big Switch Networks, Inc., Cisco, EMC, Ericsson Inc., F5 Networks, Inc., HPE, Huawei Technologies Co., Ltd., Juniper Networks, Inc., NetApp, Inc. (“NetApp”) and Nokia Corporation. We have strategic relationships with leading semiconductor and technology companies, such as Advanced Micro Devices, Inc., ARM Holdings plc, Dell, Intel Corporation and IBM, and CCSPs, such as Amazon.com, Inc. (“Amazon”), Fujitsu, Google Inc. (“Google”), IBM, Microsoft and Rackspace Hosting, Inc. We also have relationships with a number of global SIs such as Accenture plc (“Accenture”), Atos SE, Computer Sciences Corporation, HPE, IBM, Tata Consultancy Services Limited (“TCS”), Tech Mahindra Limited and Wipro Limited.
6
Table of Contents
Index to Financial Statements
Factors influencing our success
We believe our success is influenced by:
| • | the extent to which we can expand the breadth and depth of our offerings; |
| • | our ability to enhance the value of our offerings through frequent and continuing innovation while maintaining platforms designed to be stable and secure over multi-year periods; |
| • | the extent to which adoption of our emerging technology offerings by enterprises and similar institutions continues to increase; |
| • | our involvement and leadership in key open source communities, which enable us to develop, enhance and maintain our offerings; |
| • | our ability to generate increasing revenue directly and through partners and other strategic relationships, including CCSPs, distributors, embedded technology partners, IHVs, ISVs, OEMs, SIs, and VARs; |
| • | our ability to generate new and recurring revenue for our offerings; |
| • | the widespread and increasing deployment of open source technologies by enterprises and similar institutions; |
| • | our software, hardware, application and cloud service certification programs, which are intended to create an ecosystem of technologies that are compatible with our offerings and supported by us; |
| • | our ability to provide customers with consulting and training services that generate additional subscription revenue; and |
| • | our ability to provide greater subscription value, enhance the experience of our customers and promote customer loyalty by focusing on ways in which we can help our customers succeed. |
Geographic areas and segment reporting
As of February 28, 2017, Red Hat had more than 90 locations around the world, including offices in North America, South America, Europe, Asia and Australia. Red Hat has three geographic operating segments: the Americas (U.S., Canada and Latin America), EMEA (Europe, Middle East and Africa) and Asia Pacific. These segments are aggregated into one reportable segment due to the similarity in the nature of offerings, financial performance, economic characteristics (e.g., revenue growth and gross margin), methods of production and distribution and customer classes (e.g., CCSPs, distributors, resellers and enterprise). See NOTE 2—Summary of Significant Accounting Policies and NOTE 19—Segment Reporting to our Consolidated Financial Statements for further discussion of our operating segments. See Part I, Item 1A, “Risk Factors,” for a discussion of some of the risks attendant to our operations, including foreign operations.
Subscription revenue by product group
Subscription revenue for our Infrastructure-related offerings (Red Hat Enterprise Linux, Red Hat Satellite, Red Hat Enterprise Virtualization and related offerings) as a percentage of our total revenue were 70.3%, 72.1% and 74.0% for fiscal 2017, fiscal 2016 and fiscal 2015, respectively. Subscription revenue for our Application Development-related offerings (Red Hat JBoss Middleware) and other emerging technology offerings (including our cloud offerings, Red Hat Mobile Application Platform and Red Hat Storage) as a percentage of our total revenue were 18.2%, 15.7% and 13.2% for fiscal 2017, fiscal 2016 and fiscal 2015, respectively. For additional financial information about our products and services, see NOTE 19—Segment Reporting to our Consolidated Financial Statements.
Customers
We sell our offerings to enterprises in a variety of industries, including financial services, government, healthcare, retail, technology and media, telecommunications and transportation. For fiscal 2017 and fiscal 2016,
7
Table of Contents
Index to Financial Statements
the U.S. government and its agencies represented in the aggregate approximately 10% of our total revenue. For fiscal 2015, no customer accounted for more than 10% of our total revenue.
Backlog
We define total backlog as the value of non-cancellable subscription and service agreements, including total deferred revenue, which is billed, plus the value of non-cancellable subscription and service agreements to be billed in the future and not reflected in our financial statements. The value of non-cancellable subscription and service agreements at February 28, 2017 included deferred revenue classified as a current liability of $1.51 billion and long-term deferred revenue of $557.2 million. The value of non-cancellable subscription and service agreements to be billed in the future and not reflected in our financial statements is in excess of $650.0 million. The portion of total backlog at February 28, 2017 that we expect to be billed during the fiscal year ending February 28, 2018 is in excess of $330.0 million. At February 29, 2016, the value of non-cancellable subscription and service agreements included deferred revenue classified as a current liability of $1.27 billion and long-term deferred revenue of $449.6 million. The value of non-cancellable subscription and service agreements to be billed in the future and not reflected in our financial statements at February 29, 2016 was in excess of $410.0 million.
We report our off-balance sheet backlog as a conservative approximation, often describing the amount as “in excess of”, primarily because the value of underlying contracts is derived from data not yet subjected to the complete application of our revenue recognition policies. We endeavor to derive the value of our off-balance sheet backlog in a consistent manner year over year and therefore believe the amounts are comparable.
Seasonality
Our fourth fiscal quarter has historically been our strongest quarter for billing both new business and renewals. For a more detailed discussion, see Part II, Item 7, “Management’s Discussion and Analysis of Financial Condition and Results of Operations.”
BUSINESS STRATEGY
Our business strategy is to partner with our customers as they optimize their existing IT environments; integrate applications, data and processes; add and manage cloud infrastructures; and build modern applications. We implement our business strategy through:
| • | driving the widespread adoption of our offerings; |
| • | expanding our portfolio of technology offerings that enable hybrid cloud computing; |
| • | investing in the development of open source technologies and promoting the use of our technologies by software developers globally; |
| • | pursuing strategic acquisitions and alliances; |
| • | expanding relationships with our existing customers; |
| • | increasing revenue by promoting a range of services to help our customers derive additional value; |
| • | expanding routes to market; and |
| • | growing our presence in international markets. |
Driving the widespread adoption of our offerings
We believe that our open source offerings are a catalyst for change in the IT industry, enabling new deployments and migrations, which encourage a larger ecosystem of compatible hardware and software
8
Table of Contents
Index to Financial Statements
solutions. We seek to drive further adoption of our offerings by enhancing the value of our offerings through frequent and continuing innovations, supporting new and emerging technologies such as OpenShift, OpenStack and containers, leveraging new delivery models such as on-demand consumption and encouraging modern software development processes such as CI/CD (continuous integration and continuous deployment) and DevOps. Additionally, we believe the increasing use of Linux, middleware and other open source technologies in cloud environments can provide us with a greater ability to penetrate existing, and generate new, customer and partner opportunities. We also seek to encourage users of free versions of our technologies to become paying customers by helping these users understand the value proposition of our subscription offerings.
Expanding our portfolio of technology offerings that enable hybrid cloud computing
We intend to continue to expand our offerings that enable customers to increase their deployments of public and private clouds in their enterprise environments. Additionally, we expect to continue to expand our management, orchestration and other technology offerings that help our customers to optimize resource allocation and enhance performance, agility and flexibility in hybrid cloud environments.
Investing in the development of open source technologies and promoting the use of our technologies by software developers globally
We intend to continue to invest significant resources in the development of open source technologies, capitalizing on our substantial experience working with open source development communities. We expect this continued investment to take the form of expenditures on internal development efforts, as well as continued funding of third-party open source projects and the expansion of our developer offerings. Additionally, we believe that by expanding and empowering the developers that use our technologies, we can enhance our technical leadership position and drive additional growth.
Pursuing strategic acquisitions and alliances
We expect to continue to pursue a selective acquisition strategy as opportunities arise to complement and expand our technology offerings and service capabilities. In fiscal 2017, we completed the acquisition of 3scale, Inc. (“3scale”), a provider of application programming interface (“API”) management technology. By adding 3scale to our existing portfolio, we strengthened our enablement of the API economy with simplified cloud integration and microservices-based architectures.
We also intend to create and extend our strategic alliances where it is beneficial to our business. To facilitate the widespread deployment of Red Hat offerings, we will continue efforts to build broader and deeper relationships with hardware and software providers and CCSPs critical to our customers.
Expanding relationships with our existing customers
We seek to build upon the relationships we have with our current customers by providing greater subscription value, enhancing the experience of our customers and promoting customer loyalty in an effort to generate additional revenue by renewing and increasing existing subscriptions and promoting our other technology offerings. We expect to continue to build more strategic relationships with our customers through vertical specialization of our go-to-market resources.
Increasing revenue by promoting a range of services to help our customers derive additional value
We seek to increase revenue by providing additional consulting and other targeted services. We also enable our partners to provide services that promote growth in our subscription revenue. These services are designed to help customers derive additional value from Red Hat offerings.
Expanding routes to market
We intend to continue to grow our direct sales channel as well as our CCSPs, distributors, embedded technology partners, IHVs, ISVs, OEMs, VARs and other channel partner networks on a global basis. In
9
Table of Contents
Index to Financial Statements
addition, we are enhancing our relationships with SIs in order to expand our reach to customers that traditionally rely on SIs for advice and recommendations regarding their technology purchases.
Growing our presence in international markets
We have operations in a number of countries in the Americas, EMEA and Asia Pacific, with more than 90 locations worldwide. We expect to continue to expand our operations geographically when appropriate. See NOTE 19—Segment Reporting to our Consolidated Financial Statements for a discussion of our revenue by geographic area.
PRODUCTS AND SERVICES
Our software offerings are designed to provide customers with high-performing, scalable, flexible, reliable and secure infrastructure technologies that meet customers’ IT needs in hybrid cloud environments. Through our offerings, our customers and partners are able to take advantage of the quality and value of open source software that we help to develop, aggregate, integrate, test, certify, deliver, maintain, enhance and support. Customers can also take advantage of the flexibility of our software offerings to build a variety of deployment models on which to run their applications. Our service offerings include consulting, support and training.
Infrastructure-related offerings
Red Hat Enterprise Linux technologies. Red Hat Enterprise Linux is an operating system built with open source software components, including the Linux kernel, and is designed expressly for enterprise computing to run applications on a broad range of hardware in hybrid cloud environments. A worldwide community of developers collaborates to improve Linux software components, and we believe we are able to integrate the best of those improvements into our stable, yet innovative and high-performing Red Hat Enterprise Linux platform. Moreover, Red Hat Enterprise Linux enjoys the support of major CCSPs, IHVs, ISVs, OEMs and other technology partners, increasing the interest of developers in adding further enhancements to the Linux kernel and other open source software components.
Red Hat Enterprise Linux delivers features required for enterprise deployments, including support for a wide range of ISV applications from vendors, such as BMC, CA, Cerner, EMC, HPE, IBM, Microsoft, Oracle, SAP, SAS, Symantec and VMware; certification on multiple architectures and leading OEM platforms, including platforms offered by Cisco, Dell, Fujitsu, HPE, Hitachi, IBM, Lenovo and NEC; and comprehensive technical support, with up to 24x7, one-hour response, available from both Red Hat and selected OEM partners.
Red Hat Enterprise Linux is also available in multiple variants that allow customers to obtain a version of Red Had Enterprise Linux specifically for their use cases, applications, and hardware architectures. Variant options include Red Hat Enterprise Linux Atomic Host, Red Hat Enterprise Linux Server for High-Performance Computing, Red Hat Enterprise Linux for IBM z Systems, Red Hat Enterprise Linux for SAP Applications and Red Hat Enterprise Linux for SAP HANA.
In addition, Red Hat offers a portfolio of add-ons that extends the features of Red Hat Enterprise Linux. These add-ons, which are designed to tailor a customer’s computing environment to suit its specific requirements, include:
| • | High Availability—provides failover services between nodes within a cluster intended to make applications more resistant to downtime. |
| • | Resilient Storage—enables a shared storage or clustered file system to access the same storage device over a network. |
10
Table of Contents
Index to Financial Statements
| • | Load Balancer—provides redundancy for web servers, databases, networking and storage, intended to maximize throughput, decrease response time and increase reliability and uptime. |
| • | Smart Management—includes management and provisioning modules that allow a customer to provision, patch, configure and control Red Hat Enterprise Linux development, test and production systems. |
| • | Extended Lifecycle Support—provides software maintenance and support after Red Hat’s published end of life date for certain versions of Red Hat Enterprise Linux. |
| • | Extended Update Support—extends the software maintenance and support period of certain eligible Red Hat Enterprise Linux subscriptions for up to 24 months to give customers more flexibility with their resource and deployment cycles. |
| • | Red Hat Insights—provides a hosted service that is designed to help customers proactively identify and resolve technical and security issues in their Red Hat Enterprise Linux and Red Hat Cloud Infrastructure environments. |
We believe that these add-ons provide customers with increased features, flexibility and choice.
Red Hat Satellite. Red Hat Satellite is a system management offering that is designed to make Red Hat infrastructure easier to deploy, scale and manage across hybrid cloud environments. Red Hat Satellite provides broad capabilities for systems provisioning, configuration management, content management and subscription management.
Red Hat Enterprise Virtualization. Red Hat Enterprise Virtualization includes standalone virtualization functionality and management tools for both server and desktop deployments. Red Hat Enterprise Virtualization combines the Kernel-based Virtual Machine (KVM) hypervisor included in the Linux kernel with the oVirt open source virtualization management system to offer customers a platform for large-scale virtualization initiatives and cloud deployments. Red Hat Enterprise Virtualization is designed to support virtual machines running Red Hat Enterprise Linux and its wide ecosystem of certified hardware systems and software applications, as well as Microsoft Windows operating systems and application servers supported under Microsoft Windows Server Virtualization Validation Program (SVVP).
Application Development-related and other emerging technology offerings
Red Hat JBoss Middleware. Red Hat JBoss Middleware is a suite of offerings for developing, deploying and managing applications; integrating applications, data and devices; and automating business processes across hybrid cloud environments. Red Hat JBoss Middleware offerings can also be deployed on Red Hat OpenShift to provide middleware functionality as a service. Red Hat JBoss Middleware integrates, tests and refines enterprise-ready features from JBoss and other community projects into supported, stable, enterprise-class middleware platforms.
Red Hat JBoss Middleware offerings consist of a number of deployment platforms and tools, including:
| • | Red Hat JBoss Enterprise Application Platform—provides an environment for building, hosting and deploying applications and services. It includes features such as clustering, caching, messaging, transaction and a full web services stack. |
| • | Red Hat JBoss Web Server—provides an enterprise-class web server solution for large-scale websites and lightweight web applications that utilize Apache Tomcat and Apache Web Server. |
| • | Red Hat JBoss Data Grid—provides a scalable, distributed in-memory data grid that permits cost-effective scaling of big data tiers. |
| • | Red Hat JBoss Fuse and Red Hat JBoss A-MQ—provides customers messaging and integration tools for distributed applications. |
11
Table of Contents
Index to Financial Statements
| • | Red Hat 3scale API Management Platform—provides centralized API management features through a distributed, cloud hosted layer. |
| • | Red Hat JBoss Data Virtualization—provides a solution for integration of distributed data sources. |
| • | Red Hat JBoss BRMS—provides a platform for business rules management and complex event processing. |
| • | Red Hat JBoss BPM Suite—provides a business process management platform that combines business rules management and complex event processing with a business process management system to help customers model and encode business processes, policies and rules and measure the results of business activities. |
| • | Red Hat JBoss Developer Studio—provides an integrated development environment for developing, testing and deploying rich web applications, enterprise applications and service-oriented architecture services. |
| • | Red Hat JBoss Operations Network—provides built-in management and monitoring capabilities to administer JBoss application environments. |
Red Hat cloud offerings. Utilizing the interoperability of our software technologies, we provide a number of offerings to assist users in creating cloud computing environments:
| • | Red Hat OpenStack Platform—an infrastructure as a service offering that provides an enterprise-ready cloud foundation built on OpenStack technologies optimized for and integrated with Red Hat Enterprise Linux and Red Hat Enterprise Virtualization. |
| • | Red Hat Cloud Infrastructure—an offering that combines and integrates Red Hat Satellite, Red Hat Enterprise Virtualization, Red Hat CloudForms, Red Hat OpenStack Platform and Red Hat Insights. Red Hat Cloud Infrastructure allows users to build and manage a private or hybrid infrastructure as a service cloud. |
| • | Red Hat OpenShift—a container-based cloud application platform (also called “platform as a service” or “PaaS”) that allows developers to develop, host and scale applications in a cloud environment. It automates the hosting, configuration, deployment and administration of application stacks in an elastic cloud environment utilizing Linux containers. OpenShift gives application developers self-service access so they can more easily deploy applications on demand. Customers can use OpenShift Container Platform in a private cloud environment and in certain public cloud environments, OpenShift Online in a public cloud environment for on-demand consumption, or OpenShift Dedicated in a public cloud environment using their own OpenShift instance managed by Red Hat. Customers can also use Red Hat JBoss Middleware services for OpenShift to enable enterprise application development, deployment and integration capability with OpenShift. |
We also provide offerings to help our customers manage their increasingly complex IT environments. Along with Red Hat Satellite and Red Hat Insights, we offer Red Hat CloudForms, which is a hybrid cloud management solution that allows users to deploy, monitor and manage services across cloud providers and virtualized and container-based solutions. We also offer Ansible Tower, which is an IT automation platform that is designed to provide simplified provisioning, configuration management and application deployment as well as a broad range of IT automation activities across hybrid cloud environments.
Red Hat Mobile Application Platform. Red Hat Mobile Application Platform enables customers to develop, integrate, deploy and manage mobile applications for the enterprise. The Red Hat Mobile Application Platform offers flexibility in choosing front-end development tools while providing mobile backend as a service functionality, which is intended to provide more secure integration of mobile applications with back-end systems.
Red Hat Storage. Red Hat Storage technologies enable customers to build storage platforms at large-scale using commodity hardware. Red Hat Gluster Storage enables distributed file storage across hybrid cloud
12
Table of Contents
Index to Financial Statements
environments. Red Hat Ceph Storage offers a block and object storage platform for enterprises deploying on public or private clouds. Users of enterprise OpenStack deployments and container application platforms often use Red Hat Storage technologies for their storage needs.
Additional Red Hat offerings. Red Hat offerings also include other technologies, such as a realtime operating system, high-performance distributed computing, directory services and user authentication. These offerings broaden customer choice and are components of our open source architecture for the enterprise.
Red Hat consulting, support, and training services
Red Hat offers a range of services that are designed to help our customers derive additional value from Red Hat offerings.
Consulting. We offer the services of experienced consultants focused on our offerings to assist with the technology and strategic infrastructure needs of our customers. Our consulting services include assessments, proofs of concept, implementations, upgrade planning, platform migrations, solution integration and application development.
Support. Our Red Hat subscriptions generally include varying levels of technical support to assist customers with implementing, configuring and using Red Hat technologies. In addition, Red Hat’s Customer Portal provides an online method for customers to obtain certified software, access a knowledge base and software update alerts and advisories, as well as interact with our technical support engineers. We also offer technical account management services for customers that require a more personalized support relationship. The technical account management services are designed to offer a highly skilled, proactive support engineer who understands a customer’s IT infrastructure and serves as a primary point of contact for technical support that is tailored to the customer’s business.
Training. Our training services consist of an array of interactive courses and certification exams designed to meet the diverse needs of our customers. We deliver courses and exams worldwide in on-site, classroom and online settings. Courses span topics such as system administration, deployment, management and security, and enterprise application development and integration. Certifications include Red Hat Certified Architect, Red Hat Certified Engineer, Red Hat Certified JBoss Administrator, Red Hat Certified JBoss Developer, Red Hat Certified System Administrator, Red Hat Certified System Administrator in Red Hat OpenStack, Red Hat Certified Virtualization Administrator and Red Hat Certificates of Expertise in a variety of specialties. We also offer training through our Red Hat Learning Subscription, which is a tiered, subscription-based offering that includes access to all of our online courses and labs and can be delivered on demand at each user’s own pace.
By providing consulting and support services that help to enable infrastructure, application integration and middleware solutions in hybrid cloud environments, we facilitate further adoption and use of our technologies in the enterprise. In addition, our training services provide customers and partners with skilled Red Hat certified professionals who often serve as internal open source advocates, increasing opportunities for successful adoption and use of our technologies. Our service capabilities promote and reinforce the use of open source technologies as well as our Red Hat brands.
COMPETITION
The rapidly evolving and intensely competitive enterprise software industry is characterized by new and evolving industry standards, disruptive technology developments and frequent new product introductions by both new and established IT companies. We compete with a number of large and well-established companies that have significantly greater financial resources, larger development staffs and more extensive marketing and distribution capabilities. We also compete with emerging start-up companies that may be able to innovate and provide products and services faster than we can. No assurance can be given that our efforts to compete effectively will be sufficient.
13
Table of Contents
Index to Financial Statements
We believe that the major factors affecting the competitive landscape for our offerings include:
| • | the name and reputation of the vendor or competitive offering; |
| • | the product price, performance, reliability, security and functionality; |
| • | the partnerships of the vendor with major industry hardware and/or software providers; |
| • | the channel strength and number of channel partners of the vendor; |
| • | the financial and value relationship of subscription services; |
| • | the availability of third-party enterprise applications that are compatible with the technology; |
| • | the speed with which customers transition to cloud computing environments and the type of cloud computing environments utilized (public, private or hybrid); |
| • | the breadth of hardware and software ecosystem compatibility, including the ability to move IT workloads among various cloud offerings; |
| • | the number of cloud service providers; |
| • | the management framework for administering the software technologies; |
| • | the quality of consulting and support services; |
| • | the number of customer and company reference accounts; |
| • | the ability to attract and retain qualified technical and other employees; |
| • | the ability to influence enterprise software developers to write more applications that are compatible with our technologies; |
| • | the ability of the vendor to quickly diagnose software issues and provide patches and other solutions; and |
| • | the strength of the vendor’s relationships and reputation in the open source community. |
With respect to our operating system offerings, our competitors include Microsoft, which offers a hardware-independent, multi-user operating system that competes with Red Hat’s offerings. Moreover, we also compete with HPE, IBM, Oracle and Unisys Corporation, each of which offers the UNIX operating system. Many of these competitors bundle competitive operating systems, such as UNIX, with their own hardware and additional software offerings, thereby making it more difficult for us to penetrate their customer bases. With respect to Linux operating systems, our competitors include Micro Focus International plc, with its SUSE brand of Linux, and Amazon’s and Oracle’s Linux offerings. We also compete with freely available Linux distributions, such as CentOS, Debian, Fedora, openSUSE and Ubuntu.
With respect to our virtualization offerings, our competitors include Microsoft, Oracle and VMware. Microsoft and VMware offer virtualization technologies that are certified and supported with Red Hat Enterprise Linux operating system offerings, and Microsoft supports its server operating systems and application servers running on our virtualization offerings.
With respect to our middleware offerings, our competitors include IBM, Microsoft, MuleSoft, Inc., Oracle and Pivotal Software, Inc. (“Pivotal”). Most of these vendors offer the majority of their middleware products under a typical proprietary software license model. IBM and Oracle often bundle hardware and software for their customers, making it more difficult for us to penetrate their customer bases. Our middleware offerings are heavily dependent on the Java computing platform, which is controlled by Oracle.
With respect to our cloud technologies, we compete with companies that provide tools for enterprises to create private clouds, such as HPE, Microsoft, Mirantis Inc., Oracle, Pivotal and VMware, companies that
14
Table of Contents
Index to Financial Statements
provide platform as a service offerings, such as IBM, Oracle, Pivotal and SAP, and companies that provide public clouds with, and that allow users to consume, computing resources as a service without the need to purchase equipment or software, such as Amazon, Google and Microsoft.
With respect to our mobile offerings, our competitors include IBM, Oracle, salesforce.com, inc. (“Salesforce”) and SAP as well as more mobile-focused companies such as AnyPresence, Inc., Kinvey, Inc. and Kony, Inc. Increasingly, cloud service providers are also offering mobile development services as part of their enterprise cloud offerings.
With respect to our storage offerings, we compete with companies that provide storage products, such as EMC and NetApp. Public cloud service providers, such as Amazon, Google and Microsoft, also offer storage capabilities.
With respect to our service offerings, we face competition in the markets for services related to the development, deployment and integration of enterprise technologies. Our competitors in these markets include Accenture, HPE, IBM and TCS, as well as other technology consulting companies.
Due to the nature of open source technology, the open source software model is not characterized by the traditional barriers to entry that are found in the proprietary software model. For example, the financial and legal barriers to creating a new Linux distribution are relatively low because the software components typically included in Linux distributions are publicly available under open source licenses that permit copying, modification and redistribution. Anyone can use, copy, modify and redistribute Red Hat Enterprise Linux, Red Hat JBoss Middleware and our other open source offerings. However, they are not permitted to refer to these products as “Red Hat” or “Red Hat JBoss” products unless they have a formal business relationship with us that allows for such references. Moreover, our customers agree that during their support relationship with Red Hat, they will purchase a support subscription based on the number of computer systems, cores, sockets or other units on which they deploy Red Hat’s software. In addition, the primary means by which customers can receive Red Hat software, as well as security updates, fixes, functionality enhancements and upgrades to the technologies, each if and when available, is to purchase and maintain a current subscription directly from us or our partners with whom we have agreements.
There are significantly more enterprise applications available for competing operating systems technologies, such as Windows, than there are for Red Hat Enterprise Linux. An integral part of our strategy has been to help address these shortcomings by, among other methods, strengthening our existing strategic and channel partner relationships and entering into new ones to expand our marketing and distribution capabilities and by attracting more attention to the open source movement. Also, increasing the adoption of Red Hat technologies as well as the .Net infrastructure becoming available to the open source community can create additional opportunities and incentives for software developers to write more applications that are compatible with Red Hat technologies.
SOFTWARE ENGINEERING AND DEVELOPMENT
We have invested, and intend to continue to invest, significant resources in research and development. We expended $480.7 million, $413.3 million and $367.9 million in fiscal 2017, fiscal 2016 and fiscal 2015, respectively, in research and development costs. We focus and modify our research and development efforts based on our business strategy, the needs of users and changes in the marketplace. Our development efforts are currently focused on adding new or improved functionality to our offerings that is needed by customers or that supports the expansion of our third-party hardware and software ecosystem. However, any upgrades and enhancements are offered on an if-and-when-available basis. Red Hat is also investing in developing new software offerings and enabling new forms of development that are aimed at customers who seek hybrid, private and public cloud computing solutions. Our software engineers collaborate with open source software development teams working through open source communities, such as Apache Camel, the CentOS project, the
15
Table of Contents
Index to Financial Statements
Ceph community project, the Cloud Native Computing Foundation, the Fedora Project, GlusterFS, the JBoss community projects, Kubernetes, the Linux kernel, the Open Container Initiative, the OpenDaylight Project, Open Platform for NFV, OpenShift Origin and OpenStack. This involvement enables us to remain abreast of, and in some instances lead, certain technical advances, plans for development of new features and timing of releases, as well as other information related to the management of open source projects.
Our software engineers make development contributions to many components comprising Red Hat software offerings and provide leadership within the various open source communities across many of the core components. Our software engineers also perform extensive testing of Red Hat technologies. We use various industry recognized methods of quality assurance testing to seek to ensure that our technologies are ready for use by our customers when delivered. We also work closely with leading hardware and software vendors to seek to ensure that their hardware and applications will operate effectively with Red Hat platforms.
INTELLECTUAL PROPERTY
Our offerings, including Red Hat Enterprise Linux and Red Hat JBoss Middleware, are built primarily from software components licensed under various open source licenses. While some components are developed by our employees, Red Hat obtains many components from software developed and released by contributors to independent open source software development projects. Open source licenses grant licensees broad permissions to use, copy, modify and redistribute the software. Certain open source licenses, such as the GPL, impose significant limits on a distributor’s ability to license derivative works under more restrictive terms and generally require the distributor to disclose the source code of such works. The inclusion of software components governed by such licenses in our offerings limits our ability to use traditional proprietary software licensing models for those offerings. As a result, while we have substantial copyright interests in our software technologies, open source development and licensing practices may have the effect of limiting the value of our software copyright assets. Consequently, our trademarks may represent our most valuable intellectual property.
We pursue registration of some of our trademarks in the U.S. and in other countries. We have registered the “Red Hat” and “JBoss” trademarks and the Red Hat Shadowman logo in countries in North America, South America, Europe, Asia and Africa as well as in Australia.
Despite our efforts to protect our trademark rights, unauthorized third parties have, in the past, attempted and, in the future, may attempt, to misappropriate our trademark rights. We cannot be certain that we will succeed in preventing such misappropriation of our trade names and trademarks. The laws of some foreign countries do not protect or deter misappropriation of our trademark rights to the same extent as do the laws of the U.S. In addition, while we engage in certain enforcement activity, policing unauthorized use of our trademark rights is difficult, expensive and time-consuming, and our efforts may be inadequate. The loss of any material trademark or trade name could have a material adverse effect on our business, operating results and financial condition.
Red Hat also seeks patent protection for some of the innovative ideas of our software developers and other employees. Some of these inventions are applicable to our current technologies, while others provide protection to new and other technologies. Moreover, our principal objectives in seeking patent protection are to provide a measure of deterrence against the potential patent infringement claims of third parties and to a more limited extent to help ensure that new technologies and innovations covered by our patents remain open. As part of Red Hat’s commitment to the open source community, we provide our Patent Promise, an undertaking, subject to certain limitations, not to enforce our patent rights against users of open source software covered by certain open source licenses. This permits the development and distribution of open source applications by third parties that could otherwise infringe on our patents. For these reasons, it is unlikely that our patents will, of themselves, provide us substantial revenue.
16
Table of Contents
Index to Financial Statements
Third parties have, in the past, asserted and, in the future, may assert, infringement claims against us which may result in costly litigation or require us to obtain a license to third-party intellectual property rights. See Part I, Item 3, “Legal Proceedings”. There can be no assurance that such licenses will be available on reasonable terms or at all, which could have a material adverse effect on our business, operating results and financial condition. Red Hat regularly commits to its subscription customers that if portions of our offerings are found to infringe third-party intellectual property rights we will, at our expense and option: obtain the right for the customer to continue to use the technology consistent with their subscription agreement with us; modify the technology so that its use is non-infringing; or replace the infringing component with a non-infringing component, and defend them against specified infringement claims. Although we cannot predict whether we will need to satisfy these commitments and we often have limitations on these commitments, satisfying these commitments could be costly, be time-consuming, divert the attention of technical and management personnel, and adversely affect our business, financial condition, operating results and cash flows.
We also generally enter into confidentiality and nondisclosure agreements with our employees and consultants and seek to control access to and distribution of our confidential documentation and other proprietary information.
EMPLOYEES
As of February 28, 2017, Red Hat had approximately 10,500 employees.
AVAILABLE INFORMATION
We maintain a website at www.redhat.com. We make available, free of charge on our website, our Annual Report on Form 10-K, Quarterly Reports on Form 10-Q, Current Reports on Form 8-K, and amendments to those reports filed or furnished pursuant to Section 13(a) or 15(d) of the Securities Exchange Act of 1934, as amended (the “Securities Exchange Act”), as soon as reasonably practicable after we electronically file those reports with, or furnish them to, the SEC. We also similarly make available, free of charge on our website, the reports filed with the SEC by our executive officers, directors and 10% stockholders pursuant to Section 16 under the Securities Exchange Act as soon as reasonably practicable after copies of those filings are provided to us by those persons. We are not including the information contained at www.redhat.com, or at any other Internet address, as part of, or incorporating it by reference into, this Annual Report on Form 10-K.
17
Table of Contents
Index to Financial Statements
| ITEM 1A. | RISK FACTORS |
Set forth below are certain risks and cautionary statements, which supplement other disclosures in this report. Please carefully consider the following risks and cautionary statements. If any event related to the following risk factors occurs, our business, financial condition, operating results and cash flows could be materially adversely affected.
RISKS RELATED TO BUSINESS UNCERTAINTY
We face intense competition.
The enterprise software industry is rapidly evolving and intensely competitive, and is subject to changing technologies, shifting customer needs, and frequent introductions of new products and services by both new and established information technology (“IT”) companies. We compete based on our ability to provide our customers with enterprise software and related service offerings that best meet their needs at a compelling price. We expect that competition will continue to be intense, and there is a risk that our competitors’ products may provide better performance or include additional features when compared to our offerings. Competitive pressures could also affect the prices we may charge or the demand for our offerings, resulting in reduced profit margins and loss of market share.
Our current and potential competitors range from large and well-established companies to emerging start-ups. Some of our competitors have significantly greater financial resources and name recognition, larger development and sales staffs and more extensive marketing and distribution capabilities. Certain competitors also bundle hardware and software offerings, making it more difficult for us to penetrate their customer bases, while other competitors may be able to innovate and provide products and services faster than we can. As the enterprise software industry evolves, the competitive pressure for us to innovate encompasses a wider range of products and services, including new offerings that require different expertise than our current offerings. Moreover, if we are unable to effectively communicate the value of our subscription model, we may not compete effectively in attracting new, and maintaining existing, customers.
Given the rapid evolving nature of the enterprise software industry, the competitive landscape and the nature of the competition is constantly changing. Consolidation and divestitures in the technology industry are trends that we expect to continue as companies attempt to strengthen or maintain market positions as the technology industry evolves. Industry consolidation may affect competition by creating larger and potentially stronger competitors in the markets in which we compete or competitors that position themselves as key or single-source vendors providing end-to-end technology solutions for the data center. Moreover, other companies may currently be planning to or are under pressure by stockholders to divest businesses. These divestitures may result in additional competitors that may have an advantage by focusing on a single product or service. We also compete in certain areas with our partners and potential partners, some of which may form from time to time new strategic alliances designed to position one or more of them as a key or single-source vendor, and this may adversely impact our relationship with an individual partner or a number of partners.
Our efforts to compete effectively may not be sufficient, which may adversely affect our business, financial condition, operating results and cash flows.
Our continued success depends on our ability to adapt to a rapidly changing industry. Investment in new offerings, business strategies and initiatives could disrupt our ongoing business and may present risks not originally contemplated.
We operate in highly competitive markets that are characterized by rapid technological change, such as the transition of many of our enterprise customers to cloud computing environments and frequent new product and service announcements. Our continued success will depend on our ability to adapt to rapidly changing technologies and user preferences, to adapt our offerings to evolving industry standards, to predict user
18
Table of Contents
Index to Financial Statements
preferences and industry changes in order to continue to provide value to our customers and to improve the performance and reliability of our offerings. Our failure to adapt to such changes could harm our business, and our efforts to adapt to such changes could require substantial expenditures on our part to modify our offerings or infrastructure. Delays in developing, completing or delivering new or enhanced offerings and technologies could result in delayed or reduced revenue for those offerings and could also adversely affect customer acceptance of those offerings and technologies. The success of new and enhanced offering introductions depends on several factors, including our ability to invest significant resources in research and development in order to enhance our existing offerings and introduce new offerings in a timely manner, successfully promote the offerings, manage the risks associated with the offerings, make sufficient resources available to support the offerings and address any quality or other defects in the early stages of introduction. Even if we are able to enhance our existing offerings or introduce new offerings that are well perceived by the market, if our marketing or sales efforts do not generate interest in or sales for these offerings, they may be unsuccessful.
Moreover, we believe that our continued success depends on our investing in new business strategies or initiatives that complement our strategic direction and technology road map. Such endeavors may involve significant risks and uncertainties, including distraction of management’s attention away from other business operations, and insufficient revenue generation to offset liabilities and expenses undertaken with such strategies and initiatives. Because these endeavors may be inherently risky, no assurance can be given that such endeavors will not adversely affect our business, financial condition, operating results and cash flows.
If we fail to continue to establish and maintain strategic relationships with industry-leading companies, we may not be able to attract and retain a larger customer base.
Our success depends in part on our ability to continue to establish and maintain strategic relationships with industry-leading cloud service providers, hardware original equipment manufacturers (“OEMs”), independent software vendors (“ISVs”) and system integrators (“SIs”), such as Amazon.com, Inc. (“Amazon”), Cisco Systems, Inc., Dell Inc., Fujitsu Limited, Hewlett Packard Enterprise Company, International Business Machines Corporation, Microsoft Corporation (“Microsoft”), NEC Corporation, Oracle Corporation, SAP SE and others, to help us attract and retain a larger customer base. Many of these strategic partners have engineered and certified that their technologies run on or with our offerings and, in some cases, have built their products and solutions using our offerings. We may not be able to maintain these relationships or replace them on attractive terms in the future. Some of our strategic partners offer competing products and services. As a result of these factors, many of the companies with which we have strategic alliances may choose to pursue alternative technologies and develop alternative products and services in addition to or in lieu of our offerings, either on their own or in collaboration with others, including our competitors. Moreover, we cannot guarantee that the companies with which we have strategic relationships will market our offerings effectively or continue to devote the resources necessary to provide us with effective sales, marketing and technical support. As our agreements with strategic partners terminate or expire, we may be unable to renew or replace these agreements on comparable terms, or at all.
We rely, to a significant degree, on indirect sales channels for the distribution of our offerings, and disruption within these channels could adversely affect our business, financial condition, operating results and cash flows.
We use a variety of different indirect distribution methods for our offerings, including channel partners, such as certified cloud and service providers, distributors, embedded technology partners, OEMs, ISVs, SIs and value added resellers. A number of these partners in turn distribute via their own networks of channel partners with whom we have no direct relationship. These relationships allow us to offer our technologies to a much larger customer base than we would otherwise be able through our direct sales and marketing efforts.
We rely, to a significant degree, on each of our channel partners to select, screen and maintain relationships with its distribution network and to distribute our offerings in a manner that is consistent with applicable law and regulatory requirements and our quality standards. If our channel partners or a partner in its distribution network
19
Table of Contents
Index to Financial Statements
violate applicable law or regulatory requirements or misrepresent the functionality of our offerings, our reputation could be damaged and we could be subject to potential liability. Furthermore, our channel partners may offer their own products and services or the products and services of other companies that compete with our offerings or may not distribute and market our offerings effectively. Moreover, our existing channel partner relationships do not, and any future channel partner relationships may not, provide for any exclusivity regarding marketing or distribution. In addition, if a channel partner is acquired by a competitor, its business units are reorganized or divested or its financial conditions were to weaken, our revenue derived from that partner may be adversely impacted.
Recruiting and retaining qualified channel partners and training them in the use of our enterprise technologies requires significant time and resources. If we fail to devote sufficient resources to support and expand our network of channel partners, our business may be adversely affected. In addition, because we rely on channel partners for the indirect distribution of our enterprise technologies, we may have little or no contact with the ultimate end-users of our technologies, thereby making it more difficult for us to establish brand awareness, ensure proper delivery and installation of our software, support ongoing customer requirements, estimate end-user demand, respond to evolving customer needs and obtain subscription renewals from end-users.
A portion of our sales to government entities have been made indirectly through our channel partners. Government entities may have statutory, contractual, or other legal rights to terminate contracts with our channel partners for convenience or due to a default, and any such termination may adversely impact our future operating results. Government entities routinely investigate and audit government contractors’ administrative processes, and any unfavorable audit could result in a government entity refusing to continue buying our offerings, a reduction of revenue or fines or civil or criminal liability if the audit uncovers improper or illegal activities.
If our indirect distribution channel is disrupted, we may be required to devote more resources to distribute our offerings directly and support our customers, which may not be as effective and could lead to higher costs, reduced revenue and growth that is slower than expected.
The duration and extent of economic downturns, regional financial instability, and economic and market conditions in general could adversely affect our business, financial condition, operating results and cash flows.
Economic weakness and uncertainty, tightened credit markets and constrained IT spending from time to time contribute to slowdowns in the technology industry, as well as in the industries of our customers and the geographic regions in which we operate, which may result in reduced demand and increased price competition for our offerings. Our operating results in one or more geographic regions or customer industries may also be affected by uncertain or changing economic conditions within that region or industry. Uncertainty about future economic conditions may, among other things, negatively impact our current and prospective customers and result in delays or reductions in technology purchases or lengthen our sales cycle. Adverse economic conditions also may negatively impact our ability to obtain payment for outstanding debts owed to us by our customers or other parties with whom we do business. In addition, such conditions may impact our investment portfolio, and we could determine that some of our investments have experienced an other-than-temporary decline in fair value, requiring an impairment charge that could adversely impact our financial condition and operating results. Also, such conditions may make it more difficult to forecast operating results. If global economic conditions, or economic conditions in the U.S., Europe, Asia or in other key geographic regions or customer industries, were to deteriorate, current and prospective customers may delay or reduce their IT spending, which could adversely affect our business, financial condition, operating results and cash flows.
If we fail to effectively manage our growth, our business, financial condition, operating results and cash flows could be adversely affected.
We have expanded our operations significantly in recent years. For example, our total revenue increased from $2.05 billion for the fiscal year ended February 29, 2016 to $2.41 billion for the fiscal year ended February 28, 2017 (“fiscal 2017”). Moreover, the total number of our employees increased from approximately
20
Table of Contents
Index to Financial Statements
8,800 as of February 29, 2016 to approximately 10,500 as of February 28, 2017. In addition, we continue to explore ways to extend our offerings and geographic reach. Our growth has placed and will likely continue to place a strain on our management systems, information systems, resources and internal controls. Our ability to successfully provide our offerings and implement our business plan requires adequate information systems and resources, internal controls and oversight from our senior management. As we expand in international markets, these challenges increase as a result of the need to support a growing business in an environment of multiple languages, cultures, customs, legal systems, dispute resolution systems, regulatory systems and commercial practices. As we grow, (i) we may not be able to adequately screen and hire or adequately train, supervise, manage or develop sufficient personnel, and (ii) we may not be able to develop or effectively manage our controls, oversight functions or information systems. If we are unable to effectively manage our growth, our business, financial condition, operating results and cash flows could be adversely affected.
We have entered into and may continue to enter into or seek to enter into business combinations and acquisitions, which may be difficult to complete and integrate, disrupt our business, divert management’s attention, adversely affect our business, financial condition, operating results and cash flows or dilute stockholder value.
As part of our business strategy, we have in the past entered into business combinations and acquisitions, and we may continue to do so in the future. These types of transactions can increase the expense of running our business and present significant challenges and risks, including:
| • | identifying acquisition targets that complement our strategic direction and technology road map; |
| • | integrating the acquired business’ accounting, financial reporting, management, information and information security, human resource and other administrative systems to permit effective management and reporting, and the lack of control if such integration is delayed or not implemented; |
| • | gathering full information regarding a business or technology prior to a transaction, including the identification and assessment of liabilities, claims or other circumstances that could result in litigation or regulatory exposure, unfavorable accounting treatment, unexpected tax implications and other adverse effects on our business; |
| • | increasing or adding operating expenses related to the acquired business or technology; |
| • | maintaining or establishing acceptable standards, controls, procedures and policies; |
| • | disrupting our ongoing business and distracting management; |
| • | impairing relationships with our employees, partners or customers as a result of any integration of new management and other personnel, products or technology or as a result of the changes in the competitive landscape affected by the transaction; |
| • | maintaining good relationships with customers or business partners of the acquired business; |
| • | effectively evaluating talent at an acquired business or identifying cultural challenges associated with integrating employees from the acquired business into our organization; |
| • | losing key employees of the acquired business; |
| • | incorporating and further developing acquired products or technology into our offerings and maintaining quality standards consistent with our brands; |
| • | achieving the expected benefits of the transaction, which may include generating greater market acceptance of our technologies, increasing our revenues or integrating the assets acquired into one or more of our current offerings; |
| • | incurring expenses related to the transaction; |
21
Table of Contents
Index to Financial Statements
| • | assuming claims and liabilities from the acquired business or technology, or that are otherwise related to the transaction; |
| • | entering into new markets in which we have little or no experience or in which competitors may have stronger market positions; |
| • | impairing of intangible assets and goodwill acquired in transactions; and |
| • | for foreign transactions, managing additional risks related to the integration of operations across different cultures and languages, and the economic, political, compliance and regulatory risks associated with specific countries. |
There can be no assurance that we will manage these challenges and risks successfully. Moreover, if we are not successful in completing transactions that we have pursued or may pursue, our business may be adversely affected, and we may incur substantial expenses and divert significant management time and resources. In addition, in pursuing and completing such transactions, we could use substantial portions of our available cash as all or a portion of the purchase price for these transactions or as retention incentives to employees of the acquired business, or we may incur substantial debt. We could also issue additional securities as all or a portion of the purchase price for these transactions or as retention incentives to employees of the acquired business, which could cause our stockholders to suffer significant dilution. Any transaction may not generate additional revenue or profit for us, or may take longer to do so than expected, which may adversely affect our business, financial condition, operating results and cash flows.
We depend on our key employees, and our inability to attract and retain such employees could adversely affect our business or diminish our brands.
Competition in our industry for qualified employees, especially technical employees, is intense and our competitors may directly target our employees. Our inability to attract and retain key employees could hinder our influence in open source projects and seriously impede our success. We have from time to time in the past experienced, and we may experience in the future, difficulty in hiring and retaining highly skilled employees with appropriate qualifications. Also, to the extent we hire personnel from competitors, we may be subject to allegations that they have been improperly solicited, that they have divulged proprietary or other confidential information, or that their former employers own their inventions or other work product. Moreover, the loss of these key employees, particularly to a competitor, some of which may be in a position to offer greater compensation, and any resulting loss of customers could reduce our market share and diminish our brands.
A number of our key employees have become, or will become, vested in a significant amount of their equity compensation awards. Employees may be more likely to leave us after a significant portion of their equity compensation awards fully vest, especially if the shares underlying the equity awards have significantly appreciated in value. Additionally, as we grow, there may be less equity compensation to award per employee. If we do not succeed in attracting and retaining key personnel, our business, financial performance, operating results and cash flows may be adversely affected.
We may not be able to continue to attract and retain capable management.
Our future success depends on the continued services and effectiveness of a number of key management personnel. The loss of these individuals, particularly to a competitor, some of which may be in a position to offer greater compensation, could adversely affect our business or stock price.
Our ability to retain key management personnel or hire capable new management personnel as we grow may be challenged to the extent that other companies are able to offer more attractive opportunities to the individuals we seek to hire or retain. In addition, historically we have used share-based compensation as a key component of our compensation packages. If the price of our common stock falls, the value of our share-based awards to recipients is reduced. Such events, or if we are unable to secure stockholder approval for increases in the number
22
Table of Contents
Index to Financial Statements
of shares eligible for share-based compensation grants, could adversely affect our ability to successfully attract and retain key management personnel. Effective succession planning is also important to our long-term success. Failure to ensure effective transfer of knowledge and smooth transitions involving key management personnel could hinder our strategic planning and execution.
Because of the characteristics of open source software, there are few technology barriers to entry into the open source market by new competitors and it may be relatively easy for competitors, some of which may have greater resources than we have, to enter our markets and compete with us.
One of the characteristics of open source software is that anyone may modify and redistribute the existing open source software and use it to compete with us. Such competition can develop without the degree of overhead and lead time required by traditional proprietary software companies. It is possible for competitors with greater resources than ours to develop their own open source solutions or acquire a smaller business that has developed open source offerings that compete with our offerings, potentially reducing the demand for, and putting price pressure on, our offerings. In addition, some competitors make their open source software available for free download and use on an ad hoc basis or may position their open source software as a loss leader. We cannot guarantee that we will be able to compete successfully against current and future competitors or that competitive pressure and/or the availability of open source software will not result in price reductions, reduced operating margins and loss of market share. Additionally, any failure by us to provide high-quality technical support, or the perception that we do not provide high-quality technical support, could harm our reputation and negatively impact our ability to sell subscriptions for our open source offerings to existing and prospective customers. If we are unable to differentiate our open source offerings from those of our competitors or compete effectively with other open source offerings, our business, financial condition, operation results and cash flows could be adversely affected.
Our corporate culture has contributed to our success, and if we cannot maintain this culture as we grow, we could lose the innovation, creativity and collaboration fostered by our culture, and our business may be adversely affected.
We believe that a critical contributor to our success has been our corporate culture, which we believe fosters innovation, creativity and collaboration. As our organization grows, our employees (including remote workers) and our resources become more globally dispersed and our organizational management structures become more complex, we may find it increasingly difficult to maintain these beneficial aspects of our corporate culture. If we are unable to maintain our corporate culture, we may find it difficult to attract and retain motivated employees, continue to perform at current levels or execute on our business strategy. As a result, our business, financial condition, operating results and cash flows could be adversely affected.
Our emerging technology offerings are based on developing technologies and business models, and the potential market for these offerings remains uncertain.
Our emerging technology offerings, which include our cloud, mobile and storage offerings, are based on developing technologies and business models, the success of which will depend on the technological and operational benefits and cost savings associated with the adoption of these technologies. These technologies are rapidly evolving, and their development is a complex and uncertain process requiring high levels of innovation and investment as well as the accurate anticipation of technology trends, market demand and customer needs. We expect competition to remain intense and, as with many emerging IT sectors, these technologies may be subject to a “first mover” effect pursuant to which certain product offerings rapidly capture a significant portion of market share and developer attention. Moreover, we may make errors in reacting to relevant business trends and predicting which technologies will be successful or otherwise develop into industry standards.
Adoption of emerging technologies may occur more slowly or less pervasively than we expect and the revenue growth associated with these offerings may be slower than currently expected. Moreover, even if
23
Table of Contents
Index to Financial Statements
emerging technologies are adopted widely by enterprises, our offerings in these areas may not attract a sufficient number of users or generate attractive financial results. We incur expenses associated with these offerings in advance of our ability to generate associated revenue. Demand for our emerging technology offerings may unfavorably impact demand for our other offerings, including software subscriptions and related professional services. If the market for our emerging technologies offerings fails to develop adequately, it could have an adverse effect on our business, financial condition, operating results and cash flows.
We may experience a decline in the demand for our offerings.
Demand for our offerings depends substantially on the general demand for enterprise software, which fluctuates based on numerous factors, including the spending levels and growth of our current and prospective customers, and general economic conditions. In addition, our customers generally undertake a significant evaluation process that may result in a lengthy sales cycle. We spend substantial time, effort, and money on our sales efforts, including developing and implementing appropriate go-to-market strategies and training our sales force and channel partners in order to effectively market new offerings, without any assurance that our efforts will produce any sales. The purchase of our offerings may be discretionary and can involve significant expenditures. If our current and prospective customers cut costs, then they may significantly reduce their enterprise software expenditures.
An increased focus on developing and providing emerging technology offerings may place a greater emphasis on marketing more holistic solutions, rather than individual offerings. Consequently, we may need to adapt our marketing and pricing strategies for our offerings, our customers’ purchasing decisions may become more complex and require additional levels of approval and the duration of sales cycles for our offerings may increase.
If demand for our offerings declines, our business, financial condition, operating results and cash flows could be adversely affected.
If our customers do not renew their subscription agreements with us, or if they renew on less favorable terms, our business, financial results, operating results and cash flows may be adversely affected.
Our customers may not renew their subscriptions after the expiration of their subscription agreements and in fact some customers elect not to do so. In addition, our customers may opt for a lower-priced edition of our offerings or for fewer subscriptions. We have limited historical data with respect to rates of customer subscription renewals, so we cannot accurately predict customer renewal rates. Our customers’ renewal rates may decline or fluctuate as a result of a number of factors, including their level of satisfaction with our offerings and their ability to continue their operations and spending levels. Government contracts could be subject to future funding that may affect the extension or termination of programs and generally are subject to the right of the government to terminate for convenience or non-appropriation. If we experience a decline in the renewal rates for our customers or they opt for lower-priced editions of our offerings or fewer subscriptions, our business, financial condition, operating results and cash flows may be adversely affected.
Our business model may encounter customer resistance.
We provide Red Hat enterprise technologies primarily under annual or multi-year subscriptions. A subscription generally entitles a customer to, among other things, a specified level of support, as well as security updates, fixes, functionality enhancements, upgrades to the technologies, each, if and when available, and compatibility with an ecosystem of certified hardware and software. While we believe this practice complies with the requirements of the GNU General Public License, and while we have reviewed this practice with the Free Software Foundation, the organization that maintains and provides interpretations of the GNU General Public License, customers may fail to honor the terms of our subscription agreements.
As technologies and the markets for our enterprise offerings change, our annual or multi-year subscription-based business model may no longer meet the needs of our customers. For example, a business model based on
24
Table of Contents
Index to Financial Statements
annual or multi-year subscriptions may no longer be competitive in an environment where disruptive technologies (such as cloud computing) enable customers to consume competitive offerings available from companies such as Amazon, Google Inc. and Microsoft on an hourly basis or for free. We also develop and offer these disruptive technologies with consumption-based pricing, which may have an effect on the demand for our subscription-based offerings.
If we are unable to adapt our business model to changes in the marketplace, our business, financial condition, operating results and cash flows could be adversely affected.
If third-party enterprise hardware and software providers do not continue to make their products and services compatible with our offerings, our software may cease to be competitive and our business, financial condition, operating results and cash flows may be adversely affected.
The competitive position of our offerings is dependent on their compatibility with products and services of third-party enterprise hardware and software companies. To the extent that a hardware or software vendor might have or develop products and services that compete with ours, the vendor may have an incentive to seek to limit the performance, functionality or compatibility of our offerings when used with one or more of the vendor’s offerings. In addition, these vendors may fail to support or issue statements of compatibility or certification of our offerings when used with their offerings. We intend to encourage the development of additional applications that operate on both current and new versions of our offerings by, among other means, attracting third-party developers to our offerings, providing open source tools to create these applications and maintaining our existing developer relationships through marketing and technical support. We intend to encourage the compatibility of our software with various third-party hardware and software offerings by maintaining and expanding our relationships, both business and technical, with relevant independent hardware and software vendors. If we are not successful in achieving these goals, however, our offerings may not be competitive and our business, financial condition, operating results and cash flows may be adversely affected.
If open source software programmers, most of whom we do not employ, do not continue to develop and enhance open source technologies, we may be unable to develop new technologies, adequately enhance our existing technologies or meet customer requirements for innovation, quality and price.
We rely to a significant degree on a number of largely informal communities of independent open source software programmers to develop and enhance our enterprise technologies. For example, Linus Torvalds, a prominent open source software developer, and a relatively small group of software engineers, many of whom are not employed by us, are primarily responsible for the development and evolution of the Linux kernel, which is the heart of the Red Hat Enterprise Linux operating system. If these groups of programmers fail to adequately further develop and enhance open source technologies, we would have to rely on other parties to develop and enhance our offerings or we would need to develop and enhance our offerings with our own resources. We cannot predict whether further developments and enhancements to these technologies would be available from reliable alternative sources. In either event, our development expenses could be increased and our technology release and upgrade schedules could be delayed. Moreover, if third-party software programmers fail to adequately further develop and enhance open source technologies, the development and adoption of these technologies could be stifled and our offerings could become less competitive. Delays in developing, completing or delivering new or enhanced offerings could result in delayed or reduced revenue for those offerings and could also adversely affect customer acceptance of those offerings.
Our offerings may contain defects that may be costly to correct, delay market acceptance of our enterprise technologies and expose us to claims and litigation.
Despite our testing procedures, errors have been and may continue to be found in our offerings after deployment. This risk is increased by the fact that much of the code in our offerings is developed by independent parties over whom we exercise no supervision or control. If errors are discovered, we may have to make
25
Table of Contents
Index to Financial Statements
significant expenditures of capital and devote significant technical resources to analyze, correct, eliminate or work around them, and we may not be able to successfully do so in a timely manner or at all. Errors and failures in our offerings could result in a loss of, or delay in, market acceptance of our enterprise technologies, loss of existing or potential customers and delayed or lost revenue and could damage our reputation and our ability to convince enterprise users of the benefits of our technologies.
In addition, errors in our technologies could cause system failures, loss of data or other adverse effects for our customers who may assert warranty and other claims for substantial damages against us. Although our agreements with our customers often contain provisions which seek to limit our exposure to potential product liability claims, it is possible that these provisions may not be effective or enforceable under the laws of some jurisdictions. While we seek to insure against these types of claims, our insurance policies may not adequately limit our exposure to such claims. These claims, even if unsuccessful, could be costly and time-consuming to defend and could adversely affect our business, financial conditions, operating results and cash flows.
Our continued success depends on our ability to maintain and enhance strong brands.
We believe that the brand identities that we have developed have contributed significantly to the success of our business. We also believe that maintaining and enhancing our brands is important to expanding our customer and partner base and attracting talented employees. In order to maintain and enhance our brands, we may be required to make further investments that may not be successful. Maintaining our brands will depend in part on our ability to remain a leader in open source technology and our ability to continue to provide high-quality offerings. If we fail to promote and maintain our brands, or if we incur excessive costs in doing so, our business, financial condition, operating results and cash flows may be adversely affected.
Security breaches and data loss may expose us to liability, harm our reputation and adversely affect our business.
Our business involves the production and distribution of enterprise software technologies, as well as hosting applications. As part of our business, we (or third parties with whom we contract) receive, store and process our data, as well as our customers’ and partners’ data. While we take security and testing measures relating to our offerings and operations, those measures may not prevent security breaches and data loss that could harm our business or the businesses of our customers and partners. Advances in computer capabilities, new discoveries in the field of cryptography, inadequate technology or facility security measures or other factors may result in data loss or a compromise or breach of our systems and the data we receive, store and process (or systems and the data received, stored and processed by third parties with whom we contract). These security measures may be breached or data lost as a result of actions by third parties, employee error (such as weak passwords or unencrypted devices), malfeasance or vulnerabilities (including vulnerabilities of our vendors) or security bugs found in software code. A party who is able to circumvent security measures or exploit inadequacies in security measures, could, among other things, misappropriate proprietary information (including information about our employees, customers and partners, our customers’ information, financial data and data that others could use to compete against us), cause the loss or disclosure of some or all of this information, cause interruptions or denial of service in our or our customers’ operations, cause delays in development efforts or expose customers (and their customers) to computer viruses or other disruptions or vulnerabilities. A compromise to these systems could remain undetected for an extended period of time, exacerbating the impact of that compromise. These risks may increase as we continue to grow our cloud, mobile and services offerings and as we receive, store and process more of our customers’ data. Actual or perceived vulnerabilities may lead to regulatory investigations, claims against us by customers, partners or other third parties, or costs, such as those related to providing customer notifications and fraud monitoring. While our customer agreements typically contain provisions that seek to limit our liability, there is no assurance these provisions will be enforceable and effective under applicable law. In addition, the cost and operational consequences of implementing further data protection measures could be significant. Moreover, because the techniques used to obtain unauthorized access, disable or degrade service or sabotage systems change frequently and often are not recognized until launched against a target, we may be
26
Table of Contents
Index to Financial Statements
unable to anticipate these techniques or to implement adequate preventative measures. Any loss of data or compromise of our systems or the data we receive, store or process (or systems and the data received, stored and processed by third parties with whom we contract) could result in a loss of confidence in the security of our offerings, damage our reputation, loss of channel or strategic partners, lead to legal liability and adversely affect our business, financial condition, operating results and cash flows.
We are vulnerable to technology infrastructure failures, which could harm our reputation and adversely affect our business.
We rely on our technology infrastructure, and the technology infrastructure of third parties, for many functions, including selling our offerings, supporting our partners, fulfilling orders and billing, and collecting and making payments. This technology infrastructure may be vulnerable to damage or interruption from natural disasters, power loss, telecommunication failures, terrorist attacks, computer intrusions, vulnerabilities and viruses, software errors, computer denial-of-service attacks and other events. A significant number of the systems making up this infrastructure are not redundant, and our disaster recovery planning may not be sufficient for every eventuality. This technology infrastructure may fail or be vulnerable to damage or interruption because of actions by third parties or employee error or malfeasance. We may not carry business interruption insurance sufficient to protect us from all losses that may result from interruptions in our services as a result of technology infrastructure failures or to cover all contingencies. Any interruption in the availability of our websites and on-line interactions with customers or partners may cause a reduction in customer or partner satisfaction levels, which in turn could cause additional claims, reduced revenue or loss of customers or partners. Despite any precautions we may take, such problems could result in, among other consequences, a loss of data, loss of confidence in the stability and reliability of our offerings, damage to our reputation, and legal liability, all of which may adversely affect our business, financial condition, operating results and cash flows.
A decline in or reprioritization of funding in the U.S. or foreign government budgets or delays in the budget process could adversely affect our business, financial condition, operating results and cash flows.
We derive, and expect to continue to derive, a portion of our revenue from U.S. and foreign governments. Government deficit reduction and austerity measures can place pressure on U.S. and foreign government spending. The termination of, or delayed or reduced funding for, government-sponsored programs and contracts from which we derive revenue could adversely affect our business, financial condition, operating results and cash flows.
We may be unable to predict the future course of open source technology development, which could reduce the market appeal of our offerings, damage our reputation and adversely affect our business, financial condition, operating results and cash flows.
We do not exercise control over many aspects of the development of open source technology. Different groups of open source software programmers compete with one another to develop new technology. Typically, the technology developed by one group will become more widely used than that developed by others. If we acquire or adopt new technology and incorporate it into our offerings but competing technology becomes more widely used or accepted, the market appeal of our offerings may be reduced, which could harm our reputation, diminish our brands and adversely affect our business, financial condition, operating results and cash flows.
We include software licensed from other parties in our offerings, the loss of which could increase our costs and delay availability of our offerings.
We utilize various types of software licensed from unaffiliated third parties in our offerings. Aspects of our business could be disrupted if any of the software we license from others or functional equivalents of this software were no longer available to us, no longer offered to us on commercially reasonable terms or changed in ways or included defects that make the third-party software unsuitable for our use. In these cases, we would be
27
Table of Contents
Index to Financial Statements
required to either redesign our technologies to function with software available from other parties, develop these components ourselves or eliminate the functionality, which could result in increased costs, the need to mitigate customer issues, delays in delivery of our offerings and the release of new offerings and limit the features available in our current or future offerings.
RISKS RELATED TO LEGAL UNCERTAINTY
If our technologies are found or alleged to infringe third-party intellectual property rights, we may be required to take costly and time-consuming actions to meet our commitments to customers.
We regularly commit to our subscription customers that if portions of our offerings are found to infringe third-party intellectual property rights we will, at our expense and option: (i) obtain the right for the customer to continue to use the technology consistent with their subscription agreement with us; (ii) modify the technology so that its use is non-infringing; or (iii) replace the infringing component with a non-infringing component, and defend them against specified infringement claims. Although we cannot predict whether we will need to satisfy these commitments and we often have limitations on these commitments, satisfying these commitments could be costly, be time-consuming, divert the attention of technical and management personnel, and adversely affect our business, financial condition, operating results and cash flows. In addition, our insurance policies would likely not adequately cover our exposure to this type of claim. Finally, because we have agreed to defend our subscription customers against specified infringement claims arising from the use of our offerings, we could become involved in litigation brought against such customers if our services and technology are allegedly implicated.
We are vulnerable to claims that our technologies infringe third-party intellectual property rights, and an unfavorable legal decision affecting our intellectual property could adversely affect our business.
We are vulnerable to claims that our technologies infringe third-party intellectual property rights, including patents, copyrights, trademarks and trade secrets, because our technologies are comprised of software components, many of which are developed by numerous independent parties. We are also unlikely to be able to assess adequately the relevance of patents to our technologies, and may be unable to take appropriate responsive action in a timely or economic manner because, among other reasons, the scope of software patent protection is often not well defined or readily determinable, patent applications in the U.S. are not publicly disclosed at the time of filing, and the number of software patents that are issued each year is significant and growing. Our exposure to risks associated with the use of intellectual property may increase as a result of acquisitions. In addition, third parties may make infringement and similar or related claims after we have acquired technology that had not been asserted prior to our acquisition of such technology.
In the past, our technologies have been subject to intellectual property infringement claims. Some of these claims have been brought by entities that do not design, manufacture, or distribute products or services or that acquire intellectual property like patents for the sole purpose of monetizing their acquired intellectual property through asserting claims of infringement. As these entities do not have operating businesses of their own and therefore have limited risk of counterclaims for damages or injunctive relief, it may be difficult to deter them from bringing intellectual property infringement claims. We expect to face the possibility of more intellectual property infringement claims as our prominence increases, business activities expand, market share and revenue grow, the number of products and competitors in our industry grows and the functionality of products in different portions of the industry overlap. We may not be able to accurately assess the risk related to these suits, and we may be unable to accurately assess our level of exposure.
Defending patent and other intellectual property claims, even claims without significant merit, can be time-consuming, costly and can divert the attention of technical and management personnel. We may receive unfavorable preliminary or interim rulings in the course of litigation, and there can be no assurances that
28
Table of Contents
Index to Financial Statements
favorable final outcomes will be obtained in all cases. We may decide to settle certain lawsuits and disputes on terms that are disadvantageous to us. Similarly, if any litigation to which we are a party is resolved adversely, we may be subject to an unfavorable judgment that may not be reversed upon appeal. The terms of such a settlement or judgment may require us to cease offering certain of our technologies or pay substantial amounts to the other party. In addition, we may have to seek a license to continue offering technologies found to be in violation of a third party’s rights, which may not be available on reasonable terms, or at all, and may significantly increase our operating costs and expenses. As a result, we may also be required to develop alternative non-infringing technology or practices or discontinue the practices. The development of alternative non-infringing technology or practices could require significant effort and expense or may not be feasible.
An unfavorable legal decision regarding the intellectual property in and to our technology and other offerings could adversely affect our business, financial condition, operating results and cash flows. See Part I, Item 3, “Legal Proceedings” for additional information.
Our activities, or the activities of our partners, may violate anti-corruption laws and regulations that apply to us.
In many foreign countries, particularly in certain developing economies, it is not uncommon to engage in business practices that are prohibited by regulations that may apply to us, such as the U.S. Foreign Corrupt Practices Act and similar laws. Although we have policies and procedures designed to help promote compliance with these laws, our employees, contractors, partners and agents, as well as those companies to which we outsource certain of our business operations, may take actions in violation of our policies and procedures. Any violation of these laws and regulations could result in fines, criminal sanctions against us, our officers, or our employees, prohibitions on the conduct of our business, and damage to our reputation.
Governmental regulations affecting the import or export of software could adversely impact our business.
Due to the global nature of our business, we are subject to import and export restrictions and regulations, including the Export Administration Regulations administered by the U.S. Commerce Department’s Bureau of Industry and Security (“BIS”) and the trade and economic sanctions regulations administered by the U.S. Treasury Department’s Office of Foreign Assets Control (“OFAC”). The U.S., through the BIS and OFAC, places restrictions on the sale or export of certain products and services to certain countries and persons (“denied parties”). Violators of these export control and sanctions laws may be subject to significant penalties, which may include significant monetary fines, criminal proceedings against them and their officers and employees, a denial of export privileges, and suspension or debarment from selling products or services to the federal government. Any such penalties could have an adverse effect on our business, financial condition, operating results and cash flows. In addition, the political and media scrutiny surrounding any governmental investigation of us could cause us significant expense and reputational harm and distract senior executives from managing our normal day-to-day operations.
Our products could also be shipped to denied parties by third parties, including our channel partners. Even though we take precautions to ensure that our channel partners comply with all relevant import and export regulations, any failure by our channel partners to comply with such regulations could have negative consequences for us, including reputational harm, government investigations and penalties.
We could be prevented from selling or developing our software if the GNU General Public License and similar licenses under which our technologies are developed and licensed are not enforceable or are modified so as to become incompatible with other open source licenses.
A number of our offerings, including Red Hat Enterprise Linux, have been developed and licensed under the GNU General Public License and similar open source licenses. These licenses state that any program licensed under them may be liberally copied, modified and distributed. It is possible that a court would hold these licenses
29
Table of Contents
Index to Financial Statements
to be unenforceable or that someone could assert a claim for proprietary rights in a program developed and distributed under them. Additionally, if any of the open source components of our offerings may not be liberally copied, modified or distributed, then our ability to distribute or develop all or a portion of our offerings could be adversely impacted. In addition, licensors of open source software employed in our offerings may, from time to time, modify the terms of their license agreements in such a manner that those license terms may become incompatible with other open source licenses in our offerings or our end user license agreement, and thus could, among other consequences, prevent us from distributing the software code subject to the modified license.
Our efforts to protect our trademarks may not be adequate to prevent third parties from misappropriating our intellectual property rights in our trademarks.
Our collection of trademarks is valuable and important to our business. The protective steps we have taken in the past may have been, and may in the future continue to be, inadequate to protect and deter misappropriation of our trademark rights. We may be unable to detect the unauthorized use of, or take appropriate steps to enforce, our trademark rights in a timely manner. We have registered some of our trademarks in countries in North America, South America, Europe, Asia, Africa and Australia and have other trademark applications pending in various countries around the world. Effective trademark protection may not be available in every country in which we offer or intend to distribute our offerings. We may be unable to prevent third parties from acquiring domain names that are similar to, infringe upon, or diminish the value of our trademarks and other proprietary rights. Failure to adequately protect our trademark rights could damage or even destroy one or more of our brands and impair our ability to compete effectively. Furthermore, defending or enforcing our trademark rights could result in the expenditure of significant financial and managerial resources.
Efforts to assert intellectual property ownership rights in our technologies could impact our standing in the open source community, which could limit our technology innovation capabilities and adversely affect our business.
When we undertake actions to protect and maintain ownership and control over our intellectual property, including patents, copyrights and trademark rights, our standing in the open source community could be adversely affected as the community supports the ability to write and share code freely. This in turn could limit our ability to continue to rely on this community, upon which we are dependent, as a resource to help develop and improve our technologies and further our research and development efforts, which could adversely affect our business.
Our “Patent Promise” on software patents limits our ability to enforce our patent rights in certain circumstances.
As part of our commitment to the open source community, we provide our Patent Promise on software patents. Under our Patent Promise, we agree, subject to certain limitations, to not enforce our patent rights against users of open source software covered by certain open source licenses, including the GNU General Public License version 2.0 and version 3.0, GNU Lesser General Public License version 2.1 and version 3.0, IBM Public License version 1.0, Common Public License version 1.0, Q Public License version 1.0, Open Software License version 3.0 and any other open source license granted by Red Hat. While we may be able to claim protection of our intellectual property under other rights, such as trade secrets or contractual rights, our Patent Promise effectively limits our ability to assert our patent rights against these third parties (even if we were to conclude that their use infringes our patents with competing offerings), unless any such third party asserts its patent rights against us. This limitation on our ability to assert our patent rights against others could harm our business and ability to compete.
We are, and may become, involved in disputes and lawsuits that could adversely affect our business.
Lawsuits or legal proceedings may be commenced against us. These disputes and proceedings may involve significant expense and divert the attention of management and other employees. If we do not prevail in these
30
Table of Contents
Index to Financial Statements
matters, we could be required to pay substantial damages or settlement costs, which could adversely affect our business, financial condition, operating results and cash flows. See Part I, Item 3, “Legal Proceedings” for additional information.
If we fail to comply with laws and regulations regarding data privacy and protection, our business could be adversely affected.
Our business is subject to a variety of federal, state and international laws and regulations that apply to the collection, use, retention, protection, disclosure, transfer and processing of personal data. These data privacy- and protection-related laws and regulations are evolving, with new or modified laws and regulations proposed and implemented frequently and existing laws and regulations subject to new or different interpretations.
Any failure by us to comply with data privacy- and protection-related laws and regulations could result in enforcement actions, significant penalties or other legal actions against us or our customers or suppliers. An actual or alleged failure to comply, which could result in negative publicity, reduce demand for our offerings, increase the cost of compliance, require changes in business practices that result in reduced revenue, restrict our ability to provide our offerings in certain locations, result in our customers’ inability to use our offerings and prohibit data transfers or result in other claims, liabilities or sanctions, including fines, could have an adverse effect on our business, financial condition, operating results and cash flows.
If we fail to comply with our customer contracts or government contracting regulations, our business could be adversely affected.
Our contracts with our customers may include specialized performance requirements. In particular, our contracts with federal, state, provincial and local governmental customers are subject to various government certification requirements, procurement regulations, contract provisions and other requirements relating to their formation, administration and performance. Any failure by us or our channel partners to comply with the specific provisions in our customer contracts or any violation of government contracting regulations by us or our channel partners could result in the imposition of various civil and criminal penalties, which may include termination of contracts, forfeiture of profits, suspension of payments and, in the case of our government contracts, fines and suspension from future government contracting. In addition, we may be subject to qui tam litigation, the process by which a private individual sues or prosecutes on behalf of the government relating to government contracts and shares in the proceeds of any successful litigation or settlement, which could include claims for up to treble damages. Further, any negative publicity related to our customer contracts or any proceedings surrounding them, regardless of its accuracy, may damage our business and affect our ability to compete for new contracts. If our customer contracts are terminated, if we are suspended from government work, if we are unable to meet government certification requirements, or if our ability to compete for new contracts is adversely affected, we could suffer an adverse effect on our business, financial condition, operating results and cash flows.
We may be subject to legal liability associated with providing online services or content.
We provide offerings, such as Red Hat OpenShift, that enable users to exchange information, advertise products and services, conduct business, and engage in various online activities. The law relating to the liability of providers of these online offerings for activities of their users is relatively unsettled and still developing both in the U.S. and internationally and may be significantly different from jurisdiction to jurisdiction. Claims could be brought against us based on the nature and content of information that we publish or to which we provide links or that may be posted online or generated by us or by third parties, including our customers. In addition, we could be subject to domestic or international actions alleging that certain content we have generated or third-party content that we have made available within our services violates applicable law.
31
Table of Contents
Index to Financial Statements
RISKS RELATED TO FINANCIAL UNCERTAINTY
Our quarterly and annual operating results may not be a reliable indicator of our future financial performance.
Due to the unpredictability of the IT spending environment, among other reasons, our revenue and operating results have fluctuated and may continue to fluctuate. We base our current and projected future expense levels, in part, on our estimates of future revenue. Our expenses are, to a large extent, fixed in the short term. Accordingly, we may not be able to adjust our spending quickly enough to protect our projected operating results for a quarter if our revenue in that quarter falls short of our expectations.
Our fourth fiscal quarter has historically been our strongest quarter for sales. This pattern has become more pronounced as the number of customers with renewal dates occurring in the last half of our fiscal year has continued to increase. Additionally, a significant portion of our quarterly sales typically occur during the last weeks of the quarter and our operating results may be adversely impacted if we do not have sufficient time to bill and collect from our customers in the same quarter or fiscal year. Some of our customers may wait until the end of the quarter to negotiate their contracts in the hope of obtaining more favorable terms, which can also impede our ability to execute these contracts within the same quarter. Moreover, as an increasing number of customers enter into larger, multi-year transactions with us, such transactions tend to have longer sales cycles and can involve customers choosing to pay annually, which may impact our quarterly operating results. If, among other considerations, our future financial performance falls below the expectations of securities analysts or investors or we are unable to increase or maintain profitability, the market price of our common stock may decline.
We may not be able to meet the financial and operational challenges that we will encounter as our international operations, which represented approximately 41.9% of our total revenue for fiscal 2017, continue to expand.
Our international operations accounted for approximately 41.9% of total revenue for fiscal 2017. As we expand our international operations, we may have difficulty managing and administering a globally dispersed business and we may need to expend additional funds to, among other activities, reorganize our sales force and technical support services team, outsource or supplement general and administrative functions, staff key management positions, obtain additional information technology infrastructure and successfully localize offerings for a significant number of international markets, which may adversely affect our operating results. Additional challenges associated with the conduct of our business globally that may adversely affect our operating results include:
| • | fluctuations in exchange rates; |
| • | pricing environments; |
| • | longer payment cycles and less financial stability of customers; |
| • | economic, political, compliance and regulatory risks associated with specific countries; |
| • | laws and policies of the U.S. and other jurisdictions affecting trade, foreign investment, loans, immigration and taxes, including any adverse effects that may result from the recent changes in U.S. government and the United Kingdom’s vote to exit the European Union; |
| • | difficulty selecting and monitoring channel partners; |
| • | differing technology standards and customer requirements; |
| • | lower levels of availability or use of the Internet, through which our software is often delivered; |
| • | difficulty protecting our intellectual property rights globally due to, among other reasons, the uncertainty of laws and enforcement in certain countries relating to the protection of intellectual property rights; |
32
Table of Contents
Index to Financial Statements
| • | difficulty in staffing, developing and managing foreign operations as a result of distance and language, legal, cultural and other differences; |
| • | different employee/employer relationships and the existence of works councils and labor unions; |
| • | difficulty maintaining quality standards consistent with our brands; |
| • | export and import laws and regulations that could prevent us from delivering our offerings into and from certain countries; |
| • | public health risks and natural disasters, particularly in areas in which we have significant operations; |
| • | limitations on the repatriation and investment of funds and foreign currency exchange restrictions; |
| • | changes in import/export duties, quotas or other trade barriers that could affect the competitive pricing of our offerings and reduce our market share in some countries; and |
| • | economic or political instability or terrorist acts in some international markets that could adversely affect our business in those markets or result in the loss or forfeiture of some foreign assets and the loss of sums spent developing and marketing those assets and the revenue associated with them. |
Any failure by us to effectively manage the challenges associated with the international expansion of our operations could adversely affect our business, financial condition, operating results and cash flows.
A substantial portion of our revenue is derived from our Red Hat Enterprise Linux platform.
During fiscal 2017, a substantial portion of our subscription revenue was derived from our Red Hat Enterprise Linux offerings. Although we are continuing to develop other offerings, we expect that revenue from Red Hat Enterprise Linux will constitute a majority of our revenue for the foreseeable future. Declines and variability in demand for Red Hat Enterprise Linux could occur as a result of:
| • | competitive products and pricing; |
| • | failure to release new or enhanced versions of Red Hat Enterprise Linux on a timely basis, or at all; |
| • | maturity of the market for Red Hat Enterprise Linux; |
| • | technological change that we are unable to address with Red Hat Enterprise Linux; or |
| • | future economic conditions. |
Additionally, as more customers and potential customers virtualize their data centers and move computing projects to cloud environments, demand for operating systems such as Red Hat Enterprise Linux may decline. Moreover, as data centers become more virtualized and move to cloud environments, we may experience a decline in growth if we are unsuccessful in adapting our business model and offerings accordingly. Due to the concentration of our revenue from Red Hat Enterprise Linux, our business, financial condition, operating results and cash flows could be adversely affected by a decline in demand for Red Hat Enterprise Linux.
We are subject to risks of currency fluctuations and related hedging operations.
A portion of our business is conducted in currencies other than the U.S. dollar. Changes in exchange rates among other currencies and the U.S. dollar may affect our revenue, operating expenses and operating margins, which are reported in U.S. dollars. We cannot predict the impact of future exchange rate fluctuations. As we expand international operations, our exposure to exchange rate fluctuations may increase. We may use financial instruments, primarily forward purchase contracts, to economically hedge currency commitments arising from trade accounts receivable, trade accounts payable and fixed purchase obligations. If these hedging activities are not successful or we change or reduce these hedging activities in the future, we may experience significant unexpected expenses from fluctuations in exchange rates. For information regarding our hedging activity, see Part II, Item 7A, “Quantitative and Qualitative Disclosures About Market Risk”.
33
Table of Contents
Index to Financial Statements
If our growth rate slows, our stock price could be adversely affected.
As the markets for our offerings mature and the scale of our business increases, our rate of revenue, deferred revenue and operating cash flow growth may be lower than the growth rates we experienced in earlier periods. In addition, to the extent that the adoption of our offerings occurs more slowly or is less pervasive than we expect, our growth rates may slow or decline, which could adversely affect our stock price. Historical period-to-period comparisons of our revenue, deferred revenue and operating cash flow may not be meaningful and are not guarantees of our future performance.
We may be subject to greater tax liabilities.
We are subject to income and other taxes in the U.S. and in numerous foreign jurisdictions. Our domestic and foreign tax liabilities are dependent on the jurisdictions in which profits are determined to be earned and taxed. Additionally, the amount of taxes paid is subject to our interpretation of applicable tax laws in the jurisdictions in which we operate. Changes in tax laws, or in judicial or administrative interpretations of tax laws, could have an adverse effect on our business, financial condition, operating results and cash flows. Significant judgment, knowledge and experience are required in determining our worldwide provision for income taxes. Our future effective tax rate is impacted by a number of factors including changes in the valuation of our deferred tax assets and liabilities, increases in expenses not deductible for tax, including impairment of goodwill in connection with acquisitions, and changes in available tax credits. In the ordinary course of our business, there are many transactions and calculations where the ultimate tax determination is uncertain. We are regularly subject to audits by tax authorities. Although we believe our tax estimates are reasonable, the final determination of tax audits and any related litigation could be materially different from our historical income tax provisions and accruals. Economic and political pressures to increase tax revenue in various jurisdictions may make resolving tax disputes more difficult. The results of an audit or litigation could adversely affect our financial statements in the period or periods for which that determination is made.
We earn a significant amount of our operating income from outside the U.S., and any repatriation of funds currently held in foreign jurisdictions may result in higher effective tax rates for the company. In addition, there have been proposals to change U.S. tax laws that would significantly impact how U.S. multinational corporations are taxed on foreign earnings, including recent proposals to change a number of international tax practices and principles recently recommended by the Organization for Economic Co-operation and Development’s (“OECD’s”) Base Erosion and Profit Shifting (“BEPS”) project. Although we cannot predict whether or in what form any legislation based on such proposals may be adopted by the countries in which we do business, future tax reform based on such proposals may increase the amount of taxes we pay and adversely affect our operating results and cash flows.
Because we recognize revenue from subscriptions for our service over the term of the subscription, downturns or upturns in sales may not be immediately reflected in our operating results.
We generally recognize subscription revenue from customers ratably over the term of their subscription agreements, which are generally 12 to 36 months. As a result, much of the revenue we report in each quarter is deferred revenue from subscription agreements entered into during previous quarters. Consequently, a decline in subscriptions in any one quarter will not necessarily be fully reflected in the revenue in that quarter and will negatively affect our revenue in future quarters. In addition, we may be unable to adjust our cost structure to reflect this reduced revenue. Accordingly, the effect of significant downturns in sales and market acceptance of our service, and potential changes in our rate of renewals, may not be fully reflected in our operating results until future periods. Our subscription model also makes it difficult for us to rapidly increase our revenue through additional sales in any period, as revenue from new customers must be recognized over the applicable subscription term.
34
Table of Contents
Index to Financial Statements
If our goodwill or amortizable intangible assets become impaired, we may be required to record a significant charge to earnings.
Under generally accepted accounting principles, we review our amortizable intangible assets for impairment when events or changes in circumstances indicate the carrying value may not be recoverable. Goodwill is required to be tested for impairment at least annually. Factors that may be considered a change in circumstances indicating that the carrying value of our goodwill or amortizable intangible assets may not be recoverable include a decline in stock price and market capitalization, reduced future cash flow estimates and slower growth rates in our industry. We may be required to record a significant charge to earnings in our financial statements during the period in which any impairment of our goodwill or amortizable intangible assets is determined, which could adversely affect our operating results.
We may be exposed to potential risks if we do not have an effective system of disclosure controls or internal controls.
We must comply, on an on-going basis, with the requirements of the Sarbanes-Oxley Act of 2002, including those provisions that establish the requirements for both management and auditors of public companies with respect to reporting on internal control over financial reporting. We cannot be certain that measures we have taken, and will take, will be sufficient or timely completed to meet these requirements on an on-going basis, or that we will be able to implement and maintain adequate disclosure controls and controls over our financial processes and reporting in the future, particularly in light of our rapid growth, international expansion and changes in our offerings, which are expected to result in on-going changes to our control systems and areas of potential risk.
If we fail to maintain an effective system of disclosure controls or internal control over financial reporting, including satisfaction of the requirements of the Sarbanes-Oxley Act, we may not be able to accurately or timely report on our financial results or adequately identify and reduce fraud. As a result, the financial condition of our business could be adversely affected, current and potential future stockholders could lose confidence in us and/or our reported financial results, which may cause a negative effect on our trading price, and we could be exposed to litigation or regulatory proceedings, which may be costly or divert management attention.
Changes in accounting principles and guidance, or their interpretation, could result in unfavorable accounting charges or effects, including changes to previously filed financial statements, which could cause our stock to decline.
We prepare our consolidated financial statements in accordance with accounting principles generally accepted in the U.S. These principles are subject to interpretation by the U.S. Securities and Exchange Commission and various bodies formed to create and interpret appropriate accounting principles and guidance. A change in these principles or guidance, or in their interpretations, may have a significant effect on our reported results, as well as our processes and related controls, and may retroactively affect previously reported results. For example, in May 2014, the Financial Accounting Standards Board issued Accounting Standards Update 2014-09, Revenue from Contracts with Customers (“ASU 2014-09”). This guidance is effective for us beginning the first quarter of our fiscal year ending February 28, 2019. For a discussion of the potential impact that the implementation of ASU 2014-09 will have on our consolidated financial statements and related disclosures, see NOTE 2—Summary of Significant Accounting Policies to our Consolidated Financial Statements in Part II, Item 8, “Financial Statements and Supplementary Data”.
Our investment portfolio is subject to credit and liquidity risks and fluctuations in the market value of our investments and interest rates. These risks may result in an impairment of, or the loss of all or a portion of, the value of our investments, an inability to sell our investments or a decline in interest income.
We maintain an investment portfolio of various holdings, types and maturities. Our portfolio as of February 28, 2017 consisted primarily of money market funds, U.S. government and agency securities, European
35
Table of Contents
Index to Financial Statements
sovereign and agency securities with a rating of AA or higher, certificates of deposit, and corporate securities. Although we follow an established investment policy and seek to minimize the risks associated with our investments by investing primarily in investment grade, highly liquid securities and by limiting the amounts invested with any one institution, type of security or issuer, we cannot give assurances that the assets in our investment portfolio will not lose value or become impaired, or that our interest income will not decline.
A significant part of our investment portfolio consists of U.S. government and agency securities. If global credit and equity markets experience prolonged periods of decline, or if there is a default or downgrade of U.S. government or agency debt, our investment portfolio may be adversely impacted and we could determine that some of our investments have experienced an other-than-temporary decline in fair value, requiring impairment charges that could adversely affect our financial condition and operating results.
Future fluctuations and uncertainty in economic and market conditions could adversely affect the market value of our investments, and we could record additional impairment charges and lose some or all of the principal value of investments in our portfolio. A total loss of an investment or a significant decline in the value of our investment portfolio could adversely affect our financial condition and operating results. For information regarding the sensitivity of and risks associated with the market value of portfolio investments and interest rates, see Part II, Item 7A, “Quantitative and Qualitative Disclosures About Market Risk”.
Our investments in private companies are subject to risk of loss of investment capital. Some of these investments may have been made to further our strategic objectives and support our key business initiatives. Our investments in private companies are inherently risky because the markets for the technologies they have under development are typically in the early stages and may never materialize. We could lose the value of our entire investment in these companies.
Epidemics, geo-political events, Internet and power outages or natural disasters could adversely affect our business, financial condition, operating results and cash flows.
The occurrence of one or more epidemics, geo-political events (such as civil unrest or terrorist attacks), Internet and power outages or natural disasters in a country in which we operate or in which technology industry suppliers or our customers are located, could adversely affect our business, financial condition, operating results and cash flows. Such events could result in physical damage to, or the complete loss of, one or more of our facilities, the lack of an adequate work force in a market, the inability of our customers to access our offerings, the inability of our associates to reach or have transportation to our facilities or our customers’ facilities directly affected by such events, the evacuation of the populace from areas in which our facilities are located, changes in the purchasing patterns of our customers, the temporary or long-term disruption in the supply of computer hardware and related components, the disruption or delay in the manufacture and transport of goods globally, the disruption of utility services to our facilities or to suppliers, partners or customers, or disruption in our communications with our customers.
RISKS RELATED TO THE CONVERTIBLE NOTES
The convertible notes are effectively subordinated to any secured debt we incur in the future and to any liabilities of our subsidiaries.
In October 2014, we issued $805.0 million of 0.25% Convertible Senior Notes due 2019 (the “convertible notes”). The convertible notes will rank senior in right of payment to any of our indebtedness that is expressly subordinated in right of payment to the convertible notes; equal in right of payment to any of our existing and future indebtedness and other liabilities that are not so subordinated; effectively junior in right of payment to any of our secured indebtedness to the extent of the value of the assets securing such indebtedness; and structurally junior to all existing and future indebtedness and other liabilities of our subsidiaries (including trade payables). In
36
Table of Contents
Index to Financial Statements
the event of our bankruptcy, liquidation, reorganization or other winding up, our assets that secure debt ranking senior in right of payment to the convertible notes will be available to pay obligations on the convertible notes only after the secured debt has been repaid in full from these assets, and the assets of our subsidiaries will be available to pay obligations on the convertible notes only after all claims senior to the convertible notes have been repaid in full. There may not be sufficient assets remaining to pay amounts due on any or all of the convertible notes then outstanding.
We may still incur substantially more debt or take other actions that could diminish our ability to make payments on the convertible notes.
We and our subsidiaries may be able to incur substantial additional debt in the future, subject to the restrictions contained in our future debt instruments, some of which may be secured debt. We are not restricted under the terms of the indenture governing the convertible notes from incurring additional debt, securing existing or future debt, recapitalizing our debt or taking a number of other actions that are not limited by the terms of the indenture governing the convertible notes that could have the effect of diminishing our ability to make payments on the convertible notes when due.
We may not have the ability to raise the funds necessary to settle conversions of the convertible notes in cash, repay the convertible notes at maturity or repurchase the convertible notes upon a fundamental change, and our future debt may contain limitations on our ability to pay cash upon conversion or repurchase of the convertible notes.
Holders of the convertible notes will have the right to require us to repurchase all or a portion of their convertible notes upon the occurrence of a fundamental change at a repurchase price equal to 100% of the principal amount of the convertible notes to be repurchased, plus accrued and unpaid interest, if any. In addition, upon conversion of the convertible notes, unless we elect to deliver solely shares of our common stock to settle such conversion (other than paying cash in lieu of delivering any fractional share), we will be required to make cash payments in respect of the convertible notes being converted. However, we may not have enough available cash or be able to obtain financing at the time we are required to make repurchases of the convertible notes surrendered therefor or pay cash with respect to the convertible notes being converted or at their maturity.
In addition, our ability to repurchase or to pay cash upon conversions of the convertible notes may be limited by law, regulatory authority or agreements governing our future indebtedness and is dependent on our future performance, which is subject to economic, financial, competitive and other factors beyond our control. Our failure to repurchase the convertible notes at a time when the repurchase is required by the indenture or to pay any cash payable on future conversions of the convertible notes as required by the indenture would constitute a default under the indenture. A fundamental change under the indenture or a default under the indenture could also lead to a default under agreements governing our future indebtedness. If the repayment of the related indebtedness were to be accelerated after any applicable notice or grace periods, we may not have sufficient funds to repay the indebtedness and repurchase the convertible notes or make cash payments upon conversions thereof.
The conditional conversion feature of the convertible notes, if triggered, may adversely affect our financial condition and operating results.
In the event the conditional conversion feature of the convertible notes is triggered, holders of the convertible notes will be entitled to convert the convertible notes at any time during specified periods at their option. If one or more holders elect to convert their convertible notes, unless we elect to satisfy our conversion obligation by delivering solely shares of our common stock (other than paying cash in lieu of delivering any fractional share), we would be required to settle a portion or all of our conversion obligation through the payment of cash, which could adversely affect our liquidity. In addition, even if holders do not elect to convert their convertible notes, we could be required under applicable accounting rules to reclassify all or a portion of the
37
Table of Contents
Index to Financial Statements
outstanding principal of the convertible notes as a current rather than long-term liability, which would result in a material reduction of our net working capital.
The accounting method for convertible debt securities that may be settled in cash, such as the convertible notes, could have a material effect on our reported financial results.
Accounting Standards Codification Subtopic 470-20, Debt with Conversion and Other Options (“ASC 470-20”), requires an entity to separately account for the liability and equity components of convertible debt instruments (such as the convertible notes) that may be settled entirely or partially in cash upon conversion in a manner that reflects the issuer’s non-convertible debt interest rate. Accordingly, the equity component of the convertible notes is required to be included in the additional paid-in capital section of stockholders’ equity on our consolidated balance sheet, and the value of the equity component is treated as original issue discount for purposes of accounting for the debt component of the convertible notes. As a result, we are required to recognize a greater amount of non-cash interest expense in our consolidated income statements in the current and future periods presented as a result of the amortization of the discounted carrying value of the convertible notes to their principal amount over the term of the convertible notes. We will report lower net income (or greater net losses) in our consolidated financial results because ASC 470-20 will require interest to include both the current period’s amortization of the original issue discount and the instrument’s non-convertible interest rate. This could adversely affect our reported or future consolidated financial results, the trading price of our common stock and the trading price of the convertible notes.
In addition, under certain circumstances, in calculating earnings per share, convertible debt instruments (such as the convertible notes) that may be settled entirely or partly in cash are currently accounted for utilizing the treasury stock method, the effect of which is that the shares of common stock issuable upon conversion of the convertible notes, if any, are not included in the calculation of diluted earnings per share except to the extent that the conversion value of the convertible notes exceeds their principal amount. Under the treasury stock method, diluted earnings per share is calculated as if the number of shares of common stock that would be necessary to settle such excess, if we elected to settle such excess in shares, were issued. We cannot be sure that the accounting standards in the future will continue to permit the use of the treasury stock method. If we are unable to use the treasury stock method in accounting for the shares issuable upon conversion of the convertible notes, if any, then our diluted consolidated earnings per share would be adversely affected.
The convertible note hedge and warrant transactions may affect the value of our common stock.
In connection with the sale of the convertible notes, we entered into convertible note hedge transactions with institutions that we refer to as the option counterparties. We also entered into warrant transactions with the option counterparties pursuant to which we sold warrants for the purchase of our common stock. The convertible note hedge transactions are expected to offset the potential dilution to our common stock upon any conversion of convertible notes and/or offset any cash payments we are required to make in excess of the principal amount upon conversion of any convertible notes. The warrant transactions could separately have a dilutive effect to the extent that the market price per share of our common stock exceeds the strike price of the relevant warrants, unless, subject to certain conditions, we elect to settle the warrants in cash.
The option counterparties or their respective affiliates may modify their hedge positions by entering into or unwinding various derivatives with respect to our common stock and/or purchasing or selling our common stock or other securities of ours in secondary market transactions prior to the maturity of the convertible notes (and are likely to do so during any observation period related to a conversion of convertible notes or following any repurchase of convertible notes by us in connection with any fundamental change repurchase date or otherwise). This activity could suppress or inflate the market price of our common stock.
We do not make any representation or prediction as to the direction or magnitude of any potential effect that the transactions described above may have on the price of the convertible notes or our common stock. In
38
Table of Contents
Index to Financial Statements
addition, we do not make any representation that the option counterparties or their respective affiliates will engage in these transactions or that these transactions, once commenced, will not be discontinued without notice.
We are subject to counterparty risk with respect to the convertible note hedge transactions.
The option counterparties are financial institutions or affiliates of financial institutions, and we will be subject to the risk that these option counterparties may default under the convertible note hedge transactions. Our exposure to the credit risk of the option counterparties will not be secured by any collateral. If one or more of the option counterparties to one or more of our convertible note hedge transactions becomes subject to insolvency proceedings, we will become an unsecured creditor in those proceedings with a claim equal to our exposure at the time under those transactions. Our exposure will depend on many factors but, generally, the increase in our exposure will be correlated to the increase in the market price of our common stock and in the volatility of the market price of our common stock. In addition, upon a default by one of the option counterparties, we may suffer dilution with respect to our common stock as well as adverse financial consequences. We can provide no assurances as to the financial stability or viability of any of the option counterparties.
RISKS RELATED TO OWNERSHIP OF OUR COMMON STOCK
Our stock price has been volatile historically and may continue to be volatile.
The trading price of our common stock has been and may continue to be subject to wide fluctuations. Our stock price may fluctuate in response to a number of events and factors, such as quarterly variations in operating results, announcements of technological innovations or new offerings by us or our competitors, announcements relating to strategic decisions, announcements related to key personnel, customer purchase delays, service disruptions, changes in financial estimates and recommendations by securities analysts, the operating and stock price performance of other companies that investors may deem comparable to us, news reports relating to trends in our markets, the commencement or termination of any share repurchase program, general economic conditions and other risks listed herein.
The sale of our common stock by significant stockholders may cause the price of our common stock to decrease.
Several of our stockholders own significant portions of our common stock. If these stockholders were to sell all or a portion of their holdings of our common stock, then the market price of our common stock could be negatively impacted. The effect of such sales, or of significant portions of our stock being offered or made available for sale, could result in strong downward pressure on our stock price. Investors should be aware that they could experience significant short-term volatility in our stock if such stockholders decide to sell all or a portion of their holdings of our common stock at once or within a short period of time.
We may issue additional shares of our common stock or instruments convertible into shares of our common stock and thereby materially and adversely affect the market price of our common stock.
We are not restricted from issuing additional shares of our common stock or other instruments convertible into, or exchangeable or exercisable for, shares of our common stock. If we issue additional shares of our common stock or instruments convertible into shares of our common stock, it may materially and adversely affect the market price of our common stock.
In addition, a substantial number of shares of our common stock are reserved for instruments issued under our equity compensation plans, including for the issuance upon the exercise of stock options and the vesting of performance share units, restricted stock, restricted stock units and deferred stock units. A substantial number of shares of our common stock are also reserved in relation to the convertible notes, the convertible note hedge and
39
Table of Contents
Index to Financial Statements
warrant transactions and our employee stock purchase plan. We may not be able to predict the size of future issuances or the effect, if any, that they may have on the market price for our common stock. The issuance and sale of substantial amounts of common stock, or the perception that such issuances and sales may occur, could adversely affect the market price of our common stock and impair our ability to raise capital through the sale of equity or equity-linked securities.
We do not currently expect to pay dividends on our common stock, so any returns may be limited to changes in the value of our common stock.
We have never declared or paid any cash dividends on our common stock. We currently anticipate that we will retain future earnings for the development, operation and expansion of our business and do not anticipate declaring or paying any cash dividends for the foreseeable future. In addition, our ability to pay cash dividends on our common stock may be prohibited or limited by the terms of any future debt financing arrangement. Any return to stockholders will therefore be limited to the increase, if any, of our stock price.
Conversion of the convertible notes may dilute the ownership interest of existing stockholders, including holders who had previously converted their convertible notes, or may otherwise depress the price of our common stock.
The conversion of the convertible notes into shares of our common stock, to the extent that we choose not to deliver all cash for the conversion value, will dilute the ownership interests of existing stockholders. Any sales in the public market of the common stock issuable upon conversion of the convertible notes could adversely affect prevailing market prices of our common stock. In addition, the existence of the convertible notes may encourage short selling by market participants due to this dilution or may facilitate trading strategies involving the convertible notes and our common stock.
Provisions of our certificate of incorporation, by-laws, Delaware law and the convertible notes may have anti-takeover effects that could prevent a change in control even if the change in control would be beneficial to our stockholders.
Provisions of our certificate of incorporation, by-laws and Delaware law could make it more difficult for a third party to acquire us, even if doing so would be beneficial to our stockholders. These provisions include:
| • | our Board of Directors has the right to elect directors to fill a vacancy created by the expansion of the Board of Directors or the resignation, death or removal of a director, which prevents stockholders from being able to fill vacancies on our Board of Directors; |
| • | stockholders must provide advance notice to nominate individuals for election to the Board of Directors or to propose matters that can be acted upon at a stockholders’ meeting; such provisions may discourage or deter a potential acquirer from conducting a solicitation of proxies to elect the acquirer’s own slate of directors or otherwise attempting to obtain control of our company; and |
| • | our Board of Directors may issue, without stockholder approval, shares of undesignated preferred stock; the ability to issue undesignated preferred stock makes it possible for our Board of Directors to issue preferred stock with voting or other rights or preferences that could impede the success of any attempt to acquire us. |
Further, as a Delaware corporation, we are also subject to certain Delaware law anti-takeover provisions. Under Delaware law, a corporation may not engage in a business combination with any holder of 15% or more of its capital stock unless the holder has held the stock for three years or, among other things, the Board of Directors has approved the transaction. Our Board of Directors could rely on Delaware law to prevent or delay an acquisition of us. Additionally, certain provisions of the convertible notes could make it more difficult or more expensive for a third party to acquire us or could also have the effect of delaying or reducing the likelihood of a change in control of us even if such acquisition or change of control may be favorable to our stockholders.
40
Table of Contents
Index to Financial Statements
| ITEM 1B. | UNRESOLVED STAFF COMMENTS |
None.
| ITEM 2. | PROPERTIES |
Our headquarters is currently located in a subleased facility at 100 East Davie Street, Raleigh, North Carolina. The building includes approximately 380,000 square feet of office and retail space and an integrated parking deck. We entered into an agreement to sublease this building on December 27, 2011, and the sublease will expire on August 23, 2035. The rental payments under the sublease are approximately $4.6 million annually until December 31, 2020 and approximately $3.8 million annually thereafter until the end of the sublease. We are also responsible for payment of taxes and all operating expenses relating to the subleased building (other than certain expenses relating to the operation of the integrated parking deck and the retail portions of the building, which are the responsibility of the tenants of those portions of the building). Over the term of the sublease agreement, we also receive certain rent credits and improvement allowances.
In addition to our headquarters, we have leased office facilities in over 35 countries and more than 90 locations. Significant locations in North America include Ann Arbor, Michigan; Atlanta, Georgia; Chicago, Illinois; Durham, North Carolina; Mahwah, New Jersey; McLean, Virginia; Montreal, Canada; Mountain View, California; New York, New York; Plano, Texas; Toronto, Canada and Westford, Massachusetts. Significant locations in Latin America include Bogota, Colombia; Buenos Aires, Argentina; Mexico City, Mexico; Santiago, Chile and Sao Paulo, Brazil. Significant locations in EMEA include Amsterdam, Netherlands; Barcelona, Spain; Brno, Czech Republic; Cork, Ireland; Farnborough, United Kingdom; Frankfurt, Germany; London, United Kingdom; Madrid, Spain; Milan, Italy; Munich, Germany; Paris, France; Ra’anana, Israel; Rome, Italy; Stockholm, Sweden; Stuttgart, Germany and Waterford, Ireland. Significant locations in Asia Pacific include Beijing, China; Bengaluru, India; Brisbane, Australia; Canberra, Australia; Hong Kong; Melbourne, Australia; Mumbai, India; New Delhi, India; Pune, India; Seoul, South Korea; Singapore; Sydney, Australia and Tokyo, Japan. We believe that in all material respects our properties have been satisfactorily maintained, are in good condition and are suitable for our operations.
| ITEM 3. | LEGAL PROCEEDINGS |
The Company experiences routine litigation in the normal course of its business, including patent litigation. The Company presently believes that the outcome of this routine litigation will not have a material adverse effect on its financial position, results of operations or cash flows.
| ITEM 4. | MINE SAFETY DISCLOSURES |
This Item is not applicable.
41
Table of Contents
Index to Financial Statements
PART II
| ITEM 5. | MARKET FOR REGISTRANT’S COMMON EQUITY, RELATED STOCKHOLDER MATTERS AND ISSUER PURCHASES OF EQUITY SECURITIES |
Market Information
Our common stock trades on the New York Stock Exchange under the symbol “RHT”. The chart below sets forth the high and low sales price for each of the quarters of fiscal 2017 and fiscal 2016.
| FY 2017 | FY 2016 | |||||||||||||||
| Quarter |
High | Low | High | Low | ||||||||||||
| First |
$ | 77.56 | $ | 65.43 | $ | 79.35 | $ | 65.00 | ||||||||
| Second |
$ | 81.81 | $ | 70.09 | $ | 81.49 | $ | 67.01 | ||||||||
| Third |
$ | 82.73 | $ | 71.52 | $ | 83.00 | $ | 68.36 | ||||||||
| Fourth |
$ | 85.01 | $ | 68.54 | $ | 84.44 | $ | 59.59 | ||||||||
Holders
As of April 19, 2017, we estimate that there were 1,195 registered stockholders of record of our common stock.
Dividends
We have never declared or paid any cash dividends on our common stock. We currently anticipate that we will retain future earnings for the development, operation and expansion of our business and do not anticipate declaring or paying any cash dividends for the foreseeable future.
42
Table of Contents
Index to Financial Statements
Stock Performance Graph
The following graph shows a comparison of cumulative total return (equal to dividends plus stock appreciation) during the period from February 29, 2012 through February 28, 2017 for:
| • | Red Hat, Inc.; |
| • | a peer group consisting of Adobe Systems Incorporated, Akamai Technologies, Inc., ANSYS, Inc., Autodesk, Inc., Cadence Design Systems, Inc., Citrix Systems, Inc., Intuit Inc., Jack Henry & Associates, Inc., NetApp, Nuance Communications, Inc., Open Text Corporation, PTC Inc., Salesforce, Symantec, Synopsys, Inc., Verint Systems Inc., Verisign, Inc. and VMware (the “Stock Performance Peer Group”); and |
| • | the S&P 500 Index. |
We are required to provide a line-graph presentation comparing cumulative, five-year stockholder returns on an indexed basis with a broad equity market index and either a published industry index or an index of peer companies selected by Red Hat. In our index of peer group companies, we have selected peer companies considered to be peers for purposes of benchmarking executive compensation during fiscal 2017.
COMPARISON OF FIVE-YEAR CUMULATIVE
TOTAL RETURN AMONG RED HAT,
STOCK PERFORMANCE PEER GROUP AND S&P 500 INDEX
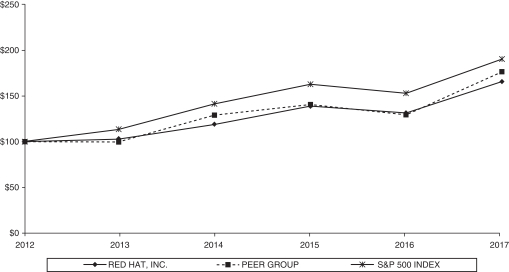
| 2/29/2012 | 2/28/2013 | 2/28/2014 | 2/28/2015 | 2/29/2016 | 2/28/2017 | |||||||||||||||||||
| RED HAT, INC. |
$ | 100.00 | $ | 102.73 | $ | 119.27 | $ | 139.75 | $ | 132.13 | $ | 167.43 | ||||||||||||
| PEER GROUP |
$ | 100.00 | $ | 99.66 | $ | 129.60 | $ | 141.56 | $ | 129.86 | $ | 180.67 | ||||||||||||
| S&P 500 INDEX |
$ | 100.00 | $ | 113.46 | $ | 142.25 | $ | 164.30 | $ | 154.13 | $ | 192.63 | ||||||||||||
Notes:
| • | Assumes initial investment of $100.00 on February 29, 2012. Total return includes reinvestment of dividends. |
| • | If the annual interval, based on the fiscal year-end, ends on a day that is not a trading day, the preceding trading day is used. |
43
Table of Contents
Index to Financial Statements
| • | The information included under the heading “Stock Performance Graph” in Item 5 of this Annual Report on Form 10-K is “furnished” and not “filed” and shall not be deemed to be “soliciting material” or subject to Regulation 14A, shall not be deemed “filed” for purposes of Section 18 of the Securities Exchange Act or otherwise subject to the limitations of that section, and shall not be deemed incorporated by reference in any filing of the Company under the Securities Act of 1933, as amended, or the Securities Exchange Act, whether made before or after the date of this report and irrespective of any general incorporation by reference language in any such filing. |
| • | The stock price performance shown in the graph is not necessarily indicative of future price performance. |
Issuer Purchases of Equity Securities
The table below sets forth information regarding the Company’s purchases of its common stock during its fourth fiscal quarter ended February 28, 2017:
Issuer Purchases of Equity Securities
| Period |
Total Number of Shares Purchased (1) |
Weighted Average Price Paid per Share |
Total Number of Shares Purchased as Part of Publicly Announced Plans or Programs (2) |
Approximate Dollar Value of Shares that May Yet Be Purchased Under the Plans or Programs (2) |
||||||||||||
| December 1, 2016 – December 31, 2016 |
772,075 | $ | 70.06 | 772,075 | $ | 721.1 million | ||||||||||
| January 1, 2017 – January 31, 2017 |
1,050,041 | $ | 73.60 | 1,005,049 | $ | 647.1 million | ||||||||||
| February 1, 2017 – February 28, 2017 |
147,693 | $ | 77.14 | 147,693 | $ | 635.7 million | ||||||||||
|
|
|
|
|
|||||||||||||
| Total |
1,969,809 | 1,924,817 | ||||||||||||||
|
|
|
|
|
|||||||||||||
| (1) | During the three months ended February 28, 2017, the Company withheld an aggregate of 44,992 shares of its common stock (with a weighted average share price of $72.99) from employees to satisfy minimum tax withholding obligations relating to the vesting of restricted share awards. These shares were not withheld pursuant to the programs described in Note (2) below. |
| (2) | On June 22, 2016, the Company announced that its Board authorized the repurchase of up to $1.0 billion of Red Hat’s common stock from time to time on the open market or in privately negotiated transactions. The program, which replaced a previous repurchase program, commenced on July 1, 2016, and will expire on the earlier of (i) June 30, 2018 or (ii) a determination by the Board, Chief Executive Officer or Chief Financial Officer to discontinue the program. |
44
Table of Contents
Index to Financial Statements
| ITEM 6. | SELECTED FINANCIAL DATA |
The following table sets forth selected financial data for each of the Company’s fiscal years in the five-year period ended February 28, 2017. The selected balance sheet data as of February 28, 2017 and February 29, 2016 and the selected statement of operations data for the fiscal years ended February 28, 2017, February 29, 2016, and February 28, 2015 are derived from our Consolidated Financial Statements contained in this Annual Report on Form 10-K and should be read in conjunction with the Consolidated Financial Statements, related notes and other financial information included herein. The selected statement of operations data for the fiscal years ended February 28, 2014 and February 28, 2013 is derived from our Consolidated Financial Statements contained in the Annual Report on Form 10-K for the fiscal year ended February 28, 2014, and the selected balance sheet data as of February 28, 2015, February 28, 2014 and February 28, 2013 is presented including the effects of retrospective application of relevant adopted Accounting Standards Updates.
| Fiscal Years Ended | ||||||||||||||||||||
| February 28, 2017 |
February 29, 2016 |
February 28, 2015 |
February 28, 2014 |
February 28, 2013 |
||||||||||||||||
| (in thousands, except per share data) | ||||||||||||||||||||
| SELECTED STATEMENT OF OPERATIONS DATA |
||||||||||||||||||||
| Revenue: |
||||||||||||||||||||
| Subscriptions |
$ | 2,135,780 | $ | 1,803,449 | $ | 1,561,234 | $ | 1,336,771 | $ | 1,148,341 | ||||||||||
| Training and services |
276,023 | 248,781 | 228,255 | 197,844 | 180,476 | |||||||||||||||
|
|
|
|
|
|
|
|
|
|
|
|||||||||||
| Total subscription and training and services revenue |
$ | 2,411,803 | $ | 2,052,230 | $ | 1,789,489 | $ | 1,534,615 | $ | 1,328,817 | ||||||||||
| Gross profit |
$ | 2,057,425 | $ | 1,742,601 | $ | 1,516,290 | $ | 1,302,015 | $ | 1,128,217 | ||||||||||
| Income from operations |
$ | 332,245 | $ | 288,048 | $ | 249,994 | $ | 232,289 | $ | 201,038 | ||||||||||
| Interest income |
$ | 13,921 | $ | 11,673 | $ | 8,336 | $ | 6,645 | $ | 8,245 | ||||||||||
| Interest expense |
$ | 23,822 | $ | 23,121 | $ | 9,394 | $ | 160 | $ | 267 | ||||||||||
| Other income (expense), net |
$ | (2,164 | ) | $ | (1,735 | ) | $ | 6,562 | $ | 774 | $ | 736 | ||||||||
| Net income |
$ | 253,703 | $ | 199,365 | $ | 180,201 | $ | 178,282 | $ | 150,204 | ||||||||||
| Net income per share: |
||||||||||||||||||||
| Basic |
$ | 1.41 | $ | 1.09 | $ | 0.97 | $ | 0.94 | $ | 0.78 | ||||||||||
| Diluted |
$ | 1.39 | $ | 1.07 | $ | 0.95 | $ | 0.93 | $ | 0.77 | ||||||||||
| Weighted average shares outstanding: |
||||||||||||||||||||
| Basic |
179,642 | 182,817 | 186,529 | 189,920 | 193,147 | |||||||||||||||
| Diluted |
182,961 | 186,119 | 189,246 | 192,036 | 195,804 | |||||||||||||||
| As of | ||||||||||||||||||||
| February 28, 2017 |
February 29, 2016 |
February 28, 2015 |
February 28, 2014 |
February 28, 2013 |
||||||||||||||||
| (in thousands) | ||||||||||||||||||||
| SELECTED BALANCE SHEET DATA |
||||||||||||||||||||
| Total cash, cash equivalents and available-for-sale investment securities |
$ | 2,133,231 | $ | 1,995,390 | $ | 1,808,743 | $ | 1,487,429 | $ | 1,318,373 | ||||||||||
| Working capital |
$ | 424,629 | $ | 313,256 | $ | 549,410 | $ | 315,502 | $ | 294,272 | ||||||||||
| Total assets |
$ | 4,535,185 | $ | 4,155,099 | $ | 3,784,569 | $ | 3,079,070 | $ | 2,807,942 | ||||||||||
| Total deferred revenue (current and long-term) |
$ | 2,069,956 | $ | 1,722,544 | $ | 1,482,328 | $ | 1,289,197 | $ | 1,089,952 | ||||||||||
| Convertible notes |
$ | 745,633 | $ | 723,942 | $ | 702,939 | $ | — | $ | — | ||||||||||
| Stockholders’ equity |
$ | 1,247,320 | $ | 1,334,432 | $ | 1,288,338 | $ | 1,551,165 | $ | 1,520,161 | ||||||||||
45
Table of Contents
Index to Financial Statements
| ITEM 7. | MANAGEMENT’S DISCUSSION AND ANALYSIS OF FINANCIAL CONDITION AND RESULTS OF OPERATIONS |
OVERVIEW
We are a leading global provider of open source software solutions, using a community-powered approach to develop and offer reliable and high-performing operating system, virtualization, management, middleware, cloud, mobile and storage technologies.
Open source software is an alternative to proprietary software and represents a different model for the development and licensing of commercial software code than that typically used for proprietary software. Because open source software code is often freely shared, there are customarily no licensing fees for the use of open source software. Therefore, we do not recognize revenue from the licensing of the code itself. We provide value to our customers through the development, aggregation, integration, testing, certification, delivery, maintenance, enhancement and support of our Red Hat technologies, and by providing a level of performance, scalability, flexibility, reliability and security for the technologies we package and distribute. Moreover, because communities of developers not employed by us assist with the creation of our open source offerings, opportunities for further innovation of our offerings are supplemented by these communities.
We market our offerings primarily to customers in the form of annual or multi-year subscriptions, and we recognize revenue over the period of the subscription agreements with our customers. Our technologies are also offered by certified cloud and service providers (“CCSPs”) as a service available on demand, and this revenue is recognized by us upon delivery.
We derive our revenue and generate cash from customers primarily from two sources: (i) subscription revenue and (ii) training and services revenue. These arrangements typically involve subscriptions to Red Hat technologies. Our revenue is affected by, among other factors, corporate, government and consumer spending levels. In evaluating the performance of our business, we consider a number of factors, including total revenue, deferred revenue, operating income, operating margin and cash flows from operations. The arrangements with our customers that produce this revenue and cash are explained in further detail in this Part II, Item 7 under “Critical Accounting Estimates” and in NOTE 2—Summary of Significant Accounting Policies to our Consolidated Financial Statements.
We believe our success is influenced by: (i) the extent to which we can expand the breadth and depth of our offerings, (ii) our ability to enhance the value of our offerings through frequent and continuing innovation while maintaining platforms designed to be stable and secure over multi-year periods, (iii) the extent to which adoption of our emerging technology offerings by enterprises and similar institutions continues to increase, (iv) our involvement and leadership in key open source communities, which enable us to develop, enhance and maintain our offerings, (v) our ability to generate increasing revenue directly and through partners and other strategic relationships, including CCSPs, distributors, embedded technology partners, independent hardware vendors, independent software vendors, original equipment manufacturers (“OEMs”), systems integrators and value added resellers, (vi) our ability to generate new and recurring revenue for our offerings, (vii) the widespread and increasing deployment of open source technologies by enterprises and similar institutions, (viii) our software, hardware, application and cloud service certification programs, which are intended to create an ecosystem of technologies that are compatible with our offerings and supported by us, (ix) our ability to provide customers with consulting and training services that generate additional subscription revenue, and (x) our ability to provide greater subscription value, enhance the experience of our customers and promote customer loyalty by focusing on ways in which we can help our customers succeed.
In fiscal 2017 we focused on, and in fiscal 2018 we expect to focus on, among other things: (i) driving the widespread adoption of our offerings, (ii) expanding our portfolio of technology offerings that enable hybrid cloud computing, (iii) investing in the development of open source technologies and promoting the use of our
46
Table of Contents
Index to Financial Statements
technologies by software developers globally, (iv) pursuing strategic acquisitions and alliances, (v) expanding relationships with our existing customers, (vi) increasing revenue by promoting a range of services to help our customers derive additional value, (vii) expanding routes to market, and (viii) growing our presence in international markets.
Non-GAAP disclosures
In accordance with accounting principles generally accepted in the U.S. (“U.S. GAAP”), the income statements of our non-U.S. operations are translated into U.S. dollars using the average exchange rates for each month in an applicable period. To the extent the U.S. dollar weakens against foreign currencies, the translation of transactions denominated in foreign currencies results in increased revenue, as stated in U.S. dollars, for our non-U.S. operations. Similarly, revenue, as stated in U.S. dollars, for our non-U.S. operations decreases if the U.S. dollar strengthens against foreign currencies. In this Part II, Item 7, we disclose non-GAAP amounts and growth rates that exclude the impact of foreign currency exchange rate fluctuations for fiscal 2017 in an effort to provide a comparable framework for assessing how our business performed when compared to fiscal 2016. To compute the non-GAAP impact of foreign currency exchange rate fluctuations, we translate amounts from our non-U.S. operations for fiscal 2017 using the average foreign currency exchange rate for the twelve months ended February 29, 2016.
Revenue
For fiscal 2017, total revenue increased 17.5%, or $359.6 million, to $2.41 billion from $2.05 billion for fiscal 2016. Excluding the impact of foreign currency exchange rate fluctuations, total revenue increased by 17.1% for fiscal 2017. The growth rates of subscription revenue by offering type, training and services revenue and total revenue, as reported and excluding the impact of foreign currency exchange rate fluctuations, for fiscal 2017 versus fiscal 2016 are as follows (in thousands):
| Fiscal Year Ended | ||||||||||||
| February 28, 2017 |
February 29, 2016 |
Year-Over- Year Growth Rate |
||||||||||
| Infrastructure-related subscription revenue, as reported |
$ | 1,696,443 | $ | 1,480,463 | 14.6 | % | ||||||
| Adjustment for foreign currency exchange rates |
(8,895 | ) | — | |||||||||
|
|
|
|
|
|||||||||
| Infrastructure-related subscription revenue, excluding foreign currency impact |
1,687,548 | 1,480,463 | 14.0 | % | ||||||||
|
|
|
|
|
|||||||||
| Application Development-related and other emerging technology subscription revenue, as reported |
439,337 | 322,986 | 36.0 | % | ||||||||
| Adjustment for foreign currency exchange rates |
(1,330 | ) | — | |||||||||
|
|
|
|
|
|||||||||
| Application Development-related and other emerging technology subscription revenue, excluding foreign currency impact |
438,007 | 322,986 | 35.6 | % | ||||||||
|
|
|
|
|
|||||||||
| Total subscription revenue, as reported |
2,135,780 | 1,803,449 | 18.4 | % | ||||||||
| Adjustment for foreign currency exchange rates |
(10,225 | ) | — | |||||||||
|
|
|
|
|
|||||||||
| Total subscription revenue, excluding foreign currency impact |
2,125,555 | 1,803,449 | 17.9 | % | ||||||||
|
|
|
|
|
|||||||||
| Total training and services revenue, as reported |
276,023 | 248,781 | 11.0 | % | ||||||||
| Adjustment for foreign currency exchange rates |
2,582 | — | ||||||||||
|
|
|
|
|
|||||||||
| Total training and services revenue, excluding foreign currency impact |
278,605 | 248,781 | 12.0 | % | ||||||||
|
|
|
|
|
|||||||||
| Total subscription and training and services revenue, as reported |
2,411,803 | 2,052,230 | 17.5 | % | ||||||||
| Adjustment for foreign currency exchange rates |
(7,643 | ) | — | |||||||||
|
|
|
|
|
|||||||||
| Total subscription and training and services revenue, excluding foreign currency impact |
$ | 2,404,160 | $ | 2,052,230 | 17.1 | % | ||||||
|
|
|
|
|
|||||||||
47
Table of Contents
Index to Financial Statements
Subscription revenue
Our enterprise technologies are delivered primarily under subscription agreements. These agreements typically have a one- or three-year subscription period. A subscription generally entitles a customer to, among other things, a specified level of support, as well as security updates, fixes, functionality enhancements, upgrades to the technologies, each if and when available, and compatibility with an ecosystem of certified hardware and software. Subscription revenue increased sequentially for each quarter of fiscal 2017, fiscal 2016 and fiscal 2015 and was driven primarily by the increased use of our offerings by customers and our expansion of sales channels and geographic footprint during these periods.
Subscription revenue increased 18.4%, or $332.3 million, for fiscal 2017 compared to fiscal 2016. Excluding the impact of foreign currency exchange rate fluctuations, subscription revenue increased by 17.9% for fiscal 2017. The increase in subscription revenue is driven primarily by additional subscriptions related to our principal Red Hat Enterprise Linux and Red Hat JBoss Middleware offerings, which continue to gain broader market acceptance in mission-critical areas of computing, and our expansion of sales channels and our geographic footprint. The increase is, in part, a result of the continued migration of enterprises in industries such as financial services, government, technology and telecommunications to our open source solutions from proprietary technologies.
Training and services revenue
Training and services revenue increased 11.0%, or $27.2 million, for fiscal 2017 as compared to fiscal 2016. Excluding the impact of foreign currency exchange rate fluctuations, training and services revenue increased by 12.0%. The increase is driven primarily by customer interest in new products and increased demand for our open source solutions.
Deferred revenue, billings proxy, seasonality and backlog
Deferred revenue
Our deferred revenue, current and long-term, balance at February 28, 2017 was $2.07 billion. Total deferred revenue at February 28, 2017 increased 20.2%, or $347.4 million, as compared to the balance of $1.72 billion at February 29, 2016. Excluding the impact of foreign currency exchange rate fluctuations, total deferred revenue increased by 20.3%, or $348.9 million, from February 29, 2016 to February 28, 2017. Because of our subscription model and revenue recognition policies, deferred revenue improves predictability of future revenue. For example, current deferred revenue provides a baseline for revenue to be recognized over the next twelve months. Similarly, long-term deferred revenue provides a baseline for revenue to be recognized beyond twelve months. Revenue derived from CCSPs for the delivery of our technologies as a service available on demand is recognized by us in the period earned and billed in arrears. As a result, revenue derived from CCSPs has no associated deferred revenue.
The increase in deferred revenue reported on our Consolidated Balance Sheets of $347.4 million differs from the increase of $348.5 million we reported on our Consolidated Statements of Cash Flows for fiscal 2017 as the amount reported on our Consolidated Statements of Cash Flows for fiscal 2017 excludes (i) the impact of changes in foreign currency exchange rates used to translate deferred revenue balances from our foreign subsidiaries’ functional currency into U.S. dollars and (ii) deferred revenue of approximately $0.4 million acquired as part of business combinations during the same period.
Current deferred revenue increased by 18.8%, or $239.9 million, to $1.51 billion at February 28, 2017 from $1.27 billion at February 29, 2016 and long-term deferred revenue increased by 23.9%, or $107.6 million, to $557.2 million at February 28, 2017 from $449.6 million at February 29, 2016. Excluding the impact of foreign currency exchange rate fluctuations, current deferred revenue increased by 18.8%, or $239.8 million, and long-
48
Table of Contents
Index to Financial Statements
term deferred revenue increased by 24.3%, or $109.1 million, from February 29, 2016 to February 28, 2017. Below is a summary of our deferred revenue for February 28, 2017 and February 29, 2016 (in thousands):
| February 28, 2017 |
February 29, 2016 |
Year-Over- Year Growth Rate |
||||||||||
| Current deferred revenue, as reported |
$ | 1,512,762 | $ | 1,272,908 | 18.8 | % | ||||||
| Adjustment for foreign currency exchange rates |
(83 | ) | — | |||||||||
|
|
|
|
|
|||||||||
| Current deferred revenue, excluding foreign currency impact |
$ | 1,512,679 | $ | 1,272,908 | 18.8 | % | ||||||
|
|
|
|
|
|||||||||
| Long-term deferred revenue, as reported |
$ | 557,194 | $ | 449,636 | 23.9 | % | ||||||
| Adjustment for foreign currency exchange rates |
1,563 | — | ||||||||||
|
|
|
|
|
|||||||||
| Long-term deferred revenue, excluding foreign currency impact |
$ | 558,757 | $ | 449,636 | 24.3 | % | ||||||
|
|
|
|
|
|||||||||
| Total deferred revenue, as reported |
$ | 2,069,956 | $ | 1,722,544 | 20.2 | % | ||||||
| Adjustment for foreign currency exchange rates |
1,480 | — | ||||||||||
|
|
|
|
|
|||||||||
| Total deferred revenue, excluding foreign currency impact |
$ | 2,071,436 | $ | 1,722,544 | 20.3 | % | ||||||
|
|
|
|
|
|||||||||
Billings proxy
We approximate our annual billings by adding revenue recognized on our Consolidated Statements of Operations to the change in total deferred revenue reported on our Consolidated Statements of Cash Flows. We use the change in deferred revenue as reported on our Consolidated Statements of Cash Flows because the amount has been adjusted for the impact of changes in foreign currency exchange rates used to translate deferred revenue balances from our foreign subsidiaries’ functional currencies into U.S. dollars.
Our annual billings proxy increased by 19.4%, or $447.6 million, to $2.76 billion for fiscal 2017 from $2.31 billion for fiscal 2016. Using the average foreign currency exchange rates from fiscal 2016, our billings proxy for fiscal 2017 would have increased by approximately 19.0%, or $440.0 million. Below is a summary of our billings proxy for fiscal 2017 and fiscal 2016 (in thousands):
| Fiscal Year Ended | ||||||||||||
| February 28, 2017 |
February 29, 2016 |
Year-Over- Year Growth Rate |
||||||||||
| Revenue, as reported |
$ | 2,411,803 | $ | 2,052,230 | 17.5 | % | ||||||
| Change in deferred revenue, as reported on Statements of Cash Flows |
348,534 | 260,495 | ||||||||||
|
|
|
|
|
|||||||||
| Billings proxy |
2,760,337 | 2,312,725 | 19.4 | % | ||||||||
| Adjustment to revenue for foreign currency exchange rates |
(7,643 | ) | — | |||||||||
|
|
|
|
|
|||||||||
| Billings proxy, excluding foreign currency impact |
$ | 2,752,694 | $ | 2,312,725 | 19.0 | % | ||||||
|
|
|
|
|
|||||||||
Seasonality
Our fourth fiscal quarter has historically been our strongest quarter for new billings and renewals. This pattern has become more pronounced over time as the number of customers with renewal dates occurring in the last half of our fiscal year has continued to increase. Furthermore, our quarterly sales cycles are frequently weighted toward the end of the quarter, with an increased volume of sales completed in the last weeks of each quarter. The year-over-year compounding effect of this seasonality in billing patterns and overall new business and renewal activity causes the value of invoices making up our billings that we generate in the last half of our fiscal year to continually increase in proportion to the value of our invoices making up our billings in the first half of our fiscal year.
49
Table of Contents
Index to Financial Statements
Below is a summary of our billings (approximated as described above by adding revenue for the period with the change in deferred revenue as reported on our Consolidated Statements of Cash Flows for the same period) by quarter for fiscal 2017, fiscal 2016, fiscal 2015, fiscal 2014 and fiscal 2013 (in thousands):
| First quarter | Second quarter | Third quarter | Fourth quarter | |||||||||||||||||||||||||||||
| Fiscal Years Ended |
Billings proxy |
% of fiscal year total |
Billings proxy |
% of fiscal year total |
Billings proxy |
% of fiscal year total |
Billings proxy |
% of fiscal year total |
||||||||||||||||||||||||
| February 28, 2017 |
$ | 521,806 | 18.9 | % | $ | 572,851 | 20.8 | % | $ | 679,441 | 24.6 | % | $ | 986,239 | 35.7 | % | ||||||||||||||||
| February 29, 2016 |
$ | 449,439 | 19.4 | % | $ | 479,131 | 20.7 | % | $ | 620,244 | 26.8 | % | $ | 763,911 | 33.0 | % | ||||||||||||||||
| February 28, 2015 |
$ | 404,005 | 19.5 | % | $ | 439,690 | 21.2 | % | $ | 539,807 | 26.1 | % | $ | 688,680 | 33.2 | % | ||||||||||||||||
| February 28, 2014 |
$ | 346,359 | 19.9 | % | $ | 376,303 | 21.6 | % | $ | 452,555 | 26.0 | % | $ | 564,755 | 32.5 | % | ||||||||||||||||
| February 28, 2013 |
$ | 309,609 | 20.8 | % | $ | 349,025 | 23.4 | % | $ | 378,813 | 25.4 | % | $ | 453,944 | 30.4 | % | ||||||||||||||||
Backlog
Our total backlog as of February 28, 2017 was approximately $2.75 billion and includes amounts billed to customers and recognized as current and long-term deferred revenue on our Consolidated Balance Sheet of $1.51 billion and $557.2 million, respectively, plus the value of non-cancellable subscription and services agreements to be billed in the future and not reflected in our financial statements, which was in excess of $650.0 million. Our total backlog as of February 29, 2016 was approximately $2.13 billion. The value of non-cancellable subscription and service agreements to be billed in the future and not reflected in our financial statements as of February 29, 2016 was in excess of $410.0 million. The increase in total backlog from approximately $2.13 billion as of February 29, 2016 to approximately $2.75 billion as of February 28, 2017 demonstrates increased customer commitment to our open source technologies.
We report our off-balance sheet backlog as a conservative approximation, often describing the amount as “in excess of,” primarily because the value of underlying contracts is derived from data not yet subjected to the complete application of our revenue recognition policies. We endeavor to derive the value of our off-balance sheet backlog in a consistent manner year over year and therefore believe the amounts are comparable.
Revenue by geography
In fiscal 2017, approximately 41.9%, or $1.01 billion, of our revenue was generated outside the U.S. compared to approximately 40.9%, or $838.7 million, for fiscal 2016. Excluding the impact of foreign currency exchange rate fluctuations, our revenue generated outside the U.S. would have been 41.8%, or $1.00 billion, of our total revenue in fiscal 2017. Our international operations are expected to grow as our international sales force and channels become more mature and as we enter new locations outside the U.S. or expand our presence in existing international locations. As of February 28, 2017, we had offices in more than 90 locations throughout the world.
We operate our business in three geographic regions: the Americas (U.S., Latin America and Canada); EMEA (Europe, Middle East and Africa); and Asia Pacific (principally Australia, China, India, Japan, Singapore and South Korea). Revenue and related year-over-year (“YoY”) revenue growth rates generated by the Americas, EMEA and Asia Pacific were as follows (in thousands):
| Americas | EMEA | Asia Pacific | Consolidated | |||||||||||||||||||||||||||||
| Fiscal Year Ended |
Revenue | YoY Growth % |
Revenue | YoY Growth % |
Revenue | YoY Growth % |
Revenue | YoY Growth % |
||||||||||||||||||||||||
| February 28, 2017, as reported |
$ | 1,555,290 | 14.8 | % | $ | 515,642 | 18.2 | % | $ | 340,871 | 30.3 | % | $ | 2,411,803 | 17.5 | % | ||||||||||||||||
| Adjustment for foreign currency exchange rates |
6,062 | 876 | (14,581 | ) | (7,643 | ) | ||||||||||||||||||||||||||
|
|
|
|
|
|
|
|
|
|||||||||||||||||||||||||
| February 28, 2017, excluding foreign currency impact |
$ | 1,561,352 | 15.3 | % | $ | 516,518 | 18.4 | % | $ | 326,290 | 24.7 | % | $ | 2,404,160 | 17.1 | % | ||||||||||||||||
|
|
|
|
|
|
|
|
|
|||||||||||||||||||||||||
50
Table of Contents
Index to Financial Statements
| Americas | EMEA | Asia Pacific | Consolidated | |||||||||||||||||||||||||||||
| Fiscal Years Ended |
Revenue | YoY Growth % |
Revenue | YoY Growth % |
Revenue | YoY Growth % |
Revenue | YoY Growth % |
||||||||||||||||||||||||
| February 29, 2016, as reported |
$ | 1,354,345 | 18.4 | % | $ | 436,304 | 6.3 | % | $ | 261,581 | 11.3 | % | $ | 2,052,230 | 14.7 | % | ||||||||||||||||
| Adjustments for foreign currency exchange |
16,743 | 75,887 | 28,160 | 120,790 | ||||||||||||||||||||||||||||
|
|
|
|
|
|
|
|
|
|||||||||||||||||||||||||
| February 29, 2016, excluding foreign currency impact |
$ | 1,371,088 | 19.8 | % | $ | 512,191 | 24.8 | % | $ | 289,741 | 23.3 | % | $ | 2,173,020 | 21.4 | % | ||||||||||||||||
|
|
|
|
|
|
|
|
|
|||||||||||||||||||||||||
| February 28, 2015, as reported |
$ | 1,144,237 | 17.4 | % | $ | 410,299 | 16.3 | % | $ | 234,953 | 13.5 | % | $ | 1,789,489 | 16.6 | % | ||||||||||||||||
| Adjustment for foreign currency exchange rates |
9,092 | 14,632 | 12,175 | 35,899 | ||||||||||||||||||||||||||||
|
|
|
|
|
|
|
|
|
|||||||||||||||||||||||||
| February 28, 2015, excluding foreign currency impact |
$ | 1,153,329 | 18.3 | % | $ | 424,931 | 20.4 | % | $ | 247,128 | 19.4 | % | $ | 1,825,388 | 18.9 | % | ||||||||||||||||
|
|
|
|
|
|
|
|
|
|||||||||||||||||||||||||
As we expand further within each region, we anticipate revenue growth rates in local currencies to become more similar among our geographic regions due to the similarity of products and services offered and the similarity in customer types or classes.
Gross profit margin
Gross profit margin increased to 85.3% for fiscal 2017 from 84.9% for fiscal 2016. An increase in the cost to deliver our subscription revenue was more than offset by a higher mix of subscription revenue relative to training and services revenue and a lower relative cost to deliver our training revenue for fiscal 2017 as compared to fiscal 2016.
Gross profit margin by geography
Gross profit margins by our geographic regions were as follows:
| Fiscal Years Ended |
Americas | EMEA | Asia Pacific | Consolidated (1) | ||||||||||||
| February 28, 2017 |
86.3 | % | 86.7 | % | 83.7 | % | 85.3 | % | ||||||||
| February 29, 2016 |
85.9 | % | 86.5 | % | 83.3 | % | 84.9 | % | ||||||||
| February 28, 2015 |
85.4 | % | 87.0 | % | 83.8 | % | 84.7 | % | ||||||||
| (1) | Consolidated gross profit as a percentage of revenue includes corporate (non-allocated) share-based compensation expense for fiscal 2017, fiscal 2016 and fiscal 2015 of $16.6 million, $15.9 million and $14.0 million, respectively. For additional information, see NOTE 19—Segment Reporting to our Consolidated Financial Statements. |
Regional year-over-year variations in gross profit margins are primarily due to slight product mix shifts between subscriptions and services.
As we continue to expand our sales and support services within our geographic regions, we expect gross profit margins across geographic regions to further converge over the long run due to the similarity of products and services offered, similarity in production and distribution methods and the similarity in customer types or classes. These geographic profit margins exclude the impact of share-based compensation expense, which was not allocated to our geographic regions.
51
Table of Contents
Index to Financial Statements
Income from operations
Operating income was 13.8%, 14.0% and 14.0% of total revenue for fiscal 2017, fiscal 2016 and fiscal 2015, respectively. Operating expenses as a percent of revenue increased slightly to 71.5% for fiscal 2017 from 70.9% for fiscal 2016 and 70.8% for fiscal 2015 due to continued investment in new and emerging cloud management technologies, including our recent business combinations. These investments are described further in our analysis of results of operations below.
Income from operations by geography
Operating income as a percentage of revenue generated by our geographic regions was as follows:
| Fiscal Years Ended |
Americas | EMEA | Asia Pacific | Consolidated (1) | ||||||||||||
| February 28, 2017 |
20.5 | % | 20.7 | % | 29.3 | % | 13.8 | % | ||||||||
| February 29, 2016 |
22.0 | % | 21.4 | % | 24.3 | % | 14.0 | % | ||||||||
| February 28, 2015 |
21.2 | % | 21.8 | % | 22.9 | % | 14.0 | % | ||||||||
| (1) | Consolidated operating income as a percentage of revenue includes corporate (non-allocated) share-based compensation expense for fiscal 2017, fiscal 2016 and fiscal 2015 of $192.5 million, $166.2 million and $135.2 million, respectively. For additional information, see NOTE 19—Segment Reporting to our Consolidated Financial Statements. |
Cash, cash equivalents, investments in debt securities and cash flow from operations
Cash, cash equivalents and short-term and long-term available-for-sale investments in debt securities balances at February 28, 2017 totaled $2.13 billion. Cash generated from operating activities for fiscal 2017 totaled $783.7 million, which represents a 6.4% increase in operating cash flow as compared to fiscal 2016. This increase is due to an increase in subscription and services revenues, billings and collections during the same period.
Our significant cash and investment balances give us a measure of flexibility to take advantage of opportunities, such as acquisitions, increasing investment in our international operations and repurchasing our common stock.
Foreign currency exchange rates’ impact on results of operations
Approximately 41.9% of our revenue for fiscal 2017 came from sales outside the U.S. We are exposed to significant risks of foreign currency fluctuation primarily from receivables denominated in foreign currency and are subject to transaction gains and losses, which are recorded as a component of net income. The income statements of our non-U.S. operations are translated into U.S. dollars at the average exchange rates for each applicable month in a period. To the extent the U.S. dollar weakens against foreign currencies, the translation of these foreign-currency-denominated transactions results in increased revenue and operating expenses from operations for our non-U.S. operations. Similarly, our revenue and operating expenses will decrease for our non-U.S. operations if the U.S. dollar strengthens against foreign currencies.
Using the average foreign currency exchange rates from fiscal 2016, our revenue from non-U.S. operations for fiscal 2017 would have been lower than we reported by approximately $7.6 million and operating expenses from non-U.S. operations for fiscal 2017 would have been higher than we reported by approximately $7.5 million, which would have resulted in income from operations being lower by $15.1 million.
Business combinations
3scale
On June 24, 2016, we completed our acquisition of all of the shares of 3scale, Inc. (“3scale”) for approximately $29.1 million. 3scale is a provider of application programming interface (“API”) management
52
Table of Contents
Index to Financial Statements
technology. By adding 3scale to our existing portfolio, including Red Hat JBoss Middleware, Red Hat OpenShift and Red Hat Mobile Application Platform, we strengthened our enablement of the API economy with simplified cloud integration and microservices-based architectures. We incurred approximately $1.8 million in transaction costs, including legal and accounting fees, relating to the acquisition. These transaction costs have been expensed as incurred and included in general and administrative expense on our Consolidated Statements of Operations for fiscal 2017.
Ansible
On October 16, 2015, we completed our acquisition of all of the shares of Ansible, Inc. (“Ansible”) for approximately $126.0 million. Ansible is a provider of IT automation solutions that allows its users to manage applications across hybrid cloud environments. The acquisition augments our management portfolio and help customers to deploy and manage applications across private and public clouds, speed service delivery through development and operations initiatives, streamline OpenStack installations and upgrades and accelerate container adoption by simplifying orchestration and configuration. We incurred approximately $3.9 million in transaction costs, including legal and accounting fees, relating to the acquisition. These transaction costs have been expensed as incurred and included in general and administrative expense on our Consolidated Statements of Operations for fiscal 2016.
FeedHenry
On October 8, 2014, we completed our acquisition of all of the shares of FeedHenry Ltd. (“Feed Henry”) for approximately $80.2 million. FeedHenry is a provider of cloud-based enterprise mobile application platforms. The acquisition expands our portfolio of application development, integration and platform as a service solutions, enabling us to support mobile application development in public and private environments. We incurred approximately $1.1 million in transaction costs, including legal and accounting fees, relating to the acquisition. These transaction costs have been expensed as incurred and included in general and administrative expense on our Consolidated Statements of Operations for fiscal 2015.
eNovance
On June 24, 2014, we completed our acquisition of all of the shares of eNovance, SAS (“eNovance”) a provider of open source cloud computing services, for $67.6 million. The acquisition assists in advancing our market position in OpenStack, and the addition of eNovance’s systems integration capabilities and engineering talent is expected to help meet growing demand for enterprise OpenStack consulting, design and deployment. We incurred approximately $0.9 million in transaction costs, including legal and accounting fees, relating to the acquisition. These transaction costs have been expensed as incurred and included in general and administrative expense on our Consolidated Statements of Operations for fiscal 2015.
Inktank
On April 30, 2014, we completed our acquisition of all of the shares of Inktank Storage, Inc. (“Inktank”), a provider of scale-out, open source storage systems, whose technology, Inktank Ceph Enterprise, delivers object and block storage software to enterprises deploying public or private clouds, for consideration of $152.5 million. The acquisition complements our existing GlusterFS-based storage and Red Hat Enterprise Linux OpenStack Platform offerings. We incurred approximately $2.0 million in transaction costs, including legal and accounting fees, relating to the acquisition. These transaction costs have been expensed as incurred and are included in general and administrative expense on our Consolidated Statements of Operations for fiscal 2015.
53
Table of Contents
Index to Financial Statements
CRITICAL ACCOUNTING ESTIMATES
We prepare our consolidated financial statements in accordance with U.S. GAAP. Our significant accounting policies are disclosed in NOTE 2—Summary of Significant Accounting Policies to our Consolidated Financial Statements and describe our methods for applying U.S. GAAP in areas such as revenue recognition, deferred selling costs, fair value measurements, and foreign currency translation among other areas deemed significant. In applying certain significant accounting policies, we have to make estimates and assumptions that affect our reported amounts of assets, liabilities, revenue, and expenses, as well as related disclosure of contingent assets and liabilities. In some cases, changes in the accounting estimates are reasonably likely to occur from period to period. Accordingly, actual results could differ materially from our estimates. To the extent that there are material differences between these estimates and actual results, our financial condition, results of operations or cash flows could be adversely affected. We base our estimates on past experience and other assumptions that we believe are reasonable under the circumstances, and we evaluate these estimates on an ongoing basis. We refer to accounting estimates of this type as critical accounting estimates, which we discuss further below. Critical accounting estimates are applied in the following areas:
| • | Revenue recognition; |
| • | Goodwill and other long-lived assets; |
| • | Share-based compensation; |
| • | Income taxes; and |
| • | Loss contingencies. |
Revenue recognition
Application of accounting principles related to the measurement and recognition of revenue requires judgment. For example, in transactions that include multiple elements, we must exercise judgment in determining whether adequate vendor-specific objective evidence (“VSOE”) of fair value exists for each undelivered element. Changes to the elements in a transaction, the ability to identify VSOE for those elements, and changes in the fair value of the respective elements could materially impact the amount of earned and unearned revenue.
In addition, complex arrangements with nonstandard terms and conditions may require significant contract interpretation to determine appropriate accounting, including whether the deliverables specified in a multiple element transaction should be treated as separate units of accounting.
We also derive a portion of our revenue from CCSPs that provide public clouds with computing resources that allow users to consume such resources as a service. We earn revenue based on subscription units consumed by the CCSP or its end users. These cloud-usage services began expanding in fiscal 2013 and have continued to grow.
For periods prior to March 1, 2015, we recognized cloud-usage revenue upon receipt of usage reports from the CCSPs, which typically report fees owed to us one month or more after the fees have been earned. Effective March 1, 2015, we believed that we had sufficient historical data and experience to estimate this cloud-usage revenue and have begun estimating the amount of and recognizing such revenue in the period earned. The estimates are based on the historical cloud-usage data available.
Goodwill and other long-lived assets
We make judgments about the recoverability of goodwill, identifiable intangible assets and other long-lived assets, including capitalized software purchased or developed for internal use. The assumptions and estimates
54
Table of Contents
Index to Financial Statements
used to determine recoverability of goodwill, identifiable intangible assets and other long-lived assets are complex and subjective. They can be affected by various factors, including external factors, such as industry and economic trends, and internal factors, such as changes in our business strategy and our internal, multi-year forecasts for our subscription and services offerings, which often include emerging technologies. Changes in any of these various factors could materially impact our financial condition and results of operations.
Share-based compensation
We are required to make estimates and assumptions with regards to the number of share-based awards that we expect will ultimately vest and the amount of tax benefits we expect will ultimately be realized, among other things.
Share-based awards expected to vest
With respect to performance-based awards that we grant to certain executive officers and senior management, we estimate the number of shares expected to vest based primarily on our most current reported financial results relative to a defined peer group’s most recent reported financial results. Because past or current financial trends may not be predictive of future financial performance, our estimate of the number of shares expected to vest may differ materially from the number of shares that actually vest. The maximum number of potential performance-based shares available to vest as of February 28, 2017 totaled 1.9 million, of which approximately 1.3 million shares are expected to vest with associated compensation expense of $31.1 million. If all of the potential performance-based shares were to vest, we would be required to recognize additional expense of approximately $8.6 million. See NOTE 13—Share-based Awards to our Consolidated Financial Statements for further discussion related to awards outstanding and expected to vest.
Income tax benefits related to share-based awards
We recognize share-based compensation expense based on an award’s grant date fair value over the performance period and/or requisite service period. Because we do not know the actual amount of tax benefits an award will generate until such award is exercised (or vested), we assume that the amount ultimately recognized for tax purposes will be the same amount we recognized in our operating results, that is for “book” purposes. Consequently, our deferred tax asset related to share-based compensation expense, which totaled $51.0 million as of February 28, 2017, is based on each qualifying award’s grant date fair value rather than the award’s to-be-determined exercise date intrinsic value (or vesting date fair value).
Historically, the difference between the grant date fair value and the exercise date intrinsic value has been significant. As a result of such differences, for fiscal 2017, fiscal 2016 and fiscal 2015, we realized excess tax benefits related to share-based awards totaling $16.0 million, $20.2 million and $5.6 million, respectively.
If the share price for our common stock were to depreciate for a sustained period of time we could be required to recognize a tax benefit shortfall. Such shortfalls could have a material adverse effect on our cash flows and financial results. For further discussion, see NOTE 2—Summary of Significant Accounting Policies, NOTE 11—Income Taxes and NOTE 13—Share-based Awards to our Consolidated Financial Statements.
Income taxes
As described in NOTE 2—Summary of Significant Accounting Policies to our Consolidated Financial Statements, we account for income taxes using the asset and liability method. Deferred tax assets and liabilities are recognized for the future tax consequences attributable to differences between the financial statement carrying amounts of existing assets and liabilities and their respective tax bases and tax credit carryforwards. Deferred tax assets and liabilities are measured using enacted tax rates expected to apply to taxable income in the years in which those temporary differences are expected to be recovered or settled.
55
Table of Contents
Index to Financial Statements
We continue to assess the realizability of our deferred tax assets, which primarily consist of share-based compensation expense deductions (described above), tax credit carryforwards and deferred revenue. In assessing the realizability of these deferred tax assets, management considers whether it is more likely than not that some portion or all of the deferred tax assets will be realized. As of February 28, 2017, deferred tax assets totaled $199.0 million, of which $5.6 million was offset by a valuation allowance. For further discussion regarding deferred income taxes see NOTE 2—Summary of Significant Accounting Policies and NOTE 11—Income Taxes to our Consolidated Financial Statements.
Because tax laws are complex and subject to different interpretations, significant judgment is required. As a result, we make certain estimates and assumptions in (i) calculating our income tax expense, deferred tax assets and deferred tax liabilities, (ii) determining any valuation allowance recorded against deferred tax assets and (iii) evaluating the amount of unrecognized tax benefits, as well as the interest and penalties related to such uncertain tax positions. Our estimates and assumptions may differ significantly from tax benefits ultimately realized. For further discussion regarding uncertain tax positions, see NOTE 11—Income Taxes to our Consolidated Financial Statements.
Loss contingencies
We are subject to the possibility of various losses arising in the course of conducting our business, including losses related to legal proceedings and claims brought against us. We consider the likelihood of loss or impairment of an asset or the incurrence of a liability, as well as our ability to reasonably estimate the amount of loss, in determining loss contingencies. An estimated loss contingency is accrued when it is probable that an asset has been impaired or a liability has been incurred and the amount of loss can be reasonably estimated.
Significant judgment is required in evaluating both the likelihood and the estimated amount of a potential loss. Until the final resolution of a matter, there may be an exposure to loss in excess of the amount recorded, and such amount could be material. Should any of our estimates or assumptions change or prove to have been incorrect, it could materially adversely impact on our business, financial condition, operating results or cash flows.
56
Table of Contents
Index to Financial Statements
RESULTS OF OPERATIONS
Fiscal years ended February 28, 2017 and February 29, 2016
The following table is a summary of our results of operations (in thousands):
| Fiscal Years Ended | ||||||||||||||||
| February 28, 2017 |
February 29, 2016 |
$ Change |
% Change |
|||||||||||||
| Revenue: |
||||||||||||||||
| Subscriptions |
$ | 2,135,780 | $ | 1,803,449 | $ | 332,331 | 18.4 | % | ||||||||
| Training and services |
276,023 | 248,781 | 27,242 | 11.0 | ||||||||||||
|
|
|
|
|
|
|
|
|
|||||||||
| Total subscription and training and services revenue |
2,411,803 | 2,052,230 | 359,573 | 17.5 | % | |||||||||||
|
|
|
|
|
|
|
|
|
|||||||||
| Cost of subscription and training and services revenue: |
||||||||||||||||
| Cost of subscriptions |
158,977 | 126,663 | 32,314 | 25.5 | ||||||||||||
| As a % of subscription revenue |
7.4 | % | 7.0 | % | ||||||||||||
| Cost of training and services |
195,401 | 182,966 | 12,435 | 6.8 | ||||||||||||
| As a % of training and services revenue |
70.8 | % | 73.5 | % | ||||||||||||
|
|
|
|
|
|
|
|
|
|||||||||
| Total cost of subscription and training and services revenue |
354,378 | 309,629 | 44,749 | 14.5 | % | |||||||||||
| As a % of total revenue |
14.7 | % | 15.1 | % | ||||||||||||
|
|
|
|
|
|
|
|
|
|||||||||
| Total gross profit |
2,057,425 | 1,742,601 | 314,824 | 18.1 | % | |||||||||||
|
|
|
|
|
|
|
|
|
|||||||||
| Operating expense: |
||||||||||||||||
| Sales and marketing |
1,036,021 | 848,950 | 187,071 | 22.0 | ||||||||||||
| Research and development |
480,668 | 413,322 | 67,346 | 16.3 | ||||||||||||
| General and administrative |
208,491 | 192,281 | 16,210 | 8.4 | ||||||||||||
|
|
|
|
|
|
|
|
|
|||||||||
| Total operating expense |
1,725,180 | 1,454,553 | 270,627 | 18.6 | % | |||||||||||
|
|
|
|
|
|
|
|
|
|||||||||
| Income from operations |
332,245 | 288,048 | 44,197 | 15.3 | ||||||||||||
| Interest income |
13,921 | 11,673 | 2,248 | 19.3 | ||||||||||||
| Interest expense |
23,822 | 23,121 | 701 | 3.0 | ||||||||||||
| Other income (expense), net |
(2,164 | ) | (1,735 | ) | (429 | ) | 24.7 | |||||||||
|
|
|
|
|
|
|
|
|
|||||||||
| Income before provision for income taxes |
320,180 | 274,865 | 45,315 | 16.5 | % | |||||||||||
| Provision for income taxes |
66,477 | 75,500 | (9,023 | ) | (12.0 | ) | ||||||||||
|
|
|
|
|
|
|
|
|
|||||||||
| Net income |
$ | 253,703 | $ | 199,365 | $ | 54,338 | 27.3 | % | ||||||||
|
|
|
|
|
|
|
|
|
|||||||||
| Gross profit margin—subscriptions |
92.6 | % | 93.0 | % | ||||||||||||
| Gross profit margin—training and services |
29.2 | % | 26.5 | % | ||||||||||||
| Gross profit margin |
85.3 | % | 84.9 | % | ||||||||||||
| As a % of total revenue: |
||||||||||||||||
| Subscription revenue |
88.6 | % | 87.9 | % | ||||||||||||
| Training and services revenue |
11.4 | % | 12.1 | % | ||||||||||||
| Sales and marketing expense |
43.0 | % | 41.4 | % | ||||||||||||
| Research and development expense |
19.9 | % | 20.1 | % | ||||||||||||
| General and administrative expense |
8.6 | % | 9.4 | % | ||||||||||||
| Total operating expenses |
71.5 | % | 70.9 | % | ||||||||||||
| Income from operations |
13.8 | % | 14.0 | % | ||||||||||||
| Income before provision for income taxes |
13.3 | % | 13.4 | % | ||||||||||||
| Net income |
10.5 | % | 9.7 | % | ||||||||||||
| Effective income tax rate (1) |
20.8 | % | 27.5 | % | ||||||||||||
| (1) | See NOTE 11—Income Taxes to our Consolidated Financial Statements for further discussion. |
57
Table of Contents
Index to Financial Statements
Revenue
Subscription revenue
Subscription revenue, which is primarily comprised of direct and indirect sales of Red Hat offerings, increased by 18.4%, or $332.3 million, to $2.14 billion for fiscal 2017 from $1.80 billion for fiscal 2016.
Revenue derived from the sale of subscriptions supporting our Infrastructure-related offerings, increased by 14.6%, or $216.0 million, to $1.70 billion for fiscal 2017 from $1.48 billion for fiscal 2016. The increase in subscription revenue is primarily due to increases in volumes sold, including additional subscriptions attributable to geographic expansion and the continued migration of customers to our open source Linux platform from proprietary operating systems.
Revenue derived from the sale of subscriptions supporting our Application Development-related and other emerging technology offerings increased by 36.0%, or $116.4 million, to $439.3 million for fiscal 2017 from $323.0 million for fiscal 2016. The increase is primarily due to additional subscriptions for Red Hat JBoss Middleware offerings. We expect the growth rate of revenue derived from our Application Development-related and other emerging technology offerings to exceed the growth rate of revenue derived from our Infrastructure-related offerings as our Application Development-related and other emerging technology offerings continue to gain broader market acceptance in the enterprise IT environment.
Training and services revenue
Training revenue includes fees paid by our customers for delivery of educational materials and instruction. Services revenue includes fees received from customers for consulting services regarding our offerings, deployment of Red Hat technologies and for delivery of added functionality to Red Hat technologies for our major customers and OEM partners. Total training and services revenue increased by 11.0%, or $27.2 million, to $276.0 million for fiscal 2017 from $248.8 million for fiscal 2016. Training revenue increased by 17.5%, or $10.2 million, primarily as a result of increased revenue generated from our Red Hat Learning Subscription (“RHLS”) offerings. Our services revenue increased by 9.0%, or $17.1 million, as a result of an increase in consulting engagements driven by increased demand for our open source solutions. We expect services revenue to continue growing, though at a slower pace than subscription revenue, as we continue to expand our reach by enabling our channel partners to provide consulting services on our behalf. Combined training and services revenue as a percentage of total revenue was 11.4% and 12.1% for fiscal 2017 and fiscal 2016, respectively.
Cost of revenue
Cost of subscription revenue
The cost of subscription revenue primarily consists of expenses we incur to support, distribute, and package Red Hat offerings. These costs include labor-related costs to provide technical support, security updates and fixes, as well as costs for fulfillment. Cost of subscription revenue increased by 25.5%, or $32.3 million, to $159.0 million for fiscal 2017 from $126.7 million for fiscal 2016. Employee-related expenses increased $21.7 million for fiscal 2017 as compared to fiscal 2016, due to the expansion of our technical staff in order to meet the demands of our growing subscriber base for support, security updates and fixes, especially with respect to the surge in demand for our emerging technology offerings. The remaining expense increase is related to $6.9 million higher expense associated with facility and technology infrastructure enhancements and $3.2 million higher professional services expense. As the number of open source technology subscriptions continues to increase, we expect associated support costs will continue to increase, although we anticipate this will occur at an overall slower rate than that of subscription revenue growth due to economies of scale. Gross profit margin on subscriptions was 92.6% and 93.0% for fiscal 2017 and fiscal 2016, respectively.
Cost of training and services revenue
Cost of training and services revenue is mainly comprised of personnel and third-party consulting costs for the design, development and delivery of custom engineering, training courses and professional services provided
58
Table of Contents
Index to Financial Statements
to various types of customers. Cost of training and services revenue increased by 6.8%, or $12.4 million, to $195.4 million for fiscal 2017 from $183.0 million for fiscal 2016. Costs to deliver our services revenue increased by 6.2%, or $9.4 million, to $160.5 million for fiscal 2017. The increase in costs to deliver services includes $9.8 million increased employee compensation expenses, partially offset by lower outside contractor fees of $1.8 million. The increase in employee compensation expense is due to the expansion of our professional consulting teams needed to meet a surge in demand for services related to our emerging technology offerings. Total costs to deliver training and services as a percentage of training and services revenue decreased to 70.8% for fiscal 2017 from 73.5% for fiscal 2016 primarily as a result of increased revenue generated from our RHLS offerings.
Gross profit
Gross profit margin increased to 85.3% for fiscal 2017 from 84.9% for fiscal 2016. An increase in the cost to deliver our subscription revenue was more than offset by a higher mix of subscription revenue relative to training and services revenue and a lower relative cost to deliver our training revenue for fiscal 2017 as compared to fiscal 2016.
Operating expenses
Sales and marketing
Sales and marketing expense consists primarily of salaries and other related costs for sales and marketing personnel, sales commissions, travel, public relations and marketing materials and trade shows. Sales and marketing expense increased by 22.0%, or $187.1 million, to $1.04 billion for fiscal 2017 from $849.0 million for fiscal 2016. Selling costs increased by 24.0%, or $152.8 million, for fiscal 2017 as compared to fiscal 2016 and include $130.6 million and $8.7 million of additional employee- and travel-related expenses, respectively, the majority of which is attributable to the expansion of our sales force from the prior year. Marketing costs grew by 16.1%, or $34.3 million, for fiscal 2017 as compared to fiscal 2016. The increase in marketing costs includes $26.5 million of employee compensation expense related to increased headcount and incremental marketing program costs of $4.0 million. The remaining increase in sales and marketing costs primarily relates to facility and technology infrastructure enhancements, which increased $11.3 million for fiscal 2017 as compared to fiscal 2016. As a result of continued investments made to expand the breadth of our global sales coverage and depth of our product sales coverage, sales and marketing expense as a percentage of revenue increased to 43.0% for fiscal 2017 from 41.4% for fiscal 2016.
Research and development
Research and development expense consists primarily of personnel and related costs for development of software technologies. Research and development expense increased by 16.3%, or $67.3 million, to $480.7 million for fiscal 2017 from $413.3 million for fiscal 2016. Employee compensation increased by $60.3 million primarily from the expansion of our engineering group through both direct hires and business acquisitions as we continue investing in hybrid cloud management and our other emerging technologies. The remaining increase in research and development costs relates primarily to process and technology infrastructure enhancements, which increased $6.2 million. Research and development expense was 19.9% and 20.1% of total revenue for fiscal 2017 and fiscal 2016, respectively.
General and administrative
General and administrative expense consists primarily of personnel and related costs for general corporate functions, including information systems, finance, accounting, legal, human resources and facilities expense. General and administrative expense increased by 8.4%, or $16.2 million, to $208.5 million for fiscal 2017 from $192.3 million for fiscal 2016. The increase in general and administrative expenses results from increased
59
Table of Contents
Index to Financial Statements
facilities and information systems costs of $9.9 million, professional services expenses of $4.6 million and employee compensation expenses of $3.6 million, primarily related to additional headcount. General and administrative expense decreased as a percentage of revenue to 8.6% for fiscal 2017 from 9.4% for fiscal 2016.
Interest income
Interest income increased by 19.3%, or $2.2 million, to $13.9 million for fiscal 2017 from $11.7 million for fiscal 2016. The increase is attributable to slightly higher yields earned on larger cash and investment balances.
Interest expense
Interest expense increased by $0.7 million to $23.8 million for fiscal 2017 as compared to $23.1 million for fiscal 2016. Interest expense is primarily attributable to our convertible debt.
Other income (expense), net
Net other expenses increased $0.4 million for fiscal 2017 as compared to fiscal 2016. The increase is primarily due to net losses recognized from the settlement of foreign currency transactions during fiscal 2017.
Income taxes
During fiscal 2017, we recorded $66.5 million of income tax expense, which resulted in an effective tax rate of 20.8%. Our effective tax rate of 20.8% differs from the U.S. federal statutory rate of 35.0% primarily due to excess tax benefits from share-based compensation, foreign income taxed at lower rates and research tax credits. Tax expense for fiscal 2017 included a discrete tax benefit of $15.8 million, related to net excess tax benefits from share-based compensation resulting from the early adoption of Accounting Standards Update 2016-09, Compensation—Stock Compensation (Topic 718): Improvements to Employee Share-Based Payment Accounting (“ASU 2016-09”). See NOTE 2—Summary of Significant Accounting Policies to our Consolidated Financial Statements for additional information.
During fiscal 2016, we recorded $75.5 million of income tax expense, which resulted in an annual effective tax rate of 27.5%. Our effective tax rate of 27.5%, differs from the U.S. federal statutory rate of 35.0% primarily due to the foreign tax credit, foreign income taxed at lower rates, research tax credits and the domestic production activities deduction.
For further discussion regarding our income taxes, see NOTE 11—Income Taxes to our Consolidated Financial Statements.
60
Table of Contents
Index to Financial Statements
Fiscal years ended February 29, 2016 and February 28, 2015
The following table is a summary of our results of operations (in thousands):
| Fiscal Years Ended | ||||||||||||||||
| February 29, 2016 |
February 28, 2015 |
$ Change |
% Change |
|||||||||||||
| Revenue: |
||||||||||||||||
| Subscriptions |
$ | 1,803,449 | $ | 1,561,234 | $ | 242,215 | 15.5 | % | ||||||||
| Training and services |
248,781 | 228,255 | 20,526 | 9.0 | ||||||||||||
|
|
|
|
|
|
|
|
|
|||||||||
| Total subscription and training and services revenue |
2,052,230 | 1,789,489 | 262,741 | 14.7 | % | |||||||||||
|
|
|
|
|
|
|
|
|
|||||||||
| Cost of subscription and training and services revenue: |
||||||||||||||||
| Cost of subscriptions |
126,663 | 112,856 | 13,807 | 12.2 | ||||||||||||
| As a % of subscription revenue |
7.0 | % | 7.2 | % | ||||||||||||
| Cost of training and services |
182,966 | 160,343 | 22,623 | 14.1 | ||||||||||||
| As a % of training and services revenue |
73.5 | % | 70.2 | % | ||||||||||||
|
|
|
|
|
|
|
|
|
|||||||||
| Total cost of subscription and training and services revenue |
309,629 | 273,199 | 36,430 | 13.3 | % | |||||||||||
| As a % of total revenue |
15.1 | % | 15.3 | % | ||||||||||||
|
|
|
|
|
|
|
|
|
|||||||||
| Total gross profit |
1,742,601 | 1,516,290 | 226,311 | 14.9 | % | |||||||||||
|
|
|
|
|
|
|
|
|
|||||||||
| Operating expense: |
||||||||||||||||
| Sales and marketing |
848,950 | 728,387 | 120,563 | 16.6 | ||||||||||||
| Research and development |
413,322 | 367,856 | 45,466 | 12.4 | ||||||||||||
| General and administrative |
192,281 | 170,053 | 22,228 | 13.1 | ||||||||||||
|
|
|
|
|
|
|
|
|
|||||||||
| Total operating expense |
1,454,553 | 1,266,296 | 188,257 | 14.9 | % | |||||||||||
|
|
|
|
|
|
|
|
|
|||||||||
| Income from operations |
288,048 | 249,994 | 38,054 | 15.2 | ||||||||||||
| Interest income |
11,673 | 8,336 | 3,337 | 40.0 | ||||||||||||
| Interest expense |
23,121 | 9,394 | 13,727 | 146.1 | ||||||||||||
| Other income (expense), net |
(1,735 | ) | 6,562 | (8,297 | ) | (126.4 | ) | |||||||||
|
|
|
|
|
|
|
|
|
|||||||||
| Income before provision for income taxes |
274,865 | 255,498 | 19,367 | 7.6 | % | |||||||||||
| Provision for income taxes |
75,500 | 75,297 | 203 | 0.3 | ||||||||||||
|
|
|
|
|
|
|
|
|
|||||||||
| Net income |
$ | 199,365 | $ | 180,201 | $ | 19,164 | 10.6 | % | ||||||||
|
|
|
|
|
|
|
|
|
|||||||||
| Gross profit margin—subscriptions |
93.0 | % | 92.8 | % | ||||||||||||
| Gross profit margin—training and services |
26.5 | % | 29.8 | % | ||||||||||||
| Gross profit margin |
84.9 | % | 84.7 | % | ||||||||||||
| As a % of total revenue: |
||||||||||||||||
| Subscription revenue |
87.9 | % | 87.2 | % | ||||||||||||
| Training and services revenue |
12.1 | % | 12.8 | % | ||||||||||||
| Sales and marketing expense |
41.4 | % | 40.7 | % | ||||||||||||
| Research and development expense |
20.1 | % | 20.6 | % | ||||||||||||
| General and administrative expense |
9.4 | % | 9.5 | % | ||||||||||||
| Total operating expenses |
70.9 | % | 70.8 | % | ||||||||||||
| Income from operations |
14.0 | % | 14.0 | % | ||||||||||||
| Income before provision for income taxes |
13.4 | % | 14.3 | % | ||||||||||||
| Net income |
9.7 | % | 10.1 | % | ||||||||||||
| Effective income tax rate (1) |
27.5 | % | 29.5 | % | ||||||||||||
| (1) | See NOTE 11—Income Taxes to our Consolidated Financial Statements for further discussion. |
61
Table of Contents
Index to Financial Statements
Revenue
Subscription revenue
Subscription revenue increased by 15.5%, or $242.2 million, to $1.80 billion for fiscal 2016 from $1.56 billion for fiscal 2015.
Revenue derived from the sale of subscriptions supporting our Infrastructure-related offerings, increased by 11.8%, or $155.8 million, to $1.48 billion for fiscal 2016 from $1.32 billion for fiscal 2015 and is primarily due to increases in volumes sold, including additional subscriptions attributable to geographic expansion and the continued migration of customers to our open source Linux platform from proprietary operating systems.
Revenue derived from the sale of subscriptions supporting our Application Development-related and other emerging technology offerings increased by 36.5%, or $86.4 million, to $323.0 million for fiscal 2016 from $236.5 million for fiscal 2015. The increase is primarily due to additional subscriptions for Red Hat JBoss Middleware offerings.
Training and services revenue
Total training and services revenue increased by 9.0%, or $20.5 million, to $248.8 million for fiscal 2016 from $228.3 million for fiscal 2015. Training revenue increased 1.9%, or $1.1 million. Our services revenue increased by 11.3%, or $19.4 million, as a result of an increase in consulting engagements driven by increased demand for our open source solutions. Combined training and services revenue as a percentage of total revenue was 12.1% and 12.8% for fiscal 2016 and fiscal 2015, respectively.
Cost of revenue
Cost of subscription revenue
Cost of subscription revenue increased by 12.2%, or $13.8 million, to $126.7 million for fiscal 2016 from $112.9 million for fiscal 2015. Employee-related expenses increased $10.6 million for fiscal 2016 as compared to fiscal 2015, due to the expansion of our technical staff in order to meet the demands of our growing subscriber base for support, security updates and fixes. The remaining increase relates to increased expense of $1.4 million related to facility and technology infrastructure enhancements. Gross profit margin on subscriptions was 93.0% and 92.8% for fiscal 2016 and fiscal 2015, respectively.
Cost of training and services revenue
Cost of training and services revenue increased by 14.1%, or $22.6 million, to $183.0 million for fiscal 2016 from $160.3 million for fiscal 2015. Costs to deliver our services revenue increased by 16.0%, or $20.9 million, to $151.1 million for fiscal 2016. The increase in costs to deliver services includes $14.5 million and $2.1 million of increased employee compensation expenses and outside contractor fees, respectively. The increase in both employee compensation expense and contractor fees is due to the expansion of our professional consulting teams needed to meet a surge in demand for services related to our emerging technology offerings. As a result of such investment in staffing, profit margin from professional services decreased to 20.8% for fiscal 2016 from 24.0% for fiscal 2015. Total costs to deliver training and services as a percentage of training and services revenue increased to 73.5% for fiscal 2016 from 70.2% for fiscal 2015.
Gross profit
Gross profit margin increased to 84.9% for fiscal 2016 from 84.7% for fiscal 2015. The increase was due to a favorable mix shift as subscription revenue increased relative to services and was partially offset by increased costs to deliver our consulting services as a result of investments in personnel, infrastructure and processes to support our emerging technologies.
62
Table of Contents
Index to Financial Statements
Operating expenses
Sales and marketing
Sales and marketing expense increased by 16.6%, or $120.6 million, to $849.0 million for fiscal 2016 from $728.4 million for fiscal 2015. Selling costs increased by 13.8%, or $77.1 million, for fiscal 2016 as compared to fiscal 2015 and include $59.9 million and $5.3 million of additional employee- and travel-related expenses, respectively, the majority of which is attributable to the expansion of our sales force from the prior year. Marketing costs grew by 25.5%, or $43.4 million, for fiscal 2016 as compared to fiscal 2015. The increase in marketing costs includes $15.9 million of employee compensation expense related to increased headcount and incremental marketing program costs of $25.5 million. The remaining increase in sales and marketing costs primarily relates to facility and technology infrastructure enhancements, which increased $4.6 million for fiscal 2016 as compared to fiscal 2015. As a result of continued investments made to expand the breadth of our global sales coverage and depth of our product sales coverage, sales and marketing expense as a percentage of revenue increased to 41.4% for fiscal 2016 from 40.7% for fiscal 2015.
Research and development
Research and development expense increased by 12.4%, or $45.5 million, to $413.3 million for fiscal 2016 from $367.9 million for fiscal 2015. Employee compensation increased by $39.8 million primarily from the expansion of our engineering group through both direct hires and business acquisitions as we continued investing in cloud management and our other emerging technologies. The remaining increase in research and development costs relates primarily to process and technology infrastructure enhancements, which increased $1.6 million. Research and development expense was 20.1% and 20.6% of total revenue for fiscal 2016 and fiscal 2015, respectively.
General and administrative
General and administrative expense increased by 13.1%, or $22.2 million, to $192.3 million for fiscal 2016 from $170.1 million for fiscal 2015. The increase in general and administrative expenses results from increased employee compensation expenses of $13.1 million, primarily related to additional headcount, increased facilities and information systems costs of $3.7 million and outside services expenses of $3.9 million. General and administrative expense decreased as a percentage of revenue to 9.4% for fiscal 2016 from 9.5% for fiscal 2015.
Interest income
Interest income increased by 40.0%, or $3.3 million, to $11.7 million for fiscal 2016 from $8.3 million for fiscal 2015. The increase is attributable to yields earned on larger cash and investment balances.
Interest expense
Interest expense increased by $13.7 million to $23.1 million for fiscal 2016 as compared to $9.4 million for fiscal 2015. The increase in interest expense is attributable to the issuance of convertible notes, which are described in NOTE 21—Convertible Notes to our Consolidated Financial Statements.
Other income (expense), net
Other income (expense), net decreased $8.3 million for fiscal 2016 as compared to fiscal 2015. The decrease is primarily due to gains on the sale of certain equity investments during fiscal 2015 not repeated during fiscal 2016.
Income taxes
During fiscal 2016, we recorded $75.5 million of income tax expense, which resulted in an effective tax rate of 27.5%. Our effective tax rate of 27.5% differs from the U.S. federal statutory rate of 35.0% primarily due to
63
Table of Contents
Index to Financial Statements
the foreign tax credit, foreign income taxed at lower rates, research tax credits and the domestic production activities deduction. The provision for income tax consists of $41.5 million of U.S. income tax expense and $34.0 million of foreign income tax expense.
During fiscal 2015, we recorded $75.3 million of income tax expense, which resulted in an annual effective tax rate of 29.5%. Our effective tax rate of 29.5% differs from the U.S. federal statutory rate of 35.0% primarily due to the foreign tax credit, foreign income taxed at lower rates, the domestic production activities deduction and research tax credits. The foreign tax credit and foreign tax rate differentials were partially offset by a deemed foreign dividend. The provision for income tax consisted of $57.2 million of U.S. income tax expense and $18.1 million of foreign income tax expense.
LIQUIDITY AND CAPITAL RESOURCES
We derive our liquidity and operating capital primarily from cash flows from operations. Historically, we also received cash from the sale of equity securities, including private sales of preferred stock and the sale of common stock in our initial and follow-on public offerings, and the issuance of convertible notes, including our issuance of convertible notes with par value totaling $805.0 million described in detail in NOTE 21—Convertible Notes to our Consolidated Financial Statements. At February 28, 2017, we had total cash and investments of $2.13 billion, which was comprised of $1.09 billion in cash and cash equivalents, $370.0 million of short-term, available-for-sale fixed-income investments and $672.4 million of long-term, available-for-sale fixed-income investments. This compares to total cash and investments of $2.00 billion at February 29, 2016.
With $1.09 billion in cash and cash equivalents on hand, we believe our cash and cash equivalent balances, together with our investments and our ability to generate additional cash from operations, should be sufficient to satisfy our cash requirements for the next twelve months and for the foreseeable future. However, we may take advantage of favorable capital market conditions that may arise from time to time to raise additional capital. We presently do not intend to liquidate our short- and long-term investments in debt securities prior to their scheduled maturity dates. However, in the event that we liquidate these investments prior to their scheduled maturities and there are adverse changes in market interest rates or the overall economic environment, we could be required to recognize a realized loss on those investments at liquidation. At both February 28, 2017 and February 29, 2016, accumulated unrealized net losses on our available-for-sale debt securities totaled a $1.4 million loss.
Fiscal year ended February 28, 2017
Cash flows—overview
At February 28, 2017, cash and cash equivalents totaled $1.09 billion, an increase of $163.0 million as compared to February 29, 2016. The increase in cash and cash equivalents for fiscal 2017 is the result of cash provided by operating activities, which totaled $783.7 million for fiscal 2017. Partially offsetting cash provided by operating activities was cash used to repurchase 6,192,382 shares of our common stock for $458.7 million, investments in property and equipment of $69.1 million, the acquisition of 3scale that included net cash consideration paid of $28.7 million and payments made in return for common shares received from employees to satisfy employees’ minimum tax withholding obligations related to employee share awards vesting of $66.5 million. Net cash generated by operating activities and net cash used for investing activities and financing activities is further described below.
Cash flows from operations
Cash provided by operations of $783.7 million during fiscal 2017 includes net income of $253.7 million, adjustments to exclude the impact of non-cash income and expenses, which totaled a $325.4 million net source of
64
Table of Contents
Index to Financial Statements
cash, and changes in operating assets and liabilities, which totaled a $204.6 million net source of cash. Cash provided by changes in operating assets and liabilities for fiscal 2017 was primarily the result of an increase in our deferred revenue, which generated operating cash flow of $348.5 million. The increase in deferred revenue was due to growth in billings as we generally bill our customers in advance of subscription periods.
Cash flows from investing
Cash used in investing activities of $110.1 million for fiscal 2017 includes investments in property and equipment, which totaled $69.1 million and primarily relate to information technology infrastructure and leasehold improvements, the purchase of 3scale for net cash consideration of $28.7 million and investments in other intangible assets, primarily patents, which totaled $11.8 million for fiscal 2017. Purchases of available-for-sale debt securities of $500.9 million were offset by maturities and sales of available-for-sale debt securities totaling $501.0 million for fiscal 2017.
Cash flows from financing
Cash used in financing activities of $504.2 million for fiscal 2017 includes $458.7 million to repurchase 6,192,382 shares of our common stock and payments made in return for common shares received from employees to satisfy employees’ minimum tax withholding obligations related to employee share awards vesting during fiscal 2017 of $66.5 million. Partially offsetting financing activities using cash were proceeds from our employee stock purchase plan, which totaled $18.9 million, and proceeds from employees’ exercise of common stock options, which totaled $3.8 million for fiscal 2017. Payments on other borrowings totaled $1.7 million for fiscal 2017.
Fiscal year ended February 29, 2016
Cash flows—overview
At February 29, 2016, cash and cash equivalents totaled $927.8 million, a decrease of $119.7 million as compared to February 28, 2015. The decrease in cash and cash equivalents for fiscal 2016 is the result of net purchases of available-for-sale debt securities of $327.3 million, the repurchase of 3,476,229 shares of our common stock for $262.6 million, business combinations, which included net cash consideration paid of $126.5 million, and payments made in return for common shares received from employees to satisfy employees’ minimum tax withholding obligations related to employee share awards vesting of $66.9 million. Partially offsetting cash used in investing and financing activities was cash provided by operating activities, which totaled $736.3 million for fiscal 2016.
As discussed in NOTE 2—Summary of Significant Accounting Policies to our Consolidated Financial Statements, we adopted ASU 2016-09 effective March 1, 2016. In addition to other provisions, under ASU 2016-09 all windfall tax benefits related to share-based payments are reported as cash flows from operating activities along with all other income tax cash flows. Previously, windfall tax benefits from share-based payment arrangements were reported as cash flows from financing activities.
With respect to the classification of windfall tax benefits on the statement of cash flows, ASU 2016-09 allows companies to elect either a prospective or retrospective application. We elected to apply this classification amendment retrospectively. As a result, $20.2 million and $5.6 million, respectively, of windfall tax benefits previously reported as cash flows from financing activities on our Consolidated Statements of Cash Flows for fiscal 2016 and fiscal 2015 have been reclassified as cash flows from operating activities.
Net cash generated by operating activities and net cash used for investing activities and financing activities is further described below.
65
Table of Contents
Index to Financial Statements
Cash flows from operations
Cash provided by operations of $736.3 million during fiscal 2016 includes net income of $199.4 million, adjustments to exclude the impact of non-cash income and expenses, which totaled a $286.5 million net source of cash, and changes in operating assets and liabilities, which totaled a $250.5 million net source of cash. Cash provided by changes in operating assets and liabilities for fiscal 2016 was primarily the result of an increase in our deferred revenue, which generated operating cash flow of $260.5 million. The increase in deferred revenue was due to growth in billings as we generally bill our customers in advance of subscription periods.
Cash flows from investing
Cash used in investing activities of $512.1 million for fiscal 2016 includes net purchases of available-for-sale debt securities of $327.3 million and net cash of $126.5 million used to acquire businesses. Investments in property and equipment totaled $41.6 million and primarily relate to information technology infrastructure and leasehold improvements. Investments in other intangible assets, primarily patents, totaled $14.0 million for fiscal 2016.
Cash flows from financing
Cash used in financing activities of $327.8 million for fiscal 2016 includes $262.6 million to repurchase 3,476,229 shares of our common stock and payments made in return for common shares received from employees to satisfy employees’ minimum tax withholding obligations related to employee share awards vesting during fiscal 2016 of $66.9 million. Partially offsetting financing activities using cash were proceeds from employees’ exercise of common stock options, which totaled $3.6 million. Payments on other borrowings totaled $1.8 million for fiscal 2016.
Investments in debt securities
Our investments are comprised primarily of debt securities that are classified as available for sale and recorded at their fair market values. At February 28, 2017 and February 29, 2016, the vast majority of our investments were priced with the assistance of pricing vendors. These pricing vendors use the most recent observable market information in pricing these securities or, if specific prices are not available for these securities, use other observable inputs. In the event observable inputs are not available, we assess other factors to determine the securities’ market values, including broker quotes or model valuations. Independent price verifications of all of our holdings are performed by the pricing vendors, which we review. In the event a price fails a pre-established tolerance check, it is researched so that we can assess the cause of the variance to determine what we believe is the appropriate fair market value.
Capital requirements
We have experienced a substantial increase in our operating expenses since our inception in connection with the growth of our operations, the development of our technologies, the expansion of our services operations and our acquisition activity. Our capital requirements during fiscal 2018 will depend on numerous factors, including the amount of resources we devote to:
| • | funding the continued development of our technology offerings; |
| • | improving and extending our services and the technologies used to market and deliver these services to our customers and support our business; |
| • | pursuing strategic acquisitions and alliances; |
| • | investing in or acquiring businesses, products and technologies; and |
| • | investing in enhancements to the systems we use to run our business and the expansion of our office facilities. |
66
Table of Contents
Index to Financial Statements
We have utilized, and will continue from time to time to utilize, cash and investments to fund, among other potential uses, purchases of our common stock, purchases of fixed assets, purchases of intangible assets (primarily patents), and mergers and acquisitions. Given our historically strong operating cash flow and the $2.13 billion of cash and investments held at February 28, 2017, we believe our cash and cash equivalent balances, together with our ability to generate additional cash from operations, should be sufficient to satisfy our cash requirements for the next twelve months and for the foreseeable future. However, we may take advantage of favorable capital market conditions that may arise from time to time to raise additional capital.
We believe that our ability to generate additional cash from operations will continue; however, there can be no assurances that we will be able to generate cash from operations at a level equal to the current rate or that such cash flows will be adequate to fund other investments or acquisitions that we may choose to make or that cash may be located in or generated in the appropriate geographic region where we can effectively use such cash. We may choose to accelerate the expansion of our business from our current plans, which may require us to raise additional funds through the sale of equity or debt securities or through other financing means. There can be no assurances that any such financing would occur in amounts or on terms favorable to us, if at all.
As of February 28, 2017, our cash, cash equivalents and available-for-sale investment securities totaled $2.13 billion, of which $1.12 billion was held outside the U.S. Our intent is to reinvest the earnings of foreign subsidiaries indefinitely outside the U.S. to fund both organic growth and acquisitions. From time to time, however, we may remit a portion of these earnings to the extent it is economically prudent. For further discussion related to geographic segments, see NOTE 19—Segment Reporting to our Consolidated Financial Statements.
With 47.7% of our available cash, cash equivalents and available-for-sale investments, as of February 28, 2017, held within the U.S., we do not anticipate a need to repatriate any foreign earnings for the foreseeable future. However, if cash held outside the U.S. were needed to fund our U.S. operations, under current tax law we would be subject to additional taxes on the portion related to repatriated earnings of our foreign subsidiaries. As of February 28, 2017, cumulative undistributed foreign earnings totaled $677.4 million. For further discussion, see NOTE 11—Income Taxes to our Consolidated Financial Statements.
Off-balance sheet arrangements
As of February 28, 2017 and February 29, 2016, we have no off-balance sheet financing arrangements and do not utilize any “structured debt,” “special purpose” or similar unconsolidated entities for liquidity or financing purposes.
Contractual obligations
The following table summarizes our principal contractual obligations at February 28, 2017 (in thousands):
| Total | Less than 1 Year |
1-3 Years | 3-5 Years | More than 5 Years |
||||||||||||||||
| Operating lease obligations |
$ | 289,802 | $ | 56,068 | $ | 92,707 | $ | 68,154 | $ | 72,873 | ||||||||||
| Capital lease obligations |
2,356 | 1,354 | 1,002 | — | — | |||||||||||||||
| Convertible notes 0.25% coupon obligations |
6,037 | 2,013 | 4,024 | — | — | |||||||||||||||
| Convertible notes principal |
805,000 | — | 805,000 | — | — | |||||||||||||||
| Purchase obligations |
2,200 | 2,200 | — | — | — | |||||||||||||||
|
|
|
|
|
|
|
|
|
|
|
|||||||||||
| Total |
$ | 1,105,395 | $ | 61,635 | $ | 902,733 | $ | 68,154 | $ | 72,873 | ||||||||||
|
|
|
|
|
|
|
|
|
|
|
|||||||||||
Obligations under contracts that we may cancel without significant penalty are not included in the table above. In addition, because we are unable to reasonably estimate the timing of settlements and any future payments related to uncertain tax positions, such liabilities are not included in the above table. However, as of February 28, 2017, we have recognized a total of $76.7 million related to such liabilities, which are included in Other long-term obligations on our Consolidated Balance Sheet.
67
Table of Contents
Index to Financial Statements
RECENT ACCOUNTING PRONOUNCEMENTS
For discussion of accounting pronouncements recently adopted and accounting pronouncements being evaluated, and the impact of these pronouncements on our consolidated financial statements, see NOTE 2—Summary of Significant Accounting Policies to our Consolidated Financial Statements.
68
Table of Contents
Index to Financial Statements
| ITEM 7A. | QUANTITATIVE AND QUALITATIVE DISCLOSURES ABOUT MARKET RISK |
We are exposed to the impact of interest rate changes, foreign currency exchange rate fluctuations and changes in the market value of our investments.
Interest rate risk
Our exposure to market rate risk for changes in interest rates relates primarily to our investment portfolio. The primary objective of our investment activities is to preserve principal and liquidity while at the same time maximizing yields without significantly increasing risk. To achieve this objective, we maintain our portfolio of short- and long-term investments in a variety of available-for-sale fixed and floating rate debt securities, including both government and corporate obligations and money market funds. Investments in both fixed rate and floating rate interest earning instruments carry a degree of interest rate risk. Fixed rate securities may have their fair market value adversely impacted due to a rise in prevailing interest rates, while floating rate securities may produce less income than expected if interest rates fall. Due in part to these factors, our future investment income related to these securities may fall short of expectations due to changes in interest rates, or we may suffer losses in principal if forced to sell securities that have declined in market value due to changes in interest rates or perceived credit risk related to the securities’ issuers. A hypothetical one-half percentage point change in interest rates, assuming a parallel shift of all interest rates, would result in an approximate $0.6 million change in annual interest income derived from investments in our portfolio as of February 28, 2017. For further discussion related to our investments as of February 28, 2017 and February 29, 2016, see NOTE 2—Summary of Significant Accounting Policies and NOTE 17—Assets and Liabilities Measured at Fair Value on a Recurring Basis to our Consolidated Financial Statements.
Investment risk
The fair market value of our available-for-sale investment portfolio is subject to interest rate risk. Based on a sensitivity analysis performed on this investment portfolio, a hypothetical one percentage point increase in prevailing interest rates would result in an approximate $12.0 million decrease in the fair value of our available-for-sale investment securities as of February 28, 2017. For further discussion related to our investments as of February 28, 2017 and February 29, 2016, see NOTE 2—Summary of Significant Accounting Policies and NOTE 17—Assets and Liabilities Measured at Fair Value on a Recurring Basis to our Consolidated Financial Statements.
Credit risk
Investments in debt and equity securities
The fair market values of our investment portfolio and cash balances are exposed to counterparty credit risk. Accordingly, while we periodically review our portfolio in an effort to mitigate counterparty risk, the principal values of our cash balances, money market accounts and investments in available-for-sale securities could suffer a loss of value.
Accounts receivable
As of February 28, 2017 and February 29, 2016, no individual customer accounted for 10% or more of our total accounts receivable.
Foreign currency risk
Approximately 41.9% of our revenue for fiscal 2017 was produced by sales outside the United States. We are exposed to significant risks of foreign currency fluctuation primarily from receivables denominated in foreign currency and are subject to transaction gains and losses, which are recorded as a component of net income. The income statements of our non-U.S. operations are translated into U.S. dollars at the average exchange rates for
69
Table of Contents
Index to Financial Statements
each applicable month in a period. To the extent the U.S. dollar weakens against foreign currencies, the translation of these foreign currency statements results in increased revenue and operating expenses for our non-U.S. operations. Similarly, our revenue and operating expenses for our non-U.S. operations decrease if the U.S. dollar strengthens against foreign currencies.
Using the average foreign currency exchange rates from fiscal 2016, our revenue from non-U.S. operations for fiscal 2017 would have been lower than we reported by approximately $7.6 million and operating expenses from non-U.S. operations for fiscal 2017 would have been higher than we reported by approximately $7.5 million, which would have resulted in income from operations being lower by $15.1 million.
Convertible notes
In October 2014, we issued $805.0 million of 0.25% convertible notes due 2019. The convertible notes have a fixed annual interest rate of 0.25%, and, therefore, we do not have economic interest rate exposure on the convertible notes. However, the fair market value of the convertible notes is exposed to interest rate risk. Generally, the fair market value of the convertible notes will increase as interest rates fall and decrease as interest rates rise. For further discussion regarding the fair value of the convertible notes, see NOTE 21—Convertible Notes to our Consolidated Financial Statements.
In connection with the sale of the convertible notes, we entered into convertible note hedge transactions and warrant transactions. The convertible note hedge transactions are expected to offset the potential dilution with respect to shares of our common stock upon any conversion of the convertible notes and/or offset any cash payments that we are required to make in excess of the principal amount of the converted notes, as the case may be. The warrant transactions will have a dilutive effect with respect to our common stock to the extent that the market price per share of our common stock, as measured under the terms of the warrant transactions, exceeds the applicable strike price of the warrants. However, subject to certain conditions, we may elect to settle all of the warrants in cash. The initial strike price of the warrants is $101.65 per share. The number of shares of our common stock underlying the warrants is 10,965,630 shares, subject to anti-dilution adjustments. The convertible note hedge and warrants are both considered indexed to our common stock and classified as equity; therefore, the convertible note hedge and warrants are not accounted for as derivative instruments.
Derivative instruments
We transact business in various foreign countries and are, therefore, subject to risk of foreign currency exchange rate fluctuations. From time to time we enter into forward contracts to economically hedge transactional exposure associated with commitments arising from trade accounts receivable, trade accounts payable and fixed purchase obligations denominated in a currency other than the functional currency of the respective operating entity. All derivative instruments are recorded on the Consolidated Balance Sheets at their respective fair market values. We have elected not to prepare and maintain the documentation required to qualify our forward contracts for hedge accounting treatment and, therefore, changes in fair value are recorded in our Consolidated Statements of Operations. For further discussion related to our management of foreign currency risk see NOTE 10—Derivative Instruments to our Consolidated Financial Statements.
The aggregate notional amount of outstanding forward contracts at February 28, 2017 was $48.8 million. The fair value of these outstanding contracts at February 28, 2017 was a gross $0.1 million asset and a gross $0.2 million liability, and is recorded in Other current assets and Accounts payable and accrued expenses, respectively, on our Consolidated Balance Sheets. The forward contracts generally expire within three months of the period ended February 28, 2017. The forward contracts will settle in Australian dollars, Euros, Hong Kong dollars, Japanese yen, Norwegian krona, Singapore dollars, Swedish krona, Swiss francs and U.S. dollars.
The aggregate notional amount of outstanding forward contracts at February 29, 2016 was $72.6 million. The fair value of these outstanding contracts at February 29, 2016 was a gross $0.6 million asset and a gross $0.5 million liability, and is recorded in Other current assets and Accounts payable and accrued expenses, respectively, on our Consolidated Balance Sheets.
70
Table of Contents
Index to Financial Statements
| ITEM 8. | FINANCIAL STATEMENTS AND SUPPLEMENTARY DATA |
INDEX TO CONSOLIDATED FINANCIAL STATEMENTS
| Page | ||||
| Report of Management on Internal Control Over Financial Reporting |
72 | |||
| 73 | ||||
| Financial Statements: |
||||
| Consolidated Balance Sheets at February 28, 2017 and February 29, 2016 |
74 | |||
| 75 | ||||
| 76 | ||||
| 77 | ||||
| 78 | ||||
| 79 | ||||
71
Table of Contents
Index to Financial Statements
REPORT OF MANAGEMENT ON INTERNAL CONTROL OVER FINANCIAL REPORTING
Our management is responsible for establishing and maintaining adequate internal control over financial reporting (as defined in Rules 13a-15(f) and 15d-15(f) under the Securities Exchange Act). Internal control over financial reporting is a process designed to provide reasonable assurance regarding the reliability of financial reporting and the preparation of financial statements for external purposes in accordance with accounting principles generally accepted in the United States of America. The Company’s internal control over financial reporting includes those policies and procedures that: (i) pertain to the maintenance of records that, in reasonable detail, accurately and fairly reflect the transactions and dispositions of the assets of the Company; (ii) provide reasonable assurance that transactions are recorded as necessary to permit preparation of financial statements in accordance with accounting principles generally accepted in the United States of America, and that receipts and expenditures of the Company are being made only in accordance with authorizations of management and directors of the Company; and (iii) provide reasonable assurance regarding prevention or timely detection of unauthorized acquisition, use, or disposition of the Company’s assets that could have a material effect on the financial statements.
Our management conducted an evaluation of the effectiveness of our internal control over financial reporting as of the end of the period covered by this report based on the framework in Internal Control—Integrated Framework (2013) issued by the Committee of Sponsoring Organizations of the Treadway Commission. Based on this evaluation, management concluded that the Company’s internal control over financial reporting was effective as of the end of the period covered by this report.
Our independent registered public accounting firm, which has audited the financial statements included in Part II, Item 8 of this report, has also audited the effectiveness of the Company’s internal control over financial reporting as of February 28, 2017, as stated in their attestation report on our internal control over financial reporting, which is included below.
72
Table of Contents
Index to Financial Statements
REPORT OF INDEPENDENT REGISTERED PUBLIC ACCOUNTING FIRM
To the Board of Directors and Shareholders of Red Hat, Inc.:
In our opinion, the accompanying consolidated balance sheets and the related consolidated statements of operations, of comprehensive income, of stockholders’ equity and of cash flows present fairly, in all material respects, the financial position of Red Hat, Inc. and its subsidiaries at February 28, 2017 and February 29, 2016, and the results of their operations and their cash flows for each of the three years in the period ended February 28, 2017 in conformity with accounting principles generally accepted in the United States of America. Also in our opinion, the Company maintained, in all material respects, effective internal control over financial reporting as of February 28, 2017, based on criteria established in Internal Control—Integrated Framework (2013) issued by the Committee of Sponsoring Organizations of the Treadway Commission (COSO). The Company’s management is responsible for these financial statements, for maintaining effective internal control over financial reporting and for its assessment of the effectiveness of internal control over financial reporting, included in the Report of Management on Internal Control over Financial Reporting appearing in Item 8. Our responsibility is to express opinions on these financial statements and on the Company’s internal control over financial reporting based on our integrated audits. We conducted our audits in accordance with the standards of the Public Company Accounting Oversight Board (United States). Those standards require that we plan and perform the audits to obtain reasonable assurance about whether the financial statements are free of material misstatement and whether effective internal control over financial reporting was maintained in all material respects. Our audits of the financial statements included examining, on a test basis, evidence supporting the amounts and disclosures in the financial statements, assessing the accounting principles used and significant estimates made by management, and evaluating the overall financial statement presentation. Our audit of internal control over financial reporting included obtaining an understanding of internal control over financial reporting, assessing the risk that a material weakness exists, and testing and evaluating the design and operating effectiveness of internal control based on the assessed risk. Our audits also included performing such other procedures as we considered necessary in the circumstances. We believe that our audits provide a reasonable basis for our opinions.
As discussed in Note 2 to the consolidated financial statements, the Company changed the manner in which it accounts for stock compensation during the fiscal year ended February 28, 2017.
A company’s internal control over financial reporting is a process designed to provide reasonable assurance regarding the reliability of financial reporting and the preparation of financial statements for external purposes in accordance with generally accepted accounting principles. A company’s internal control over financial reporting includes those policies and procedures that (i) pertain to the maintenance of records that, in reasonable detail, accurately and fairly reflect the transactions and dispositions of the assets of the company; (ii) provide reasonable assurance that transactions are recorded as necessary to permit preparation of financial statements in accordance with generally accepted accounting principles, and that receipts and expenditures of the company are being made only in accordance with authorizations of management and directors of the company; and (iii) provide reasonable assurance regarding prevention or timely detection of unauthorized acquisition, use, or disposition of the company’s assets that could have a material effect on the financial statements.
Because of its inherent limitations, internal control over financial reporting may not prevent or detect misstatements. Also, projections of any evaluation of effectiveness to future periods are subject to the risk that controls may become inadequate because of changes in conditions, or that the degree of compliance with the policies or procedures may deteriorate.
/s/ PricewaterhouseCoopers LLP
Raleigh, North Carolina
April 26, 2017
73
Table of Contents
Index to Financial Statements
RED HAT, INC.
(in thousands—except share and per share amounts)
| February 28, 2017 |
February 29, 2016 |
|||||||
| ASSETS | ||||||||
| Current assets: |
||||||||
| Cash and cash equivalents |
$ | 1,090,808 | $ | 927,778 | ||||
| Investments in debt securities, short-term |
369,983 | 281,142 | ||||||
| Accounts receivable, net of allowances for doubtful accounts of $2,791 and $2,798, respectively |
634,821 | 509,715 | ||||||
| Prepaid expenses |
200,609 | 150,877 | ||||||
| Other current assets |
19,481 | 2,921 | ||||||
|
|
|
|
|
|||||
| Total current assets |
2,315,702 | 1,872,433 | ||||||
| Property and equipment, net of accumulated depreciation and amortization of $231,533 and $194,819, respectively |
189,629 | 166,886 | ||||||
| Goodwill |
1,040,709 | 1,027,277 | ||||||
| Identifiable intangibles, net |
137,767 | 146,071 | ||||||
| Investments in debt securities, long-term |
672,440 | 786,470 | ||||||
| Deferred tax assets, net |
104,833 | 111,456 | ||||||
| Other assets, net |
74,105 | 44,506 | ||||||
|
|
|
|
|
|||||
| Total assets |
$ | 4,535,185 | $ | 4,155,099 | ||||
|
|
|
|
|
|||||
| LIABILITIES AND STOCKHOLDERS’ EQUITY | ||||||||
| Current liabilities: |
||||||||
| Accounts payable and accrued expenses |
$ | 376,957 | $ | 284,802 | ||||
| Deferred revenue, short-term |
1,512,762 | 1,272,908 | ||||||
| Other current obligations |
1,354 | 1,467 | ||||||
|
|
|
|
|
|||||
| Total current liabilities |
1,891,073 | 1,559,177 | ||||||
| Deferred revenue, long-term |
557,194 | 449,636 | ||||||
| Convertible notes |
745,633 | 723,942 | ||||||
| Other long-term obligations |
93,965 | 87,912 | ||||||
| Commitments and contingencies (NOTES 14 and 15) |
||||||||
| Stockholders’ equity: |
||||||||
| Preferred stock, $0.0001 per share par value, 5,000,000 shares authorized, none outstanding |
— | — | ||||||
| Common stock, $0.0001 per share par value, 300,000,000 shares authorized, 236,804,594 and 234,896,137 shares issued, 176,901,936 and 181,185,861 shares outstanding at February 28, 2017 and February 29, 2016, respectively |
24 | 23 | ||||||
| Additional paid-in capital |
2,294,462 | 2,162,264 | ||||||
| Retained earnings |
1,352,991 | 1,099,738 | ||||||
| Treasury stock at cost, 59,902,658 and 53,710,276 shares at February 28, 2017 and February 29, 2016, respectively |
(2,311,805 | ) | (1,853,144 | ) | ||||
| Accumulated other comprehensive loss |
(88,352 | ) | (74,449 | ) | ||||
|
|
|
|
|
|||||
| Total stockholders’ equity |
$ | 1,247,320 | $ | 1,334,432 | ||||
|
|
|
|
|
|||||
| Total liabilities and stockholders’ equity |
$ | 4,535,185 | $ | 4,155,099 | ||||
|
|
|
|
|
|||||
The accompanying notes are an integral part of these consolidated financial statements.
74
Table of Contents
Index to Financial Statements
RED HAT, INC.
CONSOLIDATED STATEMENTS OF OPERATIONS
(in thousands—except per share amounts)
| Fiscal Years Ended | ||||||||||||
| February 28, 2017 |
February 29, 2016 |
February 28, 2015 |
||||||||||
| Revenue: |
||||||||||||
| Subscriptions |
$ | 2,135,780 | $ | 1,803,449 | $ | 1,561,234 | ||||||
| Training and services |
276,023 | 248,781 | 228,255 | |||||||||
|
|
|
|
|
|
|
|||||||
| Total subscription and training and services revenue |
2,411,803 | 2,052,230 | 1,789,489 | |||||||||
|
|
|
|
|
|
|
|||||||
| Cost of subscription and training and services revenue: |
||||||||||||
| Cost of subscriptions |
158,977 | 126,663 | 112,856 | |||||||||
| Cost of training and services |
195,401 | 182,966 | 160,343 | |||||||||
|
|
|
|
|
|
|
|||||||
| Total cost of subscription and training and services revenue |
354,378 | 309,629 | 273,199 | |||||||||
|
|
|
|
|
|
|
|||||||
| Gross profit |
2,057,425 | 1,742,601 | 1,516,290 | |||||||||
| Operating expense: |
||||||||||||
| Sales and marketing |
1,036,021 | 848,950 | 728,387 | |||||||||
| Research and development |
480,668 | 413,322 | 367,856 | |||||||||
| General and administrative |
208,491 | 192,281 | 170,053 | |||||||||
|
|
|
|
|
|
|
|||||||
| Total operating expense |
1,725,180 | 1,454,553 | 1,266,296 | |||||||||
|
|
|
|
|
|
|
|||||||
| Income from operations |
332,245 | 288,048 | 249,994 | |||||||||
| Interest income |
13,921 | 11,673 | 8,336 | |||||||||
| Interest expense |
23,822 | 23,121 | 9,394 | |||||||||
| Other (expense) income, net |
(2,164 | ) | (1,735 | ) | 6,562 | |||||||
|
|
|
|
|
|
|
|||||||
| Income before provision for income taxes |
320,180 | 274,865 | 255,498 | |||||||||
| Provision for income taxes |
66,477 | 75,500 | 75,297 | |||||||||
|
|
|
|
|
|
|
|||||||
| Net income |
$ | 253,703 | $ | 199,365 | $ | 180,201 | ||||||
|
|
|
|
|
|
|
|||||||
| Net income per share: |
||||||||||||
| Basic |
$ | 1.41 | $ | 1.09 | $ | 0.97 | ||||||
| Diluted |
$ | 1.39 | $ | 1.07 | $ | 0.95 | ||||||
| Weighted average shares outstanding: |
||||||||||||
| Basic |
179,642 | 182,817 | 186,529 | |||||||||
| Diluted |
182,961 | 186,119 | 189,246 | |||||||||
The accompanying notes are an integral part of these consolidated financial statements.
75
Table of Contents
Index to Financial Statements
RED HAT, INC.
CONSOLIDATED STATEMENTS OF COMPREHENSIVE INCOME
(in thousands)
| Fiscal Years Ended | ||||||||||||
| February 28, 2017 |
February 29, 2016 |
February 28, 2015 |
||||||||||
| Net income |
$ | 253,703 | $ | 199,365 | $ | 180,201 | ||||||
| Other comprehensive income (loss): |
||||||||||||
| Change in foreign currency translation adjustment |
(14,008 | ) | (12,790 | ) | (56,163 | ) | ||||||
| Available-for-sale securities: |
||||||||||||
| Unrealized gain (loss) on available-for-sale securities during the period |
14 | (1,593 | ) | (148 | ) | |||||||
| Reclassification for gain realized on available-for-sale securities, reported in Other income (expense), net |
(21 | ) | (4 | ) | (152 | ) | ||||||
| Tax benefit |
112 | 559 | 301 | |||||||||
|
|
|
|
|
|
|
|||||||
| Net change in available-for-sale securities (net of tax) |
105 | (1,038 | ) | 1 | ||||||||
|
|
|
|
|
|
|
|||||||
| Total other comprehensive loss |
(13,903 | ) | (13,828 | ) | (56,162 | ) | ||||||
|
|
|
|
|
|
|
|||||||
| Comprehensive income |
$ | 239,800 | $ | 185,537 | $ | 124,039 | ||||||
|
|
|
|
|
|
|
|||||||
The accompanying notes are an integral part of these consolidated financial statements.
76
Table of Contents
Index to Financial Statements
RED HAT, INC.
CONSOLIDATED STATEMENTS OF STOCKHOLDERS’ EQUITY
(in thousands)
| Common Stock | Additional Paid-In Capital |
Retained Earnings |
Treasury Stock |
Accumulated Other Comprehensive Loss |
Total Stockholders’ Equity |
|||||||||||||||||||||||
| Shares | Amount | |||||||||||||||||||||||||||
| Balance at February 28, 2014 |
230,916 | $ | 23 | $ | 1,891,848 | $ | 720,172 | $ | (1,056,419 | ) | $ | (4,459 | ) | $ | 1,551,165 | |||||||||||||
| Net income |
— | — | — | 180,201 | — | — | 180,201 | |||||||||||||||||||||
| Other comprehensive loss, net of tax |
— | — | — | — | — | (56,162 | ) | (56,162 | ) | |||||||||||||||||||
| Vest and exercise of share-based awards |
2,146 | — | 2,434 | — | — | — | 2,434 | |||||||||||||||||||||
| Common stock repurchase |
— | — | (75,000 | ) | — | (460,062 | ) | — | (535,062 | ) | ||||||||||||||||||
| Share-based compensation expense |
— | — | 135,232 | — | — | — | 135,232 | |||||||||||||||||||||
| Assumed employee share-based awards from acquisitions |
— | — | 895 | — | — | — | 895 | |||||||||||||||||||||
| Tax benefits related to share-based awards |
— | — | 6,436 | — | — | — | 6,436 | |||||||||||||||||||||
| Minimum tax withholdings paid by the Company on behalf of employees related to net settlement of employee share-based awards |
— | — | (43,462 | ) | — | — | — | (43,462 | ) | |||||||||||||||||||
| Equity component of convertible notes |
— | — | 96,890 | — | — | — | 96,890 | |||||||||||||||||||||
| Equity component of convertible notes issuance cost |
— | — | (1,833 | ) | — | — | — | (1,833 | ) | |||||||||||||||||||
| Purchase of convertible note hedges |
— | — | (148,040 | ) | — | — | — | (148,040 | ) | |||||||||||||||||||
| Proceeds from issuance of warrants |
— | — | 79,776 | — | — | — | 79,776 | |||||||||||||||||||||
| Deferred taxes related to convertible notes |
— | — | 19,868 | — | — | — | 19,868 | |||||||||||||||||||||
| Other |
— | — | (1,193 | ) | — | 1,193 | — | — | ||||||||||||||||||||
|
|
|
|
|
|
|
|
|
|
|
|
|
|
|
|||||||||||||||
| Balance at February 28, 2015 |
233,062 | $ | 23 | $ | 1,963,851 | $ | 900,373 | $ | (1,515,288 | ) | $ | (60,621 | ) | $ | 1,288,338 | |||||||||||||
|
|
|
|
|
|
|
|
|
|
|
|
|
|
|
|||||||||||||||
| Net income |
— | — | — | 199,365 | — | — | 199,365 | |||||||||||||||||||||
| Other comprehensive loss, net of tax |
— | — | — | — | — | (13,828 | ) | (13,828 | ) | |||||||||||||||||||
| Vest and exercise of share-based awards |
1,834 | — | 3,596 | — | — | — | 3,596 | |||||||||||||||||||||
| Common stock repurchase |
— | — | 75,000 | — | (337,643 | ) | — | (262,643 | ) | |||||||||||||||||||
| Share-based compensation expense |
— | — | 166,234 | — | — | — | 166,234 | |||||||||||||||||||||
| Assumed employee share-based awards from acquisitions |
— | — | 505 | — | — | — | 505 | |||||||||||||||||||||
| Tax benefits related to share-based awards |
— | — | 19,772 | — | — | — | 19,772 | |||||||||||||||||||||
| Minimum tax withholdings paid by the Company on behalf of employees related to net settlement of employee share-based awards |
— | — | (66,907 | ) | — | — | — | (66,907 | ) | |||||||||||||||||||
| Other |
— | — | 213 | — | (213 | ) | — | — | ||||||||||||||||||||
|
|
|
|
|
|
|
|
|
|
|
|
|
|
|
|||||||||||||||
| Balance at February 29, 2016 |
234,896 | $ | 23 | $ | 2,162,264 | $ | 1,099,738 | $ | (1,853,144 | ) | $ | (74,449 | ) | $ | 1,334,432 | |||||||||||||
|
|
|
|
|
|
|
|
|
|
|
|
|
|
|
|||||||||||||||
| Net income |
— | — | — | 253,703 | — | — | 253,703 | |||||||||||||||||||||
| Other comprehensive loss, net of tax |
— | — | — | — | — | (13,903 | ) | (13,903 | ) | |||||||||||||||||||
| Vest and exercise of share-based awards |
1,909 | 1 | 3,828 | — | — | — | 3,829 | |||||||||||||||||||||
| Common stock repurchase |
— | — | — | — | (458,661 | ) | — | (458,661 | ) | |||||||||||||||||||
| Share-based compensation expense |
— | — | 192,530 | — | — | — | 192,530 | |||||||||||||||||||||
| Minimum tax withholdings paid by the Company on behalf of employees related to net settlement of employee share-based awards |
— | — | (66,529 | ) | — | — | — | (66,529 | ) | |||||||||||||||||||
| Cumulative-effect adjustment from adoption of ASU 2016-09 |
— | — | 2,369 | (450 | ) | — | — | 1,919 | ||||||||||||||||||||
|
|
|
|
|
|
|
|
|
|
|
|
|
|
|
|||||||||||||||
| Balance at February 28, 2017 |
236,805 | $ | 24 | $ | 2,294,462 | $ | 1,352,991 | $ | (2,311,805 | ) | $ | (88,352 | ) | $ | 1,247,320 | |||||||||||||
|
|
|
|
|
|
|
|
|
|
|
|
|
|
|
|||||||||||||||
Note: No preferred stock was issued or outstanding during the three fiscal years ended February 28, 2017.
The accompanying notes are an integral part of these consolidated financial statements.
77
Table of Contents
Index to Financial Statements
RED HAT, INC.
CONSOLIDATED STATEMENTS OF CASH FLOWS
(in thousands)
| Fiscal Years Ended | ||||||||||||
| February 28, 2017 |
February 29, 2016 |
February 28, 2015 |
||||||||||
| Cash flows from operating activities: |
||||||||||||
| Net income |
$ | 253,703 | $ | 199,365 | $ | 180,201 | ||||||
| Adjustments to reconcile net income to net cash provided by operating activities: |
||||||||||||
| Depreciation and amortization |
85,309 | 76,088 | 76,263 | |||||||||
| Amortization of debt discount and transaction costs |
21,691 | 21,003 | 8,227 | |||||||||
| Deferred income taxes |
12,327 | (13,673 | ) | 23,517 | ||||||||
| Share-based compensation expense |
192,530 | 166,234 | 135,232 | |||||||||
| Excess tax benefits from share-based payment arrangements (1) |
— | 20,231 | 5,607 | |||||||||
| Net amortization of bond premium on debt securities available for sale |
12,623 | 12,169 | 9,314 | |||||||||
| Other |
946 | 4,418 | (3,474 | ) | ||||||||
| Changes in operating assets and liabilities net of effects of acquisitions: |
||||||||||||
| Accounts receivable |
(119,102 | ) | (48,404 | ) | (121,536 | ) | ||||||
| Prepaid expenses |
(76,787 | ) | (24,486 | ) | (40,741 | ) | ||||||
| Accounts payable and accrued expenses |
71,026 | 62,438 | 71,040 | |||||||||
| Deferred revenue |
348,534 | 260,495 | 282,693 | |||||||||
| Other |
(19,083 | ) | 445 | 2,059 | ||||||||
|
|
|
|
|
|
|
|||||||
| Net cash provided by operating activities |
783,717 | 736,323 | 628,402 | |||||||||
|
|
|
|
|
|
|
|||||||
| Cash flows from investing activities: |
||||||||||||
| Purchase of investment in debt securities available for sale |
(500,849 | ) | (982,935 | ) | (568,551 | ) | ||||||
| Proceeds from maturities of investment in debt securities available for sale |
457,710 | 652,706 | 502,365 | |||||||||
| Proceeds from sales of investment in debt securities available for sale |
43,273 | 2,916 | 77,793 | |||||||||
| Acquisitions of businesses, net of cash acquired |
(28,667 | ) | (126,459 | ) | (296,121 | ) | ||||||
| Purchase of developed software and other intangible assets |
(11,774 | ) | (13,964 | ) | (6,123 | ) | ||||||
| Purchase of property and equipment |
(69,123 | ) | (41,553 | ) | (45,648 | ) | ||||||
| Other |
(703 | ) | (2,819 | ) | 11,282 | |||||||
|
|
|
|
|
|
|
|||||||
| Net cash used in investing activities |
(110,133 | ) | (512,108 | ) | (325,003 | ) | ||||||
|
|
|
|
|
|
|
|||||||
| Cash flows from financing activities: |
||||||||||||
| Proceeds from exercise of common stock options |
3,829 | 3,596 | 2,434 | |||||||||
| Proceeds from employee stock purchase program |
18,852 | — | — | |||||||||
| Purchase of treasury stock |
(458,661 | ) | (262,643 | ) | (535,062 | ) | ||||||
| Payments related to settlement of employee shared-based awards |
(66,529 | ) | (66,907 | ) | (43,462 | ) | ||||||
| Proceeds from issuance of convertible notes, net of issuance costs |
— | — | 789,769 | |||||||||
| Purchase of convertible note hedges |
— | — | (148,040 | ) | ||||||||
| Proceeds from issuance of warrants |
— | — | 79,776 | |||||||||
| Payments on other borrowings |
(1,684 | ) | (1,843 | ) | (2,782 | ) | ||||||
|
|
|
|
|
|
|
|||||||
| Net cash (used in) provided by financing activities |
(504,193 | ) | (327,797 | ) | 142,633 | |||||||
|
|
|
|
|
|
|
|||||||
| Effect of foreign currency exchange rates on cash and cash equivalents |
(6,361 | ) | (16,113 | ) | (45,301 | ) | ||||||
|
|
|
|
|
|
|
|||||||
| Net increase (decrease) in cash and cash equivalents |
163,030 | (119,695 | ) | 400,731 | ||||||||
| Cash and cash equivalents at beginning of year |
927,778 | 1,047,473 | 646,742 | |||||||||
|
|
|
|
|
|
|
|||||||
| Cash and cash equivalents at end of year |
$ | 1,090,808 | $ | 927,778 | $ | 1,047,473 | ||||||
|
|
|
|
|
|
|
|||||||
| Supplemental cash flow information: |
||||||||||||
| Cash paid for interest |
$ | 2,080 | $ | 2,039 | $ | 52 | ||||||
| Cash paid for income taxes |
$ | 56,655 | $ | 63,400 | $ | 33,701 | ||||||
| Non-cash investing and financing activities: |
||||||||||||
| Fixed assets acquired under capital leases |
$ | 1,652 | $ | 1,892 | $ | 1,818 | ||||||
| (1) | Effective March 1, 2016, the Company adopted ASU 2016-09 which, among other items, updates the cash flow presentation of excess tax benefits related to share-based compensation. The Company elected to adopt the ASC 2016-09 updates related to cash flows on a retrospective basis. As a result, net cash provided by operating activities and net cash used in financing activities each increased by $20.2 million for the fiscal year ended February 29, 2016 and $5.6 million for the fiscal year ended February 28, 2015. For the fiscal year ended February 28, 2017, excess tax benefits from share-based payment arrangements totaled $16.0 million and are included in net income. See NOTE 2—Summary of Significant Accounting Policies for detailed information on adoption of ASU 2016-09. |
The accompanying notes are an integral part of these consolidated financial statements.
78
Table of Contents
Index to Financial Statements
RED HAT, INC.
NOTES TO CONSOLIDATED FINANCIAL STATEMENTS
NOTE 1—Company
Red Hat, Inc., incorporated in Delaware, together with its subsidiaries (“Red Hat” or the “Company”) is a leading global provider of open source software solutions, using a community-powered approach to develop and offer reliable and high-performing operating system, virtualization, management, middleware, cloud, mobile and storage technologies.
Open source software is an alternative to proprietary software and represents a different model for the development and licensing of commercial software code than that typically used for proprietary software. Because open source software code is often freely shared, there are customarily no licensing fees for the use of open source software. Therefore, the Company does not recognize revenue from the licensing of the code itself. The Company provides value to its customers through the development, aggregation, integration, testing, certification, delivery, maintenance, enhancement and support of its Red Hat technologies, and by providing a level of performance, scalability, flexibility, reliability and security for the technologies the Company packages and distributes. Moreover, because communities of developers not employed by the Company assist with the creation of the Company’s open source offerings, opportunities for further innovation of the Company’s offerings are supplemented by these communities.
The Company derives its revenue and generates cash from customers primarily from two sources: (i) subscription revenue and (ii) training and services revenue. These arrangements typically involve subscriptions to Red Hat technologies. The arrangements with the Company’s customers that produce this revenue and cash are explained in further detail in NOTE 2—Summary of Significant Accounting Policies.
NOTE 2—Summary of Significant Accounting Policies
Basis of presentation
The accompanying Consolidated Financial Statements include the accounts of the Company and all of its wholly owned subsidiaries. All significant inter-company accounts and transactions are eliminated in consolidation. There are no significant foreign exchange restrictions on the Company’s foreign subsidiaries.
The Consolidated Statements of Cash Flows as of February 29, 2016 and February 28, 2015 include the effect of retrospective application of Accounting Standards Update 2016-09, Compensation—Stock Compensation (Topic 718): Improvements to Employee Share-Based Payment Accounting (“ASU 2016-09”). Under ASU 2016-09, all windfall tax benefits related to share-based payments are reported as cash flows from operating activities along with all other income tax cash flows. Previously, windfall tax benefits from share-based payment arrangements were reported as cash flows from financing activities.
With the Company’s permitted election to retrospectively apply this classification amendment, $20.2 million and $5.6 million, respectively, of windfall tax benefits previously reported as cash inflows from financing activities on the Company’s Consolidated Statements of Cash Flows for the fiscal years ended February 29, 2016 and February 28, 2015 have been reclassified as cash inflows from operating activities.
For additional discussion related to recent accounting pronouncements the Company has either recently adopted or is currently evaluating the impact from future adoption, see “Recent accounting pronouncements” in this note.
In addition to the reclassifications resulting from application of ASU 2016-09, certain other amounts for the fiscal years ended February 29, 2016 and February 28, 2015 have been reclassified to conform to the current year presentation.
79
Table of Contents
Index to Financial Statements
RED HAT, INC.
NOTES TO CONSOLIDATED FINANCIAL STATEMENTS—(Continued)
Use of estimates
The preparation of financial statements in conformity with accounting principles generally accepted in the U.S. (“U.S. GAAP”) requires management to make estimates and assumptions that affect the reported amounts of assets and liabilities and disclosure of contingent assets and liabilities at the balance sheet dates and the reported amounts of revenue and expenses during the reporting periods. Actual results could differ from such estimates.
Revenue recognition
The Company establishes persuasive evidence of a sales arrangement for each type of revenue transaction based on either a signed contract with the end customer, a click-through contract on the Company’s website whereby the customer agrees to the Company’s standard subscription terms, signed or click-through distribution contracts with original equipment manufacturers (“OEMs”) and other resellers, or, in the case of individual training seats, through receipt of payment which indicates acceptance of the Company’s training agreement terms.
Subscription revenue
Subscription revenue is comprised of direct and indirect sales of subscriptions relating to Red Hat technologies. Accounts receivable and deferred revenue are recorded at the time a customer enters into a binding subscription agreement for the purchase of a subscription, subscription services are made available to the customer and the customer is billed. The deferred revenue amount is recognized as revenue ratably over the subscription period. Red Hat technologies are generally offered with either one or three-year base subscription periods; the majority of the Company’s subscriptions have one-year terms. Under these subscription agreements, renewal rates are generally specified for one or three-year renewal terms. Subscriptions generally entitle the end user to the technology itself and post-contract customer support, generally consisting of varying levels of support services as well as access to security updates, fixes, functionality enhancements, upgrades to the technologies, each on an if and when available basis, and compatibility with an ecosystem of certified hardware and software, during the term of the subscription. The Company sells its offerings through two principal channels: (1) direct, which includes sales by the Company’s sales force as well as web store sales, and (2) indirect, which includes certified cloud and service providers (“CCSPs”), distributors, OEMs, systems integrators and value added resellers. The Company recognizes revenue from the sale of Red Hat technologies ratably over the period of the subscription beginning on the commencement date of the subscription agreement.
Subscription arrangements with large enterprise customers often have contracts with multiple elements (e.g., software technology, support, training, consulting and other services). The Company allocates revenue to each element of the arrangement based on vendor-specific objective evidence (“VSOE”) of each element’s fair value when the Company can demonstrate sufficient evidence of the fair value of at least those elements that are undelivered. The fair value of each element in multiple element arrangements is created by either (i) providing the customer with the ability during the term of the arrangement to renew that element at the same rate paid for the element included in the initial term of the agreement or (ii) selling the element on a stand-alone basis.
The Company derives a portion of its revenue from CCSPs that provide public clouds with, and allow users to consume, computing resources as a service. The Company earns revenue based on subscription units consumed by the CCSP or its end users.
For periods prior to March 1, 2015, the Company recognized cloud-usage revenue upon receipt of usage reports from the CCSPs, which typically report fees owed to the Company one month or more after the fees have been earned. Effective March 1, 2015, the Company believed that it had sufficient historical data and experience
80
Table of Contents
Index to Financial Statements
RED HAT, INC.
NOTES TO CONSOLIDATED FINANCIAL STATEMENTS—(Continued)
to estimate this cloud-usage revenue and has begun estimating the amount of and recognizing such revenue in the period earned. The estimates are based on the historical cloud-usage data available.
Training and services revenue
Training and services revenue is comprised of revenue for consulting, engineering and customer training and education services. Consulting services consist of time-based arrangements, and revenue is recognized as these services are performed. Engineering services represent revenue earned under fixed fee arrangements with the Company’s OEM partners and other customers to provide for significant modification and customization of Red Hat technologies. The Company recognizes revenue for these fixed fee engineering services using the percentage of completion basis of accounting, provided the Company has the ability to make reliable estimates of progress towards completion, the fee for such services is fixed or determinable and collection of the resulting receivable is probable. Under the percentage of completion method, earnings under the contract are recognized based on the progress toward completion as estimated using the ratio of labor hours incurred to total expected project hours. Changes in estimates are recognized in the period in which they are known. Revenue for customer training and education services is recognized on the dates the services are complete.
Deferred selling costs
Deferred commissions are the incremental costs that are directly associated with non-cancellable subscription contracts with customers and consist of sales commissions paid to the Company’s sales force. The commissions are deferred and amortized over a period that approximates the subscription period. The commission payments are paid in full subsequent to the month in which the customer’s service commences. The deferred commission amounts are recoverable through the future revenue streams under the non-cancellable customer contracts. In addition, the Company has the ability and intent under the commission plans with its sales force to recover commissions previously paid to its sales force in the event that customers breach the terms of their subscription agreements and do not fully pay for their subscription agreements. Deferred commissions are included in Prepaid expenses and Other assets, net on the accompanying Consolidated Balance Sheets. Amortization of deferred commissions is included in sales and marketing expense in the accompanying Consolidated Statements of Operations.
Goodwill and other long-lived assets
Goodwill
The Company evaluates goodwill for impairment during the fourth quarter of its fiscal year or more frequently if events or changes in circumstances indicate that an impairment to goodwill may have occurred. For fiscal years ended February 28, 2017 and February 28, 2015, the Company applied its test for goodwill impairment as permitted by Accounting Standards Update 2011-08, Intangibles—Goodwill and Other (Topic 350): Testing Goodwill for Impairment (“ASU 2011-08”), which allows the Company to first assess qualitative factors to determine whether it is “more likely than not” that the fair value of a reporting unit is less than its carrying value. The outcome of these qualitative tests determines whether it is necessary for a company to perform the two-step goodwill impairment test as required in years prior to the adoption of ASU 2011-08.
After considering such qualitative factors as macroeconomic conditions, actual or anticipated changes to cost factors (for example, selling and delivery), overall financial performance and other Company-specific factors, such as potential changes in strategy, the Company determined that it was not more likely than not that any impairment to goodwill had occurred during the fiscal years ended February 28, 2017 and February 28, 2015. Consequently, the Company was not required to perform the remaining two-step quantitative goodwill impairment test.
81
Table of Contents
Index to Financial Statements
RED HAT, INC.
NOTES TO CONSOLIDATED FINANCIAL STATEMENTS—(Continued)
For the fiscal year ended February 29, 2016, the Company elected to perform a quantitative assessment of goodwill for all of its reporting units. In doing so, the Company compared the estimated fair value of each of the reporting units to its respective book value, including allocated goodwill. The Company concluded that there were no impairments of goodwill.
Other long-lived assets
The Company evaluates the recoverability of its property and equipment and other long-lived assets whenever events or changes in circumstances indicate that an impairment may have occurred. An impairment loss is recognized when the net book value of such assets exceeds the estimated future undiscounted cash flows attributable to the assets or the business to which the assets relate. Impairment losses, if any, are measured as the amount by which the carrying value exceeds the fair value of the assets.
Cash and cash equivalents
The Company considers highly liquid investments purchased with a maturity period of three months or less at the date of purchase to be cash equivalents.
Accounts receivable and allowance for doubtful accounts
Trade accounts receivable are recorded at the invoiced amount and do not bear interest. The allowance for doubtful accounts is the Company’s estimate of the amount of probable credit losses in the Company’s existing accounts receivable. The Company determines the allowance based on historical write-off experience. The Company reviews its allowance for doubtful accounts monthly. Past due balances over 90 days and over a specified amount are reviewed individually for collectability. All other balances are reviewed on a pooled basis by type of receivable. Account balances are charged off against the allowance when the Company determines it is probable the receivable will not be recovered. The Company does not have off-balance sheet credit exposure related to its customers. See NOTE 4—Accounts Receivable for further discussion on accounts receivable balances.
Fair value measurements
Fair value is defined as the exchange price that would be received for the purchase of an asset or paid to transfer a liability (an exit price) in the principal or most advantageous market for such asset or liability in an orderly transaction between market participants on the measurement date. Valuation techniques used to measure fair value should maximize the use of observable inputs and minimize the use of unobservable inputs. To measure fair value, the Company uses the following fair value hierarchy based on three levels of inputs, of which the first two are considered observable and the last unobservable:
Level 1—Quoted prices in active markets for identical assets or liabilities.
Level 2—Inputs other than Level 1 that are observable, either directly or indirectly, such as quoted prices for similar assets or liabilities; quoted prices in markets that are not active; or other inputs that are observable or can be corroborated by observable market data for substantially the full term of the assets or liabilities.
Level 3—Unobservable inputs that are supported by little or no market activity and are significant to the fair value of the assets or liabilities.
82
Table of Contents
Index to Financial Statements
RED HAT, INC.
NOTES TO CONSOLIDATED FINANCIAL STATEMENTS—(Continued)
The Company’s investments are comprised primarily of debt securities that are classified as available for sale and recorded at their fair market values. Liquid investments with effective maturities of three months or less at the date of purchase are classified as cash equivalents. Investments with remaining effective maturities of twelve months or less from the balance sheet date are classified as short-term investments. Investments with remaining effective maturities of more than twelve months from the balance sheet date are classified as long-term investments. The Company’s Level 1 financial instruments are valued using quoted prices in active markets for identical instruments. The Company’s Level 2 financial instruments, including derivative instruments, are valued using quoted prices for identical instruments in less active markets or using other observable market inputs for comparable instruments.
Unrealized gains and temporary losses on investments classified as available for sale are included within accumulated other comprehensive income, net of any related tax effect. Realized gains and losses are recorded using the specific identification method and upon realization, such amounts are reclassified from accumulated other comprehensive income to Other income (expense), net. Realized gains and losses and other than temporary impairments, if any, are reflected in the Company’s Consolidated Statements of Operations as Other income (expense), net. The Company does not recognize changes in the fair value of its investments in income unless a decline in value is considered other than temporary. The vast majority of the Company’s investments are priced by pricing vendors. These pricing vendors use the most recent observable market information in pricing these securities or, if specific prices are not available for these securities, use other observable inputs. In the event observable inputs are not available, the Company assesses other factors to determine the security’s market value, including broker quotes or model valuations. Independent price verifications of all holdings are performed by pricing vendors which are then reviewed by the Company. In the event a price fails a pre-established tolerance check, it is researched so that the Company can assess the cause of the variance to determine what the Company believes is the appropriate fair market value. See NOTE 17—Assets and Liabilities Measured at Fair Value on a Recurring Basis for further discussion on fair value measurements.
The Company minimizes its credit risk associated with investments by investing primarily in investment grade, liquid securities. The Company’s policy is designed to limit exposures to any one issuer depending on credit quality. Periodic evaluations of the relative credit standing of those issuers are considered in the Company’s investment strategy.
Internal use software
The Company capitalizes costs related to the development of internal use software for its website, enterprise resource planning system and systems management applications. The Company amortizes the costs of computer software developed for internal use on a straight-line basis over an estimated useful life of five years. The carrying value of internal use software is included in property and equipment on the Company’s Consolidated Balance Sheets.
Capitalized software costs
Capitalization of software development costs for products to be sold to third parties begins upon the establishment of technological feasibility and ceases when the product is available for general release. As a result of the Company’s practice of frequently releasing source code that it has developed on an on-going basis for unrestricted download on the Internet, there is generally no passage of time between achievement of technological feasibility and the availability of the Company’s product for general release. Therefore, at February 28, 2017 and February 29, 2016, the Company had no internally developed capitalized software costs for products to be sold to third parties.
83
Table of Contents
Index to Financial Statements
RED HAT, INC.
NOTES TO CONSOLIDATED FINANCIAL STATEMENTS—(Continued)
Property and equipment
Property and equipment is primarily comprised of furniture, computer and other equipment, computer software and leasehold improvements, which are recorded at cost and depreciated or amortized using the straight-line method. Expenditures for maintenance and repairs are charged to operations as incurred; major expenditures for renewals and betterments are capitalized and depreciated. Property and equipment acquired under capital leases are depreciated over the lesser of the estimated remaining useful life of the asset or the remaining term of the lease.
Share-based compensation
The Company measures share-based compensation cost as of the grant date, based on the estimated fair value of the award and recognizes the cost over the employee requisite service period typically on a straight-line basis. The Company estimates the fair value of stock options using the Black-Scholes-Merton valuation model. The fair value of nonvested share awards, nonvested share units and performance share units (“PSUs”) are measured at their underlying closing share price on the date of grant. The Company’s share-based compensation is described further in NOTE 13—Share-based Awards.
Sales and marketing expenses
Sales and marketing expenses consist of costs, including salaries, sales commissions and related expenses, such as travel, of all personnel involved in the sales and marketing process. Sales and marketing expenses also include costs of advertising, sales lead generation programs, cooperative marketing arrangements and trade shows. Payments made to resellers or other customers are recognized as a reduction of revenue unless the Company (i) receives an identifiable benefit (goods or services) in exchange for such payments that is sufficiently separable from the purchase of the Company’s products and (ii) the Company can reasonably estimate the fair value of the benefit identified. Advertising costs are expensed as incurred.
Advertising expense totaled $95.7 million, $88.9 million and $62.6 million for the fiscal years ended February 28, 2017, February 29, 2016 and February 28, 2015, respectively.
Research and development expenses
Research and development expenses include all direct costs, primarily salaries for Company personnel and outside consultants, related to the development of new software products, significant enhancements to existing software products, and the portion of costs of development of internal use software required to be expensed. Research and development costs are charged to operations as incurred.
Income taxes
The Company accounts for income taxes using the asset and liability method. Deferred tax assets and liabilities are recognized for the future tax consequences attributable to differences between the financial statement carrying amounts of existing assets and liabilities and their respective tax bases and tax credit carryforwards. Deferred tax assets and liabilities are measured using enacted tax rates expected to apply to taxable income in the years in which those temporary differences are expected to be recovered or settled.
The Company continues to assess the realizability of its deferred tax assets, which primarily consist of share-based compensation expense deductions, tax credit carryforwards and deferred revenue. In assessing the realizability of these deferred tax assets, management considers whether it is more likely than not that some
84
Table of Contents
Index to Financial Statements
RED HAT, INC.
NOTES TO CONSOLIDATED FINANCIAL STATEMENTS—(Continued)
portion or all of the deferred tax assets will be realized. The Company continues to maintain a valuation allowance against its deferred tax assets with respect to certain foreign net operating loss (“NOL”) carryforwards.
With respect to foreign earnings, it is the Company’s policy to invest the earnings of foreign subsidiaries indefinitely outside the U.S. From time to time, however, the Company may remit a portion of these earnings to the extent it incurs no additional U.S. tax and it is otherwise feasible.
Because tax laws are complex and subject to different interpretations, significant judgment is required. As a result, the Company makes certain estimates and assumptions in (i) calculating its income tax expense, deferred tax assets and deferred tax liabilities, (ii) determining any valuation allowance recorded against deferred tax assets and (iii) evaluating the amount of unrecognized tax benefits, as well as the interest and penalties related to such uncertain tax positions. The Company’s estimates and assumptions may differ significantly from tax benefits ultimately realized. The Company’s income tax expense and deferred taxes are described further in NOTE 11—Income Taxes.
Foreign currency translation
The Euro has been determined to be the primary functional currency for the Company’s European operations, and local currencies have been determined to be the functional currencies for the Company’s Asia Pacific and Latin American operations. Foreign exchange gains and losses, which result from the process of remeasuring foreign currency transactions into the appropriate functional currency, are included in Other income (expense), net in the Company’s Consolidated Statements of Operations.
The impact of changes in foreign currency exchange rates resulting from the translation of foreign currency financial statements into U.S. dollars for financial reporting purposes is included in other comprehensive income, which is a separate component of stockholders’ equity. Assets and liabilities are translated into U.S. dollars at exchange rates in effect at the balance sheet date. Income and expense items are translated at average rates for the period.
Customers and credit risk
Financial instruments, which potentially subject the Company to concentrations of credit risk, consist principally of cash, cash equivalents, investments and trade receivables. The Company primarily places its cash, cash equivalents and investments with high-credit quality financial institutions which invest predominantly in U.S. government instruments, investment grade corporate bonds and certificates of deposit guaranteed by banks that are members of the Federal Deposit Insurance Corporation. Cash deposits are primarily in financial institutions in the U.S. and the United Kingdom. However, cash for monthly operating costs of international operations are deposited in banks outside the U.S.
The Company performs credit evaluations to reduce credit risk and generally requires no collateral from its customers. Management estimates the allowance for uncollectible accounts based on its historical experience and credit evaluation. The Company’s standard credit terms are net 30 days in North America, net 30 to net 45 days in EMEA (Europe, Middle East and Africa) and Latin America, and range from net 30 to net 60 days in Asia Pacific (principally Australia, China, India, Japan, Singapore and South Korea).
Net income per common share
The Company computes basic net income per common share by dividing net income available to common stockholders by the weighted average number of common shares outstanding. Diluted net income per common
85
Table of Contents
Index to Financial Statements
RED HAT, INC.
NOTES TO CONSOLIDATED FINANCIAL STATEMENTS—(Continued)
share is computed by dividing net income by the weighted average number of common shares and dilutive potential common share equivalents then outstanding. Potential common share equivalents consist of shares issuable upon the exercise of stock options or vesting of share-based awards.
With respect to the Company’s 0.25% convertible senior notes due 2019 (the “convertible notes”), the Company has the option to pay cash or deliver, as the case may be, either cash, shares of its common stock or a combination of cash and shares of its common stock for the aggregate amount due upon conversion of the convertible notes. The Company’s intent is to settle the principal amount of the convertible notes in cash upon conversion. As a result, upon conversion of the convertible notes, only the amounts payable in excess of the principal amounts of the notes are considered in diluted earnings per share under the treasury stock method. See NOTE 21—Convertible Notes for detailed information on the convertible notes.
Segment reporting
The Company is organized primarily on the basis of three geographic business units: the Americas (U.S., Latin America and Canada), EMEA and Asia Pacific. These business units are aggregated into one reportable segment due to the similarity in nature of products and services provided, financial performance economic characteristics (e.g., revenue growth and gross margin), methods of production and distribution and customer classes (e.g., cloud service providers, distributors, resellers and enterprise).
The Company has offices in more than 90 locations around the world. The Company manages its international business on an Americas-wide, EMEA-wide and Asia Pacific-wide basis. See NOTE 19—Segment Reporting for further discussion.
Recent accounting pronouncements
Accounting pronouncements adopted
In March 2016, the Financial Accounting Standards Board (“FASB”) issued ASU 2016-09 to simplify several aspects of the accounting for share-based compensation, including the income tax consequences. This guidance is effective for the Company as of the first quarter of the fiscal year ending February 28, 2018. However, the Company elected to early adopt ASU 2016-09 effective March 1, 2016.
Impact to Consolidated Statements of Operations. One of the more significant impacts of adopting ASU 2016-09 is the required change in how the Company recognizes the excess tax benefits (“windfalls”) or deficiencies (“shortfalls”) related to share-based compensation. For example, prior to adopting ASU 2016-09, such windfalls and shortfalls were credited or charged, respectively, to additional paid-in capital in the Company’s Consolidated Balance Sheets. Under ASU 2016-09, these windfalls and shortfalls are recognized as a discrete tax benefit or discrete tax expense, respectively, in the Company’s Consolidated Statements of Operations. For the fiscal year ended February 28, 2017, the Company recognized a discrete tax benefit of $15.8 million related to net windfall tax benefits from share-based compensation.
ASU 2016-09 requires companies to adopt the amendment related to accounting for windfalls and shortfalls on a prospective basis only. As a result, no change has been made to the Consolidated Statements of Operations for the fiscal years ended February 29, 2016 and February 28, 2015 related to the $19.8 million and $6.4 million, respectively, of net windfall tax benefits the Company recognized as additional paid-in capital during the fiscal years ended February 29, 2016 and February 28, 2015. Net windfall tax benefits of $19.8 million recognized as additional paid-in capital during the fiscal year ended February 29, 2016 includes gross windfall tax benefits of $20.2 million net of $0.5 million shortfall tax expense. Net windfall tax benefits of $5.4 million recognized
86
Table of Contents
Index to Financial Statements
RED HAT, INC.
NOTES TO CONSOLIDATED FINANCIAL STATEMENTS—(Continued)
within additional paid-in capital during the fiscal year ended February 28, 2015 includes gross windfall tax benefits of $5.6 million net of $0.3 million shortfall tax expense.
Impact to Consolidated Statements of Cash Flows. In addition to the income tax consequences described above, under ASU 2016-09 all windfall tax benefits related to share-based payments are reported as cash flows from operating activities along with all other income tax cash flows. Previously, windfall tax benefits from share-based payment arrangements were reported as cash flows from financing activities.
With respect to the classification of windfall tax benefits on the statement of cash flows, ASU 2016-09 allows companies to elect either a prospective or retrospective application. The Company has elected to apply this classification amendment retrospectively. As a result, $20.2 million and $5.6 million, respectively, of windfall tax benefits previously reported as cash flows from financing activities on the Company’s Consolidated Statements of Cash Flows for the fiscal years ended February 29, 2016 and February 28, 2015 have been reclassified as cash flows from operating activities.
Impact to Consolidated Balance Sheets. ASU 2016-09 requires that certain other amendments relevant to the Company be applied using a modified-retrospective transition method by means of a cumulative-effect adjustment to retained earnings as of the beginning of the period in which the guidance is adopted. As a result of adopting ASU 2016-09 during the fiscal year ended February 28, 2017, the Company adjusted retained earnings for amendments related to (i) the timing of when unrealized net windfall tax benefits are recognized and (ii) an entity-wide accounting policy election to recognize share-based award forfeitures only as they occur rather than estimate by applying a forfeiture rate. The following table summarizes the impact to the Company’s Consolidated Balance Sheet, including the net amount charged to retained earnings as of March 1, 2016 (in thousands):
| As of March 1, 2016 | ||||||
| Balance Sheet Classification | Amount | |||||
| Increase to additional paid-in capital resulting from the Company’s election to recognize forfeitures as they occur rather than applying an estimated forfeiture rate |
Additional paid-in capital | $ | 2,369 | |||
| Recognition of deferred tax assets related to cumulative-effect adjustment from the Company’s election to recognize forfeitures as they occur |
Deferred tax assets, net | $ | 603 | |||
| Recognition of deferred tax assets related to certain unrealized net windfall tax benefits from share-based compensation |
Deferred tax assets, net | $ | 1,316 | |||
| Net charge to retained earnings for cumulative-effect adjustment from adoption of ASU 2016-09 |
Retained earnings | $ | 450 | |||
In August 2014, the FASB issued Accounting Standards Update 2014-15, Presentation of Financial Statements—Going Concern (Subtopic 205-40), Disclosure of Uncertainties about an Entity’s Ability to Continue as a Going Concern (“ASU 2014-15”). This standard sets forth management’s responsibility to evaluate, each reporting period, whether there is substantial doubt about the Company’s ability to continue as a going concern, and if so, to provide related footnote disclosures. This guidance is effective for the Company as of February 28, 2017. The Company early adopted ASU 2014-15 and performed its evaluation during the fourth quarter of its fiscal year ended February 28, 2017. As a result of this evaluation, the Company does not have substantial doubt about its ability to continue as a going concern.
87
Table of Contents
Index to Financial Statements
RED HAT, INC.
NOTES TO CONSOLIDATED FINANCIAL STATEMENTS—(Continued)
Accounting pronouncements being evaluated
In January 2017, the FASB issued Accounting Standards Update 2017-04, Intangibles—Goodwill and Other (Topic 350): Simplifying the Test for Goodwill Impairment (“ASU 2017-04”). The FASB issued ASU 2017-04 to simplify the subsequent measurement of goodwill by eliminating Step 2 from the goodwill impairment test. Under this updated standard, an entity should recognize an impairment charge for the amount by which the carrying amount exceeds the reporting unit’s fair value, but the loss recognized should not exceed the total amount of goodwill allocated to that reporting unit. An entity also should consider income tax effects from any tax-deductible goodwill on the carrying amount of the reporting unit when measuring the goodwill impairment loss, if any. The FASB also eliminated the requirement for reporting units with a zero or negative carrying amount to first perform a qualitative assessment. This guidance is effective for the Company as of the first quarter of its fiscal year ending February 29, 2020. The Company is currently evaluating the impact that this updated standard, but does not believe this update will have a significant impact on its consolidated financial statements.
In August 2016, the FASB issued Accounting Standards Update 2016-15, Statement of Cash Flows (Topic 230): Classification of Certain Cash Receipts and Cash Payments (“ASU 2016-15”). The FASB issued ASU 2016-15 to decrease the diversity in practice in how certain cash receipts and cash payments are presented and classified in the statement of cash flows. The amendments in this update provide guidance on eight specific cash flow issues. This guidance is effective for the Company as of the first quarter of its fiscal year ending February 28, 2019 and should be applied using the retrospective transition method to each period presented. Early adoption is permitted but all amendments must be adopted in the same period. The Company is currently evaluating the impact that this updated standard will have on its consolidated financial statements.
In February 2016, the FASB issued Accounting Standards Update 2016-02, Leases (Topic 842) (“ASU 2016-02”). The FASB issued ASU 2016-02 to increase transparency and comparability among organizations with respect to accounting for leases. Under ASU 2016-02, lessees will recognize a right-of-use asset and a lease liability for virtually all of their leases (other than leases that meet the definition of a short-term lease). The liability will be equal to the present value of lease payments. The asset will be based on the liability, subject to adjustment, such as for initial direct costs. For income statement purposes, the FASB retained a dual model, requiring leases to be classified as either operating or finance. This guidance is effective for the Company as of the first quarter of its fiscal year ending February 28, 2019. The Company is currently evaluating the impact that this updated standard will have on its consolidated financial statements.
In January 2016, the FASB issued Accounting Standards Update 2016-01, Financial Instruments—Overall (Subtopic 825-10): Recognition and Measurement of Financial Assets and Financial Liabilities (“ASU 2016-01”). The FASB issued ASU 2016-01 to require equity investments with readily determinable fair values to be measured at fair value with changes in fair value recognized in net income. Equity investments that do not have readily determinable fair values are allowed to be remeasured upon the occurrence of an observable price change or upon identification of an impairment. This guidance is effective for the Company as of the first quarter of the fiscal year ending February 28, 2019. The Company is currently evaluating the impact that this updated standard will have on its consolidated financial statements.
In May 2014, the FASB issued Accounting Standards Update 2014-09, Revenue from Contracts with Customers, now referred to as Accounting Standards Codification Topic 606 (“ASC 606”). The FASB issued ASC 606 to clarify the principles for recognizing revenue and to develop a common revenue standard for U.S. GAAP and International Financial Reporting Standards. The standard outlines a single comprehensive model for entities to use in accounting for revenue arising from contracts with customers and supersedes the most current revenue recognition guidance. This guidance is effective for the Company beginning the first quarter of its fiscal
88
Table of Contents
Index to Financial Statements
RED HAT, INC.
NOTES TO CONSOLIDATED FINANCIAL STATEMENTS—(Continued)
year ending February 28, 2019. The standard must be adopted using either a full retrospective approach for all periods presented in the period of adoption or a modified retrospective approach.
The Company has substantially completed its preliminary assessment of the potential impact that the implementation of this updated standard will have on its consolidated financial statements. With respect to the Company’s software subscription offerings, which accounted for 89%, 88%, and 87% of the Company’s total revenue for the fiscal years ended February 28, 2017, February 29, 2016 and February 28, 2015, respectively, the Company provides value to its customers through continuous aggregation, integration, testing, certification, maintenance, enhancement and support of the open source technologies that it distributes. The Company currently recognizes subscription revenue ratably over the subscription period. Under the updated standard, these subscription attributes represent a series of performance obligations that are delivered over time, primarily on a stand-ready basis (for example, attributes such as updates, upgrades, and support are not forced upon subscribers but rather made available to subscribers). As a result, the Company believes that its subscription revenue meets the criteria for revenue recognition over time and will continue to be recognized ratably under the updated standard.
The Company also offers professional consulting and training services that are designed to help customers derive additional value from Red Hat technologies. Under the updated guidance, revenue from professional consulting and training services that were previously sold on a standalone basis will continue to be recognized over time as the Company satisfies its performance obligations by delivering and transferring such services to the customer.
With respect to customer contracts with multiple elements (such as software subscriptions and professional consulting and training services), under the current standard the Company allocates total contract revenue to each element’s relative fair value when the Company can demonstrate sufficient VSOE of the fair value of at least those elements that are undelivered. For multiple-element contracts in which one or more of the undelivered elements lacks VSOE, the Company defers recognition of any revenue until the elements lacking VSOE have been delivered. However, under the updated standard, the Company will be required to allocate total contract revenue to each element (referred to as a distinct performance obligation under the updated standard) based on either an established or estimated standalone selling price. The Company would then recognize the allocated revenue as each element (performance obligation) is delivered. Because the Company has historically established VSOE for most of its offerings and as a result has not been required to defer a significant amount of revenue due to insufficient VSOE, the Company does not anticipate the updated standard’s requirement to establish or estimate a standalone selling price, rather than defer revenues in the absence of VSOE, to have a significant impact on the Company’s financial statements.
The Company continues to assess the impact of the updated guidance, including for example, any potential changes to and investments in the Company’s policies, processes, systems and internal controls over financial reporting that may be required to comply with new guidance related to variable consideration, contract modifications, allocation of discounts and expanded disclosures. The Company has not yet finalized its decision with respect to transition method.
NOTE 3—Business Combinations
Acquisition of 3scale, Inc.
On June 24, 2016, the Company completed its acquisition of all of the shares of 3scale, Inc. (“3scale”), a provider of application programming interface (“API”) management technology. By adding 3scale to its existing portfolio, including Red Hat JBoss Middleware, Red Hat OpenShift and Red Hat Mobile Application Platform, the Company strengthens its enablement of the API economy with simplified cloud integration and microservices-based architectures.
89
Table of Contents
Index to Financial Statements
RED HAT, INC.
NOTES TO CONSOLIDATED FINANCIAL STATEMENTS—(Continued)
The consideration paid was $29.1 million in cash. Management has completed its assessment of the acquisition-date fair value of the assets acquired and liabilities assumed. The total consideration transferred of $29.1 million was allocated to the Company’s assets and liabilities as follows: $16.9 million to goodwill, $13.1 million to identifiable intangible assets and $0.9 million to working capital as a net current liability.
The Company incurred approximately $1.8 million in transaction costs, including legal and accounting fees, relating to the acquisition. These transaction costs have been expensed as incurred and included in general and administrative expense on the Company’s Consolidated Statements of Operations for the fiscal year ended February 28, 2017.
Acquisition of Ansible, Inc.
On October 16, 2015, the Company completed its acquisition of all of the shares of Ansible, Inc. (“Ansible”). Ansible is a provider of IT automation solutions that allows its users to manage applications across hybrid cloud environments. The acquisition augments the Company’s management portfolio and help customers to deploy and manage applications across private and public clouds, speed service delivery through development and operations initiatives, streamline OpenStack installations and upgrades and accelerate container adoption by simplifying orchestration and configuration.
The consideration paid was $126.0 million and includes $125.2 million of cash. Management has completed its assessment of the acquisition-date fair value of the assets acquired and liabilities assumed. The total consideration transferred of $126.0 million has been allocated to the Company’s assets and liabilities as follows: $102.3 million to goodwill, $25.1 million to identifiable intangible assets and $1.4 million to working capital as a net current liability.
The Company incurred approximately $3.9 million in transaction costs, including legal and accounting fees, relating to the acquisition. These transaction costs have been expensed as incurred and included in general and administrative expense on the Company’s Consolidated Statements of Operations for the fiscal year ended February 29, 2016.
Acquisition of FeedHenry Ltd.
On October 8, 2014, the Company completed its acquisition of all of the shares of FeedHenry Ltd. (“FeedHenry”). FeedHenry is a provider of cloud-based enterprise mobile application platforms. The acquisition expands the Company’s portfolio of application development, integration and platform-as-a-service solutions, enabling the Company to support mobile application development in public and private environments.
The consideration paid as of the closing date was $80.2 million and has been allocated to the Company’s assets and liabilities as follows: $68.5 million to goodwill, $9.0 million to identifiable intangible assets and the remaining $2.7 million to net working capital.
The Company incurred approximately $1.1 million in transaction costs, including legal and accounting fees, relating to the acquisition. These transaction costs have been expensed as incurred and included in general and administrative expense on the Company’s Consolidated Statements of Operations for the fiscal year ended February 28, 2015.
90
Table of Contents
Index to Financial Statements
RED HAT, INC.
NOTES TO CONSOLIDATED FINANCIAL STATEMENTS—(Continued)
Acquisition of eNovance, SAS
On June 24, 2014, the Company completed its acquisition of all of the shares of eNovance, SAS (“eNovance”), a provider of open source cloud computing services. The acquisition assists in advancing the Company’s market position in OpenStack, and the addition of eNovance’s systems integration capabilities and engineering talent is expected to help meet growing demand for enterprise OpenStack consulting, design and deployment.
The consideration paid was $67.6 million and has been allocated to the Company’s assets and liabilities as follows: $60.8 million to goodwill, $5.3 million to identifiable intangible assets and the remaining $1.5 million to net working capital.
In addition to the cash consideration transferred, the Company issued a total of 529,057 restricted common shares to certain employee-shareholders. The vesting of these restricted shares is conditioned on continued employment with the Company. As a result of the employment condition, the transfer of these shares has been accounted for apart from the business combination.
The Company incurred approximately $0.9 million in transaction costs, including legal and accounting fees, relating to the acquisition. These transaction costs have been expensed as incurred and included in general and administrative expense on the Company’s Consolidated Statements of Operations for the fiscal year ended February 28, 2015.
Acquisition of Inktank Storage, Inc.
On April 30, 2014, the Company completed its acquisition of all of the shares of Inktank Storage, Inc. (“Inktank”), a provider of scale-out, open source storage systems, whose flagship technology, Inktank Ceph Enterprise, delivers object and block storage software to enterprises deploying public or private clouds. The acquisition complements the Company’s existing GlusterFS-based storage offering.
The consideration paid was $152.5 million and has been allocated to the Company’s assets and liabilities as follows: $131.4 million to goodwill, $10.8 million to identifiable intangible assets and the remaining $10.3 million to net working capital.
The Company incurred approximately $2.0 million in transaction costs, including legal and accounting fees, relating to the acquisition. These transaction costs have been expensed as incurred and included in general and administrative expense on the Company’s Consolidated Statements of Operations for the fiscal year ended February 28, 2015.
Pro forma consolidated financial information (unaudited)
The following unaudited pro forma consolidated financial information reflects the results of operations of the Company (in thousands, except per share amounts) as if the acquisition of 3scale, Ansible, FeedHenry, eNovance and Inktank had closed on March 1, 2014, after giving effect to certain purchase accounting adjustments. These pro forma results are not necessarily indicative of what the Company’s operating results would have been had the acquisitions actually taken place at the beginning of the period. Pro forma consolidated financial information for the fiscal year ended February 28, 2017 has not been provided because the acquisition
91
Table of Contents
Index to Financial Statements
RED HAT, INC.
NOTES TO CONSOLIDATED FINANCIAL STATEMENTS—(Continued)
of 3scale would not have had a significant impact on consolidated operating results if the acquisition had closed on March 1, 2016.
| Fiscal Years Ended | ||||||||
| February 29, 2016 |
February 28, 2015 |
|||||||
| Revenue |
$ | 2,057,565 | $ | 1,797,959 | ||||
| Net income |
188,825 | 158,467 | ||||||
| Basic net income per common share |
$ | 1.03 | $ | 0.85 | ||||
| Diluted net income per common share |
$ | 1.01 | $ | 0.84 | ||||
Goodwill and other business combinations
The Company completed its annual goodwill impairment tests for the fiscal years ended February 28, 2017, February 29, 2016 and February 28, 2015. No goodwill impairment was deemed to have occurred for any of the fiscal years. The following is a summary of goodwill (in thousands):
| February 28, 2017 |
February 29, 2016 |
February 28, 2015 |
||||||||||
| Balance at beginning of year |
$ | 1,027,277 | $ | 927,060 | $ | 687,430 | ||||||
| Acquisitions |
16,923 | 102,260 | 260,786 | |||||||||
| Impact of foreign currency fluctuations |
(3,636 | ) | (3,493 | ) | (21,156 | ) | ||||||
| Other adjustments |
145 | 1,450 | — | |||||||||
|
|
|
|
|
|
|
|||||||
| Balance at end of year |
$ | 1,040,709 | $ | 1,027,277 | $ | 927,060 | ||||||
|
|
|
|
|
|
|
|||||||
The excess of purchase price paid for acquisitions over the fair value of the net assets acquired was recognized as goodwill. Goodwill comprises the majority of the purchase price paid for each of the acquired businesses because these businesses were focused on emerging technologies such as development and operations automation, mobile technologies, cloud-enabling technologies and software-defined storage technologies, which consequently—at the time of acquisition—generated relatively little revenue. However, these acquired businesses, with their assembled, highly-specialized workforces and community of contributors, are expected to both expand the Company’s existing technology portfolio and advance the Company’s market position overall in open source solutions.
NOTE 4—Accounts Receivable
Accounts receivable are presented net of an allowance for doubtful accounts. Activity in the Company’s allowance for doubtful accounts is presented in the following table (in thousands):
| Fiscal year ended |
Balance at beginning of period |
Charged to (recovery of) expense |
Adjustments (1) | Balance at end of period |
||||||||||||
| February 28, 2015 |
$ | 1,986 | 469 | (208 | ) | $ | 2,247 | |||||||||
| February 29, 2016 |
$ | 2,247 | 1,323 | (772 | ) | $ | 2,798 | |||||||||
| February 28, 2017 |
$ | 2,798 | (140 | ) | 133 | $ | 2,791 | |||||||||
| (1) | Represents foreign currency translation adjustments and amounts written-off as uncollectible accounts receivable. |
92
Table of Contents
Index to Financial Statements
RED HAT, INC.
NOTES TO CONSOLIDATED FINANCIAL STATEMENTS—(Continued)
As of February 28, 2017 and February 29, 2016, no individual customer accounted for 10% or more of the Company’s accounts receivable.
NOTE 5—Prepaid Expenses
Prepaid expenses include sales commissions, which are the incremental costs that are directly associated with non-cancellable subscription contracts with customers and consist of sales commissions paid to the Company’s sales force. The commissions are deferred and amortized over a period to approximate the period of the subscription term. For further discussion on deferred commissions see NOTE 2—Summary of Significant Accounting Policies. Prepaid expenses, including sales commissions, were comprised of the following (in thousands):
| February 28, 2017 |
February 29, 2016 |
|||||||
| Deferred commissions |
$ | 147,695 | $ | 102,254 | ||||
| Professional services |
24,135 | 21,160 | ||||||
| Taxes |
10,734 | 15,819 | ||||||
| Insurance |
2,166 | 2,160 | ||||||
| Other |
15,879 | 9,484 | ||||||
|
|
|
|
|
|||||
| Total prepaid expenses |
$ | 200,609 | $ | 150,877 | ||||
|
|
|
|
|
|||||
NOTE 6—Property and Equipment
The Company’s property and equipment is recorded at cost and consists of the following (in thousands):
| Estimated Useful Life (Years) |
February 28, 2017 |
February 29, 2016 |
||||||||||
| Computer and other equipment |
3-5 | $ | 155,615 | $ | 135,342 | |||||||
| Software, including software developed for internal use |
5 | 93,727 | 85,517 | |||||||||
| Furniture and fixtures |
7 | 32,260 | 28,800 | |||||||||
| Leasehold improvements |
up to 15 | 124,060 | 104,045 | |||||||||
| Property and equipment—in progress |
— | 15,500 | 8,001 | |||||||||
|
|
|
|
|
|||||||||
| Property and equipment |
421,162 | 361,705 | ||||||||||
| Less: accumulated depreciation |
(231,533 | ) | (194,819 | ) | ||||||||
|
|
|
|
|
|||||||||
| Property and equipment, net |
$ | 189,629 | $ | 166,886 | ||||||||
|
|
|
|
|
|||||||||
Property and equipment is depreciated or amortized using the straight-line method over the respective asset’s estimated useful life. Leasehold improvements are depreciated up to 15 years, over the lesser of the estimated remaining useful life of the asset or the remaining term of the lease. Depreciation expense recognized in the Company’s Consolidated Financial Statements is summarized as follows (in thousands):
| Fiscal Years Ended | ||||||||||||
| February 28, 2017 |
February 29, 2016 |
February 28, 2015 |
||||||||||
| Total depreciation expense |
$ | 54,077 | $ | 48,909 | $ | 48,001 | ||||||
|
|
|
|
|
|
|
|||||||
93
Table of Contents
Index to Financial Statements
RED HAT, INC.
NOTES TO CONSOLIDATED FINANCIAL STATEMENTS—(Continued)
NOTE 7—Identifiable Intangible Assets
Identifiable intangible assets consist primarily of trademarks, copyrights and patents, purchased technologies, customer and reseller relationships, and covenants not to compete, all of which are amortized over the estimated useful life, generally on a straight-line basis, with the exception of customer and reseller relationships, which are generally amortized over the greater of straight-line or the related asset’s pattern of economic benefit. Useful lives range from two to 10 years. As of February 28, 2017 and February 29, 2016, trademarks with an indefinite estimated useful life totaled $10.9 million and $11.1 million, respectively. The following is a summary of identifiable intangible assets (in thousands):
| February 28, 2017 | February 29, 2016 | |||||||||||||||||||||||
| Gross Amount |
Accumulated Amortization |
Net Amount |
Gross Amount |
Accumulated Amortization |
Net Amount |
|||||||||||||||||||
| Trademarks, copyrights and patents |
$ | 148,850 | $ | (59,440 | ) | $ | 89,410 | $ | 138,106 | $ | (49,876 | ) | $ | 88,230 | ||||||||||
| Purchased technologies |
107,078 | (80,536 | ) | 26,542 | 96,105 | (70,940 | ) | 25,165 | ||||||||||||||||
| Customer and reseller relationships |
104,438 | (88,046 | ) | 16,392 | 104,593 | (80,329 | ) | 24,264 | ||||||||||||||||
| Covenants not to compete |
14,081 | (12,329 | ) | 1,752 | 13,240 | (9,875 | ) | 3,365 | ||||||||||||||||
| Other intangible assets |
8,833 | (5,162 | ) | 3,671 | 8,833 | (3,786 | ) | 5,047 | ||||||||||||||||
|
|
|
|
|
|
|
|
|
|
|
|
|
|||||||||||||
| Total identifiable intangible assets |
$ | 383,280 | $ | (245,513 | ) | $ | 137,767 | $ | 360,877 | $ | (214,806 | ) | $ | 146,071 | ||||||||||
|
|
|
|
|
|
|
|
|
|
|
|
|
|||||||||||||
The following is a summary of the change in identifiable intangible assets (in thousands):
| Balance at February 29, 2016 |
$ | 146,071 | ||
| Purchase of identifiable intangible assets from 3scale, primarily developed technologies |
13,130 | |||
| Purchase of developed software and other intangible assets |
11,038 | |||
| Amortization expense |
(31,232 | ) | ||
| Impact of foreign currency fluctuations and other adjustments |
(1,240 | ) | ||
|
|
|
|||
| Balance at February 28, 2017 |
$ | 137,767 | ||
|
|
|
Amortization expense associated with identifiable intangible assets recognized in the Company’s Consolidated Financial Statements is summarized as follows (in thousands):
| Fiscal Years Ended | ||||||||||||
| February 28, 2017 |
February 29, 2016 |
February 28, 2015 |
||||||||||
| Cost of revenue |
$ | 16,938 | $ | 13,102 | $ | 12,049 | ||||||
| Sales and marketing |
7,078 | 8,075 | 7,838 | |||||||||
| Research and development |
138 | 842 | 2,417 | |||||||||
| General and administrative |
7,078 | 5,160 | 5,958 | |||||||||
|
|
|
|
|
|
|
|||||||
| Total amortization expense |
$ | 31,232 | $ | 27,179 | $ | 28,262 | ||||||
|
|
|
|
|
|
|
|||||||
94
Table of Contents
Index to Financial Statements
RED HAT, INC.
NOTES TO CONSOLIDATED FINANCIAL STATEMENTS—(Continued)
As of February 28, 2017, future amortization expense on existing intangibles is as follows (in thousands):
| Fiscal Year |
Amortization Expense of Intangible Assets |
|||
| 2018 |
$ | 27,392 | ||
| 2019 |
22,170 | |||
| 2020 |
18,371 | |||
| 2021 |
11,867 | |||
| 2022 |
7,241 | |||
| Thereafter |
39,840 | |||
|
|
|
|||
| Total amortization expense |
$ | 126,881 | ||
|
|
|
|||
NOTE 8—Other Assets, Net
Other assets, net were comprised of the following (in thousands):
| February 28, 2017 |
February 29, 2016 |
|||||||
| Deferred commissions, non-current |
$ | 38,842 | $ | 8,722 | ||||
| Cost-basis investments |
14,778 | 16,079 | ||||||
| Prepaid expenses, non-current |
12,209 | 12,553 | ||||||
| Security deposits and other |
8,276 | 7,152 | ||||||
|
|
|
|
|
|||||
| Other assets, net |
$ | 74,105 | $ | 44,506 | ||||
|
|
|
|
|
|||||
The Company reviews its non-marketable cost-basis investments in equity securities for other than temporary declines in fair value based on prices recently paid for shares in that company, as well as changes in market conditions. The carrying values are not necessarily representative of the amounts that the Company could realize in a current transaction. The Company recognized losses of $2.0 million, $2.8 million and $4.6 million on certain investments during the fiscal years ended February 28, 2017, February 29, 2016 and February 28, 2015, respectively.
NOTE 9—Accounts Payable and Accrued Expenses
Accounts payable and accrued expenses were comprised of the following (in thousands):
| February 28, 2017 |
February 29, 2016 |
|||||||
| Accounts payable |
$ | 76,197 | $ | 63,268 | ||||
| Accrued wages and other compensation-related expenses |
212,184 | 137,738 | ||||||
| Accrued other trade payables |
43,781 | 45,785 | ||||||
| Accrued income and other taxes payable |
44,032 | 37,069 | ||||||
| Accrued other |
763 | 942 | ||||||
|
|
|
|
|
|||||
| Total accounts payable and accrued expenses |
$ | 376,957 | $ | 284,802 | ||||
|
|
|
|
|
|||||
95
Table of Contents
Index to Financial Statements
RED HAT, INC.
NOTES TO CONSOLIDATED FINANCIAL STATEMENTS—(Continued)
NOTE 10—Derivative Instruments
The Company transacts business in various foreign countries and is, therefore, subject to risk of foreign currency exchange rate fluctuations. The Company from time to time enters into forward contracts to economically hedge transactional exposure associated with commitments arising from trade accounts receivable, trade accounts payable and fixed purchase obligations denominated in a currency other than the functional currency of the respective operating entity. All derivative instruments are recorded on the Consolidated Balance Sheets at their respective fair market values. The Company has elected not to prepare and maintain the documentation required to qualify for hedge accounting treatment and, therefore, changes in fair value are recorded in the Consolidated Statements of Operations. See NOTE 17—Assets and Liabilities Measured at Fair Value on a Recurring Basis for information regarding the fair value hierarchy of derivative instruments.
The effects of derivative instruments on the Company’s Consolidated Financial Statements are as follows (in thousands):
| Fiscal Year Ended February 28, 2017 |
||||||||||||||||
| As of February 28, 2017 |
Classification of Gain (Loss) Recognized in Income on Derivatives |
Amount of
Gain (Loss) Recognized in Income on Derivatives |
||||||||||||||
| Balance |
Fair Value |
Notional Value |
||||||||||||||
| Assets—foreign currency forward contracts not designated as |
Other current assets | $ | 135 | $ | 15,151 | Other income (expense), net | $ | 3,663 | ||||||||
| Liabilities—foreign currency |
Accounts payable and accrued expenses | (160 | ) | 33,670 | Other income (expense), net | (2,970 | ) | |||||||||
|
|
|
|
|
|
|
|||||||||||
| Total |
$ | (25 | ) | $ | 48,821 | $ | 693 | |||||||||
|
|
|
|
|
|
|
|||||||||||
| Fiscal Year Ended February 29, 2016 |
||||||||||||||||
| As of February 29, 2016 |
Classification of Gain (Loss) Recognized in Income on Derivatives |
Amount of
Gain (Loss) Recognized in Income on Derivatives |
||||||||||||||
| Balance |
Fair Value |
Notional Value |
||||||||||||||
| Assets—foreign currency forward contracts not designated as hedges |
Other current assets | $ | 566 | $ | 31,390 | Other income (expense), net | $ | 1,226 | ||||||||
| Liabilities—foreign currency forward contracts not designated as hedges |
Accounts payable and accrued expenses | (452 | ) | 41,214 | Other income (expense), net | (1,195 | ) | |||||||||
|
|
|
|
|
|
|
|||||||||||
| Total |
$ | 114 | $ | 72,604 | $ | 31 | ||||||||||
|
|
|
|
|
|
|
|||||||||||
96
Table of Contents
Index to Financial Statements
RED HAT, INC.
NOTES TO CONSOLIDATED FINANCIAL STATEMENTS—(Continued)
NOTE 11—Income Taxes
Components of income tax expense
The U.S. and foreign components of the Company’s income before provision for income taxes consisted of the following (in thousands):
| Fiscal Years Ended | ||||||||||||
| February 28, 2017 |
February 29, 2016 |
February 28, 2015 |
||||||||||
| U.S. |
$ | 187,316 | $ | 155,550 | $ | 167,388 | ||||||
| Foreign |
132,864 | 119,315 | 88,110 | |||||||||
|
|
|
|
|
|
|
|||||||
| Income before provision for income taxes |
$ | 320,180 | $ | 274,865 | $ | 255,498 | ||||||
|
|
|
|
|
|
|
|||||||
The components of the Company’s provision for income taxes consisted of the following (in thousands):
| Fiscal Years Ended | ||||||||||||
| February 28, 2017 |
February 29, 2016 |
February 28, 2015 |
||||||||||
| Current: |
||||||||||||
| Foreign |
$ | 35,791 | $ | 39,168 | $ | 26,325 | ||||||
| Federal |
16,857 | 44,872 | 15,252 | |||||||||
| State |
1,502 | 5,133 | 4,090 | |||||||||
|
|
|
|
|
|
|
|||||||
| Current tax expense |
$ | 54,150 | $ | 89,173 | $ | 45,667 | ||||||
| Deferred: |
||||||||||||
| Foreign |
(4,854 | ) | (5,170 | ) | (8,188 | ) | ||||||
| Federal |
17,712 | (6,142 | ) | 36,197 | ||||||||
| State |
(531 | ) | (2,361 | ) | 1,621 | |||||||
|
|
|
|
|
|
|
|||||||
| Deferred tax expense (benefit) |
$ | 12,327 | $ | (13,673 | ) | $ | 29,630 | |||||
|
|
|
|
|
|
|
|||||||
| Net provision for income taxes |
$ | 66,477 | $ | 75,500 | $ | 75,297 | ||||||
|
|
|
|
|
|
|
|||||||
97
Table of Contents
Index to Financial Statements
RED HAT, INC.
NOTES TO CONSOLIDATED FINANCIAL STATEMENTS—(Continued)
Statutory Rate Reconciliation
Taxes computed at the statutory federal income tax rates are reconciled to the provision for income taxes as follows (in thousands):
| Fiscal Years Ended | ||||||||||||||||||||||||
| February 28, 2017 | February 29, 2016 | February 28, 2015 | ||||||||||||||||||||||
| Provision at federal statutory rate |
$ | 112,063 | 35.0 | % | $ | 96,203 | 35.0 | % | $ | 89,424 | 35.0 | % | ||||||||||||
| State tax, net of federal tax benefit |
520 | 0.2 | % | 601 | 0.2 | % | 4,042 | 1.6 | % | |||||||||||||||
| Foreign rate differential (1) |
(11,795 | ) | (3.7 | )% | (8,232 | ) | (3.0 | )% | (13,983 | ) | (5.5 | )% | ||||||||||||
| Foreign dividend |
— | — | % | — | — | % | 8,720 | 3.4 | % | |||||||||||||||
| Nondeductible items |
3,077 | 1.0 | % | 3,426 | 1.2 | % | 3,339 | 1.3 | % | |||||||||||||||
| Share-based compensation (2) |
(12,749 | ) | (4.0 | )% | 149 | 0.1 | % | 105 | — | % | ||||||||||||||
| Research tax credit |
(9,532 | ) | (3.0 | )% | (5,105 | ) | (1.9 | )% | (5,329 | ) | (2.1 | )% | ||||||||||||
| Foreign tax credit |
(8,930 | ) | (2.8 | )% | (10,267 | ) | (3.7 | )% | (11,755 | ) | (4.6 | )% | ||||||||||||
| Domestic production activities deduction |
(4,601 | ) | (1.4 | )% | (5,033 | ) | (1.8 | )% | (4,433 | ) | (1.7 | )% | ||||||||||||
| Other |
(1,576 | ) | (0.5 | )% | 3,758 | 1.4 | % | 5,167 | 2.1 | % | ||||||||||||||
|
|
|
|
|
|
|
|
|
|
|
|
|
|||||||||||||
| Provision for income taxes |
$ | 66,477 | 20.8 | % | $ | 75,500 | 27.5 | % | $ | 75,297 | 29.5 | % | ||||||||||||
|
|
|
|
|
|
|
|
|
|
|
|
|
|||||||||||||
| (1) | Foreign rate differential includes a reduction of $1.5 million related to a tax holiday in Israel. The tax holiday provides for a reduced tax rate on income attributable to research and development activities and is scheduled to terminate as of the fiscal year ending February 29, 2020. The financial impact from the tax holiday for the fiscal year ended February 28, 2017 resulted in an increase to the Company’s diluted earnings per share of approximately $0.01. |
| (2) | Share-based compensation in the fiscal year ended February 28, 2017 includes $15.8 million net windfall tax benefits from share-based payments resulting from the Company’s early adoption of ASU 2016-09. See NOTE 2—Summary of Significant Accounting Policies for additional discussion regarding the adoption of ASU 2016-09. This windfall is offset by certain stock-based compensation for which the Company receives no tax benefit. |
Deferred taxes
Significant components of the Company’s deferred tax assets and liabilities consisted of the following (in thousands):
| February 28, 2017 |
February 29, 2016 |
|||||||
| Deferred tax assets: |
||||||||
| Foreign net operating loss carryforwards |
$ | 4,218 | $ | 6,679 | ||||
| Domestic net operating loss carryforwards |
5,696 | 13,202 | ||||||
| Domestic credit carryforwards |
9,864 | 7,849 | ||||||
| Share-based compensation |
51,016 | 44,276 | ||||||
| Deferred revenue |
97,258 | 83,901 | ||||||
| Foreign deferred royalty expenses |
2,505 | 9,896 | ||||||
| Convertible notes |
11,377 | 15,182 | ||||||
| Other |
17,077 | 12,313 | ||||||
|
|
|
|
|
|||||
| Total deferred tax assets |
199,011 | 193,298 | ||||||
| Valuation allowance for deferred tax assets |
(5,621 | ) | (3,291 | ) | ||||
|
|
|
|
|
|||||
| Total deferred tax assets, net of valuation allowance |
193,390 | 190,007 | ||||||
|
|
|
|
|
|||||
98
Table of Contents
Index to Financial Statements
RED HAT, INC.
NOTES TO CONSOLIDATED FINANCIAL STATEMENTS—(Continued)
| February 28, 2017 |
February 29, 2016 |
|||||||
| Deferred tax liabilities: |
||||||||
| Goodwill |
10,757 | 9,450 | ||||||
| Property and equipment |
25,163 | 22,669 | ||||||
| Identifiable intangible assets |
21,101 | 21,416 | ||||||
| Compensation accruals |
30,128 | 21,415 | ||||||
| Other |
4,347 | 3,770 | ||||||
|
|
|
|
|
|||||
| Total deferred tax liabilities |
91,496 | 78,720 | ||||||
|
|
|
|
|
|||||
| Net deferred tax asset (1) |
$ | 101,894 | $ | 111,287 | ||||
|
|
|
|
|
|||||
| (1) | Net deferred tax asset is reported on the Company’s Consolidated Balance Sheets as Deferred tax assets, net and included in Other long-term obligations. |
The Company maintains a valuation allowance against its deferred tax assets with respect to certain foreign and state NOL and credit carryforwards that the Company does not believe will ultimately be realized. For the fiscal year ended February 28, 2017, the valuation allowance increased $2.3 million primarily as a result of foreign NOL and credit carryforwards acquired through recent acquisitions.
As of February 28, 2017, the Company had U.S. federal NOL carryforwards of $9.2 million, foreign NOL carryforwards of $22.9 million and U.S. state NOL carryforwards of $72.3 million. The NOL carryforwards expire in varying amounts beginning in the fiscal year ending February 28, 2018. As of February 28, 2017, the Company had U.S. federal research tax credit carryforwards of $0.8 million, state research tax credit carryforwards of $18.1 million and foreign research tax credit carryforwards of $1.2 million, which expire in varying amounts beginning in the fiscal year ending February 28, 2018.
As of February 28, 2017, cumulative undistributed earnings of non-U.S. subsidiaries totaled $677.4 million. Determination of the deferred tax liability on these earnings reinvested indefinitely outside the U.S. is not practicable because of available foreign tax credits, continually changing variables and other factors. It is the Company’s policy to invest the earnings of foreign subsidiaries indefinitely outside the U.S. From time to time, however, the Company may remit a portion of these earnings to the extent it is economically prudent. The Company has provided U.S. income taxes on the earnings of certain foreign subsidiaries that are not considered as permanently reinvested outside the U.S. The U.S. income tax on such earnings has been offset by U.S. foreign tax credits. The Company has also provided U.S. income taxes on the earnings of certain foreign subsidiaries that are permanently reinvested outside the U.S. but are deemed distributed for U.S. federal income tax purposes. The U.S. income tax on such earnings is reduced or offset by available U.S. foreign tax credits.
Unrecognized tax benefits
The following table reconciles unrecognized tax benefits (in thousands):
| February 28, 2017 |
February 29, 2016 |
February 28, 2015 |
||||||||||
| Balance at beginning of year |
$ | 74,886 | $ | 60,343 | $ | 57,054 | ||||||
| Additions based on tax positions related to prior years |
2,142 | 13,486 | 514 | |||||||||
| Additions based on tax positions related to the current year |
4,893 | 3,494 | 3,374 | |||||||||
| (Reductions) additions related to changes in facts and circumstances |
(2,271 | ) | 256 | (229 | ) | |||||||
| Reductions related to lapse of the statute of limitations |
(2,748 | ) | (1,581 | ) | (370 | ) | ||||||
| Reductions related to settlements with tax authorities |
— | (1,112 | ) | — | ||||||||
|
|
|
|
|
|
|
|||||||
| Balance at end of year |
$ | 76,902 | $ | 74,886 | $ | 60,343 | ||||||
|
|
|
|
|
|
|
|||||||
99
Table of Contents
Index to Financial Statements
RED HAT, INC.
NOTES TO CONSOLIDATED FINANCIAL STATEMENTS—(Continued)
The Company’s unrecognized tax benefits as of February 28, 2017 and February 29, 2016, which, if recognized, would affect the Company’s effective tax rate were $69.1 million and $59.1 million, respectively.
It is the Company’s policy to recognize interest and penalties related to uncertain tax positions as income tax expense. Uncertain tax position interest and penalties recognized in the Consolidated Statements of Operations totaled $2.5 million, $1.5 million and $2.7 million for the fiscal years ended February 28, 2017, February 29, 2016 and February 28, 2015, respectively. Uncertain tax position accrued interest and accrued penalties recognized in the Consolidated Balance Sheets totaled $13.2 million and $10.7 million as of February 28, 2017 and February 29, 2016, respectively.
As of February 28, 2017, it is reasonably possible that total unrecognized tax benefits may be reduced by up to $7.6 million within the next 12 months as a result of statutes of limitations expirations in various tax jurisdictions, all of which would affect the Company’s effective tax rate.
The Company is subject to taxation in the U.S. and various other state and foreign jurisdictions. The material jurisdictions in which the Company is subject to potential examination include India, Ireland and the U.S., where the Company is no longer subject to examination prior to fiscal years ended February 28, 2006, February 29, 2012 and February 29, 2000, respectively. The Company is currently under examination in France, India and the United Kingdom. The Company believes it has adequately provided for any reasonably foreseeable outcomes related to tax audits.
NOTE 12—Stockholders’ Equity
Common stock
The Company has authorized 300,000,000 shares of common stock with a par value of $0.0001 per share. Holders of these shares have one vote per share. Upon the dissolution, liquidation or winding up of the Company, holders of common stock will be entitled to receive the assets of the Company after satisfaction of the preferential rights of any outstanding preferred stock or any other outstanding stock ranking on liquidation senior to or on parity with the common stock.
The Company repurchased 6,192,382 shares, 3,476,229 shares and 8,355,757 shares of its common stock during the fiscal years ended February 28, 2017, February 29, 2016 and February 28, 2015, respectively, at an aggregate cost of $458.7 million, $262.6 million and $535.1 million, respectively, in accordance with the share repurchase programs described below. These amounts are recorded in Treasury stock on the Company’s Consolidated Balance Sheets.
Preferred stock
At February 28, 2017, the Company has authorized 5,000,000 shares of preferred stock with a par value of $0.0001 per share. No shares of preferred stock were outstanding as of February 28, 2017 or February 29, 2016.
Share repurchase programs
On March 25, 2015, the Company announced that its Board of Directors had authorized the repurchase of up to $500.0 million of Red Hat’s common stock from time to time on the open market or in privately negotiated transactions. The program was discontinued by the Board effective June 30, 2016. From March 1, 2016 through its discontinuance on June 30, 2016, the Company repurchased 1,291,733 shares of its common stock for $94.4 million under this repurchase program.
On June 22, 2016, the Company announced that its Board of Directors authorized the repurchase of up to $1.0 billion of Red Hat’s common stock from time to time on the open market or in privately negotiated
100
Table of Contents
Index to Financial Statements
RED HAT, INC.
NOTES TO CONSOLIDATED FINANCIAL STATEMENTS—(Continued)
transactions. The new program commenced on July 1, 2016, and will expire on the earlier of (i) June 30, 2018 or (ii) a determination by the Board, Chief Executive Officer or Chief Financial Officer to discontinue the program. The new program replaced the previous $500.0 million repurchase program, which was discontinued by the Board effective June 30, 2016.
From its commencement on July 1, 2016 through February 28, 2017, the Company has repurchased 4,900,649 shares of its common stock for $364.3 million under this program. As of February 28, 2017, the amount available under the program for the repurchase of the Company’s common stock was $635.7 million.
Accelerated share repurchase
During the fiscal year ended February 28, 2015, the Company entered into an accelerated share repurchase program (the “ASR Agreement”). On October 7, 2014, under the ASR Agreement, the Company paid $375.0 million to the ASR Agreement counterparty and received 5,312,555 shares of its common stock from the ASR Agreement counterparty, which represented 80 percent of the shares deliverable to the Company under the ASR Agreement assuming an average share price of $56.47 (the Company’s closing share price at October 1, 2014). The ASR Agreement was completed on February 27, 2015. On March 4, 2015, the ASR Agreement counterparty delivered 720,101 additional shares of the Company’s common stock to the Company in settlement of the ASR Agreement.
The Company initially accounted for the ASR Agreement as two separate transactions: (i) the 5,312,555 shares of common stock initially delivered to the Company were accounted for as a treasury stock transaction with $300.0 million, or 80 percent, of the $375.0 million upfront payment being recorded in Treasury stock in the Company’s Consolidated Balance Sheet at February 28, 2015 and (ii) the unsettled portion of the ASR Agreement of $75.0 million was recorded in Additional paid-in capital on the Company’s Consolidated Balance Sheet as of February 28, 2015. The $75.0 million representing the unsettled portion of the ASR originally recorded in Additional paid-in capital was reclassified upon settlement to Treasury stock during the fiscal year ended February 29, 2016.
The total number of shares of common stock the Company repurchased under the ASR Agreement was 6,032,656 shares with a weighted average share price of $62.16.
Accumulated Other Comprehensive Loss
Accumulated other comprehensive loss was comprised of the following (in thousands):
| February 28, 2017 |
February 29, 2016 |
|||||||
| Accumulated loss from foreign currency translation adjustment |
$ | (87,784 | ) | $ | (73,776 | ) | ||
| Accumulated unrealized loss, net of tax, on available-for-sale securities |
(568 | ) | (673 | ) | ||||
|
|
|
|
|
|||||
| Accumulated other comprehensive loss |
$ | (88,352 | ) | $ | (74,449 | ) | ||
|
|
|
|
|
|||||
NOTE 13—Share-based Awards
Overview
The Company’s 2004 Long-Term Incentive Plan, as amended and restated (the “LTIP”), provides for the granting of service- and performance-based share awards, among other awards. As of February 28, 2017, there were 10.0 million shares of common stock reserved for issuance under the LTIP for future share-based awards to
101
Table of Contents
Index to Financial Statements
RED HAT, INC.
NOTES TO CONSOLIDATED FINANCIAL STATEMENTS—(Continued)
be granted to any employee, officer, director or consultant of the Company at terms and prices to be determined by the Board of Directors.
The following table summarizes granted share-based awards by type:
| Awards Granted in Fiscal Years Ended | ||||||||||||||||||||||||
| February 28, 2017 | February 29, 2016 | February 28, 2015 | ||||||||||||||||||||||
| Shares and Shares Underlying Awards |
Weighted Average Per Share Award Fair Value |
Shares and Shares Underlying Awards |
Weighted Average Per Share Award Fair Value |
Shares and Shares Underlying Awards |
Weighted Average Per Share Award Fair Value |
|||||||||||||||||||
| Service-based shares and share units (1) |
2,212,006 | $ | 75.62 | 2,108,639 | $ | 76.45 | 2,994,553 | $ | 53.23 | |||||||||||||||
| Performance-based share units—Maximum |
725,004 | $ | 76.68 | 628,596 | $ | 77.87 | 1,148,084 | $ | 52.17 | |||||||||||||||
| Stock options assumed as part of a business combination |
— | $ | — | 119,515 | $ | 58.22 | 219,169 | $ | 48.45 | |||||||||||||||
| Restricted shares issued as part of a business combination with continued-employment service conditions |
— | $ | — | — | $ | — | 529,057 | $ | 54.75 | |||||||||||||||
|
|
|
|
|
|
|
|
|
|
|
|
|
|||||||||||||
| Total share-based awards |
2,937,010 | $ | 75.88 | 2,856,750 | $ | 76.00 | 4,890,863 | $ | 52.93 | |||||||||||||||
|
|
|
|
|
|
|
|
|
|
|
|
|
|||||||||||||
| (1) | Service-based shares granted during the fiscal year ended February 28, 2017 include 140,182 restricted shares awarded to certain executives that were subject to both a four-year service condition and the achievement of a specified dollar amount of revenue for the fiscal year ended February 28, 2017 (the “RSA performance goal”). The RSA performance goal for the fiscal year ended February 28, 2017 was met. Therefore, as of February 28, 2017 only the service condition remained with 25% vesting on July 17, 2017, and the remainder vesting ratably on a quarterly basis over the course of the subsequent three-year period. |
The following summarizes share-based compensation expense recognized in the Company’s Consolidated Financial Statements (in thousands):
| Fiscal Years Ended | ||||||||||||
| February 28, 2017 (1) |
February 29, 2016 |
February 28, 2015 |
||||||||||
| Cost of revenue |
$ | 16,553 | $ | 15,898 | $ | 14,027 | ||||||
| Sales and marketing |
93,378 | 69,089 | 55,203 | |||||||||
| Research and development |
52,424 | 48,466 | 38,517 | |||||||||
| General and administrative |
30,175 | 32,781 | 27,485 | |||||||||
|
|
|
|
|
|
|
|||||||
| Total share-based compensation expense |
$ | 192,530 | $ | 166,234 | $ | 135,232 | ||||||
|
|
|
|
|
|
|
|||||||
| (1) | Total share-based compensation expense of $192.5 million includes $5.0 million of expense related to the Company’s employee stock purchase plan (“ESPP”). See NOTE 16—Employee Benefit Plans for information regarding the ESPP. |
Share-based compensation expense qualifying for capitalization was insignificant for each of the Company’s fiscal years ended February 28, 2017, February 29, 2016 and February 28, 2015. Accordingly, no share-based compensation expense was capitalized during these years.
As discussed in NOTE 2—Summary of Significant Accounting Policies, as a result of adopting ASU 2016-09 during the fiscal year ended February 28, 2017, the Company recognizes share-based award
102
Table of Contents
Index to Financial Statements
RED HAT, INC.
NOTES TO CONSOLIDATED FINANCIAL STATEMENTS—(Continued)
forfeitures only as they occur rather than estimating by applying a forfeiture rate. During the fiscal years ended February 29, 2016 and February 28, 2015, an estimated forfeiture rate of 10% per annum, which approximated the Company’s historical rate, was applied to options and service-based share awards. Awards were adjusted to actual forfeiture rates at vesting.
Stock options
The total share-based compensation expense related to stock options recognized in the Consolidated Financial Statements was as follows (in thousands):
| Fiscal Years Ended | ||||||||||||
| February 28, 2017 |
February 29, 2016 |
February 28, 2015 |
||||||||||
| Share-based compensation expense—stock options |
$ | 4,813 | $ | 4,918 | $ | 5,085 | ||||||
|
|
|
|
|
|
|
|||||||
As of February 28, 2017, the Company had 208,505 stock options outstanding with a weighted average remaining contractual life of 4.5 years and a weighted average exercise price of $34.70. The number of stock options exercisable as of February 28, 2017 was 129,576 with a weighted average share price of $38.49.
The intrinsic value of stock options exercised was as follows (in thousands):
| Fiscal Years Ended | ||||||||||||
| February 28, 2017 |
February 29, 2016 |
February 28, 2015 |
||||||||||
| Total intrinsic value of stock options exercised |
$ | 7,928 | $ | 9,103 | $ | 6,289 | ||||||
|
|
|
|
|
|
|
|||||||
As of February 28, 2017, compensation cost related to unvested stock options not yet recognized in the Company’s Consolidated Financial Statements totaled $3.2 million. The weighted average period over which these unvested stock options are expected to be recognized is approximately 1.6 years.
Service-based share awards
Service-based share awards include nonvested shares, nonvested share units and deferred share units granted under the LTIP. Nonvested shares vest, subject to continued service to the Company, 25% on the first trading day on or about July 16 of the year subsequent to the year in which the grant occurs and 6.25% on the last day of each subsequent three-month period. Nonvested share units generally vest, subject to continued service to the Company, 25% each year over a four-year period beginning on the date of grant. Nonvested shares and nonvested share units are generally amortized to expense on a straight-line basis over four years. Deferred share units are awarded to directors and generally vest within one year when issued in lieu of annual share awards or immediately when issued in lieu of cash.
The total share-based compensation expense related to service-based share awards recognized in the Company’s Consolidated Financial Statements was as follows (in thousands):
| Fiscal Years Ended | ||||||||||||
| February 28, 2017 |
February 29, 2016 |
February 28, 2015 |
||||||||||
| Share-based compensation expense—service-based awards |
$ | 147,843 | $ | 124,904 | $ | 107,887 | ||||||
|
|
|
|
|
|
|
|||||||
103
Table of Contents
Index to Financial Statements
RED HAT, INC.
NOTES TO CONSOLIDATED FINANCIAL STATEMENTS—(Continued)
The following table summarizes the activity for the Company’s service-based share awards:
| Nonvested Shares and Share Units |
Weighted Average Per Share Grant Date Fair Value |
|||||||
| Service-based share awards at February 28, 2014 |
5,373,308 | $ | 48.34 | |||||
| Granted |
2,994,553 | 53.23 | ||||||
| Vested |
(1,948,247 | ) | 47.24 | |||||
| Forfeited |
(569,952 | ) | 48.50 | |||||
| Restricted shares issued as part of a business combination with continued-employment service conditions (1) |
529,057 | 54.75 | ||||||
|
|
|
|
|
|||||
| Service-based share awards at February 28, 2015 |
6,378,719 | $ | 51.49 | |||||
| Granted |
2,108,639 | 76.45 | ||||||
| Vested |
(2,047,169 | ) | 50.78 | |||||
| Forfeited |
(265,315 | ) | 56.21 | |||||
|
|
|
|
|
|||||
| Service-based share awards at February 29, 2016 |
6,174,874 | $ | 60.05 | |||||
| Granted |
2,212,006 | 75.62 | ||||||
| Vested |
(2,409,518 | ) | 57.42 | |||||
| Forfeited |
(313,162 | ) | 64.36 | |||||
|
|
|
|
|
|||||
| Service-based share awards at February 28, 2017 |
5,664,200 | $ | 67.01 | |||||
|
|
|
|
|
|||||
| (1) | As part of the Company’s acquisition of eNovance, a total of 529,057 restricted common shares were issued to certain shareholders of eNovance. These restricted shares are conditioned on continued employment with the Company. |
The following summarizes the intrinsic value as of February 28, 2017 of the Company’s service-based awards outstanding:
| Number of Shares and Share Units |
Weighted Average Remaining Vesting Period |
Intrinsic Value at February 28, 2017 (in thousands) |
||||||||||
| Outstanding |
5,664,200 | 2.6 | $ | 469,052 | ||||||||
The intrinsic value of service-based awards vesting was as follows (in thousands):
| Fiscal Years Ended | ||||||||||||
| February 28, 2017 |
February 29, 2016 |
February 28, 2015 |
||||||||||
| Total intrinsic value of service-based awards vesting |
$ | 181,691 | $ | 157,864 | $ | 108,066 | ||||||
|
|
|
|
|
|
|
|||||||
As of February 28, 2017, compensation cost related to service-based share awards not yet recognized in the Company’s Consolidated Financial Statements totaled $279.9 million. The weighted average period over which these nonvested awards are expected to be recognized is approximately 2.6 years.
Performance-based share awards
Under the LTIP, certain executive officers and senior management were awarded a target number of PSUs. The PSU payouts are either based on (i) the Company’s financial performance (“performance condition”) or
104
Table of Contents
Index to Financial Statements
RED HAT, INC.
NOTES TO CONSOLIDATED FINANCIAL STATEMENTS—(Continued)
(ii) the performance of the Company’s total stockholder return (“market condition”). Set forth below are general descriptions of the two types of performance-based awards granted to certain executive officers and members of senior management.
PSUs with performance conditions
Depending on the Company’s financial performance measured against the financial performance of specified peer companies during a three-year performance period, PSU grantees may earn up to 200% of the target number of PSUs (the “Maximum PSUs”). Payouts are earned over a performance period with two separate performance segments. Up to 50% of the Maximum PSUs may be earned in respect of the first performance segment; and up to 100% of the Maximum PSUs may be earned in respect of the second performance segment, less the amount earned in the first performance segment.
PSUs with market conditions
Depending on the performance of the Company’s total stockholder return measured against the performance of the total shareholder return of specified peer companies over a performance period of approximately three years, PSU grantees may earn up to 200% of the target number of PSUs. Each grantee will receive a number of shares of common stock equal to the number of PSUs earned in a single payout following the end of the performance period.
In addition to the PSUs with the market condition described above, certain executives were awarded a total of 242,352 PSUs that pay out only if the Company’s total shareholder return increases by at least 50% within a three-year performance period beginning on August 6, 2014 (“TSR Hurdle PSUs”). If the performance goal is achieved during the performance period and the grantee’s business relationship with the Company has not ceased, 50% of the TSR Hurdle PSUs vest upon achievement of the performance goal and the remaining 50% of the TSR Hurdle PSUs vest on the last day of the four-year service period beginning on August 6, 2014. The TSR Hurdle PSUs’ performance goal was met during the fourth quarter of the fiscal year ended February 29, 2016.
The total share-based compensation expense related to performance-based share awards recognized in the Company’s Consolidated Financial Statements was as follows (in thousands):
| Fiscal Years Ended | ||||||||||||
| February 28, 2017 |
February 29, 2016 |
February 28, 2015 |
||||||||||
| Share-based compensation expense—performance-based awards |
$ | 34,865 | $ | 36,412 | $ | 22,260 | ||||||
|
|
|
|
|
|
|
|||||||
105
Table of Contents
Index to Financial Statements
RED HAT, INC.
NOTES TO CONSOLIDATED FINANCIAL STATEMENTS—(Continued)
The following table summarizes the activity for the Company’s PSUs:
| Maximum (1) | ||||||||
| Activity |
Shares Underlying Performance Share Units |
Weighted Average Per Share Grant Date Fair Value |
||||||
| Outstanding at February 28, 2014 |
1,675,225 | $ | 47.34 | |||||
| Granted |
1,148,084 | 52.17 | ||||||
| Vested |
(374,921 | ) | 45.42 | |||||
| Forfeited |
(299,053 | ) | 41.90 | |||||
|
|
|
|
|
|||||
| Outstanding at February 28, 2015 |
2,149,335 | $ | 51.01 | |||||
| Granted |
628,596 | 77.87 | ||||||
| Vested |
(497,656 | ) | 52.41 | |||||
| Forfeited |
(230,764 | ) | 52.29 | |||||
|
|
|
|
|
|||||
| Outstanding at February 29, 2016 |
2,049,511 | $ | 58.76 | |||||
| Granted |
725,004 | 76.68 | ||||||
| Vested |
(492,518 | ) | 48.94 | |||||
| Forfeited |
(346,102 | ) | 62.68 | |||||
|
|
|
|
|
|||||
| Outstanding at February 28, 2017 |
1,935,895 | $ | 67.27 | |||||
|
|
|
|
|
|||||
| (1) | Vested and forfeited amounts represent the actual number of shares vesting and forfeited during the year. Outstanding amounts represent the remaining maximum potential shares available to vest as of the period ended. |
The total intrinsic value of performance-based share awards vesting was as follows (in thousands):
| Fiscal Years Ended | ||||||||||||
| February 28, 2017 |
February 29, 2016 |
February 28, 2015 |
||||||||||
| Total intrinsic value of performance-based awards vesting |
$ | 36,768 | $ | 36,555 | $ | 18,733 | ||||||
|
|
|
|
|
|
|
|||||||
As of February 28, 2017, the number of shares subject to PSU awards expected to vest was 1.3 million shares. Compensation expense related to PSUs expected to vest but not yet recognized in the Consolidated Financial Statements totaled $31.1 million as of February 28, 2017. The weighted average period over which these awards are expected to be recognized is approximately 1.1 years.
106
Table of Contents
Index to Financial Statements
RED HAT, INC.
NOTES TO CONSOLIDATED FINANCIAL STATEMENTS—(Continued)
NOTE 14—Commitments and Contingencies
Operating leases
As of February 28, 2017, the Company leased office space and certain equipment under various non-cancellable operating leases. Future minimum lease payments required under the operating leases at February 28, 2017 are as follows (in thousands):
| Fiscal Year |
Operating Leases |
|||
| 2018 |
$ | 56,068 | ||
| 2019 |
49,856 | |||
| 2020 |
42,851 | |||
| 2021 |
36,514 | |||
| 2022 |
31,640 | |||
| Thereafter |
72,873 | |||
|
|
|
|||
| Total minimum lease payments |
$ | 289,802 | ||
|
|
|
|||
Rent expense under operating leases is provided in the following table (in thousands):
| Fiscal Years Ended | ||||||||||||
| February 28, 2017 |
February 29, 2016 |
February 28, 2015 |
||||||||||
| Total operating lease expense |
$ | 44,228 | $ | 38,152 | $ | 36,581 | ||||||
|
|
|
|
|
|
|
|||||||
Product indemnification
The Company is a party to a variety of agreements pursuant to which it may be obligated to indemnify the other party from losses arising in connection with the Company’s services or products, or from losses arising in connection with certain events defined within a particular contract, which may include litigation or claims relating to intellectual property infringement, certain losses arising from damage to property or injury to persons or other matters. In each of these circumstances, payment by the Company is conditioned on the other party making a claim pursuant to the procedures specified in the particular contract, which procedures typically allow the Company to challenge the other party’s claims. Further, the Company’s obligations under these agreements may in certain cases be limited in terms of time and/or amount, and in some instances, the Company may have recourse against third-parties for certain payments made by the Company.
It is not possible to predict the maximum potential amount of future payments under these or similar agreements due to the conditional nature of the Company’s obligations and the facts and circumstances involved in each particular agreement. The Company does not record a liability for claims related to indemnification unless the Company concludes that the likelihood of a material claim is probable and estimable. Payments pursuant to these indemnification claims during the fiscal years ended February 28, 2017, February 29, 2016 and February 28, 2015 were in the aggregate immaterial.
NOTE 15—Legal Proceedings
The Company experiences routine litigation in the normal course of its business, including patent litigation. The Company presently believes that the outcome of this routine litigation will not have a material adverse effect on its financial position, results of operations or cash flows.
107
Table of Contents
Index to Financial Statements
RED HAT, INC.
NOTES TO CONSOLIDATED FINANCIAL STATEMENTS—(Continued)
NOTE 16—Employee Benefit Plans
Retirement plans
The Company provides retirement plans whereby participants may elect to contribute a portion of their annual compensation to the plans, after complying with certain limitations. The Company has the option to make contributions to the plans and contributed to the plans as follows (in thousands):
| Fiscal Years Ended | ||||||||||||
| February 28, 2017 |
February 29, 2016 |
February 28, 2015 |
||||||||||
| Total contributions to employee benefit plans |
$ | 32,839 | $ | 25,731 | $ | 21,721 | ||||||
|
|
|
|
|
|
|
|||||||
Employee stock purchase plan
During the third quarter of the fiscal year ended February 28, 2017, the Company began offering an ESPP whereby eligible employees may elect to purchase common stock of the Company at the end of a six-month plan period (“Plan Period”). During each Plan Period, eligible employees who so elect may authorize payroll deductions in an amount no less than 1% nor greater than 15% of his or her eligible compensation during the Plan Period. At the end of each Plan Period, the accumulated deductions are used to purchase shares of common stock. Shares are purchased at a price equal to 85% of the closing price of the Company’s common stock, on either the first business day of the Plan Period or the last business day of the Plan Period, whichever is lower. No participant may purchase more than $25,000 worth of common stock per calendar year.
As of February 28, 2017, the Company has 5,000,000 common shares reserved for issuance under the ESPP. Share-based compensation expense recognized in the Company’s Consolidated Statements of Operations for the fiscal year ended February 28, 2017 related to the ESPP totaled $5.0 million.
NOTE 17—Assets and Liabilities Measured at Fair Value on a Recurring Basis
The following table summarizes the composition and fair value hierarchy of the Company’s financial assets and liabilities at February 28, 2017 (in thousands):
| As of February 28, 2017 |
Quoted Prices
In Active Markets for Identical Assets (Level 1) |
Significant Other Observable Inputs (Level 2) |
Significant Unobservable Inputs (Level 3) |
|||||||||||||
| Assets: |
||||||||||||||||
| Money markets (1) |
$ | 258,188 | $ | 258,188 | $ | — | $ | — | ||||||||
| Available-for-sale securities (1): |
||||||||||||||||
| U.S. agency securities |
327,430 | — | 327,430 | — | ||||||||||||
| Corporate securities |
714,993 | — | 714,993 | — | ||||||||||||
| Foreign currency derivatives (2) |
135 | — | 135 | — | ||||||||||||
| Liabilities: |
||||||||||||||||
| Foreign currency derivatives (3) |
(160 | ) | — | (160 | ) | — | ||||||||||
|
|
|
|
|
|
|
|
|
|||||||||
| Total |
$ | 1,300,586 | $ | 258,188 | $ | 1,042,398 | $ | — | ||||||||
|
|
|
|
|
|
|
|
|
|||||||||
| (1) | Included in Cash and cash equivalents, Investments in debt securities, short-term or Investments in debt securities, long-term in the Company’s Consolidated Balance Sheet at February 28, 2017 in addition to $832.6 million of cash. |
108
Table of Contents
Index to Financial Statements
RED HAT, INC.
NOTES TO CONSOLIDATED FINANCIAL STATEMENTS—(Continued)
| (2) | Included in Other current assets in the Company’s Consolidated Balance Sheet at February 28, 2017. |
| (3) | Included in Accounts payable and accrued expenses in the Company’s Consolidated Balance Sheet at February 28, 2017. |
The following table summarizes the composition and fair value hierarchy of the Company’s financial assets and liabilities at February 29, 2016 (in thousands):
| As of February 29, 2016 |
Quoted Prices
In Active Markets for Identical Assets (Level 1) |
Significant Other Observable Inputs (Level 2) |
Significant Unobservable Inputs (Level 3) |
|||||||||||||
| Assets: |
||||||||||||||||
| Money markets (1) |
$ | 221,970 | $ | 221,970 | $ | — | $ | — | ||||||||
| Available-for-sale securities (1): |
||||||||||||||||
| U.S. agency securities |
331,117 | — | 331,117 | — | ||||||||||||
| Corporate securities |
736,495 | — | 736,495 | — | ||||||||||||
| Foreign currency derivatives (2) |
566 | — | 566 | — | ||||||||||||
| Liabilities: |
||||||||||||||||
| Foreign currency derivatives (3) |
(452 | ) | — | (452 | ) | — | ||||||||||
|
|
|
|
|
|
|
|
|
|||||||||
| Total |
$ | 1,289,696 | $ | 221,970 | $ | 1,067,726 | $ | — | ||||||||
|
|
|
|
|
|
|
|
|
|||||||||
| (1) | Included in Cash and cash equivalents, Investments in debt securities, short-term or Investments in debt securities, long-term in the Company’s Consolidated Balance Sheet at February 29, 2016, in addition to $705.8 million of cash. |
| (2) | Included in Other current assets in the Company’s Consolidated Balance Sheet at February 29, 2016. |
| (3) | Included in Accounts payable and accrued expenses in the Company’s Consolidated Balance Sheet at February 29, 2016. |
The following table represents the Company’s investments measured at fair value as of February 28, 2017 (in thousands):
| Balance Sheet Classification | ||||||||||||||||||||||||||||
| Amortized Cost |
Gross Unrealized | Aggregate Fair Value |
Cash Equivalent Marketable Securities |
Investments in debt securities, short-term |
Investments in debt securities, long-term |
|||||||||||||||||||||||
| Gains | Losses(1) | |||||||||||||||||||||||||||
| Money markets |
$ | 258,188 | $ | — | $ | — | $ | 258,188 | $ | 258,188 | $ | — | $ | — | ||||||||||||||
| U.S. agency securities |
329,617 | 37 | (2,224 | ) | 327,430 | — | 27,593 | 299,837 | ||||||||||||||||||||
| Corporate securities |
714,226 | 1,416 | (649 | ) | 714,993 | — | 342,390 | 372,603 | ||||||||||||||||||||
|
|
|
|
|
|
|
|
|
|
|
|
|
|
|
|||||||||||||||
| Total |
$ | 1,302,031 | $ | 1,453 | $ | (2,873 | ) | $ | 1,300,611 | $ | 258,188 | $ | 369,983 | $ | 672,440 | |||||||||||||
|
|
|
|
|
|
|
|
|
|
|
|
|
|
|
|||||||||||||||
| (1) | As of February 28, 2017, there were $0.6 million of accumulated unrealized losses related to investments that have been in a continuous unrealized loss position for 12 months or longer. The aggregate related fair value of investments with unrealized losses was $605.9 million. |
109
Table of Contents
Index to Financial Statements
RED HAT, INC.
NOTES TO CONSOLIDATED FINANCIAL STATEMENTS—(Continued)
The following table summarizes the stated maturities of the Company’s investment in available-for-sale securities (in thousands):
| As of February 28, 2017 |
Less than 1 Year |
1-5 Years | More than 5 Years |
|||||||||||||
| Maturity of current and long-term available-for-sale securities |
$ | 1,042,423 | $ | 369,984 | $ | 672,439 | $ | — | ||||||||
The following table represents the Company’s investments measured at fair value as of February 29, 2016 (in thousands):
| Balance Sheet Classification | ||||||||||||||||||||||||||||
| Amortized Cost |
Gross Unrealized | Aggregate Fair Value |
Cash Equivalent Marketable Securities |
Investments in debt securities, short-term |
Investments in debt securities, long-term |
|||||||||||||||||||||||
| Gains | Losses(1) | |||||||||||||||||||||||||||
| Money markets |
$ | 221,970 | $ | — | $ | — | $ | 221,970 | $ | 221,970 | $ | — | $ | — | ||||||||||||||
| U.S. agency securities |
331,302 | 160 | (345 | ) | 331,117 | — | 50,453 | 280,664 | ||||||||||||||||||||
| Corporate securities |
737,723 | 994 | (2,222 | ) | 736,495 | — | 230,689 | 505,806 | ||||||||||||||||||||
|
|
|
|
|
|
|
|
|
|
|
|
|
|
|
|||||||||||||||
| Total |
$ | 1,290,995 | $ | 1,154 | $ | (2,567 | ) | $ | 1,289,582 | $ | 221,970 | $ | 281,142 | $ | 786,470 | |||||||||||||
|
|
|
|
|
|
|
|
|
|
|
|
|
|
|
|||||||||||||||
| (1) | As of February 29, 2016, there were $0.9 million of accumulated unrealized losses related to investments that have been in a continuous unrealized loss position for 12 months or longer. The aggregate related fair value of investments with unrealized losses was $608.8 million. |
NOTE 18—Earnings Per Share
The Company computes basic net income per common share by dividing net income available to common stockholders by the weighted average number of common shares outstanding. Diluted net income per common share is computed by dividing net income by the weighted average number of common shares and dilutive potential common share equivalents then outstanding. Potential common share equivalents consist of shares issuable upon the exercise of stock options or vesting of share-based awards.
The following table reconciles the numerators and denominators of the earnings per share (“EPS”) calculation (in thousands, except per share amounts):
| Fiscal Years Ended | ||||||||||||
| February 28, 2017 |
February 29, 2016 |
February 28, 2015 |
||||||||||
| Net income, basic and diluted |
$ | 253,703 | $ | 199,365 | $ | 180,201 | ||||||
|
|
|
|
|
|
|
|||||||
| Weighted average common shares outstanding |
179,642 | 182,817 | 186,529 | |||||||||
| Incremental shares attributable to assumed vesting or exercise of outstanding equity award shares |
3,027 | 3,020 | 2,717 | |||||||||
| Dilutive effect of convertible notes |
292 | 282 | — | |||||||||
|
|
|
|
|
|
|
|||||||
| Diluted shares |
182,961 | 186,119 | 189,246 | |||||||||
|
|
|
|
|
|
|
|||||||
| Net income per share - diluted |
$ | 1.39 | $ | 1.07 | $ | 0.95 | ||||||
With respect to the Company’s convertible notes, the Company has the option to pay cash or deliver, as the case may be, either cash, shares of its common stock or a combination of cash and shares of its common stock for the aggregate amount due upon conversion of the convertible notes. The Company’s intent is to settle the
110
Table of Contents
Index to Financial Statements
RED HAT, INC.
NOTES TO CONSOLIDATED FINANCIAL STATEMENTS—(Continued)
principal amount of the convertible notes in cash upon conversion. As a result, upon conversion of the convertible notes, only the amounts payable in excess of the principal amounts of the convertible notes are considered in diluted EPS under the treasury stock method. See NOTE 21—Convertible Notes for detailed information on the convertible notes.
Warrants to purchase 10,965,630 shares of the Company’s common stock at $101.65 per share were outstanding during the fiscal years ended February 28, 2017, February 29, 2016 and February 28, 2015 but were not included in the computation of diluted EPS because the warrants’ exercise price was greater than the average market price of the Company’s common stock during the related period.
The following share awards are not included in the computation of diluted EPS because the aggregate value of proceeds considered received upon either exercise or vesting was greater than the average market price of the Company’s common stock during the related periods and the effect of including such share awards in the computation would be anti-dilutive (in thousands):
| Fiscal Years Ended | ||||||||||||
| February 28, 2017 |
February 29, 2016 |
February 28, 2015 |
||||||||||
| Number of shares considered anti-dilutive for calculating diluted EPS |
77 | 21 | 121 | |||||||||
|
|
|
|
|
|
|
|||||||
NOTE 19—Segment Reporting
The following summarizes revenue from unaffiliated customers; income (loss) from operations; total cash, cash equivalents and available-for-sale investment securities and total assets by geographic segment (in thousands):
| Americas | EMEA | Asia Pacific | Corporate(1) | Consolidated | ||||||||||||||||
| Fiscal Year Ended February 28, 2017 | ||||||||||||||||||||
| Revenue from unaffiliated customers |
$ | 1,555,290 | $ | 515,642 | $ | 340,871 | $ | — | $ | 2,411,803 | ||||||||||
| Income (loss) from operations |
$ | 318,244 | $ | 106,769 | $ | 99,762 | $ | (192,530 | ) | $ | 332,245 | |||||||||
| Total cash, cash equivalents and available-for-sale investment securities |
$ | 1,100,827 | $ | 706,028 | $ | 326,376 | $ | — | $ | 2,133,231 | ||||||||||
| Total assets |
$ | 2,974,734 | $ | 1,075,422 | $ | 485,029 | $ | — | $ | 4,535,185 | ||||||||||
| Fiscal Year Ended February 29, 2016 | ||||||||||||||||||||
| Revenue from unaffiliated customers |
$ | 1,354,345 | $ | 436,304 | $ | 261,581 | $ | — | $ | 2,052,230 | ||||||||||
| Income (loss) from operations |
$ | 297,462 | $ | 93,373 | $ | 63,447 | $ | (166,234 | ) | $ | 288,048 | |||||||||
| Total cash, cash equivalents and available-for-sale investment securities |
$ | 1,222,470 | $ | 540,584 | $ | 232,336 | $ | — | $ | 1,995,390 | ||||||||||
| Total assets |
$ | 2,909,238 | $ | 871,475 | $ | 374,386 | $ | — | $ | 4,155,099 | ||||||||||
| Fiscal Year Ended February 28, 2015 | ||||||||||||||||||||
| Revenue from unaffiliated customers |
$ | 1,144,237 | $ | 410,299 | $ | 234,953 | $ | — | $ | 1,789,489 | ||||||||||
| Income (loss) from operations |
$ | 242,173 | $ | 89,364 | $ | 53,689 | $ | (135,232 | ) | $ | 249,994 | |||||||||
| Total cash, cash equivalents and available-for-sale investment securities |
$ | 1,267,824 | $ | 405,114 | $ | 135,805 | $ | — | $ | 1,808,743 | ||||||||||
| Total assets |
$ | 2,755,923 | $ | 726,101 | $ | 302,545 | $ | — | $ | 3,784,569 | ||||||||||
| (1) | Amounts represent share-based compensation expense that was not allocated to geographic segments. |
111
Table of Contents
Index to Financial Statements
RED HAT, INC.
NOTES TO CONSOLIDATED FINANCIAL STATEMENTS—(Continued)
Supplemental information about geographic areas
The Company approximates its geographic sources of revenue based on the country of origin of its non-cancellable subscription and service agreements initiated during the year (commonly referred to as bookings). The following table lists revenue from unaffiliated customers in the United States, the Company’s country of domicile, and revenue from foreign countries (in thousands):
| Fiscal Years Ended | ||||||||||||
| February 28, 2017 |
February 29, 2016 |
February 28, 2015 |
||||||||||
| United States, the Company’s country of domicile |
$ | 1,400,228 | $ | 1,213,493 | $ | 1,022,803 | ||||||
| Foreign |
1,011,575 | 838,737 | 766,686 | |||||||||
|
|
|
|
|
|
|
|||||||
| Total revenue from unaffiliated customers |
$ | 2,411,803 | $ | 2,052,230 | $ | 1,789,489 | ||||||
|
|
|
|
|
|
|
|||||||
There were no individual foreign countries in which the Company earned 10% or more of its revenue from unaffiliated customers.
Total tangible long-lived assets located in the United States, the Company’s country of domicile, and similar tangible long-lived assets held outside the U.S. are summarized in the following table (in thousands):
| February 28, 2017 |
February 29, 2016 |
February 28, 2015 |
||||||||||
| United States, the Company’s country of domicile |
$ | 133,492 | $ | 126,937 | $ | 131,792 | ||||||
| Foreign |
56,137 | 39,949 | 40,359 | |||||||||
|
|
|
|
|
|
|
|||||||
| Total tangible long-lived assets |
$ | 189,629 | $ | 166,886 | $ | 172,151 | ||||||
|
|
|
|
|
|
|
|||||||
Supplemental information about major customers
For the fiscal years ended February 28, 2017 and February 29, 2016, the U.S. government and its agencies represented in the aggregate approximately 10% of the Company’s total revenue. For the fiscal year ended February 28, 2015, there were no individual customers from which the Company generated 10% or greater revenue.
Supplemental information about products and services
The following table provides further detail, by type, of our subscription and services revenues. Infrastructure-related offerings subscription revenue includes subscription revenue generated from Red Hat Enterprise Linux and related technologies such as Red Hat Satellite and Red Hat Enterprise Virtualization. Subscription revenue generated from our Application Development-related and other emerging technology
112
Table of Contents
Index to Financial Statements
RED HAT, INC.
NOTES TO CONSOLIDATED FINANCIAL STATEMENTS—(Continued)
offerings includes Red Hat JBoss Middleware, Red Hat Storage, Red Hat Mobile Application Platform and Red Hat cloud offerings such as Red Hat OpenStack Platform and Red Hat OpenShift (in thousands):
| Fiscal Years Ended | ||||||||||||
| February 28, 2017 |
February 29, 2016 |
February 28, 2015 |
||||||||||
| Subscription revenue: |
||||||||||||
| Infrastructure-related offerings |
$ | 1,696,443 | $ | 1,480,463 | $ | 1,324,693 | ||||||
| Application Development-related and other emerging technology offerings |
439,337 | 322,986 | 236,541 | |||||||||
|
|
|
|
|
|
|
|||||||
| Total subscription revenue |
2,135,780 | 1,803,449 | 1,561,234 | |||||||||
|
|
|
|
|
|
|
|||||||
| Training and services revenue: |
||||||||||||
| Consulting services |
207,959 | 190,870 | 171,436 | |||||||||
| Training |
68,064 | 57,911 | 56,819 | |||||||||
|
|
|
|
|
|
|
|||||||
| Total training and services revenue |
276,023 | 248,781 | 228,255 | |||||||||
|
|
|
|
|
|
|
|||||||
| Total revenue |
$ | 2,411,803 | $ | 2,052,230 | $ | 1,789,489 | ||||||
|
|
|
|
|
|
|
|||||||
NOTE 20—Other Long-Term Obligations
Other long-term obligations were comprised of the following (in thousands):
| February 28, 2017 |
February 29, 2016 |
|||||||
| Accrued income taxes |
$ | 76,718 | $ | 73,403 | ||||
| Deferred rent credits |
11,670 | 13,197 | ||||||
| Net deferred tax liability, non-current |
2,939 | 169 | ||||||
| Other |
2,638 | 1,143 | ||||||
|
|
|
|
|
|||||
| Total other long-term obligations |
$ | 93,965 | $ | 87,912 | ||||
|
|
|
|
|
|||||
NOTE 21—Convertible Notes
Convertible note offering
On October 7, 2014, the Company completed its offering of $805.0 million aggregate principal amount of its 0.25% Convertible Senior Notes due 2019 (the “convertible notes”). The convertible notes were sold in a private placement under a purchase agreement, dated as of October 1, 2014, entered into by and among the Company and the Initial Purchasers, for resale to qualified institutional buyers pursuant to Rule 144A under the Securities Act of 1933, as amended.
The Company used $148.0 million of the net proceeds from the offering of the convertible notes to pay the cost of the privately-negotiated convertible note hedge transactions described below. The Company received proceeds of $79.8 million from the sale of warrants pursuant to the warrant transactions described below.
In addition, the Company used $375.0 million of the net proceeds from the offering of the convertible notes to repurchase shares of its common stock under an accelerated share repurchase program pursuant to an agreement that the Company entered into on October 1, 2014, as described in NOTE 12—Stockholders’ Equity.
113
Table of Contents
Index to Financial Statements
RED HAT, INC.
NOTES TO CONSOLIDATED FINANCIAL STATEMENTS—(Continued)
The Company has and intends to continue to use the remaining net proceeds from the offering for working capital and other general corporate purposes, which may include capital expenditures, potential acquisitions or strategic transactions.
Indenture
On October 7, 2014, the Company entered into an indenture (the “Indenture”) with respect to the convertible notes with U.S. Bank National Association, as trustee (the “Trustee”). Under the Indenture, the convertible notes will be senior unsecured obligations of the Company and bear interest at a rate of 0.25% per year, payable semiannually in arrears on April 1 and October 1 of each year, beginning on April 1, 2015. The convertible notes will mature on October 1, 2019, unless previously purchased or converted.
The convertible notes are convertible into shares of the Company’s common stock at an initial conversion rate of 13.6219 shares per $1,000 principal amount of convertible notes (which is equivalent to an initial conversion price of approximately $73.41 per share), subject to adjustment upon the occurrence of certain events. The initial conversion price represents a premium of approximately 30% to the $56.47 per share closing price of the Company’s common stock on October 1, 2014. Upon conversion of the convertible notes, holders will receive cash or shares of the Company’s common stock or a combination thereof, at the Company’s election.
Prior to April 1, 2019, the convertible notes will be convertible only upon the occurrence of certain circumstances, and will be convertible thereafter at any time until the close of business on the second scheduled trading day immediately preceding the maturity date of the convertible notes.
The conversion rate is subject to customary anti-dilution adjustments. If certain corporate events described in the Indenture occur prior to the maturity date, the conversion rate will be increased for a holder who elects to convert its convertible notes in connection with such corporate event in certain circumstances.
The convertible notes are not redeemable prior to maturity, and no sinking fund is provided for the notes. If the Company undergoes a “fundamental change,” as defined in the Indenture, subject to certain conditions, holders may require the Company to purchase for cash all or any portion of their convertible notes. The fundamental change purchase price will be 100% of the principal amount of the convertible notes to be purchased plus any accrued and unpaid special interest up to but excluding the fundamental change purchase date.
The Indenture contains customary terms and covenants, including that upon certain events of default occurring and continuing, either the Trustee or the holders of at least 25% in principal amount of the outstanding convertible notes may declare 100% of the principal of, and accrued and unpaid interest, if any, on, all the convertible notes to be due and payable.
In accounting for the issuance of the convertible notes, the Company separated the convertible notes into liability and equity components. The carrying amount of the liability component was calculated by measuring the estimated fair value of a similar liability that does not have an associated convertible feature. The carrying amount of the equity component representing the conversion option was determined by deducting the fair value of the liability component from the face value of the convertible notes as a whole. The excess of the face value of the convertible notes as a whole over the carrying amount of the liability component (the “debt discount”) is amortized to interest expense over the term of the convertible notes using the effective interest method with an effective interest rate of 2.86% per annum. The equity component is not remeasured as long as it continues to meet the conditions for equity classification.
114
Table of Contents
Index to Financial Statements
RED HAT, INC.
NOTES TO CONSOLIDATED FINANCIAL STATEMENTS—(Continued)
The convertible notes consisted of the following (in thousands):
| February 28, 2017 |
February 29, 2016 |
|||||||
| Liability component: |
||||||||
| Principal |
$ | 805,000 | $ | 805,000 | ||||
| Less: debt issuance costs |
(7,442 | ) | (10,029 | ) | ||||
| Less: debt discount |
(51,925 | ) | (71,029 | ) | ||||
|
|
|
|
|
|||||
| Net carrying amount |
$ | 745,633 | $ | 723,942 | ||||
|
|
|
|
|
|||||
| Equity component (1) |
$ | 96,890 | $ | 96,890 | ||||
|
|
|
|
|
|||||
| (1) | Recorded in the Consolidated Balance Sheets in Additional paid-in capital. |
In accounting for the transaction costs related to the convertible note issuance, the Company allocated the total amount incurred of $15.2 million to the liability and equity components based on their relative fair values. Issuance costs attributable to the liability component totaled $13.4 million and are being amortized to interest expense over the term of the convertible notes using the effective interest method. The remaining $1.8 million of issuance costs have been allocated to the equity component and are included in Additional paid-in capital on the Company’s Consolidated Balance Sheet as of February 28, 2017. Additionally, the Company recorded a deferred tax asset of $0.7 million related to the $1.8 million equity component of transactional costs, which are deductible for tax purposes.
The following table includes total interest expense recognized related to the convertible notes (in thousands):
| Fiscal Years Ended | ||||||||||||
| February 28, 2017 |
February 29, 2016 |
February 28, 2015 |
||||||||||
| Coupon rate 0.25% per year, payable semiannually |
$ | 2,012 | $ | 2,012 | $ | 805 | ||||||
| Amortization of convertible note issuance costs—liability component |
2,587 | 2,433 | 935 | |||||||||
| Accretion of debt discount |
19,104 | 18,570 | 7,292 | |||||||||
|
|
|
|
|
|
|
|||||||
| Total interest expense related to convertible notes |
$ | 23,703 | $ | 23,015 | $ | 9,032 | ||||||
|
|
|
|
|
|
|
|||||||
The fair value of the convertible notes, which was determined based on inputs that are observable in the market (Level 2), and the carrying value of convertible notes (the carrying value excludes the equity component of the convertible notes classified in equity) is as follows (in thousands):
| February 28, 2017 | ||||||||
| Fair Value | Carrying Value | |||||||
| Convertible notes |
$ | 745,865 | $ | 745,633 | ||||
|
|
|
|
|
|||||
Convertible note hedge transactions and warrant transactions
On October 1, 2014, the Company entered into convertible note hedge transactions and warrant transactions with certain of the Initial Purchasers of the convertible notes or their respective affiliates (the “Option Counterparties”).
115
Table of Contents
Index to Financial Statements
RED HAT, INC.
NOTES TO CONSOLIDATED FINANCIAL STATEMENTS—(Continued)
The convertible note hedge transactions are expected to offset the potential dilution with respect to shares of the Company’s common stock upon any conversion of the convertible notes and/or offset any cash payments the Company is required to make in excess of the principal amount of the converted notes, as the case may be. To partially offset the $148.0 million cost of the convertible note hedge transactions, the Company issued warrants and received proceeds of $79.8 million. The number of shares of the Company’s common stock underlying the warrants total 10,965,630, the same number of shares underlying the convertible notes and the convertible note hedge transactions. The combination of the convertible note hedge transactions and the warrant transactions effectively increases the initial conversion price of the convertible notes from $73.41 per share to $101.65 per share. As a result, the warrant transactions will have a dilutive effect with respect to the Company’s common stock to the extent that the market price per share of the Company’s common stock, as measured under the terms of the warrant transactions, exceeds the $101.65 strike price of the warrants. However, subject to certain conditions, the Company may elect to settle all of the warrants in cash. The $101.65 strike price of the warrants represents a premium of approximately 80% over the $56.47 per share closing price of the Company’s common stock on October 1, 2014.
The purchase of convertible note hedges and proceeds from issuance of warrants were recorded in stockholders’ equity and will continue to be classified as stockholders’ equity.
NOTE 22—Unaudited Quarterly Results
Below are unaudited condensed quarterly results (in thousands, except per share data):
| Fiscal Year Ended February 28, 2017 | ||||||||||||||||
| (Unaudited) | ||||||||||||||||
| 4th Quarter |
3rd Quarter |
2nd Quarter |
1st Quarter |
|||||||||||||
| Revenue: |
||||||||||||||||
| Subscriptions |
$ | 559,588 | $ | 543,318 | $ | 531,209 | $ | 501,665 | ||||||||
| Training and services |
69,252 | 71,942 | 68,595 | 66,234 | ||||||||||||
|
|
|
|
|
|
|
|
|
|||||||||
| Total subscription and training and services revenue |
$ | 628,840 | $ | 615,260 | $ | 599,804 | $ | 567,899 | ||||||||
| Gross profit |
$ | 536,633 | $ | 524,807 | $ | 512,134 | $ | 483,851 | ||||||||
| Income from operations |
$ | 94,225 | $ | 80,773 | $ | 81,884 | $ | 75,363 | ||||||||
| Interest income |
$ | 3,754 | $ | 3,346 | $ | 3,391 | $ | 3,430 | ||||||||
| Interest expense |
$ | 6,002 | $ | 6,009 | $ | 5,924 | $ | 5,887 | ||||||||
| Other income (expense), net |
$ | (304 | ) | $ | (1,392 | ) | $ | 85 | $ | (553 | ) | |||||
| Net income, basic and diluted |
$ | 65,803 | $ | 67,943 | $ | 58,773 | $ | 61,184 | ||||||||
| Net income per common share (1): |
||||||||||||||||
| Basic |
$ | 0.37 | $ | 0.38 | $ | 0.33 | $ | 0.34 | ||||||||
| Diluted |
$ | 0.36 | $ | 0.37 | $ | 0.32 | $ | 0.33 | ||||||||
| Weighted average shares outstanding: |
||||||||||||||||
| Basic |
177,802 | 179,233 | 180,322 | 181,168 | ||||||||||||
| Diluted |
181,197 | 182,682 | 183,346 | 184,187 | ||||||||||||
| (1) | Earnings per common share are computed independently for each of the quarters presented. Therefore, the sum of the quarterly per common share information may not equal the reported annual earnings per common share. |
116
Table of Contents
Index to Financial Statements
RED HAT, INC.
NOTES TO CONSOLIDATED FINANCIAL STATEMENTS—(Continued)
| Fiscal Year Ended February 29, 2016 | ||||||||||||||||
| (Unaudited) | ||||||||||||||||
| 4th Quarter |
3rd Quarter |
2nd Quarter |
1st Quarter |
|||||||||||||
| (in thousands, except per share data) | ||||||||||||||||
| Revenue: |
||||||||||||||||
| Subscriptions |
$ | 479,642 | $ | 457,488 | $ | 441,526 | $ | 424,793 | ||||||||
| Training and services |
63,859 | 66,092 | 62,622 | 56,208 | ||||||||||||
| Total subscription and training and services revenue |
$ | 543,501 | $ | 523,580 | $ | 504,148 | $ | 481,001 | ||||||||
| Gross profit |
$ | 462,281 | $ | 442,532 | $ | 428,184 | $ | 409,604 | ||||||||
| Income from operations |
$ | 71,771 | $ | 68,877 | $ | 76,470 | $ | 70,930 | ||||||||
| Interest income |
$ | 3,189 | $ | 2,874 | $ | 2,895 | $ | 2,715 | ||||||||
| Interest expense |
$ | 5,856 | $ | 5,817 | $ | 5,733 | $ | 5,715 | ||||||||
| Other income (expense), net |
$ | (336 | ) | $ | 49 | $ | (1,245 | ) | $ | (203 | ) | |||||
| Net income, basic and diluted |
$ | 53,036 | $ | 46,848 | $ | 51,395 | $ | 48,086 | ||||||||
| Net income per common share (1): |
||||||||||||||||
| Basic |
$ | 0.29 | $ | 0.26 | $ | 0.28 | $ | 0.26 | ||||||||
| Diluted |
$ | 0.29 | $ | 0.25 | $ | 0.28 | $ | 0.26 | ||||||||
| Weighted average shares outstanding: |
||||||||||||||||
| Basic |
182,099 | 182,850 | 183,179 | 183,130 | ||||||||||||
| Diluted |
184,888 | 186,094 | 186,750 | 186,175 | ||||||||||||
| (1) | Earnings per common share are computed independently for each of the quarters presented. Therefore, the sum of the quarterly per common share information may not equal the reported annual earnings per common share. |
117
Table of Contents
Index to Financial Statements
| ITEM 9. | CHANGES IN AND DISAGREEMENTS WITH ACCOUNTANTS ON ACCOUNTING AND FINANCIAL DISCLOSURE |
There were no changes in or disagreements with our accountants on accounting and financial disclosure matters.
| ITEM 9A. | CONTROLS AND PROCEDURES |
Role of Controls and Procedures
Our management, including our chief executive officer and chief financial officer, does not expect that our disclosure controls and procedures (as defined in Rules 13a-15(e) and 15d-15(e) under the Securities Exchange Act) or our internal control over financial reporting (as defined in Rules 13a-15(f) and 15d-15(f) under the Securities Exchange Act) will prevent all errors and all fraud. A control system, no matter how well designed and operated, can provide only reasonable, not absolute, assurance that the control system’s objectives will be met. Further, the design of a control system must reflect the fact that there are resource constraints, and the benefits of the controls must be considered relative to their costs. Because of the inherent limitations in all control systems, no evaluation of controls can provide absolute assurance that all control issues and instances of fraud, if any, within a company have been detected. These inherent limitations include the realities that judgments in decision-making can be faulty and that breakdowns can occur because of simple error and mistake. Controls can also be circumvented by the individual acts of some persons, by collusion of two or more people, or by management override of the controls. The design of any system of controls is based in part on certain assumptions about the likelihood of future events. Because of the inherent limitations in a cost-effective control system, misstatements due to error or fraud may occur and not be detected. Also projections of any evaluation of effectiveness of controls and procedures to future periods are subject to the risk that the controls and procedures may become inadequate because of changes in conditions, or that the degree of compliance with the controls and procedures may have deteriorated.
Evaluation of Disclosure Controls and Procedures
Our management, with the participation of our chief executive officer and chief financial officer, evaluated the effectiveness of our disclosure controls and procedures as of the end of the period covered by this report. Based on this evaluation, our chief executive officer and chief financial officer concluded that, as of the end of the period covered by this report, our disclosure controls and procedures were effective at a reasonable assurance level.
Report of Management on Internal Control Over Financial Reporting
Report of Management on Internal Control Over Financial Reporting is set forth above under Part II, Item 8, “Financial Statements and Supplementary Data—Report of Management on Internal Control Over Financial Reporting.”
Changes in Internal Control Over Financial Reporting
No changes in our internal control over financial reporting occurred during the fiscal quarter ended February 28, 2017 that have materially affected, or are reasonably likely to materially affect, our internal control over financial reporting.
| ITEM 9B. | OTHER INFORMATION |
None.
118
Table of Contents
Index to Financial Statements
PART III
| ITEM 10. | DIRECTORS, EXECUTIVE OFFICERS AND CORPORATE GOVERNANCE |
We intend to file with the SEC a definitive proxy statement with respect to our Annual Meeting of Stockholders to be held on August 10, 2017 (the “2017 Annual Meeting”). The information under the sections entitled “Governance,” “Executive Compensation” and “Other Matters” from the definitive proxy statement for the 2017 Annual Meeting, which is to be filed with the SEC not later than 120 days after the close of fiscal 2017 (the “2017 Proxy Statement”), is hereby incorporated by reference.
| ITEM 11. | EXECUTIVE COMPENSATION |
The information under the sections entitled “Governance,” “Executive Compensation” and “Other Matters” from the 2017 Proxy Statement is hereby incorporated by reference.
| ITEM 12. | SECURITY OWNERSHIP OF CERTAIN BENEFICIAL OWNERS AND MANAGEMENT AND RELATED STOCKHOLDER MATTERS |
The information under the sections entitled “Beneficial Ownership of Our Common Stock,” “Executive Compensation” and “Other Matters” from the 2017 Proxy Statement is hereby incorporated by reference.
| ITEM 13. | CERTAIN RELATIONSHIPS AND RELATED TRANSACTIONS, AND DIRECTOR INDEPENDENCE |
The information under the section entitled “Governance” from the 2017 Proxy Statement is hereby incorporated by reference.
| ITEM 14. | PRINCIPAL ACCOUNTANT FEES AND SERVICES |
The information under the section entitled “Audit Matters” from the 2017 Proxy Statement is hereby incorporated by reference.
119
Table of Contents
Index to Financial Statements
PART IV
| ITEM 15. | EXHIBITS AND FINANCIAL STATEMENT SCHEDULES |
(a) The following documents are filed as part of this Report:
1. Financial Statements:
| 73 | ||||
| Consolidated Balance Sheets at February 28, 2017 and February 29, 2016 |
74 | |||
| 75 | ||||
| 76 | ||||
| 77 | ||||
| 78 | ||||
| 79 |
2. Financial Statement Schedules:
All other schedules for which provision is made in the applicable accounting regulations of the SEC are not required under the related instructions or are inapplicable and therefore have been omitted.
3. List of Exhibits:
| Exhibit No. |
Description of Exhibits | |
| 3.1+ | Fourth Amended and Restated Certificate of Incorporation of Red Hat, Inc. (incorporated by reference to Exhibit 3.3 to the registrant’s Current Report on Form 8-K filed with the SEC on August 13, 2013 (File no. 001-33162)) | |
| 3.2+ | Amended and Restated By-Laws of Red Hat, Inc. (incorporated by reference to Exhibit 3.1 to the registrant’s Quarterly Report on Form 10-Q filed with the SEC on October 7, 2015 (File no. 001-33162)) | |
| 4.1+ | Specimen certificate representing the common stock of the registrant (incorporated by reference to Exhibit 4.1 to the registrant’s Registration Statement on Form S-1/A filed with the SEC on July 19, 1999 (File no. 333-80051)) | |
| 4.2+ | See Exhibits 3.1 and 3.2 for provisions of the Certificate of Incorporation and By-Laws of the registrant defining the rights of holders of common stock of the registrant | |
| 4.3+ | Indenture (including form of Note) with respect to Red Hat’s 0.25% Convertible Senior Notes due 2019, dated as of October 7, 2014, between Red Hat, Inc. and U.S. Bank National Association, as trustee (incorporated by reference to Exhibit 4.1 to the registrant’s Current Report on Form 8-K filed with the SEC on October 7, 2014 (File no. 001-33162)) | |
| 10.1+* | Red Hat, Inc. 2004 Long-Term Incentive Plan, as amended and restated effective August 14, 2008 (incorporated by reference to Exhibit 10.5 to the registrant’s Annual Report on Form 10-K filed with the SEC on April 24, 2014 (File no. 001-33162)) | |
| 10.2+* | Form of Indemnification Agreement (incorporated by reference to Exhibit 10.10 to the registrant’s Annual Report on Form 10-K filed with the SEC on April 25, 2012 (File no. 001-33162)) | |
| 10.3+* | Letter Agreement dated May 10, 2012, between Red Hat, Inc. and Arun Oberoi (incorporated by reference to Exhibit 10.3 to the registrant’s Quarterly Report on Form 10-Q filed with the SEC on July 6, 2012 (File no. 001-33162)) | |
120
Table of Contents
Index to Financial Statements
| Exhibit No. |
Description of Exhibits | |
| 10.4+* | Senior Management Change in Control Severance Policy (incorporated by reference to Exhibit 10.14 to the registrant’s Annual Report on Form 10-K filed with the SEC on April 25, 2012 (File no. 001-33162)) | |
| 10.5+* | Executive Variable Compensation Plan (incorporated by reference to Exhibit 10.15 to the registrant’s Annual Report on Form 10-K filed with the SEC on April 25, 2013 (File no. 001-33162)) | |
| 10.6+* | Executive Employment Agreement, dated December 19, 2007, between Red Hat, Inc. and James M. Whitehurst (incorporated by reference to Exhibit 10.18 to the registrant’s Annual Report on Form 10-K filed with the SEC on April 25, 2013 (File no. 001-33162)) | |
| 10.7+* | Form of Director Deferred Stock Unit Agreement (Vested) adopted June 19, 2008 (incorporated by reference to Exhibit 10.12 to the registrant’s Annual Report on Form 10-K filed with the SEC on April 24, 2014 (File no. 001-33162)) | |
| 10.8+* | Form of Director Deferred Stock Unit Agreement (With Vesting) adopted June 19, 2008 (incorporated by reference to Exhibit 10.13 to the registrant’s Annual Report on Form 10-K filed with the SEC on April 24, 2014 (File no. 001-33162)) | |
| 10.9+* | Form of Director Restricted Stock Agreement adopted June 19, 2008 (incorporated by reference to Exhibit 10.14 to the registrant’s Annual Report on Form 10-K filed with the SEC on April 24, 2014 (File no. 001-33162)) | |
| 10.10+* | Senior Management Severance Plan (incorporated by reference to Exhibit 10.15 to the registrant’s Annual Report on Form 10-K filed with the SEC on April 24, 2014 (File no. 001-33162)) | |
| 10.11+* | Form of Executive Agreement by and between Red Hat, Inc. and each participant in the registrant’s Senior Management Severance Plan (incorporated by reference to Exhibit 10.16 to the registrant’s Annual Report on Form 10-K filed with the SEC on April 24, 2014 (File no. 001-33162)) | |
| 10.12+* | Letter Agreement dated December 23, 2008 between Red Hat, Inc. and James M. Whitehurst amending the Executive Employment Agreement between the parties dated December 19, 2007 (incorporated by reference to Exhibit 10.17 to the registrant’s Annual Report on Form 10-K filed with the SEC on April 24, 2014 (File no. 001-33162)) | |
| 10.13+* | Employee Inventions Assignment and Restrictive Obligations Agreement dated January 1, 2008 between Red Hat, Inc. and James M. Whitehurst (incorporated by reference to Exhibit 10.18 to the registrant’s Annual Report on Form 10-K filed with the SEC on April 24, 2014 (File no. 001-33162)) | |
| 10.14+* | Clawback Policy of Red Hat, Inc. adopted May 13, 2009 (incorporated by reference to Exhibit 10.16 to the registrant’s Annual Report on Form 10-K filed with the SEC on April 28, 2015 (File no. 001-33162)) | |
| 10.15+* | Red Hat, Inc. Stock Ownership Policy for Directors and Senior Executives, amended and restated as of September 20, 2016 (incorporated by reference to Exhibit 99.1 to the registrant’s Current Report on Form 8-K filed with the SEC on September 26, 2016 (File no. 001-33162)) | |
| 10.16+* | Form of Performance Restricted Stock Agreement adopted May 19, 2010 (incorporated by reference to Exhibit 99.4 to the registrant’s Current Report on Form 8-K filed with the SEC on May 25, 2010 (File no. 001-33162)) | |
| 10.17+* | Form of Restricted Stock Unit Agreement (Non-Executive Participants) adopted August 11, 2010 (incorporated by reference to Exhibit 10.1 to the registrant’s Quarterly Report on Form 10-Q filed with the SEC on October 8, 2010 (File no. 001-33162)) | |
121
Table of Contents
Index to Financial Statements
| Exhibit No. |
Description of Exhibits | |
| 10.18+* | Executive Base Salaries and Target Award Amounts under Red Hat, Inc.’s Executive Variable Compensation Plan for the Fiscal Year Ending February 28, 2015 (incorporated by reference to Exhibit 99.1 to the registrant’s Current Report on Form 8-K filed with the SEC on May 27, 2014 (File no. 001-33162)) | |
| 10.19+* | Executive Base Salaries and Target Award Amounts under Red Hat, Inc.’s Executive Variable Compensation Plan for the Fiscal Year Ending February 29, 2016 (incorporated by reference to Exhibit 99.1 to the registrant’s Current Report on Form 8-K filed with the SEC on May 22, 2015 (File no. 001-33162)) | |
| 10.20+* | Current Executive Base Salaries (incorporated by reference to Exhibit 99.1 to the registrant’s Current Report on Form 8-K filed with the SEC on May 24, 2016 (File no. 001-33162)) | |
| 10.21+* | Target Award Percentages under Red Hat, Inc.’s Executive Variable Compensation Plan for the Fiscal Year Ending February 28, 2017 (incorporated by reference to Exhibit 99.2 to the registrant’s Current Report on Form 8-K filed with the SEC on May 24, 2016 (File no. 001-33162)) | |
| 10.22+* | Peer Group for PSUs Granted in FY 2015 (incorporated by reference to Exhibit 99.2 to the registrant’s Current Report on Form 8-K filed with the SEC on May 27, 2014 (File no. 001-33162)) | |
| 10.23+* | Peer Group for PSUs Granted in FY 2016 (incorporated by reference to Exhibit 99.2 to the registrant’s Current Report on Form 8-K filed with the SEC on May 22, 2015 (File no. 001-33162)) | |
| 10.24+* | Peer Group for PSUs Granted in FY 2017 (incorporated by reference to Exhibit 99.3 to the registrant’s Current Report on Form 8-K filed with the SEC on May 24, 2016 (File no. 001-33162)) | |
| 10.25+* | Red Hat, Inc. 2011 Performance Compensation Plan (incorporated by reference to Exhibit 10.1 to the registrant’s Current Report on Form 8-K filed with the SEC on August 16, 2011 (File no. 001-33162)) | |
| 10.26+ | Sublease Agreement, dated as of December 27, 2011, by and between Carolina Power & Light Company, a North Carolina corporation, d/b/a Progress Energy Carolinas, Inc. and Red Hat, Inc. (incorporated by reference to Exhibit 10.44 to the registrant’s Annual Report on Form 10-K filed with the SEC on April 25, 2012 (File no. 001-33162)) | |
| 10.27+* | Red Hat, Inc. 2010 Non-Employee Director Compensation Plan, as amended and restated effective January 1, 2013 (incorporated by reference to Exhibit 10.34 to the registrant’s Annual Report on Form 10-K filed with the SEC on April 24, 2014 (File no. 001-33162)) | |
| 10.28+* | Red Hat, Inc. 2004 Long-Term Incentive Plan, as amended and restated effective August 9, 2012 (incorporated by reference to Exhibit 10.1 to the registrant’s Quarterly Report on Form 10-Q filed with the SEC on October 5, 2012 (File no. 001-33162)) | |
| 10.29+* | Form of Operating Performance Share Unit Agreement adopted May 22, 2013 (incorporated by reference to Exhibit 99.2 to the registrant’s Current Report on Form 8-K filed with the SEC on May 29, 2013 (File no. 001-33162)) | |
| 10.30+* | Form of Total Stockholder Return Performance Share Unit Agreement adopted May 22, 2013 (incorporated by reference to Exhibit 99.3 to the registrant’s Current Report on Form 8-K filed with the SEC on May 29, 2013 (File no. 001-33162)) | |
122
Table of Contents
Index to Financial Statements
| Exhibit No. |
Description of Exhibits | |
| 10.31+* | Form of 162(m) Restricted Stock Agreement adopted May 22, 2013 (incorporated by reference to Exhibit 99.5 to the registrant’s Current Report on Form 8-K filed with the SEC on May 29, 2013 (File no. 001-33162)) | |
| 10.32+* | TSR Hurdle Performance Share Units Granted to Certain Named Executive Officers on August 6, 2014 (incorporated by reference to Exhibit 99.1 to the registrant’s Current Report on Form 8-K filed with the SEC on August 12, 2014 (File no. 001-33162)) | |
| 10.33+* | Form of Performance Share Unit Agreement (TSR Hurdle Form) adopted August 6, 2014 (incorporated by reference to Exhibit 10.2 to the registrant’s Quarterly Report on Form 10-Q filed with the SEC on September 29, 2014 (File no. 001-33162)) | |
| 10.34+ | Form of Call Option Confirmation between Red Hat, Inc. and each Option Counterparty (incorporated by reference to Exhibit 10.1 to the registrant’s Current Report on Form 8-K filed with the SEC on October 7, 2014 (File no. 001-33162)) | |
| 10.35+ | Form of Warrant Confirmation between Red Hat, Inc. and each Option Counterparty (incorporated by reference to Exhibit 10.2 to the registrant’s Current Report on Form 8-K filed with the SEC on October 7, 2014 (File no. 001-33162)) | |
| 10.36+ | Master Confirmation between Goldman, Sachs & Co. and Red Hat, Inc., dated October 2, 2014 (incorporated by reference to Exhibit 10.3 to the registrant’s Current Report on Form 8-K filed with the SEC on October 7, 2014 (File no. 001-33162)) | |
| 10.37+ | Supplemental Confirmation between Goldman, Sachs & Co. and Red Hat, Inc., dated October 2, 2014 (incorporated by reference to Exhibit 10.4 to the registrant’s Current Report on Form 8-K filed with the SEC on October 7, 2014 (File no. 001-33162)) | |
| 10.38+* | Policy on Gross-up Payments for Excise Taxes Payable under Section 4999 (incorporated by reference to Exhibit 10.44 to the registrant’s Annual Report on Form 10-K filed with the SEC on April 28, 2015 (File no. 001-33162)) | |
| 10.39+* | Letter Agreement dated June 17, 2015, between Red Hat, Inc. and Frank A. Calderoni (incorporated by reference to Exhibit 10.1 to the registrant’s Quarterly Report on Form 10-Q filed with the SEC on October 7, 2015 (File no. 001-33162)) | |
| 10.40+* | Bonus Agreement dated June 21, 2015, between Red Hat, Inc. and Frank A. Calderoni (incorporated by reference to Exhibit 10.2 to the registrant’s Quarterly Report on Form 10-Q filed with the SEC on October 7, 2015 (File no. 001-33162)) | |
| 10.41+* | Red Hat, Inc. 2016 Performance Compensation Plan (incorporated by reference to Exhibit 10.1 to the registrant’s Current Report on Form 8-K filed with the SEC on August 16, 2016 (File no. 001-33162)) | |
| 10.42+* | Red Hat, Inc. 2016 Employee Stock Purchase Plan (incorporated by reference to Exhibit 10.2 to the registrant’s Current Report on Form 8-K filed with the SEC on August 16, 2016 (File no. 001-33162)) | |
| 10.43+* | Letter Agreement dated January 20, 2017, between Red Hat, Inc. and Frank A. Calderoni (incorporated by reference to Exhibit 99.1 to the registrant’s Current Report on Form 8-K filed with the SEC on January 25, 2017 (File no. 001-33162)) | |
| 10.44* | Cash Retention Agreement dated November 2, 2015 between Eric R. Shander and Red Hat, Inc. | |
| 10.45* | Offer Letter dated November 2, 2015 between Eric R. Shander and Red Hat, Inc. | |
| 10.46* | U.S. Employee Agreement, dated November 24, 2015, between Eric R. Shander and Red Hat, Inc. | |
| 10.47* | Designated U.S. Manager Severance Plan | |
123
Table of Contents
Index to Financial Statements
| Exhibit No. |
Description of Exhibits | |
| 10.48* | Letter Agreement dated January 20, 2017 between Eric R. Shander and Red Hat, Inc. | |
| 21.1 | Subsidiaries of Red Hat, Inc. | |
| 23.1 | Consent of PricewaterhouseCoopers LLP | |
| 31.1 | Certification of the registrant’s Chief Executive Officer pursuant to Rule 13a-14(a)/Rule 15d-14(a) under the Securities Exchange Act of 1934, as amended, as adopted pursuant to Section 302 of the Sarbanes-Oxley Act of 2002 | |
| 31.2 | Certification of the registrant’s Chief Financial Officer pursuant to Rule 13a-14(a)/Rule 15d-14(a) under the Securities Exchange Act of 1934, as amended, as adopted pursuant to Section 302 of the Sarbanes-Oxley Act of 2002 | |
| 32.1 | Certification of the registrant’s principal executive officer and principal financial officer pursuant to 18 U.S.C. Section 1350 | |
| 101.INS | XBRL Instance Document | |
| 101.SCH | XBRL Taxonomy Extension Schema | |
| 101.CAL | XBRL Taxonomy Extension Calculation Linkbase | |
| 101.DEF | XBRL Taxonomy Extension Definition Linkbase | |
| 101.LAB | XBRL Taxonomy Extension Label Linkbase | |
| 101.PRE | XBRL Taxonomy Extension Presentation Linkbase | |
| + | Previously filed. |
| * | Indicates a management contract or compensatory plan, contract or arrangement. |
| ITEM 16. | FORM 10-K SUMMARY |
None.
124
Table of Contents
Index to Financial Statements
SIGNATURES
Pursuant to the requirements of Section 13 or 15(d) of the Securities Exchange Act of 1934, the registrant has duly caused this report to be signed on its behalf by the undersigned, thereunto duly authorized.
| RED HAT, INC. | ||
| By: | /S/ JAMES M. WHITEHURST | |
| James M. Whitehurst President and Chief Executive Officer | ||
Date: April 26, 2017
Pursuant to the requirements of the Securities Exchange Act of 1934, this report has been signed below by the following persons on behalf of the registrant and in the capacities and on the dates indicated.
| Signature |
Title |
Date | ||
| /S/ JAMES M. WHITEHURST James M. Whitehurst |
President, Chief Executive Officer and Director (principal executive officer) |
April 26, 2017 | ||
| /S/ ERIC R. SHANDER Eric R. Shander |
Executive Vice President, Chief Financial Officer (principal financial officer and principal accounting officer) |
April 26, 2017 | ||
| /S/ SOHAIB ABBASI Sohaib Abbasi |
Director |
April 26, 2017 | ||
| /S/ W. STEVE ALBRECHT W. Steve Albrecht |
Director |
April 26, 2017 | ||
| /S/ CHARLENE T. BEGLEY Charlene T. Begley |
Director |
April 26, 2017 | ||
| /S/ NARENDRA K. GUPTA Narendra K. Gupta |
Director |
April 26, 2017 | ||
| /S/ KIMBERLY L. HAMMONDS Kimberly L. Hammonds |
Director |
April 26, 2017 | ||
| /S/ WILLIAM S. KAISER William S. Kaiser |
Director |
April 26, 2017 | ||
| /S/ DONALD H. LIVINGSTONE Donald H. Livingstone |
Director |
April 26, 2017 | ||
| /S/ HENRY HUGH SHELTON Henry Hugh Shelton |
Chair of the Board of Directors |
April 26, 2017 | ||
125
Table of Contents
Index to Financial Statements
EXHIBIT INDEX
| Exhibit No. |
Description of Exhibits | |
| 10.44* | Cash Retention Agreement dated November 2, 2015 between Eric R. Shander and Red Hat, Inc. | |
| 10.45* | Offer Letter dated November 2, 2015 between Eric R. Shander and Red Hat, Inc. | |
| 10.46* | U.S. Employee Agreement, dated November 24, 2015, between Eric R. Shander and Red Hat, Inc. | |
| 10.47* | Designated U.S. Manager Severance Plan | |
| 10.48* | Letter Agreement dated January 20, 2017 between Eric R. Shander and Red Hat, Inc. | |
| 21.1 | Subsidiaries of Red Hat, Inc. | |
| 23.1 | Consent of PricewaterhouseCoopers LLP | |
| 31.1 | Certification of the registrant’s Chief Executive Officer pursuant to Rule 13a-14(a)/Rule 15(d)-14(a) under the Securities Exchange Act of 1934, as amended, as adopted pursuant to Section 302 of the Sarbanes-Oxley Act of 2002 | |
| 31.2 | Certification of the registrant’s Chief Financial Officer pursuant to Rule 13a-14(a)/Rule 15(d)-14(a) under the Securities Exchange Act of 1934, as amended, as adopted pursuant to Section 302 of the Sarbanes-Oxley Act of 2002 | |
| 32.1 | Certification of the registrant’s principal executive officer and principal financial officer pursuant to 18 U.S.C. Section 1350 | |
| 101.INS | XBRL Instance Document | |
| 101.SCH | XBRL Taxonomy Extension Schema | |
| 101.CAL | XBRL Taxonomy Extension Calculation Linkbase | |
| 101.DEF | XBRL Taxonomy Extension Definition Linkbase | |
| 101.LAB | XBRL Taxonomy Extension Label Linkbase | |
| 101.PRE | XBRL Taxonomy Extension Presentation Linkbase | |
| * | Indicates a management contract or compensatory plan, contract or arrangement. |
126