Attached files
Table of Contents
UNITED STATES
SECURITIES AND EXCHANGE COMMISSION
Washington, D.C. 20549
FORM 10-K
Annual Report Pursuant to Sections 13 or 15(d) of the Securities Exchange Act of 1934
(Mark One)
| x | Annual Report Pursuant to Section 13 or 15(d) of the Securities Exchange Act of 1934 |
For the fiscal year ended February 28, 2010
OR
| ¨ | Transition Report Pursuant to Section 13 or 15(d) of the Securities Exchange Act of 1934 |
For the transition period from to .
Commission File Number: 001-33162
RED HAT, INC.
(Exact name of registrant as specified in its charter)
Delaware
(State of Incorporation)
06-1364380
(I.R.S. Employer Identification No.)
1801 Varsity Drive, Raleigh, North Carolina 27606
(Address of principal executive offices, including zip code)
(919) 754-3700
(Registrant’s telephone number, including area code)
Securities registered pursuant to Section 12(b) of the Act:
| Title of each class |
Name of each exchange on which registered | |
| Common Stock, $0.0001 par value |
New York Stock Exchange |
Securities registered pursuant to Section 12(g) of the Act: None
Indicate by check mark if the registrant is a well-known seasoned issuer, as defined in Rule 405 of the Securities Act. Yes x No ¨
Indicate by check mark if the registrant is not required to file reports pursuant to Section 13 or Section 15(d) of the Act. Yes ¨ No x
Indicate by check mark whether the registrant (1) has filed all reports required to be filed by Section 13 or 15(d) of the Securities Exchange Act of 1934 during the preceding 12 months (or for such shorter period that the registrant was required to file such reports), and (2) has been subject to such filing requirements for the past 90 days. Yes x No ¨
Indicate by check mark whether the registrant has submitted electronically and posted on its corporate Web site, if any, every Interactive Data File required to be submitted and posted pursuant to Rule 405 of Regulation S-T (§232.405 of this chapter) during the preceding 12 months (or for such shorter period that the registrant was required to submit and post such files). Yes ¨ No ¨
Indicate by check mark if disclosure of delinquent filers pursuant to Item 405 of Regulation S-K is not contained herein and will not be contained, to the best of registrant’s knowledge, in definitive proxy or information statements incorporated by reference in Part III of this Form 10-K or any amendment to this Form 10-K. x
Indicate by check mark whether the registrant is a large accelerated filer, an accelerated filer, a non-accelerated filer, or a smaller reporting company. See the definitions of “large accelerated filer,” “accelerated filer” and “smaller reporting company” in Rule 12b-2 of the Exchange Act. (Check one):
| Large accelerated filer x |
Accelerated filer ¨ | |
| Non-accelerated filer ¨ (Do not check if a smaller reporting company) |
Smaller reporting company ¨ |
Indicate by check mark whether the registrant is a shell company (as defined in Rule 12b-2 of the Exchange Act). Yes ¨ No x
The aggregate market value of the common equity held by non-affiliates of the registrant as of August 31, 2009 was approximately $3.2 billion based on the closing price of $22.96 of our common stock as reported by the New York Stock Exchange on August 31, 2009. For purposes of the immediately preceding sentence, the term “affiliate” consists of each director, executive officer and greater than 10% stockholder of the registrant. There were 188,643,958 shares of common stock outstanding as of April 23, 2010.
DOCUMENTS INCORPORATED BY REFERENCE
Portions of Red Hat, Inc.’s Definitive Proxy Statement to be filed with the Securities and Exchange Commission and delivered to stockholders in connection with its annual meeting of stockholders to be held on August 12, 2010 are incorporated by reference into Part III of this Form 10-K. With the exception of the portions of the Proxy Statement expressly incorporated into this Annual Report on Form 10-K by reference, such documents shall not be deemed filed as part of this Annual Report on Form 10-K.
Table of Contents
| Page No. | ||||
| PART I | ||||
| Item 1. | 3 | |||
| Item 1A. | 19 | |||
| Item 1B. | 34 | |||
| Item 2. | 34 | |||
| Item 3. | 34 | |||
| Item 4. | 36 | |||
| PART II | ||||
| Item 5. | 37 | |||
| Item 6. | 40 | |||
| Item 7. | Management’s Discussion and Analysis of Financial Condition and Results of Operations |
42 | ||
| Item 7A. | 60 | |||
| Item 8. | 62 | |||
| Item 9. | Changes in and Disagreements With Accountants on Accounting and Financial Disclosure |
103 | ||
| Item 9A. | 103 | |||
| Item 9B. | 103 | |||
| PART III | ||||
| Item 10. | 104 | |||
| Item 11. | 104 | |||
| Item 12. | Security Ownership of Certain Beneficial Owners and Management and Related Stockholder Matters |
104 | ||
| Item 13. | Certain Relationships and Related Transactions, and Director Independence |
104 | ||
| Item 14. | 104 | |||
| PART IV | ||||
| Item 15. | 105 | |||
2
Table of Contents
| ITEM 1. | BUSINESS |
OVERVIEW
We are a global leader in providing open source software solutions to the enterprise, including our core enterprise operating system platform, Red Hat Enterprise Linux, our enterprise middleware platform, JBoss Enterprise Middleware, our virtualization solutions and other Red Hat enterprise technologies. We employ an open source software development and licensing model that uses the collaborative input of an international community of contributors to develop and enhance software. We actively participate in this community-oriented development process, often in a leadership role, and leverage it to create our Red Hat- and JBoss-branded enterprise technologies.
We believe the open source development and licensing models offer advantages over the proprietary software development and licensing models both for Red Hat and our customers. Through the open source development model, we leverage the community of developers and users, whose collective resources and knowledge supplement the developers we employ. As a result, we believe we are able to offer functionality enhancements and upgrades more quickly and with less development cost than is typical of many proprietary software vendors. In turn, our customers are able to take advantage of the quality and value of open source software, which we help develop, aggregate, integrate, test, certify, deliver, maintain and support for their enterprise use.
The collectively developed software is distributed under open source licenses, such as the GNU General Public License and GNU Lesser General Public License, permitting access to the human-readable software source code. These licenses also provide relatively broad rights for licensees to use, copy, modify and distribute open source software. These broad rights afford significant latitude for our customers to inspect, suggest changes, customize or enhance the software if they so choose.
Red Hat’s participation in the community-driven development process is illustrated by Red Hat’s sponsorship role in the Fedora Project and the JBoss.org communities. This participation enables us to leverage the efforts of these international communities, which we believe allows us to reduce both development cost and time and to enhance community acceptance and support of our products and technologies. Thus, we are able to use the Fedora Project and the JBoss.org communities as proving grounds and virtual laboratories for new technology that we can draw upon for inclusion in our enterprise technologies. Additionally, the open and transparent nature of these projects provides our customers and potential customers with access and insights into the future direction of Red Hat products and technologies.
We offer a choice of operating systems and virtualization options for servers, work stations, mainframes and desktops that support multiple application areas, including the data center, cloud deployments, software as a service, edge-of-the-network applications, information technology infrastructure (applications such as database, ERP and large web servers), mainframe computing, corporate desktop and technical/developer workstations.
JBoss Enterprise Middleware delivers a range of middleware products for developing, integrating, deploying and managing distributed composite and web-based applications. JBoss Enterprise Middleware is based on the Java programming language that enables the deployment of service-oriented architectures. JBoss Enterprise Middleware provides an application infrastructure for building and deploying distributed applications that are accessible via the Internet, corporate intranets, extranets, clouds and virtual private networks. Examples of applications deployed on JBoss Enterprise Middleware include hotel and airline reservations, online banking, credit card processing, securities trading, healthcare systems, customer and partner portals, retail and point-of-sale systems and telecommunications network infrastructure.
3
Table of Contents
Our hosted content distribution services, Red Hat Network (“RHN”) and JBoss Customer Support Portal (“JBoss CSP”), permit these Red Hat enterprise technologies to be updated and configured. Our management offerings, Red Hat Network Satellite (“RHN Satellite”) and JBoss Operations Network (“JBoss ON”), permit our customers to provision, update, monitor and manage these and other technologies in an automated fashion. Our suite of training and other professional service offerings also enable enterprise customers to leverage the performance and scalability benefits of our enterprise technologies in their environments.
We also provide other infrastructure enterprise technologies, including software development tools, higher availability clustering of systems and services, and directory services. We intend to continue to expand capabilities available under our open source architecture to help meet the performance, security, reliability and scalability requirements critical to the enterprise. In addition, we also offer a range of consulting, training and support services that are designed to help our customers derive additional value from Red Hat enterprise technologies.
In addition to our development and licensing models, we believe that our business model differentiates Red Hat from many software companies. We provide Red Hat enterprise technologies under annual or multi-year subscriptions. Through the life of a subscription, a customer is entitled to specified levels of support as well as security updates, bug fixes, functionality enhancements and upgrades to the technology, when and if available, via our hosted content distribution services (i.e., RHN and JBoss CSP). This business model allows the customer to access consistent improvements to and innovations in our technologies and the services it needs for the duration of the subscription.
We sell subscriptions to Red Hat enterprise technologies directly to customers and indirectly through various channels of distribution. We sell directly to customers through our sales force and our web store. Our indirect sales channels include distributors, systems integrators, resellers, telecom/network technology companies, cloud computing providers, hosting providers and independent software vendors (“ISVs”). In addition, leading global server and workstation hardware vendors support and pre-load Red Hat enterprise technologies on various servers and workstations and also sell their hardware together with Red Hat Enterprise Linux as part of pre-configured solutions. Red Hat Enterprise Linux and JBoss Enterprise Middleware technologies also have gained widespread support from many of the leading ISVs and independent hardware vendors (“IHVs”). With the support and tools we make available, many of these companies have engineered and certified that their offerings run on or with Red Hat Enterprise Linux, JBoss Enterprise Middleware technologies and Red Hat Enterprise Virtualization or, in the case of some IHVs and ISVs, have built their products using Red Hat Enterprise Linux, JBoss Enterprise Middleware and Red Hat Enterprise Virtualization. We believe widespread support from these companies helps to increase the level of market acceptance and adoption of our enterprise technologies. See NOTE 2 to the Consolidated Financial Statements.
The benefits of the open source development model are becoming better recognized and the acceptance of open source software is continuing to grow. We see this growth in the number of Linux server operating systems in use today, the increasing number of JBoss Enterprise Middleware deployments and an increased level of interest in open source virtualization technologies.
Red Hat, Inc. was incorporated in Connecticut in March 1993 as ACC Corp., Inc., which subsequently changed its name to Red Hat Software, Inc. Red Hat Software, Inc. reincorporated in Delaware in September 1998 and changed its name to Red Hat, Inc. in June 1999. Except as otherwise indicated, all references in this report to “we”, “us”, “our”, the “Company”, the “registrant”, or “Red Hat” refers to Red Hat, Inc. and its subsidiaries.
4
Table of Contents
INDUSTRY BACKGROUND
Origins of open source software
The open source software development model originated in academic and research environments. The model is based on the collaborative development of the software’s source code, the human-readable code that is used to develop software based on open protocols and standards. Whether individually or in groups, and regardless of location, participating developers, many of whose projects are commercially funded, make their code available over the Internet, give and receive comments on open source code and modify it accordingly. This development model gives open source software an inherent level of transparency and choice that contrasts with the proprietary software development model.
Under the proprietary model of software development, a software vendor generally develops the code itself or acquires components from other vendors, without the input from a wider community of participants. The vendor generally licenses to the user only the machine-readable binary (or object) code, with no or limited rights to copy, modify or redistribute that code, and does not make the source code available to the user or other developers. Moreover, peer review and collaborative enhancements are not readily possible because of the lack of access to the source code. In contrast, under the open source development model, the software vendor provides users and other developers with access both to the binary code and the source code and permits the user to copy, modify and redistribute the code to others.
The growth of the Internet has greatly increased the scale and efficiency of open source software development through the availability of collaborative technologies such as email lists, news groups and websites. These technologies have enabled large communities of independent developers, located around the world, to collaborate on more complex open source projects.
We believe that open source software is a viable and arguably superior alternative to traditional proprietary software. As compared to the proprietary model, the open source model:
| · | allows a company’s in-house development team to collaborate and innovate with a global community of independent developers and testers; |
| · | provides the user access to both binary and source code, and the right to inspect, copy, modify and alter the software; |
| · | offers greater flexibility through open rather than proprietary protocols and formats; and |
| · | permits the user ongoing access to improvements made to the software that are distributed by others. |
Moreover, we believe open source software offers many potential benefits for software customers and vendors. Not only are customers able to take advantage of the quality and value of open source software, but they can inspect and help diagnose problems easily, and they also may choose to customize the software to suit their particular needs. Vendors are able to leverage the community of open source developers, reducing development costs, decreasing time-to-market and mitigating the risks associated with developing new software solutions.
Challenges to the widespread adoption of open source by the enterprise
Despite a strong initial market acceptance of Red Hat Enterprise Linux, JBoss Enterprise Middleware and other Red Hat enterprise technologies by large enterprises, a number of obstacles exist to the continued growth and adoption of these technologies within the enterprise, including:
| · | competition from well-established proprietary software industry participants such as Hewlett-Packard Company (“HP”), International Business Machines Corporation (“IBM”), Microsoft Corporation (“Microsoft”), Novell, Inc. (“Novell”), Oracle Corporation (“Oracle”), Sun Microsystems, Inc., which was acquired by Oracle in early 2010 (“Sun”), and VMware, Inc. (“VMware”); |
5
Table of Contents
| · | a limited number of established, profitable and viable open source industry participants; |
| · | uncertainty as to the long term success of a development and business model not based on limiting access to proprietary technology; and |
| · | potential concern over threats of intellectual property infringement claims. |
OUR BUSINESS
We generally offer and provide our enterprise technologies with related services to our customers in the form of annual or multi-year subscriptions. Our subscription model is designed to provide customers with an all-inclusive software solution, incorporating product delivery, problem resolution, ongoing corrections, enhancements and new versions and compatibility with a portfolio of certified hardware and software applications. In addition, Red Hat customers are eligible to participate in our Open Source Assurance program, which provides certain assurances to customers in the event there is an intellectual property infringement issue with our enterprise products. We believe that the chief information officers of large enterprises select Red Hat enterprise technologies and choose to pay on a subscription basis because of the business value, flexibility and rapid innovation that we provide.
Our subscription business model contrasts with the typical proprietary software license model from a revenue recognition perspective. Under our subscription model, we generally defer revenue when we bill the customer and recognize revenue over the life of the subscription term. In contrast, under a proprietary software license model, the vendor typically recognizes license revenue in the period that the software is initially licensed.
We believe the success of our business model is influenced by:
| · | the extent to which we can expand the breadth and depth of our technology and service offerings; |
| · | our ability to enhance the value of subscriptions for Red Hat enterprise technologies through frequent and continuing innovations to these technologies; |
| · | the acceptance and widespread deployment of open source solutions by small, medium and large enterprises and government agencies; |
| · | our ability to generate subscription revenue for Red Hat enterprise technologies; and |
| · | our ability to provide customers with consulting and training services that generate additional revenue. |
Use of the open source development model
We have embraced the open source model in the development of our technology solutions and services. By developing under a collaborative model, we provide a mechanism for independent and commercial developers and our customers to influence our enterprise technologies and to receive the benefits of the collective contributions.
Our open source software operating system
One of the most widely known open source technologies is the Linux kernel, the operating system engine of Red Hat Enterprise Linux. An operating system is the software that allows a computer and its various hardware and software components to interact. A worldwide community of developers collaborates to improve the Linux kernel, and we believe we are able to integrate the best of those improvements into our stable, yet innovative and high-performance Red Hat Enterprise Linux platform. Moreover, as discussed below, Red Hat Enterprise Linux enjoys the support of major original equipment manufacturers (“OEMs”) and ISVs, increasing the interest of developers in adding further enhancements to the Linux kernel.
6
Table of Contents
We seek to engineer Red Hat Enterprise Linux to be a comprehensive, technically advanced, reliable and stable operating system. Red Hat Enterprise Linux is an integrated, open source operating system that meets the performance, reliability and scalability demands of chief information officers of large and small enterprises, from the edge of the network to cloud deployments to the data center.
Our operating system is intended to be:
| · | flexible and scalable—capable of running clusters of thousands of systems in a large enterprise on a single device; |
| · | functional—able to handle discrete or multiple applications accessed by multiple users; |
| · | adaptable—allowing the user to modify the software to meet particular needs and requirements; |
| · | stable and reliable—constantly reviewed and fine-tuned by developers worldwide; |
| · | secure—offering some of the highest levels of security in the commercial operating system market; and |
| · | high performing—yielding an array of quality performance results using industry benchmarks. |
Our virtualization and other operating system options
Virtualization allows a single computer system to function as multiple virtual systems by abstracting operating systems and application software from the underlying hardware infrastructure, thereby allowing customers to use a common hardware infrastructure to run multiple operating systems and applications. A major component of our virtualization technology is the Kernel Virtual Machine (“KVM”) platform, which is integrated within the Linux kernel. Our current version of Red Hat Enterprise Linux includes integrated virtualization.
Red Hat’s virtualization offerings and other operating system options are intended to maximize resource allocation and operational flexibility both within corporate networks and in cloud computing environments. Red Hat Enterprise Virtualization for Servers is compatible with Red Hat Enterprise Linux and its ecosystem of certified hardware systems and software applications. Our virtualization solutions are designed to allow enterprises to centrally manage virtual environments.
Our middleware tools and platforms
Middleware generally refers to the software that enables the development, operation and integration of software programs and applications. JBoss Enterprise Middleware combines, integrates and refines features from the JBoss.org communities into stable, enterprise-class platform distributions for application and service hosting, content aggregation, data integration and application integration for both the development and deployment of applications.
Our middleware tools and platforms are intended to:
| · | decrease development complexity; |
| · | improve end-user experience; |
| · | reduce business process friction; |
| · | enable flexibility; and |
| · | lower the total cost of ownership. |
Our systems management solutions
RHN, RHN Satellite, JBoss CSP and JBoss ON provide management and software delivery services for Red Hat Enterprise Linux and JBoss Enterprise Middleware technologies. With a focus on open standards and
7
Table of Contents
scalability, our management solutions help organizations increase productivity, lower costs and enhance security by provisioning, managing, monitoring and updating systems.
These management solutions provide organizations with flexibility, security and scalability. Red Hat’s customers can manage their deployments by connecting to Red Hat’s hosted servers as part of a base subscription, or by implementing the enhanced on-site functionality of RHN Satellite and JBoss ON.
Our services
Our services offerings consist of training, consulting and support designed to meet the needs of the enterprise. With these services, our goal is to help promote customer success by sharing knowledge, experience and advice at all stages of the information technology (“IT”) life cycle.
By providing consulting and support services that help to enable infrastructure, application integration and middleware solutions, we facilitate the further adoption and use of our products in the enterprise. In addition, our training services help populate customers with skilled Red Hat certified architects, engineers and administrators who often serve as internal open source advocates, increasing opportunities for the successful adoption and use of our enterprise technologies. Our service capabilities promote and reinforce the use of open source solutions as well as our Red Hat and JBoss brands.
Support by leading independent software and hardware vendors and systems integrators
To facilitate the widespread deployment of Red Hat Enterprise Linux, JBoss Enterprise Middleware and Red Hat Enterprise Virtualization, we have focused on gaining broad support for our technologies from the providers of hardware, software and systems integrator services critical to the large enterprise. For example, leading software vendors with applications that run on, or with, our enterprise technologies include BMC Software, Inc. (“BMC”), CA, Inc. (“CA”), HP, IBM, Microsoft, Oracle, SAP AG (“SAP”), Sybase, Inc. (“Sybase”), Symantec Corporation (“Symantec”), and VMware. In addition, we have certification and pre-load arrangements with leading hardware providers including HP, IBM and Dell Inc. (“Dell”), as well as Cisco Systems, Inc. (“Cisco”), Fujitsu Limited (“Fujitsu”), Fujitsu Siemens Computers (Holding) BV (“Fujitsu Siemens”), Hitachi, Ltd (“Hitachi”), and NEC Corporation (“NEC”), and certification agreements with leading networking and storage companies including Cisco, EMC Corporation (“EMC”), HP, NetApp, Inc., (“Net App”), Nokia Corporation (“Nokia”) and Nokia Siemens Networks. We also have strategic alliance relationships with the leading semiconductor providers Advanced Micro Devices, Inc. (“AMD”) and Intel Corporation (“Intel”).
An online destination for the open source community
We are dedicated to helping serve the interests and needs of open source software users and developers online. Our websites, which include redhat.com, jboss.org, fedoraproject.org and opensource.com, serve as a substantial resource for information related to open source initiatives. These websites contain news we believe to be of interest to open source users and developers, features for the open source community, a commerce site and a point-of-access for software downloads and upgrades. Visitors to our websites can organize and participate in user groups, make available incremental code improvements and bug fixes and share knowledge regarding the use and development of open source software. By acting as a publisher of open source information and by facilitating the interaction of developers, particularly through the Fedora and JBoss.org projects, we believe our websites have become community centers for open source. Additionally, redhat.com serves as a primary customer interface, web store and order mechanism for many of our products and services.
Segment reporting
Red Hat is organized primarily on the basis of three geographic business units: the Americas, EMEA (Europe, Middle East and Africa) and Asia Pacific. These business units are aggregated into one reportable
8
Table of Contents
segment due to the similarity in the nature of products provided (e.g., Red Hat Enterprise Linux, JBoss Enterprise Middleware and Red Hat Enterprise Virtualization products), financial performance economics (e.g., revenue growth and gross margin), methods of distribution (direct and indirect) and customer classification and base (e.g., distributors, resellers and enterprise).
Geographic Areas
As of February 28, 2010, Red Hat had more than 65 locations around the world, including offices in North America, South America, Europe, Asia and Australia. As stated above, we manage our international business on the basis of three geographic business units: the Americas, EMEA and Asia Pacific. See NOTE 2 to our Consolidated Financial Statements for further discussion of our geographic areas of operation. See Item 1A, “Risk Factors”, for a discussion of some of the risks attendant to our operations.
Backlog
The total value of all non-cancellable subscription and service agreements at February 28, 2010, included deferred revenue classified as a current liability of $480.6 million, long-term deferred revenue of $165.3 million and backlog (the value of customer contracts to be billed in the future) not reflected in our financial statements in excess of $190.0 million. The total value of all non-cancellable subscription and service agreements at February 28, 2009, included deferred revenue classified as a current liability of $382.1 million, long-term deferred revenue of $161.0 million and backlog not reflected in our financial statements in excess of $190.0 million. The amount of backlog at February 28, 2010 that we expect to be billed during the fiscal year ending February 28, 2011 is in excess of $90.0 million.
BUSINESS STRATEGY
Our business strategy is designed to (i) gain widespread adoption of Red Hat enterprise technologies by enterprise users globally, (ii) generate increasing revenue from our existing customer base by renewing existing subscriptions and providing additional value to our customers, and by growing the number of enterprise technologies that comprise our open source architecture, (iii) generate increasing revenue by providing additional systems management, support and other targeted services and (iv) generate increasing revenue from additional market penetration through a broader and deeper set of channel partner and other strategic relationships, including OEMs, other hardware partners, ISVs, cloud computing providers, value-added resellers (“VARs”) and systems integrators and our own international expansion, among other means.
The key elements of our strategy aim to:
Increase the adoption of Red Hat enterprise technologies by enterprise users globally
A growing number of enterprise users view Red Hat Enterprise Linux as a viable operating system and JBoss Enterprise Middleware as a viable middleware platform for mission-critical areas of their information technology infrastructure. An increasing number of these users deploy JBoss Enterprise Middleware as a comprehensive middleware reference architecture and product portfolio for development, deployment and integration of distributed applications, business processes and web services used in a service-oriented architecture. In addition, we see increasing interest among enterprise users for our virtualization and virtualization management offerings. We seek to promote further adoption of our enterprise technologies by expanding the breadth and depth of our technology and service offerings (such as messaging, high performance computing, realtime and virtualization), bringing new management services to market, improving our technology infrastructure to ease the purchasing and renewal process, offering expanded services, focusing on new geographic markets, and capitalizing on the success of our existing strategic relationships. We believe the relationships with our strategic partners will continue to stimulate the technical advancement and widespread
9
Table of Contents
distribution of our enterprise technologies and the growth of existing third-party enterprise applications using Red Hat enterprise technologies. We believe that the low-cost, high-value offerings from Red Hat are a catalyst for change in the IT industry, enabling new deployments and migrations, which encourage a larger ecosystem of compatible hardware and software solutions.
Continue to expand virtualization and other platform offerings
We intend to expand our enterprise virtualization suite of server, client and management product offerings to enable customers to increase their deployments of virtualization in enterprise and mission-critical environments. We also expect to continue to invest resources to further develop and market our cloud computing, messaging, realtime and grid product offerings.
Continue to expand routes to market
We intend to continue to grow our traditional distribution, reseller, OEM, ISV and channel partner networks on a global basis. In addition, we are enhancing our relationships with the systems integrators in order to expand our reach into customers who traditionally rely on system integrators for advice and recommendations regarding their technology purchases.
Continue to pursue strategic acquisitions and alliances
We expect to continue to pursue a selective acquisition strategy as opportunities arise to complement and expand our offerings and service capabilities. We also intend to create and extend our strategic alliances where it is beneficial to our business.
Continue to grow our presence in international markets
We have operations in a number of countries in the Americas, EMEA and Asia Pacific, with over 65 offices worldwide. We expect to continue to expand our operations geographically.
We offer our technologies and documentation in various languages. See NOTE 2 to the Consolidated Financial Statements for a discussion of our revenue by geographic area.
Continue to invest in the development of open source technology
We intend to continue to invest significant resources in the development of new open source technology in areas that include messaging, virtualization, cloud computing, real-time computing, middleware, management, security and identity, capitalizing on our substantial experience working with the open source model and community. We expect this continued investment to take the form of expenditures on internal development efforts, as well as continued funding of third-party open source projects and the expansion of our developer services.
PRODUCTS AND SERVICES
Red Hat’s software solutions, consisting of Red Hat enterprise technologies such as Red Hat Enterprise Linux, JBoss Enterprise Middleware and Red Hat Enterprise Virtualization, are at the center of our subscription strategy and our open source architecture. Our services offerings, principally directed toward our medium and large enterprise customers and the leading hardware providers with whom we have strategic relationships, include technical support and maintenance, training, professional consulting services, engineering services and hardware certification.
10
Table of Contents
Generally, we provide our enterprise technologies with related services in the form of annual or multi-year subscriptions. Our subscriptions include a bundle of services encompassing product delivery, problem resolution, ongoing corrections, enhancements and new versions, certified capability with a portfolio of hardware and software applications and Red Hat’s Open Assurance program. The subscriptions offer varying levels of support services as well as access to basic software updates and configuration management functionality via our integrated management technologies RHN, RHN Satellite, JBoss CSP and JBoss ON.
Red Hat Enterprise Linux technologies
Red Hat Enterprise Linux is an operating system built from various open source software packages including the Linux kernel, and is designed expressly for enterprise computing. Red Hat Enterprise Linux delivers the features required for commercial deployments, including:
| · | Support for a wide range of ISV applications from vendors such as BMC, CA, HP, IBM, Microsoft, Oracle, SAP, Sybase and Symantec; |
| · | Certification on multiple architectures and leading OEM platforms, including Cisco, Dell, Fujitsu, Fujitsu Siemens, HP, Hitachi, IBM, NEC and Sun; |
| · | Comprehensive technical support, with up to 24x7, one-hour response, available both from Red Hat and selected ISV/OEM partners; |
| · | Performance and scalability in accordance with leading industry benchmarks; |
| · | Stability based upon periodic upgrade cycles on a when and if available basis and multiyear support lifecycle; and |
| · | Virtualization capability incorporated into the core operating system. |
Red Hat Enterprise Linux is generally offered in three configurations:
| · | Red Hat Enterprise Linux—a base product server offering with virtualization support and a virtual guest offering for use with Red Hat or third-party hypervisors. |
| · | Red Hat Enterprise Linux Advanced Platform—a comprehensive solution bundle that includes Red Hat Enterprise Linux, Red Hat Global File System and Red Hat Cluster Suite. Red Hat Enterprise Linux Advanced Platform targets customers who require a complete, integrated virtualization solution. |
| · | Red Hat Enterprise Linux Desktop—an open source desktop offering. |
We believe that these configurations simplify the product selection and purchase process and drive deeper product adoption, while providing the flexibility that our customers desire. Each of these offerings includes virtualization capabilities that provide customers with tools to help in optimizing both existing and new hardware while providing more deployment options regarding variable workloads, virtual appliances, legacy applications and testing configurations.
JBoss Enterprise Middleware
JBoss Enterprise Middleware provides a suite of products for developing, deploying, integrating and managing distributed, composite and web-based applications and services. JBoss products are based on the Java programming language, are deployed on a variety of leading operating systems and support a distributed, modular, reusable and open standards-based “Service Oriented Architecture” or “SOA” deployment for applications and data. JBoss Enterprise Middleware offerings consist of a number of deployment platforms, tools and development frameworks, including:
| · | JBoss Enterprise Application Platform—provides an environment for building, hosting and deploying Java-based applications and services. It includes JBoss Application Server, Seam, Hibernate, JBoss Cache, JBoss Transactions, JBoss Messaging and JBoss Web services. |
11
Table of Contents
| · | JBoss Enterprise Web Platform—leverages the Java Enterprise Edition Web Profile concept to provide a standards-based environment for building light Java applications. |
| · | JBoss Enterprise Web Server—a single enterprise open source solution for large scale websites and lightweight applications that utilize Apache Tomcat and Apache Web Server. |
| · | JBoss Enterprise SOA Platform—provides the environment for deploying and integrating SOAs and business processes. |
| · | JBoss Enterprise Portal Platform—provides a Java-based platform for deploying standards-based portals. |
| · | JBoss Enterprise BRMS—a business rules management system that enables business policy and rules development, access and change management. |
| · | JBoss Developer Studio—provides an Eclipse-based application development environment for developing Java applications and development tools for building rich web-based applications and SOA services. |
| · | JBoss Enterprise Data Services Platform—provides an environment integrating distributed data sources and provides for data federation, data abstraction, data transformation and metadata management. |
| · | JBoss Hibernate Framework—an object/relational mapping and persistence framework. |
| · | JBoss Seam Framework—an application framework for building Web 2.0 applications. |
| · | JBoss Web Framework Kit—an integrated bundle of open source frameworks that are used for building light Java applications. |
Red Hat Enterprise Virtualization
Red Hat Enterprise Virtualization for Servers is designed to enhance the capital and operational efficiencies of our customers by increasing server utilization and deployment flexibility. Our virtualization solution for servers consists of two offerings:
| · | Red Hat Enterprise Virtualization Hypervisor—a hypervisor based on KVM technology that essentially converts the Red Hat Enterprise Linux kernel into a virtualization platform; and |
| · | Red Hat Enterprise Virtualization Manager for Servers—a server virtualization management system that provides advanced capabilities for both host and guest operating systems, including high availability, live migration, power manager, storage manager and system scheduler. |
Red Hat Enterprise Virtualization for Servers is compatible with Red Hat Enterprise Linux and its wide ecosystem of certified hardware systems and software applications. Our virtualization solution allows enterprises to centrally manage virtual environments.
Additional Red Hat enterprise technologies
Red Hat enterprise technologies also include other technology infrastructure, including software for software development, high availability clusters of Linux systems and storage, directory server services and authentication of users. These applications broaden customer choice and are components of our open source architecture vision for the enterprise. These technologies include:
| · | Red Hat MRG—integrates open and scalable messaging, a real-time kernel with predictable performance and grid management tools for high-performance distributed computing solutions, including virtualization, cloud computing and bare-metal mission-critical applications. |
| · | Red Hat Developer Offering—provides integrated development environments and support for application developers. |
12
Table of Contents
| · | Red Hat Cluster Suite—features clustering and uses application fail-over technology, which is designed to enable high-availability application environments. |
| · | Red Hat Global File System—is an enterprise-strength clustered file system for Linux, designed for commercial and technical computing applications requiring access to shared data. |
| · | Red Hat Certificate System—is a scalable authentication system for appropriately limiting access to mission-critical resources and data. |
| · | Red Hat Directory Server—centralizes application settings, user profiles, group data, policies and access control information into an operating system-independent, network-based registry. |
Red Hat systems management solutions
RHN, RHN Satellite, JBoss CSP and JBoss ON provide management and software delivery services for Red Hat Enterprise Linux and JBoss Enterprise Middleware technologies. With a focus on open standards and scalability, our management solutions help organizations increase productivity, lower costs and enhance security by provisioning, managing, monitoring and updating systems.
Services for Red Hat Enterprise Linux and JBoss Enterprise Middleware are available to provide organizations with the appropriate level of flexibility, security and scalability based on their size and needs. Red Hat’s customers can manage their deployments by connecting to Red Hat’s hosted servers or by implementing the enhanced functionality of RHN Satellite and JBoss ON.
Red Hat Network—Through RHN, Red Hat provides an on-line method for its customers to obtain certified software and upgrades and to manage, provision and monitor deployments of Red Hat Enterprise Linux.
RHN Update Module—The RHN Update Module is an entry-level offering included with each subscription for Red Hat Enterprise Linux, providing functionality enhancements and upgrades to individual systems. The RHN Update Module includes functionality such as a graphical user interface, priority notification, errata information, and Red Hat Package Manager (“RPM”) dependency checking and auto update. RHN Update Module also gives customers access to electronic delivery of software related to their Red Hat subscriptions. This is the default method for accessing subscription services for Red Hat Enterprise Linux.
Customers may purchase entitlements to the following additional RHN modules on an annual subscription basis:
RHN Satellite—RHN Satellite provides RHN functionality, such as managing system profiles and reporting data, locally on a customer’s system behind its IT firewall. A customer’s RHN Satellite server connects with RHN over the Internet to download updates and upgrades. RHN Satellite offers customers greater control and flexibility over the management of their Red Hat Enterprise Linux systems and may also be used to distribute custom or third party content to their Red Hat Enterprise Linux systems, and monitor the health of their systems. Additional RHN Proxy Servers can be added to an RHN Satellite deployment to improve performance and package downloads for remote locations.
RHN Management Module—The RHN Management Module allows customers to manage systems running Red Hat enterprise technology. Designed to enable scalable enterprise administration, the RHN Management Module features systems grouping, role-based administration and scheduled actions.
RHN Provisioning Module—The RHN Provisioning Module includes features such as operating system provisioning (for new, unformatted systems or previously deployed systems), configuration management, multistate rollback, scheduled remote actions, auto discovery, configuration tools and RPM-based application provisioning.
13
Table of Contents
RHN Monitoring Module—The RHN Monitoring Module, only available for RHN Satellite deployments, adds performance-tracking capabilities. Users can configure monitoring checks based on numerous pre-built probes, or they can create their own. Email or pager warnings send alerts when defined performance thresholds are crossed.
JBoss Customer Support Portal—Through JBoss CSP, Red Hat provides an on-line method for JBoss Enterprise Middleware customers to obtain certified software, access to the JBoss information knowledge base and software update alerts and advisories, as well as interact with our JBoss technical support engineers.
JBoss ON—JBoss ON is deployed in a manner similar to RHN Satellite and allows the customer to manage its JBoss Enterprise Middleware environments. Similar to RHN Satellite, JBoss ON functionality includes inventory, software update, administration, configuration management and resource deployment. JBoss ON also provides an extended module for monitoring and alert notifications on the status of JBoss Enterprise Middleware deployments.
Red Hat training, consulting and support services
Red Hat offers a range of services that are designed to help our customers derive additional value from Red Hat enterprise technologies.
Training—Our training services consist of an array of performance-based courses designed to meet the diverse needs of our customers. We deliver more than 30 Red Hat Enterprise Linux and JBoss Enterprise Middleware courses offered worldwide in classroom, corporate on-site and online settings. These courses span topics such as system administration and advanced enterprise development, deployment security, middleware and role-based offerings. Certification paths include Red Hat Certified Technician, Red Hat Certified Engineer, Red Hat Certified Data Specialist, Red Hat Certified Security Specialist, Red Hat Certified Virtualization Administrator, Red Hat Certified Architect and JBoss Certified Application Administrator.
Consulting—We offer the services of experienced consultants to assist with the technology infrastructure needs of our customers. Our offerings include assessments, installations, upgrade planning, platform migrations, solution integration and application development.
Support—Our Red Hat subscriptions generally include varying levels of technical support to assist customers with installing, configuring and using Red Hat enterprise technologies. Additionally, we offer a technical account manager (“TAM”) service for customers that require a more personalized support relationship. The TAM service is designed to offer a highly skilled, proactive support engineer that understands a customer’s IT infrastructure and serves as a primary point of contact for technical support that is tailored to the customer’s business.
COMPETITION
In the operating systems market, we compete with a number of large and well-established companies that have significantly greater financial resources, larger development staffs and more extensive marketing and distribution capabilities. These competitors include Microsoft, Novell, Sun and Oracle, all of which offer hardware-independent, multi-user operating systems, and various virtualization software for Intel platforms that compete with Red Hat’s offerings. Moreover, HP, IBM, Sun and Unisys Corporation each offer the UNIX operating system. Many of these competitors bundle competitive operating systems, such as UNIX, with their own hardware and additional software offerings, thereby making it more difficult for us to penetrate their customer bases. Moreover, Sun also provides its Solaris UNIX software under an open source license. In addition, with virtualization emerging as an important element of the operating environment, virtualization software companies like VMware, Microsoft, Citrix Systems, Inc. (“Citrix”) and Novell are also competitors to Red Hat. No assurance can be given that our efforts to compete effectively will be sufficient.
14
Table of Contents
Within the specific category of Linux operating systems, our chief competitor has historically been Novell, with its SUSE brand of Linux. In 2006, Oracle, a large and well-capitalized company, also began to sell support for its version of the Linux operating system. See Item 1A, “Risk Factors”. Other, less well-capitalized, Linux brands include Ubuntu, Debian Mandriva, and other regionally-specific distributions. The financial and legal barriers to creating a new Linux distribution are relatively low because the open source license governing Linux distributions permits copying, modification and redistribution.
In the middleware market, we compete with a number of large and well-established companies that have significantly greater financial resources, larger development staffs and more extensive marketing and distribution capabilities. These competitors include, but are not limited to, IBM, Microsoft, Oracle and Sun, all of which offer broad portfolios of enterprise Java and non-Java middleware products. All of these vendors offer the majority of their middleware products under a typical proprietary software license model. IBM and Sun often bundle hardware and software for their customers, making it more difficult to penetrate these customer bases.
In the virtualization market, we compete with a number of large and well-established companies that have significantly greater financial resources, larger development staffs and more extensive marketing and distribution capabilities. These competitors include, but are not limited to, VMware, Microsoft, Citrix, Novell and Oracle, and in the case of VMware and Microsoft, have virtualization technologies that are certified and supported with Red Hat Enterprise Linux operating system offerings.
With our services offerings, we face competition in the market for services related to the deployment of our enterprise technologies and the development and integration of applications. Our competitors in the market include HP, IBM, Oracle and Sun, as well as other technology consulting companies.
For our management offerings, we compete with a number of large companies that have significantly greater financial resources, larger development staffs and more extensive marketing and distribution capabilities. These competitors include, but are not limited to, BMC, CA, HP, IBM, Microsoft, Novell and Oracle, all of which offer support for heterogeneous operating system environments, such as Linux, Solaris, AIX, HP-UX and Windows. Many of these competitors have legacy client/server offerings that require relatively long implementation cycles and are difficult to displace in enterprise customers due to, among other reasons, switching costs. There are numerous other companies that focus exclusively on management offerings that are likely to support Linux-based systems as well as non-Linux-based systems.
The recent acquisition of Sun by Oracle could place additional competitive pressure on Red Hat across the virtualization, operating systems and middleware markets. Oracle’s acquisition of Sun creates a large, integrated supplier of enterprise software that may also provide hardware optimized for these software products. In addition, Oracle’s ownership of the Solaris technologies could make it more difficult for Red Hat to penetrate Sun’s installed base of customers.
The open source software market is not characterized by the traditional barriers to entry that are found in the proprietary software model due to the nature of open source technology. For example, anyone can copy, modify and redistribute Red Hat Enterprise Linux, JBoss Enterprise Middleware and our other open source products. However, they are not permitted to refer to these products as “Red Hat” or “JBoss” products unless they have a formal business relationship with us that allows such references. Moreover, as it relates to our enterprise technologies and management offerings, our customers agree that during their support relationship with Red Hat, they will purchase a support subscription for each computer system, CPU or other unit on which they deploy Red Hat’s software. In addition, the primary means by which customers can receive a certified version of Red Hat enterprise software and receive certified functionality enhancements and upgrades to a copy of Red Hat enterprise software is to purchase and maintain a current subscription directly from us or our partners with whom we have agreements.
15
Table of Contents
We believe that the major factors affecting the competitive landscape for our products include:
| · | the name and reputation of the vendor; |
| · | the ability to adapt development, sales, marketing and support to the open source model; |
| · | the product price, performance, reliability and functionality; |
| · | the alliances of the vendor with major industry hardware and/or software providers; |
| · | the quality of our support and consulting services; |
| · | the financial and value relationship of subscription services; |
| · | the number of Global 2000 reference accounts; |
| · | the number of cloud computing partners and reference accounts; |
| · | the availability of third-party enterprise infrastructure applications that are compatible with the technology; |
| · | the breadth of hardware and software ecosystem compatibility; |
| · | the management framework for administering the software technologies; |
| · | the distribution strength and number of distribution partners of the vendor; and |
| · | the strength of the vendor’s relationships and reputation in the open source community. |
Although we believe that overall we generally compete on par or favorably with many of our competitors in a number of respects, including product performance, price and breadth of hardware and software compatibility, we believe that a number of our key competitors currently have superior distribution capabilities. In addition, there are significantly more enterprise infrastructure applications available for competing operating systems technologies, such as Windows and UNIX, than there are for Red Hat Enterprise Linux. An integral part of our strategy has been to help address these shortcomings by, among other methods, strengthening our existing strategic relationships and entering into new ones to expand our distribution capabilities and by attracting more attention to the open source movement. Also, increasing the volume of installed subscriptions of Red Hat enterprise technologies should create additional opportunities and incentives for software developers to write more applications that are compatible with Red Hat enterprise technologies.
SOFTWARE ENGINEERING AND DEVELOPMENT
We have invested, and intend to continue to invest, significant resources in product and technology development. We expended $148.4 million, $130.2 million and $97.4 million, in our fiscal years ended February 28, 2010, February 28, 2009 and February 29, 2008, respectively, in research and development costs. We focus and modify our product development efforts based on the needs of users and changes in the marketplace. We are currently focusing our development efforts on improving or adding the functionality to our offerings that are needed by the Global 2000 or required for leading third-party applications upon which the Global 2000 are dependent. However, any upgrades and enhancements are offered on a when and if available basis.
Our software engineers collaborate with open source software development teams working across the Internet and through open source communities such as the Fedora Project and JBoss.org. This involvement enables us to remain abreast of, and in some instances lead, certain technical advances, plans for development of new features and timing of releases, as well as other information related to the development of open source projects.
16
Table of Contents
Our software engineers make development contributions to many components comprising the Red Hat Enterprise Linux operating system, JBoss Enterprise Middleware and Red Hat Enterprise Virtualization and provide leadership within the various open source communities across many of the core components.
Our software development engineers perform extensive testing of Red Hat Enterprise Linux, JBoss Enterprise Middleware, Red Hat Enterprise Virtualization, RHN, RHN Satellite, JBoss CSP, JBoss ON, JBoss Developer Studio and other Red Hat enterprise technologies. We use various industry methods of quality assurance testing to help ensure that our enterprise technologies are solidly engineered and ready for use by our customers when delivered. We also work closely with leading hardware and software vendors to help ensure that their hardware and applications will operate effectively with Red Hat enterprise platforms.
In addition, we continue to invest substantial resources in the development and commercialization of open source technologies that provide added value in addition to the operating system.
INTELLECTUAL PROPERTY
Red Hat Enterprise Linux, JBoss Enterprise Middleware and our other open source products have been developed and made available for licensing under the GNU General Public License, the GNU Lesser General Public License and other open source licenses. These licenses permit the licensee to copy, modify and distribute the software. Some licenses, such as the GNU General Public License and the GNU Lesser General Public License, require that any resulting or derivative work that is distributed to others be licensed under the same terms. Therefore, although we generally retain ownership of the copyright in the code that we develop, due to the nature of our open source software products and the licenses under which we develop and distribute them, our most valuable intellectual property is our collection of trademarks. We also generally enter into confidentiality and nondisclosure agreements with our employees and consultants and seek to control access to and distribution of our confidential documentation and other proprietary information.
We pursue registration of some of our trademarks in the United States and in other countries. We have registered the trademark “Red Hat” and the Red Hat Shadowman logo in countries in North America, South America, Europe, Asia and Africa as well as in Australia.
Despite our efforts to protect our trademark rights, unauthorized third-parties have in the past attempted, and in the future may attempt, to misappropriate our trademark rights. We cannot be certain that we will succeed in preventing such misappropriation of our trade name and trademarks. The laws of some foreign countries do not protect or deter misappropriation of our trademark rights to the same extent as do the laws of the United States. In addition, while we engage in certain enforcement activity, policing unauthorized use of our trademark rights is difficult, expensive and time consuming, and our efforts may be inadequate. The loss of any material trademark or trade name could have a material adverse effect on our business, operating results and financial condition.
Red Hat also seeks patent protection of some of the innovative ideas of our software developers. Not all of these inventions are applicable to our current technologies. Some provide protection to new and other technologies. As part of Red Hat’s commitment to the open source community, we provide our Patent Promise, an undertaking, subject to certain limitations, not to enforce our patent rights against users of open source software. This permits the development and distribution of open source applications by third parties that could otherwise infringe on our patents. Consequently, it is unlikely that our patents will, of themselves, provide us substantial revenue. Rather, they may provide a measure of deterrence against the potential patent infringement claims of third parties and may help ensure that new technologies and innovations covered by our patents remain open. We are also a founding member and active participant, along with other industry leaders (including IBM, NEC, Philips, Sony and Novell) in the Open Invention Network LLC, which acquires patents with the goal of promoting innovation in open source for the Linux platform.
17
Table of Contents
Third-parties have in the past asserted, and may in the future assert, infringement claims against us which may result in costly litigation or require us to obtain a license to third-party intellectual property rights. See Item 3, “Legal Proceedings”. There can be no assurance that such licenses will be available on reasonable terms or at all, which could have a material adverse effect on our business, operating results and financial condition. Red Hat regularly commits to its subscription customers that if portions of our enterprise products are found to infringe third-party intellectual property rights we will, at our expense and option: (i) obtain the right for the customer to continue to use the product consistent with their subscription agreement with us; (ii) modify the product so that its use is non-infringing; or (iii) replace the infringing component with a non-infringing component, and indemnify them against specified infringement claims. Although we cannot predict whether we will need to satisfy these commitments and often have limitations on these commitments, satisfying these commitments could be costly and time-consuming and could materially and adversely affect our business, operating results and financial condition.
EMPLOYEES
As of February 28, 2010, Red Hat had more than 3,200 employees. From time to time, we also employ independent contractors. Our employees are not represented by any labor union and are not recognized under a collective bargaining agreement, and we have never experienced a work stoppage. We believe our relations with our employees are generally good.
AVAILABLE INFORMATION
We maintain a website at www.redhat.com. We make available, free of charge on our website, our Annual Report on Form 10-K, Quarterly Reports on Form 10-Q, Current Reports on Form 8-K, and amendments to those reports filed or furnished pursuant to Section 13(a) or 15(d) of the Securities Exchange Act of 1934, as amended (the “Securities Exchange Act”), as soon as reasonably practicable after we electronically file those reports with, or furnish them to the Securities and Exchange Commission (the “SEC”). We also similarly make available, free of charge on our website, the reports filed with the SEC by our executive officers, directors and 10% stockholders pursuant to Section 16 under the Securities Exchange Act as soon as reasonably practicable after copies of those filings are provided to us by those persons. We are not including the information contained at www.redhat.com, or at any other Internet address, as part of, or incorporating it by reference into, this Annual Report on Form 10-K.
18
Table of Contents
| ITEM 1A. | RISK FACTORS |
Set forth below are certain risks and cautionary statements, which supplement other disclosures in this report.
Moreover, certain statements contained in this report and the documents incorporated by reference in this report, including in Management’s Discussion and Analysis of Financial Condition and Results of Operations, constitute “forward-looking statements” within the meaning of the Private Securities Litigation Reform Act of 1995. Forward-looking statements provide current expectations of future events based on certain assumptions and include any statement that is not strictly a historical statement (for example, statements regarding current or future financial performance, management’s plans and objectives for future operations, product plans and performance, management’s expectations regarding market risk and market penetration, management’s assessment of market factors or strategies, objectives and plans of Red Hat and its partners). Words such as “anticipates,” “believes,” “expects,” “estimates,” “intends,” “plans,” “projects,” and similar expressions, may also identify such forward-looking statements. Investors are cautioned that these forward-looking statements are not guarantees of Red Hat’s future performance and are subject to a number of risks and uncertainties that could cause Red Hat’s actual results to differ materially from those found in the forward-looking statements and from historical trends. These risks and uncertainties include the risks and cautionary statements detailed below and elsewhere in this report as well as in Red Hat’s other filings with the Securities and Exchange Commission (“SEC”), copies of which may be accessed through the SEC’s web site at http://www.sec.gov. Readers are urged to carefully review these risks and cautionary statements. The forward-looking statements included in this report represent our views as of the date of this report. We specifically disclaim any obligation to update these forward-looking statements in the future. These forward-looking statements should not be relied upon as representing our views as of any date subsequent to the date of this report.
RISKS RELATED TO BUSINESS UNCERTAINTY
Ongoing uncertainty regarding the duration and extent of the recent economic downturn and in global economic and market conditions generally could adversely affect our business, financial condition and results of operations.
Economic weakness and uncertainty and constrained IT spending from time to time contribute to slowdowns in the technology industry, as well as in the specific segments and markets in which we operate, which may result in reduced demand and increased price competition for our products and services. Our operating results in one or more geographic regions may also be affected by uncertain or changing economic conditions within that region, such as the challenges that are currently affecting economic conditions in the United States and elsewhere. Continuing uncertainty about future economic conditions may, among other things, negatively impact our current and prospective customers and result in delays or reductions in technology purchases or lengthen our sales cycle. Adverse economic conditions also may negatively impact our ability to obtain payment for outstanding debts owed to us by our customers or other parties with whom we do business. In addition, these conditions may impact our investment portfolio, and we could determine that some of our investments have experienced an other-than-temporary decline in fair value, requiring an impairment charge that could adversely impact our financial condition and results of operations. Also, these conditions may make it more difficult to forecast operating results. If global economic and market conditions, or economic conditions in the United States or other key markets, remain uncertain or persist, spread or deteriorate further, companies may delay or reduce their IT spending, which could adversely affect our business, financial condition and results of operations.
19
Table of Contents
If we fail to continue to establish and maintain strategic distribution and other collaborative relationships with industry-leading companies, we may not be able to attract and retain a larger customer base.
Our success depends in part on our ability to continue to establish and maintain strategic distribution and other collaborative relationships with industry-leading hardware manufacturers, distributors, software vendors and enterprise solutions providers such as SAP AG (“SAP”), Dell Inc. (“Dell”), Hewlett-Packard Co. (“HP”), International Business Machines Corporation (“IBM”), Fujitsu Limited (“Fujitsu”), NEC Corporation (“NEC”) and others. These relationships allow us to offer our products and services to a much larger customer base than we would otherwise be able through our direct sales and marketing efforts. We may not be able to maintain these relationships or replace them on attractive terms. In addition, our existing strategic relationships do not, and any future strategic relationships may not, afford us any exclusive marketing or distribution rights. As a result, many of the companies with which we have strategic alliances pursue alternative technologies and develop alternative products and services in addition to or in lieu of our products and services, either on their own or in collaboration with others, including our competitors. Moreover, we cannot guarantee that the companies with which we have strategic relationships will market our products effectively or continue to devote the resources necessary to provide us with effective sales, marketing and technical support.
We have entered into and may continue to enter into or seek to enter into business combinations and acquisitions, which may be difficult to complete and integrate, disrupt our business, divert management’s attention, adversely affect our financial condition or results of operations and dilute stockholder value.
As part of our business strategy, we have in the past entered into business combinations and acquisitions (for example, our acquisition of JBoss in June 2006 and our acquisition of Qumranet in September 2008), and we may continue to do so in the future. We have limited experience in making acquisitions, and acquisitions present significant challenges and risks, including:
| · | The difficulty of integrating the operations, systems and personnel of the acquired companies; |
| · | The difficulty of gathering full information regarding the target business prior to the acquisition; |
| · | The maintenance of acceptable standards, controls, procedures and policies; |
| · | The potential disruption of our ongoing business and distraction of management; |
| · | The impairment of relationships with employees and customers as a result of any integration of new management and other personnel; |
| · | The inability to maintain a relationship with customers of the acquired business; |
| · | The potential loss of key employees of the acquired business; |
| · | Challenges in maintaining good and effective relations with existing business partners or of those of the acquired business, including as a result of the changes in the competitive landscape effected by the acquisition; |
| · | The difficulty of incorporating acquired technology and rights into our products and services and of maintaining quality standards consistent with our brand; |
| · | The potential failure to achieve the expected benefits of the combination or acquisition; |
| · | Expenses related to the acquisition; |
| · | Potential unknown liabilities associated with the acquired businesses; |
| · | Unanticipated expenses related to acquired technology and its integration into existing technology; and |
| · | The dilutive impact on our current stockholders’ percentage of ownership as a result of issuing shares of our common stock in connection with an acquisition or business combination. |
20
Table of Contents
There can be no assurance that we will manage these challenges and risks successfully. Moreover, if we are not successful in completing acquisitions that we have pursued or may pursue, our business may be adversely affected, and we may incur substantial expenses and divert significant management time and resources. In addition, in pursuing such acquisitions, we could use substantial portions of our available cash as all or a portion of the purchase price. We could also issue additional securities as consideration for these acquisitions, which could cause our stockholders to suffer significant dilution, or we may incur substantial debt. Any acquisition may not generate additional revenue or profit for us, which may adversely affect our operating results.
If we fail to effectively manage our growth, our operations and financial results could be adversely affected.
We have expanded our operations rapidly in recent years. For example, our total revenue increased from $652.6 million for the fiscal year ended February 28, 2009 to $748.2 million for the fiscal year ended February 28, 2010. Moreover, the total number of our employees increased from over 2,800 as of February 28, 2009 to over 3,200 as of February 28, 2010 and is expected to generally increase in the foreseeable future. In addition, we continue to explore ways to extend our product and service offerings and geographic reach. Our growth has placed and will likely continue to place a strain on our management systems, information systems, resources and internal controls. Our ability to successfully offer products and services and implement our business plan requires adequate information systems and resources and oversight from our senior management. As we grow, we must also continue to hire, train, supervise and manage new employees. As we grow and expand globally, controls and oversight functions will become more complex and distributed and may in part be outsourced. We may not be able to adequately screen and hire or adequately train, supervise and manage sufficient personnel or develop management, or effectively manage and develop our controls and oversight functions and information systems to adequately manage our expansion effectively. If we are unable to adequately manage our growth and expansion, our business, operating results and financial condition could be materially adversely affected.
We rely, to a significant degree, on an indirect sales channel for distribution of our products and services, and disruption of any part of this channel could adversely affect the sales of our products.
We use a variety of different distribution methods to sell our products and services, including indirect channel partners, such as third-party OEMs, resellers and distributors. A number of these partners in turn distribute via their own networks of channel partners (e.g., distributors and resellers), with whom we have no direct relationship. We rely, to a significant degree, on our channel partners to, among other activities, select, screen and maintain relationships with our indirect distribution network and for the distribution of our products and services in a manner that is consistent with Red Hat’s quality standards. Our indirect distribution channel could be affected by disruptions in the relationships of and with our channel partners and their networks, including their customers or suppliers. As a result, we may be required to devote greater support and professional services resources to distribute our products and support our customers, which could drive up costs and may not be as effective. We cannot guarantee that our channel partners will market our products effectively. Disruptions in our distribution channel or poor marketing support by channel partners could lead to decreased sales or slower than expected growth or increased distribution and support costs.
We rely on software licensed from other parties, the loss of which could increase our costs and delay software shipments.
We utilize various types of software licensed from unaffiliated third parties. Aspects of our business could be disrupted if any of the software we license from others or functional equivalents of this software were either no longer available to us or no longer offered to us on commercially reasonable terms. In either case, we would be required to either redesign our products to function with software available from other parties, develop these components ourselves or eliminate the functionality, which would result in increased costs, delays in our product shipments and the release of new product offerings and limit the features available in our current or future products.
21
Table of Contents
We may not be able to continue to attract and retain capable management personnel.
Our ability to retain key management personnel or hire capable new management personnel as we grow may be challenged to the extent the technology sector performs well and/or if companies with more generous compensation packages or greater perceived growth opportunities compete for the same personnel. In addition, historically we have used share-based compensation as a key component of our compensation packages. Changes in the accounting for share-based compensation could adversely affect our earnings or force us to use more cash compensation to attract and retain capable personnel. If the price of our common stock falls, the value of our share-based awards to the recipient is reduced. Such events, or if we are unable to secure shareholder approval for increases in the number of shares eligible for share-based compensation grants, could adversely affect our ability to successfully attract and retain key management personnel.
We depend on our key personnel that we employ, the loss of which could adversely affect our business or stock price and diminish the Red Hat brand.
Our future success depends on the continued services and effectiveness of a number of key officers and employees, including our CEO, who assumed his role on January 1, 2008. The loss of the technical knowledge and industry expertise of any of these individuals could seriously impede our success. Moreover, the loss of these individuals, particularly to a competitor, some of which may be in a position to offer greater compensation, and any resulting loss of customers could reduce our market share and diminish the Red Hat brand and adversely affect our business or stock price.
A number of our key employees have become, or will soon become, vested in a significant amount of their equity compensation awards. Employees may be more likely to leave us after a significant portion of their equity compensation awards fully vest, especially if the shares underlying the equity awards have significantly appreciated in value. If we do not succeed in retaining and motivating our CEO and key employees and attracting new key personnel, our business, its financial performance and our stock price may decline.
Our corporate culture has contributed to our success, and if we cannot maintain this culture as we grow, we could lose the innovation, creativity and teamwork fostered by our culture, and our business may be harmed.
We believe that a critical contributor to our success has been our corporate culture, which we believe fosters innovation, creativity and teamwork. As our organization grows, and we are required to implement more complex organizational management structures, we may find it increasingly difficult to maintain beneficial aspects of our corporate culture. If we are unable to maintain our corporate culture, we may find it difficult to attract and retain motivated employees.
Our subscription-based contract model may encounter customer resistance or we may experience a decline in the demand for our products.
The subscription agreement used for many of our products, including Red Hat Enterprise Linux, requires customers to agree to a subscription for our services for each installed system on which they deploy our subscription based products. At the same time, the subscription agreement places no restriction on the customer’s right to redistribute the products. While we believe this practice complies with the requirements of the GNU General Public License, and while we have reviewed this practice with the Free Software Foundation, the organization that maintains and provides interpretations of the GNU General Public License, we may still encounter customer resistance to this distribution model or customers may fail to honor the terms of our subscription agreements. To the extent we are unsuccessful in promoting or defending this distribution model, our business and operating results could be materially and adversely affected. Additionally, as technologies and the markets for our enterprise offerings change, our subscription-based contract model may no longer meet the needs of our customers. If we are unable to adapt our contract model to changes in the marketplace, our business and operating results could be adversely impacted.
22
Table of Contents
If our current and future customers do not renew their subscription agreements with us, our operating results may be adversely impacted.
Our customers may not renew their subscriptions for our service after the expiration of their subscription agreements and in fact, some customers elect not to do so. In addition, our customers may opt for a lower priced edition of our services or for fewer subscriptions. We have limited historical data with respect to rates of customer subscription renewals, so we cannot accurately predict customer renewal rates. Our customers’ renewal rates may decline or fluctuate as a result of a number of factors, including their level of satisfaction with our services and their ability to continue their operations and spending levels. Government contracts could be subject to future funding that may affect the extension or termination of programs and generally are subject to the right of the government to terminate for convenience or non-appropriation. If we experience a decline in the renewal rates for our customers or they opt for lower priced editions of our offerings or fewer subscriptions, our operating results may be adversely impacted.
If open source software programmers, most of whom we do not employ, do not continue to develop and enhance open source technologies, we may be unable to develop new products, adequately enhance our existing products or meet customer requirements for innovation, quality and price.
We rely to a significant degree on a number of largely informal communities of independent open source software programmers to develop and enhance our products. For example, Linus Torvalds, a prominent open source software developer, and a relatively small group of software engineers, many of whom are not employed by us, are primarily responsible for the development and evolution of the Linux kernel, which is the heart of the Red Hat Enterprise Linux operating system. If these groups of programmers fail to adequately further develop and enhance open source technologies, we would have to rely on other parties to develop and enhance our products or we would need to develop and enhance our products with our own resources. We cannot predict whether further developments and enhancements to these technologies would be available from reliable alternative sources. In either event, our development expenses could be increased and our product release and upgrade schedules could be delayed. Moreover, if third-party software programmers fail to adequately further develop and enhance open source technologies, the development and adoption of these technologies could be stifled and our products could become less competitive. Delays in developing, completing or shipping new or enhanced products could result in delayed or reduced revenue for those products and could also adversely affect customer acceptance of those offerings.
If third-party enterprise hardware and software providers do not continue to make offerings compatible with our offerings, our software will cease to be competitive.
Our products will not be competitive unless third-party enterprise hardware and software offerings are compatible with our offerings. We intend to encourage the development of additional applications that operate on both current and new versions of our offerings by, among other means, attracting third-party developers to the Linux platform, providing open source tools to create these applications and maintaining our existing developer relationships through marketing and technical support. We intend to encourage the compatibility of our software with various hardware platforms by maintaining and expanding our relationships, both business and technical, with relevant independent hardware vendors. If we are not successful in achieving these goals, however, our products will not be competitive and our sales growth will be adversely affected.
We may be unable to predict the future course of open source technology development, which could reduce the market appeal of our products and damage our reputation.
We do not exercise control over many aspects of the development of open source technology. Different groups of open source software programmers compete with one another to develop new technology. Typically, the technology developed by one group will become more widely used than that developed by others. If we acquire or adopt new technology and incorporate it into our products but competing technology becomes more
23
Table of Contents
widely used or accepted, the market appeal of our products may be reduced and that could harm our reputation, diminish the Red Hat brand and result in decreased revenue.
Because of the characteristics of open source software, there are few technology barriers to entry in the open source market by new competitors and it may be relatively easy for new competitors with greater resources than we have to enter our markets and compete with us.
One of the characteristics of open source software is that anyone can modify the existing software or develop new software that competes with existing open source software. Such competition can develop without the degree of overhead and lead time required by traditional proprietary software companies. It is possible for new competitors with greater resources than ours to develop their own open source solutions, potentially reducing the demand for, and putting price pressure on, our solutions. For example, in October 2006 Oracle Corporation (“Oracle”) announced plans to sell support for its version of the Linux operating system. In addition, some competitors make their open source software available for free download and use on an ad hoc basis or may position their open source software as a loss leader. We cannot guarantee that we will be able to compete successfully against current and future competitors or that competitive pressure and/or the availability of open source software will not result in price reductions, reduced operating margins and loss of market share, any one of which could seriously harm our business.
Industry consolidation may lead to increased competition and may harm our operating results.
There has been a trend in industry consolidation in our markets for several years. We expect this trend to continue as companies attempt to strengthen or hold their market positions in an evolving industry and as companies are acquired or are unable to continue operations. For example, in early 2010, Oracle Corporation (“Oracle”) completed its acquisition of Sun Microsystems, Inc. (“Sun”). Oracle’s acquisition of Sun creates a large, integrated supplier of enterprise software that may also provide hardware optimized for these software products. We believe that industry consolidation may result in stronger competitors that are better able to compete as sole-source vendors for customers. This could have a material adverse effect on our business, financial condition and results of operations.
Our continued success depends on our ability to adapt to a rapidly changing industry as well as maintaining a strong brand. Investment in new business strategies and initiatives could disrupt our ongoing business and may present risks not originally contemplated.
We must continue to invest significant resources in research and development in order to enhance our existing products and services and introduce new high-quality products and services and technology infrastructure. If we are unable to ensure that our users and customers have a high quality experience with our products and services, then they may become dissatisfied and move to competitors’ products and services. In addition, if we are unable to predict user preferences or industry changes, or if we are unable to modify our products and services on a timely basis, we may lose customers.
We believe that the brand identity that we have developed has contributed significantly to the success of our business. We also believe that maintaining and enhancing the Red Hat brand is important to expanding our customer base and attracting talented employees. In order to maintain and enhance our brand, we may be required to make substantial investments that may or may not be successful. If we fail to promote and maintain our brand, or if we incur excessive costs in doing so, our business, operating results and financial condition may be materially and adversely affected. Maintaining our brand will depend in part on our ability to remain a leader in open source technology and our ability to continue to provide high quality products and services.
Our future success will depend on our ability to adapt to rapidly changing technologies, to adapt our services to evolving industry standards and to improve the performance and reliability of our services. Our failure to adapt to such changes would harm our business. In addition, the widespread adoption of other technological changes could require substantial expenditures to modify or adapt our services or infrastructure.
24
Table of Contents
Moreover, we believe that our continued success depends on our investing in new business strategies or initiatives that complement our strategic direction and product road map. Such endeavors may involve significant risks and uncertainties, including distraction of management’s attention away from other business operations, and insufficient revenue generation to offset liabilities and expenses undertaken with such strategies and initiatives. Because these endeavors may be inherently risky, no assurance can be given that such endeavors will not materially adversely affect our business, operating results or financial condition.
We must effectively develop, deliver and stimulate demand for new products and technologies in order to remain competitive.
We operate in highly competitive markets that are characterized by rapid technological change and frequent new product and service announcements. To retain and grow our market share, we must continually introduce new and innovative offerings and technologies, enhance and adapt existing offerings and technologies and effectively stimulate customer demand for our new offerings. Delays in developing, completing or shipping new or enhanced offerings and technologies could result in delayed or reduced revenue for those offerings and could also adversely affect customer acceptance of those offerings and technologies. The success of new and enhanced offering introductions depend on several factors, including our ability to develop and complete new products in a timely manner, successfully promote the offerings, manage the risks associated with the offerings, make sufficient resources available to support them and address any quality or other defects in the early stages of introduction. Our failure to deliver new and enhanced offerings and technologies in a timely and cost-effective manner and to effectively stimulate demand for them may harm our reputation as a leader in open source technology, diminish the Red Hat brand and adversely affect our business, operating results and financial condition.
Our Red Hat Enterprise Virtualization offerings are based on an emerging technology area, and the potential market for these offerings remains uncertain.
Our Red Hat Enterprise Virtualization products and related services are based on an emerging technology area, the success of which will depend on the perceived technological and operational benefits and cost savings associated with the adoption of this technology, virtualization solutions and the acceptance of cloud computing environments. The market for these products and services remains uncertain. To the extent that the adoption of virtualization solutions occurs more slowly or less pervasively than we expect, the revenue growth associated with these products and services may be slower than currently expected, which could adversely affect our business, operating results and financial condition.
If our growth rate slows, our stock price could be adversely impacted.
As the markets for our products mature and the scale of our business increases, the rate of growth in our product sales will likely be lower than those we have experienced in earlier periods. In addition, to the extent that the adoption of Red Hat Enterprise technologies occurs more slowly or is less pervasive than we expect, our revenue growth rates may slow materially or our revenue may decline substantially, which could adversely affect our stock price.
Security and privacy breaches may expose us to liability and harm our reputation and business.
Our security and testing measures may not prevent security breaches that could harm our business. Advances in computer capabilities, new discoveries in the field of cryptography, inadequate technology or facility security measures or other factors may result in a compromise or breach of our systems and the data we process. Any compromise of our systems or the data we process could harm our reputation or financial condition and, therefore, our business. In addition, a party who is able to circumvent our security measures or exploit inadequacies in our security measures, could, among other effects, misappropriate proprietary information, cause interruptions in our operations or expose customers to computer viruses or other disruptions or vulnerabilities.
25
Table of Contents
Actual or perceived vulnerabilities may lead to claims against us by customers, partners or other third-parties, which could be material. While our customer agreements typically contain provisions that seek to limit our liability, there is no assurance these provisions will be enforceable and effective under applicable law.
We are vulnerable to system failures, which could harm our reputation and business.
We rely on our technology infrastructure, among other functions, to sell our products and services, support our partners, fulfill orders and bill, collect and make payments. Our systems are vulnerable to damage or interruption from natural disasters, power loss, telecommunication failures, terrorist attacks, computer intrusions and viruses, computer denial-of-service attacks and other events. A significant number of our systems are not redundant, and our disaster recovery planning is not sufficient for every eventuality. Our systems are also subject to break-ins, sabotage and intentional acts of vandalism by internal employees, contractors and third-parties. Despite any precautions we may take, such problems could result in, among other consequences, interruptions in our services, which could harm our reputation, business and financial condition. We do not carry business interruption insurance sufficient to protect us from all losses that may result from interruptions in our services as a result of system failures or to cover all contingencies. Any interruption in the availability of our websites and on-line interactions with customers and partners would create a large volume of user questions and complaints that would need to be addressed by our support personnel rather than by self-help. If our support personnel cannot meet this demand, customer and partner satisfaction levels may fall, which in turn could cause additional claims, reduced revenue or loss of customers.
If we fail to comply with our customer contracts or government contracting regulations, our business could suffer.
Our contracts with our customers may include unique and specialized performance requirements. In particular, our contracts with federal, state, provincial and local governmental customers are subject to various procurements regulations, contract provisions and other requirements relating to their formation, administration and performance. Any failure by us to comply with the specific provisions in our customer contracts or any violation of government contracting regulations could result in the imposition of various civil and criminal penalties, which may include termination of contracts, forfeiture of profits, suspension of payments and, in the case of our government contracts, fines and suspension from future government contracting. In addition, we may be subject to qui tam litigation, the process by which a private individual sues or prosecutes on behalf of the government relating to government contracts and shares in the proceeds of any successful litigation or settlement, which could include claims for up to treble damages. Further, any negative publicity related to our customer contracts or any proceedings surrounding them, regardless of its accuracy, may damage our business and affect our ability to compete for new contracts. If our customer contracts are terminated, if we are suspended from government work, or if our ability to compete for new contracts is adversely affected, we could suffer an adverse effect on our business, operating results or financial condition.
RISKS RELATED TO LEGAL UNCERTAINTY
If our products are found or alleged to infringe third-party intellectual property rights, we could be required to redesign our products, replace components of our products, enter into license agreements with third parties and provide infringement indemnification.
We regularly commit to our subscription customers that if portions of our enterprise products are found to infringe any third-party intellectual property rights we will, at our expense and option: (i) obtain the right for the customer to continue to use the product consistent with their subscription agreement with us; (ii) modify the product so that it is non-infringing; or (iii) replace the infringing component with a non-infringing component, and indemnify them against specified infringement claims. Although we cannot predict whether we will need to satisfy these commitments and often have limitations on these commitments, satisfying the commitments could
26
Table of Contents
be costly and time consuming and could materially and adversely affect our operating results and financial condition. In addition, our insurance policies would likely not adequately cover our exposure to this type of claim.
We are vulnerable to claims that our products infringe third-party intellectual property rights because our products are comprised of software components, many of which are developed by numerous independent parties, and an adverse legal decision affecting our intellectual property could materially harm our business.
We are vulnerable to claims that our products infringe third-party intellectual property rights, including patent, copyright and trade secrets because our products are comprised of software components, many of which are developed by numerous independent parties. Moreover, because the scope of software patent protection is often not well defined or readily determinable, patent applications in the United States are not publicly disclosed at the time of filing, and the number of software patents that are issued each year is significant and growing, we may be unable to assess the relevance of patents to our products, or take appropriate responsive action, in a timely or economic manner. We expect that our products could increasingly be subject to intellectual property infringement claims as the size of our business and market share grow, the number of products and competitors in our industry segment grows and the functionality of products in different industry segments overlaps. Defending patent infringement, copyright infringement and/or trade secret claims, even claims without significant merit, can be expensive.
The SCO Group, Inc. (“SCO”) as well as others have publicly alleged that Linux may infringe certain third-party intellectual property rights. SCO filed suit against IBM, alleging, among other things, that certain Linux kernels wrongfully include SCO’s intellectual property. Uncertainty concerning allegations of this type, regardless of their merit, could adversely affect our reputation and business. If those asserting such claims were to prevail in this or other actions related to their claims regarding Linux or other products, our operating results and financial condition could be materially and adversely affected.
An adverse legal decision regarding the intellectual property in and to our technology and other offerings could harm our business and may do so materially. See “Legal Proceedings”.
We could be prevented from selling or developing our software if the GNU General Public License and similar licenses under which our products are developed and licensed are not enforceable or are modified so as to become incompatible with other open source licenses.
A number of our offerings, including Red Hat Enterprise Linux, have been developed and licensed under the GNU General Public License and similar open source licenses. These licenses state that any program licensed under them may be liberally copied, modified and distributed. It is possible that a court would hold these licenses to be unenforceable or that someone could assert a claim for proprietary rights in a program developed and distributed under them. Any ruling by a court that these licenses are not enforceable, or that open source components of our product offerings may not be liberally copied, modified or distributed, may have the effect of preventing us from distributing or developing all or a portion of our products. In addition, licensors of open source software employed in our offerings may, from time to time, modify the terms of their license agreements in such a manner that those license terms may no longer be compatible with other open source licenses in our offerings or our end user license agreement, and thus could, among other consequences, prevent us from continuing to distribute the software code subject to the modified license.
Our products may contain defects that may be costly to correct, delay market acceptance of our products and expose us to claims and litigation.
Despite our testing procedures, errors have been and will continue to be found in our products after commencement of commercial shipments. This risk is exacerbated by the fact that much of the code in our
27
Table of Contents
products is developed by independent parties over whom we exercise no supervision or control. If errors are discovered, we may have to make significant expenditures of capital and devote significant technical resources to analyze, correct, eliminate or work around them and may not be able to successfully do so in a timely manner or at all. Errors and failures in our products could result in a loss of, or delay in, market acceptance of our products, loss of existing or potential customers and delayed or lost revenue and could damage our reputation and our ability to convince commercial users of the benefits of Linux-based operating systems and other open source software products.
In addition, failures in our products could cause system or other failures for our customers who may assert warranty and other claims for substantial damages against us. Although our license agreements with our customers often contain provisions which seek to limit our exposure to potential product liability claims, it is possible that these provisions may not be effective or enforceable under the laws of some jurisdictions. In addition, our insurance policies may not adequately limit our exposure to this type of claim. These claims, even if unsuccessful, could be costly and time consuming to defend and could materially harm our business.
Our efforts to protect our trademarks may not be adequate to prevent third-parties from misappropriating our intellectual property rights in our trademarks.
Our collection of trademarks is valuable and important to our business. The protective steps we have taken in the past have been, and may in the future continue to be, inadequate to protect and deter misappropriation of, our trademark rights. We may be unable to detect the unauthorized use of, or take appropriate steps to enforce, our trademark rights in a timely manner. We have registered some of our trademarks in countries in North America, South America, Europe, Asia, Africa and Australia and have other trademark applications pending in various countries around the world. Effective trademark protection may not be available in every country in which we offer or intend to offer our products and services. Failure to adequately protect our trademark rights could damage or even destroy the Red Hat brand and impair our ability to compete effectively. Furthermore, defending or enforcing our trademark rights could result in the expenditure of significant financial and managerial resources.
Efforts to assert intellectual property ownership rights in our products could impact our standing in the open source community, which could limit our product innovation capabilities and adversely affect our business.
When we undertake actions to protect and maintain ownership and control over our intellectual property, including patents, copyrights and trademark rights, our standing in the open source community could be adversely affected, which in turn could limit our ability to continue to rely on this community, upon which we are dependent, as a resource to help develop and improve our products and further our research and development efforts, and could adversely affect our business.
We are, and may become, involved in disputes and lawsuits that could have a material adverse affect on our performance or stock price.
Lawsuits or legal proceedings may be commenced against us. These disputes and proceedings may involve significant expense and divert management’s attention. If we do not prevail in these matters, we could be required to pay substantial damages or settlement costs, which could have a material adverse affect on our financial condition or results of operations. See “Legal Proceedings” for additional information on this and other certain matters that may affect our performance or stock price.
Our business is subject to a variety of U.S. and international laws regarding data protection.
Our business is subject to federal, state and international laws regarding privacy and protection of user data. We post, on our website, our privacy policies and practices concerning the use and disclosure of user data. Any
28
Table of Contents
failure by us to comply with our posted privacy policies or other federal, state or international privacy-related or data protection laws and regulations could result in proceedings against us by governmental entities or others which could have a material adverse effect on our business, results of operations and financial condition.
It is possible that these laws may be interpreted and applied in a manner that is inconsistent with our data practices. If so, in addition to the possibility of fines and penalties, a governmental order requiring that we change our data practices could result, which in turn could have a material adverse effect on our business. Compliance with these regulations may involve significant costs or require changes in business practices that result in reduced revenue. Noncompliance could result in penalties being imposed on us or orders that we cease conducting the noncompliant activity.
RISKS RELATED TO FINANCIAL UNCERTAINTY
Our quarterly operating results may not be a reliable indicator of our future operating results.
Due to the unpredictability of the technology spending environment, among other reasons, our revenue and operating results have fluctuated and may continue to fluctuate. We base our current and projected future expense levels, in part, on our estimates of future revenue. Our expenses are, to a large extent, fixed in the short term. Accordingly, we may not be able to adjust our spending quickly enough to protect our projected operating results for a quarter if our revenue in that quarter falls short of our expectations. If, among other considerations, our future operating results fall below expectations of securities analysts or investors or we are unable to increase or maintain profitability, the market price of our common stock may decline.
Our stock price has been volatile historically and may continue to be volatile. Further, the sale of our common stock by significant stockholders may cause the price of our common stock to decrease.
The trading price of our common stock has been and may continue to be subject to wide fluctuations. Our stock price may fluctuate in response to a number of events and factors, such as quarterly variations in operating results, announcements of technological innovations or new products by us or our competitors, announcements relating to strategic decisions, announcements related to key personnel, customer purchase delays, service disruptions, changes in financial estimates and recommendations by securities analysts, the operating and stock price performance of other companies that investors may deem comparable to us and news reports relating to trends in our markets or general economic conditions.
In addition, several of our stockholders own significant portions of our common stock. If these stockholders were to sell all or a portion of their holdings of our common stock, then the market price of our common stock could be negatively impacted. The effect of such sales, or of significant portions of our stock being offered or made available for sale, could result in strong downward pressure on our stock price. Investors should be aware that they could experience significant short-term volatility in our stock if such stockholders decide to sell all or a portion of their holdings of our common stock at once or within a short period of time.
We may lack the financial and operational resources needed to increase our market share and compete effectively.
In the market for operating systems, we face significant competition from larger companies with greater financial, operational and technical resources and name recognition than we have. Competitors, which offer hardware-independent multi-user operating systems for Intel platforms and/or Linux and UNIX-based operating systems, include Microsoft Corporation (“Microsoft”), Oracle, Novell, Inc. (“Novell”), IBM, HP and Sun.
In the market for middleware offerings, we face significant competition from larger companies with greater financial, operational and technical resources and name recognition than we have. These competitors include, but
29
Table of Contents
are not limited to, IBM, Microsoft, Oracle and Sun, all of which offer broad portfolios of enterprise Java and non-Java middleware products. IBM and Oracle bundle hardware and software for their customers, making it more difficult to penetrate these customer bases.
In the market for virtualization offerings, we face significant competition from larger companies with greater financial, operational and technical resources and name recognition than we have. These competitors include, but are not limited to, VMware, Inc. (“VMware”), Microsoft, Citrix Systems, Inc. (“Citrix”), Novell and Oracle.
In the market for services offerings, we face significant competition from larger companies with greater financial, operational and technical resources and name recognition than we have, including those that currently provide service and training related to the Linux operating system as well as other operating systems, particularly UNIX-based operating systems, due to the fact that Linux-and UNIX-based operating systems share many common features. These larger companies, including IBM, Oracle, Novell and HP, may be able to leverage their existing service organizations and provide higher levels of consulting and training on a more cost-effective basis than we can.
We may lack the resources needed to compete successfully with our current competitors as well as potential new competitors. Moreover, we compete in certain areas with our strategic partners and potential strategic partners, and this may adversely impact our relationship with an individual partner or a number of partners. Competitive pressures could affect prices or demand for our products and services, resulting in reduced profit margins and loss of market opportunity. We may have to lower the prices of our products and services to stay competitive, which could affect our margins and financial condition. In addition, if our pricing and other factors are not sufficiently competitive, we may lose market share. Industry consolidation may also effect competition by creating larger and potentially stronger competitors in the markets in which we compete, which may have an adverse effect on our business.
During fiscal 2007, several of our largest competitors made announcements relevant to markets in which we operate, including an announcement by Oracle to offer Linux support services and an announcement by Novell regarding an agreement with Microsoft to collaborate on technology, a cross covenant not to sue the other party’s customers for patent infringement and an agreement by Microsoft to purchase and distribute coupons for SUSE Linux maintenance and support. Microsoft and Novell announced an extension of their partnership and the purchase and distribution of an additional $100 million in coupons for SUSE Linux by Microsoft in August 2008.
We may not be able to meet the financial and operational challenges that we will encounter as our international operations, which represented approximately 43.4% of our total revenue for the fiscal year ended February 28, 2010, continue to expand.
Our international operations accounted for approximately 43.4% of total revenue for the fiscal year ended February 28, 2010. As we expand our international operations, we may have difficulty managing and administering a globally-dispersed business and we may need to expend additional funds to, among other activities, reorganize our sales force and technical support services team, outsource or supplement general and administrative functions, staff key management positions, obtain additional information technology infrastructure and successfully localize software products for a significant number of international markets, which may negatively affect our operating results.
Additional challenges associated with the conduct of our business overseas that may negatively affect our operating results include:
| · | Fluctuations in exchange rates; |
| · | Longer payment cycles and less financial stability of customers; |
| · | Compliance with a wide variety of foreign laws; |
30
Table of Contents
| · | Difficulty selecting and monitoring channel partners outside of the United States; |
| · | Difficulty protecting our intellectual property rights overseas due to, among other reasons, the uncertainty of laws and enforcement in certain countries relating to the protection of intellectual property rights; |
| · | Difficulty maintaining quality standards consistent with the Red Hat brand; |
| · | Export control regulations could prevent us from shipping our products into and out of certain markets; |
| · | Changes in import/export duties, quotas or other trade barriers could affect the competitive pricing of our products and services and reduce our market share in some countries; and |
| · | Economic or political instability or terrorist acts in some international markets could result in the loss or forfeiture of some foreign assets and the loss of sums spent developing and marketing those assets and the revenue associated with them. |
Moreover, in many foreign countries, particularly in certain developing economies, it is not uncommon to engage in business practices that are prohibited by regulations applicable to us, such as the Foreign Corrupt Practices Act and similar laws. Although we have policies and procedures designed to promote compliance with these laws, our employees, contractors and agents, as well as those companies to which we outsource certain of our business operations, may take actions in violation of our policies and procedures. Any such violation, even if prohibited by our policies and procedures or the law, could have a material adverse effect on our business. Any failure by us to effectively manage the challenges associated with the international expansion of our operations could adversely affect our business, operating results and financial condition.
We may be subject to greater tax liabilities.
We are subject to income and other taxes in the U.S. and in numerous foreign jurisdictions. Our domestic and foreign tax liabilities are subject to the allocation of revenue and expenses in different jurisdictions. Additionally, the amount of taxes paid is subject to our interpretation of applicable tax laws in the jurisdictions in which we operate. We are regularly subject to audits by tax authorities. While we endeavor to comply with all applicable tax laws, there can be no assurance that a governing tax authority will not have a different interpretation of the law than we do or that we will comply in all respects with applicable tax laws, which could result in additional taxes. There can be no assurance that the outcomes from these audits will not have an adverse effect on our results of operations in the period for which the review is made.
Because we recognize revenue from subscriptions for our service over the term of the subscription, downturns or upturns in sales may not be immediately reflected in our operating results.
We generally recognize subscription revenue from customers ratably over the term of their subscription agreements, which are generally 12 to 36 months. As a result, much of the revenue we report in each quarter is deferred revenue from subscription agreements entered into during previous quarters. Consequently, a decline in subscriptions in any one quarter will not necessarily be fully reflected in the revenue in that quarter and will negatively affect our revenue in future quarters. In addition, we may be unable to adjust our cost structure to reflect this reduced revenue. Accordingly, the effect of significant downturns in sales and market acceptance of our service may not be fully reflected in our results of operations until future periods. Our subscription model also makes it difficult for us to rapidly increase our revenue through additional sales in any period, as revenue from new customers must be recognized over the applicable subscription term.
If our goodwill or amortizable intangible assets become impaired, we may be required to record a significant charge to earnings.
Under generally accepted accounting principles, we review our amortizable intangible assets for impairment when events or changes in circumstances indicate the carrying value may not be recoverable. Goodwill is
31
Table of Contents
required to be tested for impairment at least annually. Factors that may be considered a change in circumstances indicating that the carrying value of our goodwill or amortizable intangible assets may not be recoverable include a decline in stock price and market capitalization, future cash flows and slower growth rates in our industry. We may be required to record a significant charge to earnings in our financial statements during the period in which any impairment of our goodwill or amortizable intangible assets is determined resulting in an adverse impact on our results of operations.
We may be exposed to potential risks if we do not have an effective system of disclosure controls or internal controls or fail on an ongoing basis to properly address Section 404 of the Sarbanes-Oxley Act of 2002.
We must comply, on an on-going basis, with the requirements of Section 404 of the Sarbanes-Oxley Act of 2002 (“SOX”), including those provisions that establish the requirements for both management and auditors of public companies with respect to reporting on internal control over financial reporting. We cannot be certain that measures we have taken, and will take, will be sufficient or timely completed to meet the Section 404 requirements on an on-going basis, or that we will be able to implement and maintain adequate disclosure controls and controls over our financial processes and reporting in the future, particularly in light of our rapid growth, international expansion and changes in our products and services, which are expected to result in on-going changes to our control systems and areas of potential risk.
If we fail to maintain an effective system of disclosure controls or internal control over financial reporting, including satisfaction of the requirements of Section 404 of SOX, we may not be able to accurately or timely report on our financial results or adequately identify and reduce fraud. As a result, the financial position of our business could be harmed; current and potential future shareholders could lose confidence in us and/or our reported financial results, which may cause a negative effect on our trading price; and we could be exposed to litigation or regulatory proceedings, which may be costly or divert management attention.
Our investment portfolio is subject to credit and illiquidity risks and fluctuations in the market value of our investments and interest rates. These risks may result in an impairment in or the loss of all or a portion of the value of our investments, an inability to sell our investments and a decline in interest income.
We maintain an investment portfolio of various holdings, types and maturities. Our portfolio as of February 28, 2010 consisted primarily of money market funds, U.S. government securities, certificates of deposit, agency securities, corporate securities and equity securities. Although we follow an established investment policy and seek to minimize the risks associated with our investments by investing primarily in investment grade, highly liquid securities and by limiting the amounts invested with any one institution, type of security or issuer, we cannot give assurances that the assets in our investment portfolio will not lose value or become impaired, or that our interest income will not decline.
We may be required to record impairment charges for other-than-temporary declines in fair market value in our investments. Future fluctuations in economic and market conditions could adversely affect the market value of our investments, and we could record additional impairment charges and lose some or all of the principal value of investments in our portfolio. A total loss of an investment or a significant decline in the value of our investment portfolio could adversely affect our operating results and financial condition. For information regarding the sensitivity of and risks associated with the market value of portfolio investments and interest rates, see “Quantitative and Qualitative Disclosures About Market Risk”.
Our investments in private companies are subject to risk of loss of investment capital. These investments are inherently risky because the markets for the technologies they have under development are typically in the early stages and may never materialize. We could lose the value of our entire investment in these companies.
32
Table of Contents
We are subject to risks of currency fluctuations and related hedging operations.
A portion of our business is conducted in currencies other than the U.S. dollar. Changes in exchange rates among other currencies and the U.S. dollar will affect our net revenue, operating expenses and operating margins. We cannot predict the impact of future exchange rate fluctuations. We use financial instruments, primarily forward purchase contracts, to economically hedge U.S. dollar and other currency commitments arising from trade accounts receivable, trade accounts payable and fixed purchase obligations. If these hedging activities are not successful or we change or reduce these hedging activities in the future, we may experience significant unexpected expenses from fluctuations in exchange rates. For information regarding our hedging activity, see “Quantitative and Qualitative Disclosures About Market Risk”.
33
Table of Contents
| ITEM 1B. | UNRESOLVED STAFF COMMENTS |
None.
| ITEM 2. | PROPERTIES |
Our headquarters is currently located in a leased facility in Raleigh, North Carolina, which consists of approximately 120,000 square feet. In January 2002, we assumed this lease from an unrelated third-party. The lease, which has an original term of 20 years, will expire on June 10, 2020. The annual rental expense under this lease is approximately $1.7 million. In March 2006, we assumed a second lease in Raleigh, North Carolina as part of our headquarters facilities which consisted of approximately 25,000 square feet. In 2007, 2008 and 2009, we acquired under this second lease an additional 25,000, 10,000 and 8,000 square feet, respectively, further expanding our headquarters facilities. The term for this second lease, as amended, will expire on February 28, 2017. The term for 8,000 square feet on the second lease, as amended, will expire on January 31, 2014. The annual rental expense under this second lease is approximately $1.7 million.
In addition to our headquarters, we have leased office facilities in 29 countries and more than 65 locations. Significant locations in North America include Atlanta, Georgia; Charlotte, North Carolina; Mountain View, California; Richmond, Virginia; Toronto, Canada; Tyson’s Corner, Virginia and Westford, Massachusetts. Significant locations in Latin America include Buenos Aires, Argentina and Sao Paulo, Brazil. Significant locations in EMEA include Brno, Czech Republic; Cork, Ireland; Farnborough, United Kingdom; Munich, Germany; Puteaux, France; Ra’anana, Israel and Stuttgart, Germany. Significant locations in Asia Pacific include offices in Beijing, China; Brisbane, Australia; Mumbai, India; Pune, India; Singapore and Tokyo, Japan. We believe that in all material respects our properties have been satisfactorily maintained, are in good condition and are suitable for our operations.
| ITEM 3. | LEGAL PROCEEDINGS |
Commencing on or about March 2001, the Company and certain of its officers and directors were named as defendants in a series of purported class action suits arising out of the Company’s initial public offering and secondary offering. Approximately 310 other IPO issuers were named as defendants in similar class action complaints (together, the “IPO Allocation Actions”). On August 8, 2001, Chief Judge Michael Mukasey of the U.S. District Court for the Southern District of New York issued an order that transferred all of the IPO Allocation Actions, including the complaints involving the Company, to one judge for coordinated pre-trial proceedings (Case No. 21 MC 92). The plaintiffs contend that the defendants violated federal securities laws by issuing registration statements and prospectuses that contained materially false and misleading information and failed to disclose material information. Plaintiffs also challenge certain IPO allocation practices by underwriters and the lack of disclosure thereof in initial public offering documents. On April 19, 2002, plaintiffs filed amended complaints in each of the 310 consolidated actions, including the Red Hat action. The relief sought consists of unspecified damages, attorneys’ and expert fees and other unspecified costs. In October of 2002, the individual director and officer defendants of the Company were dismissed from the case without prejudice. In October of 2004, the District Court certified a class in six of the 310 actions (the “focus cases”) and noted that the decision is intended to provide strong guidance to all parties regarding class certification in the remaining cases. The Company’s action is not one of the focus cases. On December 5, 2006, the U.S. Court of Appeals for the Second Circuit vacated the District Court’s class certification with respect to the focus cases and remanded the matter for further consideration. In September 2007, discovery moved forward in the focus cases and plaintiff filed and amended complaints against the focus case issuer and underwriter defendants. Defendants in the focus cases filed motions to dismiss the second amended complaints in November 2007 and filed their oppositions to plaintiffs’ motion for class certification in December 2007. The motions to dismiss in the focus cases were granted in part and denied in part, and the issue of class certification is currently pending before the Court. On April 2, 2009, the plaintiffs filed a motion for preliminary approval of a settlement agreement to resolve the lawsuit, to which the Company has consented and for which payments called for by the settlement agreement are to be paid by the defendant insurers. The trial court heard arguments on September 10, 2009 on the fairness of
34
Table of Contents
the settlement. In an opinion and order filed October 5, 2009, the trial court granted plaintiffs’ motion for approval of the settlement and directed the clerk of the court to close the action. Notices of appeal in the matter have been filed, and the appeal is pending before the Court of Appeals for the Second Circuit.
In the summer of 2004, 14 class action lawsuits were filed against the Company and several of its former officers on behalf of investors who purchased the Company’s securities during various periods from June 19, 2001 through July 13, 2004. All 14 suits were filed in the U.S. District Court for the Eastern District of North Carolina. In each of the actions, plaintiffs sought to represent a class of purchasers of the Company’s common stock during some or all of the period from June 19, 2001 through July 13, 2004. All of the claims arose in connection with the Company’s announcement on July 13, 2004 that it would restate certain of its financial statements (the “Restatement”). One or more of the plaintiffs asserted that certain former officers (the “Individual Defendants”) and the Company violated Sections 10(b) and 20(a) of the Securities Exchange Act of 1934, as amended (the “Securities Exchange Act”), and Rule 10b-5 thereunder by issuing the financial statements that the Company subsequently restated. One or more of the plaintiffs sought unspecified damages, interest, costs, attorneys’ and experts’ fees, an accounting of certain profits obtained by the Individual Defendants from trading in the Company’s common stock, disgorgement by the Company’s former chief executive officer and former chief financial officer of certain compensation and profits from trading in the Company’s common stock pursuant to Section 304 of the Sarbanes-Oxley Act of 2002 and other relief. As of September 8, 2004, all of these class action lawsuits were consolidated into a single action referenced as Civil Action No. 5:04-CV-473BR and titled In re Red Hat, Inc. Securities Litigation. On May 6, 2005, the plaintiffs filed an amended consolidated class action complaint. On July 29, 2005, the Company, on behalf of itself and the Individual Defendants, filed a motion to dismiss the action for failure to state a claim upon which relief may be granted. Also on that date, PricewaterhouseCoopers LLP (“PwC”), another defendant, filed a separate motion to dismiss. On May 12, 2006, the Court issued an order granting the motion to dismiss the Securities Exchange Act claims against several of the Individual Defendants, but denying the motion to dismiss the Securities Exchange Act claims against the Company, its former chief executive officer and former chief financial officer. The Court dismissed the claims under the Sarbanes-Oxley Act in their entirety, and also granted PwC’s motion to dismiss. On November 6, 2006, the plaintiffs filed a motion for class certification. Subsequent to the filing of that motion, several plaintiffs withdrew as potential class representatives, and the Company opposed the certification of the remaining proposed class representatives. On May 11, 2007, the Court entered an order denying class certification and denying all other pending motions as moot. Thereafter, on July 13, 2007 Charles Gilbert filed a renewed motion for appointment as lead plaintiff and approval of selection of lead counsel. On November 13, 2007, the Court entered an Order allowing Gilbert’s motion, appointing him lead plaintiff, adding him as a party plaintiff and appointing lead counsel. On January 14, 2008, Gilbert’s counsel filed a motion to certify the action as a class action. On August 28, 2009, the Court entered an Order certifying the action as a class action, appointing Gilbert as the class representative, and defining the class as “all purchasers of the common stock of Red Hat, Inc. between December 17, 2002, and July 12, 2004, inclusive and who were damaged thereby,” excluding Company insiders. On December 15, 2009, the Company announced that it had reached an agreement in principle to settle this matter, subject, among other matters, to completion of a final written settlement agreement and court approval. The Company recorded, for its quarter ended November 30, 2009, an estimated liability in the amount of $8.8 million for its portion of the proposed settlement. Should the efforts to settle this matter not be successful, the Company intends to vigorously defend itself in this matter. There can be no assurance, however, that the Company would be successful, and an adverse resolution of the lawsuit could have a material adverse effect on the Company’s financial position and results of operations in the period in which the lawsuit is resolved.
On October 9, 2007, IP Innovation, LLC and Technology Licensing Corporation filed a complaint in the Eastern District of Texas (Civil Action No. 2-07CV-447) against Red Hat, Inc. and Novell, Inc., alleging direct and indirect infringement of U.S. Patent Nos. 5,072,412, 5,394,521 and 5,533,183 with regard to aspects of the Company’s Linux-based products. The complaint seeks, among other relief, compensatory damages. The Company answered the complaint on February 1, 2008, including counterclaims against plaintiffs for declaratory judgment of invalidity, unenforceability and noninfringement of the patents-in-suit, and the plaintiffs filed a reply to those counterclaims on February 11, 2008. The court issued a memorandum opinion and order denying
35
Table of Contents
defendants’ motion for partial summary judgment for invalidity due to indefiniteness and construing disputed claim terms on August 10, 2009. Discovery in the case is complete, and trial began on April 26, 2010. Based on information available to date, the Company believes it has meritorious defenses to this matter and does not anticipate that the lawsuit will have a material adverse effect on its business, financial position and results of operations. There can be no assurance, however, that the Company will be successful in its defense. The Company estimates that an adverse resolution of the lawsuit could result in damages ranging from approximately $0.1 million to $11.0 million.
On March 3, 2009, Software Tree LLC filed a complaint in the Eastern District of Texas (Civil Action No. 6:09-cv-00097-LED) against Red Hat, Inc., Hewlett-Packard Co., Genuitec, L.L.C., and Dell, Inc. alleging direct and indirect infringement of U.S. Patent No. 6,163,776 with regard to aspects of the Company’s JBoss Hibernate product, among other products of the Defendants. The complaint seeks, among other relief, compensatory damages, enhanced damages and injunctive relief. The Company answered the complaint on April 7, 2009 and denied the allegations of direct and indirect infringement, asserted affirmative defenses and filed a counterclaim seeking a declaration that the patent was invalid, unenforceable and not infringed. Discovery in the case is proceeding, and trial has been scheduled for September 13, 2010. Based on the Company’s efforts to date, it believes it has meritorious defenses to this matter, and intends to vigorously defend itself. There can be no assurance, however, that the Company will be successful in its defense, and an adverse resolution of the lawsuit could have a material adverse effect on its business, financial position and results of operation, including its ability to continue to commercialize the technologies implicated in the litigation.
On December 9, 2009, the Company filed a complaint in the Eastern District of Texas (Civil Action No. 6:09-cv-00549) against Bedrock Computer Technologies LLC (“Bedrock”) seeking a declaratory judgment that United States Patent No. 5,893,120 (“‘120 Patent”) is invalid, unenforceable and not infringed. The complaint states that Bedrock brought an action in which it wrongly accused some customers of the Company of infringing the ‘120 Patent based on their use of computer equipment configured with or utilizing software based on various versions of the Linux operating system. The complaint seeks a declaration that anyone’s use, sale, or offer for sale of the Linux kernel distributed by the Company has not and does not in any manner infringe any claim of the patent or otherwise infringe or violate any rights of Bedrock and that the ‘120 Patent is invalid and unenforceable. On January 29, 2010, Bedrock responded denying the contentions in the complaint and asserting a counterclaim alleging that Red Hat has directly and indirectly infringed the ‘120 Patent. On February 22, 2010, Red Hat replied to the counterclaim denying the allegations of infringement and asserting affirmative defenses. On March 26, 2010, Bedrock filed its first amended answer and counterclaim with crossclaims against fifteen parties. Based on information available to date, the Company believes it has meritorious defenses to the counterclaims and does not anticipate that the counterclaims will have a material adverse effect on its business, financial position and results of operations. There can be no assurance, however, that the Company will be successful in its defense.
The Company also experiences routine litigation in the normal course of its business, including patent litigation. The Company presently believes that the outcome of this routine litigation will not have a material adverse effect on its financial position and results of operations.
| ITEM 4. | [REMOVED AND RESERVED] |
36
Table of Contents
PART II
| ITEM 5. | MARKET FOR REGISTRANT’S COMMON EQUITY, RELATED STOCKHOLDER MATTERS AND ISSUER PURCHASES OF EQUITY SECURITIES |
Market Information
Our common stock trades on the New York Stock Exchange under the symbol “RHT”. The chart below sets forth the high and low sales information for each of the quarters of the fiscal years ended February 28, 2010 and February 28, 2009.
| FY 2010 | FY 2009 | |||||||||||
| Quarter |
High | Low | High | Low | ||||||||
| First |
$ | 20.39 | $ | 12.98 | $ | 24.42 | $ | 16.54 | ||||
| Second |
$ | 23.72 | $ | 18.11 | $ | 24.80 | $ | 19.00 | ||||
| Third |
$ | 28.94 | $ | 22.20 | $ | 21.20 | $ | 7.50 | ||||
| Fourth |
$ | 31.76 | $ | 26.52 | $ | 16.44 | $ | 8.30 | ||||
Holders
As of April 23, 2010, we estimate that there were 1,969 registered stockholders of record of our common stock.
Dividends
We have never declared or paid any cash dividends on our common stock. We anticipate that our future earnings will be retained for the operation and expansion of our business and do not anticipate paying cash dividends in the foreseeable future.
37
Table of Contents
Stock Performance Graph
The following graph shows a comparison of cumulative total return (equal to dividends plus stock appreciation) during the period from February 28, 2005 through February 28, 2010 for:
| · | Red Hat, Inc.; |
| · | A peer group consisting of Akamai Technologies, Inc., Autodesk, Inc., BMC, Cadence Design Systems, Inc., Citrix, Compuware Corporation, Jack Henry & Associates, Inc., McAfee, Inc., Micros Systems, Inc., Novell, Progress Software Corporation, RealNetworks, Inc., Sybase, TIBCO Software, Inc., VMWare, Inc. and Verisign, Inc. (the “Stock Performance Peer Group”); |
| · | the NYSE Composite Index; and |
| · | the S&P 500 Index. |
We are required to provide a line-graph presentation comparing cumulative, five-year stockholder returns on an indexed basis with a broad equity market index and either a published industry index or an index of peer companies selected by Red Hat. In our index of peer group companies, we have selected peer companies considered to be peers for purposes of benchmarking executive compensation during the fiscal year ending February 28, 2010. Also, in light of our addition to the S&P 500 Index during 2009, our exclusive comparative broad market index will be the S&P 500 Index, and we will therefore discontinue comparison against the NYSE Composite Index in future filings.
COMPARISON OF FIVE-YEAR CUMULATIVE
TOTAL RETURN AMONG RED HAT, COMPETITIVE
PEER GROUP, NYSE COMPOSITE INDEX AND S&P 500 INDEX
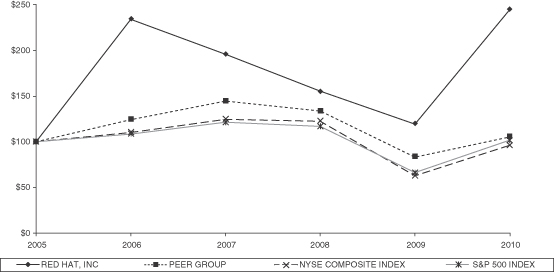
| 2/28/05 | 2/28/06 | 2/28/07 | 2/29/08 | 2/28/09 | 2/28/10 | |||||||||||||
| RED HAT, INC. |
$ | 100.00 | $ | 234.26 | $ | 195.73 | $ | 155.45 | $ | 119.35 | $ | 244.55 | ||||||
| PEER GROUP |
$ | 100.00 | $ | 124.16 | $ | 144.58 | $ | 133.79 | $ | 83.21 | $ | 105.20 | ||||||
| NYSE COMPOSITE INDEX |
$ | 100.00 | $ | 110.10 | $ | 124.63 | $ | 122.42 | $ | 63.06 | $ | 96.09 | ||||||
| S&P 500 INDEX |
$ | 100.00 | $ | 108.39 | $ | 121.36 | $ | 116.99 | $ | 66.35 | $ | 101.88 | ||||||
Notes:
| · | Assumes initial investment of $100.00 on February 28, 2005. Total return includes reinvestment of dividends. |
38
Table of Contents
| · | The lines represent monthly index levels derived from compounded daily returns that include all dividends. |
| · | If the monthly interval, based on the fiscal year-end, ends on a day that is not a trading day, the preceding trading day is used. |
| · | The index level for all series was set to $100.00 on February 28, 2005. |
| · | The information included under the heading “Stock Performance Graph” in Item 5 of this Annual Report on Form 10-K is “furnished” and not “filed” and shall not be deemed to be “soliciting material” or subject to Rule 14A, shall not be deemed “filed” for purposes of Section 18 of the Securities Exchange Act of 1934, as amended (the “Exchange Act”) or otherwise subject to the limitations of that section, and shall not be deemed incorporated by reference in any filing of the Company under the Securities Act of 1933, as amended, or the Exchange Act, whether made before or after the date of this report and irrespective of any general incorporation by reference language in any such filing. |
| · | The stock price performance shown in the graph is not necessarily indicative of future price performance. |
Issuer Purchases of Equity Securities
The table below sets forth information regarding the Company’s purchases of its common stock during its fourth fiscal quarter ended February 28, 2010:
Issuer Purchases of Equity Securities
| Period |
Total Number of Shares Purchased (1) |
Weighted Average Price Paid per Share |
Total Number of Shares Purchased as Part of Publicly Announced Plans or Programs (2) |
Maximum Number (or Approximate Dollar Value) of Shares that May Yet Be Purchased Under the Plans or Programs (2) | ||||||
| December 1, 2009 – December 31, 2009 |
135,153 | $ | 30.93 | 135,000 | $ | 95.7 million | ||||
| January 1, 2010 – January 31, 2010 |
2,294,000 | $ | 29.90 | 2,206,700 | $ | 29.7 million | ||||
| February 1, 2010 – February 28, 2010 |
722,068 | $ | 27.69 | 721,844 | $ | 9.7 million | ||||
| Total |
3,151,221 | $ | 29.43 | 3,063,544 | $ | 9.7 million | ||||
| (1) | During the three months ended February 28, 2010, the Company withheld an aggregate of 87,677 shares of common stock from employees to satisfy minimum tax withholding obligations relating to the vesting of restricted share awards. These shares were not withheld pursuant to the program described in NOTE 2 below. |
| (2) | On November 17, 2008, the Company announced that its Board of Directors had amended the repurchase program that was announced in October 2006 to authorize the repurchase of up to an aggregate of $250.0 million of common stock, without regard to amounts previously repurchased. The amended program expires on the earlier of (i) October 31, 2010 or (ii) a determination by the Board of Directors, the Chief Executive Officer or the Chief Financial Officer to discontinue the program. As of February 28, 2010 the amount available under the program for the repurchase of common stock was $9.7 million. See NOTE 17 to the Consolidated Financial Statements for information regarding the Company’s $300.0 million stock repurchase program announced on March 24, 2010, and NOTE 19 to the Consolidated Financial Statements for information regarding shares repurchased under the program subsequent to February 28, 2010. |
39
Table of Contents
| ITEM 6. | SELECTED FINANCIAL DATA |
The following table sets forth selected financial data for each of the Company’s fiscal years in the five-year period ended February 28, 2010. The selected balance sheet data as of February 28, 2010 and February 28, 2009 and the selected statement of operations data for the fiscal years ended February 28, 2010, February 28, 2009 and February 29, 2008 are derived from our Consolidated Financial Statements contained in this Annual Report on Form 10-K and should be read in conjunction with the Consolidated Financial Statements, related notes and other financial information included herein. The selected statement of operations data for the fiscal years ended February 28, 2007 and February 28, 2006 and the selected balance sheet data as of February 29, 2008, February 28, 2007 and February 28, 2006, are derived from our Consolidated Financial Statements contained in the Annual Reports on Form 10-K for the years ended February 29, 2008 and February 28, 2007.
| Year Ended | ||||||||||||||||
| February 28, 2010 |
February 28, 2009 |
February 29, 2008 |
February 28, 2007 |
February 28, 2006 | ||||||||||||
| (in thousands, except per share data) | ||||||||||||||||
| SELECTED STATEMENT OF OPERATIONS DATA |
||||||||||||||||
| Revenue: |
||||||||||||||||
| Subscriptions |
$ | 638,654 | $ | 541,210 | $ | 449,811 | $ | 341,206 | $ | 230,444 | ||||||
| Training and services |
109,582 | 111,362 | 73,205 | 59,418 | 47,886 | |||||||||||
| Total subscription and training and services revenue |
$ | 748,236 | $ | 652,572 | $ | 523,016 | $ | 400,624 | $ | 278,330 | ||||||
| Gross profit |
$ | 634,391 | $ | 546,446 | $ | 442,363 | $ | 335,888 | $ | 229,823 | ||||||
| Income from operations |
$ | 100,349 | $ | 82,521 | $ | 70,372 | $ | 52,289 | $ | 58,082 | ||||||
| Interest income |
$ | 10,381 | $ | 36,473 | $ | 58,541 | $ | 43,738 | $ | 28,780 | ||||||
| Other income, net |
$ | 10,936 | $ | 7,336 | $ | 1,879 | $ | (448 | ) | $ | 1,273 | |||||
| Interest expense |
$ | 164 | $ | 4,798 | $ | 6,252 | $ | 6,016 | $ | 6,119 | ||||||
| Net income |
$ | 87,253 | $ | 78,721 | $ | 76,667 | $ | 59,907 | $ | 79,685 | ||||||
| Basic net income per common share |
$ | 0.46 | $ | 0.41 | $ | 0.40 | $ | 0.32 | $ | 0.45 | ||||||
| Diluted net income per common share |
$ | 0.45 | $ | 0.39 | $ | 0.36 | $ | 0.29 | $ | 0.41 | ||||||
| Weighted average shares outstanding |
||||||||||||||||
| Basic |
187,845 | 190,772 | 193,485 | 189,347 | 178,112 | |||||||||||
| Diluted |
193,546 | 211,344 | 221,313 | 218,823 | 207,815 | |||||||||||
| Note: | Effective March 1, 2006, the Company adopted the fair value recognition provisions for accounting for share-based payments, using the modified prospective transition method. In accordance with the provisions of the modified prospective transition method, results for prior fiscal years have not been restated. See NOTE 2 to the Consolidated Financial Statements. |
| As of | |||||||||||||||
| February 28, 2010 |
February 28, 2009 |
February 29, 2008 |
February 28, 2007 |
February 28, 2006 | |||||||||||
| (in thousands) | |||||||||||||||
| SELECTED BALANCE SHEET DATA |
|||||||||||||||
| Total cash and investments in debt and equity securities (available-for-sale, short- and long-term) |
$ | 970,185 | $ | 846,089 | $ | 1,331,943 | $ | 1,156,094 | $ | 1,077,540 | |||||
| Working capital (1) |
$ | 436,852 | $ | 444,183 | $ | 222,608 | $ | 706,702 | $ | 680,317 | |||||
| Total assets |
$ | 1,870,872 | $ | 1,753,636 | $ | 2,079,982 | $ | 1,785,854 | $ | 1,314,241 | |||||
| Convertible debentures (1) |
$ | — | $ | — | $ | 570,000 | $ | 570,000 | $ | 570,000 | |||||
| Stockholders’ equity |
$ | 1,111,052 | $ | 1,106,053 | $ | 951,191 | $ | 821,236 | $ | 477,558 | |||||
40
Table of Contents
| Note: | Effective March 1, 2006, the Company adopted the fair value recognition provisions for accounting for share-based payments, using the modified prospective transition method. In accordance with the provisions of the modified prospective transition method, balances for prior fiscal years have not been restated. See NOTE 2 to the Consolidated Financial Statements. |
| (1) | Convertible debentures with an aggregate face amount of $570.0 million were reclassified from non-current to current during the fourth quarter of the fiscal year ended February 29, 2008, and as a result are included in working capital as of February 29, 2008. All of the debentures were repurchased or redeemed by the Company during the fiscal year ended February 28, 2009 and as a result, no balance was outstanding as of February 28, 2009. |
41
Table of Contents
| ITEM 7. | MANAGEMENT’S DISCUSSION AND ANALYSIS OF FINANCIAL CONDITION AND RESULTS OF OPERATIONS |
OVERVIEW
We are a global leader in providing open source software solutions to the enterprise, including our core enterprise operating system platform, Red Hat Enterprise Linux (“RHEL”), our enterprise middleware platform, JBoss Enterprise Middleware, our virtualization solutions and other Red Hat enterprise technologies.
Open source software is an alternative to proprietary software and represents a different model for the development and licensing of commercial software code than that typically used for proprietary software. Because open source software code is freely shared, there are customarily no licensing fees for the distribution of open source software. Therefore, we do not recognize revenue from the licensing of the code itself. We provide value to our customers through the aggregation, integration, testing, certification, delivery, maintenance and support of our Red Hat enterprise technologies, and by providing a level of scalability, stability and accountability for the enterprise technologies we package and distribute. Moreover, because communities of developers not employed by us assist with the creation of our open source offerings, opportunities for further innovation of our offerings are supplemented by these communities.
We sell our enterprise technologies through subscriptions, and we recognize revenue over the period of the subscription agreements with our customers. In addition, we generally provide certain managed services for each of our enterprise technologies, through Red Hat Network (“RHN”), Red Hat Network Satellite (“RHN Satellite”), JBoss Operations Network (“JBoss ON”) and JBoss Customer Support Portal (“JBoss CSP”), as a component of our subscriptions. We market our offerings primarily to enterprise customers including large enterprises, government organizations, small- and medium-size businesses and educational institutions.
We have focused on introducing and gaining acceptance for Red Hat enterprise technologies that comprise our open source architecture. Since introducing our initial enterprise open source operating system platform, Red Hat Enterprise Linux, it has gained widespread independent software vendor (“ISV”) and independent hardware vendor (“IHV”) support. We have continued to build our open source architecture by expanding our enterprise offerings and introducing new systems management services, middleware, integrated virtualization and clustering capability, file management systems, directory and certificate technologies and enhanced security functionality. We intend to bring the value of open source technology to other key areas of the enterprise infrastructure as the development community efforts support and customer needs dictate.
We derive our revenue and generate cash from customers primarily from two sources: (i) subscription revenue and (ii) training and services revenue. The arrangements with our customers that produce this revenue and cash are explained in further detail under “Critical Accounting Policies and Estimates” below and in NOTE 2 to the Consolidated Financial Statements. These arrangements typically involve subscriptions to Red Hat enterprise technologies. Our revenue is affected by, among other factors, corporate, government and consumer spending levels. In evaluating the performance of our business, we consider a number of factors, including total revenue, deferred revenue, operating income, operating margin and cash flows from operations.
Revenue. For the year ended February 28, 2010, total revenue increased 14.7% or $95.7 million to $748.2 million from $652.6 million for the year ended February 28, 2009. Subscription revenue increased 18.0% or $97.4 million, driven primarily by additional subscriptions related to our principal RHEL technologies, which have gained broader market acceptance in mission-critical areas of computing, and our international expansion. The increase is, in part, a result of the continued migration of enterprises in industries such as telecommunications, government and financial services to our open source platform from a proprietary Unix platform. Training and services revenue decreased by 1.6% or $1.8 million. The decrease in training and services revenue was the result of a challenging economic environment, in which enterprises were scaling back discretionary spending in areas such as training and travel.
42
Table of Contents
We believe the success of our business model is influenced by:
| · | the extent to which we can expand the breadth and depth of our technology and service offerings; |
| · | our ability to enhance the value of subscriptions for Red Hat enterprise technologies through frequent and continuous innovations to these technologies; |
| · | the acceptance and widespread deployment of open source solutions by small, medium and large enterprises and government agencies; |
| · | our ability to generate subscription revenue for Red Hat enterprise technologies; and |
| · | our ability to provide customers with consulting and training services that generate additional revenue. |
Deferred Revenue. Our deferred revenue, current and long-term, balance at February 28, 2010 was $645.9 million. Because of our subscription model and revenue recognition policies, deferred revenue improves predictability of future revenue. Deferred revenue at February 28, 2010 increased $102.8 million or 18.9% as compared to the balance at February 28, 2009 of $543.1 million. As a result of changes in foreign currency exchange rates, our deferred revenue balance at February 28, 2010 was $20.2 million higher than what it would have been if spot exchange rates on that date were the same as at February 28, 2009.
Subscriptions. Our enterprise technologies are sold under subscription agreements. These agreements typically have a one- or three-year subscription period. The subscription entitles the end user to maintenance, which generally consists of a specified level of support, as well as security updates, bug fixes, functionality enhancements and upgrades to the technology, when and if available, during the term of the subscription through our integrated management technologies, RHN, RHN Satellite, JBoss ON and JBoss CSP. Our customers have the ability to purchase higher levels of subscriptions that increase the level of support the customer is entitled to receive. Subscription revenue increased sequentially for each quarter of fiscal 2010, 2009 and 2008 and is being driven primarily by the increased market acceptance and use of open source software by the enterprise and our expansion of sales channels and geographic footprint during these periods.
Revenue by geography. We operate our business in three geographic regions: The Americas (U.S., Latin America and Canada); EMEA (Europe, Middle East and Africa); and Asia Pacific (principally Japan, Singapore, India, Australia, South Korea and China). In the fiscal year ended February 28, 2010, approximately $324.9 million or 43.4% of our revenue was generated outside the United States compared to approximately $267.0 million or 40.9% for the fiscal year ended February 28, 2009. Our international operations are expected to continue to grow as our international sales force and channels become more mature and as we enter new locations or expand our presence in existing locations. As of February 28, 2010, we had offices in more than 65 locations throughout the world.
Gross profit margin. Primarily as a result of changes in mix with a greater proportion of total revenue generated by subscription revenue, gross profit margin increased to 84.8% for the year ended February 28, 2010 from 83.7% for the year ended February 28, 2009. Training and services revenue decreased as a percentage of total revenue to 14.6% for the year ended February 28, 2010 from 17.1% for the year ended February 28, 2009.
Income from operations. Operating income was 13.4% and 12.6% of total revenue for the years ended February 28, 2010 and February 28, 2009, respectively. The increase in operating income as a percentage of revenue is a result of our increased gross profit margin described above. While we increased our profit margin for the year ended February 28, 2010 to 84.8% from 83.7% for the year ended February 28, 2009, we held operating expenses relatively flat at 71.4% of revenue for the year ended February 28, 2010 as compared to 71.1% for the year ended February 28, 2009. Operating expenses for the year ended February 28, 2010 includes an $8.8 million expense we recognized in connection with an agreement in principle to settle the class action lawsuit brought on behalf of certain shareholders in connection with the restatement of our financial results announced in July 2004. Partially offsetting this $8.8 million litigation settlement-related expense were
43
Table of Contents
efficiencies realized in our general and administrative functions. General and administrative expenses as a percentage of revenue decreased to 13.9% for the year ended February 28, 2010 from 14.6% for the year ended February 28, 2009.
Cash, cash equivalents, investments in debt and equity securities and cash flow from operations. Cash, cash equivalents and short-term and long-term available-for-sale investments in securities balances at February 28, 2010 totaled $970.2 million. During the year ended February 28, 2010, we repurchased $236.4 million of our common stock, which was partially offset by employees’ exercise of stock options which generated $103.3 million of cash proceeds. Cash generated from operating activities for the year ended February 28, 2010 totaled $255.2 million, primarily as a result of the increase in subscription revenue and billings during the same period. Our significant cash balance gives us a measure of flexibility to take advantage of opportunities such as acquisitions, increasing investment in international areas and repurchasing our own common stock.
Foreign currency exchange rates’ impact on results of operations. Approximately 43.4% of our revenue for the year ended February 28, 2010 was produced by sales outside the United States. We are exposed to significant risks of foreign currency fluctuation primarily from receivables denominated in foreign currency and are subject to transaction gains and losses, which are recorded as a component in determining net income. The income statements of our non-U.S. operations are translated into U.S. dollars at the average exchange rates for each applicable month in a period. To the extent the U.S. dollar weakens against foreign currencies, the translation of these foreign-currency-denominated transactions results in increased revenue and operating expenses from operations for our non-U.S. operations. Similarly, our revenue and operating expenses will decrease for our non-U.S. operations if the U.S. dollar strengthens against foreign currencies.
Using the average foreign currency exchange rates from our prior fiscal year ended February 28, 2009, our revenue and operating expenses from non-U.S. operations for the year ended February 28, 2010 would have been higher than we reported using the average exchange rates for our current fiscal year ended February 28, 2010 by approximately $0.6 million and $3.4 million, respectively, which would have resulted in income from operations being $2.8 million lower.
Business combinations. On September 4, 2008, we announced our acquisition of Qumranet, including its Kernel Virtual Machine (“KVM”) and SolidICE virtualization technologies, for approximately $104.8 million in cash. The acquisition provides server and desktop virtualization technologies and expertise, related virtualization management capabilities, communities of development and use, and additional influence in, and acceptance of, virtualization technology in the Linux kernel, upon which our Red Hat Linux platform is based. For further discussion, see NOTE 3 to the Consolidated Financial Statements.
In our fiscal year ended February 28, 2010, we focused on, and expect in our fiscal year ending February 28, 2011 to continue to focus on, among other things, (i) gaining widespread acceptance and deployment of Red Hat enterprise technologies by enterprise users globally, (ii) generating increasing revenue from our existing customer base by renewing existing subscriptions and providing additional value to our customers and by growing the number of enterprise technologies that comprise our open source architecture, (iii) generating increased revenue by providing additional systems management, developer support and other targeted services and (iv) generating increasing revenue from additional market penetration through a broader and deeper set of channel partner relationships, including OEMs, VARs and systems integrators and our own international expansion, among other means.
44
Table of Contents
CRITICAL ACCOUNTING POLICIES AND ESTIMATES
Our critical accounting policies and estimates include the following:
| · | Revenue recognition; |
| · | Impairment of goodwill and other long-lived assets; |
| · | Share-based compensation; and |
| · | Deferred taxes and uncertain tax positions. |
Revenue recognition
We recognize revenue in accordance with Financial Accounting Standards Board (“FASB”) Accounting Standards Codification (“ASC”) Section 985-605 (formerly referenced as Statement of Position No. 97-2, Software Revenue Recognition). We establish persuasive evidence of an arrangement for each type of revenue transaction based on either a signed contract with the end customer, a click-through contract on our website whereby the customer agrees to our standard subscription terms, signed or click-through distribution contracts with OEMs and other resellers, or, in the case of individual training seats, through receipt of payment which indicates acceptance of our training agreement terms.
Subscription revenue
Subscription revenue is comprised of direct and indirect sales of Red Hat enterprise technologies. Accounts receivable and deferred revenue are recorded at the time a customer enters into a binding subscription agreement for the purchase of a subscription, subscription services are made available to the customer and the customer is billed. The deferred revenue amount is recognized as revenue ratably over the life of the subscription. Red Hat enterprise technologies are generally offered with either one or three-year base subscription periods; the majority of our subscriptions have one-year terms. Under these subscription agreements, renewal rates are generally specified for one or three-year renewal terms. The base subscription generally entitles the end user to the technology itself and post-contract customer support (“PCS”), generally consisting of a specified level of customer support and security errata, bug fixes, functionality enhancements to the technology and upgrades to new versions of the technologies, each on a when-and-if available basis, during the term of the subscription. We sell our open source technologies through two principal channels: (1) direct, which includes sales by our sales force as well as web store sales, and (2) indirect, which includes distributors, resellers and OEMs. We recognize revenue from the sale of Red Hat enterprise technologies ratably over the period of the subscription beginning on the commencement date of the subscription agreement.
Subscription arrangements with large enterprise customers often have contracts with multiple elements (e.g., software technology, maintenance, training, consulting and other services). We allocate revenue to each element of the arrangement based on vendor-specific objective evidence of each element’s fair value when we can demonstrate sufficient evidence of the fair value of at least those elements that are undelivered. The fair value of each element in multiple element arrangements is created by either (i) providing the customer with the ability during the term of the arrangement to renew that element at the same rate paid for the element included in the initial term of the agreement or (ii) selling the element on a stand-alone basis.
Training and services revenue
Training and services revenue is comprised of revenue for consulting, engineering and customer training and education services. Consulting services consist of time-based arrangements, and revenue is recognized as these services are performed. Engineering services represent revenue earned under fixed fee arrangements with our OEM partners and other customers to provide for significant modification and customization of our Red Hat enterprise technologies. We recognize revenue for these fixed fee engineering services using the percentage of completion basis of accounting, provided we have the ability to make reliable estimates of progress towards
45
Table of Contents
completion, the fee for such services is fixed or determinable and collection of the resulting receivable is probable. Under the percentage of completion method, earnings under the contract are recognized based on the progress toward completion as estimated using the ratio of labor hours incurred to total expected project hours. Changes in estimates are recognized in the period in which they are known. Revenue for customer training and education services is recognized on the dates the services are complete.
Impairment of goodwill and other long-lived assets
We test goodwill for impairment annually and whenever events or circumstances indicate an impairment may exist. We test goodwill at least annually using a two-step process that begins with identifying any potential impairment. Potential impairment is identified if the fair value of the reporting unit to which goodwill applies is less than the recognized or book value of the related reporting entity, including such goodwill. Where the book value of a reporting entity, including related goodwill, is greater than the reporting entity’s fair value, the second step of the goodwill impairment test is performed to measure the amount of impairment loss, if any. For the years ended February 28, 2010, February 28, 2009 and February 29, 2008, we did not identify any potential impairment related to our goodwill.
We evaluate the recoverability of our property and equipment and other long-lived assets whenever events or changes in circumstances indicate an impairment may have occurred. An impairment loss is recognized when the net book value of such assets exceeds the estimated future undiscounted cash flows attributable to the assets or the business to which the assets relate. Impairment losses are measured as the amount by which the carrying value exceeds the fair value of the assets. For the years ended February 28, 2010, February 28, 2009 and February 29, 2008, no significant impairment losses related to our long-lived assets were identified. For further discussion, see NOTE 2 to the Consolidated Financial Statements.
Share-based compensation
Effective March 1, 2006, we adopted the fair value recognition provisions of FASB ASC Section 718 Compensation-Stock Compensation (formerly referenced as Statement of Financial Accounting Standards No. 123 (revised 2004), Share-Based Payment) (“ASC 718”), using the modified-prospective transition method. Under the modified-prospective method, compensation costs include (a) compensation cost for all share-based awards granted prior to, but not yet vested as of, March 1, 2006 based on the grant date fair value estimated in accordance with the original provisions of Statement of Financial Accounting Standards No. 123, Accounting for Stock-based Compensation (“SFAS 123”) and (b) compensation costs for all share-based awards granted or modified on or subsequent to March 1, 2006, based on the grant date fair value estimated in accordance with the provisions of ASC 718.
In applying ASC 718, we are required to make estimates and assumptions with regards to the number of share-based awards that we expect will ultimately vest and the amount of tax benefits we expect will ultimately be realized, among other things. The amount of share-based awards that actually vest and the amount of tax benefits from share-based awards actually realized may differ significantly from our estimates. For further discussion, see NOTE 2 to the Consolidated Financial Statements.
Deferred taxes and uncertain tax positions
We account for income taxes using the liability method in which deferred tax assets or liabilities are recognized for the temporary differences between financial reporting and tax bases of our assets and liabilities and for tax carryforwards at enacted statutory tax rates in effect for the years in which the differences are expected to reverse.
We continue to assess the realizability of our deferred tax assets, which primarily consist of share-based compensation expense deductions, tax credit carryforwards and deferred revenue. In assessing the realizability of
46
Table of Contents
these deferred tax assets, management considers whether it is more likely than not that some portion or all of the deferred tax assets will be realized. As of February 28, 2010, the net deferred tax asset balance was $79.7 million, of which $6.8 million was offset by a valuation allowance. We continue to maintain a valuation allowance against our deferred tax assets with respect to certain foreign net operating loss (“NOL”) carryforwards.
With respect to foreign earnings, it is our policy to invest the earnings of foreign subsidiaries indefinitely outside the U.S. From time to time, however, we may remit a portion of these earnings to the extent we incur no additional U.S. tax and it is otherwise feasible.
Because tax laws are complex and subject to different interpretations, significant judgment is required. As a result, we make certain estimates and assumptions, in (i) calculating our income tax expense, deferred tax assets and deferred tax liabilities, (ii) determining any valuation allowance recorded against deferred tax assets and (iii) evaluating the amount of unrecognized tax benefits, as well as the interest and penalties related to such uncertain tax positions. Our estimates and assumptions may differ significantly from tax benefits ultimately realized.
47
Table of Contents
RESULTS OF OPERATIONS
Years ended February 28, 2010 and February 28, 2009
The following table is a summary of our results of operations for the years ended February 28, 2010 and February 28, 2009 (in thousands):
| Year Ended | |||||||||||||||
| February 28, 2010 |
February 28, 2009 |
$ Change |
% Change |
||||||||||||
| Revenue: |
|||||||||||||||
| Subscriptions |
$ | 638,654 | $ | 541,210 | $ | 97,444 | 18.0 | % | |||||||
| Training and services |
109,582 | 111,362 | (1,780 | ) | (1.6 | ) | |||||||||
| Total subscription and training and services revenue |
748,236 | 652,572 | 95,664 | 14.7 | |||||||||||
| Cost of subscription and training and services revenue: |
|||||||||||||||
| Cost of subscriptions |
43,426 | 37,267 | 6,159 | 16.5 | |||||||||||
| As a % of subscription revenue |
6.8 | % | 6.9 | % | |||||||||||
| Cost of training and services |
70,419 | 68,859 | 1,560 | 2.3 | |||||||||||
| As a % of training and services revenue |
64.3 | % | 61.8 | % | |||||||||||
| Total cost of subscription and training and services revenue |
113,845 | 106,126 | 7,719 | 7.3 | |||||||||||
| As a % of total revenue |
15.2 | % | 16.3 | % | |||||||||||
| Total gross profit |
634,391 | 546,446 | 87,945 | 16.1 | |||||||||||
| Operating expense: |
|||||||||||||||
| Sales and marketing |
272,705 | 238,552 | 34,153 | 14.3 | |||||||||||
| Research and development |
148,360 | 130,177 | 18,183 | 14.0 | |||||||||||
| General and administrative |
104,227 | 95,196 | 9,031 | 9.5 | |||||||||||
| Litigation settlement |
8,750 | — | 8,750 | — | |||||||||||
| Total operating expense |
534,042 | 463,925 | 70,117 | 15.1 | |||||||||||
| Income from operations |
100,349 | 82,521 | 17,828 | 21.6 | |||||||||||
| Interest income |
10,381 | 36,473 | (26,092 | ) | (71.5 | ) | |||||||||
| Other income, net |
10,936 | 7,336 | 3,600 | 49.1 | |||||||||||
| Interest expense |
(164 | ) | (4,798 | ) | 4,634 | 96.6 | |||||||||
| Income before provision for income taxes |
121,502 | 121,532 | (30 | ) | — | ||||||||||
| Provision for income taxes |
34,249 | 42,811 | (8,562 | ) | (20.0 | ) | |||||||||
| Net income |
$ | 87,253 | $ | 78,721 | $ | 8,532 | 10.8 | % | |||||||
| Gross profit margin—subscriptions |
93.2 | % | 93.1 | % | |||||||||||
| Gross profit margin—training and services |
35.7 | % | 38.2 | % | |||||||||||
| Gross profit margin |
84.8 | % | 83.7 | % | |||||||||||
| As a % of total revenue: |
|||||||||||||||
| Subscription revenue |
85.4 | % | 82.9 | % | |||||||||||
| Training and services revenue |
14.6 | % | 17.1 | % | |||||||||||
| Sales and marketing expense |
36.4 | % | 36.6 | % | |||||||||||
| Research and development expense |
19.8 | % | 19.9 | % | |||||||||||
| General and administrative expense |
13.9 | % | 14.6 | % | |||||||||||
| Litigation settlement |
1.2 | % | — | ||||||||||||
| Total operating expenses |
71.4 | % | 71.1 | % | |||||||||||
| Income from operations |
13.4 | % | 12.6 | % | |||||||||||
| Interest income |
1.4 | % | 5.6 | % | |||||||||||
| Other income, net |
1.5 | % | 1.1 | % | |||||||||||
| Income before provision for income taxes |
16.2 | % | 18.6 | % | |||||||||||
| Net income |
11.7 | % | 12.1 | % | |||||||||||
| Effective income tax rate |
28.2 | % | 35.2 | % | |||||||||||
48
Table of Contents
Revenue
Subscription revenue
Subscription revenue, which is primarily comprised of direct and indirect sales of Red Hat enterprise technologies, increased by 18.0% or $97.4 million to $638.7 million for the year ended February 28, 2010 from $541.2 million for the year ended February 28, 2009. The increase in subscription revenue is primarily due to increases in volumes sold, including additional subscriptions attributable to geographic expansion, and continuing innovation, which attracts new customers and helps to drive renewals from existing customers.
Training and services revenue
Training revenue includes fees paid by our customers for delivery of educational materials and instruction. Services revenue includes fees received from customers for consulting services regarding our offerings, deployment of Red Hat enterprise technologies and for delivery of added functionality to Red Hat enterprise technologies for our major customers and OEM partners. Total training and services revenue decreased by 1.6% or $1.8 million to $109.6 million for the year ended February 28, 2010 from $111.4 million for the year ended February 28, 2009. Training revenue decreased 8.3% or $3.7 million as some enterprises reduced overall spending on discretionary items such as training and related travel in response to the challenging overall economic environment. Partially offsetting the reduction in training revenue, our services revenue increased by 3.0% or $2.0 million. Combined training and services revenue decreased as a percentage of total revenue to 14.6% for the year ended February 28, 2010 from 17.1% for the year ended February 28, 2009.
Cost of revenue
Cost of subscription revenue
The cost of subscription revenue primarily consists of expenses we incur to support, distribute, manufacture and package Red Hat enterprise technologies. These costs include labor related cost to provide technical support and maintenance, as well as cost for fulfillment, physical media, literature, packaging and shipping. Cost of subscription revenue increased by 16.5% or $6.2 million to $43.4 million for the year ended February 28, 2010 from $37.3 million for the year ended February 28, 2009. The increase is primarily the result of continued additions to our technical support staff to meet the demands of our growing subscriber base for support and maintenance. Gross profit margin on subscriptions increased to 93.2% for the year ended February 28, 2010 from 93.1% for the year ended February 28, 2009 as we leveraged existing infrastructure to deliver support and maintenance to our growing subscriber base.
Cost of training and services revenue
Cost of training and services revenue is mainly comprised of personnel and third-party consulting costs for the design, development and delivery of custom engineering, training courses and professional services provided to various customers. Cost of training and services revenue increased by 2.3% or $1.6 million to $70.4 million for the year ended February 28, 2010 from $68.9 million for the year ended February 28, 2009. The cost to deliver training decreased 2.8% or $0.8 million to $26.7 million for the year ended February 28, 2010 compared to $27.5 million for the year ended February 28, 2009. The overall decrease in training costs was driven by a decrease in external training costs such as rental expense for offsite training rooms and outsourced instructors in response to reduced demand for our training services during the first half of fiscal 2010. Costs to deliver our services revenue increased by 5.6% or $2.3 million primarily as a result of increased travel and internal facilities costs. Because a significant portion of our costs to deliver both training and professional services are fixed in nature, as compared to our training and services revenue, overall costs to deliver training and services as a percentage of training and services revenue increased to 64.3% for the year ended February 28, 2010 from 61.8% for the year ended February 28, 2009.
49
Table of Contents
Gross profit
Primarily as a result of changes in mix, with a greater proportion of our total revenue generated by subscription revenue, gross profit margin increased to 84.8% for the year ended February 28, 2010 from 83.7% for the year ended February 28, 2009. Training and services revenue decreased as a percentage of total revenue to 14.6% for the year ended February 28, 2010 from 17.1% for the year ended February 28, 2009.
Operating expenses
Sales and marketing
Sales and marketing expense consists primarily of salaries and other related costs for sales and marketing personnel, sales commissions, travel, public relations and marketing materials and trade shows. Sales and marketing expense increased by 14.3% or $34.2 million to $272.7 million for the year ended February 28, 2010 from $238.6 million for the year ended February 28, 2009. This increase was partially due to a $23.3 million increase in selling costs, primarily related to increased employee compensation attributable to the expansion of our sales force from the prior year. The remaining increase relates to marketing costs, which grew $10.8 million or 23.4% for the year ended February 28, 2010 as compared to the year ended February 28, 2009. The increase in marketing costs includes $6.3 million related to increased advertising and tradeshow expenditures. Sales and marketing expense as a percentage of revenue decreased to 36.4% for the year ended February 28, 2010 from 36.6% for the years ended February 28, 2009 as we leveraged our existing infrastructure to generate increased sales.
Research and development
Research and development expense consists primarily of personnel and related costs for development of software technologies and systems management offerings. Research and development expense increased by 14.0% or $18.2 million to $148.4 million for the year ended February 28, 2010 from $130.2 million for the year ended February 28, 2009. The increase in research and development costs primarily resulted from the expansion of our engineering group through direct hires and the acquisition of businesses and technologies. Employee compensation increased by $13.7 million. The remaining increase in research and development costs relates primarily to process and technology infrastructure enhancements, which increased $4.1 million. Research and development expense was 19.8% and 19.9% of total revenue for the year ended February 28, 2010 and February 28, 2009, respectively.
General and administrative
General and administrative expense consists primarily of personnel and related costs for general corporate functions, including information systems, finance, accounting, legal, human resources and facilities expense. General and administrative expense increased by 9.5% or $9.0 million to $104.2 million for the year ended February 28, 2010 from $95.2 million for the year ended February 28, 2009. Increased headcount across all functions to help the business scale increased employee compensation costs by $2.4 million for the year ended February 28, 2010 as compared to the year ended February 28, 2009. The remaining net increase in general and administrative expenses of $6.6 million for the year ended February 28, 2010 as compared to the year ended February 28, 2009, relates to increased outside services fees of $3.1 million, which were primarily for outside legal services, and $3.6 million for process and technology infrastructure enhancements, including incremental depreciation and amortization charges. General and administrative expense decreased as a percentage of revenue to 13.9% for the year ended February 28, 2010 from 14.6% for the year ended February 28, 2009 as we continued to leverage our corporate functions.
Litigation settlement
On December 15, 2009, we announced that we had reached an agreement in principle to settle the class action lawsuit, pending in the United States District Court for the Eastern District of North Carolina, brought on
50
Table of Contents
behalf of a class of shareholders in connection with the restatement of our financial results announced in July 2004. The $8.8 million expense we recorded for the year ended February 28, 2010 represents our portion of the payment pursuant to such agreement in principle. For a discussion of this matter, see “Legal Proceedings”.
Interest income
Interest income decreased by 71.5% or $26.1 million to $10.4 million for the year ended February 28, 2010 from $36.5 million for the year ended February 28, 2009. The decrease in interest income for the year ended February 28, 2010 is attributable to (i) lower yields on our investments due to an overall lower interest rate environment and (ii) lower cash balances, which were reduced by outlays for acquisitions and the repurchase and redemption of our convertible debentures and repurchases of our common stock.
Interest expense
Interest expense for the year ended February 28, 2009 primarily consisted of interest and the related amortization of deferred debt issuance costs associated with the convertible debentures and totaled $4.8 million. During the second half of fiscal 2009 we repurchased or redeemed all of our outstanding convertible debentures. Accordingly, there was no interest expense or related amortization of debt issuance costs associated with the convertible debentures for the year ended February 28, 2010.
Other income, net
Other income, net increased by 49.1% or $3.6 million to $10.9 million for the year ended February 28, 2010 from $7.3 million for the year ended February 28, 2009. The increase is primarily due to an increase in gains realized from the sale of our investments in available-for-sale equity securities for the year ended February 28, 2010.
Income taxes
During the year ended February 28, 2010, we recorded $34.2 million of income tax expense, which resulted in an annual effective tax rate of 28.2%. Our income tax expense for the year ended February 28, 2010 includes a discrete tax benefit from research tax credits, net of a corresponding reduction of NOLs, which resulted in a net reduction of income tax expense of $7.3 million. Excluding the impact of the discrete tax benefit, our annual effective tax rate was 34.2%, which differs from the U.S. federal statutory rate of 35.0% primarily due to foreign income taxed at different rates and foreign tax credits which were partially offset by state income tax expense.
The provision for income tax for the year ended February 28, 2010 consists of $24.8 million of U.S. income tax expense and $9.4 million of foreign income tax expense. During the year ended February 28, 2009, we recorded $42.8 million of income tax expense, which resulted in an annual effective tax rate of 35.2%. Our effective tax rate differed from the U.S. federal statutory rate of 35.0% primarily due to state income taxes which were partially offset by foreign income taxed at different rates and certain nonrecurring income tax deductions. The provision for income tax for the year ended February 28, 2009 consisted of $41.2 million of U.S. income tax expense and $1.6 million of foreign income tax expense.
51
Table of Contents
Years ended February 28, 2009 and February 29, 2008
The following table is a summary of our results of operations for the years ended February 28, 2009 and February 29, 2008 (in thousands):
| Year Ended | |||||||||||||||
| February 28, 2009 |
February 29, 2008 |
$ Change |
% Change |
||||||||||||
| Revenue: |
|||||||||||||||
| Subscriptions |
$ | 541,210 | $ | 449,811 | $ | 91,399 | 20.3 | % | |||||||
| Training and services |
111,362 | 73,205 | 38,157 | 52.1 | |||||||||||
| Total subscription and training and services revenue |
652,572 | 523,016 | 129,556 | 24.8 | |||||||||||
| Cost of subscription and training and services revenue: |
|||||||||||||||
| Cost of subscriptions |
37,267 | 33,581 | 3,686 | 11.0 | |||||||||||
| As a % of subscription revenue |
6.9 | % | 7.5 | % | |||||||||||
| Cost of training and services |
68,859 | 47,072 | 21,787 | 46.3 | |||||||||||
| As a % of training and services revenue |
61.8 | % | 64.3 | % | |||||||||||
| Total cost of subscription and training and services revenue |
106,126 | 80,653 | 25,473 | 31.6 | |||||||||||
| As a % of total revenue |
16.3 | % | 15.4 | % | |||||||||||
| Total gross profit |
546,446 | 442,363 | 104,083 | 23.5 | |||||||||||
| Operating expense: |
|||||||||||||||
| Sales and marketing |
238,552 | 192,049 | 46,503 | 24.2 | |||||||||||
| Research and development |
130,177 | 97,417 | 32,760 | 33.6 | |||||||||||
| General and administrative |
95,196 | 82,525 | 12,671 | 15.4 | |||||||||||
| Total operating expense |
463,925 | 371,991 | 91,934 | 24.7 | |||||||||||
| Income from operations |
82,521 | 70,372 | 12,149 | 17.3 | |||||||||||
| Interest income |
36,473 | 58,541 | (22,068 | ) | (37.7 | ) | |||||||||
| Other income, net |
7,336 | 1,879 | 5,457 | 290.4 | |||||||||||
| Interest expense |
(4,798 | ) | (6,252 | ) | 1,454 | 23.3 | |||||||||
| Income before provision for income taxes |
121,532 | 124,540 | (3,008 | ) | (2.4 | ) | |||||||||
| Provision for income taxes |
42,811 | 47,873 | (5,062 | ) | (10.6 | ) | |||||||||
| Net income |
$ | 78,721 | $ | 76,667 | $ | 2,054 | 2.7 | % | |||||||
| Gross profit margin—subscriptions |
93.1 | % | 92.5 | % | |||||||||||
| Gross profit margin—training and services |
38.2 | % | 35.7 | % | |||||||||||
| Gross profit margin |
83.7 | % | 84.6 | % | |||||||||||
| As a % of total revenue: |
|||||||||||||||
| Subscription revenue |
82.9 | % | 86.0 | % | |||||||||||
| Training and services revenue |
17.1 | % | 14.0 | % | |||||||||||
| Sales and marketing expense |
36.6 | % | 36.7 | % | |||||||||||
| Research and development expense |
19.9 | % | 18.6 | % | |||||||||||
| General and administrative expense |
14.6 | % | 15.8 | % | |||||||||||
| Total operating expenses |
71.1 | % | 71.1 | % | |||||||||||
| Income from operations |
12.6 | % | 13.5 | % | |||||||||||
| Interest income |
5.6 | % | 11.2 | % | |||||||||||
| Other income, net |
1.1 | % | 0.4 | % | |||||||||||
| Income before provision for income taxes |
18.6 | % | 23.8 | % | |||||||||||
| Net income |
12.1 | % | 14.7 | % | |||||||||||
| Effective income tax rate |
35.2 | % | 38.4 | % | |||||||||||
52
Table of Contents
Revenue
Subscription revenue
Subscription revenue increased by 20.3% or $91.4 million to $541.2 million for the year ended February 28, 2009 from $449.8 million for the year ended February 29, 2008. The increase in subscription revenue was primarily due to increases in volumes sold, including additional subscriptions attributable to geographic expansion, and continuing innovation, which attracted new customers and helped drive renewals from existing customers.
Training and services revenue
Total training and services revenue increased by 52.1% or $38.2 million to $111.4 million for the year ended February 28, 2009 from $73.2 million for the year ended February 29, 2008. Training revenue increased 7.4% or $3.1 million as a result of continued demand for Red Hat Certified Engineers, Technicians and Architects. Additionally, we enabled more resellers to provide our training which increased the availability of training classes. Services revenue increased by 112.7% or $35.0 million primarily as a result of Amentra, which provided an additional $30.1 million of consulting revenue. As a result of increased demand for training and continued investment in our services capabilities, training and services revenue increased as a percentage of total revenue to 17.1% for the year ended February 28, 2009 from 14.0% for the year ended February 29, 2008.
Cost of revenue
Cost of subscription revenue
Cost of subscription revenue increased by 11.0% or $3.7 million to $37.3 million for the year ended February 28, 2009 from $33.6 million for the year ended February 29, 2008. The increase was primarily the result of continued additions to our technical support staff to meet the demands of our growing subscriber base for support and maintenance. Gross profit margin on subscriptions increased to 93.1% for the year ended February 28, 2009 from 92.5% for the year ended February 29, 2008.
Cost of training and services revenue
Cost of training and services revenue increased by 46.3% or $21.8 million to $68.9 million for the year ended February 28, 2009 from $47.1 million for the year ended February 29, 2008. The cost to deliver training increased 8.5% or $2.1 million to $27.5 million for the year ended February 28, 2009 compared to $25.3 million for the year ended February 29, 2008. The increase in training costs were directly related to increased training revenue as the costs to deliver training as a percentage of training revenue was unchanged at 60.1% for each of the years ended February 28, 2009 and February 29, 2008. Costs to deliver our services revenue increased 86.2% or $19.3 million primarily as a result of costs to deliver consulting services related to Amentra, which added $17.6 million to the year-over-year increase. The remaining increase in costs to deliver services resulted from increased staffing to meet the growing demand for our existing consulting services. Costs to deliver training and services as a percentage of training and services revenue decreased to 61.8% for the year ended February 28, 2009 from 64.3% for the year ended February 29, 2008 due to improved margins resulting from better labor and facilities utilization.
Gross profit
As a result of changes in mix, gross profit margin decreased slightly to 83.7% for the year ended February 28, 2009 from 84.6% for the year ended February 29, 2008. Training and services revenue increased as a percentage of total revenue to 17.1% for the year ended February 28, 2009 from 14.0% for the year ended February 29, 2008, primarily due to the acquisition of Amentra. Gross profit margin on services increased to 38.2% for the year ended February 28, 2009 from 35.7% for the year ended February 29, 2008. Additionally, gross profit margin on subscriptions continued to increase, growing to 93.1% for year ended February 28, 2009 from 92.5% for the year ended February 29, 2008.
53
Table of Contents
Operating expenses
Sales and marketing
Sales and marketing expense increased by 24.2% or $46.5 million to $238.6 million for the year ended February 28, 2009 from $192.0 million for the year ended February 29, 2008. This increase was primarily due to a $39.5 million increase in selling costs, of which $28.3 million relates to increased employee compensation, primarily due to expansion of our sales force from the prior year. Further, costs related to process and technology infrastructure enhancements and incremental amortization expense related to identifiable intangibles, including licensing agreements, trademarks and customer reseller relationships increased $9.9 million and include $3.0 million related to fees paid to outside contractors for processes and systems improvements. The remaining increase relates to marketing costs which increased $7.0 million or 17.8% for the year ended February 28, 2009 as compared to the year ended February 29, 2008. Sales and marketing expense as a percentage of revenue decreased slightly to 36.6% for the year ended February 29, 2008 from 36.7% for the year ended February 29, 2008.
Research and development
Research and development expense increased by 33.6% or $32.8 million to $130.2 million for the year ended February 28, 2009 from $97.4 million for the year ended February 29, 2008. The increase in research and development costs primarily resulted from both the expansion of our engineering group through direct hires and the acquisition of businesses and technologies. Employee compensation increased by $20.1 million. The remaining increase in research and development costs relates to process and technology infrastructure enhancements, which increased $9.6 million, and an increase of $3.0 million in the cost related to facilities expansion. Research and development expense was 19.9% and 18.6% of total revenue for the year ended February 28, 2009 and February 29, 2008, respectively, as a result of continued investing to expand our capabilities in virtualization and other emerging technologies. Incremental costs described above related to Qumranet totaled $6.2 million for year ended February 28, 2009.
General and administrative
General and administrative expense increased by 15.4% or $12.7 million to $95.2 million for the year ended February 28, 2009 from $82.5 million for the year ended February 29, 2008. Increased headcount across all functions increased employee compensation related costs by $7.3 million. Technology infrastructure enhancements, including incremental depreciation and amortization charges, increased administrative costs by $3.2 million. The remaining increase is primarily increased facilities costs of $4.9 million. Partially offsetting these increases was a reduction in outside consulting fees of $2.1 million incurred during the year ended February 28, 2009. General and administrative expense decreased as a percentage of revenue to 14.6% for the year ended February 28, 2009 from 15.8% for the year ended February 29, 2008 as we continued to leverage our corporate functions.
Interest income
Interest income decreased by 37.7% or $22.1 million to $36.5 million for the year ended February 28, 2009 from $58.5 million for the year ended February 29, 2008. The decrease in interest income for the year ended February 28, 2009 was primarily attributable to (i) lower yields on our investments due to an overall lower interest rate environment and (ii) lower cash balances, which were reduced by outlays for acquisitions and the repurchase and redemption of our convertible debentures and repurchase of our common stock.
Other income, net
Other income, net increased by 290.4% or $5.5 million to $7.3 million for the year ended February 28, 2009 from $1.9 million for the year ended February 29, 2008. The increase is primarily due to a $4.1 million realized gain on the repurchase of $284.5 million face-value convertible debentures.
54
Table of Contents
Interest expense
Interest expense primarily consisted of interest and the related amortization of deferred debt issuance costs associated with the convertible debentures and totaled $4.8 million and $6.3 million for the years ended February 28, 2009 and February 29, 2008, respectively. The decrease in interest expense resulted from the repurchase and redemption of an aggregate of $570.0 million of convertible debentures during the second half of fiscal 2009. The face amount of convertible debentures outstanding at February 29, 2008 totaled $570.0 million. No debentures were outstanding at February 28, 2009.
Income taxes
During the year ended February 28, 2009, we recorded $42.8 million of income tax expense, which resulted in an annual effective tax rate of 35.2%. Our annual effective tax rate of 35.2% differed from the U.S. Federal statutory rate of 35.0% primarily due to state income taxes which were partially offset by foreign income taxed at different rates and certain nonrecurring income tax deductions. The provision for income tax for the year ended February 28, 2009 consisted of $41.2 million of U.S. income tax expense and $1.6 million of foreign income tax expense. During the year ended February 29, 2008, we recorded $47.9 million of income tax expense, which resulted in an annual effective tax rate of 38.4%. Our effective tax rate differed from the U.S. federal statutory rate of 35% primarily due to state income taxes and the foreign income taxed at different rates. The provision for income tax for the year ended February 29, 2008 consisted of $42.3 million of U.S. income tax expense and $5.6 million of foreign income tax expense.
LIQUIDITY AND CAPITAL RESOURCES
We have historically derived a significant portion of our liquidity and operating capital from cash flows from operations as well as the sale of equity securities, including private sales of preferred stock and the sale of common stock in our initial and follow-on public offerings, the issuance of convertible debentures and borrowings under working capital lines of credit. At February 28, 2010, we had total cash and investments of $970.2 million, which was comprised of $388.1 million in cash and cash equivalents, $366.5 million of short-term, available-for-sale fixed-income investments, $4.7 million of available-for-sale equity securities, $209.4 million of long-term, available-for-sale fixed-income investments, and $1.5 million in certificates of deposit with maturity dates greater than 30 days. This compares to total cash and investments of $846.1 million at February 28, 2009.
We believe that we currently have sufficient liquidity with $388.1 million in cash and cash equivalents on hand, and we presently do not intend to liquidate our short and long-term investments in debt securities prior to their scheduled maturity dates. However, in the event that we did liquidate these investments prior to their scheduled maturities and there were adverse changes in market interest rates or the overall economic environment, we could be required to recognize a realized loss on those investments when we liquidate. At February 28, 2010, we have accumulated unrealized gains of $1.7 million on our investments in debt securities compared to an accumulated unrealized gain of $0.3 million at February 28, 2009. At February 28, 2010 and February 28, 2009, accumulated unrealized gains related to short-term equity securities available for sale totaled $4.4 million and $4.7 million, respectively.
Year ended February 28, 2010
Cash flows—overview
At February 28, 2010, cash and cash equivalents totaled $388.1 million, a decrease of $127.4 million as compared to February 28, 2009. The decrease in cash and cash equivalents for the year ended February 28, 2010 is a result of net cash used for investing and financing activities. During the year ended February 28, 2010, we repurchased 10,014,022 shares of our common stock at an average price of $23.61 per share totaling
55
Table of Contents
$236.4 million, including transaction costs. Purchases of available-for-sale debt securities, net of proceeds from sales and maturities, totaled $254.4 million for the year ended February 28, 2010. These investing and financing uses of cash were partially offset by cash generated from operating activities and equity transactions related to employee share-based compensation awards, which totaled $255.2 million and $127.0 million, respectively for the year ended February 28, 2010. Net cash generated by operating activities and used for investing and financing activities is further described below.
Cash flows from operations
Cash provided by operations of $255.2 million during the year ended February 28, 2010 includes net income of $87.3 million, adjustments to exclude the impact of non-cash revenues and expenses, which totaled a $67.8 million net source of cash, and changes in working capital, which totaled a $100.2 million net source of cash. Cash provided by changes in operating assets and liabilities for the year ended February 28, 2010 was primarily the result of an increase in our deferred revenue which generated operating cash flow of $82.6 million. The increase in deferred revenue is due to growth in billings as we generally bill our customers in advance of subscription periods. This increase in deferred revenue of $82.6 million excludes the impact of foreign currency translation which increased our total consolidated deferred revenue by $20.2 million for the year ended February 28, 2010.
Cash flows from investing
Cash used in investing activities of $276.2 million for the year ended February 28, 2010 includes net purchases of investments in available-for-sale debt securities of $254.4 million. Investments in property and equipment, primarily related to process and information technology infrastructure enhancements, totaled $28.4 million for the year ended February 28, 2010. Investments in patents and externally developed technology totaled $4.7 million for the year ended February 28, 2010. Partially offsetting these investments were proceeds from the sale of available-for-sale equity securities which totaled $13.1 million for the year ended February 28, 2010.
Cash flows from financing
Cash used in financing activities of $110.2 million for the year ended February 28, 2010 includes $236.4 million used to repurchase 10,014,022 shares of our common stock at an average price of $23.61 per share, including transaction costs. Payments made in return for common shares received from employees to satisfy employees’ minimum tax withholding obligations related to restricted share awards vesting during the year ended February 28, 2010 totaled $11.9 million. Partially offsetting financing activities using cash were excess tax benefits related to share-based employee compensation which totaled $35.6 million and proceeds from employees’ exercise of common stock options which totaled $103.3 million. Payments on other borrowings totaled $0.9 million for the year ended February 28, 2010.
Year ended February 28, 2009
Cash flows—overview
At February 28, 2009, cash and cash equivalents totaled $515.5 million, a decrease of $162.2 million as compared to February 29, 2008. The decrease in cash and cash equivalents for the year ended February 28, 2009 is a result of net cash used for investing and financing activities. During the year ended February 28, 2009, we repurchased and redeemed for $565.6 million our convertible debentures with an aggregate face amount of $570.0 million and repurchased 2,875,052 million shares of our common stock at an average price of $14.70 per share totaling $42.3 million. Additionally, during the third quarter of fiscal 2009 we acquired Qumranet for net cash of $101.3 million. These significant investing and financing uses of cash were partially offset by cash generated from operating activities, which totaled $236.4 million for the year ended February 28, 2009, and proceeds from sales and maturities of our available-for-sale securities which, net of purchases, totaled $317.2
56
Table of Contents
million for the year ended February 28, 2009. Net cash generated by operating activities and investing and used for financing activities are further described below.
Cash flows from operations
Cash provided by operations of $236.4 million during the year ended February 28, 2009 includes net income of $78.7 million, adjustments to exclude the impact of non-cash revenues and expenses, which totaled a $71.9 million net source of cash, and changes in working capital, which totaled a $85.8 million net source of cash. Cash provided by changes in operating assets and liabilities for the year ended February 28, 2009 was primarily the result of an increase in our deferred revenue which generated operating cash flow of $97.9 million. The increase in deferred revenue is due to growth in billings as we generally bill our customers in advance of subscription periods. This increase in deferred revenue of $97.9 million excludes the impact of foreign currency translation which reduced our total consolidated reported deferred revenue by $27.7 million for the year ended February 28, 2009.
Cash flows from investing
Cash provided by investing activities of $146.2 million for the year ended February 28, 2009 includes net proceeds from sales and maturities of investments in debt securities of $317.2 million and proceeds from the sale of investments in equity securities of $5.6 million. Partially offsetting these proceeds from the sale and maturity of investments were acquisitions of businesses and technologies which totaled $148.1 million, including our acquisition of Qumranet during the third quarter of fiscal 2009 for net cash of $101.3 million. The remaining $46.8 million of investment relates to businesses and technologies we acquired during the first and second quarters of fiscal 2009 to enhance our services capabilities in the middleware and security management markets. Investments in property and equipment, primarily related to process and information technology infrastructure enhancements, totaled $24.5 million for the year ended February 28, 2009. Investments in patents and externally developed technology totaled $3.9 million for the year ended February 28, 2009.
Cash flows from financing
Cash used in financing activities of $539.2 million for the year ended February 28, 2009 is comprised of $565.6 million used to repurchase and redeem our convertible debentures with an aggregate face amount of $570.0 million. Additionally, under our common stock repurchase program we repurchased 2,875,052 of our common stock at an average price of $14.70 per share using $42.3 million of cash. Purchases of treasury shares from employees to satisfy employee minimum tax withholding obligations related to restricted share awards vesting during the year ended February 28, 2009 totaled $2.7 million. Partially offsetting financing activities using cash were proceeds from excess tax benefits related to share-based employee compensation which totaled $51.1 million, proceeds from employees’ exercise of common stock options which totaled $18.4 million and proceeds from a structured stock repurchase transaction which totaled $2.0 million for the year ended February 28, 2009.
Convertible debentures
During the year ended February 28, 2009, we repurchased and redeemed all of our convertible debentures. As a result of the repurchase and redemption, there were no debentures or related accrued interest payable outstanding at February 28, 2009. Interest expense related to the debentures, including amortization of debt offering costs totaled $4.4 million and $5.9 million for the years ended February 28, 2009 and February 29, 2008, respectively.
Investments in debt and equity securities
Our investments are comprised primarily of debt securities that are classified as available for sale and recorded at their fair market values. At February 28, 2010 and February 28, 2009, the vast majority of our
57
Table of Contents
investments were priced by pricing vendors. These pricing vendors use the most recent observable market information in pricing these securities or, if specific prices are not available for these securities, use other observable inputs. In the event observable inputs are not available, we assess other factors to determine the securities’ market value, including broker quotes or model valuations. Independent price verifications of all of our holdings are performed by the pricing vendors, which we review. In the event a price fails a pre-established tolerance check, it is researched so that we can assess the cause of the variance to determine what we believe is the appropriate fair market value.
Capital requirements
We have experienced a substantial increase in our operating expenses since our inception in connection with the growth of our operations, the development of our enterprise technologies, the expansion of our services operations and our acquisition activity. Our capital requirements during the year ending February 28, 2011 will depend on numerous factors, including the amount of resources we devote to:
| · | funding the continued development of our enterprise technology offerings; |
| · | accelerating the development of our systems management services; |
| · | improving and extending our services and the technologies used to deliver these services to our customers and support our business; |
| · | pursuing strategic acquisitions and alliances; and |
| · | investing in businesses, products and technologies. |
We have utilized, and will continue from time to time to utilize, cash and investments to fund, among other potential uses, purchases of our common stock, purchases of fixed assets and mergers and acquisitions.
Given our historically strong operating cash flow and the $970.2 million of cash and investments held at February 28, 2010, we do not presently anticipate the need to raise cash to fund our operations, either through the sale of additional equity or through the issuance of debt, in the foreseeable future. However, we may take advantage of favorable capital market situations that may arise from time to time to raise additional capital.
We believe that cash flow from operations will continue to improve; however, there can be no assurances that we will improve our cash flow from operations from the current rate or that such cash flows will be adequate to fund other investments or acquisitions that we may choose to make. We may choose to accelerate the expansion of our business from our current plans, which may require us to raise additional funds through the sale of equity or debt securities or through other financing means. There can be no assurances that any such financing would occur in amounts or on terms favorable to us, if at all.
Off-balance sheet arrangements
As of February 28, 2010 and February 28, 2009, we have no off-balance sheet financing arrangements and do not utilize any “structured debt”, “special purpose” or similar unconsolidated entities for liquidity or financing purposes.
58
Table of Contents
Contractual obligations
The following table summarizes our principal contractual obligations at February 28, 2010 (in thousands):
| Total | Less than 1 Year |
1-3 Years | 3-5 Years | More than 5 Years | |||||||||||
| Operating lease obligations |
$ | 89,170 | $ | 21,874 | $ | 27,691 | $ | 17,719 | $ | 21,886 | |||||
| Purchase obligations |
— | — | — | — | — | ||||||||||
| Other debt obligations, including related interest |
1,575 | 1,000 | 575 | — | — | ||||||||||
| Total |
$ | 90,745 | $ | 22,874 | $ | 28,266 | $ | 17,719 | $ | 21,886 | |||||
Because we are unable to reasonably estimate the timing of settlements and any future payments related to uncertain tax positions, such liabilities are not included in the above table. However, as of February 28, 2010, we have recognized a total of $23.6 million related to such liabilities, which are included in other long-term obligations on our Consolidated Balance Sheets.
RECENT ACCOUNTING PRONOUNCEMENTS
In January 2010 the FASB issued amended guidance to improve disclosure requirements related to Fair Value Measurements and Disclosures-Overall Subtopic 820-10 of the FASB Accounting Standards Codification (“ASC 820-10”) originally issued as FASB Statement No. 157, Fair Value Measurements. The amended guidance requires companies to disclose separately the amounts of significant transfers in and out of Level 1 and Level 2 fair value measurements and describe the reasons for such transfers. These additional disclosure requirements are effective for reporting periods beginning March 1, 2010.
In June 2009, the FASB issued Statement No. 168, The FASB Accounting Standards Codification and the Hierarchy of Generally Accepted Accounting Principles, a replacement of FASB Statement No. 162 (“the Codification”). The Codification, which was launched on July 1, 2009, became the single source of authoritative non-governmental U.S. generally accepted accounting principles (“GAAP”), superseding various existing authoritative accounting pronouncements. The Codification is effective for financial statements issued for interim and annual periods ending after September 15, 2009. The adoption of the Codification had no significant impact on our consolidated financial statements.
59
Table of Contents
| ITEM 7A. | QUANTITATIVE AND QUALITATIVE DISCLOSURES ABOUT MARKET RISK |
We are exposed to the impact of interest rate changes, foreign currency exchange rate fluctuations and changes in the market value of our investments.
Interest Rate Risk
Our exposure to market rate risk for changes in interest rates relates primarily to our investment portfolio. The primary objective of our investment activities is to preserve principal and liquidity while at the same time maximizing yields without significantly increasing risk. To achieve this objective, we maintain our portfolio of cash equivalents and short-term and long-term investments in a variety of fixed-income securities, including both government and corporate obligations and money market funds. Investments in both fixed rate and floating rate interest earning instruments carry a degree of interest rate risk. Fixed rate securities may have their fair market value adversely impacted due to a rise in prevailing interest rates, while floating rate securities may produce less income than expected if interest rates fall. Due in part to these factors, our future investment income may fall short of expectations due to changes in interest rates, or we may suffer losses in principal if forced to sell securities which have declined in market value due to changes in interest rates or perceived credit risk related to the securities’ issuers. A hypothetical one percentage point change in interest rates would result in a $7.1 million change in interest income on an annual basis.
Investment Risk
The fair market value of our investment portfolio is subject to interest rate risk. Based on a sensitivity analysis performed on this investment portfolio, a hypothetical one percentage point increase in prevailing interest rates would result in an approximate $3.6 million decrease in the fair value of our available-for-sale investment securities as of February 28, 2010.
Credit Risk
The fair market values of our investment portfolio and cash balances are exposed to counterparty credit risk. Accordingly, while we periodically review our portfolio for risk mitigation, the principal values of our cash balances, money market accounts and investments in available-for-sale securities could suffer a loss of value.
Derivative Instruments
We transact business in various foreign countries and are, therefore, subject to risk of foreign currency exchange rate fluctuations. We sometimes enter into forward contracts to economically hedge transactional exposure associated with commitments arising from trade accounts receivable, trade accounts payable and fixed purchase obligations denominated in a currency other than the functional currency of the respective operating entity. All derivative instruments are recorded on the Consolidated Balance Sheets at their respective fair market values in accordance with FASB ASC Section 815 (formerly referenced as Statement of Financial Accounting Standards No. 133, Accounting for Derivative Instruments and Hedging Activities). The Company has elected not to prepare and maintain the documentation required to qualify as an accounting hedge and, therefore, changes in fair value are recorded in the Consolidated Statements of Operations.
The aggregate notional amount of outstanding forward contracts at February 28, 2010 was $8.4 million. The fair value of these outstanding contracts at February 28, 2010 was gross, a less than $0.1 million asset and a less than $0.1 million liability, and is recorded in prepaid expenses and other current assets and accrued expenses, respectively on the Consolidated Balance Sheets. The forward contracts generally expire within three months of the period ended February 28, 2010. The forward contracts will settle in Japanese yen, Swiss francs, Swedish krona, Czech koruna, Canadian dollars and Norwegian kroner.
60
Table of Contents
The aggregate notional amount of outstanding forward contracts at February 28, 2009 was $3.8 million. The fair value of these outstanding contracts at February 28, 2009 was gross, a $0.1 million liability and a less than $0.1 million asset, and is recorded in accrued expenses on the Consolidated Balance Sheets.
Foreign Currency Risk
Approximately 43.4% of our revenue for the year ended February 28, 2010 was produced by sales outside the United States. We are exposed to significant risks of foreign currency fluctuation primarily from receivables denominated in foreign currency and are subject to transaction gains and losses, which are recorded as a component in determining net income. The income statements of our non-U.S. operations are translated into U.S. dollars at the average exchange rates for each applicable month in a period. To the extent the U.S. dollar weakens against foreign currencies, the translation of these foreign currency statements results in increased revenue and operating expenses for our non-U.S. operations. Similarly, our revenue and operating expenses for our non-U.S. operations decreases if the U.S. dollar strengthens against foreign currencies.
Impact on results of operations for the year ended February 28, 2010:
Using the average foreign currency exchange rates from our fiscal year ended February 28, 2009, our revenue and operating expenses from non-U.S. operations for the year ended February 28, 2010, would have been higher than we reported using the exchange rates from our fiscal year ended February 28, 2009 by approximately $0.6 million and $3.4 million, respectively, which would have resulted in income from operations being $2.8 million lower. For further discussion, see NOTE 2 to the Consolidated Financial Statements.
61
Table of Contents
| ITEM 8. | FINANCIAL STATEMENTS AND SUPPLEMENTARY DATA |
INDEX TO CONSOLIDATED FINANCIAL STATEMENTS
| Page | ||
| Report of Management on Internal Control Over Financial Reporting |
63 | |
| 64 | ||
| Financial Statements: |
||
| Consolidated Balance Sheets at February 28, 2010 and February 28, 2009 |
65 | |
| 66 | ||
| 67 | ||
| 68 | ||
| 69 | ||
62
Table of Contents
REPORT OF MANAGEMENT ON INTERNAL CONTROL OVER FINANCIAL REPORTING
Our management is responsible for establishing and maintaining adequate internal control over financial reporting (as defined in Rules 13a-15(f) and 15d-15(f) under the Exchange Act). Internal control over financial reporting is a process designed to provide reasonable assurance regarding the reliability of financial reporting and the preparation of financial statements for external purposes in accordance with accounting principles generally accepted in the United States of America. The Company’s internal control over financial reporting includes those policies and procedures that: (i) pertain to the maintenance of records that, in reasonable detail, accurately and fairly reflect the transactions and dispositions of the assets of the Company; (ii) provide reasonable assurance that transactions are recorded as necessary to permit preparation of financial statements in accordance with accounting principles generally accepted in the United States of America, and that receipts and expenditures of the Company are being made only in accordance with authorizations of management and directors of the Company; and (iii) provide reasonable assurance regarding prevention or timely detection of unauthorized acquisition, use, or disposition of the Company’s assets that could have a material effect on the financial statements.
Our management conducted an evaluation of the effectiveness of our internal control over financial reporting as of the end of the period covered by this report based on the framework in Internal Control—Integrated Framework issued by the Committee of Sponsoring Organizations of the Treadway Commission. Based on this evaluation, management concluded that the Company’s internal control over financial reporting was effective as of the end of the period covered by this report.
Our independent registered public accounting firm, which has audited the financial statements included in Part II, Item 8 of this report, has also audited the effectiveness of the Company’s internal control over financial reporting as of February 28, 2010, as stated in their report, which is included below.
63
Table of Contents
REPORT OF INDEPENDENT REGISTERED PUBLIC ACCOUNTING FIRM
To the Board of Directors and Shareholders of Red Hat, Inc.:
In our opinion, the accompanying consolidated balance sheets and the related consolidated statements of operations, of stockholders’ equity and comprehensive income and of cash flows present fairly, in all material respects, the financial position of Red Hat, Inc. and its subsidiaries at February 28, 2010 and February 28, 2009, and the results of their operations and their cash flows for each of the three years in the period ended February 28, 2010 in conformity with accounting principles generally accepted in the United States of America. Also in our opinion, the Company maintained, in all material respects, effective internal control over financial reporting as of February 28, 2010, based on criteria established in Internal Control—Integrated Framework issued by the Committee of Sponsoring Organizations of the Treadway Commission (COSO). The Company’s management is responsible for these financial statements, for maintaining effective internal control over financial reporting and for its assessment of the effectiveness of internal control over financial reporting, included in Management’s Report on Internal Control over Financial Reporting appearing in Item 8. Our responsibility is to express opinions on these financial statements and on the Company’s internal control over financial reporting based on our integrated audits. We conducted our audits in accordance with the standards of the Public Company Accounting Oversight Board (United States). Those standards require that we plan and perform the audits to obtain reasonable assurance about whether the financial statements are free of material misstatement and whether effective internal control over financial reporting was maintained in all material respects. Our audits of the financial statements included examining, on a test basis, evidence supporting the amounts and disclosures in the financial statements, assessing the accounting principles used and significant estimates made by management, and evaluating the overall financial statement presentation. Our audit of internal control over financial reporting included obtaining an understanding of internal control over financial reporting, assessing the risk that a material weakness exists, and testing and evaluating the design and operating effectiveness of internal control based on the assessed risk. Our audits also included performing such other procedures as we considered necessary in the circumstances. We believe that our audits provide a reasonable basis for our opinions.
As discussed in Note 11 to the consolidated financial statements, the Company changed the manner in which it accounts for uncertain tax positions for the year ended February 29, 2008.
A company’s internal control over financial reporting is a process designed to provide reasonable assurance regarding the reliability of financial reporting and the preparation of financial statements for external purposes in accordance with generally accepted accounting principles. A company’s internal control over financial reporting includes those policies and procedures that (i) pertain to the maintenance of records that, in reasonable detail, accurately and fairly reflect the transactions and dispositions of the assets of the company; (ii) provide reasonable assurance that transactions are recorded as necessary to permit preparation of financial statements in accordance with generally accepted accounting principles, and that receipts and expenditures of the company are being made only in accordance with authorizations of management and directors of the company; and (iii) provide reasonable assurance regarding prevention or timely detection of unauthorized acquisition, use, or disposition of the company’s assets that could have a material effect on the financial statements.
Because of its inherent limitations, internal control over financial reporting may not prevent or detect misstatements. Also, projections of any evaluation of effectiveness to future periods are subject to the risk that controls may become inadequate because of changes in conditions, or that the degree of compliance with the policies or procedures may deteriorate.
| /s/ PricewaterhouseCoopers LLP |
| Raleigh, North Carolina |
| April 28, 2010 |
64
Table of Contents
CONSOLIDATED BALANCE SHEETS
(in thousands—except share and per share amounts)
| February 28, 2010 |
February 28, 2009 |
|||||||
| ASSETS | ||||||||
| Current assets: |
||||||||
| Cash and cash equivalents |
$ | 388,118 | $ | 515,548 | ||||
| Investments in debt and equity securities, short-term |
372,656 | 147,178 | ||||||
| Accounts receivable, net of allowances for doubtful accounts of $2,295 and $2,387, respectively |
139,436 | 128,669 | ||||||
| Prepaid expenses and other current assets |
102,909 | 99,437 | ||||||
| Total current assets |
1,003,119 | 890,832 | ||||||
| Property and equipment, net of accumulated depreciation and amortization of $116,971 and $91,140, respectively |
71,708 | 67,913 | ||||||
| Goodwill |
438,749 | 438,109 | ||||||
| Identifiable intangibles, net |
108,213 | 122,177 | ||||||
| Investments in debt securities, long-term |
209,411 | 183,363 | ||||||
| Other assets, net |
39,672 | 51,242 | ||||||
| Total assets |
$ | 1,870,872 | $ | 1,753,636 | ||||
| LIABILITIES AND STOCKHOLDERS’ EQUITY | ||||||||
| Current liabilities: |
||||||||
| Accounts payable |
$ | 16,483 | $ | 9,576 | ||||
| Accrued expenses |
68,334 | 54,123 | ||||||
| Deferred revenue |
480,572 | 382,050 | ||||||
| Other current obligations |
878 | 900 | ||||||
| Total current liabilities |
566,267 | 446,649 | ||||||
| Deferred lease credits |
4,184 | 4,470 | ||||||
| Long-term deferred revenue |
165,288 | 161,032 | ||||||
| Other long-term obligations |
24,081 | 35,432 | ||||||
| Commitments and contingencies ( NOTE 14) |
||||||||
| Stockholders’ equity: |
||||||||
| Preferred stock, 5,000,000 shares authorized, none outstanding |
— | — | ||||||
| Common stock, $0.0001 per share par value, 300,000,000 shares authorized, 215,161,306 and 207,794,700 shares issued, 187,351,195 and 189,998,611 shares outstanding at February 28, 2010 and February 28, 2009, respectively |
22 | 21 | ||||||
| Additional paid-in capital |
1,444,848 | 1,281,469 | ||||||
| Retained earnings |
137,772 | 50,519 | ||||||
| Treasury stock at cost, 27,810,111 and 17,796,089 shares at February 28, 2010 and February 28, 2009, respectively |
(472,646 | ) | (236,283 | ) | ||||
| Accumulated other comprehensive income |
1,056 | 10,327 | ||||||
| Total stockholders’ equity |
1,111,052 | 1,106,053 | ||||||
| Total liabilities and stockholders’ equity |
$ | 1,870,872 | $ | 1,753,636 | ||||
The accompanying notes are an integral part of these consolidated financial statements.
65
Table of Contents
CONSOLIDATED STATEMENTS OF OPERATIONS
(in thousands—except per share amounts)
| Year Ended | ||||||||||||
| February 28, 2010 |
February 28, 2009 |
February 29, 2008 |
||||||||||
| Revenue: |
||||||||||||
| Subscriptions |
$ | 638,654 | $ | 541,210 | $ | 449,811 | ||||||
| Training and services |
109,582 | 111,362 | 73,205 | |||||||||
| Total subscription and training and services revenue |
748,236 | 652,572 | 523,016 | |||||||||
| Cost of subscription and training and services revenue: |
||||||||||||
| Cost of subscriptions |
43,426 | 37,267 | 33,581 | |||||||||
| Cost of training and services |
70,419 | 68,859 | 47,072 | |||||||||
| Total cost of subscription and training and services revenue |
113,845 | 106,126 | 80,653 | |||||||||
| Gross profit |
634,391 | 546,446 | 442,363 | |||||||||
| Operating expense: |
||||||||||||
| Sales and marketing |
272,705 | 238,552 | 192,049 | |||||||||
| Research and development |
148,360 | 130,177 | 97,417 | |||||||||
| General and administrative |
104,227 | 95,196 | 82,525 | |||||||||
| Litigation settlement |
8,750 | — | — | |||||||||
| Total operating expense |
534,042 | 463,925 | 371,991 | |||||||||
| Income from operations |
100,349 | 82,521 | 70,372 | |||||||||
| Interest income |
10,381 | 36,473 | 58,541 | |||||||||
| Other income, net |
10,936 | 7,336 | 1,879 | |||||||||
| Interest expense |
(164 | ) | (4,798 | ) | (6,252 | ) | ||||||
| Income before provision for income taxes |
121,502 | 121,532 | 124,540 | |||||||||
| Provision for income taxes |
34,249 | 42,811 | 47,873 | |||||||||
| Net income |
$ | 87,253 | $ | 78,721 | $ | 76,667 | ||||||
| Basic net income per common share |
$ | 0.46 | $ | 0.41 | $ | 0.40 | ||||||
| Diluted net income per common share |
$ | 0.45 | $ | 0.39 | $ | 0.36 | ||||||
| Weighted average shares outstanding |
||||||||||||
| Basic |
187,845 | 190,772 | 193,485 | |||||||||
| Diluted |
193,546 | 211,344 | 221,313 | |||||||||
The accompanying notes are an integral part of these consolidated financial statements.
66
Table of Contents
CONSOLIDATED STATEMENTS OF STOCKHOLDERS’ EQUITY AND COMPREHENSIVE INCOME
(in thousands)
| Preferred Stock | Common Stock | Additional Paid-In Capital |
Retained Earnings (Accumulated Deficit) |
Treasury Stock |
Accumulated Other Comprehensive Income (Loss) |
Total Stockholders’ Equity |
|||||||||||||||||||||||
| Shares | Amount | Shares | Amount | ||||||||||||||||||||||||||
| Balance at February 28, 2007 |
— | — | 204,017 | $ | 20 | $ | 1,040,892 | $ | (92,092 | ) | $ | (125,789 | ) | $ | (1,795 | ) | $ | 821,236 | |||||||||||
| Net income |
— | — | — | — | — | 76,667 | — | — | 76,667 | ||||||||||||||||||||
| Other comprehensive income: |
|||||||||||||||||||||||||||||
| Unrealized gain on investments in marketable securities, net of tax |
— | — | — | — | — | — | — | 7,337 | — | ||||||||||||||||||||
| Foreign currency translation adjustment, net of tax |
— | — | — | — | — | — | — | (3,552 | ) | — | |||||||||||||||||||
| Other comprehensive income |
— | — | — | — | — | — | — | 3,785 | 3,785 | ||||||||||||||||||||
| Comprehensive income |
— | — | — | — | — | — | — | — | 80,452 | ||||||||||||||||||||
| Exercise of common stock options |
— | — | 1,715 | 1 | 15,512 | — | — | — | 15,513 | ||||||||||||||||||||
| Common stock repurchase |
— | — | — | — | — | — | (67,157 | ) | — | (67,157 | ) | ||||||||||||||||||
| Share-based compensation expense |
— | — | — | — | 36,456 | — | — | — | 36,456 | ||||||||||||||||||||
| Tax benefits related to share-based awards |
— | — | — | — | 77,468 | — | — | — | 77,468 | ||||||||||||||||||||
| Adoption of ASC 740 subtopic 10, section 05-06 (formerly FIN 48) |
— | — | — | — | — | (12,777 | ) | — | — | (12,777 | ) | ||||||||||||||||||
| Balance at February 29, 2008 |
— | — | 205,732 | $ | 21 | $ | 1,170,328 | $ | (28,202 | ) | $ | (192,946 | ) | $ | 1,990 | $ | 951,191 | ||||||||||||
| Net income |
— | — | — | — | — | 78,721 | — | — | 78,721 | ||||||||||||||||||||
| Other comprehensive income: |
|||||||||||||||||||||||||||||
| Unrealized loss on investments in marketable securities, net of tax |
— | — | — | — | — | — | — | (272 | ) | — | |||||||||||||||||||
| Foreign currency translation adjustment, net of tax |
— | — | — | — | — | — | — | 8,609 | — | ||||||||||||||||||||
| Other comprehensive income |
— | — | — | — | — | — | — | 8,337 | 8,337 | ||||||||||||||||||||
| Comprehensive income |
— | — | — | — | — | — | — | — | 87,058 | ||||||||||||||||||||
| Exercise of common stock options |
— | — | 2,063 | — | 18,355 | — | — | — | 18,355 | ||||||||||||||||||||
| Common stock repurchase |
— | — | — | — | — | — | (42,318 | ) | — | (42,318 | ) | ||||||||||||||||||
| Structured stock repurchase |
— | — | — | — | 1,989 | — | — | — | 1,989 | ||||||||||||||||||||
| Share-based compensation expense |
— | — | — | — | 48,315 | — | — | — | 48,315 | ||||||||||||||||||||
| Tax benefits related to share-based awards |
— | — | — | — | 44,161 | — | — | — | 44,161 | ||||||||||||||||||||
| Minimum tax withholdings paid by the Company on behalf of employees related to net settlement of employee share-based awards |
— | — | — | — | (1,679 | ) | — | (1,019 | ) | — | (2,698 | ) | |||||||||||||||||
| Balance at February 28, 2009 |
— | — | 207,795 | $ | 21 | $ | 1,281,469 | $ | 50,519 | $ | (236,283 | ) | $ | 10,327 | $ | 1,106,053 | |||||||||||||
| Net income |
— | — | — | — | — | 87,253 | — | — | 87,253 | ||||||||||||||||||||
| Other comprehensive income: |
|||||||||||||||||||||||||||||
| Unrealized loss on investments in marketable securities, net of tax |
— | — | — | — | — | — | — | (988 | ) | — | |||||||||||||||||||
| Foreign currency translation adjustment, net of tax |
— | — | — | — | — | — | — | (8,283 | ) | — | |||||||||||||||||||
| Other comprehensive income |
— | — | — | — | — | — | — | (9,271 | ) | (9,271 | ) | ||||||||||||||||||
| Comprehensive income |
— | — | — | — | — | — | — | — | 77,982 | ||||||||||||||||||||
| Exercise of common stock options |
— | — | 7,366 | 1 | 103,332 | — | — | — | 103,333 | ||||||||||||||||||||
| Common stock repurchase |
— | — | — | — | — | — | (236,363 | ) | — | (236,363 | ) | ||||||||||||||||||
| Share-based compensation expense |
— | — | — | — | 48,288 | — | — | — | 48,288 | ||||||||||||||||||||
| Tax benefits related to share-based awards |
— | — | — | — | 23,614 | — | — | — | 23,614 | ||||||||||||||||||||
| Minimum tax withholdings paid by the Company on behalf of employees related to net settlement of employee share-based awards |
— | — | — | — | (11,855 | ) | — | — | — | (11,855 | ) | ||||||||||||||||||
| Balance at February 28, 2010 |
— | — | 215,161 | $ | 22 | $ | 1,444,848 | $ | 137,772 | $ | (472,646 | ) | $ | 1,056 | $ | 1,111,052 | |||||||||||||
The accompanying notes are an integral part of these consolidated financial statements.
67
Table of Contents
CONSOLIDATED STATEMENTS OF CASH FLOWS
(in thousands)
| Year Ended | ||||||||||||
| February 28, 2010 |
February 28, 2009 |
February 29, 2008 |
||||||||||
| Cash flows from operating activities: |
||||||||||||
| Net income |
$ | 87,253 | $ | 78,721 | $ | 76,667 | ||||||
| Adjustments to reconcile net income to net cash provided by operating activities: |
||||||||||||
| Depreciation and amortization |
45,861 | 40,309 | 33,002 | |||||||||
| Deferred income taxes |
20,636 | 38,979 | 41,211 | |||||||||
| Excess tax benefits from share-based payment arrangements |
(35,569 | ) | (51,137 | ) | (61,247 | ) | ||||||
| Share-based compensation expense |
48,288 | 48,315 | 36,457 | |||||||||
| Gain from repurchase of convertible debentures |
— | (4,129 | ) | — | ||||||||
| Amortization of debt issuance costs |
— | 2,319 | 3,010 | |||||||||
| Net gain on sale of investments |
(12,656 | ) | (3,848 | ) | (4,799 | ) | ||||||
| Other |
1,248 | 1,094 | 1,092 | |||||||||
| Changes in operating assets and liabilities net of effects of acquisitions: |
||||||||||||
| Accounts receivable |
(7,290 | ) | (2,341 | ) | (33,741 | ) | ||||||
| Prepaid expenses and other current assets |
3,147 | (18,968 | ) | (7,761 | ) | |||||||
| Accounts payable |
6,569 | (7,275 | ) | 4,713 | ||||||||
| Accrued expenses |
15,423 | 17,056 | 1,600 | |||||||||
| Deferred revenue |
82,625 | 97,861 | 113,138 | |||||||||
| Other assets, net |
(286 | ) | (517 | ) | (266 | ) | ||||||
| Net cash provided by operating activities |
255,249 | 236,439 | 203,076 | |||||||||
| Cash flows from investing activities: |
||||||||||||
| Purchase of investment in debt securities available-for-sale |
(666,890 | ) | (396,810 | ) | (1,173,012 | ) | ||||||
| Proceeds from sales and maturities of investment in debt securities available-for-sale |
412,514 | 714,015 | 1,155,854 | |||||||||
| Acquisitions of businesses, net of cash acquired |
— | (148,140 | ) | (11,784 | ) | |||||||
| Proceeds from sales of investment in equity securities available for sale |
13,053 | 5,568 | 6,199 | |||||||||
| Purchase of strategic equity investments |
(1,768 | ) | — | — | ||||||||
| Purchase of developed software and other intangible assets |
(4,692 | ) | (3,932 | ) | (5,616 | ) | ||||||
| Purchase of property and equipment |
(28,420 | ) | (24,485 | ) | (41,797 | ) | ||||||
| Net cash provided by (used in) investing activities |
(276,203 | ) | 146,216 | (70,156 | ) | |||||||
| Cash flows from financing activities: |
||||||||||||
| Excess tax benefits from share-based payment arrangements |
35,569 | 51,137 | 61,247 | |||||||||
| Redemption and repurchase of convertible debentures |
— | (565,558 | ) | — | ||||||||
| Proceeds from exercise of common stock options |
103,332 | 18,355 | 15,512 | |||||||||
| Purchase of treasury stock |
(236,393 | ) | (42,319 | ) | (67,157 | ) | ||||||
| Structured stock repurchase |
— | 1,989 | — | |||||||||
| Proceeds from other borrowings |
— | — | 2,898 | |||||||||
| Payments on other borrowings |
(900 | ) | (69 | ) | (756 | ) | ||||||
| Payments related to settlement of employee shared-based awards |
(11,855 | ) | (2,698 | ) | — | |||||||
| Net cash provided by (used in) financing activities |
(110,247 | ) | (539,163 | ) | 11,744 | |||||||
| Effect of foreign currency exchange rates on cash and cash equivalents |
3,771 | (5,664 | ) | 5,817 | ||||||||
| Net increase (decrease) in cash and cash equivalents |
(127,430 | ) | (162,172 | ) | 150,481 | |||||||
| Cash and cash equivalents at beginning of year |
515,548 | 677,720 | 527,239 | |||||||||
| Cash and cash equivalents at end of year |
$ | 388,118 | $ | 515,548 | $ | 677,720 | ||||||
| Supplemental cash flow information: |
||||||||||||
| Cash paid during the year for: |
||||||||||||
| Interest |
$ | 129 | $ | 2,475 | $ | 2,850 | ||||||
| Income taxes |
$ | 5,730 | $ | 4,950 | $ | 6,895 | ||||||
The accompanying notes are an integral part of these consolidated financial statements.
68
Table of Contents
NOTES TO CONSOLIDATED FINANCIAL STATEMENTS
NOTE 1—Company
Red Hat, Inc., incorporated in Delaware, together with its subsidiaries (“Red Hat” or the “Company”) is a global leader in providing open source software solutions to the enterprise. The Company is also the market leader in providing enterprise-ready open source operating system platforms. The Company applies its technology leadership to create its: enterprise operating platform, Red Hat Enterprise Linux; enterprise middleware platform, JBoss Enterprise Middleware; virtualization solutions and other infrastructure technology solutions, based on open source technology. The Company’s enterprise solutions are intended to meet the functionality requirements and performance demands of the enterprise and third-party computer hardware and software applications that are critical to the enterprise. The Company provides these solutions through integrated management services, Red Hat Network, RHN Satellite, JBoss Operations Network and JBoss Customer Support Portal, which allow various Red Hat enterprise technologies to be updated and configured and the performance of these and other technologies to be monitored in an automated fashion. These solutions reflect the Company’s continuing commitment to provide an enterprise-wide infrastructure platform and developer solutions based on open source technology. The Company derives its revenue and generates its cash from customers primarily from two sources: (i) subscriptions for its enterprise technologies and (ii) training and services revenue, as further described below in NOTE 2, Summary of Significant Accounting Policies.
NOTE 2—Summary of Significant Accounting Policies
Principles of Consolidation
The accompanying Consolidated Financial Statements include the accounts of the Company and all of its wholly-owned subsidiaries. All significant inter-company accounts and transactions are eliminated in consolidation. There are no significant foreign exchange restrictions on the Company’s foreign subsidiaries.
Use of Estimates
The preparation of financial statements in conformity with accounting principles generally accepted in the United States of America requires management to make estimates and assumptions that affect the reported amounts of assets and liabilities and disclosure of contingent assets and liabilities at the balance sheet dates and the reported amounts of revenue and expenses during the reporting periods. Actual results could differ from such estimates.
Revenue Recognition
The Company establishes persuasive evidence of a sales arrangement for each type of revenue transaction based on either a signed contract with the end customer, a click-through contract on the Company’s website whereby the customer agrees to the Company’s standard subscription terms, signed or click-through distribution contracts with original equipment manufacturers (“OEMs”) and other resellers, or, in the case of individual training seats, through receipt of payment which indicates acceptance of the Company’s training agreement terms.
Subscription Revenue
Subscription revenue is comprised of direct and indirect sales of Red Hat enterprise technologies. Accounts receivable and deferred revenue are recorded at the time a customer enters into a binding subscription agreement for the purchase of a subscription, subscription services are made available to the customer and the customer is billed. The deferred revenue amount is recognized as revenue ratably over the life of the subscription. Red Hat
69
Table of Contents
RED HAT, INC.
NOTES TO CONSOLIDATED FINANCIAL STATEMENTS—(Continued)
enterprise technologies are generally offered with either one or three-year base subscription periods; the majority of the Company’s subscriptions have one-year terms. Under these subscription agreements, renewal rates are generally specified for one or three-year renewal terms. The base subscription generally entitles the end user to the technology itself and post-contract customer support (“PCS”) generally consisting of a specified level of customer support and security errata, bug fixes, functionality enhancements to the technology and upgrades to new versions of the technologies, each on a when-and-if available basis, during the term of the subscription. The Company sells its offerings through two principal channels: (1) direct, which includes sales by the Company’s sales-force as well as web store sales, and (2) indirect, which includes distributors, resellers and OEMs. The Company recognizes revenue from the sale of Red Hat enterprise technologies ratably over the period of the subscription beginning on the commencement date of the subscription agreement.
Subscription arrangements with large enterprise customers often have contracts with multiple elements (e.g., software technology, maintenance, training, consulting and other services). The Company allocates revenue to each element of the arrangement based on vendor-specific objective evidence of each element’s fair value when the Company can demonstrate sufficient evidence of the fair value of at least those elements that are undelivered. The fair value of each element in multiple element arrangements is treated by either (i) providing the customer with the ability during the term of the arrangement to renew that element at the same rate paid for the element included in the initial term of the agreement or (ii) selling the services on a stand-alone basis.
Training and Services Revenue
Training and services revenue is comprised of revenue for consulting, engineering and customer training and education services. Consulting services consist of time-based arrangements, and revenue is recognized as these services are performed. Engineering services represent revenue earned under fixed fee arrangements with the Company’s OEM partners and other customers to provide for significant modification and customization of the Company’s Red Hat enterprise technologies. The Company recognizes revenue for these fixed fee engineering services using the percentage of completion basis of accounting, provided the Company has the ability to make reliable estimates of progress towards completion, the fee for such services is fixed or determinable and collection of the resulting receivable is probable. Under the percentage of completion method, earnings under the contract are recognized based on the progress toward completion as estimated using the ratio of labor hours incurred to total expected project hours. Changes in estimates are recognized in the period in which they are known. Revenue for customer training and education services is recognized on the dates the services are complete.
Deferred Commissions
Deferred commissions are the incremental costs that are directly associated with non-cancelable subscription contracts with customers and consist of sales commissions paid to the Company’s sales force. The commissions are deferred and amortized over a period that approximates the period of the subscription term. The commission payments are paid in full subsequent to the month in which the customer’s service commences. The deferred commission amounts are recoverable through the future revenue streams under the non-cancelable customer contracts. In addition, the Company has the ability and intent under the commission plans with its sales force to recover commissions previously paid to its sales force in the event that customers breach the terms of their subscription agreements and do not fully pay for their subscription agreements. Amortization of deferred commissions is included in sales and marketing expense in the accompanying Consolidated Statements of Operations. Deferred commissions are included in prepaid expenses and other current assets on the accompanying Consolidated Balance Sheets.
70
Table of Contents
RED HAT, INC.
NOTES TO CONSOLIDATED FINANCIAL STATEMENTS—(Continued)
Impairment of Goodwill and Other Long-Lived Assets
The Company tests goodwill for impairment annually and whenever events or circumstances indicate an impairment may have occurred. Accounting principles generally accepted in the U.S. require goodwill be tested at least annually using a two-step process that begins with identifying potential impairment. Potential impairment is identified if the fair value of the reporting unit to which goodwill applies is less than the recognized or book value of the related reporting entity, including such goodwill. Where the book value of a reporting entity, including related goodwill, is greater than the reporting entity’s fair value, the second step of the goodwill impairment test is performed to measure the amount of impairment loss, if any. For the years ended February 28, 2010, February 28, 2009 and February 29, 2008, the Company did not identify any potential impairment related to its goodwill.
The Company evaluates the recoverability of its property and equipment and other long-lived assets whenever events or changes in circumstances indicate an impairment may have occurred. An impairment loss is recognized when the net book value of such assets exceeds the estimated future undiscounted cash flows attributable to the assets or the business to which the assets relate. Impairment losses, if any, are measured as the amount by which the carrying value exceeds the fair value of the assets. For the years ended February 28, 2010, February 28, 2009 and February 29, 2008, no significant impairment losses related to the Company’s long-lived assets were identified.
Cash and Cash Equivalents
The Company considers liquid investments purchased with a maturity period of three months or less at the date of purchase to be cash equivalents.
Accounts Receivable and Allowance for Doubtful Accounts
Trade accounts receivable are recorded at the invoiced amount and do not bear interest. The allowance for doubtful accounts is the Company’s estimate of the amount of probable credit losses in the Company’s existing accounts receivable. The Company determines the allowance based on historical write-off experience. The Company reviews its allowance for doubtful accounts monthly. Past due balances over 90 days and over a specified amount are reviewed individually for collectability. All other balances are reviewed on a pooled basis by type of receivable. Account balances are charged off against the allowance when the Company determines it is probable the receivable will not be recovered. The Company does not have off-balance-sheet credit exposure related to its customers.
Fair Value Measurements
Fair value is defined as the exchange price that would be received for an asset or paid to transfer a liability (an exit price) in the principal or most advantageous market for such asset or liability in an orderly transaction between market participants on the measurement date. Valuation techniques used to measure fair value should maximize the use of observable inputs and minimize the use of unobservable inputs. To measure fair value, the Company uses the following fair value hierarchy based on three levels of inputs, of which the first two are considered observable and the last unobservable:
Level 1—Quoted prices in active markets for identical assets or liabilities.
Level 2—Inputs other than Level 1 that are observable, either directly or indirectly, such as quoted prices for similar assets or liabilities; quoted prices in markets that are not active; or other inputs that are observable or can be corroborated by observable market data for substantially the full term of the assets or liabilities.
71
Table of Contents
RED HAT, INC.
NOTES TO CONSOLIDATED FINANCIAL STATEMENTS—(Continued)
Level 3—Unobservable inputs that are supported by little or no market activity and are significant to the fair value of the assets or liabilities.
The Company’s investments are comprised primarily of debt securities that are classified as available for sale and recorded at their fair market values. Liquid investments with effective original maturities of 90 days or less from the balance sheet date are classified as cash equivalents. Investments with remaining effective maturities of twelve months or less from the balance sheet date are classified as short-term investments. Investments with remaining effective maturities of more than twelve months from the balance sheet date are classified as long-term investments. The Company’s Level 1 financial instruments are valued using quoted prices in active markets for identical instruments. The Company’s Level 2 financial instruments, including derivative instruments, are valued using quoted prices for identical instruments in less active markets or using other observable market inputs for comparable instruments.
Unrealized gains and temporary losses on investments classified as available for sale are included within accumulated other comprehensive income, net of any related tax effect. Upon realization, such amounts are reclassified from accumulated other comprehensive income to investment income. Realized gains and losses and other than temporary impairments, if any, are reflected in the statements of operations as other income, net. The Company does not recognize changes in the fair value of its investments in income unless a decline in value is considered other-than-temporary. At February 28, 2010 and February 28, 2009, the vast majority of the Company’s investments were priced by pricing vendors. These pricing vendors use the most recent observable market information in pricing these securities or, if specific prices are not available for these securities, use other observable inputs. In the event observable inputs are not available, the Company assesses other factors to determine the security’s market value, including broker quotes or model valuations. Independent price verifications of all holdings are performed by pricing vendors which are then reviewed by the Company. In the event a price fails a pre-established tolerance check, it is researched so that the Company can assess the cause of the variance to determine what the Company believes is the appropriate fair market value.
The Company minimizes its credit risk associated with investments by investing primarily in investment grade, liquid securities. The Company’s policy is designed to limit exposures to any one issuer depending on credit quality. Periodic evaluations of the relative credit standing of those issuers are considered in the Company’s investment strategy.
72
Table of Contents
RED HAT, INC.
NOTES TO CONSOLIDATED FINANCIAL STATEMENTS—(Continued)
Assets and Liabilities Measured at Fair Value on a Recurring Basis
The following table summarizes the composition and fair value hierarchy of the Company’s financial assets and liabilities at February 28, 2010 (in thousands):
| As of February 28, 2010 |
Quoted Prices In Active Markets for Identical Assets (Level 1) |
Significant Other Observable Inputs (Level 2) |
Significant Unobservable Inputs (Level 3) | |||||||||||
| Assets: |
||||||||||||||
| Money markets (1) |
$ | 216,624 | $ | 216,624 | $ | — | $ | — | ||||||
| Available-for-sale securities (1): |
||||||||||||||
| Treasuries |
9,294 | 9,294 | — | — | ||||||||||
| Certificates of deposit |
133,810 | — | 133,810 | — | ||||||||||
| Commercial paper |
21,367 | — | 21,367 | — | ||||||||||
| Agencies |
349,338 | — | 349,338 | — | ||||||||||
| Municipal bonds |
11,754 | — | 11,754 | — | ||||||||||
| Corporates |
160,915 | — | 160,915 | — | ||||||||||
| Equities (1) |
4,687 | 4,687 | — | — | ||||||||||
| Foreign currency derivatives (2) |
77 | — | 77 | — | ||||||||||
| Liabilities: |
||||||||||||||
| Foreign currency derivatives (3) |
(4 | ) | — | (4 | ) | — | ||||||||
| Total |
$ | 907,862 | $ | 230,605 | $ | 677,257 | $ | — | ||||||
| (1) | Included in either cash and cash equivalents or investments in debt and equity securities in the Company’s Consolidated Balance Sheet at February 28, 2010, in addition to $62.4 million of cash. |
| (2) | Included in prepaid expenses and other current assets in the Company’s Consolidated Balance Sheet at February 28, 2010. |
| (3) | Included in accrued expenses in the Company’s Consolidated Balance Sheet at February 28, 2010. |
The following table summarizes the composition and fair value hierarchy of the Company’s financial assets and liabilities at February 28, 2009 (in thousands):
| As of February 28, 2009 |
Quoted Prices In Active Markets for Identical Assets (Level 1) |
Significant Other Observable Inputs (Level 2) |
Significant Unobservable Inputs (Level 3) | |||||||||||
| Assets: |
||||||||||||||
| Money markets (1) |
$ | 417,632 | $ | 417,632 | $ | — | $ | — | ||||||
| Available-for-sale securities (1): |
||||||||||||||
| Treasuries |
17,163 | 17,163 | — | — | ||||||||||
| Certificates of deposit |
27,133 | — | 27,133 | — | ||||||||||
| Agencies |
183,636 | — | 183,636 | — | ||||||||||
| Corporates |
122,899 | — | 122,899 | — | ||||||||||
| Equities (1) |
6,022 | 6,022 | — | — | ||||||||||
| Foreign currency derivatives (2) |
30 | — | 30 | — | ||||||||||
| Liabilities: |
||||||||||||||
| Foreign currency derivatives (3) |
(64 | ) | — | (64 | ) | — | ||||||||
| Total |
$ | 774,451 | $ | 440,817 | $ | 333,634 | $ | — | ||||||
73
Table of Contents
RED HAT, INC.
NOTES TO CONSOLIDATED FINANCIAL STATEMENTS—(Continued)
| (1) | Included in either cash and cash equivalents or investments in debt and equity securities in the Company’s Consolidated Balance Sheet at February 28, 2009, in addition to $71.6 million of cash. |
| (2) | Included in prepaid expenses and other current assets in the Company’s Consolidated Balance Sheet at February 28, 2009. |
| (3) | Included in accrued expenses in the Company’s Consolidated Balance Sheet at February 28, 2009. |
The following table represents the Company’s investments measured at fair value as of February 28, 2010 (in thousands):
| Balance Sheet Classification | ||||||||||||||||||||||
| Amortized Cost |
Gross Unrealized | Aggregate Fair Value |
Cash Equivalent Marketable Securities |
Short-term Marketable Securities |
Long-term Marketable Securities | |||||||||||||||||
| Gains | Losses(1) | |||||||||||||||||||||
| Money Markets |
$ | 216,624 | $ | — | $ | — | $ | 216,624 | $ | 216,624 | $ | — | $ | — | ||||||||
| Treasury |
9,253 | 41 | — | 9,294 | — | 9,294 | — | |||||||||||||||
| Certificates of deposit |
133,810 | — | — | 133,810 | 108,060 | 25,750 | — | |||||||||||||||
| Commercial paper |
21,367 | — | — | 21,367 | — | 21,367 | — | |||||||||||||||
| Agencies |
348,940 | 452 | (54 | ) | 349,338 | — | 196,524 | 152,814 | ||||||||||||||
| Municipal bonds |
11,739 | 15 | — | 11,754 | — | 11,754 | — | |||||||||||||||
| Corporates |
159,596 | 1,399 | (80 | ) | 160,915 | 1,038 | 103,280 | 56,597 | ||||||||||||||
| Equities |
278 | 4,409 | — | 4,687 | — | 4,687 | — | |||||||||||||||
| Total |
$ | 901,607 | $ | 6,316 | $ | (134 | ) | $ | 907,789 | $ | 325,722 | $ | 372,656 | $ | 209,411 | |||||||
| (1) | Accumulated unrealized losses related to investments that have been in a continuous unrealized loss position for 12 months or longer totaled less than $0.1 million at February 28, 2010. |
The following table represents the Company’s investments measured at fair value as of February 28, 2009 (in thousands):
| Balance Sheet Classification | ||||||||||||||||||||||
| Amortized Cost |
Gross Unrealized | Aggregate Fair Value |
Cash Equivalent Marketable Securities |
Short-term Marketable Securities |
Long-term Marketable Securities | |||||||||||||||||
| Gains | Losses(1) | |||||||||||||||||||||
| Money Markets |
$ | 417,632 | $ | — | $ | — | $ | 417,632 | $ | 417,632 | $ | — | $ | — | ||||||||
| Treasury |
16,873 | 290 | — | 17,163 | — | 15,316 | 1,847 | |||||||||||||||
| Certificates of deposit |
27,133 | — | — | 27,133 | 26,312 | 821 | — | |||||||||||||||
| Commercial paper |
— | — | — | — | — | — | — | |||||||||||||||
| Agencies |
182,683 | 989 | (36 | ) | 183,636 | — | 70,364 | 113,272 | ||||||||||||||
| Corporates |
123,874 | 784 | (1,759 | ) | 122,899 | — | 54,655 | 68,244 | ||||||||||||||
| Equities |
1,307 | 4,715 | — | 6,022 | — | 6,022 | — | |||||||||||||||
| Total |
$ | 769,502 | $ | 6,778 | $ | (1,795 | ) | $ | 774,485 | $ | 443,944 | $ | 147,178 | $ | 183,363 | |||||||
| (1) | Accumulated unrealized losses related to investments that have been in a continuous unrealized loss position for 12 months or longer totaled $0.3 million at February 28, 2009. |
74
Table of Contents
RED HAT, INC.
NOTES TO CONSOLIDATED FINANCIAL STATEMENTS—(Continued)
The following table summarizes the stated maturities of the Company’s investments at February 28, 2010 (in thousands):
| Total | Less than 1 Year |
2-3 Years | 4-5 Years | More than 5 Years | |||||||||||
| Maturity of Short and Long Term Investments |
$ | 577,380 | $ | 368,007 | $ | 206,870 | $ | 2,503 | $ | — | |||||
Internal Use Software
The Company capitalized $8.3 million, $9.9 million and $12.7 million in costs related to the development of internal use software for its website, enterprise resource planning system and systems management applications during years ended February 28, 2010, February 28, 2009 and February 29, 2008, respectively. The Company amortizes the costs of computer software developed for internal use on a straight-line basis over an estimated useful life of five years. The carrying value of internal use software is included in property and equipment on the Company’s Consolidated Balance Sheets.
Capitalized Software Costs
Capitalization of software development costs for products to be sold to third parties begins upon the establishment of technological feasibility and ceases when the product is available for general release. The establishment of technological feasibility and the ongoing assessment of recoverability of capitalized software development costs require considerable judgment by management concerning certain external factors including, but not limited to, technological feasibility, anticipated future gross revenue, estimated economic life and changes in software and hardware technologies. As a result of the Company’s practice of releasing source code that it has developed on a weekly basis for unrestricted download on the Internet, there is generally no passage of time between achievement of technological feasibility and the availability of the Company’s product for general release. Therefore, at February 28, 2010 and February 28, 2009, the Company had no internally developed capitalized software costs for products to be sold to third parties.
Property and Equipment
Property and equipment is primarily comprised of furniture, computer equipment, computer software and leasehold improvements which are recorded at cost and depreciated or amortized using the straight-line method over their estimated useful lives as follows: furniture and fixtures, seven years; computer equipment, three to four years; computer software, five years; leasehold improvements, over the lesser of the estimated remaining useful life of the asset or the remaining term of the lease. Expenditures for maintenance and repairs are charged to operations as incurred; major expenditures for renewals and betterments are capitalized and depreciated. Property and equipment acquired under capital leases are depreciated over the lesser of the estimated remaining useful life of the asset or the remaining term of the lease.
Share-Based Compensation
The Company measures share-based compensation cost at grant date, based on the estimated fair value of the award and recognizes the cost over the employee requisite service period typically on a straight-line basis, net of estimated forfeitures. The Company estimates the fair value of stock options using the Black-Scholes-Merton valuation model.
75
Table of Contents
RED HAT, INC.
NOTES TO CONSOLIDATED FINANCIAL STATEMENTS—(Continued)
The following summarizes share-based compensation expense recognized in the Company’s Consolidated Financial Statements for the years ended February 28, 2010, February 28, 2009 and February 29, 2008 (in thousands):
| Year Ended February 28, 2010 |
Year Ended February 28, 2009 |
Year Ended February 29, 2008 | |||||||
| Cost of revenue |
$ | 3,630 | $ | 3,065 | $ | 2,393 | |||
| Sales and marketing |
14,041 | 13,826 | 10,193 | ||||||
| Research and development |
13,614 | 14,027 | 8,717 | ||||||
| General and administrative |
17,003 | 17,397 | 15,154 | ||||||
| Total share-based compensation expense |
$ | 48,288 | $ | 48,315 | $ | 36,457 | |||
Share-based compensation expense qualifying for capitalization was insignificant for each of the Company’s fiscal years ended February 28, 2010, February 28, 2009 and February 29, 2008. Accordingly, no share-based compensation expense was capitalized during these years.
Estimated annual forfeitures—An estimated forfeiture rate of 15% per annum, which approximates the Company’s historical rate, was applied to options and nonvested share units. Awards are adjusted to actual forfeiture rates at vesting. The Company reassesses its estimated forfeiture rate annually or when new information, including actual forfeitures, indicate a change is appropriate.
The Company’s share-based compensation is described further in NOTE 13 to the Consolidated Financial Statements.
Sales and Marketing Expenses
Sales and marketing expenses consist of costs, including salaries, sales commissions and related expenses, such as travel, of all personnel involved in the sales and marketing process. Sales and marketing expenses also include costs of advertising, sales lead generation programs, cooperative marketing arrangements and trade shows. Payments made to resellers or other customers are reported in accordance with Financial Accounting Standards Board (“FASB”) Accounting Standards Codification (“ASC”) Section 605-50 Customer Payments and Incentives (formerly referenced as Emerging Issues Task Force Issue Number 01-09, Accounting for Consideration Given by a Vendor to a Customer (Including a Reseller of the Vendor’s Products)) (“ASC 605-50”). All costs of advertising, to the extent allowable by ASC 605-50, are expensed as incurred. Advertising expense totaled $23.5 million, $18.1 million, and $18.0 million for the years ended February 28, 2010, February 28, 2009 and February 29, 2008, respectively.
Research and Development Expenses
Research and development expenses include all direct costs, primarily salaries for Company personnel and outside consultants, related to the development of new software products, significant enhancements to existing software products, and the portion of costs of development of internal use software required to be expensed. Research and development costs are charged to operations as incurred with the exception of those software development costs that may qualify for capitalization.
76
Table of Contents
RED HAT, INC.
NOTES TO CONSOLIDATED FINANCIAL STATEMENTS—(Continued)
Deferred Taxes
The Company accounts for income taxes using the liability method in which deferred tax assets or liabilities are recognized for the temporary differences between financial reporting and tax bases of the Company’s assets and liabilities and for tax carryforwards at enacted statutory tax rates in effect for the years in which the differences are expected to reverse.
The Company continues to assess the realizability of its deferred tax assets, which primarily consist of share-based compensation expense deductions, tax credit carryforwards and deferred revenue. In assessing the realizability of these deferred tax assets, management considers whether it is more likely than not that some portion or all of the deferred tax assets will be realized. As of February 28, 2010, the net deferred tax asset balance was $79.7 million, of which $6.8 million was offset by a valuation allowance. The Company continues to maintain a valuation allowance against its deferred tax assets with respect to certain foreign net operating loss (“NOL”) carryforwards.
With respect to foreign earnings, it is the Company’s policy to invest the earnings of foreign subsidiaries indefinitely outside the U.S. From time to time however, the Company may remit a portion of these earnings to the extent it incurs no additional U.S. tax and it is otherwise feasible.
Because tax laws are complex and subject to different interpretations, significant judgment is required. As a result, the Company makes certain estimates and assumptions in (i) calculating its income tax expense, deferred tax assets and deferred tax liabilities, (ii) determining any valuation allowance recorded against deferred tax assets and (iii) evaluating the amount of unrecognized tax benefits, as well as the interest and penalties related to such uncertain tax positions. The Company’s estimates and assumptions may differ significantly from tax benefits ultimately realized.
The Company’s income tax expense and deferred taxes are described further in NOTE 11 to the Consolidated Financial Statements.
Foreign Currency Translation
The Euro has been determined to be the primary functional currency for the Company’s European operations and local currencies have been determined to be the functional currencies for the Company’s Asia Pacific and South American operations. Foreign exchange gains and losses, which result from the process of remeasuring foreign currency transactions into the appropriate functional currency, are included in other income, net in the Company’s Consolidated Statements of Operations. Net foreign exchange gains and losses included in other income were a $0.6 million gain, a $0.3 million loss and a $2.2 million loss for the years ended February 28, 2010, February 28, 2009 and February 29, 2008, respectively. The impact of changes in foreign currency exchange rates resulting from the translation of foreign currency financial statements into U.S. dollars for financial reporting purposes is included in other comprehensive income, which is a separate component of stockholders’ equity. Assets and liabilities are translated into U.S. dollars at exchange rates in effect at the balance sheet date. Income and expense items are translated at average rates for the period.
Significant Customers and Credit Risk
Financial instruments which potentially subject the Company to concentrations of credit risk consist principally of cash, cash equivalents, investments and trade receivables. The Company primarily places its cash, cash equivalents and investments with high-credit quality financial institutions which invest predominantly in U.S. Government instruments, investment grade corporate bonds and certificates of deposit guaranteed by banks
77
Table of Contents
RED HAT, INC.
NOTES TO CONSOLIDATED FINANCIAL STATEMENTS—(Continued)
which are members of the FDIC. Cash deposits are primarily in financial institutions in the United States. However, cash for monthly operating costs of international operations are deposited in banks outside the United States.
The Company performs credit evaluations to reduce credit risk and generally requires no collateral from its customers. Management estimates the allowance for uncollectible accounts based on their historical experience and credit evaluation. The Company’s standard credit terms are net 30 days in the U.S., net 30 to 45 days in EMEA, and range from net 30 to net 60 days in Asia Pacific. At February 28, 2010, no individual customer accounted for more than 10% of the Company’s accounts receivable. For the years ended February 28, 2010, February 28, 2009 and February 29, 2008, there were no individually significant customers from which the Company generated revenue.
Net Income Per Common Share
The Company computes basic net income per common share by dividing net income available to common stockholders by the weighted average number of common shares outstanding. Diluted net income per common share is computed by dividing net income adjusted for interest expense and amortization of debt issuance costs associated with the convertible debentures, by the weighted average number of common shares and dilutive potential common share equivalents then outstanding. Potential common share equivalents consist of shares issuable upon the exercise of stock options or vesting of share-based awards and convertible securities such as the Company’s convertible debentures. Diluted net income per share for the years ended February 28, 2009 and February 29, 2008, assumes the conversion of the convertible debentures using the “if converted” method. For the year ended February 28, 2010, the Company had no convertible debentures outstanding and as a result, an adjustment to diluted net income for related interest or amortization expense was not required.
The following table reconciles the numerators and denominators of the earnings per share calculation for the years ended February 28, 2010, February 28, 2009 and February 29, 2008 (in thousands, except per share amounts):
| Year Ended | |||||||||
| February 28, 2010 |
February 28, 2009 |
February 29, 2008 | |||||||
| Diluted net income per share computation: |
|||||||||
| Net income |
$ | 87,253 | $ | 78,721 | $ | 76,667 | |||
| Interest expense on convertible debt, net of related tax |
— | 1,413 | 1,754 | ||||||
| Amortization of debt issuance costs, net of related tax |
— | 1,463 | 1,853 | ||||||
| Net income—diluted |
$ | 87,253 | $ | 81,597 | $ | 80,274 | |||
| Weighted average common shares outstanding |
187,845 | 190,772 | 193,485 | ||||||
| Incremental shares attributable to assumed vesting or exercise of outstanding equity awards |
5,701 | 4,942 | 5,555 | ||||||
| Incremental shares attributable to assumed conversion of convertible debentures |
— | 15,630 | 22,273 | ||||||
| Diluted shares |
193,546 | 211,344 | 221,313 | ||||||
| Diluted net income per share |
$ | 0.45 | $ | 0.39 | $ | 0.36 | |||
78
Table of Contents
RED HAT, INC.
NOTES TO CONSOLIDATED FINANCIAL STATEMENTS—(Continued)
The following share awards are not included in the computation of diluted earnings per share because the aggregate value of proceeds considered received upon either exercise or vesting were greater than the average market price of the Company’s common stock during the related periods and the effect of including such share awards in the computation would be anti-dilutive (in thousands):
| Year Ended | ||||||
| February 28, 2010 |
February 28, 2009 |
February 29, 2008 | ||||
| Number of shares considered anti-dilutive for calculating diluted EPS |
3,525 | 9,269 | 3,970 | |||
Segment Reporting
The Company is organized primarily on the basis of three geographic business units: the Americas, EMEA (Europe, Middle East and Africa) and Asia Pacific. These business units are aggregated into one reportable segment due to the similarity in nature of products provided, financial performance economics (e.g., revenue growth and gross margin), methods of distribution (direct and indirect) and customer classification and base (e.g., distributors, resellers and enterprise).
The Company has offices in more than 65 locations around the world. The Company manages its international business on an Americas-wide, EMEA-wide and Asia Pacific-wide basis. The following disclosure aggregates immaterial international operations and separately discloses the significant international operations at and for the years ended February 28, 2010, February 28, 2009 and February 29, 2008 (in thousands):
| Americas | EMEA | Asia Pacific | Total | ||||||||||
| Year Ended February 28, 2010 | |||||||||||||
| Revenue from unaffiliated customers |
$ | 474,633 | $ | 168,134 | $ | 105,469 | $ | 748,236 | |||||
| Net income |
$ | 62,849 | $ | 20,263 | $ | 4,141 | $ | 87,253 | |||||
| Total assets |
$ | 1,566,140 | $ | 205,097 | $ | 99,635 | $ | 1,870,872 | |||||
| Year Ended February 28, 2009 | |||||||||||||
| Revenue from unaffiliated customers |
$ | 421,994 | $ | 141,679 | $ | 88,899 | $ | 652,572 | |||||
| Net income (loss) |
$ | 73,120 | $ | 11,552 | $ | (5,951 | ) | $ | 78,721 | ||||
| Total assets |
$ | 1,539,840 | $ | 142,539 | $ | 71,257 | $ | 1,753,636 | |||||
| Year Ended February 29, 2008 | |||||||||||||
| Revenue from unaffiliated customers |
$ | 340,488 | $ | 111,341 | $ | 71,187 | $ | 523,016 | |||||
| Net income (loss) |
$ | 81,065 | $ | 3,225 | $ | (7,623 | ) | $ | 76,667 | ||||
| Total assets |
$ | 1,886,376 | $ | 129,662 | $ | 63,944 | $ | 2,079,982 | |||||
79
Table of Contents
RED HAT, INC.
NOTES TO CONSOLIDATED FINANCIAL STATEMENTS—(Continued)
The following table lists, for the years ended February 28, 2010, February 28, 2009 and February 29, 2008, revenue from unaffiliated customers in the United States, the Company’s country of domicile, revenue from unaffiliated customers in Japan, which in terms of revenue was the only individually material country outside the United States, and revenue from other foreign countries.
| Year Ended February 28, 2010 |
Year Ended February 28, 2009 |
Year Ended February 29, 2008 | |||||||
| United States, the Company’s country of domicile |
$ | 423,295 | $ | 385,556 | $ | 316,488 | |||
| Japan |
60,725 | 50,531 | 40,425 | ||||||
| Other foreign |
264,216 | 216,485 | 166,103 | ||||||
| Total revenue from unaffiliated customers |
$ | 748,236 | $ | 652,572 | $ | 523,016 | |||
Total tangible long-lived assets located in the United States, the Company’s country of domicile, and similar tangible long-lived assets held outside the United States are summarized in the following table for the years ended February 28, 2010 and February 28, 2009:
| As of February 28, 2010 |
As of February 28, 2009 | |||||
| United States, the Company’s country of domicile |
$ | 51,523 | $ | 53,106 | ||
| Foreign |
20,185 | 14,807 | ||||
| Total tangible long-lived assets |
$ | 71,708 | $ | 67,913 | ||
Comprehensive Income
The Company’s comprehensive income is comprised of net income, foreign currency translation adjustments, and unrealized gains and losses on marketable securities classified as available-for-sale. Comprehensive income for the years ended February 28, 2010, February 28, 2009 and February 29, 2008 was as follows (in thousands):
| Year Ended | ||||||||||||
| February 28, 2010 |
February 28, 2009 |
February 29, 2008 |
||||||||||
| Comprehensive income: |
||||||||||||
| Net income |
$ | 87,253 | $ | 78,721 | $ | 76,667 | ||||||
| Foreign currency translation adjustments, net of taxes |
(8,283 | ) | 8,609 | (3,552 | ) | |||||||
| Change in unrealized gains (losses) on marketable securities, net of taxes |
(988 | ) | (272 | ) | 7,337 | |||||||
| Total comprehensive income, net of taxes |
$ | 77,982 | $ | 87,058 | $ | 80,452 | ||||||
As of February 28, 2010, the Company holds investments in debt securities with an unrealized gain of $1.7 million and investments in equity securities with an unrealized gain of $4.4 million. As of February 28, 2009, the Company holds investments in debt securities with an unrealized gain of $0.3 million and investments in equity securities with an unrealized gain of $4.7 million.
80
Table of Contents
RED HAT, INC.
NOTES TO CONSOLIDATED FINANCIAL STATEMENTS—(Continued)
Recent Accounting Pronouncements
In January 2010, the FASB issued amended guidance to improve disclosure requirements related to Fair Value Measurements and Disclosures-Overall Subtopic 820-10 of the FASB Accounting Standards Codification (“ASC 820-10”) originally issued as FASB Statement No. 157, Fair value Measurements. The amended guidance requires companies to disclose separately the amounts of significant transfers in and out of Level 1 and Level 2 fair value measurements and describe the reasons for such transfers. These additional disclosure requirements are effective for reporting periods beginning March 1, 2010.
In June 2009, the FASB issued Statement No. 168, The FASB Accounting Standards Codification and the Hierarchy of Generally Accepted Accounting Principles, a replacement of FASB Statement No. 162 (“the Codification”). The Codification, which was launched on July 1, 2009, became the single source of authoritative non-governmental U.S. generally accepted accounting principles (“GAAP”), superseding various existing authoritative accounting pronouncements. The Codification is effective for financial statements issued for interim and annual periods ending after September 15, 2009. The adoption of the Codification had no significant impact on the Company’s consolidated financial statements.
NOTE 3—Business Combinations
Acquisition of Qumranet, Inc.
On September 4, 2008, the Company completed its acquisition of Qumranet, Inc. (“Qumranet”), a privately held software company that produces and sells virtualization technologies. The acquisition of Qumranet broadens the Company’s technology solutions, communities of development and use, and additional influence in, and acceptance of, virtualization technology in the Linux kernel, upon which the Company’s Red Hat Enterprise Linux platform is based. Under the terms of the purchase agreement the Company paid approximately $104.8 million in cash. The total consideration paid by the Company in connection with the acquisition as of February 28, 2010 is summarized in the following table (in thousands):
| Total Consideration | |||
| Cash consideration paid to and or on behalf of Qumranet stockholders |
$ | 104,772 | |
| Transaction costs |
703 | ||
| Total consideration |
$ | 105,475 | |
The table below represents the allocation of the total consideration to the Company’s tangible and identifiable intangible assets and liabilities (in thousands) based on management’s assessment of their respective fair values as of the date of the acquisition:
| Total Consideration Allocated |
||||
| Identifiable intangible assets at fair value (see detail below) |
$ | 21,200 | ||
| Cash |
4,333 | |||
| Accounts receivable at fair value |
28 | |||
| Fixed assets at fair value |
959 | |||
| Other assets at fair value |
247 | |||
| Accrued liabilities at fair value |
(1,069 | ) | ||
| Goodwill |
79,777 | |||
| Total consideration allocated |
$ | 105,475 | ||
81
Table of Contents
RED HAT, INC.
NOTES TO CONSOLIDATED FINANCIAL STATEMENTS—(Continued)
The following table summarizes the allocation of estimated identifiable intangible assets resulting from the acquisition (in thousands). For purposes of this allocation, the Company has assessed a fair value of Qumranet identifiable intangible assets related to employee covenants not to compete, developed technology and tradenames and trademarks based on the net present value of the projected income stream of these identifiable intangible assets. The resulting fair value is being amortized over the estimated useful life of each identifiable intangible asset on a straight-line basis which approximates the economic pattern of benefits (in thousands):
| Expense Type | Estimated Life (Years) |
Total | |||||
| Developed technology |
Research and development | 6 | $ | 17,000 | |||
| Employee covenants not to compete |
Research and development | 3 | 2,600 | ||||
| Tradenames and trademarks |
General and administrative | 10 | 1,600 | ||||
| Total identifiable intangible assets |
$ | 21,200 | |||||
Pro forma consolidated financial information
The following unaudited pro forma consolidated financial information reflects the results of operations (in thousands, except per share amounts) of the Company for the years ended February 28, 2009 and February 29, 2008 as if the acquisition of Qumranet had occurred at the beginning of each period, after giving effect to certain purchase accounting adjustments. These pro forma results are not necessarily indicative of what the Company’s operating results would have been had the acquisition actually taken place at the beginning of each period.
| Year Ended February 28, 2009 |
Year Ended February 29, 2008 | |||||
| Revenue |
$ | 652,697 | $ | 523,016 | ||
| Net income |
$ | 73,048 | $ | 69,945 | ||
| Diluted net income |
$ | 75,924 | $ | 73,552 | ||
| Basic net income per common share |
$ | 0.38 | $ | 0.36 | ||
| Diluted net income per common share |
$ | 0.36 | $ | 0.33 | ||
82
Table of Contents
RED HAT, INC.
NOTES TO CONSOLIDATED FINANCIAL STATEMENTS—(Continued)
Goodwill and other business combinations
The Company completed its annual goodwill impairment test as of February 28, 2010 and no goodwill impairment was deemed to have occurred. The following is a summary of goodwill for the years ended February 28, 2010, February 28, 2009 and February 29, 2008 (in thousands):
| Balance at February 28, 2007 |
$ | 328,837 | ||
| Add: acquisition of other businesses (1) |
7,758 | |||
| Add: adjustment to purchase price for finalization of allocation |
1,514 | |||
| Add: tax adjustment related to acquired NOL carryforwards and unrecognized tax benefits |
1,364 | |||
| Impact of foreign currency fluctuations and other |
841 | |||
| Balance at February 29, 2008 |
$ | 340,314 | ||
| Add: acquisition of Qumranet |
80,030 | |||
| Add: acquisition of other businesses (2) |
19,723 | |||
| Impact of foreign currency fluctuations and other |
(1,958 | ) | ||
| Balance at February 28, 2009 |
$ | 438,109 | ||
| Less: adjustment to Qumranet purchase price for finalization of allocation |
(253 | ) | ||
| Impact of foreign currency fluctuations |
893 | |||
| Balance at February 28, 2010 |
$ | 438,749 | ||
| (1) | During the year ended February 29, 2008, goodwill additions represent the excess of purchase price over tangible and identifiable intangible assets of acquired businesses operating in the middleware space. |
| (2) | During the year ended February 28, 2009, goodwill additions represent the excess of purchase price over tangible and identifiable intangible assets of businesses acquired which provide the Company additional services capability within the middleware and security management markets. The aggregate purchase price paid for these businesses, net of cash acquired, totaled $46.8 million. |
NOTE 4—Accounts Receivable
Accounts receivable are presented net of an allowance for doubtful accounts. Activity in the Company’s allowance for doubtful accounts for the years ended February 28, 2010, February 28, 2009 and February 29, 2008 is presented in the following table (in thousands):
| Balance at beginning of period |
Charged to (recovery of) expense |
Adjustments (a) | Balance at end of period | |||||||||||
| 2008 |
$ | 3,206 | $ | 825 | $ | (1,820 | ) | $ | 2,211 | |||||
| 2009 |
$ | 2,211 | $ | 495 | $ | (319 | ) | $ | 2,387 | |||||
| 2010 |
$ | 2,387 | $ | (295 | ) | $ | 203 | $ | 2,295 | |||||
| (a) | Represents foreign currency translation adjustments and amounts written-off as uncollectible accounts receivable. |
83
Table of Contents
RED HAT, INC.
NOTES TO CONSOLIDATED FINANCIAL STATEMENTS—(Continued)
NOTE 5—Property and Equipment
The Company’s property and equipment is recorded at cost and consists of the following (in thousands):
| February 28, 2010 |
February 28, 2009 |
|||||||
| Computer equipment |
$ | 75,354 | $ | 62,675 | ||||
| Software, including software developed for internal use |
74,742 | 66,550 | ||||||
| Furniture and fixtures |
11,645 | 9,092 | ||||||
| Leasehold improvements |
26,938 | 20,736 | ||||||
| Property and Equipment |
$ | 188,679 | $ | 159,053 | ||||
| Less: accumulated depreciation |
(116,971 | ) | (91,140 | ) | ||||
| Property and equipment, net |
$ | 71,708 | $ | 67,913 | ||||
Depreciation expense was $26.2 million, $22.9 million and $20.0 million for the years ended February 28, 2010, February 28, 2009 and February 29, 2008, respectively. The average useful lives of property and equipment range from 3 to 7 years.
NOTE 6—Identifiable Intangible Assets
Identifiable intangible assets consist primarily of purchased technologies, customer and reseller relationships, trademarks, copyrights and patents, which are amortized over the estimated useful life, generally on a straight line basis with the exception of customer contracts and relationships which are generally amortized over the greater of straight-line or the related asset’s pattern of economic benefit. Useful lives range from three to twelve years for purchased technologies and customer and reseller relationships and three to ten years for trademarks, copyrights and patents. As of February 28, 2010 and February 28, 2009, trademarks with an indefinite estimated useful life totaled $9.0 million and $9.1 million, respectively. Amortization expense associated with identifiable intangible assets was $19.7 million, $17.6 million and $13.0 million for the years ended February 28, 2010, February 28, 2009 and February 29, 2008, respectively. The following is a summary of identifiable intangible assets (in thousands):
| February 28, 2010 | February 28, 2009 | |||||||||||||||||||
| Gross Amount |
Accumulated Amortization |
Net Amount |
Gross Amount |
Accumulated Amortization |
Net Amount | |||||||||||||||
| Trademarks, copyrights and patents |
$ | 52,204 | $ | (13,504 | ) | $ | 38,700 | $ | 47,046 | $ | (10,296 | ) | $ | 36,750 | ||||||
| Purchased technologies |
42,444 | (23,593 | ) | 18,851 | 43,972 | (19,108 | ) | 24,864 | ||||||||||||
| Customer and reseller relationships |
80,760 | (30,098 | ) | 50,662 | 80,704 | (20,141 | ) | 60,563 | ||||||||||||
| Total identifiable intangible assets |
$ | 175,408 | $ | (67,195 | ) | $ | 108,213 | $ | 171,722 | $ | (49,545 | ) | $ | 122,177 | ||||||
As of February 28, 2010, amortization expense on existing intangibles for the next five fiscal years is as follows (in thousands):
| 2011 |
$ | 18,070 | |
| 2012 |
$ | 16,538 | |
| 2013 |
$ | 13,961 | |
| 2014 |
$ | 11,378 | |
| 2015 |
$ | 8,404 |
84
Table of Contents
RED HAT, INC.
NOTES TO CONSOLIDATED FINANCIAL STATEMENTS—(Continued)
NOTE 7—Other Assets
Other assets were comprised of the following (in thousands):
| February 28, 2010 |
February 28, 2009 | |||||
| Equity-method investment |
$ | 17,252 | $ | 19,388 | ||
| Cost-basis investments |
2,732 | 1,732 | ||||
| Net non-current deferred tax assets (see NOTE 11) |
14,967 | 25,985 | ||||
| Security deposits |
4,721 | 4,137 | ||||
| Total |
$ | 39,672 | $ | 51,242 | ||
The Company reviews the non-marketable cost-basis investments in equity securities for other than temporary declines in fair value based on prices recently paid for shares in that company, as well as changes in market conditions. The carrying values are not necessarily representative of the amounts that the Company could realize in a current transaction. During the years ended February 28, 2010, February 28, 2009 and February 29, 2008, no significant losses were recognized for equity investments in other companies.
Equity-method investment represents $17.3 million related to the Company’s investment in Open Inventions Network LLC (“OIN”) and the related share of OIN’s accumulated deficit. The Company uses the equity method to account for its investment in OIN. The equity method requires the Company to increase or decrease the carrying amount of its investment in OIN to reflect the Company’s pro rata share of OIN’s gains and losses, respectively.
NOTE 8—Prepaid Expenses and Other Current Assets
Prepaid expenses and other current assets were comprised of the following (in thousands):
| February 28, 2010 |
February 28, 2009 | |||||
| Net current deferred tax assets (see NOTE 11) |
$ | 57,951 | $ | 54,711 | ||
| Prepaid expenses |
44,116 | 41,792 | ||||
| Other receivables |
577 | 2,497 | ||||
| Inventory |
265 | 437 | ||||
| Total |
$ | 102,909 | $ | 99,437 | ||
Prepaid expenses include deferred commissions which are the incremental costs that are directly associated with non-cancelable subscription contracts with customers and consist of sales commissions paid to the Company’s sales force. The commissions are deferred and amortized over a period to approximate the period of the subscription term. Deferred commissions at February 28, 2010 and February 28, 2009 totaled $30.8 million and $28.4 million, respectively. For further discussion on deferred commissions see NOTE 2 to the Consolidated Financial Statements.
85
Table of Contents
RED HAT, INC.
NOTES TO CONSOLIDATED FINANCIAL STATEMENTS—(Continued)
NOTE 9—Accrued Expenses
Accrued expenses were comprised of the following (in thousands):
| February 28, 2010 |
February 28, 2009 | |||||
| Wages and other compensation related expenses |
$ | 41,990 | $ | 32,863 | ||
| Other trade payables |
14,885 | 15,051 | ||||
| Income and other taxes payable |
10,375 | 5,205 | ||||
| Other |
1,084 | 1,004 | ||||
| Total accrued expenses |
$ | 68,334 | $ | 54,123 | ||
NOTE 10—Foreign Currency Exchange Rate Risk
The Company transacts business in various foreign countries and is, therefore, subject to risk of foreign currency exchange rate fluctuations. The Company from time to time enters into forward contracts to economically hedge transactional exposure associated with commitments arising from trade accounts receivable, trade accounts payable and fixed purchase obligations denominated in a currency other than the functional currency of the respective operating entity. All derivative instruments are recorded on the Consolidated Balance Sheets at their respective fair market values. The Company has elected not to prepare and maintain the documentation required to qualify for hedge accounting treatment and, therefore, changes in fair value are recorded in the Consolidated Statements of Operations.
The effects of derivative instruments on the Company’s Consolidated Financial Statements are as follows as of February 28, 2010 and for the year then ended (in thousands):
| Year Ended February 28, 2010 |
|||||||||||||||
| As of February 28, 2010 | Location of Gain (Loss) Recognized in Income on Derivative |
Amount of Gain (Loss) Recognized in Income on Derivative |
|||||||||||||
| Balance Sheet Location | Fair Value |
Notional Value |
|||||||||||||
| Assets—foreign currency forward contracts not designated as hedges |
Prepaid expenses and |
$ |
77 |
|
$ |
3,888 |
Other income, net |
$ |
387 |
| |||||
| Liabilities—foreign currency forward contracts not designated as hedges |
Accrued expenses | $ | (4 | ) | $ | 4,548 | Other income, net | $ | (442 | ) | |||||
| TOTAL |
$ | 73 | $ | 8,436 | $ | (55 | ) | ||||||||
The aggregate notional amount of outstanding forward contracts at February 28, 2009 was $3.8 million. The fair value of these outstanding contracts at February 28, 2009 was gross, a $0.1 million liability and a less than $0.1 million asset, and is recorded in accrued expenses on the Consolidated Balance Sheets.
86
Table of Contents
RED HAT, INC.
NOTES TO CONSOLIDATED FINANCIAL STATEMENTS—(Continued)
NOTE 11—Income Taxes
The U.S. and foreign components of the Company’s income before provision for income taxes consisted of the following (in thousands):
| February 28, 2010 |
February 28, 2009 |
February 29, 2008 |
||||||||
| U.S. |
$ | 92,130 | $ | 116,293 | $ | 128,961 | ||||
| Foreign |
29,372 | 5,239 | (4,421 | ) | ||||||
| Income before provision for income taxes |
$ | 121,502 | $ | 121,532 | $ | 124,540 | ||||
The components of the Company’s provision for income taxes consisted of the following (in thousands):
| February 28, 2010 |
February 28, 2009 |
February 29, 2008 |
||||||||||
| Current: |
||||||||||||
| Foreign |
$ | 10,445 | $ | 3,206 | $ | 5,136 | ||||||
| Federal |
13,615 | (1,642 | ) | (420 | ) | |||||||
| State |
4,368 | 775 | 2,209 | |||||||||
| Current tax expense |
28,428 | 2,339 | 6,925 | |||||||||
| Deferred: |
||||||||||||
| Foreign |
(998 | ) | (1,628 | ) | 431 | |||||||
| Federal |
9,119 | 39,298 | 36,423 | |||||||||
| State |
(2,300 | ) | 2,802 | 4,094 | ||||||||
| Deferred tax expense |
5,821 | 40,472 | 40,948 | |||||||||
| Net provision for income taxes |
$ | 34,249 | $ | 42,811 | $ | 47,873 | ||||||
87
Table of Contents
RED HAT, INC.
NOTES TO CONSOLIDATED FINANCIAL STATEMENTS—(Continued)
Significant components of the Company’s deferred tax assets and liabilities at February 28, 2010 and February 28, 2009, consist of the following (in thousands):
| February 28, 2010 |
February 28, 2009 |
|||||||
| Deferred tax assets: |
||||||||
| Domestic net operating loss carryforwards |
$ | — | $ | 32,724 | ||||
| Foreign net operating loss carryforwards |
14,620 | 11,778 | ||||||
| Domestic credit carryforwards |
26,955 | 14,088 | ||||||
| Goodwill |
3,163 | 3,695 | ||||||
| Share-based compensation |
22,668 | 27,172 | ||||||
| Compensation-related accruals |
— | 156 | ||||||
| Deferred revenue and costs |
34,396 | 28,657 | ||||||
| Other |
7,459 | 5,414 | ||||||
| Total deferred tax assets |
109,261 | 123,684 | ||||||
| Valuation allowance for deferred tax assets |
(6,770 | ) | (12,384 | ) | ||||
| Total deferred tax assets, net of valuation allowance |
102,491 | 111,300 | ||||||
| Deferred tax liabilities: |
||||||||
| Fixed and intangible assets |
26,218 | 30,578 | ||||||
| Other |
3,355 | 26 | ||||||
| Total deferred tax liabilities |
29,573 | 30,604 | ||||||
| Net deferred tax asset |
$ | 72,918 | $ | 80,696 | ||||
| Net current deferred tax asset, recorded in prepaid expenses and other current assets |
$ | 57,951 | $ | 54,711 | ||||
| Net non-current deferred tax asset, recorded in other assets, net |
14,967 | 25,985 | ||||||
| Net deferred tax asset |
$ | 72,918 | $ | 80,696 | ||||
As of February 28, 2010, the Company continues to maintain a valuation allowance against its deferred tax assets with respect to certain foreign NOLs. The following is a summary of the Company’s valuation allowance for the three years ended February 28, 2010 (in thousands):
| Balance at February 28, 2007 |
$ | 131,026 | ||
| Add: Provisions for valuation allowance |
4,174 | |||
| Less: Release of valuation allowance |
(76,395 | ) | ||
| Balance at February 29, 2008 |
$ | 58,805 | ||
| Add: Provisions for valuation allowance |
1,572 | |||
| Less: Release of valuation allowance |
(47,993 | ) | ||
| Balance at February 28, 2009 |
$ | 12,384 | ||
| Add: Provisions for valuation allowance |
2,622 | |||
| Less: Release of valuation allowance |
(8,236 | ) | ||
| Balance at February 28, 2010 |
$ | 6,770 | ||
As of February 28, 2010, the Company had U.S. state NOL carryforwards of approximately $27.5 million. These NOL carryforwards expire in varying amounts beginning in 2011. As of February 28, 2010, the Company had a U.S. research tax credit carryforward of $31.2 million and a U.S. foreign tax credit of $8.7 million. These tax credit carryforwards expire in varying amounts beginning in 2011.
88
Table of Contents
RED HAT, INC.
NOTES TO CONSOLIDATED FINANCIAL STATEMENTS—(Continued)
Taxes computed at the statutory federal income tax rates are reconciled to the provision for income taxes for the years ended February 28, 2010, February 28, 2009 and February 29, 2008, respectively, as follows (in thousands):
| February 28, 2010 |
February 28, 2009 |
February 29, 2008 |
||||||||||
| Effective rate |
28.2 | % | 35.2 | % | 38.4 | % | ||||||
| Provision at federal statutory rate, 35% |
$ | 42,526 | $ | 42,543 | $ | 43,589 | ||||||
| State tax (net of federal tax benefit) |
2,068 | 3,576 | 4,454 | |||||||||
| Foreign rate differential |
(2,173 | ) | (2,276 | ) | 3,593 | |||||||
| Change in valuation allowance |
— | — | (2,013 | ) | ||||||||
| Nondeductible items |
875 | 832 | 2,652 | |||||||||
| Research and development tax credit (including net discrete item of $7,300) |
(7,800 | ) | — | — | ||||||||
| Foreign tax credit |
(1,577 | ) | (2,406 | ) | (4,063 | ) | ||||||
| Other |
330 | 542 | (339 | ) | ||||||||
| Provision for income taxes |
$ | 34,249 | $ | 42,811 | $ | 47,873 | ||||||
The Company has not provided U.S. deferred taxes on the cumulative earnings of foreign subsidiaries that have been reinvested outside the U.S. indefinitely; these earnings were approximately $29.4 million at February 28, 2010. Determination of the deferred tax liability, if any, on these earnings reinvested indefinitely outside the U.S. is not practicable because of available foreign tax credits. It is the Company’s policy to invest the earnings of foreign subsidiaries indefinitely outside the U.S. From time to time, however, the Company remits a portion of these earnings to the extent it does not incur additional U.S. tax and it is otherwise feasible. The Company has provided U.S. income taxes on the earnings of certain foreign subsidiaries that are not considered as permanently reinvested outside the U.S. The U.S. income tax on such earnings is completely offset by U.S. foreign tax credits.
Unrecognized tax benefits
The following table reconciles unrecognized tax benefits from adoption of ASC 740 Subtopic 10, section 05-06 (formerly referenced as FIN 48) at March 01, 2007 to February 28, 2010:
| Balance at March 1, 2007 |
$ | 27,408 | ||
| Additions based on tax positions related to the current year |
147 | |||
| Additions for tax positions of prior years |
8,325 | |||
| Balance at February 29, 2008 |
$ | 35,880 | ||
| Additions based on tax positions related to the current year |
2,627 | |||
| Balance at February 28, 2009 |
$ | 38,507 | ||
| Additions based on tax positions related to the current year |
2,320 | |||
| Additions based on tax positions related to prior years |
2,977 | |||
| Reductions related to settlements with tax authorities |
(430 | ) | ||
| Balance at February 28, 2010 |
$ | 43,374 | ||
The Company’s unrecognized tax benefits as February 28, 2010 and February 28, 2009, which, if recognized, would affect the Company’s effective tax rate were $36.1 million and $15.9 million, respectively.
89
Table of Contents
RED HAT, INC.
NOTES TO CONSOLIDATED FINANCIAL STATEMENTS—(Continued)
It is the Company’s policy to recognize interest and penalties related to uncertain tax positions as income tax expense. Accrued interest and penalties related to unrecognized tax benefits totaled $1.1 million and $0.9 million as of February 28, 2010 and February 28, 2009, respectively.
The results and timing of the resolution of tax audits is highly uncertain and the Company is unable to estimate the range of the possible changes to the balance of unrecognized tax benefits. However, the Company does not anticipate that within the next 12 months that the total amount of unrecognized tax benefits will significantly increase or decrease as a result of any such potential tax audit resolutions.
The Company or one of its subsidiaries files income tax returns in the U.S. federal jurisdiction and various states and foreign jurisdictions. The following table summarizes the tax years in the Company’s major tax jurisdictions that remain subject to income tax examinations by tax authorities as of February 28, 2010. Due to NOL carryforwards, in some cases the tax years continue to remain subject to examination with respect to such NOLs:
| Tax Jurisdiction |
Years Subject to Income Tax Examination | |
| U.S. federal |
1994 – Present | |
| North Carolina |
1999 – Present | |
| Ireland |
2001 – Present | |
| Japan* |
2008 – Present |
| * | The Company has been examined for income tax for years through February 28, 2007. However, the statute of limitations remains open for 5 years. |
The Company is currently undergoing an income tax examination by the U.S. Internal Revenue Service with respect to its fiscal year ended February 28, 2007.
The Company or one of its subsidiaries is currently undergoing income tax examinations in Germany and India.
The Company believes it has adequately provided for any reasonably foreseeable outcomes related to tax audits.
NOTE 12—Common and Preferred Stock
Common Stock
The Company has authorized 300,000,000 shares of common stock with a par value of $0.0001 per share. Holders of these shares have one vote per share. Upon the dissolution, liquidation or winding up of the Company, holders of common stock will be entitled to receive the assets of the Company after satisfaction of the preferential rights of any outstanding preferred stock or any other outstanding stock ranking on liquidation senior to or on parity with the common stock.
The Company purchased 10,014,022 shares, 2,875,052 shares and 3,747,327 shares of its common stock during the fiscal years ended February 28, 2010, February 28, 2009 and February 29, 2008, respectively, at an aggregate cost of $236.4 million, $42.3 million and $67.2 million, respectively. This amount is recorded as treasury stock on the Company’s Consolidated Balance Sheets.
90
Table of Contents
RED HAT, INC.
NOTES TO CONSOLIDATED FINANCIAL STATEMENTS—(Continued)
Preferred Stock
At February 28, 2010, the Company has authorized 5,000,000 shares of preferred stock with a par value of $0.0001 per share. No shares of preferred stock were outstanding as of February 28, 2010 or February 28, 2009.
NOTE 13—Share-based Awards
Overview
The Company’s 2004 Long-Term Incentive Plan, as amended and restated (the “2004 Plan”), provides for the granting of stock options, nonvested shares and nonvested share units, deferred share units (“DSUs”) and performance share units (“PSUs”), among other awards. As of February 28, 2010, approximately 7.9 million shares of common stock were reserved for issuance under future share-based awards to be granted to any employee, officer or director or consultant of the Company at terms and prices to be determined by the Board of Directors.
The following table summarizes share-based awards, by type, granted during the years ended February 28, 2010, February 28, 2009 and February 29, 2008:
| Awards Granted Year Ended February 28, 2010 |
Awards Granted Year Ended February 28, 2009 |
Awards Granted Year Ended February 29, 2008 | |||||||||||||
| Shares and Shares Underlying Awards |
Weighted Average Per Share Award Fair Value |
Shares and Shares Underlying Awards |
Weighted Average Per Share Award Fair Value |
Shares and Shares Underlying Awards |
Weighted Average Per Share Award Fair Value | ||||||||||
| Stock options |
100,080 | $ | 10.63 | 84,460 | $ | 4.66 | 1,432,490 | $ | 8.06 | ||||||
| Nonvested shares and share units |
2,570,243 | $ | 27.78 | 3,526,605 | $ | 14.20 | 1,817,056 | $ | 20.74 | ||||||
| Performance share units—target |
343,334 | $ | 19.68 | 202,500 | $ | 23.82 | 232,625 | $ | 21.00 | ||||||
| Deferred share units |
28,673 | $ | 21.29 | 9,369 | $ | 17.04 | 20,983 | $ | 21.46 | ||||||
| Total share-based award |
3,042,330 | $ | 26.24 | 3,822,934 | $ | 14.51 | 3,503,154 | $ | 15.58 | ||||||
Stock Options
The 2004 Plan provides that the purchase price per share for each option shall not be less than the fair market value of the underlying share on the date of grant. Options granted under the 2004 Plan to date include contract terms of five years and generally vest 25% upon completion of one full year of service and 6.25% on the first day of each subsequent three-month period of service. The maximum contract term for an option granted under the 2004 Plan is seven years from the date of grant.
Options granted under the Company’s previous long-term incentive plan, the 1999 Stock Option and Incentive Plan (the “1999 Plan”), were generally issued with a purchase price equal to the fair market value of the underlying share on the date of grant and included contract terms of ten years. Vesting under the 1999 Plan was typically 25% upon completion of one full year of service and 6.25% on the first day of each subsequent three-month period of service.
The total fair value of stock options recognized in the Consolidated Financial Statements for the years ended February 28, 2010, February 28, 2009 and February 29, 2008 was $11.4 million, $20.1 million and $29.3 million, respectively.
91
Table of Contents
RED HAT, INC.
NOTES TO CONSOLIDATED FINANCIAL STATEMENTS—(Continued)
The following table summarizes the activity for the Company’s stock options for the years ended February 28, 2010, February 28, 2009 and February 29, 2008:
| Shares Underlying Options |
Weighted Average Exercise Price Per Share | |||||
| Outstanding at February 28, 2007 |
19,628,726 | $ | 15.12 | |||
| Granted |
1,432,490 | 21.16 | ||||
| Exercised |
(1,547,810 | ) | 10.10 | |||
| Forfeited |
(1,073,990 | ) | 20.28 | |||
| Outstanding at February 29, 2008 |
18,439,416 | $ | 15.73 | |||
| Granted |
84,460 | 13.15 | ||||
| Exercised |
(1,583,329 | ) | 11.59 | |||
| Forfeited |
(1,135,185 | ) | 20.32 | |||
| Outstanding at February 28, 2009 |
15,805,362 | $ | 15.80 | |||
| Granted |
100,080 | 27.40 | ||||
| Exercised |
(6,217,251 | ) | 16.62 | |||
| Forfeited |
(463,882 | ) | 62.97 | |||
| Outstanding at February 28, 2010 |
9,224,309 | $ | 13.03 | |||
As described above, options are typically granted with an exercise price equal to the fair market value of the Company’s common stock on the date of grant. No options were granted under Red Hat Plans during the years ended February 28, 2010, February 28, 2009 and February 29, 2008 with exercise prices less than the grant date fair value of the Company’s common stock.
The following summarizes information, as of February 28, 2010, about the Company’s outstanding and exercisable stock options:
| Options Outstanding | Options Exercisable | |||||||||||
| Exercise Prices |
Number Outstanding |
Weighted Average Remaining Contractual Life |
Weighted Average Exercise Price |
Number Exercisable |
Weighted Average Exercise Price | |||||||
| $ 0.00 – $ 3.21 |
1,228,315 | 2.1 | $ | 0.53 | 1,228,315 | $ | 0.53 | |||||
| $ 3.22 – $ 6.41 |
2,155,572 | 1.9 | $ | 4.94 | 2,155,572 | $ | 4.94 | |||||
| $ 6.42 – $ 9.62 |
724,109 | 2.8 | $ | 7.51 | 724,109 | $ | 7.51 | |||||
| $ 9.63 – $12.03 |
21,344 | 2.0 | $ | 11.10 | 21,344 | $ | 11.10 | |||||
| $12.04 – $16.03 |
1,168,785 | 1.6 | $ | 14.44 | 1,117,910 | $ | 14.53 | |||||
| $16.04 – $19.24 |
145,609 | 2.3 | $ | 17.44 | 101,891 | $ | 17.39 | |||||
| $19.25 – $22.44 |
2,517,086 | 2.1 | $ | 20.31 | 1,682,982 | $ | 20.38 | |||||
| $22.45 – $28.86 |
1,215,056 | 1.6 | $ | 25.47 | 980,884 | $ | 25.48 | |||||
| $28.87 – $32.06 |
42,976 | 0.9 | $ | 29.24 | 42,086 | $ | 29.24 | |||||
| $32.07 and over |
5,457 | 0.2 | $ | 81.94 | 5,457 | $ | 81.94 | |||||
| Total |
9,224,309 | 2.0 | $ | 13.03 | 8,060,550 | $ | 11.90 | |||||
92
Table of Contents
RED HAT, INC.
NOTES TO CONSOLIDATED FINANCIAL STATEMENTS—(Continued)
The intrinsic value of options outstanding and options exercisable at February 28, 2010 was $139.0 million and $130.5 million, respectively. At February 28, 2010, the weighted average remaining contractual life of exercisable options was 1.9 years.
The intrinsic value at February 28, 2010 of options expected to vest was $7.4 million.
The intrinsic value of stock options exercised during the years ended February 28, 2010, February 28, 2009 and February 29, 2008 was $62.8 million, $13.2 million and $17.9 million, respectively.
As of February 28, 2010, compensation cost related to unvested stock options not yet recognized in the Company’s Consolidated Financial Statements totaled $8.1 million. The weighted average period over which these unvested stock options are expected to be recognized is approximately 0.8 years.
The fair values of options granted during the years ended February 28, 2010, February 28, 2009 and February 29, 2008 were estimated on the date of grant using the Black-Scholes-Merton option-pricing model based on the following weighted average assumptions:
| Year Ended February 28, 2010 |
Year Ended February 28, 2009 |
Year Ended February 29, 2008 |
||||||||||
| Expected dividend yield |
0.00 | % | 0.00 | % | 0.00 | % | ||||||
| Risk-free interest rate |
1.59 | % | 2.01 | % | 3.92 | % | ||||||
| Expected volatility (1) |
53.51 | % | 47.45 | % | 48.43 | % | ||||||
| Expected life (in years) (2) |
3.27 | 3.27 | 3.27 | |||||||||
| Weighted average fair value of options granted during the period |
$ | 10.63 | $ | 4.66 | $ | 8.06 | ||||||
| (1) | The expected volatility rates for options granted during the years ended February 28, 2010, February 28, 2009 and February 29, 2008 were estimated based on an approximate equal weighting of the historical volatility of the Company’s common stock over a period of approximately 3.27 years and the implied volatility of publicly traded options for the Company’s common stock. |
| (2) | The expected term for options granted during the years ended February 28, 2010, February 28, 2009 and February 29, 2008 was determined based on the Company’s historical exercise data. The Company reassesses its estimate of expected term annually or when new information indicates a change is appropriate. |
Nonvested Shares and Nonvested Share Units
Nonvested shares and nonvested share units granted under the 2004 Plan generally vest 25% on the first anniversary of the date of grant and (i) 6.25% on the first day of each subsequent three-month period for nonvested shares and (ii) 25% each year over a four-year period beginning on the date of grant for nonvested share units. Nonvested shares and nonvested share units are generally amortized to expense on a straight-line basis over four years. The total fair value of nonvested shares and nonvested share units recognized in the Company’s Consolidated Financial Statements for the years ended February 28, 2010, February 28, 2009 and February 29, 2008 was $28.0 million, $16.8 million and $4.7 million, respectively.
93
Table of Contents
RED HAT, INC.
NOTES TO CONSOLIDATED FINANCIAL STATEMENTS—(Continued)
The following table summarizes the activity for the Company’s nonvested shares and nonvested share units for the years ended February 28, 2010, February 28, 2009 and February 29, 2008:
| Nonvested Shares and Share Units |
Weighted Average Grant-date Fair Value | |||||
| Nonvested at February 28, 2007 |
427,487 | $ | 19.45 | |||
| Granted |
1,817,056 | 20.74 | ||||
| Vested |
(145,291 | ) | 19.30 | |||
| Forfeited |
(74,517 | ) | 20.67 | |||
| Nonvested at February 29, 2008 |
2,024,735 | $ | 20.57 | |||
| Granted |
3,526,605 | 14.20 | ||||
| Vested |
(517,810 | ) | 20.24 | |||
| Forfeited |
(200,145 | ) | 18.55 | |||
| Nonvested at February 28, 2009 |
4,833,385 | $ | 16.04 | |||
| Granted |
2,570,243 | 27.78 | ||||
| Vested |
(1,409,415 | ) | 16.77 | |||
| Forfeited |
(261,375 | ) | 17.92 | |||
| Nonvested at February 28, 2010 |
5,732,838 | $ | 21.04 | |||
The intrinsic value of nonvested shares and nonvested share units outstanding at February 28, 2010 was $160.8 million.
The intrinsic value of nonvested shares and nonvested share units vesting in the years ended February 28, 2010, February 28, 2009 and February 29, 2008 was $23.6 million, $10.5 million and $2.9 million, respectively.
As of February 28, 2010, compensation cost related to nonvested shares and nonvested share units not yet recognized in the Company’s Consolidated Financial Statements totaled $107.9 million. The weighted average period over which these nonvested awards are expected to be recognized is approximately 1.6 years. At February 28, 2010, the number of nonvested shares expected to vest, after applying an estimated annual forfeiture rate of 15%, was 4,507,557.
Deferred Share Units
Deferred share units are awarded to directors and generally vest within one year. Deferred share units awarded during the years ended February 28, 2010, February 28, 2009 and February 29, 2008 totaled 28,673 shares, 9,369 shares and 20,983 shares, respectively, with a weighted average fair value per share of $21.29, $17.04 and $21.46, respectively. The total fair value of deferred share units recognized in the Company’s Consolidated Financial Statements for the years ended February 28, 2010, February 28, 2009 and February 29, 2008 was $0.4 million, $0.1 million and $0.3 million, respectively.
Performance Share Units
The total fair value of PSUs recognized in the Company’s Consolidated Financial Statements for the years ended February 28, 2010, February 28, 2009 and February 29, 2008 was $8.5 million, $11.2 million and $2.2 million, respectively. The fair value of awards vested during the year ended February 28, 2010 and February 28,
94
Table of Contents
RED HAT, INC.
NOTES TO CONSOLIDATED FINANCIAL STATEMENTS—(Continued)
2009 totaled $4.1 million and $2.0 million, respectively. As of February 28, 2010, the intrinsic value of awards expected to vest totaled $35.2 million. Compensation expense related to PSUs not yet recognized in the Consolidated Financial Statements totaled $7.9 million as of February 28, 2010.
The following table details the performance criteria and summarizes the activity for the Company’s PSUs for the years ended February 28, 2010, February 28, 2009 and February 29, 2008:
| At Target | Expected to Vest | |||||||||||
| Activity |
Shares underlying Performance Share Units |
Weighted Average Grant Date Fair Value |
Underlying Shares Expected to Vest |
Shares Expected to Vest as a % of Target |
||||||||
| Outstanding at February 28, 2007 |
— | — | — | — | ||||||||
| Granted (4) |
232,625 | $ | 21.00 | 446,640 | 192 | % | ||||||
| Vested |
— | — | — | — | ||||||||
| Forfeited |
— | — | — | — | ||||||||
| Outstanding at February 29, 2008 |
232,625 | $ | 21.00 | 446,640 | 192 | % | ||||||
| Granted (3) |
202,500 | $ | 23.82 | 405,000 | 200 | % | ||||||
| Vested |
(46,525 | ) | $ | 21.00 | (93,050 | ) | 200 | % | ||||
| Forfeited |
— | — | — | — | ||||||||
| Outstanding at February 28, 2009 |
388,600 | $ | 22.46 | 758,590 | 195 | % | ||||||
| Granted (1) (2) |
343,334 | $ | 19.68 | 686,668 | 200 | % | ||||||
| Vested |
(120,413 | ) | $ | 21.00 | (190,200 | ) | 158 | % | ||||
| Forfeited |
— | — | — | — | ||||||||
| Outstanding at February 28, 2010 |
611,521 | $ | 21.19 | 1,255,058 | 198 | % | ||||||
| (1) | On May 13, 2009, the Compensation Committee of the Company’s Board of Directors approved a Performance Share Unit Agreement for use with certain grants of performance share units to executive officers under the Red Hat, Inc. 2004 Amended and Restated Long-Term Incentive Plan, as Amended and Restated (the “2004 Long-Term Incentive Plan”), in FY2010. During the three months ended May 31, 2009, certain executive officers were awarded a target number of PSUs, and depending on the Company’s financial performance relative to a specified peer group of companies, these executive officers may earn up to a maximum of 200% of the target number of PSUs over a performance period with three separate performance segments noted below. In respect of the first performance segment, which is the period from March 1, 2009 through February 28, 2010, up to 25% of the maximum number of PSUs may be earned. In respect of the second performance segment, which is the period from March 1, 2010 through February 28, 2011, up to 50% of the maximum number of PSUs (less the amount of PSUs earned in respect of the first performance segment) may be earned. In respect of the third and final performance segment, which is the period from March 1, 2011 through February 29, 2012, up to 100% of the maximum number of PSUs (less the aggregate amount of PSUs earned in respect of the first and second performance segments) may be earned. |
| (2) | On June 23, 2009, the Compensation Committee of the Company’s Board of Directors approved a Performance Share Unit Agreement for use with certain grants of performance share units (“Share Price PSUs”) in FY2010 to executive officers under the 2004 Long-Term Incentive Plan. During the three months ended August 31, 2009, certain executive officers were awarded a target number of Share Price PSUs, and depending on the performance of the Company’s common stock over a thirty-six month performance period beginning on March 26, 2009 relative to the performance of the stock price of specified peer companies, each of these executive officers may earn up to a maximum of 200% of the target number of Share Price PSUs. Each executive officer will receive a single payout following the end of the performance period. |
95
Table of Contents
RED HAT, INC.
NOTES TO CONSOLIDATED FINANCIAL STATEMENTS—(Continued)
| (3) | On May 22, 2008, the Board approved a Performance Share Unit Agreement for use with grants of performance share units to executive officers under the Red Hat, Inc. 2004 Amended and Restated Long-Term Incentive Plan, as amended, beginning May 2008. During the year ended February 28, 2009, certain executive officers were awarded a target number of PSUs, and depending on the Company’s financial performance relative to a specified peer group of companies, these executive officers may earn up to a maximum of 200% of the target number of PSUs over a performance period with three separate performance segments noted below. In respect of the first performance segment, which is the period from March 1, 2008 through February 28, 2009, up to 25% of the maximum number of PSUs may be earned. In respect of the second performance segment, which is the period from March 1, 2009 through February 28, 2010, up to 50% of the maximum number of PSUs (less the amount of PSUs earned in respect of the first performance segment) may be earned. In respect of the third and final performance segment, which is the period from March 1, 2010 through February 28, 2011, up to 100% of the maximum number of PSUs (less the aggregate amount of PSUs earned in respect of the first and second performance segments) may be earned. The maximum number of PSUs that may be earned during any performance segment is capped at 100% of the target for that segment if total shareholder return for both the one- and three-year periods preceding the conclusion of the relevant performance segment are negative (as calculated using a 20-day average closing price). |
| (4) | On October 12, 2007, the Board approved a form of Performance Share Unit Agreement for use with grants of PSUs to executive officers under the Red Hat, Inc. 2004 Long-Term Incentive Plan, as amended. Certain executive officers were awarded a target number of PSUs, and depending on the Company’s financial performance relative to a specified peer group of companies, these executive officers may earn up to 200% of the target number of PSUs over a performance period that has three performance segments noted below. In respect of the first performance segment, which is the period from March 1, 2007 through February 29, 2008, up to 20% of the maximum number of PSUs may be earned. In respect of the second performance segment, which is the period from March 1, 2008 through February 28, 2009, up to 50% of the maximum number of PSUs (less the amount of PSUs earned in respect of the first performance segment) may be earned. In respect of the third and final performance segment, which is the period from March 1, 2009 through February 28, 2010, up to 100% of the maximum number of PSUs (less the aggregate amount of PSUs earned in respect of the first and second performance segments) may be earned. |
NOTE 14—Commitments and Contingencies
As of February 28, 2010, the Company leased office space and certain equipment under various non-cancelable operating leases. Future minimum lease payments required under the operating leases at February 28, 2010 are as follows (in thousands):
| Fiscal Year |
Operating Leases | ||
| 2011 |
$ | 21,874 | |
| 2012 |
16,352 | ||
| 2013 |
11,339 | ||
| 2014 |
9,916 | ||
| 2015 |
7,803 | ||
| Thereafter |
21,886 | ||
| Total minimum lease payments |
$ | 89,170 | |
Rent expense under operating leases was $20.9 million, $18.5 million and $13.2 million for the fiscal years ended February 28, 2010, February 28, 2009 and February 29, 2008, respectively.
96
Table of Contents
RED HAT, INC.
NOTES TO CONSOLIDATED FINANCIAL STATEMENTS—(Continued)
In January 2002, the Company assumed the lease obligation of an unrelated third-party for an office building which serves as the Company’s headquarters. This lease terminates in June 2020. As compensation to the Company for assuming this obligation, the third-party paid rent on the Company’s behalf from the commencement of the sublease until February 2003, is allowing the Company the use of all furniture and fixtures, including building improvements, that were in the building at the time of the commencement of the sublease, and paid the Company a certain monthly amount through October 2002, to offset the operating expenses of this building, all of which was valued in the aggregate at $5.9 million. Included in the aggregate amount was $3.6 million representing the fair value of furniture and fixtures. This credit balance began to amortize, as a reduction to related rent expense, in fiscal 2004 and will continue to do so until the lease terminates in June 2020. The furniture and fixtures are being depreciated over a period of seven years. As of February 28, 2010 and February 28, 2009, the carrying amount of the long-term deferred lease credit was $3.8 million and $4.4 million, respectively.
Product Indemnification
The Company is a party to a variety of agreements pursuant to which it may be obligated to indemnify the other party from losses arising in connection with the Company’s services or products, or from losses arising in connection with certain events defined within a particular contract, which may include litigation or claims relating to intellectual property infringement, certain losses arising from damage to property or injury to persons or other matters. In each of these circumstances, payment by the Company is conditioned on the other party making a claim pursuant to the procedures specified in the particular contract, which procedures typically allow the Company to challenge the other party’s claims. Further, the Company’s obligations under these agreements may in certain cases be limited in terms of time and/or amount, and in some instances, the Company may have recourse against third-parties for certain payments made by the Company.
It is not possible to predict the maximum potential amount of future payments under these or similar agreements due to the conditional nature of the Company’s obligations and the facts and circumstances involved in each particular agreement. The Company does not record a liability for claims related to indemnification unless the Company concludes that the likelihood of a material claim is probable and estimable. Historically, payments pursuant to these indemnifications have been immaterial.
NOTE 15—Legal Proceedings
Commencing on or about March 2001, the Company and certain of its officers and directors were named as defendants in a series of purported class action suits arising out of the Company’s initial public offering and secondary offering. Approximately 310 other IPO issuers were named as defendants in similar class action complaints (together, the “IPO Allocation Actions”). On August 8, 2001, Chief Judge Michael Mukasey of the U.S. District Court for the Southern District of New York issued an order that transferred all of the IPO Allocation Actions, including the complaints involving the Company, to one judge for coordinated pre-trial proceedings (Case No. 21 MC 92). The plaintiffs contend that the defendants violated federal securities laws by issuing registration statements and prospectuses that contained materially false and misleading information and failed to disclose material information. Plaintiffs also challenge certain IPO allocation practices by underwriters and the lack of disclosure thereof in initial public offering documents. On April 19, 2002, plaintiffs filed amended complaints in each of the 310 consolidated actions, including the Red Hat action. The relief sought consists of unspecified damages, attorneys’ and expert fees and other unspecified costs. In October of 2002, the individual director and officer defendants of the Company were dismissed from the case without prejudice. In October of 2004, the District Court certified a class in six of the 310 actions (the “focus cases”) and noted that the decision is intended to provide strong guidance to all parties regarding class certification in the remaining
97
Table of Contents
RED HAT, INC.
NOTES TO CONSOLIDATED FINANCIAL STATEMENTS—(Continued)
cases. The Company’s action is not one of the focus cases. On December 5, 2006, the U.S. Court of Appeals for the Second Circuit vacated the District Court’s class certification with respect to the focus cases and remanded the matter for further consideration. In September 2007, discovery moved forward in the focus cases and plaintiff filed and amended complaints against the focus case issuer and underwriter defendants. Defendants in the focus cases filed motions to dismiss the second amended complaints in November 2007 and filed their oppositions to plaintiffs’ motion for class certification in December 2007. The motions to dismiss in the focus cases were granted in part and denied in part, and the issue of class certification is currently pending before the Court. On April 2, 2009, the plaintiffs filed a motion for preliminary approval of a settlement agreement to resolve the lawsuit, to which the Company has consented and for which payments called for by the settlement agreement are to be paid by the defendant insurers. The trial court heard arguments on September 10, 2009 on the fairness of the settlement. In an opinion and order filed October 5, 2009, the trial court granted plaintiffs’ motion for approval of the settlement and directed the clerk of the court to close the action. Notices of appeal in the matter have been filed, and the appeal is pending before the Court of Appeals for the Second Circuit.
In the summer of 2004, 14 class action lawsuits were filed against the Company and several of its former officers on behalf of investors who purchased the Company’s securities during various periods from June 19, 2001 through July 13, 2004. All 14 suits were filed in the U.S. District Court for the Eastern District of North Carolina. In each of the actions, plaintiffs sought to represent a class of purchasers of the Company’s common stock during some or all of the period from June 19, 2001 through July 13, 2004. All of the claims arose in connection with the Company’s announcement on July 13, 2004 that it would restate certain of its financial statements (the “Restatement”). One or more of the plaintiffs asserted that certain former officers (the “Individual Defendants”) and the Company violated Sections 10(b) and 20(a) of the Securities Exchange Act of 1934, as amended (the “Securities Exchange Act”), and Rule 10b-5 thereunder by issuing the financial statements that the Company subsequently restated. One or more of the plaintiffs sought unspecified damages, interest, costs, attorneys’ and experts’ fees, an accounting of certain profits obtained by the Individual Defendants from trading in the Company’s common stock, disgorgement by the Company’s former chief executive officer and former chief financial officer of certain compensation and profits from trading in the Company’s common stock pursuant to Section 304 of the Sarbanes-Oxley Act of 2002 and other relief. As of September 8, 2004, all of these class action lawsuits were consolidated into a single action referenced as Civil Action No. 5:04-CV-473BR and titled In re Red Hat, Inc. Securities Litigation. On May 6, 2005, the plaintiffs filed an amended consolidated class action complaint. On July 29, 2005, the Company, on behalf of itself and the Individual Defendants, filed a motion to dismiss the action for failure to state a claim upon which relief may be granted. Also on that date, PricewaterhouseCoopers LLP (“PwC”), another defendant, filed a separate motion to dismiss. On May 12, 2006, the Court issued an order granting the motion to dismiss the Securities Exchange Act claims against several of the Individual Defendants, but denying the motion to dismiss the Securities Exchange Act claims against the Company, its former chief executive officer and former chief financial officer. The Court dismissed the claims under the Sarbanes-Oxley Act in their entirety, and also granted PwC’s motion to dismiss. On November 6, 2006, the plaintiffs filed a motion for class certification. Subsequent to the filing of that motion, several plaintiffs withdrew as potential class representatives, and the Company opposed the certification of the remaining proposed class representatives. On May 11, 2007, the Court entered an order denying class certification and denying all other pending motions as moot. Thereafter, on July 13, 2007 Charles Gilbert filed a renewed motion for appointment as lead plaintiff and approval of selection of lead counsel. On November 13, 2007, the Court entered an Order allowing Gilbert’s motion, appointing him lead plaintiff, adding him as a party plaintiff and appointing lead counsel. On January 14, 2008, Gilbert’s counsel filed a motion to certify the action as a class action. On August 28, 2009, the Court entered an Order certifying the action as a class action, appointing Gilbert as the class representative, and defining the class as “all purchasers of the common stock of Red Hat, Inc. between December 17, 2002, and July 12, 2004, inclusive and who were damaged thereby,” excluding Company insiders. On December 15, 2009, the Company announced that it had reached an agreement in principle to settle
98
Table of Contents
RED HAT, INC.
NOTES TO CONSOLIDATED FINANCIAL STATEMENTS—(Continued)
this matter, subject, among other matters, to completion of a final written settlement agreement and court approval. The Company recorded, for its quarter ended November 30, 2009, an estimated liability in the amount of $8.8 million for its portion of the proposed settlement. Should the efforts to settle this matter not be successful, the Company intends to vigorously defend itself in this matter. There can be no assurance, however, that the Company would be successful, and an adverse resolution of the lawsuit could have a material adverse effect on the Company’s financial position and results of operations in the period in which the lawsuit is resolved.
On October 9, 2007, IP Innovation, LLC and Technology Licensing Corporation filed a complaint in the Eastern District of Texas (Civil Action No. 2-07CV-447) against Red Hat, Inc. and Novell, Inc., alleging direct and indirect infringement of U.S. Patent Nos. 5,072,412, 5,394,521 and 5,533,183 with regard to aspects of the Company’s Linux-based products. The complaint seeks, among other relief, compensatory damages. The Company answered the complaint on February 1, 2008, including counterclaims against plaintiffs for declaratory judgment of invalidity, unenforceability and noninfringement of the patents-in-suit, and the plaintiffs filed a reply to those counterclaims on February 11, 2008. The court issued a memorandum opinion and order denying defendants’ motion for partial summary judgment for invalidity due to indefiniteness and construing disputed claim terms on August 10, 2009. Discovery in the case is complete, and trial began on April 26, 2010. Based on information available to date, the Company believes it has meritorious defenses to this matter and does not anticipate that the lawsuit will have a material adverse effect on its business, financial position and results of operations. There can be no assurance, however, that the Company will be successful in its defense. The Company estimates that an adverse resolution of the lawsuit could result in damages ranging from approximately $0.1 million to $11.0 million.
On March 3, 2009, Software Tree LLC filed a complaint in the Eastern District of Texas (Civil Action No. 6:09-cv-00097-LED) against Red Hat, Inc., Hewlett-Packard Co., Genuitec, L.L.C., and Dell, Inc. alleging direct and indirect infringement of U.S. Patent No. 6,163,776 with regard to aspects of the Company’s JBoss Hibernate product, among other products of the Defendants. The complaint seeks, among other relief, compensatory damages, enhanced damages and injunctive relief. The Company answered the complaint on April 7, 2009 and denied the allegations of direct and indirect infringement, asserted affirmative defenses and filed a counterclaim seeking a declaration that the patent was invalid, unenforceable and not infringed. Discovery in the case is proceeding, and trial has been scheduled for September 13, 2010. Based on the Company’s efforts to date, it believes it has meritorious defenses to this matter, and intends to vigorously defend itself. There can be no assurance, however, that the Company will be successful in its defense, and an adverse resolution of the lawsuit could have a material adverse effect on its business, financial position and results of operation, including its ability to continue to commercialize the technologies implicated in the litigation.
On December 9, 2009, the Company filed a complaint in the Eastern District of Texas (Civil Action No. 6:09-cv-00549) against Bedrock Computer Technologies LLC (“Bedrock”) seeking a declaratory judgment that United States Patent No. 5,893,120 (“‘120 Patent”) is invalid, unenforceable and not infringed. The complaint states that Bedrock brought an action in which it wrongly accused some customers of the Company of infringing the ‘120 Patent based on their use of computer equipment configured with or utilizing software based on various versions of the Linux operating system. The complaint seeks a declaration that anyone’s use, sale, or offer for sale of the Linux kernel distributed by the Company has not and does not in any manner infringe any claim of the patent or otherwise infringe or violate any rights of Bedrock and that the ‘120 Patent is invalid and unenforceable. On January 29, 2010, Bedrock responded denying the contentions in the complaint and asserting a counterclaim alleging that Red Hat has directly and indirectly infringed the ‘120 Patent. On February 22, 2010, Red Hat replied to the counterclaim denying the allegations of infringement and asserting affirmative defenses. On March 26, 2010, Bedrock filed its first amended answer and counterclaim with crossclaims against fifteen parties. Based on information available to date, the Company believes it has meritorious defenses to the
99
Table of Contents
RED HAT, INC.
NOTES TO CONSOLIDATED FINANCIAL STATEMENTS—(Continued)
counterclaims and does not anticipate that the counterclaims will have a material adverse effect on its business, financial position and results of operations. There can be no assurance, however, that the Company will be successful in its defense.
The Company also experiences routine litigation in the normal course of its business, including patent litigation. The Company presently believes that the outcome of this routine litigation will not have a material adverse effect on its financial position and results of operations.
NOTE 16—Employee Benefit Plans
401(k) Plan
The Company provides a retirement plan qualified under Section 401(k) of the Internal Revenue Code of 1986, as amended (“IRC”). Participants may elect to contribute a portion of their annual compensation to the plan, after complying with certain limitations set by the IRC. Employees are eligible to participate in the plan if they are over 21 years of age. The Company has the option to make contributions to the plan and contributed $7.2 million, $6.0 million and $4.8 million to the plan for the years ended February 28, 2010, February 28, 2009 and February 29, 2008, respectively.
NOTE 17—Share Repurchase Program
On September 25, 2007, the Company announced that its Board of Directors had authorized a continuation of the Company’s common stock and debenture repurchase program that was announced in October 2006. Under the continued program, the Company was authorized to repurchase up to an aggregate of $250.0 million of common stock from time to time on the open market or in privately negotiated transactions, as applicable.
On November 17, 2008, the Company announced that its Board of Directors had amended the repurchase program to authorize the repurchase of up to an aggregate of $250.0 million of common stock, without regard to amounts previously repurchased under prior programs. The amended program expires on the earlier of (i) October 31, 2010 or (ii) a determination by the Board of Directors, the Chief Executive Officer or the Chief Financial Officer to discontinue the program. During the year ended February 28, 2010, the Company repurchased 10,014,022 shares under the program for $236.4 million, including transaction costs. As of February 28, 2010, the remaining amount available under the program for the repurchase of Common Stock was $9.7 million.
On March 24, 2010, the Company announced that its Board of Directors had authorized the repurchase of up to an aggregate of $300.0 million of the Company’s common stock from time to time in open market or privately negotiated transactions, as applicable. The program will expire on the earlier of (i) March 31, 2012, or (ii) a determination by the Board of Directors, Chief Executive Officer or Chief Financial Officer to discontinue the program.
See NOTE 19 to the Consolidated Financial Statements for a discussion of shares repurchased subsequent to February 28, 2010.
100
Table of Contents
RED HAT, INC.
NOTES TO CONSOLIDATED FINANCIAL STATEMENTS—(Continued)
NOTE 18—Unaudited Quarterly Results
Below are unaudited condensed quarterly results for the year ended February 28, 2010:
| Year Ended February 28, 2010 Unaudited | ||||||||||||
| 4th Quarter |
3rd Quarter |
2nd Quarter |
1st Quarter | |||||||||
| (in thousands, except per share data) | ||||||||||||
| Revenue: |
||||||||||||
| Subscriptions |
$ | 169,159 | $ | 164,432 | $ | 156,273 | $ | 148,790 | ||||
| Training and services |
26,710 | 29,914 | 27,360 | 25,598 | ||||||||
| Total subscription and training and services revenue |
$ | 195,869 | $ | 194,346 | $ | 183,633 | $ | 174,388 | ||||
| Gross profit |
$ | 166,530 | $ | 164,748 | $ | 155,193 | $ | 147,920 | ||||
| Income from operations |
$ | 27,958 | $ | 19,793 | $ | 27,542 | $ | 25,056 | ||||
| Interest income |
$ | 2,220 | $ | 2,206 | $ | 2,525 | $ | 3,430 | ||||
| Other income, net |
$ | 4,357 | $ | 3,295 | $ | 3,234 | $ | 50 | ||||
| Net income |
$ | 23,388 | $ | 16,414 | $ | 28,937 | $ | 18,514 | ||||
| Diluted net income |
$ | 23,388 | $ | 16,414 | $ | 28,937 | $ | 18,514 | ||||
| Net income per common share (a): |
||||||||||||
| Basic |
$ | 0.12 | $ | 0.09 | $ | 0.15 | $ | 0.10 | ||||
| Diluted |
$ | 0.12 | $ | 0.08 | $ | 0.15 | $ | 0.10 | ||||
| Weighted average shares outstanding: |
||||||||||||
| Basic |
187,911 | 187,450 | 187,099 | 188,916 | ||||||||
| Diluted |
193,822 | 193,733 | 192,659 | 194,382 | ||||||||
| (a) | Earnings per common share are computed independently for each of the quarters presented. Therefore, the sum of the quarterly per common share information may not equal the annual earnings per common share. |
101
Table of Contents
RED HAT, INC.
NOTES TO CONSOLIDATED FINANCIAL STATEMENTS—(Continued)
Below are unaudited condensed quarterly results for the year ended February 28, 2009:
| Year Ended February 28, 2009 Unaudited |
||||||||||||||
| 4th Quarter |
3rd Quarter |
2nd Quarter |
1st Quarter |
|||||||||||
| (in thousands, except per share data) | ||||||||||||||
| Revenue: |
||||||||||||||
| Subscriptions |
$ | 139,356 | $ | 135,451 | $ | 135,709 | $ | 130,694 | ||||||
| Training and services |
26,865 | 29,881 | 28,674 | 25,941 | ||||||||||
| Total subscription and training and services revenue |
$ | 166,221 | $ | 165,332 | $ | 164,383 | $ | 156,635 | ||||||
| Gross profit |
$ | 140,568 | $ | 138,796 | $ | 136,875 | $ | 130,206 | ||||||
| Income from operations |
$ | 20,237 | $ | 20,970 | $ | 21,404 | $ | 19,910 | ||||||
| Interest income |
$ | 5,904 | $ | 9,294 | $ | 10,442 | $ | 10,833 | ||||||
| Other income (expense), net |
$ | (688 | ) | $ | 4,501 | $ | 4,336 | $ | (813 | ) | ||||
| Net income |
$ | 15,988 | $ | 24,305 | $ | 21,138 | $ | 17,290 | ||||||
| Diluted net income (b) |
$ | 16,210 | $ | 25,147 | $ | 22,032 | $ | 18,184 | ||||||
| Net income per common share (a): |
||||||||||||||
| Basic |
$ | 0.08 | $ | 0.13 | $ | 0.11 | $ | 0.09 | ||||||
| Diluted |
$ | 0.08 | $ | 0.12 | $ | 0.10 | $ | 0.08 | ||||||
| Weighted average shares outstanding: |
||||||||||||||
| Basic |
190,146 | 190,665 | 191,485 | 190,779 | ||||||||||
| Diluted |
197,820 | 208,408 | 220,039 | 218,853 | ||||||||||
| (a) | Earnings per common share are computed independently for each of the quarters presented. Therefore, the sum of the quarterly per common share information may not equal the annual earnings per common share. |
| (b) | Diluted net income is computed by adjusting net income for the interest expense and amortization of debt issuance costs associated with the debentures, assuming the debentures were converted to common stock. |
NOTE 19—Subsequent Events
From March 1, 2010 through April 28, 2010, the Company repurchased an aggregate of 1,905,000 shares of its common stock for $57.4 million. These repurchases were made pursuant to the Company’s previously announced repurchase programs. See NOTE 17 to the Consolidated Financial Statements for further discussion of the repurchase programs. As of April 28, 2010, the amount available for repurchase of common stock was $252.3 million.
102
Table of Contents
| ITEM 9. | CHANGES IN AND DISAGREEMENTS WITH ACCOUNTANTS ON ACCOUNTING AND FINANCIAL DISCLOSURE |
There were no changes in or disagreements with our accountants on accounting and financial disclosure matters.
| ITEM 9A. | CONTROLS AND PROCEDURES |
Role of Controls and Procedures
Our management, including our chief executive officer and chief financial officer, does not expect that our disclosure controls and procedures (as defined in Rules 13a-15(e) and 15d-15(e) under the Exchange Act) or our internal control over financial reporting (as defined in Rules 13a-15(f) and 15d-15(f) under the Exchange Act) will prevent all errors and all fraud. A control system, no matter how well designed and operated, can provide only reasonable, not absolute, assurance that the control system’s objectives will be met. Further, the design of a control system must reflect the fact that there are resource constraints, and the benefits of the controls must be considered relative to their costs. Because of the inherent limitations in all control systems, no evaluation of controls can provide absolute assurance that all control issues and instances of fraud, if any, within a company have been detected. These inherent limitations include the realities that judgments in decision-making can be faulty and that breakdowns can occur because of simple error and mistake. Controls can also be circumvented by the individual acts of some persons, by collusion of two or more people, or by management override of the controls. The design of any system of controls is based in part on certain assumptions about the likelihood of future events. Because of the inherent limitations in a cost-effective control system, misstatements due to error or fraud may occur and not be detected. Also projections of any evaluation of effectiveness of controls and procedures to future periods are subject to the risk that the controls and procedures may become inadequate because of changes in conditions, or that the degree of compliance with the controls and procedures may have deteriorated.
Evaluation of Disclosure Controls and Procedures
Our management, with the participation of our chief executive officer and chief financial officer, evaluated the effectiveness of our disclosure controls and procedures as of the end of the period covered by this report. Based on this evaluation, our chief executive officer and chief financial officer concluded that, as of the end of the period covered by this report, our disclosure controls and procedures were effective at a reasonable assurance level.
Report of Management on Internal Control Over Financial Reporting
Report of Management on Internal Control Over Financial Reporting is set forth above under PART II, Item 8, “Financial Statements and Supplementary Data—Report of Management on Internal Control Over Financial Reporting.”
Changes in Internal Control Over Financial Reporting
No changes in our internal control over financial reporting occurred during the fiscal quarter ended February 28, 2010 that have materially affected, or are reasonably likely to materially affect, our internal control over financial reporting.
| ITEM 9B. | OTHER INFORMATION |
None.
103
Table of Contents
PART III
| ITEM 10. | DIRECTORS, EXECUTIVE OFFICERS AND CORPORATE GOVERNANCE |
We intend to file with the SEC a definitive proxy statement with respect to the Annual Meeting of Stockholders to be held on August 12, 2010 (the “2010 Annual Meeting”). The information under the sections entitled “Item No. 1: Election of Directors”, “Corporate Governance and Board of Director Information”, “Compensation and Other Information Concerning Executive Officers” and “Other Matters” from our definitive proxy statement for the 2010 Annual Meeting, which is to be filed with the SEC not later than 120 days after the close of our fiscal year ended February 28, 2010 (the “2010 Proxy Statement”), is hereby incorporated by reference.
| ITEM 11. | EXECUTIVE COMPENSATION |
The information under the section entitled “Compensation and Other Information Concerning Executive Officers” and “Corporate Governance and Board of Director Information” from the 2010 Proxy Statement is hereby incorporated by reference.
| ITEM 12. | SECURITY OWNERSHIP OF CERTAIN BENEFICIAL OWNERS AND MANAGEMENT AND RELATED STOCKHOLDER MATTERS |
The information under the sections entitled “Beneficial Ownership of Our Common Stock” and “Compensation and Other Information Concerning Executive Officers” from the 2010 Proxy Statement is hereby incorporated by reference.
| ITEM 13. | CERTAIN RELATIONSHIPS AND RELATED TRANSACTIONS, AND DIRECTOR INDEPENDENCE |
The information under the section entitled “Corporate Governance and Board of Directors Information” from the 2010 Proxy Statement is hereby incorporated by reference.
| ITEM 14. | PRINCIPAL ACCOUNTING FEES AND SERVICES |
The information under the sections entitled “Item No. 2: Ratification of Selection of Independent Registered Public Accounting Firm” from the 2010 Proxy Statement is hereby incorporated by reference.
104
Table of Contents
PART IV
| ITEM 15. | EXHIBITS, FINANCIAL STATEMENT SCHEDULES |
(a) The following documents are filed as part of this Report under “Item 8—Financial Statements and Supplementary Data”:
1. Financial Statements:
| 64 | ||
| Consolidated Balance Sheets at February 28, 2010 and February 28, 2009 |
65 | |
| 66 | ||
| 67 | ||
| 68 | ||
| 69 |
2. Financial Statement Schedules:
All other schedules for which provision is made in the applicable accounting regulations of the Securities and Exchange Commission are not required under the related instructions or are inapplicable and therefore have been omitted.
3. List of Exhibits:
| Exhibit No. |
Description of Exhibits | ||
| 3.1+ | Third Amended and Restated Certificate of Incorporation, as amended, of the registrant (incorporated by reference to Exhibit 3.1 to the registrant’s Quarterly Report filed on Form 10-Q with the SEC on July 10, 2007 (File no. 001-33162)) | ||
| 3.2+ | Amended and Restated By-Laws of the registrant dated April 21, 2010 (incorporated by reference to Exhibit 3.1 to the registrant’s Current Report on Form 8-K filed with the SEC on April 26, 2010 (File no. 001-33162)) | ||
| 4.1+ | Specimen certificate representing the common stock of the registrant (incorporated by reference to Exhibit 4.1 to the registrant’s Registration Statement on Form S-1/A filed with the SEC on July 19, 1999 (File no. 333-94775)) | ||
| 4.2+ | See Exhibits 3.1 and 3.2 for provisions of the Certificate of Incorporation and By-Laws of the registrant defining the rights of holders of common stock of the registrant | ||
| 4.3+ | First Amended and Restated Investor Rights Agreement by and among the registrant and the Investors and Founders listed therein, dated as of February 25, 1999, as amended (incorporated by reference to Exhibit 10.7 to the registrant’s Registration Statement on Form S-1 filed with the SEC on June 4, 1999 (File no. 333-80051)) | ||
| 10.1+ | * | Red Hat, Inc. 1998 Stock Option Plan, as amended (incorporated by reference to Exhibit 10.1 to the registrant’s Registration Statement on Form S-1 filed with the SEC on June 4, 1999 (File no. 333-80051)) | |
| 10.2+ | * | Red Hat, Inc. 1999 Employee Stock Purchase Plan (incorporated by reference to Exhibit 10.3 to the registrant’s Registration Statement on Form S-1 filed with the SEC on June 4, 1999 (File no. 333-80051) | |
105
Table of Contents
| Exhibit No. |
Description of Exhibits | |
| 10.3+ | GNU General Public License (incorporated by reference to Exhibit 10.13 to the registrant’s Registration Statement on Form S-1 filed with the SEC on June 4, 1999 ((File no. 333-80051)) | |
| 10.4+* | Employment Agreement by and between the registrant and Matthew Szulik dated July 24, 2002 (incorporated by reference to Exhibit 10.2 to the registrant’s Quarterly Report on Form 10-K filed with the SEC on October 10, 2008 (File No. 001-33162)) | |
| 10.5+* | Restricted Stock Award Agreement by and between the registrant and Matthew Szulik dated June 27, 2001 (incorporated by reference as Exhibit 10.03 to the registrant’s Quarterly Report filed on Form 10-Q with the SEC on October 10, 2008 (File no. 001-33162)) | |
| 10.6+* | Red Hat, Inc. 1999 Stock Option and Incentive Plan, as Amended and Restated August 2, 2001 (incorporated by reference to Exhibit 10.4 to the registrant’s Quarterly Report on Form 10-Q filed with the SEC on October 10, 2008 (File no. 001-33162)) | |
| 10.7+* | Restricted Stock Award Agreement by and between the registrant and Matthew Szulik dated December 17, 2003 (incorporated by reference to Exhibit 10.12 to the registrant’s Annual Report filed on Form 10-K with the SEC on May 14, 2004 (File no. 000-26281)) | |
| 10.8+* | Letter Agreement by and between registrant and Charles E. Peters, Jr. dated August 16, 2004 (incorporated by reference to Exhibit 10.1 to the registrant’s Quarterly Report filed on Form 10-Q with the SEC on October 12, 2004 (File no. 000-26281)) | |
| 10.9+* | Incentive Stock Option Agreement by and between registrant and Charles E. Peters, Jr. dated August 31, 2004 (incorporated by reference to Exhibit 10.2 to the registrant’s Quarterly Report filed on Form 10-Q with the SEC on October 12, 2004 (File no. 000-26281)) | |
| 10.10+* | Non-Qualified Stock Option Agreement by and between registrant and Charles E. Peters dated August 31, 2004 (incorporated by reference to Exhibit 10.3 to the registrant’s Quarterly Report filed on Form 10-Q with the SEC on October 12, 2004 (File no. 000-26281)) | |
| 10.11+* | Form of Long Term Incentive Plan Non-Qualified Stock Option Agreement for Directors pursuant to the Red Hat, Inc. 2004 Long-Term Incentive Plan, as Amended and Restated (incorporated by reference to Exhibit 10.3 to the registrant’s Current Report filed on Form 8-K with the SEC on December 21, 2004 (File No. 000-26281)) | |
| 10.12+* | Form of Long Term Incentive Plan Restricted Stock Agreement pursuant to the Red Hat, Inc. 2004 Long-Term Incentive Plan, as Amended and Restated (incorporated by reference to Exhibit 10.5 to the registrant’s Current Report filed on Form 8-K with the SEC on December 21, 2004 (File No. 000-26281)) | |
| 10.13+* | Form of Non-Qualified Stock Option Agreement pursuant to Red Hat, Inc. 1999 Stock Option and Incentive Plan, as amended (incorporated by reference to Exhibit 10.12 to the registrant’s Annual Report filed on Form 10-K with the SEC on May 16, 2005 (File no. 000-26281)) | |
| 10.14+* | Form of Incentive Plan and Stock Option Agreement pursuant to Red Hat, Inc. 1999 Stock Option and Incentive Plan, as amended (incorporated by reference to Exhibit 10.13 to the registrant’s Annual Report filed on Form 10-K with the SEC on May 16, 2005 (File no. 000-26281)) | |
| 10.15+* | Letter Agreement by and between registrant and Paul J. Cormier dated April 17, 2001 (incorporated by reference to Exhibit 10.26 to the registrant’s Annual Report filed on Form 10-K with the SEC on May 16, 2005 (File no. 000-26281)) | |
| 10.16+* | Letter Agreement by and between registrant and Alex Pinchev dated March 18, 2003 (incorporated by reference to Exhibit 10.27 to the registrant’s Annual Report filed on Form 10-K with the SEC on May 16, 2005 (File no. 000-26281)) | |
106
Table of Contents
| Exhibit No. |
Description of Exhibits | ||
| 10.17+ | * | Letter Agreement by and between registrant and Michael R. Cunningham dated April 16, 2004 (incorporated by reference to Exhibit 10.29 to the registrant’s Annual Report filed on Form 10-K with the SEC on May 16, 2005 (File no. 000-26281)) | |
| 10.18+ | * | Amendment to Non-Qualified Stock Option Agreement by and between the registrant and Matthew J. Szulik dated effective December 30, 2005 (incorporated by reference to Exhibit 10.1 to the registrant’s Current Report filed on Form 8-K with the SEC on January 6, 2006 (File No. 000-26281)) | |
| 10.19+ | * | Amendment to Restricted Stock Award Agreement by and between the registrant and Matthew J. Szulik dated December 30, 2005 (incorporated by reference to Exhibit 10.2 to the registrant’s Current Report filed on Form 8-K with the SEC on January 6, 2006 (File No. 000-26281)) | |
| 10.20+- | Limited Liability Company Agreement of Open Inventions Network dated November 8, 2005 (incorporated by reference to Exhibit 10.1 to the registrant’s Quarterly Report on Form 10-Q filed with the SEC on January 9, 2006 (File no. 000-26281)) | ||
| 10.21+ | * | Form of Long-Term Incentive Plan Restricted Stock Agreement pursuant to the Red Hat, Inc. 2004 Long-Term Incentive Plan, as Amended and Restated (incorporated by reference to Exhibit 10.2 to the registrant’s Quarterly Report on Form 10-Q filed with the SEC on January 9, 2006 (File No. 000-26281)) | |
| 10.22+ | * | 2006 Performance Compensation Plan (incorporated by reference to Exhibit 10.1 to the registrant’s Current Report filed on Form 8-K with the SEC on August 23, 2006 (File no. 000-26281)) | |
| 10.23+ | * | Red Hat, Inc. 2004 Long-Term Incentive Plan, as Amended and Restated (incorporated by reference to Exhibit 10.1 to the registrant’s Quarterly Report on Form 10-Q filed with the SEC on October 10, 2008 (File no. 001-33162)) | |
| 10.24+ | * | Form of Indemnification Agreement (incorporated by reference to Exhibit 10.1 to the registrant’s Current Report filed on Form 8-K with the SEC on February 28, 2007 (File No. 001-33162)) | |
| 10.25+ | * | Form of Restricted Stock Award Agreement pursuant to the Red Hat, Inc. 2004 Long-Term Incentive Plan, as Amended and Restated (incorporated by reference to Exhibit 10.2 to the registrant’s Current Report filed on Form 8-K with the SEC on February 28, 2007 (File No. 001-33162)) | |
| 10.26+ | * | Form of Non-Qualified Stock Option Agreement for Executive Employees pursuant to the Red Hat, Inc. 2004 Long-Term Incentive Plan, as Amended and Restated (incorporated by reference to Exhibit 10.3 to the registrant’s Current Report filed on Form 8-K with the SEC on February 28, 2007 (File No. 001-33162)) | |
| 10.27+ | * | Form of Amendment to Equity Awards of Executive pursuant to the Red Hat, Inc. 2004 Long-Term Incentive Plan, as Amended and Restated (incorporated by reference to Exhibit 10.4 to the registrant’s Current Report filed on Form 8-K with the SEC on February 28, 2007 (File No. 001-33162)) | |
| 10.28+ | * | Senior Management Change in Control Severance Policy (incorporated by reference to Exhibit 10.5 to the registrant’s Current Report filed on Form 8-K with the SEC on February 28, 2007 (File No. 001-33162)) | |
| 10.29+ | * | Executive Variable Compensation Plan (incorporated by reference to Exhibit 99.1 to the registrant’s Current Report filed on Form 8-K with the SEC on May 16, 2007 (File No. 001-33162)) | |
107
Table of Contents
| Exhibit No. |
Description of Exhibits | ||
| 10.30+ | * | Form of Restricted Stock Unit Agreement pursuant to the Red Hat, Inc. 2004 Long-Term Incentive Plan, as Amended and Restated (Non-Executive, U.S. Participants) (incorporated by reference to Exhibit 10.1 to the registrant’s Quarterly Report filed on Form 10-Q with the SEC on October 10, 2007 (File No. 001-33162)) | |
| 10.31+ | * | Form of Restricted Stock Unit Agreement pursuant to the Red Hat, Inc. 2004 Long-Term Incentive Plan, as Amended and Restated (Non-Executive, Non U.S. Participants) (incorporated by reference to Exhibit 10.2 to the registrant’s Quarterly Report filed on Form 10-Q with the SEC on October 10, 2007 (File No. 001-33162)) | |
| 10.32+ | * | Form of Performance Share Unit Agreement pursuant to the Red Hat, Inc. 2004 Long-Term Incentive Plan pursuant to the Red Hat, Inc. 2004 Long-Term Incentive Plan, as Amended and Restated (incorporated by reference to Exhibit 10.1 to the registrant’s Current Report filed on Form 8-K with the SEC on October 15, 2007 (File No. 001-33162)) | |
| 10.33+ | * | Executive Employment Agreement, dated December 19, 2007, between Red Hat, Inc. and James M. Whitehurst (incorporated by reference to Exhibit 10.5 to the registrant’s Quarterly Report filed on Form 10-Q with the SEC on January 9, 2008 (File No. 001-33162)) | |
| 10.34+ | * | Form of Amendment to Performance Share Unit Agreement pursuant to the Red Hat, Inc. 2004 Long-Term Incentive Plan, as Amended and Restated (incorporated by reference to Exhibit 10.38 to the registrant’s Annual Report filed on Form 10-K with the SEC on April 29, 2008 (File No. 001-33162)) | |
| 10.35+ | * | Form of Director Deferred Stock Unit Agreement pursuant to the Red Hat, Inc. 2004 Long-Term Incentive Plan, as Amended and Restated (incorporated by reference to Exhibit 10.39 to the registrant’s Annual Report filed on Form 10-K with the SEC on April 29, 2008 (File No. 001-33162)) | |
| 10.36+ | * | Executive Transition Agreement between Red Hat, Inc. and Matthew J. Szulik dated February 28, 2008 (incorporated by reference to Exhibit 10.40 to the registrant’s Annual Report filed on Form 10-K with the SEC on April 29, 2008 (File No. 001-33162)) | |
| 10.37+ | * | Non-Executive Chairman Agreement between Red Hat, Inc. and Matthew J. Szulik dated February 28, 2008 (incorporated by reference to Exhibit 10.41 to the registrant’s Annual Report filed on Form 10-K with the SEC on April 29, 2008 (File No. 001-33162)) | |
| 10.38+ | * | 2008 Independent Director Compensation Plan (incorporated by reference to Exhibit 10.42 to the registrant’s Annual Report filed on Form 10-K with the SEC on April 29, 2008 (File No. 001-33162)) | |
| 10.39+ | * | Form of Performance Share Unit Agreement adopted May 2008 pursuant to the Red Hat, Inc. 2004 Long-Term Incentive Plan, as Amended and Restated (incorporated by reference to Exhibit 99.1 to the registrant’s Current Report filed on Form 8-K with the SEC on May 23, 2008 (File No. 001-33162)) | |
| 10.40+ | * | Form of Director Deferred Stock Unit Agreement (Vested) pursuant to the Red Hat, Inc. 2004 Long-Term Incentive Plan, as Amended and Restated (incorporated by reference to Exhibit 10.2 to the registrant’s Quarterly Report filed on Form 10-Q with the SEC on July 10, 2008 (File No. 001-33162)) | |
| 10.41+ | * | Form of Director Deferred Stock Unit Agreement (With Vesting) pursuant to the Red Hat, Inc. 2004 Long-Term Incentive Plan, as Amended and Restated (incorporated by reference to Exhibit 10.3 to the registrant’s Quarterly Report filed on Form 10-Q with the SEC on July 10, 2008 (File No. 001-33162)) | |
108
Table of Contents
| Exhibit No. |
Description of Exhibits | ||
| 10.42+ | * | Form of Director Restricted Stock Unit Agreement pursuant to the Red Hat, Inc. 2004 Long-Term Incentive Plan, as Amended and Restated (incorporated by reference to Exhibit 10.4 to the registrant’s Quarterly Report filed on Form 10-Q with the SEC on July 10, 2008 (File No. 001-33162)) | |
| 10.43+ | * | Senior Management Severance Plan (incorporated by reference to Exhibit 10.1 to the registrant’s Current Report filed on Form 8-K with the SEC on December 29, 2008 (File No. 001-33162)) | |
| 10.44+ | * | Form of Executive Agreement by and between Red Hat, Inc. and each Plan Participant (incorporated by reference to Exhibit 10.2 to the registrant’s Current Report filed on Form 8-K with the SEC on December 29, 2008 (File No. 001-33162)) | |
| 10.45+ | * | Form of Amendment to Equity Awards with Independent Directors (incorporated by reference to Exhibit 10.1 to the registrant’s Quarterly Report filed on Form 10-Q with the SEC on January 9, 2009 (File No. 001-33162)) | |
| 10.46+ | * | Letter Agreement dated December 23, 2008 between Red Hat, Inc. and James M. Whitehurst amending the Executive Employment Agreement between the parties dated December 19, 2007 (incorporated by reference to Exhibit 10.4 to the registrant’s Quarterly Report filed on Form 10-Q with the SEC on January 9, 2009 (File No. 001-33162)) | |
| 10.47+ | * | Employee Inventions Assignment Agreement and Restrictive Obligations Agreement dated January 1, 2008 between Red Hat, Inc. and James M. Whitehurst (incorporated by reference to Exhibit 10.5 to the registrant’s Quarterly Report filed on Form 10-Q with the SEC on January 9, 2009 (File No. 001-33162)) | |
| 10.48+ | * | Letter Agreement dated December 29, 2008 between Red Hat, Inc. and Matthew J. Szulik amending the Non-executive Chairman Agreement between the parties dated February 28, 2008 (incorporated by reference to Exhibit 10.6 to the registrant’s Quarterly Report filed on Form 10-Q with the SEC on January 9, 2009 (File No. 001-33162)) | |
| 10.49+ | * | Letter Agreement dated December 29, 2008 between Red Hat, Inc. and Matthew J. Szulik amending the Executive Transition Agreement between the parties dated February 28, 2008 (incorporated by reference to Exhibit 10.7 to the registrant’s Quarterly Report filed on Form 10-Q with the SEC on January 9, 2009 (File No. 001-33162)) | |
| 10.50+ | * | Executive Base Salaries and Target Award Amounts under Red Hat, Inc.’s Executive Variable Compensation Plan for the Fiscal Year Ending February 28, 2010 (incorporated by reference to Exhibit 99.1 to registrant’s Current Report filed on Form 8-K with the SEC on May 19, 2009 (File No. 001-33162)) | |
| 10.51+ | * | Form of Performance Share Unit Agreement adopted May 13, 2009 (incorporated by reference to Exhibit 99.2 to the registrant’s Current Report filed on Form 8-K with the SEC on May 19, 2009 (File No. 001-33162)) | |
| 10.52+ | * | Clawback Policy of Red Hat, Inc. adopted May 13, 2009 (incorporated by reference to Exhibit 99.3 to the registrant’s Current Report filed on Form 8-K with the SEC on May 19, 2009 (File No. 001-33162)) | |
| 10.53+ | * | Form of Performance Share Unit Agreement (Fiscal Year 2010-SPP Form) adopted June 23, 2009 (incorporated by reference to Exhibit 99.1 to the registrant’s Current Report filed on Form 8-K with the SEC on June 29, 2009 (File No. 001-33162)) | |
| 10.54+ | * | Target Share Price Performance Units awarded to named executive officers on June 23, 2009 (incorporated by reference to Exhibit 99.2 to registrant’s Current Report filed on Form 8-K with the SEC on June 29, 2009 (File No. 001-33162)) | |
109
Table of Contents
| Exhibit No. |
Description of Exhibits | ||
| 10.55+ | * | Performance Compensation Plan as Amended and Restated Effective June 19, 2008 (incorporated by reference to Exhibit 10.1 to the registrant’s Quarterly Report filed on Form 10-Q with the SEC on July 10, 2009 (File No. 001-33162)) | |
| 10.56+ | * | Red Hat, Inc. 2010 Non-Employee Director Compensation Plan effective January 1, 2010 (incorporated by reference to Exhibit 10.1 to the registrant’s Quarterly Report filed on Form 10-Q with the SEC on October 5, 2009 (File No. 001-33162)) | |
| 10.57+ | * | Red Hat, Inc. Stock Ownership Policy for Directors and Senior Executives, dated as of March 1, 2010 (incorporated by reference to Exhibit 99.1 to the registrant’s Current Report filed on Form 8-K with the SEC on November 24, 2009 (File No. 001-33162)) | |
| 10.58* | Letter Agreement dated February 28, 2010 between Red Hat, Inc. and Matthew J. Szulik | ||
| 10.59* | Red Hat, Inc. 2010 Non-Employee Director Compensation Plan amended and restated effective March 1, 2010 | ||
| 21.1 | Subsidiaries of Red Hat, Inc. | ||
| 23.1 | Consent of PricewaterhouseCoopers LLP | ||
| 31.1 | Certification of the registrant’s Chief Executive Officer pursuant to Rule 13a-14(a)/Rule 15(d)-14(a) under the Securities Exchange Act of 1934, as amended, as adopted pursuant to Section 302 of the Sarbanes-Oxley Act of 2002 | ||
| 31.2 | Certification of the registrant’s Chief Financial Officer pursuant to Rule 13a-14(a)/Rule 15(d)-14(a) under the Securities Exchange Act of 1934, as amended, as adopted pursuant to Section 302 of the Sarbanes-Oxley Act of 2002 | ||
| 32.1 | Certification of the Principal Executive Officer and the Principal Financial Officer Pursuant to 18 U.S.C. Section 1350 | ||
| * | Indicates a management contract or compensatory plan, contract or arrangement. |
| + | Previously filed. |
| - | Indicates confidential treatment requested as to certain portions of this exhibit which have been filed separately with the SEC. |
110
Table of Contents
SIGNATURES
Pursuant to the requirements of Section 13 or 15(d) of the Securities Exchange Act of 1934, the registrant has duly caused this report to be signed on its behalf by the undersigned, thereunto duly authorized.
| RED HAT, INC. | ||
| By: | /S/ JAMES M. WHITEHURST | |
| James M. Whitehurst President and Chief Executive Officer | ||
Date: April 29, 2010
Pursuant to the requirements of the Securities Exchange Act of 1934, this report has been signed below by the following persons on behalf of the registrant and in the capacities and on the dates indicated.
| Signature |
Title |
Date | ||
| /S/ JAMES M. WHITEHURST James M. Whitehurst |
President, Chief Executive Officer and Director (principal executive officer) |
April 29, 2010 | ||
| /S/ CHARLES E. PETERS, JR. Charles E. Peters, Jr. |
Executive Vice President and Chief Financial Officer (principal financial officer) |
April 29, 2010 | ||
| /S/ MARK E. COOK Mark E. Cook |
Vice President Finance and Controller (principal accounting officer) |
April 29, 2010 | ||
| /S/ MICHELINE CHAU Micheline Chau |
Director |
April 29, 2010 | ||
| /S/ JEFFREY J. CLARKE Jeffrey J. Clarke |
Director |
April 29, 2010 | ||
| /S/ MARYE ANNE FOX Marye Anne Fox |
Director |
April 29, 2010 | ||
| /S/ NARENDRA K. GUPTA Narendra K. Gupta |
Director |
April 29, 2010 | ||
| /S/ WILLIAM S. KAISER William S. Kaiser |
Director |
April 29, 2010 | ||
| /S/ DONALD H. LIVINGSTONE Donald H. Livingstone |
Director |
April 29, 2010 | ||
| /S/ HENRY HUGH SHELTON Henry Hugh Shelton |
Director |
April 29, 2010 | ||
| /S/ MATTHEW J. SZULIK Matthew J. Szulik |
Chairman of the Board of Directors |
April 29, 2010 | ||
111
Table of Contents
Exhibit Index
| Exhibit |
Exhibit | |
| 10.58 | Letter Agreement dated February 28, 2010 between Red Hat, Inc. and Matthew J. Szulik | |
| 10.59 | Red Hat, Inc. 2010 Non-Employee Director Compensation Plan, amended and restated effective March 1, 2010 | |
| 21.1 | Subsidiaries of Red Hat, Inc. | |
| 23.1 | Consent of PricewaterhouseCoopers LLP | |
| 31.1 | Certification of the registrant’s Chief Executive Officer pursuant to Rule 13a-14(a)/Rule 15(d)-14(a) under the Securities Exchange Act of 1934, as amended, and adopted pursuant to Section 302 of the Sarbanes-Oxley Act of 2002 | |
| 31.2 | Certification of the registrant’s Chief Financial Officer pursuant to Rule 13a-14(a)/Rule 15(d)-14(a) under the Securities Exchange Act of 1934, as amended, and adopted pursuant to Section 302 of the Sarbanes-Oxley Act of 2002 | |
| 32.1 | Certification of the Principal Executive Officer and the Principal Financial Officer pursuant to 18 U.S.C. Section 1350 | |
112