Attached files
| file | filename |
|---|---|
| 8-K - 8-K - Steadfast Income REIT, Inc. | a8kestvaluepersharepresent.htm |
Steadfast Income REIT, Inc.
Valuation
and Portfolio Update
As of
December 31, 2016
Securities Distributed by Steadfast Capital Markets Group, LLC Member FINRA & SIPC
The information contained herein should be read in conjunction with, and is qualified by, the information in the Steadfast Income
REIT, Inc., Inc. ("Steadfast Income REIT” or the “Company”) Annual Report on Form 10-K for the year ended December 31,
2016, filed with the Securities and Commission Exchange (the "SEC") on March 16, 2017 (the "Annual Report"), including the
"Risk Factors” section contained in the Annual Report.
Forward-Looking Statements
Certain statements contained herein may be deemed to be forward-looking statements within the meaning of the Federal
Private Securities Litigation Reform Act of 1995. Steadfast Income REIT intends that such forward-looking statements be
subject to the sale harbors created by Section 27A of the Securities Act of 1933, as amended, and Section 21E of the Securities
Exchange Act of 1934, as amended. These statements include statements regarding the intent, belief or current expectations of
Steadfast Income REIT and members of its management team. as well as the assumptions on which such statements are
based, and generally are identified by the use of words such as "may," "will," "seeks," "anticipates, " "believes," "estimates,"
"expects," "plans," "intends," "should," or similar expressions. Readers are cautioned not to place undue reliance on these
forward-looking statements, which speak only as of the date they are made. Steadfast Income REIT undertakes no obligation to
update or revise forward-looking statements to reflect changed assumptions, the occurrence of unanticipated events or
changes to future operating results over time, unless required by law. Such statements are subject to known and unknown risks
and uncertainties which could cause actual results to differ materially from those contemplated by such forward-looking
statements. Steadfast Income REIT makes no representation or warranty (express or implied) about the accuracy of any such
forward-looking statements. These statements are based on a number of assumptions involving the judgment of management.
The appraisal methodology for Steadfast Income REIT's real estate properties was performed by CBRE Capital Advisors, Inc.,
an independent, third-party real estate valuation firm (“CBRE"). Even small changes to the assumptions used to determine the
estimated value per share could result in significant differences in the appraised values of Steadfast Income REIT's real estate
properties and the estimated value per share. Actual events may cause the value and returns on Steadfast Income REIT's
investments to be less than that used for purposes of Steadfast Income REIT's estimated value per share.
Forward-Looking Statements
2

Securities Distributed by Steadfast Capital Markets Group, LLC Member FINRA & SIPC
As of December 31, 2016
Total Capital Raised (including DRP): $775.4 Million
Total Acquisitions (Purchase Price): $1.64 Billion
Total Number of Assets: 65 Assets
Total Rental Units: 16,709
States: 11
Total Leverage (loan to value): 60.8%
Occupancy: 94%
Portfolio Overview
3
Securities Distributed by Steadfast Capital Markets Group, LLC Member FINRA & SIPC
Third-Party Valuation
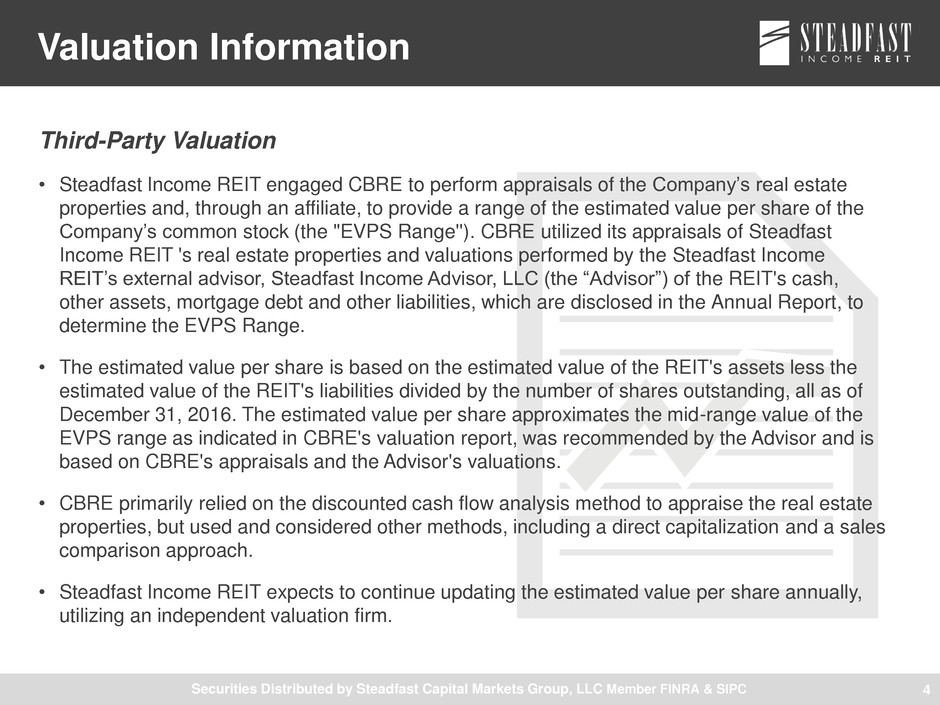
• Steadfast Income REIT engaged CBRE to perform appraisals of the Company’s real estate
properties and, through an affiliate, to provide a range of the estimated value per share of the
Company’s common stock (the "EVPS Range''). CBRE utilized its appraisals of Steadfast
Income REIT 's real estate properties and valuations performed by the Steadfast Income
REIT’s external advisor, Steadfast Income Advisor, LLC (the “Advisor”) of the REIT's cash,
other assets, mortgage debt and other liabilities, which are disclosed in the Annual Report, to
determine the EVPS Range.
• The estimated value per share is based on the estimated value of the REIT's assets less the
estimated value of the REIT's liabilities divided by the number of shares outstanding, all as of
December 31, 2016. The estimated value per share approximates the mid-range value of the
EVPS range as indicated in CBRE's valuation report, was recommended by the Advisor and is
based on CBRE's appraisals and the Advisor's valuations.
• CBRE primarily relied on the discounted cash flow analysis method to appraise the real estate
properties, but used and considered other methods, including a direct capitalization and a sales
comparison approach.
• Steadfast Income REIT expects to continue updating the estimated value per share annually,
utilizing an independent valuation firm.
Valuation Information
4

Securities Distributed by Steadfast Capital Markets Group, LLC Member FINRA & SIPC
Estimated $ Values as of December 31, 2016 and December 31, 2015
Valuation Summary
5
A
sset
s
Lia
b
ilitie
s
$1,988,400,000
$32,076,582
$34,533,491
$2,055,010,073
$1,118,126,231
$51,665,674
$8,278,117
$1,178,070,022
$876,940,051
Real Estate
Cash
Other Assets
Total Assets
Mortgage Debt
Other Liabilities
Incentive fee
Total Liabilities
Net Equity
Estimated Value
$2,014,340,000
$66,224,027
$65,175,883
$2,145,739,910
$1,197,015,105
$54,790,262
$6,540,119
$1,258,345,486
$887,394,424
As of 12/31/2016 As of 12/31/2015
Securities Distributed by Steadfast Capital Markets Group, LLC Member FINRA & SIPC
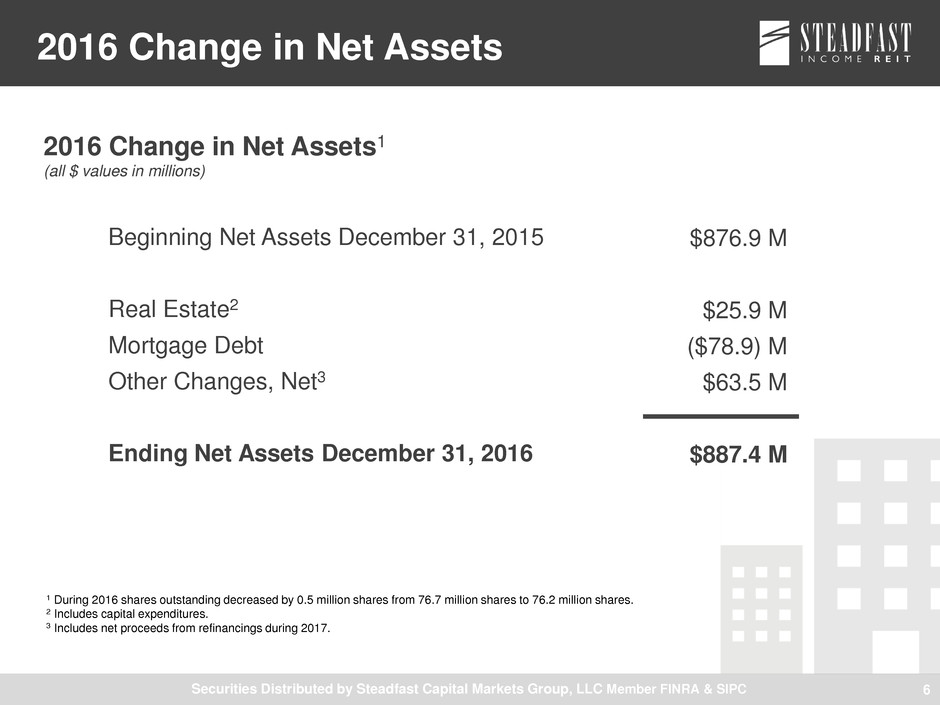
Beginning Net Assets December 31, 2015
Real Estate2
Mortgage Debt
Other Changes, Net3
Ending Net Assets December 31, 2016
2016 Change in Net Assets
6
1 During 2016 shares outstanding decreased by 0.5 million shares from 76.7 million shares to 76.2 million shares.
2 Includes capital expenditures.
3 Includes net proceeds from refinancings during 2017.
2016 Change in Net Assets1
(all $ values in millions)
$876.9 M
$25.9 M
($78.9) M
$63.5 M
$887.4 M
Securities Distributed by Steadfast Capital Markets Group, LLC Member FINRA & SIPC
Valuation History
• Primary initial public offering price: $10.00 per share (proceeds before
expenses assuming full commissions and fees are paid: $8.86)
• Estimated value per share as of March 31, 2012: $10.24
• The REIT ceased offering shares on December 20, 2013
• Estimated value per share as of December 31, 2014: $10.35
• Estimated value per share as of December 31, 2015: $11.44
• Estimated value per share as of December 31, 2016: $11.65
7
Securities Distributed by Steadfast Capital Markets Group, LLC Member FINRA & SIPC
• Distribution History:
• Average annual distributions per share from August 2010 when
distribution began to accrue through December 31, 2016:
$0.71/share on an annualized basis
• Cumulative distributions per share range from $2.21/share for late
investors to $4.57/share for early investors1
• Current annualized distribution amount of $0.72/share or an annual yield
of:
• 7.00% on shares purchased at $10.24
• 7.17% on shares purchased at $10.00
Distribution History & Current Yield
8
1 Early investor investment date is as of the beginning of the first month of distributions in August 2010 and late investor investment date is as of the beginning of
the last month of the public offering in December 2013.

Securities Distributed by Steadfast Capital Markets Group, LLC Member FINRA & SIPC
Steadfast Income REIT provides an estimated value per share to assist broker-dealers that participated in its public offerings in meeting their
customer account statement reporting obligations. This valuation was performed in accordance with the provisions of and comply with the
IPA Valuation Guidelines. As with any valuation methodology, the methodologies used are based upon a number of estimates and
assumptions that may not be accurate or complete. Different parties with different assumptions and estimates could derive a different
estimated value per share of Steadfast Income REIT's common stock, and this difference could be significant. The estimated value per
share is not audited and does not represent the fair value of the REIT's assets less the fair value of the REIT's liabilities according to GAAP.
Accordingly, with respect to the estimated value per share, Steadfast Income REIT can give no assurance that:
• a stockholder would be able to resell his or her shares at the estimated value per share;
• a stockholder would ultimately realize distributions per share equal to the Company’s estimated value per share upon liquidation
of the Company’s assets and settlement of its liabilities or a sale of the Company;
• the Company’s shares of common stock would trade at the estimated value per share on a national securities exchange;
• another independent third-party appraiser or third-party valuation firm would agree with the Company’s estimated value per
share; or
• the methodology used to determine the Company’s estimated value per share would be acceptable to FINRA or for compliance
with ERISA reporting requirements.
The estimated value per share as of December 31, 2016 is based on the estimated value of Steadfast Income REIT's assets less the
estimated value of the REIT's liabilities divided by the number of shares outstanding, all as of December 31, 2016. The value of Steadfast
Income REIT's shares will fluctuate over time in response to developments related to individual assets in its portfolio and the management of
those assets, in response to the real estate and finance markets and due to other factors. The estimated value per share does not reflect a
discount for the fact that Steadfast Income REIT is externally managed, nor does it reflect a real estate portfolio premium/discount versus the
sum of the individual property values. The estimated value per share also does not take into account estimated disposition costs and fees for
real estate properties, debt prepayment penalties that could apply upon the prepayment of certain of the REIT's debt obligations or the
impact of restrictions on the assumption of debt. Steadfast Income REIT currently expects to utilize an independent valuation firm to update
the estimated value per share as of December 31, 2017.
Stockholder Performance
9

Securities Distributed by Steadfast Capital Markets Group, LLC Member FINRA & SIPC
Stockholder Performance
Hypothetical Performance of Early and Late Investors
Estimated Value Per Share Plus Cumulative Distributions Per Share
Estimated Value Per Share As of
December 31, 2016
Cumulative Distributions Per Share
Received through December 31, 2016
Sum of Estimated Value Per Share
and Cumulative Distributions Per Share
Received through December 31, 2016
Early Investor: Invested When Distributions Began to Accrue
(August 2010)
$11.65 $4.57 $16.22
Late Investor: Invested at Close of Public Offering
(December 2013)
$11.65 $2.21 $13.86
10
Securities Distributed by Steadfast Capital Markets Group, LLC Member FINRA & SIPC
Stockholder Performance
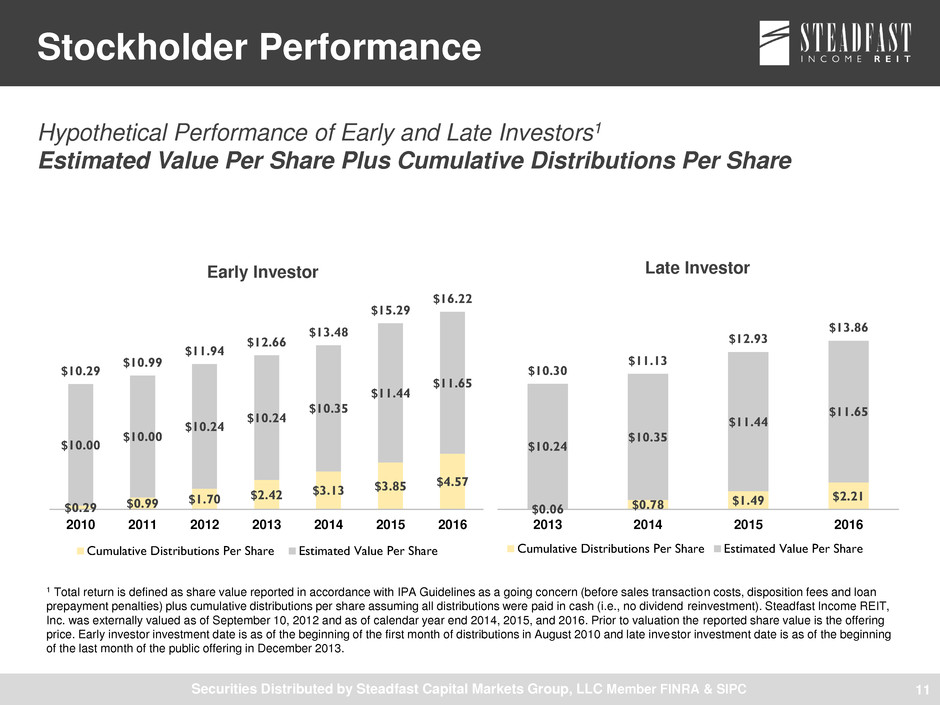
Hypothetical Performance of Early and Late Investors1
Estimated Value Per Share Plus Cumulative Distributions Per Share
11
1 Total return is defined as share value reported in accordance with IPA Guidelines as a going concern (before sales transaction costs, disposition fees and loan
prepayment penalties) plus cumulative distributions per share assuming all distributions were paid in cash (i.e., no dividend reinvestment). Steadfast Income REIT,
Inc. was externally valued as of September 10, 2012 and as of calendar year end 2014, 2015, and 2016. Prior to valuation the reported share value is the offering
price. Early investor investment date is as of the beginning of the first month of distributions in August 2010 and late investor investment date is as of the beginning
of the last month of the public offering in December 2013.
$0.29 $0.99
$1.70 $2.42
$3.13 $3.85
$4.57
$10.00
$10.00
$10.24
$10.24
$10.35
$11.44
$11.65
$10.29
$10.99
$11.94
$12.66
$13.48
$15.29
$16.22
2010 2011 2012 2013 2014 2015 2016
Early Investor
Cumulative Distributions Per Share Estimated Value Per Share
$0.06 $0.78
$1.49 $2.21
$10.24
$10.35
$11.44
$11.65
$10.30
$11.13
$12.93
$13.86
2013 2014 2015 2016
Late Investor
Cumulative Distributions Per Share Estimated Value Per Share
Securities Distributed by Steadfast Capital Markets Group, LLC Member FINRA & SIPC
2017 Goals & Objective
• Undertake renovations at certain assets to create additional
stockholder value
• Maintain portfolio occupancy
• Increase portfolio net cash flow
• Grow portfolio NAV
12
Securities Distributed by Steadfast Capital Markets Group, LLC Member FINRA & SIPC
Stockholder Communication
• 1099’s sent on January 26, 2017 showing 0% taxable distribution
• Account statements will reflect new estimated value per share of $11.65 beginning
with March 2017 statements mailed in April 2017
• Stockholder letter included with Annual Report will be mailed in April
explaining new estimated value per share
• Estimated value per share visible through DST will be updated to show new
estimated value
• While Steadfast cannot control reporting of custodians, we believe (based on
inquiries) they will report the new estimated value per share.
- It's possible that some custodians will take longer to report the estimated value per
share than others and also that some may first require reporting of the estimated
value per share from a third-party data provider.
13

Securities Distributed by Steadfast Capital Markets Group, LLC Member FINRA & SIPC
Thank you!
If you have any questions,
contact your financial advisor
or contact us at:
Steadfast Capital Markets Group, LLC
18100 Von Karman, Suite 500
Irvine, CA 92612
(877) 525-7264
14
