Attached files
| file | filename |
|---|---|
| EX-99.1 - EXHIBIT 99.1 - Steadfast Income REIT, Inc. | ex991cbreconsent.htm |
| EX-32.2 - EXHIBIT 32.2 - Steadfast Income REIT, Inc. | ex322-sir12312016.htm |
| EX-32.1 - EXHIBIT 32.1 - Steadfast Income REIT, Inc. | ex321-sir12312016.htm |
| EX-31.2 - EXHIBIT 31.2 - Steadfast Income REIT, Inc. | ex312-sir12312016.htm |
| EX-31.1 - EXHIBIT 31.1 - Steadfast Income REIT, Inc. | ex311-sir12312016.htm |
| EX-23.1 - EXHIBIT 23.1 - Steadfast Income REIT, Inc. | ex231-sir12312016.htm |
| EX-21 - EXHIBIT 21 - Steadfast Income REIT, Inc. | ex21-sir12312016.htm |
UNITED STATES
SECURITIES AND EXCHANGE COMMISSION
Washington, D.C. 20549
FORM 10-K
(Mark One)
þ | ANNUAL REPORT PURSUANT TO SECTION 13 OR 15(d) OF THE SECURITIES EXCHANGE ACT OF 1934 | |
For the fiscal year ended December 31, 2016
OR
o | TRANSITION REPORT PURSUANT TO SECTION 13 OR 15(d) OF THE SECURITIES EXCHANGE ACT OF 1934 | |
For the transition period from to | ||
Commission file number 000-54674
STEADFAST INCOME REIT, INC.
(Exact Name of Registrant as Specified in Its Charter)
Maryland | 27-0351641 | |
(State or Other Jurisdiction of | (I.R.S. Employer | |
Incorporation or Organization) | Identification No.) | |
18100 Von Karman Avenue, Suite 500 | ||
Irvine, California | 92612 | |
(Address of Principal Executive Offices) | (Zip Code) | |
(949) 852-0700
(Registrant’s Telephone Number, Including Area Code)
Securities registered pursuant to Section 12(b) of the Act:
None
Securities registered pursuant to Section 12(g) of the Act:
Common Stock, $0.01 par value per share
Indicate by check mark if the registrant is a well-known seasoned issuer, as defined in Rule 405 of the Securities Act. Yes o No þ
Indicate by check mark if the registrant is not required to file reports pursuant to Section 13 or 15(d) of the Act. Yes o No þ
Indicate by check mark whether the registrant: (1) has filed all reports required to be filed by Section 13 or 15(d) of the Securities Exchange Act of 1934 during the preceding 12 months (or for such shorter period that the registrant was required to file such reports), and (2) has been subject to such filing requirements for the past 90 days. Yes þ No o
Indicate by check mark whether the registrant has submitted electronically and posted on its corporate Web site, if any, every Interactive Data File required to be submitted and posted pursuant to Rule 405 of Regulation S-T during the preceding 12 months (or for such shorter period that the registrant was required to submit and post such files). Yes þ No o
Indicate by check mark if disclosure of delinquent filers pursuant to Item 405 of Regulation S-K is not contained herein, and will not be contained, to the best of the registrant’s knowledge, in definitive proxy or information statements incorporated by reference in Part III of this Form 10-K or any amendment to this Form 10-K. þ
Indicate by check mark whether the registrant is a large accelerated filer, an accelerated filer, a non-accelerated filer, or a smaller reporting company. See the definitions of “large accelerated filer,” “accelerated filer” and “smaller reporting company” in Rule 12b-2 of the Exchange Act. (Check one):
Large Accelerated filer o | Accelerated filer o | Non-Accelerated filer þ | Smaller reporting company o |
(Do not check if a smaller reporting company) | |||
Indicate by check mark whether the registrant is a shell company (as defined in Rule 12b-2 of the Exchange Act). Yes o No þ
There is no established market for the registrant’s shares of common stock. There were approximately 75,593,982 shares of common stock held by non-affiliates at June 30, 2016, the last business day of the registrant’s most recently completed second fiscal quarter, for an aggregate market value of $774,082,379, assuming a market value of $10.24 per share.
As of March 10, 2017, there were 76,011,185 shares of the Registrant’s common stock issued and outstanding.
STEADFAST INCOME REIT, INC.
INDEX
Page | ||
Cautionary Note Regarding Forward-Looking Statements | ||
CAUTIONARY NOTE REGARDING FORWARD-LOOKING STATEMENTS
Certain statements of Steadfast Income REIT, Inc. (“we,” “our,” “us” or the “Company”) included in this annual report on Form 10-K that are not historical facts (including any statements concerning investment objectives, other plans and objectives of management for future operations or economic performance, or assumptions or forecasts related thereto) are forward-looking statements within the meaning of Section 27A of the Securities Act of 1933, as amended, and Section 21E of the Securities Exchange Act of 1934, as amended. These statements are only predictions. We caution that forward-looking statements are not guarantees. Actual events or our investments and results of operations could differ materially from those expressed or implied in any forward-looking statements. Forward-looking statements are typically identified by the use of terms such as “may,” “should,” “expect,” “could,” “intend,” “plan,” “anticipate,” “estimate,” “believe,” “continue,” “predict,” “potential” or the negative of such terms and other comparable terminology.
The forward-looking statements included herein are based upon our current expectations, plans, estimates, assumptions and beliefs that involve numerous risks and uncertainties. Assumptions relating to the foregoing involve judgments with respect to, among other things, future economic, competitive and market conditions and future business decisions, all of which are difficult or impossible to predict accurately and many of which are beyond our control. Although we believe that the expectations reflected in such forward-looking statements are based on reasonable assumptions, our actual results and performance could differ materially from those set forth in the forward-looking statements. Factors that could have a material adverse effect on our operations and future prospects include, but are not limited to:
• | the fact that we have had a net loss for each quarterly and annual period since inception; |
• | changes in economic conditions generally and the real estate and debt markets specifically; |
• | our ability to secure resident leases at favorable rental rates; |
• | our ability to execute on our value-enhancement strategy; |
• | risks inherent in the real estate business, including tenant defaults, potential liability relating to environmental matters and the lack of liquidity of real estate investments; |
• | the fact we pay fees and expenses to our advisor and its affiliates that were not negotiated on an arm’s length basis and the fact that the payment of these fees and expenses increases the risk that our stockholders will not earn a profit on their investment in us; |
• | our ability to retain our executive officers and other key personnel of our advisor, our property manager and our affiliates; |
• | legislative or regulatory changes (including changes to the laws governing the taxation of real estate investment trusts, or REITs); |
• | our ability to generate sufficient cash flows to pay distributions to our stockholders; |
• | the availability of capital; |
• | changes in interest rates; and |
• | changes to U.S. generally accepted accounting principles, or GAAP. |
Any of the assumptions underlying forward-looking statements could be inaccurate. You are cautioned not to place undue reliance on any forward-looking statements included in this annual report. All forward-looking statements are made as of the date of this annual report and the risk that actual results will differ materially from the expectations expressed in this annual report will increase with the passage of time. Except as otherwise required by the federal securities laws, we undertake no obligation to publicly update or revise any forward-looking statements after the date of this annual report, whether as a result of new information, future events, changed circumstances or any other reason. In light of the significant uncertainties inherent in the forward-looking statements included in this annual report, including, without limitation, the risks described under “Risk Factors,” the inclusion of such forward-looking statements should not be regarded as a representation by us or any other person that the objectives and plans set forth in this annual report will be achieved.
i
PART I
ITEM 1. | BUSINESS |
Overview
Steadfast Income REIT, Inc. (which is referred to in this annual report, as the context requires, as the “Company,” “we,” “us” or “our”) was formed on May 4, 2009, as a Maryland corporation that has elected to qualify as a real estate investment trust, or REIT. We have invested in and manage a diverse portfolio of real estate investments, primarily in the multifamily sector, located throughout the United States. Substantially all of our business is conducted through Steadfast Income REIT Operating Partnership, L.P., a Delaware limited partnership formed on July 6, 2009, which we refer to as our “operating partnership.” We are the sole general partner of our operating partnership. As of December 31, 2016, we owned 65 multifamily properties comprised of a total of 16,709 apartment homes and 25,973 square feet of rentable commercial space. For more information on our real estate portfolio, see “—Our Real Estate Portfolio” below.
On July 19, 2010, we commenced our initial public offering of up to 150,000,000 shares of common stock and up to 15,789,474 shares of common stock pursuant to our distribution reinvestment plan. Upon termination of our initial public offering on December 20, 2013, we had sold 73,608,337 shares of common stock for gross offering proceeds of $745,389,748, including 1,588,289 shares of common stock issued pursuant to our distribution reinvestment plan for gross offering proceeds of $15,397,232. Following the termination of our initial public offering, we continued to offer shares of our common stock pursuant to our distribution reinvestment plan until our board of directors determined to suspend our distribution reinvestment plan, effective December 1, 2014. On March 10, 2015, our board of directors determined an estimated value per share of our common stock of $10.35 as of December 31, 2014. On February 25, 2016, our board of directors determined an estimated value per share of our common stock of $11.44 as of December 31, 2015. On February 15, 2017, our board of directors determined an estimated value per share of our common stock of $11.65 as of December 31, 2016. See Item 5. “Market for Registrant’s Common Equity, Related Stockholder Matters and Purchase of Equity Securities—Market Information—Estimated Value Per Share” for further information regarding the estimated value per share.
Prior to the commencement of our public offering, we sold shares of our common stock in a private offering exempt from the registration requirements of the Securities Act of 1933, as amended, or the Securities Act. Upon termination of the private offering, we had sold 637,279 shares of common stock at $9.40 per share (subject to certain discounts) for net offering proceeds of $5,844,325.
We are externally managed by Steadfast Income Advisor, LLC, which we refer to as our “advisor,” pursuant to the Advisory Agreement, as amended, or the advisory agreement, by and among us, our operating partnership and our advisor. Subject to certain restrictions and limitations, our advisor manages our day-to-day operations and our portfolio of properties and real estate-related assets. Our advisor sources and presents investment opportunities to our board of directors and provides investment management services on our behalf. We retained our affiliate Steadfast Capital Markets Group, LLC, which we refer to as our “dealer manager,” to serve as the dealer manager for our initial public offering. The dealer manager was responsible for marketing our shares of common stock being offered pursuant to our initial public offering. The advisor, along with the dealer manager, also provides marketing, investor relations and other administrative services on our behalf.
1
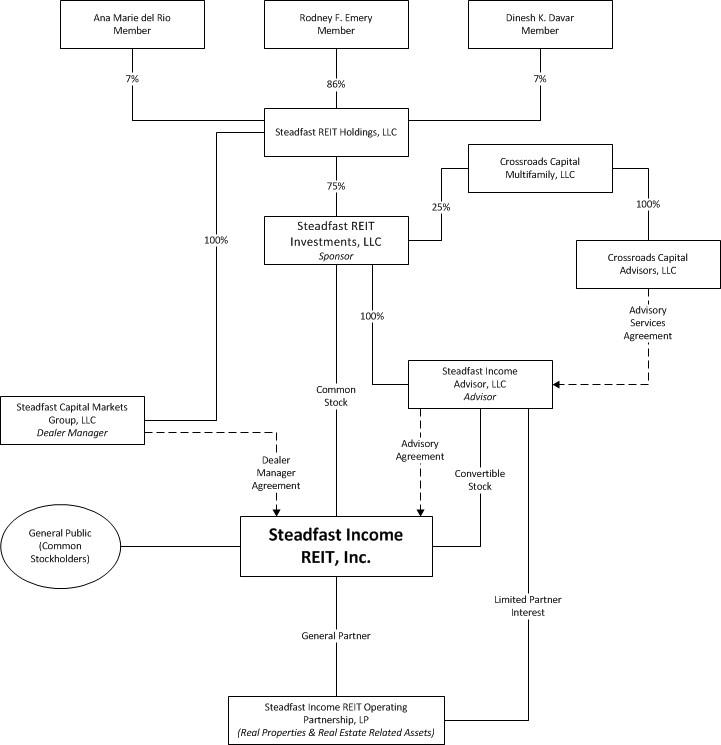
Our Structure
The chart below shows the relationships among our company and various affiliates.
2
Objectives and Strategies
Our primary investment objectives are to:
• | preserve, protect and return invested capital; |
• | pay attractive and stable cash distributions to stockholders; and |
• | realize capital appreciation in the value of our investments over the long term. |
We intend to use the cash flows from our operations to continue to invest in our real estate investments located throughout the United States. We have acquired, and actively manage, stabilized and income-producing properties with the objective of providing a stable and secure source of income for our stockholders and maximizing potential returns upon disposition of our assets through capital appreciation. We may make these investments directly or through joint ventures, in each case provided that the underlying real estate or real estate-related asset generally meets our criteria for direct investment.
2016 Highlights
During 2016, we:
• | invested $28,268,601 in improvements to our real estate investments of 65 multifamily properties; |
• | paid cash distributions of $54,871,173, which constituted a 7.0% annualized distribution rate to our stockholders based on a purchase price of $10.24 per share; |
• | generated cash flows from operations of $54,259,420; |
• | generated net operating income of $113,675,575; |
• | generated funds from operations of $43,933,833 (for further information on how we calculate funds from operations and a reconciliation of funds from operations to net loss, please refer to Item 7. “Management’s Discussion and Analysis of Financial Condition and Results of Operations—Funds From Operations and Modified Funds From Operations”); |
• | generated modified funds from operations of $49,117,817 (for further information on how we calculate modified funds from operations and a reconciliation of modified funds from operations to net loss, please refer to Item 7. “Management’s Discussion and Analysis of Financial Condition and Results of Operations—Funds From Operations and Modified Funds From Operations”); |
• | received proceeds of $106,106,830, net of principal payments of $545,151,047 and deferred financing costs of $5,489,473, related to the Refinancing Transactions (for further information on the Refinancing Transactions, please refer to Item 7. “Management’s Discussion and Analysis of Financial Condition and Results of Operations—Liquidity and Capital Resources); and |
• | generated a net loss of $25,579,651. |
Plan of Liquidation
Pursuant to our Third Articles of Amendment and Restatement, or the charter, our board of directors is required to determine whether to pursue a liquidity event by December 31, 2016. In the event that the board of directors does not determine to pursue a liquidity event by December 31, 2016, the board of directors must adopt a resolution declaring that a proposed liquidation of us was advisable on substantially the terms and conditions set forth in the resolution, or the Plan of Liquidation, and direct that the proposed Plan of Liquidation be submitted for consideration at either an annual or special meeting of the stockholders. The adoption of a Plan of Liquidation and the submission to the stockholders could be postponed if a majority of directors, including a majority of independent directors, determined that a liquidation was not then in the best interest of the stockholders. On November 8, 2016, our board of directors, including a majority of the independent directors, determined that a liquidation is not in the best interests of the stockholders at this time, and, therefore, to postpone presenting a liquidation decision to stockholders. In accordance with our charter, the board of directors will reconsider whether to seek stockholder approval of our liquidation at least annually. The board of directors, pursuant to its fiduciary duties, continuously evaluates opportunities, including possible liquidation events, of us.
3
Our Real Estate Portfolio
As of December 31, 2016, we owned the 65 multifamily properties described below.
Property Name | Location | Number of Units | Average Monthly Occupancy(1) | Average Monthly Rent(2) | Purchase Date | Contract Purchase Price(3) | Mortgage Debt Outstanding | ||||||||||||||||
1 | Park Place Condominiums | Des Moines, IA | 151 | 86.8 | % | $ | 846 | 12/22/2010 | $ | 8,323,400 | $ | 4,684,651 | |||||||||||
2 | Clarion Park Apartments(4) | Olathe, KS | 220 | 89.5 | % | 815 | 6/28/2011 | 11,215,000 | 8,136,274 | ||||||||||||||
3 | Cooper Creek Village | Louisville, KY | 123 | 91.9 | % | 947 | 8/24/2011 | 10,420,000 | 6,224,663 | ||||||||||||||
4 | Truman Farm Villas(5) | Grandview, MO | 200 | 97.5 | % | 724 | 12/22/2011 | 9,100,000 | 5,465,173 | ||||||||||||||
5 | EBT Lofts | Kansas City, MO | 102 | 93.1 | % | 1,035 | 12/30/2011 | 8,575,000 | 5,167,644 | ||||||||||||||
6 | Windsor on the River | Cedar Rapids, IA | 424 | 89.9 | % | 722 | 1/26/2012 | 33,000,000 | 22,650,962 | ||||||||||||||
7 | Renaissance St. Andrews | Louisville, KY | 216 | 90.7 | % | 698 | 2/17/2012 | 12,500,000 | 8,509,637 | ||||||||||||||
8 | Spring Creek of Edmond | Edmond, OK | 252 | 93.7 | % | 869 | 3/9/2012 | 19,350,000 | 12,854,648 | ||||||||||||||
9 | Montclair Parc Apartments | Oklahoma City, OK | 360 | 91.9 | % | 866 | 4/26/2012 | 35,750,000 | 22,770,672 | ||||||||||||||
10 | Sonoma Grande Apartments | Tulsa, OK | 336 | 94.0 | % | 922 | 5/24/2012 | 32,200,000 | 21,372,685 | ||||||||||||||
11 | Estancia Apartments | Tulsa, OK | 294 | 92.5 | % | 940 | 6/29/2012 | 27,900,000 | 20,738,073 | ||||||||||||||
12 | Montelena Apartments | Round Rock, TX | 232 | 93.1 | % | 1,097 | 7/13/2012 | 18,350,000 | 11,617,425 | ||||||||||||||
13 | Valley Farms Apartments | Louisville, KY | 160 | 94.4 | % | 895 | 8/30/2012 | 15,100,000 | 9,580,194 | ||||||||||||||
14 | Hilliard Park Apartments | Columbus, OH | 201 | 96.5 | % | 1,047 | 9/11/2012 | 19,800,000 | 12,935,281 | ||||||||||||||
15 | Sycamore Terrace Apartments | Terre Haute, IN | 250 | 93.6 | % | 1,134 | 9/20/2012 & 3/5/2014 | 23,174,157 | 17,794,863 | ||||||||||||||
16 | Hilliard Summit Apartments | Columbus, OH | 208 | 93.3 | % | 1,205 | 9/28/2012 | 24,100,000 | 15,710,108 | ||||||||||||||
17 | Springmarc Apartments | San Marcos, TX | 240 | 93.3 | % | 966 | 10/19/2012 | 21,850,000 | 14,478,724 | ||||||||||||||
18 | Renaissance at St. Andrews Condominiums(6) | Louisville, KY | 30 | 93.3 | % | 779 | 10/31/2012 | 1,423,000 | — | ||||||||||||||
19 | Ashley Oaks Apartments | San Antonio, TX | 462 | 97.0 | % | 818 | 11/29/2012 | 30,790,000 | 24,599,195 | ||||||||||||||
20 | Arrowhead Apartments | Palatine, IL | 200 | 89.5 | % | 1,050 | 11/30/2012 | 16,750,000 | 11,780,189 | ||||||||||||||
21 | The Moorings Apartments | Roselle, IL | 216 | 93.5 | % | 1,129 | 11/30/2012 | 20,250,000 | 14,240,269 | ||||||||||||||
22 | Forty-57 Apartments | Lexington, KY | 436 | 94.7 | % | 919 | 12/20/2012 | 52,500,000 | 37,031,543 | ||||||||||||||
23 | Keystone Farms Apartments | Nashville, TN | 90 | 95.6 | % | 1,254 | 12/28/2012 | 8,400,000 | 5,838,649 | ||||||||||||||
24 | Riverford Crossing Apartments | Frankfort, KY | 300 | 93.7 | % | 872 | 12/28/2012 | 30,000,000 | 21,047,995 | ||||||||||||||
25 | Valley Farms North(7) | Louisville, KY | 128 | 93.0 | % | 989 | 12/28/2012 | 14,607,032 | 9,670,974 | ||||||||||||||
4
Property Name | Location | Number of Units | Average Monthly Occupancy(1) | Average Monthly Rent(2) | Purchase Date | Contract Purchase Price(3) | Mortgage Debt Outstanding | ||||||||||||||||
26 | Montecito Apartments | Austin, TX | 268 | 91.4 | % | $ | 940 | 12/31/2012 | $ | 19,000,000 | $ | 13,398,273 | |||||||||||
27 | Hilliard Grand Apartments | Dublin, OH | 314 | 93.0 | % | 1,235 | 12/31/2012 | 40,500,000 | 29,112,914 | ||||||||||||||
28 | The Hills at Fair Oaks | Fair Oaks Ranch, TX | 288 | 94.8 | % | 1,003 | 1/31/2013 | 34,560,000 | 23,877,008 | ||||||||||||||
29 | Library Lofts East(8) | Kansas City, MO | 118 | 94.1 | % | 1,048 | 2/28/2013 | 12,750,000 | 8,517,144 | ||||||||||||||
30 | The Trails at Buda Ranch | Buda, TX | 264 | 97.0 | % | 1,058 | 3/28/2013 | 23,000,000 | 20,793,446 | ||||||||||||||
31 | Deep Deuce at Bricktown | Oklahoma City, OK | 294 | 92.2 | % | 1,287 | 3/28/2013 | 38,220,000 | 25,019,201 | ||||||||||||||
32 | Deer Valley Apartments | Lake Bluff, IL | 224 | 94.6 | % | 1,290 | 4/30/2013 | 28,600,000 | 22,796,336 | ||||||||||||||
33 | Grayson Ridge | North Richland Hills, TX | 240 | 96.3 | % | 872 | 5/31/2013 | 14,300,000 | 13,873,891 | ||||||||||||||
34 | Rosemont at Olmos Park | San Antonio, TX | 144 | 97.2 | % | 1,265 | 5/31/2013 | 22,050,000 | 14,113,839 | ||||||||||||||
35 | Retreat at Quail North | Oklahoma City, OK | 240 | 92.9 | % | 949 | 6/12/2013 | 25,250,000 | 16,686,497 | ||||||||||||||
36 | The Lodge at Trails Edge | Indianapolis, IN | 268 | 96.3 | % | 727 | 6/18/2013 | 18,400,000 | 12,053,618 | ||||||||||||||
37 | Arbors at Carrollton | Carrollton, TX | 131 | 96.9 | % | 957 | 7/3/2013 | 8,800,000 | 5,970,787 | ||||||||||||||
38 | Waterford on the Meadow | Plano, TX | 350 | 93.7 | % | 989 | 7/3/2013 | 23,100,000 | 15,850,173 | ||||||||||||||
39 | The Belmont | Grand Prairie, TX | 260 | 94.6 | % | 887 | 7/26/2013 | 12,100,000 | 8,817,677 | ||||||||||||||
40 | Meritage at Steiner Ranch(9) | Austin, TX | 502 | 91.2 | % | 1,414 | 8/6/2013 | 80,000,000 | 58,137,072 | ||||||||||||||
41 | Tapestry Park Apartments | Birmingham, AL | 354 | 94.6 | % | 1,278 | 8/13/2013 & 12/1/2014 | 50,285,000 | 43,595,145 | ||||||||||||||
42 | Dawntree Apartments | Carrollton, TX | 400 | 95.3 | % | 928 | 8/15/2013 | 24,000,000 | 15,138,014 | ||||||||||||||
43 | Stuart Hall Lofts(10) | Kansas City, MO | 115 | 91.3 | % | 1,287 | 8/27/2013 | 16,850,000 | 15,968,742 | ||||||||||||||
44 | BriceGrove Park Apartments | Canal Winchester, OH | 240 | 95.0 | % | 858 | 8/29/2013 | 20,100,000 | 17,072,164 | ||||||||||||||
45 | Retreat at Hamburg Place | Lexington, KY | 150 | 96.0 | % | 1,010 | 9/5/2013 | 16,300,000 | 12,031,675 | ||||||||||||||
46 | Cantare at Indian Lake Village | Hendersonville, TN | 206 | 94.7 | % | 1,116 | 9/24/2013 | 29,000,000 | 28,090,912 | ||||||||||||||
47 | Landing at Mansfield | Mansfield, TX | 336 | 95.8 | % | 1,027 | 9/27/2013 | 30,900,000 | 27,151,099 | ||||||||||||||
48 | The Heights Apartments | Houston, TX | 504 | 91.5 | % | 907 | 9/30/2013 | 37,000,000 | 38,211,186 | ||||||||||||||
49 | Villas at Huffmeister | Houston, TX | 294 | 91.2 | % | 1,168 | 10/10/2013 | 37,600,000 | 27,136,015 | ||||||||||||||
50 | Villas at Kingwood | Kingwood, TX | 330 | 91.5 | % | 1,221 | 10/10/2013 | 40,150,000 | 35,269,793 | ||||||||||||||
51 | Waterford Place at Riata Ranch | Cypress, TX | 228 | 91.2 | % | 1,077 | 10/10/2013 | 23,400,000 | 17,251,113 | ||||||||||||||
52 | Carrington Place | Houston, TX | 324 | 92.3 | % | 1,035 | 11/7/2013 | 32,900,000 | 27,260,883 | ||||||||||||||
5
Property Name | Location | Number of Units | Average Monthly Occupancy(1) | Average Monthly Rent(2) | Purchase Date | Contract Purchase Price(3) | Mortgage Debt Outstanding | ||||||||||||||||
53 | Carrington at Champion Forest | Houston, TX | 284 | 93.7 | % | $ | 1,066 | 11/7/2013 | $ | 33,000,000 | $ | 24,861,504 | |||||||||||
54 | Carrington Park at Huffmeister | Cypress, TX | 232 | 95.3 | % | 1,147 | 11/7/2013 | 25,150,000 | 20,204,368 | ||||||||||||||
55 | Willow Crossing | Elk Grove, IL | 579 | 93.1 | % | 1,111 | 11/20/2013 | 58,000,000 | 57,611,490 | ||||||||||||||
56 | Echo at Katy Ranch | Katy, TX | 260 | 93.1 | % | 1,373 | 12/19/2013 | 35,100,000 | — | ||||||||||||||
57 | Heritage Grand at Sienna Plantation | Missouri City, TX | 240 | 94.6 | % | 1,144 | 12/20/2013 | 27,000,000 | 17,245,125 | ||||||||||||||
58 | Audubon Park | Nashville, TN | 256 | 90.6 | % | 903 | 12/27/2013 | 16,750,000 | 16,338,651 | ||||||||||||||
59 | Mallard Crossing | Loveland, OH | 350 | 94.3 | % | 1,066 | 12/27/2013 | 39,800,000 | 33,488,573 | ||||||||||||||
60 | Renaissance at Carol Stream | Carol Stream, IL | 293 | 92.2 | % | 1,006 | 12/31/2013 | 29,150,000 | 23,028,160 | ||||||||||||||
61 | Reserve at Creekside | Chattanooga, TN | 192 | 91.7 | % | 927 | 3/28/2014 | 18,875,000 | 14,190,376 | ||||||||||||||
62 | Mapleshade Park | Dallas, TX | 148 | 97.3 | % | 1,629 | 3/31/2014 | 23,325,000 | 19,235,309 | ||||||||||||||
63 | Richland Falls(11) | Murfreesboro, TN | 276 | 94.6 | % | 1,028 | 5/16/2014 | 30,904,744 | 20,137,110 | ||||||||||||||
64 | Oak Crossing | Fort Wayne, IN | 222 | 94.1 | % | 992 | 6/3/2014 | 24,230,000 | 17,644,671 | ||||||||||||||
65 | Park Shore | St. Charles, IL | 160 | 95.6 | % | 1,189 | 9/12/2014 | 18,350,000 | 15,635,835 | ||||||||||||||
16,709 | 93.5 | % | $ | 1,026 | $ | 1,644,177,333 | $ | 1,217,716,280 | |||||||||||||||
________________
(1) | At December 31, 2016, our portfolio was approximately 95.4% leased. As of December 31, 2016, no single tenant accounted for greater than 10% of our 2016 gross annualized rental revenues. |
(2) | Average monthly rent is based upon the effective rental income after considering the effect of vacancies, concessions and write-offs. |
(3) | The contract purchase price is comprised of the purchase price upon acquisition and the development and construction costs of apartment homes we constructed, as applicable. |
(4) | 100% of the units are required to be rented to tenants earning no more than 60% of the median income in the local area. |
(5) | Approximately 74% of the units are required to be rented to tenants earning no more than 60% of the median income in the local area. |
(6) | Renaissance at St. Andrews Condominiums, initially comprised of 29 apartment homes, was acquired by us on October 31, 2012. On May 20, 2016, we acquired one additional unit at the Renaissance at St. Andrews Condominiums community for a purchase price of $48,000. |
(7) | Valley Farms North, initially comprised of 32 apartment homes and entitled for an additional 224 apartment homes, was acquired by us on December 28, 2012. During 2014, construction began on an additional 96 of the entitled 224 apartment homes at Valley Farms North. During 2015, all 96 additional apartment homes were completed and available to be leased. |
(8) | Library Lofts East contains 16,680 rentable square feet of commercial space. As of December 31, 2016, the commercial space, which represents approximately 14.1% of the rentable square feet of Library Lofts East, was 100% |
6
occupied by two tenants. The lease terms of the two tenants occupying the commercial space expire between 2019 and 2025. The tenants pay an average annual rent of $192,998, or approximately $11.57 per square foot.
(9) | Meritage at Steiner Ranch contains 4,843 rentable square feet of commercial space. As of December 31, 2016, the commercial space, which represents approximately 0.6% of the rentable square feet of Meritage at Steiner Ranch, was not occupied. |
(10) | Stuart Hall Lofts contains 4,450 rentable square feet of commercial space. As of December 31, 2016, the commercial space, which represents approximately 3.1% of the rentable square feet of Stuart Hall Lofts, was 100% occupied by one tenant. The lease term of the tenant occupying the commercial space expires in 2019. The tenant pays an average annual rent of $64,863, or approximately $14.58 per square foot. |
(11) | Richland Falls was acquired by us on May 16, 2014 and includes improved land that is zoned for an additional 86 apartment homes. During 2015, construction began on an additional 86 apartment homes at Richland Falls, all of which were completed and available to be leased as of December 31, 2016. |
At December 31, 2016, our portfolio was approximately 93.5% occupied and the average monthly rent per leased multifamily home in our portfolio was $1,026. The weighted-average remaining lease term of our portfolio is less than one year. The weighted-average remaining lease term of our commercial office space leases is 3.66 years.
We plan to invest approximately $3.5 million during the year ended December 31, 2017 for interior renovations at certain properties in our portfolio. These renovations are primarily to enhance the interior amenities of the apartment homes and will be performed initially on vacant units and thereafter on units vacated during the ordinary course of business.
The following information generally applies to all our properties:
• | we believe all of our properties are adequately covered by insurance and are suitable for their intended purposes; |
• | except as noted above, we have no plans for any material renovations, improvements or developments with respect to any of our properties; and |
• | our properties face competition in attracting new residents and retaining current residents from other multifamily properties in and around their respective submarkets. |
Debt Policy
We have used, and intend to use in the future, secured and unsecured debt as a means of providing additional funds for the acquisition, development or renovation of our properties and our real estate-related assets. We believe that careful use of debt helps us achieve our diversification goals and potentially enhance the returns on our investments. At the conclusion of our initial public offering, our debt was approximately 65% of the aggregate cost of our real properties (before deducting depreciation and amortization) plus the value of our other investments. Going forward, we expect that our debt will be approximately 65% of the value of our properties, as determined by an independent third-party appraiser or qualified independent valuation expert. At December 31, 2016, our debt was approximately 61% of the value of our properties, as determined by an independent third-party appraiser. Under our charter, we are prohibited from borrowing in excess of 300% of our net assets, which generally approximates to 75% of the aggregate cost of our assets. We may borrow in excess of this amount if such excess is approved by a majority of the independent directors and disclosed to stockholders in our next quarterly report, along with a justification for such excess. In such event, we will monitor our debt levels and take action to reduce any such excess as soon as practicable. Our aggregate borrowings are reviewed by our board of directors at least quarterly. At December 31, 2016, our borrowings were not in excess of 300% of the value of our net assets.
Employees
We have no paid employees. The employees of our advisor or its affiliates provide management, acquisition, advisory and certain administrative services for us.
7
Competition
We are subject to significant competition in seeking real estate investments and residents. We compete with many third parties engaged in real estate investment activities, including other REITs, specialty finance companies, savings and loan associations, banks, mortgage bankers, insurance companies, mutual funds, institutional investors, investment banking firms, lenders, hedge funds, governmental bodies and other entities. Many of our competitors have substantially greater financial and other resources than we have and may have substantially more operating experience than us. They also may enjoy significant competitive advantages that result from, among other things, a lower cost of capital.
We may also compete with Steadfast Apartment REIT, Inc., or Steadfast Apartment REIT, and Steadfast Apartment REIT III, Inc., or Steadfast Apartment REIT III, non-traded REITs sponsored by our sponsor that commenced their ongoing initial public offerings in December 2013 and February 2016, respectively, and have similar investment strategies as us. However, we expect any competition with Steadfast Apartment REIT or Steadfast Apartment REIT III for property acquisitions to be limited as our initial public offering terminated on December 20, 2013 and we have deployed all of the net offering proceeds raised in our initial public offering. Additionally, Steadfast Apartment REIT terminated its initial public offering on March 24, 2016, and has deployed all of its net offering proceeds raised in its initial public offering.
The multifamily property market in particular is highly competitive. This competition could reduce occupancy levels and revenues at our multifamily properties, which would adversely affect our operations. We face competition from many sources, including from other multifamily properties both in the immediate vicinity and the geographic market where our multifamily properties are and will be located. In addition, overbuilding of multifamily properties may occur, which would increase the number of multifamily homes available and may decrease occupancy and unit rental rates. Furthermore, multifamily properties we acquire most likely compete, or will compete, with numerous housing alternatives in attracting residents, including owner occupied single- and multifamily homes available to rent or purchase. Competitive housing in a particular area and the increasing affordability of owner occupied single- and multifamily homes available to rent or buy (caused by declining mortgage interest rates and government programs to promote home ownership) could adversely affect our ability to retain our residents, lease apartment homes and increase or maintain rental rates.
Regulations
Our investments are subject to various federal, state, and local laws, ordinances, and regulations, including, among other things, zoning regulations, land use controls, environmental controls relating to air and water quality, noise pollution, and indirect environmental impacts such as increased motor vehicle activity. We believe that we have all permits and approvals necessary under current law to operate our investments.
Income Taxes
We have elected to be taxed as a REIT under the Internal Revenue Code of 1986, as amended, or the Internal Revenue Code, and have operated as such beginning with the taxable year ended December 31, 2010. To qualify as a REIT, we must meet certain organizational and operational requirements, including a requirement to distribute at least 90% of our annual REIT taxable income to stockholders (which is computed without regard to the dividends paid deduction or net capital gain and which does not necessarily equal net income as calculated in accordance with GAAP). As a REIT, we generally will not be subject to federal income tax to the extent we distribute qualifying dividends to our stockholders. If we fail to qualify as a REIT in any taxable year, we will be subject to federal income tax on our taxable income at regular corporate income tax rates and generally will not be permitted to qualify for treatment as a REIT for federal income tax purposes for the four taxable years following the year during which qualification is lost, unless the Internal Revenue Service grants us relief under certain statutory provisions.
Financial Information About Industry Segments
Our current business consists of owning, managing, operating, leasing, acquiring, developing, investing in, and disposing of real estate assets. We internally evaluate all of our real estate assets as one industry segment, and, accordingly, we do not report segment information.
8
Available Information
We are subject to the reporting requirements of the Securities Exchange Act of 1934, as amended, or the Exchange Act, and, as a result, file periodic reports, proxy statements and other information with the Securities and Exchange Commission, or the SEC. Access to copies of our Annual Reports on Form 10-K, Quarterly Reports on Form 10-Q, Current Reports on Form 8-K, proxy statements and other filings with the SEC, including amendments to such filings, may be obtained free of charge from our website, http://www.steadfastreits.com. These filings are available promptly after we file them with, or furnish them to, the SEC. We are not incorporating our website or any information from the website into this annual report. The SEC also maintains a website, http://www.sec.gov, that contains our Annual Reports on Form 10-K, Quarterly Reports on Form 10-Q, Current Report on Form 8-K, proxy statements and other filings with the SEC. Access to these filings is free of charge.
ITEM 1A. | RISK FACTORS |
The following are some of the risks and uncertainties that could cause our actual results to differ materially from those presented in our forward-looking statements. The risks and uncertainties described below are not the only ones we face but do represent those risks and uncertainties that we believe are material to us. Additional risks and uncertainties not presently known to us or that we currently deem immaterial may also harm our business. References to “shares” and “our common stock” refer to the shares of common stock of Steadfast Income REIT, Inc.
General Investment Risks
From inception through December 31, 2016, we have experienced annual net losses and may experience similar losses in the future.
From inception through December 31, 2016, we incurred a net loss of $148,998,676. We cannot assure you that we will be profitable in the future or that we will recognize growth in the value of our assets.
There is no public trading market for shares of our common stock and we are not required to effectuate a liquidity event by a certain date. As a result, it will be difficult for you to sell your shares of common stock and, if you are able to sell your shares, you are likely to sell them at a substantial discount.
There is no current public market for the shares of our common stock and we have no obligation to list our shares on any public securities market or provide any other type of liquidity to our stockholders by a particular date. It may therefore be difficult for you to sell your shares of common stock. Even if you are able to sell your shares of common stock, the absence of a public market may cause the price received for any shares of our common stock sold to be less than what you paid or less than your proportionate value of the assets we own. We initially adopted a share repurchase program that allowed stockholders to sell to us their shares of common stock, subject to certain limitations. However, our share repurchase program was suspended effective November 20, 2014. We subsequently reinstated our share repurchase program effective July 1, 2015, subject to certain limitations. Our board of directors may again in the future, amend, suspend, or terminate our share repurchase program upon 30 days notice. Additionally, our charter does not require that we consummate a transaction to provide liquidity to stockholders on any date certain. As a result, you must be prepared to hold your shares for an indefinite period of time.
We have paid a significant portion of our distributions to date from the proceeds of our public offering and cannot guarantee in the future that we will pay distributions solely from cash flow from operations. To the extent that we pay distributions from sources other than our cash flow from operations, we will have less funds available for investments, the overall returns to our stockholders may be reduced and subsequent stockholders will experience dilution.
Our organizational documents permit us to pay distributions from any source, including offering proceeds or borrowings (both of which may constitute a return of capital). From inception through the date of this annual report, a significant portion of distributions paid to our stockholders were funded from offering proceeds from our public offering. Of the $54,871,173 in total distributions we paid during the year ended December 31, 2016, 7.0% of such amounts were funded from sources other than cash flow from operations. To the extent we had funded distributions from the net proceeds of our public offering, we had less funds available for investment in real properties and real estate-related assets than if our distributions came solely from cash
9
flow from operations, the overall returns to our stockholders may be reduced and subsequent investors will experience dilution. There is no limit on the amount of distributions we may fund from sources other than from cash flows from operations.
If the aggregate amount of cash we distribute to stockholders in any given year exceeds the amount of our earnings and profits generated during the year, the excess amount will either be (1) a return of capital or (2) a gain from the sale or exchange of property to the extent that a stockholder’s basis in our common stock equals or is reduced to zero as the result of our current or prior year distributions.
We face risks associated with the acquisition and value-enhancement of properties.
We regularly acquire and renovate existing properties (which we refer to as “value-enhancement projects”). These activities are subject to various risks. We may not be successful in pursuing value-enhancement project opportunities. In addition, completed value-enhancement projects may not perform as well as expected. We are subject to other risks in connection with any acquisition and value-enhancement activities, including the following:
• | costs of a project may be higher than projected, potentially making the project unfeasible or unprofitable; |
• | we may not have funds available or be able to obtain financing for our value-enhancement projects on favorable terms, if at all; |
• | occupancy rates and rents may not meet our projections and that project may not be profitable. |
If a value-enhancement project is unsuccessful, either because it is not meeting our expectations when operational or was not completed according to the value-enhancement project planning, the value of our investment in the project may decrease.
Disruptions in the financial markets and deteriorating economic conditions could adversely impact our ability to implement our investment strategy and achieve our investment objectives.
U.S. and global financial markets have experienced extreme volatility and disruption in recent years. There was a widespread tightening in overall credit markets, devaluation of the assets underlying certain financial contracts and increased borrowing by governmental entities. This turmoil in the capital markets resulted in constrained equity and debt capital available for investment in the real estate market, resulting in fewer buyers seeking to acquire real properties, increases in capitalization rates and lower property values. Recently, capital has been more available and the overall economy improved. However, the failure of a sustained economic recovery or future disruptions in the financial markets and deteriorating economic conditions could impact the value of our investments in properties. In addition, if potential purchasers of real properties have difficulty obtaining capital to finance property acquisitions, capitalization rates could increase and property values could decrease. Current economic conditions greatly increase the risks of our investments. See “—Risks Related to Investments in Real Estate.”
Recently enacted and potential financial regulatory reforms could have a significant impact on our business, financial condition and results of operations.
On July 21, 2010, President Barack Obama signed the Dodd-Frank Wall Street Reform and Consumer Protection Act, or the Dodd-Frank Act, into law. The Dodd-Frank Act represents a significant change in the American financial regulatory environment and impacts nearly every aspect of the United States financial services industry. The Dodd-Frank Act requires various federal agencies to adopt hundreds of new rules to implement the Dodd-Frank Act and to deliver to Congress numerous studies and reports that may influence future legislation. The Dodd-Frank Act leaves significant discretion to federal agencies as to exactly how to implement the broad provisions of the Dodd-Frank Act. Some provisions of the Dodd-Frank Act have not been completely implemented and future implementation is uncertain in light of the transition of power in the U.S. federal government following the 2016 election. The changes resulting from the Dodd-Frank Act may impact the profitability of business activities, require changes to certain business practices, impose more stringent capital, liquidity and leverage requirements or otherwise adversely affect our business.
Further, we may be required to invest significant management attention and resources to evaluate and make any changes necessary to comply with new statutory and regulatory requirements under the Dodd-Frank Act, which may negatively impact results of operations and our financial condition.
10
The geographic concentration of our portfolio may make us particularly susceptible to adverse economic developments in the real estate markets of those areas.
In addition to general, regional and national economic conditions, our operating results are impacted by the economic conditions of the specific markets in which we have concentrations of properties. As of December 31, 2016, of our $1,644,177,333 of real estate assets, 41.2% was located in Texas, including 17.7% located in the Houston metropolitan area, 9.9% located in the Austin metropolitan area, 8.3% located in the Dallas/Fort Worth metropolitan area and 5.3% located in the San Antonio metropolitan area. Additionally, 10.4% of our real estate assets were located in the Chicago metropolitan area. Any adverse economic or real estate developments in these markets, such as business layoffs or downsizing, industry slowdowns, relocations of businesses, changing demographics and other factors, or any decrease in demand for multifamily property space resulting from the local business climate, could adversely affect our property revenue, and hence net operating income.
Non-traded REITs have been the subject of increased scrutiny by regulators and media outlets resulting from inquiries and investigations initiated by the Financial Industry Regulatory Authority, Inc., or FINRA, and the SEC. We could also become the subject of scrutiny and may face difficulties in raising capital should negative perceptions develop regarding non-traded REITs. As a result, we may be unable to raise substantial funds which will limit the number and type of investments we may make and our ability to diversify our assets.
Our securities, like other non-traded REITs, were sold through the independent broker-dealer channel (i.e., U.S. broker-dealers that are not affiliated with money center banks or similar financial institutions). Governmental and self-regulatory organizations like the SEC and FINRA impose and enforce regulations on broker-dealers, investment banking firms, investment advisers and similar financial services companies. Self-regulatory organizations such as FINRA adopt rules, subject to approval by the SEC, that govern aspects of the financial services industry and conduct periodic examinations of the operations of registered investment dealers and broker-dealers.
Recently, FINRA has initiated investigations of broker-dealers with respect to the sales practices related to the sale of shares of non-traded REITS. These proceedings have resulted in increased regulatory scrutiny from the SEC regarding non-traded REITs. As a result of this increased scrutiny and accompanying negative publicity and coverage by media outlets, FINRA may impose additional restrictions on sales practices in the independent broker-dealer channel for non-traded REITs, and accordingly we may face increased difficulties in raising capital in the future. This could result in a reduction in the returns achieved on those investments as a result of a smaller capital base limiting our investments. If we become the subject of scrutiny, even if we have complied with all applicable laws and regulations, responding to such scrutiny could be expensive and distracting our management.
FINRA has also recently adopted changes to rules relating to information required to be included on customer account statements by registered broker dealers. In order to assist broker dealers in complying with the new rules, we are required to obtain independent valuations of our assets to determine an estimated per share value of our common stock more frequently than under prior regulations. Compliance with these new rules and future rule changes by FINRA could increase our operating expenses which could have an adverse effect on our results of operations.
A cybersecurity incident and other technology disruptions could negatively impact our business.
We use technology in substantially all aspects of our business operations. We also use mobile devices, social networking, outside vendors and other online activities to connect with our residents, suppliers and employees of our affiliates. Such uses give rise to potential cybersecurity risks, including security breach, espionage, system disruption, theft and inadvertent release of information. Our business involves the storage and transmission of numerous classes of sensitive and confidential information and intellectual property, including residents’ and suppliers’ personal information, private information about employees of our affiliates, and financial and strategic information about us. If we fail to assess and identify cybersecurity risks associated with our operations, we may become increasingly vulnerable to such risks. Additionally, the measures we have implemented to prevent security breaches and cyber incidents may not be effective. The theft, destruction, loss, misappropriation, or release of sensitive and/or confidential information or intellectual property, or interference with our information technology systems or the technology systems of third parties on which we rely, could result in business disruption, negative publicity, brand damage, violation of privacy laws, loss of residents, potential liability and competitive disadvantage, any of which could result in a material adverse effect on our financial condition or results of operations.
11
Our board of directors determined an estimated value per share of $11.65 for shares of our common stock as of December 31, 2016. You should not rely on the estimated value per share as being an accurate measure of the current value of our shares of common stock.
On February 15, 2017, our board of directors determined an estimated value per share of our common stock of $11.65 as of December 31, 2016. Our board of directors’ objective in determining the estimated value per share was to arrive at a value, based on the most recent data available, that it believed was reasonable based on methodologies that it deemed appropriate after consultation with our advisor. However, the market for commercial real estate can fluctuate quickly and substantially and the value of our assets is expected to change in the future and may decrease. Also, our board of directors did not consider certain other factors, such as a liquidity discount to reflect the fact that our shares are not currently traded on a national securities exchange and the limitations on the ability to redeem shares pursuant to our share repurchase program.
As with any valuation methodology, the methodologies used to determine the estimated value per share were based upon a number of assumptions, estimates and judgments that may not be accurate or complete. Our assets have been valued based upon appraisal standards and the value of our assets using these methodologies are not required to be a reflection of market value under those standards and will not result in a reflection of fair value under GAAP. Further, different parties using different property-specific and general real estate and capital market assumptions, estimates, judgments and standards could derive a different estimated value per share, which could be significantly different from the estimated value per share determined by our board of directors. The estimated value per share does not represent the fair value of our assets less liabilities in accordance with GAAP as of December 31, 2016. The estimated value per share is not a representation or indication that: a stockholder would be able to realize the estimated value per share if he or she attempts to sell shares; a stockholder would ultimately realize distributions per share equal to the estimated value per share upon liquidation of assets and settlement of our liabilities or upon a sale of our company; shares of our common stock would trade at the estimated value per share on a national securities exchange; a third party would offer the estimated value per share in an arms-length transaction to purchase all or substantially all of our shares of common stock; or the methodologies used to estimate the value per share would be acceptable to FINRA or the Employee Retirement Income Security Act of 1974, or ERISA, with respect to their respective requirements. Further, the estimated value per share was calculated as of a moment in time and the value of our shares will fluctuate over time as a result of, among other things, future acquisitions or dispositions of assets (including acquisitions and dispositions of real estate investments since December 31, 2016), developments related to individual assets and changes in the real estate and capital markets.
The actual value of shares that we repurchase under our share repurchase program may be substantially less than what we pay.
We adopted a share repurchase program through which shares may be repurchased at varying prices depending on (1) the number of years the shares have been held, (2) the purchase price paid for the shares and (3) whether the redemptions are sought upon a stockholder’s death or disability. Effective November 20, 2014, our board of directors suspended our share repurchase program. Effective July 1, 2015, our board of directors reinstated our share repurchase program, subject to certain limitations. The repurchase price is likely to differ from the price at which a stockholder could resell his or her shares. If the actual value of the shares that we repurchase is less than the repurchase price, the repurchase could be dilutive to our remaining stockholders. Even at lower repurchase prices, the actual value of the shares may be substantially less than what we pay and the repurchase may be dilutive to our remaining stockholders.
Because our charter does not require our listing or liquidation by a specified date, you should be prepared to hold our shares for an indefinite period of time.
Under our charter, if we had not determined to pursue a liquidity event by December 31, 2016, our charter required that we either (1) seek stockholder approval of our liquidation or (2) postpone presenting the liquidation decision to our stockholders if a majority of our board of directors, including a majority of the independent directors, determined that liquidation was not then in the best interests of our stockholders. If a majority of our board of directors, including a majority of the independent directors, determined that liquidation was not then in the best interests of our stockholders, our charter requires our board of directors to reconsider whether to seek stockholder approval of our liquidation at least annually. On November 8, 2016, our board of directors, including a majority of the independent directors, determined that a liquidation is not in the best interests of the stockholders at this time and, therefore, to postpone presenting a liquidation decision to stockholders. In accordance with our charter, the board of directors will reconsider whether to seek stockholder approval of our liquidation at least annually. The
12
board of directors, pursuant to its fiduciary duties, continuously evaluates opportunities, including possible liquidation events, of us.
Further postponement of a liquidity event or stockholder action regarding liquidation would only be permitted if a majority of our board of directors, including a majority of the independent directors, again determined that liquidation would not be in the best interests of our stockholders. If we sought and failed to obtain stockholder approval of our liquidation, our charter would not require us to consummate our liquidation and would not require our board of directors to reconsider whether to seek stockholder approval of our liquidation. There is no guarantee as to when our board of directors will pursue a liquidity event or submit a liquidation decision to our stockholders, if at all, and you should therefore be prepared to hold our shares for an indefinite period of time.
Payment of fees to our advisor and its affiliates reduces cash available for investment, which may result in our stockholders not receiving a full return of their invested capital.
Because a portion of the offering proceeds from the sale of our shares and cash flow generated from our operations were used to pay fees and expenses to our advisor and its affiliates, the amount of cash available for investments in real properties and real estate-related assets was reduced. As a result, stockholders will only receive a full return of their invested capital if we either: (1) sell our assets or our company for a sufficient amount in excess of the original purchase price of our assets or (2) the market value of our company after we list our shares of common stock on a national securities exchange is substantially in excess of the original purchase price of our assets.
If we internalize our management functions, your interest in us could be diluted and we could incur other significant costs associated with being self-managed.
Our board of directors may decide in the future to internalize our management functions. If we do so, we may elect to negotiate to acquire our advisor’s assets and personnel. At this time, we cannot anticipate the form or amount of consideration or other terms relating to any such acquisition. Such consideration could take many forms, including cash payments, promissory notes and shares of our common stock. The payment of such consideration could result in dilution of your interests as a stockholder and could have an adverse effect on our financial condition and ability to make distributions to our stockholders.
Additionally, while we would no longer bear the costs of the various fees and expenses we expect to pay to our advisor under the advisory agreement, our direct expenses would include general and administrative costs, including legal, accounting and other expenses related to corporate governance, SEC reporting and compliance. We would also be required to employ personnel and would be subject to potential liabilities commonly faced by employers, such as workers disability and compensation claims, potential labor disputes and other employee-related liabilities and grievances as well as incur the compensation and benefits costs of our officers and other employees and consultants that will be paid by our advisor or its affiliates. We may issue equity awards to officers, employees and consultants, which awards would decrease net income and funds from operations and may further dilute your investment. We cannot reasonably estimate the amount of fees to our advisor we would save or the costs we would incur if we became self-managed. If the expenses we assume as a result of an internalization are higher than the expenses we avoid paying to our advisor, our funds from operations would be lower as a result of the internalization than they otherwise would have been, potentially decreasing the amount of funds available to distribute to our stockholders.
Internalization transactions involving the acquisition of advisors have also, in some cases, been the subject of litigation. Even if these claims are without merit, we could be forced to spend significant amounts of money defending claims which would reduce the amount of funds available for us to invest or to pay distributions.
You are limited in your ability to have your shares of common stock repurchased pursuant to our share repurchase program. You may not be able to sell any of your shares of our common stock back to us, and if you do sell your shares, you may not receive the price you paid upon subscription.
Our share repurchase program may provide you with an opportunity to have your shares of common stock repurchased by us. We anticipate that shares of our common stock may be repurchased on a quarterly basis. No shares may be repurchased under our share repurchase program until after the first anniversary of the date of purchase of such shares. Prior to the first determination of our estimated value per share following the completion of our offering stage, we repurchased shares of our
13
common stock pursuant to our share repurchase program at a discount from the purchase price based upon how long such shares have been held. Notwithstanding the foregoing, following the first determination of our estimated value per share following the completion of our offering stage, shares of our common stock are repurchased at a price equal to a price based upon our estimated value per share as of our most recent appraisal.
Our share repurchase program contains certain restrictions and limitations, including those relating to the number of shares of our common stock that we can repurchase at any given time and limiting the repurchase price. Specifically, the share repurchase program limits the number of shares to be repurchased (1) during any calendar year to no more than 5.0% of the weighted average number of shares of our common stock outstanding in the prior calendar year and (2) effective July 1, 2015, in no event shall the value of the shares repurchased pursuant to the share repurchase program exceed $2,000,000 during the quarter beginning July 1, 2015, with each subsequent quarter not to exceed $1,000,000. On August 9, 2016, the Company’s board of directors approved and authorized an increase to the value of the shares that may be repurchased pursuant to the share repurchase program from $1,000,000 to $2,000,000, effective on the October 2016 repurchase date. Further, we have no obligation to repurchase shares if the repurchase would violate the restrictions on distributions under Maryland law, which prohibits distributions that would cause a corporation to fail to meet statutory tests of solvency. Our board of directors reserves the right to reject any repurchase request for any reason or no reason or to amend or terminate the share repurchase program at any time upon 30 days notice to our stockholders. Therefore, you may not have the opportunity to make a repurchase request prior to a potential termination of the share repurchase program and you may not be able to sell any of your shares of common stock back to us. Moreover, if you do sell your shares of common stock back to us pursuant to the share repurchase program, you may be forced to do so at a discount to the purchase price you paid for your shares.
Our success is dependent on the performance of our advisor and its affiliates.
Our ability to achieve our investment objectives and to pay distributions is dependent upon the performance of our advisor and its affiliates. Our advisor and its affiliates are sensitive to trends in the general economy, as well as the commercial real estate and credit markets. The recent economic recession and accompanying credit crisis negatively impacted the value of commercial real estate assets, contributing to a general slow down in the real estate industry. The failure to achieve a sustained economic recovery or renewed economic downturn could result in continued reductions in overall transaction volume and size of sales and leasing activities that our advisor and its affiliates have recently experienced, and would continue to put downward pressure on our advisor’s and its affiliates’ revenues and operating results. To the extent that any decline in revenues and operating results impacts the performance of our advisor and its affiliates, our financial condition and ability to pay distributions to our stockholders could also suffer.
Additionally, our advisor relies primarily on the fees it receives pursuant to the advisory agreement and capital from our sponsor to fund its operations and liabilities. If our advisor has insufficient cash from operations to meet its obligations under the advisory agreement and is unable to obtain financing, we would be adversely impacted.
Events in U.S. financial markets have had, and may continue to have, a negative impact on the terms and availability of credit and the overall national economy, which could have an adverse effect on our business and our results of operations.
The failure of large U.S. financial institutions in 2008 and the resulting turmoil in the U.S. financial sector has had a negative impact on the terms and availability of credit and the state of the economy generally within the United States. The tightening of the U.S. credit markets resulted in a lack of adequate credit. Some lenders continue to impose more stringent restrictions on the terms of credit, including shorter terms and more conservative loan-to-value underwriting than was previously customary. The negative impact of the tightening of the credit markets may limit our ability to finance the acquisition of properties and other real estate-related assets on favorable terms, if at all, and may result in increased financing costs or financing with increasingly restrictive covenants.
Additionally, decreasing home prices and mortgage defaults may again result in uncertainty in the real estate and real estate securities and debt markets. Until recently, the market for new issuances of commercial mortgage-backed securities, or CMBS, had been significantly reduced as a result of the recent turmoil in the financial markets and banks generally are providing limited debt financing with more stringent conditions for investments in real estate-related assets. As a result, the valuation of real estate-related assets has been volatile and is likely to continue to be volatile in the future. The volatility in markets may make it more difficult for us to obtain adequate financing or realize gains on our investments which could have an adverse effect on our business and our results of operations.
14
We are uncertain of our sources for funding our future capital needs. If we do not have sufficient funds from operations to cover our expenses, repay maturing debt obligations or to fund improvements to our real estate and cannot obtain debt or equity financing on acceptable terms, our ability to cover our expenses, repay maturing debt obligations or to fund improvements to our real estate may be adversely affected.
We terminated our initial public offering on December 20, 2013. In the event that we develop a need for additional capital in the future for the repayment of maturing debt obligations, the improvement of our real properties or for any other reason, sources of funding may not be available to us. If we do not have sufficient funds from cash flow generated by our investments or out of net sale proceeds, or cannot obtain debt or equity financing on acceptable terms, our financial condition and ability to make distributions may be adversely affected.
If we cease to retain our advisor or one of its affiliates to perform substantial advisory services for us, we may be required to cease to conduct business under or use the name “Steadfast” or any derivative thereof.
Pursuant to the terms of the advisory agreement, if we cease to retain our advisor or one of its affiliates to perform substantial advisory services for us, we are required, upon receipt of written request from our advisor, to cease to conduct business under or use the name “Steadfast” or any derivative thereof and to change our name and the names of our subsidiaries to a name that does not contain the word “Steadfast” or any other word or words that might, in the reasonable discretion of our advisor, indicate some form of relationship between us and our advisor or its affiliates. If we are required to cease to conduct business under or use the name “Steadfast” or any derivative thereof, it could have an adverse effect on our ability to achieve our investment objectives.
Risks Relating to Our Organizational Structure
Maryland law and our organizational documents limit your right to bring claims against our officers and directors.
Maryland law provides that a director will not have any liability as a director so long as he or she performs his or her duties in accordance with the applicable standard of conduct. In addition, our charter provides that, subject to the applicable limitations set forth therein or under Maryland law, no director or officer will be liable to us or our stockholders for monetary damages. Our charter also provides that we will generally indemnify our directors, our officers, our advisor and its affiliates for losses they may incur by reason of their service in those capacities unless their act or omission was material to the matter giving rise to the proceeding and was committed in bad faith or was the result of active and deliberate dishonesty, they actually received an improper personal benefit in money, property or services or, in the case of any criminal proceeding, they had reasonable cause to believe the act or omission was unlawful. Moreover, we have entered into separate indemnification agreements with each of our directors and executive officers. As a result, we and our stockholders may have more limited rights against these persons than might otherwise exist under common law. In addition, we may be obligated to fund the defense costs incurred by these persons. However, our charter provides that we may not indemnify our directors, our advisor and its affiliates for loss or liability suffered by them or hold our directors or our advisor and its affiliates harmless for loss or liability suffered by us unless they have determined that the course of conduct that caused the loss or liability was in our best interests, they were acting on our behalf or performing services for us, the liability was not the result of negligence or misconduct by our non-independent directors, our advisor and its affiliates or gross negligence or willful misconduct by our independent directors, and the indemnification or agreement to hold harmless is recoverable only out of our net assets, including the proceeds of insurance, and not from the stockholders. As a result of these limitations on liability and indemnification provisions and agreements, we and our stockholders may be entitled to a more limited right of action than we would otherwise have if indemnification rights were not granted.
The limit on the percentage of shares of our common stock that any person may own may discourage a takeover or business combination that may benefit our stockholders.
Our charter restricts the direct or indirect ownership by one person or entity to no more than 9.8% of the value of our then outstanding capital stock (which includes common stock and any preferred stock we may issue) and no more than 9.8% of the value or number of shares, whichever is more restrictive, of our then outstanding common stock unless exempted by our board of directors. These restrictions may discourage a change of control of us and may deter individuals or entities from making tender offers for shares of our common stock on terms that might be financially attractive to stockholders or which may cause a
15
change in our management. In addition to deterring potential transactions that may be favorable to our stockholders, these provisions may also decrease your ability to sell your shares of our common stock.
We may issue preferred stock or other classes of common stock, which issuance could adversely affect the holders of our common stock.
Investors in our common stock do not have preemptive rights to any shares issued by us in the future. We may issue, without stockholder approval, preferred stock or other classes of common stock with rights that could dilute the value of your shares of common stock. However, the issuance of preferred stock must also be approved by a majority of our independent directors not otherwise interested in the transaction, who will have access, at our expense, to our legal counsel or to independent legal counsel. The issuance of preferred stock or other classes of common stock may increase the number of stockholders entitled to distributions without simultaneously increasing the size of our asset base. Under our charter, we have authority to issue a total of 1,100,000,000 shares of capital stock, of which 999,999,000 shares are designated as common stock with a par value of $0.01 per share, 100,000,000 shares are designated as preferred stock with a par value of $0.01 per share, and 1,000 shares are designated as convertible stock with a par value of $0.01 per share. Our board of directors, with the approval of a majority of the entire board of directors and without any action by our stockholders, may amend our charter from time to time to increase or decrease the aggregate number of shares of capital stock or the number of shares of capital stock of any class or series that we have authority to issue. If we ever created and issued preferred stock with a distribution preference over common stock, payment of any distribution preferences of outstanding preferred stock would reduce the amount of funds available for the payment of distributions on our common stock. Further, holders of preferred stock are normally entitled to receive a preference payment in the event we liquidate, dissolve or wind up before any payment is made to our common stockholders, likely reducing the amount common stockholders would otherwise receive upon such an occurrence. In addition, under certain circumstances, the issuance of preferred stock or a separate class or series of common stock may render more difficult or tend to discourage a merger, tender offer or proxy contest, the assumption of control by a holder of a large block of our securities, or the removal of incumbent management.
Your investment will be diluted upon conversion of the convertible stock.
We have issued 1,000 shares of our convertible stock to our advisor. Under limited circumstances, each outstanding share of our convertible stock may be converted into shares of our common stock, which will have a dilutive effect to our stockholders. Our convertible stock will be converted into shares of common stock if (1) we have made total distributions on the then outstanding shares of our common stock equal to the price paid for those shares plus an 8.0% cumulative, non-compounded, annual return on that price, (2) we list our common stock for trading on a national securities exchange or enter into a merger whereby holders of our common stock receive listed securities of another issuer or (3) our advisory agreement is terminated or not renewed (other than for “cause” as defined in our advisory agreement). Upon any of these events, each share of convertible stock will be converted into a number of shares of common stock equal to 1/1000 of the quotient of (A) 10% of the amount, if any, by which (i) our “enterprise value” plus the aggregate value of the distributions paid to date on the then outstanding shares exceeds (ii) the aggregate purchase price paid by stockholders for those outstanding shares plus an 8.0% cumulative, non-compounded, annual return on the original issue price of the shares, divided by (B) our enterprise value divided by the number of outstanding shares of our common stock on an as-converted basis as of the date of conversion. In the event of a termination or non-renewal of our advisory agreement for cause, the convertible stock will be redeemed by us for $1.00. Upon the issuance of our common stock in connection with the conversion of our convertible stock, your interests in us will be diluted.
We grant stock-based awards to our directors and may in the future grant such awards to our advisor’s employees and consultants pursuant to our long-term incentive plan, which will have a dilutive effect on your investment in us.
We have adopted a long-term incentive plan pursuant to which we are authorized to grant restricted stock, stock options, stock appreciation rights, restricted or deferred stock units, performance awards, dividend equivalents or other stock-based awards to directors, our advisor’s employees and consultants selected by our board of directors for participation in the plan. As of December 31, 2016, we have issued an aggregate of 86,500 shares of restricted stock to our independent directors pursuant to this plan. If we issue additional stock-based awards to eligible participants under our long-term incentive plan, the issuance of these stock-based awards will dilute your investment in our shares of common stock.
16
Certain features of our long-term incentive plan could have a dilutive effect on your investment in us, including (1) a lack of annual award limits, individually or in the aggregate (subject to the limit on the maximum number of shares which may be issued pursuant to awards granted under the plan), (2) the fact that the limit on the maximum number of shares which may be issued pursuant to awards granted under the plan is not tied to the amount of proceeds raised in the offering and (3) share counting procedures which provide that shares subject to certain awards, including, without limitation, substitute awards granted by us to employees of another entity in connection with our merger or consolidation with such company or shares subject to outstanding awards of another company assumed by us in connection with our merger or consolidation with such company, are not subject to the limit on the maximum number of shares which may be issued pursuant to awards granted under the plan.
The conversion of the convertible stock held by our advisor due upon termination of the advisory agreement and the voting rights granted to the holder of our convertible stock, may discourage a takeover attempt or prevent us from effecting a merger that otherwise would have been in the best interests of our stockholders.
If we engage in a merger in which we are not the surviving entity or our advisory agreement is terminated without cause, our advisor may be entitled to conversion of the shares of our convertible stock it holds and to require that we purchase all or a portion of the limited partnership interests in our operating partnership that it holds at any time thereafter for cash or our common stock. The existence of this convertible stock may deter a prospective acquirer from bidding on our company, which may limit the opportunity for stockholders to receive a premium for their stock that might otherwise exist if an investor attempted to acquire us through a merger.
The affirmative vote of two-thirds of the outstanding shares of convertible stock, voting as a single class, will be required (1) for any amendment, alteration or repeal of any provision of our charter that materially and adversely changes the rights of the convertible stock and (2) to effect a merger of our company into another entity, or a merger of another entity into our company, unless in each case each share of convertible stock (A) will remain outstanding without a material and adverse change to its terms and rights or (B) will be converted into or exchanged for shares of stock or other ownership interest of the surviving entity having rights identical to that of our convertible stock. In the event that we propose to merge with or into another entity, including another REIT, our advisor could, by exercising these voting rights, determine whether or not we are able to complete the proposed transaction. By voting against a proposed merger, our advisor could prevent us from effecting the merger, even if the merger otherwise would have been in the best interests of our stockholders.
Our UPREIT structure may result in potential conflicts of interest with limited partners in our operating partnership whose interests may not be aligned with those of our stockholders.
Limited partners in our operating partnership have the right to vote on certain amendments to the operating partnership agreement, as well as on certain other matters. Persons holding such voting rights may exercise them in a manner that conflicts with the interests of our stockholders. As general partner of our operating partnership, we are obligated to act in a manner that is in the best interest of all partners of our operating partnership. Circumstances may arise in the future when the interests of limited partners in our operating partnership may conflict with the interests of our stockholders. These conflicts may be resolved in a manner stockholders do not believe are in their best interest.
We may change our targeted investments and investment guidelines without stockholder consent.
Our board of directors may change our targeted investments and investment guidelines at any time without the consent of our stockholders, which could result in our making investments that are different from, and possibly riskier than, the investments described in this prospectus. A change in our targeted investments or investment guidelines may increase our exposure to interest rate risk, default risk and real estate market fluctuations, all of which could adversely affect the value of our common stock and our ability to make distributions to you.
Your investment return may be reduced if we are required to register as an investment company under the Investment Company Act of 1940, as amended, or the Investment Company Act; if we are subject to registration under the Investment Company Act, we will not be able to continue our business.
Neither we, our operating partnership or any of our subsidiaries intend to register as an investment company under the Investment Company Act. Our operating partnership’s and subsidiaries’ investments in real estate will represent the substantial majority of our total asset mix. In order for us not to be subject to regulation under the Investment Company Act, we engage, t
17
hrough our operating partnership and our wholly and majority owned subsidiaries, primarily in the business of buying real estate. These investments must be made within a year after our public offering ends.
We expect that most of our assets will be held through wholly-owned or majority-owned subsidiaries of our operating partnership. We expect that most of these subsidiaries will be outside the definition of an “investment company” under Section 3(a)(1) of the Investment Company Act as they are generally expected to hold at least 60% of their assets in real property. Section 3(a)(1)(A) of the Investment Company Act defines an investment company as any issuer that is or holds itself out as being engaged primarily in the business of investing, reinvesting or trading in securities. Section 3(a)(1)(C) of the Investment Company Act defines an investment company as any issuer that is engaged or proposes to engage in the business of investing, reinvesting, owning, holding or trading in securities and owns or proposes to acquire investment securities having a value exceeding 40% of the value of the issuer’s total assets (exclusive of U.S. government securities and cash items) on an unconsolidated basis, which we refer to as the “40% test.” Excluded from the term “investment securities,” among other things, are U.S. government securities and securities issued by majority-owned subsidiaries that are not themselves investment companies and are not relying on the exception from the definition of investment company set forth in Section 3(c)(1) or Section 3(c)(7) of the Investment Company Act.
We believe that we, our operating partnership and most of the subsidiaries of our operating partnership will not fall within either definition of investment company under Section 3(a)(1) of the Investment Company Act as we intend to invest primarily in real property, through our wholly or majority-owned subsidiaries, the majority of which we expect to have at least 60% of their assets in real property. As these subsidiaries would be investing either solely or primarily in real property, they would be outside of the definition of “investment company” under Section 3(a)(1) of the Investment Company Act. We are organized as a holding company that conducts its businesses primarily through our operating partnership, which in turn is a holding company conducting its business through its subsidiaries. Both we and our operating partnership intend to conduct our operations so that they comply with the 40% test. We will monitor our holdings to ensure continuing and ongoing compliance with this test. In addition, we believe that neither we nor our operating partnership will be considered an investment company under Section 3(a)(1)(A) of the Investment Company Act because neither we nor our operating partnership will engage primarily or hold itself out as being engaged primarily in the business of investing, reinvesting or trading in securities. Rather, through our operating partnership’s wholly owned or majority owned subsidiaries, we and our operating partnership will be primarily engaged in the non-investment company businesses of these subsidiaries, namely the business of purchasing or otherwise acquiring real property.
In the event that the value of investment securities held by a subsidiary of our operating partnership were to exceed 40% of the value of its total assets, we expect that subsidiary to be able to rely on the exclusion from the definition of “investment company” provided by Section 3(c)(5)(C) of the Investment Company Act. Section 3(c)(5)(C), as interpreted by the staff of the SEC, requires each of our subsidiaries relying on this exception to invest at least 55% of its portfolio in “mortgage and other liens on and interests in real estate,” which we refer to as “qualifying real estate assets,” and maintain at least 80% of its assets in qualifying real estate assets or other real estate-related assets. The remaining 20% of the portfolio can consist of miscellaneous assets. What we buy and sell is therefore limited by these criteria. How we determine to classify our assets for purposes of the Investment Company Act will be based in large measure upon no-action letters issued by the SEC staff in the past and other SEC interpretive guidance and, in the absence of SEC guidance, on our view of what constitutes a qualifying real estate asset and a real estate-related asset. These no-action positions were issued in accordance with factual situations that may be substantially different from the factual situations we may face, and a number of these no-action positions were issued more than ten years ago. Pursuant to this guidance, and depending on the characteristics of the specific investments, certain mortgage loans, participations in mortgage loans, mortgage-backed securities, mezzanine loans, joint venture investments and the equity securities of other entities may not constitute qualifying real estate assets and therefore investments in these types of assets may be limited. No assurance can be given that the SEC staff will concur with our classification of our assets. Future revisions to the Investment Company Act or further guidance from the SEC or its staff may cause us to lose our exclusion from the definition of investment company or force us to re-evaluate our portfolio and our investment strategy. Such changes may prevent us from operating our business successfully.
There can be no assurance that the laws and regulations governing the Investment Company Act status of REITs, including more specific or different guidance regarding these exclusions that may be published by the SEC or its staff, will not change in a manner that adversely affects our operations. In addition, the SEC or its staff could take action that results in our or our subsidiary’s failure to maintain an exception or exemption from the Investment Company Act.
18
In the event that we, or our operating partnership, were to acquire assets that could make either entity fall within the definition of an investment company under Section 3(a)(1) of the Investment Company Act, we believe that we would still qualify for an exclusion from registration pursuant to Section 3(c)(6). Although the SEC staff has issued little interpretive guidance with respect to Section 3(c)(6), we believe that we and our operating partnership may rely on Section 3(c)(6) if 55% of the assets of our operating partnership consist of, and at least 55% of the income of our operating partnership is derived from, qualifying real estate assets owned by wholly owned or majority-owned subsidiaries of our operating partnership.
To ensure that neither we, our operating partnership or any of our subsidiaries are required to register as an investment company, each entity may be unable to sell assets that it would otherwise want to sell and may need to sell assets that it would otherwise wish to retain. In addition, we, our operating partnership or our subsidiaries may be required to acquire additional income- or loss-generating assets that we might not otherwise acquire or forego opportunities to acquire interests in companies that we would otherwise want to acquire. Although we, our operating partnership and our subsidiaries intend to monitor our portfolio periodically and prior to each acquisition and disposition, any of these entities may not be able to remain outside the definition of investment company or maintain an exclusion from the definition of investment company. If we, our operating partnership or our subsidiaries are required to register as an investment company but fail to do so, the unregistered entity would be prohibited from engaging in our business, and criminal and civil actions could be brought against such entity. In addition, the contracts of such entity would be unenforceable unless a court required enforcement, and a court could appoint a receiver to take control of the entity and liquidate its business.
Risks Related to Conflicts of Interest
We depend on our advisor and its key personnel and if any of such key personnel were to cease to be affiliated with our advisor, our business could suffer.
Our ability to achieve our investment objectives is dependent upon the performance of our advisor. Our success depends to a significant degree upon the continued contributions of certain of the key personnel of our advisor, each of whom would be difficult to replace. We currently do not have key man life insurance on any of our advisor’s personnel. If our advisor were to lose the benefit of the experience, efforts and abilities of any these individuals, our operating results could suffer.
Our advisor and its affiliates, including our officers and our affiliated directors, will face conflicts of interest caused by compensation arrangements with us, which could result in actions that are not in the best interests of our stockholders.
Our advisor and its affiliates receive substantial fees from us in return for their services and these fees could influence the advice provided to us. Among other matters, these compensation arrangements could affect their judgment with respect to:
• | public offerings of equity by us, which allow the dealer manager to earn additional dealer manager fees and allows our advisor to earn increased acquisition fees and investment management fees; |
• | real property sales, since the investment management fees and property management fees payable to our advisor and its affiliates would decrease upon the disposition of an investment; and |
• | the purchase of assets from our sponsor and its affiliates, which may allow our advisor or its affiliates to earn additional acquisition fees, investment management fees and property management fees. |
Further, our advisor may recommend that we invest in a particular asset or pay a higher purchase price for the asset than it would otherwise recommend if it did not receive an acquisition fee in connection with such transactions. Certain potential acquisition fees and investment management fees payable to our advisor and property management fees payable to our property manager will be paid irrespective of the quality of the underlying real estate or property management services. These fees may influence our advisor to recommend transactions with respect to the sale of a property or properties that may not be in our best interest. Our advisor will have considerable discretion with respect to the terms and timing of our acquisition, disposition and leasing transactions. In evaluating investments and other management strategies, the opportunity to earn these fees may lead our advisor to place undue emphasis on criteria relating to its compensation at the expense of other criteria, such as the preservation of capital, to achieve higher short-term compensation. This could result in decisions that are not in the best interests of our stockholders.
19
We may compete with affiliates of our sponsor for opportunities to acquire or sell investments, which may have an adverse impact on our operations.
We may compete with affiliates of our sponsor for opportunities to acquire or sell real properties and other real estate-related assets. We may also buy or sell real properties and other real estate-related assets at the same time as affiliates of our sponsor. In this regard, there is a risk that our sponsor will select for us investments that provide lower returns to us than investments purchased by its affiliates. Certain of our affiliates own or manage real properties in geographical areas in which we expect to own real properties. As a result of our potential competition with affiliates of our sponsor, certain investment opportunities that would otherwise be available to us may not in fact be available. This competition may also result in conflicts of interest that are not resolved in our favor.
The time and resources that our sponsor and its affiliates could devote to us may be diverted to other investment activities, and we may face additional competition due to the fact that our sponsor and its affiliates are not prohibited from raising money for, or managing, another entity that makes the same or other types of investments that we do.
Our sponsor and its affiliates are not prohibited from raising money for, or managing, another investment entity that makes the same or other types of investments as we do. As a result, the time and resources our sponsor and its affiliates could devote to us may be diverted to other investment activities. Additionally, some of our directors and officers may serve as directors and officers of investment entities sponsored by our sponsor and its affiliates, including Steadfast Apartment REIT, Steadfast Apartment REIT III and Steadfast Alcentra Global Credit Fund. We cannot currently estimate the time our officers and directors will be required to devote to us because the time commitment required of our officers and directors will vary depending upon a variety of factors, including, but not limited to, general economic and market conditions affecting us and our advisor’s ability to locate and acquire investments that meet our investment objectives. Since these professionals engage in and will continue to engage in other business activities on behalf of themselves and others, these professionals will face conflicts of interest in allocating their time among us, our advisor and its affiliates and other business activities in which they are involved. This could result in actions that are more favorable to affiliates of our advisor than to us.
In addition, we may compete with affiliates of our advisor for the same investors and investment opportunities. We may also co-invest with any such investment entity. Even though all such co-investments will be subject to approval by our independent directors, they could be on terms not as favorable to us as those we could achieve co-investing with a third party.
Our advisor may have conflicting fiduciary obligations if we acquire assets from affiliates of our sponsor or enter into joint ventures with affiliates of our sponsor. As a result, in any such transaction we may not have the benefit of arm’s-length negotiations of the type normally conducted between unrelated parties.
Our advisor may cause us to invest in a property owned by, or make an investment in equity securities in or real estate-related loans to, our sponsor or its affiliates or through a joint venture with affiliates of our sponsor. In these circumstances, our advisor will have a conflict of interest when fulfilling its fiduciary obligation to us. In any such transaction, we would not have the benefit of arm’s-length negotiations of the type normally conducted between unrelated parties.
The fees we pay to affiliates in connection with the acquisition and management of our investments were determined without the benefit of arm’s-length negotiations of the type normally conducted between unrelated parties.
The fees to be paid to our advisor, our property managers and other affiliates for services they provide for us were determined without the benefit of arm’s-length negotiations of the type normally conducted between unrelated parties, may be in excess of amounts that we would otherwise pay to third parties for such services and may reduce the amount of cash that would otherwise be available for investments in real properties and distributions to our stockholders.
20
Risks Related to Investments in Real Estate
Our operating results will be affected by economic and regulatory changes that impact the real estate market in general.
Our investments in real properties will be subject to risks generally attributable to the ownership of real property, including:
• | changes in global, national, regional or local economic, demographic or real estate market conditions; |
• | changes in supply of or demand for similar properties in an area; |
• | increased competition for real property investments targeted by our investment strategy; |
• | bankruptcies, financial difficulties or lease defaults by our tenants; |
• | changes in interest rates and availability of financing; |
• | changes in the terms of available financing, including more conservative loan-to-value requirements and shorter debt maturities; |
• | competition from residential buildings; |
• | the inability or unwillingness of residents to pay rent increases; |
• | changes in government rules, regulations and fiscal policies, including changes in tax, real estate, environmental and zoning laws; |
• | the severe curtailment of liquidity for certain real estate-related assets; and |
• | rent restrictions due to government program requirements. |
All of these factors are beyond our control. Any negative changes in these factors could affect our ability to meet our obligations and make distributions to stockholders.
We are unable to predict future changes in global, national, regional or local economic, demographic or real estate market conditions. For example, a recession or rise in interest rates could make it more difficult for us to lease or dispose of real properties and could make alternative interest-bearing and other investments more attractive and therefore potentially lower the relative value of the real estate assets we acquire. These conditions, or others we cannot predict, may adversely affect our results of operations and returns to our stockholders. In addition, the value of the real properties we acquire may decrease following the date we acquire such properties due to the risks described above or any other unforeseen changes in market conditions. If the value of our real properties decreases, we may be forced to dispose of the properties at a price lower than the price we paid to acquire our properties, which could adversely impact results of our operations and our ability to make distributions and return capital to our investors.
A concentration of our investments in the apartment community sector may leave our profitability vulnerable to a downturn or slowdown in the sector.
Our property portfolio is comprised solely of multifamily properties. As a result, we will be subject to risks inherent in investments in a single type of property. Because our investments are in the apartment community sector, the potential effects on our revenues, and as a result, on cash available for distribution to our stockholders, resulting from a downturn or slowdown in the apartment community sector could be more pronounced than if we had more fully diversified our investments.
We depend on tenants for our revenue, and, accordingly, our revenue and our ability to make distributions to our stockholders is dependent upon the ability of the tenants of our properties to generate enough income to pay their rents in a timely manner. Substantial non-renewals, terminations or lease defaults could reduce our net income and limit our ability to make distributions to our stockholders.
The underlying value of our properties and the ability to make distributions to our stockholders depend upon the ability of the tenants of our properties to generate enough income to pay their rents in a timely manner, and the success of our investments depends upon the occupancy levels, rental income and operating expenses of our properties and our company. Tenants’ inability to timely pay their rents may be impacted by employment and other constraints on their personal finances, including debts, purchases and other factors. These and other changes beyond our control may adversely affect our tenants’
21
ability to make lease payments. In the event of a tenant default or bankruptcy, we may experience delays in enforcing our rights as landlord and may incur costs in protecting our investment and re-leasing our property. We may be unable to re-lease the property for the rent previously received. We may be unable to sell a property with low occupancy without incurring a loss. These events and others could cause us to reduce the amount of distributions we make to stockholders and the value of our stockholders’ investment to decline.
We may be unable to secure funds for future capital improvements, which could adversely impact our ability to make cash distributions to our stockholders.
When residents do not renew their leases or otherwise vacate their apartment homes, in order to attract replacement residents, we may be required to expend funds for capital improvements to the vacated apartment homes. In addition, we may require substantial funds to renovate an apartment community in order to sell it, upgrade it or reposition it in the market. If we have insufficient capital reserves, we will have to obtain financing from other sources. We intend to establish capital reserves in an amount we, in our discretion, believe is necessary. A lender also may require escrow of capital reserves in excess of any established reserves. If these reserves or any reserves otherwise established are designated for other uses or are insufficient to meet our cash needs, we may have to obtain financing from either affiliated or unaffiliated sources to fund our cash requirements. We cannot assure our stockholders that sufficient financing will be available or, if available, will be available on economically feasible terms or on terms acceptable to us. Moreover, certain reserves required by lenders may be designated for specific uses and may not be available for capital purposes such as future capital improvements. Additional borrowing for capital needs and capital improvements will increase our interest expense, and therefore our financial condition and our ability to make cash distributions to our stockholders may be adversely affected.
Real property that experiences significant vacancy could be difficult to sell or re-lease.
A real property may experience a vacancy either by the continued default of a tenant under its lease or the expiration of one of our leases. Certain of the real properties we acquire may have some level of vacancy at the time of closing of our acquisition of the property. Certain other real properties may not be specifically suited to the particular needs of a tenant and may become vacant. There can be no assurances that we will have the funds available to correct defects or make capital improvements necessary to attract replacement tenants. As a result, we may have difficulty obtaining a new tenant for any vacant space we have in our real properties. If the vacancy continues for a long period of time, we may suffer reduced revenues resulting in lower cash distributions to stockholders. In addition, the resale value of the real property could be diminished because the market value may depend principally upon the value of the leases of such real property.
We will compete with numerous other persons and entities for real estate assets and tenants.
We will compete with numerous other persons and entities in acquiring real property and attracting tenants to real properties we acquire. These persons and entities may have greater experience and financial strength than us. There is no assurance that we will be able to acquire real properties or attract tenants to real properties we acquire on favorable terms, if at all. For example, our competitors may be willing to offer space at rental rates below our rates, causing us to lose existing or potential tenants and pressuring us to reduce our rental rates to retain existing tenants or convince new tenants to lease space at our properties. Each of these factors could adversely affect our results of operations, financial condition, value of our investments and ability to pay distributions to you.
Real properties are illiquid investments, and we may be unable to adjust our portfolio in response to changes in economic or other conditions or sell a property if or when we decide to do so.
Real properties are illiquid investments. We may be unable to adjust our portfolio in response to changes in economic or other conditions. In addition, the real estate market is affected by many factors, such as general economic conditions, availability of financing, interest rates, supply and demand, and other factors that are beyond our control. We cannot predict whether we will be able to sell any real property for the price or on the terms set by us, or whether any price or other terms offered by a prospective purchaser would be acceptable to us. We cannot predict the length of time needed to find a willing purchaser and to close the sale of a real property. Additionally, we may be required to expend funds to correct defects or to make improvements before a real property can be sold. We cannot assure you that we will have funds available to correct such defects or to make such improvements.
22
In acquiring a real property, we may agree to restrictions that prohibit the sale of that real property for a period of time or impose other restrictions, such as a limitation on the amount of debt that can be placed or repaid on that real property. All these provisions would restrict our ability to sell a property, which could reduce the amount of cash available for distribution to our stockholders.
Competition from other apartment communities for residents could reduce our profitability and the return on your investment.
The apartment sector is highly competitive. This competition could reduce occupancy levels and revenues at our apartment communities, which would adversely affect our operations. We expect to face competition from many sources. We will face competition from other apartment communities both in the immediate vicinity and in the larger geographic market where our apartment communities are located. These competitors may have greater experience and financial resources than us giving them an advantage in attracting residents to their properties. In addition, increases in operating costs due to inflation may not be offset by increased apartment rental rates.
Increased competition and increased affordability of single-family homes could limit our ability to retain residents, lease apartment homes or increase or maintain rents.
Any apartment communities we may acquire will most likely compete with numerous housing alternatives in attracting residents, including single-family homes, as well as owner occupied single- and multifamily homes available to rent. Competitive housing in a particular area and the increasing affordability of owner occupied single- and multifamily homes available to rent or buy caused by declining mortgage interest rates and government programs to promote home ownership could adversely affect our ability to retain our residents, lease apartment homes and increase or maintain rental rates.
Short-term apartment leases expose us to the effects of declining market rent, which could adversely impact our ability to make cash distributions to our stockholders.
Substantially all of our apartment leases are for a term of one year or less. Because these leases generally permit the residents to leave at the end of the lease term without penalty, our rental revenues may be impacted by declines in market rents more quickly than if our leases were for longer terms.
Increased construction of similar properties that compete with our apartment communities in any particular location could adversely affect the operating results of our properties and our cash available for distribution to our stockholders.
We may have acquired apartment communities in locations that may be experiencing increases in the construction of properties that compete with our apartment communities. This increased competition and construction could:
• | make it more difficult for us to find residents to lease apartment homes in our apartment communities; |
• | force us to lower our rental prices in order to lease apartment homes in our apartment communities; and/or |
• | substantially reduce our revenues and cash available for distribution to our stockholders. |
Our leases with commercial tenants at some of our properties are short-term leases, which may result in increased operating expenses if those tenants vacate their space and we are forced to locate new tenants.
A portion of our portfolio of real property investments is comprised of properties with commercial tenants. The leases for these commercial tenants are short-term leases, ranging from two to eight year terms. Short-term leases are generally less desirable than long-term leases because long-term leases provide a more predictable income stream over a longer period. Long-term leases also make it easier for us to obtain longer-term, fixed-rate mortgage financing with principal amortization, thereby moderating the interest rate risk associated with financing or refinancing our real properties portfolio by reducing the outstanding principal balance over time. Short-term commercial leases at our properties increase the risk of an extended vacancy due to the difficulty we may experience in finding new tenants upon the expiration of the leases. Additionally, we may incur significant costs related to leasing commissions and tenant improvements to attract new tenants. To the extent that a portion of our real estate portfolio is leased under the terms of short-term leases, we will be subject to the risks of a less predictable income stream and greater exposure to the fluctuations in market rental rates. We will also be subject to interest rate risks should the short-term leases result in a mismatch with any long-term mortgage financing on the real properties.
23
Our real properties will be subject to property taxes that may increase in the future, which could adversely affect our cash flow.
Our real properties are subject to real and personal property taxes that may increase as tax rates change and as the real properties are assessed or reassessed by taxing authorities. While certain of our leases, such as leases at our multifamily properties, will generally provide that we are responsible for the property taxes, or increases therein, our commercial leases may provide that such taxes are charged to the lessees as an expense related to the real properties that they occupy. In any case, as the owner of the properties, we are ultimately responsible for payment of the taxes to the applicable government authorities. If we fail to pay any such taxes, the applicable taxing authority may place a lien on the real property and the real property may be subject to a tax sale. In addition, we will generally be responsible for real property taxes related to any vacant space.
Uninsured losses or premiums for insurance coverage relating to real property may adversely affect your returns.
We will attempt to adequately insure all of our real properties against casualty losses. The nature of the activities at certain properties we may acquire, such as age-restricted communities, may expose us and our operators to potential liability for personal injuries and property damage claims. In addition, there are types of losses, generally catastrophic in nature, such as losses due to wars, acts of terrorism, earthquakes, floods, hurricanes, pollution or environmental matters that are uninsurable or not economically insurable, or may be insured subject to limitations, such as large deductibles or co-payments. Risks associated with potential acts of terrorism could sharply increase the premiums we pay for coverage against property and casualty claims. Mortgage lenders sometimes require commercial property owners to purchase specific coverage against acts of terrorism as a condition for providing mortgage loans. These policies may not be available at a reasonable cost, if at all, which could inhibit our ability to finance or refinance our real properties. In such instances, we may be required to provide other financial support, either through financial assurances or self-insurance, to cover potential losses. Changes in the cost or availability of insurance could expose us to uninsured casualty losses. In the event that any of our real properties incurs a casualty loss that is not fully covered by insurance, the value of our assets will be reduced by any such uninsured loss. In addition, we cannot assure you that funding will be available to us for repair or reconstruction of damaged real property in the future.
Costs of complying with governmental laws and regulations related to environmental protection and human health and safety may be high.
All real property investments and the operations conducted in connection with such investments are subject to federal, state and local laws and regulations relating to environmental protection and human health and safety. Some of these laws and regulations may impose joint and several liability on customers, owners or operators for the costs to investigate or remediate contaminated properties, regardless of fault or whether the acts causing the contamination were legal.
Under various federal, state and local environmental laws, a current or previous owner or operator of real property may be liable for the cost of removing or remediating hazardous or toxic substances on such real property. These environmental laws often impose liability whether or not the owner or operator knew of, or was responsible for, the presence of such hazardous or toxic substances. In addition, the presence of hazardous substances, or the failure to properly remediate these substances, may adversely affect our ability to sell, rent or pledge such real property as collateral for future borrowings. Environmental laws also may impose restrictions on the manner in which real property may be used or businesses may be operated. Some of these laws and regulations have been amended so as to require compliance with new or more stringent standards as of future dates. Compliance with new or more stringent laws or regulations or stricter interpretation of existing laws may require us to incur material expenditures. Future laws, ordinances or regulations may impose material environmental liability. Additionally, our tenants’ operations, the existing condition of land when we buy it, operations in the vicinity of our real properties, such as the presence of underground storage tanks, or activities of unrelated third parties, may affect our real properties. There are also various local, state and federal fire, health, life-safety and similar regulations with which we may be required to comply and which may subject us to liability in the form of fines or damages for noncompliance. In connection with the acquisition and ownership of our real properties, we may be exposed to these costs in connection with such regulations. The cost of defending against environmental claims, any damages or fines we must pay, compliance with environmental regulatory requirements or remediating any contaminated real property could materially and adversely affect our business and results of operations, lower the value of our assets and, consequently, lower the amounts available for distribution to our stockholders.
24
The costs associated with complying with the Americans with Disabilities Act of 1990, as amended, or the ADA, may reduce the amount of cash available for distribution to our stockholders.
Investment in real properties may also be subject to the ADA. Under the ADA, all places of public accommodation are required to comply with federal requirements related to access and use by disabled persons. We are committed to complying with the ADA to the extent to which it applies. The ADA has separate compliance requirements for “public accommodations” and “commercial facilities” that generally require that buildings and services be made accessible and available to people with disabilities. With respect to the properties we acquire, the ADA’s requirements could require us to remove access barriers and could result in the imposition of injunctive relief, monetary penalties or, in some cases, an award of damages. We will attempt to acquire properties that comply with the ADA or place the burden on the seller or other third party, such as a tenant, to ensure compliance with the ADA. We cannot assure you that we will be able to acquire properties or allocate responsibilities in this manner. Any monies we use to comply with the ADA will reduce the amount of cash available for distribution to our stockholders.
To the extent we invest in age-restricted communities, we may incur liability by failing to comply with the Housing for Older Persons Act, or HOPA, the Fair Housing Act, or FHA, or certain state regulations, which may affect cash available for distribution to our stockholders.
To the extent we invest in age-restricted communities, any such properties must comply with the FHA and the HOPA. The FHA generally prohibits age-based housing discrimination; however certain exceptions exist for housing developments that qualify as housing for older persons. HOPA provides the legal requirements for such housing developments. In order for housing to qualify as housing for older persons, HOPA requires (1) all residents of such developments to be at least 62 years of age or (2) that at least 80% of the occupied apartment homes are occupied by at least one person who is at least 55 years of age and that the housing community publish and adhere to policies and procedures that demonstrate this required intent and comply with rules issued by the United States Department of Housing and Urban Development, or HUD, for verification of occupancy. In addition, certain states require that age-restricted communities register with the state. Noncompliance with the FHA, HOPA or state registration requirements could result in the imposition of fines, awards of damages to private litigants, payment of attorneys’ fees and other costs to plaintiffs, substantial litigation costs and substantial costs of remediation, all of which would reduce the amount of cash available for distribution to our stockholders.
Government housing regulations may limit the opportunities at some of the government-assisted housing properties we invest in, and failure to comply with resident qualification requirements may result in financial penalties and/or loss of benefits, such as rental revenues paid by government agencies.
To the extent that we invest in government-assisted housing, we may acquire properties that benefit from governmental programs intended to provide affordable housing to individuals with low or moderate incomes. These programs, which are typically administered by HUD or state housing finance agencies, typically provide mortgage insurance, favorable financing terms, tax credits or rental assistance payments to property owners. As a condition of the receipt of assistance under these programs, the properties must comply with various requirements, which typically limit rents to pre-approved amounts and impose restrictions on resident incomes. Failure to comply with these requirements and restrictions may result in financial penalties or loss of benefits. In addition, we will typically need to obtain the approval of HUD in order to acquire or dispose of a significant interest in or manage a HUD-assisted property.
Risks Associated with Real Estate-Related Assets
Disruptions in the financial markets and deteriorating economic conditions could adversely impact the commercial mortgage market as well as the market for real estate-related assets and debt-related investments generally, which could hinder our ability to implement our business strategy and generate returns to our stockholders.
Our portfolio is comprised of real estate-related assets. The returns available to investors in these investments are determined by: (1) the supply and demand for such investments; and (2) the existence of a market for such investments, which includes the ability to sell or finance such investments.
25
During periods of volatility the number of investors participating in the market may change at an accelerated pace. As liquidity or “demand” increases the returns available to investors will decrease. Conversely, a lack of liquidity will cause the returns available to investors to increase. Concerns pertaining to the deterioration of credit in the residential mortgage market may adversely impact almost all areas of the debt capital markets including corporate bonds, asset-backed securities and commercial real estate bonds and loans. Future instability in the financial markets or weakened economic conditions may interfere with the successful implementation of our business strategy.
Many of our investments in real estate-related assets may be illiquid, and we may not be able to vary our portfolio in response to changes in economic and other conditions.
Certain of the real estate-related assets that we may purchase in connection with privately negotiated transactions will not be registered under the relevant securities laws, resulting in a prohibition against their transfer, sale, pledge or other disposition except in a transaction that is exempt from the registration requirements of, or is otherwise in accordance with, those laws. The mezzanine and bridge loans we may purchase would be particularly illiquid investments due to their short life, their unsuitability for securitization and the greater difficulty of recoupment in the event of a borrower’s default. As a result, our ability to vary our portfolio in response to changes in economic and other conditions may be relatively limited.
Our real estate-related assets may be sensitive to fluctuations in interest rates, and our hedging strategies may not be effective.
We may use various investment strategies to hedge interest rate risks with respect to our portfolio of real estate-related assets. The use of interest rate hedging transactions involves certain risks. These risks include: (1) the possibility that the market will move in a manner or direction that would have resulted in gain for us had an interest rate hedging transaction not been utilized, in which case our performance would have been better had we not engaged in the interest rate hedging transaction; (2) the risk of imperfect correlation between the risk sought to be hedged and the interest rate hedging transaction used; (3) potential illiquidity for the hedging instrument used, which may make it difficult for us to close-out or unwind an interest rate hedging transaction; and (4) the possibility that the counterparty fails to honor its obligation. In addition, because we have elected to be taxed as a REIT under the Internal Revenue Code beginning with the taxable year ending December 31, 2010, for federal income tax purposes we will have limitations on our income sources and the hedging strategies available to us will be more limited than those available to companies that are not REITs. To the extent that we do not hedge our interest rate exposure, our profitability may be negatively impacted by changes in long-term interest rates.
Declines in the market values of the real estate-related assets in which we invest may adversely affect our periodic reported results of operations and credit availability, which may reduce earnings and, in turn, cash available for distribution to our stockholders.
A portion of the real estate-related assets may be classified for accounting purposes as “held-for-sale.” These investments are carried at the lower of carrying value or estimated fair value less cost to sell. If these investments are carried at estimated fair value and temporary changes in the market values of those assets will be directly charged or credited to stockholders’ equity without impacting net income on our income statement. Market values of our investments may decline for a number of reasons, such as market illiquidity, changes in prevailing market rates, increases in defaults, increases in voluntary prepayments for those of our investments that are subject to prepayment risk, widening of credit spreads and downgrades of ratings of the securities by ratings agencies. If we determine that a decline in the estimated fair value of an available-for-sale security below its amortized value is other-than-temporary, we will recognize a loss on that security in our income statement, which will reduce our earnings in the period recognized.
A decline in the market value of our real estate-related assets may adversely affect us particularly in instances where we have borrowed money based on the market value of those assets. If the market value of those assets declines, the lender may require us to post additional collateral to support the loan. If we were unable to post the additional collateral, we may have to sell assets at a time when we might not otherwise choose to do so. A reduction in credit available may reduce our earnings and, in turn, cash available for distribution to stockholders. Further, credit facility providers may require us to maintain a certain amount of cash reserves or to set aside unlevered assets sufficient to maintain a specified liquidity position. As a result, we may not be able to leverage our assets as fully as we would choose, which could reduce our return on equity. In the event that we are unable to meet these contractual obligations, our financial condition could deteriorate rapidly.
26
Some of the real estate-related assets in which we invest will be carried at estimated fair value as determined by us and, as a result, there may be uncertainty as to the value of these investments.
Some of the real-estate-related assets in which we invest may be in the form of securities that are recorded at fair value but that have limited liquidity or are not publicly traded. The fair value of securities and other investments that have limited liquidity or are not publicly traded may not be readily determinable. We estimate the fair value of these investments on a quarterly basis. Because such valuations are inherently uncertain, may fluctuate over short periods of time and may be based on numerous estimates, our determinations of fair value may differ materially from the values that would have been used if a ready market for these securities existed. The value of our common stock could be adversely affected if our determinations regarding the fair value of these investments are materially higher than the values that we ultimately realize upon their disposal.
Risks Associated with Debt Financing
We will incur mortgage indebtedness and other borrowings which increase our business risks and could hinder our ability to make distributions and decrease the value of your investment.
We financed a portion of the purchase price of our real properties by borrowing funds. We may continue to incur mortgage debt and pledge some or all of our investments as security for that debt to obtain funds to acquire additional investments or for working capital. We may also borrow funds as necessary or advisable to ensure we maintain our REIT tax qualification, including the requirement that we distribute at least 90% of our annual REIT taxable income to our stockholders (computed without regard to the distribution paid deduction and excluding net capital gains). However, there is no assurance that we will be able to obtain such borrowings on satisfactory terms.
High debt levels will cause us to incur higher interest charges, which would result in higher debt service payments and could be accompanied by restrictive covenants. If there is a shortfall between the cash flow from a property and the cash flow needed to service mortgage debt on that property, then the amount available for distributions to stockholders may be reduced. In addition, incurring mortgage debt increases the risk of loss since defaults on indebtedness secured by a property may result in lenders initiating foreclosure actions. In that case, we could lose the property securing the loan that is in default, thus reducing the value of your investment. For tax purposes, a foreclosure on any of our properties will be treated as a sale of the property for a purchase price equal to the outstanding balance of the debt secured by the mortgage. If the outstanding balance of the debt secured by the mortgage exceeds our tax basis in the property, we will recognize taxable income on foreclosure, but we would not receive any cash proceeds. If any mortgage contains cross collateralization or cross default provisions, a default on a single property could affect multiple properties. If any of our properties are foreclosed upon due to a default, our ability to pay cash distributions to our stockholders will be adversely affected.
Instability in the debt markets and our inability to find financing on attractive terms may make it more difficult for us to finance or refinance properties, and could reduce the amount of cash distributions we can make to our stockholders.
If mortgage debt is unavailable on reasonable terms as a result of increased interest rates, underwriting standards, capital market instability or other factors, we run the risk of being unable to refinance such debt when the loans come due, or of being unable to refinance on favorable terms, to the extent that we place mortgage debt on properties. If interest rates are higher when we refinance debt, our income could be reduced. We may be unable to refinance debt at appropriate times, which may require us to sell properties on terms that are not advantageous to us, or could result in the foreclosure of such properties. If any of these events occur, our cash flow would be reduced. This, in turn, would reduce cash available for distribution to our stockholders and may hinder our ability to raise more capital by issuing securities or by borrowing more money.
Increases in interest rates could increase the amount of our debt payments and negatively impact our operating results.
Interest we pay on our debt obligations reduces our cash available for distributions. Utilization of variable rate debt, combined with increases in interest rates would increase our interest costs, which would reduce our cash flows and our ability to make distributions to our stockholders. If we need to repay existing debt during periods of rising interest rates, we could be required to liquidate one or more of our investments at times which may not permit realization of the maximum return on such investments.
27
Lenders may require us to enter into restrictive covenants relating to our operations, which could limit our ability to make distributions to our stockholders.
When providing financing, a lender may impose restrictions on us that affect our distribution and operating policies and our ability to incur additional debt. Loan documents we enter into may contain covenants that limit our ability to further mortgage a property, discontinue insurance coverage, or replace our advisor. In addition, loan documents may limit our ability to replace a property’s property manager or terminate certain operating or lease agreements related to a property. These or other limitations may adversely affect our flexibility and our ability to achieve our investment objectives.
The derivative financial instruments that we use to hedge against interest rate fluctuations may not be successful in mitigating our risks associated with interest rates and could reduce the overall returns on your investment.
We may use derivative financial instruments, such as interest rate cap or collar agreements and interest rate swap agreements, to hedge exposures to changes in interest rates on loans secured by our assets, but no hedging strategy can protect us completely. These agreements involve risks, such as the risk that counterparties may fail to honor their obligations under these arrangements and that these arrangements may not be effective in reducing our exposure to interest rate changes. We cannot assure you that our hedging strategy and the derivatives that we use will adequately offset the risk of interest rate volatility or that our hedging transactions will not result in losses. In addition, the use of such instruments may reduce the overall return on our investments. These instruments may also generate income that may not be treated as qualifying REIT income for purposes of the 75% or 95% REIT gross income tests.
Federal Income Tax Risks
Failure to qualify as a REIT would reduce our net earnings available for investment or distribution.
If we fail to qualify as a REIT for any taxable year and we do not qualify for certain statutory relief provisions, we will be subject to federal income tax on our taxable income at corporate rates. In addition, we would generally be disqualified from treatment as a REIT for the four taxable years following the year of losing our REIT status. Losing our REIT status would reduce our net earnings available for investment or distribution to stockholders because of the additional tax liability. In addition, distributions to stockholders would no longer qualify for the dividends paid deduction and we would no longer be required to make distributions. If this occurs, we might be required to borrow funds or liquidate some investments in order to pay the applicable tax.
You may have current tax liability on distributions you elect to reinvest in our common stock.
If you participate in our distribution reinvestment plan, you will be deemed to have received, and for income tax purposes will be taxed on, the amount reinvested in shares of our common stock to the extent the amount reinvested was not a tax-free return of capital. In addition, you will be treated for tax purposes as having received an additional distribution to the extent the shares are purchased at a discount to fair market value. As a result, unless you are a tax-exempt entity, you may have to use funds from other sources to pay your tax liability on the value of the shares of common stock received.
Distributions payable by REITs generally do not qualify for reduced tax rates under current law.
The maximum U.S. federal income tax rate for certain qualified dividends payable to U.S. stockholders that are individuals, trusts and estates generally is 20%. Distributions payable by REITs, however, are generally not eligible for the reduced rates and therefore may be subject to a 39.6% maximum U.S. federal income tax rate on ordinary income when paid to such stockholders. The more favorable rates applicable to regular corporate dividends under current law could cause investors who are individuals, trusts and estates or are otherwise sensitive to these lower rates to perceive investments in REITs to be relatively less attractive than investments in the stocks of non-REIT corporations that pay distributions, which could adversely affect the value of the stock of REITs, including our shares of our common stock.
Even if we qualify as a REIT for federal income tax purposes, we may be subject to other tax liabilities that reduce our cash flow and our ability to make distributions to you.
Even if we qualify as a REIT for federal income tax purposes, we may be subject to some federal, state and local taxes on our income or property. For example:
28
• | In order to qualify as a REIT, we must distribute annually at least 90% of our REIT taxable income (which is determined without regard to the dividends paid deduction or net capital gain for this purpose) to our stockholders. To the extent that we satisfy the distribution requirement but distribute less than 100% of our REIT taxable income, we will be subject to federal corporate income tax on the undistributed income. |
• | We will be subject to a 4% nondeductible excise tax on the amount, if any, by which distributions we pay in any calendar year are less than the sum of 85% of our ordinary income, 95% of our capital gain net income and 100% of our undistributed income from prior years. |
• | If we have net income from the sale of foreclosure property that we hold primarily for sale to customers in the ordinary course of business or other non-qualifying income from foreclosure property, we must pay a tax on that income at the highest corporate income tax rate. |
• | If we sell an asset, other than foreclosure property, that we hold primarily for sale to customers in the ordinary course of business, our gain would be subject to the 100% “prohibited transaction” tax unless such sale were made by one of our taxable REIT subsidiaries. |
REIT distribution requirements could adversely affect our ability to execute our business plan.
We generally must distribute annually at least 90% of our REIT taxable income (which is determined without regard to the dividends paid deduction or net capital gain for this purpose) in order to qualify as a REIT. To the extent that we satisfy this distribution requirement, but distribute less than 100% of our REIT taxable income (including net capital gain), we will be subject to federal corporate income tax on our undistributed REIT taxable income. In addition, we will be subject to a 4% nondeductible excise tax if the actual amount that we pay out to our stockholders in a calendar year is less than a minimum amount specified under federal tax laws. We intend to make distributions to our stockholders to comply with the REIT requirements of the Internal Revenue Code.
From time to time, we may generate taxable income greater than our taxable income for financial reporting purposes, or our taxable income may be greater than our cash flow available for distribution to stockholders. If we do not have other funds available in these situations we could be required to borrow funds, sell investments at disadvantageous prices or find another alternative source of funds to make distributions sufficient to enable us to pay out enough of our taxable income to satisfy the REIT distribution requirement and to avoid corporate income tax and the 4% excise tax in a particular year. There is no assurance that outside financing will be available to us. Even if available, the use of outside financing or other alternative sources of funds to pay distributions could increase our costs or dilute our stockholders’ equity interests. Thus, compliance with the REIT requirements may hinder our ability to operate solely on the basis of maximizing profits.
To maintain our REIT status, we may be forced to forgo otherwise attractive opportunities, which may delay or hinder our ability to meet our investment objectives and reduce your overall return.
To maintain our REIT status, we must satisfy certain tests on an ongoing basis concerning, among other things, the sources of our income, nature of our assets and the amounts we distribute to our stockholders. We may be required to make distributions to stockholders at times when it would be more advantageous to reinvest cash in our business or when we do not have funds readily available for distribution. Compliance with the REIT requirements may hinder our ability to operate solely on the basis of maximizing profits and the value of your investment.
Our gains from sales of our assets are potentially subject to the prohibited transaction tax, which could reduce the return on your investment.
Our ability to dispose of property during the first few years following acquisition is restricted to a substantial extent as a result of our REIT status. We will be subject to a 100% tax on any gain realized on the sale or other disposition of any property (other than foreclosure property) we own, directly or through any subsidiary entity, including our operating partnership, but excluding our taxable REIT subsidiaries, that is deemed to be inventory or property held primarily for sale to customers in the ordinary course of trade or business. Whether property is inventory or otherwise held primarily for sale to customers in the ordinary course of a trade or business depends on the particular facts and circumstances surrounding each property. We intend to avoid the 100% prohibited transaction tax by (1) conducting activities that may otherwise be considered prohibited transactions through a taxable REIT subsidiary, (2) conducting our operations in such a manner so that no sale or other disposition of an asset we own, directly or through any subsidiary other than a taxable REIT subsidiary, will be treated as a
29
prohibited transaction or (3) structuring certain dispositions of our properties to comply with certain safe harbors available under the Internal Revenue Code for properties held at least two years. However, no assurance can be given that any particular property we own, directly or through any subsidiary entity, including our operating partnership, but excluding our taxable REIT subsidiaries, will not be treated as inventory or property held primarily for sale to customers in the ordinary course of a trade or business.
Complying with REIT requirements may force us to liquidate otherwise attractive investments.
To maintain our REIT status, we must ensure that at the end of each calendar quarter, at least 75% of the value of our assets consists of cash, cash items, government securities and qualifying real estate assets, including certain mortgage loans and mortgage-backed securities. The remainder of our investment in securities (other than government securities and qualified real estate assets) generally cannot include more than 10% of the outstanding voting securities of any one issuer or more than 10% of the total value of the outstanding securities of any one issuer. In addition, in general, no more than 5% of the value of our assets (other than government securities and qualified real estate assets) can consist of the securities of any one issuer. For the 2016 taxable year and 2017 taxable year, no more than 25% of the value of our total assets can be represented by securities of one or more taxable REIT subsidiaries. For taxable years beginning after December 31, 2017, no more than 20% of the value of our total assets can be represented by securities of one or more taxable REIT subsidiaries.
If we fail to comply with these requirements at the end of any calendar quarter, we must correct the failure within 30 days after the end of the calendar quarter or qualify for certain statutory relief provisions to avoid losing our REIT qualification and suffering adverse tax consequences. As a result, we may be required to liquidate from our portfolio otherwise attractive investments. These actions could have the effect of reducing our income and amounts available for distribution to our stockholders.
Liquidation of assets may jeopardize our REIT status.
To maintain our REIT status, we must comply with requirements regarding our assets and our sources of income. If we are compelled to liquidate our investments to repay obligations to our lenders, we may be unable to comply with these requirements, ultimately jeopardizing our qualification as a REIT, or we may be subject to a 100% tax on any resultant gain if we sell assets that are treated as dealer property or inventory.
The failure of a mezzanine loan to qualify as a real estate asset could adversely affect our ability to qualify as a REIT.
We may acquire mezzanine loans. The Internal Revenue Service has provided a safe harbor in Revenue Procedure 2003-65 for structuring mezzanine loans so that they will be treated by the Internal Revenue Service as a real estate asset for purposes of the REIT asset tests, and interest derived from mezzanine loans will be treated as qualifying mortgage interest for purposes of the 75% gross income test. Although the Revenue Procedure provides a safe harbor on which taxpayers may rely, it does not prescribe rules of substantive tax law. We may acquire mezzanine loans that do not meet all of the requirements of the safe harbor. In the event we own a mezzanine loan that does not meet the safe harbor, the Internal Revenue Service could challenge such loan’s treatment as a real estate asset for purposes of the REIT asset and income tests and, if such a challenge were sustained, we could fail to continue to qualify as a REIT.
If our operating partnership fails to maintain its status as a partnership or as an otherwise disregarded entity, its income may be subject to taxation, which would reduce the cash available for distribution to you and likely result in a loss of our REIT status.
We intend to maintain the status of the operating partnership as a partnership or as a disregarded entity for U.S. federal income tax purposes. However, if the Internal Revenue Service were to successfully challenge the status of the operating partnership as a partnership or as a disregarded entity for such purposes, it would be taxable as a corporation. In such event, this would reduce the amount of distributions that the operating partnership could make to us. This would also likely result in our losing REIT status, and, if so, becoming subject to a corporate level tax on our own income. This would substantially reduce any cash available to pay distributions. In addition, if any of the partnerships or limited liability companies through which the operating partnership owns its properties, in whole or in part, loses its characterization as a partnership and is otherwise not disregarded for U.S. federal income tax purposes, it would be subject to taxation as a corporation, thereby reducing distributions to the operating partnership. Such a recharacterization of an underlying property owner could also threaten our ability to maintain our status as a REIT.
30
Legislative or regulatory action could adversely affect investors.
In recent years, numerous legislative, judicial and administrative changes have been made to the federal income tax laws applicable to investments in REITs and similar entities. Additional changes to tax laws are likely to continue to occur in the future and we cannot assure you that any such changes will not adversely affect the taxation of a stockholder. Any such changes could have an adverse effect on an investment in shares of our common stock. We urge you to consult with your own tax advisor with respect to the status of legislative, regulatory or administrative developments and proposals and their potential effect on an investment in shares of our common stock.
Our property taxes could increase due to property tax rate changes or reassessment, which would impact our cash flows.
Even if we qualify as a REIT for federal income tax purposes, we will be required to pay some state and local taxes on our properties. The real property taxes on our properties may increase as property tax rates change or as our properties are assessed or reassessed by taxing authorities. Therefore, the amount of property taxes we pay in the future may increase substantially. If the property taxes we pay increase and if any such increase is not reimbursable under the terms of our lease, then our cash flows will be impacted, and our ability to pay expected distributions to our stockholders could be adversely affected.
Non-U.S. investors may be subject to FIRPTA on the sale of shares of our common stock if we are unable to qualify as a “domestically controlled qualified investment entity.”
A non-U.S. person disposing of a U.S. real property interest, including shares of a U.S. corporation whose assets consist principally of U.S. real property interests, is generally subject to a tax, known as FIRPTA, on the gain recognized on the disposition of such interest. However, qualified foreign pension plans and certain foreign publicly traded entities are exempt from FIRPTA withholding. Further, FIRPTA does not apply to the disposition of stock in a REIT if the REIT is a “domestically controlled qualified investment entity.” A REIT is a domestically controlled qualified investment entity if, at all times during a specified testing period (the continuous five year period ending on the date of disposition or, if shorter, the entire period of the REIT’s existence), less than 50% in value of its shares is held directly or indirectly by non-U.S. holders. We cannot assure you that we will qualify as a domestically controlled qualified investment entity. If we were to fail to so qualify, gain realized by a non-U.S. investor on a sale of our common stock would be subject to FIRPTA unless our common stock was traded on an established securities market and the non-U.S. investor did not at any time during a specified testing period directly or indirectly own more than 10% of the value of our outstanding common stock.
Retirement Plan Risks
If you fail to meet the fiduciary and other standards under ERISA or the Internal Revenue Code as a result of an investment in our stock, you could be subject to criminal and civil penalties.
There are special considerations that apply to employee benefit plans subject to ERISA (such as pension, profit-sharing or 401(k) plans) and other retirement plans or accounts subject to Section 4975 of the Internal Revenue Code (such as an IRA or Keogh plan) whose assets are being invested in our common stock. If you are investing the assets of such a plan (including assets of an insurance company general account or entity whose assets are considered plan assets under ERISA) or account in our common stock, you should satisfy yourself that:
• | your investment is consistent with your fiduciary obligations under ERISA and the Internal Revenue Code; |
• | your investment is made in accordance with the documents and instruments governing your plan or IRA, including your plan or account’s investment policy; |
• | your investment satisfies the prudence and diversification requirements of Section 404(a)(1)(B) and 404(a)(1)(C) of ERISA and other applicable provisions of ERISA and/or the Internal Revenue Code; |
• | your investment will not impair the liquidity of the plan or IRA; |
• | your investment will not produce unrelated business taxable income, referred to as UBTI, for the plan or IRA; |
• | you will be able to value the assets of the plan annually in accordance with ERISA requirements and applicable provisions of the plan or IRA; and |
31
• | your investment will not constitute a prohibited transaction under Section 406 of ERISA or Section 4975 of the Internal Revenue Code. |
Failure to satisfy the fiduciary standards of conduct and other applicable requirements of ERISA and the Internal Revenue Code may result in the imposition of civil and criminal penalties and could subject the fiduciary to equitable remedies. In addition, if an investment in our common stock constitutes a prohibited transaction under ERISA or the Internal Revenue Code, the fiduciary that authorized or directed the investment may be subject to the imposition of excise taxes with respect to the amount invested.
If you invest in our shares through an IRA or other retirement plan, you may be limited in your ability to withdraw required minimum distributions.
If you establish a plan or account through which you invest in our common stock, federal law may require you to withdraw required minimum distributions from such plan in the future. Our stock will be highly illiquid, and our share repurchase program only offers limited liquidity. If you require liquidity, you may generally sell your shares, but such sale may be at a price less than the price at which you initially purchased your shares of our common stock. If you fail to withdraw required minimum distributions from your plan or account, you may be subject to certain taxes and tax penalties.
Specific rules apply to foreign, governmental and church plans.
As a general rule, certain employee benefit plans, including foreign pension plans, governmental plans established or maintained in the United States (as defined in Section 3(32) of ERISA), and certain church plans (as defined in Section 3(33) of ERISA), are not subject to ERISA’s requirements and are not “benefit plan investors” within the meaning of the Plan Assets Regulation. Any such plan that is qualified and exempt from taxation under Sections 401(a) and 501(a) of the Code may nonetheless be subject to the prohibited transaction rules set forth in Section 503 of the Code and, under certain circumstances in the case of church plans, Section 4975 of the Code. Also, some foreign plans and governmental plans may be subject to foreign, state, or local laws which are, to a material extent, similar to the provisions of ERISA or Section 4975 of the Code. Each fiduciary of a plan subject to any such similar law should make its own determination as to the need for and the availability of any exemption relief.
ITEM 1B. | UNRESOLVED STAFF COMMENTS |
We have no unresolved staff comments.
ITEM 2. | PROPERTIES |
As of December 31, 2016, we owned 65 multifamily properties consisting of an aggregate of 16,709 multifamily homes and 25,973 square feet of rentable commercial space. The total purchase price of our real estate portfolio, including development and construction costs for apartment homes constructed by us, as of December 31, 2016 was $1,644,177,333, exclusive of closing costs. For additional information on our real estate portfolio, see Part I, Item 1. “Business—Our Real Estate Portfolio” of this Annual Report on Form 10-K.
Our principal executive offices are located at 18100 Von Karman Avenue, Suite 500, Irvine, CA 92612. Our telephone number, general facsimile number and website address are (949) 852-0700, (949) 852-0143 and http://www.steadfastreits.com, respectively.
32
ITEM 3. | LEGAL PROCEEDINGS |
From time to time, we are party to legal proceedings that arise in the ordinary course of our business. Management is not aware of any legal proceedings of which the outcome is reasonably likely to have a material adverse effect on our results of operations or financial condition, nor are we aware of any such legal proceedings contemplated by government agencies.
ITEM 4. | MINE SAFETY DISCLOSURES |
Not applicable.
PART II
ITEM 5. | MARKET FOR REGISTRANT’S COMMON EQUITY, RELATED STOCKHOLDER MATTERS AND PURCHASES OF EQUITY SECURITIES |
Stockholder Information
As of March 10, 2017, we had approximately 76.0 million shares of common stock outstanding held by a total of approximately 19,000 stockholders. The number of stockholders is based on the records of DST Systems, Inc., who serves as our transfer agent.
Market Information
No public market currently exists for our shares of common stock and we currently have no plans to list our shares on a national securities exchange. Until our shares are listed, if ever, our stockholders may not sell their shares unless the buyer meets the applicable suitability and minimum purchase requirements. In addition, our charter prohibits the ownership of more than 9.8% in value of our outstanding capital stock (which includes common stock and preferred stock we may issue) and more than 9.8% in value or number of shares, whichever is more restrictive, of our outstanding common stock, unless exempted by our board of directors. Consequently, there is the risk that our stockholders may not be able to sell their shares at a time or price acceptable to them.
Estimated Value Per Share
Background
In November 2016, our board of directors initiated a process to determine an estimated value per share of the shares of our common stock. We are providing an estimated value per share to assist broker-dealers that participated in our public offerings in meeting their customer account statement reporting obligations under FINRA Rule 2340. This valuation was performed in accordance with Practice Guideline 2013-01, Valuations of Publicly Registered Non-Listed REITs, issued by the Investment Program Association, or IPA, in April 2013, or the IPA valuation guidelines. Our board of directors formed a valuation committee, comprised solely of independent directors, to oversee the process of determining our estimated value per share. Upon approval of the board of directors, we engaged CBRE Capital Advisors, Inc., or CBRE Cap, a FINRA registered broker dealer firm that specializes in providing real estate financial services, to provide property-level and aggregate valuation analyses and a range for the estimated value per share of our common stock as of December 31, 2016.
From CBRE Cap’s engagement through the issuance of its valuation report on February 15, 2017, or the valuation report, CBRE Cap held discussions with our advisor and our senior management and conducted or commissioned such investigations, research, review and analyses as it deemed necessary. CBRE Cap based its calculation of the range in estimated value per share of our common stock upon appraisals of all our real properties performed by CBRE, Inc., or CBRE, an affiliate of CBRE Cap and an independent third party appraisal firm, and valuations performed by our advisor with respect to our other assets and liabilities. The valuation committee, upon its receipt and review of the valuation report, concluded that the range between $10.96 and $12.32 for our estimated value per share proposed in CBRE Cap’s valuation report was reasonable and
33
recommended that the board of directors adopt $11.65 as the estimated value per share of our common stock as of December 31, 2016. The estimated value per share represents the weighted average of the range reflecting the effect of using differing
discount rates in the sensitivity analysis. On February 15, 2017, our board of directors accepted the recommendation of the valuation committee and approved $11.65 as the estimated value per share of our common stock as of December 31, 2016. CBRE Cap is not responsible for the determination of the estimated value per share of our common stock as of December 31, 2016.
Valuation Methodology
In preparing the valuation report, CBRE Cap, among other things:
• | reviewed financial and operating information requested from or provided by our advisor and us; |
• | reviewed and discussed with us and our advisor the historical and anticipated future financial performance of our multifamily properties, including forecasts prepared by us and our advisor; |
• | reviewed appraisals commissioned by us which contained analysis on each of our multifamily properties and performed analyses and studies for each property; |
• | conducted or reviewed CBRE Cap proprietary research, including market and sector capitalization rate surveys; |
• | reviewed third-party research, including equity reports and online data providers; |
• | compared our financial information to similar information of companies that CBRE Cap deemed to be comparable; |
• | reviewed our reports filed with the SEC, including our Quarterly Report on Form 10-Q for the period ended September 30, 2016, and the unaudited financial statements therein; and |
• | reviewed the unaudited financial statements as of December 31, 2016, as prepared by us. |
These appraisals were performed in accordance with Uniform Standards of Professional Appraisal Practice and were all Member of Appraisal Institute, or MAI, appraisals. The appraisals were prepared by CBRE and personnel who are members and hold the MAI designation. CBRE Cap reviewed and took into consideration the appraisals of CBRE, and described the results of such appraisals in its valuation report. Discreet values were assigned to each property in our portfolio.
Our valuation committee and board of directors considered the following valuation methodology with respect to each multifamily property, which was applied by CBRE Cap in its valuation report. Unlevered, ten-year discounted cash flow analyses from appraisals were created for our fully operational properties. For non-stabilized properties, lease-up discounts were applied to discounted cash flow to arrive at an “As Is” value. The “terminal capitalization rate” method was used to calculate terminal value of the assets, with such rates varying based on the specific geographic location and other relevant factors.
Valuation Summary: Material Assumptions
The valuation process we used to determine an estimated value per share was designed to follow the recommendations of the IPA valuation guidelines.
The following table summarizes the key assumptions that were employed by CBRE Cap in the discounted cash flow models to estimate the value of our real estate assets:
Range | Weighted-Average | |||
Terminal capitalization rate | 6.14% - 6.45% | 6.29% | ||
Discount rate | 7.45% - 7.84% | 7.64% | ||
While we believe that CBRE’s assumptions and inputs are reasonable, a change in these assumptions and inputs may significantly impact the appraised value of the real estate properties and thus, our estimated value per share. The table below illustrates the impact on the estimated value per share if the terminal capitalization rates or discount rates were adjusted by
34
2.5% in either direction, which represents a 5% sensitivity analysis, in accordance with the IPA valuation guidelines, assuming all other factors remain unchanged:
Increase (Decrease) on the Estimated Value per Share due to | ||||||||
Decrease of 2.5% | Increase of 2.5% | |||||||
Terminal capitalization rate | $ | 0.33 | $ | (0.36 | ) | |||
Discount rate | 0.32 | (0.36 | ) | |||||
In its valuation report, CBRE Cap included an estimate of the December 31, 2016 value of our assets, including cash and select other assets net of payables, and accruals and other liabilities including notes payable. The estimated values of our notes payable are equal to the GAAP fair values for the year ended December 31, 2016, but do not equal the book value of the loans in accordance with GAAP. The GAAP fair values of our notes payable were determined using a discounted cash flow analysis. The discounted cash flow analysis was based on projected cash flow over the remaining loan terms and on management’s estimates of current market interest rates for instruments with similar characteristics. The carrying values of a majority of our other assets and liabilities are considered to equal their fair value due to their short term maturities or liquid nature. Certain balances, such as lease intangible assets and liabilities related to real estate investments and deferred financing costs, have been eliminated for the purpose of the valuation due to the fact that the value of those balances was already considered in the appraisals of the real estate properties.
Our estimated value per share takes into consideration any potential liability related to an incentive fee our advisor is entitled to upon meeting certain stockholder return thresholds in accordance with our charter. For purposes of determining the estimated value per share, our advisor calculated the potential liability related to this incentive fee based on a hypothetical liquidation of our assets and liabilities at their estimated fair values, without considering the impact of any potential closing costs and fees related to the disposition of real estate properties, and determined that there would be a liability related to the incentive fee of $6,540,119.
Taking into consideration the reasonableness of the valuation methodology, assumptions and conclusions contained in the valuation report, the board of directors determined the estimated value of our equity interest in its real estate portfolio to be in the range of $1,957,021,924 to $2,070,590,612 and the Company’s net asset value to range between $835,192,604 and $938,623,630, or between $10.96 and $12.32 per share, based on a share count of 76,202,862 shares issued and outstanding as of December 31, 2016.
As with any valuation methodology, the methodologies considered by the valuation committee and board of directors in reaching an estimate of the value of our shares are based upon all of the foregoing estimates, assumptions, judgments and opinions that may, or may not, prove to be correct. The use of different estimates, assumptions, judgments or opinions may have resulted in significantly different estimates of the value of our shares.
The following table summarizes the material components of our estimated value and estimated value per share as of December 31, 2016 and 2015.
Estimated Value as of December 31, | Estimated Value Per Share as of December 31, | |||||||||||||||
2016 | 2015 | 2016 | 2015 | |||||||||||||
Real estate properties | $ | 2,014,340,000 | $ | 1,988,400,000 | $ | 26.43 | $ | 25.93 | ||||||||
Cash | 66,224,027 | 32,076,582 | 0.87 | 0.42 | ||||||||||||
Other assets | 65,175,883 | 34,533,491 | 0.86 | 0.45 | ||||||||||||
Mortgage debt | (1,197,015,105 | ) | (1,118,126,231 | ) | (15.71 | ) | (14.58 | ) | ||||||||
Other liabilities | (54,790,262 | ) | (51,665,674 | ) | (0.72 | ) | (0.67 | ) | ||||||||
Incentive fee | (6,540,119 | ) | (8,278,117 | ) | (0.09 | ) | (0.11 | ) | ||||||||
Estimated value per share | $ | 887,394,424 | $ | 876,940,051 | $ | 11.65 | $ | 11.44 | ||||||||
35
The estimated value of the real estate properties as of December 31, 2016 and 2015 was $2,014,340,000 and $1,988,400,000, respectively, while the total cost of the real estate properties was $1,720,653,099 and $1,693,275,223, respectively (comprised of the aggregate contractual purchase price and capital expenditures subsequent to acquisition).
Additional Information Regarding the Valuation, Limitations of Estimated Value per Share and the Engagement of CBRE Cap
In accordance with the IPA valuation guidelines, the valuation committee reviewed, confirmed and approved the processes and methodologies employed by CBRE Cap and their consistency with real estate industry standards and best practices.
The valuation report issued February 15, 2017, was based upon market, economic, financial and other information, circumstances and conditions existing prior to December 31, 2016, and any material change in such information, circumstances and/or conditions may have a material effect on the estimated value per share. CBRE Cap’s valuation materials were addressed solely to our board of directors to assist it in establishing an estimated value of our common stock. CBRE Cap’s valuation materials were restricted, were not addressed to the public and should not be relied upon by any other person to establish an estimated value of our common stock. The valuation report does not constitute a recommendation by CBRE Cap to purchase or sell any shares of our common stock and should not be represented as such.
Each of CBRE Cap and CBRE reviewed the information supplied or otherwise made available to it by us or our advisor, for reasonableness, and assumed and relied upon the accuracy and completeness of all such information and of all information supplied or otherwise made available to it by any other party, and did not undertake any duty or responsibility to verify independently any such information. With respect to operating or financial forecasts and other information and data provided to or otherwise reviewed by or discussed with CBRE Cap and CBRE, CBRE Cap and CBRE assumed that such forecasts and other information and data were reasonably prepared in good faith reflecting our and our advisor’s best currently available estimates and judgments and other subjective judgments, and relied upon us and our advisor to advise CBRE Cap and CBRE promptly if any information previously provided became inaccurate or was required to be updated during the period of its review. CBRE Cap assumes no obligation to update or otherwise revise these materials. In preparing its valuation materials, CBRE Cap did not, and was not requested to, solicit third party indications of interest for us in connection with possible purchases of our securities or the acquisition of all or any part of us.
In performing its analyses, CBRE Cap made numerous assumptions as of various points in time with respect to industry performance, general business, economic and regulatory conditions, current and future rental market for our operating properties and those in development and other matters, many of which are necessarily subject to change and beyond the control of CBRE Cap and us. The analyses performed by CBRE Cap are not necessarily indicative of actual values, trading values or actual future results of our common stock that might be achieved, all of which may be significantly more or less favorable than suggested by the valuation report. The analyses do not purport to be appraisals or to reflect the prices at which the properties may actually be sold, and such estimates are inherently subject to uncertainty. The actual value of our common stock may vary significantly depending on numerous factors that generally impact the price of securities, our financial condition and the state of the real estate industry more generally. Accordingly, with respect to the estimated value per share of our common stock, neither we nor CBRE Cap can give any assurance that:
• | a stockholder would be able to resell shares at this estimated value; |
• | a stockholder would ultimately realize distributions per share equal to our estimated value per share upon liquidation of our assets and settlement of our liabilities or a sale of the Company; |
• | another independent third party appraiser or third party valuation firm would agree with our estimated value per share; |
• | a third party would offer the estimated value per share in an arm’s length transaction to purchase all or substantially all of our shares of common stock; |
• | our shares would trade at a price equal to or greater than the estimated value per share if we listed them on a national securities exchange; or |
• | the methodology used to estimate our value per share would be acceptable to FINRA or under ERISA for compliance with its reporting requirements. |
36
The December 31, 2016 estimated value per share was reviewed and recommended by our valuation committee and approved by our board of directors at meetings held on February 15, 2017. The value of our common stock will fluctuate over time as a result of, among other things, developments related to individual assets and responses to the real estate and capital markets. We currently expect to utilize an independent valuation firm to update the estimated value per share as of December 31, 2017, in accordance with the IPA valuation guidelines.
The estimated value per share does not reflect a discount for the fact that we are externally managed, nor does it reflect a real estate portfolio premium/discount versus the sum of the individual property values. The estimated value per share does not take into account estimated disposition costs and fees for real estate properties that are not under contract to sell or debt prepayment penalties that could apply upon the prepayment of certain of our debt obligations or the impact of restrictions on the assumption of debt.
CBRE Cap is a FINRA registered broker-dealer and is an investment banking firm that specializes in providing real estate financial services. CBRE is actively engaged in the business of appraising commercial real estate properties similar to those owned by us in connection with public securities offerings, private placements, business combinations and similar transactions. We commissioned CBRE to deliver an appraisal report relating to our real estate properties and CBRE received fees upon delivery of such report. In addition, we have agreed to indemnify CBRE Cap against certain liabilities arising out of this engagement. Each of CBRE Cap and CBRE is an affiliate of CBRE Group, Inc., a Fortune 500 and S&P 500 company headquartered in Los Angeles, California, one of the world’s largest commercial real estate services and investment firms (in terms of 2016 revenue) and a parent holding company of affiliated companies that are engaged in the ordinary course of business in many areas related to commercial real estate and related services. CBRE Cap and its affiliates possess substantial experience in the valuation of assets similar to those owned by us and regularly undertake the valuation of securities in connection with public offerings, private placements, business combinations and similar transactions. For the preparation of the valuation report, we paid CBRE Cap a customary fee for services of this nature, no part of which was contingent relating to the provision of services or specific findings. We have not engaged CBRE Cap for any other services. During the past three years, CBRE Cap assisted our board of directors in the determination of the estimated value per share and certain of our affiliates engaged affiliates of CBRE primarily for various real estate-related services and these affiliates of CBRE received fees in connection with such services. In addition, we anticipate that affiliates of CBRE will continue to provide similar or other real estate-related services in the future for us and our affiliates. We may in our discretion engage CBRE Cap to assist our board of directors in future determinations of our estimated value per share. We are not affiliated with CBRE, CBRE Cap or any of their affiliates. CBRE Cap and CBRE and their affiliates may from time to time in the future perform other commercial real estate appraisal, valuation and financial advisory services for us and our affiliates in transactions related to the properties that are the subjects of the appraisals, so long as such other services do not adversely affect the independence of the applicable CBRE appraiser. While we and affiliates of our advisor have engaged and may engage CBRE Cap or its affiliates in the future for commercial real estate services of various kinds, we believe that there are no material conflicts of interest with respect to our engagement of CBRE Cap.
In the ordinary course of their business, each of CBRE Cap and CBRE, and their respective affiliates, directors and officers may structure and effect transactions for their own accounts or for the accounts of their customers in commercial real estate assets of the same kind and in the same markets as our assets.
Distribution Information
To qualify and maintain our qualification as a REIT, we must meet certain organizational and operational requirements, including a requirement to distribute at least 90% of our REIT taxable income (computed without regard to the dividends-paid deduction or net capital gain and which does not necessarily equal net income as calculated in accordance with GAAP). Our board of directors may authorize distributions in excess of those required for us to maintain REIT status depending on our financial condition and such other factors as our board of directors deems relevant.
We declared distributions based on daily record dates for each day during the period commencing August 12, 2010 (the day following our first property acquisition) through December 31, 2016. Distributions declared for all record dates of a given month are paid approximately three days after month-end. Distributions currently declared are calculated at a rate of $0.001958 per share of common stock per day, which if paid each day over a 366-day period is equivalent to a 7.0% annualized distribution rate based on a purchase price of $10.24 per share of common stock. Prior to April 1, 2016, distributions were
37
calculated at a rate of $0.001964 per share of common stock per day, which if paid each day over a 365-day period was equivalent to a 7.0% annualized distribution rate based on a purchase price of $10.24 per share of common stock. Prior to September 10, 2012, distributions were calculated at a rate of $0.001917 per share of common stock per day, which was equivalent to a 7.0% annualized distribution rate based on a purchase price of $10.00 per share of common stock. There is no guarantee that we will pay distributions at this rate in the future or at all.
Distributions declared during the years ended December 31, 2016 and 2015 are as follows:
2016 | |||||||||||||||||||
1st Quarter | 2nd Quarter | 3rd Quarter | 4th Quarter | Total | |||||||||||||||
Total Distributions Declared | $ | 13,649,330 | $ | 13,673,510 | $ | 13,767,424 | $ | 13,738,003 | $ | 54,828,267 | |||||||||
Total Per Share Distribution | $ | 0.178 | $ | 0.178 | $ | 0.180 | $ | 0.180 | $ | 0.716 | |||||||||
Annualized Rate Based on Purchase Price | 7.0 | % | 7.0 | % | 7.0 | % | 7.0 | % | 7.0 | % | |||||||||
2015 | |||||||||||||||||||
1st Quarter | 2nd Quarter | 3rd Quarter | 4th Quarter | Total | |||||||||||||||
Total Distributions Declared | $ | 13,585,679 | $ | 13,736,290 | $ | 13,888,802 | $ | 13,865,446 | $ | 55,076,217 | |||||||||
Total Per Share Distribution | $ | 0.177 | $ | 0.179 | $ | 0.181 | $ | 0.181 | $ | 0.718 | |||||||||
Annualized Rate Based on Purchase Price | 7.0 | % | 7.0 | % | 7.0 | % | 7.0 | % | 7.0 | % | |||||||||
The tax composition of our distributions declared for the years ended December 31, 2016 and 2015 was as follows:
December 31, | ||||||
2016 | 2015 | |||||
Ordinary income | — | % | 17.6 | % | ||
Return of capital | 100.0 | % | 82.4 | % | ||
Total | 100.0 | % | 100.0 | % | ||
On October 21, 2014, our board of directors elected to suspend our distribution reinvestment plan, effective with distributions earned beginning on December 1, 2014. All distributions paid following November 20, 2014 are paid in cash. For additional information on our distributions, see Item 7. “Management’s Discussion and Analysis of Financial Condition and Results of Operations—Distributions.”
Unregistered Sales of Equity Securities
On August 9, 2016, we granted each of the three independent directors 2,500 shares of restricted common stock upon re-election to our board of directors pursuant to our independent directors’ compensation plan. The shares of restricted common stock issued pursuant to our independent directors’ compensation plan were issued in transactions exempt from registration pursuant to Section 4(2) of the Securities Act.
Share Repurchase Program
Our share repurchase program may provide an opportunity for our stockholders to have their shares of common stock repurchased by us, subject to certain restrictions and limitations. No shares can be repurchased under our share repurchase program until after the first anniversary of the date of purchase of such shares; provided, however, that this holding period shall not apply to repurchases requested within two years after the death or disability of a stockholder.
38
The purchase price for shares repurchased under our share repurchase program will be as follows:
Share Purchase Anniversary | Repurchase Price on Repurchase Date(1) | |
Less than 1 year | No Repurchase Allowed | |
1 year | 92.5% of Estimated Value per Share(2) | |
2 years | 95.0% of Estimated Value per Share(2) | |
3 years | 97.5% of Estimated Value per Share(2) | |
4 years | 100.0% of Estimated Value per Share(2) | |
In the event of a stockholder’s death or disability(3) | Average Issue Price for Shares(4) | |
________________
(1) | As adjusted for any stock dividends, combinations, splits, recapitalizations or any similar transaction with respect to the shares of common stock. |
(2) | For purposes of the share repurchase program, the “estimated value per share” will equal the most recently determined estimated value per share. |
(3) | The required one year holding period to be eligible to redeem shares under our share repurchase program does not apply in the event of death or disability of a stockholder. |
(4) | The purchase price per share for shares redeemed upon the death or disability of a stockholder will be equal to the average issue price per share for all of the stockholder’s shares. |
The purchase price per share for shares repurchased pursuant to the share repurchase program is further reduced by the aggregate amount of net proceeds per share, if any, distributed to our stockholders prior to the repurchase date as a result of the sale of one or more of our assets that constitutes a return of capital distribution as a result of such sales.
Repurchases of shares of our common stock are made quarterly upon written request to us at least 15 days prior to the end of the applicable quarter. Repurchase requests are honored approximately 30 days following the end of the applicable quarter, which we refer to as the “repurchase date.” Stockholders may withdraw their repurchase request at any time up to three business days prior to the end of the fiscal quarter. On October 21, 2014, our board of directors elected to suspend our share repurchase program, effective November 20, 2014. On May 12, 2015, our board of directors elected to reinstate the share repurchase program, effective July 1, 2015 on the terms and subject to the limitations described below.
We cannot guarantee that any funds set aside for the share repurchase program will be sufficient to accommodate all repurchase requests made in any quarter. In the event that the redemption requests exceed our restrictions on limitation or we do not have sufficient funds available to repurchase all of the shares of our common stock for which repurchase requests have been submitted in any quarter, priority will be given to redemption requests in the case of the death or disability of a stockholder. If we repurchase less than all of the shares subject to a repurchase request in any quarter, with respect to any shares which have not been repurchased, a stockholder could (1) withdraw the request for repurchase or (2) ask that we honor the request in a future quarter, if any, when such repurchases may be made pursuant to the limitations of the share repurchase program and when sufficient funds are available. Such pending requests would be honored among all requests for redemptions in any given redemption period as follows: first, pro rata as to redemptions sought upon a stockholder’s death or disability; and, next, pro rata as to other redemption requests.
We are not obligated to repurchase shares of our common stock under the share repurchase program. In no event shall redemptions under the share repurchase program exceed 5% of the weighted average number of shares of our common stock outstanding during the prior calendar year. Effective July 1, 2015, our board of directors determined to limit the amount of shares repurchased pursuant to the share repurchase program to an amount not to exceed $2,000,000 during the quarter beginning July 1, 2015, with each subsequent quarter not to exceed $1,000,000. On August 9, 2016, our board of directors approved and authorized an increase to the value of the shares that may be repurchased pursuant to the share repurchase program from $1,000,000 to $2,000,000 per quarter, effective on the October 2016 repurchase date. There is no fee in connection with a repurchase of shares of our common stock.
39
In addition, our board of directors may, in its sole discretion, amend, suspend, or terminate the share repurchase program at any time upon 30 days notice to our stockholders if it determines that the funds available to fund the share repurchase program are needed for other business or operational purposes or that amendment, suspension or termination of the share repurchase program is in the best interest of our stockholders. Therefore, stockholders may not have the opportunity to make a repurchase request prior to any potential termination of our share repurchase program.
During the year ended December 31, 2016, we fulfilled redemption requests and redeemed shares of our common stock pursuant to our share repurchase program as follows:
Total Number of Shares Requested to be Redeemed(1) | Total Number of Shares Redeemed | Average Price Paid per Share(2)(3) | Approximate Dollar Value of Shares Available That May Yet Be Redeemed Under the Program | |||||||||
January 2016 | 95,406 | 99,243 | $ | 10.08 | (4) | |||||||
February 2016 | 45,778 | — | — | (4) | ||||||||
March 2016 | 206,328 | — | — | (4) | ||||||||
April 2016 | 110,658 | 96,215 | 10.39 | (4) | ||||||||
May 2016 | 81,565 | — | — | (4) | ||||||||
June 2016 | 74,727 | — | — | (4) | ||||||||
July 2016 | 163,822 | 93,939 | 10.65 | (4) | ||||||||
August 2016 | 134,534 | — | — | (4) | ||||||||
September 2016 | 172,021 | — | — | (4) | ||||||||
October 2016 | 103,251 | 189,750 | 10.54 | (4) | ||||||||
November 2016 | 98,598 | — | — | (4) | ||||||||
December 2016 | 48,721 | — | — | (4) | ||||||||
1,335,409 | 479,147 | |||||||||||
________________
(1) | We generally redeem shares on the last business day of the month following the end of each fiscal quarter in which requests were received. On January 31, 2017, we redeemed 183,955 shares of our common stock for a total redemption value of $2,000,000, or $10.87 per share, pursuant to our share repurchase program. |
(2) | Pursuant to the plan, as amended, we currently repurchase shares at prices determined as follows: |
• | 92.5% of the estimated value per share for stockholders who have held their shares for at least one year; |
• | 95.0% of the estimated value per share for stockholders who have held their shares for at least two years; |
• | 97.5% of the estimated value per share for stockholders who have held their shares for at least three years; and |
• | 100% of the estimated value per share for stockholders who have held their shares for at least four years. |
Notwithstanding the above, the repurchase price for repurchases sought upon a stockholder’s death, “qualifying disability” or “determination of incompetence” will be the amount the respective stockholder paid to acquire the shares from us.
(3) | For the year ended December 31, 2016, the sources of the cash used to redeem shares were 58% from cash flow from operations and 42% from available financings from our credit facilities. |
(4) | The number of shares that may be redeemed pursuant to the share repurchase program during any calendar year is limited to 5% of the weighted-average number of shares outstanding during the prior calendar year and the value of the shares repurchased shall not exceed $2,000,000 during the quarter beginning July 1, 2015, with shares repurchased |
40
each subsequent quarter not to exceed $1,000,000. Effective with the October 2016 repurchase date, the value of the shares that may be repurchased pursuant to the share repurchase program increased from $1,000,000 to $2,000,000.
ITEM 6. | SELECTED FINANCIAL DATA |
The following selected financial data as of December 31, 2016, 2015, 2014, 2013 and 2012, and for the years then ended, should be read in conjunction with the accompanying consolidated financial statements and related notes thereto and Item 7. “Management’s Discussion and Analysis of Financial Condition and Results of Operations.”
Our results of operations for the periods presented below are not indicative of those expected in future periods.
As of December 31, | |||||||||||||||||||
2016 | 2015 | 2014 | 2013 | 2012 | |||||||||||||||
Balance sheet data | |||||||||||||||||||
Total real estate, net | $ | 1,461,534,875 | $ | 1,503,455,095 | $ | 1,538,610,961 | $ | 1,470,963,159 | $ | 559,972,087 | |||||||||
Total assets | 1,592,934,785 | 1,570,303,350 | 1,609,067,128 | 1,561,889,854 | 582,586,556 | ||||||||||||||
Notes payable | 1,217,716,280 | 1,115,752,899 | 1,084,757,025 | 987,329,800 | 413,802,388 | ||||||||||||||
Total liabilities | 1,272,506,542 | 1,163,855,827 | 1,132,003,898 | 1,031,826,319 | 427,455,885 | ||||||||||||||
Redeemable common stock | — | — | — | 12,945,007 | 3,049,521 | ||||||||||||||
Total stockholders’ equity | 320,428,243 | 406,447,523 | 477,063,230 | 517,118,528 | 152,081,150 | ||||||||||||||
For the Years Ended December 31, | |||||||||||||||||||
2016 | 2015 | 2014 | 2013 | 2012 | |||||||||||||||
Operating data | |||||||||||||||||||
Total revenues | $ | 218,237,532 | $ | 209,390,658 | $ | 195,929,856 | 109,101,517 | $ | 30,586,932 | ||||||||||
Net loss | (25,579,651 | ) | (13,024,358 | ) | (25,742,292 | ) | (55,879,857 | ) | (22,559,927 | ) | |||||||||
Net loss attributable to common stockholders | (25,579,651 | ) | (13,024,358 | ) | (25,742,292 | ) | (55,879,857 | ) | (22,559,927 | ) | |||||||||
Loss per common share - basic and diluted | (0.34 | ) | (0.18 | ) | (0.34 | ) | (1.39 | ) | (1.84 | ) | |||||||||
Other data | |||||||||||||||||||
Cash flows provided by (used in) operating activities | 54,259,420 | 51,424,087 | 50,350,848 | (2,249,133 | ) | (4,563,196 | ) | ||||||||||||
Cash flows used in investing activities | (56,905,196 | ) | (29,660,218 | ) | (126,817,478 | ) | (849,128,988 | ) | (382,505,492 | ) | |||||||||
Cash flows provided by (used in) financing activities | 36,793,221 | (19,216,599 | ) | 86,443,737 | 861,401,662 | 384,396,671 | |||||||||||||
Distributions declared | 54,828,267 | 55,076,217 | 54,296,664 | 28,645,761 | 8,636,158 | ||||||||||||||
Distributions declared per common share(1) | 0.716 | 0.718 | 0.718 | 0.718 | 0.706 | ||||||||||||||
Weighted-average number of common shares outstanding, basic and diluted | 76,195,083 | 76,335,114 | 75,450,215 | 40,169,940 | 12,238,094 | ||||||||||||||
FFO(2) | 43,933,833 | 52,615,838 | 33,994,751 | (7,404,678 | ) | (7,602,070 | ) | ||||||||||||
MFFO(2) | 49,117,817 | 55,143,904 | 45,002,936 | 19,253,075 | 5,828,557 | ||||||||||||||
________________
(1) | Distributions declared per common share for the years ended December 31, 2016, 2015, 2014, 2013 and 2012 assumes each share was issued and outstanding each day of each year. Distributions currently declared are calculated at a rate of $0.001958 per share of common stock per day, which if paid each day over a 366-day period is equivalent to a 7.0% annualized distribution rate based on a purchase price of $10.24 per share of common stock. Prior to April 1, 2016, distributions were calculated at a rate of $0.001964 per share of common stock per day, which if paid each day over a 365-day period was equivalent to a 7.0% annualized distribution rate based on a purchase price of $10.24 per share of common stock. Prior to September 10, 2012, distributions were calculated at a rate of $0.001917 per share of common |
41
stock per day, which was equivalent to a 7.0% annualized distribution rate based on a purchase price of $10.00 per share of common stock.
(2) | GAAP basis accounting for real estate assets utilizes historical cost accounting and assumes real estate values diminish over time. In an effort to overcome the difference between real estate values and historical cost accounting for real estate assets, the Board of Governors of the National Association of Real Estate Investment Trusts, or NAREIT, established the measurement tool of funds from operations, or FFO. Since its introduction, FFO has become a widely used non-GAAP financial measure among REITs. Additionally, we use modified funds from operations, or MFFO, as defined by the IPA as a supplemental measure to evaluate our operating performance. MFFO is based on FFO but includes certain adjustments we believe are necessary due to changes in accounting and reporting under GAAP since the establishment of FFO. Neither FFO or MFFO should be considered as alternatives to net loss or other measurements under GAAP as indicators of our operating performance, nor should they be considered as alternatives to cash flow from operating activities or other measurements under GAAP as indicators of liquidity. For additional information on how we calculate FFO and MFFO and a reconciliation of FFO and MFFO to net loss, see Item 7. “Management’s Discussion and Analysis of Financial Condition and Results of Operations—Funds From Operations and Modified Funds From Operations.” |
ITEM 7. | MANAGEMENT’S DISCUSSION AND ANALYSIS OF FINANCIAL CONDITION AND RESULTS OF OPERATIONS |
The following discussion and analysis should be read in conjunction with the “Selected Financial Data” above and our accompanying consolidated financial statements and the notes thereto included in this annual report. Also see “Cautionary Note Regarding Forward-Looking Statements” preceding Part I.
Overview
We were formed on May 4, 2009, as a Maryland corporation that has elected to qualify as a real estate investment trust, or REIT. We invest in and manage a diverse portfolio of real estate investments, primarily in the multifamily sector, located throughout the United States.
On July 19, 2010, we commenced our initial public offering of up to a maximum of 150,000,000 shares of common stock and up to 15,789,474 shares of common stock pursuant to our distribution reinvestment plan. Upon termination of our public offering on December 20, 2013, we had sold 73,608,337 shares of common stock for gross proceeds of $745,389,748, including 1,588,289 shares of common stock issued pursuant to our distribution reinvestment plan for gross offering proceeds of $15,397,232. Following the termination of our initial public offering, we continued to offer shares of our common stock pursuant to our distribution reinvestment plan until our board of directors determined to suspend our distribution reinvestment plan, effective December 1, 2014. On March 10, 2015, our board of directors determined an estimated value per share of our common stock of $10.35 as of December 31, 2014. On February 25, 2016, our board of directors determined an estimated value per share of our common stock of $11.44 as of December 31, 2015. On February 15, 2017, our board of directors determined an estimated value per share of our common stock of $11.65 as of December 31, 2016.
Prior to the commencement of our public offering, we sold shares of our common stock in a private offering exempt from the registration requirements of the Securities Act. Upon termination of the private offering, we had sold 637,279 shares of common stock at $9.40 per share (subject to certain discounts) for gross offering proceeds of $5,844,325.
Steadfast Income Advisor, LLC is our advisor. Subject to certain restrictions and limitations, our advisor manages our day-to-day operations and our portfolio of properties and real estate-related assets. Our advisor sources and presents investment opportunities to our board of directors. Our advisor also provides investment management, marketing, investor relations and other administrative services on our behalf.
Substantially all of our business is conducted through Steadfast Income REIT Operating Partnership, L.P., our operating partnership. We are the sole general partner of our operating partnership. The initial limited partner of our operating partnership is our advisor. The limited partnership agreement of our operating partnership provides that our operating partnership will be operated in a manner that will enable us to: (1) satisfy the requirements for being classified as a REIT for tax purposes, (2)
42
avoid any federal income or excise tax liability and (3) ensure that our operating partnership will not be classified as a “publicly traded partnership” for purposes of Section 7704 of the Internal Revenue Code, which classification could result in our operating partnership being taxed as a corporation, rather than as a partnership. In addition to the administrative and operating costs and expenses incurred by our operating partnership in acquiring and operating real properties, our operating partnership will pay all of our administrative costs and expenses, and such expenses will be treated as expenses of our operating partnership.
We have made an election to be taxed as a REIT under the Internal Revenue Code beginning with the taxable year ended December 31, 2010. As a REIT, we generally will not be subject to federal income tax to the extent that we distribute qualifying dividends to our stockholders. If we fail to qualify as a REIT in any taxable year, we will be subject to federal income tax on our taxable income at regular corporate rates and will not be permitted to qualify for treatment as a REIT for federal income tax purposes for four years following the year in which qualification is denied. Failing to qualify as a REIT could materially and adversely affect our net income.
Market Outlook
During times of economic downturn, market conditions could negatively impact the multifamily real estate sector, resulting in lower occupancy, lower rental rates and declining values. The economy in the United States has improved; however, there is no assurance that economic conditions will continue to improve or will not worsen in the future. We believe we currently have unique investment opportunities, particularly in the multifamily sector. Home ownership rates are the lowest they have been since 1967. Demographic and economic factors favor the flexibility of rental housing and discourage the potential financial burden associated with home ownership. Additionally, Millennials and Baby Boomers, the two largest demographic groups comprising roughly half of the total population in the United States, are increasingly choosing rental housing over home ownership. Our plan is to provide rental housing for these generational groups as they age. Millennials are getting married and having children later and are choosing to live in apartment communities until their mid-30s. Today, 30% of Millennials are still living with their parents or are still in school. When they get a job, Millennials will likely rent moderate income apartments based upon an average income of $35,000 - $55,000. We believe these factors will continue to contribute to the demand for multifamily housing.
43
Our Real Estate Portfolio
As of December 31, 2016, we owned the 65 multifamily properties listed below:
Contract Purchase Price(1) | Mortgage Debt Outstanding at December 31, 2016 | Average Occupancy(2) as of | Average Monthly Rent(3) as of | |||||||||||||||||||||||||||
Property Name | Location | Purchase Date | Number of Units | Dec 31, 2016 | Dec 31, 2015 | Dec 31, 2016 | Dec 31, 2015 | |||||||||||||||||||||||
1 | Park Place Condominiums | Des Moines, IA | 12/22/2010 | 151 | $ | 8,323,400 | $ | 4,684,651 | 86.8 | % | 94.7 | % | $ | 846 | $ | 877 | ||||||||||||||
2 | Clarion Park Apartments | Olathe, KS | 6/28/2011 | 220 | 11,215,000 | 8,136,274 | 89.5 | % | 95.0 | % | 815 | 781 | ||||||||||||||||||
3 | Cooper Creek Village Apartments | Louisville, KY | 8/24/2011 | 123 | 10,420,000 | 6,224,663 | 91.9 | % | 94.3 | % | 947 | 903 | ||||||||||||||||||
4 | Truman Farm Villas | Grandview, MO | 12/22/2011 | 200 | 9,100,000 | 5,465,173 | 97.5 | % | 98.5 | % | 724 | 697 | ||||||||||||||||||
5 | EBT Lofts | Kansas City, MO | 12/30/2011 | 102 | 8,575,000 | 5,167,644 | 93.1 | % | 95.1 | % | 1,035 | 1,009 | ||||||||||||||||||
6 | Windsor on the River Apartments | Cedar Rapids, IA | 1/26/2012 | 424 | 33,000,000 | 22,650,962 | 89.9 | % | 92.2 | % | 722 | 688 | ||||||||||||||||||
7 | Renaissance at St. Andrews | Louisville, KY | 2/17/2012 | 216 | 12,500,000 | 8,509,637 | 90.7 | % | 94.9 | % | 698 | 705 | ||||||||||||||||||
8 | Spring Creek Apartments | Edmond, OK | 3/9/2012 | 252 | 19,350,000 | 12,854,648 | 93.7 | % | 95.6 | % | 869 | 842 | ||||||||||||||||||
9 | Montclair Parc Apartment Homes | Oklahoma City, OK | 4/26/2012 | 360 | 35,750,000 | 22,770,672 | 91.9 | % | 94.7 | % | 866 | 864 | ||||||||||||||||||
10 | Sonoma Grande Apartments | Tulsa, OK | 5/24/2012 | 336 | 32,200,000 | 21,372,685 | 94.0 | % | 93.8 | % | 922 | 956 | ||||||||||||||||||
11 | Estancia Apartments | Tulsa, OK | 6/29/2012 | 294 | 27,900,000 | 20,738,073 | 92.5 | % | 93.9 | % | 940 | 967 | ||||||||||||||||||
12 | Montelena Apartments | Round Rock, TX | 7/13/2012 | 232 | 18,350,000 | 11,617,425 | 93.1 | % | 93.5 | % | 1,097 | 1,071 | ||||||||||||||||||
13 | Valley Farms Apartment Homes | Louisville, KY | 8/30/2012 | 160 | 15,100,000 | 9,580,194 | 94.4 | % | 93.8 | % | 895 | 857 | ||||||||||||||||||
14 | Hilliard Park Apartments | Columbus, OH | 9/11/2012 | 201 | 19,800,000 | 12,935,281 | 96.5 | % | 91.5 | % | 1,047 | 998 | ||||||||||||||||||
15 | Sycamore Terrace Apartments | Terre Haute, IN | 9/20/2012 & 3/5/2014 | 250 | 23,174,157 | 17,794,863 | 93.6 | % | 97.6 | % | 1,134 | 1,154 | ||||||||||||||||||
16 | Hilliard Summit Apartments | Columbus, OH | 9/28/2012 | 208 | 24,100,000 | 15,710,108 | 93.3 | % | 92.8 | % | 1,205 | 1,105 | ||||||||||||||||||
17 | Springmarc Apartments | San Marcos, TX | 10/19/2012 | 240 | 21,850,000 | 14,478,724 | 93.3 | % | 97.9 | % | 966 | 956 | ||||||||||||||||||
18 | Renaissance at St. Andrews Condominiums(4) | Louisville, KY | 10/31/2012 | 30 | 1,423,000 | — | 93.3 | % | 100.0 | % | 779 | 689 | ||||||||||||||||||
19 | Ashley Oaks Apartment Homes | San Antonio, TX | 11/29/2012 | 462 | 30,790,000 | 24,599,195 | 97.0 | % | 95.2 | % | 818 | 793 | ||||||||||||||||||
20 | Arrowhead Apartment Homes | Palatine, IL | 11/30/2012 | 200 | 16,750,000 | 11,780,189 | 89.5 | % | 93.5 | % | 1,050 | 1,061 | ||||||||||||||||||
21 | The Moorings Apartments | Roselle, IL | 11/30/2012 | 216 | 20,250,000 | 14,240,269 | 93.5 | % | 95.8 | % | 1,129 | 1,080 | ||||||||||||||||||
22 | Forty 57 Apartments | Lexington, KY | 12/20/2012 | 436 | 52,500,000 | 37,031,543 | 94.7 | % | 95.2 | % | 919 | 881 | ||||||||||||||||||
44
Contract Purchase Price(1) | Mortgage Debt Outstanding at December 31, 2016 | Average Occupancy(2) as of | Average Monthly Rent(3) as of | |||||||||||||||||||||||||||
Property Name | Location | Purchase Date | Number of Units | Dec 31, 2016 | Dec 31, 2015 | Dec 31, 2016 | Dec 31, 2015 | |||||||||||||||||||||||
23 | Keystone Farms Apartments | Nashville, TN | 12/28/2012 | 90 | $ | 8,400,000 | $ | 5,838,649 | 95.6 | % | 100.0 | % | $ | 1,254 | $ | 1,138 | ||||||||||||||
24 | Riverford Crossing Apartments | Frankfort, KY | 12/28/2012 | 300 | 30,000,000 | 21,047,995 | 93.7 | % | 95.3 | % | 872 | 835 | ||||||||||||||||||
25 | Valley Farms North(5) | Louisville, KY | 12/28/2012 | 128 | 14,607,032 | 9,670,974 | 93.0 | % | 74.2 | % | 989 | 885 | ||||||||||||||||||
26 | Montecito Apartments | Austin, TX | 12/31/2012 | 268 | 19,000,000 | 13,398,273 | 91.4 | % | 97.0 | % | 940 | 908 | ||||||||||||||||||
27 | Hilliard Grand Apartments | Dublin, OH | 12/31/2012 | 314 | 40,500,000 | 29,112,914 | 93.0 | % | 94.9 | % | 1,235 | 1,252 | ||||||||||||||||||
28 | The Hills at Fair Oaks | Fair Oaks Ranch, TX | 1/31/2013 | 288 | 34,560,000 | 23,877,008 | 94.8 | % | 91.7 | % | 1,003 | 1,032 | ||||||||||||||||||
29 | Library Lofts East | Kansas City, MO | 2/28/2013 | 118 | 12,750,000 | 8,517,144 | 94.1 | % | 95.8 | % | 1,048 | 981 | ||||||||||||||||||
30 | Trails at Buda Ranch | Buda, TX | 3/28/2013 | 264 | 23,000,000 | 20,793,446 | 97.0 | % | 97.0 | % | 1,058 | 1,003 | ||||||||||||||||||
31 | Deep Deuce at Bricktown | Oklahoma City, OK | 3/28/2013 | 294 | 38,220,000 | 25,019,201 | 92.2 | % | 92.5 | % | 1,287 | 1,349 | ||||||||||||||||||
32 | Deer Valley Apartments | Lake Bluff, IL | 4/30/2013 | 224 | 28,600,000 | 22,796,336 | 94.6 | % | 92.4 | % | 1,290 | 1,262 | ||||||||||||||||||
33 | Grayson Ridge Apartment Homes | North Richland Hills, TX | 5/31/2013 | 240 | 14,300,000 | 13,873,891 | 96.3 | % | 95.4 | % | 872 | 815 | ||||||||||||||||||
34 | Rosemont at Olmos Park | San Antonio, TX | 5/31/2013 | 144 | 22,050,000 | 14,113,839 | 97.2 | % | 93.8 | % | 1,265 | 1,218 | ||||||||||||||||||
35 | Retreat at Quail North | Oklahoma City, OK | 6/12/2013 | 240 | 25,250,000 | 16,686,497 | 92.9 | % | 94.6 | % | 949 | 948 | ||||||||||||||||||
36 | Lodge at Trails Edge | Indianapolis, IN | 6/18/2013 | 268 | 18,400,000 | 12,053,618 | 96.3 | % | 94.8 | % | 727 | 714 | ||||||||||||||||||
37 | Arbors of Carrollton | Carrollton, TX | 7/3/2013 | 131 | 8,800,000 | 5,970,787 | 96.9 | % | 95.4 | % | 957 | 893 | ||||||||||||||||||
38 | Waterford on the Meadow | Plano, TX | 7/3/2013 | 350 | 23,100,000 | 15,850,173 | 93.7 | % | 96.6 | % | 989 | 885 | ||||||||||||||||||
39 | The Belmont | Grand Prairie, TX | 7/26/2013 | 260 | 12,100,000 | 8,817,677 | 94.6 | % | 95.4 | % | 887 | 767 | ||||||||||||||||||
40 | Meritage at Steiner Ranch | Austin, TX | 8/6/2013 | 502 | 80,000,000 | 58,137,072 | 91.2 | % | 94.0 | % | 1,414 | 1,368 | ||||||||||||||||||
41 | Tapestry Park Apartments | Birmingham, AL | 8/13/2013 & 12/1/2014 | 354 | 50,285,000 | 43,595,145 | 94.6 | % | 95.2 | % | 1,278 | 1,273 | ||||||||||||||||||
42 | Dawntree Apartments | Carrollton, TX | 8/15/2013 | 400 | 24,000,000 | 15,138,014 | 95.3 | % | 96.0 | % | 928 | 836 | ||||||||||||||||||
43 | Stuart Hall Lofts | Kansas City, MO | 8/27/2013 | 115 | 16,850,000 | 15,968,742 | 91.3 | % | 96.5 | % | 1,287 | 1,274 | ||||||||||||||||||
44 | BriceGrove Park Apartments | Canal Winchester, OH | 8/29/2013 | 240 | 20,100,000 | 17,072,164 | 95.0 | % | 95.0 | % | 858 | 815 | ||||||||||||||||||
45 | Retreat at Hamburg Place | Lexington, KY | 9/5/2013 | 150 | 16,300,000 | 12,031,675 | 96.0 | % | 94.0 | % | 1,010 | 953 | ||||||||||||||||||
46 | Cantare at Indian Lake Village | Hendersonville, TN | 9/24/2013 | 206 | 29,000,000 | 28,090,912 | 94.7 | % | 96.1 | % | 1,116 | 1,164 | ||||||||||||||||||
47 | The Landing at Mansfield | Mansfield, TX | 9/27/2013 | 336 | 30,900,000 | 27,151,099 | 95.8 | % | 97.0 | % | 1,027 | 949 | ||||||||||||||||||
45
Contract Purchase Price(1) | Mortgage Debt Outstanding at December 31, 2016 | Average Occupancy(2) as of | Average Monthly Rent(3) as of | |||||||||||||||||||||||||||
Property Name | Location | Purchase Date | Number of Units | Dec 31, 2016 | Dec 31, 2015 | Dec 31, 2016 | Dec 31, 2015 | |||||||||||||||||||||||
48 | Heights at 2121 | Houston, TX | 9/30/2013 | 504 | $ | 37,000,000 | $ | 38,211,186 | 91.5 | % | 92.5 | % | $ | 907 | $ | 957 | ||||||||||||||
49 | Villas at Huffmeister | Houston, TX | 10/10/2013 | 294 | 37,600,000 | 27,136,015 | 91.2 | % | 92.9 | % | 1,168 | 1,145 | ||||||||||||||||||
50 | Villas at Kingwood | Kingwood, TX | 10/10/2013 | 330 | 40,150,000 | 35,269,793 | 91.5 | % | 90.6 | % | 1,221 | 1,241 | ||||||||||||||||||
51 | Waterford Place at Riata Ranch | Cypress, TX | 10/10/2013 | 228 | 23,400,000 | 17,251,113 | 91.2 | % | 91.7 | % | 1,077 | 1,093 | ||||||||||||||||||
52 | Carrington Place | Houston, TX | 11/7/2013 | 324 | 32,900,000 | 27,260,883 | 92.3 | % | 92.0 | % | 1,035 | 1,054 | ||||||||||||||||||
53 | Carrington at Champion Forest | Houston, TX | 11/7/2013 | 284 | 33,000,000 | 24,861,504 | 93.7 | % | 96.1 | % | 1,066 | 1,099 | ||||||||||||||||||
54 | Carrington Park at Huffmeister | Cypress, TX | 11/7/2013 | 232 | 25,150,000 | 20,204,368 | 95.3 | % | 93.5 | % | 1,147 | 1,126 | ||||||||||||||||||
55 | Willow Crossing Apartments | Elk Grove, IL | 11/20/2013 | 579 | 58,000,000 | 57,611,490 | 93.1 | % | 94.8 | % | 1,111 | 1,062 | ||||||||||||||||||
56 | Echo at Katy Ranch | Katy, TX | 12/19/2013 | 260 | 35,100,000 | — | 93.1 | % | 86.9 | % | 1,373 | 1,236 | ||||||||||||||||||
57 | Heritage Grand at Sienna Plantation | Missouri City, TX | 12/20/2013 | 240 | 27,000,000 | 17,245,125 | 94.6 | % | 92.5 | % | 1,144 | 1,190 | ||||||||||||||||||
58 | Audubon Park Apartments | Nashville, TN | 12/27/2013 | 256 | 16,750,000 | 16,338,651 | 90.6 | % | 91.8 | % | 903 | 895 | ||||||||||||||||||
59 | Mallard Crossing Apartments | Loveland, OH | 12/27/2013 | 350 | 39,800,000 | 33,488,573 | 94.3 | % | 90.6 | % | 1,066 | 986 | ||||||||||||||||||
60 | Renaissance at Carol Stream | Carol Stream, IL | 12/31/2013 | 293 | 29,150,000 | 23,028,160 | 92.2 | % | 92.5 | % | 1,006 | 1,008 | ||||||||||||||||||
61 | Reserve at Creekside | Chattanooga, TN | 3/28/2014 | 192 | 18,875,000 | 14,190,376 | 91.7 | % | 95.3 | % | 927 | 959 | ||||||||||||||||||
62 | Mapleshade Park | Dallas, TX | 3/31/2014 | 148 | 23,325,000 | 19,235,309 | 97.3 | % | 91.2 | % | 1,629 | 1,474 | ||||||||||||||||||
63 | Richland Falls(6) | Murfreesboro, TN | 5/16/2014 | 276 | 30,904,744 | 20,137,110 | 94.6 | % | 96.8 | % | 1,028 | 924 | ||||||||||||||||||
64 | Oak Crossing | Fort Wayne, IN | 6/3/2014 | 222 | 24,230,000 | 17,644,671 | 94.1 | % | 89.6 | % | 992 | 950 | ||||||||||||||||||
65 | Park Shore Apartments | St. Charles, IL | 9/12/2014 | 160 | 18,350,000 | 15,635,835 | 95.6 | % | 90.6 | % | 1,189 | 1,152 | ||||||||||||||||||
16,709 | $ | 1,644,177,333 | $ | 1,217,716,280 | 93.5 | % | 94.0 | % | $ | 1,026 | $ | 999 | ||||||||||||||||||
________________
(1) | The contract purchase price is comprised of the purchase price upon acquisition and the development and construction costs of apartment homes we have constructed, as applicable. |
(2) | At December 31, 2016 and 2015, our portfolio was approximately 95.4% and 95.4% leased. |
(3) | Average monthly rent is based upon the effective rental income after considering the effect of vacancies, concessions and write-offs. |
(4) | Renaissance at St. Andrews Condominiums, initially comprised of 29 apartment homes, was acquired by us on October 31, 2012. On May 20, 2016, we acquired one additional unit at the Renaissance at St. Andrews Condominiums community for a purchase price of $48,000. |
(5) | Valley Farms North, initially comprised of 32 apartment homes and entitled for an additional 224 apartment homes, was acquired by us on December 28, 2012. During 2014, construction began on an additional 96 of the entitled 224 |
46
apartment homes at Valley Farms North. During 2015, all 96 additional apartment homes were completed and available to be leased.
(6) | Richland Falls was acquired by us on May 16, 2014 and included improved land zoned for an additional 86 apartment homes. During 2015, construction began on an additional 86 apartment homes at Richland Falls, all of which were completed and available to be leased as of December 31, 2016. |
Review of our Policies
Our board of directors, including our independent directors, has reviewed our policies described in this annual report, including policies regarding our investments, leverage and conflicts of interest, and determined that the policies are in the best interests of our stockholders.
Liquidity and Capital Resources
At the conclusion of our initial public offering, our overall borrowings were approximately 65% of the aggregate cost of our real properties (before deducting depreciation and amortization) plus the value of our other investments. Going forward, we expect that our borrowings will be approximately 65% of the value of our properties, as determined by an independent third party appraiser or qualified independent valuation expert. At December 31, 2016, our debt was approximately 61% of the value of our properties, as determined by an independent third party appraiser. Under our charter, we are prohibited from borrowing in excess of 300% of the value of our net assets, which generally approximates to 75% of the aggregate cost of our assets, though we may exceed this limit under certain circumstances. As of December 31, 2016, our borrowings were not in excess of 300% of the value of our net assets.
Our principal demand for funds will be to fund value-enhancement and other capital improvement projects at our properties, to pay operating expenses and interest on our outstanding indebtedness and to make distributions to our stockholders. Additionally, we expect to use our capital resources to make certain payments to our advisor in connection with the disposal of investments, the management of our assets and costs incurred by our advisor in providing services to us. We intend to generally fund our cash needs for items, other than asset acquisitions, from operations. Otherwise, we expect that our principal sources of working capital will include:
• | current unrestricted cash balances, which was $66,224,027 as of December 31, 2016; |
• | various forms of secured and unsecured financing; and |
• | equity capital from joint venture partners. |
Over the short term, we believe that our sources of capital, specifically our cash balances, cash flow from operations, our ability to raise equity capital from joint venture partners and our ability to obtain various forms of secured and unsecured financing will be adequate to meet our liquidity requirements and capital commitments.
Over the longer term, in addition to the same sources of capital we will rely on to meet our short term liquidity requirements, we may also utilize proceeds from the sale of our properties. We may also conduct additional public or private offerings of securities. We expect these resources will be adequate to fund our operating activities, debt service and distributions, which we presently anticipate will grow over time, and will be sufficient to fund our ongoing operating activities as well as providing capital for investment in future development and other joint ventures along with potential forward purchase commitments.
On October 22, 2012, we entered into a revolving credit facility with PNC Bank, National Association, or PNC Bank, to borrow up to $5,000,000. On April 25, 2013, we amended the credit facility to increase the borrowing capacity to $20,000,000. On July 18, 2014, we further amended the revolving credit facility, to, among other things, increase the borrowing capacity from $20,000,000 to $35,000,000. The amended and restated credit facility consisted of a Tranche A and a Tranche B, and provided certain security for borrowings under the credit facility. The maximum amounts that could be borrowed under Tranche A and Tranche B were $20,000,000 and $15,000,000, respectively. The amended and restated credit facility had a maturity date of July 17, 2016, subject to extension. On June 30, 2016, we repaid all outstanding amounts due and terminated the amended and restated credit facility.
47
On July 29, 2016, nine wholly-owned subsidiaries entered into a credit agreement and a multifamily note with PNC Bank that provide for a new credit facility in an amount not to exceed $350,000,000 to refinance certain of our existing mortgage loans. The credit facility has a maturity date of August 1, 2021, subject to extension. Advances made under the credit facility will be secured by certain of our properties. See Note 5 (Debt) of the accompanying consolidated financial statements. As of December 31, 2016, $235,124,750 was outstanding on our credit facility. We continue to evaluate possible sources of capital, including, without limitation, entering into additional credit facilities. There can be no assurance that we will be able to obtain any such financings on favorable terms, if at all.
On June 29 and June 30, 2016, 14 of our wholly-owned subsidiaries terminated the existing mortgage loans with their respective lenders for an aggregate principal amount of $283,313,677 and entered into new loan agreements, each a loan agreement, with, as applicable, PNC Bank and Berkeley Point Capital LLC, or Berkeley, and, together with PNC Bank, the Lenders, for an aggregate principal amount of $358,002,000, or the June Refinancing Transactions. On July 29, 2016, nine of our wholly-owned subsidiaries also entered into a credit agreement with PNC Bank in connection with the refinancing of certain additional mortgage loans. Further, on August 30, 2016 and September 29, 2016, three of our wholly-owned subsidiaries terminated the existing mortgage loans with their respective lenders for an aggregate principal amount of $61,575,025 and entered into new mortgage notes for an aggregate principal amount of $63,620,600, together with the June Refinancing Transactions, the Refinancing Transactions.
In the June Refinancing Transactions, each loan agreement was made pursuant to the Freddie Mac Capital Markets Execution Program, or the CME, as evidenced by a multifamily note. Pursuant to the CME, the applicable Lender originates the mortgage loan and then transfers the loan to the Federal Home Loan Mortgage Association. Each Loan Agreement provides for a term loan with a maturity date of July 1, 2023, unless the maturity date is accelerated in accordance with its terms. Each loan accrues interest at one-month LIBOR plus 2.31%. The entire outstanding principal balance and any accrued and unpaid interest on each of the Loans are due on the maturity date. Interest and principal payments on the loans are payable monthly in arrears on specified dates as set forth in each loan agreement. Monthly payments are due and payable on the first day of each month, commencing August 1, 2016.
Cash Flows Provided by Operating Activities
We commenced real estate operations with the acquisition of our first multifamily property on August 11, 2010. As of December 31, 2016, we owned 65 multifamily properties. During the year ended December 31, 2016, net cash provided by operating activities was $54,259,420 compared to net cash provided by operating activities of $51,424,087 for the year ended December 31, 2015. The increase in net cash provided by operating activities is primarily due to changes in net loss, depreciation and amortization, the change in fair value of interest rate cap agreements, loss on debt extinguishment, restricted cash and accounts payable and accrued liabilities.
Cash Flows Used in Investing Activities
During the year ended December 31, 2016, net cash used in investing activities was $56,905,196 compared to net cash used in investing activities of $29,660,218 during the year ended December 31, 2015. The increase in net cash used in investing activities was primarily due to a $30,000,000 investment in a certificate of deposit during the year ended December 31, 2016, compared to the year ended December 31, 2015. Net cash used in investing activities during the year ended December 31, 2016 consisted of the following:
• | $30,000,000 of cash used for short-term investments; |
• | $28,268,601 of cash used for improvements to real estate investments; |
• | $628,878 of cash provided by restricted cash accounts related to replacement reserves; |
• | $259,000 of cash used to purchase interest rate cap agreements; and |
• | $993,527 of cash provided by insurance claims. |
48
Cash Flows from Financing Activities
For the year ended December 31, 2016, net cash provided by financing activities was $36,793,221 compared to net cash used in financing activities of $19,216,599 during the year ended December 31, 2015. The increase in cash flow from financing activities is due primarily to the increase in proceeds from notes payable in connection with the Refinancing Transactions, partially offset by increases to payments of deferred financing costs, debt extinguishment costs and redemptions of common stock. Net cash provided by financing activities during the year ended December 31, 2016 consisted of the following:
• | $135,258,019 net cash used for principal payments of mortgage notes payable, net of deferred financing costs in the amount of $5,489,473 and proceeds from the issuance of mortgage notes payable of $428,196,350, each primarily in connection with the Refinancing Transactions; |
• | $235,124,750 provided by borrowings from the credit facilities, net of principal payments of $16,000,000, primarily in connection with the Refinancing Transactions; |
• | $3,202,337 of cash paid for debt extinguishment costs in connection with the Refinancing Transactions; |
• | $5,000,000 of cash paid for the redemption of common stock; and |
• | $54,871,173 of net cash distributions to our stockholders. |
Contractual Commitments and Contingencies
We have used, and intend to use in the future, secured and unsecured debt. We believe that the careful use of borrowings will help us achieve our diversification goals and potentially enhance the returns on our investments. At the conclusion of our public offering, our borrowings were approximately 65% of the cost of our real properties (before deducting depreciation and amortization) plus the value of our other investments. Going forward, we expect that our borrowings will be approximately 65% of the value of our properties, as determined by an independent third party appraiser or qualified independent valuation expert. At December 31, 2016, our debt was approximately 61% of the value of our properties, as determined by an independent third party appraiser. Under our charter, we are prohibited from borrowing in excess of 300% of our net assets, which generally approximates to 75% of the aggregate cost of our assets. We may borrow in excess of this amount if such excess is approved by a majority of the independent directors and disclosed to stockholders in our next quarterly report, along with a justification for such excess. In such event, we will monitor our debt levels and take action to reduce any such excess as practicable. Our aggregate borrowings are reviewed by our board of directors at least quarterly. As of December 31, 2016, our borrowings were not in excess of 300% of the value of our net assets.
In addition to using our capital resources for investing purposes and meeting our debt obligations, we expect to use our capital resources to make certain payments to our advisor. We expect to make payments to our advisor or its affiliates in connection with the selection and origination or purchase of real estate and real estate-related investments, the management of our assets, the management of the development or improvement of our assets and costs incurred by our advisor in providing services to us.
As of December 31, 2016, we had notes payable totaling an aggregate principal amount of $1,217,716,280, including the net premiums on certain notes payable of $2,208,619 and the net deferred financing costs of $8,846,909. For more information on our outstanding indebtedness, see Note 5 (Debt) to the consolidated financial statements included in this annual report.
The following is a summary of our contractual obligations as of December 31, 2016:
Payments due by period | ||||||||||||||||||||
Contractual Obligations | Total | Less than 1 year | 1-3 years | 3-5 years | More than 5 years | |||||||||||||||
Interest payments on outstanding debt obligations(1) | $ | 238,792,662 | $ | 40,188,192 | $ | 69,759,862 | $ | 54,156,190 | $ | 74,688,418 | ||||||||||
Principal payments on outstanding debt obligations(2) | 1,224,354,570 | 50,172,191 | 165,683,586 | 380,809,558 | 627,689,235 | |||||||||||||||
Total | $ | 1,463,147,232 | $ | 90,360,383 | $ | 235,443,448 | $ | 434,965,748 | $ | 702,377,653 | ||||||||||
49
________________
(1) | Projected interest payments on outstanding debt obligations are based on the outstanding principal amounts and interest rates in effect at December 31, 2016. We incurred interest of $40,631,593 during the year ended December 31, 2016, including amortization of deferred financing costs totaling $1,723,186, amortization of loan premiums of $1,243,385, net unrealized gains from the change in fair value of interest rate cap agreements of $61,698 and capitalized interest of $80,166. |
(2) | Projected principal payments on outstanding debt obligations are based on the terms of the notes payable agreements. Amounts exclude the amortization of the debt premiums in addition to net deferred financing costs associated with certain notes payable. |
Results of Operations
Overview
The discussion that follows is based on our consolidated results of operations for the years ended December 31, 2016, 2015 and 2014. The ability to compare one period to another is significantly affected by acquisitions completed and dispositions made during those periods in addition to our value-enhancement strategy. Although we owned all 65 multifamily properties as of December 31, 2016, 2015 and 2014, our results of operations were affected by the construction of an additional 86 apartment homes at one existing multifamily property during the year ended December 31, 2016, the construction of an additional 96 apartment homes at one existing multifamily property during the year ended December 31, 2015, the seven multifamily properties acquired during the year ended December 31, 2014 and our value-enhancement activity completed through December 31, 2016, as further discussed below.
Our results of operations for the years ended December 31, 2016, 2015 and 2014 are not indicative of those expected in future periods. During the year ended December 31, 2014, we invested the remaining proceeds from our public offering and therefore increased our borrowings and made acquisitions during the period, which had a significant impact on our future results of operations. For the years ended December 31, 2016 and 2015, we deployed the remaining offering proceeds and performed value-enhancement projects, which has had a significant impact on our results of operations. In general, we expect that our income and expenses related to our portfolio will increase in future periods as a result of organic rent increases and anticipated value-enhancement projects.
To provide additional insight into our operating results, we are also providing a detailed analysis of same-store versus non-same-store net operating income, or NOI. For more information on NOI and a reconciliation of NOI (a non-GAAP measure) to net loss, see “—Net Operating Income.”
50
Consolidated Results of Operations for the Year Ended December 31, 2016 Compared to the Year Ended December 31, 2015
The following table summarizes the consolidated results of operations for the years ended December 31, 2016 and 2015:
For the Years Ended December 31, | |||||||||||||||
2016 | 2015 | Change $ | Change % | ||||||||||||
Total revenues | $ | 218,237,532 | $ | 209,390,658 | $ | 8,846,874 | 4 | % | |||||||
Operating, maintenance and management | (57,832,187 | ) | (53,915,306 | ) | (3,916,881 | ) | 7 | % | |||||||
Real estate taxes and insurance | (36,507,827 | ) | (35,825,445 | ) | (682,382 | ) | 2 | % | |||||||
Fees to affiliates | (25,440,718 | ) | (21,927,913 | ) | (3,512,805 | ) | 16 | % | |||||||
Depreciation and amortization | (69,513,484 | ) | (65,640,196 | ) | (3,873,288 | ) | 6 | % | |||||||
Interest expense | (40,551,427 | ) | (39,149,018 | ) | (1,402,409 | ) | 4 | % | |||||||
Loss on debt extinguishment | (4,932,369 | ) | — | (4,932,369 | ) | 100% | |||||||||
General and administrative expenses | (9,039,171 | ) | (5,949,993 | ) | (3,089,178 | ) | 52 | % | |||||||
Acquisition costs | — | (7,145 | ) | 7,145 | (100 | )% | |||||||||
Loss from continuing operations | $ | (25,579,651 | ) | $ | (13,024,358 | ) | $ | (12,555,293 | ) | 96 | % | ||||
NOI(1) | $ | 113,675,575 | $ | 112,345,930 | $ | 1,329,645 | 1 | % | |||||||
FFO(2) | $ | 43,933,833 | $ | 52,615,838 | $ | (8,682,005 | ) | (17 | )% | ||||||
MFFO(2) | $ | 49,117,817 | $ | 55,143,904 | $ | (6,026,087 | ) | (11 | )% | ||||||
________________
(1) | NOI is a non-GAAP financial measure used by investors and our management to evaluate and compare the performance of our properties and to determine trends in earnings. However, the usefulness of NOI is limited because it excludes general and administrative costs, interest expense, interest income and other expense, acquisition costs, certain fees to affiliates, depreciation and amortization expense and gains or losses from the sale of our properties and other gains and losses as stipulated by GAAP, the level of capital expenditures and leasing costs, all of which are significant economic costs. For additional information on how we calculate NOI and a reconciliation of NOI to net loss, see “—Net Operating Income.” |
(2) | GAAP basis accounting for real estate assets utilizes historical cost accounting and assumes real estate values diminish over time. In an effort to overcome the difference between real estate values and historical cost accounting for real estate assets, the Board of Governors of NAREIT established the measurement tool of FFO. Since its introduction, FFO has become a widely used non-GAAP financial measure among REITs. Additionally, we use MFFO, as defined by the IPA as a supplemental measure to evaluate our operating performance. MFFO is based on FFO but includes certain adjustments we believe are necessary due to changes in accounting and reporting under GAAP since the establishment of FFO. Neither FFO nor MFFO should be considered as alternatives to net loss or other measurements under GAAP as indicators of our operating performance, nor should they be considered as alternatives to cash flow from operating activities or other measurements under GAAP as indicators of liquidity. For additional information on how we calculate FFO and MFFO and a reconciliation of FFO and MFFO to net loss, see “—Funds From Operations and Modified Funds From Operations.” |
Loss from continuing operations
For the year ended December 31, 2016, we had a loss from continuing operations of $25,579,651 compared to a loss from continuing operations of $13,024,358 for the year ended December 31, 2015. The increase in loss from continuing operations of $12,555,293 over the prior year was primarily due to the increase in operating, maintenance and management expenses of
51
$3,916,881, the increase in real estate taxes and insurance of $682,382, the increase in fees to affiliates of $3,512,805, the increase in depreciation and amortization expense of $3,873,288, the increase in interest expense of $1,402,409, the increase in loss on debt extinguishment of $4,932,369 and the increase in general and administrative expenses of $3,089,178, partially offset by the increase in total revenues of $8,846,874 and the decrease in acquisition costs of $7,145. Our operations were primarily negatively impacted by the costs incurred in connection with the Refinancing Transactions.
Total revenues
Rental income and tenant reimbursements for the year ended December 31, 2016 were $218,237,532 compared to $209,390,658 for the year ended December 31, 2015. The increase of $8,846,874 was primarily due to our total units increasing by 87 from 16,622 at December 31, 2015 to 16,709 at December 31, 2016 and average monthly rents increasing from $999 at December 31, 2015 to $1,026 at December 31, 2016. We expect rental income and tenant reimbursements to increase in future periods as a result of ordinary monthly rent increases and the implementation of our value-enhancement strategy.
Operating, maintenance and management
Operating, maintenance and management expenses for the year ended December 31, 2016 were $57,832,187 compared to $53,915,306 for the year ended December 31, 2015. The increase of $3,916,881 was primarily due to higher costs incurred for utilities, repairs and maintenance and property operating costs during the year ended December 31, 2016 compared to the year ended December 31, 2015. We expect that these amounts will decrease as a percentage of total revenues as we implement operational efficiencies at our multifamily properties.
Real estate taxes and insurance
Real estate taxes and insurance expenses for the year ended December 31, 2016 were $36,507,827 compared to $35,825,445 for the year ended December 31, 2015. The increase of $682,382 was primarily due to increased assessed values of our property portfolio resulting in higher property taxes at certain of our properties. We expect these amounts may increase in future periods as a result of ordinary municipal property tax increases as well as increases in the assessed value of our property portfolio.
Fees to affiliates
Fees to affiliates for the year ended December 31, 2016 were $25,440,718 compared to $21,927,913 for the year ended December 31, 2015. The increase of $3,512,805 was primarily due to the $3,283,737 in refinancing fees incurred in connection with the Refinancing Transactions during the year ended December 31, 2016, compared to no refinancing fees incurred during the year ended December 31, 2015. Additionally, investment management fees and property management fees increased from the year ended December 31, 2015 to the year ended December 31, 2016. We expect fees to affiliates to decrease in future periods as a result of the decrease in anticipated future refinancing activity.
Depreciation and amortization
Depreciation and amortization expenses for the year ended December 31, 2016 were $69,513,484 compared to $65,640,196 for the year ended December 31, 2015. The increase of $3,873,288 was primarily due to the net increase in depreciable and amortizable assets of $29,570,511 since December 31, 2015 from the completion of construction of additional 86 apartment homes at an existing multifamily property and the implementation of our value-enhancement strategy. We expect these amounts to increase slightly in future periods as a result of anticipated future enhancements to our real estate portfolio.
Interest expense
Interest expense for the year ended December 31, 2016 was $40,551,427 compared to $39,149,018 for the year ended December 31, 2015. The increase of $1,402,409 was primarily due to the net increase in the notes payable balance of $101,963,381 from December 31, 2015 to December 31, 2016, partially offset by the unrealized gain on derivative instruments of $61,698 for the year ended December 31, 2016 and unrealized loss on derivative instruments of $2,032,746 for the year ended December 31, 2015. Included in interest expense is the amortization of deferred financing costs of $1,723,186 and $1,553,718 and amortization of loan premiums and discounts of $1,243,385 and $1,234,793 for the years ended December 31,
52
2016 and 2015, respectively. Our interest expense in future periods will vary based on our level of borrowings, which will depend on the availability and cost of debt financing, the opportunity to acquire real estate and real estate-related investments meeting our investment objectives and the opportunity to sell real properties and real estate-related investments.
Loss on debt extinguishment
Loss on debt extinguishment for the year ended December 31, 2016 was $4,932,369 compared to $0 for the year ended December 31, 2015. These expenses consisted of prepayment penalties and the expense of the deferred financing costs, net related to the repayment and extinguishment of the debt in conjunction with the Refinancing Transactions. The loss on debt extinguishment will vary in future periods if we repay the remaining outstanding principal prior to the scheduled maturity dates of the mortgage notes payable.
General and administrative expenses
General and administrative expenses for the year ended December 31, 2016 were $9,039,171 compared to $5,949,993 for the year ended December 31, 2015. These general and administrative costs consisted primarily of legal fees, insurance premiums, audit fees, other professional fees, independent director compensation and certain state taxes. The increase of $3,089,178 was primarily due to costs incurred related to the Refinancing Transactions during the year ended December 31, 2016 compared to the year ended December 31, 2015.
Acquisition costs
Acquisition costs for the year ended December 31, 2016 were $0 compared to $7,145 for the year ended December 31, 2015. We do not expect to incur significant acquisition costs in future periods as we have invested all proceeds from our public offering.
Consolidated Results of Operations for the Year Ended December 31, 2015 Compared to the Year Ended December 31, 2014
The following table summarizes the consolidated results of operations for the years ended December 31, 2015 and 2014:
For the Years Ended December 31, | |||||||||||||||
2015 | 2014 | Change $ | Change % | ||||||||||||
Total revenues | $ | 209,390,658 | $ | 195,929,856 | $ | 13,460,802 | 7 | % | |||||||
Operating, maintenance and management | (53,915,306 | ) | (52,427,001 | ) | (1,488,305 | ) | 3 | % | |||||||
Real estate taxes and insurance | (35,825,445 | ) | (34,750,097 | ) | (1,075,348 | ) | 3 | % | |||||||
Fees to affiliates | (21,927,913 | ) | (23,923,921 | ) | 1,996,008 | (8 | )% | ||||||||
Depreciation and amortization | (65,640,196 | ) | (69,681,177 | ) | 4,040,981 | (6 | )% | ||||||||
Interest expense | (39,149,018 | ) | (40,370,846 | ) | 1,221,828 | (3 | )% | ||||||||
Loss on debt extinguishment | — | (1,939,817 | ) | 1,939,817 | (100 | )% | |||||||||
General and administrative expenses | (5,949,993 | ) | (6,896,519 | ) | 946,526 | (14 | )% | ||||||||
Acquisition costs | (7,145 | ) | (1,626,904 | ) | 1,619,759 | (100 | )% | ||||||||
Loss from continuing operations | $ | (13,024,358 | ) | $ | (35,686,426 | ) | $ | 22,662,068 | (64 | )% | |||||
NOI(1) | $ | 112,345,930 | $ | 101,797,896 | $ | 10,548,034 | 10 | % | |||||||
FFO(2) | $ | 52,615,838 | $ | 33,994,751 | $ | 18,621,087 | 55 | % | |||||||
MFFO(2) | $ | 55,143,904 | $ | 45,002,936 | $ | 10,140,968 | 23 | % | |||||||
________________
(1) | For information on how we calculate NOI and a reconciliation of NOI to net loss, see “—Net Operating Income.” |
53
(2) | For information on how we calculate FFO and MFFO and a reconciliation of FFO and MFFO to net loss, see “—Funds From Operations and Modified Funds From Operations.” |
Loss from continuing operations
For the year ended December 31, 2015, we had a loss from continuing operations of $13,024,358 compared to a loss from continuing operations of $35,686,426 for the year ended December 31, 2014. The decrease in loss from continuing operations of $22,662,068 over the prior year was primarily due to the increase in total revenues of $13,460,802, the decrease in fees to affiliates of $1,996,008, the decrease in depreciation and amortization expense of $4,040,981, the decrease in interest expense of $1,221,828, the decrease in loss on debt extinguishment of $1,939,817, the decrease in general and administrative expenses of $946,526 and the decrease in acquisition costs of $1,619,759, partially offset by the increase in operating, maintenance and management expenses of $1,488,305 and the increase in real estate taxes and insurance of $1,075,348.
Total revenues
Rental income and tenant reimbursements for the year ended December 31, 2015 were $209,390,658 compared to $195,929,856 for the year ended December 31, 2014. The increase of $13,460,802 was primarily due to the seven multifamily properties acquired during the year ended December 31, 2014 that experienced a full year of operations in 2015 in addition to the results of our value-enhancement activity. Our total units increased by 96 from 16,526 at December 31, 2014 to 16,622 at December 31, 2015 and average monthly rents increased from $966 at December 31, 2014 to $999 at December 31, 2015.
Operating, maintenance and management
Operating, maintenance and management expenses for the year ended December 31, 2015 were $53,915,306 compared to $52,427,001 for the year ended December 31, 2014. The increase of $1,488,305 was primarily due to the seven multifamily properties acquired during the year ended December 31, 2014 that experienced a full year of operations in 2015.
Real estate taxes and insurance
Real estate taxes and insurance expenses for the year ended December 31, 2015 were $35,825,445 compared to $34,750,097 for the year ended December 31, 2014. The increase of $1,075,348 was primarily due to the seven multifamily properties acquired during the year ended December 31, 2014 that experienced a full year of operations in 2015, ordinary municipal property tax increases and increases in the assessed value of our property portfolio.
Fees to affiliates
Fees to affiliates for the year ended December 31, 2015 were $21,927,913 compared to $23,923,921 for the year ended December 31, 2014. The decrease of $1,996,008 was primarily due to acquisition fees of $187,735 earned by our advisor in connection with the completion of the construction of an additional 96 apartment homes at an existing multifamily property during the year ended December 31, 2015, compared to acquisition fees of $3,251,400 earned by our advisor in connection with the acquisition of seven multifamily properties with an aggregate purchase price of $130,339,157 during the year ended December 31, 2014. This decrease was partially offset by investment management fees of $13,854,825 earned by our advisor during the year ended December 31, 2015, compared to investment management fees of $13,252,309 earned during the year ended December 31, 2014.
Depreciation and amortization
Depreciation and amortization expenses for the year ended December 31, 2015 were $65,640,196 compared to $69,681,177 for the year ended December 31, 2014. The decrease of $4,040,981 was primarily due to the tenant origination and absorption costs recognized from the significant number of acquisitions made leading up to, and immediately after, the conclusion of our initial public offering on December 20, 2013 that were fully amortized prior to the year ended December 31, 2015. This decrease was partially offset by a net increase in depreciable and amortizable assets of $29,803,132 since December 31, 2014 from the completion of construction of additional 96 apartment homes at an existing multifamily property and out value-enhancement strategy.
54
Interest expense
Interest expense for the year ended December 31, 2015 was $39,149,018 compared to $40,370,846 for the year ended December 31, 2014. The decrease of $1,221,828 was primarily due to the unrealized loss on derivative instruments of $2,032,746 and $4,353,301 for the years ended December 31, 2015 and 2014, respectively, partially offset by the net increase in the notes payable balance of $37,693,346 due to the refinancing and financing of previously unencumbered properties during the year ended December 31, 2015 and the net increase in the notes payable balance of $97,427,225 from financing incurred in connection with the acquisition of seven multifamily properties acquired during the year ended December 31, 2014 that experienced a full year of interest expense in 2015. Included in interest expense is the amortization of deferred financing costs of $1,553,718 and $1,489,834 and amortization of loan premiums and discounts of $1,234,793 and $1,234,793 for the years ended December 31, 2015 and 2014, respectively.
Loss on debt extinguishment
Loss on debt extinguishment for the year ended December 31, 2015 was $0 compared to $1,939,817 for the year ended December 31, 2014. These expenses consisted of prepayment penalties and the expense of the deferred financing costs, net related to the repayment and extinguishment of the debt in conjunction with the sale of three multifamily properties during the year ended December 31, 2014. There were no property sales and related repayment and extinguishment of debt during the year ended December 31, 2015.
General and administrative expense
General and administrative expenses for the year ended December 31, 2015 were $5,949,993 compared to $6,896,519 for the year ended December 31, 2014. These general and administrative costs consisted primarily of legal fees, insurance premiums, audit fees, other professional fees, independent director compensation and certain state taxes. The decrease of $946,526 was primarily due to the costs incurred the year ended December 31, 2014 related to the evaluation of strategic alternatives.
Acquisition costs
Acquisition costs for the year ended December 31, 2015 were $7,145 compared to $1,626,904 for the year ended December 31, 2014. The decrease in acquisition costs related primarily to no acquisitions of multifamily properties being made during 2015 compared to seven acquisitions of multifamily properties during 2014.
Property Operations for the Year Ended December 31, 2016 Compared to the Year Ended December 31, 2015
For purposes of evaluating comparative operating performance for the year, we categorize our properties as “same-store” or “non-same-store.” A “same-store” property is a property that was owned at January 1, 2015. A “non-same-store” property is a property that was acquired, placed into service or disposed of after January 1, 2015. As of December 31, 2016, 65 properties were categorized as same-store properties.
55
The following table presents the same-store and non-same-store results from operations for the years ended December 31, 2016 and 2015:
For the Year Ended December 31, | |||||||||||||||
2016 | 2015 | Change $ | Change % | ||||||||||||
Same-store properties: | |||||||||||||||
Revenues | $ | 216,095,792 | $ | 209,351,763 | $ | 6,744,029 | 3 | % | |||||||
Operating expenses | 102,420,217 | 97,057,602 | 5,362,615 | 6 | % | ||||||||||
Net operating income | 113,675,575 | 112,294,161 | 1,381,414 | 1 | % | ||||||||||
Non-same-store properties: | |||||||||||||||
Net operating income | — | 51,769 | (51,769 | ) | |||||||||||
Total net operating income(1) | $ | 113,675,575 | $ | 112,345,930 | $ | 1,329,645 | |||||||||
________________
(1) | See “—Net Operating Income” below for a reconciliation of NOI to net income (loss). |
Net Operating Income
Same-store net operating income for the year ended December 31, 2016 was $113,675,575 compared to $112,294,161 for the year ended December 31, 2015. The 1% increase in same-store net operating income was primarily due to the 3% increase in same-store rental revenues partially offset by a 6% increase in same-store operating expenses over the comparable prior year period.
Revenues
Same-store revenues for the year ended December 31, 2016 were $216,095,792 compared to $209,351,763 for the year ended December 31, 2015. The 3% increase in same-store revenues was primarily due to average rent increases at the same-store properties from $999 as of December 31, 2015 to $1,026 as of December 31, 2016.
Operating Expenses
Same-store operating expenses for the year ended December 31, 2016 were $102,420,217 compared to $97,057,602 for the year ended December 31, 2015. The 6% increase in same-store operating expenses was primarily due to increased utilities, repairs and maintenance and property tax expense during the year ended December 31, 2016 compared to the prior year.
Net Operating Income
Net Operating Income, or NOI, is a non-GAAP financial measure of performance. NOI is used by investors and our management to evaluate and compare the performance of our properties and to determine trends in earnings and to compute the fair value of our properties as it is not affected by (1) the cost of funds, (2) acquisition costs, (3) non-operating fees to affiliates, (4) the impact of depreciation and amortization expenses as well as gains or losses from the sale of operating real estate assets that are included in net income computed in accordance with GAAP, or (5) general and administrative expenses and other gains and losses that are specific to us. The cost of funds is eliminated from net income (loss) because it is specific to our particular financing capabilities and constraints. The cost of funds is also eliminated because it is dependent on historical interest rates and other costs of capital as well as past decisions made by us regarding the appropriate mix of capital which may have changed or may change in the future. Acquisition costs and non-operating fees to affiliates are eliminated because they do not reflect our continuing operating costs.
Depreciation and amortization expenses as well as gains or losses from the sale of operating real estate assets are eliminated because they may not accurately represent the actual change in value in our multifamily properties that result from use of the properties or changes in market conditions. While certain aspects of real property do decline in value over time in a manner that
56
is reasonably captured by depreciation and amortization, the value of the properties as a whole have historically increased or decreased as a result of changes in overall economic conditions instead of from actual use of the property or the passage of time. Gains and losses from the sale of real property vary from property to property and are affected by market conditions at the time of sale which will usually change from period to period. These gains and losses can create distortions when comparing one period to another or when comparing our operating results to the operating results of other real estate companies that have not made similarly timed purchases or sales. We believe that eliminating these costs from net income is useful because the resulting measure captures the actual revenue generated and actual expenses incurred in operating our properties as well as trends in occupancy rates, rental rates and operating costs.
The usefulness of NOI is limited because it excludes general and administrative costs, interest expense, interest income and other expense, acquisition costs, certain fees to affiliates, depreciation and amortization expense and gains or losses from the sale of properties, and other gains and losses as stipulated by GAAP, the level of capital expenditures and leasing costs necessary to maintain the operating performance of our properties, all of which are significant economic costs. NOI may fail to capture significant trends in these components of net income which further limits its usefulness.
NOI is a measure of the operating performance of our properties but does not measure our performance as a whole. NOI is therefore not a substitute for net income (loss) as computed in accordance with GAAP. This measure should be analyzed in conjunction with net income (loss) computed in accordance with GAAP and discussions elsewhere in “—Results of Operations” regarding the components of net income (loss) that are eliminated in the calculation of NOI. Other companies may use different methods for calculating NOI or similarly entitled measures and, accordingly, our NOI may not be comparable to similarly entitled measures reported by other companies that do not define the measure exactly as we do.
The following is a reconciliation of our NOI to net loss for the three months ended December 31, 2016 and 2015 and for the years ended December 31, 2016, 2015 and 2014 computed in accordance with GAAP:
For the Three Months Ended December 31, | For the Year Ended December 31, | |||||||||||||||||||
2016 | 2015 | 2016 | 2015 | 2014 | ||||||||||||||||
Net loss | $ | (4,223,102 | ) | $ | (2,685,557 | ) | $ | (25,579,651 | ) | $ | (13,024,358 | ) | $ | (25,742,292 | ) | |||||
Fees to affiliates(1) | 3,538,199 | 3,484,384 | 17,360,515 | 14,042,560 | 16,503,709 | |||||||||||||||
Depreciation and amortization | 17,789,498 | 16,807,484 | 69,513,484 | 65,640,196 | 69,681,177 | |||||||||||||||
Interest expense | 9,843,905 | 9,621,910 | 40,551,427 | 39,149,018 | 40,370,846 | |||||||||||||||
Loss on debt extinguishment | — | — | 4,932,369 | — | 1,939,817 | |||||||||||||||
General and administrative expenses | 2,550,631 | 1,544,005 | 9,039,171 | 5,949,993 | 6,896,519 | |||||||||||||||
Acquisition costs | — | — | — | 7,145 | 1,626,904 | |||||||||||||||
Gain on sales of real estate | — | — | — | — | (9,944,134 | ) | ||||||||||||||
Other (gains) and losses(2) | (516,752 | ) | 84,709 | (2,141,740 | ) | 581,376 | 465,350 | |||||||||||||
Net operating income | $ | 28,982,379 | $ | 28,856,935 | $ | 113,675,575 | $ | 112,345,930 | $ | 101,797,896 | ||||||||||
________________
(1) | Fees to affiliates for the three months and year ended December 31, 2016 excludes property management fees of $1,612,601 and $6,406,479 and other fees of $342,312 and $1,673,724, respectively, that are included in NOI. Fees to affiliates for the three months and year ended December 31, 2015 excludes property management fees of $1,566,955 and $6,188,525 and other fees of $434,665 and $1,696,828, respectively, that are included in NOI. Fees to affiliates for the year ended December 31, 2014 excludes property management fees of $5,802,772 and other fees of $1,617,440 that are included in NOI. |
(2) | Other gains and losses for the years ended December 31, 2016, 2015 and 2014 include non-recurring insurance proceeds and certain corporate level expenses that are not included in NOI. |
57
Funds from Operations and Modified Funds from Operations
Due to certain unique operating characteristics of real estate companies, as discussed below, NAREIT, an industry trade group, has promulgated a measure known as funds from operations, or FFO, which we believe to be an appropriate supplemental measure to reflect the operating performance of a real estate investment trust, or REIT. The use of FFO is recommended by the REIT industry as a supplemental performance measure. FFO is not equivalent to our net income (loss) as determined under GAAP.
We define FFO, a non-GAAP financial measure, consistent with the standards established by the White Paper on FFO approved by the Board of Governors of NAREIT, as revised in February 2004, or the White Paper. The White Paper defines FFO as net income (loss) computed in accordance with GAAP, excluding gains or losses from sales of property and non-cash impairment charges of real estate related investments, plus real estate related depreciation and amortization, and after adjustments for unconsolidated partnerships and joint ventures. In particular, we believe it is appropriate to disregard impairment charges, as this is a fair value adjustment that is largely based on market fluctuations and assessments regarding general market conditions which can change over time. An asset will only be evaluated for impairment if certain impairment indications exist and if the carrying, or book value, exceeds the total estimated undiscounted future cash flows (including net rental and lease revenues, net proceeds on the sale of the property, and any other ancillary cash flows at a property or group level under GAAP) from such asset. Investors should note, however, that determinations of whether impairment charges have been incurred are based partly on anticipated operating performance, because estimated undiscounted future cash flows from a property, including estimated future net rental and lease revenues, net proceeds on the sale of the property, and certain other ancillary cash flows, are taken into account in determining whether an impairment charge has been incurred. While impairment charges are excluded from the calculation of FFO as described above, investors are cautioned that due to the fact that impairments are based on estimated future undiscounted cash flows and the relatively limited term of our operations, it could be difficult to recover any impairment charges. Our FFO calculation complies with NAREIT’s policy described above.
The historical accounting convention used for real estate assets requires straight-line depreciation of buildings and improvements, which implies that the value of real estate assets diminishes predictably over time, especially if such assets are not adequately maintained or repaired and renovated as required by relevant circumstances and/or as requested or required by lessees for operational purposes in order to maintain the value disclosed. We believe that since real estate values historically rise and fall with market conditions, including inflation, interest rates, the business cycle, unemployment and consumer spending, presentations of operating results for a REIT using historical accounting for depreciation may be less informative. Historical accounting for real estate involves the use of GAAP. Any other method of accounting for real estate such as the fair value method cannot be construed to be any more accurate or relevant than the comparable methodologies of real estate valuation found in GAAP. Nevertheless, we believe that the use of FFO, which excludes the impact of real estate related depreciation and amortization, provides a more complete understanding of our performance to investors and to management, and when compared year over year, reflects the impact on our operations from trends in occupancy rates, rental rates, operating costs, general and administrative expenses, and interest costs, which may not be immediately apparent from net income. However, FFO, and MFFO as described below, should not be construed to be more relevant or accurate than the current GAAP methodology in calculating net income or in its applicability in evaluating our operating performance. The method utilized to evaluate the value and performance of real estate under GAAP should be construed as a more relevant measure of operational performance and considered more prominently than the non-GAAP FFO and MFFO measures and the adjustments to GAAP in calculating FFO and MFFO.
Changes in the accounting and reporting promulgations under GAAP (for acquisition fees and expenses from a capitalization/depreciation model to an expensed-as-incurred model) that were put into effect in 2009 and other changes to GAAP accounting for real estate subsequent to the establishment of NAREIT’s definition of FFO have prompted an increase in cash-settled expenses, specifically acquisition fees and expenses for all industries as items that are expensed under GAAP, that are typically accounted for as operating expenses. Management believes these fees and expenses do not affect our overall long-term operating performance. Publicly registered, non-listed REITs typically have a significant amount of acquisition activity and are substantially more dynamic during their initial years of investment and operation. While other start-up entities may also experience significant acquisition activity during their initial years, we believe that public, non-listed REITs, like us, are unique in that they have a limited life with targeted exit strategies within a relatively limited time frame after acquisition activity ceases. Our board of directors will determine to pursue a liquidity event when it believes that the then-current market conditions are favorable. Thus, as a limited life REIT, we will not continuously purchase assets and will have a limited life.
58
Due to the above factors and other unique features of publicly registered, non-listed REITs, the IPA, an industry trade group, has standardized a measure known as MFFO, which the IPA has recommended as a supplemental measure for publicly registered non-listed REITs and which we believe to be another appropriate supplemental measure to reflect the operating performance of a public, non-listed REIT having the characteristics described above. MFFO is not equivalent to our net income or loss as determined under GAAP, and MFFO may not be a useful measure of the impact of long-term operating performance on value if we do not continue to operate with a limited life and targeted exit strategy, as currently intended. We believe that, because MFFO excludes costs that we consider more reflective of investing activities and other non-operating items included in FFO and also excludes acquisition fees and expenses that affect our operations only in periods in which properties are acquired, MFFO can provide, on a going forward basis, an indication of the sustainability (that is, the capacity to continue to be maintained) of our operating performance after the period in which we are acquiring our properties and once our portfolio is in place. By providing MFFO, we believe we are presenting useful information that assists investors and analysts to better assess the sustainability of our operating performance after our offering has been completed and our properties have been acquired. We also believe that MFFO is a recognized measure of sustainable operating performance by the non-listed REIT industry. Further, we believe MFFO is useful in comparing the sustainability of our operating performance after our offering and acquisitions are completed with the sustainability of the operating performance of other real estate companies that are not as involved in acquisition activities. Investors are cautioned that MFFO should only be used to assess the sustainability of our operating performance after our offering has been completed and properties have been acquired, as it excludes acquisition costs that have a negative effect on our operating performance during the periods in which properties are acquired.
We define MFFO, a non-GAAP financial measure, consistent with the IPA’s Guideline 2010-01, Supplemental Performance Measure for Publicly Registered, Non-Listed REITs: Modified Funds from Operations, or the Practice Guideline, issued by the IPA in November 2010. The Practice Guideline defines MFFO as FFO further adjusted for the following items, as applicable, included in the determination of GAAP net income: acquisition fees and expenses; amounts relating to deferred rent receivables and amortization of above and below market leases and liabilities (which are adjusted in order to reflect such payments from a GAAP accrual basis to a cash basis of disclosing the rent and lease payments); accretion of discounts and amortization of premiums on debt investments; mark-to-market adjustments included in net income; nonrecurring gains or losses included in net income from the extinguishment or sale of debt, hedges, foreign exchange, derivatives or securities holdings where trading of such holdings is not a fundamental attribute of the business plan, unrealized gains or losses resulting from consolidation from, or deconsolidation to, equity accounting, and after adjustments for consolidated and unconsolidated partnerships and joint ventures, with such adjustments calculated to reflect MFFO on the same basis. The accretion of discounts and amortization of premiums on debt investments, nonrecurring unrealized gains and losses on hedges, foreign exchange, derivatives or securities holdings, unrealized gains and losses resulting from consolidations, as well as other listed cash flow adjustments are adjustments made to net income in calculating the cash flows provided by operating activities and, in some cases, reflect gains or losses which are unrealized and may not ultimately be realized. While we rely on our advisor for managing interest rate, hedge and foreign exchange risk, we do not retain an outside consultant to review all our hedging agreements. Inasmuch as interest rate hedges are not a fundamental part of our operations, we believe it is appropriate to exclude such non-recurring gains and losses in calculating MFFO, as such gains and losses are not reflective of on-going operations.
Our MFFO calculation complies with the IPA’s Practice Guideline described above. In calculating MFFO, we exclude acquisition related expenses, amortization of above and below market leases, fair value adjustments of derivative financial instruments, deferred rent receivables and the adjustments of such items related to noncontrolling interests. Under GAAP, acquisition fees and expenses are characterized as operating expenses in determining operating net income. These expenses are paid in cash by us. All paid and accrued acquisition fees and expenses will have negative effects on returns to investors, the potential for future distributions, and cash flows generated by us, unless earnings from operations or net sales proceeds from the disposition of other properties are generated to cover the purchase price of the property, these fees and expenses and other costs related to such property. In the event that operational earnings and cash flow are not available to fund our reimbursement of acquisition fees and expenses incurred by our advisor, such fees and expenses will need to be reimbursed to our advisor from other sources, including debt, net proceeds from the sale of properties, or from ancillary cash flows. The acquisition of properties, and the corresponding acquisition fees and expenses, is the key operational feature of our business plan to generate operational income and cash flow to fund distributions to our stockholders. Further, under GAAP, certain contemplated non-cash fair value and other non-cash adjustments are considered operating non-cash adjustments to net income in determining cash flow from operating activities. In addition, we view fair value adjustments of derivatives and gains and losses from dispositions of assets and loss on extinguishment of debts as non-recurring items or items which are unrealized and may not
59
ultimately be realized, and which are not reflective of on-going operations and are therefore typically adjusted for when assessing operating performance.
Our management uses MFFO and the adjustments used to calculate MFFO in order to evaluate our performance against other public, non-listed REITs which have limited lives with short and defined acquisition periods and targeted exit strategies shortly thereafter. As noted above, MFFO may not be a useful measure of the impact of long-term operating performance on value if we do not continue to operate in this manner. We believe that our use of MFFO and the adjustments used to calculate MFFO allow us to present our performance in a manner that reflects certain characteristics that are unique to public, non-listed REITs, such as their limited life, limited and defined acquisition period and targeted exit strategy, and hence that the use of such measures is useful to investors. By excluding expensed acquisition costs, the use of MFFO provides information consistent with management’s analysis of the operating performance of the properties. Additionally, fair value adjustments, which are based on
the impact of current market fluctuations and underlying assessments of general market conditions, but can also result from operational factors such as rental and occupancy rates, may not be directly related or attributable to our current operating performance. By excluding such changes that may reflect anticipated and unrealized gains or losses, we believe MFFO provides useful supplemental information.
Presentation of this information is intended to provide useful information to investors as they compare our operating performance to that of other public, non-listed REITs, although it should be noted that not all public, non-listed REITs calculate FFO and MFFO the same way, so comparisons with other public, non-listed REITs may not be meaningful. Furthermore, FFO and MFFO are not necessarily indicative of cash flow available to fund cash needs and should not be considered as an alternative to net income (loss) or income (loss) from continuing operations as an indication of our performance, as an alternative to cash flows from operations as an indication of our liquidity, or indicative of funds available to fund our cash needs, including our ability to make distributions to our stockholders. FFO and MFFO should be reviewed in conjunction with GAAP measurements as an indication of our performance. MFFO has limitations as a performance measure where there is no regular net asset value determination of us. MFFO is useful in assisting management and investors in assessing the sustainability of operating performance in future operating periods, and in particular, after the offering and acquisition stages are complete and net asset value is disclosed. MFFO is not a useful measure in evaluating net asset value because impairments are taken into account in determining net asset value but not in determining MFFO.
Neither the SEC, NAREIT nor any other regulatory body has passed judgment on the acceptability of the adjustments that we use to calculate FFO or MFFO. In the future, the SEC, NAREIT or another regulatory body may decide to standardize the allowable adjustments across the non-listed REIT industry and in response to such standardization we may have to adjust our calculation and characterization of FFO or MFFO accordingly.
60
Our calculation of FFO and MFFO is presented in the following table for the years ended December 31, 2016, 2015 and 2014:
For the Years Ended December 31, | ||||||||||||
Reconciliation of net loss to MFFO: | 2016 | 2015 | 2014 | |||||||||
Net loss | $ | (25,579,651 | ) | $ | (13,024,358 | ) | $ | (25,742,292 | ) | |||
Depreciation of real estate assets | 69,360,316 | 65,271,243 | 59,014,085 | |||||||||
Amortization of lease-related costs | 153,168 | 368,953 | 10,667,092 | |||||||||
Gain on sales of real estate, net | — | — | (9,944,134 | ) | ||||||||
FFO | 43,933,833 | 52,615,838 | 33,994,751 | |||||||||
Acquisition fees and expenses(1)(2) | 960 | 194,880 | 4,878,304 | |||||||||
Unrealized (gain) loss on derivative instruments | (61,698 | ) | 2,032,746 | 4,353,301 | ||||||||
Loss on debt extinguishment | 4,932,369 | — | 1,939,817 | |||||||||
Amortization of below-market leases | — | — | (163,237 | ) | ||||||||
Change in value of restricted common stock to Advisor | 312,353 | 300,440 | — | |||||||||
MFFO | $ | 49,117,817 | $ | 55,143,904 | $ | 45,002,936 | ||||||
FFO per share - basic and diluted | $ | 0.58 | $ | 0.69 | $ | 0.45 | ||||||
MFFO per share - basic and diluted | 0.64 | 0.72 | 0.60 | |||||||||
Loss per common share - basic and diluted | (0.34 | ) | (0.18 | ) | (0.34 | ) | ||||||
Weighted average number of common shares outstanding, basic and diluted | 76,195,083 | 76,335,114 | 75,450,215 | |||||||||
________________
(1) | By excluding acquisition fees and expenses, management believes MFFO provides useful supplemental information that is comparable for each type of real estate investment and is consistent with management’s analysis of the investing and operating performance of our properties. Acquisition fees and expenses include payments to our advisor or third parties. Acquisition fees and expenses under GAAP are considered operating expenses and as expenses included in the determination of net income (loss) and income (loss) from continuing operations, both of which are performance measures under GAAP. All paid and accrued acquisition fees and expenses will have negative effects on returns to investors, the potential for future distributions, and cash flows generated by us, unless earnings from operations or net sales proceeds from the disposition of properties are generated to cover the purchase price of the property, these fees and expenses and other costs related to the property. In the event that proceeds from our initial public offering are not available to fund our reimbursement of acquisition fees and expenses incurred by our advisor, such fees and expenses will need to be reimbursed to the advisor from other sources, including debt, operational earnings or cash flow, net proceeds from the sale of properties, or from ancillary cash flows. |
(2) | Acquisition fees and expenses for the years ended December 31, 2016, 2015 and 2014 includes acquisition fees of $960, $187,735 and $3,251,400, respectively, that are recorded in fees to affiliates in the accompanying consolidated statements of operations and acquisition expenses of $0, $7,145 and $1,626,904, respectively, that are recorded in acquisition costs in the accompanying consolidated statements of operations. |
FFO and MFFO may be used to fund all or a portion of certain capitalizable items that are excluded from FFO and MFFO, such as tenant improvements, building improvements and deferred leasing costs.
Inflation
Substantially all of our multifamily property leases are for a term of one year or less. In an inflationary environment, this may allow us to realize increased rents upon renewal of existing leases or the beginning of new leases. Short-term leases generally will minimize our risk from the adverse effects of inflation, although these leases generally permit residents to leave
61
at the end of the lease term and therefore will expose us to the effects of a decline in market rents. In a deflationary rent environment, we may be exposed to declining rents more quickly under these shorter term leases.
With respect to other commercial properties, we currently include, and expect in the future to include, provisions in our leases designed to protect us from the impact of inflation. These provisions will include reimbursement billings for operating expense pass-through charges, real estate tax and insurance reimbursements, or in some cases annual reimbursement of operating expenses above a certain allowance. We believe that shorter term lease contracts lessen the impact of inflation due to the ability to adjust rental rates to market levels as leases expire.
As of December 31, 2016, we had not entered into any leases as a lessee.
REIT Compliance
To qualify as a REIT for tax purposes, we are required to distribute at least 90% of our REIT taxable income (which is computed without regard to the dividends paid deduction or net capital gain and which does not necessarily equal net income as calculated in accordance with GAAP) to our stockholders. We must also meet certain asset and income tests, as well as other requirements. We monitor the operations and transactions that may potentially impact our REIT status. If we fail to qualify as a REIT in any taxable year, we will be subject to federal income tax (including any applicable alternative minimum tax) on our taxable income at regular corporate rates.
Distributions
Our board of directors has declared daily distributions that are paid on a monthly basis. We expect to continue paying monthly distributions unless our results of operations, our general financial condition, general economic conditions or other factors prohibit us from doing so. We may declare distributions in excess of our cash from operations. As a result, our distribution rate and payment frequency may vary from time to time. However, to qualify as a REIT for tax purposes, we must make distributions equal to at least 90% of our REIT taxable income each year.
During 2016, distributions (1) accrued daily to our stockholders of record as of the close of business on each day, (2) were payable in cumulative amounts on or before the third day of each calendar month with respect to the prior month and (3) (i) for the three months ended March 31, 2016, were calculated at a rate of $0.001964 per share of common stock per day, which if paid each day over a 365-day period is equivalent to a 7.0% annualized distribution rate based on a purchase price of $10.24 per share of common stock, and (ii) for the nine months ended December 31, 2016, were calculated at a rate of $0.001958 per share per day, which if paid each day over a 366-day period is equivalent to a 7.0% annualized distribution rate based on a purchase price of $10.24 per share of common stock. There is no guaranty that we will pay distributions at this rate in the future if at all.
Distributions declared and paid during each of the four quarters ended December 31, 2016 were as follows:
Period | Distributions Declared(1) | Distributions Declared Per Share(1)(2) | Distributions Paid(3)(4) | Sources of Distributions Paid | Net Cash Provided By Operating Activities | |||||||||||||||||||
Cash Flow From Operations | Credit Facilities | |||||||||||||||||||||||
First Quarter 2016 | $ | 13,649,330 | $ | 0.178 | $ | 13,669,663 | $ | 11,942,765 | $ | 1,726,898 | $ | 11,942,765 | ||||||||||||
Second Quarter 2016 | 13,673,510 | 0.178 | 13,829,064 | 11,699,749 | 2,129,315 | 11,699,749 | ||||||||||||||||||
Third Quarter 2016 | 13,767,424 | 0.180 | 13,772,501 | 13,772,501 | — | 14,661,164 | ||||||||||||||||||
Fourth Quarter 2016 | 13,738,003 | 0.180 | 13,599,945 | 13,599,945 | — | 15,955,742 | ||||||||||||||||||
$ | 54,828,267 | $ | 0.716 | $ | 54,871,173 | $ | 51,014,960 | $ | 3,856,213 | $ | 54,259,420 | |||||||||||||
________________
(1) | Distributions were based on daily record dates and calculated at a rate of $0.001964 per share per day during the year ended December 31, 2015 and three months ended March 31, 2016 and at a rate of $0.001958 per share per day during the nine months ended December 31, 2016. |
(2) | Assumes each share was issued and outstanding each day during the periods presented. |
62
(3) | Distributions are paid on a monthly basis. Distributions for all record dates of a given month are paid approximately three days following month end. |
(4) | Our distribution reinvestment plan was suspended by our board of directors effective with distributions earned beginning on December 1, 2014. |
For the year ended December 31, 2016, we paid aggregate distributions of $54,871,173. All such distributions were paid in cash. For the year ended December 31, 2016, we had a net loss of $25,579,651. We had FFO for the year ended December 31, 2016 of $43,933,833 and net cash provided by operating activities was $54,259,420. For the year ended December 31, 2016, we funded $51,014,960 of distributions paid with net cash provided by operating activities and with proceeds from our credit facilities of $3,856,213. During the year ended December 31, 2016, of the $54,871,173 in total distributions paid, all of which were paid in cash, 93% of such amounts were funded from cash flow from operations and 7% were funded from credit facilities. Since inception, of the $198,728,962 in total distributions paid through December 31, 2016, including shares issued pursuant to our distribution reinvestment plan, 77% of such amounts were funded from cash flow from operations, 18% of such amounts were funded from offering proceeds and 4% of such amounts were funded from credit facilities. See the reconciliation of FFO to net loss above in “—Funds from Operations and Modified Funds from Operations.”
Over the long-term, we expect that our distributions will be paid from cash flow from operations and FFO (except with respect to distributions related to sales of our real estate investments). However, our operating performance cannot be accurately predicted and may deteriorate in the future due to numerous factors, including those discussed under “Risk Factors,” and “—Results of Operations.” In the event our cash flow from operations decreases in the future, the level of our distributions may also decrease.
Off-Balance Sheet Arrangements
As of December 31, 2016 and 2015, we had no off-balance sheet arrangements that have or are reasonably likely to have a current or future effect on our financial condition, changes in financial condition, revenues or expenses, results of operations, liquidity, capital expenditures or capital resources.
Related-Party Transactions and Agreements
We have entered into agreements with our advisor and its affiliates, whereby we have paid, and may continue to pay, certain fees to, or reimburse certain expenses of, our advisor or its affiliates for acquisition and advisory fees and expenses, financing coordination fees, organization and offering costs, sales commissions, dealer manager fees, asset and property management fees and expenses, leasing fees and reimbursement of certain operating costs. See Item 13. “Certain Relationships and Related Transactions, Director Independence” and Note 8 (Related Party Arrangements) to the consolidated financial statements included in this annual report for a discussion of the various related-party transactions, agreements and fees.
Critical Accounting Policies
Below is a discussion of the accounting policies that we believe are critical because they involve significant judgments and assumptions, require estimates about matters that are inherently uncertain and because they are important for understanding and evaluating our reported financial results. These judgments affect the reported amounts of assets and liabilities and our disclosure of contingent assets and liabilities at the dates of the financial statements and the reported amounts of revenue and expenses during the reporting periods. With different estimates or assumptions, materially different amounts could be reported in our financial statements. Other companies may utilize different estimates that may impact the comparability of our results of operations to those of companies in similar businesses.
Real Estate Assets
Depreciation and Amortization
Real estate costs related to the development, construction and improvement of properties are capitalized. Acquisition costs related to business combinations are expensed as incurred. Acquisition costs related to asset acquisitions are capitalized. Repair and maintenance and tenant turnover costs are charged to expense as incurred and significant replacements and betterments are
63
capitalized. Repair and maintenance and tenant turnover costs include all costs that do not extend the useful life of the real estate asset. We consider the period of future benefit of an asset to determine its appropriate useful life and anticipate the estimated useful lives of assets by class to be generally as follows:
Buildings | 27.5 years | |
Building improvements | 5-25 years | |
Tenant improvements | Shorter of lease term or expected useful life | |
Tenant origination and absorption costs | Remaining term of related lease | |
Furniture, fixtures, and equipment | 5-10 years | |
Real Estate Purchase Price Allocation
We record the acquisition of income-producing real estate or real estate that will be used for the production of income as a business combination. All assets acquired and liabilities assumed in a business combination are measured at their acquisition-date fair values. Acquisition costs are expensed as incurred.
We assess the acquisition-date fair values of all tangible assets, identifiable intangible assets and assumed liabilities using methods similar to those used by independent appraisers (e.g., discounted cash flow analysis) and that utilize appropriate discount and/or capitalization rates and available market information. Estimates of future cash flows are based on a number of factors including historical operating results, known and anticipated trends, and market and economic conditions. The fair value of tangible assets of an acquired property considers the value of the property as if it was vacant.
Intangible assets include the value of in-place leases, which represents the estimated value of the net cash flows of the in-place leases to be realized, as compared to the net cash flows that would have occurred had the property been vacant at the time of acquisition and subject to lease-up.
We estimate the value of tenant origination and absorption costs by considering the estimated carrying costs during hypothetical expected lease-up periods, considering current market conditions. In estimating carrying costs, we estimate the amount of lost rentals using market rates during the expected lease-up periods.
We amortize the value of in-place leases to expense over the remaining non-cancelable term of the respective leases. Should a tenant terminate its lease, the unamortized portion of the in-place lease value and customer relationship intangibles would be charged to expense in that period.
We record above-market and below-market in-place lease values for acquired properties, if any, based on the present value (using an interest rate that reflects the risks associated with the leases acquired) of the difference between (1) the contractual amounts to be paid pursuant to the in-place leases and (2) our estimate of fair market lease rates for the corresponding in-place leases, measured over a period equal to the remaining non-cancelable term of the lease. We amortize any capitalized above-market or below-market lease values as a reduction or increase to rental income over the remaining non-cancelable terms of the respective leases.
Estimates of the fair values of the tangible assets, identifiable intangible assets and assumed liabilities require us to make significant assumptions to estimate market lease rates, property-operating expenses, carrying costs during lease-up periods, discount rates, market absorption periods, and the number of years the property will be held for investment. The use of inappropriate assumptions could result in an incorrect valuation of acquired tangible assets, identifiable intangible assets and assumed liabilities, which could impact the amount of our net income (loss).
Sale of Real Estate Assets
We record property sales or dispositions when title transfers to unrelated third parties, contingencies have been removed and sufficient cash consideration has been received by us. Upon disposition, the related costs and accumulated depreciation are removed from the respective accounts. Any gain or loss on sale is recognized in accordance with GAAP.
We classify real estate assets as real estate held for sale once the criteria, as defined by GAAP, have been met.
64
Impairment of Real Estate Assets
We account for our real estate assets in accordance with ASC 360—Property, Plant and Equipment (“ASC 360”). ASC 360 requires that we continually monitor events and changes in circumstances that could indicate that the carrying amounts of our real estate and related intangible assets may not be recoverable. When indicators of potential impairment suggest that the carrying value of real estate and related intangible assets and liabilities may not be recoverable, we assess the recoverability of the assets by estimating whether we will recover the carrying value of the asset through its undiscounted future cash flows and its eventual disposition. Based on this analysis, if we do not believe that we will be able to recover the carrying value of the real estate and related intangible assets and liabilities, we record an impairment loss to the extent that the carrying value exceeds the estimated fair value of the real estate and related intangible assets and liabilities. If any assumptions, projections or estimates regarding an asset changes in the future, we may have to record an impairment to reduce the net book value of such individual asset.
Rents and Other Receivables
We periodically evaluate the collectability of amounts due from tenants and maintain an allowance for doubtful accounts for estimated losses resulting from the inability of tenants to make required payments under lease agreements. We exercise judgment in establishing these allowances and consider payment history and current credit status of tenants in developing these estimates. Due to the short-term nature of the operating leases, we do not maintain an allowance for deferred rent receivable related to the straight-lining of rents.
Revenue Recognition
We lease apartment and condominium units under operating leases with terms generally of one year or less. Generally, credit investigations are performed for prospective residents and security deposits are obtained. We recognize minimum rent, including rental abatements, concessions and contractual fixed increases attributable to operating leases, on a straight-line basis over the term of the related lease and amounts expected to be received in later years are recorded as deferred rents. We record property operating expense reimbursements due from tenants for common area maintenance, real estate taxes, and other recoverable costs in the period the related expenses are incurred.
We recognize gains on sales of real estate either in total or deferred for a period of time, depending on whether a sale has been consummated, the extent of the buyer’s investment in the property being sold, whether the receivable is subject to future subordination, and the degree of our continuing involvement with the property after the sale. If the criteria for profit recognition under the full-accrual method are not met, we will defer gain recognition and account for the continued operations of the property by applying the percentage-of-completion, reduced profit, deposit, installment or cost recovery method, as appropriate, until the appropriate criteria are met.
Fair Value Measurements
Under GAAP, we are required to measure certain financial instruments at fair value on a recurring basis. In addition, we are required to measure other assets and liabilities at fair value on a non-recurring basis (e.g., carrying value of impaired real estate loans receivable and long-lived assets). Fair value is defined as the price that would be received upon the sale of an asset or paid to transfer a liability in an orderly transaction between market participants at the measurement date. The GAAP fair value framework uses a three-tiered approach. Fair value measurements are classified and disclosed in one of the following three categories:
Level 1: | unadjusted quoted prices in active markets that are accessible at the measurement date for identical assets or liabilities; |
Level 2: | quoted prices for similar instruments in active markets, quoted prices for identical or similar instruments in markets that are not active, and model-derived valuations in which significant inputs and significant value drivers are observable in active markets; and |
Level 3: | prices or valuation techniques where little or no market data is available that requires inputs that are both significant to the fair value measurement and unobservable. |
When available, we utilize quoted market prices from an independent third-party source to determine fair value and will classify such items in Level 1 or Level 2. In instances where the market is not active, regardless of the availability of a
65
nonbinding quoted market price, observable inputs might not be relevant and could require us to make a significant adjustment to derive a fair value measurement. Additionally, in an inactive market, a market price quoted from an independent third party may rely more on models with inputs based on information available only to that independent third party. When we determine the market for a financial instrument we own to be illiquid or when market transactions for similar instruments do not appear orderly, we use several valuation sources (including internal valuations, discounted cash flow analysis and quoted market prices) and we establish a fair value by assigning weights to the various valuation sources.
Changes in assumptions or estimation methodologies can have a material effect on these estimated fair values. In this regard, the derived fair value estimates cannot be substantiated by comparison to independent markets and, in many cases, may not be realized in an immediate settlement of the instrument.
Accounting for Stock-Based Compensation
We amortize the fair value of stock-based compensation awards to expense over the vesting period and record any dividend equivalents earned as dividends for financial reporting purposes. Stock-based compensation awards are valued at the fair value on the date of grant and amortized as an expense over the vesting period.
Income Taxes
We have elected to be taxed as a REIT under the Internal Revenue Code beginning with the tax year ended December 31, 2010. To qualify as a REIT, we must meet certain organizational and operational requirements, including the requirement to distribute at least 90% of our annual REIT taxable income to our stockholders (which is computed without regard to the dividends paid deduction or net capital gain and which does not necessarily equal net income as calculated in accordance with GAAP). As a REIT, we generally will not be subject to federal income tax to the extent we distribute qualifying dividends to our stockholders. If we fail to qualify as a REIT in any taxable year, we will be subject to federal income tax on our taxable income at regular corporate income tax rates and generally will not be permitted to qualify for treatment as a REIT for federal income tax purposes for the four taxable years following the year during which qualification is lost, unless the Internal Revenue Service grants us relief under certain statutory provisions. Such an event could materially adversely affect our net income and net cash available for distribution to our stockholders. However, we believe we are organized and operate in such a manner as to qualify for treatment as a REIT.
We follow the income tax guidance under GAAP to recognize, measure, present and disclose in our consolidated financial statements uncertain tax positions that we have taken or expect to take on a tax return. As of December 31, 2016 and 2015, we did not have any liabilities for uncertain tax positions that we believe should be recognized in our consolidated financial statements. Due to uncertainty regarding the realization of certain deferred tax assets, we have established valuation allowances, primarily in connection with the net operating loss carryforward related to the REIT. We have not been assessed material interest or penalties by any major tax jurisdictions. Our evaluation was performed for the tax years ended December 31, 2016 and 2015. As of December 31, 2016, returns for calendar years 2015, 2014 and 2013 remain subject to examination by major tax jurisdictions.
Subsequent Events
Distributions Paid
On January 3, 2017, we paid distributions of $4,625,355, which related to distributions declared for each day in the period from December 1, 2016 through December 31, 2016. All such distributions were paid in cash.
On February 1, 2017, we paid distributions of $4,639,320, which related to distributions declared for each day in the period from January 1, 2017 through January 31, 2017. All such distributions were paid in cash.
On March 1, 2017, we paid distributions of $4,180,195, which related to distributions declared for each day in the period from February 1, 2017 through February 28, 2017. All such distributions were paid in cash.
Redemption
On January 31, 2017, we redeemed 183,955 shares of our common stock for a total redemption value of $2,000,000, or $10.87 per share, pursuant to our share repurchase program.
66
Estimated Value per Share
On February 15, 2017, our board of directors determined an estimated value per share of our common stock of $11.65 as of December 31, 2016. In connection with the determination of the estimated value per share, redemptions pursuant to our share repurchase program will be based on a price of $11.65 commencing on the repurchase date for the quarter ended March 31, 2017.
ITEM 7A. | QUANTITATIVE AND QUALITATIVE DISCLOSURES ABOUT MARKET RISK |
We may be exposed to the effects of interest rate changes as a result of borrowings used to maintain liquidity and to fund the acquisition, expansion and refinancing of our real estate investment portfolio and operations. We may be also exposed to the effects of changes in interest rates as a result of the acquisition and origination of mortgage, mezzanine, bridge and other loans. Our profitability and the value of our investment portfolio may be adversely affected during any period as a result of interest rate changes. Our interest rate risk management objectives are to limit the impact of interest rate changes on earnings, prepayment penalties and cash flows and to lower overall borrowing costs. We have managed and will continue to manage interest rate risk by maintaining a ratio of fixed rate, long-term debt such that floating rate exposure is kept at an acceptable level. In addition, we may utilize a variety of financial instruments, including interest rate caps, collars, floors and swap agreements, in order to limit the effects of changes in interest rates on our operations. When we use these types of derivatives to hedge the risk of interest-earning assets or interest-bearing liabilities, we may be subject to certain risks, including the risk that losses on a hedge position will reduce the funds available for payments to holders of our common stock and that the losses may exceed the amount we invested in the instruments.
We borrow funds and make investments at a combination of fixed and variable rates. Interest rate fluctuations will generally not affect our future earnings or cash flows on our fixed rate debt unless such instruments mature or are otherwise terminated. However, interest rate changes will affect the fair value of our fixed rate instruments. At December 31, 2016, the fair value of our fixed rate debt was $460,324,325 and the carrying value of our fixed rate debt was $471,541,902. The fair value estimate of our fixed rate debt was estimated using a discounted cash flow analysis utilizing rates we would expect to pay for debt of a similar type and remaining maturity if the loans were originated at December 31, 2016. As we expect to hold our fixed rate instruments to maturity and the amounts due under such instruments would be limited to the outstanding principal balance and any accrued and unpaid interest, we do not expect that fluctuations in interest rates, and the resulting change in fair value of our fixed rate instruments, would have a significant impact on our operations.
Conversely, movements in interest rates on our variable rate debt would change our future earnings and cash flows, but not significantly affect the fair value of those instruments. However, changes in required risk premiums would result in changes in the fair value of floating rate instruments. At December 31, 2016, the fair value of our variable rate debt was $736,690,780 and the carrying value of our variable rate debt was $746,174,378. Based on interest rates as of December 31, 2016, if interest rates are 100 basis points higher during the 12 months ending December 31, 2017, interest expense on our variable rate debt would increase by $7,738,583 and if interest rates are 100 basis points lower during the 12 months ending December 31, 2017, interest expense on our variable rate debt would decrease by $5,835,928.
At December 31, 2016, the weighted-average interest rate of our fixed rate debt and variable rate debt was 4.06% and 2.92%, respectively. The weighted-average interest rate of our blended fixed and variable rates was 3.36% at December 31, 2016. The weighted-average interest rate represents the actual interest rate in effect at December 31, 2016 (consisting of the contractual interest rate), using interest rate indices as of December 31, 2016, where applicable.
ITEM 8. | FINANCIAL STATEMENTS AND SUPPLEMENTARY DATA |
Our consolidated financial statements and supplementary data can be found beginning at page F-1 of this annual report.
ITEM 9. | CHANGES IN AND DISAGREEMENTS WITH ACCOUNTANTS ON ACCOUNTING AND FINANCIAL DISCLOSURE |
None.
67
ITEM 9A. | CONTROLS AND PROCEDURES |
Disclosure Controls and Procedures
We maintain disclosure controls and procedures that are designed to ensure that information required to be disclosed in our reports under the Exchange Act is recorded, processed, summarized and reported within the time periods specified in the rules and forms, and that such information is accumulated and communicated to us, including our chief executive officer and principal financial officer, as appropriate, to allow timely decisions regarding required disclosure. In designing and evaluating the disclosure controls and procedures, we recognize that any controls and procedures, no matter how well designed and operated, can provide only reasonable assurance of achieving the desired control objectives, as ours are designed to do, and we necessarily are required to apply our judgment in evaluating whether the benefits of the controls and procedures that we adopt outweigh their costs.
As required by Rules 13a-15(b) and 15d-15(b) of the Exchange Act, an evaluation as of December 31, 2016 was conducted under the supervision and with the participation of our management, including our chief executive officer and principal financial officer, of the effectiveness of our disclosure controls and procedures (as defined in Rules 13a-15(e) and 15d-15(e) under the Exchange Act). Based on this evaluation, our chief executive officer and principal financial officer concluded that our disclosure controls and procedures, as of December 31, 2016, were effective at the reasonable assurance level.
Internal Control Over Financial Reporting
Our management is responsible for establishing and maintaining adequate internal control over financial reporting, as such term is defined in Rule 13a-15(f) or 15d-15(f) promulgated under the Exchange Act.
In connection with the preparation of this annual report, our management, including our chief executive officer and chief accounting officer, assessed the effectiveness of our internal control over financial reporting as of December 31, 2016. In making that assessment, our management used the criteria set forth by the Committee of Sponsoring Organizations of the Treadway Commission (COSO) in Internal Control-Integrated Framework (2013 framework).
Based on its assessment, our management believes that, as of December 31, 2016, our internal control over financial reporting was effective based on those criteria.
There have been no changes in our internal control over financial reporting that occurred during the quarter ended December 31, 2016 that have materially affected, or are reasonably likely to materially affect, our internal control over financial reporting.
ITEM 9B. | OTHER INFORMATION |
None.
68
PART III
ITEM 10. | DIRECTORS, EXECUTIVE OFFICERS AND CORPORATE GOVERNANCE |
Our directors and executive officers and their respective positions and offices are as follows:
Name | Age | Position | ||
Rodney F. Emery | 66 | Chairman of the Board and Chief Executive Officer | ||
Ella S. Neyland | 62 | Affiliated Director and President | ||
Kevin J. Keating | 54 | Treasurer | ||
Ana Marie del Rio | 62 | Secretary | ||
Scot B. Barker | 68 | Independent Director | ||
Ned W. Brines | 55 | Independent Director | ||
Don B. Saulic | 58 | Independent Director | ||
________________
Rodney F. Emery serves as our Chairman of the Board and Chief Executive Officer, positions he has held since our inception in May 2009. Mr. Emery also serves as Chairman of the Board and Chief Executive Officer of Steadfast Apartment REIT, positions he has held since August 2013 and September 2013, respectively. In addition, Mr. Emery serves as Chairman of the Board and Chief Executive Officer of Steadfast Apartment REIT III, positions he has held since January 2016 and August 2015, respectively. Mr. Emery is the founder of Steadfast Companies and is responsible for the corporate vision, strategy and overall guidance of the operations of Steadfast Companies. Mr. Emery chairs the Steadfast Executive Committee, which establishes policy and strategy and acts as the general oversight committee of Steadfast Companies. Mr. Emery also serves on the Steadfast Companies Investment Committee and is a member of the Board of Managers of Steadfast Capital Markets Group, LLC. Prior to founding Steadfast Companies in 1994, Mr. Emery served for 17 years as the President of Cove Properties, a diversified commercial real estate firm specializing in property-management, construction and development with a specialty in industrial properties. Mr. Emery received a Bachelor of Science in Accounting from the University of Southern California and serves on the board of directors of several non-profit organizations.
Our board of directors, excluding Mr. Emery, has determined that the leadership positions previously and currently held by Mr. Emery and Mr. Emery’s extensive experience acquiring, financing, developing and managing hotel, multifamily, office, and retail real estate assets throughout the country have provided Mr. Emery with the experience, skills and attributes necessary to effectively carry out his duties and responsibilities as a director. Consequently, our board of directors has determined that Mr. Emery is highly qualified to serve as one of our directors.
Ella S. Neyland, serves as our President and an affiliated director, positions she has held since October 2012. Ms. Neyland has also served as one of our independent directors, a position she held from October 2011 to September 2012. Ms. Neyland also serves as President and an affiliated director of Steadfast Apartment REIT, positions she has held since September 2013 and August 2013, respectively. In addition, Ms. Neyland serves as President and an affiliated director of Steadfast Apartment REIT III, positions she has held since August 2015 and January 2016, respectively. Ms. Neyland founded Thin Centers MD, or TCMD, which provides medically supervised weight loss programs, in June 2010, and served as its Chief Financial Officer from February 2011 to October 2011. Prior to founding TCMD, Ms. Neyland was a founder of Santa Barbara Medical Innovations, LLC, a privately owned company that owns and leases low-level lasers to medical groups, and served as its Chief Financial Officer from December 2008 to February 2011. From October 2004 to December 2008, Ms. Neyland was a financial advisor and an owner of Montecito Medical Investment Company, a private real estate acquisition and development company headquartered in Santa Barbara, California. While with Montecito Medical Investment Company, Ms. Neyland advised the company in the acquisition of 43 medical properties with over two million square feet of space in 13 states and advised an affiliate company, Montecito Property Company, in the acquisition of 8,300 apartments in 29 communities. From April 2001 to September 2004, Ms. Neyland served as the Executive Vice President, Treasurer and Investor Relations Officer of United Dominion Realty Trust, Inc., where she was responsible for capital market transactions, banking relationships and presentations
69
to investors and Wall Street analysts. Ms. Neyland also served as a voting member of the Investment Committee of United Dominion Realty Trust, Inc. that approved the repositioning of over $3 billion of investments. Prior to working at United Dominion Realty Trust, Inc., Ms. Neyland served as the Chief Financial Officer at Sunrise Housing, Ltd, a privately owned apartment development company, from November 1999 to March 2001. Ms. Neyland also served as Executive Director of CIBC World Markets, which provides investment, research and corporate banking products, from November 1997 to October 1999. From July 1990 to October 1997, Ms. Neyland served as the Senior Vice President of Finance and the Vice President of Troubled Debt Restructures/Finance for the Lincoln Property Company, a commercial real estate development and management company. From November 1989 to July 1990, Ms. Neyland was the Vice President/Portfolio Manager at Bonnet Resources Corporation, a subsidiary of BancOne. Prior to her employment at Bonnet Resources Corporation, Ms. Neyland served on the board of directors and as the Senior Vice President/Director of Commercial Real Estate Lending at Commerce Savings Association, a subsidiary of the publicly held American Century Corporation, from May 1983 to March 1989. Ms. Neyland received a Bachelor of Science in Finance from Trinity University in San Antonio, Texas.
Our board of directors, excluding Ms. Neyland, has determined that Ms. Neyland’s prior service as a director and as chief financial officer have provided Ms. Neyland with the experience, skills and attributes necessary to effectively carry out her duties and responsibilities as a director. Consequently, our board of directors has determined that Ms. Neyland is highly qualified to serve as one of our directors.
Kevin J. Keating serves as our Treasurer, a position he has held since April 2011. Mr. Keating has also served as Treasurer of both Steadfast Apartment REIT and Steadfast Apartment REIT III since September 2013 and August 2015, respectively. In addition, Mr. Keating has served as the Chief Accounting Officer for our advisor and Treasurer of Steadfast Apartment Advisor, LLC since April 2011 and September 2013, respectively, where he has focused primarily on the accounting function and compliance responsibilities for us and our advisor. Prior to joining us and our advisor, Mr. Keating served as Senior Audit Manager with BDO USA, LLP (formerly BDO Seidman, LLP), an accounting and audit firm, from June 2006 to January 2011. From June 2004 to June 2006, Mr. Keating served as Vice President and Corporate Controller of Endocare, Inc., a medical device manufacturer. Mr. Keating has extensive experience working with public companies and served as Assistant Controller and Audit Manager for Ernst & Young LLP from 1988 to 1999. Mr. Keating holds a Bachelor of Science, Accounting from St. John’s University in New York, New York and is a certified public accountant.
Ana Marie del Rio serves as our Secretary and Compliance Officer, positions she has held since our inception in May 2009. Ms. del Rio has also served as Secretary of Steadfast Apartment REIT since September 2013 and as Secretary of Steadfast Apartment REIT III since August 2015. Ms. del Rio also serves as the Chief Operating Officer for Steadfast Companies. Ms. del Rio manages the Human Resources, Information Technology, Risk Management and Legal Services Departments for Steadfast Companies. Ms. del Rio also works closely with Steadfast Management Company, Inc. in the management and operation of Steadfast Companies’ residential apartment homes, especially in the area of compliance. Prior to joining Steadfast Companies in April 2003, Ms. del Rio was a partner in the public finance group at Orrick, Herrington & Sutcliffe, LLP, where she practiced from September 1993 to April 2003, representing both issuers and underwriters in financing single-family and multifamily housing, and other types of public-private and redevelopment projects. From 1979 to 1993, Ms. del Rio co-owned and operated a campaign consulting and research company specializing in local campaigns and ballot measures. Ms. del Rio received a Juris Doctor from the University of the Pacific, McGeorge School of Law, and received a Master of Public Administration and a Bachelor of Arts from the University of Southern California. Ms. del Rio also serves on the Board of Directors of Project Access and is a lecturer for the University of California, Irvine, School of Law.
Scot B. Barker serves as one of our independent directors, a position he has held since September 2009. From December 2003 to his retirement in December 2005, Mr. Barker served as President and Chief Operating Officer of GMAC Commercial Holding Corp., or GMACCH, one of the nation’s largest financiers of commercial real estate. Mr. Barker served as President of GMACCH Capital Markets Corp from 1998 to December 2003. During his tenure at GMACCH, Mr. Barker oversaw the firm’s real estate lending and investing activities in North America, Latin America, Asia and Europe. In 1978, Mr. Barker and several associates formed Newman and Associates, Inc., an investment banking firm specializing in financing affordable multifamily housing with tax exempt municipal securities. Mr. Barker served as Vice-President of Newman and Associates, Inc. from 1978 to 1984 and as President from 1984 to 1998, when Newman and Associates was acquired by GMACCH. Prior to founding Newman and Associates, Inc., Mr. Barker served as Vice-President with Gerwin & Co. from 1973 to 1978. Mr. Barker has been involved in a variety of professional and not-for-profit groups primarily focused on housing related business. Mr. Barker currently serves on the board of directors of Mountain Asset Management, a wholly-owned subsidiary of The Great-West Life
70
Assurance Company. Mr. Barker was a past president of the National Housing and Rehabilitation Association and a past member of the Federal National Mortgage Association (Fannie Mae) Housing Impact Advisory Council. Mr. Barker received a Bachelor of Arts from Colorado College and a Master of Business Administration from the University of Denver.
Our board of directors, excluding Mr. Barker, has determined that the prior leadership positions which Mr. Barker has held and Mr. Barker’s extensive experience with the financing of commercial real estate and multifamily housing have provided Mr. Barker with the experience, skills and attributes necessary to effectively carry out his duties and responsibilities as a director. Consequently, our board of directors has determined that Mr. Barker is highly qualified to serve as one of our directors.
Ned W. Brines serves as one of our independent directors, a position he has held since October 2012. Mr. Brines currently serves as an independent director and audit committee chairman for Steadfast Apartment REIT III, since January 2016. Mr. Brines is presently the Director of Investments for Arnel & Affiliates where he oversees the management of the assets of a private family with significant and diversified holdings. From 2012 to 2016, Mr. Brines served as the Chief Investment Officer for the CitizenTrust Wealth Management and Trust division of Citizens Business Bank, where he was responsible for the investment management discipline, process, products and related sources. In addition, in September 2008 Mr. Brines founded Montelena Asset Management, a California based registered investment advisor firm, and currently serves as its Chief Investment Officer. From June 2010 to July 2012, Mr. Brines served as a portfolio manager for Andell Holdings, a private family office with significant and diversified holdings. From May 2001 to September 2008, Mr. Brines served as a Senior Vice President and senior portfolio manager with Provident Investment Counsel in Pasadena managing their Small Cap Growth Fund with $1.6 billion in assets under management (AUM). Mr. Brines was with Roger Engemann & Associate in Pasadena from September 1994 to March 2001 in which he served as both an analyst and portfolio manager for their mid cap mutual fund and large cap Private Client business as the firm grew from $3 billion to over $19 billion in AUM. Mr. Brines earned a Master of Business Administration degree from the University of Southern California and a Bachelor of Science degree from San Diego State University. Mr. Brines also holds the Chartered Financial Analyst (CFA) designation and is involved in various community activities including serving on the investment committee of City of Hope as well as the Orange County Regional Counsel for San Diego State University.
Our board of directors, excluding Mr. Brines, has determined that Mr. Brines’ prior service as a director and as chief investment officer have provided Mr. Brines with the experience, skills and attributes necessary to effectively carry out his duties and responsibilities as a director. Consequently, our board of directors has determined that Mr. Brines is highly qualified to serve as one of our directors.
Don B. Saulic serves as one of our independent directors, a position he has held since August 2015. Mr. Saulic has been actively involved in real estate and financial services for over 30 years. Mr. Saulic currently serves as a Managing Partner and Private Wealth Advisor for The Bahnsen Group at HighTower Advisors, LLC, a position he has held since August 2015. In his role, Mr. Saulic provides comprehensive financial planning, investment advisory, and risk management to high net worth investors, businesses and institutions. From April 2013 to August 2015, Mr. Saulic served as a Private Wealth Advisor at Capstone Partners Financial and Insurance Services, LLC. From June 2012 to August 2015, Mr. Saulic served as Chief Executive Officer for King Crown Capital Corporation, a company providing strategic business planning and consulting services. From January 2013 to April 2014, Mr. Saulic was a Private Wealth Advisor for Stephen A. Kohn & Associates, LTD. In his role, Mr. Saulic provided financial planning and investment advisory services. From June 2006 to March 2014, Mr. Saulic served as President and Chief Operating Officer for Cornerstone Ventures, Inc., a real estate investment company. In his role, he helped manage real estate and wholesale distribution operations, including private client services, compliance, investor relations, human resources, information technology, and administration. From June 2012 to March 2013, Mr. Saulic was Chief Operating Officer for Healthcare Real Estate Partners, LLC, a company focused on acquiring and developing healthcare real estate. In his role, Mr. Saulic helped in managing company operations. From March 2008 to December 2012, Mr. Saulic was Chief Operating Officer for Pacific Cornerstone Capital, Inc. In his role, he managed sales operations, compliance, technology and investment services. From 1987 to 2008, Mr. Saulic served in Chief Information Officer roles for Corinthian Colleges, Inc., North American Van Lines, Inc., BAX Global, and Budget Rent a Car Corporation. Prior to 1987 he worked in the financial services industry in management positions with Ernst and Young, GATX Corporation and Kemper Financial Services. Mr. Saulic earned a Masters of Business Administration from DePaul University, a Bachelor of Science in Accounting with a minor in Economics from Illinois State University, and is a Certified Public Accountant. Mr. Saulic is involved in various community activities and is a Board Member for Vanguard University, YMCA, and the Forum of Christian Business Leaders.
71
Our board of directors, excluding Mr. Saulic, has determined that the prior leadership positions which Mr. Saulic has held and Mr. Saulic’s extensive real estate and investment management experience have provided Mr. Saulic with the experience, skills and attributes necessary to effectively carry out his duties and responsibilities as a director. Consequently, our board of directors has determined that Mr. Saulic is highly qualified to serve as one of our directors.
The Audit Committee
Our board of directors has established an audit committee. The audit committee’s function is to assist our board of directors in fulfilling its responsibilities by overseeing: (1) the integrity of our financial statements, (2) our compliance with legal and regulatory requirements, (3) our independent auditors’ qualifications and independence and (4) the performance of the independent auditors and our internal audit function. The members of the audit committee are Scot B. Barker, Ned W. Brines and Don B. Saulic. All of the members of the audit committee are “independent” as defined by our charter. Our shares are not listed for trading on any national securities exchange and therefore our audit committee members are not subject to the independence requirements of the New York Stock Exchange, or NYSE, or any other national securities exchange. However, each member of our audit committee is “independent” as defined by the NYSE. All members of the audit committee have significant financial and/or accounting experience. Our board of directors has determined that Mr. Brines satisfies the SEC’s requirements for and serves as our “audit committee financial expert.”
Investment Committee
Our board of directors has established an investment committee. Our board of directors has delegated to the investment committee: (1) certain responsibilities with respect to investment in specific investments proposed by our advisor and (2) the authority to review our investment policies and procedures on an ongoing basis. The investment committee must at all times be comprised of at least three members and a majority of independent directors. The current members of the investment committee are Rodney F. Emery, Scot B. Barker and Don B. Saulic, with Mr. Emery serving as the chairman of the investment committee.
With respect to investments, the investment committee has the authority to approve all real property acquisitions, developments and dispositions, including real property portfolio acquisitions, developments and dispositions, as well as all real estate-related investments and all investments consistent with our investment objectives, for a purchase price, total project cost or sales price of up to 10% of the cost of our net assets as of the date of investment.
Valuation Committee
Our board of directors has established a valuation committee. The valuation committee’s function, as recommended by the IPA, is to perform the following functions: (1) ratify and approve the engagement of an independent third-party valuation firm, its scope of work and any amendments thereto, (2) review and approve the proposed valuation process and methodology to be used to determine a valuation, (3) review the reasonableness of the valuation or range of value resulting from the process and (4) recommend the final proposed valuation for approval by the board of directors. The members of the valuation committee are Scot B. Barker, Ned W. Brines, and Don B. Saulic, with Mr. Brines serving as the chairman of the valuation committee.
Section 16(a) Beneficial Ownership Reporting Compliance
Section 16(a) of the Exchange Act requires each director, officer and individual beneficially owning more than 10% of our common stock to file with the SEC, within specified time frames, initial statements of beneficial ownership (Form 3) of our common stock and statements of changes in beneficial ownership (Forms 4 and 5) of our common stock. These specified time frames require the reporting of changes in ownership within two business days of the transaction giving rise to the reporting obligation. Reporting persons are required to furnish us with copies of all Section 16(a) forms filed with the SEC. Based solely on a review of the copies of such forms furnished to us during and with respect to the fiscal year ended December 31, 2016, or written representations that no additional forms were required, we believe that all required Section 16(a) filings were timely and correctly made by reporting persons during 2016.
72
Code of Conduct and Ethics
We have adopted a Code of Ethics that applies to all of our executive officers and directors, including but not limited to, our principal executive officer, principal financial officer and principal accounting officer. Our Code of Ethics can be found at our website: http://www.steadfastreits.com.
ITEM 11. | EXECUTIVE COMPENSATION |
Compensation of Executive Officers
Our executive officers do not receive compensation directly from us for services rendered to us and we do not intend to pay any compensation to our executive officers. We do not reimburse our advisor directly or indirectly for the salary or other compensation paid to any of our executive officers. As a result, we do not, nor has our board of directors considered, a compensation policy for our executive officers and we have not included a Compensation Discussion and Analysis in this annual report. Our executive officers are officers and/or employees of, or hold an indirect ownership interest in our advisor, and/or its affiliates, and our executive officers are compensated by these entities, in part, for their services to us. See Item 13. “Certain Relationships and Related Transactions, and Director Independence—Certain Transactions with Related Persons” for a discussion of the fees paid to our advisor and its affiliates.
Compensation of Directors
If a director is also one of our executive officers or an affiliate of our advisor, we do not pay any compensation to that person for services rendered as a director. The amount and form of compensation payable to our independent directors for their service to us is determined by our board of directors, based upon recommendations from our advisor. Four of our executive officers, Messrs. Rodney F. Emery and Kevin Keating and Mses. Ana Marie del Rio and Ella Neyland, manage, control or are affiliated with our advisor, and through our advisor, they are involved in recommending the compensation to be paid to our independent directors.
We have provided below certain information regarding compensation earned by or paid to our directors during fiscal year December 31, 2016:
Name | Fees Earned or Paid in Cash in 2016 | Stock Awards(1) | Option Awards | Non-Equity Incentive Plan Compensation | Change in Pension Value and Nonqualified Deferred Compensation | All Other Compensation(2) | Total | |||||||||||||||||||||
Scot B. Barker(3) | $ | 83,004 | $ | 28,600 | $ | — | $ | — | $ | — | $ | 1,918 | $ | 113,522 | ||||||||||||||
Ned W. Brines(3) | 97,991 | 28,600 | — | — | — | — | 126,591 | |||||||||||||||||||||
Don B. Saulic(3) | 88,004 | 28,600 | — | — | — | — | 116,604 | |||||||||||||||||||||
Ella S. Neyland(4) | — | — | — | — | — | — | — | |||||||||||||||||||||
Rodney F. Emery(4) | — | — | — | — | — | — | — | |||||||||||||||||||||
$ | 268,999 | $ | 85,800 | $ | — | $ | — | $ | — | $ | 1,918 | $ | 356,717 | |||||||||||||||
________________
(1) | The amounts shown in this column reflect the aggregate fair value of shares of restricted stock granted under our independent directors’ compensation plan computed as of the grant date in accordance with Financial Accounting Standards Board Accounting Standards Codification Topic 718. |
(2) | Amount represents reimbursement of expenses incurred by directors to attend various board of directors’ meetings. |
(3) | Independent Directors. |
(4) | Directors who are also our executive officers or executive officers of our affiliates do not receive compensation for services rendered as a director. |
73
Cash Compensation to Independent Directors
We pay each of our independent directors:
• | an annual retainer of $65,000 (the audit committee chairperson receives an additional $10,000 annual retainer); |
• | $3,000 for each in-person board of directors meeting attended; |
• | $2,000 for each in-person committee meeting attended; and |
• | $1,000 for each teleconference meeting of the board of directors or committee. |
Equity Plan Compensation to Independent Directors
We have approved and adopted an independent directors’ compensation plan, which operates as a sub-plan of our long-term incentive plan. Under the independent directors’ compensation plan and subject to such plan’s conditions and restrictions, each of our then independent directors was entitled to receive 5,000 shares of restricted common stock in connection with the initial meeting of the full board of directors. Our initial board of directors, and each of the independent directors, agreed to delay the initial grant of restricted stock until we raised $2,000,000 in gross offering proceeds. Each new independent director that joins our board of directors receives 5,000 shares of restricted common stock upon election to our board of directors. In addition, on the date following an independent director’s re-election to our board of directors, he or she receives 2,500 shares of restricted common stock. The shares of restricted common stock granted pursuant to our independent directors’ compensation plan generally vest in four equal annual installments beginning on the date of grant and ending on the third anniversary of the date of grant; provided, however, that the restricted stock will become fully vested on the earlier to occur of: (1) the termination of the independent director’s service as a director due to his or her death or disability, or (2) our change in control or as otherwise provided in the incentive award plan.
Compensation Committee Interlocks and Insider Participation
We currently do not have a compensation committee of our board of directors because we do not pay any compensation to our officers. There are no interlocks or insider participation as to compensation decisions required to be disclosed pursuant to SEC regulations.
74
ITEM 12. | SECURITY OWNERSHIP OF CERTAIN BENEFICIAL OWNERS AND MANAGEMENT AND RELATED STOCKHOLDER MATTERS |
Equity Compensation Plan Information
The following table provides information about our common stock that may be issued upon the exercise of options, warrants and rights under our incentive award plan as of December 31, 2016.
Plan Category | Number of Securities to be Issued Upon Exercise of Outstanding Options, Warrants and Rights | Weighted-Average Exercise Price of Outstanding Options, Warrants and Rights | Number of Securities Remaining Available for Future Issuance Under Equity Compensation Plans | |||||
Equity compensation plans approved by security holders: | — | — | 913,500 | |||||
Equity compensation plans not approved by security holders: | N/A | N/A | N/A | |||||
Total | — | — | 913,500 | |||||
Security Ownership of Certain Beneficial Owners
The following table shows, as of March 10, 2017, the amount of our common stock beneficially owned (unless otherwise indicated) by: (1) any person who is known by us to be the beneficial owner of more than 5% of the outstanding shares of our common stock, (2) our directors, (3) our executive officers, and (4) all of our directors and executive officers as a group.
Name and Address of Beneficial Owner(1) | Amount and Nature of Beneficial Ownership(2) | Percentage | |||
Rodney F. Emery(3) | 510,504 | * | |||
Scot B. Barker | 37,052 | * | |||
Don B. Saulic | 7,500 | * | |||
Ned W. Brines | 24,956 | * | |||
Ella S. Neyland | 9,900 | * | |||
Kevin J. Keating | 4,706 | * | |||
Ana Marie del Rio | 5,496 | * | |||
All officers and directors as a group (seven persons) | 600,114 | * | |||
________________
* | Less than 1% of the outstanding common stock. |
(1) | The address of each named beneficial owner is c/o Steadfast Income REIT, Inc., 18100 Von Karman Avenue, Suite 500, Irvine, CA, 92612. |
(2) | None of the shares are pledged as security. |
(3) | Consists of 22,223 shares owned by Steadfast REIT Investments, LLC, and 488,281 shares owned by Steadfast Income Advisor, LLC, which are each primarily indirectly owned and controlled by Rodney F. Emery. |
75
ITEM 13. | CERTAIN RELATIONSHIPS AND RELATED TRANSACTIONS, AND DIRECTOR INDEPENDENCE |
Certain Transactions with Related Persons
The following describes all transactions during the year ended December 31, 2016 involving us, our directors, our advisor, our sponsor and any affiliate thereof and all such proposed transactions. See also Note 8 (Related Party Arrangements) to the consolidated financial statements included in this annual report. Our independent directors are specifically charged with and have examined the fairness of such transactions to our stockholders, and have determined that all such transactions are fair and reasonable to us.
Ownership Interests
On June 12, 2009, our sponsor, Steadfast REIT Investments, LLC, purchased 22,223 shares of our common stock for an aggregate purchase price of $200,007 and was admitted as our initial stockholder. Our sponsor is majority owned and controlled indirectly by Rodney F. Emery, our chairman and chief executive officer. On July 10, 2009, our advisor purchased 1,000 shares of our convertible stock for an aggregate purchase price of $1,000. As of December 31, 2016, our advisor owned 100% of our outstanding convertible stock. We are the general partner of our operating partnership and our advisor has made a $1,000 capital contribution to our operating partnership as the initial limited partner.
Our convertible stock will convert into shares of our common stock if and when: (A) we have made total distributions on the then outstanding shares of our common stock equal to the original issue price of those shares plus an aggregate 8.0% cumulative, non-compounded, annual return on the original issue price of those shares, (B) we list our common stock for trading on a national securities exchange or (C) our advisory agreement is terminated or not renewed (other than for “cause” as defined in our advisory agreement). In the event of a termination or non-renewal of our advisory agreement for cause, the convertible stock will be redeemed by us for $1.00. In general, each share of our convertible stock will convert into a number of shares of common stock equal to 1/1000 of the quotient of: (A) 10% of the excess of (1) our “enterprise value” (as defined in our charter) plus the aggregate value of distributions paid to date on the then outstanding shares of our common stock over (2) the aggregate purchase price paid by stockholders for those outstanding shares of common stock plus an 8.0% cumulative, non-compounded, annual return on the original issue price of those outstanding shares, divided by (B) our enterprise value divided by the number of outstanding shares of common stock on an as-converted basis, in each case calculated as of the date of the conversion. Shares of our convertible stock are not paid dividends and as of December 31, 2016 all shares of convertible stock remained outstanding.
Our Relationships with our Advisor and our Sponsor
Steadfast Income Advisor, LLC is our advisor and, as such, supervises and manages our day-to-day operations and selects our real property investments and real estate-related assets, subject to oversight by our board of directors. Our advisor also provides marketing, sales and client services on our behalf. Our advisor is owned by our sponsor. Mr. Emery, our chairman of the board and chief executive officer, indirectly controls our sponsor, our advisor and our dealer manager. Ms. Ana Marie del Rio, our Secretary, owns an indirect 7% interest in our sponsor and advisor. Crossroads Capital Multifamily, LLC, or Crossroads Capital Multifamily, owns a 25% membership interest in our sponsor. Pursuant to the Third Amended and Restated Operating Agreement of our sponsor, effective as of January 1, 2014, all distributions to Crossroads Capital Multifamily are subordinated to distributions to the other member of our sponsor, Steadfast REIT Holdings, LLC, or Steadfast Holdings, until Steadfast Holdings has received an amount equal to certain expenses, including certain organization and offering costs, incurred by Steadfast Holdings and its affiliates on our behalf.
All of our other officers and directors, other than our independent directors, are officers of our advisor and officers, limited partners and/or members of our sponsor and other affiliates of our advisor.
We and our operating partnership have entered into the advisory agreement with our advisor and our operating partnership which has a one-year term expiring November 15, 2017, subject to an unlimited number of successive one-year renewals upon mutual consent of the parties. We may terminate the advisory agreement without cause or penalty upon 60 days written notice and immediately upon fraud, criminal conduct, willful misconduct, gross negligence or material breach of the advisory
76
agreement by our advisor or our advisor’s bankruptcy. If we terminate the advisory agreement, we will pay our advisor all unpaid advances for operating expenses and all earned but unpaid fees.
Services provided by our advisor under the terms of the advisory agreement include the following:
• | finding, presenting and recommending investment opportunities to us consistent with our investment policies and objectives; |
• | making investment decisions for us, subject to the limitations in our charter and the direction and oversight of our board of directors; |
• | structuring the terms and conditions of our investments, sales and joint ventures; |
• | acquiring investments on our behalf in compliance with our investment objectives and policies; |
• | sourcing and structuring our loan originations; |
• | arranging for financing and refinancing of investments; |
• | entering into service agreements for our loans; |
• | supervising and evaluating each loan servicer’s and property manager’s performance; |
• | reviewing and analyzing the operating and capital budgets of the properties underlying our investments and the properties we may acquire; |
• | entering into leases and service contracts for our properties; |
• | assisting us in obtaining insurance; |
• | generating our annual budget; |
• | reviewing and analyzing financial information for each of our assets and our overall investment portfolio; |
• | formulating and overseeing the implementation of strategies for the administration, promotion, management, financing and refinancing, marketing, servicing and disposition of our investments; |
• | performing investor relations services; |
• | maintaining our accounting and other records and assisting us in filing all reports required to be filed with the SEC, the Internal Revenue Service and other regulatory agencies; |
• | engaging and supervising the performance of our agents, including our registrar and transfer agent; and |
• | performing any other services reasonably requested by us. |
The above summary is provided to illustrate the material functions that our advisor performs for us as an advisor and is not intended to include all of the services that may be provided to us by our advisor, its affiliates or third parties. The advisor has also entered into a Services Agreement with Crossroads Capital Advisors, LLC, or Crossroads Capital Advisors, a subsidiary of Crossroads Capital Multifamily, whereby Crossroads Capital Advisors provides advisory services to us on behalf of our advisor.
Fees and Expense Reimbursements Paid to our Advisor
Pursuant to the terms of our advisory agreement, we pay our advisor the fees described below.
• | We pay our advisor an acquisition fee of 2.0% of: (1) the total cost of investment, as defined in connection with the acquisition or origination of any type of real property or real estate-related asset, or (2) our allocable cost of a real property or real estate-related asset acquired in a joint venture, in each case including purchase price, acquisition expenses and any debt attributable to such investments. For the year ended December 31, 2016, we incurred and paid acquisition fees of $960 in connection with the acquisition of one additional unit at the Renaissance at St. Andrews Condominiums community. |
• | We pay our advisor an annual investment management fee that is payable monthly in an amount equal to one-twelfth of 0.8% of the cost of all assets we own and of our investments in joint ventures, including acquisition fees, origination |
77
fees, acquisition and origination expenses and any debt attributable to such investments. For the year ended December 31, 2016, we incurred investment management fees to our advisor of $14,075,818. During the same period, we paid $14,060,587 in investment management fees to our advisor.
• | We pay our advisor a disposition fee in connection with a sale of an investment and in the event of the sale of the entire Company, which we refer to as a “final liquidity event,” in either case when our advisor or its affiliates provides a substantial amount of services as determined by a majority of our independent directors. With respect to a sale of an investment, we pay our advisor a disposition fee equal to 1.5% of the contract sales price of the investment sold. With respect to a final liquidity event, we pay our advisor a disposition fee equal to (i) 0.5% of the total consideration paid in a final liquidity event if the price per share paid to stockholders is less than or equal to $9.00; (ii) 0.75% of the total consideration paid in a final liquidity event if the price per share paid to stockholders is between $9.01 and $10.24; (iii) 1.00% of the total consideration paid in a final liquidity event if the price per share paid to stockholders is between $10.25 and $11.24; (iv) 1.25% of the total consideration paid in a final liquidity event if the price per share paid to stockholders is between $11.25 and $12.00; and (v) 1.50% of the total consideration paid in a final liquidity event if the price per share paid to stockholders is greater than or equal to $12.01. Our charter limits the maximum amount of disposition fees payable to our advisor for the sale of any real property to the lesser of one-half of the brokerage commission paid or 3% of the contract sales price, but in no event shall the total real estate commissions paid, including any disposition fees payable to our advisor, exceed 6% of the contract sales price. With respect to a property held in a joint venture, the foregoing commission will be reduced to a percentage of such amounts reflecting our economic interest in the joint venture. For the year ended December 31, 2016, we did not incur or pay any disposition fees. |
• | We pay our advisor a refinancing fee equal to 0.50% of the refinancing amount in connection with the refinancing of certain of our existing mortgage loans. For the year ended December 31, 2016, we incurred and paid refinancing fees to our advisor of $3,283,737. Additionally, in connection with the refinancing of certain of our existing mortgage loans, we reimbursed $139,229 of deferred financing costs payable to an affiliate of our sponsor. |
In addition to the fees we pay to our advisor pursuant to the advisory agreement, we also reimburse our advisor and its affiliates for the costs and expenses described below.
• | Subject to the 2%/25% Guidelines discussed below, we reimburse our advisor for the cost of administrative services, including personnel costs and our allocable share of other overhead of the advisor such as rent and utilities; provided, however, that no reimbursement shall be made for costs of such personnel to the extent that personnel are used in transactions for which our advisor receives an acquisition fee, investment management fee or disposition fee or for the employee costs our advisor pays to our executive officers. For the year ended December 31, 2016, $1,098,568 was reimbursed to our advisor for administrative services. |
• | We reimburse our advisor for acquisition expenses incurred related to the selection and acquisition of real property investments and real estate-related investments. For the year ended December 31, 2016, we did not incur or pay any acquisition expenses. |
• | On June 11, 2014, we entered into a restricted stock agreement with our advisor whereby we issued to our advisor 488,281.25 restricted shares of our common stock at a fair market value of $10.24 per share in satisfaction of certain deferred fees due to our advisor in the aggregate amount of $5,000,000. Pursuant to the terms of the restricted stock agreement, the shares of restricted stock vested and became non-forfeitable 50% at December 31, 2015 and 50% at December 31, 2016. |
2%/25% Guidelines
As described above, our advisor and its affiliates are entitled to reimbursement of actual expenses incurred for administrative and other services provided to us for which they do not otherwise receive a fee. However, we will not reimburse our advisor or its affiliates at the end of any fiscal quarter for “total operating expenses” that for the four consecutive fiscal quarters then ended, or the expense year, exceeded the greater of (1) 2% of our average invested assets or (2) 25% of our net income, which we refer to as the “2%/25% Guidelines,” and our advisor must reimburse us quarterly for any amounts by which our total operating expenses exceed the 2%/25% Guidelines in the expense year, unless our independent directors have determined that such excess expenses were justified based on unusual and non-recurring factors.
78
For purposes of the 2%/25% Guidelines, “total operating expenses” means all costs and expenses paid or incurred by us, as determined under GAAP, that are in any way related to our operation or to corporate business, including advisory fees, but excluding (1) the expenses of raising capital such as organization and offering expenses, legal, audit, accounting, underwriting, brokerage, listing, registration, and other fees, printing and other such expenses and taxes incurred in connection with the issuance, distribution, transfer, registration and the listing of our shares of common stock, (2) interest payments, (3) taxes, (4) non-cash expenditures such as depreciation, amortization and bad debt reserves, (5) incentive fees, (6) acquisition fees and acquisition expenses, (7) real estate commissions on the sale of a real property, and (8) other fees and expenses connected with the acquisition, disposition, management and ownership of real estate interests, mortgage loans or other property (including the costs of foreclosure, insurance premiums, legal services, maintenance, repair, and improvement of property).
At December 31, 2016, our total operating expenses, as defined above, did not exceed the 2%/25% Guidelines.
Fees and Reimbursements Paid to Our Property Manager
• | We have entered into property management agreements with Steadfast Management Company, Inc., or the property manager, an affiliate of our sponsor, with respect to the management of 62 of our multifamily properties. Pursuant to the management agreements, we pay the property manager a monthly management fee equal to a certain percentage, which ranges from 2.50% to 3.75%, of each property’s gross revenues (as defined in the respective management agreements) for each month. The property manager also receives an oversight fee of 1% of gross revenues at certain of the properties at which it does not serve as a property manager. Each management agreement has an initial one year term and will continue thereafter on a month-to-month basis unless either party gives prior 60 day notice of its desire to terminate the management agreement, provided that we may terminate the management agreement upon an uncured breach of the agreement upon 30 days prior written notice to the property manager. For the year ended December 31, 2016, we incurred property management fees of $6,406,479 to our property manager. During the same period, we paid property management fees of $6,392,550 to our property manager. |
• | The property management agreements specify that we are to reimburse the property manager for the salaries and related benefits of on-site personnel. For the year ended December 31, 2016, we reimbursed on-site personnel costs of $18,650,009 to our property manager. |
• | The property management agreements also specify certain other fees payable to the property manager for benefit administration, information technology infrastructure, licenses and support, and training services. For the year ended December 31, 2016, we paid other fees of $1,839,319 to our property manager. |
Payments to Our Construction Manager
• | We have entered into construction management agreements with Pacific Coast Land and Construction, Inc., or the construction manager, an affiliate of our sponsor, in connection with the planned renovation for certain of our properties. The construction management fee payable with respect to each property under the construction management agreements ranges from 5.0% to 12.0% of the costs of the improvements for which the construction manager has oversight authority. Generally, each construction management agreement has a term equal to the planned renovation timeline unless either party gives 30 days prior notice of its desire to terminate the construction management agreement. For the year ended December 31, 2016, we incurred construction management fees of $1,493,999 to our construction manager. During the same period, we paid construction management fees of $1,548,701 to our construction manager. |
• | The construction management agreements also specify that we are to reimburse the construction manager for the salaries and related benefits of certain of its employees for time spent working on capital improvements and renovations. For the year ended December 31, 2016, we reimbursed labor costs of $474,155 to our construction manager. |
Other Transactions
• | We deposit amounts with an affiliate of our sponsor to fund a prepaid insurance deductible account to cover the cost of required insurance deductibles across all multifamily properties owned by us and other affiliated entities of our sponsor. Upon filing a major claim, proceeds from the insurance deductible account may be used by us or another |
79
affiliate of our sponsor. For the year ended December 31, 2016, we funded $248,370 into the prepaid insurance deductible account. Additionally, for the year ended December 31, 2016, we received $113,853 in proceeds from an affiliate of our sponsor upon filing a major claim.
Currently Proposed Transactions
Other than as described above, there are no currently proposed material transactions with related persons other than those covered by the terms of the agreements described above.
Policies and Procedures for Transactions with Related Persons
In order to reduce or eliminate certain potential conflicts of interest, our charter and our advisory agreement contain restrictions and conflict resolution procedures relating to transactions we enter into with our advisor, our directors or their respective affiliates. Each of the restrictions and procedures that apply to transactions with our advisor and its affiliates will also apply to any transaction with any entity or real estate program controlled by our advisor and its affiliates. As a general rule, any related party transaction must be approved by a majority of the directors (including a majority of independent directors) not otherwise interested in the transaction. In determining whether to approve or authorize a particular related party transaction, these persons will consider whether the transaction between us and the related party is fair and reasonable to us and has terms and conditions no less favorable to us than those available from unaffiliated third parties.
We have also adopted a Code of Ethics that applies to each of our officers and directors, which we refer to as “covered persons.” The Code of Ethics sets forth certain conflicts of interest policies that limit and govern certain matters among us, the covered persons, our advisor and their respective affiliates.
Director Independence
Although our shares are not listed for trading on any national securities exchange, a majority of the members of our board of directors and all of the members of the audit committee are “independent” as defined by the NYSE. The NYSE standards provide that to qualify as an independent director, in addition to satisfying certain bright-line criteria, the board of directors must affirmatively determine that a director has no material relationship with us (either directly or as a partner, stockholder or officer of an organization that has a relationship with us). In addition, we have determined that these directors are independent pursuant to the definition of independence in our charter, which is based on the definition included in the North American Securities Administrators Association, Inc.’s Statement of Policy Regarding Real Estate Investment Trusts, as revised and adopted on May 7, 2007. Our board of directors has determined that Scot B. Barker, Don B. Saulic and Ned W. Brines each satisfies the bright-line criteria and that none has a relationship with us that would interfere with such person’s ability to exercise independent judgment as a member of our board of directors. None of these directors has ever served as (or is related to) an employee of ours or any of our predecessors or acquired companies or received any compensation from us or any such other entities except for compensation directly related to service as a director. Therefore, we believe that all of these directors are independent directors.
ITEM 14. | PRINCIPAL ACCOUNTANT FEES AND SERVICES |
Independent Registered Public Accounting Firm
During the years ended December 31, 2016 and 2015, Ernst & Young LLP, or Ernst & Young, served as our independent registered public accounting firm and provided us with certain tax and other services. Ernst & Young has served as our independent auditor since our formation.
Pre-Approval Policies
The audit committee charter imposes a duty on our audit committee to pre-approve all auditing services performed for us by our independent auditors as well as all permitted non-audit services in order to ensure that the provision of such services does not impair the auditors’ independence. In determining whether or not to pre-approve services, our audit committee will consider
80
whether the service is a permissible service under the rules and regulations promulgated by the SEC. Our audit committee, may, in its discretion, delegate to one or more of its members the authority to pre-approve any audit or non-audit services to be performed by the independent auditors, provided any such approval is presented to and approved by the full audit committee at its next scheduled meeting.
All services rendered by Ernst & Young for the years ended December 31, 2016 and 2015 were pre-approved in accordance with the policies and procedures described above.
Principal Independent Registered Public Accounting Firm Fees
Our audit committee reviewed the audit and non-audit services performed by Ernst & Young, as well as the fees charged by Ernst & Young for such services. In its review of the non-audit service fees, our audit committee considered whether the provision of such services is compatible with maintaining the independence of Ernst & Young. The aggregate fees billed to us for professional accounting services, including the audit of our annual financial statements by Ernst & Young for the years ended December 31, 2016 and 2015, are set forth in the table below.
2016 | 2015 | |||||||
Audit fees | $ | 399,315 | $ | 426,500 | ||||
Audit-related fees | — | — | ||||||
Tax fees | 132,320 | 161,015 | ||||||
All other fees | 998 | 998 | ||||||
Total | $ | 532,633 | $ | 588,513 | ||||
For purposes of the preceding table, Ernst & Young’s professional fees are classified as follows:
• | Audit fees - These are fees for professional services performed for the audit of our annual financial statements and the required review of quarterly financial statements and other procedures performed by Ernst & Young in order for them to be able to form an opinion on our consolidated financial statements. These fees also cover services that are normally provided by independent auditors in connection with statutory and regulatory filings or engagements. |
• | Audit-related fees - These are fees for assurance and related services that traditionally are performed by independent auditors that are reasonably related to the performance of the audit or review of the financial statements, such as due diligence related to acquisitions and dispositions, attestation services that are not required by statute or regulation, internal control reviews and consultation concerning financial accounting and reporting standards. |
• | Tax fees - These are fees for all professional services performed by professional staff in our independent auditor’s tax division, except those services related to the audit of our financial statements. These include fees for tax compliance, tax planning and tax advice, including federal, state and local issues. Services may also include assistance with tax audits and appeals before the Internal Revenue Service and similar state and local agencies, as well as federal, state and local tax issues related to due diligence. |
• | All other fees - These are fees for any services not included in the above-described categories. |
81
PART IV
ITEM 15. | EXHIBITS, FINANCIAL STATEMENT SCHEDULES |
a. | Financial Statement Schedules |
See the Index to Financial Statements at page F-1 of this report.
The following financial statement schedule is included herein at page F-39 of this report:
Schedule III - Real Estate Assets and Accumulated Depreciation and Amortization
b. | Exhibits |
EXHIBIT INDEX
Effective February 1, 2010, Steadfast Secure Income REIT, Inc., Steadfast Secure Income Advisor, LLC and Steadfast Secure Income REIT Operating Partnership, L.P. changed their names to Steadfast Income REIT, Inc., Steadfast Income Advisor, LLC and Steadfast Income REIT Operating Partnership, L.P., respectively. With respect to documents executed prior to the name change, the following Exhibit Index refers to the entity names used prior to the name changes in order to accurately reflect the names of the entities that appear on such documents.
The following exhibits are included, or incorporated by reference, in this Annual Report on Form 10-K for the year ended December 31, 2016 (and are numbered in accordance with Item 601 of Regulation S-K).
Exhibit | Description |
3.1 | Third Articles of Amendment and Restatement of Steadfast Income REIT, Inc. (incorporated by reference to Exhibit 3.1 to Registrant’s Form 8-K filed August 6, 2014) |
3.2 | Bylaws of Steadfast Income REIT, Inc. (incorporated by reference to Exhibit 3.2 to the Registrant’s Registration Statement on Form S-11, filed July 23, 2009, Commission File No. 333-160748) |
4.1 | Form of Subscription Agreement (incorporated by reference to Appendix B to the prospectus, dated July 9, 2010 of the Registrant) |
4.2 | Form of Distribution Reinvestment Plan (incorporated by reference to Appendix C to the prospectus, dated July 9, 2010, of the Registrant) |
10.1 | Amended and Restated Advisory Agreement, dated as of May 4, 2010, by and among Steadfast Income REIT, Inc., Steadfast Secure Income REIT Operating Partnership, L.P. and Steadfast Income Advisor, LLC (incorporated by reference to Exhibit 10.1 to Pre-Effective Amendment No. 4 to the Registrant’s Registration Statement on Form S-11, filed May 6, 2010, Commission File No. 333-160748 (“Pre-Effective Amendment No. 4”)) |
10.2 | Amended and Restated Limited Partnership Agreement of Steadfast Income REIT Operating Partnership, L.P. (incorporated by reference to Exhibit 10.3 to Pre-Effective Amendment No. 1 to the Registrant’s Registration Statement on Form S-11, filed October 15, 2009, Commission File No. 333-160748 (“Pre-Effective Amendment No. 1”)) |
10.3 | Steadfast Income REIT, Inc. 2009 Long-Term Incentive Plan (incorporated by reference to Exhibit 10.4 to Pre-Effective Amendment No. 1) |
10.4 | Steadfast Income REIT, Inc. Independent Directors Compensation Plan (incorporated by reference to Exhibit 10.5 to Pre-Effective Amendment No. 1) |
10.5 | Form of Restricted Stock Award Certificate (incorporated by reference to Exhibit 10.6 to Pre-Effective Amendment No. 4) |
82
10.6 | Amendment No. 1 to the Amended and Restated Advisory Agreement, dated as of March 21, 2011, by and among Steadfast Income REIT, Inc., Steadfast Income REIT Operating Partnership, L.P. and Steadfast Income Advisor, LLC (incorporated by reference to Exhibit 10.2 to the Registrant’s Annual Report on Form 10-K filed March 22, 2011) |
10.7 | Property Management Agreement, dated as of January 26, 2012, by and between SIR Windsor On The River, LLC and Steadfast Management Company, Inc. (incorporated by reference to Exhibit 10.1 to the Registrant’s Form 8-K filed February 1, 2012) |
10.8 | Land Use Restriction Agreement, dated as of November 1, 2007, by and between Iowa Finance Authority, Windsor On The River, LLC and The Bank Of New York Trust Company, N.A. (incorporated by reference to Exhibit 10.10 to the Registrant’s Form 8-K filed February 1, 2012) |
10.9 | Property Management Agreement, dated as of February 17, 2012, by and between SIR Renaissance, LLC and Steadfast Management Company, Inc. (incorporated by reference to Exhibit 10.3 to the Registrant’s Form 8-K filed February 24, 2012) |
10.10 | Property Management Agreement, dated as of March 9, 2012, by and between SIR Spring Creek, LLC and Steadfast Management Company, Inc. (incorporated by reference to Exhibit 10.3 to the Registrant’s Form 8-K filed March 15, 2012) |
10.11 | Assumption Agreement, dated as of March 9, 2012, by and among U.S. Bank National Association, as Trustee for the Registered Holders of J.P. Morgan Commercial Securities Corp., Multifamily Mortgage pass-Through Certificates, Series 2011-K702, WC/TP Spring Creek, LLC, SIR Spring Creek, LLC, John A. Wensigner, Steadfast Income REIT Operating Partnership, L.P. and Steadfast Income REIT, Inc. (incorporated by reference to Exhibit 10.4 to the Registrant’s Form 8-K filed March 15, 2012) |
10.12 | Multifamily Note, effective as of January 31, 2011, by WC/TP Spring Creek, LLC in favor of Holliday Fenoglio Fowler, L.P. (incorporated by reference to Exhibit 10.5 to the Registrant’s Form 8-K filed March 15, 2012) |
10.13 | Allonge to Note, dated as of March 9, 2012, by SIR Spring Creek, LLC in favor of U.S. Bank National Association, as Trustee for the Registered Holders of J.P. Morgan Commercial Securities Corp., Multifamily Mortgage pass-Through Certificates, Series 2011-K702 (incorporated by reference to Exhibit 10.6 to the Registrant’s Form 8-K filed March 15, 2012) |
10.14 | Multifamily Mortgage, Assignment of Rents and Security Agreement (Oklahoma - Revision Date 03-31-2008), dated as of January 31, 2011, by and between WC/TP Spring Creek, LLC and Holliday Fenoglio Fowler, L.P. (incorporated by reference to Exhibit 10.7 to the Registrant’s Form 8-K filed March 15, 2012) |
10.15 | Assignment of Management Agreement and Subordination of Management Fees, dated as of March 9, 2012, by and between SIR Spring Creek, LLC, Steadfast Management Company, Inc. and U.S. Bank National Association, as Trustee for the Registered Holders of J.P. Morgan Commercial Securities Corp., Multifamily Mortgage pass-Through Certificates, Series 2011-K702 (incorporated by reference to Exhibit 10.8 to the Registrant’s Form 8-K filed March 15, 2012) |
10.16 | Guaranty, dated as of March 9, 2012, by Steadfast Income REIT Operating Partnership, L.P. and Steadfast Income REIT, Inc. for the benefit of U.S. Bank National Association, as Trustee for the Registered Holders of J.P. Morgan Commercial Securities Corp., Multifamily Mortgage pass-Through Certificates, Series 2011-K702 (incorporated by reference to Exhibit 10.9 to the Registrant’s Form 8-K filed March 15, 2012) |
10.17 | Amendment No. 2 to the Amended and Restated Advisory Agreement, dated as of April 11, 2012, by and among Steadfast Income REIT, Inc., Steadfast Income REIT Operating Partnership, L.P. and Steadfast Income Advisor, LLC (incorporated by reference to Exhibit 10.1 to the Registrant’s Form 8-K filed April 16, 2012) |
10.18 | Property Management Agreement, dated as of April 26, 2012, by and between Steadfast Management Company, Inc. and SIR Montclair Parc, LLC (incorporated by reference to Exhibit 10.1 to the Registrant’s Form 8-K filed May 2, 2012) |
10.19 | Multifamily Note, dated as of April 26, 2012, by SIR Montclair Parc, LLC, in favor of PNC Bank, National Association (incorporated by reference to Exhibit 10.2 to the Registrant’s Form 8-K filed May 2, 2012) |
10.20 | Multifamily Loan and Security Agreement (Non-Recourse), dated as of April 26, 2012, by and between SIR Montclair Parc, LLC and PNC Bank, National Association (incorporated by reference to Exhibit 10.3 to the Registrant’s Form 8-K filed May 2, 2012) |
83
10.21 | Multifamily Mortgage, Assignment of Leases and Rents, Security Agreement and Fixture Filing, dated as of April 26, 2012, by and among SIR Montclair Parc, LLC and PNC Bank, National Association (incorporated by reference to Exhibit 10.4 to the Registrant’s Form 8-K filed May 2, 2012) |
10.22 | Assignment of Management Agreement, dated as of April 26, 2012, by and among SIR Montclair Parc, LLC, PNC Bank, National Association and Steadfast Management Company, Inc. (incorporated by reference to Exhibit 10.5 to the Registrant’s Form 8-K filed May 2, 2012) |
10.23 | Guaranty of Non-Recourse Obligations, dated as of April 26, 2012, by Steadfast Income REIT, Inc. to and for the benefit of PNC Bank, National Association (incorporated by reference to Exhibit 10.6 to the Registrant’s Form 8-K filed May 2, 2012) |
10.24 | Environmental Indemnity Agreement, dated as of April 26, 2012, by SIR Montclair Parc, LLC and PNC Bank, National Association (incorporated by reference to Exhibit 10.7 to the Registrant’s Form 8-K filed May 2, 2012) |
10.25 | Property Management Agreement, made as of May 24, 2012, by and between Steadfast Management Company, Inc. and SIR Sonoma Grande, LLC (incorporated by reference to Exhibit 10.5 to the Registrant’s Form 8-K filed May 31, 2012) |
10.26 | Multifamily Note, effective as of May 24, 2012, by SIR Sonoma Grande, LLC in favor of PNC Bank, National Association (incorporated by reference to Exhibit 10.6 to the Registrant’s Form 8-K filed May 31, 2012) |
10.27 | Multifamily Loan and Security Agreement, dated as of May 24, 2012, by and between SIR Sonoma Grande, LLC and PNC Bank, National Association (incorporated by reference to Exhibit 10.7 to the Registrant’s Form 8-K filed May 31, 2012) |
10.28 | Multifamily Mortgage, Assignment of Rents and Security Agreement, dated as of May 24, 2012, by and between SIR Sonoma Grande, LLC and PNC Bank, National Association (incorporated by reference to Exhibit 10.8 to the Registrant’s Form 8-K filed May 31, 2012) |
10.29 | Guaranty, effective as of May 24, 2012, by Steadfast Income REIT, Inc. to and for the benefit of PNC Bank, National Association (incorporated by reference to Exhibit 10.9 to the Registrant’s Form 8-K filed May 31, 2012) |
10.30 | Assignment of Management Agreement and Subordination of Management Fees, effective as of May 24, 2012, by and among SIR Sonoma Grande, LLC, PNC Bank, National Association and Steadfast Management Company, Inc. (incorporated by reference to Exhibit 10.10 to the Registrant’s Form 8-K filed May 31, 2012) |
10.31 | Property Management Agreement, made as of June 29, 2012, by and between Steadfast Management Company, Inc. and SIR Estancia, LLC (incorporated by reference to Exhibit 10.4 to the Registrant’s Form 8-K filed July 6, 2012) |
10.32 | Assumption Agreement, effective as of June 29, 2012, by and among Estancia Tulsa, LLC, SIR Estancia, LLC, Federal Home Loan Mortgage Corporation, Flournoy Development Company, LLC, and Steadfast Income REIT, Inc. (incorporated by reference to Exhibit 10.5 to the Registrant’s Form 8-K filed July 6, 2012) |
10.33 | Multifamily Note, effective as of September 6, 2007, by Estancia Tulsa, LLC in favor of CBRE Melody & Company (incorporated by reference to Exhibit 10.6 to the Registrant’s Form 8-K filed July 6, 2012) |
10.34 | Multifamily Mortgage, Assignment of Rents and Security Agreement, made as of September 6, 2007, by and between Estancia Tulsa, LLC and CBRE Melody & Company (incorporated by reference to Exhibit 10.7 to the Registrant’s Form 8-K filed July 6, 2012) |
10.35 | Guaranty, effective as of June 29, 2012 by Steadfast Income REIT, Inc. to and for the benefit of Federal Home Loan Mortgage Corporation (incorporated by reference to Exhibit 10.8 to the Registrant’s Form 8-K filed July 6, 2012) |
10.36 | Subordination of Management Agreement, effective as of June 29, 2012, by and between SIR Estancia, LLC, and Steadfast Management Company, Inc. (incorporated by reference to Exhibit 10.9 to the Registrant’s Form 8-K filed July 6, 2012) |
10.37 | Membership Interests Assignment and Assumption, made and entered into effective as of September 11, 2012, by and between Gary L. Schottenstein and SIR Hilliard Park, LLC (incorporated by reference to Exhibit 10.3 to the Registrant’s Form 8-K filed October 4, 2012) |
84
10.38 | Property Management Agreement, made and entered into as of September 11, 2012, by and between Steadfast Management Company, Inc. and Hilliard Park Partners, L.L.C (incorporated by reference to Exhibit 10.4 to the Registrant’s Form 8-K filed October 4, 2012) |
10.39 | Multifamily Note, effective as of September 28, 2012, by Hilliard Park Partners, L.L.C. in favor of PNC Bank, National Association (incorporated by reference to Exhibit 10.5 to the Registrant’s Form 8-K filed October 4, 2012) |
10.40 | Multifamily Loan and Security Agreement, made as of September 28, 2012, by and between Hilliard Park Partners, L.L.C. and PNC Bank, National Association (incorporated by reference to Exhibit 10.6 to the Registrant’s Form 8-K filed October 4, 2012) |
10.41 | Open-End Multifamily Mortgage, Assignment of Leases and Rents, Security Agreement and Fixture Filing, dated as of September 28, 2012, by Hilliard Park Partners, L.L.C. to and for the benefit of PNC Bank, National Association (incorporated by reference to Exhibit 10.7 to the Registrant’s Form 8-K filed October 4, 2012) |
10.42 | Guaranty of Non-Recourse Obligations, dated as of September 28, 2012, by Steadfast Income REIT, Inc. to and for the benefit of PNC Bank, National Association (incorporated by reference to Exhibit 10.8 to the Registrant’s Form 8-K filed October 4, 2012) |
10.43 | Environmental Indemnity Agreement, dated as of September 28, 2012, by Hilliard Park Partners, L.L.C. to and for the benefit of PNC Bank, National Association (incorporated by reference to Exhibit 10.9 to the Registrant’s Form 8-K filed October 4, 2012) |
10.44 | Membership Interests Assignment and Assumption, made and entered into effective as of September 28, 2012, by and between HMSREG, LLC, CSL HillMeadows, LTD., and SIR Hilliard Summit, LLC (incorporated by reference to Exhibit 10.12 to the Registrant’s Form 8-K filed October 4, 2012) |
10.45 | Property Management Agreement, made and entered into as of September 28, 2012, by and between Steadfast Management Company, Inc. and Hilliard Meadows Apartments, LLC (incorporated by reference to Exhibit 10.13 to the Registrant’s Form 8-K filed October 4, 2012) |
10.46 | Multifamily Note, effective as of September 28, 2012, by Hilliard Meadows Apartments, LLC in favor of PNC Bank, National Association (incorporated by reference to Exhibit 10.14 to the Registrant’s Form 8-K filed October 4, 2012) |
10.47 | Multifamily Loan and Security Agreement, made as of September 28, 2012, by and between Hilliard Meadows Apartments, LLC and PNC Bank, National Association (incorporated by reference to Exhibit 10.15 to the Registrant’s Form 8-K filed October 4, 2012) |
10.48 | Open-End Multifamily Mortgage, Assignment of Leases and Rents, Security Agreement and Fixture Filing, dated as of September 28, 2012, by Hilliard Meadows Apartments, LLC to and for the benefit of PNC Bank, National Association (incorporated by reference to Exhibit 10.16 to the Registrant’s Form 8-K filed October 4, 2012) |
10.49 | Guaranty of Non-Recourse Obligations, dated as of September 28, 2012, by Steadfast Income REIT, Inc. to and for the benefit of PNC Bank, National Association (incorporated by reference to Exhibit 10.17 to the Registrant’s Form 8-K filed October 4, 2012) |
10.50 | Environmental Indemnity Agreement, dated as of September 28, 2012, by Hilliard Meadows Apartments, LLC to and for the benefit of PNC Bank, National Association (incorporated by reference to Exhibit 10.18 to the Registrant’s Form 8-K filed October 4, 2012) |
10.51 | Property Management Agreement, dated as of December 20, 2012, by and between Steadfast Management Company, Inc. and SIR Forty 57, LLC (incorporated by reference to Exhibit 10.4 to the Registrant’s Form 8-K filed December 27, 2012) |
10.52 | Multifamily Note, effective as of December 20, 2012, by SIR Forty 57, LLC, in favor of PNC Bank, National Association (incorporated by reference to Exhibit 10.5 to the Registrant’s Form 8-K filed December 27, 2012) |
10.53 | Multifamily Loan and Security Agreement, dated as of December 20, 2012, by and between SIR Forty 57, LLC and PNC Bank, National Association (incorporated by reference to Exhibit 10.6 to the Registrant’s Form 8-K filed December 27, 2012) |
85
10.54 | Multifamily Open-End Mortgage, Assignment of Rents, Security Agreement and Fixture Financing Statement, dated as of December 20, 2012, by and among SIR Forty 57, LLC and PNC Bank, National Association (incorporated by reference to Exhibit 10.7 to the Registrant’s Form 8-K filed December 27, 2012) |
10.55 | Guaranty, dated as of December 20, 2012, by Steadfast Income REIT, Inc. to and for the benefit of PNC Bank, National Association (incorporated by reference to Exhibit 10.8 to the Registrant’s Form 8-K filed December 27, 2012) |
10.56 | Membership Interests Assignment and Assumption, made and entered into effective as of December 31, 2012, by and between Gary L. Schottenstein and SIR Hilliard Grand, LLC (incorporated by reference to Exhibit 10.4 to the Registrant’s Form 8-K filed January 7, 2013) |
10.57 | Property Management Agreement, made and entered into as of December 31, 2012, by and between Steadfast Management Company, Inc. and Hilliard Grand Apartments, LLC (incorporated by reference to Exhibit 10.5 to the Registrant’s Form 8-K filed January 7, 2013) |
10.58 | Amendment No. 3 to the Amended and Restated Advisory Agreement, dated as of March 13, 2013, by and among Steadfast Income REIT, Inc., Steadfast Income REIT Operating Partnership, L.P. and Steadfast Income Advisor, LLC (incorporated by reference to Exhibit 10.1 to the Registrant’s Form 8-K filed March 25, 2013) |
10.59 | Amendment No. 4 to the Amended and Restated Advisory Agreement, dated as of May 14, 2013, by and among Steadfast Income REIT, Inc., Steadfast Income REIT Operating Partnership, L.P. and Steadfast Income Advisor, LLC (incorporated by reference to Exhibit 10.1 of the Registrant’s Form 8-K filed May 17, 2013) |
10.60 | Property Management Agreement, made and entered into as of October 10, 2013, by and between Steadfast Management Company, Inc. and SIR Waterford Riata, LLC (incorporated by reference to Exhibit 10.3 to the Registrant’s Form 8-K filed November 14, 2013) |
10.61 | Property Management Agreement, made and entered into as of October 10, 2013, by and between Steadfast Management Company, Inc. and SIR Huffmeister Villas, LLC (incorporated by reference to Exhibit 10.9 to the Registrant’s Form 8-K filed November 14, 2013) |
10.62 | Property Management Agreement, made and entered into as of October 10, 2013, by and between Steadfast Management Company, Inc. and SIR Kingwood Villas, LLC (incorporated by reference to Exhibit 10.15 to the Registrant’s Form 8-K filed November 14, 2013) |
10.63 | Property Management Agreement, made and entered into as of November 7, 2013, by and between Steadfast Management Company, Inc. and SIR Carrington Park, LLC (incorporated by reference to Exhibit 10.21 to the Registrant’s Form 8-K filed November 14, 2013) |
10.64 | Property Management Agreement, made and entered into as of November 7, 2013, by and between Steadfast Management Company, Inc. and SIR Carrington Champion, LLC (incorporated by reference to Exhibit 10.28 to the Registrant’s Form 8-K filed November 14, 2013) |
10.65 | Property Management Agreement, made and entered into as of November 7, 2013, by and between Steadfast Management Company, Inc. and SIR Carrington Place, LLC (incorporated by reference to Exhibit 10.35 to the Registrant’s Form 8-K filed November 14, 2013) |
10.66 | Amendment No. 5 to the Amended and Restated Advisory Agreement, dated as of March 12, 2014, by and among Steadfast Income REIT, Inc., Steadfast Income REIT Operating Partnership, L.P. and Steadfast Income Advisor, LLC (incorporated by reference to Exhibit 10.1 to the Registrant’s Form 8-K filed March 13, 2014) |
10.67 | Restricted Stock Agreement, dated as of June 11, 2014, by and among Steadfast Income REIT, Inc. and Steadfast Income Advisor, LLC (incorporated by reference to Exhibit 10.1 to the Registrant’s Form 8-K filed June 13, 2014) |
10.68 | Amendment No. 6 to the Amended and Restated Advisory Agreement, dated as of June 11, 2014, by and among Steadfast Income REIT, Inc., Steadfast Income REIT Operating Partnership, L.P. and Steadfast Income Advisor, LLC (incorporated by reference to Exhibit 10.2 to the Registrant’s Form 8-K filed June 13, 2014) |
86
10.69 | Amendment No. 7 to the Amended and Restated Advisory Agreement, dated as of April 13, 2015, by and among Steadfast Income REIT, Inc., Steadfast Income REIT Operating Partnership, L.P. and Steadfast Income Advisor, LLC (incorporated by reference to Exhibit 10.1 to the Registrant’s Form 8-K filed April 15, 2015) |
10.70 | Amendment No. 8 to the Amended and Restated Advisory Agreement, dated as of November 10, 2015, by and among Steadfast Income REIT, Inc., Steadfast Income REIT Operating Partnership, L.P. and Steadfast Income Advisor, LLC (incorporated by reference to Exhibit 10.1 to the Registrant’s Form 8-K filed November 12, 2015) |
10.71 | Multifamily Loan and Security Agreement, made as of June 29, 2016, by and between SIR Heights, LLC and PNC Bank, National Association (incorporated by reference to Exhibit 10.1 to the Registrant’s Form 8-K filed July 5, 2016) |
10.72 | Multifamily Note, made as of June 29, 2016, by SIR Heights, LLC, in favor of PNC Bank, National Association (incorporated by reference to Exhibit 10.2 to the Registrant’s Form 8-K filed July 5, 2016) |
10.73 | Multifamily Deed of Trust, Assignment of Rents, Security Agreement and Fixture Filing, dated as of June 29, 2016, by SIR Heights, LLC to Gary S. Farmer for the benefit of PNC Bank, National Association (incorporated by reference to Exhibit 10.3 to the Registrant’s Form 8-K filed July 5, 2016) |
10.74 | Guaranty, dated as of June 29, 2016, by Steadfast Income REIT, Inc. to and for the benefit of PNC Bank, National Association (incorporated by reference to Exhibit 10.4 to the Registrant’s Form 8-K filed July 5, 2016) |
10.75 | Assignment of Management Agreement and Subordination of Management Fees, dated as of June 29, 2016, by and among SIR Heights, LLC, PNC Bank, National Association and Steadfast Management Company, Inc. (incorporated by reference to Exhibit 10.5 to the Registrant’s Form 8-K filed July 5, 2016) |
10.76 | Multifamily Loan and Security Agreement, made as of June 29, 2016, by and between SIR Huffmeister Villas, LLC and PNC Bank, National Association (incorporated by reference to Exhibit 10.6 to the Registrant’s Form 8-K filed July 5, 2016) |
10.77 | Multifamily Note, made as of June 29, 2016, by SIR Huffmeister Villas, LLC, in favor of PNC Bank, National Association (incorporated by reference to Exhibit 10.7 to the Registrant’s Form 8-K filed July 5, 2016) |
10.78 | Multifamily Deed of Trust, Assignment of Rents, Security Agreement and Fixture Filing, dated as of June 29, 2016, by SIR Huffmeister Villas, LLC to Gary S. Farmer for the benefit of PNC Bank, National Association (incorporated by reference to Exhibit 10.8 to the Registrant’s Form 8-K filed July 5, 2016) |
10.79 | Guaranty, dated as of June 29, 2016, by Steadfast Income REIT, Inc. to and for the benefit of PNC Bank, National Association (incorporated by reference to Exhibit 10.9 to the Registrant’s Form 8-K filed July 5, 2016) |
10.80 | Assignment of Management Agreement and Subordination of Management Fees, dated as of June 29, 2016, by and among SIR Huffmeister Villas, LLC, PNC Bank, National Association and Steadfast Management Company, Inc. (incorporated by reference to Exhibit 10.10 to the Registrant’s Form 8-K filed July 5, 2016) |
10.81 | Multifamily Loan and Security Agreement, made as of June 29, 2016, by and between SIR Kingwood Villas, LLC and PNC Bank, National Association (incorporated by reference to Exhibit 10.11 to the Registrant’s Form 8-K filed July 5, 2016) |
10.82 | Multifamily Note, made as of June 29, 2016, by SIR Kingwood Villas, LLC, in favor of PNC Bank, National Association (incorporated by reference to Exhibit 10.12 to the Registrant’s Form 8-K filed July 5, 2016) |
10.83 | Multifamily Deed of Trust, Assignment of Rents, Security Agreement and Fixture Filing, dated as of June 29, 2016, by SIR Kingwood Villas, LLC to Gary S. Farmer for the benefit of PNC Bank, National Association (incorporated by reference to Exhibit 10.13 to the Registrant’s Form 8-K filed July 5, 2016) |
10.84 | Guaranty, dated as of June 29, 2016, by Steadfast Income REIT, Inc. to and for the benefit of PNC Bank, National Association (incorporated by reference to Exhibit 10.14 to the Registrant’s Form 8-K filed July 5, 2016) |
87
10.85 | Assignment of Management Agreement and Subordination of Management Fees, dated as of June 29, 2016, by and among SIR Kingwood Villas, LLC, PNC Bank, National Association and Steadfast Management Company, Inc. (incorporated by reference to Exhibit 10.15 to the Registrant’s Form 8-K filed July 5, 2016) |
10.86 | Multifamily Loan and Security Agreement, made as of June 29, 2016, by and between SIR Waterford Riata, LLC and PNC Bank, National Association (incorporated by reference to Exhibit 10.16 to the Registrant’s Form 8-K filed July 5, 2016) |
10.87 | Multifamily Note, made as of June 29, 2016, by SIR Waterford Riata, LLC, in favor of PNC Bank, National Association (incorporated by reference to Exhibit 10.17 to the Registrant’s Form 8-K filed July 5, 2016) |
10.88 | Multifamily Deed of Trust, Assignment of Rents, Security Agreement and Fixture Filing, dated as of June 29, 2016, by SIR Waterford Riata, LLC to Gary S. Farmer for the benefit of PNC Bank, National Association (incorporated by reference to Exhibit 10.18 to the Registrant’s Form 8-K filed July 5, 2016) |
10.89 | Guaranty, dated as of June 29, 2016, by Steadfast Income REIT, Inc. to and for the benefit of PNC Bank, National Association (incorporated by reference to Exhibit 10.19 to the Registrant’s Form 8-K filed July 5, 2016) |
10.90 | Assignment of Management Agreement and Subordination of Management Fees, dated as of June 29, 2016, by and among SIR Waterford Riata, LLC, PNC Bank, National Association and Steadfast Management Company, Inc. (incorporated by reference to Exhibit 10.20 to the Registrant’s Form 8-K filed July 5, 2016) |
10.91 | Multifamily Loan and Security Agreement, made as of June 29, 2016, by and between SIR Mansfield Landing, LLC and PNC Bank, National Association (incorporated by reference to Exhibit 10.21 to the Registrant’s Form 8-K filed July 5, 2016) |
10.92 | Multifamily Note, made as of June 29, 2016, by SIR Mansfield Landing, LLC, in favor of PNC Bank, National Association (incorporated by reference to Exhibit 10.22 to the Registrant’s Form 8-K filed July 5, 2016) |
10.93 | Multifamily Deed of Trust, Assignment of Rents, Security Agreement and Fixture Filing, dated as of June 29, 2016, by SIR Mansfield Landing, LLC to Gary S. Farmer for the benefit of PNC Bank, National Association (incorporated by reference to Exhibit 10.23 to the Registrant’s Form 8-K filed July 5, 2016) |
10.94 | Guaranty, dated as of June 29, 2016, by Steadfast Income REIT, Inc. to and for the benefit of PNC Bank, National Association (incorporated by reference to Exhibit 10.24 to the Registrant’s Form 8-K filed July 5, 2016) |
10.95 | Assignment of Management Agreement and Subordination of Management Fees, dated as of June 29, 2016, by and among SIR Mansfield Landing, LLC, PNC Bank, National Association and Steadfast Management Company, Inc. (incorporated by reference to Exhibit 10.25 to the Registrant’s Form 8-K filed July 5, 2016) |
10.96 | Multifamily Loan and Security Agreement, made as of June 29, 2016, by and between Brice Grove Apartments, LLC and Berkeley Point Capital LLC (incorporated by reference to Exhibit 10.26 to the Registrant’s Form 8-K filed July 5, 2016) |
10.97 | Multifamily Note, made as of June 29, 2016, by Brice Grove Apartments, LLC, in favor of Berkeley Point Capital LLC (incorporated by reference to Exhibit 10.27 to the Registrant’s Form 8-K filed July 5, 2016) |
10.98 | Multifamily Mortgage, Assignment of Rents and Security Agreement, dated as of June 29, 2016, by Brice Grove Apartments, LLC to and for the benefit of Berkeley Point Capital LLC (incorporated by reference to Exhibit 10.28 to the Registrant’s Form 8-K filed July 5, 2016) |
10.99 | Guaranty, dated as of June 29, 2016, by Steadfast Income REIT, Inc. to and for the benefit of Berkeley Point Capital LLC (incorporated by reference to Exhibit 10.29 to the Registrant’s Form 8-K filed July 5, 2016) |
10.100 | Assignment of Management Agreement and Subordination of Management Fees, dated as of June 29, 2016, by and among Brice Grove Apartments, LLC, Berkeley Point Capital LLC and Steadfast Management Company, Inc. (incorporated by reference to Exhibit 10.30 to the Registrant’s Form 8-K filed July 5, 2016) |
10.101 | Multifamily Loan and Security Agreement, made as of June 29, 2016, by and between SIR Grayson Ridge, LLC and Berkeley Point Capital LLC (incorporated by reference to Exhibit 10.31 to the Registrant’s Form 8-K filed July 5, 2016) |
88
10.102 | Multifamily Note, made as of June 29, 2016, by SIR Grayson Ridge, LLC, in favor of Berkeley Point Capital LLC (incorporated by reference to Exhibit 10.32 to the Registrant’s Form 8-K filed July 5, 2016) |
10.103 | Multifamily Deed of Trust, Assignment of Rents, Security Agreement and Fixture Filing, dated as of June 29, 2016, by SIR Grayson Ridge, LLC to Melissa A. Johnson for the benefit of Berkeley Point Capital LLC (incorporated by reference to Exhibit 10.33 to the Registrant’s Form 8-K filed July 5, 2016) |
10.104 | Guaranty, dated as of June 29, 2016, by Steadfast Income REIT, Inc. to and for the benefit of Berkeley Point Capital LLC (incorporated by reference to Exhibit 10.34 to the Registrant’s Form 8-K filed July 5, 2016) |
10.105 | Assignment of Management Agreement and Subordination of Management Fees, dated as of June 29, 2016, by and among SIR Grayson Ridge, LLC, Berkeley Point Capital LLC and Steadfast Management Company, Inc. (incorporated by reference to Exhibit 10.35 to the Registrant’s Form 8-K filed July 5, 2016) |
10.106 | Multifamily Loan and Security Agreement, made as of June 29, 2016, by and between SIR Mallard Crossing, LLC and Berkeley Point Capital LLC (incorporated by reference to Exhibit 10.36 to the Registrant’s Form 8-K filed July 5, 2016) |
10.107 | Multifamily Note, made as of June 29, 2016, by SIR Mallard Crossing, LLC, in favor of Berkeley Point Capital LLC (incorporated by reference to Exhibit 10.37 to the Registrant’s Form 8-K filed July 5, 2016) |
10.108 | Multifamily Mortgage, Assignment of Rents and Security Agreement, dated as of June 29, 2016, by SIR Mallard Crossing, LLC to and for the benefit of Berkeley Point Capital LLC (incorporated by reference to Exhibit 10.38 to the Registrant’s Form 8-K filed July 5, 2016) |
10.109 | Guaranty, dated as of June 29, 2016, by Steadfast Income REIT, Inc. to and for the benefit of Berkeley Point Capital LLC (incorporated by reference to Exhibit 10.39 to the Registrant’s Form 8-K filed July 5, 2016) |
10.110 | Assignment of Management Agreement and Subordination of Management Fees, dated as of June 29, 2016, by and among SIR Mallard Crossing, LLC, Berkeley Point Capital LLC and Steadfast Management Company, Inc. (incorporated by reference to Exhibit 10.40 to the Registrant’s Form 8-K filed July 5, 2016) |
10.111 | Multifamily Loan and Security Agreement, made as of June 30, 2016, by and between SIR Mapleshade, LLC and Berkeley Point Capital LLC (incorporated by reference to Exhibit 10.41 to the Registrant’s Form 8-K filed July 5, 2016) |
10.112 | Multifamily Note, made as of June 30, 2016, by SIR Mapleshade, LLC, in favor of Berkeley Point Capital LLC (incorporated by reference to Exhibit 10.42 to the Registrant’s Form 8-K filed July 5, 2016) |
10.113 | Multifamily Deed of Trust, Assignment of Rents, Security Agreement and Fixture Filing, dated as of June 30, 2016, by SIR Mapleshade, LLC to Melissa A. Johnson for the benefit of Berkeley Point Capital LLC (incorporated by reference to Exhibit 10.43 to the Registrant’s Form 8-K filed July 5, 2016) |
10.114 | Guaranty, dated as of June 30, 2016, by Steadfast Income REIT, Inc. to and for the benefit of Berkeley Point Capital LLC (incorporated by reference to Exhibit 10.44 to the Registrant’s Form 8-K filed July 5, 2016) |
10.115 | Assignment of Management Agreement and Subordination of Management Fees, dated as of June 30, 2016, by and among SIR Mapleshade, LLC, Berkeley Point Capital LLC and Steadfast Management Company, Inc. (incorporated by reference to Exhibit 10.45 to the Registrant’s Form 8-K filed July 5, 2016) |
10.116 | Multifamily Loan and Security Agreement, made as of June 30, 2016, by and between SIR Tapestry Park, LLC and Berkeley Point Capital LLC (incorporated by reference to Exhibit 10.46 to the Registrant’s Form 8-K filed July 5, 2016) |
10.117 | Multifamily Note, made as of June 30, 2016, by SIR Tapestry Park, LLC, in favor of Berkeley Point Capital LLC (incorporated by reference to Exhibit 10.47 to the Registrant’s Form 8-K filed July 5, 2016) |
10.118 | Multifamily Mortgage, Assignment of Rents and Security Agreement, dated as of June 30, 2016, by SIR Tapestry Park, LLC to and for the benefit of Berkeley Point Capital LLC (incorporated by reference to Exhibit 10.48 to the Registrant’s Form 8-K filed July 5, 2016) |
10.119 | Guaranty, dated as of June 30, 2016, by Steadfast Income REIT, Inc. to and for the benefit of Berkeley Point Capital LLC (incorporated by reference to Exhibit 10.49 to the Registrant’s Form 8-K filed July 5, 2016) |
89
10.120 | Assignment of Management Agreement and Subordination of Management Fees, dated as of June 30, 2016, by and among SIR Tapestry Park, LLC, Berkeley Point Capital LLC and Steadfast Management Company, Inc. (incorporated by reference to Exhibit 10.50 to the Registrant’s Form 8-K filed July 5, 2016) |
10.121 | Multifamily Loan and Security Agreement, made as of June 30, 2016, by and between SIR Park Shore, LLC and Berkeley Point Capital LLC (incorporated by reference to Exhibit 10.51 to the Registrant’s Form 8-K filed July 5, 2016) |
10.122 | Multifamily Note, made as of June 30, 2016, by SIR Park Shore, LLC, in favor of Berkeley Point Capital LLC (incorporated by reference to Exhibit 10.52 to the Registrant’s Form 8-K filed July 5, 2016) |
10.123 | Multifamily Mortgage, Assignment of Rents and Security Agreement, dated as of June 30, 2016, by SIR Park Shore, LLC to and for the benefit of Berkeley Point Capital LLC (incorporated by reference to Exhibit 10.53 to the Registrant’s Form 8-K filed July 5, 2016) |
10.124 | Guaranty, dated as of June 30, 2016, by Steadfast Income REIT, Inc. to and for the benefit of Berkeley Point Capital LLC (incorporated by reference to Exhibit 10.54 to the Registrant’s Form 8-K filed July 5, 2016) |
10.125 | Assignment of Management Agreement and Subordination of Management Fees, dated as of June 30, 2016, by and among SIR Park Shore, LLC, Berkeley Point Capital LLC and Steadfast Management Company, Inc. (incorporated by reference to Exhibit 10.55 to the Registrant’s Form 8-K filed July 5, 2016) |
10.126 | Multifamily Loan and Security Agreement, made as of June 30, 2016, by and between SIR Carol Stream, LLC and Berkeley Point Capital LLC (incorporated by reference to Exhibit 10.56 to the Registrant’s Form 8-K filed July 5, 2016) |
10.127 | Multifamily Note, made as of June 30, 2016, by SIR Carol Stream, LLC, in favor of Berkeley Point Capital LLC (incorporated by reference to Exhibit 10.57 to the Registrant’s Form 8-K filed July 5, 2016) |
10.128 | Multifamily Mortgage, Assignment of Rents and Security Agreement, dated as of June 30, 2016, by SIR Carol Stream, LLC to and for the benefit of Berkeley Point Capital LLC (incorporated by reference to Exhibit 10.58 to the Registrant’s Form 8-K filed July 5, 2016) |
10.129 | Guaranty, dated as of June 30, 2016, by Steadfast Income REIT, Inc. to and for the benefit of Berkeley Point Capital LLC (incorporated by reference to Exhibit 10.59 to the Registrant’s Form 8-K filed July 5, 2016) |
10.130 | Assignment of Management Agreement and Subordination of Management Fees, dated as of June 30, 2016, by and among SIR Carol Stream, LLC, Berkeley Point Capital LLC and Steadfast Management Company, Inc. (incorporated by reference to Exhibit 10.60 to the Registrant’s Form 8-K filed July 5, 2016) |
10.131 | Multifamily Loan and Security Agreement, made as of June 30, 2016, by and between SIR Cantare, LLC and Berkeley Point Capital LLC (incorporated by reference to Exhibit 10.61 to the Registrant’s Form 8-K filed July 5, 2016) |
10.132 | Multifamily Note, made as of June 30, 2016, by SIR Cantare, LLC, in favor of Berkeley Point Capital LLC (incorporated by reference to Exhibit 10.62 to the Registrant’s Form 8-K filed July 5, 2016) |
10.133 | Multifamily Deed of Trust, Absolute Assignment of Leases and Rents and Security Agreement (Including Fixture Filing), dated as of June 30, 2016, by SIR Cantare, LLC to Joseph B. Pitts, Jr. for the benefit of Berkeley Point Capital LLC (incorporated by reference to Exhibit 10.63 to the Registrant’s Form 8-K filed July 5, 2016) |
10.134 | Guaranty, dated as of June 30, 2016, by Steadfast Income REIT, Inc. to and for the benefit of Berkeley Point Capital LLC (incorporated by reference to Exhibit 10.64 to the Registrant’s Form 8-K filed July 5, 2016) |
10.135 | Assignment of Management Agreement and Subordination of Management Fees, dated as of June 30, 2016, by and among SIR Cantare, LLC, Berkeley Point Capital LLC and Steadfast Management Company, Inc. (incorporated by reference to Exhibit 10.65 to the Registrant’s Form 8-K filed July 5, 2016) |
10.136 | Multifamily Loan and Security Agreement, made as of June 30, 2016, by and between SIR Stuart Hall, LLC and Berkeley Point Capital LLC (incorporated by reference to Exhibit 10.66 to the Registrant’s Form 8-K filed July 5, 2016) |
10.137 | Multifamily Note, made as of June 30, 2016, by SIR Stuart Hall, LLC, in favor of Berkeley Point Capital LLC (incorporated by reference to Exhibit 10.67 to the Registrant’s Form 8-K filed July 5, 2016) |
90
10.138 | Multifamily Deed of Trust, Assignment of Rents and Security Agreement, dated as of June 30, 2016, by SIR Stuart Hall, LLC to Steven M. Leigh for the benefit of Berkeley Point Capital LLC (incorporated by reference to Exhibit 10.68 to the Registrant’s Form 8-K filed July 5, 2016) |
10.139 | Guaranty, dated as of June 30, 2016, by Steadfast Income REIT, Inc. to and for the benefit of Berkeley Point Capital LLC (incorporated by reference to Exhibit 10.69 to the Registrant’s Form 8-K filed July 5, 2016) |
10.140 | Assignment of Management Agreement and Subordination of Management Fees, dated as of June 30, 2016, by and among SIR Stuart Hall, LLC, Berkeley Point Capital LLC and Steadfast Management Company, Inc. (incorporated by reference to Exhibit 10.70 to the Registrant’s Form 8-K filed July 5, 2016) |
10.141 | Assignment of Management Agreement and Subordination of Management Fees, dated as of June 30, 2016, by and among SIR Stuart Hall, LLC, Berkeley Point Capital LLC and Embassy Properties, Inc. (incorporated by reference to Exhibit 10.71 to the Registrant’s Form 8-K filed July 5, 2016) |
10.142 | Multifamily Loan and Security Agreement, made as of July 29, 2016, by and between SIR Ashley Oaks, LLC and PNC Bank, National Association (incorporated by reference to Exhibit 10.1 to the Registrant’s Form 8-K filed August 3, 2016) |
10.143 | Multifamily Deed of Trust, Assignment of Rents, Security Agreement and Fixture Filing, dated as of July 29, 2016, by SIR Ashley Oaks, LLC to Ann Johnson for the benefit of PNC Bank, National Association (incorporated by reference to Exhibit 10.2 to the Registrant’s Form 8-K filed August 3, 2016) |
10.144 | Assignment of Management Agreement and Subordination of Management Fees, dated as of July 29, 2016, by and among SIR Ashley Oaks, LLC, PNC Bank, National Association and Steadfast Management Company, Inc. (incorporated by reference to Exhibit 10.3 to the Registrant’s Form 8-K filed August 3, 2016) |
10.145 | Multifamily Loan and Security Agreement, made as of July 29, 2016, by and between SIR Buda Ranch, LLC and PNC Bank, National Association (incorporated by reference to Exhibit 10.4 to the Registrant’s Form 8-K filed August 3, 2016) |
10.146 | Multifamily Deed of Trust, Assignment of Rents, Security Agreement and Fixture Filing, dated as of July 29, 2016, by SIR Buda Ranch, LLC to Ann Johnson for the benefit of PNC Bank, National Association (incorporated by reference to Exhibit 10.5 to the Registrant’s Form 8-K filed August 3, 2016) |
10.147 | Assignment of Management Agreement and Subordination of Management Fees, dated as of July 29, 2016, by and among SIR Buda Ranch, LLC, PNC Bank, National Association and Steadfast Management Company, Inc. (incorporated by reference to Exhibit 10.6 to the Registrant’s Form 8-K filed August 3, 2016) |
10.148 | Multifamily Loan and Security Agreement, made as of July 29, 2016, by and between SIR Deer Valley, LLC and PNC Bank, National Association (incorporated by reference to Exhibit 10.7 to the Registrant’s Form 8-K filed August 3, 2016) |
10.149 | Multifamily Mortgage, Assignment of Rents and Security Agreement, dated as of July 29, 2016, by and between SIR Deer Valley, LLC and PNC Bank, National Association (incorporated by reference to Exhibit 10.8 to the Registrant’s Form 8-K filed August 3, 2016) |
10.150 | Assignment of Management Agreement and Subordination of Management Fees, dated as of July 29, 2016, by and among SIR Deer Valley, LLC, PNC Bank, National Association and Steadfast Management Company, Inc. (incorporated by reference to Exhibit 10.9 to the Registrant’s Form 8-K filed August 3, 2016) |
10.151 | Multifamily Loan and Security Agreement, made as of July 29, 2016, by and between SIR Carrington Park, LLC and PNC Bank, National Association (incorporated by reference to Exhibit 10.10 to the Registrant’s Form 8-K filed August 3, 2016) |
10.152 | Multifamily Deed of Trust, Assignment of Rents, Security Agreement and Fixture Filing, dated as of July 29, 2016, by SIR Carrington Park, LLC to Ann Johnson for the benefit of PNC Bank, National Association (incorporated by reference to Exhibit 10.11 to the Registrant’s Form 8-K filed August 3, 2016) |
10.153 | Assignment of Management Agreement and Subordination of Management Fees, dated as of July 29, 2016, by and among SIR Carrington Park, LLC, PNC Bank, National Association and Steadfast Management Company, Inc. (incorporated by reference to Exhibit 10.12 to the Registrant’s Form 8-K filed August 3, 2016) |
91
10.154 | Multifamily Loan and Security Agreement, made as of July 29, 2016, by and between SIR Carrington Place, LLC and PNC Bank, National Association (incorporated by reference to Exhibit 10.13 to the Registrant’s Form 8-K filed August 3, 2016) |
10.155 | Multifamily Deed of Trust, Assignment of Rents, Security Agreement and Fixture Filing, dated as of July 29, 2016, by SIR Carrington Place, LLC to Ann Johnson for the benefit of PNC Bank, National Association (incorporated by reference to Exhibit 10.14 to the Registrant’s Form 8-K filed August 3, 2016) |
10.156 | Assignment of Management Agreement and Subordination of Management Fees, dated as of July 29, 2016, by and among SIR Carrington Place, LLC, PNC Bank, National Association and Steadfast Management Company, Inc. (incorporated by reference to Exhibit 10.15 to the Registrant’s Form 8-K filed August 3, 2016) |
10.157 | Multifamily Loan and Security Agreement, made as of July 29, 2016, by and between SIR Carrington Champion, LLC and PNC Bank, National Association (incorporated by reference to Exhibit 10.16 to the Registrant’s Form 8-K filed August 3, 2016) |
10.158 | Multifamily Deed Trust, Assignment of Rents, Security Agreement and Fixture Filing, dated as of July 29, 2016, by SIR Carrington Champion, LLC to Ann Johnson for the benefit of PNC Bank, National Association (incorporated by reference to Exhibit 10.17 to the Registrant’s Form 8-K filed August 3, 2016) |
10.159 | Assignment of Management Agreement and Subordination of Management Fees, dated as of July 29, 2016, by and among SIR Carrington Champion, LLC, PNC Bank, National Association and Steadfast Management Company, Inc. (incorporated by reference to Exhibit 10.18 to the Registrant’s Form 8-K filed August 3, 2016) |
10.160 | Multifamily Loan and Security Agreement, made as of July 29, 2016, by and between SIR Audubon Park, LLC and PNC Bank, National Association (incorporated by reference to Exhibit 10.19 to the Registrant’s Form 8-K filed August 3, 2016) |
10.161 | Multifamily Deed of Trust, Absolute Assignment of Leases and Rents and Security Agreement (Including Fixture Filing), dated as of July 29, 2016, by SIR Audubon Park, LLC to Joseph B. Pitt, Jr. for the benefit of PNC Bank, National Association (incorporated by reference to Exhibit 10.20 to the Registrant’s Form 8-K filed August 3, 2016) |
10.162 | Assignment of Management Agreement and Subordination of Management Fees, dated as of July 29, 2016, by and among SIR Audubon Park, LLC, PNC Bank, National Association and Steadfast Management Company, Inc. (incorporated by reference to Exhibit 10.21 to the Registrant’s Form 8-K filed August 3, 2016) |
10.163 | Multifamily Loan and Security Agreement, made as of July 29, 2016, by and between SIR Oak Crossing, LLC and PNC Bank, National Association (incorporated by reference to Exhibit 10.22 to the Registrant’s Form 8-K filed August 3, 2016) |
10.164 | Multifamily Mortgage, Assignment of Rents, Security Agreement and Fixture Filing, dated as of July 29, 2016, by and between SIR Oak Crossing, LLC and PNC Bank, National Association (incorporated by reference to Exhibit 10.23 to the Registrant’s Form 8-K filed August 3, 2016) |
10.165 | Assignment of Management Agreement and Subordination of Management Fees, dated as of July 29, 2016, by and among SIR Oak Crossing, LLC, PNC Bank, National Association and Steadfast Management Company, Inc. (incorporated by reference to Exhibit 10.24 to the Registrant’s Form 8-K filed August 3, 2016) |
10.166 | Multifamily Loan and Security Agreement, made as of July 29, 2016, by and between SIR Steiner Ranch Apartments, LLC and PNC Bank, National Association (incorporated by reference to Exhibit 10.25 to the Registrant’s Form 8-K filed August 3, 2016) |
10.167 | Multifamily Deed of Trust, Assignment of Rents, Security Agreement and Fixture Filing, dated as of July 29, 2016, by SIR Steiner Ranch Apartments, LLC to Ann Johnson for the benefit of PNC Bank, National Association (incorporated by reference to Exhibit 10.26 to the Registrant’s Form 8-K filed August 3, 2016) |
10.168 | Assignment of Management Agreement and Subordination of Management Fees, dated as of July 29, 2016, by and among SIR Steiner Ranch Apartments, LLC, PNC Bank, National Association and Steadfast Management Company, Inc. (incorporated by reference to Exhibit 10.27 to the Registrant’s Form 8-K filed August 3, 2016) |
92
10.169 | Credit Agreement, dated July 29, 2016, by and between SIR Ashley Oaks, LLC, SIR Buda Ranch, LLC, SIR Deer Valley, LLC, SIR Carrington Park, LLC, SIR Carrington Place, LLC, SIR Carrington Champion, SIR Audubon Park, LLC, SIR Oak Crossing, LLC, SIR Steiner Ranch Apartments, LLC and PNC Bank, National Association (incorporated by reference to Exhibit 10.28 to the Registrant’s Form 8-K filed August 3, 2016) |
10.170 | Multifamily Note, made as of July 29, 2016, by SIR Ashley Oaks, LLC, SIR Audubon Park, LLC, SIR Carrington Champion, LLC, SIR Carrington Park, LLC, SIR Carrington Place, LLC, SIR Deer Valley, LLC, SIR Steiner Ranch Apartments, LLC, SIR Oak Crossing, LLC and SIR Buda Ranch, LLC, in favor of PNC Bank, National Association (incorporated by reference to Exhibit 10.29 to the Registrant’s Form 8-K filed August 3, 2016) |
10.171 | Guaranty, dated as of July 29, 2016, by Steadfast Income REIT, Inc. to and for the benefit of PNC Bank, National Association (incorporated by reference to Exhibit 10.30 to the Registrant’s Form 8-K filed August 3, 2016) |
10.172 | Amendment No. 9 to the Amended and Restated Advisory Agreement, dated as of November 8, 2016, by and among Steadfast Income REIT, Inc., Steadfast Income REIT Operating Partnership, L.P. and Steadfast Income Advisor, LLC (incorporated by reference to Exhibit 10.1 to the Registrant’s Form 8-K filed November 14, 2016) |
21* | Subsidiaries of the Company |
23.1* | Consent of Ernst & Young LLP |
31.1* | Certification of the Principal Executive Officer pursuant to Exchange Act Rule 13a-14(a) or 15d-14(a), as adopted pursuant to Section 302 of the Sarbanes-Oxley Act of 2002. |
31.2* | Certification of the Principal Financial Officer pursuant to Exchange Act Rule 13a-14(a) or 15d-14(a), as adopted pursuant to Section 302 of the Sarbanes-Oxley Act of 2002. |
32.1** | Certification of the Principal Executive Officer pursuant to 18 U.S.C. Section 1350, as adopted pursuant to Section 906 of the Sarbanes-Oxley Act of 2002. |
32.2** | Certification of the Principal Financial Officer pursuant to 18 U.S.C. Section 1350, as adopted pursuant to Section 906 of the Sarbanes-Oxley Act of 2002. |
99.1* | Consent of CBRE Capital Advisors, Inc. |
101.INS* | XBRL Instance Document. |
101.SCH* | XBRL Taxonomy Extension Schema Document. |
101.CAL* | XBRL Taxonomy Extension Calculation Linkbase Document. |
101.LAB* | XBRL Taxonomy Extension Labels Linkbase Document. |
101.PRE* | XBRL Taxonomy Extension Presentation Linkbase Document. |
101.DEF* | XBRL Taxonomy Extension Definition Linkbase Document. |
* | Filed herewith. |
** | In accordance with Item 601(b)(32) of Regulation S-K, this Exhibit is not deemed “filed” for purposes of Section 18 of the Exchange Act or otherwise subject to the liabilities of that section. Such certifications will not be deemed incorporated by reference into any filing under the Securities Act or the Exchange Act, except to the extent that the registrant specifically incorporates it by reference. |
ITEM 16. | FORM 10-K SUMMARY |
The Company has elected not to provide summary information.
93
STEADFAST INCOME REIT, INC.
INDEX TO CONSOLIDATED FINANCIAL STATEMENTS
All other schedules are omitted because they are not applicable or the required information is shown in the financial statements or notes thereto.
F-1
REPORT OF INDEPENDENT REGISTERED PUBLIC ACCOUNTING FIRM
The Board of Directors and Stockholders of
Steadfast Income REIT, Inc.
We have audited the accompanying consolidated balance sheets of Steadfast Income REIT, Inc. (the “Company”) as of December 31, 2016 and 2015, and the related consolidated statements of operations, stockholders’ equity, and cash flows for each of the three years in the period ended December 31, 2016. Our audits also included the financial statement schedule listed in the Index at Item 15(a), Schedule III - Real Estate Assets and Accumulated Depreciation and Amortization. These financial statements and schedule are the responsibility of the Company’s management. Our responsibility is to express an opinion on these financial statements and schedule based on our audits.
We conducted our audits in accordance with the standards of the Public Company Accounting Oversight Board (United States). Those standards require that we plan and perform the audit to obtain reasonable assurance about whether the financial statements are free of material misstatement. We were not engaged to perform an audit of the Company’s internal control over financial reporting. Our audits included consideration of internal control over financial reporting as a basis for designing audit procedures that are appropriate in the circumstances, but not for the purpose of expressing an opinion on the effectiveness of the Company’s internal control over financial reporting. Accordingly, we express no such opinion. An audit also includes examining, on a test basis, evidence supporting the amounts and disclosures in the financial statements, assessing the accounting principles used and significant estimates made by management, and evaluating the overall financial statement presentation. We believe that our audits provide a reasonable basis for our opinion.
In our opinion, the financial statements referred to above present fairly, in all material respects, the consolidated financial position of Steadfast Income REIT, Inc. at December 31, 2016 and 2015, and the consolidated results of its operations and its cash flows for each of the three years in the period ended December 31, 2016, in conformity with U.S. generally accepted accounting principles. Also, in our opinion, the related financial statement schedule, when considered in relation to the basic financial statements taken as a whole, presents fairly in all material respects, the information set forth therein.
As discussed in Note 2 to the consolidated financial statements, the Company changed its presentation of debt issuance costs as a result of the adoption of the amendments to the FASB Accounting Standards Codification resulting from Accounting Standards Update No. 2015-03, “Interest - Imputation of interest (Subtopic 835-10): Simplifying the Presentation of Debt Issuance Costs” (ASU No. 2015-03), effective December 31, 2016.
/s/ Ernst & Young LLP
Irvine, California
March 16, 2017
F-2
STEADFAST INCOME REIT, INC.
CONSOLIDATED BALANCE SHEETS
December 31, | |||||||
2016 | 2015 | ||||||
ASSETS | |||||||
Assets: | |||||||
Real Estate: | |||||||
Land | $ | 174,102,422 | $ | 174,102,422 | |||
Building and improvements | 1,517,532,273 | 1,487,961,762 | |||||
Other intangible assets | 2,644,263 | 2,644,263 | |||||
Construction-in-progress | — | 2,192,635 | |||||
Total real estate, cost | 1,694,278,958 | 1,666,901,082 | |||||
Less accumulated depreciation and amortization | (232,744,083 | ) | (163,445,987 | ) | |||
Total real estate, net | 1,461,534,875 | 1,503,455,095 | |||||
Cash and cash equivalents | 66,224,027 | 32,076,582 | |||||
Restricted cash | 27,553,851 | 27,700,811 | |||||
Short-term investments | 30,084,750 | — | |||||
Rents and other receivables | 2,750,520 | 2,742,011 | |||||
Other assets, net | 4,786,762 | 4,328,851 | |||||
Total assets | $ | 1,592,934,785 | $ | 1,570,303,350 | |||
LIABILITIES AND STOCKHOLDERS’ EQUITY | |||||||
Liabilities: | |||||||
Accounts payable and accrued liabilities | $ | 47,377,341 | $ | 40,752,458 | |||
Notes payable: | |||||||
Mortgage notes payable, net | 985,080,154 | 1,115,752,899 | |||||
Credit facilities, net | 232,636,126 | — | |||||
Total notes payable, net | 1,217,716,280 | 1,115,752,899 | |||||
Distributions payable | 4,625,355 | 4,668,261 | |||||
Due to affiliates | 2,787,566 | 2,682,209 | |||||
Total liabilities | 1,272,506,542 | 1,163,855,827 | |||||
Commitments and contingencies (Note 10) | |||||||
Stockholders’ Equity: | |||||||
Preferred stock, $0.01 par value per share; 100,000,000 shares authorized, no shares issued and outstanding | — | — | |||||
Common stock $0.01 par value per share; 999,999,000 shares authorized, 76,202,862 and 76,674,502 shares issued and outstanding at December 31, 2016 and December 31, 2015, respectively | 762,029 | 766,745 | |||||
Convertible stock, $0.01 par value per share; 1,000 shares authorized, issued and outstanding as of December 31, 2016 and December 31, 2015, respectively | 10 | 10 | |||||
Additional paid-in capital | 672,018,194 | 677,624,840 | |||||
Cumulative distributions and net losses | (352,351,990 | ) | (271,944,072 | ) | |||
Total stockholders’ equity | 320,428,243 | 406,447,523 | |||||
Total liabilities and stockholders’ equity | $ | 1,592,934,785 | $ | 1,570,303,350 | |||
See accompanying notes to consolidated financial statements.
F-3
STEADFAST INCOME REIT, INC.
CONSOLIDATED STATEMENTS OF OPERATIONS
For the year ended December 31, | |||||||||||
2016 | 2015 | 2014 | |||||||||
Revenues: | |||||||||||
Rental income | $ | 192,088,348 | $ | 186,264,470 | $ | 175,267,082 | |||||
Tenant reimbursements and other | 26,149,184 | 23,126,188 | 20,662,774 | ||||||||
Total revenues | 218,237,532 | 209,390,658 | 195,929,856 | ||||||||
Expenses: | |||||||||||
Operating, maintenance and management | 57,832,187 | 53,915,306 | 52,427,001 | ||||||||
Real estate taxes and insurance | 36,507,827 | 35,825,445 | 34,750,097 | ||||||||
Fees to affiliates | 25,440,718 | 21,927,913 | 23,923,921 | ||||||||
Depreciation and amortization | 69,513,484 | 65,640,196 | 69,681,177 | ||||||||
Interest expense | 40,551,427 | 39,149,018 | 40,370,846 | ||||||||
Loss on debt extinguishment | 4,932,369 | — | 1,939,817 | ||||||||
General and administrative expenses | 9,039,171 | 5,949,993 | 6,896,519 | ||||||||
Acquisition costs | — | 7,145 | 1,626,904 | ||||||||
Total expenses | 243,817,183 | 222,415,016 | 231,616,282 | ||||||||
Loss from continuing operations | (25,579,651 | ) | (13,024,358 | ) | (35,686,426 | ) | |||||
Gain on sales of real estate, net | — | — | 9,944,134 | ||||||||
Net loss | $ | (25,579,651 | ) | $ | (13,024,358 | ) | $ | (25,742,292 | ) | ||
Loss per common share — basic and diluted | $ | (0.34 | ) | $ | (0.18 | ) | $ | (0.34 | ) | ||
Weighted average number of common shares outstanding — basic and diluted | 76,195,083 | 76,335,114 | 75,450,215 | ||||||||
See accompanying notes to consolidated financial statements.
F-4
STEADFAST INCOME REIT, INC.
CONSOLIDATED STATEMENTS OF STOCKHOLDERS’ EQUITY
FOR THE YEARS ENDED DECEMBER 31, 2016, 2015 AND 2014
Common Stock | Convertible Stock | Additional Paid- In Capital | Cumulative Distributions & Net Losses | Total Stockholders’ Equity | |||||||||||||||||||||
Shares | Amount | Shares | Amount | ||||||||||||||||||||||
BALANCE, December 31, 2013 | 74,153,580 | $ | 741,538 | 1,000 | $ | 10 | $ | 640,181,521 | $ | (123,804,541 | ) | $ | 517,118,528 | ||||||||||||
Issuance of common stock | 2,496,806 | 24,968 | — | — | 24,170,846 | — | 24,195,814 | ||||||||||||||||||
Issuance of restricted common stock to Advisor | 488,281 | 4,883 | — | — | 4,995,117 | — | 5,000,000 | ||||||||||||||||||
Transfers from redeemable common stock | — | — | — | — | 13,393,647 | — | 13,393,647 | ||||||||||||||||||
Redemption of common stock | (280,184 | ) | (2,804 | ) | — | — | (2,721,144 | ) | — | (2,723,948 | ) | ||||||||||||||
Distributions declared | — | — | — | — | — | (54,296,664 | ) | (54,296,664 | ) | ||||||||||||||||
Amortization of stock-based compensation | — | — | — | — | 118,145 | — | 118,145 | ||||||||||||||||||
Net loss for the year ended December 31, 2014 | — | — | — | — | — | (25,742,292 | ) | (25,742,292 | ) | ||||||||||||||||
BALANCE, December 31, 2014 | 76,858,483 | 768,585 | 1,000 | 10 | 680,138,132 | (203,843,497 | ) | 477,063,230 | |||||||||||||||||
Issuance of common stock | 14,008 | 140 | — | — | (62 | ) | — | 78 | |||||||||||||||||
Transfers to redeemable common stock | — | — | — | — | (1,000,000 | ) | — | (1,000,000 | ) | ||||||||||||||||
Redemption of common stock | (197,989 | ) | (1,980 | ) | — | — | (1,998,020 | ) | — | (2,000,000 | ) | ||||||||||||||
Distributions declared | — | — | — | — | — | (55,076,217 | ) | (55,076,217 | ) | ||||||||||||||||
Amortization of stock-based compensation | — | — | — | — | 184,350 | — | 184,350 | ||||||||||||||||||
Change in value of restricted common stock to Advisor | — | — | — | — | 300,440 | — | 300,440 | ||||||||||||||||||
Net loss for the year ended December 31, 2015 | — | — | — | — | — | (13,024,358 | ) | (13,024,358 | ) | ||||||||||||||||
BALANCE, December 31, 2015 | 76,674,502 | 766,745 | 1,000 | 10 | 677,624,840 | (271,944,072 | ) | 406,447,523 | |||||||||||||||||
Issuance of common stock | 7,500 | 75 | — | — | (75 | ) | — | — | |||||||||||||||||
Transfers to redeemable common stock | — | — | — | — | (1,000,000 | ) | — | (1,000,000 | ) | ||||||||||||||||
Redemption of common stock | (479,140 | ) | (4,791 | ) | — | — | (4,995,209 | ) | — | (5,000,000 | ) | ||||||||||||||
Distributions declared | — | — | — | — | — | (54,828,267 | ) | (54,828,267 | ) | ||||||||||||||||
Amortization of stock-based compensation | — | — | — | — | 76,285 | — | 76,285 | ||||||||||||||||||
Change in value of restricted common stock to Advisor | — | — | — | — | 312,353 | — | 312,353 | ||||||||||||||||||
Net loss for the year ended December 31, 2016 | — | — | — | — | — | (25,579,651 | ) | (25,579,651 | ) | ||||||||||||||||
BALANCE, December 31, 2016 | 76,202,862 | $ | 762,029 | 1,000 | $ | 10 | $ | 672,018,194 | $ | (352,351,990 | ) | $ | 320,428,243 | ||||||||||||
See accompanying notes to consolidated financial statements.
F-5
STEADFAST INCOME REIT, INC.
CONSOLIDATED STATEMENTS OF CASH FLOWS
For the year ended December 31, | ||||||||||||
2016 | 2015 | 2014 | ||||||||||
Cash Flows from Operating Activities: | ||||||||||||
Net loss | $ | (25,579,651 | ) | $ | (13,024,358 | ) | $ | (25,742,292 | ) | |||
Adjustments to reconcile net loss to net cash provided by operating activities: | ||||||||||||
Depreciation and amortization | 69,513,484 | 65,640,196 | 69,681,177 | |||||||||
Accretion of below-market leases | — | — | (163,237 | ) | ||||||||
Amortization of deferred financing costs | 1,723,186 | 1,479,710 | 1,489,834 | |||||||||
Amortization of stock-based compensation | 76,285 | 184,350 | 118,145 | |||||||||
Change in value of restricted common stock to Advisor | 312,353 | 300,440 | — | |||||||||
Amortization of loan premiums and discounts | (1,243,385 | ) | (1,234,793 | ) | (1,234,793 | ) | ||||||
Change in fair value of interest rate cap agreements | (61,698 | ) | 2,032,746 | 4,353,301 | ||||||||
Loss on debt extinguishment | 4,932,369 | — | 1,939,817 | |||||||||
Gain on sales of real estate | — | — | (9,944,134 | ) | ||||||||
Insurance claim recoveries | (993,527 | ) | — | — | ||||||||
Loss on disposal of buildings and improvements | 892,396 | — | — | |||||||||
Unrealized gain on short-term investments | (84,750 | ) | — | — | ||||||||
Changes in operating assets and liabilities: | ||||||||||||
Restricted cash for operating activities | (481,918 | ) | (2,822,331 | ) | (1,166,924 | ) | ||||||
Rents and other receivables | (8,509 | ) | (749,701 | ) | 8,622 | |||||||
Other assets | (250,396 | ) | 326,182 | 164,858 | ||||||||
Accounts payable and accrued liabilities | 5,246,172 | (209,027 | ) | 9,023,776 | ||||||||
Due to affiliates, net | 267,009 | (499,327 | ) | 1,822,698 | ||||||||
Net cash provided by operating activities | 54,259,420 | 51,424,087 | 50,350,848 | |||||||||
Cash Flows from Investing Activities: | ||||||||||||
Short-term investments | (30,000,000 | ) | — | — | ||||||||
Acquisition of real estate investments | — | — | (126,718,757 | ) | ||||||||
Additions to real estate investments | (28,268,601 | ) | (29,908,727 | ) | (26,806,870 | ) | ||||||
Escrow deposits for pending real estate acquisitions | — | — | (3,120,400 | ) | ||||||||
Restricted cash for investing activities | 628,878 | 600,459 | 931,301 | |||||||||
Purchase of interest rate cap agreements | (259,000 | ) | (351,950 | ) | (863,934 | ) | ||||||
Proceeds from sales of real estate, net | — | — | 29,761,182 | |||||||||
Proceeds from insurance claims | 993,527 | — | — | |||||||||
Net cash used in investing activities | (56,905,196 | ) | (29,660,218 | ) | (126,817,478 | ) | ||||||
Cash Flows from Financing Activities: | ||||||||||||
Proceeds from issuance of mortgage notes payable | 428,196,350 | 110,986,313 | 156,238,185 | |||||||||
Principal payments on mortgage notes payable | (557,964,896 | ) | (58,058,174 | ) | (71,576,167 | ) | ||||||
Borrowings from credit facilities | 251,124,750 | 6,000,000 | 49,000,000 | |||||||||
Principal payments on credit facilities | (16,000,000 | ) | (20,000,000 | ) | (35,000,000 | ) | ||||||
Proceeds from issuance of common stock | — | — | 26,561,229 | |||||||||
Reimbursement of other offering costs to affiliates | — | — | (3,105,246 | ) | ||||||||
Payment of deferred financing costs | (5,489,473 | ) | (1,057,405 | ) | (1,664,326 | ) | ||||||
Payment of debt extinguishment costs | (3,202,337 | ) | — | (1,794,001 | ) | |||||||
Distributions to common stockholders | (54,871,173 | ) | (55,087,333 | ) | (29,491,989 | ) | ||||||
Redemptions of common stock | (5,000,000 | ) | (2,000,000 | ) | (2,723,948 | ) | ||||||
Net cash provided by (used in) financing activities | 36,793,221 | (19,216,599 | ) | 86,443,737 | ||||||||
Net increase in cash and cash equivalents | 34,147,445 | 2,547,270 | 9,977,107 | |||||||||
Cash and cash equivalents, beginning of year | 32,076,582 | 29,529,312 | 19,552,205 | |||||||||
Cash and cash equivalents, end of year | $ | 66,224,027 | $ | 32,076,582 | $ | 29,529,312 | ||||||
F-6
STEADFAST INCOME REIT, INC.
CONSOLIDATED STATEMENT OF CASH FLOWS (CONTINUED)
For the year ended December 31, | ||||||||||||
2016 | 2015 | 2014 | ||||||||||
Supplemental Disclosure of Cash Flow Information: | ||||||||||||
Interest paid, net of amounts capitalized of $80,166, $153,920 and $41,898 for the years ended December 31, 2016, 2015 and 2014, respectively | $ | 39,622,084 | $ | 36,734,805 | $ | 35,432,090 | ||||||
Supplemental Disclosure of Noncash Transactions: | ||||||||||||
Increase in distributions payable | $ | — | $ | — | $ | 621,003 | ||||||
Application of escrow deposits to acquire real estate | $ | — | $ | — | $ | 3,620,400 | ||||||
Distributions paid to common stockholders through common stock issuances pursuant to the distribution reinvestment plan | $ | — | $ | 78 | $ | 24,183,672 | ||||||
Issuance of restricted common stock to settle liability | $ | — | $ | — | $ | 5,000,000 | ||||||
Decrease in redeemable common stock, net | $ | — | $ | — | $ | 13,393,647 | ||||||
Increase in redeemable common stock payable | $ | 1,000,000 | $ | 1,000,000 | $ | — | ||||||
Increase in accounts payable and accrued liabilities from additions to real estate investments | $ | 378,711 | $ | 433,557 | $ | — | ||||||
(Decrease) increase in due to affiliates from additions to real estate investments | $ | (161,652 | ) | $ | 142,046 | $ | — | |||||
See accompanying notes to consolidated financial statements.
F-7
STEADFAST INCOME REIT, INC.
NOTES TO CONSOLIDATED FINANCIAL STATEMENTS
DECEMBER 31, 2016
1. | Organization and Business |
Steadfast Income REIT, Inc. (the “Company”) was formed on May 4, 2009 as a Maryland corporation that has elected to be treated as, and currently qualifies as, a real estate investment trust (“REIT”). On June 12, 2009, the Company was initially capitalized pursuant to the sale of 22,223 shares of common stock to Steadfast REIT Investments, LLC (the “Sponsor”) at a purchase price of $9.00 per share for an aggregate purchase price of $200,007. On July 10, 2009, Steadfast Income Advisor, LLC (the “Advisor”), a Delaware limited liability company formed on May 1, 2009, invested $1,000 in the Company in exchange for 1,000 shares of convertible stock (the “Convertible Stock”) as described in Note 6.
Substantially all of the Company’s business is conducted through Steadfast Income REIT Operating Partnership, L.P., a Delaware limited partnership formed on July 6, 2009 (the “Operating Partnership”). The Company is the sole general partner of the Operating Partnership. As the Company accepted subscriptions for shares of its common stock in the Public Offering (as defined below), the Company transferred substantially all of the net offering proceeds to the Operating Partnership in exchange for limited partnership interests, and the Company’s percentage ownership in the Operating Partnership increased proportionately. The Company and Advisor entered into an Amended and Restated Limited Partnership Agreement of the Operating Partnership (the “Partnership Agreement”) on September 28, 2009.
As of December 31, 2016, the Company owned 65 multifamily properties comprising a total of 16,709 apartment homes and 25,973 square feet of rentable commercial space. For more information on the Company’s real estate portfolio, see Note 3.
Private Offering
On October 13, 2009, the Company commenced a private offering of up to $94,000,000 in shares of the Company’s common stock at a purchase price of $9.40 per share (with discounts available for certain categories of purchasers) (the “Private Offering”). The Company offered its shares of common stock for sale in the Private Offering pursuant to a confidential private placement memorandum and only to persons that were “accredited investors,” as that term is defined under the Securities Act of 1933, as amended (the “Securities Act”), and Regulation D promulgated thereunder. On July 9, 2010, the Company terminated the Private Offering and on July 19, 2010, the Company commenced its registered public offering described below. The Company sold 637,279 shares of common stock in the Private Offering for gross offering proceeds of $5,844,325.
Public Offering
On July 23, 2009, the Company filed a registration statement on Form S-11 with the Securities and Exchange Commission (the “SEC”) to offer a maximum of 150,000,000 shares of common stock for sale to the public at an initial price of $10.00 per share (with discounts available for certain categories of purchasers) (the “Primary Offering”). The Company also registered up to 15,789,474 shares of common stock for sale pursuant to the Company’s distribution reinvestment plan (the “DRP,” and together with the Primary Offering, the “Public Offering”) at an initial price of $9.50 per share. The SEC declared the Company’s registration statement effective on July 9, 2010. The Company commenced the Public Offering on July 19, 2010. The Company could reallocate shares of common stock registered in the Public Offering between the Primary Offering and the DRP.
On July 12, 2012, the Company’s board of directors determined an estimated value per share of the Company’s common stock as of March 31, 2012 of $10.24. As a result of the determination of the estimated value per share of the Company’s common stock as of March 31, 2012, effective September 10, 2012, the offering price of the Company’s common stock to the public in the Primary Offering increased from the previous price of $10.00 per share to $10.24 per share. Additionally, effective September 10, 2012, the price of shares of the Company’s common stock issued pursuant to the DRP increased from a price of $9.50 per share to a price of $9.73 per share, or 95% of the new Primary Offering price of $10.24 per share. Effective September 10, 2012, the Company’s board of directors increased the amount of distributions paid on each share of the Company’s common stock from $0.001917 per share per day to $0.001964 per share per day, which, if paid each day over a 365-day period, is equivalent to a 7.0% annualized distribution rate based on the new offering price of $10.24 per share.
F-8
STEADFAST INCOME REIT, INC.
NOTES TO CONSOLIDATED FINANCIAL STATEMENTS - (Continued)
DECEMBER 31, 2016
The Company terminated its Public Offering on December 20, 2013. Following termination of the Public Offering, the Company continued to offer shares of common stock pursuant to the DRP until the Company’s board of directors suspended the DRP effective with distributions earned beginning on December 1, 2014. Through December 20, 2013, the Company sold 73,608,337 shares of common stock in the Public Offering for gross proceeds of $745,389,748, including 1,588,289 shares of common stock issued pursuant to the DRP for gross offering proceeds of $15,397,232.
On March 10, 2015, the Company’s board of directors determined an estimated value per share of the Company’s common stock of $10.35 as of December 31, 2014. On February 25, 2016, the Company’s board of directors again determined an estimated value per share of the Company’s common stock of $11.44 as of December 31, 2015. See “—Note 14. Subsequent Events” for further information regarding the estimated value per share.
The business of the Company is externally managed by the Advisor pursuant to the Advisory Agreement by and among the Company, the Operating Partnership and the Advisor (as amended, the “Advisory Agreement”), which is subject to annual renewal by the Company’s board of directors. The current term of the Advisory Agreement expires on November 15, 2017. Subject to certain restrictions and limitations, the Advisor manages the Company’s day-to-day operations, manages the Company’s portfolio of properties and real estate-related assets, sources and presents investment opportunities to the Company’s board of directors and provides investment management services on the Company’s behalf. Steadfast Capital Markets Group, LLC (the “Dealer Manager”), an affiliate of the Company, served as the dealer manager for the Public Offering. The Advisor, along with the Dealer Manager, also provides marketing, investor relations and other administrative services on the Company’s behalf.
The Partnership Agreement provides that the Operating Partnership is operated in a manner that will enable the Company to (1) satisfy the requirements for being classified as a REIT for tax purposes, (2) avoid any federal income or excise tax liability and (3) ensure that the Operating Partnership will not be classified as a “publicly traded partnership” for purposes of Section 7704 of the Internal Revenue Code of 1986, as amended (the “Internal Revenue Code”), which classification could result in the Operating Partnership being taxed as a corporation, rather than as a partnership. In addition to the administrative and operating costs and expenses incurred by the Operating Partnership in acquiring and operating real properties, the Operating Partnership will pay all of the Company’s administrative costs and expenses, and such expenses will be treated as expenses of the Operating Partnership.
2. | Summary of Significant Accounting Policies |
Principles of Consolidation and Basis of Presentation
The consolidated financial statements include the accounts of the Company, the Operating Partnership and its subsidiaries. All significant intercompany balances and transactions are eliminated in consolidation. The financial statements of the Company’s subsidiaries are prepared using accounting policies consistent with those of the Company.
The accompanying consolidated financial statements are prepared in accordance with U.S. generally accepted accounting principles (“GAAP”) as contained within the Financial Accounting Standards Board (“FASB”), Accounting Standards Codification (“ASC”) and the rules and regulations of the SEC.
Square footage, occupancy and certain other measures used to describe real estate included in the notes to the consolidated financial statements are presented on an unaudited basis.
Use of Estimates
The preparation of the consolidated financial statements in conformity with GAAP requires the Company to make estimates and assumptions that affect the amounts reported in the consolidated financial statements and accompanying notes. Actual results could materially differ from those estimates.
F-9
STEADFAST INCOME REIT, INC.
NOTES TO CONSOLIDATED FINANCIAL STATEMENTS - (Continued)
DECEMBER 31, 2016
Reclassifications
Certain prior year amounts in the consolidated financial statements have been reclassified to conform with the current year presentation. These reclassifications have not changed the results of operations of prior periods. During the year ended December 31, 2016, the Company adopted new accounting guidance to simplify the presentation of debt issuance costs. As a result, net deferred financing costs of $6,697,472 related to mortgage notes payable as of December 31, 2015, were reclassified from other assets, net to mortgage notes payable, net on the consolidated balance sheets. Additionally, during the year ended December 31, 2016, the Company adopted new accounting guidance to clarify how certain cash receipts and cash payments should be classified on the statement of cash flows. As a result, the Company reclassified payments for debt extinguishment costs of $0 and $1,794,001 from cash flows from operating activities to cash flows from financing activities for the years ended December 31, 2015 and 2014 on the consolidated statements of cash flows.
Real Estate Assets
Depreciation and Amortization
Real estate costs related to the development, construction and improvement of properties are capitalized. Acquisition costs related to business combinations are expensed as incurred. Acquisition costs related to asset acquisitions are capitalized. Repair and maintenance and tenant turnover costs are charged to expense as incurred and significant replacements and betterments are capitalized. Repair and maintenance and tenant turnover costs include all costs that do not extend the useful life of the real estate asset. The Company considers the period of future benefit of an asset to determine its appropriate useful life and anticipates the estimated useful lives of assets by class to be generally as follows:
Buildings | 27.5 years | |
Building improvements | 5-25 years | |
Tenant improvements | Shorter of lease term or expected useful life | |
Tenant origination and absorption costs | Remaining term of related lease | |
Furniture, fixtures, and equipment | 5-10 years | |
Real Estate Purchase Price Allocation
The Company records the acquisition of income-producing real estate or real estate that will be used for the production of income as a business combination. All assets acquired and liabilities assumed in a business combination are measured at their acquisition-date fair values. Acquisition costs related to business combinations are expensed as incurred.
The Company assesses the acquisition-date fair values of all tangible assets, identifiable intangible assets and assumed liabilities using methods similar to those used by independent appraisers (e.g., discounted cash flow analysis) and that utilize appropriate discount and/or capitalization rates and available market information. Estimates of future cash flows are based on a number of factors including historical operating results, known and anticipated trends, and market and economic conditions. The fair value of tangible assets of an acquired property considers the value of the property as if it was vacant.
Intangible assets include the value of in-place leases, which represents the estimated value of the net cash flows of the in-place leases to be realized, as compared to the net cash flows that would have occurred had the property been vacant at the time of acquisition and subject to lease-up.
The Company estimates the value of tenant origination and absorption costs by considering the estimated carrying costs during hypothetical expected lease-up periods, considering current market conditions. In estimating carrying costs, the Company estimates the amount of lost rentals using market rates during the expected lease-up periods.
The Company amortizes the value of in-place leases to expense over the remaining non-cancelable term of the respective leases. Should a tenant terminate its lease, the unamortized portion of the in-place lease value and customer relationship intangibles would be charged to expense in that period.
F-10
STEADFAST INCOME REIT, INC.
NOTES TO CONSOLIDATED FINANCIAL STATEMENTS - (Continued)
DECEMBER 31, 2016
The Company records above-market and below-market in-place lease values for acquired properties based on the present value (using an interest rate that reflects the risks associated with the leases acquired) of the difference between (1) the contractual amounts to be paid pursuant to the in-place leases and (2) the Company’s estimate of fair market lease rates for the corresponding in-place leases, measured over a period equal to the remaining non-cancelable term of the lease. The Company amortizes any capitalized above-market or below-market lease values as a reduction or increase to rental income over the remaining non-cancelable terms of the respective leases.
The total amount of other lease-related intangible assets acquired will be further allocated to in-place lease values and customer relationship intangible values based on the Company’s evaluation of the specific characteristics of each tenant’s lease and its overall relationship with that respective tenant. Characteristics that the Company considers in allocating these values include the nature and extent of existing business relationships with the tenant, growth prospects for developing new business with the tenant, and the tenant’s credit quality and expectations of lease renewals (including those existing under the terms of the lease agreement), among other factors.
The total amount of non-lease-related intangible assets, including amenity access agreements, tax abatement agreements or other contract rights assumed as part of the acquisition of certain properties, will be allocated to other intangible assets based on the present value of the difference between contractual amounts to be paid pursuant to the contracts assumed and the Company’s estimate of the fair market contract rates for corresponding contracts measured over a period equal to the remaining non-cancelable term of the contracts assumed. Other intangible assets are amortized using the straight-line method over the remaining non-cancelable term of the related contracts.
Estimates of the fair values of the tangible assets, identifiable intangible assets and assumed liabilities require the Company to make significant assumptions to estimate market lease rates, property-operating expenses, carrying costs during lease-up periods, discount rates, market absorption periods, and the number of years the property will be held for investment. The use of inappropriate assumptions could result in an incorrect valuation of acquired tangible assets, identifiable intangible assets and assumed liabilities, which could impact the amount of the Company’s net income (loss).
Sale of Real Estate Assets
Property sales or dispositions are recorded when title transfers to unrelated third parties, contingencies have been removed and sufficient cash consideration has been received by the Company. Upon disposition, the related costs and accumulated depreciation are removed from the respective accounts. Any gain or loss on sale is recognized in accordance with GAAP.
The Company classifies real estate assets as real estate held for sale once the criteria, as defined by GAAP, have been met.
Impairment of Real Estate Assets
The Company accounts for its real estate assets in accordance with ASC 360—Property, Plant and Equipment (“ASC 360”). ASC 360 requires the Company to continually monitor events and changes in circumstances that could indicate that the carrying amounts of the Company’s real estate and related intangible assets may not be recoverable. When indicators of potential impairment suggest that the carrying value of real estate and related intangible assets and liabilities may not be recoverable, the Company assesses the recoverability of the assets by estimating whether the Company will recover the carrying value of the asset through its undiscounted future cash flows and its eventual disposition. Based on this analysis, if the Company does not believe that it will be able to recover the carrying value of the real estate and related intangible assets and liabilities, the Company records an impairment loss to the extent that the carrying value exceeds the estimated fair value of the real estate and related intangible assets and liabilities. If any assumptions, projections or estimates regarding an asset changes in the future, the Company may have to record an impairment to reduce the net book value of such individual asset. The Company did not record any impairment loss on its real estate assets during the years ended December 31, 2016, 2015 and 2014.
Rents and Other Receivables
The Company will periodically evaluate the collectability of amounts due from tenants and maintain an allowance for doubtful accounts for estimated losses resulting from the inability of tenants to make required payments under lease
F-11
STEADFAST INCOME REIT, INC.
NOTES TO CONSOLIDATED FINANCIAL STATEMENTS - (Continued)
DECEMBER 31, 2016
agreements. The Company exercises judgment in establishing these allowances and considers payment history and current credit status of tenants in developing these estimates. Due to the short-term nature of the operating leases, the Company does not maintain a deferred rent receivable related to the straight-lining of rents.
Revenue Recognition
The Company leases apartment and condominium units under operating leases with terms generally of one year or less. Generally, credit investigations are performed for prospective residents and security deposits are obtained. The Company will recognize minimum rent, including rental abatements, concessions and contractual fixed increases attributable to operating leases, on a straight-line basis over the term of the related lease and amounts expected to be received in later years will be recorded as deferred rents. The Company records property operating expense reimbursements due from tenants for common area maintenance, real estate taxes, and other recoverable costs in the period the related expenses are incurred.
The Company recognizes gains on sales of real estate either in total or deferred for a period of time, depending on whether a sale has been consummated, the extent of the buyer’s investment in the property being sold, whether the receivable is subject to future subordination, and the degree of the Company’s continuing involvement with the property after the sale. If the criteria for profit recognition under the full-accrual method are not met, the Company will defer gain recognition and account for the continued operations of the property by applying the percentage-of-completion, reduced profit, deposit, installment or cost recovery method, as appropriate, until the appropriate criteria are met.
Cash and Cash Equivalents
The Company considers all highly liquid investments purchased with an original maturity of three months or less to be cash equivalents. Cash equivalents may include cash and short-term investments. Short-term investments are stated at cost, which approximates fair value. As of December 31, 2016 and 2015, the Company had amounts in excess of federally insured limits in deposit accounts with a financial institution. The Company limits such deposits to financial institutions with high credit standing.
Restricted Cash
Restricted cash represents those cash accounts for which the use of funds is restricted by loan covenants. As of December 31, 2016 and 2015, the Company had a restricted cash balance of $27,553,851 and $27,700,811, respectively, which represents amounts set aside as impounds for future property tax payments, property insurance payments and tenant improvement payments as required by agreements with the Company’s lenders.
Short-term Investments
Short-term investments consist of any highly-liquid securities that have an original maturity of less than one year but greater than three months at the time of purchase. As of December 31, 2016, short-term investments consisted of $30,000,000 held in a certificate of deposit and are included in short-term investments on the consolidated balance sheets. No short-term investments were held as of December 31, 2015. The short-term investment is classified as held-to-maturity and was recorded at the amortized cost on the accompanying consolidated balance sheets. During the year ended December 31, 2016, $84,750 was included in tenant reimbursements and other on the accompanying consolidated statements of operations.
Deferred Financing Costs
The Company capitalizes deferred financing costs such as commitment fees, legal fees and other third party costs associated with obtaining commitments for financing that result in a closing of such financing, as a contra liability against the respective outstanding debt balances. The Company amortizes these costs over the terms of the respective financing agreements using the effective interest method. The Company expenses unamortized deferred financing costs when the associated debt is refinanced or repaid before maturity unless specific rules are met that would allow for the carryover of such costs to the refinanced debt. Costs incurred in seeking financing transactions that do not close are expensed in the period in which it is determined that the financing will not close.
F-12
STEADFAST INCOME REIT, INC.
NOTES TO CONSOLIDATED FINANCIAL STATEMENTS - (Continued)
DECEMBER 31, 2016
Derivative Financial Instruments
The Company accounts for its derivative financial instruments in accordance with ASC 815—Derivatives and Hedging. The Company’s objective in using derivatives is to add stability to interest expense and to manage the Company’s exposure to interest rate movements or other identified risks. To accomplish these objectives, the Company may use various types of derivative instruments to manage fluctuations in cash flows resulting from interest rate risk attributable to changes in the benchmark interest rate of LIBOR or other applicable benchmark rates.
The Company measures its derivative instruments and hedging activities at fair value and records them as an asset or liability, depending on its rights or obligations under the applicable derivative contract. For derivatives designated as fair value hedges, the changes in the fair value of both the derivative instrument and the hedged items are recorded in earnings. Derivatives used to hedge the exposure to variability in expected future cash flows, or other types of forecasted transactions, are considered cash flow hedges. For derivatives designated as cash flow hedges, the effective portions of changes in fair value of the derivatives are reported in other comprehensive income (loss) and are subsequently reclassified into earnings when the hedged item affects earnings. Changes in fair value of derivative instruments not designated as hedges and ineffective portions of hedges are recognized in earnings in the affected period. The Company assesses the effectiveness of each hedging relationship by comparing the changes in fair value or cash flows of the derivative hedging instrument with the changes in fair value or cash flows of the designated hedged item or transaction.
As of December 31, 2016, the Company did not have any derivatives designated as cash flow or fair value hedges, nor are derivatives being used for trading or speculative purposes.
Fair Value Measurements
Under GAAP, the Company is required to measure certain financial instruments at fair value on a recurring basis. In addition, the Company is required to measure other assets and liabilities at fair value on a non-recurring basis (e.g., carrying value of impaired real estate loans receivable and long-lived assets). Fair value is defined as the price that would be received upon the sale of an asset or paid to transfer a liability in an orderly transaction between market participants at the measurement date. The GAAP fair value framework uses a three-tiered approach. Fair value measurements are classified and disclosed in one of the following three categories:
• | Level 1: unadjusted quoted prices in active markets that are accessible at the measurement date for identical assets or liabilities; |
• | Level 2: quoted prices for similar instruments in active markets, quoted prices for identical or similar instruments in markets that are not active, and model-derived valuations in which significant inputs and significant value drivers are observable in active markets; and |
• | Level 3: prices or valuation techniques where little or no market data is available that requires inputs that are both significant to the fair value measurement and unobservable. |
When available, the Company utilizes quoted market prices from an independent third-party source to determine fair value and will classify such items in Level 1 or Level 2. In instances where the market is not active, regardless of the availability of a nonbinding quoted market price, observable inputs might not be relevant and could require the Company to make a significant adjustment to derive a fair value measurement. Additionally, in an inactive market, a market price quoted from an independent third party may rely more on models with inputs based on information available only to that independent third party. When the Company determines the market for a financial instrument owned by the Company to be illiquid or when market transactions for similar instruments do not appear orderly, the Company uses several valuation sources (including internal valuations, discounted cash flow analysis and quoted market prices) and will establish a fair value by assigning weights to the various valuation sources.
The following describes the valuation methodologies used by the Company to measure fair value, including an indication of the level in the fair value hierarchy in which each asset or liability is generally classified.
F-13
STEADFAST INCOME REIT, INC.
NOTES TO CONSOLIDATED FINANCIAL STATEMENTS - (Continued)
DECEMBER 31, 2016
Interest rate cap agreements - The Company has entered into certain interest rate cap agreements. These derivatives did not qualify as fair value hedges. Fair value was based on a model-driven valuation using the associated variable rate curve and an implied market volatility, both of which were observable at commonly quoted intervals for the full term of the interest rate cap agreements. Therefore, the Company’s interest rate cap agreements were classified within Level 2 of the fair value hierarchy and are included in deferred financing costs and other assets, net in the accompanying consolidated balance sheets.
The following table reflects the Company’s assets required to be measured at fair value on a recurring basis on the consolidated balance sheets:
December 31, 2016 | ||||||||||||
Fair Value Measurements Using | ||||||||||||
Level 1 | Level 2 | Level 3 | ||||||||||
Assets: | ||||||||||||
Interest rate cap agreements | $ | — | $ | 618,841 | $ | — | ||||||
December 31, 2015 | ||||||||||||
Fair Value Measurements Using | ||||||||||||
Level 1 | Level 2 | Level 3 | ||||||||||
Assets: | ||||||||||||
Interest rate cap agreements | $ | — | $ | 298,143 | $ | — | ||||||
Changes in assumptions or estimation methodologies can have a material effect on these estimated fair values. In this regard, the derived fair value estimates cannot be substantiated by comparison to independent markets and, in many cases, may not be realized in an immediate settlement of the instrument.
Fair Value of Financial Instruments
The accompanying consolidated balance sheets include the following financial instruments: cash and cash equivalents, restricted cash, short-term investments, rents and other receivables, accounts payable and accrued liabilities, distributions payable, due to affiliates and notes payable.
The Company considers the carrying value of cash and cash equivalents, restricted cash, rents and other receivables, accounts payable and accrued liabilities and distributions payable to approximate the fair value of these financial instruments based on the short duration between origination of the instruments and their expected realization. The Company considers the carrying value of short-term investments to approximate fair value as it was recorded at amortized cost. The fair value of amounts due to affiliates is not determinable due to the related party nature of such amounts.
The fair value of the notes payable is estimated using a discounted cash flow analysis using borrowing rates available to the Company for debt instruments with similar terms and maturities. As of December 31, 2016 and 2015, the fair value of the notes payable was $1,197,015,105 and $1,118,126,231, respectively, compared to the carrying value of $1,217,716,280 and $1,115,752,899, respectively. The Company has determined that its notes payable are classified as Level 3 within the fair value hierarchy.
Accounting for Stock-Based Compensation
The Company amortizes the fair value of stock-based compensation awards to expense over the vesting period and records any dividend equivalents earned as dividends for financial reporting purposes. Stock-based compensation awards to independent directors are valued at the fair value on the date of grant and amortized as an expense over the vesting period. Awards to non-employees are remeasured at fair value each reporting period and amortized as an expense over the vesting period.
F-14
STEADFAST INCOME REIT, INC.
NOTES TO CONSOLIDATED FINANCIAL STATEMENTS - (Continued)
DECEMBER 31, 2016
Distribution Policy
The Company has elected to be taxed as a REIT and to operate as a REIT beginning with its taxable year ended December 31, 2010. To maintain its qualification as a REIT, the Company intends to make distributions each taxable year equal to at least 90% of its REIT taxable income (which is determined without regard to the dividends paid deduction or net capital gain and which does not necessarily equal net income as calculated in accordance with GAAP). Distributions were based on daily record dates and calculated at a rate of $0.001964 per share per day during the year ended December 31, 2015 and the three months ended March 31, 2016. Distributions were based on daily record dates and calculated at a rate of $0.001958 per share per day during the nine months ended December 31, 2016. Each day during the period from January 1, 2016 through December 31, 2016 was a record date for distributions.
Distributions to stockholders are determined by the board of directors of the Company and are dependent upon a number of factors relating to the Company, including funds available for the payment of distributions, financial condition, the timing of property acquisitions, capital expenditure requirements and annual distribution requirements in order for the Company to qualify as a REIT under the Internal Revenue Code.
Operating Expenses
Pursuant to the Advisory Agreement, the Company is limited in the amount of certain operating expenses it may record on a rolling four-quarter basis to the greater of 2% of average invested assets and 25% of net income. Operating expenses include all costs and expenses incurred by the Company, as determined under GAAP, that in any way are related to the operation of the Company, excluding expenses of raising capital, interest payments, taxes, property operating expenses, non-cash expenditures, incentive fees, acquisition fees and expenses and investment management fees. During the four quarters ended December 31, 2016, the Company recorded operating expenses of $6,243,984, which is included in general and administrative expenses in the accompanying consolidated statements of operations. Operating expenses of $184,954 remain payable and are included in due to affiliates in the accompanying consolidated balance sheet as of December 31, 2016.
Income Taxes
The Company has elected to be taxed as a REIT under the Internal Revenue Code beginning with the tax year ended December 31, 2010. To qualify as a REIT, the Company must meet certain organizational and operational requirements, including the requirement to distribute at least 90% of the Company’s annual REIT taxable income to stockholders (which is computed without regard to the dividends paid deduction or net capital gain and which does not necessarily equal net income as calculated in accordance with GAAP). As a REIT, the Company generally will not be subject to federal income tax to the extent it distributes qualifying dividends to its stockholders. If the Company fails to qualify as a REIT in any taxable year, it will be subject to federal income tax on its taxable income at regular corporate income tax rates and generally will not be permitted to qualify for treatment as a REIT for federal income tax purposes for the four taxable years following the year during which qualification is lost, unless the Internal Revenue Service grants the Company relief under certain statutory provisions. Such an event could materially adversely affect the Company’s net income and net cash available for distribution to stockholders. However, the Company believes it is organized and operates in such a manner as to qualify for treatment as a REIT.
The Company follows the Income Taxes Topic of the ASC to recognize, measure, present and disclose in its accompanying consolidated financial statements uncertain tax positions that the Company has taken or expects to take on a tax return. As of December 31, 2016 and 2015, the Company had no liabilities for uncertain tax positions that it believes should be recognized in its accompanying consolidated financial statements. Due to uncertainty regarding the realization of certain deferred tax assets, the Company has established valuation allowances, primarily in connection with the net operating loss carryforward related to the REIT. The Company has not been assessed material interest or penalties by any major tax jurisdictions. The Company’s evaluation was performed for the tax years ended December 31, 2016 and 2015. As of December 31, 2016, the Company’s tax returns for calendar years 2015, 2014 and 2013 remain subject to examination by major tax jurisdictions.
Per Share Data
Basic earnings (loss) per share attributable to common stockholders for all periods presented are computed by dividing net income (loss) by the weighted average number of shares of the Company’s common stock outstanding during the period.
F-15
STEADFAST INCOME REIT, INC.
NOTES TO CONSOLIDATED FINANCIAL STATEMENTS - (Continued)
DECEMBER 31, 2016
Diluted earnings (loss) per share is computed based on the weighted average number of shares of the Company’s common stock and all potentially dilutive securities, if any. Distributions declared per common share assume each share was issued and outstanding each day during the period. Nonvested shares of the Company’s restricted common stock give rise to potentially dilutive shares of the Company’s common stock, but such shares were excluded from the computation of diluted earnings (loss) per share because such shares were anti-dilutive during the period.
In accordance with FASB ASC Topic 260-10-45, Earnings Per Share, the Company uses the two-class method to calculate earnings (loss) per share. Basic earnings (loss) per share is calculated based on dividends declared (“distributed earnings”) and the rights of common shares and participating securities in any undistributed earnings, which represents net income (loss) remaining after deduction of dividends declared during the period. The undistributed earnings (loss) are allocated to all outstanding common shares based on the relative percentage of each class of shares. The Company does not have any participating securities outstanding other than the shares of common stock and the unvested restricted common stock during the period presented. Earnings (loss) attributable to the unvested restricted common stock are deducted from earnings (loss) in the computation of per share amounts where applicable
Segment Disclosure
The Company has determined that it has one reportable segment with activities related to investing in multifamily properties. The Company’s investments in real estate are in different geographic regions, and management evaluates operating performance on an individual asset level. However, as each of the Company’s assets has similar economic characteristics, tenants and products and services, its assets have been aggregated into one reportable segment.
Recent Accounting Pronouncements
In May 2014, the FASB issued ASU 2014-09, Revenue from Contracts with Customers (Topic 606). The new guidance requires an entity to recognize the revenue to depict the transfer of promised goods or services to customers in an amount that reflects the consideration to which the entity expects to be entitled in exchange for those goods and services. The new guidance supersedes the revenue requirements in Revenue Recognition (Topic 605) and most industry-specific guidance throughout the Industry Topics of the Codification. The new guidance does not apply to lease contracts within the scope of Leases (Topic 840). In August 2015, the FASB issued ASU 2015-14, Revenue from Contracts with Customers (Topic 606), which delayed the effective date of the new guidance by one year, which will result in the new guidance being effective for fiscal years, and interim periods within those years, beginning after December 15, 2017, and is to be applied retrospectively. Early adoption is permitted, but can be no earlier than the original public entity effective date of fiscal years, and interim periods within those years, beginning after December 15, 2016. The Company anticipates selecting the modified retrospective transition method with a cumulative effect recognized as of the date of adoption and will adopt the new standard effective January 1, 2018. The Company is continuing to evaluate the standard; however, the Company does not expect its adoption to have a material impact on the consolidated financial statements, as rental income from leasing arrangements is specifically excluded from the standard.
In August 2014, the FASB issued ASU 2014-15, Disclosure of Uncertainties about an Entity’s Ability to Continue as a Going Concern, that requires management to evaluate whether there are conditions and events that raise substantial doubt about an entity’s ability to continue as a going concern. Until now, the requirement to perform a going concern evaluation existed only in auditing standards. The new guidance requires management to evaluate relevant conditions, events and certain management plans that are known or reasonably knowable as of the evaluation date when determining whether substantial doubt about an entity’s ability to continue as a going concern exists. Management will be required to make this evaluation for both annual and interim reporting periods. The standard states substantial doubt about an entity’s ability to continue as a going concern exists when relevant conditions and events, considered in the aggregate, indicate that it is probable that the entity will be unable to meet its obligations as they become due within one year after the date that the financial statements are issued. The guidance is effective for annual periods ending after December 15, 2016 and for annual periods and interim periods thereafter. Early adoption is permitted. The Company did not experience a material impact from adopting this new guidance.
F-16
STEADFAST INCOME REIT, INC.
NOTES TO CONSOLIDATED FINANCIAL STATEMENTS - (Continued)
DECEMBER 31, 2016
In January 2015, the FASB issued ASU 2015-01, Simplifying Income Statement Presentation by Eliminating the Concept of Extraordinary Items, that eliminates the concept of the extraordinary items from GAAP. The objective of the new guidance is to simplify the income statement presentation requirements of GAAP by altogether removing the concept of extraordinary items from consideration. The guidance is effective for annual periods, including interim periods within that period, beginning after December 15, 2015. The Company did not experience a material impact from adopting this new guidance.
In February 2015, the FASB issued ASU 2015-02, Consolidation, which makes changes to both the variable interest model and the voting model of consolidation. Under ASU 2015-02, companies will need to re-evaluate whether an entity meets the criteria to be considered a variable interest entity (“VIE”) or whether the consolidation of an entity should be assessed under the voting model. The new standard specifically eliminates the presumption in the current voting model that a general partner controls a limited partnership or similar entity unless that presumption can be overcome. The new standard was effective for the Company beginning on January 1, 2016. The adoption of the new standard did not result in the consolidation of entities not previously consolidated or the deconsolidation of any entities previously consolidated. Upon adopting the new standard, the Operating Partnership became a VIE as the limited partner lacks substantive kick-out rights and substantive participating rights. The Company is the primary beneficiary of, and continues to consolidate, the Operating Partnership determined to be a VIE.
In April 2015, the FASB issued ASU 2015-03, Simplifying the Presentation of Debt Issuance Costs, as amended in August 2015 by ASU 2015-15, Presentation and Subsequent Measurement of Debt Issuance Costs Associated with Line-of-Credit Arrangements, that will require that debt issuance costs be presented in the balance sheet as a direct deduction from the carrying amount of debt liability, consistent with debt discounts or premiums. The FASB will permit debt issuance costs related to line-of-credit arrangements to be deferred and presented as an asset and subsequently amortized over the term of the line-of-credit arrangement, regardless of whether there are any outstanding borrowings on the line-of-credit arrangement. The recognition and measurement guidance for debt issuance costs will not be affected by the new guidance. The guidance requires retrospective application and is effective for annual periods, including interim periods within that period, beginning after December 15, 2015. Early adoption is permitted. Upon adoption, the Company reclassified net debt issuance costs of $8,846,909 and $6,697,472 as of December 31, 2016 and 2015, respectively, related to mortgage notes payable from other assets, net to mortgage notes payable, net on the consolidated balance sheets.
In February 2016, the FASB issued ASU 2016-02, Leases, amending the existing accounting standards for lease accounting, including requiring lessees to recognize most leases on their balance sheets and making targeted changes to lessor accounting. The new standard requires a modified retrospective transition approach for all leases existing at, or entered into after, the date of initial application, with an option to use certain transition relief. The new standard requires lessors to account for leases using an approach that is substantially equivalent to existing guidance for sales-type leases, direct financing leases and operating leases. The guidance will be effective in the first quarter of 2019 and allows for early adoption. The Company is continuing to evaluate the standard; however, we do not expect its adoption to have a material impact on the consolidated financial statements, as lessor accounting for leases will be substantially equivalent to existing guidance.
In March 2016, the FASB issued ASU 2016-09, Compensation - Stock Compensation (Topic 718), Improvements to Employee Share-Based Payment Accounting, that simplifies several aspects of the accounting for employee share-based payment transactions for both public and nonpublic entities, including the accounting for income taxes, forfeitures and statutory tax withholding requirements, as well as classification in the statement of cash flows. The guidance is effective for annual reporting periods beginning after December 15, 2016, and interim periods within those years. The Company is currently evaluating the impact of this guidance.
In August 2016, the FASB issued ASU 2016-15, Statement of Cash Flows (Topic 230), Classification of Certain Cash Receipts and Cash Payments (a consensus of the Emerging Issues Task Force), that clarifies how certain cash receipts and cash payments should be classified on the statement of cash flows. This ASU addresses eight specific cash flow issues with the objective of reducing the existing diversity in practice. The guidance is effective for annual reporting periods beginning after December 15, 2017, and interim periods within those years. Early adoption is permitted. Upon adoption, the Company reclassified payments for debt extinguishment costs of $3,202,337, $0 and $1,794,001 from cash flows from operating activities to cash flows from financing activities as of December 31, 2016, 2015 and 2014, respectively.
F-17
STEADFAST INCOME REIT, INC.
NOTES TO CONSOLIDATED FINANCIAL STATEMENTS - (Continued)
DECEMBER 31, 2016
In November 2016, the FASB issued ASU No. 2016-18, Statement of Cash Flows (Topic 230): Restricted Cash (“ASU No. 2016-18”). ASU No. 2016-18 requires that a statement of cash flows explain the change during the period in the total of cash, cash equivalents, restricted cash and restricted cash equivalents. Therefore, amounts generally described as restricted cash should be included with cash and cash equivalents when reconciling the beginning of period and end of period total amounts shown on the statement of cash flows. ASU No. 2016-18 is effective for annual periods beginning after December 15, 2017, including interim periods within those fiscal years. Early adoption is permitted. The Company is currently evaluating the impact this guidance will have on its consolidated financial statements and related disclosures.
In January 2017, the FASB issued ASU 2017-01, Business Combinations (Topic 805): Clarifying the definition of business, that clarifies the definition of a business with the objective of adding guidance to assist entities with evaluating whether transactions should be accounted for as acquisitions (or disposals) of businesses. This ASU provides a screen to determine when a set is not a business. If the screen is not met, it (1) requires that to be considered a business, a set must include, at a minimum, an input and a substantive process that together significantly contribute to the ability to create output and (2) removes the evaluation of whether a market participant could replace the missing elements. The guidance is effective for annual reporting periods beginning after December 15, 2017, and interim periods within those years. Early adoption is permitted. The Company does not expect there to be a material impact from adopting this new guidance.
3. | Real Estate |
As of December 31, 2016, the Company owned 65 multifamily properties, encompassing in the aggregate 16,709 residential apartment homes and 25,973 square feet of rentable commercial space. The total purchase price of the Company’s real estate portfolio, including development and construction costs for apartment homes constructed by the Company, was $1,644,177,333. As of December 31, 2016 and 2015, the Company’s portfolio was approximately 93.5% and 94.0% occupied and the average monthly rent was $1,026 and $999, respectively.
As of December 31, 2016 and 2015, accumulated depreciation and amortization related to the Company’s consolidated real estate properties and related intangibles were as follows:
December 31, 2016 | ||||||||||||||||||||
Assets | ||||||||||||||||||||
Land | Building and Improvements | Other Intangible Assets | Construction-in-Progress | Total Real Estate | ||||||||||||||||
Investments in real estate | $ | 174,102,422 | $ | 1,517,532,273 | $ | 2,644,263 | $ | — | $ | 1,694,278,958 | ||||||||||
Less: Accumulated depreciation and amortization | — | (232,198,052 | ) | (546,031 | ) | — | (232,744,083 | ) | ||||||||||||
Net investments in real estate and related lease intangibles | $ | 174,102,422 | $ | 1,285,334,221 | $ | 2,098,232 | $ | — | $ | 1,461,534,875 | ||||||||||
December 31, 2015 | ||||||||||||||||||||
Assets | ||||||||||||||||||||
Land | Building and Improvements | Other Intangible Assets | Construction-in-Progress | Total Real Estate | ||||||||||||||||
Investments in real estate | $ | 174,102,422 | $ | 1,487,961,762 | $ | 2,644,263 | $ | 2,192,635 | $ | 1,666,901,082 | ||||||||||
Less: Accumulated depreciation and amortization | — | (163,053,124 | ) | (392,863 | ) | — | (163,445,987 | ) | ||||||||||||
Net investments in real estate and related lease intangibles | $ | 174,102,422 | $ | 1,324,908,638 | $ | 2,251,400 | $ | 2,192,635 | $ | 1,503,455,095 | ||||||||||
Depreciation and amortization expenses were $69,513,484, $65,640,196 and $69,681,177 for the years ended December 31, 2016, 2015 and 2014, respectively.
Depreciation of the Company’s buildings and improvements was $69,360,316, $65,271,243 and $59,014,085 for the years ended December 31, 2016, 2015 and 2014, respectively.
F-18
STEADFAST INCOME REIT, INC.
NOTES TO CONSOLIDATED FINANCIAL STATEMENTS - (Continued)
DECEMBER 31, 2016
Amortization of the Company’s tenant origination and absorption costs was $0, $215,786 and $10,513,924 for the years ended December 31, 2016, 2015 and 2014, respectively. Tenant origination and absorption costs had a weighted-average amortization period as of the date of acquisition of less than one year. At December 31, 2015, all tenant origination and absorption costs were fully amortized and written off.
Amortization of the Company’s other intangible assets was $153,168, $153,167 and $153,168 for the years ended December 31, 2016, 2015 and 2014, respectively. Other intangible assets had a weighted-average amortization period as of the date of acquisition of 18.17 years.
The increase in rental income as a result of the accretion of the Company’s below-market lease intangible liabilities for the years ended December 31, 2016, 2015 and 2014 was $0, $0 and $163,237, respectively. The Company’s below-market lease intangible liabilities had a weighted-average accretion period as of the date of acquisition of less than one year.
The future amortization of the Company’s acquired other intangible assets as of December 31, 2016 and thereafter is as follows:
2017 | $ | 153,168 | |
2018 | 153,168 | ||
2019 | 153,168 | ||
2020 | 153,168 | ||
2021 | 153,168 | ||
Thereafter | 1,332,392 | ||
$ | 2,098,232 | ||
Operating Leases
As of December 31, 2016, the Company’s real estate portfolio comprised 16,709 residential apartment homes and was 95.4% leased by a diverse group of residents. For the years ended December 31, 2016 and 2015, the Company’s real estate portfolio earned approximately 99% and 1% of its rental income from residential tenants and commercial office tenants, respectively. The residential tenant lease terms consist of lease durations equal to 12 months or less. The commercial office tenant leases consist of lease durations varying from 2.41 to 8.25 years.
Some residential and commercial leases contain provisions to extend the lease agreements, options for early termination after paying a specified penalty and other terms and conditions as negotiated. The Company retains substantially all of the risks and benefits of ownership of the real estate assets leased to tenants. Generally, upon the execution of a lease, the Company requires security deposits from tenants in the form of a cash deposit and/or a letter of credit for commercial tenants. Amounts required as security deposits vary depending upon the terms of the respective leases and the creditworthiness of the tenant, but generally are not significant amounts. Therefore, exposure to credit risk exists to the extent that a receivable from a tenant exceeds the amount of its security deposit. Security deposits received in cash related to tenant leases are included in accounts payables and accrued liabilities in the accompanying consolidated balance sheets and totaled $5,047,792 and $4,672,961 as of December 31, 2016 and 2015, respectively.
F-19
STEADFAST INCOME REIT, INC.
NOTES TO CONSOLIDATED FINANCIAL STATEMENTS - (Continued)
DECEMBER 31, 2016
The future minimum rental receipts from the Company’s properties under non-cancelable operating leases attributable to commercial office tenants as of December 31, 2016 and thereafter is as follows:
2017 | $ | 238,140 | |
2018 | 259,143 | ||
2019 | 180,858 | ||
2020 | 74,313 | ||
2021 | 76,535 | ||
Thereafter | 264,345 | ||
$ | 1,093,334 | ||
As of December 31, 2016 and 2015, no tenant represented over 10% of the Company’s annualized base rent and there were no significant industry concentrations with respect to its commercial leases.
4. | Other Assets, Net |
As of December 31, 2016 and 2015, other assets, net of accumulated amortization, consisted of:
December 31, | |||||||
2016 | 2015 | ||||||
Deferred financing costs | $ | — | $ | 660,585 | |||
Less: accumulated amortization | — | (547,402 | ) | ||||
— | 113,183 | ||||||
Prepaid expenses | 3,041,353 | 2,648,238 | |||||
Interest rate cap agreements (Note 11) | 618,841 | 298,143 | |||||
Other deposits | 1,126,568 | 1,269,287 | |||||
Other assets, net | $ | 4,786,762 | $ | 4,328,851 | |||
F-20
STEADFAST INCOME REIT, INC.
NOTES TO CONSOLIDATED FINANCIAL STATEMENTS - (Continued)
DECEMBER 31, 2016
5. | Debt |
Mortgage Notes Payable
The following is a summary of mortgage notes payable secured by real property as of December 31, 2016 and 2015:
December 31, 2016 | ||||||||||||||||||
Interest Rate Range | Weighted Average Interest Rate | |||||||||||||||||
Type | Number of Instruments | Maturity Date Range | Minimum | Maximum | Principal Outstanding | |||||||||||||
Mortgage notes payable - fixed | 37 | 10/1/2017 - 10/1/2056 | 3.19 | % | 5.94 | % | 4.06 | % | $ | 471,344,145 | ||||||||
Mortgage notes payable - variable(1) | 21 | 8/31/2017 - 1/1/2026 | 1-Mo LIBOR + 1.65% | 1-Mo LIBOR + 2.65% | 3.05 | % | 517,885,675 | |||||||||||
Total mortgage notes payable | 58 | 3.52 | % | 989,229,820 | ||||||||||||||
Premium, net(2) | 2,208,619 | |||||||||||||||||
Deferred financing costs, net(3) | (6,358,285 | ) | ||||||||||||||||
Total mortgage notes payable, net | $ | 985,080,154 | ||||||||||||||||
December 31, 2015 | ||||||||||||||||||
Interest Rate Range | Weighted Average Interest Rate | |||||||||||||||||
Type | Number of Instruments | Maturity Date Range | Minimum | Maximum | Principal Outstanding | |||||||||||||
Mortgage notes payable - fixed | 37 | 10/1/2017 - 1/1/2053 | 3.31 | % | 5.94 | % | 4.32 | % | $ | 477,139,001 | ||||||||
Mortgage notes payable - variable(1) | 30 | 5/16/2017 - 1/1/2026 | 1-Mo LIBOR + 1.62% | 1-Mo LIBOR + 2.75% | 2.77 | % | 641,859,365 | |||||||||||
Total mortgage notes payable | 67 | 3.44 | % | 1,118,998,366 | ||||||||||||||
Premium/discount, net(2) | 3,452,005 | |||||||||||||||||
Deferred financing costs, net(3) | (6,697,472 | ) | ||||||||||||||||
Total mortgage notes payable, net | $ | 1,115,752,899 | ||||||||||||||||
_______________
(1) | See Note 11 for a discussion of the interest rate cap agreements used to manage the exposure to interest rate movement on the Company’s variable rate loans. |
F-21
STEADFAST INCOME REIT, INC.
NOTES TO CONSOLIDATED FINANCIAL STATEMENTS - (Continued)
DECEMBER 31, 2016
(2) | The following table summarizes the debt premiums and discounts as of December 31, 2016, including the unamortized portion included in the principal balance as well as amounts amortized as an offset to interest expense in the accompanying consolidated statements of operations: |
Unamortized Portion of Net Debt Premium as of December 31, 2016 | Amortization of Net Debt Premium During the Years Ended December 31, | |||||||||||||
2016 | 2015 | 2014 | ||||||||||||
$ | 2,208,619 | $ | 1,243,385 | $ | 1,234,793 | $ | 1,234,793 | |||||||
(3) | The following table summarizes the deferred financing costs, net related to mortgage notes payable as of December 31, 2016 and December 31, 2015: |
December 31, | ||||||||
2016 | 2015 | |||||||
Deferred financing costs | $ | 10,104,244 | $ | 10,140,097 | ||||
Less: accumulated amortization | (3,745,959 | ) | (3,442,625 | ) | ||||
Deferred financing costs, net | $ | 6,358,285 | $ | 6,697,472 | ||||
Refinancing Transactions
On June 29 and June 30, 2016, 14 wholly-owned subsidiaries of the Company terminated the existing mortgage loans with their respective lenders for an aggregate principal amount of $283,313,677 and entered into new loan agreements (each a “Loan Agreement”) with, as applicable, PNC Bank, National Association (“PNC Bank”) and Berkeley Point Capital LLC (“Berkeley” and, together with PNC Bank, the “Lenders”) for an aggregate principal amount of $358,002,000 (the “June Refinancing Transactions”). On July 29, 2016, nine wholly-owned subsidiaries of the Company also entered into a credit agreement (the “Credit Agreement”) with PNC Bank in connection with the refinancing of certain additional mortgage loans as further detailed below. Further, on August 30, 2016 and September 29, 2016, three wholly-owned subsidiaries of the Company terminated the existing mortgage loans with an aggregate principal amount of $61,575,025 and entered into new mortgage notes for an aggregate principal amount of $63,620,600 (together with the June Refinancing Transactions, the “Refinancing Transactions”).
In the June Refinancing Transactions, each Loan Agreement was made pursuant to the Freddie Mac Capital Markets Execution Program (the “CME”), as evidenced by a multifamily note. Pursuant to the CME, the applicable Lender originates the mortgage loan and then transfers the loan to the Federal Home Loan Mortgage Association. Each Loan Agreement provides for a term loan with a maturity date of July 1, 2023, unless the maturity date is accelerated in accordance with its terms. Each loan accrues interest at one-month LIBOR plus 2.31%. The entire outstanding principal balance and any accrued and unpaid interest on each of the Loans are due on the maturity date. Interest and principal payments on the loans are payable monthly in arrears on specified dates as set forth in each Loan Agreement. Monthly payments are due and payable on the first day of each month, commencing August 1, 2016.
Revolving Credit Facility
The Company entered into a revolving credit facility with PNC Bank to borrow up to $20,000,000. On July 18, 2014, the Company and PNC Bank amended the revolving credit facility to, among other things, increase the potential borrowing limit from $20,000,000 to $35,000,000. The amended and restated credit facility consisted of a Tranche A and a Tranche B, and provided certain security for borrowings under the credit facility. The maximum amounts that could be borrowed under Tranche A and Tranche B were $20,000,000 and $15,000,000, respectively.
F-22
STEADFAST INCOME REIT, INC.
NOTES TO CONSOLIDATED FINANCIAL STATEMENTS - (Continued)
DECEMBER 31, 2016
For each advance under the amended and restated revolving credit facility, the Company had the option to select the interest rate from the following options: (1) Base Rate Option (as defined in the amended and restated credit facility) plus (i) with respect to Tranche A, 0.75% and (ii) with respect to Tranche B, 2.0%; or (2) LIBOR Option, which was a rate per annum fixed for the LIBOR Interest Period (as defined in the amended and restated credit facility) equal to the sum of LIBOR plus (i) with respect to Tranche A, 1.6% and (ii) with respect to Tranche B, 3.0%. The Company elected for each draw the LIBOR Option. Additionally, the Company incurred a commitment fee equal to 0.25% of the average daily difference between the $35,000,000 maximum available balance and the aggregate outstanding principal balance.
No amounts were outstanding under the revolving credit facility as of December 31, 2016 or December 31, 2015. The amended and restated revolving credit facility had a maturity date of July 17, 2016, subject to extension. On June 30, 2016, the Company repaid all outstanding amounts due and terminated the amended and restated revolving credit facility.
Credit Facility
On July 29, 2016, nine wholly-owned subsidiaries of the Company entered into the Credit Agreement and a multifamily note with PNC Bank (the Credit Agreement, Loan and Security Agreements, Mortgages and Guaranty, collectively referred to herein as the “Loan Documents”) that provide for a new credit facility in an amount not to exceed $350,000,000 to refinance certain of the Company’s existing mortgage loans. The credit facility has a maturity date of August 1, 2021, subject to extension, as further described in the Credit Agreement. Advances made under the credit facility are secured by the properties set out in the schedule below (the “Collateral Pool Property”), pursuant to a mortgage deed of trust with the nine wholly-owned subsidiaries of the Company in favor of PNC Bank.
The credit facility accrues interest at the one-month LIBOR plus (1) the servicing spread of 0.05% and (2) the net spread, based on the debt service coverage ratio, of between 1.73% and 1.93%, as further described in the Credit Agreement. The entire outstanding principal balance and any accrued and unpaid interest on the credit facility are due on the maturity date. Interest only payments on the credit facility are payable monthly in arrears and are due and payable on the first day of each month, commencing September 1, 2016. The Company’s nine wholly-owned subsidiaries may voluntarily prepay all or a portion of the amounts advanced under the Loan Documents. Notwithstanding the foregoing, in the event a Collateral Pool Property is released or the Credit Agreement is terminated, a termination fee is due and payable by the Company’s nine wholly-owned subsidiaries. In certain instances of a breach of the Credit Agreement, the Company guarantees to PNC Bank the full and prompt payment and performance when due of all amounts for which the Company’s nine wholly-owned subsidiaries are personally liable under the Loan Documents, in addition to all costs and expenses incurred by PNC Bank in enforcing such guaranty. The Company paid loan origination fees to PNC Bank of $1,293,186, and the Advisor earned a refinancing fee of $1,175,624.
F-23
STEADFAST INCOME REIT, INC.
NOTES TO CONSOLIDATED FINANCIAL STATEMENTS - (Continued)
DECEMBER 31, 2016
As of December 31, 2016, the advances obtained under the credit facility on July 29, 2016 are summarized in the following table:
Collateralized Property(1) | Amount of Advance | |||
Ashley Oaks Apartment Homes | $ | 24,867,500 | ||
Trails at Buda Ranch | 21,025,000 | |||
Deer Valley Apartments | 22,982,500 | |||
Carrington Park at Huffmeister | 20,430,500 | |||
Carrington Place | 27,535,500 | |||
Carrington at Champion Forest | 25,121,250 | |||
Audubon Park Apartments | 16,602,500 | |||
Oak Crossing | 17,980,000 | |||
Meritage at Steiner Ranch | 58,580,000 | |||
$ | 235,124,750 | |||
Deferred financing costs, net on credit facility(2) | (2,488,624 | ) | ||
Credit facility, net | $ | 232,636,126 | ||
___________
(1) | Each property is pledged as collateral for repayment of all amounts advanced under the credit facility. |
(2) | Accumulated amortization related to deferred financing costs for the credit facility as of December 31, 2016, was $433,522. |
Maturity and Interest
The following is a summary of the Company’s aggregate maturities as of December 31, 2016:
Maturities During the Years Ending December 31, | ||||||||||||||||||||||||||||
Contractual Obligation | Total | 2017 | 2018 | 2019 | 2020 | 2021 | Thereafter | |||||||||||||||||||||
Principal payments on outstanding debt obligations(1) | $ | 1,224,354,570 | $ | 50,172,191 | $ | 76,235,702 | $ | 89,447,884 | $ | 101,538,337 | $ | 279,271,221 | $ | 627,689,235 | ||||||||||||||
________________
(1) | Projected principal payments on outstanding debt obligations are based on the terms of the notes payable agreements. Amounts exclude the amortization of the deferred financing costs and debt premiums associated with certain notes payable. |
The Company’s notes payable contain customary financial and non-financial debt covenants. As of December 31, 2016 and 2015, the Company was in compliance with all financial and non-financial debt covenants.
For the years ended December 31, 2016, 2015 and 2014, the Company incurred interest of $40,631,593, $39,302,938 and $40,412,744, respectively. Interest expense for the years ended December 31, 2016, 2015 and 2014 includes amortization of deferred financing costs of $1,723,186, $1,553,718 and $1,489,834, amortization of loan premiums and discounts of $1,243,385, $1,234,793 and $1,234,793, net unrealized (gain) loss from the change in fair value of interest rate cap agreements of $(61,698), $2,032,746 and $4,353,301, and capitalized interest of $80,166, $153,920 and $41,898, respectively. The capitalized interest is included in real estate on the consolidated balance sheets.
F-24
STEADFAST INCOME REIT, INC.
NOTES TO CONSOLIDATED FINANCIAL STATEMENTS - (Continued)
DECEMBER 31, 2016
Interest expense of $3,444,162 and $2,932,922 was payable as of December 31, 2016 and 2015, respectively, and is included in accounts payable and accrued liabilities in the accompanying consolidated balance sheets.
6. | Stockholders’ Equity |
General
Under the Company’s Third Articles of Amendment and Restatement (the “Charter”), the total number of shares of capital stock authorized for issuance is 1,100,000,000 shares, consisting of 999,999,000 shares of common stock with a par value of $0.01 per share, 1,000 shares of convertible stock with a par value of $0.01 per share and 100,000,000 shares designated as preferred stock with a par value of $0.01 per share.
Common Stock
The shares of the Company’s common stock entitle the holders to one vote per share on all matters upon which stockholders are entitled to vote, to receive dividends and other distributions as authorized by the Company’s board of directors in accordance with the Maryland General Corporation Law and to all rights of a stockholder pursuant to the Maryland General Corporation Law. The common stock has no preferences or preemptive, conversion or exchange rights.
During 2009, the Company issued 22,223 shares of common stock to the Sponsor for $200,007. From inception through December 31, 2016, the Company had issued 76,732,395 shares of common stock in its Private Offering and Public Offering for offering proceeds of $679,572,220, net of offering costs of $95,845,468, including 4,073,759 shares of common stock pursuant to the DRP, for total proceeds of $39,580,847. Offering costs primarily consisted of selling commissions and dealer manager fees. The Company terminated its Public Offering on December 20, 2013, but continued to offer shares pursuant to the DRP through November 30, 2014.
The issuance and vesting activity for the years ended December 31, 2016, 2015 and 2014 for the restricted stock issued to the Company’s independent directors as compensation for services in connection with their initial election or re-election to the board of directors at the Company’s annual meeting, upon their departure from the board of directors, or in appreciation of their service and commitment to the Company is as follows:
2016 | 2015 | 2014 | |||||||
Nonvested shares at the beginning of the year | 11,250 | 16,875 | 18,750 | ||||||
Granted shares | 7,500 | 14,000 | 10,000 | ||||||
Vested shares | (6,875 | ) | (19,625 | ) | (11,875 | ) | |||
Nonvested shares at the end of the year | 11,875 | 11,250 | 16,875 | ||||||
The weighted average fair value of restricted stock issued to the Company’s independent directors for the years ended December 31, 2016, 2015 and 2014 is as follows:
Grant Year | Weighted Average Fair Value | |||
2014 | $ | 10.24 | ||
2015 | 10.35 | |||
2016 | 11.44 | |||
F-25
STEADFAST INCOME REIT, INC.
NOTES TO CONSOLIDATED FINANCIAL STATEMENTS - (Continued)
DECEMBER 31, 2016
The shares of restricted common stock vest and become non-forfeitable in four equal annual installments beginning on the date of grant and ending on the third anniversary of the date of grant and will become fully vested and become non-forfeitable on the earlier to occur of (1) the termination of the independent director’s service as a director due to his or her death or disability, or (2) a change in control of the Company and as otherwise provided in the Incentive Award Plan, as defined below.
Included in general and administrative expenses is $76,285, $184,350 and $118,145 for the years ended December 31, 2016, 2015 and 2014, respectively, for compensation expense related to the issuance of restricted common stock. The weighted average remaining vesting term of the restricted common stock is 1.72 years as of December 31, 2016. As of December 31, 2016, the compensation expense related to the issuance of the restricted common stock not vested was $105,111.
On June 11, 2014, the Company entered into a restricted stock agreement with the Advisor whereby the Company issued to the Advisor 488,281.25 restricted shares of the Company’s common stock at a fair market value of $10.24 per share in satisfaction of certain deferred fees due to the Advisor in the aggregate amount of $5,000,000. Pursuant to the restricted stock agreement, the shares of restricted stock vested and became non-forfeitable 50% at December 31, 2015 and 50% at December 31, 2016. The fair value of the vested common stock as of December 31, 2016 and 2015 of $5,637,207 and $5,493,164, respectively, are recorded in stockholders’ equity in the accompanying consolidated balance sheets. Included in general and administrative expenses on the accompanying consolidated statements of operations is $312,353 and $300,440 for the years ended December 31, 2016 and 2015 for the change in value of restricted common stock issued to the Advisor. No such amounts were incurred for the year ended December 31, 2014.
Convertible Stock
The Company issued 1,000 shares of Convertible Stock to the Advisor for $1,000. The Convertible Stock will convert into shares of the Company’s common stock if and when: (A) the Company has made total distributions on the then outstanding shares of common stock equal to the original issue price of those shares plus an 8.0% cumulative, non-compounded, annual return on the original issue price of those shares, (B) subject to specified conditions, the Company lists the common stock for trading on a national securities exchange or (C) the Advisory Agreement is terminated or not renewed by the Company (other than for “cause” as defined in the Advisory Agreement). A “listing” will also be deemed to have occurred on the effective date of any merger of the Company in which the consideration received by the holders of the Company’s common stock is the securities of another issuer that are listed on a national securities exchange. Upon conversion, each share of Convertible Stock will convert into a number of shares of common stock equal to 1/1000 of the quotient of (A) 10% of the amount, if any, by which (1) the Company’s “enterprise value” (as defined in the Charter) plus the aggregate value of distributions paid to date on the outstanding shares of common stock exceeds (2) the aggregate purchase price paid by the stockholders for those shares plus an 8.0% cumulative, non-compounded, annual return on the original issue price of those shares, divided by (B) the Company’s enterprise value divided by the number of outstanding shares of common stock, in each case calculated as of the date of the conversion. In the event of a termination or non-renewal of the Advisory Agreement by the Company for cause, the Convertible Stock will be redeemed by the Company for $1.00.
Preferred Stock
The Charter also provides the Company’s board of directors with the authority to issue one or more classes or series of preferred stock, and prior to the issuance of such shares of preferred stock, the board of directors shall have the power from time to time to classify or reclassify, in one or more series, any unissued shares and designate the preferences, rights and privileges of such shares of preferred stock. The Company’s board of directors is authorized to amend the Charter, without the approval of the stockholders, to increase the aggregate number of authorized shares of capital stock or the number of shares of any class or series that the Company has authority to issue. As of December 31, 2016 and 2015, no shares of the Company’s preferred stock were issued and outstanding.
Distribution Reinvestment Plan
The Company’s board of directors had approved the DRP through which common stockholders could elect to reinvest an amount equal to the distributions declared on their shares of common stock in additional shares of the Company’s common stock in lieu of receiving cash distributions. The initial purchase price per share under the DRP was $9.50. Effective September
F-26
STEADFAST INCOME REIT, INC.
NOTES TO CONSOLIDATED FINANCIAL STATEMENTS - (Continued)
DECEMBER 31, 2016
10, 2012, shares of the Company’s common stock were issued pursuant to the DRP at a price of $9.73 per share. Effective with distributions earned beginning on December 1, 2014, the Company’s board of directors elected to suspend the DRP. As a result, all distributions are paid in cash and not reinvested in shares of the Company’s common stock. The Company’s board of directors may, in its sole discretion, from time to time, reinstate the DRP, although there is no assurance as to if or when this will happen, and change the DRP price based upon changes in the Company’s estimated value per share and other factors that the Company’s board of directors deems relevant.
No sales commissions or dealer manager fees were payable on shares sold through the DRP.
Share Repurchase Program and Redeemable Common Stock
The Company’s share repurchase program may provide an opportunity for stockholders to have their shares of common stock repurchased by the Company, subject to certain restrictions and limitations. No shares can be repurchased under the Company’s share repurchase program until after the first anniversary of the date of purchase of such shares; provided, however, that this holding period shall not apply to repurchases requested within two years after the death or disability of a stockholder.
The purchase price for shares repurchased under the Company’s share repurchase program is as follows:
Share Purchase Anniversary | Repurchase Price on Repurchase Date(1) | |
Less than 1 year | No Repurchase Allowed | |
1 year | 92.5% of Estimated Value per Share(2) | |
2 years | 95.0% of Estimated Value per Share(2) | |
3 years | 97.5% of Estimated Value per Share(2) | |
4 years | 100.0% of Estimated Value per Share(2) | |
In the event of a stockholder’s death or disability(3) | Average Issue Price for Shares(4) | |
________________
(1) | As adjusted for any stock dividends, combinations, splits, recapitalizations or any similar transaction with respect to the shares of common stock. |
(2) | For purposes of the share repurchase program, the “Estimated Value per Share” will equal the most recently determined Estimated Value per Share. |
(3) | The required one year holding period to be eligible to redeem shares under the Company’s share repurchase program does not apply in the event of death or disability of a stockholder. |
(4) | The purchase price per share for shares redeemed upon the death or disability of a stockholder will be equal to the average issue price per share for all of the stockholder’s shares. |
The purchase price per share for shares repurchased pursuant to the share repurchase program is further reduced by the aggregate amount of net proceeds per share, if any, distributed to the Company’s stockholders prior to the repurchase date as a result of the sale of one or more of the Company’s assets that constitutes a return of capital distribution as a result of such sales.
Repurchases of shares of the Company’s common stock are made quarterly upon written request to the Company at least 15 days prior to the end of the applicable quarter during which the share repurchase program is in effect. Repurchase requests are honored approximately 30 days following the end of the applicable quarter (the “Repurchase Date”). Stockholders may withdraw their repurchase request at any time up to three business days prior the end of the applicable quarter. On October 21, 2014, the Company’s board of directors elected to suspend the Company’s share repurchase program, effective November 20, 2014. On May 12, 2015, the Company’s board of directors elected to reinstate the share repurchase program effective July 1, 2015.
F-27
STEADFAST INCOME REIT, INC.
NOTES TO CONSOLIDATED FINANCIAL STATEMENTS - (Continued)
DECEMBER 31, 2016
During the year ended December 31, 2016, the Company redeemed a total of 479,147 shares with a total redemption value of $5,000,000 and received net requests for the redemption of 1,335,407 shares with a total redemption value of $14,625,190. During the year ended December 31, 2015, the Company redeemed a total of 197,989 shares with a total redemption value of $2,000,000 and received net requests for the redemption of 652,066 shares with a total redemption value of $6,562,585.
The Company cannot guarantee that the funds set aside for the share repurchase program will be sufficient to accommodate all repurchase requests made in any quarter. In the event that the redemption requests exceed the Company’s restrictions on limitation or the Company does not have sufficient funds available to repurchase all of the shares of the Company’s common stock for which repurchase requests have been submitted in any quarter, priority will be given to redemption requests in the case of the death or disability of a stockholder. If the Company repurchases less than all of the shares subject to a repurchase request in any quarter, with respect to any shares which have not been repurchased, the requesting stockholder could (1) withdraw the request for repurchase or (2) ask that the Company honor the request in a future quarter, if any, when such repurchases may be made pursuant to the limitations of the share repurchase program and when sufficient funds were available. Such pending requests would be honored among all requests for redemptions in any given redemption period as follows: first, pro rata as to redemptions sought upon a stockholder’s death or disability; and, next, pro rata as to other redemption requests.
The Company is not obligated to repurchase shares of the Company’s common stock under the share repurchase program. In no event shall redemptions under the share repurchase program exceed 5% of the weighted average number of shares of the Company’s common stock outstanding during the prior calendar year. Effective July 1, 2015, the Company’s board of directors determined to limit the amount of shares repurchased pursuant to the share repurchase program to an amount not to exceed $2,000,000 during the quarter beginning July 1, 2015, with each subsequent quarter not to exceed $1,000,000. On August 9, 2016, the Company’s board of directors approved and authorized an increase to the value of the shares that may be repurchased pursuant to the share repurchase program from $1,000,000 to $2,000,000 per quarter, effective on the October 2016 repurchase date. There is no fee in connection with a repurchase of shares of the Company’s common stock. As of December 31, 2016, the Company has recognized redemptions payable of $2,000,000, which is included in accounts payable and accrued expenses on the accompanying consolidated balance sheets.
In addition, the Company’s board of directors may, in its sole discretion, amend, suspend, or terminate the share repurchase program at any time upon 30 days notice to the Company’s stockholders if it determines that the funds available to fund the share repurchase program are needed for other business or operational purposes or that amendment, suspension or termination of the share repurchase program is in the best interest of the Company’s stockholders. Therefore, stockholders may not have the opportunity to make a repurchase request prior to any potential termination of the Company’s share repurchase program.
Distributions Declared
Distributions declared during 2016 (1) accrued daily to stockholders of record as of the close of business on each day, (2) were payable in cumulative amounts on or before the third day of each calendar month with respect to the prior month and (3) (i) for the three months ended March 31, 2016, were calculated at a rate of $0.001964 per share of common stock per day, which if paid each day over a 365-day period is equivalent to a 7.0% annualized distribution rate based on a purchase price of $10.24 per share of common stock, and (ii) for the nine months ended December 31, 2016, were calculated at a rate of $0.001958 per share per day, which if paid each day over a 366-day period is equivalent to a 7.0% annualized distribution rate based on a purchase price of $10.24 per share of common stock.
Distributions declared for the years ended December 31, 2016 and 2015 were $54,828,267 and $55,076,217, including $0 and $78, or 0 shares and 8 shares, respectively, of common stock issued pursuant to the DRP.
As of December 31, 2016 and 2015, $4,625,355 and $4,668,261 distributions declared were payable, none of which were reinvested pursuant to the DRP.
F-28
STEADFAST INCOME REIT, INC.
NOTES TO CONSOLIDATED FINANCIAL STATEMENTS - (Continued)
DECEMBER 31, 2016
Distributions Paid
For the years ended December 31, 2016 and 2015, the Company paid cash distributions of $54,871,173 and $55,087,333, which related to distributions declared for each day in the period from December 1, 2015 through November 30, 2016 and December 1, 2014 through November 30, 2015, respectively. Additionally, for the years ended December 31, 2016 and 2015, 0 and 8 shares of common stock were issued pursuant to the DRP for gross offering proceeds of $0 and $78, respectively. For the years ended December 31, 2016 and 2015, the Company paid total distributions of $54,871,173 and $55,087,411.
7. | Earnings (Loss) Per Share |
The following table presents a reconciliation of net loss attributable to common stockholders and shares used in calculating basic and diluted earnings (loss) per share, or EPS, for the years ended December 31, 2016, 2015 and 2014:
Years Ended December 31, | ||||||||||||
2016 | 2015 | 2014 | ||||||||||
Net loss attributable to the Company | $ | (25,579,651 | ) | $ | (13,024,358 | ) | $ | (25,742,292 | ) | |||
Less: dividends declared on participating securities | 183,805 | 360,446 | 203,990 | |||||||||
Net loss attributable to common stockholders | (25,763,456 | ) | (13,384,804 | ) | (25,946,282 | ) | ||||||
Weighted average common shares outstanding - basic and diluted | 76,195,083 | 76,335,114 | 75,450,215 | |||||||||
Loss per common share - basic and diluted | $ | (0.34 | ) | $ | (0.18 | ) | $ | (0.34 | ) | |||
The Company excluded all unvested restricted common shares outstanding issued to the Advisor and the Company’s independent directors from the calculation of diluted loss per common share as the effect would have been antidilutive.
8. | Related Party Arrangements |
The Company has entered into the Advisory Agreement with the Advisor. Pursuant to the Advisory Agreement, the Company is obligated to pay the Advisor specified fees upon the provision of certain services related to the investment of funds in real estate and real estate-related investments, the management of the Company’s investments and for other services (including, but not limited to, the disposition of investments). Subject to the limitations described below, the Company is also obligated to reimburse the Advisor and its affiliates for organization and offering costs incurred by the Advisor and its affiliates on behalf of the Company, and the Company is obligated to reimburse the Advisor and its affiliates for acquisition and origination expenses and certain operating expenses incurred on behalf of the Company or incurred in connection with providing services to the Company.
F-29
STEADFAST INCOME REIT, INC.
NOTES TO CONSOLIDATED FINANCIAL STATEMENTS - (Continued)
DECEMBER 31, 2016
Amounts attributable to the Advisor and its affiliates incurred (received) for the years ended December 31, 2016, 2015 and 2014 are as follows:
Incurred (Received) For the Year Ended December 31, | |||||||||||
2016 | 2015 | 2014 | |||||||||
Consolidated Statements of Operations: | |||||||||||
Expensed | |||||||||||
Investment management fees(1) | $ | 14,075,818 | $ | 13,854,825 | $ | 13,252,309 | |||||
Acquisition fees(1) | 960 | 187,735 | 3,251,400 | ||||||||
Acquisition expenses(2) | — | 7,145 | 587,513 | ||||||||
Property management | |||||||||||
Fees(1) | 6,406,479 | 6,188,525 | 5,802,772 | ||||||||
Reimbursement of onsite personnel(3) | 18,751,492 | 18,760,621 | 17,841,495 | ||||||||
Other fees(1) | 1,673,724 | 1,696,828 | 1,617,440 | ||||||||
Other fees - G&A(4) | 168,037 | — | — | ||||||||
Other operating expenses(4) | 1,232,493 | 1,346,002 | 980,195 | ||||||||
Disposition fees(5) | — | — | 463,688 | ||||||||
Refinancing fee(1) | 3,283,737 | — | — | ||||||||
Insurance proceeds(6) | (113,853 | ) | — | — | |||||||
Consolidated Balance Sheets: | |||||||||||
Capitalized | |||||||||||
Construction management | |||||||||||
Fees(7) | 1,493,999 | 1,618,438 | 1,391,360 | ||||||||
Reimbursement of labor costs(7) | 367,204 | 233,748 | 88,781 | ||||||||
Prepaid insurance deductible account(8) | 198,674 | 74,489 | — | ||||||||
Deferred financing costs(9) | 139,229 | — | — | ||||||||
$ | 47,677,993 | $ | 43,968,356 | $ | 45,276,953 | ||||||
(1) | Included in fees to affiliates in the accompanying consolidated statements of operations. |
(2) | Included in acquisition costs in the accompanying consolidated statements of operations. |
(3) | Included in operating, maintenance and management in the accompanying consolidated statements of operations. |
(4) | Included in general and administrative expenses in the accompanying consolidated statements of operations. |
(5) | Included in gain on sales of real estate, net in the accompanying consolidated statements of operations. |
(6) | Included in tenant reimbursements and other in the accompanying consolidated statements of operations. |
(7) | Included in building and improvements in the accompanying consolidated balance sheets. |
(8) | Included in other assets, net in the accompanying consolidated balance sheets upon payment. The amortization of the prepaid insurance deductible account is included in general and administrative expenses in the accompanying consolidated statements of operations. |
(9) | Included in mortgage notes payable, net in the accompanying consolidated balance sheets. |
F-30
STEADFAST INCOME REIT, INC.
NOTES TO CONSOLIDATED FINANCIAL STATEMENTS - (Continued)
DECEMBER 31, 2016
Amounts attributable to the Advisor and its affiliates incurred and paid (received) for the years ended December 31, 2016, 2015 and 2014 are as follows:
Paid (Received) For the Year Ended December 31, | |||||||||||
2016 | 2015 | 2014 | |||||||||
Consolidated Statements of Operations: | |||||||||||
Expensed | |||||||||||
Investment management fees | $ | 14,060,587 | $ | 13,840,067 | $ | 16,627,339 | |||||
Acquisition fees | 960 | 791,135 | 3,296,422 | ||||||||
Acquisition expenses | — | 11,147 | 583,511 | ||||||||
Property management | |||||||||||
Fees | 6,392,550 | 6,169,938 | 5,717,813 | ||||||||
Reimbursement of onsite personnel | 18,650,009 | 18,639,991 | 17,827,185 | ||||||||
Other fees | 1,671,282 | 1,721,504 | 1,585,747 | ||||||||
Other fees - G&A | 168,037 | — | — | ||||||||
Other operating expenses | 1,098,568 | 1,367,226 | 915,618 | ||||||||
Disposition fees | — | — | 463,688 | ||||||||
Refinancing fee | 3,283,737 | — | — | ||||||||
Insurance proceeds | (113,853 | ) | — | — | |||||||
Consolidated Balance Sheets: | |||||||||||
Capitalized | |||||||||||
Construction management | |||||||||||
Fees | 1,548,701 | 1,590,514 | 1,348,151 | ||||||||
Reimbursement of labor costs | 474,155 | 119,626 | 88,781 | ||||||||
Prepaid insurance deductible account | 248,370 | 148,978 | — | ||||||||
Deferred financing costs | 139,229 | — | — | ||||||||
Additional paid-in-capital | |||||||||||
Other offering costs reimbursement | — | — | 3,105,246 | ||||||||
$ | 47,622,332 | $ | 44,400,126 | $ | 51,559,501 | ||||||
F-31
STEADFAST INCOME REIT, INC.
NOTES TO CONSOLIDATED FINANCIAL STATEMENTS - (Continued)
DECEMBER 31, 2016
Amounts attributable to the Advisor and its affiliates that are payable (prepaid) as of December 31, 2016 and 2015 are as follows:
Payable (Prepaid) as of December 31, | |||||||
2016 | 2015 | ||||||
Consolidated Statements of Operations: | |||||||
Expensed | |||||||
Investment management fees | $ | 1,185,001 | $ | 1,169,770 | |||
Acquisition fees | — | — | |||||
Acquisition expenses | — | — | |||||
Property management | |||||||
Fees | 534,056 | 520,127 | |||||
Reimbursement of onsite personnel | 805,274 | 703,791 | |||||
Other fees | 54,679 | 52,237 | |||||
Other fees - G&A | — | — | |||||
Other operating expenses | 184,954 | 51,029 | |||||
Disposition fees | — | — | |||||
Refinancing fee | — | — | |||||
Insurance proceeds | — | — | |||||
Consolidated Balance Sheets: | |||||||
Capitalized | |||||||
Construction management | |||||||
Fees | 16,431 | 71,133 | |||||
Reimbursement of labor costs | 7,171 | 114,122 | |||||
Prepaid insurance deductible account | (124,185 | ) | (74,489 | ) | |||
Deferred financing costs | — | — | |||||
$ | 2,663,381 | $ | 2,607,720 | ||||
Investment Management Fee
The Company pays the Advisor a monthly investment management fee equal to one-twelfth of 0.80% of (1) the cost of real properties and real estate-related assets acquired directly by the Company or (2) the Company’s allocable cost of each real property or real estate-related asset acquired through a joint venture. Such fee is calculated including acquisition fees, acquisition expenses and any debt attributable to such investments, or the Company’s proportionate share thereof in the case of investments made through joint ventures. The cost of real properties and real estate-related assets that have been sold by the Company during the applicable month is excluded from the fee.
Acquisition Fees and Expenses
The Company pays the Advisor an acquisition fee equal to 2.0% of (1) the cost of investment, as defined in the Advisory Agreement, in connection with the acquisition or origination of any type of real property or real estate-related asset acquired directly by the Company or (2) the Company’s allocable portion of the purchase price in connection with the acquisition or origination of any type of real property or real estate-related asset acquired through a joint venture, including any acquisition and origination expenses and any debt attributable to such investments.
F-32
STEADFAST INCOME REIT, INC.
NOTES TO CONSOLIDATED FINANCIAL STATEMENTS - (Continued)
DECEMBER 31, 2016
In addition to acquisition fees, the Company reimburses the Advisor for amounts directly incurred by the Advisor or its affiliates, including personnel-related costs for acquisition due diligence, legal and non-recurring management services, and amounts the Advisor pays to third parties in connection with the selection, acquisition or development of a property or acquisition of real estate-related assets, whether or not the Company ultimately acquires the property or the real estate-related assets.
The Charter limits the Company’s ability to pay acquisition fees if the total of all acquisition fees and expenses relating to the purchase would exceed 6.0% of the contract purchase price. Under the Charter, a majority of the Company’s board of directors, including a majority of the independent directors, is required to approve any acquisition fees (or portion thereof) that would cause the total of all acquisition fees and expenses relating to an acquisition to exceed 6.0% of the contract purchase price. In connection with the purchase of securities, the acquisition fee may be paid to an affiliate of the Advisor that is registered as a FINRA member broker-dealer if applicable FINRA rules would prohibit the payment of the acquisition fee to a firm that is not a registered broker-dealer.
Property Management Fees and Expenses
The Company has entered into Property Management Agreements with Steadfast Management Company, Inc., an affiliate of the Sponsor (the “Property Manager”), in connection with the acquisition of each of the Company’s properties (other than EBT Lofts, Library Lofts and Stuart Hall Lofts, which are managed by an unaffiliated third-party management company). The property management fee payable with respect to each property under the Property Management Agreements (each a “Property Management Agreement”) ranges from 2.50% to 3.75% of the annual gross revenue collected, which is usual and customary for comparable property management services rendered to similar properties in similar geographic markets, as determined by the Advisor and approved by a majority of the Company’s board of directors, including a majority of the independent directors. The Property Manager also receives an oversight fee of 1% of gross revenues at certain of the properties at which it does not serve as a property manager. Generally, each Property Management Agreement has an initial one year term and will continue thereafter on a month-to-month basis unless either party gives a 60 day prior notice of its desire to terminate the Property Management Agreement, provided that the Company may terminate the Property Management Agreement at any time upon a determination of gross negligence, willful misconduct or bad acts of the Property Manager or its employees or upon an uncured breach of the Property Management Agreement upon 30 days prior written notice to the Property Manager.
In addition to the property management fee, the Property Management Agreements also specify certain other fees payable to the Property Manager or its affiliates, including fees for benefit administration, information technology infrastructure, licenses, and support and training services. The Company also reimburses the Property Manager for the salaries and related benefits of on-site property management employees.
Construction Management
The Company has entered into Construction Management Agreements with Pacific Coast Land and Construction, Inc., an affiliate of the Sponsor (the “Construction Manager”), in connection with the planned capital improvements and renovation for certain of the Company’s properties. The construction management fee payable with respect to each property under the Construction Management Agreements (each a “Construction Management Agreement”) ranges from 5.0% to 12.0% of the costs of the improvements for which the Construction Manager has planning and oversight authority. Generally, each Construction Management Agreement has a term equal to the planned renovation timeline unless either party gives a 30 day prior notice of its desire to terminate the Construction Management Agreement. Construction management fees are capitalized to the respective real estate properties in the period in which they are incurred, as such costs relate to capital improvements and renovations for units taken out of service while they undergo the planned renovation.
The Company may also reimburse the Construction Manager for the salaries and related benefits of certain of its employees for time spent working on capital improvements and renovations at its properties.
F-33
STEADFAST INCOME REIT, INC.
NOTES TO CONSOLIDATED FINANCIAL STATEMENTS - (Continued)
DECEMBER 31, 2016
Prepaid Insurance Deductible Account
The Company deposits amounts with an affiliate of the Sponsor to fund a prepaid insurance deductible account to cover the cost of required insurance deductibles across all multifamily properties of the Company and other affiliated entities. Upon filing a major claim, proceeds from the insurance deductible account may be used by the Company or another affiliate of the Sponsor.
Other Operating Expense Reimbursement
In addition to the various fees paid to the Advisor, the Company is obligated to pay directly or reimburse all expenses incurred by the Advisor in providing services to the Company, including the Company’s allocable share of the Advisor’s overhead, such as rent, employee costs, utilities and information technology costs. The Company will not reimburse the Advisor for employee costs in connection with services for which the Advisor or its affiliates receive acquisition fees or disposition fees or for the salaries the Advisor pays to the Company’s executive officers.
The Charter limits the Company’s total operating expenses during any four fiscal quarters to the greater of 2% of the Company’s average invested assets or 25% of the Company’s net income for the same period (the “2%/25% Limitation”). The Company may reimburse the Advisor, at the end of each fiscal quarter, for operating expenses incurred by the Advisor; provided, however, that the Company shall not reimburse the Advisor at the end of any fiscal quarter for operating expenses that exceed the 2%/25% Limitation unless the independent directors have determined that such excess expenses were justified based on unusual and non-recurring factors. The Advisor must reimburse the Company for the amount by which the Company’s operating expenses for the preceding four fiscal quarters then ended exceed the 2%/25% Limitation unless the independent directors have determined that such excess expenses were justified. For purposes of determining the 2%/25% Limitation amount, “average invested assets” means the average monthly book value of the Company’s assets invested directly or indirectly in equity interests and loans secured by real estate during the 12-month period before deducting depreciation, bad debts or other non-cash reserves. “Total operating expenses” means all expenses paid or incurred by the Company that are in any way related to the Company’s operation, including the Company’s allocable share of Advisor overhead and investment management fees, but excluding (a) the expenses of raising capital such as organization and offering expenses, legal, audit, accounting, underwriting, brokerage, listing, registration and other fees, printing and other such expenses and taxes incurred in connection with the issuance, distribution, transfer, listing and registration of shares of the Company’s common stock; (b) interest payments; (c) taxes; (d) non-cash expenditures such as depreciation, amortization and bad debt reserves; (e) reasonable incentive fees based on the gain in the sale of the Company’s assets; (f) acquisition fees and acquisition expenses (including expenses relating to potential acquisitions that the Company does not close); (g) real estate commissions on the resale of investments; and (h) other expenses connected with the acquisition, disposition, management and ownership of investments (including the costs of foreclosure, insurance premiums, legal services, maintenance, repair and improvement of real property).
For the year ended December 31, 2016, the Advisor and its affiliates incurred $1,232,493 of the Company’s operating expenses, including the allocable share of the Advisor’s overhead expenses of $1,232,493, none of which were in excess of the 2%/25% Limitation and are included in the $9,039,171 of general and administrative expenses recognized by the Company. As of December 31, 2016, the Company’s total operating expenses were 0.1% of its average invested assets and 4.8% of its net loss.
For the year ended December 31, 2015, the Advisor and its affiliates incurred $1,346,002 of the Company’s operating expenses, including the allocable share of the Advisor’s overhead expenses of $1,346,002, none of which were in excess of the 2%/25% Limitation and are included in the $5,949,993 of general and administrative expenses recognized by the Company.
For the year ended December 31, 2014, the Advisor and its affiliates incurred $980,192 of the Company’s operating expenses, including the allocable share of the Advisor’s overhead expenses of $980,192, none of which were in excess of the 2%/25% Limitation, and $2,571,910 of previously deferred operating expenses, all of which are included in the $6,896,519 of general and administrative expenses recognized by the Company.
F-34
STEADFAST INCOME REIT, INC.
NOTES TO CONSOLIDATED FINANCIAL STATEMENTS - (Continued)
DECEMBER 31, 2016
Disposition Fee
The Company will pay the Advisor a disposition fee in connection with a sale of a property or real estate-related asset and in the event of the sale of the entire Company (a “Final Liquidity Event”), in either case when the Advisor or its affiliates provides a substantial amount of services as determined by a majority of the Company’s independent directors. With respect to a sale of a property or real estate-related asset, the Company will pay the Advisor a disposition fee equal to 1.5% of the contract sales price of the investment sold. With respect to a Final Liquidity Event, the Company will pay the Advisor a disposition fee equal to (i) 0.5% of the total consideration paid in a Final Liquidity Event if the price per share paid to stockholders is less than or equal to $9.00; (ii) 0.75% of the total consideration paid in a final liquidity event if the price per share paid to stockholders is between $9.01 and $10.24; (iii) 1.00% of the total consideration paid in a final liquidity event if the price per share paid to stockholders is between $10.25 and $11.24; (iv) 1.25% of the total consideration paid in a final liquidity event if the price per share paid to stockholders is between $11.25 and $12.00; and (v) 1.50% of the total consideration paid in a final liquidity event if the price per share paid to stockholders is greater than or equal to $12.01. To the extent the disposition fee is paid upon the sale of any assets other than real property, it will be included as an operating expense for purposes of the 2%/25% Limitation. In connection with the sale of securities, the disposition fee may be paid to an affiliate of the Advisor that is registered as a FINRA member broker-dealer if applicable FINRA rules would prohibit the payment of the disposition fee to a firm that is not a registered broker-dealer. The Charter limits the maximum amount of the disposition fees payable to the Advisor for the sale of any real property to the lesser of one-half of the brokerage commission paid or 3% of the contract sales price, but in no event shall the total real estate commissions paid, including any disposition fees payable to the Advisor, exceed 6% of the contract sales price.
Refinancing Fee
The Company paid the Advisor a refinancing fee equal to 0.50% of the refinancing amount in connection with the refinancing of certain of the Company’s existing mortgage loans. For the year ended December 31, 2016, the Advisor earned $3,283,737 in refinancing fees in connection with the Refinancing Transactions, which was expensed by the Company. No amounts were earned by the Advisor for the years ended December 31, 2015 and 2014. Additionally, in connection with the Refinancing Transactions, the Company reimbursed certain deferred financing costs payable to an affiliate of the Sponsor that have been recorded to notes payable, net on the accompanying consolidated balance sheets.
Restricted Stock Agreement
On June 11, 2014, the Company entered into a restricted stock agreement with the Advisor whereby the Company issued to the Advisor 488,281.25 restricted shares of the Company’s common stock at a fair market value of $10.24 per share in satisfaction of certain deferred fees due to the Advisor in the aggregate amount of $5,000,000. Pursuant to the terms of the restricted stock agreement, the shares of restricted stock vested and became non-forfeitable 50% at December 31, 2015 and 50% at December 31, 2016.
9. | Incentive Award Plan and Independent Director Compensation |
The Company has adopted an incentive plan (the “Incentive Award Plan”) that provides for the grant of equity awards to its employees, directors and consultants and those of the Company’s affiliates. The Incentive Award Plan authorizes the grant of non-qualified and incentive stock options, restricted stock awards, restricted stock units, stock appreciation rights, dividend equivalents and other stock-based awards or cash-based awards. No awards have been granted under the Incentive Award Plan as of December 31, 2016 and 2015, except those awards granted to the independent directors as described below.
Under the Company’s independent directors’ compensation plan, which is a sub-plan of the Incentive Award Plan, each of the Company’s then independent directors was entitled to receive 5,000 shares of restricted common stock in connection with the initial meeting of the Company’s full board of directors and at the initial election of a new independent director. The Company’s initial board of directors, and each of the independent directors, agreed to delay the initial grant of restricted stock until the Company raised $2,000,000 in gross offering proceeds in the Private Offering. In addition, on the date following an independent director’s re-election to the Company’s board of directors, he or she receives 2,500 shares of restricted common
F-35
STEADFAST INCOME REIT, INC.
NOTES TO CONSOLIDATED FINANCIAL STATEMENTS - (Continued)
DECEMBER 31, 2016
stock. One-fourth of the shares of restricted common stock generally vest and become non-forfeitable upon issuance and the remaining portion will vest in three equal annual installments beginning on the date of grant and ending on the third anniversary of the date of grant; provided, however, that the restricted stock will become fully vested and become non-forfeitable on the earlier to occur of (1) the termination of the independent director’s service as a director due to his or her death or disability, or (2) a change in control of the Company and as otherwise provided in the Incentive Award Plan.
On August 5, 2014, the Company granted each of the four independent directors 2,500 shares of restricted stock upon re-election to the Company’s board of directors. On August 10, 2015, the Company’s board of directors granted 2,000 shares of restricted common stock pursuant to the Incentive Award Plan to each of Larry H. Dale and Kerry D. Vandell in appreciation of their service as independent directors and commitment to the Company for their prior years of service as independent directors, all of which vested immediately. On August 11, 2015, the Company granted each of the two independent directors 2,500 shares of restricted common stock upon re-election to the Company’s board of directors. On August 11, 2015, the Company granted 5,000 shares of restricted common stock to its new independent director. On August 9, 2016, the Company granted 2,500 shares of restricted common stock to each of its three independent directors upon their re-election to the Company’s board of directors at the 2016 annual meeting of stockholders. The Company recorded stock-based compensation expense of $76,285, $184,350 and $118,145 for the years ended December 31, 2016, 2015 and 2014 respectively.
10. | Commitments and Contingencies |
Economic Dependency
The Company is dependent on the Advisor and its affiliates for certain services that are essential to the Company, including the sale of the Company’s shares of common and preferred stock available for issue; the identification, evaluation, negotiation, purchase, and disposition of real estate and real estate-related investments; management of the daily operations of the Company’s real estate and real estate-related investment portfolio; and other general and administrative responsibilities. In the event that these companies are unable to provide the respective services, the Company will be required to obtain such services from other sources.
Concentration of Credit Risk
The geographic concentration of the Company’s portfolio makes it particularly susceptible to adverse economic developments in the Houston, Texas, Chicago, Illinois and Austin, Texas apartment markets. Any adverse economic or real estate developments in these markets, such as business layoffs or downsizing, relocations of businesses, increased competition from other apartment communities, decrease in demand for apartments or any other changes, could adversely affect the Company’s operating results and its ability to make distributions to stockholders.
Environmental
As an owner of real estate, the Company is subject to various environmental laws of federal, state and local governments. The Company is not aware of any environmental liability that could have a material adverse effect on its financial condition or results of operations. However, changes in applicable environmental laws and regulations, the uses and conditions of properties in the vicinity of the Company’s properties, the activities of its tenants and other environmental conditions of which the Company is unaware with respect to the properties could result in future environmental liabilities.
Legal Matters
From time to time, the Company is subject, or party, to legal proceedings that arise in the ordinary course of its business. Management is not aware of any legal proceedings of which the outcome is reasonably likely to have a material adverse effect on the Company’s results of operations or financial condition nor is the Company aware of any such legal proceedings contemplated by government agencies.
F-36
STEADFAST INCOME REIT, INC.
NOTES TO CONSOLIDATED FINANCIAL STATEMENTS - (Continued)
DECEMBER 31, 2016
11. | Derivative Financial Instruments |
The Company uses interest rate derivatives with the objective of managing exposure to interest rate movements thereby minimizing the effect of interest rate changes and the effect they could have on future cash flows. Interest rate cap agreements are used to accomplish this objective. As of December 31, 2016, the Company had 43 interest rate cap agreements with notional amounts totaling $973,400,000. The following table provides the terms of the Company’s interest rate derivative instruments that were in effect at December 31, 2016 and 2015:
December 31, 2016 | |||||||||||||||||||||
Type | Maturity Date Range | Based on | Number of Instruments | Notional Amount | Variable Rate | Weighted Average Rate Cap | Fair Value | ||||||||||||||
Interest rate cap | 4/1/2017 - 10/1/2019 | One-Month LIBOR | 43 | $ | 973,400,000 | 0.77 | % | 2.70 | % | $ | 618,841 | ||||||||||
December 31, 2015 | |||||||||||||||||||||
Type | Maturity Date Range | Based on | Number of Instruments | Notional Amount | Variable Rate | Weighted Average Rate Cap | Fair Value | ||||||||||||||
Interest rate cap | 11/1/2016 - 10/1/2019 | One-Month LIBOR | 30 | $ | 637,110,000 | 0.43 | % | 2.68 | % | $ | 298,143 | ||||||||||
The interest rate cap agreements are not designated as cash flow hedges. Accordingly, the Company records any changes in the fair value of the interest rate cap agreements as interest expense. The change in the fair value of the interest rate cap agreements for the years ended December 31, 2016, 2015 and 2014 resulted in an unrealized gain (loss) of $61,698, $(2,032,746) and $(4,353,301), respectively, which is included in interest expense in the accompanying consolidated statements of operations. During the years ended December 31, 2016 and 2015, the Company acquired interest rate cap agreements of $259,000 and 351,950. The fair value of interest rate cap agreements of $618,841 and $298,143 are included in other assets, net on the accompanying consolidated balance sheets.
12. | Selected Quarterly Results (unaudited) |
Presented below is a summary of the Company’s unaudited quarterly financial information for the years ended December 31, 2016 and 2015:
First Quarter | Second Quarter | Third Quarter | Fourth Quarter | Total | |||||||||||||||
2016 | |||||||||||||||||||
Revenues | $ | 52,906,908 | $ | 54,022,623 | $ | 56,371,925 | $ | 54,936,076 | $ | 218,237,532 | |||||||||
Net loss | (3,618,142 | ) | (8,039,220 | ) | (9,699,187 | ) | (4,223,102 | ) | (25,579,651 | ) | |||||||||
Loss per common share, basic and diluted | (0.05 | ) | (0.11 | ) | (0.13 | ) | (0.05 | ) | (0.34 | ) | |||||||||
Distributions declared per common share | 0.178 | 0.178 | 0.180 | 0.180 | 0.716 | ||||||||||||||
2015 | |||||||||||||||||||
Revenues | $ | 51,051,301 | $ | 52,243,802 | $ | 53,166,421 | $ | 52,929,134 | $ | 209,390,658 | |||||||||
Net loss | (3,830,646 | ) | (2,904,429 | ) | (3,603,728 | ) | (2,685,555 | ) | (13,024,358 | ) | |||||||||
Loss per common share, basic and diluted | (0.05 | ) | (0.04 | ) | (0.05 | ) | (0.04 | ) | (0.18 | ) | |||||||||
Distributions declared per common share | 0.177 | 0.179 | 0.181 | 0.181 | 0.718 | ||||||||||||||
F-37
STEADFAST INCOME REIT, INC.
NOTES TO CONSOLIDATED FINANCIAL STATEMENTS - (Continued)
DECEMBER 31, 2016
13. Subsequent Events
The Company has evaluated all subsequent event activity through the date these consolidated financial statements were available to be issued.
Distributions Paid
On January 3, 2017, the Company paid distributions of $4,625,355, which related to distributions declared for each day in the period from December 1, 2016 through December 31, 2016. All such distributions were paid in cash.
On February 1, 2017, the Company paid distributions of $4,639,320, which related to distributions declared for each day in the period from January 1, 2017 through January 31, 2017. All such distributions were paid in cash.
On March 1, 2017, the Company paid distributions of $4,180,195, which related to distributions declared for each day in the period from February 1, 2017 through February 28, 2017. All such distributions were paid in cash.
Redemption
On January 31, 2017, the Company redeemed 183,955 shares of its common stock for a total redemption value of $2,000,000, or $10.87 per share, pursuant to the Company’s share repurchase program.
Estimated Value per Share
On February 15, 2017, the Company’s board of directors determined an estimated value per share of the Company’s common stock of $11.65 as of December 31, 2016. In connection with the determination of the estimated value per share, redemptions pursuant to our share repurchase program will be based on a price of $11.65 commencing on the repurchase date for the quarter ended March 31, 2017.
F-38
STEADFAST INCOME REIT, INC.
SCHEDULE III
REAL ESTATE ASSETS AND ACCUMULATED DEPRECIATION AND AMORTIZATION
DECEMBER 31, 2016
Description | Location | Owner-ship Percent | Encumbrances(1) | Initial Cost of Company | Cost Capitalized Subsequent to Acquisition | Gross Amount at which Carried at Close of Period | Accumulated Depreciation and Amortization | Original Date of Construction | Date Acquired | |||||||||||||||||||||||||||||||||||
Land | Building and Improvements(2) | Total | Land | Building and Improvements(2) | Total(3) | |||||||||||||||||||||||||||||||||||||||
Park Place Condominiums | Des Moines, IA | 100% | $ | 4,684,652 | $ | 500,000 | $ | 7,823,400 | $ | 8,323,400 | $ | 1,336,729 | $ | 410,000 | $ | 8,435,749 | $ | 8,845,747 | $ | (2,170,351 | ) | 1986 | 12/22/10 | |||||||||||||||||||||
Clarion Park Apartments | Olathe, KS | 100% | 8,136,274 | 1,470,991 | 9,744,009 | 11,215,000 | 658,698 | 1,470,991 | 10,120,792 | 11,591,783 | (2,313,011 | ) | 1994 | 6/28/11 | ||||||||||||||||||||||||||||||
Cooper Creek Village | Louisville, KY | 100% | 6,224,663 | 593,610 | 9,826,390 | 10,420,000 | 593,397 | 593,610 | 10,235,577 | 10,829,187 | (2,260,840 | ) | 1997 | 8/24/11 | ||||||||||||||||||||||||||||||
Truman Farm Villas | Grandview, MO | 100% | 5,465,173 | 842,987 | 8,257,013 | 9,100,000 | 998,241 | 842,987 | 9,014,625 | 9,857,612 | (2,054,821 | ) | 2008 | 12/22/11 | ||||||||||||||||||||||||||||||
EBT Lofts | Kansas City, MO | 100% | 5,167,644 | 460,362 | 8,114,638 | 8,575,000 | 712,494 | 460,362 | 8,484,814 | 8,945,176 | (1,721,239 | ) | 1899 | 12/30/11 | ||||||||||||||||||||||||||||||
Windsor on the River | Cedar Rapids, IA | 100% | 22,650,962 | 3,381,946 | 29,618,054 | 33,000,000 | 1,904,731 | 3,381,946 | 30,329,856 | 33,711,802 | (6,149,216 | ) | 1982 | 1/26/12 | ||||||||||||||||||||||||||||||
Renaissance St. Andrews | Louisville, KY | 100% | 8,509,637 | 838,685 | 11,661,315 | 12,500,000 | 928,954 | 838,685 | 12,347,865 | 13,186,550 | (2,588,524 | ) | 2001 | 2/17/12 | ||||||||||||||||||||||||||||||
Spring Creek of Edmond | Edmond, OK | 100% | 12,854,648 | 2,346,503 | 17,602,343 | 19,948,846 | 749,023 | 2,346,503 | 17,945,974 | 20,292,477 | (3,665,352 | ) | 1974 | 3/9/12 | ||||||||||||||||||||||||||||||
Montclair Parc Apartments | Oklahoma City, OK | 100% | 22,770,672 | 3,325,556 | 32,424,444 | 35,750,000 | 1,354,603 | 3,325,556 | 32,593,452 | 35,919,008 | (6,044,463 | ) | 1999 | 4/26/12 | ||||||||||||||||||||||||||||||
Sonoma Grande Apartments | Tulsa, OK | 100% | 21,372,685 | 2,737,794 | 29,462,206 | 32,200,000 | 670,190 | 2,737,794 | 29,582,783 | 32,320,577 | (5,582,829 | ) | 2009 | 5/24/12 | ||||||||||||||||||||||||||||||
Estancia Apartments | Tulsa, OK | 100% | 20,738,073 | 2,544,634 | 27,240,628 | 29,785,262 | 638,375 | 2,544,634 | 27,357,439 | 29,902,073 | (5,004,351 | ) | 2006 | 6/29/12 | ||||||||||||||||||||||||||||||
Montelena Apartments | Round Rock, TX | 100% | 11,617,425 | 1,860,351 | 17,375,907 | 19,236,258 | 1,118,408 | 1,860,351 | 18,039,155 | 19,899,506 | (3,331,915 | ) | 1998 | 7/13/12 | ||||||||||||||||||||||||||||||
Valley Farms Apartments | Louisville, KY | 100% | 9,580,194 | 724,771 | 14,375,229 | 15,100,000 | 468,483 | 724,771 | 14,583,123 | 15,307,894 | (2,535,034 | ) | 2007 | 8/30/12 | ||||||||||||||||||||||||||||||
Hilliard Park Apartments | Hilliard, OH | 100% | 12,935,281 | 1,413,437 | 18,484,692 | 19,898,129 | 750,143 | 1,413,437 | 18,829,514 | 20,242,951 | (3,210,369 | ) | 2000 | 9/11/12 | ||||||||||||||||||||||||||||||
Sycamore Terrace Apartments | Terre Haute, IN | 100% | 17,794,863 | 1,321,194 | 21,852,963 | 23,174,157 | 253,629 | 1,321,194 | 21,661,008 | 22,982,202 | (3,474,702 | ) | 2011/2013 | 9/20/12, 3/5/14 | ||||||||||||||||||||||||||||||
Hilliard Summit Apartments | Hilliard, OH | 100% | 15,710,108 | 1,536,795 | 22,639,028 | 24,175,823 | 299,652 | 1,536,795 | 22,490,028 | 24,026,823 | (3,730,353 | ) | 2012 | 9/28/12 | ||||||||||||||||||||||||||||||
Springmarc Apartments | San Marcos, TX | 100% | 14,478,724 | 1,917,909 | 20,027,929 | 21,945,838 | 191,528 | 1,917,909 | 19,787,579 | 21,705,488 | (3,360,558 | ) | 2008 | 10/19/12 | ||||||||||||||||||||||||||||||
Renaissance at St. Andrews Condominiums | Louisville, KY | 100% | — | 92,255 | 1,282,745 | 1,375,000 | 372,603 | 92,255 | 1,628,683 | 1,720,938 | (315,718 | ) | 2001 | 10/31/12 | ||||||||||||||||||||||||||||||
Ashley Oaks Apartments | San Antonio, TX | 100% | 24,599,195 | 3,819,796 | 26,970,204 | 30,790,000 | 3,143,971 | 3,819,796 | 29,378,393 | 33,198,189 | (5,492,084 | ) | 1985 | 11/29/12 | ||||||||||||||||||||||||||||||
Arrowhead Apartments | Palatine, IL | 100% | 11,780,189 | 2,094,728 | 14,655,272 | 16,750,000 | 522,991 | 2,094,728 | 14,775,664 | 16,870,392 | (2,483,129 | ) | 1976 | 11/30/12 | ||||||||||||||||||||||||||||||
The Moorings Apartments | Roselle, IL | 100% | 14,240,269 | 2,250,208 | 17,999,792 | 20,250,000 | 1,704,628 | 2,250,208 | 19,282,954 | 21,533,162 | (3,223,466 | ) | 1976 | 11/30/12 | ||||||||||||||||||||||||||||||
F-39
STEADFAST INCOME REIT, INC.
SCHEDULE III
REAL ESTATE ASSETS AND ACCUMULATED DEPRECIATION AND AMORTIZATION (CONTINUED)
DECEMBER 31, 2016
Description | Location | Owner-ship Percent | Encumbrances(1) | Initial Cost of Company | Cost Capitalized Subsequent to Acquisition | Gross Amount at which Carried at Close of Period | Accumulated Depreciation and Amortization | Original Date of Construction | Date Acquired | |||||||||||||||||||||||||||||||||||
Land | Building and Improvements(2) | Total | Land | Building and Improvements(2) | Total(3) | |||||||||||||||||||||||||||||||||||||||
Forty-57 Apartments | Lexington, KY | 100% | $ | 37,031,543 | $ | 3,055,614 | $ | 49,444,386 | $ | 52,500,000 | $ | 991,127 | $ | 3,055,614 | $ | 49,673,628 | $ | 52,729,242 | $ | (8,009,307 | ) | 2008 | 12/20/12 | |||||||||||||||||||||
Keystone Farms Apartments | Nashville, TN | 100% | 5,838,649 | 1,052,401 | 7,347,599 | 8,400,000 | 419,971 | 1,052,401 | 7,587,711 | 8,640,112 | (1,302,888 | ) | 1998 | 12/28/12 | ||||||||||||||||||||||||||||||
Riverford Crossing Apartments | Frankfort, KY | 100% | 21,047,995 | 2,595,387 | 27,404,613 | 30,000,000 | 561,378 | 2,595,387 | 27,423,957 | 30,019,344 | (4,543,289 | ) | 2011 | 12/28/12 | ||||||||||||||||||||||||||||||
Valley Farms North | Louisville, KY | 100% | 9,670,974 | 2,212,402 | 3,062,598 | 5,275,000 | 9,431,261 | 2,212,402 | 12,427,823 | 14,640,225 | (1,002,296 | ) | 2010 | 12/28/12 | ||||||||||||||||||||||||||||||
Montecito Apartments | Austin, TX | 100% | 13,398,273 | 3,081,522 | 15,918,478 | 19,000,000 | 2,010,551 | 3,081,522 | 17,494,833 | 20,576,355 | (3,127,534 | ) | 1984 | 12/31/12 | ||||||||||||||||||||||||||||||
Hilliard Grand Apartments | Dublin, OH | 100% | 29,112,914 | 2,657,734 | 38,012,528 | 40,670,262 | 346,192 | 2,657,734 | 37,542,053 | 40,199,787 | (5,809,899 | ) | 2010 | 12/31/12 | ||||||||||||||||||||||||||||||
The Hills at Fair Oaks | Fair Oaks Ranch, TX | 100% | 23,877,008 | 3,008,363 | 31,700,639 | 34,709,002 | 225,562 | 3,008,363 | 31,300,409 | 34,308,772 | (4,985,452 | ) | 2012 | 1/31/13 | ||||||||||||||||||||||||||||||
Library Lofts East | Kansas City, MO | 100% | 8,517,144 | 1,669,405 | 11,080,595 | 12,750,000 | 320,683 | 1,669,405 | 11,195,311 | 12,864,716 | (1,760,405 | ) | 1906/1923 | 2/28/13 | ||||||||||||||||||||||||||||||
The Trails at Buda Ranch | Buda, TX | 100% | 20,793,446 | 2,504,114 | 20,495,886 | 23,000,000 | 619,347 | 2,504,114 | 20,609,163 | 23,113,277 | (3,101,817 | ) | 2009 | 3/28/13 | ||||||||||||||||||||||||||||||
Deep Deuce at Bricktown | Oklahoma City, OK | 100% | 25,019,201 | 2,529,318 | 37,266,648 | 39,795,966 | 5,389,403 | 2,529,318 | 41,980,975 | 44,510,293 | (7,658,658 | ) | 2001 | 3/28/13 | ||||||||||||||||||||||||||||||
Deer Valley Apartments | Lake Bluff, IL | 100% | 22,796,336 | 2,494,142 | 26,105,858 | 28,600,000 | 1,281,791 | 2,494,142 | 26,858,741 | 29,352,883 | (4,166,884 | ) | 1991 | 4/30/13 | ||||||||||||||||||||||||||||||
Grayson Ridge | North Richland, TX | 100% | 13,873,891 | 1,594,099 | 12,705,901 | 14,300,000 | 1,490,206 | 1,594,099 | 13,842,333 | 15,436,432 | (2,328,649 | ) | 1988 | 5/31/13 | ||||||||||||||||||||||||||||||
Rosemont at Olmos Park | San Antonio, TX | 100% | 14,113,839 | 2,064,447 | 19,985,553 | 22,050,000 | 418,637 | 2,064,447 | 19,981,067 | 22,045,514 | (2,816,561 | ) | 1995 | 5/31/13 | ||||||||||||||||||||||||||||||
Retreat at Quail North | Oklahoma City, OK | 100% | 16,686,497 | 1,700,810 | 24,025,543 | 25,726,353 | 289,501 | 1,700,810 | 23,826,401 | 25,527,211 | (3,528,686 | ) | 2012 | 6/12/13 | ||||||||||||||||||||||||||||||
The Lodge at Trails Edge | Indianapolis, IN | 100% | 12,053,618 | 2,389,613 | 16,128,107 | 18,517,720 | 480,803 | 2,389,613 | 16,223,290 | 18,612,903 | (2,345,643 | ) | 1981 | 6/18/13 | ||||||||||||||||||||||||||||||
Arbors of Carrollton | Carrollton, TX | 100% | 5,970,787 | 1,424,432 | 7,560,527 | 8,984,959 | 626,698 | 1,424,432 | 7,963,035 | 9,387,467 | (1,303,824 | ) | 1984 | 7/3/13 | ||||||||||||||||||||||||||||||
Waterford on the Meadow | Plano, TX | 100% | 15,850,173 | 2,625,024 | 20,849,131 | 23,474,155 | 2,681,671 | 2,625,024 | 22,965,636 | 25,590,660 | (3,345,355 | ) | 1984 | 7/3/13 | ||||||||||||||||||||||||||||||
The Belmont | Grand Prairie, TX | 100% | 8,817,677 | 1,550,028 | 11,264,510 | 12,814,538 | 804,563 | 1,550,028 | 11,706,430 | 13,256,458 | (1,690,496 | ) | 1983 | 7/26/13 | ||||||||||||||||||||||||||||||
Meritage at Steiner Ranch | Austin, TX | 100% | 58,137,072 | 7,353,620 | 73,356,373 | 80,709,993 | 7,787,008 | 7,353,620 | 79,692,598 | 87,046,218 | (11,642,139 | ) | 2001 | 8/6/13 | ||||||||||||||||||||||||||||||
Tapestry Park Apartments | Birmingham , AL | 100% | 43,595,145 | 3,277,884 | 47,118,797 | 50,396,681 | 172,341 | 3,277,884 | 46,652,674 | 49,930,558 | (6,345,414 | ) | 2012/2014 | 8/13/13, 12/1/14 | ||||||||||||||||||||||||||||||
Dawntree Apartments | Carrollton, TX | 100% | 15,138,014 | 3,135,425 | 21,753,469 | 24,888,894 | 1,806,673 | 3,135,425 | 22,957,681 | 26,093,106 | (3,441,941 | ) | 1982 | 8/15/13 | ||||||||||||||||||||||||||||||
Stuart Hall Lofts | Kansas City, MO | 100% | 15,968,742 | 1,585,035 | 15,264,965 | 16,850,000 | 132,759 | 1,585,035 | 15,112,965 | 16,698,000 | (2,092,972 | ) | 1910 | 8/27/13 | ||||||||||||||||||||||||||||||
F-40
STEADFAST INCOME REIT, INC.
SCHEDULE III
REAL ESTATE ASSETS AND ACCUMULATED DEPRECIATION AND AMORTIZATION (CONTINUED)
DECEMBER 31, 2016
Description | Location | Owner-ship Percent | Encumbrances(1) | Initial Cost of Company | Cost Capitalized Subsequent to Acquisition | Gross Amount at which Carried at Close of Period | Accumulated Depreciation and Amortization | Original Date of Construction | Date Acquired | |||||||||||||||||||||||||||||||||||
Land | Building and Improvements(2) | Total | Land | Building and Improvements(2) | Total(3) | |||||||||||||||||||||||||||||||||||||||
BriceGrove Park Apartments | Canal Winchester, OH | 100% | $ | 17,072,164 | $ | 1,596,212 | $ | 18,503,788 | $ | 20,100,000 | $ | 610,535 | $ | 1,596,212 | $ | 18,663,503 | $ | 20,259,715 | $ | (2,646,653 | ) | 2002 | 8/29/13 | |||||||||||||||||||||
Retreat at Hamburg Place | Lexington, KY | 100% | 12,031,675 | 1,605,839 | 14,694,161 | 16,300,000 | 282,991 | 1,605,839 | 14,649,237 | 16,255,076 | (2,076,333 | ) | 2013 | 9/5/13 | ||||||||||||||||||||||||||||||
Cantare at Indian Lake Village | Nashville, TN | 100% | 28,090,912 | 2,489,757 | 26,510,243 | 29,000,000 | 229,795 | 2,489,757 | 26,278,537 | 28,768,294 | (3,528,727 | ) | 2013 | 9/24/13 | ||||||||||||||||||||||||||||||
Landing at Mansfield | Mansfield, TX | 100% | 27,151,099 | 3,375,831 | 27,524,169 | 30,900,000 | 461,928 | 3,375,831 | 27,353,633 | 30,729,464 | (3,624,415 | ) | 2006 | 9/27/13 | ||||||||||||||||||||||||||||||
The Heights Apartments | Houston, TX | 100% | 38,211,186 | 9,869,925 | 27,130,075 | 37,000,000 | 2,525,594 | 9,869,925 | 28,293,938 | 38,163,863 | (4,550,038 | ) | 1977 | 9/30/13 | ||||||||||||||||||||||||||||||
Villas at Huffmeister | Houston, TX | 100% | 27,136,015 | 5,858,663 | 31,741,337 | 37,600,000 | 1,313,137 | 5,858,663 | 32,334,058 | 38,192,721 | (4,551,111 | ) | 2007 | 10/10/13 | ||||||||||||||||||||||||||||||
Villas at Kingwood | Kingwood, TX | 100% | 35,269,793 | 6,512,468 | 33,637,532 | 40,150,000 | 1,686,569 | 6,512,468 | 34,535,279 | 41,047,747 | (4,873,640 | ) | 2008 | 10/10/13 | ||||||||||||||||||||||||||||||
Waterford Place at Riata Ranch | Cypress, TX | 100% | 17,251,113 | 3,184,857 | 20,215,143 | 23,400,000 | 841,041 | 3,184,857 | 20,556,194 | 23,741,051 | (2,935,027 | ) | 2008 | 10/10/13 | ||||||||||||||||||||||||||||||
Carrington Place | Houston, TX | 100% | 27,260,883 | 5,450,417 | 27,449,583 | 32,900,000 | 1,271,692 | 5,450,417 | 28,027,114 | 33,477,531 | (3,858,036 | ) | 2004 | 11/7/13 | ||||||||||||||||||||||||||||||
Carrington Champion Forest | Houston, TX | 100% | 24,861,504 | 3,760,329 | 29,239,671 | 33,000,000 | 1,079,818 | 3,760,329 | 29,703,594 | 33,463,923 | (4,067,232 | ) | 2008 | 11/7/13 | ||||||||||||||||||||||||||||||
Carrington Park at Huffmeister | Houston, TX | 100% | 20,204,368 | 3,241,747 | 21,908,253 | 25,150,000 | 926,359 | 3,241,747 | 22,310,267 | 25,552,014 | (3,121,645 | ) | 2008 | 11/7/13 | ||||||||||||||||||||||||||||||
Willow Crossing | Elk Grove Village, IL | 100% | 57,611,490 | 8,091,870 | 49,908,130 | 58,000,000 | 6,225,527 | 8,091,870 | 54,418,750 | 62,510,620 | (7,844,662 | ) | 1977-81 | 11/20/13 | ||||||||||||||||||||||||||||||
Echo at Katy Ranch | Katy, TX | 100% | — | 4,402,862 | 30,419,853 | 34,822,715 | 341,550 | 4,402,862 | 30,287,683 | 34,690,545 | (3,808,330 | ) | 2013 | 12/19/13 | ||||||||||||||||||||||||||||||
Heritage Grand at Sienna Plantation | Missouri City, TX | 100% | 17,245,125 | 3,776,547 | 22,762,411 | 26,538,958 | 321,845 | 3,776,547 | 22,538,115 | 26,314,662 | (2,942,740 | ) | 2012 | 12/20/13 | ||||||||||||||||||||||||||||||
Audubon Park | Nashville, TN | 100% | 16,338,651 | 2,489,428 | 14,260,572 | 16,750,000 | 4,274,554 | 2,489,428 | 18,116,033 | 20,605,461 | (2,766,635 | ) | 1968 | 12/27/13 | ||||||||||||||||||||||||||||||
Mallard Crossing | Loveland, OH | 100% | 33,488,573 | 2,383,256 | 37,416,744 | 39,800,000 | 957,780 | 2,383,256 | 37,703,951 | 40,087,207 | (4,541,177 | ) | 1997 | 12/27/13 | ||||||||||||||||||||||||||||||
Renaissance at Carol Stream | Carol Stream, IL | 100% | 23,028,160 | 4,605,682 | 24,544,318 | 29,150,000 | 1,174,704 | 4,605,682 | 25,145,094 | 29,750,776 | (3,160,231 | ) | 1972 | 12/31/13 | ||||||||||||||||||||||||||||||
Reserve at Creekside | Chattanooga, TN | 100% | 14,190,376 | 1,344,233 | 17,530,767 | 18,875,000 | 282,030 | 1,344,233 | 17,460,773 | 18,805,006 | (2,038,086 | ) | 2004 | 3/28/14 | ||||||||||||||||||||||||||||||
Mapleshade Park | Dallas, TX | 100% | 19,235,309 | 3,585,171 | 19,739,829 | 23,325,000 | 1,788,113 | 3,585,171 | 20,919,343 | 24,504,514 | (2,555,555 | ) | 1995 | 3/31/14 | ||||||||||||||||||||||||||||||
Richland Falls | Murfreesboro, TN | 100% | 20,137,110 | 1,306,794 | 19,693,206 | 21,000,000 | 10,079,447 | 1,306,794 | 29,502,008 | 30,808,802 | (2,206,780 | ) | 2012-13 | 5/16/14 | ||||||||||||||||||||||||||||||
Oak Crossing | Fort Wayne, IN | 100% | 17,644,671 | 2,005,491 | 22,224,509 | 24,230,000 | 231,175 | 2,005,491 | 22,039,213 | 24,044,704 | (2,286,220 | ) | 2012-13 | 6/3/14 | ||||||||||||||||||||||||||||||
Park Shore | St. Charles, IL | 100% | 15,635,835 | 1,619,712 | 16,730,288 | 18,350,000 | 1,194,761 | 1,619,712 | 17,416,478 | 19,036,190 | (1,698,378 | ) | 1965 | 9/12/14 | ||||||||||||||||||||||||||||||
$ | 1,217,716,280 | $ | 174,192,422 | $ | 1,459,075,487 | $ | 1,633,267,909 | $ | 95,760,542 | $ | 174,102,422 | $ | 1,520,176,536 | $ | 1,694,278,958 | $ | (232,744,083 | ) | ||||||||||||||||||||||||||
F-41
STEADFAST INCOME REIT, INC.
SCHEDULE III
REAL ESTATE ASSETS AND ACCUMULATED DEPRECIATION AND AMORTIZATION (CONTINUED)
DECEMBER 31, 2016
________________
(1) | Encumbrances include the unamortized portion of loan premiums (discounts) on assumed debt allocated to individual assets in the aggregate amount of $2.2 million and net deferred financing costs of $8,846,909 as of December 31, 2016. |
(2) | Building and improvements include tenant origination and absorption costs and other intangible assets. |
(3) | The aggregate cost of real estate for federal income tax purposes was $1.75 billion (unaudited) as of December 31, 2016. |
A summary of activity for real estate and accumulated depreciation for the years ended December 31, 2016, 2015 and 2014:
2016 | 2015 | 2014 | ||||||||||
Real estate: | ||||||||||||
Balance at the beginning of the year | $ | 1,666,901,082 | $ | 1,636,953,413 | $ | 1,519,883,478 | ||||||
Acquisitions | — | — | 130,339,157 | |||||||||
Improvements | 28,485,659 | 30,484,330 | 26,806,872 | |||||||||
Cost of real estate sold | — | — | (22,738,038 | ) | ||||||||
Write-off of disposed and fully depreciated and fully amortized assets | (1,107,783 | ) | (536,661 | ) | (17,338,056 | ) | ||||||
Balance at the end of the year | $ | 1,694,278,958 | $ | 1,666,901,082 | $ | 1,636,953,413 | ||||||
Accumulated depreciation and amortization: | ||||||||||||
Balance at the beginning of the year | $ | 163,445,987 | $ | 98,342,452 | $ | 48,920,319 | ||||||
Depreciation and amortization expense | 69,513,484 | 65,640,196 | 69,681,177 | |||||||||
Write-off of accumulated depreciation and amortization of real estate assets sold | — | — | (2,920,988 | ) | ||||||||
Write-off of disposed and fully depreciated and fully amortized assets | (215,388 | ) | (536,661 | ) | (17,338,056 | ) | ||||||
Balance at the end of the year | $ | 232,744,083 | $ | 163,445,987 | $ | 98,342,452 | ||||||
F-42
SIGNATURES
Pursuant to the requirements of Section 13 or 15(d) of the Securities Exchange Act of 1934, the registrant has duly caused this report to be signed on its behalf by the undersigned, thereunto duly authorized, in the City of Irvine, State of California, on March 16, 2017.
Steadfast Income REIT, Inc.
By: | /s/ Rodney F. Emery |
Rodney F. Emery | |
Chief Executive Officer and Chairman of the Board | |
Pursuant to the requirements of the Securities Exchange Act of 1934, this report has been signed below by the following persons on behalf of the registrant and in the capacities and on the dates indicated.
Name | Title | Date | |||
/s/ Rodney F. Emery | Chief Executive Officer and Chairman of the Board (principal executive officer) | ||||
Rodney F. Emery | March 16, 2017 | ||||
/s/ Kevin J. Keating | Treasurer (principal financial officer and principal accounting officer) | ||||
Kevin J. Keating | March 16, 2017 | ||||
/s/ Ella S. Neyland | |||||
Ella S. Neyland | President and Director | March 16, 2017 | |||
/s/ Scot B. Barker | |||||
Scot B. Barker | Director | March 16, 2017 | |||
/s/ Ned W. Brines | |||||
Ned W. Brines | Director | March 16, 2017 | |||
/s/ Don B. Saulic | |||||
Don B. Saulic | Director | March 16, 2017 | |||