Attached files
| file | filename |
|---|---|
| EX-32.1 - EXHIBIT 32.1 - CALERES INC | exhibit321certificationfy2.htm |
| EX-31.2 - EXHIBIT 31.2 - CALERES INC | exhibit312certificationfy2.htm |
| EX-31.1 - EXHIBIT 31.1 - CALERES INC | exhibit311certificationsfy.htm |
| EX-23 - EXHIBIT 23 - CALERES INC | exhibit23-consentfy2016.htm |
| EX-21 - EXHIBIT 21 - CALERES INC | exhibit21subsidiariesfy2016.htm |
| EX-10.3B(5) - EXHIBIT 10.3B(5) - CALERES INC | exhibit103b5.htm |
| EX-10.2G - EXHIBIT 10.2G - CALERES INC | exhibit102g.htm |
UNITED STATES SECURITIES AND EXCHANGE COMMISSION
Washington, D.C. 20549
FORM 10-K
(Mark One)
þ | ANNUAL REPORT PURSUANT TO SECTION 13 OR 15(d) OF THE SECURITIES EXCHANGE ACT OF 1934 |
For the fiscal year ended January 28, 2017 | |
OR | |
¨ | TRANSITION REPORT PURSUANT TO SECTION 13 OR 15(d) OF THE SECURITIES EXCHANGE ACT OF 1934 |
For the transition period from ____________ to ______________ | |
Commission file number 1-2191
CALERES, INC.
(Exact name of registrant as specified in its charter)
New York | 43-0197190 |
(State or other jurisdiction of incorporation or organization) | (IRS Employer Identification Number) |
8300 Maryland Avenue | 63105 |
St. Louis, Missouri | (Zip Code) |
(Address of principal executive offices) | |
(314) 854-4000
(Registrant’s telephone number, including area code)
Securities Registered Pursuant to Section 12(b) of the Act:
Title of each class | Name of each exchange on which registered |
Common Stock — par value $0.01 per share | New York Stock Exchange |
Securities Registered Pursuant to Section 12(g) of the Act: None
Indicate by check mark if the registrant is a well-known seasoned issuer, as defined in Rule 405 of the Securities Act. Yes þ No ¨
Indicate by check mark if the registrant is not required to file reports pursuant to Section 13 or Section 15(d) of the Act. Yes ¨ No þ
Indicate by check mark whether the registrant: (1) has filed all reports required to be filed by Section 13 or 15(d) of the Securities Exchange Act of 1934 during the preceding 12 months (or for such shorter period that the registrant was required to file such reports), and (2) has been subject to such filing requirements for the past 90 days. Yes þ No ¨
Indicate by check mark whether the registrant has submitted electronically and posted on its corporate Web site, if any, every Interactive Data File required to be submitted and posted pursuant to Rule 405 of Regulation S-T (§ 232.405 of this chapter) during the preceding 12 months (or for such shorter period that the registrant was required to submit and post such files). Yes þ No ¨
Indicate by checkmark if disclosure of delinquent filers pursuant to Item 405 of Regulation S-K is not contained herein, and will not be contained, to the best of registrant’s knowledge, in definitive proxy or information statements incorporated by reference in Part III of this Form 10-K or any amendment to this Form 10-K. þ
Indicate by checkmark whether the registrant is a large accelerated filer, an accelerated filer, a non-accelerated filer, or a smaller reporting company. See the definitions of “large accelerated filer,” “accelerated filer” and “smaller reporting company” in Rule 12b-2 of the Exchange Act:
Large accelerated filer þ | Accelerated filer ¨ | Non-accelerated filer ¨ | Smaller reporting company ¨ |
Indicate by check mark whether the registrant is a shell company (as defined in Rule 12b-2 of the Act). Yes ¨ No þ
The aggregate market value of the stock held by non-affiliates of the registrant as of July 29, 2016, the last business day of the registrant’s most recently completed second fiscal quarter, was approximately $1,082.6 million.
As of February 24, 2017, 42,958,719 common shares were outstanding.
Documents Incorporated by Reference
Portions of the Proxy Statement for the 2017 Annual Meeting of Shareholders are incorporated by reference into Part III.
INTRODUCTION
This Annual Report on Form 10-K is a document that U.S. public companies file with the Securities and Exchange Commission ("SEC") on an annual basis. Part II of the Form 10-K contains the business information and financial statements that many companies include in the financial sections of their annual reports. The other sections of this Form 10-K include further information about our business that we believe will be of interest to investors. We hope investors will find it useful to have all of this information in a single document.
The SEC allows us to report information in the Form 10-K by “incorporating by reference” from another part of the Form 10-K or from the proxy statement. You will see that information is “incorporated by reference” in various parts of our Form 10-K. The proxy statement will be available on our website after it is filed with the SEC in April 2017.
Unless the context otherwise requires, “we,” “us,” “our,” “the Company” or “Caleres” refers to Caleres, Inc. and its subsidiaries.
Information in this Form 10-K is current as of March 28, 2017, unless otherwise specified.
CAUTION REGARDING FORWARD-LOOKING STATEMENTS
In this report, and from time to time throughout the year, we share our expectations for the Company’s future performance. These forward-looking statements include statements about our business plans; the potential development, regulatory approval and public acceptance of our products; our expected financial performance, including sales performance, and the anticipated effect of our strategic actions; the anticipated benefits of acquisitions; the outcome of contingencies, such as litigation; domestic or international economic, political and market conditions; and other factors that could affect our future results of operations or financial position, including, without limitation, statements under the captions “Business,” “Legal Proceedings” and “Management’s Discussion and Analysis of Financial Condition and Results of Operations.” Any statements we make that are not matters of current disclosures or historical fact should be considered forward-looking. Such statements often include words such as “believe,” “expect,” “anticipate,” “intend,” “plan,” “estimate,” “will” and similar expressions. By their nature, these types of statements are uncertain and are not guarantees of our future performance.
Our forward-looking statements represent our estimates and expectations at the time that we make them. However, circumstances change constantly, often unpredictably, and investors should not place undue reliance on these statements. Many events beyond our control will determine whether our expectations will be realized. We disclaim any current intention or obligation to revise or update any forward-looking statements, or the factors that may affect their realization, whether in light of new information, future events or otherwise, and investors should not rely on us to do so. In the interests of our investors, and in accordance with the “safe harbor” provisions of the Private Securities Litigation Reform Act of 1995, Part I. Item 1A. Risk Factors explains some of the important reasons that actual results may be materially different from those that we anticipate.
y
2
INDEX | |
PART I | Page | |
Item 1 | ||
Item 1A | ||
Item 1B | ||
Item 2 | ||
Item 3 | ||
Item 4 | ||
PART II | ||
Item 5 | ||
Item 6 | ||
Item 7 | ||
Item 7A | ||
Item 8 | ||
Item 9 | ||
Item 9A | ||
Evaluation of Disclosure Controls and Procedures | ||
Item 9B | ||
PART III | ||
Item 10 | ||
Item 11 | ||
Item 12 | ||
Item 13 | ||
Item 14 | ||
PART IV | ||
Item 15 | ||
Item 16 | ||
3
PART I |
ITEM 1 | BUSINESS |
Caleres, Inc., originally founded as Brown Shoe Company in 1878 and incorporated in 1913, is a global footwear retailer and wholesaler with annual net sales of $2.6 billion. In May 2015, the shareholders of Brown Shoe Company, Inc. approved a rebranding initiative that changed the name of the company to Caleres, Inc. (the "Company"). Current activities include the operation of retail shoe stores and e-commerce websites as well as the design, sourcing and marketing of footwear for women and men. Our business is seasonal in nature due to consumer spending patterns, with higher back-to-school and Christmas season sales. Traditionally, the third fiscal quarter accounts for a substantial portion of our earnings for the year.
Our net sales are comprised of four major categories: women's footwear, men's footwear, children's footwear and accessories. The percentage of net sales attributable to each category is as follows:
2016 | 2015 | 2014 | ||||
Women's footwear | 63 | % | 63 | % | 64 | % |
Men's footwear | 22 | % | 23 | % | 22 | % |
Children's footwear | 9 | % | 9 | % | 9 | % |
Accessories | 6 | % | 5 | % | 5 | % |
Approximately 67% of footwear sales in 2016 were retail sales, including sales through our e-commerce websites, compared to 66% in 2015 and 67% in 2014, while the remaining 33%, 34% and 33% in the respective years represented wholesale sales.
Employees
We had approximately 12,000 full-time and part-time employees as of January 28, 2017. In the United States, there are no employees subject to union contracts. In Canada, we employ approximately 20 warehouse employees under a union contract, which expires in October 2019.
Competition
With many companies operating retail shoe stores and shoe departments, we compete in a highly fragmented market. Competitors include local, regional and national shoe store chains, department stores, discount stores, mass merchandisers, numerous independent retail operators of various sizes and e-commerce businesses. Quality of products and services, store location, trend-right merchandise selection and availability of brands, pricing, advertising and consumer service are all factors that impact retail competition.
In addition, our wholesale customers sell shoes purchased from competing footwear suppliers. Those competing footwear suppliers own and license brands, many of which are well-known and marketed aggressively. Many retailers, who are our wholesale customers, source directly from factories or through agents. The wholesale footwear business has low barriers to entry, which further intensifies competition.
FAMOUS FOOTWEAR |
Our Famous Footwear segment includes our Famous Footwear stores and Famous.com, and included our Shoes.com subsidiary prior to its sale in December 2014, as further discussed in Note 4 to the consolidated financial statements. Famous Footwear is one of America’s leading family-branded footwear retailers with 1,055 stores at the end of 2016 and net sales of $1.6 billion in 2016. Our core consumers are women who seek leading national brands of casual, athletic and fashionable footwear at a value for themselves and their families.
Famous Footwear stores feature a wide selection of brand-name athletic, casual and dress shoes for the entire family. Brands carried include, among others, Nike, Skechers, Converse, adidas, Vans, Asics, Sperry, New Balance, Bearpaw and Sof Sole, as well as company-owned and licensed brands including, among others, LifeStride, Dr. Scholl’s Shoes, Naturalizer, Fergalicious, Carlos by Carlos Santana and Circus by Sam Edelman. Our company-owned and licensed products are sold to our Famous Footwear segment by our Brand Portfolio segment at a profit and represent approximately 8% of the Famous Footwear segment's net sales. We work closely with our vendors to provide our consumers with fresh product and, in some cases, product exclusively designed for and available only in our stores. Famous Footwear’s average retail price is approximately $42 for footwear with retail price points typically ranging from $25 for shoes up to $220 for boots.
4
Famous Footwear stores are located in strip shopping centers as well as outlet and regional malls in all 50 states, Guam and Canada. The breakdown by venue at the end of each of the last three fiscal years is as follows:
2016 | 2015 | 2014 | |||||
Strip centers | 699 | 697 | 696 | ||||
Outlet malls | 190 | 189 | 183 | ||||
Regional malls | 166 | 160 | 159 | ||||
Total | 1,055 | 1,046 | 1,038 | ||||
We expect to open approximately 40 new stores and close approximately 70 stores in 2017, as we continue to focus on store locations with a greater penetration of high-value consumers. New stores typically experience an initial start-up period characterized by lower sales and operating earnings than what is generally achieved by more mature stores. While the duration of this start-up period may vary by type of store, economic environment and geographic location, new stores typically reach a normal level of profitability within approximately four years.
Famous Footwear relies on merchandise allocation systems and processes that use allocation criteria, consumer segmentation and inventory data in an effort to ensure stores are adequately stocked with product and to differentiate the needs of each store based on location, consumer segmentation and other factors. Famous Footwear’s distribution systems allow for merchandise to be delivered to each store weekly, or on a more frequent basis, as needed. Famous Footwear also uses regional third-party pooled distribution sites across the country.
Famous Footwear’s marketing programs include digital marketing and social media, national television, e-commerce advertising, print, cinema and in-store advertisements, all of which are designed to further develop and reinforce the Famous Footwear concept and strengthen our connection with consumers. We believe the success of our campaigns is attributable to highlighting key categories and tailoring the timing of such messaging to adapt to seasonal shopping patterns. In 2016, we spent approximately $52.5 million to advertise and market Famous Footwear to our target consumers, a portion of which was recovered from suppliers. In 2016, we integrated our high- value consumer strategy and our digital marketing efforts to include new experiences both in-store and online to drive cohesive messaging. Famous Footwear has an extensive loyalty program (“Rewards”), which informs and rewards frequent consumers with product previews, earned incentives based upon purchase continuity and other periodic promotional offers. In 2016, approximately 75% of our Famous Footwear net sales were generated by our Rewards members compared to 74% in 2015. During the year, we expanded our efforts to connect with and engage our consumers to build a strong brand preference for Famous Footwear through both our loyalty program and social media. In 2016, we grew our mobile application and had more than one million members enrolled by the end of the year. In 2017, we will continue to intensify our digital marketing presence to acquire and retain highly valuable consumers.
As part of our omni-channel approach to reach consumers, we also operate Famous.com, which offers an expanded product assortment beyond what is sold in Famous Footwear stores. Accessible via desktop, tablet and mobile devices, Famous.com helps consumers explore product assortments, including items available in local stores, and make purchases. In 2015, we expanded our in-store fulfillment initiative to increase product selection and reduce the average delivery time for direct-to-consumer purchases, which we believe contributed to the significant increase in Famous.com sales in 2016. Famous.com also allows Rewards members to view their points status and purchase history, manage profile settings and engage further with the brand. Famous Footwear’s mobile app further serves as a hub for Rewards members to shop, find local stores, redeem Rewards certificates, and learn about the newest products, latest trends and hottest deals.
In 2016, we invested in our logistics network to meet the omni-channel demands of today, including faster order processing and faster delivery to our customers, as well as to prepare for ongoing growth in our business. The expansion and modernization projects at our distribution centers, which were completed in the second half of 2016, are providing additional shipping flexibility, operational efficiencies and an expansion of our logistics infrastructure capacity.
Until December 2014, we owned and operated Shoes.com, Inc., a pure-play Internet retailing company. Shoes.com offered a diverse selection of footwear and accessories for women, men and children, including footwear purchased from third-party suppliers and the Company's other brands. As further discussed in Note 4 to the consolidated financial statements, we sold Shoes.com in December 2014 and recognized a gain on sale of $4.7 million.
BRAND PORTFOLIO |
Our Brand Portfolio segment offers retailers and consumers a portfolio of leading brands from our Healthy Living and Contemporary Fashion platforms by designing, sourcing and marketing branded footwear for women and men at a variety of price points. Certain of our branded footwear products are sold under brand names that are owned by the Company and others are developed pursuant to licensing
5
agreements. Our Brand Portfolio segment sells footwear on a wholesale basis to retailers. The segment also sells footwear through our branded retail stores and e-commerce businesses. In 2016, we expanded our men's business with the acquisition of Allen Edmonds, as further discussed in the Portfolio of Brands section below and Note 2 to the consolidated financial statements.
Portfolio of Brands
The following is a listing of our principal brands and licensed products:
Healthy Living
Naturalizer: Naturalizer was born in the 1920s when we realized women deserved a better shoe. Our legendary emphasis on "fit" means that we build our design aesthetic with a simple, elegant and utility style in mind. Our flagship Naturalizer brand is sold throughout the United States and Canada, primarily at Naturalizer retail stores, national chains, online retailers, department stores, catalog retailers and independent retailers. At the end of 2016, we operated 153 Naturalizer stores in the United States, Canada and Guam. Naturalizer footwear is also distributed through approximately 35 retail and wholesale partners in 50 countries around the world. Suggested retail price points range from $69 for shoes to $219 for boots.
Dr. Scholl’s Shoes: Inspired by its founder Dr. William Scholl, Dr. Scholl’s Shoes remains forever passionate about creating playful, effortless footwear for a healthy life. With fashion and function in perfect harmony, the brand delivers stylish and accessible shoes with superior comfort for men and women. This footwear reaches consumers at a wide range of distribution channels: mass merchandisers, national chains, online and catalogs, our Famous Footwear retail stores, specialty and independent retailers and department stores. Suggested price points range from $40 for shoes to $200 for boots. We have a long-term license agreement with Bayer HealthCare, LLC to sell Dr. Scholl’s Shoes, which is renewable through December 2026 for the United States and Canada and December 2017 for Latin America.
LifeStride: For more than 70 years, LifeStride has created quality footwear for women who value both style and all-day comfort. Each season, LifeStride delivers the most current looks and must-have styles with a dynamic attitude and distinctive flair, offering a work-to-weekend shoe collection that dresses up or down at the right price. The brand is sold in national chains, our Famous Footwear retail stores, department stores and online at suggested retail price points ranging from $40 for shoes to $100 for boots.
Rykä: For over 25 years, Rykä has been innovating athletic footwear exclusively for women. From the shape of her foot to the angle of her stride, Rykä understands that women require more than just a downsized version of a men’s athletic shoe. The brand is distributed through independent retailers, national chains, online retailers, department stores and our Famous Footwear retail stores at suggested retail price points from $50 to $90.
Contemporary Fashion
Sam Edelman: Since its inception in 2004, designer Sam Edelman’s brand has quickly emerged as a favorite among celebrities and fashionistas around the globe. Sam Edelman captures the imagination of women with on-trend styling and unique materials. Sam Edelman continues to expand its retail presence by opening additional stores. At the end of 2016, we operated twelve Sam Edelman stores in the United States, and expect to open one store in 2017. Sam Edelman footwear is sold primarily at online retailers and catalogs, national chains, department stores, mass merchants and independent retailers at suggested retail price points of $40 for shoes to $378 for boots.
Allen Edmonds: In December 2016, we acquired Allen Edmonds to increase our exposure in men’s footwear, solidifying a new revenue stream to drive overall growth. Allen Edmonds, founded in 1922, is a U.S.-based retailer and wholesaler of premium men’s footwear, apparel, leather goods and accessories with a strong manufacturing heritage. Allen Edmonds’ famous Goodyear welted shoes are handcrafted in Port Washington, Wisconsin using a 212-step production process. Allen Edmonds remains committed to providing excellent products at exceptional value for style and quality-conscious men worldwide. Allen Edmonds products are available at premier stores worldwide and select retailers, including our 69 stores in the United States and Italy, and online at AllenEdmonds.com at suggested retail price points of $160 for shoes to $445 for boots. We expect to open 10 Allen Edmonds stores in 2017.
Franco Sarto: The Franco Sarto brand embodies the spirit of craftsmanship, always attentive to the Italian-inspired details that make each pair work. Professional for work, casual on the weekend or glamorous for a special event, Franco Sarto footwear is for women who love beautifully stylish and wearable shoes for every occasion. The brand is sold in major national chains, online and catalogs, department stores, independent retailers and our Famous Footwear stores at suggested retail price points from $69 for shoes to $275 for boots.
Vince: The Vince women's shoe collection launched in the fall of 2012 and was expanded in 2014 to include the Vince men's footwear collection. Vince delivers contemporary casual footwear that sophisticated, modern women and men wear effortlessly, serving as a luxury staple in their shoe closet. The collection is distinguished by clean lines, rich fabrics and intricate details. The brand is primarily sold in
6
premier department stores, online, national chains and independent retailers at suggested price points ranging from $225 for shoes to $395 for boots. We have a license agreement with Vince, LLC to sell Vince footwear that expires in December 2018.
Carlos by Carlos Santana: The Carlos by Carlos Santana collection of women’s footwear is sold at national chains, major department stores, our Famous Footwear stores and online. Marketed under a license agreement with legendary musician Carlos Santana, this brand targets trend-conscious consumers with hot, fashionable shoes inspired by the passion and energy of Santana’s music. Suggested retail price points range from $60 for shoes to $200 for boots. We have a license agreement with Santana Tesoro, LLC to sell Carlos by Carlos Santana footwear that expires in December 2017, with extension options through December 2020.
Via Spiga: Established in 1985, Via Spiga is named after the main street in one of the most famed shopping districts in Milan, Italy. Via Spiga delivers sleek and architecturally-inspired styles, bringing luxury within reach. The collection has a feel of amped-up femininity for women who like to command attention. Italian design, luxurious materials and beautiful detailing maintain Via Spiga’s rich heritage, reflecting the cosmopolitan woman’s polished and feminine style. The brand is primarily sold in premier department stores, national chains and online at suggested retail price points from $195 for shoes to $495 for boots.
Fergie and Fergalicious by Fergie: We have created two namesake footwear lines in collaboration with entertainment superstar Fergie (Fergie Duhamel, formerly Stacy Ferguson) to fully capture the artist’s confident, individual style in a line of sophisticated, sexy footwear with a glam rock influence. The Fergie brand is currently being sold online, at national chains, department stores and our Famous Footwear retail stores at suggested retail price points of $60 for shoes to $199 for boots. Fergalicious by Fergie is available at Famous Footwear and other national chains at suggested retail price points of $40 for shoes to $90 for boots. We have a license agreement with Krystal Ball Productions to sell Fergie/Fergalicious footwear that expires in December 2018.
Diane von Furstenberg: The Diane von Furstenberg (DVF) brand is a staple of American luxury design. The DVF collection exemplifies feminine, effortless and classic styles that are sold in more than 55 countries worldwide. Suggested price points range from $248 for shoes to $348 for boots. In December 2014, we entered into a license agreement with DVF Studio, LLC to produce and distribute the DVF women's shoe collection, which expires in December 2020, with an extension option through December 2023.
George Brown Bilt: George Brown Bilt launched in 2016. The line takes inspiration from two key elements of George Brown’s legacy - the boots he built for the United States Army during World War I and his farming and hunting boots. George Brown Bilt is a modern men’s brand that echoes our founder’s commitment to innovation, hard work and the American dream of building something from nothing. The brand is primarily sold at national chains, online and department stores at suggested retail price points ranging from $250 for shoes to $495 for boots.
Wholesale
Within our Brand Portfolio segment, footwear is distributed on a wholesale basis to over 1,900 retailers, including national chains, online retailers, department stores, mass merchandisers, independent retailers and catalogs throughout the United States and Canada, as well as approximately 62 other countries (including sales to our retail operations). Our most significant wholesale customers include Famous Footwear and many of the nation’s largest retailers including national chains such as DSW, TJX Corporation (including TJ Maxx and Marshalls), Nordstrom Rack and Ross; online retailers such as Nordstrom.com, Zappos.com and Amazon.com; department stores such as Nordstrom, Macy’s, Dillard's and Bloomingdale's; mass merchandisers such as Walmart and Target; and independent retailers such as QVC and Home Shopping Network. We also sell product to a variety of international retail customers and distributors. The loss of any one or more of our significant customers could have a material negative impact on our Brand Portfolio segment and the Company.
Our Brand Portfolio segment sold approximately 46 million pairs of shoes on a wholesale basis during 2016. We sell footwear to wholesale customers on both a landed and a first-cost basis. Landed sales are those in which we obtain title to the footwear from our overseas suppliers and maintain title until the footwear clears United States customs and is shipped to our wholesale customers. Landed sales generally carry a higher profit rate than first-cost sales as a result of the brand equity associated with the product along with the additional customs, warehousing and logistics services provided to customers and the risks associated with inventory ownership. To allow for the prompt shipment on reorders, we carry inventories of certain styles. First-cost sales are those in which we obtain title to footwear from our overseas suppliers and typically relinquish title to customers at a designated overseas port. Many of these customers then import this product into the United States.
Products sold under license agreements accounted for approximately 26% of the sales of the Brand Portfolio segment in 2016 and 2014, and 27% of the segment's sales in 2015. Caleres also receives royalty revenues for licensing owned brands, including certain brands listed above, to third parties.
7
Retail
Our Brand Portfolio segment also includes retail stores for certain brands, including Naturalizer, Allen Edmonds and Sam Edelman. The number of our Brand Portfolio retail stores at the end of the last three fiscal years was as follows:
2016 | 2015 | 2014 | |||||||
Naturalizer | 153 | 159 | 169 | ||||||
Allen Edmonds | 69 | N/A | N/A | ||||||
Sam Edelman | 12 | 6 | 2 | ||||||
Total | 234 | 165 | 171 | ||||||
At the end of 2016, we operated 85 Naturalizer stores in Canada, 67 Naturalizer stores in the United States and one Naturalizer store in Guam. Of the 153 Naturalizer stores, approximately 49% are concept stores primarily located in regional malls and average approximately 1,200 square feet in size. The other 51% of stores are located in outlet malls and average approximately 2,300 square feet in size. Total Naturalizer store square footage at the end of 2016 was approximately 272,000 compared to 280,000 in 2015. During 2016, we acquired 68 Allen Edmonds stores in the United States and one store in Italy, with total square footage of 106,775. We operated 12 Sam Edelman stores at the end of 2016. During 2017, we expect to open four Naturalizer stores, 10 Allen Edmonds stores and one Sam Edelman store and close 11 Naturalizer stores and one Allen Edmonds store.
In connection with our omni-channel approach to reach consumers, we also operate Naturalizer.com, Naturalizer.ca, AllenEdmonds.com, SamEdelman.com, DrSchollsShoes.com, Ryka.com, LifeStride.com, ViaSpiga.com, FrancoSarto.com, CarlosShoes.com, FergieShoes.com and GeorgeBrownBilt.com, which offer substantially the same product selection to consumers as we sell to our retail partners. Vince.com and DVF.com complement our distribution of those brands.
References to our website addresses do not constitute incorporation by reference of the information contained on the websites and the information contained on the websites is not part of this report.
Marketing
We continue to build on the recognition of our portfolio of brands to create differentiation and consumer loyalty. Our marketing teams are responsible for the development and implementation of marketing programs for each brand, both for us and for our retail partners. In 2016, we spent approximately $22.1 million in advertising and marketing support for our Brand Portfolio segment, including digital marketing and social media, consumer media advertising, trade shows, print, production, public relations and in-store displays and fixtures. The marketing teams are also responsible for driving the development of branding and content for our brand websites. We continually focus on enhancing the effectiveness of these marketing efforts through market research, product development and marketing communications that collectively address the ever-changing lives and needs of our consumers. In 2016, the marketing teams were instrumental in driving record-setting sales on the brand’s websites and executing new product launches, by branding, positioning and marketing to both the consumer and trade audiences. In 2017, we will seek to continue driving consumer engagement and revenue-strengthening business with our key customers and increase market share by targeting new audiences and growth areas, with particular emphasis on awareness, engagement and acquisition in the digital space.
Sourcing and Product Development Operations
Our sourcing and product development operations source and develop footwear for our Brand Portfolio segment and also a portion of the footwear sold by our Famous Footwear segment. We have sourcing and product development offices in St. Louis, China, New York, Port Washington, Italy, Macau, Vietnam, Hong Kong and Ethiopia.
Sourcing Operations
In 2016, the sourcing operations sourced approximately 46 million pairs of shoes through a global network of third-party independent footwear manufacturers. The majority of our footwear sourced is provided by approximately 54 manufacturers operating approximately 78 manufacturing facilities. In certain countries, we use agents to facilitate and manage the development, production and shipment of product. We attribute our ability to achieve consistent quality, competitive prices and on-time delivery to the breadth of these established relationships. While we generally do not have significant contractual commitments with our suppliers, we do enter into sourcing agreements with certain independent sourcing agents. Prior to production, we monitor the quality of all of our footwear components and also inspect the prototypes of each footwear style.
8
In 2016, approximately 74% of the footwear we sourced was from manufacturing facilities in China. The following table provides an overview of our sourcing in 2016:
Country | Millions of Pairs | |
China | 33.7 | |
Vietnam | 9.5 | |
Ethiopia | 1.3 | |
Other | 1.3 | |
Total | 45.8 | |
Product Development Operations
In our Dongguan, China office, we operate a sample-making facility that allows us to have greater control over our product development in terms of accuracy, execution and speed-to-market. We maintain design and product development teams for our brands in St. Louis, China, New York, and Port Washington as well as other select fashion locations, including Italy. These teams, which include independent designers, are responsible for the creation and development of new product styles. Our designers monitor trends in fashion footwear and apparel and work closely with retailers to identify consumer footwear preferences. Our design teams create collections of footwear and work closely with our product development and sourcing offices to convert our designs into new footwear styles.
Our long-range plans include further expansion into new markets outside of China, developing more progressive processes to improve factory capacity and material planning, and continuing to drive excellence in product value and execution in a continually evolving manufacturing landscape.
Backlog
At January 28, 2017, our Brand Portfolio segment had a backlog of unfilled wholesale orders of approximately $263.1 million compared to $274.4 million on January 30, 2016. Most orders are for delivery within the next 90 to 120 days, and although orders are subject to cancellation, we have not experienced significant cancellations in the past. The backlog at any particular time is affected by a number of factors, including seasonality, the continuing trend among customers to reduce the lead time on their orders, capacity shifts at foreign manufacturers and the volume of e-commerce drop ship orders that are received immediately rather than in advance. Accordingly, a comparison of backlog from period to period is not necessarily meaningful and may not be indicative of eventual actual shipments or the growth rate of sales from one period to the next.
AVAILABLE INFORMATION |
Our Internet address is www.caleres.com. Our Internet address is included in this annual report on Form 10-K as an inactive textual reference only. The information contained on our website is not incorporated by reference into this annual report on Form 10-K and should not be considered part of this report. We file annual, quarterly and current reports, proxy statements and other information with the SEC. We make available free of charge our annual report on Form 10-K, quarterly reports on Form 10-Q, current reports on Form 8-K and amendments to those reports filed or furnished, as required by Section 13(a) or 15(d) of the Securities Exchange Act of 1934, through our Internet website as soon as reasonably practicable after we electronically file such material with or furnish it to the SEC. You may access these SEC filings via the hyperlink to a third-party SEC filings website that we provide on our website.
EXECUTIVE OFFICERS OF THE REGISTRANT |
The following is a list of the names and ages of the executive officers of the Company and of the offices held by each person. There is no family relationship between any of the named persons. The terms of the following executive officers will expire in May 2017 or upon their respective successors being chosen and qualified.
9
Name | Age | Current Position |
Diane M. Sullivan | 61 | Chief Executive Officer, President and Chairman of the Board of Directors |
Richard M. Ausick | 63 | Division President – Famous Footwear |
Daniel R. Friedman | 56 | Division President – Global Supply Chain |
Kenneth H. Hannah | 48 | Senior Vice President and Chief Financial Officer |
Douglas W. Koch | 65 | Senior Vice President and Chief Human Resources Officer |
John W. Schmidt | 56 | Division President – Brand Portfolio |
Mark A. Schmitt | 53 | Senior Vice President, Chief Information Officer, Logistics and Customer Care |
The period of service of each officer in the positions listed and other business experience are set forth below.
Diane M. Sullivan, Chairman of the Board of Directors since February 2014. Chief Executive Officer and President since May 2011. President and Chief Operating Officer from March 2006 to May 2011. President from January 2004 to March 2006.
Richard M. Ausick, Division President – Famous Footwear since January 2010. Division President, Caleres Wholesale from July 2006 to January 2010. Senior Vice President and Chief Merchandising Officer of Famous Footwear from January 2002 to July 2006.
Daniel R. Friedman, Division President – Global Supply Chain since January 2010. Senior Vice President, Product Development and Sourcing from July 2006 to January 2010. Managing Director at Camuto Group, Inc. from 2002 to July 2006.
Kenneth H. Hannah, Senior Vice President and Chief Financial Officer since February 2015. Executive Vice President and Chief Financial Officer of JC Penney Company, Inc. from May 2012 to March 2014. Executive Vice President and President–Solar Energy of MEMC Electronic Materials, Inc. and had previously served as Executive Vice President and President–Solar Materials from 2009 to 2012. Senior Vice President and Chief Financial Officer of MEMC Electronic Materials, Inc. from 2006 to 2009.
Douglas W. Koch, Senior Vice President and Chief Human Resources Officer since January 2016. Senior Vice President and Chief Talent and Strategy Officer from January 2011 to January 2016. Senior Vice President and Chief Talent Officer from May 2005 to January 2011. Senior Vice President, Human Resources from March 2002 to May 2005.
John W. Schmidt, Division President - Brand Portfolio since October 2015. Division President – Contemporary Fashion Brands from January 2011 to September 2015. Senior Vice President, Better and Image Brands from January 2010 to January 2011. Senior Vice President and General Manager, Better and Image Brands from March 2008 until January 2010. Various positions, including Vice President, President, Group President of Wholesale Footwear for Nine West Group from September 1998 to February 2008.
Mark A. Schmitt, Senior Vice President, Chief Information Officer, Logistics and Customer Care since February 2013. Senior Vice President and Chief Information Officer from January 2012 through February 2013. Senior Director of Management Information Systems for Express Scripts from 2010 through 2011. Various management information systems positions including Group Director with Anheuser-Busch InBev from 1996 to 2009.
ITEM 1A | RISK FACTORS |
Consumer demand for our products may be adversely impacted by economic conditions and other factors.
Worldwide economic conditions continue to be uncertain. Consumer confidence and spending are strongly influenced by general economic conditions and other factors, including fiscal policy, the changing tax and regulatory environment, interest rates, minimum wage rates, inflation, consumer debt levels, the availability of consumer credit, the liquidity of consumers’ assets, health care costs, currency exchange rates, taxation, energy costs, real estate values, foreclosure rates, unemployment trends, weather conditions, and the economic consequences of military action or terrorist activities. Negative economic conditions generally decrease disposable income and, consequently, consumer purchases of discretionary items like our products. Negative trends in economic conditions could also drive up the cost of our products, which may require us to increase our product prices. These increases in our product costs, and possibly prices, may not be offset by comparable increases in consumer disposable income. As a result, our customers may choose to purchase fewer of our products or purchase the lower-priced products of our competitors, and our business, results of operations, financial condition and cash flows could be adversely affected.
10
If we are unable to anticipate and respond to consumer preferences and fashion trends and successfully apply new technology, we may not be able to maintain or increase our net sales and earnings.
The footwear industry is subject to rapidly changing consumer shopping preferences and patterns and fashion trends. Our products must appeal to a broad range of consumers whose preferences cannot be predicted with certainty and are subject to rapid change. Accordingly, the success of both our wholesale and retail operations depends largely on our ability to anticipate, understand and react to changing consumer demands and preferences, including the recent consumer shift to primarily online shopping. If we fail to successfully anticipate and respond to changes in consumer shopping patterns, demands and fashion trends, develop new products and designs, and implement effective, responsive merchandising and marketing strategies and programs, we could experience lower sales, excess inventories and lower gross margins, any of which could have an adverse effect on our results of operations and financial condition.
We operate in a highly competitive industry.
Competition is intense in the footwear industry. Certain of our competitors are larger and have greater financial, marketing and technological resources than we do; others are able to offer footwear on a lateral basis alongside their apparel products; and others have successfully branded their trademarks as lifestyle brands, resulting in greater competitive advantages. Low barriers to entry into this industry further intensify competition by allowing new companies to easily enter the markets in which we compete. Some of our suppliers further compound these competitive pressures by allowing consumers to purchase their products directly through supplier-maintained Internet sites and retail stores. In addition, retailers aggressively compete on the basis of price, which puts competitive pressure on us to keep our prices low.
We believe that our ability to compete successfully in the footwear industry depends on a number of factors, including style, price, performance, quality, location and service, as well as the strength of our brand names. We remain competitive by increasing awareness of our brands, improving the efficiency of our supply chain and enhancing the style, comfort, fashion and perceived value of our products. However, our competitors may implement more effective marketing campaigns, adopt more aggressive pricing policies, make more attractive offers to potential employees, distribution partners and manufacturers, or respond more quickly to changes in consumer preferences than us. As a result, we may not be able to compete successfully in the future, and increased competition may result in price reductions, reduced gross margins, loss of market share and an inability to generate cash flows that are sufficient to maintain or expand the development and marketing of our products, which could adversely impact our financial results.
We rely primarily on foreign sources of production, which subjects our business to risks associated with international trade.
We rely primarily on foreign sourcing for our footwear products through third-party manufacturing facilities located outside the United States. As is common in the industry, we do not have any long-term contracts with our third-party foreign manufacturers. Foreign sourcing is subject to numerous risks, including trade relations, work stoppages, transportation delays (including delays at foreign and domestic ports) and costs (including customs duties, quotas, tariffs, anti-dumping duties, safeguard measures, cargo restrictions or other trade restrictions), domestic and foreign political instability, foreign currency fluctuations, variable economic conditions, expropriation, nationalization, natural disasters, terrorist acts and military conflict and changes in governmental regulations (including the U.S. Foreign Corrupt Practices Act). At the same time, potential changes in manufacturing preferences, including, but not limited to the following, pose additional risk and uncertainty:
• | Manufacturing capacity may shift from footwear to other industries with manufacturing margins that are perceived to be higher. |
• | Some footwear manufacturers may face labor shortages as workers seek better wages and working conditions in other industries and locations. |
As a result of these risks, there can be no assurance that we will not experience reductions in available production capacity, increases in our manufacturing costs, late deliveries or terminations of our supplier relationships. Furthermore, these sourcing risks are compounded by the lack of diversification in the geographic location of our foreign sourcing and manufacturing. With the majority of our supply originating in China, a substantial portion of our supply could be at risk in the event of any significant negative development related to relations between United States and China.
Although we believe we could find alternative manufacturing sources for the products that we currently source from third-party manufacturing facilities in China or other countries, we may not be able to locate alternative manufacturers on terms as favorable as our current terms, including pricing, payment terms, manufacturing capacity, quality standards and lead times for delivery. In addition, there is substantial competition in the footwear industry for quality footwear manufacturers. Accordingly, our future results will partly depend on our ability to maintain positive working relationships with, and offer competitive terms to, our foreign manufacturers. If supply issues cause us to be unable to provide products consistent with our standards or manufacture our footwear in a cost and time efficient manner, our customers may cancel orders, refuse to accept deliveries or demand reductions in purchase prices, any of which could have a material adverse effect on our business and results of operations.
11
Our operating results depend on preparing accurate sales forecasts and properly managing our inventory levels.
Using sales forecasts, we place orders with manufacturers for some of our products prior to the time we receive all of our customers’ orders to minimize purchasing costs, the time necessary to fill customer orders and the risk of non-delivery. We also maintain an inventory of certain products that we anticipate will be in greater demand. At the retail level, we place orders for product many months in advance of our key selling seasons. Adverse economic conditions and rapidly changing consumer preferences can make it difficult for us and our retail customers to accurately forecast product trends in order to match production with demand. If we fail to accurately assess consumer fashion tastes and the impact of economic factors on consumer spending or to effectively differentiate our retail and wholesale offerings, our inventory levels may exceed customer demand, resulting in inventory write-downs, higher carrying costs, lower gross margins or the sale of excess inventory at discounted prices, which could significantly impact our financial results. Conversely, if we underestimate consumer demand for our products or if our manufacturers fail to supply the quality products that we require in a timely manner, we may experience inventory shortages. Inventory shortages may delay shipments to customers (and possibly require us to offer discounts or costly expedited shipping), negatively impact retailer and distributor relationships, adversely impact our sales results and diminish brand awareness and loyalty.
We are reliant upon our information technology systems, and any major disruption of these systems could adversely impact our ability to effectively operate our business.
Our computer network and systems are essential to all aspects of our operations, including design, pricing, production, forecasting, ordering, manufacturing, transportation, sales and distribution. Our ability to manage and maintain our inventory and to deliver products in a timely manner depends on these systems. If any of these systems fails to operate as expected, we experience problems with transitioning to upgraded or replacement systems, a breach in security occurs or a natural disaster interrupts system functions, we may experience delays in product fulfillment and reduced efficiency in our operations or be required to expend significant capital to correct the problem, which may have an adverse effect on our results of operations and financial condition.
A cybersecurity breach may adversely affect our sales and reputation.
We routinely possess sensitive consumer and associate information. We also provide certain customer and employee data to third parties for analysis, benefit distribution or compliance purposes. While we believe we have taken reasonable and appropriate steps to protect that information, hackers and data thieves operate sophisticated, large-scale attacks that could breach our information systems, despite ongoing security measures. In addition, we are required to comply with increasingly complex regulations designed to protect our business and personal data. Any breach of our network security, a third-party’s network security or failure to comply with applicable regulations may result in (a) the loss of valuable business data and/or our consumers’ or associates’ personal information, (b) increased costs associated with implementing additional protections and processes, (c) a disruption of our business and a loss of sales, (d) negative media attention, (e) damage to our consumer and associate relationships and reputation, and (f) fines or lawsuits.
Transitional challenges with acquisitions could result in unexpected expenditures of time and resources.
Periodically, we pursue acquisitions of other companies or businesses, such as our 2016 acquisition of Allen Edmonds, as further discussed in Note 2 to the consolidated financial statements. Although we review the records of acquisition candidates, the review may not reveal all existing or potential problems. As a result, we may not accurately assess the value of the business and may, accordingly, ultimately assume unknown adverse operating conditions and/or unanticipated liabilities. Acquisitions may also cause the Company to incur debt, write-offs of goodwill if the business does not perform as well as expected and substantial amortization expenses associated with other intangible assets. We face the risk that the returns on acquisitions will not support the expenditures or indebtedness incurred to acquire or launch such businesses. We also face the risk that we will not be able to integrate acquisitions into our existing operations effectively without substantial expense, delay or other operational or financial problems. Integration may be hindered by, among other things, differing procedures, including internal controls, business practices and technology systems. We may need to allocate more management resources to integration than we planned, which may adversely affect our ability to pursue other profitable activities.
Customer concentration and other trends in customer behavior may lead to a reduction in or loss of sales.
Our wholesale customers include national chains, online retailers, department stores, mass merchandisers, independent retailers and catalogs. Several of our customers operate multiple department store divisions. Furthermore, we often sell multiple types of branded, licensed and private-label footwear to these same customers. While we believe purchasing decisions in many cases are made independently by the buyers and merchandisers of each of the customers, a decision by a significant customer to decrease the amount of footwear products purchased from us could have a material adverse effect on our business, financial condition or results of operations.
In addition, with the growing trend toward retail trade consolidation, including store count reductions at major retail chains, we and our wholesale customers increasingly depend upon a reduced number of key retailers whose bargaining strength is growing. This consolidation may result in the following adverse consequences:
12
• | Our wholesale customers may seek more favorable terms for their purchases of our products, which could limit our ability to raise prices, recoup cost increases or achieve our profit goals. |
• | The number of stores that carry our products could decline, thereby exposing us to a greater concentration of accounts receivable risk and negatively impacting our brand visibility. |
We also face the following risks with respect to our customers:
• | Our customers could develop in-house brands or use a higher mix of private-label footwear products, which would negatively impact our sales. |
• | As we sell our products to customers and extend credit based on an evaluation of each customer’s financial condition, the financial difficulties of a customer could cause us to stop doing business with that customer, reduce our business with that customer or be unable to collect from that customer. |
• | Since we transact primarily in United States dollars, our international customers could purchase from competitors who will transact business in their local currency. |
• | If any of our major wholesale customers experiences a significant downturn in its business or fails to remain committed to our products or brands, then these customers may reduce or discontinue purchases from us. |
• | Retailers are directly sourcing more of their products directly from foreign manufacturers and reducing their reliance on wholesalers, which could have a material adverse effect on our business and results of operations. |
A disruption in the effective functioning of our distribution centers could adversely affect our ability to deliver inventory on a timely basis.
We currently use several distribution centers, which are leased or third-party managed. These distribution centers serve as the source of replenishment of inventory for our footwear stores and e-commerce websites operated by our Famous Footwear and Brand Portfolio segments and serve the wholesale operations of our Brand Portfolio segment. We may be unable to successfully manage, negotiate or renew our third-party distribution center agreements, or we may experience complications with respect to our distribution centers, such as substantial damage to, or destruction of, such facilities due to natural disasters or ineffective information technology systems. In such an event, our other distribution centers may not be able to support the resulting additional distribution demands and we may be unable to locate alternative persons or entities capable of fulfilling our distribution needs, resulting in an adverse effect on our ability to deliver inventory on a timely basis.
Our success depends on our ability to retain senior management and recruit and retain other key associates.
Our success depends on our ability to attract, retain and motivate qualified management, administrative, product development and sales personnel to support existing operations and future growth. In addition, our ability to successfully integrate acquired businesses often depends on our ability to retain incumbent personnel, many of whom possess valuable institutional knowledge and operating experience. Competition for qualified personnel in the footwear industry is intense and we compete for these individuals with other companies that in many cases have superior financial and other resources. The loss of the services of any member of our senior management or key associates, the inability to attract and retain other qualified personnel or the inability to effectively transition positions could adversely affect the sales, design and production of our products as well as the implementation of our strategic initiatives.
Foreign currency fluctuations may result in higher costs and decreased gross profits.
Although we purchase most of our products from foreign manufacturers in United States dollars and otherwise engage in foreign currency hedging transactions, we cannot ensure that we will not experience cost variations with respect to exchange rate changes. Currency exchange rate fluctuations may also adversely impact third parties who manufacture the Company’s products by making their purchases of raw materials or other production costs more expensive and more difficult to finance, resulting in higher prices and lower margins for the Company, its distributors and licensees.
Our business, sales and brand value could be harmed by violations of labor, trade or other laws.
We focus on doing business with those suppliers who share our commitment to responsible business practices and the principles set forth in our Production Code of Conduct (the “PCOC”). By requiring our suppliers to comply with the PCOC, we encourage our suppliers to promote best practices and work toward continual improvement throughout their production operations. The PCOC sets forth standards for working conditions and other matters, including compliance with applicable labor practices, workplace environment and compliance with laws. Although we promote ethical business practices, we do not control our suppliers or their labor practices. A failure by any of our suppliers to adhere to these standards or laws could cause us to incur additional costs for our products, could cause negative publicity and harm our business and reputation. We also require our suppliers to meet our standards for product safety, including compliance with applicable laws and standards with respect to safety issues, including lead content in paint. Failure by any of our suppliers to adhere to product safety standards could lead to a product recall, which may result in critical media coverage, harm our business and reputation, and cause us to incur additional costs.
13
In addition, if we, or our suppliers or foreign manufacturers, violate United States or foreign trade laws or regulations, we may be subject to additional duties, significant monetary penalties, the seizure and forfeiture of the products we are attempting to import or the loss of our import privileges. Possible violations of United States or foreign laws or regulations could include inadequate record keeping of our imported products, misstatements or errors as to the origin, classification, marketing or valuation of our imported products, fraudulent visas or labor violations. The effects of these factors could render our conduct of business in a particular country undesirable or impractical and have a negative impact on our operating results.
Our retail business depends on our ability to secure affordable and desirable leased locations without creating a competitive concentration of stores.
The success of the retail business within our Famous Footwear and Brand Portfolio segments depends, in part, on our ability to secure affordable, long-term leases in desirable locations for our leased retail footwear stores and to secure renewals of such leases. As consumer shopping preferences have evolved, we continue to focus on opening stores in locations with a greater penetration of high-value consumers. No assurance can be given that we will be able to successfully negotiate lease renewals for existing stores or obtain acceptable terms for new stores in desirable locations. In addition, opening new stores in our existing markets may result in reduced net sales in existing stores as our stores become more concentrated in the markets we serve. As a result, the number of consumers and financial performance of individual stores may decline and the average sales per square foot at our stores may be reduced.
If we are unable to maintain working relationships with our major branded suppliers, our business, results of operations, financial condition and cash flows may be adversely impacted.
Our Famous Footwear segment purchases a substantial portion of its footwear products from major branded suppliers. Purchases from two major branded suppliers, Nike, Inc. and Skechers USA, Inc., collectively comprise approximately 25% and 12%, respectively, of sales for the Famous Footwear segment. As is common in the industry, we do not have any long-term contracts with our suppliers. In addition, the success of our financial performance is dependent on the ability of our Famous Footwear segment to obtain products from our suppliers on a timely basis and on acceptable terms. While we believe our relationships with our current suppliers are good, the loss of any of our major suppliers or product developed exclusively for our Famous Footwear stores could have a material adverse effect on our business, financial condition and results of operations. In addition, negative trends in global economic conditions may adversely impact our suppliers. If these third parties do not perform their obligations or are unable to provide us with the materials and services we need at prices and terms that are acceptable to us, our ability to meet our consumers’ demand could be adversely affected.
Our reputation and competitive position are dependent on our ability to license well-recognized brands, license our own brands under successful licensing arrangements and protect our intellectual property rights.
Licenses - Company as Licensee
Although we own most of our wholesale brands, we also rely on our ability to attract, retain and maintain good relationships with licensors that have strong, well-recognized brands and trademarks. Our license agreements are generally for an initial term of two to four years, subject to renewal, and there can be no assurance that we will be able to renew these licenses. Even our longer-term or renewable licenses are typically dependent upon our ability to market and sell the licensed products at specified levels, and the failure to meet such levels may result in the termination or non-renewal of such licenses. Furthermore, many of our license agreements require minimum royalty payments, and if we are unable to generate sufficient sales and profitability to cover these minimum royalty requirements, we may be required to make additional payments to the licensors that could have a material adverse effect on our business and results of operations. In addition, because certain of our license agreements are non-exclusive, new or existing competitors may obtain licenses with overlapping product or geographic terms, resulting in increased competition for a particular market.
Licenses - Company as Licensor
We have entered into numerous license agreements with respect to the brands and trademarks that we own. While we have significant control over our licensees’ products and advertising, we generally cannot control their operational and financial issues. If our licensees are not able to meet annual sales and royalty goals, obtain financing, manage their supply chain, control quality and maintain positive relationships with their customers, our business, results of operations and financial position may be adversely affected. While we would likely have the ability to terminate an underperforming license, it may be difficult and costly to locate an acceptable substitute distributor or licensee, and we may experience a disruption in our sales and brand visibility. In addition, although many of our license agreements prohibit the licensees from entering into licensing arrangements with certain of our competitors, they are generally not prohibited from offering, under other brands, the types of products covered by their license agreements with us.
Trademarks
We believe that our trademarks and trade names are important to our success and competitive position because our distinctive marks create a market for our products and distinguish our products from other products. We cannot, however, guarantee that we will be able to secure
14
protection for our intellectual property in the future or that such protection will be adequate for future operations. Furthermore, we face the risk of ineffective protection of intellectual property rights in jurisdictions where we source and distribute our products, some of which do not protect intellectual property rights to the same extent as the United States. If we are unsuccessful in challenging a party’s products on the basis of infringement of our intellectual property rights, continued sales of these products could adversely affect our sales, devalue our brands and result in a shift in consumer preference away from our products. We may face significant expenses and liability in connection with the protection of our intellectual property rights, and if we are unable to successfully protect our rights or resolve intellectual property conflicts with others, our business or financial condition could be adversely affected.
Changes in tax laws, policies and treaties could result in higher taxes, lower profitability, and increased volatility in our financial results.
Our financial results are significantly impacted by our effective tax rates, for both domestic and international operations. Our effective income tax rate could be adversely affected by factors such as changes in the mix of earnings in countries with differing statutory tax rates, changes in the valuation of deferred tax assets and liabilities, changes in permitted deductions, changes in tax laws, interpretations, policies and treaties, the outcome of income tax audits in various jurisdictions and any repatriation of earnings from our international operations. The occurrence of such events may result in higher taxes, lower profitability and increased volatility in our financial results. In addition, President Trump and his administration have indicated that corporate tax reform is a high priority, which may impact us in a variety of ways, including corporate tax rates, the deductibility of certain expenses and potential taxation of foreign earnings (including the taxation of previously unrepatriated foreign earnings). Although we cannot predict whether or in what form any proposed legislation may pass, if enacted, such legislation could have a material adverse impact on our earnings or cash flow.
Our quarterly sales and earnings may fluctuate, which may result in volatility in, or a decline in, our stock price.
Our quarterly sales and earnings can vary due to a number of factors, many of which are beyond our control, including the following:
• | Our Famous Footwear retail business is seasonally weighted to the back-to-school season, which falls in our third fiscal quarter. As a result, the success of our back-to-school offering, which is affected by our ability to anticipate consumer demand and fashion trends, could have a disproportionate impact on our full year results. |
• | In our wholesale business, sales of footwear are dependent on orders from our major customers, and they may change delivery schedules, change the mix of products they order or cancel orders without penalty. |
• | Our wholesale customers set the delivery schedule for shipments of our products, which could cause shifts of sales between quarters. |
• | Our estimated annual tax rate is based on projections of our domestic and international operating results for the year, which we review and revise as necessary each quarter. |
• | Our earnings are also sensitive to a number of factors that are beyond our control, including manufacturing and transportation costs, changes in product sales mix, geographic sales trends, weather conditions, consumer sentiment and currency exchange rate fluctuations. |
As a result of these specific and other general factors, our operating results will vary from quarter to quarter and the results for any particular quarter may not be indicative of results for the full year. Any shortfall in sales or earnings from the levels expected by investors could cause a decrease in the trading price of our common stock.
We are subject to periodic litigation and other regulatory proceedings, which could result in the unexpected expenditure of time and resources.
We are a defendant from time to time in lawsuits and regulatory actions (including environmental matters) relating to our business and to our past operations. Due to the inherent uncertainties of litigation and regulatory proceedings, we cannot accurately predict the ultimate outcome of any such proceedings. An unfavorable outcome could have a material adverse impact on our business, financial condition and results of operations. In addition, regardless of the outcome of any litigation or regulatory proceedings, such proceedings are expensive and will require that we devote substantial resources and executive time to defend, thereby diverting management’s attention and resources that are needed to successfully run our business. See Item 3, Legal Proceedings, for further discussion of pending matters.
A significant portion of our Famous Footwear sales are dependent on our Famous Footwear loyalty program, Rewards, and any decrease in sales from Rewards could have a material adverse impact on our sales.
Rewards is a customer loyalty program that drives sales and traffic for the Famous Footwear segment. Rewards members earn points toward savings certificates for qualifying purchases. Upon reaching specified point values, members are issued a savings certificate, which they may redeem for purchases at Famous Footwear. Approximately 75% of our fiscal 2016 sales within the Famous Footwear segment were generated by our Rewards members. If our Rewards members do not continue to shop at Famous Footwear, our sales may be adversely affected.
15
Our business, results of operations, financial condition and cash flows could be adversely affected by the failure of financial institutions to fulfill their commitments under our Credit Agreement.
The First Amendment to our Fourth Amended and Restated Credit Agreement (the “Credit Agreement”), which matures on December 18, 2019, is provided by a syndicate of financial institutions, with each institution agreeing severally (and not jointly) to make revolving credit loans to us in an aggregate amount of up to $600.0 million in accordance with the terms of the Credit Agreement. In addition, the Credit Agreement provides for an increase at the Company's option by up to $150.0 million. If one or more of the financial institutions participating in the Credit Agreement were to default on its obligation to fund its commitment, the portion of the facility provided by such defaulting financial institution might not be available to us.
If we are unable to maintain our credit rating, our ability to access capital and interest rates may be negatively impacted.
The credit rating agencies periodically review our capital structure and the quality and stability of our earnings. Any negative ratings actions could constrain the capital available to us or our industry and could limit our access to long-term funding or cause such access to be available at a higher borrowing cost for our operations. We are dependent upon our ability to access capital at rates and on terms we determine to be attractive. If our ability to access capital becomes constrained, our interest expense will likely increase, which could adversely affect our financial condition and results of operations.
Changes to Federal overtime regulations could increase our payroll costs.
In May 2016, the U.S. Department of Labor ("DOL") released updated overtime and exemption rules under the Fair Labor Standards Act which increase the minimum salary needed to qualify for the standard white collar employee exemption and the threshold to qualify for a highly compensated employee ("HCE"). Additionally, the updated rules establish a mechanism for automatically increasing the minimum salary and compensation levels every three years. Changes to the overtime and exemption rules may increase the Company's payroll costs and the risk of litigation. The rules had an effective date of December 1, 2016. However, on November 22, 2016, a federal district court temporarily enjoined enforcement of the rules. The final outcome of these proceedings and potential impact to the Company is uncertain.
ITEM 1B | UNRESOLVED STAFF COMMENTS |
There are no unresolved written comments that were received from the SEC staff 180 days or more before the end of our fiscal year relating to our periodic or current reports under the Securities Exchange Act of 1934, as amended.
ITEM 2 | PROPERTIES |
We own our principal executive, sales and administrative offices located in Clayton (“St. Louis”), Missouri.
Our retail operations, included in both our Famous Footwear and Brand Portfolio segments, are conducted throughout the United States, Canada, Guam and Italy and involve the operation of 1,289 shoe stores, including 99 in Canada. All store locations are leased, with approximately 49% of them having renewal options. The footwear sold through our domestic wholesale business is primarily processed through third-party facilities in either Chino, California or Clifton, New Jersey or our leased distribution center in Port Washington, Wisconsin.
The following table summarizes the general location and use of the Company's primary properties:
16
Location | Owned/Leased | Segment | Use | |||
Clayton, Missouri | Owned | Famous Footwear and Brand Portfolio | Principal executive, sales and administrative offices | |||
United States, Canada, Guam and Italy | Leased | Famous Footwear and Brand Portfolio | Retail operations | |||
Lebanon, Tennessee (1) | Leased | Famous Footwear | Distribution center | |||
Bakersfield, California (2) | Leased | Famous Footwear | Distribution center | |||
New York, New York | Leased | Brand Portfolio | Office space and showrooms | |||
Bentonville, Arkansas | Leased | Brand Portfolio | Showrooms | |||
Dallas, Texas | Leased | Brand Portfolio | Showrooms | |||
Perth, Ontario | Owned | Brand Portfolio | Primary Canadian operations | |||
Laval, Quebec | Leased | Brand Portfolio | Office space | |||
China, Minneapolis, Italy, Macau, Vietnam, Hong Kong and Ethiopia | Leased | Brand Portfolio | Office space | |||
Dongguan, China | Leased | Brand Portfolio | Sample-making facility | |||
Dominican Republic | Leased | Brand Portfolio | Manufacturing facility | |||
Port Washington, Wisconsin | Owned | Brand Portfolio | Manufacturing facility, office space, recrafting facility and warehouse | |||
Port Washington, Wisconsin (3) | Leased | Brand Portfolio | Distribution center | |||
(1) | This distribution center is approximately 540,000 square feet. |
(2) | This distribution center is approximately 350,000 square feet. |
(3) | This distribution center is approximately 38,000 square feet. |
We also own a building in Denver, Colorado, which is leased to a third party; and undeveloped land in Colorado and New York. See Item 3, Legal Proceedings, for further discussion of certain of these properties.
ITEM 3 | LEGAL PROCEEDINGS |
We are involved in legal proceedings and litigation arising in the ordinary course of business. In the opinion of management, the outcome of such ordinary course business proceedings and litigation currently pending will not have a material adverse effect on our results of operations or financial position.
Our prior operations included numerous manufacturing and other facilities for which we may have responsibility under various environmental laws to address conditions that may be identified in the future. We are involved in environmental remediation and ongoing compliance activities at several sites and have been notified that we are or may be a potentially responsible party at several other sites. We are remediating, under the oversight of Colorado authorities, contamination at and beneath our owned facility in Colorado (also known as the “Redfield” site) and groundwater and indoor air in residential neighborhoods adjacent to and near the property, which have been affected by solvents previously used at the site and surrounding facilities.
Refer to Note 17 to the consolidated financial statements for additional information related to the Redfield matter and other legal proceedings.
ITEM 4 | MINE SAFETY DISCLOSURES |
Not applicable.
PART II |
ITEM 5 | MARKET FOR REGISTRANT’S COMMON EQUITY, RELATED STOCKHOLDER MATTERS AND ISSUER PURCHASES OF EQUITY SECURITIES |
17
Our common stock is listed on the New York Stock Exchange (“NYSE”) under the trading symbol “CAL.” As of January 28, 2017, we had approximately 3,694 shareholders of record. The following table sets forth the high and low sales prices per share of our common stock as reported on the NYSE and the dividends paid per share for each fiscal quarter during 2016 and 2015.
2016 | 2015 | ||||||||||||||||||||||
Dividend | Dividend | ||||||||||||||||||||||
Low | High | Paid | Low | High | Paid | ||||||||||||||||||
1st Quarter | $ | 23.89 | $ | 29.49 | $ | 0.07 | $ | 27.22 | $ | 33.33 | $ | 0.07 | |||||||||||
2nd Quarter | 21.27 | 27.30 | 0.07 | 28.91 | 33.83 | 0.07 | |||||||||||||||||
3rd Quarter | 23.12 | 26.90 | 0.07 | 27.90 | 33.73 | 0.07 | |||||||||||||||||
4th Quarter | 24.14 | 36.61 | 0.07 | 23.22 | 31.75 | 0.07 | |||||||||||||||||
Restrictions on the Payment of Dividends
The First Amendment to our Fourth Amended and Restated Credit Agreement (the “Credit Agreement”) and the indenture governing our 6.25% senior notes due in 2023 (the “2023 Senior Notes”) limit the amount of dividends that can be declared and paid. However, we do not believe this limitation materially restricts the Board of Directors’ ability to declare or our ability to pay regular quarterly dividends to our common stockholders.
In addition to this limitation, the declaration and payment of dividends and the amount of dividends will depend on our results of operations, financial condition, future prospects and other factors deemed relevant by our Board of Directors.
Issuer Purchases of Equity Securities
The following table represents issuer purchases of equity securities:
Total Number of | Maximum Number | |||||||||||
Total Number | Shares Purchased | of Shares that May | ||||||||||
of Shares | Average Price | as Part of Publicly | Yet Be Purchased | |||||||||
Fiscal Period | Purchased | Paid per Share | Announced Program | Under the Program (1) | ||||||||
October 30, 2016 - November 26, 2016 | — | (2) | $ | — | — | 1,448,500 | ||||||
November 27, 2016 - December 31, 2016 | 1,135 | (2) | $ | 33.55 | — | 1,448,500 | ||||||
January 1, 2017 - January 28, 2017 | — | (2) | $ | — | — | 1,448,500 | ||||||
Total | 1,135 | (2) | $ | 33.55 | — | 1,448,500 | ||||||
(1) | On August 25, 2011, the Board of Directors approved a stock repurchase program authorizing the repurchase of up to 2,500,000 shares of our outstanding common stock. We can use the repurchase program to repurchase shares on the open market or in private transactions from time to time, depending on market conditions. The repurchase program does not have an expiration date. Under this plan, 900,000 and 151,500 shares were repurchased during 2016 and 2015, respectively. Therefore, there were 1,448,500 shares authorized to be repurchased under the program as of January 28, 2017. Our repurchases of common stock are limited under our debt agreements. |
(2) | Reflects shares that were tendered by employees related to certain share-based awards. These shares were tendered in satisfaction of the exercise price of stock options and/or to satisfy minimum tax withholding amounts for non-qualified stock options, restricted stock and stock performance awards. Accordingly, these share purchases are not considered a part of our publicly announced stock repurchase program. |
18
Stock Performance Graph
The following performance graph compares the cumulative total return on our common stock with the cumulative total return of the following indices: (i) the S&P© SmallCap 600 Stock Index and (ii) a peer group of companies believed to be engaged in similar businesses. Our peer group consists of DSW, Inc., Genesco, Inc., Shoe Carnival, Inc., Skechers U.S.A., Inc., Steven Madden, Ltd. and Wolverine World Wide, Inc.
Our fiscal year ends on the Saturday nearest to each January 31. Accordingly, share prices are as of the last business day in each fiscal year. The graph assumes that the value of the investment in our common stock and each index was $100 at January 28, 2012. The graph also assumes that all dividends were reinvested and that investments were held through January 28, 2017. These indices are included for comparative purposes only and do not necessarily reflect management’s opinion that such indices are an appropriate measure of the relative performance of the stock involved and are not intended to forecast or be indicative of possible future performance of the common stock.
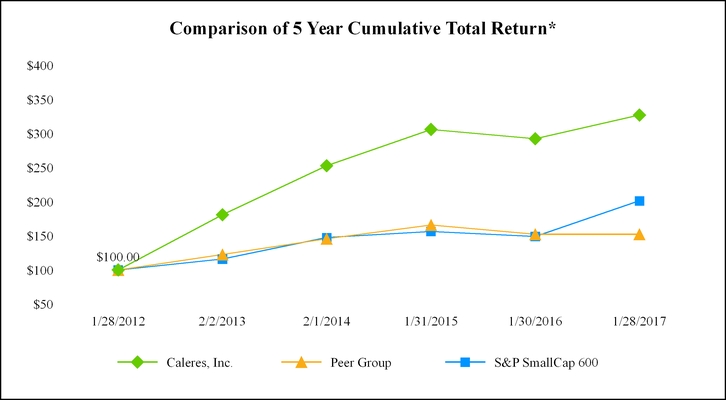
*$100 invested on January 28, 2012 in stock or index, including reinvestment of dividends. Index calculated on month-end basis.
1/28/2012 | 2/2/2013 | 2/1/2014 | 1/31/2015 | 1/30/2016 | 1/28/2017 | ||||||||||||||||||
Caleres, Inc. | $ | 100.00 | $ | 180.78 | $ | 252.76 | $ | 306.04 | $ | 292.41 | $ | 326.99 | |||||||||||
Peer Group | 100.00 | 122.70 | 145.73 | 165.71 | 152.26 | 152.17 | |||||||||||||||||
S&P© SmallCap 600 Stock Index | 100.00 | 116.03 | 147.39 | 156.46 | 149.13 | 201.32 | |||||||||||||||||
ITEM 6 | SELECTED FINANCIAL DATA |
The selected financial data set forth below should be read in conjunction with the consolidated financial statements and notes thereto and the other information contained elsewhere in this report. Our accounting period is based upon a traditional retail calendar, which ends on the Saturday nearest January 31. Periodically, this results in a fiscal year that includes 53 weeks which can affect annual comparisons. Our 2016, 2015, 2014, and 2013 fiscal years each included 52 weeks, while our 2012 fiscal year included 53 weeks.
19
2016 | 2015 | 2014 | 2013 | 2012 | ||||||||||||||||
($ thousands, except per share amounts) | (52 Weeks) | (52 Weeks) | (52 Weeks) | (52 Weeks) | (53 Weeks) | |||||||||||||||
Operations: | ||||||||||||||||||||
Net sales | $ | 2,579,388 | $ | 2,577,430 | $ | 2,571,709 | $ | 2,513,113 | $ | 2,477,796 | ||||||||||
Cost of goods sold | 1,517,397 | 1,529,627 | 1,531,609 | 1,498,825 | 1,489,221 | |||||||||||||||
Gross profit | 1,061,991 | 1,047,803 | 1,040,100 | 1,014,288 | 988,575 | |||||||||||||||
Selling and administrative expenses | 927,602 | 912,696 | 910,682 | 909,749 | 891,666 | |||||||||||||||
Restructuring and other special charges, net | 23,404 | — | 3,484 | 1,262 | 22,431 | |||||||||||||||
Impairment of assets held for sale | — | — | — | 4,660 | — | |||||||||||||||
Operating earnings | 110,985 | 135,107 | 125,934 | 98,617 | 74,478 | |||||||||||||||
Interest expense | (15,111 | ) | (16,589 | ) | (20,445 | ) | (21,254 | ) | (22,973 | ) | ||||||||||
Loss on early extinguishment of debt | — | (10,651 | ) | (420 | ) | — | — | |||||||||||||
Interest income | 1,380 | 899 | 379 | 377 | 322 | |||||||||||||||
Gain on sale of subsidiary | — | — | 4,679 | — | — | |||||||||||||||
Earnings before income taxes | 97,254 | 108,766 | 110,127 | 77,740 | 51,827 | |||||||||||||||
Income tax provision | (31,168 | ) | (26,942 | ) | (27,184 | ) | (23,758 | ) | (16,656 | ) | ||||||||||
Net earnings | 66,086 | 81,824 | 82,943 | 53,982 | 35,171 | |||||||||||||||
Discontinued operations: | ||||||||||||||||||||
Loss from discontinued operations, net of tax | — | — | — | (4,574 | ) | (4,437 | ) | |||||||||||||
Disposition/impairment of discontinued operations, net of tax | — | — | — | (11,512 | ) | (3,530 | ) | |||||||||||||
Net loss from discontinued operations | — | — | — | (16,086 | ) | (7,967 | ) | |||||||||||||
Net earnings | 66,086 | 81,824 | 82,943 | 37,896 | 27,204 | |||||||||||||||
Net earnings (loss) attributable to noncontrolling interests | 428 | 345 | 93 | (177 | ) | (287 | ) | |||||||||||||
Net earnings attributable to Caleres, Inc. | $ | 65,658 | $ | 81,479 | $ | 82,850 | $ | 38,073 | $ | 27,491 | ||||||||||
Operations: | ||||||||||||||||||||
Return on net sales | 2.5 | % | 3.2 | % | 3.2 | % | 1.5 | % | 1.1 | % | ||||||||||
Return on beginning Caleres, Inc. shareholders' equity | 10.9 | % | 15.1 | % | 17.4 | % | 9.0 | % | 6.7 | % | ||||||||||
Return on average invested capital (1) | 8.8 | % | 12.6 | % | 11.6 | % | 9.1 | % | 6.5 | % | ||||||||||
Dividends paid | $ | 12,104 | $ | 12,253 | $ | 12,237 | $ | 12,105 | $ | 12,011 | ||||||||||
Purchases of property and equipment | $ | 50,523 | $ | 73,479 | $ | 44,952 | $ | 43,968 | $ | 55,801 | ||||||||||
Capitalized software | $ | 9,039 | $ | 7,735 | $ | 5,086 | $ | 5,235 | $ | 7,928 | ||||||||||
Depreciation and amortization (2) | $ | 57,857 | $ | 52,606 | $ | 54,015 | $ | 57,842 | $ | 57,344 | ||||||||||
Per Common Share: | ||||||||||||||||||||
Basic earnings (loss) per common share: | ||||||||||||||||||||
From continuing operations | $ | 1.52 | $ | 1.86 | $ | 1.90 | $ | 1.25 | $ | 0.83 | ||||||||||
From discontinued operations | — | — | — | (0.37 | ) | (0.19 | ) | |||||||||||||
Basic earnings per common share attributable to Caleres, Inc. shareholders | 1.52 | 1.86 | 1.90 | 0.88 | 0.64 | |||||||||||||||
Diluted earnings (loss) per common share: | ||||||||||||||||||||
From continuing operations | 1.52 | 1.85 | 1.89 | 1.25 | 0.83 | |||||||||||||||
From discontinued operations | — | — | — | (0.37 | ) | (0.19 | ) | |||||||||||||
Diluted earnings per common share attributable to Caleres, Inc. shareholders | 1.52 | 1.85 | 1.89 | 0.88 | 0.64 | |||||||||||||||
Dividends paid | 0.28 | 0.28 | 0.28 | 0.28 | 0.28 | |||||||||||||||
Ending Caleres, Inc. shareholders’ equity | 14.27 | 13.78 | 12.36 | 10.99 | 9.91 | |||||||||||||||
20
($ thousands, except per share amounts) | 2016 | 2015 | 2014 | 2013 | 2012 | |||||||||||||||
Financial Position: | ||||||||||||||||||||
Receivables, net | $ | 153,121 | $ | 153,664 | $ | 136,646 | $ | 129,217 | $ | 111,392 | ||||||||||
Inventories, net | 585,764 | 546,745 | 543,103 | 547,531 | 503,688 | |||||||||||||||
Working capital | 316,150 | 484,766 | 420,609 | 420,735 | 306,781 | |||||||||||||||
Property and equipment, net | 219,196 | 179,010 | 149,743 | 143,560 | 144,856 | |||||||||||||||
Total assets | 1,475,273 | 1,303,323 | 1,214,327 | 1,146,340 | 1,170,332 | |||||||||||||||
Borrowings under revolving credit agreement | 110,000 | — | — | 7,000 | 105,000 | |||||||||||||||
Long-term debt | 197,003 | 196,544 | 196,712 | 195,947 | 195,182 | |||||||||||||||
Caleres, Inc. shareholders’ equity | 613,117 | 601,484 | 540,910 | 476,699 | 425,129 | |||||||||||||||
Average common shares outstanding – basic | 42,026 | 42,455 | 42,071 | 41,356 | 40,659 | |||||||||||||||
Average common shares outstanding – diluted | 42,181 | 42,656 | 42,274 | 41,653 | 40,794 | |||||||||||||||
All data presented reflects the fiscal year ended on the Saturday nearest to January 31. Certain prior period amounts have been reclassified to conform to current period presentation. These reclassifications did not affect net earnings attributable to Caleres, Inc. Refer to Item 7, Management’s Discussion and Analysis of Financial Condition and Results of Operations, for additional information related to the selected financial data above.
(1) | Return on average invested capital is calculated by dividing operating earnings for the period, adjusted for income taxes at the applicable effective rate, by the average of each month-end invested capital balance during the year. Invested capital is defined as Caleres, Inc. shareholders’ equity plus long-term debt and borrowings under the Credit Agreement. |
(2) | Depreciation and amortization includes depreciation of property and equipment and amortization of capitalized software, intangibles and debt issuance costs and debt discount. The amortization of debt issuance costs and debt discount is reflected within interest expense in our consolidated statement of earnings and totaled $1.7 million in 2016, $1.2 million in 2015, $2.4 million in 2014, $2.5 million in 2013 and $2.6 million in 2012. |
ITEM 7 | MANAGEMENT’S DISCUSSION AND ANALYSIS OF FINANCIAL CONDITION AND RESULTS OF OPERATIONS |
OVERVIEW |
Business Overview
We are a global footwear company with annual net sales of $2.6 billion. Our shoes are worn by people of all ages and from all walks of life. Our mission is to inspire people to feel better feet first. We offer the consumer a powerful portfolio of footwear stores and global footwear brands. As both a retailer and a wholesaler, we have a perspective on the marketplace that enables us to serve consumers from different vantage points. We believe our diversified business model provides us with synergies by spanning consumer segments, categories and distribution channels. A combination of talent acquisition, thoughtful planning and rigorous execution is key to our success in optimizing our business and portfolio of brands. Our business strategy is focused on continuing to evolve our portfolio of brands, driving profit growth to achieve our financial targets, investing in avenues of growth while refocusing our resources, and remaining consumer centric.
Famous Footwear
Our Famous Footwear segment includes our Famous Footwear stores as well as Famous.com. Famous Footwear is one of America’s leading family–branded footwear retailers with 1,055 stores at the end of 2016 and net sales of $1.6 billion in 2016. Our focus for the Famous Footwear segment is on meeting the needs of a well-defined consumer by providing an assortment of trend-right, brand-name fashion and athletic footwear at a great price, coupled with exclusive products and engaging marketing programs. As further discussed in Note 4 to the consolidated financial statements, Shoes.com, which was previously included in our Famous Footwear segment, was sold in December of 2014.
Brand Portfolio
Our Brand Portfolio segment is consumer-focused and we believe our success is dependent upon our ability to strengthen consumers’ preference for our brands by offering compelling style, quality, differentiated brand promises and innovative marketing campaigns. The segment is comprised of the Naturalizer, Sam Edelman, Dr. Scholl's Shoes, Franco Sarto, LifeStride, Vince, Carlos, Via Spiga, Fergie, Rykä, Allen Edmonds, Diane von Furstenberg and George Brown Bilt brands. Through these brands, we offer our customers a diversified selection of footwear, each designed and targeted to a specific consumer segment within the marketplace. We are able to showcase many of our brands in our retail stores and online, leveraging our wholesale and retail platforms, sharing consumer insights across our businesses and testing new and innovative products. Our Brand Portfolio segment operates 234 retail stores in the United States, Canada, Guam and Italy for our Naturalizer, Allen Edmonds (acquired in 2016) and Sam Edelman brands. This segment also includes our e-commerce businesses that sell our branded footwear.
21
Allen Edmonds Acquisition
On December 13, 2016, we acquired the Allen Edmonds business for $260.6 million, which was funded under our existing credit agreement. Allen Edmonds is a leading U.S.-based retailer and wholesaler of premium men’s footwear, apparel, leather goods and accessories with a strong manufacturing heritage. We believe the acquisition of Allen Edmonds complements our brand and product offerings within our Brand Portfolio segment, increasing our exposure in men’s footwear, and solidifying a new revenue stream to drive overall growth.
The Allen Edmonds business contributed $24.3 million in net sales during the period we owned them during 2016. The earnings impact for 2016 was not significant. However, we anticipate the acquisition will be accretive in 2017 and beyond. We incurred acquisition and integration expenses of $7.0 million ($0.13 per diluted share) during 2016, including $1.2 million of incremental costs of goods sold related to the amortization of the inventory adjustment required for purchase accounting. Refer to Note 2 and Note 4 to the consolidated financial statements for further discussion.
Financial Highlights
During 2016, we took proactive steps to maintain our consistent approach of managing the areas under our control, while investing for growth, despite a promotional and challenging retail environment. We experienced an increase in gross profit of $14.2 million driven by our Brand Portfolio segment, due in part to our acquisition of the Allen Edmonds business during the fourth quarter of 2016. In our Famous Footwear segment, we experienced an increase in net sales, primarily driven by a 0.6% increase in same-store sales and a net increase in new and closed stores. Despite an overall increase in net sales, we experienced a decline in operating earnings, due in part to restructuring and other special charges.
The following is a summary of the financial highlights for 2016:
• | Consolidated net sales increased $2.0 million, or 0.1%, to $2,579.4 million in 2016, compared to $2,577.4 million last year. The growth was driven by our Famous Footwear segment, which reported a net sales increase of $17.4 million, partially offset by a decrease in our Brand Portfolio segment, a portion of which was a planned reduction of lower margin categories. Our acquisition of Allen Edmonds contributed $19.3 million in retail sales and $5.0 million in wholesale sales during 2016. |
• | Consolidated operating earnings declined to $111.0 million in 2016, compared to $135.1 million last year, primarily driven by $23.4 million in restructuring and other special charges, partially offset by a higher consolidated gross profit rate. |
• | Consolidated net earnings attributable to Caleres, Inc. were $65.7 million, or $1.52 per diluted share, in 2016, compared to $81.5 million, or $1.85 per diluted share, last year. |
The following items should be considered in evaluating the comparability of our 2016 and 2015 results:
• | Impairment of Shoes.com note receivable – We incurred costs of $8.0 million ($4.9 million on an after-tax basis, or $0.11 per diluted share) during 2016 primarily associated with the impairment of the convertible note received as partial consideration in the 2014 disposition of Shoes.com. Refer to Note 4 to the consolidated financial statements for additional information. |
• | Impairment of investment in nonconsolidated affiliate – We incurred an impairment charge of $7.0 million ($7.0 million on an after-tax basis, or $0.16 per diluted share) during 2016 related to our investment in a nonconsolidated affiliate. Refer to Note 4 to the consolidated financial statements for further discussion. |
• | Acquisition and integration costs – We incurred costs of $7.0 million ($5.7 million on an after-tax basis, or $0.13 per diluted share) during 2016 related to the acquisition and integration of Allen Edmonds. Approximately $5.8 million is recorded in restructuring and other special charges. An additional $1.2 million related to the amortization of the inventory adjustment required for purchase accounting is included in cost of goods sold. Refer to Note 2 and Note 4 to the consolidated financial statements for additional information. |
• | Brand Portfolio business exits and restructuring – We incurred costs of $4.2 million ($3.3 million on an after-tax basis, or $0.08 per diluted share) during 2016 primarily related to the planned exit of our international e-commerce business and other restructuring. Approximately $2.6 million is included in restructuring and other special charges and $1.6 million is included in cost of goods sold. Refer to Note 4 to the consolidated financial statements for additional information. |
• | Incentive plans - Our selling and administrative expenses decreased $14.6 million during 2016 compared to last year due to lower anticipated payments under our cash and stock-based incentive plans. |
22
• | Loss on early extinguishment of debt – During 2015, we incurred a loss of $10.7 million ($6.5 million on an after-tax basis, or $0.15 per diluted share) related to the redemption of our senior notes due in 2019 prior to maturity, as further discussed in Note 10 to the consolidated financial statements. |
Our debt-to-capital ratio, as defined in the Liquidity and Capital Resources – Working Capital and Cash Flow section, was 33.3% as of January 28, 2017, compared to 24.6% at January 30, 2016, primarily reflecting an increase in borrowings under our revolving line of credit related to the acquisition of the Allen Edmonds business. Our current ratio, as defined in the Liquidity and Capital Resources – Working Capital and Cash Flow section, was 1.60 to 1 at January 28, 2017, compared to 2.24 to 1 at January 30, 2016.
Outlook for 2017
In 2017, we will strive to respond rapidly to changing consumer shopping behaviors and also to capitalize on the strategic investments we have made, including Allen Edmonds and the expansion and modernization project at our Lebanon distribution center. We expect same-store sales at Famous Footwear will grow in the low single-digit percentage range in 2017, as retail pressure continues based on the current environment. Our Brand Portfolio net sales are expected to increase in the high teens percentage range, inclusive of our Allen Edmonds business.
Following are the consolidated results and results by segment for 2016, 2015 and 2014:
CONSOLIDATED RESULTS | ||||||||||||||||||
2016 | 2015 | 2014 | ||||||||||||||||
% of | % of | % of | ||||||||||||||||
($ millions) | Net Sales | Net Sales | Net Sales | |||||||||||||||
Net sales | $ | 2,579.4 | 100.0 | % | $ | 2,577.4 | 100.0 | % | $ | 2,571.7 | 100.0 | % | ||||||
Cost of goods sold | 1,517.4 | 58.8 | % | 1,529.6 | 59.3 | % | 1,531.6 | 59.6 | % | |||||||||
Gross profit | 1,062.0 | 41.2 | % | 1,047.8 | 40.7 | % | 1,040.1 | 40.4 | % | |||||||||
Selling and administrative expenses | 927.6 | 36.0 | % | 912.7 | 35.4 | % | 910.7 | 35.4 | % | |||||||||
Restructuring and other special charges, net | 23.4 | 0.9 | % | — | — | 3.5 | 0.1 | % | ||||||||||
Operating earnings | 111.0 | 4.3 | % | 135.1 | 5.2 | % | 125.9 | 4.9 | % | |||||||||
Interest expense | (15.1 | ) | (0.6 | )% | (16.5 | ) | (0.6) | % | (20.5 | ) | (0.8) | % | ||||||
Loss on early extinguishment of debt | — | — | (10.7 | ) | (0.4 | )% | (0.4 | ) | (0.0 | )% | ||||||||
Interest income | 1.4 | 0.1 | % | 0.9 | 0.0 | % | 0.4 | 0.0 | % | |||||||||
Gain on sale of subsidiary | — | — | — | — | 4.7 | 0.2 | % | |||||||||||
Earnings before income taxes | 97.3 | 3.8 | % | 108.8 | 4.2 | % | 110.1 | 4.3 | % | |||||||||
Income tax provision | (31.2 | ) | (1.2 | )% | (27.0 | ) | (1.0) | % | (27.2 | ) | (1.1) | % | ||||||
Net earnings | 66.1 | 2.6 | % | 81.8 | 3.2 | % | 82.9 | 3.2 | % | |||||||||
Net earnings attributable to noncontrolling interests | 0.4 | 0.0 | % | 0.3 | 0.0 | % | 0.1 | 0.0 | % | |||||||||
Net earnings attributable to Caleres, Inc. | $ | 65.7 | 2.6 | % | $ | 81.5 | 3.2 | % | $ | 82.8 | 3.2 | % | ||||||
Net Sales
Net sales increased $2.0 million, or 0.1%, to $2,579.4 million in 2016, compared to $2,577.4 million last year, primarily driven by our Famous Footwear segment, which reported a $17.4 million, or 1.1%, increase in net sales, reflecting a 0.6% increase in same-store sales and a net increase in new and closed stores. Net sales of our Brand Portfolio segment declined $15.5 million in 2016, driven by lower net sales of our Dr. Scholl's Shoes, Naturalizer and LifeStride brands, a portion of which reflects the planned reduction of lower margin categories, partially offset by higher sales from our Carlos, Vince and Rykä brands. We acquired the Allen Edmonds business on December 13, 2016. Allen Edmonds contributed $19.3 million in retail sales and $5.0 million in wholesale sales during 2016. Our Brand Portfolio retail sales benefited from the acquisition of Allen Edmonds, but net sales were partially offset by a decrease in same-store sales of 2.9% and a lower Canadian dollar exchange rate.
Net sales increased $5.7 million, or 0.2%, to $2,577.4 million in 2015, compared to $2,571.7 million in 2014, primarily driven by our Brand Portfolio segment, which reported a $22.3 million, or 2.3%, increase in net sales. The increase reflects strong performance from many of our brands. Our Brand Portfolio retail net sales were impacted by a lower Canadian dollar exchange rate, a lower store count and a 0.7% decrease in same-store sales. Our Famous Footwear segment reported a $16.6 million decrease in net sales, primarily driven by the disposition of Shoes.com in December of 2014, partially offset by a 1.9% increase in same-store sales at our Famous Footwear retail stores.
23
Excluding Shoes.com, which contributed $45.7 million of net sales in 2014, our Famous Footwear segment net sales were $29.1 million, or 1.9% higher in 2015 than 2014. Excluding Shoes.com, our consolidated net sales were $51.4 million, or 2.0% higher in 2015 than 2014.
Same-store sales changes are calculated by comparing the sales in stores that have been open at least 13 months. Relocated stores are treated as new stores, and closed stores are excluded from the calculation. Sales change from new and closed stores, net, reflects the change in net sales due to stores that have been opened or closed during the period and are thereby excluded from the same-store sales calculation. E-commerce sales for those websites that function as an extension of a retail chain are included in the same-store sales calculation.
Gross Profit
Gross profit increased $14.2 million, or 1.4%, to $1,062.0 million in 2016, compared to $1,047.8 million last year. As a percentage of net sales, our gross profit rate increased to 41.2% in 2016, compared to 40.7% in 2015, primarily resulting from an improved mix of our higher margin brands, including the planned exit of some lower margin categories, lower inventory markdowns and a higher consolidated mix of retail versus wholesale sales. Gross profit rates on retail sales are higher than wholesale sales. In aggregate, retail and wholesale net sales were 67% and 33%, respectively, in 2016 compared to 66% and 34% in 2015. These improvements were partially offset by $1.2 million of incremental cost of goods sold related to the amortization of the inventory adjustment required for purchase accounting for our recent Allen Edmonds acquisition and $1.6 million of inventory markdowns associated with the planned exit of our China e-commerce business.
Gross profit increased $7.7 million, or 0.7%, to $1,047.8 million in 2015, compared to $1,040.1 million in 2014. As a percentage of net sales, our gross profit rate increased to 40.7% in 2015, compared to 40.4% in 2014, driven by our Famous Footwear segment, which reported a gross profit rate of 44.9% for 2015, compared to 44.4% in 2014 driven in part by the disposition of Shoes.com. Our Shoes.com business achieved lower margins than the rest of the Famous Footwear segment due to the higher expenses for freight and customer returns inherent in the e-commerce business. This impact was partially offset by a higher consolidated mix of wholesale versus retail sales. In aggregate, retail and wholesale net sales were 66% and 34%, respectively, in 2015 compared to 67% and 33% in 2014.
We classify warehousing, distribution, sourcing and other inventory procurement costs in selling and administrative expenses. Accordingly, our gross profit and selling and administrative expenses rates, as a percentage of net sales, may not be comparable to other companies.
Selling and Administrative Expenses
Selling and administrative expenses increased $14.9 million, or 1.6%, to $927.6 million in 2016, compared to $912.7 million last year. The increase reflects higher costs attributable to our expanded store base, including our recently acquired Allen Edmonds business, and higher warehouse and distribution costs, due in part to our expanded distribution center in Lebanon, Tennessee, partially offset by lower expenses related to cash-based incentive compensation. As a percentage of net sales, selling and administrative expenses increased to 36.0% in 2016 from 35.4% last year.
Selling and administrative expenses increased $2.0 million, or 0.2%, to $912.7 million in 2015, compared to $910.7 million in 2014, driven by a $14.2 million increase in our Brand Portfolio segment expenses due to the expansion of several of our brands and a new warehouse service provider in China. This was partially offset by an $11.6 million decrease in unallocated corporate administrative and other costs due to lower pension expense, lower variable compensation expense for directors and certain employees and a gain on the sale of a vacant building at our Corporate headquarters. As a percentage of net sales, selling and administrative expenses were 35.4% in 2015, consistent with 2014.
Restructuring and Other Special Charges, Net
Restructuring and other special charges of $23.4 million were incurred in 2016 related to the impairment of the Shoes.com note receivable, the impairment of our investment in a nonconsolidated affiliate, the acquisition and integration of Allen Edmonds, the planned exit of our China e-commerce business and other organizational changes within our Brand Portfolio segment. There were no restructuring and other special charges in 2015. Restructuring and other special charges were $3.5 million in 2014 which reflected $1.9 million related to organizational changes and $1.5 million related to the disposition of Shoes.com. Refer to Note 4 to the consolidated financial statements for additional information related to these charges.
Operating Earnings
Operating earnings decreased $24.1 million, or 17.9%, to $111.0 million in 2016, compared to $135.1 million last year, primarily driven by an increase in restructuring and other special charges, partially offset by a higher gross profit rate. Operating earnings at our Famous Footwear segment declined $25.3 million, reflecting lower product margins and higher rent, freight and distribution expenses. However, we achieved a $9.6 million improvement in operating earnings at our Brand Portfolio segment, driven by gross margin expansion.
24
Operating earnings increased $9.2 million, or 7.3%, to $135.1 million in 2015, compared to $125.9 million in 2014, primarily driven by higher gross profit rate. In addition, operating earnings in 2015 benefited from the impact of no restructuring and other special charges in 2015, partially offset by higher selling and administrative expenses, as discussed above.
Interest Expense
Interest expense decreased $1.4 million, or 8.9%, to $15.1 million in 2016, compared to $16.5 million last year. In 2016 and 2015, we capitalized interest of $1.4 million and $0.3 million, respectively, associated with the expansion and modernization of our Lebanon, Tennessee distribution center. The decrease in interest expense in 2016 also reflects lower interest expense on our senior notes as a result of the 2015 redemption of our senior notes due in 2019 ("2019 Senior Notes") and the issuance of senior notes due in 2023 ("2023 Senior Notes") reducing our interest rate from 7.125% to 6.25%, as further discussed in Liquidity and Capital Resources, partially offset by higher interest on our revolving credit agreement, which was used to fund the acquisition of Allen Edmonds in the fourth quarter of 2016.
Interest expense decreased $4.0 million, or 18.9%, to $16.5 million in 2015, compared to $20.5 million in 2014. The decrease in interest expense in 2015 reflects lower average borrowings under our revolving credit agreement and lower interest on our senior notes. In 2015, we capitalized interest of $0.3 million, with no corresponding amount capitalized in 2014.
Loss on Early Extinguishment of Debt
During 2015, we incurred a loss of $10.7 million related to the redemption of our 2019 senior notes prior to maturity, as further discussed in Note 10 to the consolidated financial statements, with no corresponding costs in 2016. During 2014, we incurred a loss of $0.4 million reflecting the early extinguishment of the former revolving credit agreement prior to maturity.
Gain on Sale of Subsidiary
In 2014, we sold our e-commerce subsidiary, Shoes.com. We recognized a pre-tax gain upon on the sale of the subsidiary of $4.7 million, representing the difference in the net proceeds less costs to sell, as compared to the carrying value of the net assets. Refer to Note 4 to the consolidated financial statements for further discussion.
Income Tax Provision
Our consolidated effective tax rate was a provision of 32.0% in 2016 compared to 24.8% in 2015 and 24.7% in 2014. Our consolidated effective tax rate is generally below the federal statutory rate of 35% because our foreign earnings are subject to lower statutory tax rates.
In 2016, our effective tax rate was impacted by several discrete tax benefits, including the settlement of certain federal and state tax matters, reductions of the valuation allowance related to capital loss carryforwards, and other adjustments, which totaled $2.5 million for the year. If these discrete tax benefits had not been recognized, the Company's full fiscal year 2016 effective tax rate would have been 34.6%, which is higher than 2015, driven by the non-deductibility of certain acquisition and integration expenses and other restructuring items.
In 2015, our effective tax rate was impacted by several discrete tax benefits which totaled $5.1 million for the year. These discrete tax benefits primarily reflected the utilization of operating loss, capital loss and other carryforwards that were previously not anticipated to be utilized and were therefore fully reserved on the consolidated balance sheet. A portion of these carryforwards became utilizable upon conversion of our primary retail entity to an LLC early in 2015. In addition, certain additional tax carryforwards were able to be utilized upon settlement of the tax attributes associated with the sale of our Shoes.com subsidiary. If these discrete tax benefits had not been recognized, our full fiscal year 2015 effective tax rate would have been 29.5%, which is 1.1% lower than 2014, driven by a lower state tax rate and a higher mix of earnings in international jurisdictions.
Refer to Note 6 to the consolidated financial statements for additional information regarding our tax rates.
Net Earnings
We reported net earnings of $66.1 million in 2016, compared to $81.8 million in 2015 and $82.9 million in 2014, as a result of the factors described above.
Net Earnings Attributable to Caleres, Inc.
We reported net earnings attributable to Caleres, Inc. of $65.7 million in 2016, compared to $81.5 million last year and $82.8 million in 2014.
Geographic Results
We have both domestic and foreign operations. Domestic operations include the nationwide operation of our Famous Footwear and other branded retail footwear stores, the wholesale distribution of footwear to numerous retail customers and the operation of our e-commerce
25
websites. Foreign operations primarily consist of wholesale operations in the Far East and Canada, retail operations in Canada and the operation of our international e-commerce websites. In addition, we license certain of our trademarks to third parties who distribute and/or operate retail locations internationally. The Far East operations include first-cost transactions, where footwear is sold at foreign ports to customers who then import the footwear into the United States and other countries. The breakdown of domestic and foreign net sales and earnings before income taxes was as follows:
2016 | 2015 | 2014 | |||||||||||||||||||||
Earnings Before | Earnings Before | Earnings Before | |||||||||||||||||||||
($ millions) | Net Sales | Income Taxes | Net Sales | Income Taxes | Net Sales | Income Taxes | |||||||||||||||||
Domestic | $ | 2,385.1 | $ | 60.9 | $ | 2,342.6 | $ | 68.2 | $ | 2,318.5 | $ | 70.8 | |||||||||||
Foreign | 194.3 | 36.4 | 234.8 | 40.6 | 253.2 | 39.3 | |||||||||||||||||
$ | 2,579.4 | $ | 97.3 | $ | 2,577.4 | $ | 108.8 | $ | 2,571.7 | $ | 110.1 | ||||||||||||
As a percentage of sales, the pre-tax profitability on foreign sales is higher than on domestic sales because of a lower cost structure and the inclusion in domestic earnings of the unallocated corporate administrative and other costs.
FAMOUS FOOTWEAR | ||||||||||||||||||
2016 | 2015 | 2014 | ||||||||||||||||
% of | % of | % of | ||||||||||||||||
($ millions) | Net Sales | Net Sales | Net Sales | |||||||||||||||
Net sales | $ | 1,590.1 | 100.0 | % | $ | 1,572.7 | 100.0 | % | $ | 1,589.3 | 100.0 | % | ||||||
Cost of goods sold | 887.5 | 55.8 | % | 866.0 | 55.1 | % | 883.2 | 55.6 | % | |||||||||
Gross profit | 702.6 | 44.2 | % | 706.7 | 44.9 | % | 706.1 | 44.4 | % | |||||||||
Selling and administrative expenses | 618.9 | 38.9 | % | 597.7 | 38.0 | % | 600.7 | 37.7 | % | |||||||||
Restructuring and other special charges, net | — | — | — | — | 0.8 | 0.1 | % | |||||||||||
Operating earnings | $ | 83.7 | 5.3 | % | $ | 109.0 | 6.9 | % | $ | 104.6 | 6.6 | % | ||||||
Key Metrics | ||||||||||||||||||
Same-store sales % change (on a 52-week basis) | 0.6 | % | 1.9 | % | 1.5 | % | ||||||||||||
Same-store sales $ change (on a 52-week basis) | $ | 9.7 | $ | 27.9 | $ | 22.4 | ||||||||||||
Sales change from new and closed stores, net (on a 52-week basis) | $ | 7.9 | $ | 2.9 | $ | (6.1 | ) | |||||||||||
Impact of changes in Canadian exchange rate on sales | $ | (0.2 | ) | $ | (1.7 | ) | $ | (0.3 | ) | |||||||||
Sales change of Shoes.com (sold in December 2014) | N/A | $ | (45.7 | ) | $ | (15.3 | ) | |||||||||||
Sales per square foot, excluding e-commerce (on a 52-week basis) | $ | 216 | $ | 217 | $ | 215 | ||||||||||||
Square footage (thousands sq. ft.) | 6,986 | 6,949 | 6,958 | |||||||||||||||
Stores opened | 49 | 50 | 50 | |||||||||||||||
Stores closed | 40 | 42 | 56 | |||||||||||||||
Ending stores | 1,055 | 1,046 | 1,038 | |||||||||||||||
Net Sales
Net sales increased $17.4 million, or 1.1%, to $1,590.1 million in 2016 compared to $1,572.7 million last year. During 2016, the increase was primarily driven by a 0.6% increase in same-store sales and a net increase in new and closed stores. Famous Footwear experienced an increase in e-commerce sales of more than 50% and reported improvement in both online conversion rate and customer traffic, due in part to the expansion of our in-store fulfillment program. Strong e-commerce sales were partially offset by a decline in customer traffic at
26
our retail store locations. The segment experienced sales growth in the lifestyle athletic and sport-influenced product, while boot sales declined. Sales per square foot, excluding e-commerce, decreased 0.8% to $216, compared to $217 last year. We continue to expand the membership base of our customer loyalty program, Rewards. Sales to our Rewards members account for a majority of the segment's sales, with approximately 75% of our net sales to Rewards members in 2016, compared to 74% in 2015 and 73% in 2014.
Net sales decreased $16.6 million to $1,572.7 million in 2015 compared to $1,589.3 million in 2014. This decrease was primarily due to the disposition of Shoes.com, as further discussed in Note 4 to the consolidated financial statements, which contributed $45.7 million of net sales in 2014, partially offset by a 1.9%, or $27.9 million, increase in same-store sales. The same-store sales increase was driven by continued strength in key selling categories, including athletic shoes and booties, which drove our average retail prices higher. We also saw growth in our e-commerce sales as more customers shifted from visiting our stores to the more convenient online shopping experience. During 2015, we expanded our in-store fulfillment initiative to approximately 900 stores, which reduced the average number of business days for shoes ordered online or in our Famous Footwear stores to be delivered to our customers. As a result of the same-store sales increase, sales per square foot, excluding e-commerce, increased 1.2% to $217 in 2015, compared to $215 in 2014. Net sales were also impacted by a higher store count and a lower Canadian dollar exchange rate.
Gross Profit
Gross profit decreased $4.1 million, or 0.6%, to $702.6 million in 2016 compared to $706.7 million last year due to a lower gross profit rate, partially offset by higher sales. As a percentage of net sales, our gross profit rate declined to 44.2% in 2016 compared to 44.9% last year. The decrease in our gross profit rate reflects higher freight expense due to growth in our Famous.com business and the in-store fulfillment program as well as lower initial product margins in certain categories, including athletic and boots.
Gross profit increased $0.6 million, or 0.1%, to $706.7 million in 2015 compared to $706.1 million in 2014 due to a higher gross profit rate, partially offset by lower sales. As a percentage of net sales, our gross profit rate increased to 44.9% in 2015 compared to 44.4% in 2014. The increase in our gross profit rate reflects the disposition of Shoes.com late in 2014, and a continued shift in mix toward higher margin products. Our Shoes.com business achieved lower margins than the rest of the Famous Footwear segment due to the higher expenses for freight and customer returns inherent in the e-commerce business.
Selling and Administrative Expenses
Selling and administrative expenses increased $21.2 million, or 3.5%, to $618.9 million during 2016 compared to $597.7 million last year. The increase reflects higher rent and facilities charges attributable to our expanded store base and higher warehouse and distribution costs, primarily related to our expanded distribution center in Lebanon, Tennessee, partially offset by lower expenses related to cash-based incentive compensation. As a percentage of net sales, selling and administrative expenses increased to 38.9% in 2016 from 38.0% last year.
Selling and administrative expenses decreased $3.0 million, or 0.5%, to $597.7 million during 2015 compared to $600.7 million in 2014. The decrease was primarily attributable to lower expenses due to the disposition of Shoes.com in late 2014, partially offset by higher store rent and facilities costs and an increase in expected payouts under our cash and stock-based incentive plans. As a percentage of net sales, selling and administrative expenses increased to 38.0% in 2015 from 37.7% in 2014.
Restructuring and Other Special Charges, Net
We incurred restructuring and other special charges of $0.8 million in 2014 related to the disposition of Shoes.com, as further discussed in Note 4 to the consolidated financial statements, with no corresponding costs in 2016 or 2015.
Operating Earnings
Operating earnings decreased $25.3 million, or 23.2% to $83.7 million for 2016, compared to $109.0 million last year. As a percentage of net sales, our operating earnings decreased to 5.3% for 2016, compared to 6.9% for 2015.
Operating earnings increased $4.4 million, or 4.3%, to $109.0 million for 2015, compared to $104.6 million in 2014. As a percentage of net sales, our operating earnings increased to 6.9% for 2015, compared to 6.6% for 2014.
27
BRAND PORTFOLIO | ||||||||||||||||||
2016 | 2015 | 2014 | ||||||||||||||||
% of | % of | % of | ||||||||||||||||
($ millions) | Net Sales | Net Sales | Net Sales | |||||||||||||||
Net sales | $ | 989.3 | 100.0 | % | $ | 1,004.8 | 100.0 | % | $ | 982.5 | 100.0 | % | ||||||
Cost of goods sold | 629.9 | 63.7 | % | 663.7 | 66.1 | % | 648.5 | 66.0 | % | |||||||||
Gross profit | 359.4 | 36.3 | % | 341.1 | 33.9 | % | 334.0 | 34.0 | % | |||||||||
Selling and administrative expenses | 279.3 | 28.2 | % | 274.5 | 27.3 | % | 260.3 | 26.5 | % | |||||||||
Restructuring and other special charges, net | 3.9 | 0.4 | % | — | — | 0.3 | 0.0 | % | ||||||||||
Operating earnings | $ | 76.2 | 7.7 | % | $ | 66.6 | 6.6 | % | $ | 73.4 | 7.5 | % | ||||||
Key Metrics | ||||||||||||||||||
Wholesale/retail sales mix (%) | 85%/15% | 87%/13% | 86%/14% | |||||||||||||||
Change in wholesale net sales ($) (1) | $ | (38.4 | ) | $ | 32.5 | $ | 77.8 | |||||||||||
Unfilled order position at year-end | $ | 263.1 | $ | 274.4 | $ | 284.6 | ||||||||||||
Same-store sales % change (on a 52-week basis) (2) | (2.9 | )% | (0.7 | )% | (3.6 | )% | ||||||||||||
Same-store sales $ change (on a 52-week basis) (2) | $ | (3.4 | ) | $ | (0.8 | ) | $ | (4.8 | ) | |||||||||
Sales change from new and closed stores, net (on a 52-week basis) (2) | $ | 27.1 | $ | (1.8 | ) | $ | (11.3 | ) | ||||||||||
Impact of changes in Canadian exchange rate on retail sales | $ | (0.8 | ) | $ | (7.6 | ) | $ | (3.8 | ) | |||||||||
Sales per square foot, excluding e-commerce (on a 52-week basis) (1) | $ | 314 | $ | 343 | $ | 377 | ||||||||||||
Square footage (thousands sq. ft.) (2) | 302 | 294 | 302 | |||||||||||||||
Stores opened (3) | 77 | 7 | 7 | |||||||||||||||
Stores closed | 8 | 13 | 15 | |||||||||||||||
Ending stores | 234 | 165 | 171 | |||||||||||||||
(1) | Change in wholesale net sales in 2016 includes $5.0 million in net sales from our recently acquired Allen Edmonds business. Refer to Note 2 to the consolidated financial statements for additional information. |
(2) | These key metrics exclude our recently acquired Allen Edmonds business. |
(3) | Sales change from new and closed stores, net and stores opened in 2016 include the acquisition of 69 Allen Edmonds retail stores with a net sales impact of $19.3 million in 2016. |
Net Sales
Net sales decreased $15.5 million, or 1.5%, to $989.3 million in 2016 compared to $1,004.8 million last year. The decrease was driven by lower net sales of our Dr. Scholl's Shoes, Naturalizer and LifeStride brands, partially offset by higher sales from our Carlos, Vince and Rykä brands. We acquired the Allen Edmonds business on December 13, 2016, as further discussed in Note 2 to the consolidated financial statements. Allen Edmonds contributed $19.3 million in retail sales and $5.0 million in wholesale sales during 2016. Our retail stores benefited from a net increase in sales from new and closed stores driven primarily by our acquisition of Allen Edmonds, partially offset by a decrease in same-store sales of 2.9% and a lower Canadian dollar exchange rate. We opened eight stores and acquired 69 Allen Edmonds stores, and closed eight stores during 2016, resulting in a total of 234 stores at the end of 2016. Sales per square foot, excluding e-commerce, decreased 8.4% to $314 compared to $343 last year. Our unfilled order position for our wholesale business decreased $11.3 million, or 4.1%, to $263.1 million at the end of 2016, compared to $274.4 million at the end of last year.
Net sales increased $22.3 million, or 2.3%, to $1,004.8 million in 2015 compared to $982.5 million in 2014. The increase reflected strong performance from many of our brands, including Sam Edelman, LifeStride, Vince and Carlos, partially offset by decreases in our Naturalizer and Via Spiga brands. Net sales at our branded retail stores were impacted by a lower Canadian dollar exchange rate, a lower store count
28
and a decline in same-store sales of 0.7%. We opened seven stores and closed 13 stores during 2015, resulting in a total of 165 stores at the end of 2015 compared to 171 stores at the end of 2014. Sales per square foot, excluding e-commerce, decreased 8.9% to $343 compared to $377 in 2014. Our unfilled order position for our wholesale sales decreased $10.2 million, or 3.6%, to $274.4 million at the end of 2015, compared to $284.6 million at the end of 2014.
Gross Profit
Gross profit increased $18.3 million, or 5.4%, to $359.4 million in 2016 compared to $341.1 million last year driven by a higher gross profit rate, partially offset by lower net sales and $1.2 million of incremental cost of goods sold related to the amortization of the inventory adjustment required for purchase accounting for our recent Allen Edmonds acquisition. We also incurred an incremental $1.6 million for inventory markdowns associated with the planned exit of our China e-commerce business. Our gross profit rate increased to 36.3% in 2016 compared to 33.9% last year primarily resulting from an improved mix of higher margin brands, as well as the planned exit of some lower margin categories. We also experienced a higher mix of retail versus wholesale sales. Our retail operations have a higher gross profit rate than our wholesale business.
Gross profit increased $7.1 million, or 2.1%, to $341.1 million in 2015 compared to $334.0 million in 2014 driven by higher net sales, partially offset by a lower gross profit rate. Our gross profit rate decreased slightly to 33.9% in 2015 compared to 34.0% in 2014 primarily resulting from higher inventory markdowns to clear inventory at our branded retail stores and a lower mix of retail versus wholesale sales.
Selling and Administrative Expenses
Selling and administrative expenses increased $4.8 million, or 1.7%, to $279.3 million during 2016 compared to $274.5 million last year, primarily driven by higher costs associated with our expanded store base, reflecting the impact of our recently acquired Allen Edmonds business, and an increase in warehouse expenses, partially offset by a decrease in anticipated payments under our cash-based incentive plans. As a percentage of net sales, selling and administrative expenses increased to 28.2% in 2016 from 27.3% last year, reflecting the above named factors.
Selling and administrative expenses increased $14.2 million, or 5.5%, to $274.5 million during 2015 compared to $260.3 million in 2014, primarily driven by additional costs associated with our new or expanded brands, including Sam Edelman, Vince Men's and Diane von Furstenberg, and higher expenses for a new warehouse service provider in China to distribute product to our international customers, partially offset by a decrease in anticipated payments under our cash-based incentive plans. As a percentage of net sales, selling and administrative expenses increased to 27.3% in 2015 from 26.5% in 2014, reflecting the above named factors.
Restructuring and Other Special Charges, Net
Restructuring and other special charges were $3.9 million in 2016, attributable to business exit and restructuring charges, certain Allen Edmonds acquisition and integration costs and other charges, with no corresponding costs in 2015. Restructuring and other special charges were $0.3 million in 2014 as a result of our portfolio realignment initiatives. Refer to Note 2 and Note 4 to the consolidated financial statements for additional information related to these charges.
Operating Earnings
Operating earnings increased $9.6 million, or 14.5%, to $76.2 million in 2016 compared to $66.6 million last year. As a percentage of net sales, operating earnings increased to 7.7% in 2016 compared to 6.6% last year.
Operating earnings decreased $6.8 million, or 9.3%, to $66.6 million in 2015, compared to $73.4 million in 2014. As a percentage of net sales, operating earnings decreased to 6.6% in 2015 compared to 7.5% in 2014.
OTHER |
The Other category includes unallocated corporate administrative and other costs and recoveries. Costs of $49.0 million, $40.5 million, and $52.1 million were incurred in 2016, 2015 and 2014, respectively.
The $8.5 million increase in costs in 2016 compared to 2015 was primarily a result of the following factors:
• | The impairment of the Shoes.com note receivable, as further discussed in Note 4 to the consolidated financial statements; |
• | The impairment of the investment in a nonconsolidated affiliate, as further discussed in Note 4 to the consolidated financial statements; and |
29
• | The costs associated with our acquisition and integration of Allen Edmonds, as further discussed in Note 2 and Note 4 to the consolidated financial statements; partially offset by |
• | Lower expenses related to our cash-based variable compensation plans for our directors and certain employees; and |
• | Lower consulting expenses related to new brand launches. |
The $11.6 million decrease in costs in 2015 compared to 2014 was primarily a result of the following factors:
• | Lower pension expense driven by plan provision changes which lowered our projected benefit obligation; |
• | Lower expenses related to our variable compensation plans for our directors and certain employees with awards that utilize mark-to-market accounting based on the Company's closing stock price; and |
• | A gain on sale of a vacant building at our corporate headquarters. |
RESTRUCTURING AND OTHER INITIATIVES |
During 2016, we incurred restructuring and other special charges of $23.4 million, including $8.0 million, primarily related to the impairment of the Shoes.com note receivable, $7.0 million related to the impairment of our investment in a nonconsolidated affiliate, $5.8 million of costs associated with the acquisition and integration of Allen Edmonds, and $2.6 million of costs associated with the planned exit of our international e-commerce business and other restructuring. During 2014, we incurred costs of $1.9 million related to organizational changes and charges of $1.5 million related to the disposition of Shoes.com. There were no restructuring and other special charges in 2015. Refer to the Financial Highlights section above and Note 2 and Note 4 to the consolidated financial statements for additional information related to these charges.
IMPACT OF INFLATION AND CHANGING PRICES |
While we have felt the effects of inflation on our business and results of operations, it has not had a significant impact on our business over the last three years. Inflation can have a long-term impact on our business because increasing costs of materials and labor may impact our ability to maintain satisfactory profit rates. For example, our products are manufactured in other countries, and a decline in the value of the U.S. dollar and the impact of labor shortages in China or other countries may result in higher manufacturing costs. Similarly, any potential significant shortage of quantities or increases in the cost of the materials that are used in our manufacturing process, such as leather and other materials or resources, could have a material negative impact on our business and results of operations. In addition, inflation is often accompanied by higher interest rates, which could have a negative impact on consumer spending, in which case our net sales and profit rates could decrease. Moreover, increases in inflation may not be matched by increases in wages, which also could have a negative impact on consumer spending. If we incur increased costs that are unable to be recovered through price increases, or if consumer spending decreases generally, our business, results of operations, financial condition and cash flows may be adversely affected. In an effort to mitigate the impact of these incremental costs on our operating results, we expect to pass on some portion of the cost increases to our consumers and adjust our business model, as appropriate, to minimize the impact of higher costs. Further discussion of the potential impact of inflation and changing prices is included in Item 1A, Risk Factors.
LIQUIDITY AND CAPITAL RESOURCES |
Borrowings
($ millions) | January 28, 2017 | January 30, 2016 | Increase | ||||||||
Borrowings under revolving credit agreement | $ | 110.0 | $ | — | $ | 110.0 | |||||
Long-term debt | 197.0 | 196.5 | 0.5 | ||||||||
Total debt | $ | 307.0 | $ | 196.5 | $ | 110.5 | |||||
Total debt obligations increased $110.5 million to $307.0 million at the end of 2016 compared to $196.5 million at the end of last year. Interest expense in 2016 was $15.1 million compared to $16.5 million in 2015 and $20.5 million in 2014. The decrease in interest expense in 2016 primarily reflects a $1.1 million increase in capitalized interest associated with the expansion and modernization of our Lebanon, Tennessee distribution center that was completed in the fourth quarter of 2016. In 2016 and 2015, we capitalized interest of $1.4 million and $0.3 million, respectively, associated with the distribution center, with no corresponding amounts capitalized in 2014. The decrease in interest expense in 2016 also reflects lower interest on our senior notes as a result of the redemption of our senior notes due in 2019 ("2019 Senior Notes") and the issuance of senior notes due in 2023 ("2023 Senior Notes") during 2015, reducing our interest rate from 7.125% to 6.25% as further described below, partially offset by higher average borrowings under our revolving credit agreement, which
30
was used to fund the acquisition of Allen Edmonds in the fourth quarter of 2016. The decrease in interest expense in 2015 reflects lower average borrowings under our revolving credit agreement, as further described below, and lower interest on our senior notes.
Credit Agreement
The Company maintains a revolving credit facility for working capital needs in an aggregate amount of up to $600.0 million, with the option to increase by up to $150.0 million. On December 18, 2014, the Company and certain of its subsidiaries (the “Loan Parties”) entered into a Fourth Amended and Restated Credit Agreement, which was further amended on July 20, 2015 to release all of the Company’s subsidiaries that were borrowers under or that guaranteed the Credit Agreement other than Sidney Rich Associates, Inc. and BG Retail, LLC (as so amended, the “Credit Agreement”). On December 13, 2016, Allen Edmonds was joined to the Credit Agreement as a guarantor. After giving effect to the joinder, the Company is the lead borrower, and Sidney Rich Associates, Inc., BG Retail, LLC and Allen Edmonds are each co-borrowers and guarantors under the Credit Agreement. The Credit Agreement matures on December 18, 2019.
Borrowing availability under the Credit Agreement is limited to the lesser of the total commitments and the borrowing base ("Loan Cap"), which is based on stated percentages of the sum of eligible accounts receivable, eligible inventory and eligible credit card receivables, as defined, less applicable reserves. Under the Credit Agreement, the Loan Parties’ obligations are secured by a first-priority security interest in all accounts receivable, inventory and certain other collateral.
Interest on borrowings is at variable rates based on the London Interbank Offered Rate (“LIBOR”) or the prime rate, as defined in the Credit Agreement, plus a spread. The interest rate and fees for letters of credit vary based upon the level of excess availability under the Credit Agreement. There is an unused line fee payable on the unused portion under the facility and a letter of credit fee payable on the outstanding face amount under letters of credit.
We were in compliance with all covenants and restrictions under the Credit Agreement as of January 28, 2017. Refer to further discussion regarding the Credit Agreement in Note 10 to the consolidated financial statements.
At January 28, 2017, we had $110.0 million in borrowings and $7.4 million in letters of credit outstanding under the Credit Agreement. Total borrowing availability was $415.4 million at January 28, 2017.
$200 Million Senior Notes
As further discussed in Note 10 to the consolidated financial statements, on July 20, 2015, we commenced a cash tender offer for our 2019 Senior Notes. The tender offer expired on July 24, 2015 and $160.7 million aggregate principal amount of the 2019 Senior Notes were tendered. The remaining $39.3 million aggregate principal amount of 2019 Senior Notes was redeemed on August 26, 2015.
On July 27, 2015, we issued $200.0 million aggregate principal amount of the 2023 Senior Notes in a private placement. On October 22, 2015, we commenced an offer to exchange our 2023 Senior Notes outstanding for substantially identical debt securities registered under the Securities Act of 1933. The exchange offer was completed on November 23, 2015 and did not affect the amount of our indebtedness outstanding.
The 2023 Senior Notes are guaranteed on a senior unsecured basis by each of the subsidiaries of Caleres, Inc. that is an obligor under the Credit Agreement, and bear interest at 6.25%, which is payable on February 15 and August 15 of each year. The 2023 Senior Notes mature on August 15, 2023. Prior to August 15, 2018, we may redeem some or all of the 2023 Senior Notes at various redemption prices.
The 2023 Senior Notes also contain covenants and restrictions that limit certain activities including, among other things, levels of indebtedness, payments of dividends, the guarantee or pledge of assets, certain investments, common stock repurchases, mergers and acquisitions and sales of assets. As of January 28, 2017, we were in compliance with all covenants and restrictions relating to the 2023 Senior Notes.
Loss on Early Extinguishment of Debt
During 2015 and 2014, we incurred losses on early extinguishment of debt of $10.7 million and $0.4 million, respectively, with no corresponding loss in 2016. The loss in 2015 represents the tender offer and call premiums, the unamortized debt issuance costs, and original issue discount related to the 2019 Senior Notes. Of the $10.7 million loss on early extinguishment of debt in 2015, approximately $3.0 million was non-cash. The loss in 2014 represents the early extinguishment of the revolving credit agreement prior to maturity.
31
Working Capital and Cash Flow
January 28, 2017 | January 30, 2016 | (Decrease) Increase | |||||||
Working capital ($ millions) (1) | $316.2 | $484.8 | $(168.6) | ||||||
Debt-to-capital ratio (2) | 33.3 | % | 24.6 | % | 8.7 | % | |||
Current ratio (3) | 1.60:1 | 2.24:1 | |||||||
(1) | Working capital has been computed as total current assets less total current liabilities. |
(2) | Debt-to-capital has been computed by dividing total debt by total capitalization. Total debt is defined as long-term debt and borrowings under the Credit Agreement. Total capitalization is defined as total debt and total equity. |
(3) | The current ratio has been computed by dividing total current assets by total current liabilities. |
2016 | 2015 | Increase (Decrease) in Cash and Cash Equivalents | |||||||||
Net cash provided by operating activities | $ | 183.6 | $ | 149.2 | $ | 34.4 | |||||
Net cash used for investing activities | (319.4 | ) | (73.8 | ) | (245.6 | ) | |||||
Net cash provided by (used for) financing activities | 72.8 | (23.5 | ) | 96.3 | |||||||
Effect of exchange rate changes on cash and cash equivalents | 0.2 | (1.2 | ) | 1.4 | |||||||
(Decrease) increase in cash and cash equivalents | $ | (62.8 | ) | $ | 50.7 | $ | (113.5 | ) | |||
Working capital at January 28, 2017, was $316.2 million, which was $168.6 million lower than at January 30, 2016. The decrease in working capital reflects higher borrowings under our revolving credit agreement, lower cash and cash equivalents and an increase in trade accounts payable, partially offset by higher inventory. The lower working capital primarily reflects the impact of the Allen Edmonds acquisition in 2016, which was funded initially with borrowings under our revolving credit agreement. A significant portion of the Allen Edmonds purchase price has been preliminarily allocated to intangible assets, which are noncurrent, while the entire purchase price was funded using current liabilities. Our current ratio decreased to 1.60 to 1 at January 28, 2017, from 2.24 to 1 at January 30, 2016, reflecting the above named factors. Our debt-to-capital ratio was 33.3% as of January 28, 2017, compared to 24.6% at January 30, 2016, primarily reflecting higher borrowings under our revolving credit agreement.
At January 28, 2017, we had $55.3 million of cash and cash equivalents. Approximately 40% of this balance represents the accumulated unremitted earnings of our foreign subsidiaries, which are considered indefinitely reinvested. Refer to Note 6 to the consolidated financial statements for more information regarding our unremitted foreign earnings.
Reasons for the major variances in cash provided (used) in the table above are as follows:
Cash provided by operating activities was $34.4 million higher in 2016 than last year. The changes in operating assets and liabilities, which exclude the initial amounts acquired from Allen Edmonds, reflect the following factors:
• | A decrease in receivables in 2016 as compared to an increase in 2015 driven by lower wholesale sales volume during the fourth quarter of 2016 and improved cash collections; |
• | A decrease in prepaid expenses and other current and noncurrent assets in 2016 as compared to an increase in 2015, due to lower prepaid rent in 2016 compared to 2015, reflecting a shift in the timing of rent payment due dates relative to the end of our fiscal year; and |
• | A decrease in inventories in 2016 as compared to an increase in 2015, reflecting our continued focus on inventory management; partially offset by |
• | Lower net earnings (after consideration of non-cash items); and |
• | A larger decrease in accrued expenses and other liabilities in 2016 as compared to 2015, driven by lower anticipated payments under our cash-based incentive compensation plans. |
Cash used for investing activities was $245.6 million higher in 2016 than last year, reflecting the acquisition of Allen Edmonds, as further discussed in Note 2 to the consolidated financial statements, partially offset by lower purchases of property and equipment in 2016. In 2017, we expect purchases of property and equipment and capitalized software of approximately $55 million.
32
Cash provided by financing activities was $96.3 million higher in 2016 than last year, primarily due to an increase in net borrowings under our revolving credit agreement to fund the Allen Edmonds acquisition, partially offset by an increase in share repurchases under our stock repurchase program in 2016.
We paid dividends of $0.28 per share in each of 2016, 2015 and 2014. The 2016 dividends marked the 94th year of consecutive quarterly dividends. On March 9, 2017, the Board of Directors declared a quarterly dividend of $0.07 per share, payable April 3, 2017, to shareholders of record on March 21, 2017, marking the 376th consecutive quarterly dividend to be paid by the Company. The declaration and payment of any future dividend is at the discretion of the Board of Directors and will depend on our results of operations, financial condition, business conditions and other factors deemed relevant by our Board of Directors. However, we presently expect that dividends will continue to be paid.
CRITICAL ACCOUNTING POLICIES AND ESTIMATES |
Certain accounting issues require management estimates and judgments for the preparation of financial statements. Our most significant policies requiring the use of estimates and judgments are listed below.
Revenue Recognition
Retail sales, recognized at the point of sale, are recorded net of returns and exclude sales tax. Wholesale sales are recorded, net of returns, allowances and discounts, generally when the merchandise has been shipped and title and risk of loss have passed to the customer. Revenue for products sold that are shipped directly to an individual consumer is recognized upon delivery to the consumer. Reserves for projected merchandise returns, discounts and allowances are determined based on historical experience and current expectations. Revenue is recognized on license fees related to Company-owned brand-names, where the Company is the licensor, when the related sales of the licensee are made.
Inventories
Inventories are our most significant asset, representing approximately 40% of total assets at the end of 2016. We value inventories at the lower of cost or market with 86% of consolidated inventories using the last-in, first-out (“LIFO”) method. An actual valuation of inventory under the LIFO method can be made only at the end of each year based on the inventory levels and costs at that time. Accordingly, interim LIFO calculations are based on management’s estimates of expected year-end inventory levels and costs and are subject to the final year-end LIFO inventory valuation.
We apply judgment in valuing our inventories by assessing the net realizable value of our inventories based on current selling prices. At our Famous Footwear segment, we recognize markdowns when it becomes evident that inventory items will be sold at retail prices less than cost, plus the cost to sell the product. This policy causes the gross profit rate at our Famous Footwear segment to be lower than the initial markup during periods when permanent price reductions are taken to clear product. Within our Brand Portfolio segment, we generally provide markdown reserves to reduce the carrying values of inventories to a level where, upon sale of the product, we will realize our normal gross profit rate. We believe these policies reflect the difference in operating models between our Famous Footwear segment and our Brand Portfolio segment. Famous Footwear periodically runs promotional events to drive sales to clear seasonal inventories. The Brand Portfolio segment generally relies on permanent price reductions to clear slower-moving inventory.
We perform physical inventory counts or cycle counts on all merchandise inventory on hand throughout the year and adjust the recorded balance to reflect the results. We record estimated shrinkage between physical inventory counts based on historical results. Inventory shrinkage is included as a component of cost of goods sold.
Income Taxes
We record deferred taxes for the effects of timing differences between financial and tax reporting. These differences relate principally to employee benefit plans, accrued expenses, bad debt reserves, depreciation and amortization and inventory.
We evaluate our foreign investment opportunities and plans, as well as our foreign working capital needs, to determine the level of investment required and, accordingly, determine the level of foreign earnings that we consider indefinitely reinvested. Based upon that evaluation, earnings of our foreign subsidiaries that are not otherwise subject to United States taxation, except for our Canadian subsidiary, are considered to be indefinitely reinvested, and accordingly, deferred taxes have not been provided. If changes occur in future investment opportunities and plans, those changes will be reflected when known and may result in providing residual United States deferred taxes on unremitted foreign earnings.
At January 28, 2017, we have net operating loss and other carryforwards at certain of our subsidiaries. We evaluate these carryforwards for realization based upon their expiration dates and our expectations of future taxable income. As deemed appropriate, valuation reserves are recorded to adjust the recorded value of these carryforwards to the expected realizable value.
33
We are audited periodically by domestic and foreign tax authorities and tax assessments may arise several years after tax returns have been filed. Tax liabilities are recorded when, in management’s judgment, a tax position does not meet the more-likely-than-not threshold for recognition. For tax positions that meet the more-likely-than-not threshold, a tax liability may be recorded depending on management’s assessment of how the tax position will ultimately be settled. In evaluating issues raised in such audits and other uncertain tax positions, we provide reserves for exposures as appropriate.
Goodwill and Intangible Assets
Goodwill and intangible assets deemed to have indefinite lives are not amortized but are subject to annual impairment tests. We adopted the provisions of Accounting Standards Codification (“ASC”), Intangibles-Goodwill and Other (ASC Topic 350) Testing Goodwill for Impairment, which permits, but does not require, a company to qualitatively assess indicators of a reporting unit’s fair value when it is unlikely that a reporting unit is impaired. If, after completing the qualitative assessment, a company believes it is likely that a reporting unit is impaired, a discounted cash flow analysis is prepared to estimate fair value. If the recorded values of these assets are not recoverable, based on either the assessment screen or discounted cash flow analysis, management performs the next step, which compares the fair value of the reporting unit to the recorded value of the tangible and intangible assets of the reporting units. Goodwill is considered impaired if the fair value of the tangible and intangible assets exceeds the fair value of the reporting unit. An adjustment to goodwill is recorded for any goodwill determined to be impaired. Impairment of goodwill is measured as the excess of the carrying amount of goodwill over the fair values of recognized assets and liabilities of the reporting unit. For 2016, we elected to perform the optional qualitative assessment for the goodwill impairment test.
We perform impairment tests during the fourth quarter of each fiscal year unless events indicate an interim test is required. The goodwill impairment testing and other indefinite-lived intangible asset impairment reviews were performed as of the first day of our fourth fiscal quarter and resulted in no impairment charges. Other intangible assets are amortized over their useful lives and are reviewed for impairment if and when impairment indicators are present. Refer to Note 9 to the consolidated financial statements for additional information related to the impairment of goodwill and intangible assets. Goodwill and intangible assets acquired in the Allen Edmonds acquisition in December 2016 will be reviewed for impairment beginning in 2017.
Store Closing and Impairment Charges
We regularly analyze the results of all of our stores and assess the viability of underperforming stores to determine whether events or circumstances exist that indicate the stores should be closed or whether the carrying amount of their long-lived assets may not be recoverable. After allowing for an appropriate start-up period, unusual nonrecurring events or favorable trends, we write down to fair value the fixed assets of stores indicated as impaired.
Litigation Contingencies
We are the defendant in several claims and lawsuits arising in the ordinary course of business. We do not believe any of these ordinary- course-of-business proceedings will have a material adverse effect on our consolidated financial position or results of operations. We accrue our best estimate of the cost of resolution of these claims. Legal defense costs of such claims are recognized in the period in which we incur the costs. See Note 17 to the consolidated financial statements for a further description of commitments and contingencies.
Environmental Matters
We are involved in environmental remediation and ongoing compliance activities at several sites. We are remediating, under the oversight of Colorado authorities, the groundwater and indoor air at our Redfield site and residential neighborhoods adjacent to and near the property, which have been affected by solvents previously used at the facility. In addition, various federal and state authorities have identified us as a potentially responsible party for remediation at certain landfills. While we currently do not operate manufacturing facilities in the United States, prior operations included numerous manufacturing and other facilities for which we may have responsibility under various environmental laws to address conditions that may be identified in the future. See Note 17 to the consolidated financial statements for a further description of specific properties.
Environmental expenditures relating to an existing condition caused by past operations and that do not contribute to current or future revenue generation are expensed. Liabilities are recorded when environmental assessments and/or remedial efforts are probable and the costs can be reasonably estimated and are evaluated independently of any future claims recovery. Generally, the timing of these accruals coincides with completion of a feasibility study or our commitment to a formal plan of action, and our estimates of cost are subject to change as new information becomes available. Costs of future expenditures for environmental remediation obligations are discounted to their present value in those situations requiring only continuing maintenance and monitoring based upon a schedule of fixed payments.
34
Business Combination Accounting
We allocate the purchase price of an acquired entity to the assets and liabilities acquired based upon their estimated fair values at the business combination date. We also identify and estimate the fair values of intangible assets that should be recognized as assets apart from goodwill. A single estimate of fair value results from a complex series of judgments about future events and uncertainties and relies heavily on estimates and assumptions. We have historically relied in part upon the use of reports from third-party valuation specialists to assist in the estimation of fair values for intangible assets other than goodwill, inventory and fixed assets. The carrying values of acquired receivables and trade accounts payable have historically approximated their fair values at the business combination date. With respect to other acquired assets and liabilities, we use all available information to make our best estimates of their fair values at the business combination date.
Our purchase price allocation methodology contains uncertainties because it requires management to make assumptions and to apply judgment to estimate the fair value of the acquired assets and liabilities. Management estimates the fair value of assets and liabilities based upon quoted market prices, the carrying value of the acquired assets and widely accepted valuation techniques, including discounted cash flows. Unanticipated events or circumstances may occur which could affect the accuracy of our fair value estimates, including assumptions regarding industry economic factors and business strategies.
Retirement and Other Benefit Plans
We sponsor pension plans in both the United States and Canada. Our domestic pension plans cover substantially all United States employees, and our Canadian pension plans cover certain employees based on plan specifications. In addition, we maintain an unfunded Supplemental Executive Retirement Plan (“SERP”) and sponsor unfunded defined benefit postretirement life insurance plans that cover both salaried and hourly employees who had become eligible for benefits by January 1, 1995.
We determine our expense and obligations for retirement and other benefit plans based on assumptions related to discount rates, expected long-term rates of return on invested plan assets, expected salary increases and certain employee-related factors, such as turnover, retirement age and mortality, among others. Our assumptions reflect our historical experience and our best judgment regarding future expectations. Additional information related to our assumptions is as follows:
• | Expected long-term rate of return – The expected long-term rate of return on plan assets is based on historical and projected rates of return for current and planned asset classes in the plan’s investment portfolio. Assumed projected rates of return for each asset class were selected after analyzing experience and future expectations of the returns. The overall expected rate of return for the portfolio was developed based on the target allocation for each asset class. The weighted-average expected rate of return on plan assets used to determine our pension expense for 2016 was 8.00%. A decrease of 50 basis points in the weighted-average expected rate of return on plan assets would increase pension expense by approximately $1.8 million. The actual return on plan assets in a given year may differ from the expected long-term rate of return, and the resulting gain or loss is deferred and recognized into the plans’ expense over time. |
• | Discount rate – Discount rates used to measure the present value of our benefit obligations for our pension and other postretirement benefit plans are based on a hypothetical bond portfolio constructed from a subset of high-quality bonds for which the timing and amount of cash outflows approximate the estimated payouts of the plans. The weighted-average discount rate selected to measure the present value of our benefit obligations under our pension and other postretirement benefit plans was 4.4% for each. A decrease of 50 basis points in the weighted-average discount rate would have increased the projected benefit obligation of the pension and other postretirement benefit plans by approximately $27.2 million and $0.1 million, respectively. |
• | Mortality table – As of January 28, 2017, we are using the RP-2014 Bottom Quartile tables, projected using generational scale MP-2016, an updated projection scale issued by the Society of Actuaries in 2016, grading to 0.75% by 2032, to estimate the plan liabilities. Actuarial gains, related to the change in mortality projection scale, reduced the projected benefit obligation by approximately $5.8 million as of January 28, 2017. |
Refer to Note 5 to the consolidated financial statements for additional information related to our retirement and other benefit plans.
Impact of Prospective Accounting Pronouncements
Recent accounting pronouncements and their impact on the Company are described in Note 1 to the consolidated financial statements.
OFF-BALANCE SHEET ARRANGEMENTS |
The Company has no off-balance sheet arrangements as of January 28, 2017.
CONTRACTUAL OBLIGATIONS |
35
The table below sets forth our significant future obligations by time period. Further information on certain of these commitments is provided in the notes to our consolidated financial statements, which are cross-referenced in this table. Our obligations outstanding as of January 28, 2017 include the following:
Payments Due by Period | |||||||||||||||
Less Than | 1-3 | 3-5 | More Than | ||||||||||||
($ millions) | Total | 1 Year | Years | Years | 5 Years | ||||||||||
Borrowings under Credit Agreement (1) | $ | 110.0 | $ | 110.0 | $ | — | $ | — | $ | — | |||||
Long-term debt (2) | 200.0 | — | — | — | 200.0 | ||||||||||
Interest on long-term debt (2) | 87.5 | 12.5 | 25.0 | 25.0 | 25.0 | ||||||||||
Financial instruments (3) | 0.6 | 0.6 | — | — | — | ||||||||||
Operating lease commitments (4) | 892.1 | 185.3 | 279.7 | 191.1 | 236.0 | ||||||||||
Minimum license commitments | 15.0 | 9.4 | 4.4 | 1.2 | — | ||||||||||
Purchase obligations (5) | 561.8 | 545.4 | 9.5 | 1.3 | 5.6 | ||||||||||
Other (6) | 15.7 | 3.1 | 4.4 | 4.2 | 4.0 | ||||||||||
Total (7) | $ | 1,882.7 | $ | 866.3 | $ | 323.0 | $ | 222.8 | $ | 470.6 | |||||
(1) | Interest on borrowings is at variable rates based on LIBOR or the prime rate, as defined in the Credit Agreement, plus a spread. The interest rate and fees for letters of credit varies based upon the level of excess availability under the Credit Agreement. There is an unused line fee payable on the excess availability under the facility and a letter of credit fee payable on the outstanding exposure under letters of credit. Interest obligations, which are variable in nature, are not included in the table above. Refer to Note 10 to the consolidated financial statements. |
(2) | Interest obligations have been reflected based on our $200.0 million principal value of 2023 Senior Notes at a fixed interest rate of 6.25% as of fiscal year ended January 28, 2017. Refer to Note 10 to the consolidated financial statements. |
(3) | Financial instruments reflect the net fair value of our foreign exchange forwards contracts. Refer to Note 12 to the consolidated financial statements. |
(4) | A majority of our retail operating leases contain provisions that allow us to modify amounts payable under the lease or terminate the lease in certain circumstances, such as experiencing actual sales volume below a defined threshold and/or co-tenancy provisions associated with the facility. The contractual obligations presented in the table above reflect the total lease obligation, irrespective of our ability to reduce or terminate rental payments in the future, as noted. Refer to Note 11 to the consolidated financial statements. |
(5) | Purchase obligations include agreements to purchase assets, goods or services that specify all significant terms, including quantity and price provisions. |
(6) | Includes obligations for our supplemental executive retirement plan and other postretirement benefits, as discussed in Note 5 to the consolidated financial statements, and other contractual obligations. |
(7) | Excludes liabilities of $5.1 million, $1.9 million and $9.4 million for our non-qualified deferred compensation plan, deferred compensation plan for non-employee directors and restricted stock units for non-employee directors, respectively, due to the uncertain nature in timing of payments. Refer to Note 5, Note 13 and Note 15 to the consolidated financial statements. |
SAFE HARBOR STATEMENT UNDER THE PRIVATE SECURITIES LITIGATION REFORM ACT OF 1995 AND FORWARD-LOOKING STATEMENTS | |
This Management’s Discussion and Analysis of Financial Condition and Results of Operations contains forward-looking statements within the meaning of the Private Securities Litigation Reform Act of 1995. Actual results could differ materially from those projected as they are subject to various risks and uncertainties. These risks and uncertainties include, without limitation, the risks detailed in Item 1A, Risk Factors, and those described in other documents and reports filed from time to time with the SEC, press releases and other communications. We do not undertake any obligation or plan to update these forward-looking statements, even though our situation may change.
ITEM 7A | QUANTITATIVE AND QUALITATIVE DISCLOSURES ABOUT MARKET RISK |
FOREIGN CURRENCY EXCHANGE RATES |
The market risk inherent in our financial instruments and positions represents the potential loss arising from adverse changes in foreign currency exchange rates and interest rates. To address these risks, we enter into various hedging transactions. All decisions on hedging transactions are authorized and executed pursuant to our policies and procedures, which do not allow the use of financial instruments for trading purposes. We also are exposed to credit-related losses in the event of nonperformance by counterparties to these financial instruments. Counterparties to these agreements, however, are major international financial institutions, and we believe the risk of loss due to nonperformance is minimal.
36
A description of our accounting policies for derivative financial instruments is included in Notes 1 and 12 to the consolidated financial statements.
In addition, we are exposed to translation risk because certain of our foreign operations use the local currency as their functional currency and those financial results must be translated into United States dollars. As currency exchange rates fluctuate, translation of our financial statements of foreign businesses into United States dollars affects the comparability of financial results between years.
INTEREST RATES |
Our financing arrangements include $110.0 million of outstanding variable rate debt under the Credit Agreement at January 28, 2017. We also have $200.0 million in principal value of 2023 Senior Notes, which bear interest at a fixed rate of 6.25%. Changes in interest rates impact fixed and variable rate debt differently. For fixed rate debt, a change in interest rates will only impact the fair value of the debt, whereas a change in the interest rates on variable rate debt will impact interest expense and cash flows.
At January 28, 2017, the fair value of our long-term debt is estimated at approximately $209.0 million based upon the pricing of our 2023 Senior Notes at that time. Market risk is viewed as the potential change in fair value of our debt resulting from a hypothetical 10% adverse change in interest rates and would be $6.0 million for our long-term debt at January 28, 2017.
Information appearing under the caption Risk Management and Derivatives in Note 12 and Fair Value Measurements in Note 13 to the consolidated financial statements is incorporated herein by reference.
ITEM 8 | FINANCIAL STATEMENTS AND SUPPLEMENTARY DATA |
Management’s Report on Internal Control Over Financial Reporting
Our management is responsible for establishing and maintaining adequate internal control over financial reporting as such term is defined in Exchange Act Rules 13a-15(f) and 15d-15(f). Under the supervision and with the participation of our management, including our principal executive officer and principal financial officer, we conducted an evaluation of the effectiveness of our internal control over financial reporting based on the framework in Internal Control — Integrated Framework issued by the Committee of Sponsoring Organizations of the Treadway Commission (2013 Framework). Management's assessment of the effectiveness of our internal control over financial reporting did not include the internal controls of Allen Edmonds, which was acquired in December 2016, as further discussed in Note 2 to the consolidated financial statements. Based on our evaluation, our principal executive officer and principal financial officer have concluded that the Company’s internal control over financial reporting was effective as of January 28, 2017. The effectiveness of our internal control over financial reporting as of January 28, 2017 has been audited by Ernst & Young LLP, an independent registered public accounting firm, as stated in its report which is included herein.
37
Report of Independent Registered Public Accounting Firm
The Board of Directors and Shareholders
Caleres, Inc.
We have audited Caleres, Inc.’s (the Company’s) internal control over financial reporting as of January 28, 2017, based on criteria established in Internal Control — Integrated Framework issued by the Committee of Sponsoring Organizations of the Treadway Commission (2013 Framework) (the COSO criteria). The Company’s management is responsible for maintaining effective internal control over financial reporting and for its assessment of the effectiveness of internal control over financial reporting included in the accompanying Management’s Report on Internal Control Over Financial Reporting. Our responsibility is to express an opinion on the Company’s internal control over financial reporting based on our audit.
We conducted our audit in accordance with the standards of the Public Company Accounting Oversight Board (United States). Those standards require that we plan and perform the audit to obtain reasonable assurance about whether effective internal control over financial reporting was maintained in all material respects. Our audit included obtaining an understanding of internal control over financial reporting, assessing the risk that a material weakness exists, testing and evaluating the design and operating effectiveness of internal control based on the assessed risk, and performing such other procedures as we considered necessary in the circumstances. We believe that our audit provides a reasonable basis for our opinion.
A company’s internal control over financial reporting is a process designed to provide reasonable assurance regarding the reliability of financial reporting and the preparation of financial statements for external purposes in accordance with generally accepted accounting principles. A company’s internal control over financial reporting includes those policies and procedures that (1) pertain to the maintenance of records that, in reasonable detail, accurately and fairly reflect the transactions and dispositions of the assets of the company; (2) provide reasonable assurance that transactions are recorded as necessary to permit preparation of financial statements in accordance with generally accepted accounting principles and that receipts and expenditures of the company are being made only in accordance with authorizations of management and directors of the company; and (3) provide reasonable assurance regarding prevention or timely detection of unauthorized acquisition, use, or disposition of the company’s assets that could have a material effect on the financial statements.
Because of its inherent limitations, internal control over financial reporting may not prevent or detect misstatements. Also, projections of any evaluation of effectiveness to future periods are subject to the risk that controls may become inadequate because of changes in conditions or that the degree of compliance with the policies or procedures may deteriorate.
As indicated in the accompanying Management’s Report on Internal Control over Financial Reporting, management’s assessment of and conclusion on the effectiveness of internal control over financial reporting did not include the internal controls of Allen Edmonds, which is included in the 2016 consolidated financial statements of Caleres, Inc. and constituted $311.0 million of total assets as of January 28, 2017 and $24.3 million and ($0.1) million of net sales and net loss, respectively, for the year then ended. Our audit of internal control over financial reporting of Caleres, Inc. also did not include an evaluation of the internal control over financial reporting of Allen Edmonds.
In our opinion, Caleres, Inc. maintained, in all material respects, effective internal control over financial reporting as of January 28, 2017, based on the COSO criteria.
We also have audited, in accordance with the standards of the Public Company Accounting Oversight Board (United States), the consolidated balance sheets of Caleres, Inc. as of January 28, 2017 and January 30, 2016, and the related consolidated statements of earnings, comprehensive income, cash flows and shareholders’ equity for each of the three years in the period ended January 28, 2017, and our report dated March 28, 2017, expressed an unqualified opinion thereon.
/s/ ERNST & YOUNG LLP
St. Louis, Missouri
March 28, 2017
38
Report of Independent Registered Public Accounting Firm
The Board of Directors and Shareholders
Caleres, Inc.
We have audited the accompanying consolidated balance sheets of Caleres, Inc. (the Company) as of January 28, 2017 and January 30, 2016, and the related consolidated statements of earnings, comprehensive income, cash flows and shareholders’ equity for each of the three years in the period ended January 28, 2017. Our audits also included the financial statement schedule listed in the Index at Item 15(a). These financial statements and schedule are the responsibility of the Company’s management. Our responsibility is to express an opinion on these financial statements and schedule based on our audits.
We conducted our audits in accordance with the standards of the Public Company Accounting Oversight Board (United States). Those standards require that we plan and perform the audit to obtain reasonable assurance about whether the financial statements are free of material misstatement. An audit includes examining, on a test basis, evidence supporting the amounts and disclosures in the financial statements. An audit also includes assessing the accounting principles used and significant estimates made by management, as well as evaluating the overall financial statement presentation. We believe that our audits provide a reasonable basis for our opinion.
In our opinion, the financial statements referred to above present fairly, in all material respects, the consolidated financial position of Caleres, Inc. at January 28, 2017 and January 30, 2016, and the consolidated results of its operations and its cash flows for each of the three years in the period ended January 28, 2017, in conformity with U.S. generally accepted accounting principles. Also, in our opinion, the related financial statement schedule, when considered in relation to the basic financial statements taken as a whole, presents fairly, in all material respects, the information set forth therein.
We also have audited, in accordance with the standards of the Public Company Accounting Oversight Board (United States), Caleres, Inc.’s internal control over financial reporting as of January 28, 2017, based on criteria established in Internal Control — Integrated Framework issued by the Committee of Sponsoring Organizations of the Treadway Commission (2013 Framework), and our report dated March 28, 2017, expressed an unqualified opinion thereon.
/s/ ERNST & YOUNG LLP
St. Louis, Missouri
March 28, 2017
39
Consolidated Balance Sheets | ||||||||
($ thousands, except number of shares and per share amounts) | January 28, 2017 | January 30, 2016 | ||||||
ASSETS | ||||||||
Current assets: | ||||||||
Cash and cash equivalents | $ | 55,332 | $ | 118,151 | ||||
Receivables, net of allowances of $23,652 in 2016 and $24,780 in 2015 | 153,121 | 153,664 | ||||||
Inventories, net of adjustment to last-in, first-out cost of $4,345 in 2016 and $4,094 in 2015 | 585,764 | 546,745 | ||||||
Income taxes | 9,659 | 11,146 | ||||||
Prepaid expenses and other current assets | 39,869 | 45,359 | ||||||
Total current assets | 843,745 | 875,065 | ||||||
Prepaid pension costs | 32,489 | 64,890 | ||||||
Property and equipment, net | 219,196 | 179,010 | ||||||
Deferred income taxes | 2,486 | 1,847 | ||||||
Goodwill | 127,098 | 13,954 | ||||||
Intangible assets, net | 216,660 | 116,945 | ||||||
Other assets | 33,599 | 51,612 | ||||||
Total assets | $ | 1,475,273 | $ | 1,303,323 | ||||
LIABILITIES AND EQUITY | ||||||||
Current liabilities: | ||||||||
Borrowings under revolving credit agreement | $ | 110,000 | $ | — | ||||
Trade accounts payable | 266,370 | 237,802 | ||||||
Employee compensation and benefits | 44,644 | 54,993 | ||||||
Income taxes | 3,599 | 3,519 | ||||||
Other accrued expenses | 102,982 | 93,985 | ||||||
Total current liabilities | 527,595 | 390,299 | ||||||
Other liabilities: | ||||||||
Long-term debt | 197,003 | 196,544 | ||||||
Deferred rent | 51,124 | 46,506 | ||||||
Deferred income taxes | 52,702 | 32,268 | ||||||
Other liabilities | 32,363 | 35,234 | ||||||
Total other liabilities | 333,192 | 310,552 | ||||||
Equity: | ||||||||
Preferred stock, $1.00 par value, 1,000,000 shares authorized; no shares outstanding | — | — | ||||||
Common stock, $0.01 par value, 100,000,000 shares authorized; 42,963,219 and 43,660,213 shares outstanding, net of 3,123,576 and 2,426,582 treasury shares in 2016 and 2015, respectively | 430 | 437 | ||||||
Additional paid-in capital | 121,537 | 138,881 | ||||||
Accumulated other comprehensive loss | (30,434 | ) | (5,864 | ) | ||||
Retained earnings | 521,584 | 468,030 | ||||||
Total Caleres, Inc. shareholders’ equity | 613,117 | 601,484 | ||||||
Noncontrolling interests | 1,369 | 988 | ||||||
Total equity | 614,486 | 602,472 | ||||||
Total liabilities and equity | $ | 1,475,273 | $ | 1,303,323 | ||||
See notes to consolidated financial statements.
40
Consolidated Statements of Earnings | ||||||||||||
($ thousands, except per share amounts) | 2016 | 2015 | 2014 | |||||||||
Net sales | $ | 2,579,388 | $ | 2,577,430 | $ | 2,571,709 | ||||||
Cost of goods sold | 1,517,397 | 1,529,627 | 1,531,609 | |||||||||
Gross profit | 1,061,991 | 1,047,803 | 1,040,100 | |||||||||
Selling and administrative expenses | 927,602 | 912,696 | 910,682 | |||||||||
Restructuring and other special charges, net | 23,404 | — | 3,484 | |||||||||
Operating earnings | 110,985 | 135,107 | 125,934 | |||||||||
Interest expense | (15,111 | ) | (16,589 | ) | (20,445 | ) | ||||||
Loss on early extinguishment of debt | — | (10,651 | ) | (420 | ) | |||||||
Interest income | 1,380 | 899 | 379 | |||||||||
Gain on sale of subsidiary | — | — | 4,679 | |||||||||
Earnings before income taxes | 97,254 | 108,766 | 110,127 | |||||||||
Income tax provision | (31,168 | ) | (26,942 | ) | (27,184 | ) | ||||||
Net earnings | 66,086 | 81,824 | 82,943 | |||||||||
Net earnings attributable to noncontrolling interests | 428 | 345 | 93 | |||||||||
Net earnings attributable to Caleres, Inc. | $ | 65,658 | 81,479 | 82,850 | ||||||||
Basic earnings per common share attributable to Caleres, Inc. shareholders | $ | 1.52 | $ | 1.86 | $ | 1.90 | ||||||
Diluted earnings per common share attributable to Caleres, Inc. shareholders | $ | 1.52 | $ | 1.85 | $ | 1.89 | ||||||
See notes to consolidated financial statements.
41
Consolidated Statements of Comprehensive Income | ||||||||||||
($ thousands) | 2016 | 2015 | 2014 | |||||||||
Net earnings | $ | 66,086 | $ | 81,824 | $ | 82,943 | ||||||
Other comprehensive income (loss) ("OCI"), net of tax: | ||||||||||||
Foreign currency translation adjustment | 1,045 | (224 | ) | (3,145 | ) | |||||||
Pension and other postretirement benefits adjustments | (24,728 | ) | (8,589 | ) | (10,349 | ) | ||||||
Derivative financial instruments | (934 | ) | 168 | (514 | ) | |||||||
Other comprehensive loss, net of tax | (24,617 | ) | (8,645 | ) | (14,008 | ) | ||||||
Comprehensive income | 41,469 | 73,179 | 68,935 | |||||||||
Comprehensive income attributable to noncontrolling interests | 381 | 276 | 49 | |||||||||
Comprehensive income attributable to Caleres, Inc. | $ | 41,088 | $ | 72,903 | $ | 68,886 | ||||||
See notes to consolidated financial statements.
42
Consolidated Statements of Cash Flows | ||||||||||||
($ thousands) | 2016 | 2015 | 2014 | |||||||||
Operating Activities | ||||||||||||
Net earnings | $ | 66,086 | $ | 81,824 | $ | 82,943 | ||||||
Adjustments to reconcile net earnings to net cash provided by operating activities: | ||||||||||||
Depreciation | 39,419 | 35,428 | 35,002 | |||||||||
Amortization of capitalized software | 13,007 | 12,323 | 12,662 | |||||||||
Amortization of intangibles | 3,705 | 3,688 | 3,951 | |||||||||
Amortization of debt issuance costs and debt discount | 1,726 | 1,167 | 2,400 | |||||||||
Loss on early extinguishment of debt | — | 10,651 | 420 | |||||||||
Share-based compensation expense | 7,725 | 7,491 | 6,190 | |||||||||
Excess tax benefit related to share-based plans | (2,251 | ) | (2,651 | ) | (929 | ) | ||||||
Loss (gain) on disposal of property and equipment | 1,065 | (1,963 | ) | 1,610 | ||||||||
Impairment charges for property and equipment | 1,586 | 2,761 | 1,982 | |||||||||
Impairment of note receivable | 7,281 | — | — | |||||||||
Impairment of investment in nonconsolidated affiliate | 7,000 | — | — | |||||||||
Net gain on sale of subsidiaries | — | — | (4,679 | ) | ||||||||
Deferred rent | 4,618 | 6,764 | 1,149 | |||||||||
Deferred income taxes (benefit) provision | (5,303 | ) | 10,581 | (3,416 | ) | |||||||
Provision for doubtful accounts | 1,384 | 480 | 1,716 | |||||||||
Changes in operating assets and liabilities, net of acquired amounts: | ||||||||||||
Receivables | 5,433 | (17,438 | ) | (9,175 | ) | |||||||
Inventories | 13,835 | (5,270 | ) | (7,651 | ) | |||||||
Prepaid expenses and other current and noncurrent assets | 14,226 | (8,654 | ) | (20,053 | ) | |||||||
Trade accounts payable | 16,074 | 21,881 | (8,204 | ) | ||||||||
Accrued expenses and other liabilities | (15,051 | ) | (1,865 | ) | 20,142 | |||||||
Income taxes | 1,329 | (10,308 | ) | 2,411 | ||||||||
Other, net | 728 | 2,262 | 341 | |||||||||
Net cash provided by operating activities | 183,622 | 149,152 | 118,812 | |||||||||
Investing Activities | ||||||||||||
Purchases of property and equipment | (50,523 | ) | (73,479 | ) | (44,952 | ) | ||||||
Proceeds from disposal of property and equipment | — | 7,433 | — | |||||||||
Capitalized software | (9,039 | ) | (7,735 | ) | (5,086 | ) | ||||||
Acquisition cost, net of cash received | (259,932 | ) | — | — | ||||||||
Acquisition of trademarks | — | — | (65,065 | ) | ||||||||
Investment in nonconsolidated affiliate | — | — | (7,000 | ) | ||||||||
Net proceeds from sale of subsidiaries, inclusive of note receivable | — | — | 10,120 | |||||||||
Net cash used for investing activities | (319,494 | ) | (73,781 | ) | (111,983 | ) | ||||||
Financing Activities | ||||||||||||
Borrowings under revolving credit agreement | 623,000 | 198,000 | 867,000 | |||||||||
Repayments under revolving credit agreement | (513,000 | ) | (198,000 | ) | (874,000 | ) | ||||||
Proceeds from issuance of 2023 senior notes | — | 200,000 | — | |||||||||
Redemption of 2019 senior notes | — | (200,000 | ) | — | ||||||||
Dividends paid | (12,104 | ) | (12,253 | ) | (12,237 | ) | ||||||
Debt issuance costs | — | (3,650 | ) | (2,618 | ) | |||||||
Acquisition of treasury stock | (23,139 | ) | (4,921 | ) | — | |||||||
Issuance of common stock under share-based plans, net | (4,188 | ) | (5,297 | ) | 443 | |||||||
Excess tax benefit related to share-based plans | 2,251 | 2,651 | 929 | |||||||||
Net cash provided by (used for) financing activities | 72,820 | (23,470 | ) | (20,483 | ) | |||||||
Effect of exchange rate changes on cash and cash equivalents | 233 | (1,153 | ) | (1,489 | ) | |||||||
(Decrease) increase in cash and cash equivalents | (62,819 | ) | 50,748 | (15,143 | ) | |||||||
Cash and cash equivalents at beginning of year | 118,151 | 67,403 | 82,546 | |||||||||
Cash and cash equivalents at end of year | $ | 55,332 | $ | 118,151 | $ | 67,403 | ||||||
See notes to consolidated financial statements.
43
Consolidated Statements of Shareholders’ Equity | |||||||||||||||||||||||
Additional Paid-In Capital | Accumulated Other Comprehensive Income (Loss) | Retained Earnings | Total Caleres, Inc. Shareholders’ Equity | Non-controlling Interests | |||||||||||||||||||
Common Stock | |||||||||||||||||||||||
($ thousands, except number of shares and per share amounts) | Shares | Dollars | Total Equity | ||||||||||||||||||||
BALANCE FEBRUARY 1, 2014 | 43,378,279 | $ | 434 | $ | 131,398 | $ | 16,676 | $ | 328,191 | $ | 476,699 | $ | 663 | $ | 477,362 | ||||||||
Net earnings | 82,850 | 82,850 | 93 | 82,943 | |||||||||||||||||||
Foreign currency translation adjustment | (3,101 | ) | (3,101 | ) | (44 | ) | (3,145 | ) | |||||||||||||||
Unrealized loss on derivative financial instruments, net of tax of $408 | (514 | ) | (514 | ) | (514 | ) | |||||||||||||||||
Pension and other postretirement benefits adjustments, net of tax of $6,494 | (10,349 | ) | (10,349 | ) | (10,349 | ) | |||||||||||||||||
Comprehensive income | 68,886 | 49 | 68,935 | ||||||||||||||||||||
Dividends ($0.28 per share) | (12,237 | ) | (12,237 | ) | (12,237 | ) | |||||||||||||||||
Stock issued under employee and director benefit and restricted stock plans | 373,752 | 3 | 440 | 443 | 443 | ||||||||||||||||||
Excess tax benefit related to share-based plans | 929 | 929 | 929 | ||||||||||||||||||||
Share-based compensation expense | 6,190 | 6,190 | 6,190 | ||||||||||||||||||||
BALANCE JANUARY 31, 2015 | 43,752,031 | $ | 437 | $ | 138,957 | $ | 2,712 | $ | 398,804 | $ | 540,910 | $ | 712 | $ | 541,622 | ||||||||
Net earnings | 81,479 | 81,479 | 345 | 81,824 | |||||||||||||||||||
Foreign currency translation adjustment | (155 | ) | (155 | ) | (69 | ) | (224 | ) | |||||||||||||||
Unrealized gain on derivative financial instruments, net of tax of $170 | 168 | 168 | 168 | ||||||||||||||||||||
Pension and other postretirement benefits adjustments, net of tax of $5,537 | (8,589 | ) | (8,589 | ) | (8,589 | ) | |||||||||||||||||
Comprehensive income | 72,903 | 276 | 73,179 | ||||||||||||||||||||
Dividends ($0.28 per share) | (12,253 | ) | (12,253 | ) | (12,253 | ) | |||||||||||||||||
Acquisition of treasury stock | (151,500 | ) | (2 | ) | (4,919 | ) | (4,921 | ) | (4,921 | ) | |||||||||||||
Stock issued under employee and director benefit and restricted stock plans | 59,682 | 2 | (5,299 | ) | (5,297 | ) | (5,297 | ) | |||||||||||||||
Excess tax benefit related to share-based plans | 2,651 | 2,651 | 2,651 | ||||||||||||||||||||
Share-based compensation expense | 7,491 | 7,491 | 7,491 | ||||||||||||||||||||
BALANCE JANUARY 30, 2016 | 43,660,213 | $ | 437 | $ | 138,881 | $ | (5,864 | ) | $ | 468,030 | $ | 601,484 | $ | 988 | $ | 602,472 | |||||||
Net earnings | 65,658 | 65,658 | 428 | 66,086 | |||||||||||||||||||
Foreign currency translation adjustment | 1,092 | 1,092 | (47 | ) | 1,045 | ||||||||||||||||||
Unrealized loss on derivative financial instruments, net of tax of $309 | (934 | ) | (934 | ) | (934 | ) | |||||||||||||||||
Pension and other postretirement benefits adjustments, net of tax of $15,766 | (24,728 | ) | (24,728 | ) | (24,728 | ) | |||||||||||||||||
Comprehensive income | 41,088 | 381 | 41,469 | ||||||||||||||||||||
Dividends ($0.28 per share) | (12,104 | ) | (12,104 | ) | (12,104 | ) | |||||||||||||||||
Acquisition of treasury stock | (900,000 | ) | (9 | ) | (23,130 | ) | (23,139 | ) | (23,139 | ) | |||||||||||||
Stock issued under employee and director benefit and restricted stock plans | 203,006 | 2 | (4,190 | ) | (4,188 | ) | (4,188 | ) | |||||||||||||||
Excess tax benefit related to share-based plans | 2,251 | 2,251 | 2,251 | ||||||||||||||||||||
Share-based compensation expense | 7,725 | 7,725 | 7,725 | ||||||||||||||||||||
BALANCE JANUARY 28, 2017 | 42,963,219 | $ | 430 | $ | 121,537 | $ | (30,434 | ) | $ | 521,584 | $ | 613,117 | $ | 1,369 | $ | 614,486 | |||||||
See notes to consolidated financial statements.
44
Notes to Consolidated Financial Statements |
1. SUMMARY OF SIGNIFICANT ACCOUNTING POLICIES
Organization
Caleres, Inc., originally founded as Brown Shoe Company in 1878 and incorporated in 1913, is a global footwear retailer and wholesaler. In May 2015, the shareholders of Brown Shoe Company, Inc. approved a rebranding initiative that changed the name of the company to Caleres, Inc. (the "Company"). The Company’s shares are traded under the “CAL” symbol on the New York Stock Exchange.
The Company provides a broad offering of licensed, branded and private-label casual, dress and athletic footwear products to women, men and children. Footwear is sold at a variety of price points through multiple distribution channels both domestically and internationally. The Company currently operates 1,289 retail shoe stores in the United States, Canada, Guam and Italy, primarily under the Famous Footwear and Naturalizer and Allen Edmonds names. In addition, through its Brand Portfolio segment, the Company designs, sources and markets footwear to retail stores domestically and internationally, including national chains, online retailers, department stores, mass merchandisers, independent retailers and catalogs. In both 2016 and 2014, approximately 67% of the Company’s net sales were at retail, compared to 66% in 2015. Refer to Note 7 to the consolidated financial statements for additional information regarding the Company’s business segments.
The Company’s business is seasonal in nature due to consumer spending patterns with higher back-to-school and Christmas season sales. Traditionally, the third fiscal quarter accounts for a substantial portion of the Company’s earnings for the year.
Consolidation
The consolidated financial statements include the accounts of the Company and its wholly-owned and majority-owned subsidiaries, after the elimination of intercompany accounts and transactions.
Noncontrolling Interests
Noncontrolling interests in the Company’s consolidated financial statements result from the accounting for noncontrolling interests in partially-owned consolidated subsidiaries or affiliates. Noncontrolling interests represent partially-owned subsidiaries’ or consolidated affiliates’ losses and components of other comprehensive income that are attributable to the noncontrolling parties’ equity interests. The Company consolidates B&H Footwear Company Limited (“B&H Footwear”), a joint venture, into its consolidated financial statements. Net earnings attributable to noncontrolling interests represent the share of net earnings that are attributable to the B&H Footwear equity. Transactions between the Company and B&H Footwear have been eliminated in the consolidated financial statements. As further discussed in Note 16 to the consolidated financial statements, in the second quarter of 2016, the Company communicated its intention to dissolve the joint venture upon the expiration of the joint venture agreement in August 2017.
Accounting Period
The Company’s fiscal year is the 52- or 53-week period ending the Saturday nearest to January 31. Fiscal years 2016, 2015 and 2014 each included 52 weeks and ended on January 28, 2017, January 30, 2016 and January 31, 2015, respectively.
Basis of Presentation
Certain prior period amounts on the consolidated financial statements have been reclassified to conform to the current period presentation. These reclassifications did not affect net earnings attributable to Caleres, Inc.
Use of Estimates
The preparation of financial statements in conformity with generally accepted accounting principles (“GAAP”) requires management to make estimates and assumptions that affect the amounts reported in the financial statements and accompanying notes. Actual results could differ from those estimates.
Cash and Cash Equivalents
The Company considers all highly liquid investments with maturities of three months or less when purchased to be cash equivalents.
45
Receivables
The Company evaluates the collectibility of selected accounts receivable on a case-by-case basis and makes adjustments to the bad debt reserve for expected losses. The Company considers factors such as ability to pay, bankruptcy, credit ratings and payment history. For all other accounts, the Company estimates reserves for bad debts based on experience and past due status of the accounts. If circumstances related to customers change, estimates of recoverability are further adjusted. The Company recognized a provision for doubtful accounts of $1.4 million in 2016, $0.5 million in 2015 and $1.7 million in 2014.
Customer allowances represent reserves against our wholesale customers’ accounts receivable for margin assistance, product returns, customer deductions and co-op advertising allowances. The Company estimates the reserves needed for margin assistance by reviewing inventory levels on the retail floors, sell-through rates, historical dilution, current gross margin levels and other performance indicators of our major retail customers. Product returns and customer deductions are estimated using historical experience and anticipated future trends. Co-op advertising allowances are estimated based on customer agreements. The Company recognized a provision for customer allowances of $45.2 million in 2016, $47.4 million in 2015 and $46.9 million in 2014.
Customer discounts represent reserves against our accounts receivable for discounts that our wholesale customers may take based on meeting certain order, payment or return guidelines. The Company estimates the reserves needed for customer discounts based upon customer net sales and respective agreement terms. The Company recognized a provision for customer discounts of $3.6 million in 2016, $2.6 million in 2015 and $3.5 million in 2014.
Inventories
All inventories are valued at the lower of cost or market with 86% of consolidated inventories using the last-in, first-out (“LIFO”) method. An actual valuation of inventory under the LIFO method can be made only at the end of each year based on the inventory levels and costs at that time. Accordingly, interim LIFO calculations are based on management’s estimates of expected year-end inventory levels and costs and are subject to the final year-end LIFO inventory valuation. If the first-in, first-out (“FIFO”) method had been used, consolidated inventories would have been $4.3 million and $4.1 million higher at January 28, 2017 and January 30, 2016, respectively. The Company's inventory balance as of January 28, 2017 is comprised of $569.3 million of finished goods, $15.4 million of raw materials and $1.1 million of work-in-process. The Company's inventory balance as of January 30, 2016 was primarily comprised of finished goods. As of January 28, 2017 and January 30, 2016, the Company's inventory balance includes $1.6 million and $2.3 million, respectively, of product subject to a consignment arrangement with wholesale customers.
The costs of inventory, inbound freight and duties, markdowns, shrinkage and royalty expense are classified in cost of goods sold. Costs of warehousing and distribution are classified in selling and administrative expenses and are expensed as incurred. Such warehousing and distribution costs totaled $77.7 million, $70.4 million and $70.1 million in 2016, 2015 and 2014, respectively. Costs of overseas sourcing offices and other inventory procurement costs are reflected in selling and administrative expenses and are expensed as incurred. Such sourcing and procurement costs totaled $21.5 million, $23.9 million and $20.8 million in 2016, 2015 and 2014, respectively.
The Company applies judgment in valuing inventories by assessing the net realizable value of inventories based on current selling prices. At the Famous Footwear segment, markdowns are recognized when it becomes evident that inventory items will be sold at retail prices less than cost, plus the cost to sell the product. This policy causes the gross profit rate at Famous Footwear to be lower than the initial markup during periods when permanent price reductions are taken to clear product. Within the Brand Portfolio segment, markdown reserves generally reduce the carrying values of inventories to a level where, upon sale of the product, the Company will realize its normal gross profit rate. The Company believes these policies reflect the difference in operating models between the Famous Footwear and Brand Portfolio segments. Famous Footwear periodically runs promotional events to drive sales to clear seasonal inventories. The Brand Portfolio segment relies on permanent price reductions to clear slower-moving inventory.
Markdowns are recorded to reflect expected adjustments to sales prices. In determining markdowns, management considers current and recently recorded sales prices, the length of time the product is held in inventory and quantities of various product styles contained in inventory, among other factors. The ultimate amount realized from the sale of certain products could differ from management estimates. The Company performs physical inventory counts or cycle counts on all merchandise inventory on hand throughout the year and adjusts the recorded balance to reflect the results. The Company records estimated shrinkage between physical inventory counts based on historical results.
Computer Software Costs
The Company capitalizes certain costs in other assets, including internal payroll costs incurred in connection with the development or acquisition of software for internal use. Other assets on the consolidated balance sheets include $30.0 million and $33.2 million of computer
46
software costs as of January 28, 2017 and January 30, 2016, respectively, which are net of accumulated amortization of $111.7 million and $101.0 million as of the end of the respective periods.
Property and Equipment
Property and equipment are stated at cost. Depreciation of property and equipment is provided over the estimated useful lives of the assets or the remaining lease terms, where applicable, using the straight-line method.
Interest Expense
Capitalized Interest
Interest costs for major asset additions are capitalized during the construction or development period and amortized over the lives of the related assets. The Company capitalized interest of $1.4 million and $0.3 million in 2016 and 2015, respectively, related to its expansion and modernization project at its Lebanon, Tennessee distribution center, with no corresponding amounts capitalized in 2014.
Interest Expense
Interest expense includes interest for borrowings under both the Company’s short-term and long-term debt, net of amounts capitalized. Interest expense includes fees paid under the short-term revolving credit agreement for the unused portion of its line of credit. Interest expense also includes the amortization of deferred debt issuance costs and debt discount as well as the accretion of certain discounted noncurrent liabilities.
Goodwill and Intangible Assets
Goodwill and intangible assets deemed to have indefinite lives are not amortized but are subject to annual impairment tests. The Company adopted the provisions of Accounting Standards Codification (“ASC”), Intangibles-Goodwill and Other (ASC Topic 350) Testing Goodwill for Impairment, which permits, but does not require, a company to qualitatively assess indicators of a reporting unit’s fair value when it is unlikely that a reporting unit is impaired. If, after completing the qualitative assessment, a company believes it is likely that a reporting unit is impaired, a discounted cash flow analysis is prepared to estimate fair value. A fair value-based test is applied at the reporting unit level, which is generally at or one level below the operating segment level. The test compares the fair value of the Company’s reporting units to the carrying value of those reporting units. This test requires significant assumptions, estimates and judgments by management, and is subject to inherent uncertainties and subjectivity. The fair value of goodwill is determined using an estimate of future cash flows of the reporting units and a risk-adjusted discount rate to compute a net present value of future cash flows. Projected net sales, gross profit, selling and administrative expense, capital expenditures and working capital requirements are based on the Company's internal projections. Discount rates reflect market-based estimates of the risks associated with the projected cash flows of the reporting units directly resulting from the use of its assets in its operations. Assumptions that market participants may use are also considered. Both the estimates of the fair value of the Company's reporting units and the allocation of the estimated fair value of the reporting units are based on the best information available to the Company's management as of the date of the assessment. If the recorded values of these assets are not recoverable, based on either the assessment screen or discounted cash flow analysis, management performs the next step, which compares the fair value of the reporting unit to the recorded value of the tangible and intangible assets of the reporting units. Goodwill is considered impaired if the fair value of the tangible and intangible assets exceeds the fair value of the reporting unit.
The Company elected to perform the optional qualitative assessment for the goodwill impairment test as of the first day of the fourth quarter of 2016. The Company has two reporting units, Famous Footwear and Brand Portfolio. Based on the results of the most recent goodwill impairment qualitative assessment, the Company determined that it was more likely than not that the fair value of the reporting units exceeded the carrying value. As a result, the Company was not required to perform the discounted cash flow analysis. As of January 28, 2017, the goodwill allocated to the Brand Portfolio reporting unit was $127.1 million, which includes $113.1 million of incremental goodwill based on the preliminary allocation of the Allen Edmonds purchase price, as further discussed in Note 9 to the consolidated financial statements. Goodwill and intangible assets acquired in the Allen Edmonds acquisition will be reviewed for impairment beginning in 2017.
The Company performs impairment tests on its indefinite-lived intangible assets as of the first day of the fourth quarter of each fiscal year unless events indicate an interim test is required. The indefinite-lived intangible asset impairment reviews performed as of the first day of the Company’s fourth fiscal quarter resulted in no impairment charges. Definite-lived intangible assets, other than goodwill, are amortized over their useful lives and are reviewed for impairment if and when impairment indicators are present.
Investment in Nonconsolidated Affiliate
The Company has an investment in a nonconsolidated affiliate that is accounted for using the cost method. The investment's carrying value of $7.0 million as of January 30, 2016 was included in other assets on the consolidated balance sheets. During the fourth quarter of 2016, the Company determined that the investment had an other-than-temporary decline in its fair value that exceeded its carrying value and
47
recorded an impairment charge of $7.0 million, which is presented in restructuring and other special charges, net in the consolidated statements of earnings.
Self-Insurance Reserves
The Company is self-insured and/or retains high deductibles for a significant portion of its workers’ compensation, health, disability, cyber risk, general liability, automobile and property programs, among others. Liabilities associated with the risks that are retained by the Company are estimated by considering historical claims experience, trends of the Company and the industry, and other actuarial assumptions. The estimated accruals for these liabilities could be affected if development of costs on claims differ from these assumptions and historical trends. Based on available information as of January 28, 2017, the Company believes it has provided adequate reserves for its self-insurance exposure. As of January 28, 2017 and January 30, 2016, self-insurance reserves were $10.4 million and $9.7 million, respectively.
Revenue Recognition
Retail sales, recognized at the point of sale, are recorded net of returns and exclude sales tax. Wholesale sales are recorded, net of returns, allowances and discounts, generally when the merchandise has been shipped and title and risk of loss have passed to the customer. Revenue for products sold that are shipped directly to an individual consumer is recognized upon delivery to the consumer. Reserves for projected merchandise returns, discounts and allowances are determined based on historical experience and current expectations. Revenue is recognized on license fees related to Company-owned brand-names, where the Company is the licensor, when the related sales of the licensee are made.
Gift Cards
The Company sells gift cards to its consumers in its retail stores, through its Internet sites and at other retailers. The Company’s gift cards do not have expiration dates or inactivity fees. The Company recognizes revenue from gift cards when (i) the gift card is redeemed by the consumer or (ii) the likelihood of the gift card being redeemed by the consumer is remote (“gift card breakage”) and the Company determines that it does not have a legal obligation to remit the value of unredeemed gift cards to the relevant jurisdictions. The Company determines its gift card breakage rate based upon historical redemption patterns. The Company recognizes gift card breakage during the 24-month period following the sale of the gift card, according to the Company’s historical redemption pattern. Gift card breakage income is included in net sales in the consolidated statements of earnings and the liability established upon the sale of a gift card is included in other accrued expenses within the consolidated balance sheets. The Company recognized $0.7 million of gift card breakage in 2016 and 2015, and $0.4 million in 2014.
Loyalty Program
The Company maintains a loyalty program (“Rewards”) at Famous Footwear, through which consumers earn points toward savings certificates for qualifying purchases. Upon reaching specified point values, consumers are issued a savings certificate that may be redeemed for purchases at Famous Footwear. Savings certificates earned must be redeemed within stated expiration dates. In addition to the savings certificates, the Company also offers exclusive member discounts. The value of points and rewards earned by Famous Footwear’s Rewards program members are recorded as a reduction of net sales and a liability is established within other accrued expenses at the time the points are earned based on historical conversion and redemption rates. Approximately 75% of net sales in the Famous Footwear segment were made to its Rewards members in 2016, compared to 74% in 2015 and 73% in 2014. As of January 28, 2017 and January 30, 2016, the Company had a Rewards program liability of $7.6 million and $7.1 million, respectively, which is included in other accrued expenses on the consolidated balance sheets.
Store Closing and Impairment Charges
The costs of closing stores, including lease termination costs, property and equipment write-offs and severance, as applicable, are recorded when the store is closed or when a binding agreement is reached with the landlord to close the store.
The Company regularly analyzes the results of all of its stores and assesses the viability of underperforming stores to determine whether events or circumstances exist that indicate the stores should be closed or whether the carrying amount of their long-lived assets may not be recoverable. After allowing for an appropriate start-up period, unusual nonrecurring events or favorable trends, property and equipment at stores indicated as impaired are written down to fair value as calculated using a discounted cash flow method. The Company recorded asset impairment charges, primarily related to underperforming retail stores, of $1.6 million in 2016, $2.8 million in 2015 and $2.0 million in 2014.
Advertising and Marketing Expense
Advertising and marketing costs are expensed as incurred, except for the costs of direct response advertising that relate primarily to the production and distribution of the Company's catalogs and coupon mailers. Direct response advertising costs are capitalized and amortized over the expected future revenue stream, which is generally one to three months from the date the materials are mailed. External production costs of advertising are expensed when the advertising first appears in the media or in the store.
48
In addition, the Company participates in co-op advertising programs with certain of its wholesale customers. For those co-op advertising programs where the Company has validated the fair value of the advertising received, co-op advertising costs are reflected as advertising expense within selling and administrative expenses. Otherwise, co-op advertising costs are reflected as a reduction of net sales.
Total advertising and marketing expense was $78.8 million, $78.4 million and $83.6 million in 2016, 2015 and 2014, respectively. These costs were offset by co-op advertising allowances recovered by the Company’s retail business of $4.1 million, $6.5 million and $6.2 million in 2016, 2015 and 2014, respectively. Total co-op advertising costs reflected as a reduction of net sales were $8.4 million in 2016, $9.7 million in 2015 and $10.0 million in 2014. Total advertising costs attributable to future periods that are deferred and recognized as a component of prepaid expenses and other current assets were $2.3 million and $2.7 million at January 28, 2017 and January 30, 2016, respectively.
Income Taxes
The Company recognizes deferred tax assets and liabilities for the expected future tax consequences of temporary differences between the consolidated financial statement carrying amounts and the tax bases of its assets and liabilities. The Company establishes valuation allowances if it believes that it is more-likely-than-not that some or all of its deferred tax assets will not be realized. The Company does not recognize a tax benefit unless it concludes that it is more-likely-than-not that the benefit will be sustained on audit by the taxing authority based solely on the technical merits of the associated tax position. If the recognition threshold is met, the Company recognizes a tax benefit measured at the largest amount of the tax benefit that, in its judgment, is greater than 50% likely to be realized. The Company records interest and penalties related to unrecognized tax positions within the income tax provision on the consolidated statements of earnings.
Operating Leases
The Company leases its store premises and certain office locations, distribution centers and equipment under operating leases. Approximately one-half of the leases entered into by the Company include options that allow the Company to extend the lease term beyond the initial commitment period, subject to terms agreed to at lease inception. Some leases also include early termination options that can be exercised under specific conditions.
Contingent Rentals
Many of the leases covering retail stores require contingent rentals in addition to the minimum monthly rental charge based on retail sales volume. The Company records expense for contingent rentals during the period in which the retail sales volume exceeds the respective targets.
Construction Allowances Received From Landlords
At the time its retail facilities are initially leased, the Company often receives consideration from landlords to be applied against the cost of leasehold improvements necessary to open the store. The Company treats these construction allowances as a lease incentive. The allowances are recorded as a deferred rent obligation and amortized to income over the lease term as a reduction of rent expense. The allowances are reflected as a component of other accrued expenses and deferred rent on the consolidated balance sheets.
Straight-Line Rents and Rent Holidays
The Company records rent expense on a straight-line basis over the lease term for all of its leased facilities. For leases that have predetermined fixed escalations of the minimum rentals, the Company recognizes the related rental expense on a straight-line basis and records the difference between the recognized rental expense and amounts payable under the lease as deferred rent. At the time its retail facilities are leased, the Company is frequently not charged rent for a specified period of time, typically 30 to 60 days, while the store is being prepared for opening. This rent-free period is referred to as a rent holiday. The Company recognizes rent expense over the lease term, including any rent holiday, within selling and administrative expenses on the consolidated statements of earnings.
Pre-opening Costs
Pre-opening costs associated with opening retail stores, including payroll, supplies and facility costs, are expensed as incurred.
Earnings Per Common Share Attributable to Caleres, Inc. Shareholders
The Company uses the two-class method to calculate basic and diluted earnings per common share attributable to Caleres, Inc. shareholders. Unvested restricted stock awards are considered participating units because they entitle holders to non-forfeitable rights to dividends or dividend equivalents during the vesting term. Under the two-class method, basic earnings per common share attributable to Caleres, Inc. shareholders is computed by dividing the net earnings attributable to Caleres, Inc. after allocation of earnings to participating securities by the weighted-average number of common shares outstanding during the year. Diluted earnings per common share attributable to Caleres, Inc. shareholders is computed by dividing the net earnings attributable to Caleres, Inc. after allocation of earnings to participating securities
49
by the weighted-average number of common shares and potential dilutive securities outstanding during the year. Potential dilutive securities consist of outstanding stock options and contingently issuable shares for the Company's performance share awards. Refer to Note 3 to the consolidated financial statements for additional information related to the calculation of earnings per common share attributable to Caleres, Inc. shareholders.
Comprehensive Income
Comprehensive income includes the effect of foreign currency translation adjustments, pension and other postretirement benefits adjustments and unrealized gains or losses from derivatives used for hedging activities.
Foreign Currency Translation Adjustment
For certain of the Company’s international subsidiaries, the local currency is the functional currency. Assets and liabilities of these subsidiaries are translated into United States dollars at the period-end exchange rate or historical rates as appropriate. Consolidated statements of earnings amounts are translated at average exchange rates for the period. The cumulative translation adjustments resulting from changes in exchange rates are included in the consolidated balance sheets as a component of accumulated other comprehensive loss in total Caleres, Inc. shareholders’ equity. Transaction gains and losses are included in the consolidated statements of earnings.
Pension and Other Postretirement Benefits Adjustments
The Company determines the expense and obligations for retirement and other benefit plans using assumptions related to discount rates, expected long-term rates of return on invested plan assets, expected salary increases and certain employee-related factors. The unrecognized portion of the gain or loss on plan assets is included in the consolidated balance sheets as a component of accumulated other comprehensive loss in total Caleres, Inc. shareholders’ equity and is recognized into the plans’ expense over time. Refer to additional information related to pension and other postretirement benefits in Note 5 and Note 14 to the consolidated financial statements.
Derivative Financial Instruments
The Company recognizes all derivative financial instruments as either assets or liabilities in the consolidated balance sheets and measures those instruments at fair value. The Company evaluates its exposure to volatility in foreign currency rates and may enter into derivative transactions. These derivative financial instruments are viewed as risk management tools and are not used for trading or speculative purposes. Refer to additional information related to derivative financial instruments in Note 12, Note 13 and Note 14 to the consolidated financial statements.
Business Combination Accounting
The Company allocates the purchase price of an acquired entity to the assets and liabilities acquired based upon their estimated fair values at the business combination date. The Company also identifies and estimates the fair values of intangible assets that should be recognized as assets apart from goodwill. A single estimate of fair value results from a complex series of judgments about future events and uncertainties and relies heavily on estimates and assumptions. The Company has engaged third-party valuation specialists to assist in the estimation of fair values for intangible assets other than goodwill, inventory and fixed assets. The carrying values of acquired receivables and trade accounts payable have historically approximated their fair values at the business combination date. With respect to other acquired assets and liabilities, the Company uses all available information to make the best estimates of their fair values at the business combination date.
The Company’s purchase price allocation methodology contains uncertainties because it requires management to make assumptions and to apply judgment to estimate the fair value of the acquired assets and liabilities. Management estimates the fair value of assets and liabilities based upon quoted market prices, the carrying value of the acquired assets and widely accepted valuation techniques, including discounted cash flows. Unanticipated events or circumstances may occur which could affect the accuracy of the Company’s estimates, including assumptions regarding industry economic factors and business strategies.
Share-Based Compensation
The Company has share-based incentive compensation plans under which certain officers, employees and members of the Board of Directors are participants and may be granted restricted stock, stock performance awards and stock options. Additionally, share-based grants may be made to non-employee members of the Board of Directors in the form of cash-equivalent restricted stock units (“RSUs”) at no cost to the non-employee member of the Board of Directors. The Company accounts for share-based compensation in accordance with the fair value recognition provisions of ASC 718, Compensation – Stock Compensation, and ASC 505, Equity, which require all share-based payments to employees and members of the Board of Directors, including grants of employee stock options, to be recognized as expense in the consolidated financial statements based on their fair values. The fair value of stock options is estimated using the Black-Scholes option pricing formula that requires assumptions for expected volatility, expected dividends, the risk-free interest rate and the expected term of the option. Stock options generally vest over four years, with 25% vesting annually, and expense is recognized on a straight-line basis separately for each vesting portion of the stock option award. Expense for restricted stock is based on the fair value of the restricted stock
50
on the date of grant and is generally recognized on a straight-line basis over a four-year vesting period. Expense for stock performance awards is recognized based upon the fair value of the awards on the date of grant and the anticipated number of shares or units to be awarded on a straight-line basis over the respective term of the award, or individual vesting portion of an award. Expense for the initial grant of RSUs is recognized ratably over the one-year vesting period based upon the fair value of the RSUs, as remeasured at the end of each period. If any of the assumptions used in the Black-Scholes model or the anticipated number of shares to be awarded change significantly, share-based compensation expense may differ materially in the future from that recorded in the current period. Refer to additional information related to share-based compensation in Note 15 to the consolidated financial statements.
Impact of Prospective Accounting Pronouncements
In May 2014, the Financial Accounting Standards Board ("FASB") issued Accounting Standards Update ("ASU") No. 2014-09, Revenue from Contracts with Customers (Topic 606), and subsequently issued ASU 2015-14 to defer the effective date and ASUs 2016-08, 2016-10, 2016-12 and ASU 2016-20 to clarify the implementation guidance in ASU 2014-09. Topic 606 provides a five-step analysis of transactions to determine when and how revenue is recognized, based upon the core principle that revenue is recognized to depict the transfer of goods or services to customers in an amount that reflects the consideration to which the entity expects to be entitled in exchange for those goods or services. ASU 2014-09 also requires additional disclosures regarding the nature, amount, timing and uncertainty of revenue and cash flows arising from contracts with customers. The ASUs are effective for fiscal years, and interim periods within those years, beginning after December 15, 2017, with early adoption permitted beginning after December 15, 2016. The Company has completed an initial assessment of the ASUs. Although the ASUs will impact revenue recognition for both of the Company's reportable segments, the Company anticipates a more significant impact on its Famous Footwear segment, primarily due to the ASUs' required treatment for loyalty programs (such as Rewards, the Company's loyalty program). While the Company is currently developing its implementation plan, including the determination of its adoption method, it expects to adopt the ASUs in the first quarter of 2018. The Company anticipates that the adoption may have a material impact on the consolidated financial statements.
In July 2015, the FASB issued ASU 2015-11, Simplifying the Measurement of Inventory (Topic 330), which requires entities to measure inventory at "the lower of cost and net realizable value", simplifying the current guidance under which entities must measure inventory at the lower of cost or market. Net realizable value is the estimated selling price in the ordinary course of business, less reasonably predictable costs of completion, disposal and transportation. Subsequent measurement is unchanged for inventory measured using the last-in, first-out (LIFO) method. The ASU is effective prospectively for fiscal years, and interim periods within those years, beginning after December 15, 2016. The Company will adopt the ASU in the first quarter of 2017, which is not expected to have a material impact on the consolidated financial statements.
In February 2016, the FASB issued ASU 2016-02, Leases (Topic 842), which requires lessees to recognize most leases on the balance sheet. The ASU is effective for fiscal years, and interim periods within those fiscal years, beginning after December 15, 2018, with early adoption permitted. The Company is currently evaluating the impact of the adoption of this ASU on its consolidated financial statements. Due to the large number of retail operating leases to which the Company is a party, the Company anticipates that the impact to its consolidated financial statements upon adoption in the first quarter of 2019 will be significant. However, the adoption of the ASU is not expected to trigger non-compliance with any covenant or other restrictions under the provisions of any of the Company’s debt obligations. Refer to Note 11 to the consolidated financial statement for further discussion on the Company's leases.
In March 2016, the FASB issued ASU 2016-09, Improvements to Employee Share-Based Payment Accounting (Topic 718), which simplifies accounting for certain aspects of share-based payments to employees, including income taxes, forfeitures and statutory income tax withholding requirements, as well as classification in the statement of cash flows. The ASU is effective for fiscal years, and interim periods within those fiscal years, beginning after December 15, 2016. The ASU requires certain income tax impacts related to share-based plans to be recorded within the income tax provision, rather than as a component of additional paid-in capital, as presented today. The Company will adopt the ASU in the first quarter of 2017 and will elect to account for forfeitures as they occur. The adoption of the income tax provisions will be applied prospectively and is anticipated to result in a greater degree of volatility in the income tax provision and effective income tax rate.
In June 2016, the FASB issued ASU 2016-13, Financial Instruments - Credit Losses (Topic 326): Measurement of Credit Losses on Financial Instruments, which significantly changes how entities will measure credit losses for most financial assets and certain other instruments that aren’t measured at fair value through net income. The ASU is effective for fiscal years, and interim periods within those fiscal years, beginning after December 15, 2019, with early adoption permitted beginning after December 15, 2018. The ASU's provisions will be applied as a cumulative effect adjustment to retained earnings as of the beginning of the first reporting period in which it is adopted. As credit losses from our trade receivables have not historically been significant, the Company anticipates that the adoption of the ASU will not have a material impact on the Company's consolidated financial statements.
51
In March 2017, the FASB issued ASU 2017-07, Improving the Presentation of Net Periodic Pension Cost and Net Periodic Postretirement Benefit Cost. The ASU amends ASC 715, Compensation — Retirement Benefits, to require employers that present a measure of operating income in their statements of earnings to include only the service cost component of net periodic pension cost and net periodic postretirement benefit cost in operating expenses (together with other employee compensation costs). The other components of net benefit cost, including amortization of prior service cost/credit, and settlement and curtailment effects, are to be included in non-operating expenses. The ASU is effective for fiscal years, and interim periods within those fiscal years, beginning after December 15, 2017, with early adoption only permitted for the Company in the first quarter of 2017, provided all provisions of the ASU are adopted. The Company is currently evaluating the impact of the adoption of this ASU on its consolidated financial statements.
2. ACQUISITION
Allen Edmonds
On December 13, 2016, the Company entered into a Stock Purchase Agreement (the "Purchase Agreement") with Apollo Investors, LLC (the "Seller") and Apollo Buyer Holding Company, Inc. (the "Holding Company"), pursuant to which the Company acquired all outstanding capital stock of Allen Edmonds ("Allen Edmonds"). The aggregate purchase price for the Allen Edmonds stock was $259.9 million, net of cash received of $0.7 million. The purchase was funded with cash and funds available under the Company's revolving credit agreement. Refer to Note 10 to the consolidated financial statements for additional information regarding the revolving credit agreement. The operating results of Allen Edmonds since December 13, 2016 have been included in the Company’s consolidated financial statements within the Brand Portfolio segment.
Allen Edmonds, founded in 1922, is a U.S.-based retailer and wholesaler of premium men’s footwear, apparel, leather goods and accessories with a strong manufacturing heritage. The acquisition increased the Company's exposure in men’s footwear, solidifying a new revenue stream to drive overall growth.
The Company incurred acquisition and integration costs of $5.8 million ($5.0 million on an after-tax basis, or $0.11 per diluted share) in 2016, which were recorded as a component of restructuring and other special charges, net. Of the $5.8 million, $5.2 million was reflected within the Other category and $0.6 million was reflected within the Brand Portfolio segment. In addition, the Brand Portfolio segment recognized $1.2 million in cost of goods sold in 2016 related to the amortization of the inventory fair value adjustment required for purchase accounting. Refer to Note 4 to the consolidated financial statements for additional information related to the acquisition and integration costs.
The assets and liabilities of Allen Edmonds were recorded at their estimated fair values, and the excess of the purchase price over the fair value of the assets acquired and liabilities assumed, including identified intangible assets, was recorded as goodwill. The Company has preliminarily allocated the purchase price as of the acquisition date, December 13, 2016 as follows:
52
($ thousands) | December 13, 2016 | |||
ASSETS | ||||
Current assets: | ||||
Cash and cash equivalents | $ | 668 | ||
Receivables | 6,273 | |||
Inventories | 51,836 | |||
Prepaid expense and other current assets | 2,353 | |||
Total current assets | 61,130 | |||
Other assets | 1,060 | |||
Goodwill | 113,144 | |||
Intangible assets | 103,420 | |||
Property and equipment | 32,243 | |||
Total assets | $ | 310,997 | ||
LIABILITIES AND EQUITY | ||||
Current liabilities: | ||||
Trade accounts payable | $ | 12,256 | ||
Other accrued expenses | 12,692 | |||
Total current liabilities | 24,948 | |||
Deferred income taxes | 25,098 | |||
Other liabilities | 351 | |||
Total liabilities | 50,397 | |||
Net assets | $ | 260,600 | ||
The allocation of the purchase price is based on certain preliminary valuations and analysis that have not been completed as of the date of this filing. Any subsequent changes in the estimated fair values assumed upon the finalization of more detailed analysis within the measurement period will change the allocation of the purchase price and will be adjusted during the period in which the amounts are determined. The Company’s purchase price allocation contains uncertainties because it required management to make assumptions and to apply judgment to estimate the fair value of the acquired assets and liabilities. A single estimate of fair value results from a complex series of judgments about future events and uncertainties and relies heavily on estimates and assumptions. The judgments the Company used in estimating the fair values assigned to each class of the acquired assets and assumed liabilities could materially affect the results of its operations. Management estimated the fair value of the assets and liabilities based upon quoted market prices, the carrying value of the acquired assets and widely accepted valuation techniques, including discounted cash flows. Unanticipated events or circumstances may occur, which could affect the accuracy of the Company’s fair value estimates, including assumptions regarding industry economic factors and business strategies.
A third-party valuation specialist assisted the Company with its fair value estimates for inventory, property and equipment, and intangible assets other than goodwill. The Company estimated the fair value of inventories based on the estimated selling price of the work-in-process and finished goods acquired at the closing date, less the sum of the costs to complete the work-in-process, the costs of disposal and a reasonable profit allowance for the completion and post-transaction selling effort based on profit for similar finished goods. The book value of the raw materials acquired was considered a reasonable representation of fair value. With respect to other acquired assets and liabilities, the Company used all available information to make its best estimate of fair values at the acquisition date.
Goodwill and intangible assets reflected above were determined to meet the criteria for recognition apart from tangible assets acquired and liabilities assumed. The goodwill recognized is primarily attributable to non-separable retail customer relationships, synergies and an assembled workforce and is not deductible for tax purposes. Refer to Note 9 to the consolidated financial statements for additional information regarding goodwill and intangible assets.
During the period from the acquisition date through January 28, 2017, Allen Edmonds contributed $24.3 million of net sales and had an immaterial impact on the Company's earnings.
53
3. EARNINGS PER SHARE
The Company uses the two-class method to compute basic and diluted earnings per common share attributable to Caleres, Inc. shareholders. In periods of net loss, no effect is given to the Company’s participating securities since they do not contractually participate in the losses of the Company. The following table sets forth the computation of basic and diluted earnings per common share attributable to Caleres, Inc. shareholders:
(in $ thousands, except per share amounts) | 2016 | 2015 | 2014 | ||||||||
NUMERATOR | |||||||||||
Net earnings | $ | 66,086 | $ | 81,824 | $ | 82,943 | |||||
Net earnings attributable to noncontrolling interests | (428 | ) | (345 | ) | (93 | ) | |||||
Net earnings allocated to participating securities | (1,750 | ) | (2,587 | ) | (3,068 | ) | |||||
Net earnings attributable to Caleres, Inc. after allocation of earnings to participating securities | 63,908 | 78,892 | 79,782 | ||||||||
DENOMINATOR | |||||||||||
Denominator for basic earnings per common share attributable to Caleres, Inc. shareholders | 42,026 | 42,455 | 42,071 | ||||||||
Dilutive effect of share-based awards | 155 | 201 | 203 | ||||||||
Denominator for diluted earnings per common share attributable to Caleres, Inc. shareholders | 42,181 | 42,656 | 42,274 | ||||||||
Basic earnings per common share attributable to Caleres, Inc. shareholders | $ | 1.52 | $ | 1.86 | $ | 1.90 | |||||
Diluted earnings per common share attributable to Caleres, Inc. shareholders | $ | 1.52 | $ | 1.85 | $ | 1.89 | |||||
Options to purchase 63,915, 56,997 and 64,497 shares of common stock in 2016, 2015 and 2014, respectively, were not included in the denominator for diluted earnings per common share attributable to Caleres, Inc. shareholders because the effect would be antidilutive.
The Company repurchased 900,000 and 151,500 shares during the years ended January 28, 2017 and January 30, 2016, respectively, under the publicly announced share repurchase program, which permits repurchases of up to 2.5 million shares. As of January 28, 2017, the Company has repurchased a total of 1.1 million shares at a cost of $28.1 million.
4. RESTRUCTURING AND OTHER INITIATIVES, NET
Impairment of Note Receivable
During 2014, the Company sold Shoes.com for an aggregate purchase price of $15.0 million, subject to working capital and other adjustments. The Company received $4.4 million in cash and a $7.5 million face value secured convertible note ("convertible note") at closing. The convertible note required installments over four years with the first principal payment of $1.25 million due on July 1, 2017 and quarterly installments of $0.6 million thereafter, plus accrued interest, until it matured on December 12, 2019. The Company recognized a pre-tax gain on the sale of $4.7 million.
On January 27, 2017, Shoes.com announced the business had ceased operating and would be working with creditors to liquidate. In conjunction with the announcement, the Company recorded an impairment charge of $8.0 million ($4.9 million on an after-tax basis, or $0.11 per diluted share), comprised of the fair value of the convertible note of $7.3 million, and associated accounts receivable of $0.7 million. Of the $8.0 million in costs recorded in restructuring and other special charges, net during 2016, $7.3 million was reflected within the Other category and $0.7 million was reflected within the Brand Portfolio segment.
54
Impairment of Investment in Nonconsolidated Affiliate
In August 2014, the Company invested $7.0 million in a nonconsolidated affiliate that is accounted for using the cost method and is presented within other assets on the consolidated balance sheets. During the fourth quarter of 2016, the Company determined that the investment had an other-than-temporary decline in its fair value that exceeded its carrying value and recorded an impairment charge of $7.0 million ($7.0 million on an after-tax basis, or $0.16 per diluted share) in restructuring and other special charges, net, which is included in the Other category.
Acquisition and Integration Costs
On December 13, 2016, the Company acquired the outstanding capital stock of Allen Edmonds, as further discussed in Note 2 to the consolidated financial statements. During 2016, the Company incurred acquisition and integration costs totaling $5.8 million ($5.0 million on an after-tax basis, or $0.11 per diluted share), of which $5.2 million was reflected within the Other category and $0.6 million was reflected within the Brand Portfolio segment. Refer to Note 2 to the consolidated financial statements for further information.
Business Exits and Restructuring
The Company incurred costs of $4.2 million ($3.3 million on an after-tax basis, or $0.08 per diluted share) during 2016 related to the planned exit of our international e-commerce business and other restructuring. Approximately $2.6 million represents severance and closure costs and is presented within restructuring and other special charges, net within the Brand Portfolio segment. The remaining $1.6 million represents incremental inventory markdowns required to reduce the value of inventory to net realizable value. Inventory markdowns are included in cost of goods sold within the Brand Portfolio segment.
Organizational Change
During 2014, the Company incurred costs of $1.9 million ($1.2 million on an after-tax basis, or $0.03 per diluted share) related to a management change at the corporate headquarters, with no corresponding charges in 2016 or 2015. These costs were recognized as restructuring and other special charges, net and included in the Other category.
5. RETIREMENT AND OTHER BENEFIT PLANS
The Company sponsors pension plans in both the United States and Canada. The Company’s domestic pension plans cover substantially all United States employees. Under the domestic plans, salaried, management and certain hourly employees’ pension benefits are based on a two-rate formula applied to each year of service. Participants receive the larger of the accrued benefit as of December 31, 2015 (based on service commencing at the date of hire and a 35-year service cap and an average annual salary for the five highest consecutive years during the last 10 year period) and the benefit calculated under the current plan provisions using pay and service from the date of hire. Generally, under the current plan provisions, a participant receives credit for one year of service for each 365 days of employment as an eligible employee with the Company commencing after the employee's date of participation in the plan, up to 30 years. A service credit of 0.825% is applied to that portion of the average annual salary for the last 10 years that does not exceed “covered compensation,” which is the 35-year average compensation subject to FICA tax based on a participant’s year of birth, and a service credit of 1.425% is applied to that portion of the average salary during those 10 years that exceeds said level.
The Company’s Canadian pension plans cover certain employees based on plan specifications. Under the Canadian plans, employees’ pension benefits are based on the employee’s highest consecutive five years of compensation during the 10 years before retirement. The Company’s funding policy for all plans is to make the minimum annual contributions required by applicable regulations. The Company also maintains an unfunded Supplemental Executive Retirement Plan (“SERP”).
In addition to providing pension benefits, the Company sponsors unfunded defined benefit postretirement life insurance plans that cover both salaried and hourly employees who became eligible for benefits by January 1, 1995. The life insurance plans provide coverage of up to $20 thousand dollars for qualifying retired employees.
55
Benefit Obligations
The following table sets forth changes in benefit obligations, including all domestic and Canadian plans:
Pension Benefits | Other Postretirement Benefits | |||||||||||||
($ thousands) | 2016 | 2015 | 2016 | 2015 | ||||||||||
Benefit obligation at beginning of year | $ | 326,077 | $ | 362,340 | $ | 1,411 | $ | 1,512 | ||||||
Service cost | 8,288 | 12,639 | — | — | ||||||||||
Interest cost | 15,275 | 14,321 | 76 | 56 | ||||||||||
Plan participants’ contribution | 11 | 11 | 9 | 9 | ||||||||||
Plan amendments | 316 | 91 | — | — | ||||||||||
Actuarial loss (gain) | 11,155 | (49,318 | ) | 357 | (31 | ) | ||||||||
Benefits paid | (19,853 | ) | (13,490 | ) | (187 | ) | (135 | ) | ||||||
Settlement gain | (1,304 | ) | — | — | — | |||||||||
Contractual termination benefits | 77 | — | — | — | ||||||||||
Curtailments | — | (120 | ) | — | — | |||||||||
Foreign exchange rate changes | 236 | (397 | ) | — | — | |||||||||
Benefit obligation at end of year | $ | 340,278 | $ | 326,077 | $ | 1,666 | $ | 1,411 | ||||||
The accumulated benefit obligation for the United States pension plans was $320.1 million and $311.6 million as of January 28, 2017 and January 30, 2016, respectively. The accumulated benefit obligation for the Canadian pension plans was $3.8 million and $3.5 million as of January 28, 2017 and January 30, 2016, respectively.
Pension Benefits | Other Postretirement Benefits | |||||||||
Weighted–average assumptions used to determine benefit obligations, end of year | 2016 | 2015 | 2016 | 2015 | ||||||
Discount rate | 4.40 | % | 4.70 | % | 4.40 | % | 4.70 | % | ||
Rate of compensation increase | 3.00 | % | 3.00 | % | N/A | N/A | ||||
As of January 28, 2017, the Company is using the RP-2014 Bottom Quartile tables, projected using generational scale MP-2016, an updated projection scale issued by the Society of Actuaries in 2016, grading to 0.75% by 2032, to estimate the plan liabilities. Actuarial gains, related to the change in mortality projection scales, reduced the projected benefit obligation by approximately $5.8 million as of January 28, 2017.
During 2014, the Company announced amendments to the domestic qualified pension plan and the SERP, including certain changes to eligibility and service period requirements as well as changes to the benefit formula, including the calculation of participants' final average compensation. Certain changes became effective in January 2015, while other changes became effective in January 2016. These plan amendments increased the pension liability by $0.3 million and $0.1 million as of January 28, 2017 and January 30, 2016, respectively.
Plan Assets
Pension assets are managed in accordance with the prudent investor standards of the Employee Retirement Income Security Act (“ERISA”). The plan’s investment objective is to earn a competitive total return on assets, while also ensuring plan assets are adequately managed to provide for future pension obligations. This results in the protection of plan surplus and is accomplished by matching the duration of the projected benefit obligation using leveraged fixed income instruments and, while maintaining an equity commitment, managing an equity overlay strategy. The overlay strategy is intended to protect the managed equity portfolios against adverse stock market environments. The Company delegates investment management of the plan assets to specialists in each asset class and regularly monitors manager performance and compliance with investment guidelines. The Company’s overall investment strategy is to achieve a mix of approximately 97% of investments for long-term growth and 3% for near-term benefit payments with a wide diversification of asset types, fund strategies and fund managers. The target allocations for plan assets for 2016 were 70% equities and 30% debt securities. Allocations may change periodically based upon changing market conditions. Equities did not include any Company stock at January 28, 2017 or January 30, 2016.
Assets of the Canadian pension plans, which total approximately $4.4 million at January 28, 2017, were invested 60% in equity funds, 36% in bond funds and 4% in money market funds. The Canadian pension plans did not include any Company stock as of January 28, 2017 or January 30, 2016.
56
A financial instrument’s level within the valuation hierarchy is based upon the lowest level of input that is significant to the fair value measurement. Refer to further discussion on the fair value hierarchy in Note 13 to the consolidated financial statements. Following is a description of the pension plan investments measured at fair value, including the general classification of such investments pursuant to the valuation hierarchy.
• | Cash and cash equivalents include cash collateral and margin as well as money market funds. The fair values are based on unadjusted quoted market prices in active markets with sufficient volume and frequency and therefore are classified within Level 1 of the fair value hierarchy. |
• | Investments in U.S. government securities, mutual funds, real estate investment trusts, exchange-traded funds, corporate stocks - common, preferred securities and S&P 500 Index put and call options (traded on security exchanges) are classified within Level 1 of the fair value hierarchy because the fair values are based on unadjusted quoted market prices in active markets with sufficient volume and frequency. |
• | Interest rate swap agreements are valued at fair value based on vendor-quoted pricing for which inputs are observable and can be corroborated; therefore, these are classified within Level 2 of the fair value hierarchy. |
• | The alternative investment fund, with a fair value of $12.1 million and $10.9 million as of January 28, 2017 and January 30, 2016, respectively, is an investment in a pool of long-duration domestic investment grade assets. This investment is valued at fair value based on vendor-quoted pricing for which inputs are observable and can be corroborated and therefore, are classified within Level 2 of the fair value hierarchy. |
• | The unallocated insurance contract is valued at contract value, which approximates fair value; therefore, this contract is classified within Level 3 of the fair value hierarchy. The unallocated insurance contract fair value was $0.1 million as of both January 28, 2017 and January 30, 2016. |
The fair values of the Company’s pension plan assets at January 28, 2017 by asset category are as follows:
Fair Value Measurements at January 28, 2017 | ||||||||||||||||
($ thousands) | Total | Level 1 | Level 2 | Level 3 | ||||||||||||
Asset | ||||||||||||||||
Cash and cash equivalents | $ | 16,484 | $ | 16,484 | $ | — | $ | — | ||||||||
U.S. government securities | 97,226 | 97,226 | — | — | ||||||||||||
Mutual fund | 34,833 | 34,833 | — | — | ||||||||||||
Real estate investment trusts | 1,505 | 1,505 | — | — | ||||||||||||
Exchange-traded funds | 62,244 | 62,244 | — | — | ||||||||||||
Corporate stocks - common | 141,372 | 141,372 | — | — | ||||||||||||
Preferred securities | 706 | 706 | — | — | ||||||||||||
S&P 500 Index options | 4,392 | 4,392 | — | — | ||||||||||||
Interest rate swap agreements | (8,997 | ) | — | (8,997 | ) | — | ||||||||||
Alternative investment fund | 12,101 | — | 12,101 | — | ||||||||||||
Unallocated insurance contract | 90 | — | — | 90 | ||||||||||||
Total | $ | 361,956 | $ | 358,762 | $ | 3,104 | $ | 90 | ||||||||
57
The fair values of the Company’s pension plan assets at January 30, 2016 by asset category are as follows:
Fair Value Measurements at January 30, 2016 | ||||||||||||||||
($ thousands) | Total | Level 1 | Level 2 | Level 3 | ||||||||||||
Asset | ||||||||||||||||
Cash and cash equivalents | $ | 42,881 | $ | 42,881 | $ | — | $ | — | ||||||||
U.S. government securities | 129,846 | 129,846 | — | — | ||||||||||||
Mutual fund | 27,662 | 27,662 | — | — | ||||||||||||
Real estate investment trusts | 245 | 245 | — | — | ||||||||||||
Exchange-traded funds | 55,651 | 55,651 | — | — | ||||||||||||
Corporate stocks - common | 116,002 | 116,002 | — | — | ||||||||||||
S&P 500 Index options | 657 | 657 | — | — | ||||||||||||
Preferred securities | 1,742 | 1,742 | — | — | ||||||||||||
Interest rate swap agreements | (6,028 | ) | — | (6,028 | ) | — | ||||||||||
Alternative investment fund | 10,901 | — | 10,901 | — | ||||||||||||
Unallocated insurance contract | 79 | — | — | 79 | ||||||||||||
Total | $ | 379,638 | $ | 374,686 | $ | 4,873 | $ | 79 | ||||||||
The following table sets forth changes in the fair value of plan assets, including all domestic and Canadian plans:
Pension Benefits | Other Postretirement Benefits | ||||||||||||||
($ thousands) | 2016 | 2015 | 2016 | 2015 | |||||||||||
Fair value of plan assets at beginning of year | $ | 379,638 | $ | 423,534 | $ | — | $ | — | |||||||
Actual return on plan assets | 1,755 | (30,091 | ) | — | — | ||||||||||
Employer contributions | 1,458 | 90 | 178 | 126 | |||||||||||
Plan participants’ contributions | 11 | 11 | 9 | 9 | |||||||||||
Benefits paid | (19,853 | ) | (13,490 | ) | (187 | ) | (135 | ) | |||||||
Settlement gain | (1,304 | ) | — | — | — | ||||||||||
Foreign exchange rate changes | 251 | (416 | ) | — | — | ||||||||||
Fair value of plan assets at end of year | $ | 361,956 | $ | 379,638 | $ | — | $ | — | |||||||
Funded Status
The over-funded status as of January 28, 2017 and January 30, 2016 for pension benefits was $21.7 million and $53.6 million, respectively. The under-funded status as of January 28, 2017 and January 30, 2016 for other postretirement benefits was $1.7 million and $1.4 million, respectively.
Amounts recognized in the consolidated balance sheets consist of:
Pension Benefits | Other Postretirement Benefits | ||||||||||||||
($ thousands) | 2016 | 2015 | 2016 | 2015 | |||||||||||
Prepaid pension costs (noncurrent assets) | $ | 32,489 | $ | 64,890 | $ | — | $ | — | |||||||
Accrued benefit liabilities (current liability) | (2,765 | ) | (3,512 | ) | (250 | ) | (141 | ) | |||||||
Accrued benefit liabilities (noncurrent liability) | (8,043 | ) | (7,817 | ) | (1,416 | ) | (1,270 | ) | |||||||
Net amount recognized at end of year | $ | 21,681 | $ | 53,561 | $ | (1,666 | ) | $ | (1,411 | ) | |||||
The projected benefit obligation, the accumulated benefit obligation and the fair value of plan assets for pension plans with a projected benefit obligation in excess of plan assets and for pension plans with an accumulated benefit obligation in excess of plan assets, which includes only the Company’s SERP, were as follows:
58
Projected Benefit Obligation Exceeds the Fair Value of Plan Assets | Accumulated Benefit Obligation Exceeds the Fair Value of Plan Assets | ||||||||||||||
($ thousands) | 2016 | 2015 | 2016 | 2015 | |||||||||||
End of Year | |||||||||||||||
Projected benefit obligation | $ | 10,808 | $ | 11,326 | $ | 10,808 | $ | 11,326 | |||||||
Accumulated benefit obligation | 9,646 | 10,747 | 9,646 | 10,747 | |||||||||||
Fair value of plan assets | — | — | — | — | |||||||||||
The accumulated postretirement benefit obligation exceeds assets for all of the Company’s other postretirement benefit plans.
The amounts in accumulated other comprehensive loss that have not yet been recognized as components of net periodic benefit income at January 28, 2017 and January 30, 2016, and the expected amortization of the January 28, 2017 amounts as components of net periodic benefit income for fiscal year 2017 are as follows:
Pension Benefits | Other Postretirement Benefits | ||||||||||||||
($ thousands) | 2016 | 2015 | 2016 | 2015 | |||||||||||
Components of accumulated other comprehensive loss, net of tax: | |||||||||||||||
Net actuarial loss (gain) | $ | 35,104 | $ | 11,976 | $ | (635 | ) | $ | (947 | ) | |||||
Net prior service credit | (4,385 | ) | (5,673 | ) | — | — | |||||||||
$ | 30,719 | $ | 6,303 | $ | (635 | ) | $ | (947 | ) | ||||||
Pension Benefits | Other Postretirement Benefits | ||||||||||
($ thousands) | 2017 | 2017 | |||||||||
Expected amortization, net of tax: | |||||||||||
Amortization of net actuarial loss (gain) | $ | 521 | $ | (146 | ) | ||||||
Amortization of net prior service cost | (1,840 | ) | — | ||||||||
$ | (1,319 | ) | $ | (146 | ) | ||||||
Net Periodic Benefit Income
Net periodic benefit income for 2016, 2015 and 2014 for all domestic and Canadian plans included the following components:
Pension Benefits | Other Postretirement Benefits | |||||||||||||||||||
($ thousands) | 2016 | 2015 | 2014 | 2016 | 2015 | 2014 | ||||||||||||||
Service cost | $ | 8,288 | $ | 12,639 | $ | 9,650 | $ | — | $ | — | $ | — | ||||||||
Interest cost | 15,275 | 14,321 | 14,230 | 76 | 56 | 49 | ||||||||||||||
Expected return on assets | (28,949 | ) | (31,682 | ) | (24,757 | ) | — | — | — | |||||||||||
Amortization of: | ||||||||||||||||||||
Actuarial loss (gain) | 272 | 604 | 201 | (163 | ) | (220 | ) | (432 | ) | |||||||||||
Prior service (credit) cost | (1,840 | ) | (1,906 | ) | 27 | — | — | — | ||||||||||||
Settlement cost | 259 | — | — | — | — | — | ||||||||||||||
Cost of contractual termination benefits | 77 | — | — | — | — | — | ||||||||||||||
Curtailments | — | (184 | ) | — | — | — | — | |||||||||||||
Total net periodic benefit income | $ | (6,618 | ) | $ | (6,208 | ) | $ | (649 | ) | $ | (87 | ) | $ | (164 | ) | $ | (383 | ) | ||
Weighted-average assumptions used to determine net periodic benefit income:
Pension Benefits | Other Postretirement Benefits | |||||||||||||
2016 | 2015 | 2014 | 2016 | 2015 | 2014 | |||||||||
Discount rate | 4.70 | % | 3.90 | % | 5.00 | % | 4.70 | % | 3.90 | % | 5.00 | % | ||
Rate of compensation increase | 3.00 | % | 3.00 | % | 3.00 | % | N/A | N/A | N/A | |||||
Expected return on plan assets | 8.00 | % | 8.25 | % | 8.25 | % | N/A | N/A | N/A | |||||
59
The net actuarial loss (gain) subject to amortization is amortized on a straight-line basis over the average future service of active plan participants as of the measurement date. The prior service (credit) cost is amortized on a straight-line basis over the average future service of active plan participants benefiting under the plan at the time of each plan amendment.
The expected long-term rate of return on plan assets is based on historical and projected rates of return for current and planned asset classes in the plan’s investment portfolio. Assumed projected rates of return for each asset class were selected after analyzing experience and future expectations of the returns. The overall expected rate of return for the portfolio was developed based on the target allocation for each asset class.
Expected Cash Flows
Information about expected cash flows for all pension and postretirement benefit plans follows:
Pension Benefits | ||||||||||||||
($ thousands) | Funded Plan | SERP | Total | Other Postretirement Benefits | ||||||||||
Employer Contributions | ||||||||||||||
2017 expected contributions to plan trusts | $ | 103 | $ | — | $ | 103 | $ | — | ||||||
2017 expected contributions to plan participants | — | 2,826 | 2,826 | 255 | ||||||||||
Expected Benefit Payments | ||||||||||||||
2017 | $ | 12,117 | $ | 2,826 | $ | 14,943 | $ | 255 | ||||||
2018 | 12,825 | 2,647 | 15,472 | 231 | ||||||||||
2019 | 13,541 | 1,297 | 14,838 | 208 | ||||||||||
2020 | 14,263 | 3,117 | 17,380 | 186 | ||||||||||
2021 | 15,057 | 710 | 15,767 | 166 | ||||||||||
2022 – 2026 | 84,718 | 3,490 | 88,208 | 563 | ||||||||||
Defined Contribution Plans
The Company’s domestic defined contribution 401(k) plan covers salaried and certain hourly employees. Company contributions represent a partial matching of employee contributions, generally up to a maximum of 3.5% of the employee’s salary and bonus. The Company’s expense for this plan was $3.5 million in 2016, $3.6 million in 2015, and $3.0 million in 2014.
The Company’s Canadian defined contribution plan covers certain salaried and hourly employees. The Company makes contributions for all eligible employees, ranging from 3% to 5% of the employee’s salary. In addition, eligible employees may voluntarily contribute to the plan. The Company’s expense for this plan was $0.2 million in 2016, 2015 and 2014, respectively.
Deferred Compensation Plan
The Company has a non-qualified deferred compensation plan (the “Deferred Compensation Plan”) for the benefit of certain management employees. The investment funds offered to the participants generally correspond to the funds offered in the Company’s 401(k) plan and the account balance fluctuates with the investment returns on those funds. The Deferred Compensation Plan permits the deferral of up to 50% of base salary and 100% of compensation received under the Company’s annual incentive plan. The deferrals are held in a separate trust, which has been established by the Company to administer the Deferred Compensation Plan. The assets of the trust are subject to the claims of the Company’s creditors in the event that the Company becomes insolvent. Consequently, the trust qualifies as a grantor trust for income tax purposes (i.e., a “Rabbi Trust”). The liabilities of the Deferred Compensation Plan of $5.1 million and $3.4 million as of January 28, 2017 and January 30, 2016, respectively, are presented in employee compensation and benefits in the accompanying consolidated balance sheets. The assets held by the trust of $5.1 million as of January 28, 2017 and $3.4 million as of January 30, 2016 are classified as trading securities within prepaid expenses and other current assets in the accompanying consolidated balance sheets, with changes in the deferred compensation charged to selling and administrative expenses in the accompanying consolidated statements of earnings.
Deferred Compensation Plan for Non-Employee Directors
Non-employee directors are eligible to participate in a deferred compensation plan, whereby deferred compensation amounts are valued as if invested in the Company’s common stock through the use of phantom stock units (“PSUs”). Under the plan, each participating director’s account is credited with the number of PSUs equal to the number of shares of the Company’s common stock that the participant could purchase or receive with the amount of the deferred compensation, based upon the fair value (as determined based on the average of the high and low prices) of the Company’s common stock on the last trading day of the fiscal quarter when the cash compensation was earned.
60
Dividend equivalents are paid on PSUs at the same rate as dividends on the Company’s common stock and are re-invested in additional PSUs at the next fiscal quarter-end. The PSUs are payable in cash based on the number of PSUs credited to the participating director’s account, valued on the basis of the fair value at fiscal quarter-end on or following termination of the director’s service. The liabilities of the plan of $1.9 million as of January 28, 2017 and $1.7 million as of January 30, 2016 are based on 57,234 and 56,629 outstanding PSUs, respectively, and are presented in other liabilities in the accompanying consolidated balance sheets. Gains and losses resulting from changes in the fair value of the PSUs are charged to selling and administrative expenses in the accompanying consolidated statements of earnings.
6. INCOME TAXES
The components of earnings before income taxes consisted of domestic earnings before income taxes of $60.9 million, $68.2 million and $70.8 million in 2016, 2015 and 2014, respectively, and foreign earnings before income taxes of $36.4 million, $40.6 million and $39.3 million in 2016, 2015 and 2014, respectively.
The components of income tax provision (benefit) on earnings were as follows:
($ thousands) | 2016 | 2015 | 2014 | |||||||||
Federal | ||||||||||||
Current | $ | 10,577 | $ | 9,530 | $ | 27,311 | ||||||
Deferred | 14,164 | 11,202 | (9,502 | ) | ||||||||
24,741 | 20,732 | 17,809 | ||||||||||
State | ||||||||||||
Current | 3,844 | 497 | 5,501 | |||||||||
Deferred | (1,157 | ) | 1,176 | (642 | ) | |||||||
2,687 | 1,673 | 4,859 | ||||||||||
Foreign | 3,740 | 4,537 | 4,516 | |||||||||
Total income tax provision | $ | 31,168 | $ | 26,942 | $ | 27,184 | ||||||
The Company made federal, state and foreign tax payments, net of refunds, of $16.9 million, $22.1 million and $20.1 million in 2016, 2015 and 2014, respectively.
The differences between the income tax provision reflected in the consolidated financial statements and the amounts calculated at the federal statutory income tax rate of 35% were as follows:
($ thousands) | 2016 | 2015 | 2014 | |||||||||
Income taxes at statutory rate | $ | 34,039 | $ | 38,068 | $ | 38,544 | ||||||
State income taxes, net of federal tax benefit | 3,149 | 2,481 | 3,159 | |||||||||
Foreign earnings taxed at lower rates | (8,404 | ) | (9,491 | ) | (8,882 | ) | ||||||
Tax on international subsidiary dividend | — | — | 1,040 | |||||||||
Disposal and settlement of Shoes.com | — | (1,701 | ) | (7,428 | ) | |||||||
Valuation allowance release on state loss carryforwards | — | (1,635 | ) | — | ||||||||
Valuation allowance release on other tax carryforwards | (179 | ) | (1,367 | ) | — | |||||||
Valuation allowance for impairment of investment in nonconsolidated affiliate | 2,450 | — | — | |||||||||
Non-deductibility of acquisition costs | 1,280 | — | — | |||||||||
Settlement of federal and state audit matters | (945 | ) | — | — | ||||||||
Other | (222 | ) | 587 | 751 | ||||||||
Total income tax provision | $ | 31,168 | $ | 26,942 | $ | 27,184 | ||||||
In 2016, the Company's effective tax rate was impacted by several discrete tax benefits, including the settlement of certain federal and state tax matters, reductions of the valuation allowance related to capital loss carryforwards, and other adjustments, which totaled $2.5 million for the year. If these discrete tax benefits had not been recognized, the Company's full fiscal year 2016 effective tax rate would have been 34.6%.
The other category of income tax provision principally represents the impact of expenses that are not deductible or partially deductible for federal income tax purposes and adjustments in the amounts of deferred tax assets that are anticipated to be realized.
61
Significant components of the Company’s deferred income tax assets and liabilities were as follows:
($ thousands) | January 28, 2017 | January 30, 2016 | ||||||
Deferred Tax Assets | ||||||||
Employee benefits, compensation and insurance | $ | 18,783 | $ | 24,740 | ||||
Accrued expenses | 18,843 | 16,118 | ||||||
Postretirement and postemployment benefit plans | 706 | 721 | ||||||
Deferred rent | 8,319 | 7,269 | ||||||
Accounts receivable reserves | 7,479 | 7,946 | ||||||
Net operating loss (“NOL”) carryforward/carryback | 23,302 | 7,943 | ||||||
Capital loss carryforward | 2,185 | 2,368 | ||||||
Alternative minimum tax credit carryforward | 270 | — | ||||||
Inventory capitalization and inventory reserves | 3,871 | 1,620 | ||||||
Impairment of investment in nonconsolidated affiliate | 2,590 | — | ||||||
Depreciation | — | 630 | ||||||
Other | 1,580 | 1,346 | ||||||
Total deferred tax assets, before valuation allowance | 87,928 | 70,701 | ||||||
Valuation allowance | (7,890 | ) | (6,544 | ) | ||||
Total deferred tax assets, net of valuation allowance | 80,038 | 64,157 | ||||||
Deferred Tax Liabilities | ||||||||
Retirement plans | (8,421 | ) | (21,051 | ) | ||||
LIFO inventory valuation | (61,301 | ) | (61,585 | ) | ||||
Capitalized software | (8,715 | ) | (10,525 | ) | ||||
Depreciation | (9,076 | ) | — | |||||
Other | (1,096 | ) | (786 | ) | ||||
Intangible assets | (41,645 | ) | (631 | ) | ||||
Total deferred tax liabilities | (130,254 | ) | (94,578 | ) | ||||
Net deferred tax liability | $ | (50,216 | ) | $ | (30,421 | ) | ||
As of January 28, 2017, the Company had various federal and state net operating loss carryforwards totaling $23.3 million, with expiration dates between 2017 and 2036. The Company's state net operating loss carryforwards have tax values totaling $8.1 million, for which the Company has recorded a valuation allowance of $3.1 million. The remaining net operating loss will be carried forward to future tax years. The Company also has valuation allowances of $2.6 million related to the impairment of an investment in a nonconsolidated affiliate, as further described in Note 4 to the consolidated financial statements, and $2.2 million related to capital loss carryforwards. In connection with the Allen Edmonds acquisition, the Company acquired net operating loss carryforwards totaling $15.6 million, the majority of which represents federal carryforwards. The Company anticipates full utilization of these federal operating loss carryforwards.
As of January 28, 2017, no deferred taxes have been provided on the accumulated unremitted earnings of the Company’s foreign subsidiaries that are not subject to United States income tax. The Company periodically evaluates its foreign investment opportunities and plans, as well as its foreign working capital needs, to determine the level of investment required and, accordingly, determines the level of foreign earnings that is considered indefinitely reinvested. Based upon that evaluation, earnings of the Company’s foreign subsidiaries that are not otherwise subject to United States taxation, are considered to be indefinitely reinvested, and accordingly, deferred taxes have not been provided. If changes occur in future investment opportunities and plans, those changes will be reflected when known and may result in providing residual United States deferred taxes on unremitted foreign earnings. If the Company’s unremitted foreign earnings were not considered indefinitely reinvested as of January 28, 2017, additional deferred taxes of approximately $53.4 million would have been provided.
Uncertain Tax Positions
ASC 740, Income Taxes, establishes a single model to address accounting for uncertain tax positions. The standard clarifies the accounting for income taxes by prescribing a minimum recognition threshold a tax position is required to meet before being recognized in the financial statements. The standard also provides guidance on derecognition, measurement classification, interest and penalties, accounting in interim periods, disclosure and transition.
62
A reconciliation of the beginning and ending amount of unrecognized tax benefits is as follows:
($ thousands) | ||||
Balance at February 1, 2014 | $ | 1,015 | ||
Reductions for tax positions of prior years due to a lapse in the statute of limitations | — | |||
Balance at January 31, 2015 | $ | 1,015 | ||
Amounts settled and utilized for current tax obligations | (636 | ) | ||
Reductions for tax positions of prior years | (379 | ) | ||
Balance at January 30, 2016 | $ | — | ||
Amounts settled and utilized for current tax obligations | — | |||
Balance at January 28, 2017 | $ | — | ||
If the unrecognized tax benefits were to be recognized in full, the net amount that would be reflected in the income tax provision in prior years, thereby impacting the effective tax rate, would have been $1.1 million at January 31, 2015.
Estimated interest related to the underpayment of income taxes was classified as a component of the income tax provision in the consolidated statements of earnings and was insignificant in 2016, 2015 and 2014.
For federal purposes, the Company’s tax years 2013 to 2015 (fiscal years ending February 1, 2014, January 31, 2015 and January 30, 2016) remain open to examination. The Company also files tax returns in various foreign jurisdictions and numerous states for which various tax years are subject to examination. The Company does not expect any significant changes to its liability for unrecognized tax benefits during the next 12 months.
7. BUSINESS SEGMENT INFORMATION
The Company's reportable segments are Famous Footwear and Brand Portfolio.
The Famous Footwear segment is comprised of Famous Footwear and Famous.com. In addition, Shoes.com was included through December 12, 2014 (the date of sale). Famous Footwear operated 1,055 stores at the end of 2016, primarily selling branded footwear for the entire family.
The Brand Portfolio segment is comprised of our branded footwear, our branded retail stores and e-commerce sites associated with those brands. This segment sources and markets licensed, branded and private-label footwear primarily to national chains, online retailers, department stores, mass merchandisers, independent retailers and catalogs as well as Company-owned Famous Footwear, Naturalizer, Sam Edelman and Allen Edmonds stores, and e-commerce businesses. The Brand Portfolio segment included 148 branded retail stores in the United States, 85 branded retail stores in Canada and one branded retail store in Italy at the end of 2016.
The Company’s Famous Footwear and Brand Portfolio reportable segments are operating units that are managed separately. An operating segment’s performance is evaluated and resources are allocated based primarily on operating earnings (loss). Operating earnings (loss) represent gross profit, less selling and administrative expenses and restructuring and other special charges, net. The accounting policies of the reportable segments are the same as those described in Note 1 to the consolidated financial statements. Intersegment sales are generally recorded at a profit to the selling segment. All intersegment earnings related to inventory on hand at the purchasing segment are eliminated against the earnings of the selling segment.
Corporate assets, administrative expenses, and other costs and recoveries that are not allocated to the operating units are reported in the Other category.
63
Following is a summary of certain key financial measures for the respective periods:
($ thousands) | Famous Footwear | Brand Portfolio | Other | Total | ||||||||
Fiscal 2016 | ||||||||||||
External sales | $ | 1,590,065 | $ | 989,323 | $ | — | $ | 2,579,388 | ||||
Intersegment sales | — | 91,415 | — | 91,415 | ||||||||
Depreciation and amortization | 27,832 | 11,028 | 17,271 | 56,131 | ||||||||
Operating earnings (loss) | 83,735 | 76,248 | (48,998 | ) | 110,985 | |||||||
Segment assets | 526,555 | 838,328 | 110,390 | 1,475,273 | ||||||||
Purchases of property and equipment | 37,697 | 8,828 | 3,998 | 50,523 | ||||||||
Capitalized software | 3,468 | 50 | 5,521 | 9,039 | ||||||||
Fiscal 2015 | ||||||||||||
External sales | $ | 1,572,665 | $ | 1,004,765 | $ | — | $ | 2,577,430 | ||||
Intersegment sales | — | 100,186 | — | 100,186 | ||||||||
Depreciation and amortization | 25,842 | 9,339 | 16,258 | 51,439 | ||||||||
Operating earnings (loss) | 109,030 | 66,578 | (40,501 | ) | 135,107 | |||||||
Segment assets | 542,842 | 534,137 | 226,344 | 1,303,323 | ||||||||
Purchases of property and equipment | 48,761 | 18,340 | 6,378 | 73,479 | ||||||||
Capitalized software | 2,538 | — | 5,197 | 7,735 | ||||||||
Fiscal 2014 | ||||||||||||
External sales | $ | 1,589,258 | $ | 982,451 | $ | — | $ | 2,571,709 | ||||
Intersegment sales | — | 114,408 | — | 114,408 | ||||||||
Depreciation and amortization | 26,581 | 8,974 | 16,060 | 51,615 | ||||||||
Operating earnings (loss) | 104,581 | 73,403 | (52,050 | ) | 125,934 | |||||||
Segment assets | 458,847 | 518,099 | 237,381 | 1,214,327 | ||||||||
Purchases of property and equipment | 33,001 | 6,105 | 5,846 | 44,952 | ||||||||
Capitalized software | 198 | 58 | 4,830 | 5,086 | ||||||||
Following is a reconciliation of operating earnings to earnings before income taxes:
($ thousands) | 2016 | 2015 | 2014 | |||||||||
Operating earnings | $ | 110,985 | $ | 135,107 | $ | 125,934 | ||||||
Interest expense | (15,111 | ) | (16,589 | ) | (20,445 | ) | ||||||
Loss on early extinguishment of debt | — | (10,651 | ) | (420 | ) | |||||||
Interest income | 1,380 | 899 | 379 | |||||||||
Gain on sale of subsidiary | — | — | 4,679 | |||||||||
Earnings before income taxes | $ | 97,254 | $ | 108,766 | $ | 110,127 | ||||||
For geographic purposes, the domestic operations include the wholesale distribution of licensed, branded and private-label footwear to a variety of retail customers, including the Company’s Famous Footwear and Brand Portfolio stores and e-commerce businesses, as well as the Company's domestic retail operations.
The Company’s foreign operations primarily consist of wholesale and retail operations in the Far East and Canada. The Far East operations include first-cost transactions, where footwear is sold at foreign ports to customers who then import the footwear into the United States and other countries.
64
A summary of the Company’s net sales and long-lived assets by geographic area were as follows:
($ thousands) | 2016 | 2015 | 2014 | |||||||||
Net Sales | ||||||||||||
United States | $ | 2,385,111 | $ | 2,342,590 | $ | 2,318,530 | ||||||
Far East | 134,430 | 177,654 | 194,296 | |||||||||
Canada | 59,847 | 57,186 | 58,883 | |||||||||
Total net sales | $ | 2,579,388 | $ | 2,577,430 | $ | 2,571,709 | ||||||
Long-Lived Assets | ||||||||||||
United States | $ | 617,211 | $ | 417,198 | $ | 412,822 | ||||||
Canada | 10,141 | 8,596 | 8,773 | |||||||||
Latin America, Europe and other | 2,362 | 271 | 248 | |||||||||
Far East | 1,814 | 2,193 | 2,336 | |||||||||
Total long-lived assets | $ | 631,528 | $ | 428,258 | $ | 424,179 | ||||||
Long-lived assets consisted primarily of property and equipment, intangible assets, goodwill, prepaid pension costs and other noncurrent assets.
8. PROPERTY AND EQUIPMENT
Property and equipment consisted of the following:
($ thousands) | January 28, 2017 | January 30, 2016 | ||||||
Land and buildings | $ | 40,363 | $ | 38,300 | ||||
Leasehold improvements | 215,347 | 196,960 | ||||||
Technology equipment | 52,680 | 49,575 | ||||||
Machinery and equipment | 67,245 | 35,805 | ||||||
Furniture and fixtures | 148,473 | 121,186 | ||||||
Construction in progress | 6,996 | 33,924 | ||||||
Property and equipment | 531,104 | 475,750 | ||||||
Allowances for depreciation | (311,908 | ) | (296,740 | ) | ||||
Property and equipment, net | $ | 219,196 | $ | 179,010 | ||||
Useful lives of property and equipment are as follows:
Buildings | 5-30 years |
Leasehold improvements | 5-20 years |
Technology equipment | 2-10 years |
Machinery and equipment | 4-20 years |
Furniture and fixtures | 3-10 years |
The Company recorded charges for impairment within selling and administrative expenses of $1.6 million, $2.8 million and $2.0 million in 2016, 2015 and 2014, respectively, primarily for leasehold improvements and furniture and fixtures in the Company’s retail stores. Fair value was based on estimated future cash flows to be generated by retail stores, discounted at a market rate of interest.
Interest costs for major asset additions are capitalized during the construction or development period and amortized over the lives of the related assets. In 2016 and 2015, the Company capitalized interest of $1.4 million and $0.3 million, respectively, related to its expansion and modernization project at its Lebanon, Tennessee distribution center, with no corresponding amounts capitalized in 2014.
65
9. GOODWILL AND INTANGIBLE ASSETS
Goodwill and intangible assets were as follows:
($ thousands) | January 28, 2017 | January 30, 2016 | |||||
Intangible Assets | |||||||
Famous Footwear | $ | 2,800 | $ | 2,800 | |||
Brand Portfolio | 286,488 | 183,068 | |||||
Total intangible assets | 289,288 | 185,868 | |||||
Accumulated amortization | (72,628 | ) | (68,923 | ) | |||
Total intangible assets, net | 216,660 | 116,945 | |||||
Goodwill | |||||||
Brand Portfolio | 127,098 | 13,954 | |||||
Total goodwill | 127,098 | 13,954 | |||||
Goodwill and intangible assets, net | $ | 343,758 | $ | 130,899 | |||
As further described in Note 2 to the consolidated financial statements, the Company acquired Allen Edmonds on December 13, 2016. The preliminary allocation of the purchase price resulted in incremental intangible assets of $103.4 million, consisting of trademarks and customer relationships of $97.3 million and $6.1 million, respectively, and incremental goodwill of $113.1 million.
The Company's intangible assets as of January 28, 2017 and January 30, 2016 were as follows:
($ thousands) | January 28, 2017 | ||||||||||||||
Estimated Useful Lives | Original Cost | Accumulated Amortization | Net Carrying Value | ||||||||||||
Trademarks | 15-40 years | $ | 165,288 | $ | 72,604 | $ | 92,684 | ||||||||
Trademarks | Indefinite | 117,900 | — | 117,900 | |||||||||||
Customer relationships | 15 years | 6,100 | 24 | (1 | ) | 6,076 | |||||||||
$ | 289,288 | $ | 72,628 | $ | 216,660 | ||||||||||
(1) The customer relationships intangible asset was acquired in the Allen Edmonds acquisition, as further discussed in Note 2 to the consolidated financial statements. The accumulated amortization represents amortization from the acquisition date through January 28, 2017. | |||||||||||||||
January 30, 2016 | ||||||||||||||
Estimated Useful Lives | Original Cost | Accumulated Amortization | Net Carrying Value | |||||||||||
Trademarks | 15-40 years | $ | 165,068 | $ | 68,923 | $ | 96,145 | |||||||
Trademarks | Indefinite | 20,800 | — | 20,800 | ||||||||||
$ | 185,868 | $ | 68,923 | $ | 116,945 | |||||||||
Amortization expense related to intangible assets was $3.7 million in 2016 and 2015 and $4.0 million in 2014. The Company estimates $3.9 million of amortization expense related to intangible assets in each of the years from 2017 through 2021. As a result of its annual impairment testing, the Company did not record any impairment charges during 2016, 2015 and 2014 related to intangible assets.
Goodwill is tested for impairment at least annually, or more frequently if events or circumstances indicate it might be impaired, using either the qualitative assessment or a fair value-based test, as further discussed in Note 1 to the consolidated financial statements. The Company performed a goodwill impairment test as of the first day of the Company’s fourth fiscal quarter and determined that it was more likely than not that the fair value of the reporting units exceeded the carrying value. As a result, the Company was not required to perform the discounted cash flow analysis.
66
Indefinite-lived intangible assets are tested for impairment as of the first day of the fourth quarter of each fiscal year unless events indicate an interim test is required. The indefinite-lived intangible asset impairment reviews resulted in no impairment charges.
10. LONG-TERM AND SHORT-TERM FINANCING ARRANGEMENTS
Credit Agreement
The Company maintains a revolving credit facility for working capital needs in an aggregate amount of up to $600.0 million, with the option to increase by up to $150.0 million. On December 18, 2014, the Company and certain of its subsidiaries (the “Loan Parties”) entered into a Fourth Amended and Restated Credit Agreement, which was further amended on July 20, 2015 to release all of the Company’s subsidiaries that were borrowers under or that guaranteed the Credit Agreement other than Sidney Rich Associates, Inc. and BG Retail, LLC (as so amended, the “Credit Agreement”). On December 13, 2016, Allen Edmonds was joined to the Credit Agreement as a guarantor. After giving effect to the joinder, the Company is the lead borrower, and Sidney Rich Associates, Inc., BG Retail, LLC and Allen Edmonds are each co-borrowers and guarantors under the Credit Agreement. The Credit Agreement matures on December 18, 2019. The Credit Agreement amended and restated the Third Amended and Restated Credit Agreement, dated January 7, 2011 (the "Former Credit Agreement").
Borrowing availability under the Credit Agreement is limited to the lesser of the total commitments and the borrowing base ("Loan Cap"), which is based on stated percentages of the sum of eligible accounts receivable, eligible inventory and eligible credit card receivables, as defined, less applicable reserves. Under the Credit Agreement, the Loan Parties’ obligations are secured by a first-priority security interest in all accounts receivable, inventory and certain other collateral.
Interest on borrowings is at variable rates based on the London Interbank Offered Rate (“LIBOR”) or the prime rate, as defined in the Credit Agreement, plus a spread. The interest rate and fees for letters of credit vary based upon the level of excess availability under the Credit Agreement. There is an unused line fee payable on the unused portion under the facility and a letter of credit fee payable on the outstanding face amount under letters of credit.
The Credit Agreement limits the Company’s ability to create, incur, assume or permit to exist additional indebtedness and liens, make investments or specified payments, give guarantees, pay dividends, make capital expenditures and merge or acquire or sell assets. In addition, certain additional covenants would be triggered if excess availability were to fall below specified levels, including fixed charge coverage ratio requirements. Furthermore, if excess availability falls below 12.5% of the Loan Cap for three consecutive business days or an event of default occurs, the lenders may assume dominion and control over the Company’s cash (a “cash dominion event”) until such event of default is cured or waived or the excess availability exceeds such amount for 30 consecutive days, provided that a cash dominion event shall be deemed continuing (even if an event of default is no longer continuing and/or excess availability exceeds the required amount for 30 consecutive business days) after a cash dominion event has occurred and been discontinued on two occasions in any twelve-month period.
The Credit Agreement contains customary events of default, including, without limitation, payment defaults, breaches of representations and warranties, covenant defaults, cross-defaults to other material indebtedness, certain events of bankruptcy and insolvency, judgment defaults in excess of a certain threshold, the failure of any guaranty or security document supporting the agreement to be in full force and effect, and a change of control event. In addition, if the excess availability falls below the greater of (i) 10.0% of the lesser of the Loan Cap and (ii) $50.0 million, and the fixed charge coverage ratio is less than 1.0 to 1.0, the Company would be in default under the Credit Agreement. The Credit Agreement also contains certain other covenants and restrictions. The Company was in compliance with all covenants and restrictions under the Credit Agreement as of January 28, 2017.
The maximum amount of borrowings under the Credit Agreement at the end of any month was $260.0 million in 2016 and $28.0 million in 2015. As discussed further in Note 2 to the consolidated financial statements, the Company utilized the Credit Agreement in December 2016 to fund the Allen Edmonds acquisition. The average daily borrowings during the year were $34.8 million and $3.6 million in 2016 and 2015, respectively and the weighted-average interest rates approximated 2.7% and 3.0% in 2016 and 2015, respectively. At January 28, 2017, the Company had $110.0 million in borrowings outstanding and $7.4 million in letters of credit outstanding under the Credit Agreement. Total additional borrowing availability was $415.4 million at January 28, 2017.
$200 Million Senior Notes Due 2019
During 2011, the Company issued $200.0 million aggregate principal amount of 7.125% Senior Notes due 2019 (the “2019 Senior Notes”). The 2019 Senior Notes were guaranteed on a senior unsecured basis by each of its subsidiaries that was an obligor under the Credit Agreement. Interest on the 2019 Senior Notes was payable on May 15 and November 15 of each year. The 2019 Senior Notes were scheduled to mature on May 15, 2019 but were callable at specified redemption prices, plus accrued and unpaid interest.
67
On July 20, 2015, the Company commenced a cash tender offer (the "Tender Offer") to purchase any and all of the outstanding aggregate principal amount of its 2019 Senior Notes. Upon expiration of the Tender Offer on July 24, 2015, $160.7 million aggregate principal amount of the 2019 Senior Notes were validly tendered at the redemption price of 103.950%, representing the specified redemption price and a tender premium. On August 26, 2015, the remaining outstanding $39.3 million aggregate principal amount of outstanding 2019 Senior Notes were redeemed at the redemption price of 103.563%.
$200 Million Senior Notes Due 2023
On July 27, 2015, the Company issued $200.0 million aggregate principal amount of 6.25% Senior Notes due 2023 (the "2023 Senior Notes") in a private placement. On October 22, 2015, the Company commenced an offer to exchange its 2023 Senior Notes outstanding for substantially identical debt securities registered under the Securities Act of 1933. The exchange offer was completed on November 23, 2015 and did not affect the amount of the Company's indebtedness outstanding. The net proceeds from the issuance of the 2023 Senior Notes were approximately $196.3 million after deducting fees and expenses associated with the offering. The Company used the net proceeds, together with cash on hand, to redeem the outstanding 2019 Senior Notes.
The 2023 Senior Notes are guaranteed on a senior unsecured basis by each of the Company's subsidiaries that is a borrower or guarantor under the Credit Agreement. Interest on the 2023 Senior Notes is payable on February 15 and August 15 of each year. The 2023 Senior Notes will mature on August 15, 2023. Prior to August 15, 2018, the Company may redeem some or all of the 2023 Senior Notes at a redemption price equal to 100% of the principal amount of the 2023 Senior Notes plus a "make-whole" premium (as defined in the 2023 Senior Notes indenture) and accrued and unpaid interest to the redemption date. After August 15, 2018, the Company may redeem all or a part of the 2023 Senior Notes at the redemption prices (expressed as a percentage of principal amount) set forth below plus accrued and unpaid interest, and Additional Interest (as defined in the 2023 Senior Notes indenture), if redeemed during the 12-month period beginning on August 15 of the years indicated below:
Year | Percentage | |
2018 | 104.688 | % |
2019 | 103.125 | % |
2020 | 101.563 | % |
2021 and thereafter | 100.000 | % |
If the Company experiences specific kinds of changes of control, it would be required to offer to purchase the 2023 Senior Notes at a purchase price equal to 101% of the principal amount, plus accrued and unpaid interest and Additional Interest, if any, to, but not including, the date of repurchase.
The 2023 Senior Notes also contain certain other covenants and restrictions that limit certain activities including, among other things, levels of indebtedness, payments of dividends, the guarantee or pledge of assets, certain investments, common stock repurchases, mergers and acquisitions and sales of assets. As of January 28, 2017, we were in compliance with all covenants and restrictions relating to the 2023 Senior Notes.
Cash payments of interest for these financing arrangements during 2016, 2015 and 2014 were $15.2 million, $11.9 million and $17.9 million, respectively.
Loss on Early Extinguishment of Debt
During 2015 and 2014, we incurred a loss on early extinguishment of debt of $10.7 million and $0.4 million respectively, with no corresponding loss in 2016. The loss in 2015 represents the tender offer and call premiums, the unamortized debt issuance costs and the original issue discount related to the 2019 Senior Notes. Of the $10.7 million loss on early extinguishment of debt recognized in 2015, approximately $3.0 million was non-cash. The loss in 2014 represents the early extinguishment of the Former Credit Agreement prior to maturity.
11. LEASES
The Company leases all of its retail locations, a manufacturing facility, and certain office locations, distribution centers and equipment. The minimum lease terms for the Company’s retail stores generally range from five to 10 years. Approximately 49% of the retail store leases
68
contain renewal options for varying periods. The term of the manufacturing facility lease is eight years. The terms of the leases for office facilities and distribution centers average approximately 10 years with renewal options of five to 20 years.
At the time its retail facilities are initially leased, the Company often receives consideration from landlords for a portion of the cost of leasehold improvements necessary to open the store, which are recorded as a deferred rent obligation and amortized to income over the lease term as a reduction of rent expense. In addition to minimum rental payments, certain of the retail store leases require contingent payments based on sales levels. A majority of the Company’s retail operating leases contain provisions that allow it to modify amounts payable under the lease or terminate the lease in certain circumstances, such as experiencing actual sales volume below a defined threshold and/or co-tenancy provisions associated with the facility.
The following is a summary of rent expense for operating leases:
($ thousands) | 2016 | 2015 | 2014 | |||||||||
Minimum rent | $ | 160,806 | $ | 149,902 | $ | 143,050 | ||||||
Contingent rent | 470 | 520 | 971 | |||||||||
Sublease income | (1,665 | ) | (1,223 | ) | (1,197 | ) | ||||||
Total | $ | 159,611 | $ | 149,199 | $ | 142,824 | ||||||
Future minimum payments under noncancelable operating leases with an initial term of one year or more were as follows at January 28, 2017:
($ thousands) | ||||
2017 | $ | 185,338 | ||
2018 | 156,683 | |||
2019 | 123,049 | |||
2020 | 105,979 | |||
2021 | 85,099 | |||
Thereafter | 235,994 | |||
Total minimum operating lease payments (1) | $ | 892,142 | ||
(1) Minimum operating lease payments have not been reduced by minimum sublease rental income of $2.3 million due in the future under noncancelable sublease agreements.
12. RISK MANAGEMENT AND DERIVATIVES
General Risk Management
The Company maintains cash and cash equivalents and certain other financial instruments with various financial institutions. The financial institutions are located throughout the world and the Company’s policy is designed to limit exposure to any one institution or geographic region. The Company’s periodic evaluations of the relative credit standing of these financial institutions are considered in the Company’s investment strategy.
The Company’s Brand Portfolio segment sells to national chains, online retailers, department stores, mass merchandisers, independent retailers and catalogs in the United States, Canada and approximately 62 other countries. Receivables arising from these sales are not collateralized. However, a portion is covered by documentary letters of credit. Credit risk is affected by conditions or occurrences within the economy and the retail industry. The Company maintains an allowance for doubtful accounts based upon factors surrounding the credit risk of specific customers and historical trends.
Derivatives
In the normal course of business, the Company’s financial results are impacted by currency rate movements in foreign-currency-denominated assets, liabilities and cash flows as it makes a portion of its purchases and sales in local currencies. The Company has established policies and business practices that are intended to mitigate a portion of the effect of these exposures. The Company uses derivative financial instruments, primarily forward contracts, to manage its currency exposures. These derivative financial instruments are viewed as risk management tools and are not used for trading or speculative purposes. Derivatives entered into by the Company are designated as cash flow hedges of forecasted foreign currency transactions.
69
Derivative financial instruments expose the Company to credit and market risk. The market risk associated with these instruments resulting from currency exchange movements is expected to offset the market risk of the underlying transactions being hedged. The Company does not believe there is a significant risk of loss in the event of non-performance by the counterparties associated with these instruments because these transactions are executed with major international financial institutions and have varying maturities through February 2018. Credit risk is managed through the continuous monitoring of exposures to such counterparties.
The Company principally uses foreign currency forward contracts as cash flow hedges to offset a portion of the effects of exchange rate fluctuations. The Company’s cash flow exposures include anticipated foreign currency transactions, such as foreign currency denominated sales, costs, expenses and intercompany charges, as well as collections and payments. The Company performs a quarterly assessment of the effectiveness of the hedge relationship and measures and recognizes any hedge ineffectiveness in the consolidated statements of earnings. Hedge ineffectiveness is evaluated using the hypothetical derivative method. The amount of hedge ineffectiveness for 2016, 2015 and 2014 was not material.
The Company’s hedging strategy uses forward contracts as cash flow hedging instruments, which are recorded in the Company’s consolidated balance sheets at fair value. The effective portion of gains and losses resulting from changes in the fair value of these hedge instruments are deferred in accumulated other comprehensive income and reclassified to earnings in the period that the hedged transaction is recognized in earnings.
As of January 28, 2017 and January 30, 2016, the Company had forward contracts maturing at various dates through February 2018 and January 2017, respectively. The contract amounts in the following table represent the net notional amount of all purchase and sale contracts of a foreign currency.
(U.S. $ equivalent in thousands) | January 28, 2017 | January 30, 2016 | ||||||
Financial Instruments | ||||||||
U.S. dollars (purchased by the Company’s Canadian division with Canadian dollars) | $ | 18,826 | $ | 14,118 | ||||
Euro | 13,297 | 15,499 | ||||||
Chinese yuan | 7,723 | 14,623 | ||||||
Japanese yen | 769 | 1,159 | ||||||
United Arab Emirates dirham | 823 | 930 | ||||||
New Taiwanese dollars | 526 | 570 | ||||||
Other currencies | 124 | 219 | ||||||
Total financial instruments | $ | 42,088 | $ | 47,118 | ||||
The classification and fair values of derivative instruments designated as hedging instruments included within the consolidated balance sheets as of January 28, 2017 and January 30, 2016 are as follows:
($ in thousands) | Asset Derivatives | Liability Derivatives | |||||||||
Balance Sheet Location | Fair Value | Balance Sheet Location | Fair Value | ||||||||
Foreign exchange forwards contracts: | |||||||||||
January 28, 2017 | Prepaid expenses and other current assets | $ | 234 | Other accrued expenses | $ | 874 | |||||
January 30, 2016 | Prepaid expenses and other current assets | $ | 1,000 | Other accrued expenses | $ | 846 | |||||
During 2016 and 2015, the effect of derivative instruments in cash flow hedging relationships on the consolidated statements of earnings was as follows:
70
2016 | 2015 | |||||||||||||||
Foreign exchange forward contracts: Income Statement Classification (Losses) Gains - Realized | Loss Recognized in OCI on Derivatives | (Loss) Gain Reclassified from Accumulated OCI into Earnings | Gain (Loss) Recognized in OCI on Derivatives | Gain (Loss) Reclassified from Accumulated OCI into Earnings | ||||||||||||
Net sales | $ | (61 | ) | $ | (125 | ) | $ | 57 | $ | 147 | ||||||
Cost of goods sold | (1,308 | ) | 64 | 1,028 | (27 | ) | ||||||||||
Selling and administrative expenses | (359 | ) | (441 | ) | (907 | ) | (297 | ) | ||||||||
Interest expense | (21 | ) | (4 | ) | (17 | ) | — | |||||||||
All of the gains and losses currently included within accumulated other comprehensive loss associated with the Company’s foreign exchange forward contracts are expected to be reclassified into net earnings within the next 12 months. Additional information related to the Company’s derivative financial instruments are disclosed within Note 1 and Note 13 to the consolidated financial statements.
13. FAIR VALUE MEASUREMENTS
Fair Value Hierarchy
Fair value measurement disclosure requirements specify a hierarchy of valuation techniques based upon whether the inputs to those valuation techniques reflect assumptions other market participants would use based upon market data obtained from independent sources (“observable inputs”) or reflect the Company’s own assumptions of market participant valuation (“unobservable inputs”). In accordance with the fair value guidance, the inputs to valuation techniques used to measure fair value are categorized into three levels based on the reliability of the inputs as follows:
• | Level 1 – Quoted prices in active markets that are unadjusted and accessible at the measurement date for identical, unrestricted assets or liabilities; |
• | Level 2 – Quoted prices for identical assets and liabilities in markets that are not active, quoted prices for similar assets and liabilities in active markets or financial instruments for which significant inputs are observable, either directly or indirectly; and |
• | Level 3 – Prices or valuations that require inputs that are both significant to the fair value measurement and unobservable. |
In determining fair value, the Company uses valuation techniques that maximize the use of observable inputs and minimize the use of unobservable inputs to the extent possible as well as considers counterparty credit risk in its assessment of fair value. Classification of the financial or non-financial asset or liability within the hierarchy is determined based on the lowest level input that is significant to the fair value measurement.
Measurement of Fair Value
The Company measures fair value as an exit price, the price to sell an asset or transfer a liability in an orderly transaction between market participants at the measurement date, using the procedures described below for all financial and non-financial assets and liabilities measured at fair value.
Money Market Funds
The Company has cash equivalents consisting of short-term money market funds backed by U.S. Treasury securities. The primary objective of these investing activities is to preserve the Company's capital for the purpose of funding operations and it does not enter into money market funds for trading or speculative purposes. The fair value is based on unadjusted quoted market prices for the funds in active markets with sufficient volume and frequency (Level 1).
71
Deferred Compensation Plan Assets and Liabilities
The Company maintains a non-qualified deferred compensation plan (the “Deferred Compensation Plan”) for the benefit of certain management employees. The investment funds offered to the participants generally correspond to the funds offered in the Company’s 401(k) plan, and the account balance fluctuates with the investment returns on those funds. The Deferred Compensation Plan permits the deferral of up to 50% of base salary and 100% of compensation received under the Company’s annual incentive plan. The deferrals are held in a separate trust, which has been established by the Company to administer the Deferred Compensation Plan. The assets of the trust are subject to the claims of the Company’s creditors in the event that the Company becomes insolvent. Consequently, the trust qualifies as a grantor trust for income tax purposes (i.e., a “Rabbi Trust”). The liabilities of the Deferred Compensation Plan are presented in other accrued expenses and the assets held by the trust are classified as trading securities within prepaid expenses and other current assets in the accompanying consolidated balance sheets. Changes in deferred compensation plan assets and liabilities are charged to selling and administrative expenses. The fair value is based on unadjusted quoted market prices for the funds in active markets with sufficient volume and frequency (Level 1).
Deferred Compensation Plan for Non-Employee Directors
Non-employee directors are eligible to participate in a deferred compensation plan with deferred amounts valued as if invested in the Company’s common stock through the use of phantom stock units (“PSUs”). Under the plan, each participating director’s account is credited with the number of PSUs equal to the number of shares of the Company’s common stock that the participant could purchase or receive with the amount of the deferred compensation, based upon the average of the high and low prices of the Company’s common stock on the last trading day of the fiscal quarter when the cash compensation was earned. Dividend equivalents are paid on PSUs at the same rate as dividends on the Company’s common stock and are re-invested in additional PSUs at the next fiscal quarter-end. The liabilities of the plan are based on the fair value of the outstanding PSUs and are presented in other accrued expenses (current portion) or other liabilities in the accompanying consolidated balance sheets. Gains and losses resulting from changes in the fair value of the PSUs are presented in selling and administrative expenses in the Company’s consolidated statements of earnings. The fair value of each PSU is based on an unadjusted quoted market price for the Company’s common stock in an active market with sufficient volume and frequency on each measurement date (Level 1).
Restricted Stock Units for Non-Employee Directors
Under the Company’s incentive compensation plans, cash-equivalent restricted stock units (“RSUs”) of the Company may be granted at no cost to non-employee directors. The RSUs are subject to a vesting requirement (usually one year), earn dividend-equivalent units and are settled in cash on the date the director terminates service or such earlier date as a director may elect, subject to restrictions, based on the then current fair value of the Company’s common stock. The fair value of each RSU is based on an unadjusted quoted market price for the Company’s common stock in an active market with sufficient volume and frequency on each measurement date (Level 1). Additional information related to RSUs for non-employee directors is disclosed in Note 15 to the consolidated financial statements.
Performance Share Units
Under the Company’s incentive compensation plans, common stock or cash may be awarded at the end of the performance period at no cost to certain officers and key employees if certain financial goals are met. Under the plan, employees are granted performance share awards at a target number of shares or units, which generally vest over a three-year service period. At the end of the vesting period, the employee will have earned an amount of shares or units between 0% and 200% of the targeted award, depending on the achievement of specified financial goals for the service period. The fair value of each performance share unit is based on an unadjusted quoted market price for the Company’s common stock in an active market with sufficient volume and frequency on each measurement date (Level 1). Additional information related to performance share units is disclosed in Note 15 to the consolidated financial statements.
Derivative Financial Instruments
The Company uses derivative financial instruments, primarily foreign exchange contracts, to reduce its exposure to market risks from changes in foreign exchange rates. These foreign exchange contracts are measured at fair value using quoted forward foreign exchange prices from counterparties corroborated by market-based pricing (Level 2). Additional information related to the Company’s derivative financial instruments is disclosed in Note 1 and Note 12 to the consolidated financial statements.
72
Secured Convertible Note
The Company received a secured convertible note as partial consideration for the 2014 disposition of Shoes.com, and the convertible note was measured at fair value using unobservable inputs (Level 3). During 2016, the convertible note was fully impaired, as further discussed in Note 4 to the consolidated financial statements.
The following table presents the Company’s assets and liabilities that are measured at fair value on a recurring basis at January 28, 2017 and January 30, 2016. The Company did not have any transfers between Level 1 and Level 2 during 2016 or 2015.
Fair Value Measurements | ||||||||||||||||
($ thousands) | Total | Level 1 | Level 2 | Level 3 | ||||||||||||
Asset (Liability) | ||||||||||||||||
As of January 28, 2017 | ||||||||||||||||
Cash equivalents – money market funds | $ | 27,530 | $ | 27,530 | $ | — | $ | — | ||||||||
Non-qualified deferred compensation plan assets | 5,051 | 5,051 | — | — | ||||||||||||
Non-qualified deferred compensation plan liabilities | (5,051 | ) | (5,051 | ) | — | — | ||||||||||
Deferred compensation plan liabilities for non-employee directors | (1,909 | ) | (1,909 | ) | — | — | ||||||||||
Restricted stock units for non-employee directors | (9,390 | ) | (9,390 | ) | — | — | ||||||||||
Performance share units | (3,352 | ) | (3,352 | ) | — | — | ||||||||||
Derivative financial instruments, net | (640 | ) | — | (640 | ) | — | ||||||||||
As of January 30, 2016: | ||||||||||||||||
Cash equivalents – money market funds | $ | 100,694 | $ | 100,694 | $ | — | $ | — | ||||||||
Non-qualified deferred compensation plan assets | 3,383 | 3,383 | — | — | ||||||||||||
Non-qualified deferred compensation plan liabilities | (3,383 | ) | (3,383 | ) | — | — | ||||||||||
Deferred compensation plan liabilities for non-employee directors | (1,728 | ) | (1,728 | ) | — | — | ||||||||||
Restricted stock units for non-employee directors | (8,879 | ) | (8,879 | ) | — | — | ||||||||||
Performance share units | (3,780 | ) | (3,780 | ) | — | — | ||||||||||
Derivative financial instruments, net | 154 | — | 154 | — | ||||||||||||
Secured convertible note | 7,117 | — | — | 7,117 | ||||||||||||
Impairment Charges
The Company assesses the impairment of long-lived assets whenever events or changes in circumstances indicate that the carrying value may not be recoverable. Factors the Company considers important that could trigger an impairment review include underperformance relative to expected historical or projected future operating results, a significant change in the manner of the use of the asset or a negative industry or economic trend. When the Company determines that the carrying value of long-lived assets may not be recoverable based upon the existence of one or more of the aforementioned factors, impairment is measured based on a projected discounted cash flow method. Certain factors, such as estimated store sales and expenses, used for this nonrecurring fair value measurement are considered Level 3 inputs as defined by FASB ASC 820, Fair Value Measurement. Long-lived assets held and used with a carrying amount of $99.4 million, $92.9 million and $87.8 million in 2016, 2015 and 2014, respectively, were assessed for indicators of impairment and written down to their fair value. This assessment resulted in the following impairment charges, by segment, which were included in selling and administrative expenses for the respective periods.
($ thousands) | 2016 | 2015 | 2014 | |||||||||
Impairment Charges | ||||||||||||
Famous Footwear | $ | 211 | $ | 1,159 | $ | 1,018 | ||||||
Brand Portfolio | 1,375 | 1,602 | 964 | |||||||||
Total impairment charges | $ | 1,586 | $ | 2,761 | $ | 1,982 | ||||||
73
During the fourth quarter of 2016, the Company recognized an impairment charge of $7.0 million ($7.0 million on an after-tax basis, or $0.16 per diluted share) related to its cost method investment in a nonconsolidated affiliate. The impairment charge is included in restructuring and other special charges in the Company's consolidated statements of earnings. Refer to Note 4 to the consolidated financial statements for additional information.
The Company performed its annual impairment tests of indefinite-lived intangible assets, which involves estimating the fair value using significant unobservable inputs (Level 3). As a result of its annual impairment testing, the Company did not record any impairment charges during 2016, 2015 or 2014 related to intangible assets.
The Company performed its annual impairment test of goodwill by performing a qualitative assessment at the reporting unit level during 2016 and 2015. During 2014, the Company performed a quantitative assessment which involved estimating the fair value of its reporting units using significant unobservable inputs (Level 3). The impairment tests, performed as of the first day of the Company’s fourth fiscal quarter of 2016, 2015 and 2014, resulted in no impairment charges. See Note 1 and Note 9 to the consolidated financial statements for additional information related to the goodwill impairment test.
Fair Value of the Company’s Other Financial Instruments
The fair values of cash and cash equivalents (excluding money market funds discussed above), receivables and trade accounts payable approximate their carrying values due to the short-term nature of these instruments.
The carrying amounts and fair values of the Company’s other financial instruments subject to fair value disclosures are as follows:
January 28, 2017 | January 30, 2016 | |||||||||||||||||
Carrying Value | Fair Value | Carrying Value | Fair Value | |||||||||||||||
($ thousands) | ||||||||||||||||||
Borrowings under revolving credit agreement | $ | 110,000 | $ | 110,000 | $ | — | $ | — | ||||||||||
Long-term debt | 197,003 | 209,000 | 196,544 | 196,000 | ||||||||||||||
Total debt | $ | 307,003 | $ | 319,000 | $ | 196,544 | $ | 196,000 | ||||||||||
The fair value of the borrowings under revolving credit agreement approximate their carrying value due to the short-term nature (Level 1), and the fair value of the Company's long-term debt was based upon quoted prices in an inactive market as of the end of the respective periods (Level 2).
14. SHAREHOLDERS' EQUITY
Stock Repurchase Program
On August 25, 2011, the Board of Directors approved a stock repurchase program (“2011 Program”) authorizing the repurchase of up to 2.5 million shares of the Company’s outstanding common stock. The Company can use the repurchase program to repurchase shares on the open market or in private transactions from time to time, depending on market conditions. The repurchase program does not have an expiration date. Repurchases of common stock are limited under the Company’s debt agreements. During 2016 and 2015, there were 900,000 and 151,500 shares, respectively, repurchased under the 2011 Program. There were no shares repurchased under the stock repurchase program during 2014 or in prior years. Therefore, there were 1.4 million shares remaining that are authorized to be repurchased under the 2011 Program as of January 28, 2017.
Repurchases Related to Employee Share-based Awards
During 2016, 2015, and 2014, 205,569 shares, 222,110 shares and 172,471 shares, respectively, were tendered by employees related to certain share-based awards. These shares were tendered in satisfaction of the exercise price of stock options and/or to satisfy minimum tax withholding amounts for non-qualified stock options, restricted stock and stock performance awards. Accordingly, these share repurchases are not considered a part of the Company’s publicly announced stock repurchase programs.
74
Accumulated Other Comprehensive Loss
The following table sets forth the changes in accumulated other comprehensive loss, net of tax, by component for 2016, 2015 and 2014:
($ thousands) | Foreign Currency Translation | Pension and Other Postretirement Transactions (1) | Derivative Transactions (2) | Accumulated Other Comprehensive Income (Loss) | |||||||||||
Balance February 1, 2014 | $ | 2,356 | $ | 13,582 | $ | 738 | $ | 16,676 | |||||||
Other comprehensive loss before reclassifications | (3,101 | ) | (10,235 | ) | (411 | ) | (13,747 | ) | |||||||
Reclassifications: | |||||||||||||||
Amounts reclassified from accumulated other comprehensive loss | — | (204 | ) | (142 | ) | (346 | ) | ||||||||
Tax provision | — | 90 | 39 | 129 | |||||||||||
Net reclassifications | — | (114 | ) | (103 | ) | (217 | ) | ||||||||
Other comprehensive loss | (3,101 | ) | (10,349 | ) | (514 | ) | (13,964 | ) | |||||||
Balance January 31, 2015 | $ | (745 | ) | $ | 3,233 | $ | 224 | $ | 2,712 | ||||||
Other comprehensive (loss) income before reclassifications | (155 | ) | (7,559 | ) | 74 | (7,640 | ) | ||||||||
Reclassifications: | |||||||||||||||
Amounts reclassified from accumulated other comprehensive loss | — | (1,706 | ) | 177 | (1,529 | ) | |||||||||
Tax provision (benefit) | — | 676 | (83 | ) | 593 | ||||||||||
Net reclassifications | — | (1,030 | ) | 94 | (936 | ) | |||||||||
Other comprehensive (loss) income | (155 | ) | (8,589 | ) | 168 | (8,576 | ) | ||||||||
Balance January 30, 2016 | $ | (900 | ) | $ | (5,356 | ) | $ | 392 | $ | (5,864 | ) | ||||
Other comprehensive income (loss) before reclassifications | 1,092 | (23,888 | ) | (1,255 | ) | (24,051 | ) | ||||||||
Reclassifications: | |||||||||||||||
Amounts reclassified from accumulated other comprehensive loss | — | (1,395 | ) | 506 | (889 | ) | |||||||||
Tax provision (benefit) | — | 555 | (185 | ) | 370 | ||||||||||
Net reclassifications | — | (840 | ) | 321 | (519 | ) | |||||||||
Other comprehensive income (loss) | 1,092 | (24,728 | ) | (934 | ) | (24,570 | ) | ||||||||
Balance January 28, 2017 | $ | 192 | $ | (30,084 | ) | $ | (542 | ) | $ | (30,434 | ) | ||||
(1) | Amounts reclassified are included in selling and administrative expenses. Refer to Note 5 to the consolidated financial statements for additional information related to pension and other postretirement benefits. |
(2) | Amounts reclassified are included in net sales, costs of goods sold, selling and administrative expenses and interest expense. Refer to Note 12 and Note 13 to the consolidated financial statements for additional information related to derivative financial instruments. |
15. SHARE-BASED COMPENSATION
The Company has share-based incentive compensation plans under which certain officers, employees and members of the Board of Directors are participants and may be granted restricted stock, stock performance awards and stock options.
ASC 718, Compensation – Stock Compensation, and ASC 505, Equity, require companies to recognize compensation expense in an amount equal to the fair value of all share-based payments granted to employees over the requisite service period for each award. In certain limited circumstances, the Company’s incentive compensation plan provides for accelerated vesting of the awards, such as in the event of a change in control, qualified retirement, death or disability. The Company has a policy of issuing treasury shares in satisfaction of share-based awards.
75
Share-based compensation expense of $7.7 million, $7.5 million and $6.2 million was recognized in 2016, 2015 and 2014, respectively, as a component of selling and administrative expenses. The following table details the share-based compensation expense by plan and the total related income tax benefit for 2016, 2015 and 2014:
($ thousands) | 2016 | 2015 | 2014 | |||||||||
Expense (income) for share-based compensation plans, net of forfeitures: | ||||||||||||
Restricted stock grants | $ | 5,858 | $ | 6,027 | $ | 6,236 | ||||||
Stock performance awards | 1,829 | 1,398 | — | |||||||||
Stock options | 38 | 66 | (46 | ) | ||||||||
Total share-based compensation expense | $ | 7,725 | $ | 7,491 | $ | 6,190 | ||||||
In addition to the share-based compensation expense above, the Company recognized cash-based expense related to performance share units and cash awards granted under the performance share plans. In 2016, 2015 and 2014, the Company recognized $2.9 million, $5.1 million and $6.6 million, respectively, in expense for cash-based awards under the performance share plans.
The Company issued 203,066, 59,682 and 373,752 shares of common stock in 2016, 2015 and 2014, respectively, for restricted stock grants, stock performance awards issued to employees, stock options exercised and common and restricted stock grants issued to directors, net of forfeitures and shares withheld to satisfy the minimum tax withholding requirement. There were no significant modifications to any share-based awards in 2016, 2015 or 2014.
Restricted Stock
Under the Company’s incentive compensation plans, restricted stock of the Company may be granted at no cost to certain officers, key employees and directors. Plan participants are entitled to cash dividends and voting rights for their respective shares. The restricted stock generally cliff vests after four years and restrictions limit the sale or transfer of these shares during the requisite service period. Expense for restricted stock grants is recognized on a straight-line basis separately for each vesting portion of the stock award based upon fair value of the award on the date of grant. The fair value of the restricted stock grants is the quoted market price for the Company’s common stock on the date of grant.
The following table summarizes restricted stock activity for 2016, 2015 and 2014:
Number of Nonvested Restricted Shares | Weighted-Average Grant Date Fair Value | |||||
Nonvested at February 1, 2014 | 1,700,098 | $13.25 | ||||
Granted | 281,710 | 28.17 | ||||
Vested | (364,238 | ) | 14.21 | |||
Forfeited | (55,100 | ) | 15.89 | |||
Nonvested at January 31, 2015 | 1,562,470 | 15.61 | ||||
Granted | 318,921 | 30.02 | ||||
Vested | (492,092 | ) | 14.10 | |||
Forfeited | (126,850 | ) | 18.74 | |||
Nonvested at January 30, 2016 | 1,262,449 | 19.55 | ||||
Granted | 402,100 | 27.55 | ||||
Vested | (428,750 | ) | 9.29 | |||
Forfeited | (107,750 | ) | 24.24 | |||
Nonvested at January 28, 2017 | 1,128,049 | $25.85 | ||||
All of the 402,100 restricted shares granted during 2016 have a vesting term of four years. Of the 318,921 restricted shares granted during 2015, 306,421 have a vesting term of four years and 12,500 of the shares have a vesting term of five years. Of the 281,710 restricted shares granted during 2014, 279,910 have a vesting term of four years and 1,800 had a vesting term of one year.
The total grant date fair value of restricted stock awards vested during the years ended January 28, 2017, January 30, 2016 and January 31, 2015, was $4.0 million, $6.9 million and $5.2 million, respectively. As of January 28, 2017, the total remaining unrecognized compensation
76
cost related to nonvested restricted stock grants was $14.1 million, which will be amortized over the weighted-average remaining requisite service period of 2.6 years.
The Company recognized excess tax benefits related to restricted stock vesting and dividends of $2.3 million, $2.6 million and $0.8 million in 2016, 2015 and 2014, respectively, which were reflected as an increase to additional paid-in capital.
Performance Share Awards
Under the Company’s incentive compensation plans, common stock or cash may be awarded at the end of the performance period at no cost to certain officers and key employees if certain financial goals are met. Under the plan, employees are granted performance share awards at a target number of shares or units, which vest over a three-year service period. At the end of the vesting period, the employee will have earned an amount of shares between 0% and 200% of the targeted award, depending on the achievement of specified financial goals for the service period. If the awards are granted in units, the employee will be given an amount of cash ranging from 0% to 200% of the equivalent market value of the targeted award.
Expense for performance share awards is recognized based upon the fair value of the awards on the date of grant and the anticipated number of shares or cash to be awarded on a straight-line basis for each vesting portion of the share award. The fair value of the performance share awards granted in units is the unadjusted quoted market price for the Company’s common stock on the date of grant, as further discussed in Note 13 to the consolidated financial statements.
The following table summarizes performance share award activity for 2016, 2015 and 2014:
Number of Performance Share Awards at Target Level | Number of Nonvested Performance Share Awards at Maximum Level | Weighted-Average Grant Date Fair Value | |||||||
Nonvested at February 1, 2014 | 164,525 | 329,050 | $12.69 | ||||||
Granted (award of units payable in cash) | 88,185 | 176,370 | 28.18 | ||||||
Vested | (84,275 | ) | (168,550 | ) | 9.27 | ||||
Expired | — | — | — | ||||||
Forfeited | (19,900 | ) | (39,800 | ) | 15.96 | ||||
Nonvested at January 31, 2015 | 148,535 | 297,070 | 23.39 | ||||||
Granted (award payable in shares) | 177,921 | 355,842 | 30.12 | ||||||
Vested | (15,182 | ) | (30,364 | ) | 24.71 | ||||
Expired | — | — | — | ||||||
Forfeited | (3,750 | ) | (7,500 | ) | 29.47 | ||||
Nonvested at January 30, 2016 | 307,524 | 615,048 | 27.14 | ||||||
Granted (award payable in shares) | 159,000 | 318,000 | 26.64 | ||||||
Vested | (56,175 | ) | (112,350 | ) | 17.00 | ||||
Expired | — | — | — | ||||||
Forfeited | (7,850 | ) | (15,700 | ) | 27.14 | ||||
Nonvested at January 28, 2017 | 402,499 | 804,998 | $28.36 | ||||||
As of January 28, 2017, the remaining unrecognized compensation cost related to nonvested performance share awards was $5.8 million, which will be recognized over the weighted-average remaining service period of 1.5 years.
Stock Options
Stock options are granted to employees at exercise prices equal to the quoted market price of the Company’s stock at the date of grant. Stock options generally vest over four years and have a term of 10 years. Compensation cost for all stock options is recognized over the requisite service period for each award. No dividends are paid on unexercised options. Expense for stock options is recognized on a straight-line basis separately for each vesting portion of the stock option award.
77
The Company granted 16,667 stock options during 2015. No stock options were granted during 2016 or 2014. Fair values of options granted were estimated using the Black-Scholes option-pricing model based on the following assumptions:
2015 | |||||||
Dividend yield | 1.0 | % | |||||
Expected volatility | 45.5 | % | |||||
Risk-free interest rate | 1.8 | % | |||||
Expected term (in years) | 7 | ||||||
Dividend yields are based on historical dividend yields. Expected volatilities are based on historical volatilities of the Company’s common stock at the time of grant. The risk-free interest rate is based on the U.S. Treasury yield curve in effect at the time of the grant for periods corresponding with the expected term of the options. The expected term of options represents the weighted-average period of time that options granted are expected to be outstanding, giving consideration to vesting schedules and the Company’s historical exercise patterns.
Summarized information about stock options outstanding and exercisable at January 28, 2017 is as follows:
Outstanding | Exercisable | |||||||||||||||
Exercise Price Range | Number of Options | Weighted- Average Remaining Life (Years) | Weighted- Average Exercise Price | Number of Options | Weighted- Average Remaining Life (Years) | Weighted- Average Exercise Price | ||||||||||
$3.33 - $8.07 | 28,250 | 2.8 | $4.63 | 18,250 | 3.2 | $5.35 | ||||||||||
$8.08 - $14.60 | 33,875 | 4.0 | 10.99 | 33,875 | 4.0 | 10.99 | ||||||||||
$14.61 - $24.82 | 24,500 | 2.4 | 16.08 | 24,500 | 2.4 | 16.08 | ||||||||||
$24.83 - $32.22 | 16,667 | 8.0 | 29.18 | — | — | — | ||||||||||
$32.23 - $35.25 | 47,248 | 0.1 | 35.25 | 47,248 | 0.1 | 35.25 | ||||||||||
150,540 | 2.8 | $20.25 | 123,873 | 2.1 | $20.42 | |||||||||||
The aggregate intrinsic value of stock options outstanding and currently exercisable at January 28, 2017 was $1.7 million and $1.4 million, respectively. Intrinsic value for stock options is calculated based on the exercise price of the underlying awards as compared to the quoted price of the Company’s common stock as of the reporting date.
The following table summarizes stock option activity for 2016 under the current and prior plans:
Number of Options | Weighted-Average Exercise Price | |||||
Outstanding at January 30, 2016 | 301,295 | $18.93 | ||||
Exercised | (111,381 | ) | 14.86 | |||
Forfeited | (9,749 | ) | 35.25 | |||
Canceled or expired | (29,625 | ) | 22.17 | |||
Outstanding at January 28, 2017 | 150,540 | $20.25 | ||||
Exercisable at January 28, 2017 | 123,873 | $20.42 | ||||
The intrinsic value of stock options exercised was $1.4 million, $1.3 million and $3.8 million for 2016, 2015 and 2014, respectively. The amount of cash received from the exercise of stock options was $0.6 million in 2016, $0.4 million in 2015 and $3.2 million in 2014. In addition, 39,402, 32,139 and 60,624 shares were tendered by employees in satisfaction of the exercise price of stock options during 2016, 2015 and 2014, respectively.
The Company recognized an immaterial amount of excess tax benefits related to stock option exercises in 2016. The Company recognized $0.1 million in excess tax benefits related to stock option exercises in 2015 and 2014, respectively, which were reflected as an increase to additional paid-in capital.
78
The following table summarizes nonvested stock option activity for 2016 under the current and prior plans:
Number of Nonvested Options | Weighted-Average Grant Date Fair Value | ||||||
Nonvested at January 30, 2016 | 33,667 | $ | 7.16 | ||||
Granted | — | — | |||||
Vested | (7,000 | ) | 2.36 | ||||
Forfeited | — | — | |||||
Nonvested at January 28, 2017 | 26,667 | $ | 8.42 | ||||
The weighted-average grant date fair value of stock options granted for 2015 was $12.81. The total grant date fair value of stock options vested during 2015 and 2014 was $0.1 million and $0.3 million, respectively, and immaterial in 2016. As of January 28, 2017, the total remaining unrecognized compensation cost related to nonvested stock options was $0.1 million, which will be amortized over the weighted-average remaining requisite service period of 2.6 years.
Restricted Stock Units for Non-Employee Directors
Equity-based grants may be made to non-employee directors in the form of cash-equivalent restricted stock units (“RSUs”) at no cost to the non-employee director. The RSUs are subject to a vesting requirement (usually one year), earn dividend equivalent units and are payable in cash on the date the director terminates service or such earlier date as a director may elect, subject to restrictions, based on the then current fair value of the Company’s common stock. Dividend equivalents are paid on outstanding RSUs at the same rate as dividends on the Company’s common stock, are automatically re-invested in additional RSUs and vest immediately as of the payment date for the dividend. Expense related to the initial grant of RSUs is recognized ratably over the vesting period based upon the fair value of the RSUs, as remeasured at the end of each period. Expense for the dividend equivalents is recognized at fair value immediately. Gains and losses resulting from changes in the fair value of the RSUs subsequent to the vesting period and through the settlement date are reported in the Company’s consolidated statements of earnings. Refer to Note 5 and Note 13 to the consolidated financial statements for information regarding the deferred compensation plan for non-employee directors.
The following table summarizes restricted stock unit activity for the year ended January 28, 2017:
Outstanding | Accrued (1) | Nonvested RSUs | |||||||||||||
Number of Vested RSUs | Number of Nonvested RSUs | Total Number of RSUs | Total Number of RSUs | Weighted-Average Grant Date Fair Value | |||||||||||
January 30, 2016 | 312,437 | 36,000 | 348,437 | 336,437 | $31.67 | ||||||||||
Granted (2) | 3,360 | 52,697 | 56,057 | 38,657 | 21.61 | ||||||||||
Vested | 36,497 | (36,497 | ) | — | 12,000 | 31.35 | |||||||||
Settled | (52,524 | ) | — | (52,524 | ) | (52,524 | ) | 32.94 | |||||||
January 28, 2017 | 299,770 | 52,200 | 351,970 | 334,570 | $21.74 | ||||||||||
(1) | Accrued RSUs include all fully vested awards and a pro-rata portion of nonvested awards based on the elapsed portion of the vesting period. | ||||||||||||||
(2) | Granted RSUs include 3,857 RSUs resulting from dividend equivalents paid on outstanding RSUs, of which 3,360 related to outstanding vested RSUs and 497 to outstanding nonvested RSUs. | ||||||||||||||
The following table summarizes RSUs granted, vested and settled during 2016, 2015 and 2014:
($ thousands, except per unit amounts) | 2016 | 2015 | 2014 | ||||||||||
Weighted-average grant date fair value of RSUs granted (1) | $ | 21.95 | $ | 31.54 | $ | 28.69 | |||||||
Fair value of RSUs vested | $ | 1,086 | $ | 1,049 | $ | 1,558 | |||||||
RSUs settled | 52,524 | 21,698 | 57,260 | ||||||||||
(1) | Includes dividend equivalents granted on outstanding RSUs, which vest immediately. | ||||||||||||
79
The following table details the RSU compensation expense and the related income tax benefit for 2016, 2015 and 2014:
($ thousands) | 2016 | 2015 | 2014 | |||||||||
Compensation expense | $ | 2,459 | $ | 704 | $ | 2,707 | ||||||
Income tax benefit | (956 | ) | (276 | ) | (1,053 | ) | ||||||
Compensation expense, net of income tax benefit | $ | 1,503 | $ | 428 | $ | 1,654 | ||||||
The aggregate intrinsic value of RSUs outstanding and currently vested at January 28, 2017 is $10.5 million and $8.9 million, respectively. The liabilities associated with the accrued RSUs totaled $9.4 million and $8.9 million as of January 28, 2017 and January 30, 2016, respectively.
16. RELATED PARTY TRANSACTIONS
C. banner International Holdings Limited
The Company has a joint venture agreement with a subsidiary of C. banner International Holdings Limited (“CBI”) to market Naturalizer footwear in China, effective through August 2017. The Company is a 51% owner of the joint venture (“B&H Footwear”), with CBI owning the other 49%. During 2013, B&H Footwear transferred the operation of its retail stores in China to CBI. B&H Footwear continues to sell Naturalizer footwear to a retail affiliate of CBI on a wholesale basis, which in turn sells the Naturalizer products through department store shops and free-standing stores in China. The Company, through its consolidated subsidiary, B&H Footwear, sold Naturalizer footwear on a wholesale basis to CBI totaling $5.4 million, $8.4 million, and $8.6 million in 2016, 2015 and 2014, respectively. During the second quarter of 2016, the Company communicated its intention to dissolve the joint venture with CBI upon the expiration of the license to sell Naturalizer footwear.
17. COMMITMENTS AND CONTINGENCIES
Environmental Remediation
Prior operations included numerous manufacturing and other facilities for which the Company may have responsibility under various environmental laws for the remediation of conditions that may be identified in the future. The Company is involved in environmental remediation and ongoing compliance activities at several sites and has been notified that it is or may be a potentially responsible party at several other sites.
Redfield
The Company is remediating, under the oversight of Colorado authorities, the groundwater and indoor air at its owned facility in Colorado (the “Redfield site” or, when referring to remediation activities at or under the facility, the “on-site remediation”) and residential neighborhoods adjacent to and near the property (the “off-site remediation”) that have been affected by solvents previously used at the facility. The on-site remediation calls for the operation of a pump and treat system (which prevents migration of contaminated groundwater off the property) as the final remedy for the site, subject to monitoring and periodic review of the on-site conditions and other remedial technologies that may be developed in the future. In May 2016, the Company submitted a revised plan to address on-site conditions, including direct treatment of source areas, and received approval from the oversight authorities to begin implementing the revised plan later in 2016.
As the treatment of the on-site source areas progresses, the Company expects to convert the pump and treat system to a passive treatment barrier system. Off-site groundwater concentrations have been reducing over time since installation of the pump and treat system in 2000 and injection of clean water beginning in 2003. However, localized areas of contaminated bedrock just beyond the property line continue to impact off-site groundwater. The modified workplan for addressing this condition includes converting the off-site bioremediation system into a monitoring well network and employing different remediation methods in these recalcitrant areas. In accordance with the workplan, a pilot test was conducted of certain groundwater remediation methods and the results of that test were used to develop more detailed plans for remedial activities in the off-site areas, which were approved by the authorities and are being implemented in a phased manner. The results of groundwater monitoring are being used to evaluate the effectiveness of these activities. In 2014, the Company submitted a proposed expanded remedy workplan that was accepted by the oversight authorities during 2015. The Company continues to implement the expanded remedy workplan.
The cumulative expenditures for both on-site and off-site remediation through January 28, 2017 were $29.1 million. The Company has recovered a portion of these expenditures from insurers and other third parties. The reserve for the anticipated future remediation activities at January 28, 2017 is $9.8 million, of which $8.9 million is recorded within other liabilities and $0.9 million is recorded within other accrued expenses. Of the total $9.8 million reserve, $4.7 million is for on-site remediation and $5.1 million is for off-site remediation. The
80
liability for the on-site remediation was discounted at 4.8%. On an undiscounted basis, the on-site remediation liability would be $14.6 million as of January 28, 2017. The Company expects to spend approximately $0.6 million in the next year, $0.1 million in each of the following four years and $13.6 million in the aggregate thereafter related to the on-site remediation.
Other
The Company has completed its remediation efforts at its closed New York tannery and two associated landfills. In 1995, state environmental authorities reclassified the status of these sites as being properly closed and requiring only continued maintenance and monitoring through 2024. The Company has an accrued liability of $1.2 million at January 28, 2017 related to these sites, which has been discounted at 6.4%. Of the $1.2 million reserve, $1.0 million is recorded in other liabilities and $0.2 million is recorded in other accrued expenses. On an undiscounted basis, this liability would be $1.4 million. The Company expects to spend approximately $0.2 million in each of the next five years and $0.4 million in the aggregate thereafter related to these sites. In addition, various federal and state authorities have identified the Company as a potentially responsible party for remediation at certain other sites. However, the Company does not currently believe that its liability for such sites, if any, would be material.
The Company continues to evaluate its estimated costs in conjunction with its environmental consultants and records its best estimate of such liabilities. However, future actions and the associated costs are subject to oversight and approval of various governmental authorities. Accordingly, the ultimate costs may vary, and it is possible costs may exceed the recorded amounts.
Litigation
The Company is involved in legal proceedings and litigation arising in the ordinary course of business. In the opinion of management, the outcome of such ordinary course of business proceedings and litigation currently pending is not expected to have a material adverse effect on the Company’s results of operations or financial position. Legal costs associated with litigation are generally expensed as incurred.
18. FINANCIAL INFORMATION FOR THE COMPANY AND ITS SUBSIDIARIES
The Company's 2023 Senior Notes are fully and unconditionally and jointly and severally guaranteed by all of its existing and future subsidiaries that are guarantors under the Credit Agreement, as further discussed in Note 10 to the consolidated financial statements. The following table presents the condensed consolidating financial information for each of Caleres, Inc. (“Parent”), the Guarantors, and subsidiaries of the Parent that are not Guarantors (the “Non-Guarantors”), together with consolidating eliminations, as of and for the periods indicated. Guarantors are 100% owned by the Parent.
The condensed consolidating financial statements have been prepared using the equity method of accounting in accordance with the requirements for presentation of such information. Management believes that the information, presented in lieu of complete financial statements for each of the Guarantors, provides meaningful information to allow investors to determine the nature of the assets held by, and operations and cash flows of, each of the consolidated groups.
81
CONDENSED CONSOLIDATING BALANCE SHEET | |||||||||||||||||||
AS OF JANUARY 28, 2017 | |||||||||||||||||||
Non-Guarantors | |||||||||||||||||||
($ thousands) | Parent | Guarantors | Eliminations | Total | |||||||||||||||
Assets | |||||||||||||||||||
Current assets: | |||||||||||||||||||
Cash and cash equivalents | $ | 23,999 | $ | 9,029 | $ | 22,304 | $ | — | $ | 55,332 | |||||||||
Receivables, net | 118,746 | 5,414 | 28,961 | — | 153,121 | ||||||||||||||
Inventories, net | 150,098 | 410,867 | 24,799 | — | 585,764 | ||||||||||||||
Prepaid expenses and other current assets | 24,293 | 23,040 | 8,058 | (5,863 | ) | 49,528 | |||||||||||||
Intercompany receivable - current | 695 | 263 | 22,091 | (23,049 | ) | — | |||||||||||||
Total current assets | 317,831 | 448,613 | 106,213 | (28,912 | ) | 843,745 | |||||||||||||
Property and equipment, net | 31,424 | 176,358 | 11,414 | — | 219,196 | ||||||||||||||
Goodwill and intangible assets, net | 113,333 | 219,337 | 11,088 | — | 343,758 | ||||||||||||||
Other assets | 51,181 | 16,567 | 826 | — | 68,574 | ||||||||||||||
Investment in subsidiaries | 1,343,954 | — | (21,946 | ) | (1,322,008 | ) | — | ||||||||||||
Intercompany receivable - noncurrent | 568,541 | 366,902 | 581,624 | (1,517,067 | ) | — | |||||||||||||
Total assets | $ | 2,426,264 | $ | 1,227,777 | $ | 689,219 | $ | (2,867,987 | ) | $ | 1,475,273 | ||||||||
Liabilities and Equity | |||||||||||||||||||
Current liabilities: | |||||||||||||||||||
Borrowings under revolving credit agreement | $ | 110,000 | $ | — | $ | — | $ | — | $ | 110,000 | |||||||||
Trade accounts payable | 116,783 | 112,434 | 37,153 | — | 266,370 | ||||||||||||||
Other accrued expenses | 74,941 | 65,228 | 16,919 | (5,863 | ) | 151,225 | |||||||||||||
Intercompany payable - current | 12,794 | — | 10,255 | (23,049 | ) | — | |||||||||||||
Total current liabilities | 314,518 | 177,662 | 64,327 | (28,912 | ) | 527,595 | |||||||||||||
Other liabilities: | |||||||||||||||||||
Long-term debt | 197,003 | — | — | — | 197,003 | ||||||||||||||
Other liabilities | 91,683 | 40,507 | 3,999 | — | 136,189 | ||||||||||||||
Intercompany payable - noncurrent | 1,209,943 | 98,982 | 208,142 | (1,517,067 | ) | — | |||||||||||||
Total other liabilities | 1,498,629 | 139,489 | 212,141 | (1,517,067 | ) | 333,192 | |||||||||||||
Equity: | |||||||||||||||||||
Caleres, Inc. shareholders’ equity | 613,117 | 910,626 | 411,382 | (1,322,008 | ) | 613,117 | |||||||||||||
Noncontrolling interests | — | — | 1,369 | — | 1,369 | ||||||||||||||
Total equity | 613,117 | 910,626 | 412,751 | (1,322,008 | ) | 614,486 | |||||||||||||
Total liabilities and equity | $ | 2,426,264 | $ | 1,227,777 | $ | 689,219 | $ | (2,867,987 | ) | $ | 1,475,273 | ||||||||
82
CONDENSED CONSOLIDATING STATEMENT OF EARNINGS | |||||||||||||||||||
FOR THE FISCAL YEAR ENDED JANUARY 28, 2017 | |||||||||||||||||||
($ thousands) | Parent | Guarantors | Non-Guarantors | Eliminations | Total | ||||||||||||||
Net sales | $ | 825,654 | $ | 1,692,093 | $ | 227,557 | $ | (165,916 | ) | $ | 2,579,388 | ||||||||
Cost of goods sold | 583,131 | 938,169 | 129,410 | (133,313 | ) | 1,517,397 | |||||||||||||
Gross profit | 242,523 | 753,924 | 98,147 | (32,603 | ) | 1,061,991 | |||||||||||||
Selling and administrative expenses | 212,156 | 690,292 | 57,757 | (32,603 | ) | 927,602 | |||||||||||||
Restructuring and other special charges, net | 15,333 | 433 | 7,638 | — | 23,404 | ||||||||||||||
Operating earnings | 15,034 | 63,199 | 32,752 | — | 110,985 | ||||||||||||||
Interest expense | (15,102 | ) | (9 | ) | — | — | (15,111 | ) | |||||||||||
Interest income | 811 | — | 569 | — | 1,380 | ||||||||||||||
Intercompany interest income (expense) | 8,888 | (9,033 | ) | 145 | — | — | |||||||||||||
Earnings before income taxes | 9,631 | 54,157 | 33,466 | — | 97,254 | ||||||||||||||
Income tax provision | (5,075 | ) | (20,084 | ) | (6,009 | ) | — | (31,168 | ) | ||||||||||
Equity in earnings (loss) of subsidiaries, net of tax | 61,102 | — | (2,422 | ) | (58,680 | ) | — | ||||||||||||
Net earnings | 65,658 | 34,073 | 25,035 | (58,680 | ) | 66,086 | |||||||||||||
Less: Net earnings attributable to noncontrolling interests | — | — | 428 | — | 428 | ||||||||||||||
Net earnings attributable to Caleres, Inc. | $ | 65,658 | $ | 34,073 | $ | 24,607 | $ | (58,680 | ) | $ | 65,658 | ||||||||
CONDENSED CONSOLIDATING STATEMENT OF COMPREHENSIVE INCOME | |||||||||||||||||||
FOR THE FISCAL YEAR ENDED JANUARY 28, 2017 | |||||||||||||||||||
Non-Guarantors | |||||||||||||||||||
($ thousands) | Parent | Guarantors | Eliminations | Total | |||||||||||||||
Net earnings | $ | 65,658 | $ | 34,073 | $ | 25,035 | $ | (58,680 | ) | $ | 66,086 | ||||||||
Other comprehensive income (loss), net of tax: | |||||||||||||||||||
Foreign currency translation adjustment | — | — | 1,045 | — | 1,045 | ||||||||||||||
Pension and other postretirement benefits adjustments | (24,790 | ) | — | 62 | — | (24,728 | ) | ||||||||||||
Derivative financial instruments | 181 | — | (1,115 | ) | — | (934 | ) | ||||||||||||
Other comprehensive income from investment in subsidiaries | 39 | — | — | (39 | ) | — | |||||||||||||
Other comprehensive loss, net of tax | (24,570 | ) | — | (8 | ) | (39 | ) | (24,617 | ) | ||||||||||
Comprehensive income | 41,088 | 34,073 | 25,027 | (58,719 | ) | 41,469 | |||||||||||||
Comprehensive income attributable to noncontrolling interests | — | — | 381 | — | 381 | ||||||||||||||
Comprehensive income attributable to Caleres, Inc. | $ | 41,088 | $ | 34,073 | $ | 24,646 | $ | (58,719 | ) | $ | 41,088 | ||||||||
83
CONDENSED CONSOLIDATING STATEMENT OF CASH FLOWS | |||||||||||||||||||
FOR THE FISCAL YEAR ENDED JANUARY 28, 2017 | |||||||||||||||||||
Non-Guarantors | |||||||||||||||||||
($ thousands) | Parent | Guarantors | Eliminations | Total | |||||||||||||||
Net cash provided by operating activities | $ | 66,800 | $ | 71,781 | $ | 45,041 | $ | — | $ | 183,622 | |||||||||
Investing activities | |||||||||||||||||||
Purchases of property and equipment | (4,769 | ) | (41,606 | ) | (4,148 | ) | — | (50,523 | ) | ||||||||||
Capitalized software | (5,521 | ) | (3,481 | ) | (37 | ) | — | (9,039 | ) | ||||||||||
Acquisition cost, net of cash received | (259,932 | ) | — | — | — | (259,932 | ) | ||||||||||||
Intercompany investing | (3,257 | ) | 3,257 | — | — | — | |||||||||||||
Net cash used for investing activities | (273,479 | ) | (41,830 | ) | (4,185 | ) | — | (319,494 | ) | ||||||||||
Financing activities | |||||||||||||||||||
Borrowings under revolving credit agreement | 623,000 | — | — | — | 623,000 | ||||||||||||||
Repayments under revolving credit agreement | (513,000 | ) | — | — | — | (513,000 | ) | ||||||||||||
Dividends paid | (12,104 | ) | — | — | — | (12,104 | ) | ||||||||||||
Acquisition of treasury stock | (23,139 | ) | — | — | — | (23,139 | ) | ||||||||||||
Issuance of common stock under share-based plans, net | (4,188 | ) | — | — | — | (4,188 | ) | ||||||||||||
Excess tax benefit related to share-based plans | 2,251 | — | — | — | 2,251 | ||||||||||||||
Intercompany financing | 126,858 | (20,922 | ) | (105,936 | ) | — | — | ||||||||||||
Net cash provided by (used for) financing activities | 199,678 | (20,922 | ) | (105,936 | ) | — | 72,820 | ||||||||||||
Effect of exchange rate changes on cash and cash equivalents | — | — | 233 | — | 233 | ||||||||||||||
(Decrease) increase in cash and cash equivalents | (7,001 | ) | 9,029 | (64,847 | ) | — | (62,819 | ) | |||||||||||
Cash and cash equivalents at beginning of year | 31,000 | — | 87,151 | — | 118,151 | ||||||||||||||
Cash and cash equivalents at end of year | $ | 23,999 | $ | 9,029 | $ | 22,304 | $ | — | $ | 55,332 | |||||||||
84
CONDENSED CONSOLIDATING BALANCE SHEET | |||||||||||||||||||
AS OF JANUARY 30, 2016 | |||||||||||||||||||
Non- Guarantors | |||||||||||||||||||
($ thousands) | Parent | Guarantors | Eliminations | Total | |||||||||||||||
Assets | |||||||||||||||||||
Current assets: | |||||||||||||||||||
Cash and cash equivalents | $ | 31,000 | $ | — | $ | 87,151 | $ | — | $ | 118,151 | |||||||||
Receivables, net | 110,235 | 2,290 | 41,139 | — | 153,664 | ||||||||||||||
Inventories, net | 151,704 | 371,538 | 23,503 | — | 546,745 | ||||||||||||||
Prepaid expenses and other current assets | 29,765 | 24,597 | 8,109 | (5,966 | ) | 56,505 | |||||||||||||
Intercompany receivable - current | 650 | 176 | 6,877 | (7,703 | ) | — | |||||||||||||
Total current assets | 323,354 | 398,601 | 166,779 | (13,669 | ) | 875,065 | |||||||||||||
Property and equipment, net | 32,538 | 136,223 | 10,249 | — | 179,010 | ||||||||||||||
Goodwill and intangible assets, net | 115,558 | 2,800 | 12,541 | — | 130,899 | ||||||||||||||
Other assets | 94,767 | 15,772 | 7,810 | — | 118,349 | ||||||||||||||
Investment in subsidiaries | 1,028,143 | — | (19,524 | ) | (1,008,619 | ) | — | ||||||||||||
Intercompany receivable - noncurrent | 431,523 | 354,038 | 556,259 | (1,341,820 | ) | — | |||||||||||||
Total assets | $ | 2,025,883 | $ | 907,434 | $ | 734,114 | $ | (2,364,108 | ) | $ | 1,303,323 | ||||||||
Liabilities and Equity | |||||||||||||||||||
Current liabilities: | |||||||||||||||||||
Trade accounts payable | $ | 78,332 | $ | 123,274 | $ | 36,196 | $ | — | $ | 237,802 | |||||||||
Other accrued expenses | 80,053 | 62,729 | 15,681 | (5,966 | ) | 152,497 | |||||||||||||
Intercompany payable - current | 4,394 | — | 3,309 | (7,703 | ) | — | |||||||||||||
Total current liabilities | 162,779 | 186,003 | 55,186 | (13,669 | ) | 390,299 | |||||||||||||
Other liabilities: | |||||||||||||||||||
Long-term debt | 196,544 | — | — | — | 196,544 | ||||||||||||||
Other liabilities | 44,011 | 66,302 | 3,695 | — | 114,008 | ||||||||||||||
Intercompany payable - noncurrent | 1,021,065 | 39,175 | 281,580 | (1,341,820 | ) | — | |||||||||||||
Total other liabilities | 1,261,620 | 105,477 | 285,275 | (1,341,820 | ) | 310,552 | |||||||||||||
Equity: | |||||||||||||||||||
Caleres, Inc. shareholders’ equity | 601,484 | 615,954 | 392,665 | (1,008,619 | ) | 601,484 | |||||||||||||
Noncontrolling interests | — | — | 988 | — | 988 | ||||||||||||||
Total equity | 601,484 | 615,954 | 393,653 | (1,008,619 | ) | 602,472 | |||||||||||||
Total liabilities and equity | $ | 2,025,883 | $ | 907,434 | $ | 734,114 | $ | (2,364,108 | ) | $ | 1,303,323 | ||||||||
85
CONDENSED CONSOLIDATING STATEMENT OF EARNINGS | |||||||||||||||||||
FOR THE FISCAL YEAR ENDED JANUARY 30, 2016 | |||||||||||||||||||
Non-Guarantors | |||||||||||||||||||
($ thousands) | Parent | Guarantors | Eliminations | Total | |||||||||||||||
Net sales | $ | 819,148 | $ | 1,652,444 | $ | 268,779 | $ | (162,941 | ) | $ | 2,577,430 | ||||||||
Cost of goods sold | 591,539 | 905,412 | 162,384 | (129,708 | ) | 1,529,627 | |||||||||||||
Gross profit | 227,609 | 747,032 | 106,395 | (33,233 | ) | 1,047,803 | |||||||||||||
Selling and administrative expenses | 235,210 | 649,020 | 61,699 | (33,233 | ) | 912,696 | |||||||||||||
Operating (loss) earnings | (7,601 | ) | 98,012 | 44,696 | — | 135,107 | |||||||||||||
Interest expense | (16,588 | ) | (1 | ) | — | — | (16,589 | ) | |||||||||||
Loss on early extinguishment of debt | (10,651 | ) | — | — | — | (10,651 | ) | ||||||||||||
Interest income | 695 | — | 204 | — | 899 | ||||||||||||||
Intercompany interest income (expense) | 14,363 | (14,581 | ) | 218 | — | — | |||||||||||||
(Loss) earnings before income taxes | (19,782 | ) | 83,430 | 45,118 | — | 108,766 | |||||||||||||
Income tax benefit (provision) | 8,755 | (29,475 | ) | (6,222 | ) | — | (26,942 | ) | |||||||||||
Equity in earnings (loss) of subsidiaries, net of tax | 92,506 | — | (616 | ) | (91,890 | ) | — | ||||||||||||
Net earnings | 81,479 | 53,955 | 38,280 | (91,890 | ) | 81,824 | |||||||||||||
Less: Net earnings attributable to noncontrolling interests | — | — | 345 | — | 345 | ||||||||||||||
Net earnings attributable to Caleres, Inc. | $ | 81,479 | $ | 53,955 | $ | 37,935 | $ | (91,890 | ) | $ | 81,479 | ||||||||
CONDENSED CONSOLIDATING STATEMENT OF COMPREHENSIVE INCOME | |||||||||||||||||||
FOR THE FISCAL YEAR ENDED JANUARY 30, 2016 | |||||||||||||||||||
Non-Guarantors | |||||||||||||||||||
($ thousands) | Parent | Guarantors | Eliminations | Total | |||||||||||||||
Net earnings | $ | 81,479 | $ | 53,955 | $ | 38,280 | $ | (91,890 | ) | $ | 81,824 | ||||||||
Other comprehensive income (loss), net of tax: | |||||||||||||||||||
Foreign currency translation adjustment | — | — | (224 | ) | — | (224 | ) | ||||||||||||
Pension and other postretirement benefits adjustments | (8,838 | ) | — | 249 | — | (8,589 | ) | ||||||||||||
Derivative financial instruments | 628 | — | (460 | ) | — | 168 | |||||||||||||
Other comprehensive loss from investment in subsidiaries | (366 | ) | — | — | 366 | — | |||||||||||||
Other comprehensive loss, net of tax | (8,576 | ) | — | (435 | ) | 366 | (8,645 | ) | |||||||||||
Comprehensive income | 72,903 | 53,955 | 37,845 | (91,524 | ) | 73,179 | |||||||||||||
Comprehensive income attributable to noncontrolling interests | — | — | 276 | — | 276 | ||||||||||||||
Comprehensive income attributable to Caleres, Inc. | $ | 72,903 | $ | 53,955 | $ | 37,569 | $ | (91,524 | ) | $ | 72,903 | ||||||||
86
CONDENSED CONSOLIDATING STATEMENT OF CASH FLOWS | |||||||||||||||||||
FOR THE FISCAL YEAR ENDED JANUARY 30, 2016 | |||||||||||||||||||
Non-Guarantors | |||||||||||||||||||
($ thousands) | Parent | Guarantors | Eliminations | Total | |||||||||||||||
Net cash (used for) provided by operating activities | $ | (1,259 | ) | $ | 99,222 | $ | 51,189 | $ | — | $ | 149,152 | ||||||||
Investing activities | |||||||||||||||||||
Purchases of property and equipment | (14,585 | ) | (56,382 | ) | (2,512 | ) | — | (73,479 | ) | ||||||||||
Proceeds from disposal of property and equipment | 7,111 | — | 322 | — | 7,433 | ||||||||||||||
Capitalized software | (5,197 | ) | (2,538 | ) | — | — | (7,735 | ) | |||||||||||
Intercompany investing | (568 | ) | 568 | — | — | — | |||||||||||||
Net cash used for investing activities | (13,239 | ) | (58,352 | ) | (2,190 | ) | — | (73,781 | ) | ||||||||||
Financing activities | |||||||||||||||||||
Borrowings under revolving credit agreement | 198,000 | — | — | — | 198,000 | ||||||||||||||
Repayments under revolving credit agreement | (198,000 | ) | — | — | — | (198,000 | ) | ||||||||||||
Proceeds from issuance of 2023 senior notes | 200,000 | — | — | — | 200,000 | ||||||||||||||
Redemption of 2019 senior notes | (200,000 | ) | — | — | — | (200,000 | ) | ||||||||||||
Dividends paid | (12,253 | ) | — | — | — | (12,253 | ) | ||||||||||||
Debt issuance costs | (3,650 | ) | — | — | — | (3,650 | ) | ||||||||||||
Acquisition of treasury stock | (4,921 | ) | — | — | — | (4,921 | ) | ||||||||||||
Issuance of common stock under share-based plans, net | (5,297 | ) | — | — | — | (5,297 | ) | ||||||||||||
Excess tax benefit related to share-based plans | 2,651 | — | — | — | 2,651 | ||||||||||||||
Intercompany financing | 55,077 | (40,870 | ) | (14,207 | ) | — | — | ||||||||||||
Net cash provided by (used for) financing activities | 31,607 | (40,870 | ) | (14,207 | ) | — | (23,470 | ) | |||||||||||
Effect of exchange rate changes on cash and cash equivalents | — | — | (1,153 | ) | — | (1,153 | ) | ||||||||||||
Increase in cash and cash equivalents | 17,109 | — | 33,639 | — | 50,748 | ||||||||||||||
Cash and cash equivalents at beginning of year | 13,891 | — | 53,512 | — | 67,403 | ||||||||||||||
Cash and cash equivalents at end of year | $ | 31,000 | $ | — | $ | 87,151 | $ | — | $ | 118,151 | |||||||||
CONDENSED CONSOLIDATING STATEMENT OF EARNINGS | |||||||||||||||||||
FOR THE FISCAL YEAR ENDED JANUARY 31, 2015 | |||||||||||||||||||
Non-Guarantors | |||||||||||||||||||
($ thousands) | Parent | Guarantors | Eliminations | Total | |||||||||||||||
Net sales | $ | 788,708 | $ | 1,634,375 | $ | 329,765 | $ | (181,139 | ) | $ | 2,571,709 | ||||||||
Cost of goods sold | 570,343 | 899,968 | 213,716 | (152,418 | ) | 1,531,609 | |||||||||||||
Gross profit | 218,365 | 734,407 | 116,049 | (28,721 | ) | 1,040,100 | |||||||||||||
Selling and administrative expenses | 231,141 | 633,073 | 75,189 | (28,721 | ) | 910,682 | |||||||||||||
Restructuring and other special charges, net | 3,484 | — | — | — | 3,484 | ||||||||||||||
Operating (loss) earnings | (16,260 | ) | 101,334 | 40,860 | — | 125,934 | |||||||||||||
Interest expense | (20,444 | ) | (1 | ) | — | — | (20,445 | ) | |||||||||||
Loss on early extinguishment of debt | (420 | ) | — | — | — | (420 | ) | ||||||||||||
Interest income | 31 | — | 348 | — | 379 | ||||||||||||||
Intercompany interest income (expense) | 12,115 | (12,826 | ) | 711 | — | — | |||||||||||||
Gain on sale of subsidiary | — | — | 4,679 | — | 4,679 | ||||||||||||||
(Loss) earnings before income taxes | (24,978 | ) | 88,507 | 46,598 | — | 110,127 | |||||||||||||
Income tax benefit (provision) | 10,599 | (34,710 | ) | (3,073 | ) | — | (27,184 | ) | |||||||||||
Equity in earnings of subsidiaries, net of tax | 97,229 | — | 37 | (97,266 | ) | — | |||||||||||||
Net earnings | 82,850 | 53,797 | 43,562 | (97,266 | ) | 82,943 | |||||||||||||
Less: Net earnings attributable to noncontrolling interests | — | — | 93 | — | 93 | ||||||||||||||
Net earnings attributable to Caleres, Inc. | $ | 82,850 | $ | 53,797 | $ | 43,469 | $ | (97,266 | ) | $ | 82,850 | ||||||||
87
CONDENSED CONSOLIDATING STATEMENT OF COMPREHENSIVE INCOME | |||||||||||||||||||
FOR THE FISCAL YEAR ENDED JANUARY 31, 2015 | |||||||||||||||||||
Non-Guarantors | |||||||||||||||||||
($ thousands) | Parent | Guarantors | Eliminations | Total | |||||||||||||||
Net earnings | $ | 82,850 | $ | 53,797 | $ | 43,562 | $ | (97,266 | ) | $ | 82,943 | ||||||||
Other comprehensive income (loss), net of tax: | |||||||||||||||||||
Foreign currency translation adjustment | — | — | (3,145 | ) | — | (3,145 | ) | ||||||||||||
Pension and other postretirement benefits adjustments | (10,003 | ) | — | (346 | ) | — | (10,349 | ) | |||||||||||
Derivative financial instruments | (1,250 | ) | — | 736 | — | (514 | ) | ||||||||||||
Other comprehensive loss from investment in subsidiaries | (2,711 | ) | — | — | 2,711 | — | |||||||||||||
Other comprehensive loss, net of tax | (13,964 | ) | — | (2,755 | ) | 2,711 | (14,008 | ) | |||||||||||
Comprehensive income | 68,886 | 53,797 | 40,807 | (94,555 | ) | 68,935 | |||||||||||||
Comprehensive income attributable to noncontrolling interests | — | — | 49 | — | 49 | ||||||||||||||
Comprehensive income attributable to Caleres, Inc. | $ | 68,886 | $ | 53,797 | $ | 40,758 | $ | (94,555 | ) | $ | 68,886 | ||||||||
CONDENSED CONSOLIDATING STATEMENT OF CASH FLOWS | |||||||||||||||||||
FOR THE FISCAL YEAR ENDED JANUARY 31, 2015 | |||||||||||||||||||
Non-Guarantors | |||||||||||||||||||
($ thousands) | Parent | Guarantors | Eliminations | Total | |||||||||||||||
Net cash (used for) provided by operating activities | $ | (11,728 | ) | $ | 99,709 | $ | 30,831 | $ | — | $ | 118,812 | ||||||||
Investing activities | |||||||||||||||||||
Purchases of property and equipment | (7,129 | ) | (33,067 | ) | (4,756 | ) | — | (44,952 | ) | ||||||||||
Capitalized software | (4,834 | ) | (194 | ) | (58 | ) | — | (5,086 | ) | ||||||||||
Acquisition of trademarks | (65,065 | ) | — | — | — | (65,065 | ) | ||||||||||||
Investment in nonconsolidated affiliate | — | — | (7,000 | ) | — | (7,000 | ) | ||||||||||||
Net proceeds from sale of subsidiaries, inclusive of note receivable | — | — | 10,120 | — | 10,120 | ||||||||||||||
Intercompany investing | (2,314 | ) | (124 | ) | 2,438 | — | — | ||||||||||||
Net cash (used for) provided by investing activities | (79,342 | ) | (33,385 | ) | 744 | — | (111,983 | ) | |||||||||||
Financing activities | |||||||||||||||||||
Borrowings under revolving credit agreement | 867,000 | — | — | — | 867,000 | ||||||||||||||
Repayments under revolving credit agreement | (874,000 | ) | — | — | — | (874,000 | ) | ||||||||||||
Dividends paid | (12,237 | ) | — | — | — | (12,237 | ) | ||||||||||||
Debt issuance costs | (2,618 | ) | — | — | — | (2,618 | ) | ||||||||||||
Issuance of common stock under share-based plans, net | 443 | — | — | — | 443 | ||||||||||||||
Excess tax benefit related to share-based plans | 929 | — | — | — | 929 | ||||||||||||||
Intercompany financing | 125,444 | (66,324 | ) | (59,120 | ) | — | — | ||||||||||||
Net cash provided by (used for) financing activities | 104,961 | (66,324 | ) | (59,120 | ) | — | (20,483 | ) | |||||||||||
Effect of exchange rate changes on cash and cash equivalents | — | — | (1,489 | ) | — | (1,489 | ) | ||||||||||||
Increase (decrease) in cash and cash equivalents | 13,891 | — | (29,034 | ) | — | (15,143 | ) | ||||||||||||
Cash and cash equivalents at beginning of year | — | — | 82,546 | — | 82,546 | ||||||||||||||
Cash and cash equivalents at end of year | $ | 13,891 | $ | — | $ | 53,512 | $ | — | $ | 67,403 | |||||||||
88
19. QUARTERLY FINANCIAL DATA (Unaudited)
Quarterly financial results (unaudited) for 2016 and 2015 are as follows:
Quarters | |||||||||||||||
First Quarter | Second Quarter | Third Quarter | Fourth Quarter | ||||||||||||
($ thousands, except per share amounts) | (13 weeks) | (13 weeks) | (13 weeks) | (13 Weeks) | |||||||||||
2016 | |||||||||||||||
Net sales | $ | 584,733 | $ | 622,937 | $ | 732,230 | $ | 639,488 | |||||||
Gross profit | 247,793 | 259,555 | 293,771 | 260,872 | |||||||||||
Net earnings (loss) (2) | 17,878 | 19,679 | 34,726 | (6,196 | ) | ||||||||||
Net earnings (loss) attributable to Caleres, Inc. (2) | 17,782 | 19,768 | 34,730 | (6,622 | ) | ||||||||||
Per share of common stock: | |||||||||||||||
Basic earnings (loss) per common share attributable to Caleres, Inc. shareholders (1) | 0.41 | 0.46 | 0.81 | (0.16 | ) | ||||||||||
Diluted earnings (loss) per common share attributable to Caleres, Inc. shareholders (1) | 0.41 | 0.46 | 0.81 | (0.16 | ) | ||||||||||
Dividends paid | 0.07 | 0.07 | 0.07 | 0.07 | |||||||||||
Market value: | |||||||||||||||
High | 29.49 | 27.30 | 26.90 | 36.61 | |||||||||||
Low | 23.89 | 21.27 | 23.12 | 24.14 | |||||||||||
(1) EPS for the quarters may not sum to the annual amount as each period is computed on a discrete period basis.
(2) The fourth quarter of 2016 reflects the impact of several restructuring and other charges totaling $20.2 million on an after-tax basis, as further described in Note 4 to the consolidated financial statements.
Quarters | |||||||||||||||
First Quarter | Second Quarter | Third Quarter | Fourth Quarter | ||||||||||||
($ thousands, except per share amounts) | (13 weeks) | (13 weeks) | (13 weeks) | (13 Weeks) | |||||||||||
2015 | |||||||||||||||
Net sales | $ | 602,283 | $ | 637,834 | $ | 728,639 | $ | 608,674 | |||||||
Gross profit | 248,526 | 262,795 | 288,434 | 248,048 | |||||||||||
Net earnings | 19,391 | 16,863 | 33,992 | 11,578 | |||||||||||
Net earnings attributable to Caleres, Inc. | 19,261 | 16,825 | 33,983 | 11,410 | |||||||||||
Per share of common stock: | |||||||||||||||
Basic earnings per common share attributable to Caleres, Inc. shareholders (1) | 0.44 | 0.38 | 0.78 | 0.26 | |||||||||||
Diluted earnings per common share attributable to Caleres, Inc. shareholders (1) | 0.44 | 0.38 | 0.78 | 0.26 | |||||||||||
Dividends paid | 0.07 | 0.07 | 0.07 | 0.07 | |||||||||||
Market value: | |||||||||||||||
High | 33.33 | 33.83 | 33.73 | 31.75 | |||||||||||
Low | 27.22 | 28.91 | 27.90 | 23.22 | |||||||||||
(1) EPS for the quarters may not sum to the annual amount as each period is computed on a discrete period basis.
89
SCHEDULE II — VALUATION AND QUALIFYING ACCOUNTS
Col. A | Col. B | Col. C | Col. D | Col. E | |||||||||||||||
Additions | |||||||||||||||||||
Balance at Beginning of Period | Charged to Costs and Expenses | Charged to Other Accounts - Describe | Deductions - Describe | Balance at End of Period | |||||||||||||||
Description | |||||||||||||||||||
($ thousands) | |||||||||||||||||||
YEAR ENDED JANUARY 28, 2017 | |||||||||||||||||||
Deducted from assets or accounts: | |||||||||||||||||||
Doubtful accounts and allowances | $ | 2,295 | $ | 1,384 | $ | 70 | (E) | $ | 2,182 | (A) | $ | 1,567 | |||||||
Customer allowances | 21,590 | 45,186 | — | 45,853 | (B) | 20,923 | |||||||||||||
Customer discounts | 895 | 3,573 | — | 3,306 | (B) | 1,162 | |||||||||||||
Inventory valuation allowances | 15,780 | 52,041 | 2,225 | (E) | 55,817 | (C) | 14,229 | ||||||||||||
Deferred tax asset valuation allowance | 6,544 | 3,697 | 450 | (E) | 2,801 | (D) | 7,890 | ||||||||||||
YEAR ENDED JANUARY 30, 2016 | |||||||||||||||||||
Deducted from assets or accounts: | |||||||||||||||||||
Doubtful accounts and allowances | $ | 2,235 | $ | 480 | $ | — | $ | 420 | (A) | $ | 2,295 | ||||||||
Customer allowances | 21,906 | 47,435 | — | 47,751 | (B) | 21,590 | |||||||||||||
Customer discounts | 1,252 | 2,624 | — | 2,981 | (B) | 895 | |||||||||||||
Inventory valuation allowances | 16,051 | 55,126 | — | 55,397 | (C) | 15,780 | |||||||||||||
Deferred tax asset valuation allowance | 11,514 | 670 | — | 5,640 | (D) | 6,544 | |||||||||||||
YEAR ENDED JANUARY 31, 2015 | |||||||||||||||||||
Deducted from assets or accounts: | |||||||||||||||||||
Doubtful accounts and allowances | $ | 832 | $ | 1,716 | $ | — | $ | 313 | (A) | $ | 2,235 | ||||||||
Customer allowances | 19,862 | 46,878 | — | 44,834 | (B) | 21,906 | |||||||||||||
Customer discounts | 776 | 3,519 | — | 3,043 | (B) | 1,252 | |||||||||||||
Inventory valuation allowances | 17,739 | 50,781 | — | 52,469 | (C) | 16,051 | |||||||||||||
Deferred tax asset valuation allowance | 13,949 | 714 | — | 3,149 | (D) | 11,514 | |||||||||||||
(A) | Accounts written off, net of recoveries. |
(B) | Discounts and allowances granted to wholesale customers of the Brand Portfolio segment. |
(C) | Adjustment upon disposal of related inventories. |
(D) | Reductions to the valuation allowance for the net operating loss carryforwards for certain states based on the Company’s expectations for utilization of net operating loss carryforwards. |
(E) | Established through purchase accounting related to the Allen Edmonds acquisition. |
ITEM 9 | CHANGES IN AND DISAGREEMENTS WITH ACCOUNTANTS ON ACCOUNTING AND FINANCIAL DISCLOSURE |
None.
ITEM 9A | CONTROLS AND PROCEDURES |
Evaluation of Disclosure Controls and Procedures
It is the Chief Executive Officer’s and Chief Financial Officer’s ultimate responsibility to ensure we maintain disclosure controls and procedures designed to provide reasonable assurance that information required to be disclosed in the reports that we file or submit under the Securities Exchange Act of 1934 is recorded, processed, summarized and reported within the time periods specified in the Commission’s
90
rules and forms and is accumulated and communicated to our management, including our principal executive and principal financial officers, or persons performing similar functions, as appropriate to allow timely decisions regarding required disclosure. Our disclosure controls and procedures include mandatory communication of material events; automated accounting processing and reporting; management review of monthly, quarterly and annual results; an established system of internal controls; and internal control reviews by our internal auditors.
A control system, no matter how well-conceived or operated, can provide only reasonable, not absolute, assurance that the objectives of the control system are met. Furthermore, the design of a control system must reflect the fact there are resource constraints, and the benefits of controls must be considered relative to their costs. Because of the inherent limitations in all control systems, no evaluation of controls can provide absolute assurance that all control issues and instances of fraud, if any, have been detected. These inherent limitations include the realities that judgments in decision-making can be faulty, and breakdowns can occur because of simple error or mistake. Additionally, controls can be circumvented by the individual acts of some persons, by collusion of two or more people or by management override of the controls. The design of any system of controls is based in part upon certain assumptions about the likelihood of future events, and there can be no assurance any design will succeed in achieving its stated goals under all potential future conditions; over time, controls may become inadequate because of changes in conditions or the degree of compliance with the policies or procedures may deteriorate. Because of the inherent limitations in a cost-effective control system, misstatements due to errors or fraud may occur and not be detected. Our disclosure controls and procedures are designed to provide a reasonable level of assurance that their objectives are achieved. As of January 28, 2017, management of the Company, including the Chief Executive Officer and Chief Financial Officer, conducted an evaluation of the effectiveness of our disclosure controls and procedures (as defined in Rule 13a-15(e) under the Securities Exchange Act of 1934). Based upon and as of the date of that evaluation, the Chief Executive Officer and Chief Financial Officer have concluded our disclosure controls and procedures were effective at the reasonable assurance level.
Internal Control Over Financial Reporting
On December 13, 2016, we acquired Allen Edmonds. As a result of the acquisition, we are in the process of reviewing the internal control structure of Allen Edmonds and, if necessary, will make appropriate changes as we incorporate our internal controls into the acquired business. Based on the evaluation of internal control over financial reporting, the Chief Executive Officer and Chief Financial Officer have concluded that there have been no changes in the Company’s internal controls over financial reporting or in other factors during the quarter ended January 28, 2017, except for the acquisition, that have materially affected, or are reasonably likely to materially affect, the Company’s internal control over financial reporting.
ITEM 9B | OTHER INFORMATION |
None.
PART III |
ITEM 10 | DIRECTORS, EXECUTIVE OFFICERS AND CORPORATE GOVERNANCE |
Information regarding Directors of the Company is set forth under the caption Proposal 1 – Election of Directors in the Proxy Statement for the Annual Meeting of Shareholders to be held May 25, 2017, which information is incorporated herein by reference.
Information regarding Executive Officers of the Registrant is set forth under the caption Executive Officers of the Registrant that can be found in Item 1 of this report, which information is incorporated herein by reference.
Information regarding Section 16, Beneficial Ownership Reporting Compliance, is set forth under the caption Section 16(a) Beneficial Ownership Reporting Compliance in the Proxy Statement for the Annual Meeting of Shareholders to be held May 25, 2017, which information is incorporated herein by reference.
Information regarding the Audit Committee and the Audit Committee financial expert is set forth under the caption Board Meetings and Committees in the Proxy Statement for the Annual Meeting of Shareholders to be held May 25, 2017, which information is incorporated herein by reference.
Information regarding the Corporate Governance Guidelines, Code of Business Conduct, and Code of Ethics is set forth under the caption Corporate Governance in the Proxy Statement for the Annual Meeting of Shareholders to be held May 25, 2017, which information is incorporated herein by reference.
91
ITEM 11 | EXECUTIVE COMPENSATION |
Information regarding Executive Compensation is set forth under the captions Compensation Discussion and Analysis, Executive Compensation, and Compensation of Non-Employee Directors in the Proxy Statement for the Annual Meeting of Shareholders to be held May 25, 2017, which information is incorporated herein by reference.
Information regarding the Compensation Committee Report is set forth under the caption Compensation Committee Report in the Proxy Statement for the Annual Meeting of Shareholders to be held May 25, 2017, which information is incorporated herein by reference.
Information regarding Compensation Committee Interlocks and Insider Participation is set forth under the caption Compensation Committee Interlocks and Insider Participation in the Proxy Statement for the Annual Meeting of Shareholders to be held May 25, 2017, which information is incorporated herein by reference.
ITEM 12 | SECURITY OWNERSHIP OF CERTAIN BENEFICIAL OWNERS AND MANAGEMENT AND RELATED STOCKHOLDER MATTERS |
Information regarding Company Stock Ownership by Directors, Officers and Principal Holders of Our Stock is set forth under the caption Stock Ownership by Directors, Executive Officers and 5% Shareholders in the Proxy Statement for the Annual Meeting of Shareholders to be held May 25, 2017, which information is incorporated herein by reference.
Equity Compensation Plan Information
The following table sets forth aggregate information regarding the Company’s equity compensation plans as of January 28, 2017:
Number of securities to be issued upon exercise of outstanding options, warrants and rights | Weighted-average exercise price of outstanding options, warrants and rights | Number of securities remaining available for future issuance under equity compensation plans (excluding securities reflected in column (a)) | |||||||||||
Plan Category | (a) | (b) | (c) | ||||||||||
Equity compensation plans approved by security holders | 824,382 | (1) | $ | 20.25 | (1) | 1,475,169 | (2) | ||||||
Equity compensation plans not approved by security holders | — | — | — | ||||||||||
Total | 824,382 | $ | 20.25 | 1,475,169 | |||||||||
(1) | Column (a) includes 150,540 outstanding (vested and nonvested) stock options and 672,842 performance share units payable in shares, which reflects the maximum number of shares to be issued under the performance share plans. The target number of shares to be issued under the plans is 366,421. Performance share awards were disregarded for purposes of computing the weighted-average exercise price in column (b). This table excludes performance share units that can only be settled in cash. Restricted stock units granted to independent directors and independent directors’ deferred compensation units, which are payable only in cash, are also excluded. |
(2) | Represents our remaining shares available for award grants based upon the plan provisions, which reflects our practice to reserve shares for outstanding awards. Per our current practice, the number of securities available for grant has been reduced for stock option grants. Performance share awards are reserved based on the maximum payout level. |
Information regarding share-based plans is set forth in Note 15 to the consolidated financial statements and is hereby incorporated by reference.
ITEM 13 | CERTAIN RELATIONSHIPS AND RELATED TRANSACTIONS, AND DIRECTOR INDEPENDENCE |
Information regarding Certain Relationships and Related Transactions is set forth under the caption Related Party Transactions in the Proxy Statement for the Annual Meeting of Shareholders to be held May 25, 2017, which information is incorporated herein by reference.
Information regarding Director Independence is set forth under the caption Director Independence in the Proxy Statement for the Annual Meeting of Shareholders to be held May 25, 2017, which information is incorporated herein by reference.
92
ITEM 14 | PRINCIPAL ACCOUNTING FEES AND SERVICES |
Information regarding our Principal Accounting Fees and Services is set forth under the caption Fees Paid to Independent Registered Public Accountants in the Proxy Statement for the Annual Meeting of Shareholders to be held May 25, 2017, which information is incorporated herein by reference.
PART IV |
ITEM 15 | EXHIBITS AND FINANCIAL STATEMENT SCHEDULES |
(a) | (1) and (2) The list of financial statements and Financial Statement Schedules required by this item is included in the Index on page 3 under Financial Statements and Supplementary Data. All other schedules specified under Regulation S-X have been omitted because they are not applicable, because they are not required or because the information required is included in the financial statements or notes thereto. |
(3) Exhibits | |
Certain instruments defining the rights of holders of long-term debt securities of the Company are omitted pursuant to Item 601(b)(4)(iii) of Regulation S-K, and the Company hereby undertakes to furnish to the SEC, upon request, copies of any such instruments. | |
Exhibit No. | Description | |
2.1 | Stock Purchase Agreement, dated December 13, 2016, by and among Caleres, Inc., Apollo Investors, LLC, and Apollo Buyer Holding Company, Inc., incorporated herein by reference to Exhibit 2.1 to the Company’s Form 8-K filed December 14, 2016. | |
3.1 | Restated Certificate of Incorporation of Caleres, Inc. (the “Company”) incorporated herein by reference to Exhibit 3.1 to the Company's Form 8-K filed June 1, 2015. | |
3.2 | Bylaws of the Company as amended through May 28, 2015, incorporated herein by reference to Exhibit 3.2 to the Company’s Form 8-K filed June 1, 2015. | |
4.1 | Indenture for the 6.250% Senior Notes due 2023, dated July 27, 2015 among the Company, the subsidiary guarantors set forth therein, and Wells Fargo Bank, National Association, as trustee, as incorporated herein by reference to Exhibit 4.1 to the Company’s Form 8-K dated and filed July 27, 2015. | |
4.2 | Form of 6.250% Senior Notes due 2023 (included in Exhibit 4.1). | |
10.1 | First Amendment to Fourth Amended and Restated Credit Agreement, dated as of July 20, 2015 (the “Credit Agreement”), among the Company, as lead borrower for itself and on behalf of certain of its subsidiaries, and Bank of America, N.A., as lead issuing bank, administrative agent and collateral agent, Wells Fargo Bank, National Association, as an issuing bank, Wells Fargo Bank, National Association, as syndication agent, JPMorgan Chase Bank, N.A. and SunTrust Bank, as co-documentation agents, and the other financial institutions party thereto, as lenders, as incorporated herein by reference to Exhibit 10.1 to the Company’s Form 8-K dated and filed July 20, 2015. | |
10.1a | Second Amendment to Fourth Amended and Restated Credit Agreement, dated August 17, 2016, among the Company, as lead borrower for itself and on behalf of certain of its subsidiaries, and the financial institutions party thereto, incorporated herein by reference to Exhibit 10.1 to the Company’s Form 10-Q for the quarterly period ended July 30, 2016. | |
10.2a* | Caleres, Inc. Incentive and Stock Compensation Plan of 2002, as Amended and Restated as of May 22, 2008, incorporated herein by reference to Exhibit A to the Company’s definitive proxy statement dated and filed April 11, 2008. | |
10.2b(1)* | Form of Incentive Stock Option Award Agreement (for grants commencing May 2008) under the Company's Incentive and Stock Compensation Plan of 2002, incorporated herein by reference to Exhibit 10.5b(1) to the Company’s Form 10-K for the year ended January 31, 2009, and filed March 31, 2009. | |
10.2b(2)* | Form of Incentive Stock Option Award Agreement (for grants prior to May 2008) under the Company's Incentive and Stock Compensation Plan of 2002, incorporated herein by reference to Exhibit 10.4 to the Company’s Form 10-Q for the quarter ended July 31, 2004, and filed September 8, 2004. | |
10.2c(1)* | Form of Non-Qualified Stock Option Award Agreement (for grants commencing May 2008) under the Company's Incentive and Stock Compensation Plan of 2002, incorporated herein by reference to Exhibit 10.5c(1) to the Company’s Form 10-K for the year ended January 31, 2009, and filed March 31, 2009. | |
10.2c(2)* | Form of Non-Qualified Stock Option Award Agreement (for grants prior to May 2008) under the Company's Incentive and Stock Compensation Plan of 2002, incorporated herein by reference to Exhibit 10.3 to the Company’s Form 10-Q for the quarter ended July 31, 2004, and filed September 8, 2004. | |
93
10.2d* | Form of Restricted Stock Agreement (for employee grants commencing 2008) under the Company's Incentive and Stock Compensation Plan of 2002, incorporated herein by reference to Exhibit 10.5d(1) to the Company’s Form 10-K for the year ended January 31, 2009, and filed March 31, 2009. | |
10.2e* | Form of Restricted Stock Award Agreement for non-employee director awards (for grants commencing May 2015) under the Company's Incentive and Stock Compensation Plan of 2011, incorporated herein by reference to Exhibit 10.2e to the Company’s Form 10-K for the year ended January 30, 2016, and filed March 29, 2016. | |
10.2f* | Form of Restricted Stock Award Agreement (for employee grants commencing March 2016) under the Company's Incentive and Stock Compensation Plan of 2011, incorporated herein by reference to Exhibit 10.2f to the Company’s Form 10-K for the year ended January 30, 2016, and filed March 29, 2016. | |
† | 10.2g* | Form of Restricted Stock Award Agreement (for employee grants commencing December 2016 and March 2017) under the Company's Incentive and Stock Compensation Plan of 2011, filed herewith. |
10.3a* | Caleres, Inc. Incentive and Stock Compensation Plan of 2011,as amended and restated effective May 28, 2015, incorporated by reference to Exhibit 10.1 to the Company's Form 10-Q for the quarter ended May 2, 2015, and filed June 10, 2015. | |
10.3(b)(1)* | Form of Performance Award Agreement (for 2013-2015 performance period) under the Company's Incentive and Stock Compensation Plan of 2011, incorporated herein by reference to Exhibit 10.3(b)(3) to the Company’s Form 10-K for the year ended February 2, 2013, and filed April 2, 2013. | |
10.3(b)(2)* | Form of Performance Award Agreement (for 2014-2016 performance period) under the Company's Incentive and Stock Compensation Plan of 2011, incorporated herein by reference to Exhibit 10.3(b)(4) to the Company's Form 10-K for the year ended February 1, 2014, and filed April 1, 2014. | |
10.3(b)(3)* | Form of Performance Award Agreement (for 2015-2017 performance period) under the Company's Incentive and Stock Compensation Plan of 2011, incorporated herein by reference to Exhibit 10.3(b)(4) to the Company's Form 10-K for the year ended January 31, 2015, and filed March 31, 2015. | |
10.3(b)(4)* | Form of Performance Award Agreement (for 2016-2018 performance period) under the Company's Incentive and Stock Compensation Plan of 2011, incorporated herein by reference to Exhibit 10.3(b)(5) to the Company’s Form 10-K for the year ended January 30, 2016, and filed March 29, 2016. | |
† | 10.3(b)(5)* | Form of Performance Award Agreement (for 2017-2019 performance period) under the Company's Incentive and Stock Compensation Plan of 2011, filed herewith. |
10.4a* | Form of Non-Employee Director Restricted Stock Unit Agreement between the Company and its Non-Employee Directors (for grants commencing in 2015), incorporated herein by reference to Exhibit 10.4a to the Company’s Form 10-K for the year ended January 30, 2016, and filed March 29, 2016. | |
10.5* | Caleres, Inc. Deferred Compensation Plan for Non-Employee Directors, as amended and restated as of May 28, 2015, incorporated herein by reference to Exhibit 10.2 to the Company’s Form 10-Q for the quarter ended May 2, 2015, and filed June 10, 2015. | |
10.6* | Caleres, Inc. Supplemental Executive Retirement Plan (SERP), as amended and restated as of May 28, 2015, incorporated herein by reference to Exhibit 10.3 to the Company’s Form 10-Q for the quarter ended May 2, 2015, and filed June 10, 2015. | |
10.7* | Caleres, Inc. Deferred Compensation Plan, as amended and restated as of May 28, 2015, incorporated herein by reference to Exhibit 10.4 to the Company’s Form 10-Q for the quarter ended May 2, 2015, and filed June 10, 2015. | |
10.8* | Caleres, Inc. Non-Employee Director Share Plan (2009), incorporated herein by reference to Exhibit 10.5 to the Company’s Form 10-Q for the quarter ended May 2, 2015, and filed June 10, 2015. | |
10.9* | Severance Agreement, effective April 1, 2006, between the Company and Richard M. Ausick, incorporated herein by reference to Exhibit 10.4 to the Company’s Form 10-Q for the quarter ended July 31, 2010, and filed September 7, 2010. | |
10.10* | Severance Agreement, effective April 1, 2006, between the Company and Diane M. Sullivan, incorporated herein by reference to Exhibit 10.5 to the Company’s Form 8-K dated and filed April 6, 2006. | |
10.11* | Severance Agreement, effective April 1, 2006, between the Company and Douglas W. Koch, incorporated herein by reference to Exhibit 10.12 to the Company’s Form 10-K for the year ended February 2, 2013 and filed April 2, 2013. | |
10.12* | Severance Agreement, dated March 24, 2009 and effective as of April 1, 2009, between the Company and Daniel R. Friedman, incorporated herein by reference to Exhibit 10.12 to the Company's Form 10-K for the year ended January 31, 2015 and filed March 31, 2015. | |
10.13* | Form of Amendment letter dated December 18, 2009, to the Severance Agreements between the Company and each of: Richard M. Ausick, Daniel R. Friedman, Douglas W. Koch and Diane M. Sullivan, as incorporated herein by reference to Exhibit 10.6 to the Company’s Form 10-Q for the quarter ended July 31, 2010, and filed September 7, 2010. | |
10.14* | Severance Agreement, effective February 16, 2015, between the Company and Kenneth H. Hannah, incorporated herein by reference to Exhibit 10.1 to the Company’s Form 8-K dated and filed February 6, 2015. | |
† | 21 | Subsidiaries of the registrant. |
† | 23 | Consent of Registered Public Accounting Firm. |
† | 24 | Power of attorney (contained on signature page). |
94
† | 31.1 | Certification of the Chief Executive Officer pursuant to Section 302 of the Sarbanes-Oxley Act of 2002. |
† | 31.2 | Certification of the Chief Financial Officer pursuant to Section 302 of the Sarbanes-Oxley Act of 2002. |
† | 32.1 | Certification of the Chief Executive and Chief Financial Officer pursuant to Section 906 of the Sarbanes-Oxley Act of 2002. |
† | 101.INS | XBRL Instance Document |
† | 101.SCH | XBRL Taxonomy Extension Schema Document |
† | 101.CAL | XBRL Taxonomy Extension Calculation Linkbase Document |
† | 101.LAB | XBRL Taxonomy Extension Label Linkbase Document |
† | 101.PRE | XBRL Taxonomy Presentation Linkbase Document |
† | 101.DEF | XBRL Taxonomy Definition Linkbase Document |
(b) | Exhibits: |
See Item 15(a)(3) above. On request, copies of any exhibit will be furnished to shareholders upon payment of the Company’s reasonable expenses incurred in furnishing such exhibits. | |
(c) | Financial Statement Schedules: |
See Item 8 above. | |
* Denotes management contract or compensatory plan arrangements.
† Denotes exhibit is filed with this Form 10-K.
ITEM 16 | FORM 10-K SUMMARY | |||
None.
95
SIGNATURES |
Pursuant to the requirements of Section 13 or 15(d) of the Securities Exchange Act of 1934, the registrant has duly caused this report to be signed on its behalf by the undersigned, thereunto duly authorized.
CALERES, INC. | |
By: | /s/ Kenneth H. Hannah |
Kenneth H. Hannah | |
Senior Vice President and Chief Financial Officer | |
Date: March 28, 2017
Know all men by these presents, that each person whose signature appears below constitutes and appoints Diane M. Sullivan and Kenneth H. Hannah his or her true and lawful attorney-in-fact and agent, with full power of substitution and resubstitution, for him or her and in his or her name, place and stead, in any and all capacities, to sign any and all amendments to this Annual Report on Form 10-K, and to file the same, with all exhibits thereto, and other documents in connection therewith, with the Securities and Exchange Commission, granting unto said attorney-in-fact and agent, full power and authority to do and perform each and every act and thing requisite and necessary to be done, as fully to all intents and purposes as he or she might or could do in person, hereby ratifying and confirming all that said attorney-in-fact and agent or his substitute or substitutes may lawfully do or cause to be done by virtue hereof.
Pursuant to the requirements of the Securities Exchange Act of 1934, this report has been signed below by the following persons on behalf of the registrant, on the dates and in the capacities indicated.
96
Signatures | Date | Title | ||
/s/ Diane M. Sullivan | ||||
Diane M. Sullivan | March 28, 2017 | Chief Executive Officer, President and Chairman of the Board of Directors (Principal Executive Officer) | ||
/s/ Kenneth H. Hannah | ||||
Kenneth H. Hannah | March 28, 2017 | Senior Vice President and Chief Financial Officer (Principal Financial Officer and Principal Accounting Officer) | ||
/s/ W. Lee Capps | ||||
W. Lee Capps | March 21, 2017 | Director | ||
/s/ Lori H. Greeley | ||||
Lori H. Greeley | March 21, 2017 | Director | ||
/s/ Mahendra R. Gupta | ||||
Mahendra R. Gupta | March 21, 2017 | Director | ||
/s/ Carla C. Hendra | ||||
Carla C. Hendra | March 21, 2017 | Director | ||
/s/ Ward M. Klein | ||||
Ward M. Klein | March 21, 2017 | Director | ||
/s/ Steven W. Korn | ||||
Steven W. Korn | March 21, 2017 | Director | ||
/s/ Patricia G. McGinnis | ||||
Patricia G. McGinnis | March 21, 2017 | Director | ||
/s/ W. Patrick McGinnis | ||||
W. Patrick McGinnis | March 21, 2017 | Director | ||
97