Attached files
| file | filename |
|---|---|
| EX-23 - EXHIBIT 23 - CALERES INC | bws10k2010ex23.htm |
| EX-21 - EXHIBIT 21 - CALERES INC | bws10k2010ex21.htm |
| EX-32.1 - EXHIBIT 32.1 - CALERES INC | bws10k2010ex32_1.htm |
| EX-31.1 - EXHIBIT 31.1 - CALERES INC | bws10k2010ex31_1.htm |
| EX-4.1D - EXHIBIT 4.1D - CALERES INC | bws10k2010ex4_1d.htm |
| EX-31.2 - EXHIBIT 31.2 - CALERES INC | bws10k2010ex31_2.htm |
|
BROWN SHOE COMPANY, INC.
|
2010 FORM 10-K
|
UNITED STATES SECURITIES AND EXCHANGE COMMISSION
Washington, D.C. 20549
FORM 10-K
(Mark One)
|
R
|
ANNUAL REPORT PURSUANT TO SECTION 13 OR 15(d) OF THE SECURITIES EXCHANGE ACT OF 1934
|
|
For the fiscal year ended January 29, 2011
|
|
|
OR
|
|
|
£
|
TRANSITION REPORT PURSUANT TO SECTION 13 OR 15(d) OF THE SECURITIES EXCHANGE ACT OF 1934
|
|
For the transition period from ____________ to ______________
|
Commission file number 1-2191
BROWN SHOE COMPANY, INC.
(Exact name of registrant as specified in its charter)
|
New York
|
43-0197190
|
|
(State or other jurisdiction of incorporation or organization)
|
(IRS Employer Identification Number)
|
|
8300 Maryland Avenue
|
63105
|
|
St. Louis, Missouri
|
(Zip Code)
|
|
(Address of principal executive offices)
|
(314) 854-4000
(Registrant’s telephone number, including area code)
Securities Registered Pursuant to Section 12(b) of the Act:
|
Title of each class
|
Name of each exchange on which registered
|
|
Common Stock — par value $0.01 per share
|
New York Stock Exchange
|
|
Chicago Stock Exchange
|
Securities Registered Pursuant to Section 12(g) of the Act: None
Indicate by check mark if the registrant is a well-known seasoned issuer, as defined in Rule 405 of the Securities Act. Yes R No £
Indicate by check mark if the registrant is not required to file reports pursuant to Section 13 or Section 15(d) of the Act. Yes £ No R
Indicate by check mark whether the registrant: (1) has filed all reports required to be filed by Section 13 or 15(d) of the Securities Exchange Act of 1934 during the preceding 12 months (or for such shorter period that the registrant was required to file such reports), and (2) has been subject to such filing requirements for the past 90 days. Yes R No £
Indicate by check mark whether the registrant has submitted electronically and posted on its corporate Web site, if any, every Interactive Data File required to be submitted and posted pursuant to Rule 405 of Regulation S-T (§ 232.405 of this chapter) during the preceding 12 months (or for such shorter period that the registrant was required to submit and post such files). Yes £ No £
Indicate by checkmark if disclosure of delinquent filers pursuant to Item 405 of Regulation S-K is not contained herein, and will not be contained, to the best of registrant’s knowledge, in definitive proxy or information statements incorporated by reference in Part III of this Form 10-K or any amendment to this Form 10-K. R
Indicate by checkmark whether the registrant is a large accelerated filer, an accelerated filer, a non-accelerated filer, or a smaller reporting company. See the definitions of “large accelerated filer,” “accelerated filer” and “smaller reporting company” in Rule 12b-2 of the Exchange Act:
| Large accelerated filer £ | Accelerated filer R | Non-accelerated filer £ | Smaller reporting company £ |
| (Do not check if a smaller reporting company) |
Indicate by check mark whether the registrant is a shell company (as defined in Rule 12b-2 of the Act). Yes £ No R
The aggregate market value of the stock held by non-affiliates of the registrant as of July 30, 2010, the last business day of the registrant’s most recently completed second fiscal quarter, was approximately $641.3 million.
As of February 26, 2011, 43,924,340 common shares were outstanding.
Documents Incorporated by Reference
Portions of the Proxy Statement for the Annual Meeting of Shareholders to be held May 26, 2011, are incorporated by reference into Part III.
1
|
BROWN SHOE COMPANY, INC.
|
2010 FORM 10-K
|
INTRODUCTION
This Annual Report on Form 10-K is a document that U.S. public companies file with the Securities and Exchange Commission every year. Part II of the Form 10-K contains the business information and financial statements that many companies include in the financial sections of their annual reports. The other sections of this Form 10-K include further information about our business that we believe will be of interest to investors. We hope investors will find it useful to have all of this information in a single document.
The SEC allows us to report information in the Form 10-K by “incorporating by reference” from another part of the Form 10-K or from the proxy statement. You will see that information is “incorporated by reference” in various parts of our Form 10-K. The proxy statement will be available on our website after it is filed with the SEC in April 2011.
Unless the context otherwise requires, “we,” “us,” “our,” “the Company” or “Brown Shoe” refers to Brown Shoe Company, Inc. and its subsidiaries.
Information in this Form 10-K is current as of April 1, 2011, unless otherwise specified.
CAUTION REGARDING FORWARD-LOOKING STATEMENTS
In this report, and from time to time throughout the year, we share our expectations for our company’s future performance. These forward-looking statements include statements about our business plans; the potential development, regulatory approval and public acceptance of our products; our expected financial performance, including sales performance, and the anticipated effect of our strategic actions; the anticipated benefits of recent acquisitions; the outcome of contingencies, such as litigation; domestic or international economic, political and market conditions; and other factors that could affect our future results of operations or financial position, including, without limitation, statements under the captions “Business,” “Legal Proceedings” and “Management’s Discussion and Analysis of Financial Condition and Results of Operations.” Any statements we make that are not matters of current reportage or historical fact should be considered forward-looking. Such statements often include words such as “believe,” “expect,” “anticipate,” “intend,” “plan,” “estimate,” “will” and similar expressions. By their nature, these types of statements are uncertain and are not guarantees of our future performance.
Our forward-looking statements represent our estimates and expectations at the time that we make them. However, circumstances change constantly, often unpredictably, and investors should not place undue reliance on these statements. Many events beyond our control will determine whether our expectations will be realized. We disclaim any current intention or obligation to revise or update any forward-looking statements, or the factors that may affect their realization, whether in light of new information, future events or otherwise, and investors should not rely on us to do so. In the interests of our investors, and in accordance with the “safe harbor” provisions of the Private Securities Litigation Reform Act of 1995, Part I. Item 1A. Risk Factors below explains some of the important reasons that actual results may be materially different from those that we anticipate.
2
|
BROWN SHOE COMPANY, INC.
|
2010 FORM 10-K
|
|
INDEX
|
|
PART I
|
Page
|
|
|
Item 1
|
4
|
|
|
Item 1A
|
14
|
|
|
Item 1B
|
20
|
|
|
Item 2
|
20
|
|
|
Item 3
|
20
|
|
|
Item 4
|
21
|
|
|
PART II
|
||
|
Item 5
|
21
|
|
|
Item 6
|
23
|
|
|
Item 7
|
24
|
|
|
Item 7A
|
44
|
|
|
Item 8
|
44
|
|
|
44
|
||
|
45
|
||
|
46
|
||
|
47
|
||
|
48
|
||
|
49
|
||
|
50
|
||
|
51
|
||
|
89
|
||
|
Item 9
|
89
|
|
|
Item 9A
|
90
|
|
|
90
|
||
|
90
|
||
|
90
|
||
|
Item 9B
|
90
|
|
|
PART III
|
||
|
Item 10
|
91
|
|
|
Item 11
|
91
|
|
|
Item 12
|
92
|
|
|
Item 13
|
92
|
|
|
Item 14
|
92
|
|
|
PART IV
|
||
|
Item 15
|
93
|
3
|
BROWN SHOE COMPANY, INC.
|
2010 FORM 10-K
|
|
PART I
|
|
BUSINESS
|
Brown Shoe Company, Inc., founded in 1878 and incorporated in 1913, operates in the footwear industry. Current activities include the operation of retail shoe stores and e-commerce websites as well as the sourcing and marketing of footwear for women, men and children. Our business is seasonal in nature due to consumer spending patterns, with higher back-to-school and Christmas and Easter holiday season sales. Traditionally, the third fiscal quarter accounts for a substantial portion of our earnings for the year.
During 2010, categories of our consolidated net sales were approximately 62% women’s footwear, 23% men’s footwear, 11% children’s footwear and 4% accessories. This composition has remained relatively constant over the past few years. Approximately 70% of 2010 footwear sales represented retail sales, including sales through our e-commerce websites, compared to 72% in 2009 and 69% in 2008, and the remaining 30%, 28% and 31% in the respective years represented wholesale sales. See Note 8 to the consolidated financial statements for additional information regarding our business segments and financial information by geographic area.
We had approximately 13,400 full-time and part-time employees as of January 29, 2011. In the United States, there are no employees employed subject to union contracts. In Canada, we employ approximately 20 warehousing employees under a union contract, which expires in October 2013.
|
RETAIL OPERATIONS
|
Our retail operations at January 29, 2011, included 1,369 retail shoe stores in the United States, Canada, China and Guam. The number of our retail footwear stores at the end of each of the last three fiscal years was as follows:
|
2010
|
2009
|
2008
|
||
|
Famous Footwear
|
||||
|
Family footwear stores that feature a wide selection of brand-name, value-priced footwear; located in shopping centers, outlet malls and regional malls in the United States and Guam; primarily includes stores operated under the Famous Footwear, Famous Footwear Outlet, Factory Brand Shoes and Mind Body Sole names
|
1,110
|
1,129
|
1,138
|
|
|
Specialty Retail
|
||||
|
Stores selling women’s footwear, primarily Naturalizer, located mostly in regional malls, shopping centers, outlet malls and premier street locations in the United States, Canada and China (through our majority-owned subsidiary, B&H Footwear Company Limited); includes stores operated under the Naturalizer, Brown Shoe Closet, F.X. LaSalle, Via Spiga and Sam Edelman names
|
259
|
282
|
306
|
|
|
Total
|
1,369
|
1,411
|
1,444
|
With many companies operating retail shoe stores and departments, we compete in a highly fragmented market. Competitors include local, regional and national shoe store chains, department stores, discount stores, mass merchandisers, numerous independent retail operators of various sizes and internet retailers. Quality of products and services, store location, trend-right merchandise selection and availability of brands, pricing, advertising and customer service are all factors that impact retail competition.
Famous Footwear
Famous Footwear, with 1,110 stores at the end of 2010 and net sales of $1.5 billion in 2010, is one of America’s leading family branded footwear retailers selling value-priced footwear for the entire family, based on the number of stores it operates and sales volume compiled by the Company from published information of its direct competitors. Its target customers are women who buy brand-name fashionable shoes at value prices for themselves and their families. In addition to our retail footwear stores, we operate a FamousFootwear.com website as a Famous Footwear internet retailing store.
Famous Footwear stores feature a wide selection of value-priced brand-name, athletic, casual and dress shoes for the entire family. Brands carried include, among others, Nike, Skechers, New Balance, Puma, Converse, DC, adidas, Asics, LifeStride, Naturalizer, Vans, Dr. Scholl’s, Rocket Dog, Reebok, Bearpaw, Dockers, Hot Kiss, Connie and Madden Girl. We work closely with our vendors to provide our customers with fresh product and, in some cases, product exclusively designed for and available only in our stores. Retail price points typically range from $20 for shoes up to $130 for boots and health and wellness products.
Famous Footwear sells various Company-owned and licensed products. Such products are sold to Famous Footwear by our Wholesale Operations segment at a profit and represent approximately 15% of Famous Footwear net sales of footwear.
4
|
BROWN SHOE COMPANY, INC.
|
2010 FORM 10-K
|
Famous Footwear stores are located in strip shopping centers, as well as outlet and regional malls in all 50 states and Guam. The breakdown by venue is as follows at the end of each of the last three fiscal years:
|
2010
|
2009
|
2008
|
|
|
Strip centers
|
762
|
778
|
759
|
|
Outlet malls
|
174
|
181
|
197
|
|
Regional malls
|
174
|
170
|
182
|
|
Total
|
1,110
|
1,129
|
1,138
|
The stores open at the end of 2010 and 2009 averaged approximately 7,000 square feet. Total square footage at the end of 2010 decreased 2.4% to 7.7 million square feet compared to 7.9 million at the end of 2009. We currently intend to open approximately 45 new stores and close approximately 40 stores in 2011. New stores typically experience an initial start-up period characterized by lower sales and operating earnings than what is generally achieved by more mature stores or the division as a whole. While the duration of this start-up period may vary by type of store, economic environment and geographic location, new stores typically reach a normal level of profitability within approximately four years.
Sales per square foot were $187 in 2010, which was up from $167 in 2009. Same-store sales improved 10.5% during 2010. Same-store sales changes are calculated by comparing the sales in stores that have been open at least 13 months.
Famous Footwear relies on merchandise allocation systems and processes that utilize allocation criteria, customer segmentation and inventory data in an effort to ensure stores are adequately stocked with products and to differentiate the needs of each store based on location, customer segmentation and other factors. Famous Footwear’s distribution systems allow for merchandise to be delivered to each store weekly or on a more frequent basis. Famous Footwear also utilizes third-party-owned regional pooled distribution sites across the country. We operate three leased distribution centers located in Sun Prairie, Wisconsin; Lebanon, Tennessee; and Bakersfield, California, for our retail operations. Famous Footwear’s in-store point-of-sale systems provide detailed sales transaction data to the corporate offices in St. Louis, Missouri, for daily update and analysis of the perpetual inventory and merchandise allocation systems. These systems also are used for training employees and communicating between the stores and the main office.
Famous Footwear’s marketing programs include print, national television, radio, in-store advertisements, viral and digital marketing and social networking, all of which are designed to further develop and reinforce the Famous Footwear concept and strengthen our connection with consumers. Most marketing and advertising programs are tailored on a region-by-region basis to reach target customers. We execute certain advertising campaigns to correspond to regional differences such as the important back-to-school season, which begins at various times throughout the country. The key to our successful campaigns is highlighting key categories when most appropriate and tailoring the timing of such messaging to adapt to seasonal shopping patterns. In 2010, we spent approximately $58.0 million to advertise and market Famous Footwear to our target customer and her family, a portion of which is recovered from suppliers. In addition, Famous Footwear has a robust customer loyalty program (“Rewards”), which informs and rewards frequent customers with product previews, earned incentives based upon purchase continuity, and other periodic promotional offers. In 2010, more than half of our Famous Footwear net sales were generated by our Rewards members. Additionally, continued intense focus on social media throughout 2010 is building a stronger connection with our customers, allowing us to both listen to and communicate with our core market. We will continue to seek to expand ways for customers to connect to Famous Footwear (beyond email, Facebook, Twitter, YouTube and proprietary mobile applications) to drive our fans from the digital world into profitable and loyal customers in our multi-channel selling environments.
Specialty Retail
Our Specialty Retail segment, composed of 259 stores as of January 29, 2011, includes the following retail concepts and our Shoes.com and other e-commerce businesses, with the exception of FamousFootwear.com, which is included in the Famous Footwear segment.
Naturalizer
The Naturalizer retail stores are complementary to and a showcase for our Naturalizer brand of women’s shoes. These stores are designed and merchandised to appeal to the Naturalizer customer, who is style- and comfort-conscious and who seeks quality and value in her footwear selections. The Naturalizer stores offer a selection of women’s footwear styles, including casual, dress, boots and sandals, primarily under the Naturalizer brand. Retail price points typically range from $59 for shoes to $169 for boots.
At the end of 2010, we operated 110 Naturalizer stores in the United States and 105 Naturalizer stores in Canada. Of the total 215 stores, approximately 64% are located in regional malls, with a few stores having street locations, and average approximately 1,200 square feet in size. The other 36% of stores are located in outlet malls and average approximately 2,400 square feet in size. Total square footage at the end of 2010 was 354,000 compared to 390,000 in 2009. In 2010, we closed 29 Naturalizer stores and opened six stores in the United States and Canada, primarily in regional malls. We currently plan to open 12 Naturalizer stores and close 21 stores in 2011.
5
|
BROWN SHOE COMPANY, INC.
|
2010 FORM 10-K
|
At the end of 2010, through our majority-owned subsidiary, B&H Footwear Company Limited (“B&H Footwear”), we also operated 15 stores in several of China’s largest cities. We currently plan to open eight stores in China in 2011. In addition, our joint venture partner, Hongguo International Holdings Limited (“Hongguo”), operated 45 stores at the end of 2010 and plans to open approximately 20 stores in 2011. Naturalizer footwear is distributed through these stores operated by B&H Footwear and Hongguo. See Note 17 to the consolidated financial statements for additional information about B&H Footwear.
Marketing programs for the Naturalizer stores have complemented our Naturalizer brand advertising, building on the brand’s consumer recognition and value proposition, and reinforcing the brand’s focus on effortless style, comfort and quality. Naturalizer utilizes a database-marketing program, which targets frequent customers through catalogs and other mailings that display the brand’s product offerings. Customers can purchase the products in these catalogs from our stores, via the internet at Naturalizer.com and Naturalizer.ca, or by telephone through our Consumer Services call center.
E-Commerce/Direct-To-Consumer
We own Shoes.com, Inc., a pure-play internet retailing company. Shoes.com offers a diverse selection of footwear and accessories to women, men and children that includes footwear purchased from outside suppliers, Company-branded and licensed footwear, and certain merchandise sold in Famous Footwear stores.
In connection with our multi-channel approach to reach consumers, we also operate FamousFootwear.com, Naturalizer.com, Naturalizer.ca and ViaSpiga.com, which offer substantially the same product selection to consumers as sold in their respective retail stores. Additional websites such as ShoeSteal.com, DrSchollsShoes.com, SamEdelman.com, CarlosShoes.com, LifeStride.com, FergieShoes.com and FrancoSarto.com function as retail outlets for the online consumer and serve as additional brand-building vehicles for the Company.
References to our website addresses do not constitute incorporation by reference of the information contained on the websites, and the information contained on the websites is not part of this report.
Other Store Concepts
Our Specialty Retail segment also includes other store concepts that sell other premium brands. These include retail stores operated under the Brown Shoe Closet, F.X. LaSalle, Via Spiga and Sam Edelman names.
At the end of 2010, we operated 15 Brown Shoe Closet retail stores located in United States outlet malls, averaging approximately 2,100 square feet. These multi-branded outlet stores primarily carry Brown Shoe brands, including Etienne Aigner, Franco Sarto, Dr. Scholl’s, Carlos by Carlos Santana, Fergie and Nickels, with price points typically ranging from $49 to $89 for shoes and up to $179 for boots. We currently plan to close three stores in 2011.
At the end of 2010, we operated 12 F.X. LaSalle retail stores, primarily in the Montreal, Canada, market, that sell better-grade women’s and men’s branded and private-label footwear. Canadian dollar retail price points for this footwear typically range from $110 to $250 per pair. These stores average approximately 2,300 square feet. We plan to close one F.X. LaSalle store in 2011.
At the end of 2010, we operated one Via Spiga concept store and one Sam Edelman concept store. The Via Spiga concept store is located in Manhattan’s SoHo neighborhood in New York City. The store sells primarily Via Spiga product, including women’s footwear and accessories and men’s footwear with footwear price points typically ranging from $175 for shoes to $425 for boots. The Sam Edelman concept store is located in an upscale Palm Beach, Florida, shopping center, exclusively sells Sam Edelman styles with footwear price points typically ranging from $100 to $250 per pair and is intended to be a short-term location. We currently plan to open two Sam Edelman stores and close the Palm Beach, Florida, store in 2011.
6
|
BROWN SHOE COMPANY, INC.
|
2010 FORM 10-K
|
|
WHOLESALE OPERATIONS
|
Our Wholesale Operations segment designs, sources and markets branded and nonbranded casual, dress and athletic footwear for women, men and children at a variety of price points. Certain of our branded footwear products are developed pursuant to licensing agreements. Our footwear is distributed to over 2,000 retailers, including national chains, department stores, mass merchandisers, independent retailers, catalogs and online retailers throughout the United States and Canada as well as approximately 50 other countries (including intersegment sales). The most significant wholesale customers include many of the nation’s largest retailers, including national chains such as TJX Corporation (including TJ Maxx and Marshalls), Retail Ventures (including DSW), Ross Stores and Kohl’s; department stores such as Macy’s, Nordstrom, Dillard’s, Bon-Ton and Belk; and mass merchandisers such as Walmart, Collective Brands, Inc. (including Payless ShoeSource), Target and Sears. The loss of any one or more of our significant customers could have a material adverse effect on our Wholesale Operations as well as the consolidated Company. We also sell product to a variety of international retail customers and distributors. The vast majority of our wholesale customers also sell shoes purchased from competing footwear suppliers. Those competing footwear suppliers own and license brands, many of which are well-known and marketed aggressively. Many retailers, who are our wholesale customers, are increasing the amount of products that carry private brand names that they source directly from factories or through agents. In 2010, our Wholesale Operations segment sold its customers approximately 61 million pairs of shoes.
Our sales force solicits wholesale orders for shoes and is generally responsible for managing our relationships with wholesale customers. We generally accept orders as a result of these sales efforts before the shoes are sourced, with delivery generally within three to four months thereafter. We sell footwear to wholesale customers on both a landed and first-cost basis. Landed sales are those in which we obtain title to the footwear from our overseas suppliers and maintain title until the footwear clears United States customs and is shipped to our wholesale customers. Landed sales generally carry a higher margin rate than first-cost sales as a result of the brand equity associated with the product along with the additional customs, warehousing and logistics services provided to customers and the risks associated with inventory ownership. First-cost sales are those in which we obtain title to footwear from our overseas suppliers and typically relinquish title to customers at a designated overseas port. Many of these customers then import this product into the United States. We carry inventories of certain high-volume styles, particularly in the Naturalizer, LifeStride, Franco Sarto, Dr. Scholl’s, Sam Edelman, Via Spiga, Carlos by Carlos Santana, Etienne Aigner and Vera Wang Lavender lines, to allow prompt shipment on reorders.
Marketing
We continue to build on the heritage and recognition of our wholesale brands to create differentiation and consumer loyalty. Marketing teams are responsible for the development and implementation of marketing programs for each brand, both for us and for our retail partners. In 2010, we spent approximately $27 million in advertising and marketing support, including cooperative advertising, in-store promotions and events, in-store displays and fixtures, consumer print advertising, direct mail, public relations and internet advertising with our wholesale customers. The marketing teams are also responsible for driving the development of branding and content for our brand websites. We continually focus on enhancing the effectiveness of these marketing efforts through market research, product development and marketing communications that collectively address the ever-changing lives and needs of our consumers. In 2010, the marketing teams were instrumental in the development and execution of new product launches, including target consumer identification, branding, positioning and marketing to both the consumer and trade audiences. We intend to continue the growth of our social media presence, especially with our largest wholesale brands (Naturalizer and Dr. Scholl’s). We believe increasing our focus on social media will help drive us into the next generation of marketing, allowing us to connect even more intimately with consumers.
Portfolio of Brands
Our Wholesale Operations segment offers retailers a portfolio of leading fashion brands, each targeted to a specific customer segment within the marketplace. Our brands are differentiated by style point of view, design level, material costs and quality, consumer-focused marketing and price points. Products sold under license agreements accounted for Wholesale Operations’ sales of approximately 44% in 2010, 48% in 2009 and 49% in 2008.
Naturalizer: Introduced in 1927, Naturalizer has become a global family of comfort lifestyle footwear brands meeting the needs of women across the marketplace with uncompromising comfort, fit and style. Our flagship Naturalizer brand, offering our exclusive N5 Comfort ElementsTM, is a leading women’s brand sold primarily at department stores, independent retailers, national chains, online retailers and our Naturalizer retail stores. The brand is distributed in 50 countries around the world. Suggested retail price points range from $69 for shoes to $179 for boots. NaturalSoul by Naturalizer, introduced in 2007 to provide women with uncompromising value, is our fastest growing brand sold primarily in national chains, our Naturalizer outlet stores and Famous Footwear retail stores. Suggested retail price points range from $59 for shoes to $99 for boots. Naya, the newest member of the brand family, introduced in March 2010, combines feminine style, premium comfort and materials designed to leave a softer footprint on the Earth. Naya is sold primarily at department stores, independent and online retailers. Suggested retail price points range from $130 for shoes to $285 for boots. Naya is sold in 16 countries around the world.
7
|
BROWN SHOE COMPANY, INC.
|
2010 FORM 10-K
|
Dr. Scholl’s: Dr. Scholl’s is an iconic global comfort brand, delivering unique, proprietary comfort technology and design. This footwear features Dr. Scholl’s insole technology and is primarily distributed through mass merchandisers, national and shoe chains and our Famous Footwear retail stores at suggested retail price points of $20 for sandals to $70 for boots. Dr. Scholl’s holds the No. 8 market share position in the comfort zone within the women’s fashion footwear category across point-of-sale channels at the end of 2010, according to NPD Group. We also sell the Dr. Scholl’s Shoes line of women’s fashion footwear under this license. Dr. Scholl’s Shoes offers hip comfort for the fashion consumer with cool, casual styling and comfort technology. It is sold through national chains, our Famous Footwear and Naturalizer retail stores and department stores at suggested retail prices ranging from $29 for sandals to $79 for boots. We have a long-term license agreement, which is renewable through 2026 for the United States and 2014 for Canada and Latin America, to market the Dr. Scholl’s brand of affordable casual, athletic, work and dress shoes for women, men and children.
Sam Edelman: In 2010, we acquired the remaining interest in Edelman Shoe, Inc. (“Edelman Shoe”), resulting in Edelman Shoe becoming a wholly-owned subsidiary of the Company. Sam’s eponymous brand is designed for women who radiate fashion, style and chic sophistication. Innovative and fresh, his creations exude the energy of luxury shoes without the high-end price tag. The brand is sold primarily through department stores and independent retailers at suggested retail price points ranging from $79 for sandals, flats and heels to $300 for boots. Sam Edelman holds the No. 7 market share position in the bridge/designer zone within the women’s fashion footwear category across point-of-sale channels at the end of 2010, according to NPD Group.
Franco Sarto: The Franco Sarto brand has a loyal, career-focused consumer who is as passionate about the brand’s modern Italian-inspired style, fit and quality as she is about the man behind the design. Franco Sarto’s personal appearances in select retail venues generate lines of consumers anxious to meet the designer himself. Through licensed relationships, Franco Sarto has expanded its offering into other categories including handbags and eyewear. The brand is sold in the better zone of major national chains, department stores and independent retailers at suggested retail price points from $79 for shoes to $250 for boots. Franco Sarto ranked No. 3 in market share position in the better zone within the women’s fashion footwear category across point-of-sale channels at the end of 2010, according to NPD Group. Our license to sell Franco Sarto product is a multi-year agreement that expires in December 2012, with an extension option through December 2019.
LifeStride: A leading entry-level price point women’s brand, LifeStride footwear offers feminine, fashionable styling at value pricing. The brand is sold in department stores, national and shoe chains, and our Famous Footwear retail stores. The LifeStride target consumer seeks great fashion-at-a-price. Suggested retail price points range from $39 for sandals to $89 for boots. LifeStride ranked No. 3 in market share position in the moderate zone within the women’s fashion footwear category across point-of-sale channels at the end of 2010, according to NPD Group.
Buster Brown: Our heritage children’s brand, Buster Brown, was launched in 1904 and is sold primarily through national chains including our Famous Footwear stores. We leverage the strength and recognition of the Buster Brown name by marketing children’s footwear under the Buster Brown & Co. umbrella. This product features numerous popular characters from children’s entertainment companies, including Hasbro, Nickelodeon, Fisher Price, Marvel and Barbie characters. The terms of the license agreements vary. We sell these products to mass merchandisers and national chains including Collective Brands, Inc. (including Payless ShoeSource), Walmart, Target and Sears as well as our Famous Footwear retail stores. The Buster Brown & Co. umbrella provides customers with the assurance that these licensed products contain the quality that they are accustomed to receiving from the Buster Brown brand.
Via Spiga: Via Spiga provides chic, sophisticated footwear for the cosmopolitan woman who wants to make a fashion statement every day. The brand is sold in the bridge/designer zone in premier department stores and upscale boutiques. Via Spiga designs fashion footwear that is true to its Italian heritage with attention to detail and quality. Through licensed relationships, Via Spiga has expanded its offering into other categories including outerwear, men’s footwear, eyewear, handbags, hosiery and belts, growing the brand’s reputation as a true fashion brand. This brand sells at suggested retail price points from $198 for shoes to $398 for boots. The brand holds the No. 5 market share position in the bridge/designer zone within the women’s fashion footwear category across point-of-sale channels at the end of 2010, according to NPD Group.
Etienne Aigner: Etienne Aigner, known for its timeless style and designer heritage, appeals to a target customer who seeks classic footwear styling. It is sold in the better zone of national chains, department stores and our Famous Footwear retail stores at price points ranging from $69 for shoes to $185 for boots. Etienne Aigner holds the No. 12 market share position in the better zone within the women’s fashion footwear category across point-of-sale channels at the end of 2010, according to NPD Group. The Etienne Aigner name is licensed under a multi-year agreement that expires in December 2017, with an extension option through December 2022.
8
|
BROWN SHOE COMPANY, INC.
|
2010 FORM 10-K
|
Carlos by Carlos Santana: In 2001, we launched the Carlos by Carlos Santana collection of women’s footwear to the better zone at major department stores, national chains and our Famous Footwear and Naturalizer retail stores. Marketed under a license agreement with legendary musician Carlos Santana, this brand targets trend-conscious consumers with hot, fashionable shoes inspired by the passion and energy of Santana’s music. Suggested retail price points range from $79 for shoes to $199 for boots. Carlos by Carlos Santana holds the No. 14 market share position in the better zone within the women’s fashion footwear category across point-of-sale channels at the end of 2010, according to NPD Group. Our license to sell Carlos by Carlos Santana product expires in 2011, with an extension option through 2016.
Vera Wang Lavender: Launched in 2009, the Vera Wang Lavender shoe collection includes a complete lifestyle collection aimed at the contemporary customer and includes ballerina flats, espadrilles, sandals, clogs, pumps and boots. The collection interprets Vera’s fun, youthful, whimsical spirit and offers the customer unique product for her contemporary, fashion-savvy lifestyle. The brand is sold in the designer section in premier department stores, and retail prices range from $250 for shoes to $495 for boots. It holds the No. 10 market share position in the bridge/designer zone within the women’s fashion footwear category across point-of-sale channels at the end of 2010, according to NPD Group. Our license to sell Vera Wang Lavender product expires in 2013, with an extension option through 2016.
Fergie/Fergalicious by Fergie: We have created two namesake footwear lines in collaboration with entertainment superstar Fergie (Stacy Ferguson) to fully capture the multifaceted aspects of Fergie’s life as an award-winning singer, songwriter and actress. Fergie footwear portrays the artist’s confident, individual style in a line of sophisticated, sexy footwear with a glam rock influence. The brand launched in spring of 2009 at better department stores, boutiques, independent retailers and online at retail price points of $69 for sandals to $129 for boots. Fergalicious by Fergie shoes have a fun, funky attitude inspired by her pop rock persona. Fergalicious by Fergie also launched in spring 2009 and is available at Famous Footwear, FamousFootwear.com and other national chains at retail price points of $39 for sandals to $79 for boots. Our license to sell Fergie/Fergalicious by Fergie product is a multi-year agreement that expires in 2012, with an extension option through 2014.
Backlog
At January 29, 2011, our Wholesale Operations had a backlog of unfilled orders of approximately $244 million compared to $246 million on January 30, 2010. Most orders are for delivery within the next 90 to 120 days, and although orders are subject to cancellation, we have not experienced significant cancellations in the past. The backlog at any particular time is affected by a number of factors, including seasonality, the continuing trend among customers to reduce the lead time on their orders, capacity shifts in China and, in some cases, the timing of licensed product movie releases. Accordingly, a comparison of backlog from period to period is not necessarily meaningful and may not be indicative of eventual actual shipments or the growth rate of sales from one period to the next. See Management’s Discussion and Analysis of Financial Condition and Results of Operations – Financial Highlights for further discussion on the challenges faced during the second half of 2010 that impacted the timeliness of order fulfillment and related deliveries. Additionally, backlog at January 29, 2011, excludes any impact related to the acquisition of American Sporting Goods Corporation (“ASG”), which closed on February 17, 2011, and is discussed further in the Subsequent Event – Acquisition of American Sporting Goods Corporation section below and Note 2 to the consolidated financial statements.
9
|
BROWN SHOE COMPANY, INC.
|
2010 FORM 10-K
|
Brands and Licensed Products
The following is a listing of our brands and licensed products:
|
Women’s
|
Men’s and Athletic
|
Children’s
|
ASG
|
|
AirStep
|
Big Country
|
Backyardigans(9)
|
AND1
|
|
Carlos by Carlos Santana(1)
|
Dr. Scholl’s(2)
|
Barbie(10)
|
Apex
|
|
Connie
|
Francois Xavier Collection
|
Buster Brown
|
Avia
|
|
Dr. Scholl’s(2)
|
F.X. LaSalle
|
Captain America Movie(11)
|
Nevados
|
|
EA by Etienne Aigner(3)
|
FX
|
Dr. Scholl’s(2)
|
Nice Skate Shoes
|
|
Etienne Aigner(3)
|
Regal
|
Fergalicious by Fergie(5)
|
rykä
|
|
Eurosole
|
Studio Via Spiga
|
Firstkiss(4)
|
Turntec
|
|
Eurostep
|
TX Traction
|
Fisher Price(10)
|
Yukon
|
|
Eurowalker
|
Via Spiga
|
Go Diego Go(12)
|
|
|
Fanfares
|
Zodiac American Original
|
iCarly(12)
|
|
|
Firstkiss(4)
|
Iron Man 2 Movie(11)
|
||
|
Fergie Footwear(5)
|
Marvel classic characters, including:
|
||
|
Fergalicious by Fergie(5)
|
Spider-Man, Wolverine and Hulk(11)
|
||
|
Franco Sarto(6)
|
Spectacular Spider-Man(11)
|
||
|
Francois Xavier Collection
|
The Avengers Movie(11)
|
||
|
F.X. LaSalle
|
Thor Movie(11)
|
||
|
FX
|
Toe Zone(13)
|
||
|
HOTKISS(4)
|
Zodiac American Original
|
||
|
Libby Edelman
|
|||
|
LifeStride
|
|||
|
LS Studio
|
|||
|
Maserati
|
|||
|
Natural Sole
|
|||
|
Natural Soul
|
|||
|
Natural Soul by Naturalizer
|
|||
|
Naturalizer
|
|||
|
Naturalizer Sport
|
|||
|
Natural Sport
|
|||
|
Naya
|
|||
|
Naya by Naturalizer
|
|||
|
Nickels
|
|||
|
Nickels Soft
|
|||
|
Opale
|
|||
|
Dr. Scholl’s Shoes(2)
|
|||
|
Paloma
|
|||
|
Reba(7)
|
|||
|
Sam Edelman
|
|||
|
Samuel
|
|||
|
SE Boutique
|
|||
|
Signature Naturalizer
|
|||
|
Studio Paolo
|
|||
|
TX Traction
|
|||
|
Unity by Carlos Santana(1)
|
|||
|
Vera Wang Lavender(8)
|
|||
|
Via Spiga
|
|||
|
V Via Spiga
|
|||
|
VS
|
|||
|
VS Via Spiga
|
|||
|
Zodiac
|
|||
|
Zodiac American Original
|
|||
As denoted, these brands are used with permission from and, in most cases, are registered trademarks of:
|
(1) Santana Tesoro, LLC
|
(9) Nelvana, Inc.
|
|
|
(2) Schering-Plough Healthcare Products, Inc.
|
(10) Mattel, Inc.
|
|
|
(3) Etienne Aigner, Inc.
|
(11) Marvel Entertainment LLC
|
|
|
(4) HK WORLDWIDE, LLC
|
(12) MTV Networks
|
|
|
(5) Krystal Ball Productions
|
(13) Sole Concepts, Inc.
|
|
|
(6) Fashion Shoe Licensing LLC
|
||
|
(7) RebaWear LLC
|
||
|
(8) Vera Wang Licensing LLC
|
Brands listed under ASG above were acquired with the ASG acquisition on February 17, 2011. See Note 2 to the consolidated financial statements for further information.
All other brands are owned by and, in most cases, are registered trademarks of Brown Shoe Company, Inc. or its consolidated subsidiaries.
10
|
BROWN SHOE COMPANY, INC.
|
2010 FORM 10-K
|
Brown Shoe Sourcing and Product Development Operations
Brown Shoe Sourcing and Product Development Operations source and develop footwear for our Wholesale Operations and Specialty Retail segments and a portion of the footwear sold by our Famous Footwear segment. We have sourcing and product development offices in China, Hong Kong, Italy, Macau, New York City and St. Louis and through an agent partnership in Brazil and Central America.
Sourcing Operations
In 2010, the sourcing operations sourced approximately 64 million pairs of shoes with a global network of third-party independent footwear manufacturers. Our structure enables us to source footwear at various price levels from significant shoe manufacturing regions of the world. The majority of our footwear sourced is provided by approximately 15 manufacturers operating approximately 100 manufacturing facilities. In certain countries, we utilize agents to facilitate and manage the development, production and shipment of product. We attribute our ability to achieve consistent quality, competitive prices and on-time delivery to the breadth of our established relationships. While we do not have any significant contractual commitments with our suppliers, we do enter into sourcing agreements with certain independent sourcing agents.
As discussed further below in Item 7, Management’s Discussion and Analysis of Financial Condition and Results of Operations-Financial Highlights, during the second half of 2010, our wholesale business experienced a continuation of industry-wide sourcing and supply chain issues that led to increased delivery costs and disruption in the timing of deliveries, and order fulfillment was further aggravated by the business process changes, data conversion, and learning curves associated with our systems transition that went live in December 2010. Despite these challenges, and the fact that system transition efforts and alignment of existing business processes are expected to continue into 2011, we are focused on correcting these issues and implementing solutions to minimize their impact in 2011.
We monitor the quality of the components of all of our footwear prior to production and inspect prototypes of every footwear style. We also perform random in-line quality control checks during production and before footwear leaves the manufacturing facility.
In 2010, 98% of the footwear we sourced was from manufacturing facilities in China. The following table provides an overview of our foreign sourcing in 2010:
|
Country
|
Millions of Pairs
|
|
China
|
63.2
|
|
Brazil
|
0.3
|
|
All other
|
0.8
|
|
Total
|
64.3
|
Product Development Operations
In our Dongguan, China, and our Putien, China, offices, we operate a total of four sample-making facilities with unique and diverse capabilities, including footwear for women, men and children, providing speed, control and execution in product development.
We maintain design teams for our brands in St. Louis, Missouri, New York and China as well as other select fashion locations, including Italy. These teams, which include independent designers, are responsible for the creation and development of new product styles. Our designers monitor trends in apparel and footwear fashion and work closely with retailers to identify consumer footwear preferences. Our design teams create collections of footwear and work closely with our product development and sourcing offices to translate our designs into new footwear styles.
See Subsequent Event – Acquisition of American Sporting Goods Corporation section below for further information on the manufacturing, design, development and distribution facilities associated with ASG.
Subsequent Event – Acquisition of American Sporting Goods Corporation
On February 17, 2011, we entered into a Stock Purchase Agreement with American Sporting Goods Corporation (“ASG”) and ASG’s stockholders, pursuant to which one of our subsidiaries acquired all of the outstanding capital stock of ASG from the ASG stockholders on that date. See Note 2 to the consolidated financial statements for further information.
ASG is a designer, manufacturer and marketer of a broad range of athletic footwear with a strong presence in walking, fitness and basketball. It was founded in 1983 and is headquartered in Aliso Viejo, California.
The acquisition adds performance athletic and outdoor footwear brands to our portfolio, including Avia, rykä, AND1, Nevados and Yukon, complementing our existing fitness and comfort offerings.
11
|
BROWN SHOE COMPANY, INC.
|
2010 FORM 10-K
|
Avia, a multisport endurance brand, offers shoes for endurance athletes, fitness enthusiasts and people seeking a healthy lifestyle. The brand is primarily distributed through national and shoe chains, mass merchandisers and our Famous Footwear retail stores at retail price points of $40 to $130.
rykä is a leading women’s performance lifestyle brand focused on fitness. rykä is managed, designed and solely dedicated to creating women’s performance footwear. The brand is distributed through department stores, specialty retailers and our Famous Footwear retail stores at retail price points of $60 to $130.
AND1 is an authentic basketball brand that caters to hard-core basketball players. Its product offerings appeal to youth and those seeking premium gear at affordable value. AND1 offers this “affordable premium” with retail price points from $20 to $80. The brand is primarily distributed through national and shoe chains and our Famous Footwear retail stores.
ASG operates three primary manufacturing facilities in China as well as other facilities in the United States and China used for design, development, distribution and sales and administrative purposes. ASG leases all of these facilities.
|
AVAILABLE INFORMATION
|
Our internet address is www.brownshoe.com. Our internet address is included in this annual report on Form 10-K as an inactive textual reference only. The information contained on our website is not incorporated by reference into this annual report on Form 10-K and should not be considered part of this report. We file annual, quarterly and current reports, proxy statements and other information with the Securities and Exchange Commission (“SEC”). We make available free of charge our annual report on Form 10-K, quarterly reports on Form 10-Q, current reports on Form 8-K and amendments to those reports filed or furnished, as required by Section 13(a) or 15(d) of the Securities Exchange Act of 1934, through our internet website as soon as reasonably practicable after we electronically file such material with or furnish it to the SEC. You may access these SEC filings via the hyperlink to a third-party SEC filings website that we provide on our website.
12
|
BROWN SHOE COMPANY, INC.
|
2010 FORM 10-K
|
|
EXECUTIVE OFFICERS OF THE REGISTRANT
|
The following is a list of the names and ages of the executive officers of the Company and of the offices held by each person. There is no family relationship between any of the named persons. The terms of the following executive officers will expire in May 2011.
|
Name
|
Age
|
Current Position
|
|
Ronald A. Fromm
|
60
|
Chairman of the Board of Directors and Chief Executive Officer
|
|
Diane M. Sullivan
|
55
|
President and Chief Operating Officer
|
|
Richard M. Ausick
|
57
|
Division President – Retail
|
|
Mark D. Lardie
|
50
|
Division President – Wholesale, Heritage Brands
|
|
Daniel R. Friedman
|
50
|
Division President – Global Sourcing & Supply Chain
|
|
John W. Schmidt
|
50
|
Division President – Wholesale, Better & Image Brands
|
|
Douglas W. Koch
|
59
|
Senior Vice President and Chief Talent & Strategy Officer
|
|
Mark E. Hood
|
58
|
Senior Vice President and Chief Financial Officer
|
|
Joseph Caro
|
48
|
Senior Vice President and Chief Information Officer
|
|
Michael I. Oberlander
|
42
|
Senior Vice President, General Counsel and Corporate Secretary
|
The period of service of each officer in the positions listed and other business experience are set forth below.
Ronald A. Fromm, Chairman of the Board of Directors and Chief Executive Officer of the Company since January 2004. Chairman of the Board of Directors, President and Chief Executive Officer of the Company from January 1999 to December 2003. President of the Company’s branded division from April 1998 to January 1999. Executive Vice President, Famous Footwear from September 1992 to March 1998. On January 10, 2011, we announced that, effective May 26, 2011, Mr. Fromm will retire as our Chief Executive Officer but retain the position of Chairman of the Board of Directors of the Company.
Diane M. Sullivan, President and Chief Operating Officer since March 2006. President from January 2004 to March 2006. On January 10, 2011, we announced that, effective May 26, 2011, Ms. Sullivan will assume the position of President and Chief Executive Officer.
Richard M. Ausick, Division President – Retail since January 2011. Division President – Famous Footwear from January 2010 to January 2011. Division President, Brown Shoe Wholesale from July 2006 to January 2010. Senior Vice President and Chief Merchandising Officer of Famous Footwear from January 2002 to July 2006.
Mark D. Lardie, Division President – Wholesale, Heritage Brands since January 2011. Division President – Wholesale from January 2010 to January 2011. Senior Vice President, General Merchandise Manager at Famous Footwear from June 2006 to January 2010. Vice President, General Merchandise Manager at Famous Footwear from January 2005 to June 2006.
Daniel R. Friedman, Division President – Global Sourcing & Supply Chain since January 2011. Division President – Wholesale, Product and Sourcing from January 2010 to January 2011. Senior Vice President, Product Development and Sourcing from July 2006 to January 2010. Managing Director at Camuto Group, Inc. from 2002 to July 2006.
John W. Schmidt, Division President – Wholesale, Better & Image Brands since January 2011. Senior Vice President, Better & Image Brands from January 2010 to January 2011. Senior Vice President and General Manager, Better & Image Brands from March 2008 until January 2010. Various positions, including Vice President, President, Group President of Wholesale Footwear for Nine West Group from September 1998 to February 2008.
Douglas W. Koch, Senior Vice President and Chief Talent & Strategy Officer since January 2011. Senior Vice President and Chief Talent Officer from May 2005 to January 2011. Senior Vice President, Human Resources from March 2002 to May 2005.
Mark E. Hood, Senior Vice President and Chief Financial Officer since November 2006. Senior Vice President and Chief Financial Officer of Panera Bread Company from April 2003 to May 2006. Senior Vice President, Finance and Administration of Panera Bread Company from August 2002 to April 2003.
Joseph Caro, Senior Vice President and Chief Information Officer since November 2007. Senior Vice President and Chief Technology Officer of the CitiFinancial International division of Citigroup, Inc. from December 2005 to July 2007.
Michael I. Oberlander, Senior Vice President, General Counsel and Corporate Secretary since March 2006. Vice President, General Counsel and Corporate Secretary from July 2001 to March 2006. Vice President and General Counsel from September 2000 to July 2001.
13
|
BROWN SHOE COMPANY, INC.
|
2010 FORM 10-K
|
|
RISK FACTORS
|
Economic conditions may adversely impact demand for our products, reduce access to credit and cause our customers and others with whom we do business to suffer financial hardship, all of which could adversely impact our business, results of operations, financial condition and cash flows.
During 2008 and 2009, worldwide economic conditions deteriorated in many countries and regions, including the United States. Despite some positive trends during the second half of 2009 and throughout 2010, business conditions may remain difficult for the foreseeable future. Consumer spending is affected by many factors, including, among others, general business conditions, interest rates, inflation, consumer debt levels, the availability of consumer credit, health care costs, currency exchange rates, taxation, gasoline prices, real estate values, foreclosure rates, unemployment trends, economic consequences of military action or terrorist activities and other matters that influence consumer confidence and spending. Many of these factors are outside of our control and may have a negative impact on our sales and margins. Our customers’ purchases, including our products, could decline during periods when disposable income is lower, when prices increase in response to rising costs or in periods of actual or perceived unfavorable economic conditions. If we encounter increases in our product costs, these may not be offset by comparable rises in the income of consumers of our products. These consumers may choose to purchase fewer of our products or purchase lower-priced products of our competitors in response to higher prices for our products or may choose not to purchase our products at prices that reflect our price increases that become effective from time to time. If any of these events occur, or if unfavorable economic conditions further challenge the consumer environment, our business, results of operations, financial condition and cash flows could be adversely affected.
In addition, economic conditions, including decreased access to credit, may result in financial difficulties leading to restructurings, bankruptcies, liquidations and other unfavorable events for our customers, product suppliers, insurers, logistics and other service providers and financial institutions that are counterparties to our credit facilities and derivatives transactions. Our customers may experience diminished liquidity that could result in an increase in our credit risk, or our customers may encounter an inability to obtain credit to finance purchases of our products. If third parties on which we rely for goods or services are unable to overcome difficulties resulting from the deterioration in worldwide economic conditions and provide us with the materials and services we need, or if counterparties to our credit facilities or derivatives transactions do not perform their obligations, our business, results of operations, financial condition and liquidity could be adversely affected. For example, over the last few years, we experienced some disruption in product sourcing as a result of certain unforeseen factory closures. While the financial consequences to the Company of these closures were not material, the impact of many closures of major facilities may have an adverse effect on product sourcing. We attempt to mitigate this risk in a variety of ways, including diversification among factories, but such risk to our business and results of operations cannot be completely eliminated.
We face risks relating to competition.
Competition is intense in the footwear industry. Certain of our competitors are larger and have greater financial, marketing and technological resources than we do. In addition, there are low barriers of entry into this industry and new companies may enter the markets in which we compete, further increasing competition in the industry. Our success depends upon our ability to remain competitive in the areas of style, price, quality, location and service, among others, and in part on our ability to anticipate and respond to changing merchandise and fashion trends and consumer preferences and demands in a timely manner. The industry has also been impacted by retailers aggressively competing on the basis of price. Accordingly, there has been competitive pressure on us to keep our selling prices low. Additionally, retailers are increasingly relying on private label brands, which compete with our products directly. Further, these retailers, in some cases, are deciding to source more of their products directly from manufacturers overseas, reducing their reliance on wholesalers. If we are unable to respond effectively to these competitive pressures, our business and results of operations may be adversely affected.
We face risks related to the maintenance of proper inventory levels.
We place orders with manufacturers for some of our products prior to the time we receive all of our customers’ orders. We do this to minimize purchasing costs, the time necessary to fill customer orders and the risk of non-delivery. We also maintain an inventory of certain products that we anticipate will be in greater demand. We may fail to gauge the fashion tastes of consumers or differentiate our retail and wholesale offerings. Also, current economic conditions make it increasingly difficult for us and our customers to accurately forecast product demand trends, and we may be unable to sell the products we have ordered in advance from manufacturers or that we have in our inventory. Inventory levels in excess of customer demand may result in inventory write-downs, and the sale of excess inventory at discounted prices could significantly impair the brand image and have a material adverse effect on our operating results and financial condition. Conversely, if we underestimate consumer demand for our products or if our manufacturers fail to supply the quality products that we require at the time we need them, we may experience inventory shortages. Inventory shortages might delay shipments to customers, negatively impact retailer and distributor relationships, negatively impact our sales results and diminish brand awareness.
14
|
BROWN SHOE COMPANY, INC.
|
2010 FORM 10-K
|
We face risks relating to changes in consumer preferences.
The footwear industry is subject to rapidly changing consumer demands and fashion trends. Accordingly, our success in both our wholesale and retail operations depends in large part on our ability to anticipate, understand and react to changing consumer demands. Our products must appeal to a broad range of consumers whose preferences cannot be predicted with certainty and are subject to rapid change. The success of our products, merchandising strategies and marketing strategies and programs will also depend on a favorable reception by our customers. Furthermore, consumer preferences and purchasing patterns may be influenced by consumers’ disposable income, which could impact the success of our operations.
We rely on foreign sources of production.
General
We rely almost entirely on foreign sourcing for our footwear products. We source footwear products from independent third-party manufacturing facilities located in China and, to a much lesser extent, Brazil and other countries. At times, we are a major customer of these third-party manufacturing facilities. However, there is substantial competition in the footwear industry for quality footwear manufacturers. Accordingly, our future results will partly depend on maintaining close working relationships with our principal manufacturers.
As is common in the industry, we do not have any long-term contracts with our independent third-party foreign manufacturers. We cannot ensure that we will not experience difficulties with such manufacturers, including reduction in the availability of production capacity, failure to meet production deadlines, increases in manufacturing costs or failure to meet our quality standards. Foreign manufacturing is subject to a number of risks, including work stoppages, political instability, expropriation, nationalization, foreign currency fluctuations, changing economic conditions, the imposition of tariffs, import and export controls and other non-tariff barriers and changes in governmental policies or climate change legislation. These risks, as well as other factors outside of our control, such as manufacturing or shipping delays or quality problems, could disrupt the manufacturing process and timeliness of merchandise deliveries and result in lost sales, order cancellations or excessive markdowns, any of which could have an adverse effect on our business, results of operations and financial condition.
We require our third-party foreign manufacturers to meet our standards and footwear-industry standards for working conditions and other matters, including compliance with applicable labor, environmental and other laws, before we place orders with them to manufacture products for us. A failure by any of our third-party manufacturers to adhere to these standards or laws could cause us to incur additional costs for our products and could cause negative publicity and harm our business and reputation. We also require our third-party foreign manufacturers to meet our and industry standards for product safety, including compliance with applicable laws and standards with respect to lead content in paint and other safety issues. A failure by any of our third-party manufacturers to adhere to product safety standards could lead to a product recall, which could result in critical media coverage and harm our business and reputation and could cause us to incur additional costs.
We cannot predict whether additional United States or foreign customs quotas, duties, taxes or other changes or restrictions will be imposed upon the importation of foreign produced products in the future or what effect such actions could have on our business, financial condition or results of operations.
Furthermore, our products depend on the availability of leather and other raw materials. Any significant shortage of quantities or increases in the cost of leather or other materials or resources used to produce our products could have a material adverse effect on our business and results of operations.
China
We rely heavily on manufacturing facilities located in China. Historically, the trade relationship between the United States and China has not had a material adverse effect on our business, financial condition or results of operations. There have been, however, and may in the future be, threats to the trade relationships between the United States and China. There can be no assurance that the trade relationship between the United States and China will not worsen, and if it does worsen, that our financial condition or results of operations will not be materially adversely affected thereby.
15
|
BROWN SHOE COMPANY, INC.
|
2010 FORM 10-K
|
We cannot predict the effect that changes in the economic and political conditions in the United States and China could have on the economics of doing business with Chinese manufacturers. Examples include, but are not limited to, the following:
|
·
|
manufacturing capacity in China may shift from footwear to other industries with manufacturing margins that are perceived to be higher;
|
|
·
|
growth in domestic footwear consumption in China could lead to a significant decrease in factory space available for the manufacture of footwear to be exported; and
|
|
·
|
currently, many footwear manufacturers in China are facing labor shortages as migrant workers seek better wages and working conditions in other industries and vocations.
|
Any of the conditions described above, including the continuation of certain trends identified, could adversely affect our current manufacturers’ operations and the ability to source footwear from these manufacturers, and we may experience difficulties or delays in sourcing our footwear as well as higher footwear costs.
Although we believe we could find alternative manufacturing sources for those products we currently source from China through independent third-party manufacturing facilities in other countries, the loss of a substantial portion of our Chinese manufacturing capacity would have a material adverse effect on the Company. For example, alternative manufacturers may have higher prices, less favorable payment terms, less manufacturing capacity, lower quality standards or increased lead times for delivery. If we are unable to provide products consistent with our standards or the manufacture of our footwear is delayed or becomes more expensive, this could result in our customers canceling orders, refusing to accept deliveries or demanding reductions in purchase prices, any of which could have a material adverse effect on our business and results of operations. In addition, the occurrence of a natural disaster, such as an earthquake or hurricane, the outbreak of a pandemic disease in China or any other disaster, such as that caused by a nuclear meltdown in which radioactive material is released into the environment, would severely interfere with the manufacture of our products and have a material adverse effect on the Company.
Currency
Although we purchase most products from foreign manufacturers in United States dollars and otherwise engage in foreign currency hedging transactions, we cannot ensure that we will not experience cost variations with respect to exchange rate changes. For example, although we purchase footwear made in China using United States dollars, recently Chinese manufacturers have been increasing their United States dollar prices to compensate for the appreciation of the Chinese currency against the United States dollar.
We face risks relating to operating newly acquired manufacturing facilities in China.
Our acquisition of ASG on February 17, 2011, included manufacturing facilities in China that are now owned and operated by Brown Shoe. Although these facilities account for only a portion of total production of performance athletic footwear and outdoor brands acquired from ASG, these manufacturing operations are subject to a number of potential risks. Such risks include, among others:
|
·
|
inflation or changes in political and economic conditions;
|
|
·
|
unstable regulatory environments;
|
|
·
|
changes in import and export duties;
|
|
·
|
domestic and foreign customs and tariffs;
|
|
·
|
potentially adverse tax consequences;
|
|
·
|
trade restrictions;
|
|
·
|
restrictions on the transfer of funds into or out of China;
|
|
·
|
labor unrest and/or shortages; and
|
|
·
|
logistical and communications challenges.
|
These risks may have an adverse effect on our Chinese manufacturing operations and on our overall business and results of operations.
We lease the land where our Chinese manufacturing facilities are located from the Chinese government through land use rights agreements. Although we believe our relationship with the Chinese government is good, if the Chinese government decided to terminate our land use rights agreements, our assets could become impaired, and our ability to meet our customers’ orders could be impacted. This could have a material adverse effect on our business and results of operations.
16
|
BROWN SHOE COMPANY, INC.
|
2010 FORM 10-K
|
We face risks relating to customer concentration in our wholesale business.
Our wholesale customers include national chains, mass merchandisers, department stores, independent retailers, catalogs and online retailers. Several of our customers operate multiple department store divisions. Furthermore, we often sell multiple types of licensed, branded and private-label footwear to these same national chains, mass merchandisers, department stores, independent retailers, catalogs and online retailers. While we believe purchasing decisions in many cases are made independently by the buyers and merchandisers of each of the customers, a decision by a significant customer, including any multiple national chain operators, mass merchandiser, department store, independent retailer, catalog and/or online retailer or any other significant customer, to decrease the amount of footwear products purchased from us could have a material adverse effect on our business, financial condition or results of operations.
The retail industry has experienced increased consolidation. As this trend continues, our wholesale customers will likely seek more favorable terms for their purchases of our products, which could limit our ability to raise prices or achieve our profit goals. In turn, we may not be able to recoup raw material or other cost increases. Sales on terms less favorable to us than our current terms will have an adverse effect on our profitability. Consolidation could lead to a decrease in the number of stores that carry our products and could expose us to greater concentration of accounts receivable risk. In addition, retailers are deciding to source more of their products directly from manufacturers overseas and reducing their reliance on wholesalers. If retailers continue to increase their direct sourcing of footwear from overseas, this could have a material adverse effect on our business and results of operations.
We are dependent on our information technology systems.
Our computer network and systems are essential to all aspects of our operations. If there were to be a major disruption of our information technology operations, we believe that we would be able to recover necessary information, but we do not have complete assurance that we would be able to do so. Further, we do not have complete assurance that we would be able to repair our systems to allow us to continue operations without significant business interruption. If a disruption is of a nature that delays or prohibits implementation of recovery arrangements, it could have a material adverse effect on our results of operations.
To support our business strategy while streamlining and transforming day-to-day operations for our integrated business model, we converted certain of our existing internally developed and certain other third-party applications to an integrated enterprise resource planning (“ERP”) information technology system provided by third-party vendors. While we believe the implementation of these systems provides significant opportunity for us, such a major undertaking carries various risks and uncertainties that could cause actual results to differ materially. These include: (i) changes in the anticipated benefits of strategic business transformation; (ii) our ability to utilize our new information technology system and perform our business processes as designed to successfully execute our strategies; and (iii) the additional risk of future unforeseen issues, interruptions and costs. In the fourth quarter of 2010, we went live on the wholesale portion of our new ERP system, and experienced some delays in the financial statement closing process and timely access to key information used to monitor our business. While we are addressing these issues, the timeline for stabilization of the issues experienced and optimization of benefits expected from the implementation of the ERP system are not now determinable.
We may fail to protect the integrity and security of customer and associate information.
We routinely possess sensitive customer and associate information and, while we have taken reasonable and appropriate steps to protect that information, if our security procedures and controls were compromised, it could harm our business, reputation, results of operations and financial condition and may increase the costs we incur to protect against such information security breaches, such as increased investment in technology, the costs of compliance with consumer protection laws and costs resulting from consumer fraud.
We depend on key personnel to manage our business effectively and may be unable to retain senior management and recruit and retain other key associates.
Our success depends on the ability to attract, retain and motivate qualified management, administrative, product development and sales personnel to support existing operations and future growth. Competition for qualified personnel in the footwear industry is intense, and we compete for these individuals with other companies that in many cases have substantial financial and other resources. The loss of the services of any members of senior management, the inability to attract and retain other qualified personnel, or the inability to effectively transition senior management positions could have a material adverse effect on our business, results of operations and financial condition. We may also be unable to retain key management personnel in businesses that we acquire.
17
|
BROWN SHOE COMPANY, INC.
|
2010 FORM 10-K
|
We face risks relating to our licensed and owned intellectual property.
Licenses
The success of our Wholesale Operations segment to date has been due, in part, to our ability to attract and retain licensors that have strong, well-recognized brands and trademarks. Our license agreements are generally for an initial term of two to four years, subject to renewal, but even where we have longer-term licenses or have an option to renew a license, such agreements are dependent upon our achieving certain results in marketing the licensed products. While we believe we will generally be able to decide whether to renew our existing licenses and obtain new licenses in the future, there can be no assurance we will be able to renew our current licenses or obtain new licenses. In addition, certain of our license agreements are not exclusive, and new or existing competitors may obtain similar licenses.
Many of our license agreements require minimum royalty payments. Our ability to generate sufficient sales and profitability to cover these minimum royalty requirements is not guaranteed, and if sales of such products are not sufficient to generate these minimum payments, it could have a material adverse effect on our business and results of operations.
Trademarks
We believe that our trademarks and trade names are important to our business and are generally sufficient to permit us to carry on our business as presently conducted and planned. We cannot, however, know whether we will be able to secure protection for our intellectual property in the future or if that protection will be adequate for future operations. Furthermore, we face the risk of ineffective protection of intellectual property rights in jurisdictions where we source and distribute our products. We also cannot be certain that our activities do not infringe on the proprietary rights of others. If we are compelled to prosecute infringing parties, defend our intellectual property or defend ourselves from intellectual property claims made by others, we may face significant expenses and liability.
We are dependent on leased locations.
Our Famous Footwear and Specialty Retail segments operate footwear stores. We lease all of these stores. Accordingly, the success of our operations, in part, is dependent on our ability to secure affordable, long-term leases in desirable locations and to secure renewals of such leases. Although we believe that most of our current leases can be renewed on acceptable terms, no assurance can be given that we will be able to successfully negotiate lease renewals on existing stores or to obtain acceptable terms for new stores in desirable locations, and the failure to do so could have an adverse effect on our ability to grow our business and our financial condition and results of operations.
We are dependent on distribution centers.
We currently use six distribution centers, which serve as the source of replenishment of inventory for our footwear stores operated by our Famous Footwear and Specialty Retail segments and serve our Wholesale Operations segment. If complications arise with certain of our operating distribution centers or these distribution centers are severely damaged or destroyed, our other distribution centers may not be able to support the resulting additional distribution demands and we may be unable to locate alternative persons or entities capable of doing so. This may adversely affect our ability to deliver inventory on a timely basis, which could adversely affect our results of operations.
We are dependent on major branded suppliers.
Our Famous Footwear retail chain purchases a substantial portion of its footwear products from major branded suppliers. While we believe our relationships with our current suppliers are good, the loss of any of our major suppliers or product developed exclusively for Famous Footwear could have a material adverse effect on our business, financial condition and results of operations. As is common in the industry, we do not have any long-term contracts with our suppliers. In addition, the success of our financial performance is dependent on the ability of Famous Footwear to obtain products from its suppliers on a timely basis and on acceptable terms.
We face risks that our quarterly sales and earnings may fluctuate, which may result in volatility in our stock price.
Our quarterly sales and earnings can vary due to a number of factors, many of which are beyond our control. Accordingly, we may not be able to accurately predict our quarterly sales and earnings. In our wholesale business, sales of footwear are dependent on orders from our major customers, and they may change delivery schedules, change the mix of products they order or cancel orders without penalty. In addition, our wholesale customers set the delivery schedule for shipments of our products, which could cause shifts of sales between quarters. Our Famous Footwear retail business is seasonally weighted to the back-to-school season, which falls into our fiscal third quarter. In addition, our annualized tax rate is based on projections of our domestic and international operating results for the year, which we review and revise as necessary each quarter. As a result of these specific and other general factors, our operating results will vary from quarter to quarter, and the results for any particular quarter may not be indicative of results for the full year. Any shortfall in sales or earnings from the levels expected by investors or securities analysts could cause a decrease in the trading price of our stock.
18
|
BROWN SHOE COMPANY, INC.
|
2010 FORM 10-K
|
We could be adversely affected by changes in tax laws, policies and treaties.
Our financial results are significantly impacted by our effective tax rates, for both domestic and international operations; therefore, changes in domestic and/or international tax laws, interpretations, policies and treaties may result in increased volatility of our financial results. The passage of any currently existing or future legislation, as a result of changes in domestic or international tax laws, that defers or eliminates certain tax deductions that are currently available to the Company would result in the Company paying higher income taxes and, depending on the specifics of the changes, could materially and negatively affect our financial condition and results of operations.
We may face transitional challenges with acquisitions and/or joint ventures.
Periodically, we pursue acquisitions of other companies or businesses and/or joint ventures. Although we review the records of acquisition candidates, such an in-depth review of the records may not reveal existing or potential problems. As a result, we may not become familiar enough with the business to fully assess its strengths and weaknesses, and accordingly, we may assume adverse operating conditions and/or unanticipated liabilities, and the business may not perform as well as expected. We face the risk that the returns on acquisitions and/or joint ventures will not support the expenditures or indebtedness incurred to acquire or launch such businesses. We also face the risk that we will not be able to integrate acquisitions and/or joint ventures into our existing operations effectively without substantial expense, delay or other operational or financial problems. Integration may be hindered by, among other things, differing procedures, including internal controls, business practices and technology systems. We may need to allocate more management resources to integration than we planned, which may adversely affect our ability to pursue other profitable activities.
With our recent acquisition of ASG, we have expanded our presence in the highly competitive performance footwear market.
Our acquisition of ASG added performance athletic and outdoor footwear brands to our existing wholesale portfolio of brands, strengthening our position in the performance footwear market. The performance footwear market is highly competitive in the United States and worldwide, and market participants face many challenges. Consumer perceptions of our newly acquired performance footwear brands, competitive product offerings and technologies, rapid changes in footwear technology and consumer preferences, any negative professional and expert opinions on the unique technologies and designs of the newly acquired performance footwear brands and performance claims that may arise and any negative publicity and media attention associated with this product category that may arise may constitute significant risk factors in our operations and may negatively impact our business.
We could be adversely affected by the failure of financial institutions to fulfill their commitments under our Credit Agreement.
Our Third Amended and Restated Credit Agreement (the “Credit Agreement”), which matures on January 7, 2016, is provided by a syndicate of financial institutions, with each institution agreeing severally (and not jointly) to make revolving credit loans to us in an aggregate amount of up to $530.0 million in accordance with the terms of the Credit Agreement. In addition, the Credit Agreement provides for up to an additional $150.0 million of optional availability pursuant to a provision commonly referred to as an “accordion feature”. If one or more of the financial institutions participating in the senior secured revolving credit facility were to default on its obligation to fund its commitment, the portion of the facility provided by such defaulting financial institution would not be available to us.
We may be unable to maintain our credit rating, thus negatively affecting our ability to access capital and increasing our interest expense.
The credit ratings agencies periodically review our capital structure and the quality and stability of our earnings. Any negative ratings actions could constrain the capital available to our company or our industry and could limit our access to long-term funding or cause such access to be available at a higher borrowing cost for our operations. We are dependent upon our ability to access capital at rates and on terms we determine to be attractive. If our ability to access capital becomes constrained, our interest costs will likely increase, which could adversely affect our financial condition and results of operations.
We are subject to periodic litigation and other regulatory proceedings.
We are a defendant from time to time in lawsuits and regulatory actions (including environmental matters) relating to our business and to our past operations. Due to the inherent uncertainties of litigation and regulatory proceedings, we cannot accurately predict the ultimate outcome of any such proceedings. An unfavorable outcome could have a material adverse impact on our business, financial condition and results of operations. In addition, regardless of the outcome of any litigation or regulatory proceedings, such proceedings are expensive and will require that we devote substantial resources and executive time to defend the Company. See Item 3, Legal Proceedings, for further discussion of pending matters.
19
|
BROWN SHOE COMPANY, INC.
|
2010 FORM 10-K
|
We are subject to rising insurance costs.
We self-insure a significant portion of our expected losses under our workers’ compensation, employment practices, health, disability, cyber risk, general liability, automobile and property programs, among others. The liabilities associated with the risks that are retained by us are estimated by considering our historical claims experience and data from actuarial sources. The estimated accruals for these liabilities could be affected if claims differ from the assumptions used and historical trends. Unanticipated changes in the estimates underlying our reserves for these losses, such as claims experience, inflation and regulatory changes, could have a material adverse effect on our financial condition and results of operations.
We are subject to legislative or regulatory initiatives related to global warming/climate change concerns, which could negatively affect our business.
There has been an increasing focus and continuous debate on global climate change, including increased attention from regulatory agencies and legislative bodies globally. This increased focus may lead to new initiatives directed at regulating an unspecified array of environmental matters. Legislative, regulatory or other efforts globally to combat climate change could have negative implications, including, but not limited to, future tax increases, increased costs of transportation and utilities and other cost increases imposed on foreign sources of production, all of which could decrease our operating profits. We are unable to predict the potential effects that any such future environmental initiatives may have on our business.
|
UNRESOLVED STAFF COMMENTS
|
None.
|
PROPERTIES
|
We own our principal executive, sales and administrative offices located in Clayton (“St. Louis”), Missouri. Our Canada wholesale division operates from an owned building in Perth, Ontario, and from leased office space in Laval, Quebec. Our Wholesale Operations division also utilizes leased office space in New York, New York, where we also maintain a showroom for our wholesale brands.
Our retail footwear operations are conducted throughout the United States, Canada, China and Guam and involve the operation of 1,369 shoe stores, including 117 in Canada and 15 in China. All store locations are leased, with approximately one-half having renewal options. Famous Footwear operates a leased 750,000 square-foot distribution center, including a mezzanine level, in Sun Prairie, Wisconsin, a leased 800,000 square-foot distribution center, including mezzanine levels, in Lebanon, Tennessee, and a leased 380,000 square-foot distribution center, including a mezzanine level, in Bakersfield, California. We also operate an owned 150,000 square-foot distribution facility in Perth, Ontario.
The footwear sold through our domestic wholesale divisions is processed through one of two main distribution centers: a Company-owned distribution center in Sikeston, Missouri, which has 720,000 square feet, including mezzanine levels, and one third-party facility in Chino, California.
We lease office space in China, Hong Kong, Macau, Taiwan and Italy and four sample-making facilities in Dongguan, China, and Putien, China.
We own a vacant manufacturing facility in Stirling, Ontario; an office building in Perth, Ontario, which is leased to a third-party; a building in Denver, Colorado, which is leased to a third-party; and undeveloped land in Colorado and New York. See Item 3, Legal Proceedings, for further discussion of certain of these properties.
See Subsequent Event – Acquisition of American Sporting Goods Corporation section in Item 1, Business, for further information on the properties associated with ASG.
|
LEGAL PROCEEDINGS
|
We are involved in legal proceedings and litigation arising in the ordinary course of business. In the opinion of management, the outcome of such ordinary course business proceedings and litigation currently pending will not have a material adverse effect on our results of operations or financial position.
We are involved in environmental remediation and ongoing compliance activities at several sites. We are remediating, under the oversight of Colorado authorities, contamination at and beneath our owned facility in Colorado (also known as the “Redfield” site) and groundwater and indoor air in residential neighborhoods adjacent to and near the property, which have been affected by solvents previously used at the site and surrounding facilities. See Note 18 to the consolidated financial statements for additional information related to the Redfield matter.
20
|
BROWN SHOE COMPANY, INC.
|
2010 FORM 10-K
|
Our prior operations included numerous manufacturing and other facilities for which we may have responsibility under various environmental laws to address conditions that may be identified in the future.
|
(REMOVED AND RESERVED)
|
|
PART II
|
|
MARKET FOR REGISTRANT’S COMMON EQUITY, RELATED STOCKHOLDER MATTERS AND ISSUER PURCHASES OF EQUITY SECURITIES
|
Our common stock is listed on the New York Stock Exchange (the “NYSE”) and the Chicago Stock Exchange under the trading symbol “BWS.” As of January 29, 2011, we had approximately 3,600 shareholders of record. The following table sets forth for each fiscal quarter during 2010 and 2009 the high and low sales prices per share of our common stock as reported on the NYSE and the dividends paid per share.
|
2010
|
2009
|
|||||||||||||||||
|
Low
|
High
|
Dividends
Paid
|
Low
|
High
|
Dividends
Paid
|
|||||||||||||
|
1st Quarter
|
$11.56
|
$19.96
|
$0.07
|
$2.04
|
$6.70
|
$0.07
|
||||||||||||
|
2nd Quarter
|
13.71
|
19.10
|
0.07
|
5.41
|
9.44
|
0.07
|
||||||||||||
|
3rd Quarter
|
10.25
|
15.16
|
0.07
|
6.97
|
12.33
|
0.07
|
||||||||||||
|
4th Quarter
|
11.12
|
15.28
|
0.07
|
9.82
|
13.07
|
0.07
|
||||||||||||
Restrictions on the Payment of Dividends
Our Credit Agreement and our 8.75% senior notes due in 2012 (the “Senior Notes”) limit the amount of dividends that can be declared and paid. However, we do not believe this limitation materially restricts the Board of Directors’ ability to declare or our ability to pay regular quarterly dividends to our common stockholders.
In addition to this limitation, the declaration and payment of dividends and the amount of dividends will depend on our results of operations, financial conditions, future prospects and other factors deemed relevant by our Board of Directors.
Issuer Purchases of Equity Securities
The following table represents issuer purchases of equity securities.
|
Fiscal Period
|
Total Number
of Shares
Purchased
|
Average
Price Paid
per Share
|
Total Number of
Shares Purchased
as Part of Publicly
Announced Program
|
Maximum Number of
Shares that May Yet
Be Purchased Under
the Program (1)
|
|||||||
|
October 31, 2010 – November 27, 2010
|
656
|
(2)
|
$
|
11.52
|
–
|
2,500,000
|
|||||
|
November 28, 2010 – January 1, 2011
|
2,433
|
(2)
|
14.19
|
–
|
2,500,000
|
||||||
|
January 2, 2011 – January 29, 2011
|
–
|
–
|
–
|
2,500,000
|
|||||||
|
Total
|
3,089
|
(2)
|
$
|
13.62
|
|
–
|
2,500,000
|
||||
|
(1)
|
In January 2008, the Board of Directors approved a stock repurchase program authorizing the repurchase of up to 2.5 million shares of our outstanding common stock. We can utilize the repurchase program to repurchase shares on the open market or in private transactions from time to time, depending on market conditions. The repurchase program does not have an expiration date. Under this plan, no shares were repurchased during the fourth quarter of 2010; therefore, there were 2.5 million shares authorized to be purchased under the program as of January 29, 2011. Our repurchases of common stock are limited under our debt agreements.
|
|
(2)
|
Reflects shares that were tendered by employees related to certain share-based awards. These shares were tendered in satisfaction of the exercise price of stock options and/or to satisfy minimum tax withholding amounts for non-qualified stock options, restricted stock and stock performance awards. Accordingly, these share purchases are not considered a part of our publicly announced stock repurchase program.
|
21
|
BROWN SHOE COMPANY, INC.
|
2010 FORM 10-K
|
Stock Performance Graph
The following performance graph compares the cumulative total return on our common stock with the cumulative total return of the following indices: (i) the S&P© 600 SmallCap Stock Index and (ii) a peer group of companies believed to be engaged in similar businesses. Our peer group consists of Genesco, Inc., Collective Brands, Inc. (including Payless ShoeSource), Shoe Carnival, Inc., DSW, Inc., Skechers U.S.A., Inc., Steven Madden, Ltd., The Timberland Company and Wolverine World Wide, Inc. In August 2007, Payless ShoeSource changed its name to Collective Brands, Inc. and acquired The Stride Rite Corporation. The results of The Stride Rite Corporation are included within the graph through the date of acquisition. Our fiscal year ends on the Saturday nearest to each January 31; accordingly, share prices are as of the last business day in each fiscal year. The graph assumes that the value of the investment in our common stock and each index was $100 at January 28, 2006. The graph also assumes that all dividends were reinvested and that investments were held through January 29, 2011. These indices are included for comparative purposes only and do not necessarily reflect management’s opinion that such indices are an appropriate measure of the relative performance of the stock involved and are not intended to forecast or be indicative of possible future performance of the common stock.
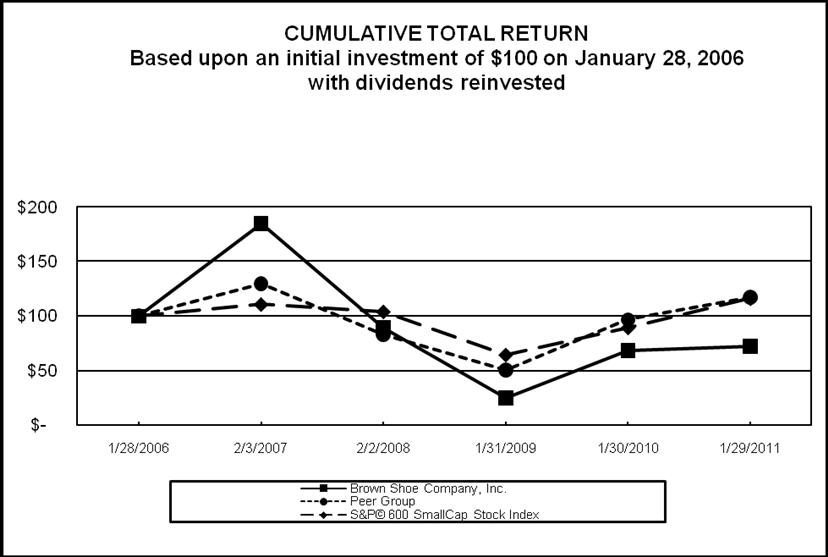
|
1/28/2006
|
2/3/2007
|
2/2/2008
|
1/31/2009
|
1/30/2010
|
1/29/2011
|
|||||||
|
Brown Shoe Company, Inc.
|
$
|
100
|
$
|
185
|
$
|
90
|
$
|
25
|
$
|
69
|
$
|
73
|
|
S&P© 600 SmallCap Stock Index
|
100
|
129
|
83
|
50
|
97
|
117
|
||||||
|
Peer Group
|
100
|
111
|
104
|
64
|
89
|
116
|
||||||
22
|
BROWN SHOE COMPANY, INC.
|
2010 FORM 10-K
|
|
SELECTED FINANCIAL DATA
|
The selected financial data set forth below should be read in conjunction with the consolidated financial statements and notes thereto and the other information contained elsewhere in this report.
|
($ thousands, except per share amounts)
|
2010
(52 Weeks)
|
2009
(52 Weeks)
|
2008
(52 Weeks)
|
2007
(52 Weeks)
|
2006
(53Weeks)
|
||||||||||
|
Operations:
|
|||||||||||||||
|
Net sales
|
$
|
2,504,091
|
$
|
2,241,968
|
$
|
2,276,362
|
$
|
2,359,909
|
$
|
2,470,930
|
|||||
|
Cost of goods sold
|
1,500,537
|
1,338,829
|
1,394,126
|
1,416,510
|
1,500,037
|
||||||||||
|
Gross profit
|
1,003,554
|
903,139
|
882,236
|
943,399
|
970,893
|
||||||||||
|
Selling and administrative expenses
|
922,976
|
859,693
|
851,893
|
827,350
|
854,053
|
||||||||||
|
Restructuring and other special charges, net
|
7,914
|
11,923
|
54,278
|
19,000
|
8,145
|
||||||||||
|
Impairment of goodwill and intangible assets
|
–
|
–
|
149,150
|
–
|
–
|
||||||||||
|
Equity in net loss of nonconsolidated affiliate
|
–
|
–
|
216
|
439
|
–
|
||||||||||
|
Operating earnings (loss)
|
72,664
|
31,523
|
(173,301
|
)
|
96,610
|
108,695
|
|||||||||
|
Interest expense
|
(19,647
|
)
|
(20,195
|
)
|
(17,105
|
)
|
(16,232
|
)
|
(17,892
|
)
|
|||||
|
Interest income
|
203
|
374
|
1,800
|
3,434
|
2,610
|
||||||||||
|
Earnings (loss) before income taxes
|
53,220
|
11,702
|
(188,606
|
)
|
83,812
|
93,413
|
|||||||||
|
Income tax (provision) benefit
|
(16,160
|
)
|
(1,259
|
)
|
53,793
|
(23,483
|
)
|
(27,719
|
)
|
||||||
|
Net earnings (loss)
|
37,060
|
10,443
|
(134,813
|
)
|
60,329
|
65,694
|
|||||||||
|
Less: Net (loss) earnings attributable to noncontrolling interests
|
(173
|
)
|
943
|
(1,575
|
)
|
(98
|
)
|
(14
|
)
|
||||||
|
Net earnings (loss) attributable to Brown Shoe Company, Inc.
|
$
|
37,233
|
$
|
9,500
|
$
|
(133,238
|
)
|
$
|
60,427
|
$
|
65,708
|
||||
|
Operations:
|
|||||||||||||||
|
Return on net sales
|
1.5%
|
0.4%
|
(5.9)%
|
2.6%
|
2.7%
|
||||||||||
|
Return on beginning Brown Shoe Company, Inc.
shareholders’equity
|
9.3%
|
2.4%
|
(23.9)%
|
11.5%
|
15.1%
|
||||||||||
|
Return on average invested capital(1)
|
7.8%
|
3.6%
|
(17.2)%
|
9.5%
|
11.3%
|
||||||||||
|
Dividends paid
|
$
|
12,254
|
$
|
12,009
|
$
|
11,855
|
$
|
12,312
|
$
|
9,147
|
|||||
|
Purchases of property and equipment
|
$
|
30,781
|
$
|
24,880
|
$
|
60,417
|
$
|
41,355
|
$
|
60,725
|
|||||
|
Capitalized software
|
$
|
24,046
|
$
|
25,098
|
$
|
16,327
|
$
|
5,770
|
$
|
10,080
|
|||||
|
Depreciation and amortization(2)
|
$
|
52,517
|
$
|
53,295
|
$
|
56,510
|
$
|
52,148
|
$
|
50,943
|
|||||
|
Per Common Share:
|
|||||||||||||||
|
Basic earnings (loss) per common share attributable to Brown Shoe Company, Inc. shareholders
|
$
|
0.85
|
$
|
0.22
|
$
|
(3.21
|
)
|
$
|
1.38
|
$
|
1.54
|
||||
|
Diluted earnings (loss) per common share attributable to Brown Shoe Company, Inc. shareholders
|
0.85
|
0.22
|
(3.21
|
)
|
1.36
|
1.50
|
|||||||||
|
Dividends paid
|
0.28
|
0.28
|
0.28
|
0.28
|
0.21
|
||||||||||
|
Ending Brown Shoe Company, Inc. shareholders’ equity
|
9.45
|
9.38
|
9.31
|
13.35
|
12.10
|
||||||||||
|
Financial Position:
|
|||||||||||||||
|
Receivables, net
|
$
|
113,937
|
$
|
84,297
|
$
|
84,252
|
$
|
116,873
|
$
|
132,224
|
|||||
|
Inventories, net
|
524,250
|
456,682
|
466,002
|
435,682
|
420,520
|
||||||||||
|
Working capital
|
296,376
|
294,186
|
279,297
|
333,142
|
303,844
|
||||||||||
|
Property and equipment, net
|
135,632
|
141,561
|
157,451
|
141,964
|
138,164
|
||||||||||
|
Total assets
|
1,148,043
|
1,040,150
|
1,026,031
|
1,099,841
|
1,099,057
|
||||||||||
|
Average net assets(3)
|
483,398
|
465,057
|
496,979
|
496,996
|
428,118
|
||||||||||
|
Borrowings under Revolving Credit Agreement
|
198,000
|
94,500
|
112,500
|
15,000
|
1,000
|
||||||||||
|
Long-term debt
|
150,000
|
150,000
|
150,000
|
150,000
|
150,000
|
||||||||||
|
Brown Shoe Company, Inc. shareholders’ equity
|
415,080
|
402,171
|
394,104
|
558,577
|
523,645
|
||||||||||
|
Average common shares outstanding – basic
|
42,156
|
41,585
|
41,525
|
43,223
|
42,225
|
||||||||||
|
Average common shares outstanding – diluted
|
42,487
|
41,649
|
41,525
|
43,916
|
43,364
|
||||||||||
All data presented reflects the fiscal year ended on the Saturday nearest to January 31. Certain prior-period amounts have been reclassified to conform to current-period presentation. These reclassifications did not affect net earnings (loss) attributable to Brown Shoe Company, Inc. See Item 7, Management’s Discussion and Analysis of Financial Condition and Results of Operations, for additional information related to the selected financial data above.
|
(1)
|
Return on average invested capital is calculated by dividing operating earnings (loss) for the period, adjusted for income taxes at the applicable effective rate, by the average of each month-end invested capital balance during the year. Invested capital is defined as Brown Shoe Company, Inc. shareholders’ equity plus long-term debt and borrowings under the Revolving Credit Agreement.
|
|
(2)
|
Depreciation and amortization includes depreciation of property and equipment and amortization of capitalized software, intangibles and debt issuance costs. The amortization of debt issuance costs is reflected within interest expense in our consolidated statement of earnings and totaled $2.2 million in 2010, $2.2 million in 2009, $1.6 million in 2008, $1.5 million in 2007 and $1.5 million in 2006.
|
|
(3)
|
Average net assets are calculated as the average of each month-end net asset balance during the year. Net assets are calculated as the sum of working capital, property and equipment, net and capitalized software, net.
|
23
|
BROWN SHOE COMPANY, INC.
|
2010 FORM 10-K
|
|
MANAGEMENT’S DISCUSSION AND ANALYSIS OF FINANCIAL CONDITION AND RESULTS OF OPERATIONS
|
|
OVERVIEW
|
Business Overview
We are a footwear company with both retail and wholesale operations and have annual net sales of over $2.5 billion. We are a fashion footwear marketer, offering the consumer a powerful portfolio of great footwear stores and global footwear brands. As both a retailer and a wholesaler, we have a perspective on the marketplace that enables us to serve consumers from different vantage points. We believe our diversified business model provides us with synergies by spanning consumer segments, categories and distribution channels.
Our goal is to be the leading footwear marketer, while winning loyal customers with compelling global brands. We are a consumer-driven enterprise. To successfully provide consumers with the product they want, we leverage our partnerships with our customers and suppliers. We also believe that a combination of talent acquisition, thoughtful planning and rigorous execution are keys to our success in optimizing our business and brand portfolio.
Retail
In our retail businesses, we strive to offer differentiated consumer experiences in a convenient, easy-to-shop environment. Our focus is on meeting the needs of a well-defined consumer, by providing our customer and her entire family an assortment of trend-right, brand-name fashion and athletic footwear at a great price, coupled with engaging marketing programs and some exclusive products. We also seek to engage our customers through our Famous Footwear customer loyalty program, Rewards, and have placed additional focus on a variety of other consumer communications, including in-store advertisement, national television, radio, print, viral marketing and social networking. We test innovative ideas in our stores to improve the customer’s shopping experience and to further differentiate our retail chains. Our retail segments include Famous Footwear and Specialty Retail. Famous Footwear is America’s leading family branded footwear retailer selling branded value-priced footwear for the entire family with over 1,100 stores. Our Specialty Retail segment operates approximately 250 retail stores in the United States and Canada, primarily under the Naturalizer name, as well as several stores in China. It also includes Shoes.com and our other e-commerce businesses, with the exception of FamousFootwear.com, which is included in our Famous Footwear segment.
The footwear industry is subject to changing consumer demands and fashion trends, and our success depends in large part on our ability to anticipate, understand and react to these changing consumer demands. The success of our retail stores is also driven by the relative strength of consumer spending, primarily in the United States. The level of consumers’ disposable income impacts consumer preferences and purchasing patterns. Another long-term success factor for our retail business is placing our stores in locations desirable to our target consumer.
Wholesale
In our wholesale business, we believe our key success factors are strengthening the consumers’ preference for our brands by offering compelling style and quality, differentiated brand promises and innovative marketing campaigns. Owning approximately one-half of our major brands and licensing the others, we offer retailers a portfolio of brands, each designed and targeted to a specific customer segment within the marketplace. Brand strength and preference are built by developing fresh product assortments and executing marketing campaigns. We are also able to showcase many of our brands in our retail stores, leveraging our wholesale and retail platforms, sharing consumer insights across our businesses and testing new and innovative products. We believe our brands are aligned with the macro-trends of family, healthy living and contemporary fashion and position us to achieve our goals.
Our major brands, both owned and licensed, include Naturalizer, Dr. Scholl’s, Sam Edelman, Franco Sarto, LifeStride, Buster Brown, Via Spiga, Etienne Aigner, Carlos by Carlos Santana, Vera Wang Lavender, Fergie/Fergalicious by Fergie and Nickels Soft. As a result of our acquisition of ASG on February 17, 2011, we have added some major performance athletic and outdoor footwear brands such as Avia, rykä, AND1, Nevados and Yukon.
Our wholesale business model focuses on maximizing the sell-through of our product to the final consumer rather than maximizing sell-ins to our retail customers. This business model focuses on a continuous flow of smaller quantities of new goods versus large preseason sell-ins, thereby minimizing markdowns and allowances. We have seen success with this consumer-driven approach and believe it has improved the performance of many of our brands and believe additional opportunities exist to capitalize on this business model.
24
|
BROWN SHOE COMPANY, INC.
|
2010 FORM 10-K
|
Financial Highlights
Overall, 2010 was a solid year for Brown Shoe Company, Inc. Both our retail and wholesale businesses contributed to the stronger financial performance compared to last year. In total, the Company achieved a record sales result and more than doubled its operating earnings from last year. The strong operating results were driven by the continued strength of our Famous Footwear division, which achieved record sales for the year and doubled its operating earnings. Additionally, our Wholesale division achieved a 19.4% increase in net sales, with increases across nearly all of our brands and channels of distribution. Despite this positive momentum and solid sales growth in our wholesale brands, our Wholesale division experienced a greater-than-expected decline in gross profit rate during the second half of 2010. The margin weakness in the Wholesale division was driven by several factors, including: (a) a continuation of industry-wide sourcing and supply chain issues that led to increased delivery costs and disruption in the timing of deliveries, leading to lower initial margins and greater markdowns and allowances, and (b) order fulfillment was further aggravated by the business process changes, data conversion and learning curves associated with the Company’s systems transition that went live in December 2010. We are planning our wholesale business more cautiously in the near-term as we work through our systems transition, and we believe our investments in product styling enhancements, brand assortments and innovative marketing during 2010, which enabled our brands to continue to improve their connection with consumers, will continue our momentum into 2011, drive profitable sales from our retail and wholesale businesses and enhance the productivity of our store base.
The following is a summary of the financial highlights for 2010:
|
·
|
Consolidated net sales increased $262.1 million, or 11.7%, to $2.5 billion in 2010, compared to $2.2 billion last year. All segments experienced an increase in net sales during 2010 as compared to last year. Net sales of our Famous Footwear, Wholesale Operations and Specialty Retail segments increased $122.9 million, $122.6 million and $16.6 million, respectively.
|
|
·
|
Consolidated operating earnings were $72.7 million in 2010, compared to $31.5 million last year.
|
|
·
|
Consolidated net earnings attributable to Brown Shoe Company, Inc. were $37.2 million, or $0.85 per diluted share, in 2010, compared to $9.5 million, or $0.22 per diluted share, last year.
|
There were several items that impacted our 2010 and 2009 operating results that should be considered in evaluating the comparability of our results.
Items impacting selling and administrative expenses in our consolidated statements of earnings are as follows:
|
·
|
Marketing initiatives – As planned, marketing expenses were $17.0 million ($11.8 million on an after-tax basis, or $0.28 per diluted share) higher during 2010, compared to last year, due to our continued focus on driving brand awareness across our retail and wholesale businesses and strengthening our connection with customers.
|
|
·
|
Incentive plans – Our selling and administrative expenses were higher by $11.5 million ($8.0 million on an after-tax basis, or $0.19 per diluted share) during 2010, compared to last year, due to a stronger financial performance in 2010 relative to our plans.
|
Items impacting restructuring and other special charges, net in our consolidated statements of earnings are as follows:
|
·
|
Acquisition-related costs – We incurred costs of $1.1 million ($0.7 million on an after-tax basis, or $0.02 per diluted share) during 2010, related to the acquisition of ASG, which closed on February 17, 2011, with no corresponding costs in 2009.
|
|
·
|
Information technology initiatives – We incurred expenses of $6.8 million ($4.6 million on an after-tax basis, or $0.10 per diluted share) during 2010, related to our integrated ERP information technology system that has replaced certain of our existing internally developed and certain other third-party applications, with $9.2 million ($5.8 million on an after-tax basis, or $0.14 per diluted share) in corresponding expenses last year. See the Recent Developments section that follows and Note 5 to the consolidated financial statements for additional information related to these expenses.
|
|
·
|
Organizational changes – During 2009, we incurred charges of $4.6 million ($2.8 million on an after-tax basis, or $0.07 per diluted share) related to the retirement of two executive officers, with no corresponding charges in 2010. See Note 5 to the consolidated financial statements for additional information related to these charges.
|
25
|
BROWN SHOE COMPANY, INC.
|
2010 FORM 10-K
|
|
·
|
Headquarters consolidation – During 2009, we recorded income of $1.9 million ($1.1 million on an after-tax basis, or $0.03 per diluted share) as a result of an expanded sublease arrangement for our former Famous Footwear division headquarters facility in Madison, Wisconsin, with no corresponding income in 2010. See Note 5 to the consolidated financial statements for additional information related to these recoveries.
|
Our debt-to-capital ratio, as defined in the Liquidity and Capital Resources – Working Capital and Cash Flow section, increased to 45.6% as of January 29, 2011, compared to 37.3% at January 30, 2010, primarily due to our $103.5 million increase in borrowings under our Revolving Credit Agreement at the end of 2010, due in part to our higher inventories and receivables and lower trade accounts payable, and our acquisition of the remaining 50% of the noncontrolling interest in Edelman Shoe, Inc. (“Edelman Shoe”), as described further in Note 2 to the consolidated financial statements. Our current ratio, as defined in the Liquidity and Capital Resources – Working Capital and Cash Flow section, was 1.58 to 1 at January 29, 2011, compared to 1.71 to 1 at January 30, 2010. Inventories at January 29, 2011, were $524.3 million, up from $456.7 million at January 30, 2010, primarily due to an increase in inventories for both our Wholesale Operations and Famous Footwear segments in support of higher sales levels. Additionally, the increase in inventories for our Wholesale Operations segment is due in part to an acceleration in the timing of inventory receipts.
Recent Developments
Subsequent Event – Acquisition of ASG and Related Financing
On February 17, 2011, we entered into a Stock Purchase Agreement with ASG and ASG’s stockholders, pursuant to which one of our subsidiaries acquired all of the outstanding capital stock of ASG (the “ASG Stock”) from the ASG stockholders on that date. The aggregate purchase price for the ASG Stock was $145.0 million in cash plus assumed debt, and included a $2.0 million cash earn-out contingent upon ASG’s achievement of certain financial targets. The acquisition adds performance athletic and outdoor footwear brands to our portfolio, including Avia, rykä, AND1, Nevados and Yukon, and complements our existing fitness and comfort offerings.
Effective February 17, 2011, the Loan Parties under our Credit Agreement exercised the $150.0 million designated event accordion feature to fund the acquisition of ASG, increasing the aggregate amount available under the Credit Agreement from $380.0 million to $530.0 million. The Credit Agreement still provides for access to an additional $150.0 million of optional availability pursuant to a separate accordion feature, subject to satisfaction of certain conditions and approval of the lenders.
Additionally, we incurred costs of $1.1 million ($0.7 million on an after-tax basis, or $0.02 per diluted share) during 2010, as a component of restructuring and other special charges, net related to the acquisition, with no corresponding costs last year.
In 2011, ASG will be consolidated within our Wholesale Operations segment. See Note 2 to the consolidated financial statements for additional information.
Additional Investment in Edelman Shoe, Inc.
On June 4, 2010, we acquired the remaining 50% of the noncontrolling interest in Edelman Shoe for $40.0 million, consisting of a combination of $32.7 million of cash, including transaction fees, and $7.3 million in shares of our common stock. Edelman Shoe is a leading designer and marketer of fashion footwear. The Sam Edelman brand was launched in 2004 and is primarily sold through department stores and independent retailers. We believe the acquisition is important to the execution of our contemporary fashion strategy, which includes providing consumers access to fashion primarily in the bridge/designer footwear price zones. See Note 2 to the consolidated financial statements for additional information.
Information Technology Initiatives
We converted certain of our existing internally developed and certain other third-party applications to an integrated ERP information technology system provided by third-party vendors. We expect the implementation will enhance our profitability through improved management and execution of our business operations, financial systems, supply chain efficiency and planning and employee productivity. Although we went live on the wholesale portion of our new ERP system in the fourth quarter of 2010, system transition efforts and alignment of existing business processes are expected to continue into 2011. During 2010, we incurred expenses of $6.8 million ($4.6 million on an after-tax basis, or $0.10 per diluted share) as a component of restructuring and other special charges, net related to these initiatives. Of the $6.8 million in expenses recorded during 2010, $0.7 million was recorded in the Wholesale Operations segment, and the remaining expense was recorded in the Other segment.
During 2009, we incurred expenses of $9.2 million ($5.8 million on an after-tax basis, or $0.14 per diluted share) as a component of restructuring and other special charges, net related to these initiatives. Of the $9.2 million in expenses recorded during 2009, $0.3 million was recorded in the Wholesale Operations segment, and the remaining expense was recorded in the Other segment.
26
|
BROWN SHOE COMPANY, INC.
|
2010 FORM 10-K
|
Outlook for 2011
Looking ahead, we believe our brands and product offerings are well-positioned in the marketplace and will enable us to further capitalize on consumers’ desire for trend-right products. We continue to attract new customers and have experienced higher conversion rates, resulting from improved product, differentiated store experiences and enhanced marketing initiatives. The actions and investments we made in 2010 are expected to generate greater efficiencies from our operating platform and drive continued profitability improvements in 2011. In addition, as discussed in the Recent Developments section above, on February 17, 2011, the Company acquired all of the outstanding capital stock of ASG. We believe this acquisition represents a strategic complement to our fitness and comfort offerings by adding performance athletic and outdoor footwear to our portfolio and better positions us to meet consumer demand for products that support active and healthy lifestyles. We expect that the same-store sales of our retail businesses will grow in the low- to mid-single digit percentage range in 2011. For our legacy wholesale business, we expect a net sales increase in 2011 in the low- to mid-single digit percentage range as compared to 2010, and net sales from ASG brands of more than $200 million.
Following are the consolidated results and the results by segment for 2010, 2009 and 2008:
|
CONSOLIDATED RESULTS
|
||||||||||||||||
|
2010
|
2009
|
2008
|
||||||||||||||
|
($ millions)
|
% of
Net Sales
|
% of
Net Sales
|
% of
Net Sales
|
|||||||||||||
|
Net sales
|
$
|
2,504.1
|
100.0%
|
$
|
2,242.0
|
100.0%
|
$
|
2,276.4
|
100.0%
|
|||||||
|
Cost of goods sold
|
1,500.5
|
59.9%
|
1,338.9
|
59.7%
|
1,394.2
|
61.2%
|
||||||||||
|
Gross profit
|
1,003.6
|
40.1%
|
903.1
|
40.3%
|
882.2
|
38.8%
|
||||||||||
|
Selling and administrative expenses
|
923.0
|
36.9%
|
859.7
|
38.4%
|
851.8
|
37.4%
|
||||||||||
|
Restructuring and other special charges, net
|
7.9
|
0.3%
|
11.9
|
0.5%
|
54.3
|
2.4%
|
||||||||||
|
Impairment of goodwill and intangible assets
|
–
|
–
|
–
|
–
|
149.2
|
6.6%
|
||||||||||
|
Equity in net loss of nonconsolidated affiliate
|
–
|
–
|
–
|
–
|
0.2
|
0.0%
|
||||||||||
|
Operating earnings (loss)
|
72.7
|
2.9%
|
31.5
|
1.4%
|
(173.3
|
)
|
(7.6)%
|
|||||||||
|
Interest expense
|
(19.7
|
)
|
(0.8)%
|
(20.2
|
)
|
(0.9)%
|
(17.1
|
)
|
(0.8)%
|
|||||||
|
Interest income
|
0.2
|
0.0%
|
0.4
|
0.0%
|
1.8
|
0.1%
|
||||||||||
|
Earnings (loss) before income taxes
|
53.2
|
2.1%
|
11.7
|
0.5%
|
(188.6
|
)
|
(8.3)%
|
|||||||||
|
Income tax (provision) benefit
|
(16.1
|
)
|
(0.6)%
|
(1.3
|
)
|
(0.1)%
|
53.8
|
2.3%
|
||||||||
|
Net earnings (loss)
|
$
|
37.1
|
1.5%
|
$
|
10.4
|
0.4%
|
$
|
(134.8
|
)
|
(6.0)%
|
||||||
|
Less: Net (loss)earnings attributable to noncontrolling interests
|
(0.1
|
)
|
0.0%
|
0.9
|
0.0%
|
(1.6
|
)
|
(0.1)%
|
||||||||
|
Net earnings (loss) attributable to Brown Shoe Company, Inc.
|
$
|
37.2
|
1.5%
|
$
|
9.5
|
0.4%
|
$
|
(133.2
|
)
|
(5.9)%
|
||||||
Net Sales
Net sales increased $262.1 million, or 11.7%, to $2.5 billion in 2010, compared to $2.2 billion last year. All segments experienced an increase in net sales during 2010 as compared to last year. Our Famous Footwear segment reported a $122.9 million increase in net sales, reflecting a 10.5% same-store sales increase, resulting from a higher conversion rate in our stores, higher average retail prices and increases in customer traffic levels. Our Wholesale Operations segment reported a $122.6 million, or 19.4%, increase in net sales, primarily as a result of strong demand and sales growth in nearly all of our brands, primarily led by our Naturalizer, Dr. Scholl’s, Sam Edelman, Via Spiga and Vera Wang Lavender divisions. The net sales of our Specialty Retail segment increased $16.6 million, reflecting a same-store sales increase of 6.6% in our retail stores, higher net sales at Shoes.com and an increase in the Canadian dollar exchange rate.
Net sales decreased $34.4 million, or 1.5%, to $2.2 billion in 2009, compared to $2.3 billion in 2008. Our Wholesale Operations and Specialty Retail segments’ net sales declined, while our Famous Footwear segment’s net sales increased. Our Wholesale Operations segment’s net sales declined $72.0 million, primarily as a result of retailers reducing inventory levels across our channels of distribution in response to weak consumer spending as well as the continued decline in our private label business. The net sales of our Specialty Retail segment declined by $5.9 million, due to lower net sales at Shoes.com and a decline in the Canadian dollar exchange rate, partially offset by an increase in same-store sales of 0.8% in our retail stores. Our Famous Footwear segment’s net sales increased by $43.6 million, reflecting an increase in net sales from net closed stores and a same-store sales increase of 0.5%.
27
|
BROWN SHOE COMPANY, INC.
|
2010 FORM 10-K
|
Same-store sales changes are calculated by comparing the sales in stores that have been open at least 13 months. This method avoids the distorting effect that grand opening sales have in the first month of operation. Relocated stores are treated as new stores, and closed stores are excluded from the calculation. Sales change from new and closed stores, net, reflects the change in net sales due to stores that have been opened or closed during the period and are thereby excluded from the same-store sales calculation.
Gross Profit
Gross profit increased $100.5 million, or 11.1%, to $1.0 billion in 2010, compared to $903.1 million last year resulting from higher net sales. As a percent of net sales, our gross profit decreased to 40.1% in 2010, from 40.3% last year. The decrease in the gross profit rate was primarily due to our Wholesale Operations segment, which experienced lower initial margins and greater markdowns and allowances resulting from industry-wide sourcing and supply chain issues, and order fulfillment challenges resulting from business process changes, data conversion and learning curves associated with the Company’s systems transition that went live in December 2010. This decrease was partially offset by improvements in gross profit rate recognized by both our Famous Footwear and Specialty Retail segments. Our Famous Footwear segment experienced a significant decrease in promotional activity and strong sales of higher-margin product categories, such as health and wellness and boots, in 2010 as compared to last year. Our Specialty Retail segment experienced improved retail sell-through, partially offset by a lower gross profit rate for Shoes.com in 2010 as compared to last year. In addition, as a percentage of consolidated sales, we experienced an increased mix of wholesale sales, which carry a lower gross profit rate.
Gross profit increased $20.9 million, or 2.4%, to $903.1 million in 2009, compared to $882.2 million in 2008 due to an increase in our gross profit rate, partially offset by lower net sales. As a percent of net sales, our gross profit increased to 40.3% in 2009, from 38.8% in 2008. The increase in our gross profit rate reflects improved margins in each of our reportable segments. Our Wholesale Operations segment experienced higher margins, driven by shifts in channel and brand mix and lower provisions for customer allowances. Famous Footwear, particularly in the second half of 2009, had increased sales in higher-margin product categories, such as boots and health and wellness products, but margins at Famous Footwear were partially offset by increased promotional activity. In our Specialty Retail segment, our gross profit rate increased as we experienced lower freight expenses and markdowns at Shoes.com as compared to 2008. In addition, as a percentage of consolidated sales, we experienced an increased mix of retail sales, which carry a higher gross profit rate.
We classify warehousing, distribution, sourcing and other inventory procurement costs in selling and administrative expenses. Accordingly, our gross profit and selling and administrative expenses rates, as a percent of net sales, may not be comparable to other companies.
Selling and Administrative Expenses
Selling and administrative expenses increased $63.3 million, or 7.4%, to $923.0 million in 2010 compared to $859.7 million last year and increased $7.9 million, or 0.9%, in 2009 compared to $851.8 million in 2008.
Selling and administrative expenses increased $63.3 million in 2010 compared to last year. We experienced higher selling and merchandising costs, driven by higher sales volumes across all of our segments. We also incurred higher marketing expenses and higher anticipated payments under our incentive plans. These increases were partially offset by a decline in our retail facilities expenses as a result of our lower store count and cost savings initiatives. As a percent of net sales, selling and administrative expenses decreased to 36.9% in 2010 from 38.4% last year. This decrease is due to the better leveraging of our expense base over the higher sales volume.
Selling and administrative expenses increased $7.9 million in 2009 compared to 2008, primarily due to higher costs related to our incentive plans, higher expenses for retail facilities, the consolidation of Edelman Shoe and new brand launches, partially offset by a decline in marketing expenses and savings from our expense and capital containment initiatives implemented at the beginning of 2009. As a percent of net sales, selling and administrative expenses increased to 38.4% in 2009 from 37.4% in 2008. This increase is due to the impact of the factors listed above and the de-leveraging of our expense base over the lower sales volume.
Impairment of Goodwill and Intangible Assets
We incurred charges related to the impairment of our goodwill and intangible assets of $149.2 million in 2008 as a result of the deterioration of general economic conditions, industry trends and the resulting decline in our share price and market capitalization, with no corresponding charges in 2010 or 2009. See Note 1 and Note 10 to the consolidated financial statements for additional information related to impairment of goodwill and intangible assets.
28
|
BROWN SHOE COMPANY, INC.
|
2010 FORM 10-K
|
Restructuring and Other Special Charges, Net
Restructuring and other special charges, net decreased $4.0 million, or 33.6%, to $7.9 million during 2010, compared to $11.9 million last year as a result of several factors, as follows (see Note 5 to the consolidated financial statements for additional information related to these charges and recoveries):
|
·
|
Information technology initiatives – We incurred charges of $6.8 million during 2010 related to our integrated ERP information technology system, with $9.2 million in corresponding charges last year.
|
|
·
|
Acquisition-related costs – We incurred $1.1 million of costs during 2010 related to the acquisition of ASG, which closed on February 17, 2011, with no corresponding costs in 2009.
|
|
·
|
Organizational changes – During 2009, we incurred charges of $4.6 million related to the retirement of two executive officers, with no corresponding charges in 2010.
|
|
·
|
Headquarters consolidation – During 2009, we recorded income of $1.9 million as a result of an expanded sublease arrangement related to our former Famous Footwear division headquarters in Madison, Wisconsin, with no corresponding income recorded in 2010.
|
As a percent of net sales, restructuring and other special charges, net decreased to 0.3% in 2010, from 0.5% last year, reflecting the above-named factors.
Restructuring and other special charges, net decreased $42.4 million, or 78.0%, to $11.9 million during 2009, compared to $54.3 million in 2008 as a result of several factors, as follows:
|
·
|
Information technology initiatives – We incurred charges of $9.2 million during 2009 related to our integrated ERP information technology system, with $3.7 million in corresponding charges in 2008.
|
|
·
|
Organizational changes – We incurred charges of $4.6 million during 2009 related to the retirement of two executive officers, with no corresponding expenses in 2008.
|
|
·
|
Headquarters consolidation – During 2008, we incurred charges of $29.8 million related to the relocation and transition of our Famous Footwear division headquarters. During 2009, we recorded income of $1.9 million as a result of an expanded sublease arrangement related to the facility.
|
|
·
|
Expense and capital containment initiatives – During 2008, we incurred charges of $30.9 million related to our expense and capital containment initiatives, with no corresponding charges in 2009.
|
|
·
|
Environmental insurance recoveries and charges – We recorded income related to environmental insurance recoveries, net of associated fees and costs, of $10.1 million in 2008, with no corresponding recoveries in 2009.
|
As a percent of net sales, restructuring and other special charges, net decreased to 0.5% in 2009, from 2.4% in 2008, reflecting the above-named factors.
Equity in Net Loss of Nonconsolidated Affiliate
Since our initial investment in Edelman Shoe during 2007, we recorded our portion of Edelman Shoe’s operating results in our financial statements based upon the equity method of accounting, as equity in net loss of nonconsolidated affiliate. We continued to record the results of Edelman Shoe using the equity method until November 3, 2008 (fourth quarter of 2008), when we purchased additional shares of Edelman Shoe. Since that date, the results of Edelman Shoe were fully consolidated into our financial statements, with net earnings or loss related to the noncontrolling interests reflected in the line titled Less: Net earnings (loss) attributable to noncontrolling interests on our consolidated statement of earnings. On June 4, 2010, we acquired the remaining 50% of the outstanding stock of Edelman Shoe. The acquisition was accounted for in accordance with the consolidation guidance applicable to noncontrolling interests. As a result, the Company’s acquisition of the remaining interest in Edelman Shoe resulted in the elimination of $8.6 million of the noncontrolling interest in Edelman Shoe. As of June 4, 2010, Edelman Shoe is a wholly-owned subsidiary of the Company. See Note 2 to the consolidated financial statements for additional information related to Edelman Shoe.
Operating Earnings (Loss)
Operating earnings increased $41.2 million, or 130.5%, to $72.7 million in 2010 compared to $31.5 million last year due to the increase in net sales and decline in restructuring and other special charges, net, partially offset by an increase in our selling and administrative expenses and a decline in gross profit rate, as discussed above.
We reported operating earnings of $31.5 million in 2009 compared to an operating loss of $173.3 million in 2008 due primarily to the nonrecurrence of the charge for impairment of goodwill and intangible assets, a decline in restructuring and other special charges, net and an increase in gross profit rate, partially offset by a decline in net sales and an increase in our selling and administrative expenses as discussed above.
29
|
BROWN SHOE COMPANY, INC.
|
2010 FORM 10-K
|
Interest Expense
Interest expense decreased $0.5 million, or 2.7%, to $19.7 million in 2010 compared to $20.2 million last year and increased $3.1 million, or 18.1%, in 2009 compared to $17.1 million in 2008.
The decrease in interest expense in 2010 is primarily due to lower rates on borrowings under our Revolving Credit Agreement, increased capitalization of interest related to our integrated ERP information technology system and decreased interest expense associated with a sublease arrangement that was expanded during 2009. Increased interest expense resulting from higher average borrowings under our Revolving Credit Agreement partially offset these decreases.
The increase in interest expense in 2009 primarily reflected higher average borrowings under our Revolving Credit Agreement and higher amortization of debt issuance costs, partially offset by lower rates on our borrowings under our Revolving Credit Agreement.
Income Tax (Provision) Benefit
Our consolidated effective tax rate was a provision of 30.4% in 2010 compared to 10.8% in 2009 and a benefit of 28.5% in 2008. Our consolidated effective tax rate is generally below the federal statutory rate of 35% because our foreign earnings are subject to lower statutory tax rates.
In 2010, we experienced pretax earnings in both our domestic operations and foreign jurisdictions. Our domestic operations are generally subject to a normal combined tax rate of 35% to 39%, while foreign jurisdictions are generally subject to lower statutory tax rates. This mix of domestic and foreign pretax earnings resulted in an overall effective tax provision rate of 30.4% in 2010.
In 2009, we incurred a pretax loss in our domestic operations and pretax earnings in foreign jurisdictions. This combination of a domestic loss and foreign earnings resulted in an overall effective tax provision rate of 10.8% in 2009.
In 2008, we also incurred a pretax loss in our domestic operations and pretax earnings in foreign jurisdictions. The combination of a domestic loss and foreign earnings, the impairment of goodwill and intangible assets, some of which is not deductible for tax purposes, and the recognition of certain state tax incentives resulted in an overall effective tax benefit rate of 28.5% in 2008.
See Note 7 to the consolidated financial statements for additional information regarding our tax rates.
Net Earnings (Loss) Attributable to Brown Shoe Company, Inc.
We reported net earnings attributable to Brown Shoe Company, Inc. of $37.2 million in 2010, compared to $9.5 million last year as a result of the reasons noted above.
We reported net earnings attributable to Brown Shoe Company, Inc. of $9.5 million in 2009, compared to a net loss attributable to Brown Shoe Company, Inc. of $133.2 million in 2008 as a result of the reasons noted above.
Geographic Results
We have both domestic and foreign operations. Domestic operations include the nationwide operation of the Famous Footwear and Specialty Retail chains of footwear stores, the wholesale distribution of footwear to numerous retail customers and the operation of our e-commerce websites. Foreign operations primarily consist of wholesale operations in the Far East, retailing operations in Canada and China and the operation of our international e-commerce websites. In addition, we license certain of our trademarks to third parties who distribute and/or operate retail locations internationally. The Far East operations include first-cost transactions, where footwear is sold at foreign ports to customers who then import the footwear into the United States and other countries. The breakdown of domestic and foreign net sales and earnings (loss) before income taxes was as follows:
|
2010
|
2009
|
2008
|
||||||||||||
|
($ millions)
|
Net Sales
|
Earnings
Before
Income
Taxes
|
Net Sales
|
(Loss)
Earnings
Before
Income
Taxes
|
Net Sales
|
(Loss)
Earnings
Before
Income
Taxes
|
||||||||
|
Domestic
|
$2,179.7
|
|
$23.8
|
$1,978.7
|
$(6.8
|
)
|
$1,916.5
|
$(217.2
|
)
|
|||||
|
Foreign
|
324.4
|
29.4
|
263.3
|
18.5
|
359.9
|
28.6
|
||||||||
|
$2,504.1
|
$53.2
|
$2,242.0
|
$11.7
|
$2,276.4
|
$(188.6
|
)
|
||||||||
30
|
BROWN SHOE COMPANY, INC.
|
2010 FORM 10-K
|
The pretax profitability on foreign sales is higher than on domestic sales because of a lower cost structure and the inclusion in domestic earnings of the unallocated corporate administrative and other costs.
We incurred domestic and foreign earnings before income taxes in 2010 primarily as a result of the strong sales results in both our retail and wholesale businesses, partially offset by higher selling and administrative expenses, a portion of which are variable with higher sales volumes. Our performance is primarily attributable to the record sales results and operating earnings gains within our Famous Footwear segment and sales growth within our Wholesale Operations segment due to capitalization on key footwear trends.
We incurred domestic losses before income taxes in 2009 primarily as a result of the weak consumer environment that existed during the majority of 2009 and the impact of higher selling and administrative expenses and higher interest expense. We began to experience positive business trends in the second half of 2009 as the consumer spending patterns began to improve.
We incurred domestic losses before income taxes in 2008 as a result of the weak consumer environment and the impact of higher domestic costs in 2008 primarily related to the impairment of goodwill and intangible assets and higher restructuring and other special charges, net.
|
FAMOUS FOOTWEAR
|
|||||||||||||
|
2010
|
2009
|
2008
|
|||||||||||
|
($ millions, except sales per square foot)
|
% of
Net Sales
|
% of
Net Sales
|
% of
Net Sales
|
||||||||||
|
Operating Results
|
|||||||||||||
|
Net sales
|
$
|
1,486.5
|
100.0%
|
$
|
1,363.6
|
100.0%
|
$
|
1,320.0
|
100.0%
|
||||
|
Cost of goods sold
|
817.5
|
55.0%
|
770.7
|
56.5%
|
748.4
|
56.7%
|
|||||||
|
Gross profit
|
669.0
|
45.0%
|
592.9
|
43.5%
|
571.6
|
43.3%
|
|||||||
|
Selling and administrative expenses
|
578.6
|
38.9%
|
548.3
|
40.2%
|
537.3
|
40.7%
|
|||||||
|
Impairment of goodwill and intangible assets
|
–
|
–
|
–
|
–
|
3.5
|
0.3%
|
|||||||
|
Restructuring and other special charges, net
|
–
|
–
|
–
|
–
|
3.8
|
0.3%
|
|||||||
|
Operating earnings
|
$
|
90.4
|
6.1%
|
$
|
44.6
|
3.3%
|
$
|
27.0
|
2.0%
|
||||
|
Key Metrics
|
|||||||||||||
|
Same-store sales % change
|
10.5%
|
0.5%
|
(4.7)%
|
||||||||||
|
Same-store sales $ change
|
$
|
138.0
|
$
|
6.9
|
$
|
(60.3
|
)
|
||||||
|
Sales change from new and closed stores, net
|
$
|
(15.1
|
)
|
$
|
36.7
|
$
|
67.1
|
||||||
|
Sales per square foot, excluding e-commerce
|
$
|
187
|
$
|
167
|
$
|
168
|
|||||||
|
Square footage (thousand sq. ft.)
|
7,677
|
7,868
|
7,894
|
||||||||||
|
Stores opened
|
32
|
55
|
89
|
||||||||||
|
Stores closed
|
51
|
64
|
25
|
||||||||||
|
Ending stores
|
1,110
|
1,129
|
1,138
|
||||||||||
Net Sales
Net sales increased $122.9 million, or 9.0%, to $1.5 billion in 2010 compared to $1.4 billion last year. During 2010, same-store sales increased 10.5%, or $138.0 million, reflecting a higher conversion rate in our stores, higher average retail prices and increases in customer traffic levels. Net closed stores resulted in a $15.1 million decrease in net sales, partially offsetting the same-store sales increase. Overall, the improvement in net sales was broad-based with all major categories, channels and geographic regions contributing to the increase. As a result of the same-store sales increase, sales per square foot, excluding e-commerce, increased 11.5% to $187, compared to $167 last year. While we continued our traditional efforts of connecting with and engaging our customers through our customer loyalty program, Rewards, our increased focus on social media also helped maintain a strong brand preference for Famous Footwear with our customers. Approximately 61% of our net sales were made to members of Rewards in 2010 and 2009, compared to 60% in 2008.
31
|
BROWN SHOE COMPANY, INC.
|
2010 FORM 10-K
|
Net sales increased $43.6 million, or 3.3%, to $1.4 billion in 2009 compared to $1.3 billion in 2008. During 2009, net closed stores provided a $36.7 million increase in net sales, and higher average retail prices, partially offset by a decline in customer traffic levels, led to a same-store sales increase of 0.5%, or $6.9 million. The increase in average retail prices was primarily due to overall improvement in the second half of 2009, in particular with strong sales in our boots and health and wellness product categories. Sales per square foot were relatively flat compared to 2008.
Gross Profit
Gross profit increased $76.1 million, or 12.8%, to $669.0 million in 2010 compared to $592.9 million last year due to the higher net sales and a higher gross profit rate. As a percent of net sales, our gross profit increased to 45.0% in 2010 compared to 43.5% last year. The increase in our gross profit rate was driven by a significant decrease in promotional activity and strong sales of higher-margin product categories, including health and wellness and boots, during 2010.
Gross profit increased $21.3 million, or 3.7%, to $592.9 million in 2009 compared to $571.6 million in 2008 due to the increase in net sales and the slight improvement in gross profit rate. As a percent of net sales, our gross profit increased to 43.5% in 2009 compared to 43.3% in 2008.
Selling and Administrative Expenses
Selling and administrative expenses increased $30.3 million, or 5.5%, to $578.6 million during 2010 compared to $548.3 million last year. The increase was primarily attributable to higher selling and merchandising expenses, some of which are variable with higher sales volume, higher marketing expenses and higher anticipated payments under our incentive plans. These increases were partially offset by lower retail facilities expenses, primarily resulting from the lower store count. As a percent of net sales, selling and administrative expenses decreased to 38.9% in 2010 from 40.2% last year, reflecting the better leveraging of our expense base over the higher sales volume.
Selling and administrative expenses increased $11.0 million, or 2.1%, to $548.3 million during 2009 compared to $537.3 million in 2008. The increase was primarily attributable to higher selling and merchandising and retail facilities expenses as a result of the higher sales volume and the higher store count that existed for most of 2009. A decline in marketing expenses partially offset the increases described above. As a percent of net sales, selling and administrative expenses decreased to 40.2% in 2009 from 40.7% in 2008, reflecting the better leveraging of our expense base over the higher sales volume.
Impairment of Goodwill and Intangible Assets
In 2008, we incurred charges related to the impairment of our goodwill of $3.5 million as a result of the deterioration of general economic conditions, industry trends and the resulting decline in our share price and market capitalization, with no corresponding charges in 2010 or 2009. As a percent of net sales, impairment of goodwill and intangible assets was 0.3% in 2008. See Note 1 and Note 10 to the consolidated financial statements for additional information related to impairment of goodwill and intangible assets.
Restructuring and Other Special Charges, Net
We incurred costs related to our expense and capital containment initiatives of $3.8 million in 2008, with no corresponding charges in 2010 or 2009. As a percent of net sales, restructuring and other special charges, net were 0.3% in 2008.
Operating Earnings
Operating earnings increased $45.8 million, or 102.7%, to $90.4 million for 2010, compared to $44.6 million last year. The execution of our strategic initiatives has led to improved performance metrics, including a higher conversion rate in our stores, higher average retail prices and increases in customer traffic levels. These factors resulted in an increase in net sales and gross profit rate, partially offset by the increase in selling and administrative expenses, as described above. As a percent of net sales, operating earnings increased to 6.1% in 2010 compared to 3.3% last year.
Operating earnings increased $17.6 million, or 65.5%, to $44.6 million for 2009, compared to $27.0 million for 2008. The increase was primarily driven by the increase in net sales and gross profit rate, partially offset by the increase in selling and administrative expenses. In addition, we incurred charges in 2008 related to the impairment of our goodwill of $3.5 million and our expense and capital containment initiatives of $3.8 million, with no corresponding charges in 2009. As a percent of net sales, operating earnings increased to 3.3% in 2009 compared to 2.0% in 2008.
32
|
BROWN SHOE COMPANY, INC.
|
2010 FORM 10-K
|
|
WHOLESALE OPERATIONS
|
|
2010
|
2009
|
2008
|
|||||||||||||
|
($ millions)
|
% of
Net Sales
|
% of
Net Sales
|
% of
Net Sales
|
||||||||||||
|
Operating Results
|
|||||||||||||||
|
Net sales
|
$
|
754.4
|
100.0%
|
$
|
631.8
|
100.0%
|
$
|
703.8
|
100.0%
|
||||||
|
Cost of goods sold
|
532.4
|
70.6%
|
426.0
|
67.4%
|
497.9
|
70.7%
|
|||||||||
|
Gross profit
|
222.0
|
29.4%
|
205.8
|
32.6%
|
205.9
|
29.3%
|
|||||||||
|
Selling and administrative expenses
|
189.1
|
25.0%
|
164.4
|
26.0%
|
170.3
|
24.2%
|
|||||||||
|
Restructuring and other special charges, net
|
0.7
|
0.1%
|
0.3
|
0.1%
|
14.4
|
2.1%
|
|||||||||
|
Impairment of goodwill and intangible assets
|
–
|
–
|
–
|
–
|
129.1
|
18.4%
|
|||||||||
|
Equity in net loss of nonconsolidated affiliate
|
–
|
–
|
–
|
–
|
0.2
|
0.0%
|
|||||||||
|
Operating earnings (loss)
|
$
|
32.2
|
4.3%
|
$
|
41.1
|
6.5%
|
$
|
(108.1
|
)
|
(15.4)%
|
|||||
|
Key Metrics
|
|||||||||||||||
|
Unfilled order position at year-end
|
$
|
243.8
|
$
|
246.0
|
$
|
200.2
|
|||||||||
Net Sales
Net sales increased $122.6 million, or 19.4%, to $754.4 million in 2010 compared to $631.8 million last year. Demand for many of our brands continued to strengthen during 2010, as our brand performance at our retail customers improved. We experienced sales growth in nearly all of our brands, primarily led by our Naturalizer, Dr. Scholl’s, Sam Edelman, Via Spiga and Vera Wang Lavender divisions. The sales growth was driven by sales increases across nearly all of our channels of distribution, particularly in the mid-tier channel. Our unfilled order position decreased $2.2 million, or 0.9%, to $243.8 at the end of 2010, as compared to $246.0 million at the end of 2009. The unfilled order position is consistent with our net sales expectations for our wholesale business, exclusive of the impact of ASG, for the first quarter of 2011 as compared to the first quarter of 2010.
Net sales decreased $72.0 million, or 10.2%, to $631.8 million in 2009 compared to $703.8 million in 2008. With some exceptions, the challenging retail environment during 2009 softened demand for many of our brands as retailers reduced inventory levels across our channels of distribution in response to weak consumer spending. We also continued to experience a decline in our private label business. We experienced sales declines from most of our brands, including primarily our Women’s Specialty, Franco Sarto, Children’s and Etienne Aigner divisions. These declines were partially offset by sales growth in our Sam Edelman (Edelman Shoe, Inc. was first consolidated in the fourth quarter of 2008), Carlos by Carlos Santana and Fergie/Fergalicious by Fergie divisions as well as initial sales from our Vera Wang Lavender division. By channel of distribution, we experienced sales declines primarily from mass merchandisers.
Gross Profit
Gross profit increased $16.2 million, or 7.9%, to $222.0 million in 2010 compared to $205.8 million last year due to the increase in net sales, partially offset by a decline in gross profit rate. As a percent of net sales, our gross profit decreased to 29.4% in 2010, from 32.6% last year. The decrease in gross profit rate was primarily due to industry-wide sourcing and supply chain issues that led to increased delivery costs and disruption in the timing of deliveries, leading to lower initial margins and greater markdowns and allowances, and order fulfillment was further aggravated by the business process changes, data conversion and learning curves associated with the Company’s systems transition that went live in December 2010. Additionally, shifts in channel and customer mix negatively impacted the gross profit rate.
Gross profit decreased $0.1 million, or 0.1%, to $205.8 million in 2009 compared to $205.9 million in 2008 due to a decline in net sales partially offset by a higher gross profit rate. As a percent of net sales, our gross profit increased to 32.6% in 2009, from 29.3% in 2008. The increase in gross profit rate was due primarily to shifts in channel and brand mix and lower provisions for customer allowances. In addition, the higher-margin boot category performed comparatively better in 2009.
Selling and Administrative Expenses
Selling and administrative expenses increased $24.7 million, or 15.1%, to $189.1 million during 2010 compared to $164.4 million last year, due primarily to higher anticipated payments under our incentive plans, higher marketing expenses and higher selling and merchandising expenses, some of which are variable with higher sales volume. As a percent of net sales, selling and administrative expenses decreased to 25.0% in 2010 from 26.0% last year, reflecting the better leveraging of our expense base over the higher sales volume.
33
|
BROWN SHOE COMPANY, INC.
|
2010 FORM 10-K
|
Selling and administrative expenses decreased $5.9 million, or 3.6%, to $164.4 million during 2009 compared to $170.3 million in 2008, due primarily to lower sourcing and general and administrative expenses that resulted from savings as a result of our expense and capital containment initiatives implemented at the beginning of 2009. These declines were partially offset by an increase in expenses associated with the consolidation of Edelman Shoe and new brand launches. As a percent of net sales, selling and administrative expenses increased to 26.0% in 2009 from 24.2% in 2008, reflecting the de-leveraging of our expense base over the lower sales volume.
Impairment of Goodwill and Intangible Assets
In 2008, we incurred charges related to the impairment of our goodwill and intangible assets of $129.1 million as a result of the deterioration of general economic conditions, industry trends and the resulting decline in our share price and market capitalization, with no corresponding charges in 2010 or 2009. As a percent of net sales, impairment of goodwill and intangible assets was 18.4% in 2008. See Note 1 and Note 10 to the consolidated financial statements for additional information related to impairment of goodwill and intangible assets.
Restructuring and Other Special Charges, Net
Restructuring and other special charges, net increased $0.4 million to $0.7 million, with $0.3 million of corresponding charges last year. All charges incurred during 2010 and 2009 were related to our information technology initiatives. As a percent of net sales, restructuring and other special charges, net was 0.1% in 2010 and 2009.
Restructuring and other special charges, net decreased $14.1 million to $0.3 million in 2009 compared to $14.4 million in 2008. The decrease was attributable to expense and capital containment initiative costs of $14.4 million incurred in 2008, with no corresponding charges in 2009. Charges incurred during 2009 related to our information technology initiatives of $0.3 million partially offset the decline from 2008. As a percent of net sales, restructuring and other special charges, net decreased to 0.1% in 2009 from 2.1% in 2008.
Equity in Net Loss of Nonconsolidated Affiliate
Since our initial investment in Edelman Shoe during 2007, we recorded our portion of Edelman Shoe’s operating results in our financial statements based upon the equity method of accounting as equity in net loss of nonconsolidated affiliate. We continued to record the results of Edelman Shoe using the equity method until November 3, 2008 (fourth quarter of 2008), when we purchased additional shares of Edelman Shoe. Since that date, the results of Edelman Shoe were fully consolidated into our financial statements, with net earnings or loss related to the noncontrolling interests reflected in the line titled Less: Net earnings (loss) attributable to noncontrolling interests on our consolidated statement of earnings. On June 4, 2010, we acquired the remaining 50% of the outstanding stock of Edelman Shoe. The acquisition was accounted for in accordance with the consolidation guidance applicable to noncontrolling interests. As a result, the Company’s acquisition of the remaining interest in Edelman Shoe resulted in the elimination of $8.6 million of the noncontrolling interest in Edelman Shoe. As of June 4, 2010, Edelman Shoe is a wholly-owned subsidiary of the Company. See Note 2 to the consolidated financial statements for additional information related to Edelman Shoe.
Operating Earnings (Loss)
Operating earnings decreased $8.9 million, or 21.6%, to $32.2 million in 2010 compared to $41.1 million last year. The decrease was primarily driven by the increase in selling and administrative expenses and decrease in gross profit rate, partially offset by the increase in net sales. As a percent of net sales, operating earnings decreased to 4.3% in 2010 compared to 6.5% last year.
Operating earnings increased $149.2 million, or 138.1%, to $41.1 million in 2009 compared to an operating loss of $108.1 million in 2008, reflecting primarily the nonrecurrence of the charge for impairment of goodwill and intangible assets and declines in restructuring and other special charges, net and selling and administrative expenses, as described above. As a percent of net sales, operating earnings increased to 6.5% in 2010 compared to an operating loss of 15.4% in 2008.
34
|
BROWN SHOE COMPANY, INC.
|
2010 FORM 10-K
|
|
SPECIALTY RETAIL
|
|
2010
|
2009
|
2008
|
|||||||||||||||
|
($ millions, except sales per square foot)
|
% of
Net Sales
|
% of
Net Sales
|
% of
Net Sales
|
||||||||||||||
|
Operating Results
|
|||||||||||||||||
|
Net sales
|
$
|
263.2
|
100.0%
|
$
|
246.6
|
100.0%
|
$
|
252.5
|
100.0%
|
||||||||
|
Cost of goods sold
|
150.7
|
57.2%
|
142.2
|
57.6%
|
147.8
|
58.5%
|
|||||||||||
|
Gross profit
|
112.5
|
42.8%
|
104.4
|
42.4%
|
104.7
|
41.5%
|
|||||||||||
|
Selling and administrative expenses
|
118.5
|
45.1%
|
118.6
|
48.2%
|
118.0
|
46.8%
|
|||||||||||
|
Impairment of goodwill and intangible assets
|
–
|
–
|
–
|
–
|
16.6
|
6.6%
|
|||||||||||
|
Restructuring and other special charges, net
|
–
|
–
|
–
|
–
|
0.6
|
0.2%
|
|||||||||||
|
Operating loss
|
$
|
(6.0
|
)
|
(2.3)%
|
$
|
(14.2
|
)
|
(5.8)%
|
$
|
(30.5
|
)
|
(12.1)%
|
|||||
|
Key Metrics
|
|||||||||||||||||
|
Same-store sales % change
|
6.6%
|
0.8%
|
(3.4)%
|
||||||||||||||
|
Same-store sales $ change
|
$
|
10.5
|
$
|
1.3
|
$
|
(6.0
|
)
|
||||||||||
|
Sales change from new and closed stores, net
|
$
|
(9.7
|
)
|
$
|
0.2
|
$
|
3.1
|
||||||||||
|
Impact of changes in Canadian exchange rate on sales
|
$
|
6.0
|
$
|
(1.3
|
)
|
$
|
(3.4
|
)
|
|||||||||
|
Sales change of e-commerce subsidiary
|
$
|
9.8
|
$
|
(6.1
|
)
|
$
|
(4.4
|
)
|
|||||||||
|
Sales per square foot, excluding e-commerce
|
$
|
381
|
$
|
341
|
$
|
348
|
|||||||||||
|
Square footage (thousand sq. ft.)
|
417
|
456
|
487
|
||||||||||||||
|
Stores opened
|
15
|
8
|
31
|
||||||||||||||
|
Stores closed
|
38
|
32
|
9
|
||||||||||||||
|
Ending stores
|
259
|
282
|
306
|
||||||||||||||
Net Sales
Net sales increased $16.6 million, or 6.7%, to $263.2 million in 2010 compared to $246.6 million last year. A same-store sales increase of 6.6% in our retail stores, higher net sales at Shoes.com and an increase in the Canadian dollar exchange rate led to an overall increase in our level of net sales. A lower store count, as a result of store closings, partially offset the net sales increases. The net sales of Shoes.com increased $9.8 million, or 14.4%, to $77.9 million in 2010 compared to $68.1 million last year, reflecting an increase in site visits and a higher conversion rate. We opened 15 new stores (including eight new Naturalizer stores in China) and closed 38 stores (including seven Naturalizer stores in China) during 2010, resulting in a total of 259 stores (including 15 Naturalizer stores in China) and total square footage of 417,000 at the end of 2010 compared to 282 stores (including 14 Naturalizer stores in China) and total square footage of 456,000 at the end of last year. As a result of the above-named factors, sales per square foot, excluding e-commerce, increased 11.8% to $381 compared to $341 last year.
Net sales decreased $5.9 million, or 2.4%, to $246.6 million in 2009 compared to $252.5 million in 2008. Lower net sales at Shoes.com and a decline in the Canadian dollar exchange rate, partially offset by an increase in same-store sales of 0.8% in our retail stores, led to an overall decrease in our level of net sales. The net sales of Shoes.com decreased $6.1 million, or 8.3%, to $68.1 million in 2009 compared to $74.2 million in 2008, reflecting a decline in site visits. During 2009, we opened eight new stores (including three new Naturalizer stores in China) and closed 32 stores (including eight Naturalizer stores in China), resulting in a total of 282 stores (including 14 Naturalizer stores in China) and total square footage of 456,000 at the end of 2009 compared to 306 stores (including 19 Naturalizer stores in China) and total square footage of 487,000 at the end of 2008. Sales per square foot decreased 2.1% to $341 compared to $348 in 2008.
Gross Profit
Gross profit increased $8.1 million, or 7.7%, to $112.5 million in 2010 compared to $104.4 million last year, reflecting higher net sales and a slight increase in gross profit rate. As a percent of net sales, our gross profit increased to 42.8% in 2010, from 42.4% last year, due to an increase in gross profit rate in our retail stores resulting from improved retail sell-through, partially offset by a lower gross profit rate for Shoes.com.
35
|
BROWN SHOE COMPANY, INC.
|
2010 FORM 10-K
|
Gross profit decreased $0.3 million, or 0.3%, to $104.4 million in 2009 compared to $104.7 million in 2008, reflecting lower net sales, partially offset by an increase in gross profit rate. As a percent of net sales, our gross profit increased to 42.4% in 2009, from 41.5% in 2008, driven by lower freight expenses and lower markdowns at Shoes.com. As a percent of net sales, gross profit in our retail stores declined during 2009.
Selling and Administrative Expenses
Selling and administrative expenses decreased $0.1 million, or 0.2%, to $118.5 million during 2010 compared to $118.6 million last year, primarily resulting from the lower store count, partially offset by an increase in the Canadian dollar exchange rate. As a percent of net sales, selling and administrative expenses decreased to 45.1% in 2010 compared to 48.2% last year reflecting the factors listed above and better leveraging of our expense base over the higher sales volume.
Selling and administrative expenses increased $0.6 million, or 0.5%, to $118.6 million during 2009 compared to $118.0 million in 2008. The increase reflects higher general and administrative and retail facility expenses, partially offset by a decline in marketing expenses. As a percent of net sales, selling and administrative expenses increased to 48.2% in 2009 compared to 46.8% in 2008 primarily as a result of the decline in net sales.
Impairment of Goodwill and Intangible Assets
In 2008, we incurred charges related to the impairment of our goodwill of $16.6 million as a result of the deterioration of general economic conditions, industry trends and the resulting decline in our share price and market capitalization, with no corresponding charges in 2010 or 2009. As a percent of net sales, impairment of goodwill and intangible assets was 6.6% in 2008. See Note 1 and Note 10 to the consolidated financial statements for additional information related to impairment of goodwill and intangible assets.
Restructuring and Other Special Charges, Net
We incurred costs related to our expense and capital containment initiatives of $0.6 million in 2008, with no corresponding charges in 2010 or 2009. As a percent of net sales, restructuring and other special charges, net were 0.2% in 2008.
Operating Loss
Operating loss decreased $8.2 million, or 58.1%, to $6.0 million for 2010 compared to $14.2 million for last year, primarily due to an increase in net sales, as described above.
Operating loss decreased $16.3 million, or 53.3%, to $14.2 million for 2009 compared to $30.5 million for 2008, due primarily to the nonrecurrence of $16.6 million in charges related to the impairment of goodwill experienced in 2008.
|
OTHER
|
The Other segment includes unallocated corporate administrative and other costs and recoveries. The segment reported costs of $44.0 million, $40.0 million and $61.7 million in 2010, 2009 and 2008, respectively.
There were several factors impacting the $4.0 million increase in costs from 2009 to 2010, as follows:
|
·
|
Incentive plans – Our selling and administrative expenses were higher by $3.3 million during 2010, compared to 2009, due to higher anticipated payments under our incentive plans.
|
|
·
|
Acquisition-related costs – During 2010, we incurred costs of $1.1 million related to the acquisition of ASG, which closed on February 17, 2011, with no corresponding costs in 2009.
|
|
·
|
Headquarters consolidation – During 2009, we recorded income of $1.9 million as a result of an expanded lease arrangement with no corresponding income recorded during 2010.
|
|
·
|
Higher expenses related to retirement plans.
|
|
·
|
Organizational changes – We incurred charges of $4.6 million during 2009 related to the retirement of two executive officers announced in the fourth quarter of 2009, with no corresponding charges recorded during 2010.
|
|
·
|
Information technology initiatives:
|
|
o
|
We incurred charges of $6.8 million during 2010, related to our integrated ERP information technology system, $2.1 million lower than the $8.9 million in corresponding charges last year.
|
|
o
|
We incurred higher amortization expense related to the integrated ERP information technology system during 2010 as compared to 2009.
|
36
|
BROWN SHOE COMPANY, INC.
|
2010 FORM 10-K
|
There were several factors impacting the $21.7 million decrease in costs from 2008 to 2009, as follows:
|
·
|
Incentive plans – Our selling and administrative expenses were higher by $6.5 million during 2009 compared to 2008, due to changes in anticipated payments under our incentive plans.
|
|
·
|
Information technology initiatives – We incurred expenses of $8.9 million during 2009 related to our integrated ERP information technology system, with $3.7 million in corresponding expenses in 2008.
|
|
·
|
Organizational changes – We incurred charges of $4.6 million during 2009 related to the retirement of two executive officers announced in the fourth quarter of 2009.
|
|
·
|
Headquarters consolidation – In 2008, we incurred charges of $29.8 million related to the relocation and transition of our Famous Footwear division headquarters. During 2009, we recorded income of $1.9 million as a result of an expanded sublease arrangement.
|
|
·
|
Expense and capital containment initiatives – We incurred charges of $12.1 million in 2008 related to our expense and capital containment initiatives, with no corresponding charges in 2009.
|
|
·
|
Environmental insurance recoveries and charges – We recorded income related to environmental insurance recoveries, net of associated fees and costs, of $10.2 million in 2008, with no corresponding recoveries during 2009.
|
|
·
|
Lower expenses resulting from our expense and capital containment initiatives.
|
|
RESTRUCTURING AND OTHER SPECIAL CHARGES, NET
|
During 2010, we recorded restructuring and other special charges, net of $7.9 million, including $6.8 million in expenses related to our information technology initiatives and $1.1 million in acquisition-related costs related to our February 17, 2011, acquisition of ASG. See the Financial Highlights and Recent Developments sections above and Note 2 and Note 5 to the consolidated financial statements for additional information related to these charges and the acquisition of ASG.
During 2009, we recorded restructuring and other special charges, net of $11.9 million, including $9.2 million in expenses related to our information technology initiatives, $4.6 million in expenses related to the retirement of two executive officers, partially offset by $1.9 million of income related to our headquarters consolidation. See the Recent Developments section above and Note 5 to the consolidated financial statements for additional information related to these charges and recoveries.
During 2008, we recorded restructuring and other special charges, net of $54.3 million, including $30.9 million in charges related to our expense and capital containment initiatives, $29.8 million in charges associated with our headquarters consolidation and $3.7 million in expenses related to our information technology initiatives, partially offset by $10.1 million of income related to insurance recoveries, net of associated fees and costs. See Note 5 to the consolidated financial statements for additional information related to these charges and recoveries.
|
IMPACT OF INFLATION AND CHANGING PRICES
|
The effects of inflation on our business and results of operations have not been significant over the last three years. Inflation can have a long-term impact on our business because increasing costs of materials and labor may impact our ability to maintain satisfactory margins. For example, our products are manufactured in other countries, and a decline in the value of the U.S. dollar and the impact of labor shortages in China may result in higher manufacturing costs. Similarly, any potential significant shortage of quantities or increases in the cost of the materials that are used in our manufacturing process, such as leather and other materials or resources, could have a material adverse effect on our business and results of operations. In addition, inflation often is accompanied by higher interest rates, which could have a negative impact on consumer spending, in which case our net sales and margins could decrease. Moreover, increases in inflation may not be matched by rises in income, which also could have a negative impact on consumer spending. If we incur increased costs that are unable to be recovered through price increases, or if consumer spending decreases generally, our business, results of operations, financial condition and cash flows may be adversely affected. In an effort to mitigate the impact of these incremental costs on our operating results, we expect to pass on some portion of cost increases to our consumers and adjust our business model, as appropriate, to minimize the impact of higher costs. Further discussion of the risks related to inflation and changing prices is included in Item 1A, Risk Factors.
37
|
BROWN SHOE COMPANY, INC.
|
2010 FORM 10-K
|
|
LIQUIDITY AND CAPITAL RESOURCES
|
Borrowings
|
($ millions)
|
January 29, 2011
|
January 30, 2010
|
Increase/
(Decrease)
|
||||||
|
Borrowings under Revolving Credit Agreement
|
$
|
198.0
|
$
|
94.5
|
$
|
103.5
|
|||
|
Senior notes
|
150.0
|
150.0
|
–
|
||||||
|
Total debt
|
$
|
348.0
|
$
|
244.5
|
$
|
103.5
|
|||
Total debt obligations increased $103.5 million, or 42.3%, to $348.0 million at the end of 2010 compared to $244.5 million at the end of last year, due to an increase in borrowings under our Revolving Credit Agreement. Interest expense in 2010 was $19.7 million compared to $20.2 million in 2009 and $17.1 million in 2008.
Credit Agreement
On January 7, 2011, Brown Shoe Company, Inc. and certain of our subsidiaries (the “Loan Parties”) entered into a Third Amended and Restated Credit Agreement (the “Credit Agreement”). The Credit Agreement replaces the Second Amended and Restated Credit Agreement, dated as of January 21, 2009 (the “Former Credit Agreement”), which was scheduled to mature on January 21, 2014. The Credit Agreement now matures on January 7, 2016. As of the end of 2010, the Credit Agreement provides for revolving credit in an aggregate amount of up to $380.0 million, subject to the calculated borrowing base restrictions, and may be increased at the Company’s option (a) by up to $150.0 million from time to time during the term of the Credit Agreement (the “general purpose accordion feature”) and (b) by an additional $150.0 million prior to February 28, 2011 (the “designated event accordion feature”), in both instances subject to the approval of lenders and the satisfaction of certain conditions. Borrowing availability under the Credit Agreement is limited to the lesser of the total commitments and the borrowing base, which is based on stated percentages of the sum of eligible accounts receivable and inventory, as defined, less applicable reserves. Under the Credit Agreement, the Loan Parties’ obligations are secured by a first priority security interest in all accounts receivable, inventory and certain other collateral.
Interest on borrowings is at variable rates based on the London Inter-Bank Offered Rate (“LIBOR”) or the prime rate, as defined in the Credit Agreement, plus a spread. The interest rate and fees for letters of credit varies based upon the level of excess availability under the Credit Agreement. There is an unused line fee payable on the unused portion under the facility and a letter of credit fee payable on the outstanding face amount under letters of credit.
The Credit Agreement limits our ability to incur additional indebtedness, create liens, make investments or specified payments, give guarantees, pay dividends, make capital expenditures and merge or acquire or sell assets. In addition, certain additional covenants would be triggered if excess availability were to fall below specified levels, including fixed charge coverage ratio requirements. Furthermore, if excess availability falls below the greater of (i) 15.0% of the lesser of (x) the borrowing base or (y) the total commitments and (ii) $35.0 million for three consecutive business days, or an event of default occurs, the lenders may assume dominion and control over our cash (a “cash dominion event”) until such event of default is cured or waived or the excess availability exceeds such amount for 30 consecutive days.
The Credit Agreement contains customary events of default including, without limitation, payment defaults, breaches of representations and warranties, covenant defaults, cross-defaults to other material indebtedness, certain events of bankruptcy and insolvency, judgment defaults in excess of a certain threshold, the failure of any guaranty or security document supporting the agreement to be in full force and effect and a change of control event. In addition, if the excess availability falls below the greater of (i) 12.5% of the lesser of (x) the borrowing base or (y) the total commitments and (ii) $35.0 million and the fixed charge coverage ratio is less than 1.0 to 1.0, we would be in default under the Credit Agreement. The Credit Agreement also contains certain other covenants and restrictions. We were in compliance with all covenants and restrictions under the Credit Agreement as of January 29, 2011.
At January 29, 2011, we had $198.0 million in borrowings outstanding and $10.4 million in letters of credit outstanding under the Credit Agreement. Total additional borrowing availability was $171.6 million at January 29, 2011.
Effective February 17, 2011, the Loan Parties exercised the $150.0 million designated event accordion feature to fund the acquisition of ASG, increasing the aggregate amount available under the Credit Agreement from $380.0 million to $530.0 million. The Credit Agreement still provides for access to an additional $150.0 million of optional availability pursuant to the general purpose accordion feature, subject to satisfaction of certain conditions and approval of the lenders.
We believe that borrowing capacity under our Credit Agreement will be adequate to meet our expected operational needs, capital expenditure plans and provide liquidity for potential acquisitions.
38
|
BROWN SHOE COMPANY, INC.
|
2010 FORM 10-K
|
Senior Notes
In April 2005, we issued $150.0 million of 8.75% senior notes due in 2012 (“Senior Notes”). The Senior Notes are guaranteed on a senior unsecured basis by each of the subsidiaries of Brown Shoe Company, Inc. that is an obligor under the Credit Agreement. Interest on the Senior Notes is payable on May 1 and November 1 of each year. The Senior Notes mature on May 1, 2012, but became callable on May 1, 2009. We may redeem all or a part of the Senior Notes at the redemption prices (expressed as a percentage of principal amount) set forth below plus accrued and unpaid interest, if redeemed during the 12-month period beginning on May 1 of the years indicated below:
|
Year
|
Percentage
|
|
2010
|
102.188%
|
|
2011 and thereafter
|
100.000%
|
The Senior Notes also contain certain other covenants and restrictions that limit certain activities including, among other things, levels of indebtedness, payments of dividends, the guarantee or pledge of our assets, certain investments, common stock repurchases, mergers and acquisitions and sales of assets. As of January 29, 2011, we were in compliance with all covenants relating to the Senior Notes.
We anticipate that we will refinance our Senior Notes during 2011. We believe we will be able to refinance our Senior Notes on favorable terms, but can give no assurance that we will be able to do so.
Working Capital and Cash Flow
|
January 29, 2011
|
January 30, 2010
|
Increase/
(Decrease)
|
|||||||
|
Working capital ($ millions) (1)
|
$
|
296.4
|
$
|
294.2
|
$
|
2.2
|
|||
|
Debt-to-capital ratio (2)
|
45.6%
|
37.3%
|
8.3%
|
||||||
|
Current ratio (3)
|
1.58:1
|
1.71:1
|
|||||||
| (1) | Working capital has been computed as total current assets less total current liabilities. | |
| (2) | Debt-to-capital has been computed by dividing total debt by total capitalization. Total debt is defined as long-term debt and borrowings under the Revolving Credit Agreement. Total capitalization is defined as total debt and total equity. | |
| (3) | The current ratio has been computed by dividing total current assets by total current liabilities. |
|
|
|||||||||
|
2010
|
2009
|
Increase/
(Decrease) in
Cash and Cash
Equivalents
|
|||||||
|
Net cash (used for) provided by operating activities
|
$
|
(2.3
|
)
|
$
|
118.1
|
$
|
(120.4
|
)
|
|
|
Net cash used for investing activities
|
(54.8
|
)
|
(50.0
|
)
|
(4.8
|
)
|
|||
|
Net cash provided by (used for) financing activities
|
57.3
|
(30.0
|
)
|
87.3
|
|||||
|
Effect of exchange rate changes on cash and cash equivalents
|
0.5
|
0.8
|
(0.3
|
)
|
|||||
|
Increase in cash and cash equivalents
|
$
|
0.7
|
$
|
38.9
|
$
|
(38.2
|
)
|
||
Working capital at January 29, 2011, was $296.4 million, which was $2.2 million higher than at January 30, 2010. Our current ratio decreased to 1.58 to 1 at January 29, 2011, from 1.71 to 1 at January 30, 2010. The increase in working capital is primarily attributable to higher inventories and receivables and lower trade accounts payable, partially offset by higher borrowings under our Revolving Credit Agreement in 2010 as compared to 2009. Our ratio of debt-to-capital increased to 45.6% as of January 29, 2011, compared to 37.3% at January 30, 2010, primarily due to our $103.5 million increase in borrowings under our Revolving Credit Agreement at the end of 2010 due in part to the higher working capital levels, discussed above, and our acquisition of the remaining 50% of our noncontrolling interest in Edelman Shoe, as described further in Note 2 to the consolidated financial statements. At January 29, 2011, we had $126.5 million of cash and cash equivalents, most of which represented cash and cash equivalents of our foreign subsidiaries.
39
|
BROWN SHOE COMPANY, INC.
|
2010 FORM 10-K
|
Reasons for the major variances in cash provided (used) in the table above are as follows:
Cash flow from operating activities was $120.4 million lower in 2010 as compared to 2009, reflecting several factors:
|
·
|
An increase in inventories during 2010 compared to a decrease in inventories last year to support higher current-year sales levels and the accelerated timing of inventory receipts;
|
|
·
|
A decrease in trade accounts payable in 2010 compared to an increase in trade accounts payable last year due to the timing and amount of purchases and payments to vendors; and
|
|
·
|
A larger increase in receivables during 2010 as compared to last year due to higher sales levels in our Wholesale Operations segment.
|
These factors were partially offset by an increase in net earnings.
Cash used for investing activities was higher by $4.8 million as a result of higher purchases of property and equipment in 2010, as compared to 2009, primarily related to remodeled stores. The increase was partially offset by lower capitalization of software primarily related to our information technology initiatives during both years. At our retail division, we opened 47 stores during 2010 compared to 63 stores in 2009. In 2011, we expect purchases of property and equipment and capitalized software of approximately $58.0 million to $60.0 million, primarily related to our new and remodeled stores, logistics network and general infrastructure.
Cash flow from financing activities was $87.3 million higher than last year, primarily due to higher borrowings, net of repayments, under our Revolving Credit Agreement. Partially offsetting this increase, in 2010, we acquired the remaining 50% of our noncontrolling interest in Edelman Shoe as well as incurred $2.6 million of debt issuance costs in connection with our new Revolving Credit Agreement, with no corresponding costs in 2009.
We paid dividends of $0.28 per share in each of 2010, 2009 and 2008. The 2010 dividends marked the 88th year of consecutive quarterly dividends. On March 3, 2011, the Board of Directors declared a quarterly dividend of $0.07 per share, payable April 1, 2011, to shareholders of record on March 18, 2011, marking the 353rd consecutive quarterly dividend to be paid by the Company. The declaration and payment of any future dividend is at the discretion of the Board of Directors and will depend on our results of operations, financial condition, business conditions and other factors deemed relevant by our Board of Directors; however, we presently expect that dividends will continue to be paid.
|
CRITICAL ACCOUNTING POLICIES AND ESTIMATES
|
Certain accounting issues require management estimates and judgments for the preparation of financial statements. Our most significant policies requiring the use of estimates and judgments are listed below.
Revenue Recognition
Retail sales, recognized at the point of sale, are net of returns and exclude sales tax. Wholesale sales and sales through our internet sites are recorded, net of returns, allowances and discounts, when the merchandise has been shipped and title and risk of loss have passed to the customer. Retail items sold through our internet sites are made pursuant to a sales agreement that provides for transfer of both title and risk of loss upon our delivery to the carrier. Reserves for projected merchandise returns, discounts and allowances are carried based on historical experience and current expectations. Revenue is recognized on license fees related to our owned brand names, where we are licensor, when the related sales of the licensee are made.
Gift Cards
We sell gift cards to our customers in our retail stores and through our internet sites. Our gift cards do not have expiration dates or inactivity fees. We recognize revenue from gift cards when (i) the gift card is redeemed by the customer, or (ii) the likelihood of the gift card being redeemed by the customer is remote (“gift card breakage”), and we determine that we do not have a legal obligation to remit the value of unredeemed gift cards to the relevant jurisdictions. We determine our gift card breakage rate based upon historical redemption patterns. We recognize gift card breakage during the 24-month period following the sale of the gift card, according to our historical redemption pattern. Gift card breakage income is included in net sales in the consolidated statements of earnings, and the liability established upon the sale of a gift card is included in other accrued expenses within the consolidated balance sheets. We recognized $0.6 million, $0.5 million and $0.4 million of gift card breakage in 2010, 2009 and 2008, respectively.
40
|
BROWN SHOE COMPANY, INC.
|
2010 FORM 10-K
|
Inventories
Inventories are our most significant asset, representing approximately 46% of total assets at the end of 2010. We value inventories at the lower of cost or market, with 93% of consolidated inventories using the last-in, first-out (“LIFO”) method. An actual valuation of inventory under the LIFO method can be made only at the end of each year based on the inventory levels and costs at that time. Accordingly, interim LIFO calculations are based on management’s estimates of expected year-end inventory levels and costs and are subject to the final year-end LIFO inventory valuation.
We apply judgment in valuing our inventories by assessing the net realizable value of our inventories based on current selling prices. At our Famous Footwear division, we recognize markdowns when it becomes evident that inventory items will be sold at retail prices less than cost, plus the cost to sell the product. This policy causes gross profit rates at Famous Footwear to be lower than the initial markup during periods when permanent price reductions are taken to clear product. At our other divisions, we generally provide markdown reserves to reduce the carrying values of inventories to a level where, upon sale of the product, we will realize our normal gross profit rate. We believe these policies reflect the difference in operating models between Famous Footwear and our other divisions. Famous Footwear periodically runs promotional events to drive seasonal sales to clear seasonal inventories. The other divisions rely on permanent price reductions to clear slower-moving inventory.
The Company physically counts all merchandise inventory on hand at least annually and adjusts the recorded balance to reflect the results of the physical counts. The Company records estimated shrinkage between physical inventory counts based on historical results. Inventory shrinkage is included as a component of cost of goods sold.
Income Taxes
We record deferred taxes for the effects of timing differences between financial and tax reporting. These differences relate principally to employee benefit plans, accrued expenses, bad debt reserves, depreciation and amortization and inventory.
We evaluate our foreign investment opportunities and plans, as well as our foreign working capital needs, to determine the level of investment required and, accordingly, determine the level of foreign earnings that we consider indefinitely reinvested. Based upon that evaluation, earnings of our foreign subsidiaries that are not otherwise subject to United States taxation, except for our Canadian subsidiary, are considered to be indefinitely reinvested, and accordingly, deferred taxes have not been provided. If changes occur in future investment opportunities and plans, those changes will be reflected when known and may result in providing residual United States deferred taxes on unremitted foreign earnings.
At January 29, 2011, we have net operating loss carryforwards at certain of our subsidiaries. We evaluate these carryforwards for realization based upon their expiration dates and our expectations of future taxable income. As deemed appropriate, valuation reserves are recorded to adjust the recorded value of these carryforwards to the expected realizable value.
We are audited periodically by domestic and foreign tax authorities and tax assessments may arise several years after tax returns have been filed. Tax liabilities are recorded when, in management’s judgment, a tax position does not meet the more-likely-than-not threshold for recognition. For tax positions that meet the more-likely-than-not threshold, a tax liability may be recorded depending on management’s assessment of how the tax position will ultimately be settled. In evaluating issues raised in such audits and other uncertain tax positions, we provide reserves for exposures as appropriate.
Goodwill and Intangible Assets
Goodwill and intangible assets deemed to have indefinite lives are not amortized but are subject to annual impairment tests. Future impairment charges on our intangible assets may be required if the fair value becomes less than carrying value. The determination of the fair value is highly subjective as it is determined largely by projections of future profitability and cash flows. This evaluation utilizes discounted cash flow analysis and analyses of historical and forecasted operating results. We perform impairment tests during the fourth quarter of each fiscal year unless events indicate an interim test is required. Other intangible assets are amortized over their useful lives and are reviewed for impairment if and when impairment indicators are present. See Note 1 and Note 10 to the consolidated financial statements for additional information related to the impairment of intangible assets.
Self-Insurance
We are self-insured and/or retain high deductibles for a significant portion of our workers’ compensation, employment practices, health, disability, cyber risk, general liability, automobile and property programs, among others. We purchase varying levels of insurance for losses in excess of our deductibles or self-insured retentions for these categories of loss. At January 29, 2011, and January 30, 2010, self-insurance reserves were $10.8 million and $10.4 million, respectively. We utilize (i) estimates from third-party actuaries and claims adjusters, (ii) statistical analyses of historical data for our industry and our Company and (iii) our own estimates to determine required self-insurance reserves. Our reserves and assumptions are reviewed, monitored and adjusted when warranted by changing circumstances. Actual experience may vary from estimates and result in adjustments to our self-insurance liabilities.
41
|
BROWN SHOE COMPANY, INC.
|
2010 FORM 10-K
|
Store Closing and Impairment Charges
We regularly analyze the results of all of our stores and assess the viability of underperforming stores to determine whether events or circumstances exist that indicate the stores should be closed or whether the carrying amount of their long-lived assets may not be recoverable. After allowing for an appropriate start-up period, unusual nonrecurring events or favorable trends, we write down to fair value the fixed assets of stores indicated as impaired.
Litigation Contingencies
We are the defendant in several claims and lawsuits arising in the ordinary course of business. We do not believe any of these ordinary- course-of-business proceedings will have a material adverse effect on our consolidated financial position or results of operations. We accrue our best estimate of the cost of resolution of these claims. Legal defense costs of such claims are recognized in the period in which we incur the costs. See Note 18 to the consolidated financial statements for a further description of commitments and contingencies.
Environmental Matters
We are involved in environmental remediation and ongoing compliance activities at several sites. We are remediating, under the oversight of Colorado authorities, the groundwater and indoor air at our Redfield site and residential neighborhoods adjacent to and near the property, which have been affected by solvents previously used at the facility. In addition, various federal and state authorities have identified us as a potentially responsible party for remediation at certain landfills. While we currently do not operate manufacturing facilities in the United States, prior operations included numerous manufacturing and other facilities for which we may have responsibility under various environmental laws to address conditions that may be identified in the future. See Note 18 to the consolidated financial statements for a further description of specific properties.
Environmental expenditures relating to an existing condition caused by past operations and that do not contribute to current or future revenue generation are expensed. Liabilities are recorded when environmental assessments and/or remedial efforts are probable and the costs can be reasonably estimated and are evaluated independently of any future claims recovery. Generally, the timing of these accruals coincides with completion of a feasibility study or our commitment to a formal plan of action, and our estimates of cost are subject to change as new information becomes available. Costs of future expenditures for environmental remediation obligations are discounted to their present value in those situations requiring only continuing maintenance and monitoring based upon a schedule of fixed payments.
Share-based Compensation
We account for share-based compensation in accordance with the fair value recognition provisions of Financial Accounting Standards Board (“FASB”) Accounting Standards Codification (“ASC”) 718, Compensation – Stock Compensation, and FASB ASC 505, Equity, which require all share-based payments to employees, including grants of employee stock options, to be recognized in the consolidated financial statements based on their fair values. The fair value of stock options is calculated by using the Black-Scholes option pricing formula that requires estimates for expected volatility, expected dividends, the risk-free interest rate and the term of the option. Stock options generally vest over four years, with 25% vesting annually, and expense is recognized on a straight-line basis separately for each vesting portion of the stock option award. Expense for stock performance awards is recognized based upon the fair value of the awards on the date of grant and the anticipated number of shares to be awarded on a straight-line basis over the three-year service period. If any of the assumptions used in the Black-Scholes model or the anticipated number of shares to be awarded change significantly, share-based compensation expense may differ materially in the future from that recorded in the current period. See additional information related to share-based compensation in Note 16 to the consolidated financial statements.
Retirement and Other Benefit Plans
We sponsor pension plans in both the United States and Canada. Our domestic pension plans cover substantially all United States employees, and our Canadian pension plans cover certain employees based on plan specifications. In addition, we maintain an unfunded Supplemental Executive Retirement Plan (“SERP”) and sponsor unfunded defined-benefit postretirement life insurance plans that cover both salaried and hourly employees who had become eligible for benefits by January 1, 1995.
We determine our expense and obligations for retirement and other benefit plans based on assumptions related to discount rates, expected long-term rates of return on invested plan assets, expected salary increases and certain employee-related factors, such as turnover, retirement age and mortality among others. Our assumptions reflect our historical experiences and our best judgment regarding future expectations. Additional information related to our assumptions is as follows:
42
|
BROWN SHOE COMPANY, INC.
|
2010 FORM 10-K
|
|
·
|
Expected long-term rate of return – The expected long-term rate of return on plan assets is based on historical and projected rates of return for current and planned asset classes in the plan’s investment portfolio. Assumed projected rates of return for each asset class were selected after analyzing experience and future expectations of the returns. The overall expected rate of return for the portfolio was developed based on the target allocation for each asset class. The weighted-average expected rate of return on plan assets used to determine our pension expense for 2010 was 8.50%. A decrease of 50 basis points in the weighted-average expected rate of return on plan assets would impact pension expense by approximately $1.2 million. The actual return on plan assets in a given year may differ from the expected long-term rate of return, and the resulting gain or loss is deferred and recognized into the plans’ expense over time.
|
|
·
|
Discount rate – Discount rates used to measure the present value of our benefit obligations for our pension and other postretirement benefit plans are based on a yield curve constructed from a subset of high-quality bonds for which the timing and amount of cash outflows approximate the estimated payouts of the plans. The weighted-average discount rate selected to measure the present value of our benefit obligations under our pension and other postretirement benefit plans was 5.75% for each. A decrease of 50 basis points in the weighted-average discount rate would have increased the projected benefit obligation of the pension and other postretirement benefit plans by approximately $14.7 million and $0.1 million, respectively.
|
See Note 6 to the consolidated financial statements for additional information related to our retirement and other benefit plans.
Impact of Prospective Accounting Pronouncements
Recent accounting pronouncements and their impact on the Company are described in Note 1 to the consolidated financial statements.
|
OFF-BALANCE SHEET ARRANGEMENTS
|
At January 29, 2011, we were contingently liable for remaining lease commitments of approximately $1.1 million in the aggregate, which relate to former retail locations that we exited in prior years. These obligations will continue to decline over the next several years as leases expire. In order for us to incur any liability related to these lease commitments, the current lessees would have to default.
|
CONTRACTUAL OBLIGATIONS
|
The table below sets forth our significant future obligations by time period. Further information on certain of these commitments is provided in the notes to our consolidated financial statements, which are cross-referenced in this table. Our obligations outstanding as of January 29, 2011, include the following:
|
Payments Due by Period
|
||||||||||||
|
($ millions)
|
Total
|
Less Than
1 Year
|
1-3
Years
|
3-5
Years
|
More Than
5 Years
|
|||||||
|
Borrowings under Revolving Credit Agreement(1)
|
$
|
198.0
|
$
|
198.0
|
$
|
–
|
$
|
–
|
$
|
–
|
||
|
Long-term debt(2)
|
150.0
|
–
|
150.0
|
–
|
–
|
|||||||
|
Interest on long-term debt(2)
|
16.4
|
13.1
|
3.3
|
–
|
–
|
|||||||
|
Operating lease commitments(3)
|
655.7
|
154.6
|
231.1
|
146.0
|
124.0
|
|||||||
|
Minimum license commitments
|
36.9
|
13.2
|
9.1
|
7.1
|
7.5
|
|||||||
|
Purchase obligations(4)
|
573.9
|
564.8
|
8.4
|
0.7
|
–
|
|||||||
|
Obligations related to restructuring initiatives(5)
|
1.2
|
1.2
|
–
|
–
|
–
|
|||||||
|
Other(6)
|
17.9
|
7.5
|
1.1
|
2.9
|
6.4
|
|||||||
|
Total(7) (8)
|
$
|
1,650.0
|
$
|
952.4
|
$
|
403.0
|
$
|
156.7
|
$
|
137.9
|
||
|
(1)
|
Interest on borrowings is at variable rates based on LIBOR or the prime rate, as defined in the Credit Agreement, plus a spread. The interest rate and fees for letters of credit varies based upon the level of excess availability under the Credit Agreement. There is an unused line fee payable on the excess availability under the facility and a letter of credit fee payable on the outstanding exposure under letters of credit. Interest obligations, which are variable in nature, are not included in the table above. See Note 11 to the consolidated financial statements.
|
|||||||||||
|
(2)
|
Interest obligations in future periods have been reflected based on our $150.0 million in Senior Notes and a fixed interest rate (8.75%) as of fiscal year ended January 29, 2011. See Note 11 to the consolidated financial statements.
|
|||||||||||
|
(3)
|
A majority of our retail operating leases contain provisions that allow us to modify amounts payable under the lease or terminate the lease in certain circumstances, such as experiencing actual sales volume below a defined threshold and/or co-tenancy provisions associated with the facility. The contractual obligations presented in the table above reflect the total lease obligation, irrespective of the Company’s ability to reduce or terminate rental payments in the future, as noted. See Note 12 to the consolidated financial statements.
|
|||||||||||
|
(4)
|
Purchase obligations include agreements to purchase goods or services that specify all significant terms, including quantity and price provisions.
|
|||||||||||
|
(5)
|
See Note 5 to the consolidated financial statements for further information related to these obligations.
|
|||||||||||
|
(6)
|
Includes obligations for our supplemental executive retirement plan and other postretirement benefits. See Note 6 to the consolidated financial statements.
|
|||||||||||
|
(7)
|
Excludes liabilities of $0.8 million, established pursuant to the provisions of FASB ASC 740, Income Taxes, due to their uncertain nature in timing of payments See Note 7 to the consolidated financial statements.
|
|||||||||||
43
|
BROWN SHOE COMPANY, INC.
|
2010 FORM 10-K
|
|
(8)
|
Excludes liabilities of $1.4 million, $0.8 million and $2.4 million for our non-qualified deferred compensation plan, deferred compensation plan for non-employee directors and restricted stock units for non-employee directors, respectively, due to the uncertain nature in timing of payments. See Note 6 and Note 16 to the consolidated financial statements.
|
|||||||||||
|
SAFE HARBOR STATEMENT UNDER THE PRIVATE SECURITIES LITIGATION REFORM ACT OF 1995 AND FORWARD-LOOKING STATEMENTS
|
||||||||||||
This Management’s Discussion and Analysis of Financial Condition and Results of Operations contains forward-looking statements within the meaning of the Private Securities Litigation Reform Act of 1995. Actual results could differ materially from those projected as they are subject to various risks and uncertainties. These risks and uncertainties include, without limitation, the risks detailed in Item 1A, Risk Factors, and those described in other documents and reports filed from time to time with the SEC, press releases and other communications. We do not undertake any obligation or plan to update these forward-looking statements, even though our situation may change.
|
QUANTITATIVE AND QUALITATIVE DISCLOSURES ABOUT MARKET RISK
|
|
FOREIGN CURRENCY EXCHANGE RATES
|
The market risk inherent in our financial instruments and positions represents the potential loss arising from adverse changes in foreign currency exchange rates and interest rates. To address these risks, we enter into various hedging transactions to the extent described below. All decisions on hedging transactions are authorized and executed pursuant to our policies and procedures, which do not allow the use of financial instruments for trading purposes. We also are exposed to credit-related losses in the event of nonperformance by counterparties to these financial instruments. Counterparties to these agreements, however, are major international financial institutions, and we believe the risk of loss due to nonperformance is minimal.
A description of our accounting policies for derivative financial instruments is included in Notes 1 and 13 to the consolidated financial statements.
In addition, we are exposed to translation risk because some of our foreign operations are in local currency and must be translated into United States dollars. As currency exchange rates fluctuate, translation of our financial statements of foreign businesses into United States dollars affects the comparability of financial results between years.
|
INTEREST RATES
|
Our financing arrangements include $198.0 million of outstanding variable rate debt under the Credit Agreement at January 29, 2011. We also have $150.0 million in Senior Notes, which bear interest at a fixed rate of 8.75%. Changes in interest rates impact fixed and variable rate debt differently. For fixed rate debt, a change in interest rates will only impact the fair value of the debt, whereas a change in the interest rates on variable rate debt will impact interest expense and cash flows.
At January 29, 2011, the fair value of our long-term debt is estimated at approximately $152.2 million based upon the pricing of our Senior Notes at that time. Market risk is viewed as the potential change in fair value of our debt resulting from a hypothetical 10% adverse change in interest rates and would be $1.3 million for our long-term debt at January 29, 2011.
Information appearing under the caption Risk Management and Derivatives in Note 13 and Fair Value Measurements in Note 14 to the consolidated financial statements is incorporated herein by reference.
|
FINANCIAL STATEMENTS AND SUPPLEMENTARY DATA
|
Our management is responsible for establishing and maintaining adequate internal control over financial reporting as such term is defined in Exchange Act Rules 13a-15(f) and 15d-15(f). Under the supervision and with the participation of our management, including our principal executive officer and principal financial officer, we conducted an evaluation of the effectiveness of our internal control over financial reporting based on the framework in Internal Control — Integrated Framework issued by the Committee of Sponsoring Organizations of the Treadway Commission. Based on that evaluation, our principal executive officer and principal financial officer have concluded that the Company’s internal control over financial reporting was effective as of January 29, 2011. The effectiveness of our internal control over financial reporting as of January 29, 2011, has been audited by Ernst & Young LLP, an independent registered public accounting firm, as stated in its report which is included herein.
44
|
BROWN SHOE COMPANY, INC.
|
2010 FORM 10-K
|
The Board of Directors and Shareholders
Brown Shoe Company, Inc.
We have audited Brown Shoe Company, Inc.’s (the Company’s) internal control over financial reporting as of January 29, 2011, based on criteria established in Internal Control – Integrated Framework issued by the Committee of Sponsoring Organizations of the Treadway Commission (the COSO criteria). The Company's management is responsible for maintaining effective internal control over financial reporting and for its assessment of the effectiveness of internal control over financial reporting included in the accompanying Management’s Report on Internal Control Over Financial Reporting. Our responsibility is to express an opinion on the Company’s internal control over financial reporting based on our audit.
We conducted our audit in accordance with the standards of the Public Company Accounting Oversight Board (United States). Those standards require that we plan and perform the audit to obtain reasonable assurance about whether effective internal control over financial reporting was maintained in all material respects. Our audit included obtaining an understanding of internal control over financial reporting, assessing the risk that a material weakness exists, testing and evaluating the design and operating effectiveness of internal control based on the assessed risk, and performing such other procedures as we considered necessary in the circumstances. We believe that our audit provides a reasonable basis for our opinion.
A company’s internal control over financial reporting is a process designed to provide reasonable assurance regarding the reliability of financial reporting and the preparation of financial statements for external purposes in accordance with generally accepted accounting principles. A company’s internal control over financial reporting includes those policies and procedures that (1) pertain to the maintenance of records that, in reasonable detail, accurately and fairly reflect the transactions and dispositions of the assets of the company; (2) provide reasonable assurance that transactions are recorded as necessary to permit preparation of financial statements in accordance with generally accepted accounting principles and that receipts and expenditures of the company are being made only in accordance with authorizations of management and directors of the company; and (3) provide reasonable assurance regarding prevention or timely detection of unauthorized acquisition, use, or disposition of the company’s assets that could have a material effect on the financial statements.
Because of its inherent limitations, internal control over financial reporting may not prevent or detect misstatements. Also, projections of any evaluation of effectiveness to future periods are subject to the risk that controls may become inadequate because of changes in conditions or that the degree of compliance with the policies or procedures may deteriorate.
In our opinion, Brown Shoe Company, Inc., maintained, in all material respects, effective internal control over financial reporting as of January 29, 2011, based on the COSO criteria.
We also have audited, in accordance with the standards of the Public Company Accounting Oversight Board (United States), the consolidated balance sheets of Brown Shoe Company, Inc. as of January 29, 2011, and January 30, 2010, and the related consolidated statements of earnings, shareholders’ equity, and cash flows for each of the three years in the period ended January 29, 2011, and our report dated April 1, 2011, expressed an unqualified opinion thereon.
/s/ ERNST & YOUNG LLP
St. Louis, Missouri
April 1, 2011
45
|
BROWN SHOE COMPANY, INC.
|
2010 FORM 10-K
|
The Board of Directors and Shareholders
Brown Shoe Company, Inc.
We have audited the accompanying consolidated balance sheets of Brown Shoe Company, Inc. (the Company) as of January 29, 2011, and January 30, 2010, and the related consolidated statements of earnings, shareholders’ equity, and cash flows for each of the three years in the period ended January 29, 2011. Our audits also included the financial statement schedule listed in the Index at Item 15(a). These financial statements and schedule are the responsibility of the Company’s management. Our responsibility is to express an opinion on these financial statements and schedule based on our audits.
We conducted our audits in accordance with the standards of the Public Company Accounting Oversight Board (United States). Those standards require that we plan and perform the audit to obtain reasonable assurance about whether the financial statements are free of material misstatement. An audit includes examining, on a test basis, evidence supporting the amounts and disclosures in the financial statements. An audit also includes assessing the accounting principles used and significant estimates made by management, as well as evaluating the overall financial statement presentation. We believe that our audits provide a reasonable basis for our opinion.
In our opinion, the financial statements referred to above present fairly, in all material respects, the consolidated financial position of Brown Shoe Company, Inc. at January 29, 2011, and January 30, 2010, and the consolidated results of its operations and its cash flows for each of the three years in the period ended January 29, 2011, in conformity with U.S. generally accepted accounting principles. Also, in our opinion, the related financial statement schedule, when considered in relation to the basic financial statements taken as a whole, presents fairly, in all material respects, the information set forth therein.
We also have audited, in accordance with the standards of the Public Company Accounting Oversight Board (United States), Brown Shoe Company, Inc.’s internal control over financial reporting as of January 29, 2011, based on criteria established in Internal Control – Integrated Framework issued by the Committee of Sponsoring Organizations of the Treadway Commission, and our report dated April 1, 2011, expressed an unqualified opinion thereon.
/s/ ERNST & YOUNG LLP
St. Louis, Missouri
April 1, 2011
46
|
BROWN SHOE COMPANY, INC.
|
2010 FORM 10-K
|
|
Consolidated Balance Sheets
|
|
($ thousands, except number of shares and per share amounts)
|
January 29,
2011
|
January 30,
2010
|
||||
|
ASSETS
|
||||||
|
Current assets:
|
||||||
|
Cash and cash equivalents
|
$
|
126,548
|
$
|
125,833
|
||
|
Receivables, net of allowances of $18,398 in 2010 and $14,311 in 2009
|
113,937
|
84,297
|
||||
|
Inventories, net of adjustment to last-in, first-out cost of $4,437 in 2010 and $7,407 in 2009
|
524,250
|
456,682
|
||||
|
Deferred income taxes
|
4,503
|
17,894
|
||||
|
Income taxes
|
10,195
|
4,163
|
||||
|
Prepaid expenses and other current assets
|
28,848
|
19,380
|
||||
|
Total current assets
|
808,281
|
708,249
|
||||
|
Prepaid pension costs
|
63,250
|
54,485
|
||||
|
Deferred income taxes
|
–
|
2,304
|
||||
|
Property and equipment, net
|
135,632
|
141,561
|
||||
|
Intangible assets, net
|
70,592
|
77,226
|
||||
|
Other assets
|
70,288
|
56,325
|
||||
|
Total assets
|
$
|
1,148,043
|
$
|
1,040,150
|
||
|
LIABILITIES AND EQUITY
|
||||||
|
Current liabilities:
|
||||||
|
Borrowings under revolving credit agreement
|
$
|
198,000
|
$
|
94,500
|
||
|
Trade accounts payable
|
167,190
|
177,700
|
||||
|
Employee compensation and benefits
|
64,528
|
59,619
|
||||
|
Other accrued expenses
|
82,187
|
82,244
|
||||
|
Total current liabilities
|
511,905
|
414,063
|
||||
|
Other liabilities:
|
||||||
|
Long-term debt
|
150,000
|
150,000
|
||||
|
Deferred rent
|
34,678
|
38,869
|
||||
|
Deferred income taxes
|
11,534
|
–
|
||||
|
Other liabilities
|
24,017
|
25,991
|
||||
|
Total other liabilities
|
220,229
|
214,860
|
||||
|
Equity:
|
||||||
|
Preferred stock, $1.00 par value, 1,000,000 shares authorized; no shares outstanding
|
–
|
–
|
||||
|
Common stock, $0.01 par value, 100,000,000 shares authorized; 43,911,286 and 42,891,905 shares outstanding, net of 2,175,509 and 3,194,890 treasury shares in 2010 and 2009, respectively
|
439
|
429
|
||||
|
Additional paid-in capital
|
134,270
|
152,314
|
||||
|
Accumulated other comprehensive income (loss)
|
6,141
|
177
|
||||
|
Retained earnings
|
274,230
|
249,251
|
||||
|
Total Brown Shoe Company, Inc. shareholders’ equity
|
415,080
|
402,171
|
||||
|
Noncontrolling interests
|
829
|
9,056
|
||||
|
Total equity
|
415,909
|
411,227
|
||||
|
Total liabilities and equity
|
$
|
1,148,043
|
$
|
1,040,150
|
||
See notes to consolidated financial statements.
47
|
BROWN SHOE COMPANY, INC.
|
2010 FORM 10-K
|
|
Consolidated Statements of Earnings
|
|
($ thousands, except per share amounts)
|
2010
|
2009
|
2008
|
||||||
|
Net sales
|
$
|
2,504,091
|
$
|
2,241,968
|
$
|
2,276,362
|
|||
|
Cost of goods sold
|
1,500,537
|
1,338,829
|
1,394,126
|
||||||
|
Gross profit
|
1,003,554
|
903,139
|
882,236
|
||||||
|
Selling and administrative expenses
|
922,976
|
859,693
|
851,893
|
||||||
|
Restructuring and other special charges, net
|
7,914
|
11,923
|
54,278
|
||||||
|
Impairment of goodwill and intangible assets
|
–
|
–
|
149,150
|
||||||
|
Equity in net loss of nonconsolidated affiliate
|
–
|
–
|
216
|
||||||
|
Operating earnings (loss)
|
72,664
|
31,523
|
(173,301
|
)
|
|||||
|
Interest expense
|
(19,647
|
)
|
(20,195
|
)
|
(17,105
|
)
|
|||
|
Interest income
|
203
|
374
|
1,800
|
||||||
|
Earnings (loss) before income taxes
|
53,220
|
11,702
|
(188,606
|
)
|
|||||
|
Income tax (provision) benefit
|
(16,160
|
)
|
(1,259
|
)
|
53,793
|
||||
|
Net earnings (loss)
|
$
|
37,060
|
$
|
10,443
|
$
|
(134,813
|
)
|
||
|
Less: Net (loss) earnings attributable to noncontrolling interests
|
(173
|
)
|
943
|
(1,575
|
)
|
||||
|
Net earnings (loss) attributable to Brown Shoe Company, Inc.
|
$
|
37,233
|
$
|
9,500
|
$
|
(133,238
|
)
|
||
|
Basic earnings (loss) per common share attributable to Brown Shoe Company, Inc. shareholders
|
$
|
0.85
|
$
|
0.22
|
$
|
(3.21
|
)
|
||
|
Diluted earnings (loss) per common share attributable to Brown Shoe Company, Inc. shareholders
|
$
|
0.85
|
$
|
0.22
|
$
|
(3.21
|
)
|
||
See notes to consolidated financial statements.
48
|
BROWN SHOE COMPANY, INC.
|
2010 FORM 10-K
|
|
Consolidated Statements of Cash Flows
|
|
($ thousands)
|
2010
|
2009
|
2008
|
||||||
|
Operating Activities
|
|||||||||
|
Net earnings (loss)
|
$
|
37,060
|
$
|
10,443
|
$
|
(134,813
|
)
|
||
|
Adjustments to reconcile net earnings (loss) to net cash (used for) provided by operating activities:
|
|||||||||
|
Depreciation
|
33,149
|
36,459
|
39,937
|
||||||
|
Amortization of capitalized software
|
10,506
|
7,867
|
7,812
|
||||||
|
Amortization of intangibles
|
6,667
|
6,774
|
7,124
|
||||||
|
Amortization of debt issuance costs
|
2,195
|
2,195
|
1,637
|
||||||
|
Share-based compensation expense
|
6,144
|
4,673
|
2,601
|
||||||
|
Tax deficiency (benefit) related to share-based plans
|
87
|
58
|
(498
|
)
|
|||||
|
Loss on disposal of facilities and equipment
|
1,089
|
1,180
|
1,065
|
||||||
|
Impairment charges for facilities and equipment
|
2,762
|
3,928
|
2,657
|
||||||
|
Impairment of goodwill and intangible assets
|
–
|
–
|
149,150
|
||||||
|
Deferred rent
|
(4,191
|
)
|
(2,845
|
)
|
249
|
||||
|
Deferred income taxes
|
27,229
|
15,414
|
(51,248
|
)
|
|||||
|
Provision for doubtful accounts
|
516
|
727
|
548
|
||||||
|
Foreign currency transaction (gains) losses
|
(18
|
)
|
(106
|
)
|
131
|
||||
|
Undistributed loss of nonconsolidated affiliate
|
–
|
–
|
216
|
||||||
|
Changes in operating assets and liabilities:
|
|||||||||
|
Receivables
|
(30,088
|
)
|
(714
|
)
|
35,644
|
||||
|
Inventories
|
(66,568
|
)
|
11,166
|
(29,196
|
)
|
||||
|
Prepaid expenses and other current and noncurrent assets
|
(9,440
|
)
|
(1,601
|
)
|
(373
|
)
|
|||
|
Trade accounts payable
|
(10,754
|
)
|
24,987
|
(27,213
|
)
|
||||
|
Accrued expenses and other liabilities
|
2,668
|
285
|
22,406
|
||||||
|
Income taxes
|
(5,993
|
)
|
2,742
|
(336
|
)
|
||||
|
Other, net
|
(5,332
|
)
|
(5,554
|
)
|
6,836
|
||||
|
Net cash (used for) provided by operating activities
|
(2,312
|
)
|
118,078
|
34,336
|
|||||
|
Investing Activities
|
|||||||||
|
Purchases of property and equipment
|
(30,781
|
)
|
(24,880
|
)
|
(60,417
|
)
|
|||
|
Capitalized software
|
(24,046
|
)
|
(25,098
|
)
|
(16,327
|
)
|
|||
|
Cash recognized on initial consolidation
|
–
|
–
|
3,337
|
||||||
|
Investments in consolidated companies
|
–
|
–
|
(7,683
|
)
|
|||||
|
Net cash used for investing activities
|
(54,827
|
)
|
(49,978
|
)
|
(81,090
|
)
|
|||
|
Financing Activities
|
|||||||||
|
Borrowings under revolving credit agreement
|
1,051,500
|
848,900
|
655,500
|
||||||
|
Repayments under revolving credit agreement
|
(948,000
|
)
|
(866,900
|
)
|
(558,000
|
)
|
|||
|
Acquisition of noncontrolling interests (Edelman Shoe, Inc.)
|
(32,692
|
)
|
–
|
–
|
|||||
|
Dividends paid
|
(12,254
|
)
|
(12,009
|
)
|
(11,855
|
)
|
|||
|
Debt issuance costs
|
(2,636
|
)
|
–
|
(7,500
|
)
|
||||
|
Proceeds from stock options exercised
|
926
|
107
|
313
|
||||||
|
Contributions by noncontrolling interests
|
527
|
–
|
–
|
||||||
|
Tax (deficiency) benefit related to share-based plans
|
(87
|
)
|
(58
|
)
|
498
|
||||
|
Net cash provided by (used for) financing activities
|
57,284
|
(29,960
|
)
|
78,956
|
|||||
|
Effect of exchange rate changes on cash and cash equivalents
|
570
|
793
|
(5,103
|
)
|
|||||
|
Increase in cash and cash equivalents
|
715
|
38,933
|
27,099
|
||||||
|
Cash and cash equivalents at beginning of year
|
125,833
|
86,900
|
59,801
|
||||||
|
Cash and cash equivalents at end of year
|
$
|
126,548
|
$
|
125,833
|
$
|
86,900
|
|||
See notes to consolidated financial statements.
49
|
BROWN SHOE COMPANY, INC.
|
2010 FORM 10-K
|
|
Consolidated Statements of Shareholders’ Equity
|
|
($ thousands, except number of shares and per
|
Common Stock
|
Additional
Paid-In
|
Accumulated
Other
Comprehensive
|
Retained
|
Total
Brown Shoe
Company, Inc.
Shareholders’
|
Non-
controlling
|
Total
|
|||||||||||||||||||||||||
|
share amounts)
|
Shares
|
Dollars
|
Capital
|
Income (Loss)
|
Earnings
|
Equity
|
Interests
|
Equity
|
||||||||||||||||||||||||
|
BALANCE FEBRUARY 2, 2008
|
41,832,656 | $ | 418 | $ | 145,690 | $ | 15,598 | $ | 396,871 | $ | 558,577 | $ | 2,087 | $ | 560,664 | |||||||||||||||||
|
Net loss
|
(133,238 | ) | (133,238 | ) | (1,575 | ) | (134,813 | ) | ||||||||||||||||||||||||
|
Foreign currency translation adjustment
|
(10,544 | ) | (10,544 | ) | 172 | (10,372 | ) | |||||||||||||||||||||||||
|
Unrealized gains on derivative financial instruments, net of tax provision of $189
|
398 | 398 | 398 | |||||||||||||||||||||||||||||
|
Pension and other postretirement benefits adjustments, net of tax benefit of $7,150
|
(11,233 | ) | (11,233 | ) | (11,233 | ) | ||||||||||||||||||||||||||
|
Comprehensive loss
|
(154,617 | ) | (1,403 | ) | (156,020 | ) | ||||||||||||||||||||||||||
|
Dividends ($0.28 per share)
|
(11,855 | ) | (11,855 | ) | (11,855 | ) | ||||||||||||||||||||||||||
|
Adjustment for adoption of FASB ASC 715, net of deferred tax liability of $14
|
(18 | ) | (18 | ) | (18 | ) | ||||||||||||||||||||||||||
|
Capital contribution – B&H Footwear
|
490 | 490 | ||||||||||||||||||||||||||||||
|
Acquisition of noncontrolling interests associated with Edelman Shoe, Inc.
|
6,936 | 6,936 | ||||||||||||||||||||||||||||||
|
Stock issued under employee benefit and restricted stock plans
|
490,568 | 5 | (1,087 | ) | (1,082 | ) | (1,082 | ) | ||||||||||||||||||||||||
|
Tax benefit related to share-based plans
|
498 | 498 | 498 | |||||||||||||||||||||||||||||
|
Share-based compensation expense
|
2,601 | 2,601 | 2,601 | |||||||||||||||||||||||||||||
|
BALANCE JANUARY 31, 2009
|
42,323,224 | $ | 423 | $ | 147,702 | $ | (5,781 | ) | $ | 251,760 | $ | 394,104 | $ | 8,110 | $ | 402,214 | ||||||||||||||||
|
Net earnings
|
9,500 | 9,500 | 943 | 10,443 | ||||||||||||||||||||||||||||
|
Foreign currency translation adjustment
|
3,434 | 3,434 | 3 | 3,437 | ||||||||||||||||||||||||||||
|
Unrealized losses on derivative financial instruments, net of tax benefit of $399
|
(985 | ) | (985 | ) | (985 | ) | ||||||||||||||||||||||||||
|
Pension and other postretirement benefits adjustments, net of tax provision of $2,485
|
3,509 | 3,509 | 3,509 | |||||||||||||||||||||||||||||
|
Comprehensive income
|
15,458 | 946 | 16,404 | |||||||||||||||||||||||||||||
|
Dividends ($0.28 per share)
|
(12,009 | ) | (12,009 | ) | (12,009 | ) | ||||||||||||||||||||||||||
|
Stock issued under employee and director benefit and restricted stock plans
|
568,681 | 6 | (3 | ) | 3 | 3 | ||||||||||||||||||||||||||
|
Tax deficiency related to share-based plans
|
(58 | ) | (58 | ) | (58 | ) | ||||||||||||||||||||||||||
|
Share-based compensation expense
|
4,673 | 4,673 | 4,673 | |||||||||||||||||||||||||||||
|
BALANCE JANUARY 30, 2010
|
42,891,905 | $ | 429 | $ | 152,314 | $ | 177 | $ | 249,251 | $ | 402,171 | $ | 9,056 | $ | 411,227 | |||||||||||||||||
|
Net earnings
|
37,233 | 37,233 | (173 | ) | 37,060 | |||||||||||||||||||||||||||
|
Foreign currency translation adjustment
|
2,127 | 2,127 | 23 | 2,150 | ||||||||||||||||||||||||||||
|
Unrealized gains on derivative financial instruments, net of tax provision of $187
|
404 | 404 | 404 | |||||||||||||||||||||||||||||
|
Pension and other postretirement benefits adjustments, net of tax provision of $2,197
|
3,433 | 3,433 | 3,433 | |||||||||||||||||||||||||||||
|
Comprehensive income
|
43,197 | (150 | ) | 43,047 | ||||||||||||||||||||||||||||
|
Dividends ($0.28 per share)
|
(12,254 | ) | (12,254 | ) | (12,254 | ) | ||||||||||||||||||||||||||
|
Contributions by noncontrolling interests
|
527 | 527 | ||||||||||||||||||||||||||||||
| Acquisition of noncontrolling interests (Edelman Shoe, Inc.): | ||||||||||||||||||||||||||||||||
|
Stock issued in connection with acquisition of the noncontrolling interest
|
473,081 | 5 | 7,304 | 7,309 | 7,309 | |||||||||||||||||||||||||||
|
Distribution to noncontrolling interest
|
(31,397 | ) | (31,397 | ) | (8,604 | ) | (40,001 | ) | ||||||||||||||||||||||||
|
Stock issued under employee and director benefit and restricted stock plans
|
546,300 | 5 | (8 | ) | (3 | ) | (3 | ) | ||||||||||||||||||||||||
|
Tax deficiency related to share-based plans
|
(87 | ) | (87 | ) | (87 | ) | ||||||||||||||||||||||||||
|
Share-based compensation expense
|
6,144 | 6,144 | 6,144 | |||||||||||||||||||||||||||||
|
BALANCE JANUARY 29, 2011
|
43,911,286 | $ | 439 | $ | 134,270 | $ | 6,141 | $ | 274,230 | $ | 415,080 | $ | 829 | $ | 415,909 | |||||||||||||||||
See notes to consolidated financial statements.
|
1.
|
SUMMARY OF SIGNIFICANT ACCOUNTING POLICIES
|
Organization
Brown Shoe Company, Inc. (the “Company”), founded in 1878 and incorporated in 1913, is a footwear retailer and wholesaler. The Company’s shares are traded under the “BWS” symbol on the New York and Chicago Stock Exchanges.
The Company provides a broad offering of licensed, branded and private-label casual, dress and athletic footwear products to women, men and children. Footwear is sold at a variety of price points through multiple distribution channels both domestically and internationally. The Company currently operates 1,369 retail shoe stores in the United States, Canada, China and Guam primarily under the Famous Footwear and Naturalizer names. In addition, through its Wholesale Operations segment, the Company designs, sources and markets footwear to retail stores domestically and internationally, including national chains, mass merchandisers, department stores, independent retailers, catalogs and online retailers. In 2010, approximately 70% of the Company’s net sales were at retail compared to 72% in 2009 and 69% in 2008. See Note 8 for additional information regarding the Company’s business segments.
The Company’s business is seasonal in nature due to consumer spending patterns, with higher back-to-school and Christmas and Easter holiday season sales. Traditionally, the third fiscal quarter accounts for a substantial portion of the Company’s earnings for the year.
Consolidation
The consolidated financial statements include the accounts of the Company and its wholly-owned and majority-owned subsidiaries, after the elimination of intercompany accounts and transactions.
Noncontrolling Interests
Noncontrolling interests in the Company’s consolidated financial statements result from the accounting for noncontrolling interests in partially-owned consolidated subsidiaries or affiliates. Noncontrolling interests represent partially-owned subsidiaries’ or consolidated affiliates’ earnings, losses and components of other comprehensive income (loss) that are attributable to the noncontrolling parties’ equity interests. The Company consolidates B&H Footwear Company Limited (“B&H Footwear”), a joint venture, into its consolidated financial statements. Net earnings (loss) attributable to noncontrolling interests represents the share of net earnings (loss) that is attributable to the equity that is owned by the Company’s partners. Transactions between the Company and B&H Footwear have been eliminated in the consolidated financial statements. Prior to June 4, 2010, at which time the Company acquired the remaining 50% of the outstanding stock of Edelman Shoe, Inc. (“Edelman Shoe”), the equity interests held by other parties in Edelman Shoe were accounted for as a noncontrolling interest. Subsequent to June 4, 2010, Edelman Shoe became a wholly-owned subsidiary of the Company. See Note 2 to the consolidated financial statements for further information on Edelman Shoe.
Accounting Period
The Company’s fiscal year is the 52- or 53-week period ending the Saturday nearest to January 31. Fiscal years 2010, 2009 and 2008 ended on January 29, 2011, January 30, 2010, and January 31, 2009, respectively, and each included 52 weeks.
Basis of Presentation
Certain prior-period amounts on the consolidated financial statements have been reclassified to conform to current-period presentation. These reclassifications did not affect net earnings (loss) attributable to Brown Shoe Company, Inc.
Use of Estimates
The preparation of financial statements in conformity with generally accepted accounting principles (“GAAP”) requires management to make estimates and assumptions that affect the amounts reported in the financial statements and accompanying notes. Actual results could differ from those estimates.
Cash and Cash Equivalents
The Company considers all highly liquid investments with maturities of three months or less when purchased to be cash equivalents.
51
|
BROWN SHOE COMPANY, INC.
|
2010 FORM 10-K
|
Receivables
The Company evaluates the collectability of selected accounts receivable on a case-by-case basis and makes adjustments to the bad debt reserve for expected losses. The Company considers factors such as ability to pay, bankruptcy, credit ratings and payment history. For all other accounts, the Company estimates reserves for bad debts based on experience and past-due status of the accounts. If circumstances related to customers change, estimates of recoverability would be further adjusted. The Company recognized a provision for doubtful accounts of $0.5 million in 2010, $0.7 million in 2009 and $0.5 million in 2008. Certain additional reserves and allowances are carried as a reduction of gross receivables to reflect co-op advertising and other allowances to be granted to customers as well as anticipated reserves for products to be returned.
Inventories
All inventories are valued at the lower of cost or market, with 93% of consolidated inventories using the last-in, first-out (“LIFO”) method. An actual valuation of inventory under the LIFO method can be made only at the end of each year based on the inventory levels and costs at that time. Accordingly, interim LIFO calculations are based on management’s estimates of expected year-end inventory levels and costs and are subject to the final year-end LIFO inventory valuation. If the first-in, first-out (“FIFO”) method had been used, consolidated inventories would have been $4.4 million and $7.4 million higher at both January 29, 2011, and January 30, 2010, respectively. Substantially all inventory is finished goods.
The costs of inventory, inbound freight and duties, markdowns, shrinkage and royalty expense are classified in cost of goods sold. Costs of warehousing and distribution are classified in selling and administrative expenses and are expensed as incurred. Such warehousing and distribution costs totaled $65.0 million, $63.0 million and $60.2 million in 2010, 2009 and 2008, respectively. Costs of overseas sourcing offices and other inventory procurement costs are reflected in selling and administrative expenses and are expensed as incurred. Such sourcing and procurement costs totaled $21.3 million, $19.1 million and $21.9 million in 2010, 2009 and 2008, respectively.
Markdowns are recorded to reflect expected adjustments to sales prices. In determining markdowns, management considers current and recently recorded sales prices, the length of time the product is held in inventory and quantities of various product styles contained in inventory, among other factors. The ultimate amount realized from the sale of certain products could differ from management estimates. The Company physically counts all merchandise inventory on hand at least annually and adjusts the recorded balance to reflect the results of the physical counts. The Company records estimated shrinkage between physical inventory counts based on historical results.
Computer Software Costs
The Company capitalizes certain costs in other assets, including internal payroll costs, incurred in connection with the development or acquisition of software for internal use. Other assets on the consolidated balance sheets include $60.9 million and $47.4 million of unamortized computer software costs as of January 29, 2011, and January 30, 2010, respectively.
Property and Equipment
Property and equipment are stated at cost. Depreciation of property and equipment is provided over the estimated useful lives of the assets or the remaining lease terms, where applicable, using the straight-line method.
Interest
Capitalized Interest
Interest costs applicable to major asset additions are capitalized during the construction or development period and amortized over the lives of the related assets, including $1.3 million in 2010, $1.0 million in 2009 and $0.2 million in 2008.
Interest Expense
Interest expense includes interest for borrowings under both the Company’s Senior Notes and its Revolving Credit Agreement. Interest expense includes fees paid under the Revolving Credit Agreement for the unused portion of its line of credit. Interest expense also includes the amortization of deferred debt issuance costs as well as the accretion of certain discounted noncurrent liabilities.
Goodwill and Intangible Assets
Goodwill and intangible assets deemed to have indefinite lives are not amortized but are subject to annual impairment tests using primarily a discounted cash flow approach. The Company performs impairment tests during the fourth quarter of each fiscal year unless events indicate an interim test is required. Other intangible assets are amortized over their useful lives and are reviewed for impairment if and when impairment indicators are present.
During 2008, the Company recorded a non-cash impairment charge for goodwill and intangible assets of $149.2 million ($119.2 million on an after-tax basis, or $2.87 per diluted share) as a result of a substantial decrease in its share price and market capitalization, reflecting the difficult market conditions and industry trends experienced during 2008. See Note 10 for additional information related to the impairment of goodwill and intangible assets.
52
|
BROWN SHOE COMPANY, INC.
|
2010 FORM 10-K
|
Self-Insurance Reserves
The Company is self-insured and/or retains high deductibles for a significant portion of its workers’ compensation, employment practices, health, disability, cyber risk, general liability, automobile and property programs, among others. Liabilities associated with the risks that are retained by the Company are estimated by considering historical claims experience, trends of the Company and the industry and other actuarial assumptions. The estimated accruals for these liabilities could be affected if development of costs on claims differ from these assumptions and historical trends. Based on information known at January 29, 2011, the Company believes it has provided adequate reserves for its self-insurance exposure. As of January 29, 2011, and January 30, 2010, self-insurance reserves were $10.8 million and $10.4 million, respectively.
Revenue Recognition
Retail sales, recognized at the point of sale, are net of returns and exclude sales tax. Wholesale sales and sales through the Company’s internet sites are recorded, net of returns, allowances and discounts, when the merchandise has been shipped and title and risk of loss have passed to the customer. Retail items sold through the Company’s internet sites are made pursuant to a sales agreement that provides for transfer of both title and risk of loss upon delivery to the carrier. Reserves for projected merchandise returns, discounts and allowances are determined based on historical experience and current expectations. Revenue is recognized on license fees related to Company-owned brand names, where the Company is licensor, when the related sales of the licensee are made.
Gift Cards
The Company sells gift cards to its customers in its retail stores and through its internet sites. The Company’s gift cards do not have expiration dates or inactivity fees. The Company recognizes revenue from gift cards when (i) the gift card is redeemed by the customer or (ii) the likelihood of the gift card being redeemed by the customer is remote (“gift card breakage”) and the Company determines that it does not have a legal obligation to remit the value of unredeemed gift cards to the relevant jurisdictions. The Company determines its gift card breakage rate based upon historical redemption patterns. The Company recognizes gift card breakage during the 24-month period following the sale of the gift card, according to the Company’s historical redemption pattern. Gift card breakage income is included in net sales in the consolidated statements of earnings, and the liability established upon the sale of a gift card is included in other accrued expenses within the consolidated balance sheets. The Company recognized $0.6 million, $0.5 million and $0.4 million of gift card breakage in 2010, 2009 and 2008, respectively.
Loyalty Program
The Company maintains a customer loyalty program (“Rewards”) for Famous Footwear stores in which customers earn points toward savings certificates for qualifying purchases. Upon reaching specified point values, customers are issued a savings certificate, which they may redeem for purchases at Famous Footwear stores. In addition to the savings certificates, the Company also offers exclusive member mailings that offer additional incentives to purchase. Generally, savings certificates earned must be redeemed no later than 10 to 13 weeks from the date of issuance. The value of points and rewards earned by Famous Footwear’s Rewards program members are recorded as a reduction of net sales, and a liability is established within other accrued expenses at the time the points are earned based on historical conversion and redemption rates. Approximately 61% of net sales in the Company’s Famous Footwear segment were made to its Rewards members in 2010 and 2009 compared to 60% in 2008.
Store Closing and Impairment Charges
The costs of closing stores, including lease termination costs, property and equipment write-offs and severance, as applicable, are recorded when the store is closed or when a binding agreement is reached with the landlord to close the store.
The Company regularly analyzes the results of all of its stores and assesses the viability of underperforming stores to determine whether events or circumstances exist that indicate the stores should be closed or whether the carrying amount of their long-lived assets may not be recoverable. After allowing for an appropriate start-up period, unusual nonrecurring events or unfavorable trends, property and equipment at stores indicated as impaired are written down to fair value using primarily a discounted cash flow technique. The Company recorded asset impairment charges primarily related to underperforming retail stores of $2.8 million during 2010, of which $1.9 million related to the Famous Footwear segment and $0.9 million related to the Specialty Retail segment. During 2009, the Company recorded asset impairment charges of $3.9 million, of which $3.0 million related to the Famous Footwear segment and $0.9 million related to the Specialty Retail segment. During 2008, the Company recorded asset impairment charges of $2.7 million, of which $1.8 million related to the Famous Footwear segment, $0.5 million related to the Specialty Retail segment and $0.4 million related to the Wholesale Operations segment. Impairment charges are recorded within selling and administrative expenses on the consolidated statements of earnings.
Advertising and Marketing Expense
All advertising and marketing costs are expensed at the time the event occurs or the promotion first appears in media or in the store, except for direct response advertising that relates primarily to the production and distribution of the Company’s catalogs and coupon mailers. Direct response advertising costs are amortized over the expected future revenue stream, which is one to three months from the date materials are mailed.
53
|
BROWN SHOE COMPANY, INC.
|
2010 FORM 10-K
|
In addition, the Company participates in co-op advertising programs with certain of its wholesale customers. For those co-op advertising programs where the Company has validated the fair value of the advertising received, co-op advertising costs are reflected as advertising expense within selling and administrative expenses. Otherwise, co-op advertising costs are reflected as a reduction of net sales.
Total advertising and marketing expense was $91.4 million, $70.4 million and $73.4 million in 2010, 2009 and 2008, respectively. In 2010, 2009 and 2008, these costs were offset by co-op advertising allowances recovered by the Company’s retail divisions of $9.4 million, $6.3 million and $5.4 million, respectively. Total co-op advertising costs reflected as a reduction of net sales were $7.7 million in 2010 and $7.5 million in 2009 and 2008. Total advertising costs attributable to future periods that are deferred and recognized as a component of prepaid expenses and other current assets were $2.5 million and $1.0 million at January 29, 2011 and January 30, 2010, respectively.
Income Taxes
The Company recognizes deferred tax assets and liabilities for the expected future tax consequences of temporary differences between the consolidated financial statement carrying amounts and the tax bases of its assets and liabilities. The Company establishes valuation allowances if it believes that it is more-likely-than-not that some or all of its deferred tax assets will not be realized. The Company does not recognize a tax benefit unless it concludes that it is more-likely-than-not that the benefit will be sustained on audit by the taxing authority based solely on the technical merits of the associated tax position. If the recognition threshold is met, the Company recognizes a tax benefit measured at the largest amount of the tax benefit that, in its judgment, is greater than 50% likely to be realized. The Company records interest and penalties related to unrecognized tax positions within the income tax (provision) benefit balance on the consolidated statements of earnings.
Operating Leases
The Company leases its store premises and distribution center premises under operating leases. Many leases entered into by the Company include options under which the Company may extend the lease term beyond the initial commitment period, subject to terms agreed to at lease inception. Most leases also include early termination options that can be exercised under specific conditions.
Contingent Rentals
Many of the leases covering retail stores require contingent rentals in addition to the minimum monthly rental charge based on retail sales volume. The Company records expense for contingent rentals during the period in which the retail sales volume exceeds the respective targets.
Construction Allowances Received From Landlords
At the time its retail facilities are initially leased, the Company often receives consideration from landlords to be applied against the cost of leasehold improvements necessary to open the store. The Company treats these construction allowances as a lease incentive. The allowances are recorded as a deferred rent obligation upon receipt and amortized to income over the lease term as a reduction of rent expense. The allowances are reflected as a component of other accrued expenses and deferred rent on the consolidated balance sheets.
Straight-Line Rents and Rent Holidays
The Company records rent expense on a straight-line basis over the lease term for all of its leased facilities. For leases that have predetermined fixed escalations of the minimum rentals, the Company recognizes the related rental expense on a straight-line basis and records the difference between the recognized rental expense and amounts payable under the lease as deferred rent. At the time its retail facilities are leased, the Company is frequently not charged rent for a specified period of time, typically 30 to 60 days, while the store is being prepared for opening. This rent-free period is referred to as a rent holiday. The Company recognizes rent expense over the lease term, including any rent holiday, within selling and administrative expenses on the consolidated statements of earnings.
Preopening Costs
Preopening costs associated with opening retail stores, including payroll, supplies and facility costs, are expensed as incurred.
54
|
BROWN SHOE COMPANY, INC.
|
2010 FORM 10-K
|
Earnings (Loss) Per Common Share Attributable to Brown Shoe Company, Inc. Shareholders
At the beginning of 2009, the Company was required to begin using the two-class method to calculate basic and diluted earnings (loss) per common share attributable to Brown Shoe Company, Inc. shareholders as unvested restricted stock awards are considered participating units because they entitle holders to non-forfeitable rights to dividends or dividend equivalents during the vesting term. Under the two-class method, basic earnings (loss) per common share attributable to Brown Shoe Company, Inc. shareholders is computed by dividing the net earnings (loss) attributable to Brown Shoe Company, Inc. after allocation of earnings to participating securities by the weighted-average number of common shares outstanding during the year. Diluted earnings (loss) per common share attributable to Brown Shoe Company, Inc. shareholders is computed by dividing the net earnings (loss) attributable to Brown Shoe Company, Inc. after allocation of earnings to participating securities by the weighted-average number of common shares and potential dilutive securities outstanding during the year. Potential dilutive securities consist of outstanding stock options. See Note 3 to the consolidated financial statements for additional information related to the calculation of earnings (loss) per common share attributable to Brown Shoe Company, Inc. shareholders.
Comprehensive Income (Loss)
Comprehensive income (loss) includes the effect of foreign currency translation adjustments, unrealized gains or losses from derivatives used for hedging activities, and pension and other postretirement benefits adjustments.
Foreign Currency Translation
For the Company’s international subsidiaries, the local currency is generally the functional currency. Assets and liabilities of these subsidiaries are translated into United States dollars at the fiscal year-end exchange rate or historical rates as appropriate. Consolidated statements of earnings amounts are translated at average exchange rates for the period. The cumulative translation adjustments resulting from changes in exchange rates are included in the consolidated balance sheets as a component of accumulated other comprehensive income (loss) in total Brown Shoe Company, Inc. shareholders’ equity. Transaction gains and losses are included in the consolidated statements of earnings.
Derivative Financial Instruments
The Company recognizes all derivative financial instruments as either assets or liabilities in the consolidated balance sheets and measures those instruments at fair value. The Company evaluates its exposure to volatility in foreign currency rates and may enter into derivative transactions as it deems necessary. These derivative financial instruments are viewed as risk management tools and are not used for trading or speculative purposes. See additional information related to derivative financial instruments in Note 13 to the consolidated financial statements.
Share-based Compensation
The Company has share-based incentive compensation plans under which certain officers, employees and members of the Board of Directors are participants and may be granted stock option, restricted stock and stock performance awards. Additionally, share-based grants may be made to non-employee members of the Board of Directors in the form of cash-equivalent restricted stock units (“RSUs”) at no cost to the non-employee member of the Board of Directors. The Company accounts for share-based compensation in accordance with the fair value recognition provisions of FASB ASC 718, Compensation – Stock Compensation, and FASB ASC 505, Equity, which require all share-based payments to employees and members of the Board of Directors, including grants of employee stock options, to be recognized in the consolidated financial statements based on their fair values. The fair value of stock options is calculated using the Black-Scholes option pricing formula that requires estimates for expected volatility, expected dividends, the risk-free interest rate and the term of the option. Stock options generally vest over four years, with 25% vesting annually, and expense is recognized on a straight-line basis separately for each vesting portion of the stock option award. Expense for restricted stock is based on the fair value of the restricted stock on the date of grant and is recognized on a straight-line basis generally over a four-year vesting period. Expense for stock performance awards is recognized based upon the fair value of the awards on the date of grant and the anticipated number of shares to be awarded on a straight-line basis over the three-year service period. Expense for the initial grant of RSUs is recognized ratably over the one-year vesting period based upon the fair value of the RSUs, as remeasured at the end of each period. If any of the assumptions used in the Black-Scholes model or the anticipated number of shares to be awarded change significantly, share-based compensation expense may differ materially in the future from that recorded in the current period. See additional information related to share-based compensation in Note 16 to the consolidated financial statements.
55
|
BROWN SHOE COMPANY, INC.
|
2010 FORM 10-K
|
Impact of New Accounting Pronouncements
In June 2009, the FASB issued a standard that changes the consolidation guidance applicable to a variable interest entity (“VIE”). The pronouncement also amends previous rules governing the determination of whether an enterprise is the primary beneficiary of a VIE, and is, therefore, required to consolidate an entity by requiring a qualitative analysis rather than a quantitative analysis. The qualitative analysis should include, among other things, consideration of who has the power to direct the activities of the entity that most significantly impact the entity’s economic performance and who has the obligation to absorb losses or the right to receive benefits of the VIE that could potentially be significant to the VIE. This guidance also requires continuous reassessments of whether an enterprise is the primary beneficiary of a VIE and enhanced disclosures about an enterprise’s involvement with a VIE. The standard is effective as of the beginning of interim and annual reporting periods that begin after November 15, 2009. The Company adopted the guidance at the beginning of 2010. See Note 2 to the consolidated financial statements for additional information.
In January 2010, the FASB issued guidance that provides amendments to FASB ASC 820, Fair Value Measurements and Disclosures, and requires more extensive disclosures about (a) transfers in and out of Levels 1 and 2, (b) activity in Level 3 fair value measurements, (c) different classes of assets and liabilities measured at fair value, and (d) the valuation techniques and inputs used to measure fair value for both recurring and nonrecurring fair value measurements. The guidance is effective for interim or annual reporting periods beginning after December 15, 2009, except for certain disclosures applicable to Level 3 fair value measurements, which are effective for fiscal years beginning after December 15, 2010, and for interim periods within those fiscal years. Accordingly, the Company adopted the guidance, except for certain disclosures applicable to Level 3 fair value measurements, at the beginning of 2010. The Company will adopt the guidance applicable to Level 3 fair value measurements in 2011.
Impact of Prospective Accounting Pronouncements
In December 2010, the FASB issued Emerging Issues Task Force Issue No. 10-G, Disclosure of Supplementary Pro Forma Information for Business Combinations, requiring entities that have entered into a material business combination or a series of immaterial business combinations that are material in the aggregate to present pro forma disclosures required under ASC 805, Business Combinations, as if the business combination occurred at the beginning of the prior annual period when preparing pro forma financial information for both the current and prior annual periods. Additional disclosures describing the nature and amount of material, nonrecurring pro forma adjustments are also required. The guidance is effective for business combinations consummated on or after the beginning of the first annual reporting period beginning on or after December 15, 2010. Accordingly, the Company will adopt the guidance in 2011.
|
2.
|
ACQUISITIONS
|
Edelman Shoe, Inc.
Edelman Shoe, Inc. (“Edelman Shoe”) is a leading designer and marketer of fashion footwear. The Sam Edelman brand was launched in 2004 and is primarily sold through department stores and independent retailers.
In 2007, the Company invested cash of $7.1 million in Edelman Shoe, acquiring 42.5% of the outstanding stock. On November 3, 2008, the Company invested an additional $4.1 million of cash in Edelman Shoe, acquiring 7.5% of the outstanding stock, bringing the Company’s total equity interest to 50%.
Beginning November 3, 2008, the Company’s consolidated financial statements included the accounts of Edelman Shoe as a result of the Company’s determination that Edelman Shoe was a VIE, for which the Company was the primary beneficiary. At the beginning of fiscal 2010, the Company adopted amended consolidation guidance applicable to VIEs, evaluated the impact on the existing variable interests in Edelman Shoe and determined that Edelman Shoe continued to be a VIE that was appropriately consolidated by the Company.
On June 4, 2010, the Company acquired the remaining 50% of the outstanding stock of Edelman Shoe for $40.0 million, consisting of a combination of $32.7 million of cash, including transaction fees, and $7.3 million in shares of the Company’s common stock. The stock consideration consisted of 473,081 shares of the Company’s common stock. The acquisition of the remaining interest in Edelman Shoe was accounted for in accordance with the consolidation guidance applicable to noncontrolling interests, which requires changes in a parent’s ownership interest in a subsidiary, without loss of control, to be reflected as an adjustment to the carrying amount of the noncontrolling interest with excess consideration recognized directly to equity attributable to the controlling interest. As a result, the Company’s acquisition of the remaining interest in Edelman Shoe resulted in a reduction to total equity of $32.7 million, consisting of a net reduction of $24.1 million to total Brown Shoe Company, Inc. shareholders’ equity and the elimination of $8.6 million of the noncontrolling interest in Edelman Shoe. As of June 4, 2010, Edelman Shoe is a wholly-owned subsidiary of the Company.
56
|
BROWN SHOE COMPANY, INC.
|
2010 FORM 10-K
|
American Sporting Goods Corporation – Subsequent Event (Unaudited)
On February 17, 2011, subsequent to fiscal 2010 year-end, the Company entered into a Stock Purchase Agreement with American Sporting Goods Corporation (“ASG”) and ASG’s stockholders, pursuant to which a subsidiary of the Company acquired all of the outstanding capital stock of ASG (the “ASG Stock”) from the ASG stockholders on that date. The aggregate purchase price for the ASG Stock was $145.0 million in cash plus assumed net debt, and included a $2.0 million cash earn-out contingent upon ASG’s achievement of certain financial targets.
ASG is a designer, manufacturer and marketer of a broad range of athletic footwear with a strong presence in walking, fitness and basketball. It was founded in 1983 and headquartered in Aliso Viejo, California.
The acquisition adds performance athletic and outdoor footwear brands to the Company’s portfolio, including Avia, rykä, AND1, Nevados and Yukon, and complements the Company’s existing fitness and comfort offerings.
Effective February 17, 2011, the Loan Parties under the Company’s Credit Agreement exercised the $150.0 million designated event accordion feature to fund the $145.0 million purchase price for ASG, increasing the aggregate amount available under the Credit Agreement from $380.0 million to $530.0 million. The Credit Agreement still provides for access to an additional $150.0 million of optional availability pursuant to a separate accordion feature, subject to satisfaction of certain conditions and approval of the lenders.
The Company incurred acquisition-related costs of $1.1 million ($0.7 million on an after-tax basis, or $0.02 per diluted share) during 2010, as a component of restructuring and other special charges, net.
The acquisition of ASG will be recorded in accordance with the acquisition method, and it is expected that goodwill and intangible assets will be recorded on the consolidated balance sheets. However, as the initial accounting for the business combination has not been completed as of April 1, 2011, including the measurement of certain intangible assets and goodwill, further details have not yet been disclosed.
|
3.
|
EARNINGS (LOSS) PER SHARE
|
As discussed in Note 1, the Company began using the two-class method to compute basic and diluted earnings (loss) per common share attributable to Brown Shoe Company, Inc. shareholders at the beginning of 2009. In periods of net loss, no effect is given to the Company’s participating securities since they do not contractually participate in the losses of the Company. The following table sets forth the computation of basic and diluted earnings (loss) per common share attributable to Brown Shoe Company, Inc. shareholders:
|
(in thousands, except per share amounts)
|
2010
|
2009
|
2008
|
||||||||||||
|
NUMERATOR
|
|||||||||||||||
|
Net earnings (loss) attributable to Brown Shoe Company, Inc. before allocation of earnings to participating securities
|
$
|
37,233
|
$
|
9,500
|
$
|
(133,238
|
)
|
||||||||
|
Less: Earnings allocated to participating securities
|
(1,283
|
)
|
(361
|
)
|
–
|
||||||||||
|
Net earnings (loss) attributable to Brown Shoe Company, Inc. after allocation of earnings to participating securities
|
$
|
35,950
|
$
|
9,139
|
$
|
(133,238
|
)
|
||||||||
|
DENOMINATOR
|
|||||||||||||||
|
Denominator for basic earnings (loss) per common share attributable to Brown Shoe Company, Inc. shareholders
|
42,156
|
41,585
|
41,525
|
||||||||||||
|
Dilutive effect of share-based awards
|
331
|
64
|
–
|
||||||||||||
|
Denominator for diluted earnings (loss) per common share attributable to Brown Shoe Company, Inc. shareholders
|
42,487
|
41,649
|
41,525
|
||||||||||||
|
Basic earnings (loss) per common share attributable to Brown Shoe Company, Inc. shareholders
|
$
|
0.85
|
$
|
0.22
|
$
|
(3.21
|
)
|
||||||||
|
Diluted earnings (loss) per common share attributable to Brown Shoe Company, Inc. shareholders
|
$
|
0.85
|
$
|
0.22
|
$
|
(3.21
|
)
|
||||||||
Options to purchase 1,186,570 and 1,679,335 shares of common stock in 2010 and 2009, respectively, were not included in the denominator for diluted earnings per common share attributable to Brown Shoe Company, Inc. shareholders because the effect would be antidilutive. Due to the Company’s net loss attributable to Brown Shoe Company, Inc. in 2008, the denominator for diluted loss per common share attributable to Brown Shoe Company, Inc. shareholders is the same as the denominator for basic loss per common share attributable to Brown Shoe Company, Inc. shareholders.
57
|
BROWN SHOE COMPANY, INC.
|
2010 FORM 10-K
|
|
4.
|
COMPREHENSIVE INCOME (LOSS)
|
Comprehensive income (loss) includes changes in equity related to foreign currency translation adjustments, unrealized gains or losses from derivatives used for hedging activities and pension and other postretirement benefits adjustments.
The following table sets forth the reconciliation from net earnings (loss) to comprehensive income (loss) for the periods ended January 29, 2011, January 30, 2010 and January 31, 2009:
|
($ thousands)
|
2010
|
2009
|
2008
|
||||||||||
|
Net earnings (loss)
|
$
|
37,060
|
$
|
10,443
|
$
|
(134,813
|
)
|
||||||
|
Other comprehensive income (loss) (“OCI”), net of tax:
|
|||||||||||||
|
Foreign currency translation adjustment
|
2,150
|
3,437
|
(10,372
|
)
|
|||||||||
|
Pension and other postretirement benefits adjustments, net of tax of $2,197, $2,485 and $7,150 in 2010, 2009 and 2008, respectively
|
3,433
|
3,509
|
(11,233
|
)
|
|||||||||
|
Unrealized gains (losses) on derivative financial instruments, net of tax of $63, $481 and $200 in 2010, 2009 and 2008, respectively
|
171
|
(1,146
|
)
|
409
|
|||||||||
|
Net loss (gain) from derivatives reclassified into earnings, net of tax of $124, $82 and $11 in 2010, 2009 and 2008, respectively
|
233
|
161
|
(11
|
)
|
|||||||||
|
5,987
|
5,961
|
(21,207
|
)
|
||||||||||
|
Comprehensive income (loss)
|
$
|
43,047
|
$
|
16,404
|
$
|
(156,020
|
)
|
||||||
|
Less: Comprehensive (loss) income attributable
to noncontrolling interests
|
(150
|
)
|
946
|
(1,403
|
)
|
||||||||
|
Comprehensive income (loss) attributable to
Brown Shoe Company, Inc.
|
$
|
43,197
|
$
|
15,458
|
$
|
(154,617
|
)
|
||||||
The following table sets forth the balance in accumulated other comprehensive income (loss) for the Company at January 29, 2011, January 30, 2010 and January 31, 2009:
|
($ thousands)
|
2010
|
2009
|
2008
|
||||||
|
Foreign currency translation gains
|
$
|
6,281
|
$
|
4,154
|
$
|
720
|
|||
|
Unrealized (losses) gains on derivative financial instruments, net of tax
|
(313
|
)
|
(717
|
)
|
268
|
||||
|
Pension and other postretirement benefits, net of tax
|
173
|
(3,260
|
)
|
(6,769
|
)
|
||||
|
Accumulated other comprehensive income (loss)
|
$
|
6,141
|
$
|
177
|
$
|
(5,781
|
)
|
||
See additional information related to derivative financial instruments in Note 1, Note 13 and Note 14 to the consolidated financial statements and additional information related to pension and other postretirement benefits in Note 6 to the consolidated financial statements.
|
5.
|
RESTRUCTURING AND OTHER SPECIAL CHARGES, NET
|
Information Technology Initiatives
During 2008, the Company began implementation of an integrated enterprise resource planning (“ERP”) information technology system provided by third-party vendors. The ERP information technology system has replaced certain of the Company’s existing internally developed and certain other third-party applications and is expected to better support the Company’s business model. The Company expects the implementation will enhance its profitability through improved management and execution of its business operations, financial systems, supply chain efficiency and planning and employee productivity. Although the Company went live on the wholesale portion of its new ERP system in the fourth quarter of 2010, system transition efforts and alignment of existing business processes are expected to continue into 2011. During 2010, the Company incurred expenses of $6.8 million ($4.6 million on an after-tax basis, or $0.10 per diluted share) related to these initiatives. Of the $6.8 million in expenses recorded during 2010, $6.1 million was recorded in the Other segment, and the remaining expense was recorded in the Wholesale Operations segment. During 2009, the Company incurred expenses of $9.2 million ($5.8 million on an after-tax basis, or $0.14 per diluted share) related to these initiatives. Of the $9.2 million in expenses recorded during 2009, $8.9 million was recorded in the Other segment, and the remaining expense was recorded in the Wholesale Operations segment. During 2008, the Company incurred expenses of $3.7 million ($2.4 million on an after-tax basis, or $0.06 per diluted share), and these expenses were reflected within the Other segment. All expenses incurred were recorded as a component of restructuring and other special charges, net.
58
|
BROWN SHOE COMPANY, INC.
|
2010 FORM 10-K
|
Acquisition-related Costs
On February 17, 2011, the Company entered into a Stock Purchase Agreement with ASG and ASG’s stockholders, pursuant to which a subsidiary of the Company acquired all of the outstanding capital stock of ASG from the ASG stockholders on that date. During 2010, the Company incurred acquisition-related costs totaling $1.1 million ($0.7 million on an after-tax basis, or $0.02 per diluted share) to effect the acquisition of ASG. All of the costs recorded during 2010 were reflected within the Other segment. See Note 2 to the consolidated financial statements for further information.
Organizational Changes
During November 2009, the Company made a series of changes within its leadership team as two executives announced plans to retire during 2010. During the fourth quarter of 2009, the Company incurred charges of $4.6 million ($2.8 million on an after-tax basis, or $0.07 per diluted share), related to their retirement. All of the costs recorded during 2009 were reflected within the Other segment as a component of restructuring and other special charges, net. No additional charges were incurred during 2010, and all charges have been settled in 2010.
Headquarters Consolidation
During 2008, the Company relocated its Famous Footwear division headquarters from Madison, Wisconsin, to St. Louis, Missouri, to foster collaboration, increase the Company’s speed to market and strengthen its connection with consumers. The Company incurred charges of $29.8 million ($18.2 million on an after-tax basis, or $0.44 per diluted share) during 2008. These costs included employee-related costs for relocation, severance, recruiting and retention, as well as facility and other costs. All of the costs recorded during 2008 were reflected within the Other segment as a component of restructuring and other special charges, net. During 2008, a tax benefit of $11.6 million associated with the costs was recorded. The write-off of assets during 2008 of $3.4 million, included in facility costs, was a noncash item. During 2009, the Company recorded income of $1.9 million ($1.1 million on an after-tax basis, or $0.03 per diluted share) as a result of an expanded sublease arrangement. The Company incurred no additional charges or income during 2010.
The following is a summary of the charges and settlements by category of costs:
|
($ millions)
|
Employee
Severance
|
Employee
Relocation
|
Employee
Recruiting
|
Facility
|
Other
|
Total
|
||||||||||||
|
Original charges and reserve balance
|
$
|
6.6
|
$
|
8.3
|
$
|
4.6
|
$
|
9.2
|
$
|
1.1
|
$
|
29.8
|
||||||
|
Amounts settled in 2008
|
(4.7
|
)
|
(6.2
|
)
|
(4.3
|
)
|
(3.6
|
)
|
(1.0
|
)
|
(19.8
|
)
|
||||||
|
Reserve reduction in 2009
|
–
|
–
|
–
|
(1.9
|
)
|
–
|
(1.9
|
)
|
||||||||||
|
Amounts settled in 2009
|
(1.9
|
)
|
(1.7
|
)
|
(0.2
|
)
|
(1.9
|
)
|
(0.1
|
)
|
(5.8
|
)
|
||||||
|
Reserve balance at January 30, 2010
|
$
|
–
|
$
|
0.4
|
$
|
0.1
|
$
|
1.8
|
$
|
–
|
$
|
2.3
|
||||||
|
Amounts settled in 2010
|
–
|
(0.4
|
)
|
(0.1
|
)
|
(1.4
|
)
|
–
|
(1.9
|
)
|
||||||||
|
Reserve balance at January 29, 2011
|
$
|
–
|
$
|
–
|
$
|
–
|
$
|
0.4
|
$
|
–
|
$
|
0.4
|
||||||
Expense and Capital Containment Initiatives
During 2008, the Company announced expense and capital containment initiatives in an effort to proactively position itself for continued challenges in the retail environment. These initiatives included a voluntary separation program, changes in compensation structure, further rationalization of operating expenses and the closing of certain functions at its Fredericktown, Missouri, distribution center. The Company incurred no charges during 2010 or 2009 but incurred charges of $30.9 million ($19.1 million on an after-tax basis, or $0.46 per diluted share) during 2008. These costs included employee-related costs for severance, including health care benefits and enhanced pension benefits, as well as facility and other costs.
The following is a summary of the charges and settlements by category of costs:
|
($ millions)
|
Employee Severance
|
Facility
|
Other
|
Total
|
|||||||||||
|
Original charges and reserve balance
|
$
|
24.7
|
$
|
6.0
|
$
|
0.2
|
$
|
30.9
|
|||||||
|
Amounts settled in 2008
|
(5.3
|
)
|
(2.7
|
)
|
–
|
(8.0
|
)
|
||||||||
|
Amounts settled in 2009
|
(15.3
|
)
|
(2.1
|
)
|
(0.2
|
)
|
(17.6
|
)
|
|||||||
|
Reserve balance at January 30, 2010
|
$
|
4.1
|
$
|
1.2
|
$
|
–
|
$
|
5.3
|
|||||||
|
Amounts settled in 2010
|
(3.3
|
)
|
(1.2
|
)
|
–
|
(4.5
|
)
|
||||||||
|
Reserve balance at January 29, 2011
|
$
|
0.8
|
$
|
–
|
$
|
–
|
$
|
0.8
|
|||||||
Of the $30.9 million in costs recorded during 2008, $14.4 million was recorded in the Wholesale Operations segment, $12.1 million was recorded in the Other segment, $3.8 million was recorded in the Famous Footwear segment and $0.6 million was recorded in the Specialty Retail segment. All of the costs recorded during 2008 were reflected as a component of restructuring and other special charges, net. A tax benefit of $11.8 million associated with the costs was recorded during 2008. The write-off of assets during 2008 of $0.5 million, included in facility costs, was a noncash item.
59
|
BROWN SHOE COMPANY, INC.
|
2010 FORM 10-K
|
Environmental Insurance Recoveries, Net
During 2008, the Company reached agreements with certain insurance carriers to recover environmental remediation costs associated with its facility in Denver, Colorado (the “Redfield” facility). As a result of these settlements, all claims among the parties were dismissed. The Company recorded income within its Other segment related to these recoveries, net of associated fees and costs, of $10.1 million ($6.2 million on an after-tax basis, or $0.15 per diluted share) as a component of restructuring and other special charges, net, with no corresponding charges or recoveries during 2010 or 2009.
|
6.
|
RETIREMENT AND OTHER BENEFIT PLANS
|
The Company sponsors pension plans in both the United States and Canada. The Company’s domestic pension plans cover substantially all United States employees. Under the domestic plans, salaried, management and certain hourly employees’ pension benefits are based on the employee’s highest consecutive five years of compensation during the 10 years before retirement; hourly employees’ and union members’ benefits are based on stated amounts for each year of service. The Company’s Canadian pension plans cover certain employees based on plan specifications. Under the Canadian plans, employees’ pension benefits are based on the employee’s highest consecutive five years of compensation during the 10 years before retirement. The Company’s funding policy for all plans is to make the minimum annual contributions required by applicable regulations.
The Company also maintains an unfunded Supplemental Executive Retirement Plan (“SERP”). As of January 29, 2011, the projected benefit obligation of this plan was $12.7 million, and the accumulated benefit obligation was $11.1 million.
In addition to providing pension benefits, the Company sponsors unfunded defined-benefit postretirement life insurance plans that cover both salaried and hourly employees who had become eligible for benefits by January 1, 1995. The life insurance plans provide coverage ranging from $1 to $20 thousand for qualifying retired employees.
Benefit Obligations
The following table sets forth changes in benefit obligations, including all domestic and Canadian plans:
|
Pension Benefits
|
Other Postretirement
Benefits
|
|||||||||||
|
($ thousands)
|
2010
|
2009
|
2010
|
2009
|
||||||||
|
Benefit obligation at beginning of year
|
$
|
197,259
|
$
|
181,867
|
$
|
3,657
|
$
|
3,542
|
||||
|
Service cost
|
7,826
|
6,790
|
–
|
–
|
||||||||
|
Interest cost
|
12,102
|
11,573
|
186
|
219
|
||||||||
|
Plan participants’ contribution
|
10
|
9
|
41
|
37
|
||||||||
|
Plan amendments
|
18
|
21
|
–
|
–
|
||||||||
|
Actuarial loss (gain)
|
13,657
|
7,854
|
(409
|
)
|
109
|
|||||||
|
Benefits paid
|
(15,854
|
)
|
(11,418
|
)
|
(245
|
)
|
(250
|
)
|
||||
|
Foreign exchange rate changes
|
355
|
563
|
–
|
–
|
||||||||
|
Benefit obligation at end of year
|
$
|
215,373
|
$
|
197,259
|
$
|
3,230
|
$
|
3,657
|
||||
The accumulated benefit obligation for the United States pension plans was $196.6 million and $181.8 million as of January 29, 2011, and January 30, 2010, respectively. The accumulated benefit obligation for the Canadian pension plans was $5.1 million and $4.3 million as of January 29, 2011 and January 30, 2010, respectively.
|
Pension Benefits
|
Other Postretirement
Benefits
|
||||||||||||||||
|
Weighted-average assumptions Used to determine benefit obligations, end of year
|
2010
|
2009
|
2010
|
2009
|
|||||||||||||
| Discount rate | 5.75% | 6.00% | 5.75% | 6.00% | |||||||||||||
| Rate of compensation increase | 4.00% | 4.25% | N/A | N/A | |||||||||||||
60
|
BROWN SHOE COMPANY, INC.
|
2010 FORM 10-K
|
Plan Assets
Pension assets are managed in accordance with the prudent investor standards of the Employee Retirement Income Security Act (“ERISA”). The plan’s investment objective is to earn a competitive total return on assets, while also ensuring plan assets are adequately managed to provide for future pension obligations. This results in the protection of plan surplus and is accomplished by matching the duration of the projected benefit obligation using leveraged fixed income instruments and, while maintaining a 70% overall (United States and international) equity commitment, managing an equity overlay strategy. The overlay strategy is intended to protect the managed equity portfolios against adverse stock market environments. The Company delegates investment management to specialists in each asset class and regularly monitors manager performance and compliance with investment guidelines. The Company’s overall investment strategy is to achieve a mix of approximately 95% of investments for long-term growth and 5% for near-term benefit payments with a wide diversification of asset types, fund strategies and fund managers. The target allocations for plan assets for 2011 are 55% domestic equities, 30% debt securities and 15% foreign equities. Domestic equities did not include any Company stock at January 29, 2011, or January 30, 2010.
Assets of the Canadian pension plans, which total approximately $5.7 million at January 29, 2011, were invested 57% in equity funds, 41% in bond funds and 2% in money market funds. The Canadian pension plans did not include any Company stock as of January 29, 2011, or January 30, 2010.
A financial instrument’s level within the valuation hierarchy is based upon the lowest level of input that is significant to the fair value measurement. See further discussion on the fair value hierarchy in Note 14 to the consolidated financial statements. Following is a description of the pension plan investments measured at fair value, including the general classification of such investments pursuant to the valuation hierarchy.
|
·
|
Investments in corporate stocks – common, U.S. government securities, mutual fund, money market funds, real estate investment trusts and S&P 500 Index put and call options (traded on security exchanges) are classified within Level 1 of the fair value hierarchy because the fair values are based on unadjusted quoted market prices in active markets with sufficient volume and frequency.
|
|
·
|
Corporate debt instruments and interest rate swap agreements are valued at fair value based on vendor-quoted pricing for which inputs are observable; therefore, these are classified within Level 2 of the fair value hierarchy.
|
|
·
|
The limited partnership investment represents the pension plan’s undivided interest in a limited partnership. Limited partnership assets are allocated to the pension plan by assigning the pension plan transactions that can be specifically identified and allocating non-specific transactions in proportion to the pension plan’s beneficial interest in the limited partnership; therefore, this contract is classified within Level 2 of the fair value hierarchy. There are currently no redemption restrictions on the limited partnership investment.
|
|
·
|
The group trust investment is a unitized fund classified within Level 2 of the fair value hierarchy because the fair value is estimated using the NAV per unit based on vendor-quoted pricing for which inputs are observable. There are currently no redemption restrictions on the group trust investment.
|
|
·
|
The unallocated insurance contract is valued at contract value, which approximates fair value; therefore, this contract is classified within Level 3 of the fair value hierarchy. The unallocated insurance contract fair value was $0.1 million as of both January 29, 2011, and January 30, 2010.
|
The fair values of the Company’s pension plan assets at January 29, 2011, by asset category are as follows:
|
Fair Value Measurements at January 29, 2011
|
|||||||||
|
($ thousands)
|
Total
|
Level 1
|
Level 2
|
Level 3
|
|||||
|
Asset (liability)
|
|||||||||
|
Money market funds
|
$
|
6,991
|
$
|
6,991
|
$
|
–
|
$
|
–
|
|
|
U.S. government securities
|
40,965
|
40,965
|
–
|
–
|
|||||
|
Mutual fund
|
13,180
|
13,180
|
–
|
–
|
|||||
|
Limited partnership
|
39,459
|
–
|
39,459
|
–
|
|||||
|
Group trust
|
8,548
|
–
|
8,548
|
–
|
|||||
|
Real estate investment trusts
|
1,970
|
1,970
|
–
|
–
|
|||||
|
Corporate debt instruments
|
51,263
|
–
|
51,263
|
–
|
|||||
|
Corporate stocks – common
|
119,460
|
119,460
|
–
|
–
|
|||||
|
S&P 500 Index options
|
(1,632
|
) |
(1,632
|
) |
–
|
–
|
|||
|
Interest rate swap agreements
|
(14,462
|
) |
–
|
(14,462
|
) |
–
|
|||
|
Unallocated insurance contract
|
106
|
–
|
–
|
106
|
|||||
|
Total
|
$
|
265,848
|
$
|
180,934
|
$
|
84,800
|
$
|
106
|
|
61
|
BROWN SHOE COMPANY, INC.
|
2010 FORM 10-K
|
The following table sets forth changes in the fair value of plan assets, including all domestic and Canadian plans:
|
Pension Benefits
|
Other Postretirement
Benefits
|
|||||||||||
|
($ thousands)
|
2010
|
2009
|
2010
|
2009
|
||||||||
|
Fair value of plan assets at beginning of year
|
$
|
239,427
|
$
|
213,705
|
$
|
–
|
$
|
–
|
||||
|
Actual return on plan assets
|
38,178
|
34,000
|
–
|
–
|
||||||||
|
Employer contributions
|
3,657
|
2,521
|
204
|
213
|
||||||||
|
Plan participants’ contributions
|
10
|
9
|
41
|
37
|
||||||||
|
Benefits paid
|
(15,802
|
)
|
(11,418
|
)
|
(245
|
)
|
(250
|
)
|
||||
|
Foreign exchange rate changes
|
378
|
610
|
–
|
–
|
||||||||
|
Fair value of plan assets at end of year
|
$
|
265,848
|
$
|
239,427
|
$
|
–
|
$
|
–
|
||||
Employer contributions and benefits paid in the above table include both those amounts contributed directly to and paid directly from plan assets and those amounts paid directly to plan participants.
Funded Status
The over-funded status as of January 29, 2011, and January 30, 2010, for pension benefits was $50.5 million and $42.2 million, respectively. The under-funded status as of January 29, 2011, and January 30, 2010, for other postretirement benefits was $3.2 million and $3.7 million, respectively.
Amounts recognized in the consolidated balance sheets consist of:
|
Pension Benefits
|
Other Postretirement
Benefits
|
|||||||||||
|
($ thousands)
|
2010
|
2009
|
2010
|
2009
|
||||||||
|
Prepaid pension costs (noncurrent asset)
|
$
|
63,250
|
$
|
54,485
|
$
|
-
|
$
|
-
|
||||
|
Accrued benefit liabilities (current liability)
|
(7,218
|
)
|
(3,378
|
)
|
(327
|
)
|
(349
|
)
|
||||
|
Accrued benefit liabilities (noncurrent liability)
|
(5,556
|
)
|
(8,939
|
)
|
(2,903
|
)
|
(3,308
|
)
|
||||
|
Net amount recognized at end of year
|
$
|
50,476
|
$
|
42,168
|
$
|
(3,230
|
)
|
$
|
(3,657
|
)
|
||
The projected benefit obligation, the accumulated benefit obligation and the fair value of plan assets for pension plans with a projected benefit obligation in excess of plan assets and for pension plans with an accumulated benefit obligation in excess of plan assets, which includes only the Company’s SERP, were as follows:
|
Projected Benefit
Obligation Exceeds
the Fair Value
of Plan Assets
|
Accumulated Benefit
Obligation Exceeds
the Fair Value
of Plan Assets
|
|||||||||||
|
($ thousands)
|
2010
|
2009
|
2010
|
2009
|
||||||||
|
End of Year
|
||||||||||||
|
Projected benefit obligation
|
$
|
12,710
|
$
|
12,051
|
$
|
12,710
|
$
|
12,051
|
||||
|
Accumulated benefit obligation
|
11,080
|
11,262
|
11,080
|
11,262
|
||||||||
|
Fair value of plan assets
|
-
|
-
|
-
|
-
|
||||||||
The accumulated postretirement benefit obligation exceeds assets for all of the Company’s other postretirement benefit plans.
62
|
BROWN SHOE COMPANY, INC.
|
2010 FORM 10-K
|
The amounts in accumulated other comprehensive (income) loss that have not yet been recognized as components of net periodic benefits (income) cost at January 29, 2011 and January 30, 2010, and the expected amortization of the January 29, 2011 amounts as components of net periodic benefit cost (income) for the year ended January 28, 2012, are as follows:
|
Pension Benefits
|
Other Postretirement Benefits
|
|||||||||||
|
($ thousands)
|
2010
|
2009
|
2010
|
2009
|
||||||||
|
Components of accumulated other comprehensive (income) loss, net of tax:
|
||||||||||||
|
Net actuarial loss (gain)
|
$
|
669
|
$
|
3,967
|
$
|
(745
|
)
|
$
|
(565
|
)
|
||
|
Net prior service cost
|
(32
|
)
|
(49
|
)
|
-
|
-
|
||||||
|
Net transition asset
|
(65
|
)
|
(93
|
)
|
-
|
-
|
||||||
|
$
|
572
|
$
|
3,825
|
$
|
(745
|
)
|
$
|
(565
|
)
|
|||
|
Pension Benefits
|
Other Postretirement Benefits
|
|||||||||||
|
($ thousands)
|
2011
|
2011
|
||||||||||
|
Expected amortization, net of tax:
|
||||||||||||
|
Amortization of net actuarial losses (gains)
|
$
|
221
|
$
|
(62
|
)
|
|||||||
|
Amortization of net prior service cost
|
(5
|
)
|
-
|
|||||||||
|
Amortization of net transition asset
|
29
|
-
|
||||||||||
|
$
|
245
|
$
|
(62
|
)
|
||||||||
Net Periodic Benefit Cost
Net periodic benefit (income) cost for 2010, 2009 and 2008 for all domestic and Canadian plans included the following components:
|
Pension Benefits
|
Other Postretirement Benefits
|
||||||||||||||||||
|
($ thousands)
|
2010
|
2009
|
2008
|
2010
|
2009
|
2008
|
|||||||||||||
|
Service cost
|
$
|
7,826
|
$
|
6,790
|
$
|
7,970
|
$
|
–
|
$
|
–
|
$
|
–
|
|||||||
|
Interest cost
|
12,102
|
11,573
|
10,935
|
186
|
219
|
257
|
|||||||||||||
|
Expected return on assets
|
(20,183
|
)
|
(19,494
|
)
|
(18,762
|
)
|
–
|
–
|
–
|
||||||||||
|
Amortization of:
|
|||||||||||||||||||
|
Actuarial loss (gain)
|
172
|
120
|
246
|
(112
|
)
|
(85
|
)
|
(9
|
)
|
||||||||||
|
Prior service cost
|
(8
|
)
|
(12
|
)
|
(23
|
)
|
–
|
–
|
–
|
||||||||||
|
Net transition asset
|
(46
|
)
|
(137
|
)
|
(161
|
)
|
–
|
–
|
–
|
||||||||||
|
Special termination benefits
|
–
|
–
|
5,407
|
–
|
–
|
–
|
|||||||||||||
|
Settlement cost
|
878
|
127
|
449
|
–
|
–
|
–
|
|||||||||||||
|
Total net periodic benefit (income) cost
|
$
|
741
|
$
|
(1,033
|
)
|
$
|
6,061
|
$
|
74
|
$
|
134
|
$
|
248
|
||||||
|
Pension Benefits
|
Other Postretirement Benefits
|
|||||||||||
|
Weighted-average assumptions used to determine net cost
|
2010
|
2009
|
2008
|
2010
|
2009
|
2008
|
||||||
|
Discount rate
|
6.00%
|
6.50%
|
6.00%
|
6.00%
|
6.50%
|
6.00%
|
||||||
|
Rate of compensation increase
|
4.00%
|
4.25%
|
4.25%
|
N/A
|
N/A
|
N/A
|
||||||
|
Expected return on plan assets
|
8.50%
|
8.50%
|
8.75%
|
N/A
|
N/A
|
N/A
|
||||||
The prior service cost is amortized on a straight-line basis over the average future service of active plan participants benefiting under the plan at the time of each plan amendment. The net actuarial loss (gain) subject to amortization is amortized on a straight-line basis over the average future service of active plan participants as of the measurement date. The net transition asset is amortized over the estimated service life.
The expected long-term rate of return on plan assets is based on historical and projected rates of return for current and planned asset classes in the plan’s investment portfolio. Assumed projected rates of return for each asset class were selected after analyzing experience and future expectations of the returns. The overall expected rate of return for the portfolio was developed based on the target allocation for each asset class.
63
|
BROWN SHOE COMPANY, INC.
|
2010 FORM 10-K
|
Expected Cash Flows
Information about expected cash flows for all pension and postretirement benefit plans follows:
|
Pension Benefits
|
|||||||||||||
|
($ thousands)
|
Funded Plans
|
SERP
|
Total
|
Other
Postretirement
Benefits
|
|||||||||
|
Employer Contributions
|
|||||||||||||
|
2011 expected contributions to plan trusts
|
$
|
185
|
$
|
–
|
$
|
185
|
$
|
–
|
|||||
|
2011 expected contributions to plan participants
|
–
|
7,218
|
7,218
|
327
|
|||||||||
|
Expected Benefit Payments
|
|||||||||||||
|
2011
|
$
|
9,949
|
$
|
7,218
|
$
|
17,167
|
$
|
327
|
|||||
|
2012
|
10,293
|
220
|
10,513
|
314
|
|||||||||
|
2013
|
10,760
|
239
|
10,999
|
300
|
|||||||||
|
2014
|
11,125
|
142
|
11,267
|
285
|
|||||||||
|
2015
|
11,455
|
2,235
|
13,690
|
269
|
|||||||||
|
2016 – 2020
|
63,947
|
5,308
|
69,255
|
1,076
|
|||||||||
Defined-Contribution Plans
The Company’s domestic defined-contribution 401(k) plan covers salaried and certain hourly employees. Company contributions represent a partial matching of employee contributions, generally up to a maximum of 3.5% of the employee’s salary and bonus. The Company’s expense for this plan was $3.0 million, $3.2 million and $3.3 million in 2010, 2009 and 2008, respectively.
The Company’s Canadian defined-contribution plan covers certain salaried and hourly employees. The Company makes contributions for all eligible employees, ranging from 3% to 5% of the employee’s salary. In addition, eligible employees may voluntarily contribute to the plan. The Company’s expense for this plan was $0.3 million in 2010, 2009 and 2008.
Deferred Compensation Plan
In 2007, the Company established a non-qualified deferred compensation plan (the “Deferred Compensation Plan”) for the benefit of certain management employees. The investment funds offered to the participants generally correspond to the funds offered in the Company’s 401(k) plan, and the account balance fluctuates with the investment returns on those funds. The Deferred Compensation Plan permits the deferral of up to 50% of base salary and 100% of compensation received under the Company’s annual incentive plan. The deferrals are held in a separate trust, which has been established by the Company to administer the Deferred Compensation Plan. The assets of the trust are subject to the claims of the Company’s creditors in the event that the Company becomes insolvent. Consequently, the trust qualifies as a grantor trust for income tax purposes (i.e., a “Rabbi Trust”). The liabilities of the Deferred Compensation Plan of $1.4 million in 2010 and $1.0 million in 2009 are presented in employee compensation and benefits in the accompanying consolidated balance sheets. The assets held by the trust of $1.4 million in 2010 and $1.0 million in 2009 are classified as trading securities within prepaid expenses and other current assets in the accompanying consolidated balance sheets, with changes in the deferred compensation charged to selling and administrative expenses in the accompanying consolidated statements of earnings.
Deferred Compensation Plan for Non-Employee Directors
Non-employee directors are eligible to participate in a deferred compensation plan, whereby deferred compensation amounts are valued as if invested in the Company’s common stock through the use of phantom stock units (“PSUs”). Under the plan, each participating director’s account is credited with the number of PSUs equal to the number of shares of the Company’s common stock that the participant could purchase or receive with the amount of the deferred compensation, based upon the fair value (as determined based on the average of the high and low prices) of the Company’s common stock on the last trading day of the fiscal quarter when the cash compensation was earned. Dividend equivalents are paid on PSUs at the same rate as dividends on the Company’s common stock and are re-invested in additional PSUs at the next fiscal quarter-end. The PSUs are payable in cash based on the number of PSUs credited to the participating director’s account, valued on the basis of the fair value at fiscal quarter-end on or following termination of the director’s service. The liabilities of the plan of $0.8 million as of January 29, 2011, and $0.7 million as of January 30, 2010, are based on 62,218 and 61,002 outstanding PSUs, respectively, and are presented in other liabilities in the accompanying consolidated balance sheets. Gains and losses resulting from changes in the fair value of the PSUs are charged to selling and administrative expenses in the accompanying consolidated statements of earnings.
64
|
BROWN SHOE COMPANY, INC.
|
2010 FORM 10-K
|
|
7.
|
INCOME TAXES
|
The components of earnings (loss) before income taxes consisted of domestic earnings (loss) before income taxes of $23.8 million, $(6.8) million and $(217.2) million in 2010, 2009 and 2008, respectively, and foreign earnings before income taxes of $29.4 million, $18.5 million and $28.6 million in 2010, 2009 and 2008, respectively.
The components of income tax provision (benefit) on earnings (loss) were as follows:
|
($ thousands)
|
2010
|
2009
|
2008
|
||||||
|
Federal
|
|||||||||
|
Current
|
$
|
(3,001
|
)
|
$
|
(16,602
|
)
|
$
|
(1,174
|
)
|
|
Deferred
|
13,209
|
14,567
|
(43,336
|
)
|
|||||
|
10,208
|
(2,035
|
)
|
(44,510
|
)
|
|||||
|
State
|
|||||||||
|
Current
|
885
|
1,102
|
(1,308
|
)
|
|||||
|
Deferred
|
2,285
|
847
|
(7,912
|
)
|
|||||
|
3,170
|
1,949
|
(9,220
|
)
|
||||||
|
Foreign
|
2,782
|
1,345
|
(63
|
)
|
|||||
|
Total income tax provision (benefit)
|
$
|
16,160
|
$
|
1,259
|
$
|
(53,793
|
)
|
||
The Company received federal, state and foreign tax refunds, net of payments of $4.6 million in 2010 and made tax payments, net of refunds, of $(13.0) million in 2009 and $(1.4) million in 2008.
The differences between the tax provision (benefit) reflected in the consolidated financial statements and the amounts calculated at the federal statutory income tax rate of 35% were as follows:
|
($ thousands)
|
2010
|
2009
|
2008
|
||||||
|
Income taxes at statutory rate
|
$
|
18,627
|
$
|
4,095
|
$
|
(66,012
|
)
|
||
|
State income taxes, net of federal tax benefit
|
2,061
|
1,267
|
(4,411
|
)
|
|||||
|
State income tax credits, net of federal tax expense
|
–
|
–
|
(1,582
|
)
|
|||||
|
Tax impact of nondeductible stock option expense
|
285
|
305
|
708
|
||||||
|
Tax impact of nondeductible goodwill impairment
|
–
|
–
|
24,883
|
||||||
|
Foreign earnings taxed at lower rates
|
(6,504
|
)
|
(4,442
|
)
|
(10,195
|
)
|
|||
|
Other
|
1,691
|
34
|
2,816
|
||||||
|
Total income tax provision (benefit)
|
$
|
16,160
|
$
|
1,259
|
$
|
(53,793
|
)
|
||
The other category of income tax provision (benefit) principally represents the impact of expenses that are not deductible for federal income tax purposes.
65
|
BROWN SHOE COMPANY, INC.
|
2010 FORM 10-K
|
Significant components of the Company’s deferred income tax assets and liabilities were as follows:
|
($ thousands)
|
January 29, 2011
|
January 30, 2010
|
||||
|
Deferred Tax Assets
|
||||||
|
Employee benefits, compensation and insurance
|
$
|
13,735
|
$
|
15,160
|
||
|
Accrued expenses
|
8,088
|
8,611
|
||||
|
Depreciation
|
–
|
2,304
|
||||
|
Postretirement and postemployment benefit plans
|
1,915
|
2,009
|
||||
|
Deferred rent
|
5,072
|
7,402
|
||||
|
Accounts receivable reserves
|
5,375
|
3,348
|
||||
|
Net operating loss (“NOL”) carryforward/carryback
|
26,643
|
34,837
|
||||
|
Inventory capitalization and inventory reserves
|
2,752
|
4,240
|
||||
|
Intangible assets
|
993
|
2,405
|
||||
|
Other
|
2,172
|
3,510
|
||||
|
Total deferred tax assets, before valuation allowance
|
66,745
|
83,826
|
||||
|
Valuation allowance
|
(6,751
|
)
|
(8,859
|
)
|
||
|
Total deferred tax assets, net of valuation allowance
|
59,994
|
74,967
|
||||
|
Deferred Tax Liabilities
|
||||||
|
Retirement plans
|
(18,961
|
)
|
(17,349
|
)
|
||
|
LIFO inventory valuation
|
(31,927
|
)
|
(28,192
|
)
|
||
|
Capitalized software
|
(13,403
|
)
|
(7,609
|
)
|
||
|
Other
|
(1,656
|
)
|
(1,619
|
)
|
||
|
Depreciation
|
(1,078
|
)
|
–
|
|||
|
Total deferred tax liabilities
|
(67,025
|
)
|
(54,769
|
)
|
||
|
Net deferred tax (liability) asset
|
$
|
(7,031
|
)
|
$
|
20,198
|
|
At the end of 2010, the Company had a net operating loss carryforward with a tax value of $1.8 million related to Shoes.com, which expires in 2019, and various state net operating loss carryforwards with tax values totaling $10.0 million. A valuation allowance of $6.3 million has been established related to these operating loss carryforwards. The Company also has a valuation allowance of $0.5 million related to share-based compensation. The remaining net operating loss will be carried forward to future tax years.
As of January 29, 2011, no deferred taxes have been provided on the accumulated unremitted earnings of the Company’s foreign subsidiaries that are not subject to United States income tax. At January 29, 2011, the Company had approximately $131 million of cash and cash equivalents at its Canadian and other foreign subsidiaries.
The Company periodically evaluates its foreign investment opportunities and plans, as well as its foreign working capital needs, to determine the level of investment required and, accordingly, determine the level of foreign earnings that is considered indefinitely reinvested. Based upon that evaluation, earnings of the Company’s foreign subsidiaries that are not otherwise subject to United States taxation, except for the Company’s Canadian subsidiary, are considered to be indefinitely reinvested, and accordingly, deferred taxes have not been provided. If changes occur in future investment opportunities and plans, those changes will be reflected when known and may result in providing residual United States deferred taxes on unremitted foreign earnings. If the Company’s unremitted foreign earnings were not considered indefinitely reinvested as of January 29, 2011, additional deferred taxes of approximately $40.6 million would have been provided.
Uncertain Tax Positions
FASB ASC 740, Income Taxes, establishes a single model to address accounting for uncertain tax positions. The standard clarifies the accounting for income taxes by prescribing a minimum recognition threshold a tax position is required to meet before being recognized in the financial statements. The standard also provides guidance on derecognition, measurement classification, interest and penalties, accounting in interim periods, disclosure and transition.
66
|
BROWN SHOE COMPANY, INC.
|
2010 FORM 10-K
|
A reconciliation of the beginning and ending amount of unrecognized tax benefits is as follows:
|
($ thousands)
|
|||
|
Balance at February 2, 2008
|
$
|
923
|
|
|
Additions for tax positions of prior years
|
619
|
||
|
Reductions for tax positions of prior years due to a lapse in the statute of limitations
|
(149
|
)
|
|
|
Balance at January 31, 2009
|
$
|
1,393
|
|
|
Additions for tax positions of prior years
|
242
|
||
|
Reductions for tax positions of prior years due to a lapse in the statute of limitations
|
(262
|
)
|
|
|
Balance at January 30, 2010
|
$
|
1,373
|
|
|
Additions for tax positions of prior years
|
624
|
||
|
Settlements
|
(887
|
)
|
|
|
Reductions for tax positions of prior years due to a lapse in the statute of limitations
|
(358
|
)
|
|
|
Balance at January 29, 2011
|
$
|
752
|
|
If the unrecognized tax benefits were to be recognized in full, the net amount that would be reflected in the income statement tax provision, thereby impacting the effective tax rate, would be $0.7 million at January 29, 2011, and $1.3 million at both January 30, 2010, and January 31, 2009.
Estimated interest and penalties related to the underpayment of income taxes were classified as a component of the income tax provision (benefit) in the consolidated statements of earnings and were insignificant in both 2010 and 2009 and $0.1 million in 2008. Accrued interest and penalties were $0.3 million at January 29, 2011, and $0.4 million at January 30, 2010.
The Company has settled examinations by the Internal Revenue Service of tax years through February 3, 2007 (fiscal year 2006). The Company also files tax returns in various foreign jurisdictions and numerous states for which various tax years are subject to examination. The Company does not expect any significant changes to its liability for unrecognized tax benefits during the next 12 months.
|
8.
|
BUSINESS SEGMENT INFORMATION
|
The Company’s reportable segments include Famous Footwear, Wholesale Operations, Specialty Retail and Other.
Famous Footwear, which represents the Company’s largest division, operated 1,110 stores at the end of 2010, primarily selling branded footwear for the entire family.
Wholesale Operations source and market licensed, branded and private-label footwear primarily to national chains, mass merchandisers and department stores as well as Company-owned Famous Footwear and Specialty Retail divisions.
The Specialty Retail operations included 127 stores in the United States, 117 stores in Canada and 15 stores in China at the end of 2010, selling primarily Naturalizer brand footwear in regional malls and outlet centers as well as other e-commerce businesses.
The Other segment includes corporate assets and administrative expenses and other costs and recoveries that are not allocated to the operating units.
The Company’s reportable segments are operating units that market to different customers and are each managed separately as they distribute their products on a retail or wholesale basis. An operating segment’s performance is evaluated and resources are allocated based on operating earnings (loss). Operating earnings (loss) represent gross profit, less selling and administrative expenses, impairment of goodwill and intangible assets, restructuring and other special charges, net and equity in net loss of nonconsolidated affiliate. The accounting policies of the reportable segments are the same as those described in Note 1. Intersegment sales are generally recorded at a profit to the selling division. All intersegment earnings related to inventory on hand at the purchasing division are eliminated against the earnings of the selling segment.
67
|
BROWN SHOE COMPANY, INC.
|
2010 FORM 10-K
|
|
($ thousands)
|
Famous
Footwear
|
Wholesale
Operations
|
Specialty
Retail
|
Other
|
Total
|
||||||||||
|
Fiscal 2010
|
|||||||||||||||
|
External sales
|
$
|
1,486,538
|
$
|
754,389
|
$
|
263,164
|
$
|
-
|
$
|
2,504,091
|
|||||
|
Intersegment sales
|
1,939
|
192,157
|
-
|
-
|
194,096
|
||||||||||
|
Depreciation and amortization
|
26,017
|
9,410
|
3,852
|
13,238
|
52,517
|
||||||||||
|
Operating earnings (loss)
|
90,419
|
32,227
|
(5,970
|
)
|
(44,012
|
)
|
72,664
|
||||||||
|
Operating segment assets
|
473,098
|
401,700
|
56,941
|
216,304
|
1,148,043
|
||||||||||
|
Purchases of property and equipment
|
22,066
|
2,619
|
2,730
|
3,366
|
30,781
|
||||||||||
|
Capitalized software
|
253
|
-
|
-
|
23,793
|
24,046
|
||||||||||
|
Fiscal 2009
|
|||||||||||||||
|
External sales
|
$
|
1,363,617
|
$
|
631,785
|
$
|
246,566
|
$
|
-
|
$
|
2,241,968
|
|||||
|
Intersegment sales
|
2,186
|
193,114
|
-
|
-
|
195,300
|
||||||||||
|
Depreciation and amortization
|
29,405
|
9,908
|
4,476
|
9,506
|
53,295
|
||||||||||
|
Operating earnings (loss)
|
44,617
|
41,129
|
(14,246
|
)
|
(39,977
|
)
|
31,523
|
||||||||
|
Operating segment assets
|
453,927
|
292,052
|
62,154
|
232,017
|
1,040,150
|
||||||||||
|
Purchases of property and equipment
|
19,129
|
1,888
|
1,931
|
1,932
|
24,880
|
||||||||||
|
Capitalized software
|
1,127
|
48
|
-
|
23,923
|
25,098
|
||||||||||
|
Fiscal 2008
|
|||||||||||||||
|
External sales
|
$
|
1,319,978
|
$
|
703,841
|
$
|
252,543
|
$
|
-
|
$
|
2,276,362
|
|||||
|
Intersegment sales
|
2,252
|
167,164
|
-
|
-
|
169,416
|
||||||||||
|
Equity in net loss of nonconsolidated affiliate(1)
|
-
|
216
|
-
|
-
|
216
|
||||||||||
|
Depreciation and amortization
|
30,806
|
10,365
|
4,913
|
10,426
|
56,510
|
||||||||||
|
Operating earnings (loss)
|
26,955
|
(108,065
|
)
|
(30,530
|
)
|
(61,661
|
)
|
(173,301
|
)
|
||||||
|
Operating segment assets
|
448,472
|
340,318
|
71,115
|
166,126
|
1,026,031
|
||||||||||
|
Purchases of property and equipment
|
48,512
|
1,328
|
5,714
|
4,863
|
60,417
|
||||||||||
|
Capitalized software
|
3,133
|
82
|
39
|
13,073
|
16,327
|
||||||||||
|
(1) Related to the operating results of Edelman Shoe, which was accounted for under the equity method until the fourth quarter of 2008. See Note 2 to the consolidated financial statements for additional information related to Edelman Shoe.
|
|||||||||||||||
Following is a reconciliation of operating earnings (loss) to earnings (loss) before income taxes:
|
($ thousands)
|
2010
|
2009
|
2008
|
||||||
|
Operating earnings (loss)
|
$
|
72,664
|
$
|
31,523
|
$
|
(173,301
|
)
|
||
|
Interest expense
|
(19,647
|
)
|
(20,195
|
)
|
(17,105
|
)
|
|||
|
Interest income
|
203
|
374
|
1,800
|
||||||
|
Earnings (loss) before income taxes
|
$
|
53,220
|
$
|
11,702
|
$
|
(188,606
|
)
|
||
In 2010, the impact of restructuring and other special charges, net included in operating earnings was as follows:
|
·
|
Other – $6.1 million of charges related to the Company’s information technology initiatives and $1.1 million of charges related to the acquisition of ASG.
|
|
·
|
Wholesale Operations – $0.7 million of charges related to the Company’s information technology initiatives.
|
In 2009, the impact of restructuring and other special charges, net included in operating earnings was as follows:
|
·
|
Other – $8.9 million of charges related to the Company’s information technology initiatives and $4.6 million of charges related to the Company’s organizational changes, partially offset by $1.9 million of income related to the Company’s headquarters consolidation.
|
|
·
|
Wholesale Operations – $0.3 million of charges related to the Company’s information technology initiatives.
|
68
|
BROWN SHOE COMPANY, INC.
|
2010 FORM 10-K
|
In 2008, the impact of impairment of goodwill and intangible assets and restructuring and other special charges, net included in operating loss was as follows:
|
·
|
Wholesale Operations – $129.1 million of charges related to the Company’s impairment of goodwill and intangible assets and $14.4 million of charges related to the Company’s expense and capital containment initiatives.
|
|
·
|
Other – $29.8 million of charges related to the Company’s headquarters consolidation, $12.1 million of charges related to the Company’s expense and capital containment initiatives and $3.7 million of charges related to the Company’s information technology initiatives, partially offset by $10.1 million of income related to the environmental insurance recoveries, net of associated fees and costs.
|
|
·
|
Specialty Retail – $16.6 million of charges related to the Company’s impairment of goodwill and $0.6 million of charges related to the Company’s expense and capital containment initiatives.
|
|
·
|
Famous Footwear – $3.8 million of charges related to the Company’s expense and capital containment initiatives and $3.5 million of charges related to the Company’s impairment of goodwill.
|
For geographic purposes, the domestic operations include the wholesale distribution of licensed, branded and private-label footwear to a variety of retail customers and nationwide operation of the Company’s retail chains, including Famous Footwear and Specialty Retail, and e-commerce business.
The Company’s foreign operations primarily consist of wholesale distribution operations in the Far East and retail operations in Canada, China and Guam. The Far East operations include first-cost transactions, where footwear is sold at foreign ports to customers who then import the footwear into the United States and other countries.
A summary of the Company’s net sales and long-lived assets by geographic area were as follows:
|
($ thousands)
|
2010
|
2009
|
2008
|
||||||
|
Net Sales
|
|||||||||
|
United States
|
$
|
2,179,658
|
$
|
1,978,656
|
$
|
1,916,522
|
|||
|
Far East
|
217,346
|
190,750
|
283,122
|
||||||
|
Canada
|
107,087
|
72,562
|
76,718
|
||||||
|
$
|
2,504,091
|
$
|
2,241,968
|
$
|
2,276,362
|
||||
|
Long-Lived Assets
|
|||||||||
|
United States
|
$
|
331,092
|
$
|
321,494
|
$
|
333,134
|
|||
|
Far East
|
3,749
|
4,159
|
4,331
|
||||||
|
Canada
|
4,888
|
6,007
|
6,878
|
||||||
|
Latin America, Europe and other
|
33
|
241
|
245
|
||||||
|
$
|
339,762
|
$
|
331,901
|
$
|
344,588
|
||||
Long-lived assets consisted primarily of property and equipment, intangible assets, prepaid pension costs and other noncurrent assets.
|
9.
|
PROPERTY AND EQUIPMENT
|
Property and equipment consisted of the following:
|
($ thousands)
|
January 29, 2011
|
January 30, 2010
|
||||
|
Land and buildings
|
$
|
42,180
|
$
|
41,701
|
||
|
Leasehold improvements
|
167,377
|
172,335
|
||||
|
Technology equipment
|
46,004
|
45,180
|
||||
|
Machinery and equipment
|
52,799
|
52,725
|
||||
|
Furniture and fixtures
|
105,890
|
105,155
|
||||
|
Construction in progress
|
8,853
|
1,669
|
||||
|
423,103
|
418,765
|
|||||
|
Allowances for depreciation
|
(287,471
|
)
|
(277,204
|
)
|
||
|
$
|
135,632
|
$
|
141,561
|
|||
69
|
BROWN SHOE COMPANY, INC.
|
2010 FORM 10-K
|
Useful lives of property and equipment are as follows:
|
Buildings
|
15-30 years
|
|
Leasehold improvements
|
5-20 years
|
|
Technology equipment
|
3-10 years
|
|
Machinery and equipment
|
8-20 years
|
|
Furniture and fixtures
|
3-10 years
|
Selling and administrative expenses include charges for impairment, primarily for leasehold improvements and fixtures in the Company’s retail stores, of $2.8 million, $3.9 million and $2.7 million in 2010, 2009 and 2008, respectively. Fair value was based on estimated future cash flows to be generated by retail stores, discounted at a market rate of interest.
|
10.
|
GOODWILL AND INTANGIBLE ASSETS
|
As of January 29, 2011, the Company had intangible assets of $70.6 million (net of $48.7 million accumulated amortization), primarily related to trademarks. Intangible assets of $13.7 million are not subject to amortization. All remaining intangible assets are subject to amortization and have useful lives ranging from five to 15 years. Amortization expense related to intangible assets was $6.7 million, $6.8 million and $7.1 million in 2010, 2009 and 2008, respectively. The Company estimates the following amortization expense related to intangible assets: $6.6 million in 2011 and $6.4 million in 2012, 2013, 2014 and 2015. Future estimated amortization expense is exclusive of any impact from assets acquired from ASG on February 17, 2011, as discussed further in Note 2 to the consolidated financial statements.
As of January 30, 2010, the Company had intangible assets of $77.2 million (net of $43.1 million accumulated amortization). Intangible assets of $13.7 million, primarily related to trademarks, are not subject to amortization.
Intangible assets were attributable to the Company's operating segments as follows:
|
($ thousands)
|
January 29, 2011
|
January 30, 2010
|
||||
|
Famous Footwear
|
$
|
2,800
|
$
|
2,800
|
||
|
Wholesale Operations
|
67,592
|
74,226
|
||||
|
Specialty Retail
|
200
|
200
|
||||
|
$
|
70,592
|
$
|
77,226
|
|||
The decline in the intangible assets of the Company’s Wholesale Operations segment from January 30, 2010, to January 29, 2011 reflected amortization of its licensed and owned trademarks.
As a result of annual impairment testing, the Company did not record any impairment charges during 2010 or 2009 related to intangible assets.
2008 Impairment Charges
Goodwill Impairment
As a result of the difficult market conditions and industry trends, and the resulting decline in the market price of the Company’s common stock at the end of 2008, the Company performed an impairment test as of January 31, 2009 and determined that the fair values, estimated using discounted cash flow analyses and reconciled to its market capitalization, related to its recorded goodwill were less than their carrying values. For purposes of the goodwill impairment calculations, the Company assumed discount rates of 16.0% to 18.0% based on the reporting unit. As a result, the Company recorded a non-cash goodwill impairment charge of $140.9 million in 2008.
Intangible Asset Impairment
Due to declines experienced in the private label business, the Company performed an impairment test as of January 31, 2009, and determined that the Company’s private label customer relationships acquired as part of the Bennett Footwear Holdings, LLC (“Bennett”) acquisition during 2005 were impaired. The Company determined that the fair value of the intangible asset was lower than the carrying value by $8.3 million. The fair value was determined using a discounted cash flow analysis, and a discount rate of 14% was used in the calculation. As a result, the Company recorded a non-cash impairment charge of $8.3 million in 2008.
70
|
BROWN SHOE COMPANY, INC.
|
2010 FORM 10-K
|
In total, during 2008, the Company recorded non-cash impairment charges for goodwill and intangible assets of $149.2 million ($119.2 million on an after-tax basis, or $2.87 per diluted share). The Company’s Wholesale Operations, Specialty Retail and Famous Footwear segments incurred charges of $120.8 million, $16.6 million and $3.5 million, respectively, related to the impairment of goodwill and its Wholesale Operations segment incurred $8.3 million in impairment charges for intangible assets. For the Wholesale Operations segment, the goodwill impaired was primarily related to goodwill associated with the acquisition of Bennett. The goodwill impaired for the Company’s Specialty Retail and Famous Footwear segments were primarily related to goodwill associated with the acquisition of Shoes.com and goodwill associated with the acquisition of retail stores, respectively.
The non-cash goodwill and intangible assets impairment charges in 2008 did not have an adverse effect on the covenant calculations under the Company’s debt agreements or its overall compliance with the covenants of its debt agreements. The impairment of goodwill and intangible assets resulted in a reduction of goodwill and intangible assets, net on the consolidated balance sheet, and the impairment amount was disclosed separately as impairment of goodwill and intangible assets within the consolidated statements of earnings and consolidated statements of cash flows.
|
11.
|
LONG-TERM AND SHORT-TERM FINANCING ARRANGEMENTS
|
Credit Agreement
On January 7, 2011, the Company and certain of its subsidiaries (the “Loan Parties”) entered into a Third Amended and Restated Credit Agreement (the “Credit Agreement”). The Credit Agreement replaces the Second Amended and Restated Credit Agreement, dated as of January 21, 2009 (the “Former Credit Agreement”), which was scheduled to mature on January 21, 2014. The Credit Agreement matures on January 7, 2016. As of the end of 2010, the Credit Agreement provided for revolving credit in an aggregate amount of up to $380.0 million, subject to the calculated borrowing base restrictions, and may be increased at the Company’s option (a) by up to $150.0 million from time to time during the term of the Credit Agreement (the “general purpose accordion feature”) and (b) by an additional $150.0 million prior to February 28, 2011 (the “designated event accordion feature”), in both instances subject to the approval of lenders and satisfaction of certain conditions. Borrowing availability under the Credit Agreement is limited to the lesser of the total commitments and the borrowing base, which is based on stated percentages of the sum of eligible accounts receivable and inventory, as defined, less applicable reserves. Under the Credit Agreement, the Loan Parties’ obligations are secured by a first-priority security interest in all accounts receivable, inventory and certain other collateral.
Interest on borrowings is at variable rates based on the London Inter-Bank Offer Rate (“LIBOR”) or the prime rate, as defined in the Credit Agreement, plus a spread. The interest rate and fees for letters of credit varies based upon the level of excess availability under the Credit Agreement. There is an unused line fee payable on the unused portion under the facility and a letter of credit fee payable on the outstanding face amount under letters of credit.
The Credit Agreement limits the Company’s ability to incur additional indebtedness, create liens, make investments or specified payments, give guarantees, pay dividends, make capital expenditures and merge or acquire or sell assets. In addition, certain additional covenants would be triggered if excess availability were to fall below specified levels, including fixed charge coverage ratio requirements. Furthermore, if excess availability falls below the greater of (i) 15.0% of the lesser of (x) the borrowing base or (y) the total commitments and (ii) $35.0 million for three consecutive business days, or an event of default occurs, the lenders may assume dominion and control over the Company’s cash (a “cash dominion event”) until such event of default is cured or waived or the excess availability exceeds such amount for 30 consecutive days.
The Credit Agreement contains customary events of default, including, without limitation, payment defaults, breaches of representations and warranties, covenant defaults, cross-defaults to other material indebtedness, certain events of bankruptcy and insolvency, judgment defaults in excess of a certain threshold, the failure of any guaranty or security document supporting the agreement to be in full force and effect and a change of control event. In addition, if the excess availability falls below the greater of (i) 12.5% of the lesser of (x) the borrowing base or (y) the total commitments and (ii) $35.0 million, and the fixed charge coverage ratio is less than 1.0 to 1.0, the Company would be in default under the Credit Agreement. The Credit Agreement also contains certain other covenants and restrictions. The Company was in compliance with all covenants and restrictions under the Credit Agreement as of January 29, 2011.
The maximum amount of borrowings under either the Credit Agreement or Former Credit Agreement at the end of any month was $220.0 million in 2010 and $128.0 million in 2009. The average daily borrowings during the year were $91.9 million in 2010 and $77.6 million in 2009. The weighted-average interest rates approximated 3.2% in 2010 and 3.5% in 2009.
At January 29, 2011, the Company had $198.0 million in borrowings outstanding and $10.4 million in letters of credit outstanding under the Credit Agreement. Total additional borrowing availability was $171.6 million at January 29, 2011.
71
|
BROWN SHOE COMPANY, INC.
|
2010 FORM 10-K
|
Effective February 17, 2011, the Loan Parties exercised the $150.0 million designated event accordion feature to fund the acquisition of ASG, increasing the aggregate amount available under the Credit Agreement from $380.0 million to $530.0 million. The Credit Agreement still provides for access to an additional $150.0 million of optional availability pursuant to the general purpose accordion feature, subject to satisfaction of certain conditions and approval of the lenders. See Note 2 to the consolidated financial statements for further information.
Senior Notes
In April 2005, the Company issued $150.0 million of 8.75% senior notes due in 2012 (“Senior Notes”). The Senior Notes are guaranteed on a senior unsecured basis by each of the subsidiaries of Brown Shoe Company, Inc. that is an obligor under the Credit Agreement. Interest on the Senior Notes is payable on May 1 and November 1 of each year. The Senior Notes mature on May 1, 2012, but became callable on May 1, 2009. The Company may redeem all or a part of the Senior Notes at the redemption prices (expressed as a percentage of principal amount) set forth below plus accrued and unpaid interest, if redeemed during the 12-month period beginning on May 1 of the years indicated below:
|
Year
|
Percentage
|
|
2010
|
102.188%
|
|
2011 and thereafter
|
100.000%
|
The Senior Notes also contain certain other covenants and restrictions that limit certain activities including, among other things, levels of indebtedness, payments of dividends, the guarantee or pledge of assets, certain investments, common stock repurchases, mergers and acquisitions and sales of assets. As of January 29, 2011, the Company was in compliance with all covenants relating to the Senior Notes.
Cash payments of interest for these financing arrangements during 2010, 2009 and 2008 were $18.0 million, $17.7 million and $15.0 million, respectively.
The Company anticipates refinancing its Senior Notes during 2011. The Company believes it will be able to refinance its Senior Notes on favorable terms but can give no assurance that it will be able to do so.
|
12.
|
LEASES
|
The Company leases all of its retail locations and certain office locations, distribution centers and equipment. The minimum lease terms for the Company’s retail stores generally range from five to 10 years. The term of the leases for the office facilities and distribution centers averages approximately 15 years. Approximately one-half of the retail store leases are subject to renewal options for varying periods. The office and distribution centers have renewal options of 15 to 20 years. In addition to minimum rental payments, certain of the retail store leases require contingent payments based on sales levels. A majority of the Company’s retail operating leases contain provisions that allow it to modify amounts payable under the lease or terminate the lease in certain circumstances, such as experiencing actual sales volume below a defined threshold and/or co-tenancy provisions associated with the facility.
Rent expense for operating leases was:
|
($ thousands)
|
2010
|
2009
|
2008
|
||||||
|
Minimum rents
|
$
|
158,387
|
$
|
161,767
|
$
|
153,273
|
|||
|
Contingent rents
|
314
|
298
|
446
|
||||||
|
Total
|
$
|
158,701
|
$
|
162,065
|
$
|
153,719
|
|||
Future minimum payments under noncancelable operating leases with an initial term of one year or more were as follows at January 29, 2011:
|
($ thousands)
|
|||
|
2011
|
$
|
154,562
|
|
|
2012
|
128,335
|
||
|
2013
|
102,770
|
||
|
2014
|
82,145
|
||
|
2015
|
63,827
|
||
|
Thereafter
|
124,102
|
||
|
Total minimum operating lease payments
|
$
|
655,741
|
72
|
BROWN SHOE COMPANY, INC.
|
2010 FORM 10-K
|
|
13.
|
RISK MANAGEMENT AND DERIVATIVES
|
General Risk Management
The Company maintains cash and cash equivalents and certain other financial instruments with various financial institutions. The financial institutions are located throughout the world, and the Company’s policy is designed to limit exposure to any one institution or geographic region. The Company’s periodic evaluations of the relative credit standing of these financial institutions are considered in the Company’s investment strategy.
The Company’s Wholesale Operations segment sells to national chains, mass merchandisers and department stores primarily in the United States, Canada and China. Receivables arising from these sales are not collateralized; however, a portion is covered by documentary letters of credit. Credit risk is affected by conditions or occurrences within the economy and the retail industry. The Company maintains an allowance for doubtful accounts based upon factors surrounding the credit risk of specific customers and historical trends.
Derivatives
In the normal course of business, the Company’s financial results are impacted by currency rate movements in foreign-currency-denominated assets, liabilities and cash flows as it makes a portion of its purchases and sales in local currencies. The Company has established policies and business practices that are intended to mitigate a portion of the effect of these exposures. The Company uses derivative financial instruments, primarily forward contracts, to manage its currency exposures. These derivative financial instruments are viewed as risk management tools and are not used for trading or speculative purposes. Derivatives entered into by the Company are designated as cash flow hedges of forecasted foreign currency transactions.
Derivative financial instruments expose the Company to credit and market risk. The market risk associated with these instruments resulting from currency exchange movements is expected to offset the market risk of the underlying transactions being hedged. The Company does not believe there is a significant risk of loss in the event of non-performance by the counterparties associated with these instruments because these transactions are executed with major international financial institutions and have varying maturities through January 2012. Credit risk is managed through the continuous monitoring of exposures to such counterparties.
The Company principally uses foreign currency forward contracts as cash flow hedges to offset a portion of the effects of exchange rate fluctuations. The Company’s cash flow exposures include anticipated foreign currency transactions, such as foreign currency denominated sales, costs, expenses, intercompany charges, as well as collections and payments. The Company performs a quarterly assessment of the effectiveness of the hedge relationship and measures and recognizes any hedge ineffectiveness in the consolidated statement of earnings. Hedge ineffectiveness is evaluated using the hypothetical derivative method, and the ineffective portion of the hedge is reported in the Company’s consolidated statement of earnings. The amount of hedge ineffectiveness for 2010, 2009 and 2008 was not material.
The Company’s hedging strategy uses forward contracts as cash flow hedging instruments, which are recorded in the Company’s consolidated balance sheets at fair value. The effective portion of gains and losses resulting from changes in the fair value of these hedge instruments are deferred in accumulated other comprehensive income (loss) and reclassified to earnings in the period that the hedged transaction is recognized in earnings.
As of January 29, 2011, the Company had forward contracts maturing at various dates through January 2012. The contract amount represents the net amount of all purchase and sale contracts of a foreign currency.
|
Contract Amount
|
||||||
|
(U.S. $ equivalent in thousands)
|
January 29, 2011
|
January 30, 2010
|
||||
|
Deliverable Financial Instruments
|
||||||
|
U.S. dollars (purchased by the Company’s Canadian division with Canadian dollars)
|
$
|
19,200
|
$
|
14,900
|
||
|
Euro
|
5,977
|
5,500
|
||||
|
Other currencies
|
229
|
–
|
||||
|
Non-deliverable Financial Instruments
|
||||||
|
Chinese yuan
|
13,199
|
12,000
|
||||
|
Japanese yen
|
1,344
|
1,600
|
||||
|
New Taiwanese dollars
|
1,263
|
1,200
|
||||
|
Other currencies
|
795
|
700
|
||||
|
$
|
42,007
|
$
|
35,900
|
|||
73
|
BROWN SHOE COMPANY, INC.
|
2010 FORM 10-K
|
|
($ in thousands)
|
Asset Derivatives
|
Liability Derivatives
|
||||||||
|
Balance Sheet Location
|
Fair Value
|
Balance Sheet Location
|
Fair Value
|
|||||||
|
Foreign exchange forwards contracts:
|
||||||||||
|
January 29, 2011
|
Prepaid expenses and other current assets
|
$
|
223
|
Other accrued expenses
|
$
|
567
|
||||
|
January 30, 2010
|
Prepaid expenses and other current assets
|
$
|
88
|
Other accrued expenses
|
$
|
689
|
||||
During 2010 and 2009, the effect of derivative instruments in cash flow hedging relationships on the consolidated statement of earnings was as follows:
|
($ in thousands)
|
Fiscal Year Ended 2010
|
Fiscal Year Ended 2009
|
||||||||||
|
Foreign exchange forward contracts:
Income Statement Classification
Gains (Losses) - Realized
|
Gain (Loss)
Recognized in
OCI on
Derivatives
|
Loss Reclassified
from
Accumulated
OCI into
Earnings
|
Loss
Recognized
in OCI on
Derivatives
|
Loss Reclassified
from Accumulated
OCI into Earnings
|
||||||||
|
Net sales
|
$
|
(242
|
)
|
$
|
(232
|
)
|
$
|
(113
|
)
|
$
|
(100
|
)
|
|
Cost of goods sold
|
442
|
(34
|
)
|
(1,330
|
)
|
(118
|
)
|
|||||
|
Selling and administrative expenses
|
41
|
(91
|
)
|
(175
|
)
|
(23
|
)
|
|||||
|
Interest expense
|
(7
|
)
|
–
|
(9
|
)
|
(2
|
)
|
|||||
All of the gains and losses currently included within accumulated other comprehensive income (loss) associated with the Company’s foreign exchange forward contracts are expected to be reclassified into net earnings within the next 12 months. Additional information related to the Company’s derivative financial instruments are disclosed within Note 1 and Note 14 to the consolidated financial statements.
|
14.
|
FAIR VALUE MEASUREMENTS
|
Fair Value Hierarchy
FASB guidance on fair value measurements and disclosures specifies a hierarchy of valuation techniques based upon whether the inputs to those valuation techniques reflect assumptions other market participants would use based upon market data obtained from independent sources (“observable inputs”) or reflect the Company’s own assumptions of market participant valuation (“unobservable inputs”). In accordance with the fair value guidance, the hierarchy is broken down into three levels based on the reliability of the inputs as follows:
|
·
|
Level 1 – Quoted prices in active markets that are unadjusted and accessible at the measurement date for identical, unrestricted assets or liabilities;
|
|
·
|
Level 2 – Quoted prices for identical assets and liabilities in markets that are not active, quoted prices for similar assets and liabilities in active markets or financial instruments for which significant inputs are observable, either directly or indirectly; and
|
|
·
|
Level 3 – Prices or valuations that require inputs that are both significant to the fair value measurement and unobservable.
|
74
|
BROWN SHOE COMPANY, INC.
|
2010 FORM 10-K
|
In determining fair value, the Company utilizes valuation techniques that maximize the use of observable inputs and minimize the use of unobservable inputs to the extent possible as well as considers counterparty credit risk in its assessment of fair value. Classification of the financial or non-financial asset or liability within the hierarchy is determined based on the lowest level input that is significant to the fair value measurement.
Measurement of Fair Value
The Company measures fair value as an exit price, the price to sell an asset or transfer a liability in an orderly transaction between market participants at the measurement date, using the procedures described below for all financial and non-financial assets and liabilities measured at fair value.
Money Market Funds
The Company has cash equivalents consisting of short-term money market funds backed by U.S. Treasury securities. The primary objective of these investing activities is to preserve its capital for the purpose of funding operations and it does not enter into money market funds for trading or speculative purposes. The fair value is based on unadjusted quoted market prices for the funds in active markets with sufficient volume and frequency (Level 1).
Deferred Compensation Plan Assets
The Company maintains a Deferred Compensation Plan for the benefit of certain management employees. The investment funds offered to the participant generally correspond to the funds offered in the Company’s 401(k) plan, and the account balance fluctuates with the investment returns on those funds. The fair value of the assets and corresponding liabilities are based on unadjusted quoted market prices for the funds in active markets with sufficient volume and frequency (Level 1). Additional information related to the Company’s Deferred Compensation Plan is disclosed in Note 6 to the consolidated financial statements.
Deferred Compensation Plan for Non-Employee Directors
Non-employee directors are eligible to participate in a deferred compensation plan, whereby deferred compensation amounts are valued as if invested in the Company’s common stock through the use of PSUs. Under the plan, each participating director’s account is credited with the number of PSUs equal to the number of shares of the Company’s common stock that the participant could purchase or receive with the amount of the deferred compensation, based upon the fair value (as determined based on the average of the high and low prices) of the Company’s common stock on the last trading day of the fiscal quarter when the cash compensation was earned. Dividend equivalents are paid on PSUs at the same rate as dividends on the Company’s common stock and are re-invested in additional PSUs at the next fiscal quarter-end. The PSUs are payable in cash based on the number of PSUs credited to the participating director’s account, valued on the basis of the fair value at fiscal quarter-end on or following termination of the director’s service. The fair value of the liabilities is based on an unadjusted quoted market price for the Company’s common stock in an active market with sufficient volume and frequency (Level 1). Additional information related to the Company’s Deferred Compensation Plan for Non-Employee Directors is disclosed in Note 6 to the consolidated financial statements.
Derivative Financial Instruments
The Company uses derivative financial instruments, primarily foreign exchange contracts, to reduce its exposure to market risks from changes in foreign exchange rates. These foreign exchange contracts are measured at fair value using quoted forward foreign exchange prices from counterparties corroborated by market-based pricing (Level 2). Additional information related to the Company’s derivative financial instruments is disclosed in Note 1 and Note 13 to the consolidated financial statements.
75
|
BROWN SHOE COMPANY, INC.
|
2010 FORM 10-K
|
The following table presents the Company’s assets and liabilities that are measured at fair value on a recurring basis at January 29, 2011, and January 30, 2010. The Company did not have any transfers between Level 1 and Level 2 during 2010 or 2009:
|
Fair Value Measurements
|
||||||||||||
|
($ thousands)
|
Total
|
Level 1
|
Level 2
|
Level 3
|
||||||||
|
Asset (Liability)
|
||||||||||||
|
As of January 29, 2011:
|
||||||||||||
|
Cash equivalents – money market funds
|
$
|
50,000
|
$
|
50,000
|
$
|
–
|
$
|
–
|
||||
|
Non-qualified deferred compensation plan assets
|
1,447
|
1,447
|
–
|
–
|
||||||||
|
Non-qualified deferred compensation plan Liabilities
|
(1,447
|
)
|
(1,447
|
)
|
–
|
–
|
||||||
|
Deferred compensation plan liabilities for non-employee directors
|
(792
|
)
|
(792
|
)
|
–
|
–
|
||||||
|
Derivative financial instruments, net
|
(344
|
)
|
–
|
(344
|
)
|
–
|
||||||
|
As of January 30, 2010:
Cash equivalents – money market funds
|
$
|
25,000
|
$
|
25,000
|
$
|
–
|
$
|
–
|
||||
|
Non-qualified deferred compensation plan assets
|
1,033
|
1,033
|
–
|
–
|
||||||||
|
Non-qualified deferred compensation plan liabilities
|
(1,033
|
)
|
(1,033
|
)
|
–
|
–
|
||||||
|
Deferred compensation plan liabilities for non- employee directors
|
(747
|
)
|
(747
|
)
|
–
|
–
|
||||||
|
Derivative financial instruments, net
|
(601
|
)
|
–
|
(601
|
)
|
–
|
||||||
Store Impairment Charges
The Company assesses the impairment of long-lived assets whenever events or changes in circumstances indicate that the carrying value may not be recoverable. Factors the Company considers important that could trigger an impairment review include underperformance relative to expected historical or projected future operating results, a significant change in the manner of the use of the asset or a negative industry or economic trend. When the Company determines that the carrying value of long-lived assets may not be recoverable based upon the existence of one or more of the aforementioned factors, impairment is measured based on a projected discounted cash flow method. Certain factors, such as estimated store sales and expenses, used for this nonrecurring fair value measurement are considered Level 3 inputs. Long-lived store assets held and used with a carrying amount of $52.4 million were assessed for impairment and written down to their fair value, resulting in an impairment charge of $2.8 million, which was recorded within selling and administrative expenses in 2010. Of the $2.8 million impairment charge, $1.9 million related to the Famous Footwear segment and $0.9 million related to the Specialty Retail segment.
Fair Value of the Company’s Other Financial Instruments
The fair values of cash and cash equivalents (excluding money market funds discussed above), receivables and trade accounts payable approximate their carrying values due to the short-term nature of these instruments.
The carrying amounts and fair values of the Company’s other financial instruments subject to fair value disclosures are as follows:
|
January 29, 2011
|
January 30, 2010
|
|||||||||||||||
|
($ thousands)
|
Carrying Amount
|
Fair Value
|
Carrying
Amount
|
Fair
Value
|
||||||||||||
|
Borrowings under Revolving Credit Agreement
|
$
|
198,000
|
$
|
198,000
|
$
|
94,500
|
$
|
94,500
|
||||||||
|
Senior Notes
|
150,000
|
152,157
|
150,000
|
152,250
|
||||||||||||
The fair value of borrowings under the Revolving Credit Agreement approximated their carrying value due to the short-term nature, and the fair value of the Company’s Senior Notes was based upon quoted prices as of the end of the respective periods.
76
|
BROWN SHOE COMPANY, INC.
|
2010 FORM 10-K
|
|
15.
|
COMMON STOCK REPURCHASES
|
Stock Repurchase Program
In January 2008, the Board of Directors approved a stock repurchase program (“2008 Program”) authorizing the repurchase of up to 2.5 million shares of the Company’s outstanding common stock. The Company can utilize the repurchase program to repurchase shares on the open market or in private transactions from time to time, depending on market conditions. The repurchase program does not have an expiration date. There have been no shares repurchased under the 2008 Program.
Repurchases Related to Employee Share-based Awards
During 2010 and 2009, 70,995 shares and 25,227 shares, respectively, were tendered by employees related to certain share-based awards. These shares were tendered in satisfaction of the exercise price of stock options and/or to satisfy minimum tax withholding amounts for non-qualified stock options, restricted stock and stock performance awards. Accordingly, these share repurchases are not considered a part of the Company’s publicly announced stock repurchase programs.
|
16.
|
SHARE-BASED PLANS
|
The Company has share-based incentive compensation plans under which certain officers, employees and members of the Board of Directors are participants and may be granted stock option, restricted stock and stock performance awards.
FASB ASC 718, Compensation – Stock Compensation, and FASB ASC 505, Equity, require companies to recognize compensation expense in an amount equal to the fair value of all share-based payments granted to employees over the requisite service period for each award. In certain limited circumstances, the Company’s incentive compensation plan provides for accelerated vesting of the awards, such as in the event of a change in control, qualified retirement, death or disability. The Company has a policy of issuing treasury shares in satisfaction of share-based awards.
Share-based compensation expense of $6.1 million, $4.7 million and $2.6 million was recognized in 2010, 2009 and 2008, respectively, as a component of selling and administrative expenses. The following table details the share-based compensation expense by plan and the total related income tax benefit for 2010, 2009 and 2008:
|
($ thousands)
|
2010
|
2009
|
2008
|
||||
|
Expense for share-based compensation plans:
|
|||||||
|
Stock options
|
$
|
824
|
$
|
947
|
$
|
2,663
|
|
|
Stock performance awards
|
1,243
|
623
|
(3,157
|
)
|
|||
|
Restricted stock grants
|
4,077
|
3,103
|
3,095
|
||||
|
Total share-based compensation expense
|
6,144
|
4,673
|
2,601
|
||||
|
Income tax benefit
|
2,082
|
1,479
|
225
|
||||
|
Total share-based compensation expense, net of income tax benefit
|
$
|
4,062
|
$
|
3,194
|
$
|
2,376
|
|
The Company issued 546,300, 568,681 and 490,568 shares of common stock in 2010, 2009 and 2008, respectively, for restricted stock grants, stock options exercised and stock performance awards issued to employees and common and restricted stock grants issued to directors. Other than the amendment to the structured payout for the Company’s 2008 stock performance awards discussed in the Stock Performance Awards section to follow, there were no significant modifications to any share-based awards in 2010, 2009 or 2008.
Stock Options
Stock options are granted to employees at exercise prices equal to the quoted market price of the Company’s stock at the date of grant. Stock options generally vest over four years and have a term of 10 years. Compensation cost for all stock options is recognized over the requisite service period for each award. No dividends are paid on unexercised options. Expense for stock options is recognized on a straight-line basis separately for each vesting portion of the stock option award.
The Company granted 143,000, 212,400 and 103,500 stock options during 2010, 2009 and 2008, respectively. Fair values of options granted in 2010, 2009 and 2008 were estimated using the Black-Scholes option-pricing model based on the following assumptions:
|
2010
|
2009
|
2008
|
|||||||
|
Dividend yield
|
2.0%
|
7.1%
|
2.2%
|
||||||
|
Expected volatility
|
59.8%
|
55.3%
|
39.7%
|
||||||
|
Risk-free interest rate
|
2.9%
|
2.9%
|
3.0%
|
||||||
|
Expected term (in years)
|
7
|
8
|
7
|
||||||
77
|
BROWN SHOE COMPANY, INC.
|
2010 FORM 10-K
|
Dividend yields are based on historical dividend yields. Expected volatilities are based on historical volatilities of the Company’s common stock. The risk-free interest rate is based on the U.S. Treasury yield curve in effect at the time of grant for periods corresponding with the expected term of the options. The expected term of options represents the weighted-average period of time that options granted are expected to be outstanding, giving consideration to vesting schedules and the Company’s historical exercise patterns.
Summarized information about stock options outstanding and exercisable at January 29, 2011 is as follows:
|
Outstanding
|
Exercisable
|
|||||||||||||
|
Exercise Price Range
|
Number
of
Options
|
Weighted-
Average
Remaining
Life (Years)
|
Weighted-
Average
Exercise
Price
|
Number
of
Options
|
Weighted-
Average
Exercise
Price
|
|||||||||
|
$3.33 – $9.99
|
348,818
|
5
|
$
|
5.90
|
191,393
|
$
|
7.70
|
|||||||
|
$10.00 – $14.99
|
668,264
|
5
|
13.79
|
518,264
|
13.86
|
|||||||||
|
$15.00 – $19.99
|
487,628
|
4
|
16.81
|
444,503
|
16.92
|
|||||||||
|
$20.00 – $24.99
|
202,936
|
5
|
21.57
|
199,311
|
21.59
|
|||||||||
|
$25.00 – $29.99
|
–
|
–
|
–
|
–
|
–
|
|||||||||
|
$30.00 – $35.25
|
127,496
|
6
|
34.97
|
99,930
|
34.90
|
|||||||||
|
1,835,142
|
5
|
$
|
15.42
|
1,453,401
|
$
|
16.49
|
||||||||
The weighted-average remaining contractual term of stock options outstanding and currently exercisable at January 29, 2011, was 4.7 years and 3.8 years, respectively. The aggregate intrinsic value of stock options outstanding and currently exercisable at January 29, 2011, was $2.6 million and $1.2 million, respectively. Intrinsic value for stock options is calculated based on the exercise price of the underlying awards as compared to the quoted price of the Company’s common stock as of the reporting date.
The following table summarizes stock option activity for 2010 under the current and prior plans:
|
Number of Options
|
Weighted-Average
Exercise Price
|
|||||
|
Outstanding at January 30, 2010
|
1,967,316
|
$
|
14.93
|
|||
|
Granted
|
143,000
|
13.78
|
||||
|
Exercised
|
(144,944
|
)
|
7.11
|
|||
|
Forfeited
|
(108,479
|
)
|
16.59
|
|||
|
Canceled or expired
|
(21,751
|
)
|
9.39
|
|||
|
Outstanding at January 29, 2011
|
1,835,142
|
$
|
15.42
|
|||
|
Exercisable at January 29, 2011
|
1,453,401
|
$
|
16.49
|
|||
The intrinsic value of stock options exercised was $1.1 million, $0.3 million and $0.1 million for 2010, 2009 and 2008 respectively. The amount of cash received from the exercise of stock options was $0.9 million, $0.1 million and $0.3 million for 2010, 2009 and 2008, respectively. In addition, 7,124, 7,956 and 4,960 shares were tendered by employees in satisfaction of the exercise price of stock options during 2010, 2009 and 2008, respectively. The tax impact associated with stock options exercised was $0.2 million for 2010, immaterial for 2009 and $0.4 million for 2008, which was reflected as an increase to additional paid-in capital.
The following table summarizes nonvested stock option activity for 2010 under the current and prior plans:
|
Number of
Nonvested
Options
|
Weighted-Average
Grant Date
Fair Value
|
|||||
|
Nonvested at January 30, 2010
|
409,781
|
$
|
5.70
|
|||
|
Granted
|
143,000
|
7.48
|
||||
|
Vested
|
(149,289
|
)
|
8.51
|
|||
|
Forfeited
|
(21,751
|
)
|
3.83
|
|||
|
Nonvested at January 29, 2011
|
381,741
|
$
|
5.37
|
|||
The weighted-average grant date fair value of stock options granted for 2010, 2009 and 2008 was $7.48, $1.57 and $5.30, respectively. The total grant date fair value of stock options vested during 2010, 2009 and 2008 was $1.3 million, $2.2 million and $3.5 million, respectively. As of January 29, 2011, the total remaining unrecognized compensation cost related to nonvested stock options amounted to $0.7 million, which will be amortized over the weighted-average remaining requisite service period of 2.2 years.
78
|
BROWN SHOE COMPANY, INC.
|
2010 FORM 10-K
|
Restricted Stock
Under the Company’s incentive compensation plans, restricted stock of the Company may be granted at no cost to certain officers, key employees and directors. Plan participants are entitled to cash dividends and voting rights for their respective shares. Restrictions limit the sale or transfer of these shares during the requisite service period, which generally ranges from one to eight years. Expense for restricted stock grants is recognized on a straight-line basis separately for each vesting portion of the stock award based upon fair value of the award on the date of grant. The fair value of the restricted stock grants is the quoted market price for the Company’s common stock on the date of grant.
The following table summarizes restricted stock activity for the year ended January 29, 2011:
|
Number of
Nonvested
Restricted Shares
|
Weighted-Average
Grant Date
Fair Value
|
||||||||
|
Nonvested at January 30, 2010
|
1,255,421
|
$
|
11.64
|
||||||
|
Granted
|
565,864
|
13.97
|
|||||||
|
Vested
|
(218,322
|
)
|
20.33
|
||||||
|
Forfeited
|
(100,719
|
)
|
8.03
|
||||||
|
Nonvested at January 29, 2011
|
1,502,244
|
$
|
11.50
|
||||||
For the years ended January 29, 2011, January 30, 2010 and January 31, 2009, restricted shares granted were 565,864, 601,175 and 362,500, respectively. Restricted shares forfeited during 2010, 2009 and 2008 were 100,719, 60,442 and 50,689, respectively. The weighted-average fair value of restricted stock awards granted for the years ended January 29, 2011, January 30, 2010, and January 31, 2009, was $13.97, $3.40 and $15.07, respectively. The total grant date fair value of restricted stock awards vested during the years ended January 29, 2011, January 30, 2010, and January 31, 2009, was $4.4 million, $0.7 million and $0.4 million, respectively. As of January 29, 2011, the total remaining unrecognized compensation cost related to nonvested restricted stock grants amounted to $8.3 million, which will be amortized over the weighted-average remaining requisite service period of 2.7 years.
The Company recognized ($0.3) million, ($0.1) million and $0.1 million in 2010, 2009 and 2008, respectively, of excess tax (deficiencies) benefits related to restricted stock vesting and dividends, which was reflected as a (decrease) increase to additional paid-in capital.
Equity-based grants may be made to non-employee directors in the form of cash-equivalent restricted stock units (“RSUs”) at no cost to the non-employee director. The RSUs are subject to a vesting requirement (usually one-year), earn dividend equivalent units, and are payable in cash on the date the director terminates service or such earlier date as a director may elect, subject to restrictions, based on the then-current fair value of the Company’s common stock. Dividend equivalents are paid on outstanding RSUs at the same rate as dividends on the Company’s common stock, are automatically re-invested in additional RSUs and vest immediately as of the payment date for the dividend. Expense related to the initial grant of RSUs is recognized ratably over the vesting period based upon the fair value of the RSUs, as remeasured at the end of each period. Expense for the dividend equivalents is recognized at fair value immediately. Gains and losses resulting from changes in the fair value of the RSUs subsequent to the vesting period and through the settlement date are reported in the Company’s consolidated statements of earnings.
79
|
BROWN SHOE COMPANY, INC.
|
2010 FORM 10-K
|
The following table summarizes restricted stock unit activity for the year ended January 29, 2011:
|
Outstanding
|
Accrued(1)
|
Nonvested RSUs
|
||||||||||||
|
Number of
Vested
RSUs
|
Number of
Nonvested
RSUs
|
Total
Number
of RSUs
|
Total
Number
of RSUs
|
Weighted-Average
Grant Date
Fair Value
|
||||||||||
|
January 30, 2010
|
101,606
|
40,000
|
141,606
|
128,273
|
$
|
7.75
|
||||||||
|
Granted (2)
|
2,711
|
62,140
|
64,851
|
44,518
|
16.58
|
|||||||||
|
Vested
|
41,140
|
(41,140
|
)
|
–
|
13,333
|
7.91
|
||||||||
|
Settled
|
–
|
–
|
–
|
–
|
–
|
|||||||||
|
January 29, 2011
|
145,457
|
61,000
|
206,457
|
186,124
|
$
|
16.63
|
||||||||
|
(1)
|
Accrued RSUs include all fully vested awards and a pro-rata portion of nonvested awards based on the elapsed portion of the vesting period.
|
|||||||||||||
|
(2)
|
Granted RSUs include 3,851 RSUs resulting from dividend equivalents paid on outstanding RSUs, of which 2,711 related to outstanding vested RSUs and 1,140 related to outstanding nonvested RSUs.
|
|||||||||||||
Information about RSUs granted, vested and settled during 2010, 2009 and 2008 is as follows:
|
($ thousands, except per unit amounts)
|
2010
|
2009
|
2008
|
|||||||||||||
|
Weighted-average grant date fair value of RSUs granted(1)
|
$
|
16.46
|
$
|
7.70
|
$
|
15.13
|
||||||||||
|
Fair value of RSUs vested
|
$
|
534
|
$
|
278
|
$
|
78
|
||||||||||
|
RSUs settled
|
$
|
–
|
$
|
–
|
$
|
–
|
||||||||||
|
(1)
|
Includes dividend equivalents granted on outstanding RSUs, which vest immediately.
|
|||||||||||||||
The following table details the RSU compensation expense (income) and the total related income tax (benefit) provision for 2010, 2009 and 2008:
|
($ thousands)
|
2010
|
2009
|
2008
|
|||||||||||||
|
Compensation expense (income)
|
$
|
798
|
$
|
1,145
|
$
|
(828
|
)
|
|||||||||
|
Income tax (benefit) provision
|
(310
|
)
|
(445
|
)
|
322
|
|||||||||||
|
Compensation expense (income), net of income tax (benefit) provision
|
$
|
488
|
$
|
700
|
$
|
(506
|
)
|
|||||||||
The aggregate intrinsic value of RSUs outstanding and currently vested at January 29, 2011, is $2.7 million and $1.9 million, respectively. Aggregate intrinsic value for RSUs is calculated based on the average of the high and low prices of the Company’s common stock as of the reporting date. As of January 29, 2011, and January 30, 2010, the liabilities associated with the accrued RSUs totaled $2.4 million and $1.6 million, respectively.
Stock Performance Awards
Under the Company’s incentive compensation plans, common stock may be awarded at the end of the performance period at no cost to certain officers and key employees if certain financial goals are met. Under the plan, employees are granted stock performance awards at a target number of shares, which cliff-vest generally over a three-year service period. At the end of the three-year period, the employee will be given an amount of shares between 0% and 150% of the targeted award, depending on the achievement of specified financial goals for the three-year period. A portion of the award may be paid in cash and, accordingly, would be reflected as a liability.
Expense for stock performance awards is recognized based upon the fair value of the awards on the date of grant and the anticipated number of shares to be awarded on a straight-line basis over the three-year service period. The fair value of the stock performance awards is the quoted market price for the Company’s common stock on the date of grant. The Company had nonvested outstanding stock performance awards for 520,375 shares at a target level as of January 29, 2011, which may result in the issuance of up to 780,563 shares at the end of the service periods.
80
|
BROWN SHOE COMPANY, INC.
|
2010 FORM 10-K
|
The following table summarizes stock performance activity for the year ended January 29, 2011:
|
Number of
Nonvested Stock
Performance Awards at
Target Level
|
Number of
Nonvested Stock
Performance Awards
at Maximum Level
|
Weighted-
Average
Grant Date
Fair Value
|
|||||||
|
Nonvested at January 30, 2010
|
406,000
|
609,000
|
$
|
3.07
|
|||||
|
Granted
|
168,375
|
252,563
|
13.99
|
||||||
|
Vested
|
–
|
–
|
–
|
||||||
|
Expired
|
–
|
–
|
–
|
||||||
|
Forfeited
|
(54,000
|
)
|
(81,000
|
)
|
3.07
|
||||
|
Nonvested at January 29, 2011
|
520,375
|
780,563
|
$
|
6.60
|
|||||
The weighted-average grant-date fair value of stock performance awards granted for 2010, 2009 and 2008 was $13.99, $3.07 and $15.43, respectively. In 2010, 2009 and 2008, no stock performance awards vested. As of January 29, 2011, the total remaining unrecognized compensation cost related to nonvested stock performance awards was $2.1 million based on the anticipated number of shares to be awarded. During 2008, the Company reversed $3.2 million of previously recognized expense for stock performance awards as the probability of meeting the minimum financial goals was no longer considered likely.
|
17.
|
RELATED PARTY TRANSACTIONS
|
Hongguo International Holdings
The Company entered into a joint venture agreement with a subsidiary of Hongguo International Holdings Limited (“Hongguo”) to market Naturalizer footwear in China in 2007. The Company is a 51% owner of the joint venture (“B&H Footwear”), with Hongguo owning the other 49%. B&H Footwear began operations in 2007 and distributes the Naturalizer brand in department store shops and free-standing stores in several of China’s largest cities. In addition, B&H Footwear sells Naturalizer footwear to Hongguo on a wholesale basis. Hongguo then sells Naturalizer products through retail stores in China. During 2010, 2009 and 2008, the Company, through its consolidated subsidiary, B&H Footwear, sold $3.9 million, $2.2 million and $4.5 million, respectively, of Naturalizer footwear on a wholesale basis to Hongguo.
|
18.
|
COMMITMENTS AND CONTINGENCIES
|
Environmental Remediation
Prior operations included numerous manufacturing and other facilities for which the Company may have responsibility under various environmental laws for the remediation of conditions that may be identified in the future. The Company is involved in environmental remediation and ongoing compliance activities at several sites and has been notified that it is or may be a potentially responsible party at several other sites.
Redfield
The Company is remediating, under the oversight of Colorado authorities, the groundwater and indoor air at its owned facility in Colorado (the “Redfield site” or, when referring to remediation activities at or under the facility, the “on-site remediation”) and residential neighborhoods adjacent to and near the property (the “off-site remediation”) that have been affected by solvents previously used at the facility. The on-site remediation calls for the operation of a pump and treat system (which prevents migration of contaminated groundwater off the property) as the final remedy for the site, subject to monitoring and periodic review of the on-site conditions and other remedial technologies that may be developed in the future. Off-site groundwater concentrations have been reducing over time since installation of the pump and treat system in 2000 and injection of clean water beginning in 2003. However, localized areas of contaminated bedrock just beyond the property line continue to impact off-site groundwater. The modified workplan for addressing this condition includes converting the off-site bioremediation system into a monitoring well network and employing different remediation methods in these recalcitrant areas. In accordance with the workplan, a pilot test was conducted of certain groundwater remediation methods and the results of that test were used to develop more detailed plans for remedial activities in the off-site areas, which were approved by the authorities and are being implemented in a phased manner. The results of groundwater monitoring are being used to evaluate the effectiveness of these activities. The Company submitted a proposed expanded remedy workplan and is awaiting public comment and feedback from the oversight authorities. The liability for the on-site remediation was discounted at 4.8%. On an undiscounted basis, the on-site remediation liability would be $16.3 million as of January 29, 2011. The Company expects to spend approximately $0.2 million in each of the next five years and $15.3 million in the aggregate thereafter related to the on-site remediation.
81
|
BROWN SHOE COMPANY, INC.
|
2010 FORM 10-K
|
The cumulative expenditures for both on-site and off-site remediation through January 29, 2011, are $23.1 million. The Company has recovered a portion of these expenditures from insurers and other third parties. The reserve for the anticipated future remediation activities at January 29, 2011, is $7.7 million, of which $0.8 million is recorded within other accrued expenses and $6.9 million is recorded within other liabilities. Of the total $7.7 million reserve, $5.0 million is for on-site remediation and $2.7 million is for off-site remediation. In addition to the accretion of interest expense, the Company recorded an expense of $1.2 million in 2008 related to the on-site and off-site remediations, with no charges incurred in 2010 or 2009.
Other
The Company has completed its remediation efforts at its closed New York tannery and two associated landfills. In 1995, state environmental authorities reclassified the status of these sites as being properly closed and requiring only continued maintenance and monitoring through 2024. The Company has an accrued liability of $1.8 million at January 29, 2011, related to these sites, which has been discounted at 6.4%. On an undiscounted basis, this liability would be $2.5 million. The Company expects to spend approximately $0.2 million in each of the next five years and $1.5 million in the aggregate thereafter related to these sites. In addition, various federal and state authorities have identified the Company as a potentially responsible party for remediation at certain other sites. However, the Company does not currently believe that its liability for such sites, if any, would be material.
Based on information currently available, the Company has an accrued liability of $9.5 million as of January 29, 2011, to complete the cleanup, maintenance and monitoring at all sites. Of the $9.5 million liability, $1.0 million is recorded in other accrued expenses and $8.5 million is recorded in other liabilities. The Company continues to evaluate its estimated costs in conjunction with its environmental consultants and records its best estimate of such liabilities. However, future actions and the associated costs are subject to oversight and approval of various governmental authorities. Accordingly, the ultimate costs may vary, and it is possible costs may exceed the recorded amounts.
Litigation
On April 25, 2008, the Board of Commissioners of the County of La Plata, Colorado, filed suit against a subsidiary of the Company in the United States District Court for the District of Colorado, alleging soil and groundwater contamination associated with a former facility located in Durango, Colorado. The Redfield rifle scope business operated a lens crafting facility on this property, which was subsequently sold to the County. The County seeks reimbursement for its past expenditures and a judgment obligating the Company to pay for cleanup of the site. The trial concluded during the third quarter of 2010, and judgment was received in the first quarter of 2011. The judgment did not have a material adverse effect on the Company’s results of operations or financial position.
The Company is involved in legal proceedings and litigation arising in the ordinary course of business. In the opinion of management, the outcome of such ordinary course of business proceedings and litigation currently pending is not expected to have a material adverse effect on the Company’s results of operations or financial position. All legal costs associated with litigation are expensed as incurred.
Other
In 2004, the Company was notified of the insolvency of an insurance company that insured the Company for workers’ compensation and casualty losses from 1973 to 1989. That company is now in liquidation. Certain claims from that time period are still outstanding, for which the Company has an accrued liability of $1.6 million as of January 29, 2011. While management believes it has an appropriate reserve for this matter, the ultimate outcome and cost to the Company may vary.
At January 29, 2011, the Company was contingently liable for remaining lease commitments of approximately $1.1 million in the aggregate, which relate to former retail locations that it exited in prior years. These obligations will continue to decline over the next several years as leases expire. In order for the Company to incur any liability related to these lease commitments, the current lessees would have to default.
|
19.
|
FINANCIAL INFORMATION FOR THE COMPANY AND ITS SUBSIDIARIES
|
In 2005, Brown Shoe Company, Inc. issued Senior Notes, which are fully and unconditionally and jointly and severally guaranteed by all of its existing and future subsidiaries that are guarantors under its existing Credit Agreement. The following table presents the condensed consolidating financial information for each of Brown Shoe Company, Inc. (“Parent”), the Guarantors and subsidiaries of the Parent that are not Guarantors (the “Non-Guarantors”), together with consolidating eliminations, as of and for the periods indicated.
The condensed consolidating financial statements have been prepared using the equity method of accounting in accordance with the requirements for presentation of such information. Management believes that the information, presented in lieu of complete financial statements for each of the Guarantors, provides meaningful information to allow investors to determine the nature of the assets held by, and the operations and cash flows of, each of the consolidated groups.
82
|
BROWN SHOE COMPANY, INC.
|
2010 FORM 10-K
|
|
CONDENSED CONSOLIDATING BALANCE SHEET
AS OF JANUARY 29, 2011
|
|||||||||||||||||
|
($ thousands)
|
Parent
|
Guarantors
|
Non-Guarantors
|
Eliminations
|
Total
|
||||||||||||
|
Assets
|
|||||||||||||||||
|
Current assets:
|
|||||||||||||||||
|
Cash and cash equivalents
|
$
|
–
|
$
|
27,095
|
$
|
99,453
|
$
|
–
|
$
|
126,548
|
|||||||
|
Receivables
|
64,742
|
5,201
|
43,994
|
–
|
113,937
|
||||||||||||
|
Inventories
|
119,855
|
400,578
|
3,817
|
–
|
524,250
|
||||||||||||
|
Prepaid expenses and other current assets
|
26,979
|
15,868
|
699
|
–
|
43,546
|
||||||||||||
|
Total current assets
|
211,576
|
448,742
|
147,963
|
–
|
808,281
|
||||||||||||
|
Other assets
|
113,193
|
19,667
|
678
|
–
|
133,538
|
||||||||||||
|
Intangible assets, net
|
53,279
|
17,280
|
33
|
–
|
70,592
|
||||||||||||
|
Property and equipment, net
|
25,850
|
106,475
|
3,307
|
–
|
135,632
|
||||||||||||
|
Investment in subsidiaries
|
598,106
|
139,601
|
–
|
(737,707
|
)
|
–
|
|||||||||||
|
Total assets
|
$
|
1,002,004
|
$
|
731,765
|
$
|
151,981
|
$
|
(737,707
|
)
|
$
|
1,148,043
|
||||||
|
Liabilities and Equity
|
|||||||||||||||||
|
Current liabilities:
|
|||||||||||||||||
|
Borrowings under revolving credit agreement
|
$
|
198,000
|
$
|
–
|
$
|
–
|
$
|
–
|
$
|
198,000
|
|||||||
|
Trade accounts payable
|
52,616
|
75,764
|
38,810
|
–
|
167,190
|
||||||||||||
|
Other accrued expenses
|
82,201
|
58,702
|
5,812
|
–
|
146,715
|
||||||||||||
|
Total current liabilities
|
332,817
|
134,466
|
44,622
|
–
|
511,905
|
||||||||||||
|
Other liabilities:
|
|||||||||||||||||
|
Long-term debt
|
150,000
|
–
|
–
|
–
|
150,000
|
||||||||||||
|
Other liabilities
|
23,228
|
46,661
|
340
|
–
|
70,229
|
||||||||||||
|
Intercompany payable (receivable)
|
80,879
|
(47,468
|
)
|
(33,411
|
)
|
–
|
–
|
||||||||||
|
Total other liabilities
|
254,107
|
(807
|
)
|
(33,071
|
)
|
–
|
220,229
|
||||||||||
|
Equity:
|
|||||||||||||||||
|
Brown Shoe Company, Inc. shareholders’ equity
|
415,080
|
598,106
|
139,601
|
(737,707
|
)
|
415,080
|
|||||||||||
|
Noncontrolling interests
|
–
|
–
|
829
|
–
|
829
|
||||||||||||
|
Total equity
|
415,080
|
598,106
|
140,430
|
(737,707
|
)
|
415,909
|
|||||||||||
|
Total liabilities and equity
|
$
|
1,002,004
|
$
|
731,765
|
$
|
151,981
|
$
|
(737,707
|
)
|
$
|
1,148,043
|
||||||
|
CONDENSED CONSOLIDATING STATEMENT OF EARNINGS
FOR THE FISCAL YEAR ENDED JANUARY 29, 2011
|
|||||||||||||||||
|
($ thousands)
|
Parent
|
Guarantors
|
Non-Guarantors
|
Eliminations
|
Total
|
||||||||||||
|
Net sales
|
$
|
714,388
|
$
|
1,768,767
|
$
|
216,604
|
$
|
(195,668
|
)
|
$
|
2,504,091
|
||||||
|
Cost of goods sold
|
545,219
|
967,712
|
183,274
|
(195,668
|
)
|
1,500,537
|
|||||||||||
|
Gross profit
|
169,169
|
801,055
|
33,330
|
–
|
1,003,554
|
||||||||||||
|
Selling and administrative expenses
|
190,586
|
717,775
|
14,615
|
–
|
922,976
|
||||||||||||
|
Restructuring and other special charges, net
|
7,209
|
–
|
705
|
–
|
7,914
|
||||||||||||
|
Equity in (earnings) loss of subsidiaries
|
(58,275
|
)
|
(11,860
|
)
|
–
|
70,135
|
–
|
||||||||||
|
Operating earnings (loss)
|
29,649
|
95,140
|
18,010
|
(70,135
|
)
|
72,664
|
|||||||||||
|
Interest expense
|
(19,643
|
)
|
(4
|
)
|
–
|
–
|
(19,647
|
)
|
|||||||||
|
Interest income
|
1
|
76
|
126
|
–
|
203
|
||||||||||||
|
Intercompany interest income (expense)
|
14,961
|
(11,212
|
)
|
(3,749
|
)
|
–
|
–
|
||||||||||
|
Earnings (loss) before income taxes
|
24,968
|
84,000
|
14,387
|
(70,135
|
)
|
53,220
|
|||||||||||
|
Income tax benefit (provision)
|
12,265
|
(25,415
|
)
|
(3,010
|
)
|
–
|
(16,160
|
)
|
|||||||||
|
Net earnings (loss)
|
$
|
37,233
|
$
|
58,585
|
$
|
11,377
|
$
|
(70,135
|
)
|
$
|
37,060
|
||||||
|
Less: Net earnings (loss) attributable to noncontrolling
interests
|
–
|
310
|
(483
|
)
|
–
|
(173
|
)
|
||||||||||
|
Net earnings (loss) attributable to Brown Shoe
Company, Inc.
|
$
|
37,233
|
$
|
58,275
|
$
|
11,860
|
$
|
(70,135
|
)
|
$
|
37,233
|
||||||
83
|
BROWN SHOE COMPANY, INC.
|
2010 FORM 10-K
|
|
CONDENSED CONSOLIDATING STATEMENT OF CASH FLOWS
FOR THE FISCAL YEAR ENDED JANUARY 29, 2011
|
|
($ thousands)
|
Parent
|
Guarantors
|
Non-Guarantors
|
Eliminations
|
Total
|
||||||||||
|
Net cash provided (used for) by operating activities
|
$
|
64,824
|
$
|
(129,040
|
)
|
$
|
61,904
|
$
|
–
|
$
|
(2,312
|
)
|
|||
|
Investing activities
|
|||||||||||||||
|
Purchases of property and equipment
|
(4,863
|
)
|
(25,126
|
)
|
(792
|
)
|
–
|
(30,781
|
)
|
||||||
|
Capitalized software
|
(23,793
|
)
|
(253
|
)
|
–
|
–
|
(24,046
|
)
|
|||||||
|
Net cash used for investing activities
|
(28,656
|
)
|
(25,379
|
)
|
(792
|
)
|
–
|
(54,827
|
)
|
||||||
|
Financing activities
|
|||||||||||||||
|
Borrowings under revolving credit agreement
|
1,051,500
|
–
|
–
|
–
|
1,051,500
|
||||||||||
|
Repayments under revolving credit agreement
|
(948,000
|
)
|
–
|
–
|
–
|
(948,000
|
)
|
||||||||
|
Intercompany financing
|
(132,926
|
)
|
206,664
|
(73,738
|
)
|
–
|
–
|
||||||||
|
Acquisition of noncontrolling interests (Edelman Shoe, Inc.)
|
7,309
|
(40,001
|
)
|
–
|
–
|
(32,692
|
)
|
||||||||
|
Dividends paid
|
(12,254
|
)
|
5,010
|
(5,010
|
)
|
–
|
(12,254
|
)
|
|||||||
|
Debt issuance costs
|
(2,636
|
)
|
–
|
–
|
–
|
(2,636
|
)
|
||||||||
|
Proceeds from stock options exercised
|
926
|
–
|
–
|
–
|
926
|
||||||||||
|
Contributions by noncontrolling interests
|
–
|
–
|
527
|
–
|
527
|
||||||||||
|
Tax deficiency related to share-based plans
|
(87
|
)
|
–
|
–
|
–
|
(87
|
)
|
||||||||
|
Net cash (used for) provided by financing
activities
|
(36,168
|
)
|
171,673
|
(78,221
|
)
|
–
|
57,284
|
||||||||
|
Effect of exchange rate changes on cash and cash equivalents
|
–
|
570
|
–
|
–
|
570
|
||||||||||
|
Increase (decrease) in cash and cash equivalents
|
–
|
17,824
|
(17,109
|
)
|
–
|
715
|
|||||||||
|
Cash and cash equivalents at beginning of period
|
–
|
9,271
|
116,562
|
–
|
125,833
|
||||||||||
|
Cash and cash equivalents at end of period
|
$
|
–
|
$
|
27,095
|
$
|
99,453
|
$
|
–
|
$
|
126,548
|
|||||
84
|
BROWN SHOE COMPANY, INC.
|
2010 FORM 10-K
|
|
CONDENSED CONSOLIDATING BALANCE SHEET
AS OF JANUARY 30, 2010
|
|||||||||||||||||
|
($ thousands)
|
Parent
|
Guarantors
|
Non-Guarantors
|
Eliminations
|
Total
|
||||||||||||
|
Assets
|
|||||||||||||||||
|
Current assets:
|
|||||||||||||||||
|
Cash and cash equivalents
|
$
|
–
|
$
|
2,809
|
$
|
123,024
|
$
|
–
|
$
|
125,833
|
|||||||
|
Receivables
|
51,417
|
3,002
|
29,878
|
–
|
84,297
|
||||||||||||
|
Inventories
|
77,730
|
376,110
|
2,842
|
–
|
456,682
|
||||||||||||
|
Prepaid expenses and other current assets
|
26,751
|
12,327
|
2,359
|
–
|
41,437
|
||||||||||||
|
Total current assets
|
155,898
|
394,248
|
158,103
|
–
|
708,249
|
||||||||||||
|
Other assets
|
92,413
|
(1,189
|
)
|
21,890
|
–
|
113,114
|
|||||||||||
|
Intangible assets, net
|
58,826
|
3,000
|
15,400
|
–
|
77,226
|
||||||||||||
|
Property and equipment, net
|
25,140
|
112,580
|
3,841
|
–
|
141,561
|
||||||||||||
|
Investment in subsidiaries
|
641,409
|
199,234
|
–
|
(840,643
|
)
|
–
|
|||||||||||
|
Total assets
|
$
|
973,686
|
$
|
707,873
|
$
|
199,234
|
$
|
(840,643
|
)
|
$
|
1,040,150
|
||||||
|
Liabilities and Equity
|
|||||||||||||||||
|
Current liabilities:
|
|||||||||||||||||
|
Borrowings under revolving credit agreement
|
$
|
94,500
|
$
|
–
|
$
|
–
|
$
|
–
|
$
|
94,500
|
|||||||
|
Trade accounts payable
|
53,410
|
93,937
|
30,353
|
–
|
177,700
|
||||||||||||
|
Other accrued expenses
|
78,504
|
55,685
|
7,674
|
–
|
141,863
|
||||||||||||
|
Total current liabilities
|
226,414
|
149,622
|
38,027
|
–
|
414,063
|
||||||||||||
|
Other liabilities:
|
|||||||||||||||||
|
Long-term debt
|
150,000
|
–
|
–
|
–
|
150,000
|
||||||||||||
|
Other liabilities
|
19,455
|
39,386
|
6,019
|
–
|
64,860
|
||||||||||||
|
Intercompany payable (receivable)
|
210,439
|
(261,042
|
)
|
50,603
|
–
|
–
|
|||||||||||
|
Total other liabilities
|
379,894
|
(221,656
|
)
|
56,622
|
–
|
214,860
|
|||||||||||
|
Equity:
|
|||||||||||||||||
|
Brown Shoe Company, Inc. shareholders’ equity
|
367,378
|
779,907
|
95,529
|
(840,643
|
)
|
402,171
|
|||||||||||
|
Noncontrolling interests
|
–
|
–
|
9,056
|
–
|
9,056
|
||||||||||||
|
Total equity
|
367,378
|
779,907
|
104,585
|
(840,643
|
)
|
411,227
|
|||||||||||
|
Total liabilities and equity
|
$
|
973,686
|
$
|
707,873
|
$
|
199,234
|
$
|
(840,643
|
)
|
$
|
1,040,150
|
||||||
|
CONDENSED CONSOLIDATING STATEMENT OF EARNINGS
FOR THE FISCAL YEAR ENDED JANUARY 30, 2010
|
|||||||||||||||||
|
($ thousands)
|
Parent
|
Guarantors
|
Non-Guarantors
|
Eliminations
|
Total
|
||||||||||||
|
Net sales
|
$
|
578,281
|
$
|
1,624,989
|
$
|
237,988
|
$
|
(199,290
|
)
|
$
|
2,241,968
|
||||||
|
Cost of goods sold
|
439,386
|
909,656
|
189,077
|
(199,290
|
)
|
1,338,829
|
|||||||||||
|
Gross profit
|
138,895
|
715,333
|
48,911
|
–
|
903,139
|
||||||||||||
|
Selling and administrative expenses
|
151,611
|
683,838
|
24,244
|
–
|
859,693
|
||||||||||||
|
Restructuring and other special charges, net
|
11,625
|
–
|
298
|
–
|
11,923
|
||||||||||||
|
Equity in (earnings) loss of subsidiaries
|
(27,932
|
)
|
(20,002
|
)
|
–
|
47,934
|
–
|
||||||||||
|
Operating earnings (loss)
|
3,591
|
51,497
|
24,369
|
(47,934
|
)
|
31,523
|
|||||||||||
|
Interest expense
|
(19,942
|
)
|
(1
|
)
|
(252
|
)
|
–
|
(20,195
|
)
|
||||||||
|
Interest income
|
1
|
38
|
335
|
–
|
374
|
||||||||||||
|
Intercompany interest income (expense)
|
15,498
|
(16,487
|
)
|
989
|
–
|
–
|
|||||||||||
|
(Loss) earnings before income taxes
|
(852
|
)
|
35,047
|
25,441
|
(47,934
|
)
|
11,702
|
||||||||||
|
Income tax benefit (provision)
|
10,349
|
(7,113
|
)
|
(4,495
|
)
|
–
|
(1,259
|
)
|
|||||||||
|
Net earnings (loss)
|
$
|
9,497
|
$
|
27,934
|
$
|
20,946
|
$
|
(47,934
|
)
|
$
|
10,443
|
||||||
|
Less: Net earnings attributable to noncontrolling interests
|
–
|
–
|
943
|
–
|
943
|
||||||||||||
|
Net earnings (loss) attributable to Brown Shoe Company, Inc.
|
$
|
9,497
|
$
|
27,934
|
$
|
20,003
|
$
|
(47,934
|
)
|
$
|
9,500
|
||||||
85
|
BROWN SHOE COMPANY, INC.
|
2010 FORM 10-K
|
|
CONDENSED CONSOLIDATING STATEMENT OF CASH FLOWS
FOR THE FISCAL YEAR ENDED JANUARY 30, 2010
|
|
($ thousands)
|
Parent
|
Guarantors
|
Non-Guarantors
|
Eliminations
|
Total
|
||||||||||
|
Net cash provided by operating activities
|
$
|
45,390
|
$
|
35,475
|
$
|
37,088
|
$
|
125
|
$
|
118,078
|
|||||
|
Investing activities
|
|||||||||||||||
|
Purchases of property and equipment
|
(2,114
|
)
|
(21,422
|
)
|
(1,344
|
)
|
–
|
(24,880
|
)
|
||||||
|
Capitalized software
|
(23,923
|
)
|
(1,127
|
)
|
(48
|
)
|
–
|
(25,098
|
)
|
||||||
|
Net cash used for investing activities
|
(26,037
|
)
|
(22,549
|
)
|
(1,392
|
)
|
–
|
(49,978
|
)
|
||||||
|
Financing activities
|
|||||||||||||||
|
Borrowings under revolving credit agreement
|
848,900
|
–
|
–
|
–
|
848,900
|
||||||||||
|
Repayments under revolving credit agreement
|
(866,900
|
)
|
–
|
–
|
–
|
(866,900
|
)
|
||||||||
|
Proceeds from stock options exercised
|
107
|
–
|
–
|
–
|
107
|
||||||||||
|
Tax deficiency related to share-based plans
|
(58
|
)
|
–
|
–
|
–
|
(58
|
)
|
||||||||
|
Dividends paid
|
(12,009
|
)
|
–
|
–
|
–
|
(12,009
|
)
|
||||||||
|
Intercompany financing
|
10,607
|
(33,744
|
)
|
23,262
|
(125
|
)
|
–
|
||||||||
|
Net cash (used for) provided by financing activities
|
(19,353
|
)
|
(33,744
|
)
|
23,262
|
(125
|
)
|
(29,960
|
)
|
||||||
|
Effect of exchange rate changes on cash and cash equivalents
|
–
|
793
|
–
|
–
|
793
|
||||||||||
|
(Decrease) increase in cash and cash equivalents
|
–
|
(20,025
|
)
|
58,958
|
–
|
38,933
|
|||||||||
|
Cash and cash equivalents at beginning of year
|
–
|
22,834
|
64,066
|
–
|
86,900
|
||||||||||
|
Cash and cash equivalents at end of year
|
$
|
–
|
$
|
2,809
|
$
|
123,024
|
$
|
–
|
$
|
125,833
|
|||||
|
CONDENSED CONSOLIDATING STATEMENT OF EARNINGS
FOR THE FISCAL YEAR ENDED JANUARY 31, 2009
|
|
($ thousands)
|
Parent
|
Guarantors
|
Non-Guarantors
|
Eliminations
|
Total
|
||||||||||
|
Net sales
|
$
|
569,026
|
$
|
1,594,761
|
$
|
285,138
|
$
|
(172,563
|
)
|
$
|
2,276,362
|
||||
|
Cost of goods sold
|
431,128
|
896,663
|
238,898
|
(172,563
|
)
|
1,394,126
|
|||||||||
|
Gross profit
|
137,898
|
698,098
|
46,240
|
–
|
882,236
|
||||||||||
|
Selling and administrative expenses
|
156,863
|
676,710
|
18,320
|
–
|
851,893
|
||||||||||
|
Impairment of goodwill and intangible assets
|
115,006
|
30,309
|
3,835
|
–
|
149,150
|
||||||||||
|
Restructuring and other special charges, net
|
49,890
|
4,388
|
–
|
–
|
54,278
|
||||||||||
|
Equity in net loss of nonconsolidated affiliate
|
–
|
–
|
216
|
–
|
216
|
||||||||||
|
Equity in (earnings) loss of subsidiaries
|
(5,385)
|
(26,307
|
)
|
–
|
31,692
|
–
|
|||||||||
|
Operating (loss) earnings
|
(178,476
|
)
|
12,998
|
23,869
|
(31,692
|
)
|
(173,301
|
)
|
|||||||
|
Interest expense
|
(17,007
|
)
|
–
|
(98
|
)
|
–
|
(17,105
|
)
|
|||||||
|
Interest income
|
80
|
669
|
1,051
|
–
|
1,800
|
||||||||||
|
Intercompany interest income (expense)
|
5,753
|
(6,677
|
)
|
924
|
–
|
–
|
|||||||||
|
(Loss) earnings before income taxes
|
(189,650
|
)
|
6,990
|
25,746
|
(31,692
|
)
|
(188,606
|
)
|
|||||||
|
Income tax benefit (provision)
|
56,412
|
(1,605
|
)
|
(1,014
|
)
|
–
|
53,793
|
||||||||
|
Net (loss) earnings
|
$
|
(133,238
|
)
|
$
|
5,385
|
$
|
24,732
|
$
|
(31,692
|
)
|
$
|
(134,813
|
)
|
||
|
Less: Net loss attributable to noncontrolling interests
|
–
|
–
|
(1,575
|
)
|
–
|
(1,575
|
)
|
||||||||
|
Net (loss) earnings attributable to Brown Shoe Company, Inc.
|
$
|
(133,238
|
)
|
$
|
5,385
|
$
|
26,307
|
$
|
(31,692
|
)
|
$
|
(133,238
|
)
|
||
86
|
BROWN SHOE COMPANY, INC.
|
2010 FORM 10-K
|
|
CONDENSED CONSOLIDATING STATEMENT OF CASH FLOWS
FOR THE FISCAL YEAR ENDED JANUARY 31, 2009
|
|
($ thousands)
|
Parent
|
Guarantors
|
Non-Guarantors
|
Eliminations
|
Total
|
||||||||||
|
Net cash (used for) provided by operating activities
|
$
|
(22,725
|
)
|
$
|
41,416
|
$
|
15,645
|
$
|
–
|
$
|
34,336
|
||||
|
Investing activities
|
|||||||||||||||
|
Purchases of property and equipment
|
(5,095
|
)
|
(54,229
|
)
|
(1,093
|
)
|
–
|
(60,417
|
)
|
||||||
|
Capitalized software
|
(13,073
|
)
|
(3,172
|
)
|
(82
|
)
|
–
|
(16,327
|
)
|
||||||
|
Cash recognized on initial consolidation
|
–
|
–
|
3,337
|
–
|
3,337
|
||||||||||
|
Investments in consolidated companies
|
–
|
–
|
(7,683
|
)
|
–
|
(7,683
|
)
|
||||||||
|
Net cash used for investing activities
|
(18,168
|
)
|
(57,401
|
)
|
(5,521
|
)
|
–
|
(81,090
|
)
|
||||||
|
Financing activities
|
|||||||||||||||
|
Borrowings under revolving credit agreement
|
655,500
|
–
|
–
|
–
|
655,500
|
||||||||||
|
Repayments under revolving credit agreement
|
(558,000
|
)
|
–
|
–
|
–
|
(558,000
|
)
|
||||||||
|
Debt issuance costs
|
(7,500
|
)
|
–
|
–
|
–
|
(7,500
|
)
|
||||||||
|
Proceeds from stock options exercised
|
313
|
–
|
–
|
–
|
313
|
||||||||||
|
Tax benefit related to share-based plans
|
498
|
–
|
–
|
–
|
498
|
||||||||||
|
Dividends (paid) received
|
(11,855
|
)
|
7,105
|
(7,105
|
)
|
–
|
(11,855
|
)
|
|||||||
|
Intercompany financing
|
(38,063
|
)
|
12,800
|
25,263
|
–
|
–
|
|||||||||
|
Net cash provided by financing activities
|
40,893
|
19,905
|
18,158
|
–
|
78,956
|
||||||||||
|
Effect of exchange rate changes on cash and cash equivalents
|
–
|
(5,103
|
)
|
–
|
–
|
(5,103
|
)
|
||||||||
|
(Decrease) increase in cash and cash equivalents
|
–
|
(1,183
|
)
|
28,282
|
–
|
27,099
|
|||||||||
|
Cash and cash equivalents at beginning of year
|
–
|
24,017
|
35,784
|
–
|
59,801
|
||||||||||
|
Cash and cash equivalents at end of year
|
$
|
–
|
$
|
22,834
|
$
|
64,066
|
$
|
–
|
$
|
86,900
|
|||||
87
|
BROWN SHOE COMPANY, INC.
|
2010 FORM 10-K
|
|
20.
|
QUARTERLY FINANCIAL DATA (Unaudited)
|
Quarterly financial results (unaudited) for the years 2010 and 2009 are as follows:
|
Quarters
|
|||||||||
|
($ thousands, except per share amounts)
|
First Quarter
(13 weeks)
|
Second Quarter
(13 weeks)
|
Third Quarter
(13 weeks)
|
Fourth Quarter
(13 weeks)
|
|||||
|
2010
|
|||||||||
|
Net sales
|
$597,718
|
$585,756
|
$716,093
|
$604,524
|
|||||
|
Gross profit
|
247,560
|
238,470
|
282,219
|
235,305
|
|||||
|
Net earnings
|
10,535
|
4,788
|
18,490
|
3,247
|
|||||
|
Net earnings attributable to Brown Shoe Company, Inc.
|
10,046
|
5,261
|
18,573
|
3,353
|
|||||
|
Per share of common stock:
|
|||||||||
|
Basic earnings per common share attributable to Brown Shoe Company, Inc. shareholders
|
0.23
|
0.12
|
0.42
|
0.08
|
|||||
|
Diluted earnings per common share attributable to Brown Shoe Company, Inc. shareholders
|
0.23
|
0.12
|
0.42
|
0.08
|
|||||
|
Dividends paid
|
0.07
|
0.07
|
0.07
|
0.07
|
|||||
|
Market value:
|
|||||||||
|
High
|
19.96
|
19.10
|
15.16
|
15.28
|
|||||
|
Low
|
11.56
|
13.71
|
10.25
|
11.12
|
|||||
|
Quarters
|
|||||||||
|
($ thousands, except per share amounts)
|
First Quarter
(13 weeks)
|
Second Quarter
(13 weeks)
|
Third Quarter
(13 weeks)
|
Fourth Quarter
(13 weeks)
|
|||||
|
2009
|
|||||||||
|
Net sales
|
$538,740
|
$511,621
|
$625,635
|
$565,972
|
|||||
|
Gross profit
|
208,164
|
203,640
|
258,943
|
232,392
|
|||||
|
Net (loss) earnings
|
(7,071
|
)
|
(4,216
|
)
|
17,004
|
4,726
|
|||
|
Net (loss) earnings attributable to Brown Shoe Company, Inc.
|
(7,603
|
)
|
(4,245
|
)
|
16,300
|
5,048
|
|||
|
Per share of common stock:
|
|||||||||
|
Basic (loss) earnings per common share attributable to Brown Shoe Company, Inc. shareholders
|
(0.18
|
)
|
(0.10
|
)
|
0.38
|
0.12
|
|||
|
Diluted (loss) earnings per common share attributable to Brown Shoe Company, Inc. shareholders
|
(0.18
|
)
|
(0.10
|
)
|
0.38
|
0.12
|
|||
|
Dividends paid
|
0.07
|
0.07
|
0.07
|
0.07
|
|||||
|
Market value:
|
|||||||||
|
High
|
6.70
|
9.44
|
12.33
|
13.07
|
|||||
|
Low
|
2.04
|
5.41
|
6.97
|
9.82
|
|||||
The fourth quarter of 2010 included:
|
·
|
$1.4 million of charges ($0.9 million on an after-tax basis) related to the Company’s information technology initiatives, and
|
|
·
|
$1.1 million of acquisition-related costs ($0.7 million on an after-tax basis) related to the acquisition of ASG, which closed on February 17, 2011.
|
The fourth quarter of 2009 included:
|
·
|
$4.6 million of charges ($2.8 million on an after-tax basis) related to organizational changes and
|
|
·
|
$2.3 million of charges ($1.4 million on an after-tax basis) related to the Company’s information technology initiatives, partially offset by
|
|
·
|
$1.9 million of income ($1.1 million on an after-tax basis) related to the relocation and transition of the Company’s Famous Footwear division headquarters.
|
88
|
BROWN SHOE COMPANY, INC.
|
2010 FORM 10-K
|
|
SCHEDULE II — VALUATION AND QUALIFYING ACCOUNTS
|
|
Col. A
|
Col. B
|
Col. C
|
Col. D
|
Col. E
|
|
|
Additions
|
|||||
|
Description
|
Balance at
Beginning
of Period
|
Charged to
Costs and
Expenses
|
Charged to
Other
Accounts-
Describe
|
Deductions-Describe
|
Balance
at End
of Period
|
|
($ thousands)
|
|||||
|
YEAR ENDED JANUARY 29, 2011
|
|||||
|
Deducted from assets or accounts:
|
|||||
|
Doubtful accounts and allowances
|
$14,311
|
$50,421
|
–
|
$ 46,334(A)
|
$18,398
|
|
Inventory valuation allowances
|
15,414
|
53,506
|
–
|
53,615(B)
|
15,305
|
|
Deferred tax asset valuation allowance
|
8,859
|
296
|
–
|
2,404(C)
|
6,751
|
|
YEAR ENDED JANUARY 30, 2010
|
|||||
|
Deducted from assets or accounts:
|
|||||
|
Doubtful accounts and allowances
|
$12,878
|
$46,909
|
–
|
$45,476 (A)
|
$14,311
|
|
Inventory valuation allowances
|
15,027
|
51,712
|
–
|
51,325 (B)
|
15,414
|
|
Deferred tax asset valuation allowance
|
6,723
|
2,136
|
–
|
–
|
8,859
|
|
YEAR ENDED JANUARY 31, 2009
|
|||||
|
Deducted from assets or accounts:
|
|||||
|
Doubtful accounts and allowances
|
$13,844
|
$50,802
|
–
|
$51,768 (A)
|
$12,878
|
|
Inventory valuation allowances
|
13,041
|
53,624
|
–
|
51,638 (B)
|
15,027
|
|
Deferred tax asset valuation allowance
|
3,236
|
3,487
|
–
|
–
|
6,723
|
|
(A)
|
Accounts written off, net of recoveries, discounts and allowances taken.
|
|
(B)
|
Adjustment upon disposal of related inventories.
|
|
(C)
|
Reflects reductions to valuation allowance for the net operating loss carryforwards for certain states based on both changes in tax filing status in those states and the Company’s expectations for utilization of net operating loss carryforwards..
|
|
|
CHANGES IN AND DISAGREEMENTS WITH ACCOUNTANTS ON ACCOUNTING AND FINANCIAL DISCLOSURE
|
None.
89
|
BROWN SHOE COMPANY, INC.
|
2010 FORM 10-K
|
|
CONTROLS AND PROCEDURES
|
It is the Chief Executive Officer’s and Chief Financial Officer’s ultimate responsibility to ensure we maintain disclosure controls and procedures designed to provide reasonable assurance that information required to be disclosed in the reports that we file or submit under the Securities Exchange Act of 1934 is recorded, processed, summarized and reported within the time periods specified in the Commission’s rules and forms and is accumulated and communicated to our management, including our principal executive and principal financial officers, or persons performing similar functions, as appropriate to allow timely decisions regarding required disclosure. Our disclosure controls and procedures include mandatory communication of material events; automated accounting processing and reporting; management review of monthly, quarterly and annual results; an established system of internal controls; and internal control reviews by our internal auditors.
A control system, no matter how well-conceived or operated, can provide only reasonable, not absolute, assurance that the objectives of the control system are met. Furthermore, the design of a control system must reflect the fact there are resource constraints, and the benefits of controls must be considered relative to their costs. Because of the inherent limitations in all control systems, no evaluation of controls can provide absolute assurance that all control issues and instances of fraud, if any, have been detected. These inherent limitations include the realities that judgments in decision-making can be faulty, and breakdowns can occur because of simple error or mistake. Additionally, controls can be circumvented by the individual acts of some persons, by collusion of two or more people or by management override of the controls. The design of any system of controls is based in part upon certain assumptions about the likelihood of future events, and there can be no assurance any design will succeed in achieving its stated goals under all potential future conditions; over time, controls may become inadequate because of changes in conditions or the degree of compliance with the policies or procedures may deteriorate. Because of the inherent limitations in a cost-effective control system, misstatements due to errors or fraud may occur and not be detected. Our disclosure controls and procedures are designed to provide a reasonable level of assurance that their objectives are achieved. As of January 29, 2011, management of the Company, including the Chief Executive Officer and Chief Financial Officer, conducted an evaluation of the effectiveness of our disclosure controls and procedures (as defined in Rule 13a-15(e) under the Securities Exchange Act of 1934). Based upon and as of the date of that evaluation, the Chief Executive Officer and Chief Financial Officer have concluded our disclosure controls and procedures were effective at the reasonable assurance level.
We converted certain of our existing internally developed and certain other third-party applications to an integrated ERP information technology system provided by third-party vendors. We have updated our internal control over financial reporting as necessary to accommodate the modifications to our business processes and related internal control over financial reporting. This ERP system, along with the internal control over financial reporting impacted by the implementation, were appropriately tested for design and operating effectiveness as part of our annual evaluation of internal control over financial reporting as of January 29, 2011. As we continue our system transition efforts and alignment of existing business processes in 2011, we expect that there may be additional changes in related internal control over financial reporting.
Management’s assessment of the effectiveness of internal control over financial reporting as of January 29, 2011 can be found in Item 8 of this report. The effectiveness of internal control over financial reporting as of January 29, 2011, was audited by Ernst & Young LLP, an independent registered public accounting firm, as stated in their report, which can also be found in Item 8 of this report.
Based on the evaluation of internal control over financial reporting, the Chief Executive Officer and Chief Financial Officer have concluded that there have been no changes in the Company’s internal controls over financial reporting or in other factors during the quarter ended January 29, 2011, other than those described above relating to the implementation of the new ERP system, that have materially affected, or are reasonably likely to materially affect, the Company’s internal control over financial reporting.
|
OTHER INFORMATION
|
None.
90
|
BROWN SHOE COMPANY, INC.
|
2010 FORM 10-K
|
|
PART III
|
|
DIRECTORS, EXECUTIVE OFFICERS AND CORPORATE GOVERNANCE
|
Information regarding Directors of the Company is set forth under the caption Election of Directors in the Proxy Statement for the Annual Meeting of Shareholders to be held May 26, 2011, which information is incorporated herein by reference.
Information regarding Executive Officers of the Registrant is set forth under the caption Executive Officers of the Registrant that can be found in Item 1 of this report, which information is incorporated herein by reference.
Information regarding Section 16, Beneficial Ownership Reporting Compliance, is set forth under the caption Section 16(a) Beneficial Ownership Reporting Compliance in the Proxy Statement for the Annual Meeting of Shareholders to be held May 26, 2011, which information is incorporated herein by reference.
Information regarding the Audit Committee and the Audit Committee financial expert is set forth under the captions Board Meetings and Committees and Audit Committee, respectively, in the Proxy Statement for the Annual Meeting of Shareholders to be held May 26, 2011, which information is incorporated herein by reference.
Information regarding the Corporate Governance Guidelines, Code of Business Conduct and Code of Ethics is set forth under the caption Corporate Governance in the Proxy Statement for the Annual Meeting of Shareholders to be held May 26, 2011, which information is incorporated herein by reference.
|
EXECUTIVE COMPENSATION
|
Information regarding Executive Compensation is set forth under the section titled Executive Compensation and under the caption Compensation of Non-Employee Directors in the Proxy Statement for the Annual Meeting of Shareholders to be held May 26, 2011, which information is incorporated herein by reference.
Information regarding the Compensation Committee Report is set forth under the caption Report of the Compensation Committee in the Proxy Statement for the Annual Meeting of Shareholders to be held May 26, 2011, which information is incorporated herein by reference.
Information regarding Compensation Committee Interlocks and Insider Participation is set forth under the caption Compensation Committee Interlocks and Insider Participation in the Proxy Statement for the Annual Meeting of Shareholders to be held May 26, 2011, which information is incorporated herein by reference.
91
|
BROWN SHOE COMPANY, INC.
|
2010 FORM 10-K
|
|
SECURITY OWNERSHIP OF CERTAIN BENEFICIAL OWNERS AND MANAGEMENT AND RELATED STOCKHOLDER MATTERS
|
Information regarding Company Stock Ownership by Directors, Officers and Principal Holders of Our Stock is set forth under the caption Stock Ownership by Directors, Executive Officers and 5% Shareholders in the Proxy Statement for the Annual Meeting of Shareholders to be held May 26, 2011, which information is incorporated herein by reference.
Equity Compensation Plan Information
The following table sets forth aggregate information regarding the Company’s equity compensation plans as of January 29, 2011:
|
Plan Category
|
Number of securities
to be issued upon
exercise of
outstanding options,
warrants and rights
(a)
|
Weighted-average exercise
price of outstanding options,
warrants and rights
(b)
|
Number of securities remaining
available for future issuance under
equity compensation plans
(excluding securities reflected in
column (a))
(c)
|
|||||
|
Equity compensation plans approved by security holders
|
2,615,705
|
(1)
|
$15.42
|
(1)
|
1,417,211
|
(2)
|
||
|
Equity compensation plans not approved by security holders
|
–
|
–
|
|
8,997
|
(3)
|
|||
|
Total
|
2,615,705
|
$15.42
|
1,426,208
|
|||||
|
(1)
|
Column (a) includes the following:
|
|||||||
| (i) | 1,835,142 outstanding stock options (includes vested and nonvested options) | |||||||
| (ii) | 780,563 rights to receive common shares subject to nonvested performance share awards at the maximum award level. The target amount of shares to be awarded under these performance share awards is 352,000 and 168,375, depending on the achievement of certain objectives at the end of 2011 and 2012, respectively. These awards may be payable at anywhere from zero to a maximum 528,000 and 252,563 shares at the end of 2011 and 2012, respectively. Our current expectation is that 696,375 shares will be issued upon satisfaction of these awards. | |||||||
| Performance share rights described in (ii) above were disregarded for purposes of computing the weighted-average exercise price in column (b). This table excludes restricted stock units granted to independent directors and independent directors’ deferred compensation units, which are payable only in cash and are described further in Note 6 and Note 16 to the consolidated financial statements. | ||||||||
|
(2)
|
Represents our remaining shares available for award grants based upon the plan provisions, which reflects our practice to reserve shares for outstanding awards. Per our current practice, the number of securities available for grant has been reduced for stock option grants and performance share awards payable in stock. Performance share awards are reserved based on the maximum payout level.
|
|||||||
|
(3)
|
Represents our remaining shares available for grant for our director share plan, whereby non-employee directors can elect to receive their annual retainer and meeting fees in whole shares of our stock in lieu of cash.
|
|||||||
Information regarding share-based plans is set forth in Note 16 to the consolidated financial statements and is hereby incorporated by reference.
|
CERTAIN RELATIONSHIPS AND RELATED TRANSACTIONS, AND DIRECTOR INDEPENDENCE
|
Information regarding Certain Relationships and Related Transactions is set forth under the caption Related Party Transactions in the Proxy Statement for the Annual Meeting of Shareholders to be held May 26, 2011, which information is incorporated herein by reference.
Information regarding Director Independence is set forth under the caption Director Independence in the Proxy Statement for the Annual Meeting of Shareholders to be held May 26, 2011, which information is incorporated herein by reference.
|
PRINCIPAL ACCOUNTING FEES AND SERVICES
|
Information regarding our Principal Accounting Fees and Services is set forth under the caption Fees Paid to Independent Registered Public Accountants in the Proxy Statement for the Annual Meeting of Shareholders to be held May 26, 2011, which information is incorporated herein by reference.
92
|
BROWN SHOE COMPANY, INC.
|
2010 FORM 10-K
|
|
PART IV
|
|
EXHIBITS AND FINANCIAL STATEMENT SCHEDULES
|
|||
|
(a)
|
(1) and (2) The list of financial statements and Financial Statement Schedules required by this item is included in the Index on page 3 under Financial Statements and Supplementary Data. All other schedules specified under Regulation S-X have been omitted because they are not applicable, because they are not required or because the information required is included in the financial statements or notes thereto.
|
||
|
(3) Exhibits
|
|||
|
Certain instruments defining the rights of holders of long-term debt securities of the Company are omitted pursuant to Item 601(b)(4)(iii) of Regulation S-K, and the Company hereby undertakes to furnish to the SEC, upon request, copies of any such instruments.
|
|||
|
Exhibit
No.
|
Description
|
|||
|
3.1
|
Restated Certificate of Incorporation of Brown Shoe Company, Inc. (the “Company”) incorporated herein by reference to Exhibit 3.1 to the Company's Quarterly Report on Form 10-Q for the quarter ended May 5, 2007, and filed June 5, 2007.
|
|||
|
3.2
|
Bylaws of the Company as amended through October 2, 2008, incorporated herein by reference to Exhibit 3.1 to the Company’s Form 8-K dated and filed October 8, 2008.
|
|||
|
4.1a
|
Indenture for the 8.75% Senior Notes due 2012 dated April 22, 2005, among the Company, the subsidiary guarantors set forth therein, and SunTrust Bank, as trustee, including the form of Global Note attached thereto, incorporated herein by reference to Exhibit 4.1 to the Company’s Form 8-K dated and filed April 26, 2005.
|
|||
|
4.1b
4.1c
|
Supplemental Indenture for 8.75% Senior Notes, dated October 24, 2007, incorporated herein by reference to Exhibit 4.1b to the Company’s Form 10-K for the year ended February 2, 2008, and filed March 28, 2008.
Supplemental Indenture for 8.75% Senior Notes due 2012, dated as of June 18, 2010, between Edelman Shoe, Inc., the Company and U.S. Bank National Association, as successor to SunTrust Bank, as trustee, incorporated herein by reference to Exhibit 4.1 to the Company’s Form 10-Q for the quarter ended July 31, 2010, and filed September 7, 2010.
|
|||
|
†
|
4.1d
|
|||
|
10.1a
|
Third Amended and Restated Credit Agreement, dated as of January 7, 2011 (the “Credit Agreement”), among the Company, as lead borrower for itself and on behalf of certain of its subsidiaries, and Bank of America, N.A., as lead issuing bank, administrative agent and collateral agent, Wells Fargo Bank, National Association, as an issuing bank, Wells Fargo Capital Finance, LLC, as syndication agent, Bank of America, N.A. and JPMorgan Chase Bank, N.A., as co-documentation agents, and the other financial institutions party thereto, as lenders, as incorporated herein by reference to Exhibit 10.1 to the Company’s Form 8-K dated and filed January 7, 2011.
|
|||
|
10.1b
|
First Amendment to Third Amended and Restated Credit Agreement and Confidential Side Letter, dated February 17, 2011, by and among Brown Shoe Company, Inc., as lead borrower for itself and on behalf of certain of its subsidiaries, and Bank of America, N.A., as lead issuing bank, administrative agent and collateral agent, Wells Fargo Bank, National Association, as an issuing bank, Wells Fargo Capital Finance, LLC, as syndication agent, Bank of America, N.A. and JPMorgan Chase Bank, N.A., as co-documentation agents, and the other financial institutions party thereto, as lenders, as incorporated herein by reference to Exhibit 10.2 to the Company’s Form 8-K dated and filed February 17, 2011.
|
|||
|
10.2*
|
Summary of non-employee director compensation, incorporated herein by reference to Exhibit 10.2 to the Company’s Form 10-Q for the quarter ended May 1, 2010, and filed June 8, 2010.
|
|||
|
10.3*
|
Summary of compensatory arrangements for the named executive officers of the Company, incorporated herein by reference to Exhibit 10.1 to the Company’s Form 8-K dated March 4, 2009, and filed March 10, 2009, and Exhibit 10.2 to the Company’s Form 10-Q for the quarter ended July 31, 2010, and filed September 7, 2010.
|
|||
|
10.4a*
|
Incentive and Stock Compensation Plan of 1999, incorporated herein by reference to Exhibit 2 to the Company’s definitive proxy statement dated and filed April 26, 1999.
|
|||
| 10.4b* | Amendment to Incentive and Stock Compensation Plan of 1999, dated May 27, 1999, incorporated herein by reference to Exhibit 10(e)(i) to the Company’s Form 10-K for the year ended January 29, 2000, and filed April 19, 2000. | |||
| 10.4c* | First Amendment to the Incentive and Stock Compensation Plan of 1999, dated January 7, 2000, incorporated herein by reference to Exhibit 10(e)(ii) to the Company's Form 10-K for the year ended January 29, 2000 and filed April 19, 2000. | |||
| 10.5a* | Brown Shoe Company, Inc. Incentive and Stock Compensation Plan of 2002, as Amended and Restated as of May 22, 2008, incorporated herein by reference to Exhibit A to the Company’s definitive proxy statement dated and filed April 11, 2008. | |||
| 10.56(1)* | Form of Incentive Stock Option Award Agreement (for grants commencing May 2008) under the Brown Shoe Company, Inc. Incentive and Stock Compensation Plan of 2002, incorporated herein by reference to Exhibit 10.5b(1) to the Company’s Form 10-K for the year ended January 31, 2009, and filed March 31, 2009. | |||
| 10.5b(2)* | Form of Incentive Stock Option Award Agreement (for grants prior to May 2008) under the Brown Shoe Company, Inc. Incentive and Stock Compensation Plan of 2002, incorporated herein by reference to Exhibit 10.4 to the Company’s Form 10-Q for the quarter ended July 31, 2004, and filed September 8, 2004. | |||
| 10.5c(1)* | Form of Non-Qualified Stock Option Award Agreement (for grants commencing May 2008) under the Brown Shoe Company, Inc. Incentive and Stock Compensation Plan of 2002, incorporated herein by reference to Exhibit 10.5c(1) to the Company’s Form 10-K for the year ended January 31, 2009, and filed March 31, 2009. | |||
93
|
BROWN SHOE COMPANY, INC.
|
2010 FORM 10-K
|
|
10.5c(2)*
|
Form of Non-Qualified Stock Option Award Agreement for awards issued prior to May 2008 under the Brown Shoe Company, Inc. Incentive and Stock Compensation Plan of 2002, incorporated herein by reference to Exhibit 10.3 to the Company’s Form 10-Q for the quarter ended July 31, 2004, and filed September 8, 2004.
|
|
|
10.5d(1)*
|
Form of Restricted Stock Agreement (for employee grants commencing 2008) under the Brown Shoe Company, Inc. Incentive and Stock Compensation Plan of 2002, incorporated herein by reference to Exhibit 10.5d(1) to the Company’s Form 10-K for the year ended January 31, 2009, and filed March 31, 2009.
|
|
|
10.5d(2)*
|
Form of Restricted Stock Agreement (for employee grants in 2006 and 2007) under the Brown Shoe Company, Inc. Incentive and Stock Compensation Plan of 2002, incorporated herein by reference to Exhibit 10.6 to the Company’s Form 8-K dated and filed March 8, 2006.
|
|
|
10.5d(3)*
|
Form of Restricted Stock Agreement (for employee grants in 2002 through 2005) under the Brown Shoe Company, Inc. Incentive and Stock Compensation Plan of 2002, incorporated herein by reference to Exhibit 10.5 to the Company’s Form 10-Q for the quarter ended July 31, 2004, and filed September 8, 2004.
|
|
|
10.5e*
|
Form of Restricted Stock Award Agreement for non-employee director awards (for grants commencing May 2008) under the Brown Shoe Company, Inc. Incentive and Stock Compensation Plan of 2002, incorporated herein by reference to Exhibit 10.5e to the Company’s Form 10-K for the year ended January 31, 2009, and filed March 31, 2009.
|
|
|
10.5f(1)*
|
Form of Performance Unit Award Agreement (for 2008-2010 performance period) under the Brown Shoe Company, Inc. Incentive and Stock Compensation Plan of 2002, incorporated herein by reference to Exhibit 10.1 to the Company’s Form 10-Q for the quarter ended October 30, 2010, and filed December 7, 2010.
|
|
|
10.5f(2)*
|
Amendment to Performance Unit Award Agreement (for 2008-2010 performance period) under the Brown Shoe Company, Inc. Incentive and Stock Compensation Plan of 2002, incorporated herein by reference to Exhibit 10.4 to the Company’s Form 8-K dated March 4, 2009, and filed March 10, 2009.
|
|
|
10.5f(3)*
|
Form of Performance Award Agreement (for 2009-2011 performance period) under the Brown Shoe Company, Inc. Incentive and Stock Compensation Plan of 2002, incorporated herein by reference to Exhibit 10.2 to the Company’s Form 10-Q for the quarter ended October 30, 2010, and filed December 7, 2010.
|
|
|
10.5f(4)*
|
Form of Performance Award Agreement (for 2010-2012 performance period) under the Brown Shoe Company, Inc. Incentive and Stock Compensation Plan of 2002, incorporated herein by reference to Exhibit 10.3 to the Company’s Form 10-Q for the quarter ended October 30, 2010, and filed December 7, 2010.
|
|
|
10.5g(1)*
|
Form of Performance Share Award Agreement (for 2007-2009 performance period) under the Brown Shoe Company, Inc. Incentive and Stock Compensation Plan of 2002, incorporated herein by reference to Exhibit 10.5f to the Company’s Form 10-K for the year ended January 28, 2006, and filed April 10, 2006.
|
|
|
10.5g(2)*
|
Amendment to Performance Share Award Agreement (for 2007-2009 performance period) under the Brown Shoe Company, Inc. Incentive and Stock Compensation Plan of 2002, incorporated herein by reference to Exhibit 10.6 to the Company’s Form 8-K dated March 4, 2009, and filed March 10, 2009.
|
|
|
10.6a*
|
Form of Non-Employee Director Restricted Stock Unit Agreement between the Company and each of its Non-Employee Directors (for grants commencing in 2008), incorporated herein by reference to Exhibit 10.2 to the Company’s Form 10-Q for the quarter ended August 2, 2008, and filed September 10, 2008.
|
|
|
10.6b*
|
Form of Non-Employee Director Restricted Stock Unit Agreement between the Company and each of its Non-Employee Directors (for grants prior to 2008), incorporated herein by reference to Exhibit 10(u) to the Company’s Form 10-K for the year ended January 29, 2005, and filed April 1, 2005.
|
|
|
10.7*
|
Brown Shoe Company, Inc. Deferred Compensation Plan for Non-Employee Directors, as amended and restated as of January 1, 2009, incorporated herein by reference to Exhibit 10.2a to the Company’s Form 10-Q for the quarter ended November 1, 2008, and filed December 9, 2008.
|
|
|
10.8*
|
Brown Shoe Company, Inc. Supplemental Executive Retirement Plan (SERP), conformed and restated as of December 2, 2008, incorporated herein by reference to Exhibit 10.3 to the Company’s Form 10-Q for the quarter ended November 1, 2008, and filed December 9, 2008.
|
|
|
10.9*
|
Brown Shoe Company, Inc. Deferred Compensation Plan, incorporated herein by reference to Exhibit 4.1 to the Company’s Registration Statement on Form S-8 filed December 11, 2007.
|
|
|
10.10*
|
Brown Shoe Company, Inc. Non-Employee Director Share Plan (2009), incorporated herein by reference to Exhibit 10.1 to the Company’s Form 10-Q for the quarter ended November 1, 2008, and filed December 9, 2008.
|
|
|
10.11a*
|
Severance Agreement, effective April 1, 2006, between the Company and Ronald A. Fromm, incorporated herein by reference to Exhibit 10.1 to the Company’s Form 8-K dated and filed April 6, 2006.
|
|
|
10.11b*
|
Amendment letter dated December 18, 2009, to the Severance Agreement (April 1, 2006), between the Company and Ronald A. Fromm, as incorporated herein by reference to Exhibit 10.3 to the Company’s Form 10-Q for the quarter ended July 31, 2010, and filed September 7, 2010.
|
|
|
10.12*
|
Severance Agreement, effective April 1, 2006, between the Company and Richard M. Ausick, incorporated herein by reference to Exhibit 10.4 to the Company’s Form 10-Q for the quarter ended July 31, 2010, and filed September 7, 2010.
|
|
|
10.13*
|
Severance Agreement, effective April 1, 2006, between the Company and Diane M. Sullivan, incorporated herein by reference to Exhibit 10.5 to the Company’s Form 8-K dated and filed April 6, 2006.
|
|
|
10.14*
|
Severance Agreement, effective October 30, 2006, between the Company and Mark E. Hood, incorporated herein by reference to Exhibit 10.6 to the Company’s Form 8-K dated and filed October 30, 2006.
|
|
|
10.15*
|
Severance Agreement, effective April 1, 2009, between the Company and Mark D. Lardie, as incorporated herein by reference to Exhibit 10.5 to the Company’s Form 10-Q for the quarter ended July 31, 2010 and filed September 7, 2010.
|
|
|
10.16*
|
Form of Amendment letter dated December 18, 2009, to the Severance Agreements between the Company and each of: Richard M. Ausick, Mark E. Hood, Mark D. Lardie and Diane M. Sullivan, as incorporated herein by reference to Exhibit 10.6 to the Company’s Form 10-Q for the quarter ended July 31, 2010, and filed September 7, 2010.
|
94
|
BROWN SHOE COMPANY, INC.
|
2010 FORM 10-K
|
|
10.17*
|
Employment Agreement, dated January 7, 2011, between Ronald A. Fromm and the Company, as incorporated herein by reference to Exhibit 10.1 to the Company’s Form 8-K dated and filed January 10, 2011.
|
|
|
†
|
21
|
|
|
†
|
23
|
|
|
†
|
24
|
|
|
†
|
31.1
|
|
|
†
|
31.2
|
|
|
†
|
32.1
|
|
(b)
|
Exhibits:
|
|
See Item 15(a)(3) above. On request, copies of any exhibit will be furnished to shareholders upon payment of the Company’s reasonable expenses incurred in furnishing such exhibits.
|
|
|
(c)
|
Financial Statement Schedules:
|
|
See Item 8 above.
|
* Denotes management contract or compensatory plan arrangements.
† Denotes exhibit is filed with this Form 10-K.
95
|
BROWN SHOE COMPANY, INC.
|
2010 FORM 10-K
|
Pursuant to the requirements of Section 13 or 15(d) of the Securities Exchange Act of 1934, the registrant has duly caused this report to be signed on its behalf by the undersigned, thereunto duly authorized.
|
BROWN SHOE COMPANY, INC.
|
||
|
By:
|
/s/ Mark E. Hood
|
|
|
Mark E. Hood
|
||
|
Senior Vice President and Chief Financial Officer
|
||
Date: April 1, 2011
Know all men by these presents, that each person whose signature appears below constitutes and appoints Ronald A. Fromm, Mark E. Hood and Michael I. Oberlander his or her true and lawful attorney-in-fact and agent, with full power of substitution and resubstitution, for him or her and in his or her name, place and stead, in any and all capacities, to sign any and all amendments to this Annual Report on Form 10-K, and to file the same, with all exhibits thereto, and other documents in connection therewith, with the Securities and Exchange Commission, granting unto said attorney-in-fact and agent, full power and authority to do and perform each and every act and thing requisite and necessary to be done, as fully to all intents and purposes as he or she might or could do in person, hereby ratifying and confirming all that said attorney-in-fact and agent or his substitute or substitutes may lawfully do or cause to be done by virtue hereof.
Pursuant to the requirements of the Securities Exchange Act of 1934, this report has been signed below by the following persons on behalf of the registrant, on the dates and in the capacities indicated.
|
Signatures
|
Date
|
Title
|
||
|
/s/ Ronald A. Fromm
|
April 1, 2011
|
Chairman of the Board of Directors and Chief Executive Officer on behalf of the Company and as Principal Executive Officer
|
||
|
Ronald A. Fromm
|
||||
|
/s/ Mark E. Hood
|
April 1, 2011
|
Senior Vice President and Chief Financial Officer on behalf of the Company and as Principal Financial Officer and Principal Accounting Officer
|
||
|
Mark E. Hood
|
||||
|
/s/ Diane M. Sullivan
|
March 28, 2011
|
Director, President and Chief Operating Officer
|
||
|
Diane M. Sullivan
|
||||
|
/s/ Mario L. Baeza
|
March 31, 2011
|
Director
|
||
|
Mario L. Baeza
|
||||
|
/s/ Joseph L. Bower
|
March 29, 2011
|
Director
|
||
|
Joseph L. Bower
|
||||
|
/s/ Julie C. Esrey
|
March 21, 2011
|
Director
|
||
|
Julie C. Esrey
|
||||
|
/s/ Carla C. Hendra
|
March 22, 2011
|
Director
|
||
|
Carla C. Hendra
|
||||
|
/s/ Ward M. Klein
|
March 28, 2011
|
Director
|
||
|
Ward M. Klein
|
||||
|
/s/ Steven W. Korn
|
March 20, 2011
|
Director
|
||
|
Steven W. Korn
|
||||
|
/s/ Patricia G. McGinnis
|
March 29, 2011
|
Director
|
||
|
Patricia G. McGinnis
|
||||
|
/s/ W. Patrick McGinnis
|
March 21, 2011
|
Director
|
||
|
W. Patrick McGinnis
|
||||
|
/s/ Michael F. Neidorff
|
March 28, 2011
|
Director
|
||
|
Michael F. Neidorff
|
||||
|
/s/ Hal J. Upbin
|
March 24, 2011
|
Director
|
||
|
Hal J. Upbin
|
||||
|
/s/ Harold B. Wright
|
March 21, 2011
|
Director
|
||
|
Harold B. Wright
|
96