Attached files
| file | filename |
|---|---|
| EX-32.2 - EXHIBIT 32.2 - SUFFOLK BANCORP | ex32_2.htm |
| EX-32.1 - EXHIBIT 32.1 - SUFFOLK BANCORP | ex32_1.htm |
| EX-31.2 - EXHIBIT 31.2 - SUFFOLK BANCORP | ex31_2.htm |
| EX-31.1 - EXHIBIT 31.1 - SUFFOLK BANCORP | ex31_1.htm |
| EX-23.1 - EXHIBIT 23.1 - SUFFOLK BANCORP | ex23_1.htm |
UNITED STATES SECURITIES AND EXCHANGE COMMISSION
WASHINGTON, D.C. 20549
FORM 10-K
☒ ANNUAL REPORT PURSUANT TO SECTION 13 OR 15(D) OF THE SECURITIES EXCHANGE ACT OF 1934
For the fiscal year ended December 31, 2016
OR
☐ TRANSITION REPORT PURSUANT TO SECTION 13 OR 15(D) OF THE SECURITIES EXCHANGE ACT OF 1934
FOR THE TRANSITION PERIOD FROM _______ TO ______
Commission File Number: 001-37658
SUFFOLK BANCORP
(Exact name of registrant as specified in its charter)
|
New York
|
11-2708279
|
|
|
(State or Other Jurisdiction of Incorporation or Organization)
|
(I.R.S. Employer Identification No.)
|
|
4 West Second Street, P.O. Box 9000, Riverhead, NY
|
11901
|
|
|
(Address of Principal Executive Offices)
|
(Zip Code)
|
Registrant’s Telephone Number, Including Area Code: (631) 208-2400
Securities registered pursuant to Section 12(b) of the Act:
|
Title of each class
|
Name of each exchange on which registered
|
|
|
Common Stock, par value $2.50 per share
|
New York Stock Exchange
|
Securities registered pursuant to Section 12(g) of the Act: None
Indicate by check mark if the Registrant is a well-known seasoned issuer, as defined in Rule 405 of the Securities Act. YES ☐ NO ☒
Indicate by check mark if the Registrant is not required to file reports pursuant to Section 13 or 15(d) of the Act. YES ☐ NO ☒
Indicate by check mark whether the Registrant (1) has filed all reports required to be filed by Section 13 or 15(d) of the Securities Exchange Act of 1934 during the preceding 12 months (or for such shorter period that the Registrant was required to file such reports), and (2) has been subject to such filing requirements for the past 90 days. YES ☒ NO ☐
Indicate by check mark whether the registrant has submitted electronically and posted on its corporate Web site, if any, every Interactive Data File required to be submitted and posted pursuant to Rule 405 of Regulation S-T (§ 232.405 of this chapter) during the preceding 12 months (or for such shorter period that the registrant was required to submit and post such files) YES ☒ NO ☐
Indicate by check mark if disclosure of delinquent filers pursuant to Item 405 of Regulation S-K (§ 229.405 of this chapter) is not contained herein and will not be contained, to the best of Registrant’s knowledge, in definitive proxy or information statements incorporated by reference in Part III of this Form 10-K or any amendment to this Form 10-K. ☒
Indicate by check mark whether the Registrant is a large accelerated filer, an accelerated filer, a non-accelerated filer or a smaller reporting company. See the definitions of “large accelerated filer,” “accelerated filer” and “smaller reporting company” in Rule 12b-2 of the Exchange Act.
Large accelerated filer ☐ Accelerated filer ☒ Non-accelerated filer ☐ Smaller reporting company ☐
Indicate by check mark whether the Registrant is a shell company (as defined in Rule 12b-2 of the Act). YES ☐ NO ☒
The aggregate market value of the common equity held by non-affiliates of the Registrant as of the last business day of the Registrant’s most recently completed second fiscal quarter was $359 million.
As of February 10, 2017, there were 11,943,789 shares of Registrant’s Common Stock outstanding.
SUFFOLK BANCORP
Annual Report on Form 10-K
For the Year Ended December 31, 2016
|
Page
|
||
|
PART I
|
||
|
Item 1.
|
3
|
|
|
Item 1A.
|
7
|
|
|
Item 1B.
|
13
|
|
|
Item 2.
|
14
|
|
|
Item 3.
|
14
|
|
|
Item 4.
|
14
|
|
|
PART II
|
||
|
Item 5.
|
14
|
|
|
Item 6.
|
17
|
|
|
Item 7.
|
18
|
|
|
Item 7A.
|
34
|
|
|
Item 8.
|
37
|
|
|
Item 9.
|
76
|
|
|
Item 9A.
|
76
|
|
|
Item 9B.
|
78
|
|
|
PART III
|
||
|
Item 10.
|
78
|
|
|
Item 11.
|
81
|
|
|
Item 12.
|
99
|
|
|
Item 13.
|
100
|
|
|
Item 14.
|
101
|
|
|
PART IV
|
||
|
Item 15.
|
103
|
|
| Item 16. | Form 10-K Summary | 103 |
|
104
|
PART I
Suffolk Bancorp (the “Company”) was incorporated in 1985 as a bank holding company. The Company currently owns all of the outstanding capital stock of Suffolk County National Bank (the “Bank”). The Bank was organized under the national banking laws of the United States in 1890. The Bank is a member of the Federal Reserve System and its deposits are insured by the Federal Deposit Insurance Corporation (“FDIC”) to the extent provided by law. The income of the Company is primarily derived through the operations of the Bank and its subsidiaries, consisting of the real estate investment trust (“REIT”) Suffolk Greenway, Inc., an insurance agency and two corporations used to acquire foreclosed real estate. The insurance agency and the two corporations used to acquire foreclosed real estate are immaterial to the Company’s operations. The Company had 296 full-time equivalent employees as of December 31, 2016.
On June 26, 2016, the Company entered into an Agreement and Plan of Merger (the “merger agreement”) with People’s United Financial, Inc. (“People’s United”) pursuant to which the Company will merge into People’s United (the “merger”). People’s United will be the surviving corporation in the merger. Subject to the terms and conditions of the merger agreement, the Company’s shareholders will have the right to receive 2.225 shares of People’s United common stock in exchange for each share of Company common stock. The merger agreement was adopted by the Company’s shareholders, and both the Office of the Comptroller of the Currency (the “OCC”) and the Board of Governors of the Federal Reserve System (the “Federal Reserve Board”) have approved the merger. The merger remains subject to other customary conditions to closing.
The Bank is a full-service bank serving the needs of its local residents through 27 branch offices in Nassau, Suffolk and Queens Counties, New York and loan production offices in Garden City, Melville and Long Island City. The Bank offers a full line of domestic commercial and retail banking services. The Bank makes commercial real estate floating and fixed rate loans, multifamily and mixed use commercial loans primarily in the boroughs of New York City, commercial and industrial loans to manufacturers, wholesalers, distributors, developers/contractors and retailers and agricultural loans. The Bank also makes loans secured by residential mortgages, and both floating and fixed rate second mortgage loans with a variety of plans for repayment. Real estate construction loans are also offered.
One of the largest community banks headquartered on Long Island, the Company serves clients in its traditional markets on the east end of Long Island, western Suffolk County and in its newer markets of Nassau County and New York City. The Company considers its business to be highly competitive in its market area with numerous competitors for its core niche of small business and middle market clients, as well as retail clients ancillary to these commercial relationships. The Company competes with local, regional and national depository financial institutions, including commercial banks, savings banks, insurance companies, credit unions and money market funds, and other businesses with respect to its lending services and in attracting deposits. Although the New York metropolitan area has a high density of financial institutions, a number of which are significantly larger than the Company, the core deposit franchise the Company has built over its more than 125 years of doing business by focusing its deposit gathering efforts on low cost deposits is unique in the local marketplace and gives it a significant competitive advantage on cost of funds. In addition to serving the banking needs of the communities in its market area, the Company is also known, along with its employees, for its active community involvement.
At December 31, 2016, the Company, on a consolidated basis, had total assets of approximately $2.1 billion, total deposits of approximately $1.8 billion and stockholders’ equity of approximately $215 million.
Unless the context otherwise requires, references herein to the Company include the Company and the Bank on a consolidated basis.
Business Segment Reporting
The Bank is a community bank, which offers a wide array of products and services to its customers. Pursuant to its banking strategy, emphasis is placed on building relationships with its customers and operations are managed and financial performance is evaluated on a Company-wide basis. As a result, the Company, the only reportable segment, is not organized around discernible lines of business and prefers to work as an integrated unit to customize solutions for its customers, with business line emphasis and product offerings changing over time as needs and demands change.
Available Information
The Company files Annual Reports on Form 10-K, Quarterly Reports on Form 10-Q, Current Reports on Form 8-K, Proxy Statements on Schedule 14A, and any amendments to those reports, with the United States Securities and Exchange Commission (“SEC”). The public may read and copy any of these materials at the SEC’s Public Reference Room at 100 F Street, NE, Washington, D.C. 20549. Information on the operation of the Public Reference Room can be obtained by calling the SEC at 1-800-SEC-0330 (1-800-732-0330). The SEC also maintains an Internet site (www.sec.gov) that contains reports, proxy and information statements, and other information regarding issuers, including the Company, that file electronically with the SEC. The Company also makes these reports available free of charge through its Internet website (www.scnb.com) as soon as practicably possible after the Company files these reports electronically with the SEC. Information on the Company’s website is not incorporated by reference into this Form 10-K.
Supervision and Regulation
References in this section to applicable statutes and regulations are brief summaries only and do not purport to be complete. It is suggested that the reader review such statutes and regulations in their entirety for a full understanding.
As a consequence of the extensive regulation of commercial banking activities in the United States, the business of the Company and the Bank is particularly susceptible to federal and state legislation that may affect the cost of doing business, modifying permissible activities or enhancing the competitive position of other financial institutions.
The Dodd-Frank Wall Street Reform and Consumer Protection Act (“Dodd-Frank Act”) signed into law in 2011 makes extensive changes to the laws regulating financial services firms. The Dodd-Frank Act also requires significant rulemaking and mandates multiple studies which could result in additional legislative or regulatory action. Under the Dodd-Frank Act, federal banking regulatory agencies are required to draft and implement enhanced supervision, examination and capital standards for depository institutions and their holding companies. The enhanced requirements include, among other things, changes to capital, leverage and liquidity standards and numerous other requirements. The Dodd-Frank Act authorizes various new assessments and fees, expands supervision and oversight authority over non-bank subsidiaries, increases the standards for certain covered transactions with affiliates and requires the establishment of minimum leverage and risk-based capital requirements for insured depository institutions. The Dodd-Frank Act also established a new federal Consumer Financial Protection Bureau with broad authority and permits states to adopt stricter consumer protection laws and enforce consumer protection rules issued by the Consumer Financial Protection Bureau. Due to the passage of the Dodd-Frank Act, the standard deposit insurance amount is $250 thousand per depositor per insured bank for each account ownership category. In addition, the FDIC assessment is now based on the Bank’s total average assets less tier 1 capital, instead of deposits, and is computed at lower rates. Following the 2016 U.S. elections, it is possible that the new administration may seek to revise or repeal certain regulations adopted pursuant to the Dodd-Frank Act, although the extent of any such change remains uncertain.
Bank Holding Company Regulation
The Company is a bank holding company registered under the Bank Holding Company Act (“BHC Act”) and is subject to supervision and regulation by the Federal Reserve Board. Federal laws subject bank holding companies to particular restrictions on the types of activities in which they may engage and to a range of supervisory requirements and activities, including regulatory enforcement actions, for violation of laws and policies.
Activities Closely Related to Banking
The BHC Act prohibits a bank holding company, with certain limited exceptions, from acquiring direct or indirect ownership or control of any voting shares of any company that is not a bank or from engaging in any activities other than those of banking, managing or controlling banks and certain other subsidiaries or furnishing services to or performing services for its subsidiaries. Bank holding companies also may engage in or acquire interests in companies that engage in a limited set of activities that are closely related to banking or managing or controlling banks. If a bank holding company has become a financial holding company (an “FHC”), it may engage in a broader set of activities, including insurance underwriting and broker-dealer services as well as activities that are jointly determined by the Federal Reserve Board and the Treasury Department to be financial in nature or incidental to such financial activity. FHCs may also engage in activities that are determined by the Federal Reserve to be complementary to financial activities. The Company has not elected to be an FHC at this time but may make such an election at any time so long as the statutory criteria are satisfied. In order to become an FHC, the bank holding company and all subsidiary depository institutions must be well managed and well capitalized. Additionally, all subsidiary depository institutions must have received at least a “satisfactory” rating on its most recent Community Reinvestment Act (“CRA”) examination. At December 31, 2016, the Bank’s CRA rating was “outstanding.”
Safe and Sound Banking Practices
Bank holding companies are not permitted to engage in unsafe and unsound banking practices. The Federal Reserve Board may order a bank holding company to terminate an activity or control of a nonbank subsidiary if such activity or control constitutes a significant risk to the financial safety, soundness or stability of a subsidiary bank and is inconsistent with sound banking principles. Regulation Y also requires a holding company to give the Federal Reserve Board prior notice of any redemption or repurchase of its own equity securities if the consideration to be paid, together with the consideration paid for any repurchases or redemptions in the preceding year, is equal to 10% or more of the company’s consolidated net worth.
The Federal Reserve Board has broad authority to prohibit activities of bank holding companies and their non-banking subsidiaries which represent unsafe and unsound banking practices or which constitute violations of laws or regulations. Notably, the Financial Institutions Reform, Recovery and Enforcement Act of 1989 (“FIRREA”) provides that the Federal Reserve Board can assess civil money penalties for such practices or violations which can be as high as $1 million per day. FIRREA contains expansive provisions regarding the scope of individuals and entities against which such penalties may be assessed.
Annual Reporting and Examinations
The Company is required to file an annual report with the Federal Reserve Board and such additional information as the Federal Reserve Board may require pursuant to the BHC Act. The Federal Reserve Board may examine a bank holding company or any of its subsidiaries and charge the company for the cost of such an examination. The Company is also subject to reporting and disclosure requirements under state and federal securities laws.
Rules on Regulatory Capital
Regulatory capital rules, released in July 2013, implement higher minimum capital requirements for bank holding companies and banks. The rules include a common equity tier 1 capital requirement and establish criteria that instruments must meet in order to be considered common equity tier 1 capital, additional tier 1 capital or tier 2 capital. These enhancements are expected to both improve the quality and increase the quantity of capital required to be held by banking organizations, better equipping the U.S. banking system to deal with adverse economic conditions. The capital rules require banks and bank holding companies to maintain a minimum common equity tier 1 capital ratio of 4.5%, a tier 1 capital ratio of 6%, a total capital ratio of 8% and a leverage ratio of 4%. Bank holding companies are also required to hold a capital conservation buffer of common equity tier 1 capital of 2.5% to avoid limitations on capital distributions and executive compensation payments. The capital rules also require banks to maintain a common equity tier 1 capital ratio of 6.5%, a tier 1 capital ratio of 8%, a total capital ratio of 10% and a leverage ratio of 5% to be deemed “well capitalized” for purposes of certain rules and prompt corrective action requirements.
The rules attempt to improve the quality of capital by implementing changes to the definition of capital. Among the most important changes are stricter eligibility criteria for regulatory capital instruments that would disallow the inclusion of instruments, such as trust preferred securities, in tier 1 capital going forward and constraints on the inclusion of minority interests, mortgage-servicing assets, deferred tax assets and certain investments in the capital of unconsolidated financial institutions. In addition, the rules require that most regulatory capital deductions be made from common equity tier 1 capital.
Under the rules, in order to avoid limitations on capital distributions, including dividend payments and certain discretionary bonus payments to executive officers, a banking organization must hold a capital conservation buffer composed of common equity tier 1 capital above its minimum risk-based capital requirements. This buffer will help to ensure that banking organizations conserve capital when it is most needed, allowing them to better weather periods of economic stress. The buffer is measured relative to risk-weighted assets.
Community banks, such as the Bank, began transitioning to these rules on January 1, 2015. The new minimum capital requirements were effective on January 1, 2015, whereas the capital conservation buffer and the deductions from common equity tier 1 capital phase in over time. Phase-in of the capital conservation buffer requirements was effective January 1, 2016. The Company’s and the Bank’s capital buffers are in excess of both the current and fully phased-in requirements.
The Federal Reserve Board may also set higher capital requirements for holding companies whose circumstances warrant it. For example, holding companies experiencing internal growth or making acquisitions are expected to maintain strong capital positions substantially above the minimum supervisory levels, without significant reliance on intangible assets. At this time, the bank regulatory agencies are more inclined to impose higher capital requirements in order to meet well capitalized standards and future regulatory changes could impose higher capital standards as a routine matter. The Company’s regulatory capital ratios and those of the Bank are in excess of the levels established for “well capitalized” institutions.
Imposition of Liability for Undercapitalized Subsidiaries
The Federal Deposit Insurance Corporation Improvement Act of 1991 (“FDICIA”) required each federal banking agency to revise its risk-based capital standards to ensure that those standards take adequate account of interest rate risk, concentration of credit risk and the risks of nontraditional activities, as well as reflect the actual performance and expected risk of loss on multifamily mortgages. In accordance with the law, each federal banking agency has specified, by regulation, the levels at which an insured institution would be considered well capitalized, adequately capitalized, undercapitalized, significantly undercapitalized and critically undercapitalized. As of December 31, 2016, the Bank exceeded the capital levels required in order to be deemed well capitalized.
By statute and regulation a bank holding company must serve as a source of financial and managerial strength to each bank that it controls and, under appropriate circumstances, may be required to commit resources to support each such controlled bank. This support may be required at times when the bank holding company may not have the resources to provide the support.
Under the prompt corrective action provisions of FDICIA, if a controlled bank is undercapitalized, then the regulators could require the bank holding company to guarantee the bank’s capital restoration plan. In addition, if the Federal Reserve Board believes that a bank holding company’s activities, assets or affiliates represent a significant risk to the financial safety, soundness or stability of a controlled bank, then the Federal Reserve Board could require the bank holding company to terminate the activities, liquidate the assets or divest the affiliates. The regulators may require these and other actions in support of controlled banks even if such actions are not in the best interests of the bank holding company or its stockholders.
The appropriate federal banking agency may also require a holding company to provide financial assistance to a bank with impaired capital. Under this requirement, in the future the Company could be required to provide financial assistance to the Bank should it experience financial distress. Based on our ownership of a national bank subsidiary, the OCC could assess us if the capital of the Bank were to become impaired. If we failed to pay the assessment within three months, the OCC could order the sale of our stock in the Bank to cover the deficiency.
Additionally, FDICIA requires bank regulators to take prompt corrective action to resolve problems associated with insured depository institutions. In the event an institution becomes undercapitalized, it must submit a capital restoration plan. If an institution becomes significantly undercapitalized or critically undercapitalized, additional and significant limitations are placed on the institution. The capital restoration plan of an undercapitalized institution will not be accepted by the regulators unless each company having control of the undercapitalized institution guarantees the subsidiary’s compliance with the capital restoration plan until it becomes adequately capitalized. The Company has control of the Bank for the purpose of this statute.
Acquisitions by Bank Holding Companies
The BHC Act requires every bank holding company to obtain the prior approval of the Federal Reserve Board before it may acquire all or substantially all of the assets of any bank or ownership or control of any voting shares of any bank if after such acquisition it would own or control, directly or indirectly, more than 5% of the voting shares of such bank. In approving bank acquisitions by bank holding companies, the Federal Reserve Board is required to consider the financial and managerial resources and future prospects of the bank holding company and banks concerned, the convenience and needs of the communities to be served and the effect on competition. The Attorney General of the United States may, within 30 days after approval of an acquisition by the Federal Reserve Board, bring an action challenging such acquisition under the federal antitrust laws, in which case the effectiveness of such approval is stayed pending a final ruling by the courts. Under certain circumstances, the 30-day period may be shortened to 15 days.
Interstate Acquisitions
Under the Riegle-Neal Interstate Banking and Branching Efficiency Act (“Riegle-Neal Act”), a bank holding company may acquire banks in states other than its home state, subject to any state requirement that the bank has been organized and operating for a minimum period of time, not to exceed five years, and the requirement that the bank holding company not control, prior to or following the proposed acquisition, more than 10% of the total amount of deposits of insured depository institutions nationwide or, unless the acquisition is the bank holding company’s initial entry into the state, more than 30% of such deposits in the state (or such lesser or greater amount set by the state). The Riegle-Neal Act also authorizes banks to merge across state lines, thereby creating interstate branches. The Dodd-Frank Act permits a national or state bank, with the approval of its regulator, to open a branch in any state if the law of the state in which the branch is located would permit the establishment of the branch if the bank were a bank chartered in that state. National banks may provide trust services in any state to the same extent as a trust company chartered by that state.
Bank Regulation
The Bank is a national bank, which is subject to regulation and supervision primarily by the OCC and secondarily by the Federal Reserve Board and the FDIC. The Bank is subject to requirements and restrictions under federal law, including requirements to maintain reserves against deposits, restrictions on the types and amounts of loans that may be granted and the interest that may be charged thereon and limitations on the types of investments that may be made and the types of services that may be offered. Various consumer laws and regulations also affect the operations of the Bank.
The OCC regularly examines the Bank and records of the Bank. The FDIC may also periodically examine and evaluate insured banks.
Standards for Safety and Soundness
As part of FDICIA’s efforts to promote the safety and soundness of depository institutions and their holding companies, appropriate federal banking regulators are required to have in place regulations specifying operational and management standards (addressing internal controls, loan documentation, credit underwriting and interest rate risk), asset quality and earnings. As discussed above, the Federal Reserve Board, the OCC, and the FDIC have extensive authority to police unsafe or unsound practices and violations of applicable laws and regulations by depository institutions and their holding companies. For example, the FDIC may terminate the deposit insurance of any institution that it determines has engaged in an unsafe or unsound practice. The agencies can also assess civil money penalties of up to $1 million per day, issue cease-and-desist or removal orders, seek injunctions and publicly disclose such actions.
Restrictions on Transactions with Affiliates
Section 23A of the Federal Reserve Act imposes quantitative and qualitative limits on transactions between a bank and any affiliate and requires certain levels of collateral for such loans. It also limits the amount of advances to third parties which are collateralized by the securities or obligations of the Company. Section 23B of the Federal Reserve Act requires that certain transactions between the Bank and its affiliates must be on terms substantially the same, or at least as favorable, as those prevailing at the time for comparable transactions with or involving other nonaffiliated companies. In the absence of such comparable transactions, any transaction between the Bank and its affiliates must be on terms and under circumstances, including credit standards, which in good faith would be offered to or would apply to nonaffiliated companies.
Governmental Monetary Policies and Economic Conditions
The principal sources of funds essential to the business of banks and bank holding companies are deposits, stockholders’ equity and borrowed funds. The availability of these various sources of funds and other potential sources, such as preferred stock or commercial paper, and the extent to which they are utilized depends on many factors, the most important of which are the Federal Reserve Board’s monetary policies and the relative costs of different types of funds. An important function of the Federal Reserve Board is to regulate the national supply of bank credit in order to combat recession and curb inflationary pressure. Among the instruments of monetary policy used by the Federal Reserve Board to implement these objectives are open market operations in United States government securities, changes in the discount rate on bank borrowings and changes in reserve requirements against bank deposits. The monetary policies of the Federal Reserve Board have had a significant effect on the operating results of commercial banks in the past and are expected to continue to do so in the future. In view of the recent changes in regulations affecting commercial banks and other actions and proposed actions by the federal government and its monetary and fiscal authorities, no prediction can be made as to future changes in interest rates, availability of credit, deposit balances or the overall performance of banks generally or the Company and the Bank in particular.
Because the market price of People’s United common stock will fluctuate, the Company’s shareholders cannot be certain of the market value of the merger consideration they will receive.
Upon completion of the merger, each outstanding share of Company common stock (except for certain shares specified in the merger agreement) will be converted into the right to receive 2.225 shares of People’s United common stock. The market value of the People’s United common stock to be issued in the merger will depend upon the market price of People’s United common stock. This market price may vary from the closing price of People’s United common stock on the date the merger was announced, on the date that the proxy statement/prospectus relating to the merger was mailed to the Company’s shareholders and on the date on which Company shareholders voted to adopt the merger agreement at a special meeting of shareholders. There will be no adjustment to the consideration paid to Company shareholders in the merger for changes in the market price of either shares of People’s United common stock or Company common stock.
The market price of People’s United common stock could be subject to significant fluctuations due to changes in sentiment in the market regarding People’s United’s operations or business prospects, including market sentiment regarding People’s United’s entry into the merger agreement. These risks may be affected by:
| · |
operating results that vary from the expectations of People’s United’s management or of securities analysts and investors;
|
| · |
developments in People’s United’s business or in the financial services sector generally;
|
| · |
regulatory or legislative changes affecting People’s United’s industry generally or its business and operations;
|
| · |
operating and securities price performance of companies that investors consider to be comparable to People’s United;
|
| · |
changes in estimates or recommendations by securities analysts or rating agencies;
|
| · |
announcements of strategic developments, acquisitions, dispositions, financings and other material events by People’s United or its competitors; and
|
| · |
changes in global financial markets and economies and general market conditions, such as interest or foreign exchange rates, stock, commodity, credit or asset valuations or volatility.
|
Accordingly, at the time Company shareholders decided to adopt the merger agreement at the special meeting, they did not necessarily know or were not able to calculate the value of the merger consideration they would be entitled to receive upon completion of the merger. Company shareholders are encouraged to obtain current market quotations for both People’s United common stock and Company common stock.
The merger agreement may be terminated in accordance with its terms, and the merger may not be completed.
The merger agreement is subject to a number of conditions that must be fulfilled in order to complete the merger. These conditions to the closing of the merger may not be fulfilled in a timely manner or at all, and, accordingly, the merger may be delayed or may not be completed. In addition, if the merger is not completed by June 26, 2017, either People’s United or the Company may choose not to proceed with the merger, and the parties may mutually decide to terminate the merger agreement at any time. In addition, People’s United and the Company may elect to terminate the merger agreement in certain other circumstances and the Company may be required to pay a termination fee.
Failure to complete the merger could negatively impact the stock price, future business and financial results of the Company.
If the merger is not completed, the ongoing business of the Company may be adversely affected, and the Company will be subject to several risks, including the following:
| · |
the Company may be required, under certain circumstances, to pay People’s United a termination fee of $16 million under the merger agreement;
|
| · |
the Company will be required to pay certain costs relating to the merger, whether or not the merger is completed, such as legal, accounting, financial advisor and printing fees;
|
| · |
under the merger agreement, the Company is subject to certain restrictions on the conduct of its business prior to completing the merger, which may adversely affect its ability to execute certain of its business strategies; and
|
| · |
matters relating to the merger may require substantial commitments of time and resources by Company management, which could otherwise have been devoted to other opportunities that may have been beneficial to the Company.
|
In addition, if the merger is not completed, the Company may experience negative reactions from the financial markets and from its customers and employees. For example, the Company’s business may be impacted adversely by the failure to pursue other beneficial opportunities due to the focus of management on the merger, without realizing any of the anticipated benefits of completing the merger. The market price of Company common stock could decline to the extent that the current market price reflects a market assumption that the merger will be completed. The Company also could be subject to litigation related to any failure to complete the merger or to proceedings commenced against the Company to perform its obligations under the merger agreement. If the merger is not completed, the Company cannot assure its shareholders that the risks described above will not materialize and will not materially affect the business, financial results and stock price of the Company.
Lawsuits challenging the merger have been filed against the Company, the Company’s board of directors and People’s United, and an adverse judgment in any such lawsuit or any future similar lawsuits could prevent or delay completion of the merger and result in substantial costs to the Company, including any costs associated with the indemnification of directors and officers.
The Company, its board of directors and People’s United are named as defendants in two purported class action lawsuits in the Supreme Court of the State of New York, Suffolk County, and one purported class action lawsuit in the federal district court for the Eastern District of New York, challenging the merger and seeking, among other things, to enjoin the defendants from completing the merger on the agreed-upon terms, and rescission of the merger and/or awarding of damages to the extent the merger is completed. The parties to these actions have entered into a memorandum of understanding regarding a settlement—which, if finally approved by the court, would resolve and release all claims that were brought or could have been brought in these actions—although there can be no assurance that the court will approve such settlement. In addition, additional plaintiffs may also file lawsuits against the Company or People’s United and/or their directors and officers in connection with the merger. The outcome of any such litigation is uncertain. If the cases are not resolved, these lawsuits could prevent or delay completion of the merger and result in substantial costs to the Company, including any costs associated with the indemnification of directors and officers.
One of the conditions to the closing of the merger is that no order, injunction or decree issued by any court or agency of competent jurisdiction or other legal restraint or prohibition that prevents the consummation of the merger or any of the other transactions contemplated by the merger agreement be in effect. If any plaintiff were successful in obtaining an injunction prohibiting the Company or People’s United from completing the merger on the agreed upon terms, then such injunction may prevent the merger from becoming effective or from becoming effective within the expected timeframe.
The Company will be subject to business uncertainties and contractual restrictions while the merger is pending.
Uncertainty about the effect of the merger on employees and customers may have an adverse effect on the Company. These uncertainties may impair the Company’s ability to attract, retain and motivate key personnel until the merger is completed and could cause customers and others that deal with the Company to seek to change existing business relationships with the Company. Retention of certain employees may be challenging while the merger is pending, as certain employees may experience uncertainty about their future roles with the combined company. If key employees depart because of issues relating to the uncertainty and difficulty of integration or a desire not to remain with the combined company, the Company’s business could be harmed. In addition, the merger agreement restricts the Company from making certain acquisitions and taking other specified actions until the merger occurs without the consent of People’s United. These restrictions may prevent the Company from pursuing attractive business opportunities that may arise prior to the completion of the merger.
If the merger is not completed, the Company will have incurred substantial expenses without realizing the expected benefits of the merger.
The Company has incurred and will incur substantial expenses in connection with the negotiation and completion of the transactions contemplated by the merger agreement. If the merger is not completed, the Company would have to recognize these expenses without realizing the expected benefits of the merger.
The Company’s results may be adversely affected if it suffers higher than expected losses on its loans or is required to increase its allowance for loan losses.
The Company assumes credit risk from the possibility that it will suffer losses because borrowers, guarantors and related parties fail to perform under the terms of their loans. Management tries to minimize and monitor this risk by adopting and implementing what management believes are effective underwriting and credit policies and procedures, including how the Company establishes and reviews the allowance for loan losses. The allowance for loan losses is determined by continuous analysis of the loan portfolio and the analytical process is regularly reviewed and adjustments may be made based on the assessments of internal and external influences on credit quality. Those policies and procedures may still not prevent unexpected losses that could adversely affect the Company’s results. Weak economic conditions could adversely impact the ability of borrowers to repay outstanding loans or the value of collateral securing those loans. In particular, earlier this year the Company saw worrisome signs of certain commercial real estate markets becoming overheated, and a decline in property values could materially and adversely affect the value of the collateral securing the Company’s commercial real estate loans. In addition, deterioration in economic conditions affecting borrowers, new information regarding existing loans, identification of additional problem loans, changes in regulation and regulatory interpretation and other factors, both within and outside of the Company’s control, may require an increase in the allowance for loan losses.
The Company operates in a highly regulated environment and its operations and income may be affected adversely by changes in laws and regulations governing its operations. The Company may be unable to satisfy the individual minimum capital requirements imposed by the OCC, and lack of compliance may result in regulatory enforcement actions and adversely impact the Company’s business, financial condition or results of operations.
The Company is subject to extensive regulation and supervision by the Federal Reserve Board, the OCC and the FDIC. Such regulators govern the activities in which the Company may engage. These regulatory authorities have extensive discretion in connection with their supervisory and enforcement activities, including the ability to impose restrictions on a bank’s operations, limit growth rates, reclassify assets, determine the adequacy of a bank’s allowance for loan losses and determine the level of deposit insurance premiums assessed. Any change in such regulation and oversight, whether in the form of regulatory policy, new regulations or legislation or additional deposit insurance premiums could materially and adversely impact on the Company’s business, financial condition or results of operations. Any new laws, rules and regulations could also make compliance more difficult or expensive or otherwise materially and adversely affect the Company’s business, financial condition or results of operations. Such changes could subject the Company to additional costs, limit the types of financial services and products the Company may offer and/or increase the ability of non-banks to offer competing financial services and products, among other things.
As a result of its commercial real estate concentrations, the OCC established individual minimum capital ratios for the Bank that require it to maintain a tier 1 leverage ratio of at least 9%, a tier 1 risk-based capital ratio of at least 11% and a total risk-based capital ratio of at least 12%. There is no guarantee that the Bank will be able to maintain compliance with these heightened capital ratios. Any failure by the Bank to comply with these individual minimum capital ratios (including as a result of increases to the Bank’s allowance for loan losses), may result in regulatory enforcement actions and adversely impact the Company’s business, financial condition or results of operations.
The Company’s loan portfolio has a high concentration of commercial real estate loans (inclusive of multifamily and mixed use commercial loans), and its business may be adversely affected by credit risk associated with commercial real estate and a decline in property values. The Company’s limitation on the growth of its commercial real estate loan portfolio due to the Company’s concentrated position in such assets could materially and adversely affect the Company’s ability to generate interest income and the Company’s business, financial condition and results of operations.
At December 31, 2016, $1.2 billion, or 72% of the Company’s total gross loan portfolio, was comprised of commercial real estate (inclusive of multifamily and mixed use commercial loans). This type of lending is generally sensitive to regional and local economic conditions. Unlike larger national or regional banks that serve a broader and more diverse geographic region, the Company’s business depends significantly on general economic conditions in the New York metropolitan and Long Island markets, where the majority of the properties securing the multifamily and commercial real estate loans the Company originates, and the businesses of the customers to whom the Company makes its C&I loans, are located. Accordingly, the ability of borrowers to repay their loans, and the value of the collateral securing such loans, may be significantly affected by economic conditions in this region, including changes in the local real estate market, making loan loss levels difficult to predict and increasing the risk that the Company would incur material losses if borrowers default on their loans. A decline in general economic conditions could therefore have an adverse effect on the Company’s business, financial condition and results of operations. In addition, because multifamily and CRE loans represent the large majority of the Company’s loan portfolio, a decline in tenant occupancy or rents could adversely impact the ability of borrowers to repay their loans on a timely basis, which could have a negative impact on the Company’s net income, as well as the Company’s ability to maintain or increase the level of cash dividends it currently pays to its stockholders. While the Company seeks to minimize these risks through its underwriting policies, which generally require that such loans be qualified on the basis of the collateral property’s cash flows, appraised value and debt service coverage ratio, among other factors, there can be no assurance that the Company’s underwriting policies will protect it from credit-related losses or delinquencies.
Furthermore, during 2016, the Company became increasingly concerned with conditions in many of its local CRE markets, particularly those in the boroughs of New York City. The Company saw worrisome signs of markets that were becoming overheated. As a result of these concerns, the Company stopped accepting new applications for multifamily loans in the boroughs of New York City during the first quarter of 2016. The CRE lending market is also an area which has attracted significant regulatory scrutiny. The OCC, the Company’s primary bank regulator, has publicly expressed broadly applicable concerns over the last year about overheated conditions in many CRE markets. The OCC established individual minimum capital ratios for the Bank as a result of its concentration of CRE loans. In response, the Company decided to temporarily pull back from the CRE lending markets, which could have a material and adverse impact on the Company’s net income and the Company’s business, financial condition and results of operation. Following the Company’s implementation of enhanced risk management processes in order to remain compliant with applicable regulatory guidance, the Company re-entered certain commercial real estate markets that it backed away from, although it has no plans to re-enter the multifamily lending markets in New York City.
Recent financial reforms and related regulations may affect our results of operations, financial condition or liquidity.
The Dodd-Frank Act could result in additional legislative or regulatory action. For a description of the Dodd-Frank Act see Part I, Item 1. Business, Supervision and Regulation contained in this Form 10-K. At this time, it is difficult to predict the extent to which the Dodd-Frank Act or the resulting regulations will impact the Company’s business. However, compliance with these new laws and regulations have resulted in and will likely continue to result in additional costs and these additional costs may adversely impact our results of operations, financial condition or liquidity.
As a bank holding company that conducts substantially all of its operations through its banking subsidiary, our ability to pay dividends to stockholders depends upon the results of operations of the Bank and its ability to pay dividends to the Company. Dividends paid by the Bank are subject to limits imposed by law and regulation.
Substantially all of the Company’s activities are conducted through the Bank, and the Company receives substantially all of its funds (other than the net proceeds of any capital raising transactions that the Company may undertake) through dividends from the Bank. The Company’s ability to pay dividends to stockholders depends primarily on the Bank’s ability to pay dividends to the Company. Various laws and regulations limit the amount of dividends that the Bank may pay to the Company. If the Bank is unable to pay dividends to the Company, the Company may not be able to pay dividends to its stockholders.
Changes in interest rates could adversely affect the Company’s results of operations and financial condition.
The Company’s ability to generate net income depends primarily upon our net interest income. Net interest income is income that remains after deducting from total income generated by earning assets the interest expense attributable to the acquisition of the funds required to support earning assets. Income from earning assets includes income from loans, investment securities and short-term investments. The amount of interest income is dependent on many factors including the volume of earning assets, the general level of interest rates, the dynamics of the change in interest rates and the levels of non-performing loans. The cost of funds varies with the amount of funds necessary to support earning assets, the rates paid to attract and hold deposits, rates paid on borrowed funds and the levels of non-interest-bearing demand deposits and equity capital.
Different types of assets and liabilities may react differently, at different times, to changes in market interest rates. Management expects that the Company will periodically experience gaps in the interest-rate sensitivities of its assets and liabilities. That means either our interest-bearing liabilities will be more sensitive to changes in market interest rates than our interest earning assets or vice versa. When interest-bearing liabilities mature or reprice more quickly than interest-earning assets, an increase in market rates of interest could reduce our net interest income. Likewise, when interest-earning assets mature or reprice more quickly than interest-bearing liabilities, falling interest rates could reduce net interest income. Management is unable to predict changes in market interest rates which are affected by many factors beyond our control including inflation, recession, unemployment, money supply and other governmental monetary and fiscal policies, domestic and international events and changes in the United States and other financial markets. Net interest income is not only affected by the level and direction of interest rates, but also by the shape of the yield curve, relationships between interest sensitive instruments and key driver rates, as well as balance sheet growth, client loan and deposit preferences and the timing of changes in these variables.
Management attempts to manage risk from changes in market interest rates, in part, by controlling the mix of interest rate-sensitive assets and interest rate-sensitive liabilities. Management reviews the Company's interest rate risk position and modifies its strategies based on projections to minimize the impact of future interest rate changes. However, interest rate risk management techniques are not exact. A rapid increase or decrease in interest rates could adversely affect our results of operations and financial condition.
The Company is subject to risks associated with taxation that could adversely affect the Company’s results of operations and financial condition.
The amount of income taxes the Company is required to pay on its earnings is based on federal, state and city laws and regulations. The Company provides for current and deferred taxes in its financial statements, based on its results of operations, business activity, legal structure, interpretation of tax statutes, assessment of risk of adjustment upon audit and application of financial accounting standards. The Company may take tax return filing positions for which the final determination of tax is uncertain. The Company’s net income and earnings per share may be reduced if a federal, state or local authority assesses additional taxes that have not been provided for in the consolidated financial statements. There can be no assurance that the Company will achieve its anticipated effective tax rate either due to a change in tax law, a change in regulatory or judicial guidance or an audit assessment that denies previously recognized tax benefits. The new tax provisions of New York State Article 9A allow banking corporations to exclude from income 160% of the dividends it has received from subsidiaries such as a REIT, which is now included in the mandatory combined group. Going forward, the Company may not realize the benefits of the exclusion from income of 160% of the dividends received from the REIT, if the bank’s assets were in excess of $8 billion, resulting in a higher effective state income tax rate. The occurrence of any of these tax-related risks could adversely affect the Company’s results of operations and financial condition.
The Company’s financial condition and results of operations are dependent on the economy, as well as competition from other banks. Changing economic conditions could adversely impact the Company’s earnings and increase the credit risk of the Company’s loan portfolio.
The Company’s primary market area includes Suffolk County, Nassau County and New York City. Adverse economic conditions in that market area could reduce the Company’s rate of growth, affect customers’ ability to repay loans and result in higher levels of loan delinquencies, problem assets and foreclosures and a decline in the values of the collateral (including residential and commercial real estate) securing the Company’s loans, any of which could have a material adverse effect on the Company’s business, financial condition and results of operations. General economic conditions, including inflation, unemployment and money supply fluctuations, also may adversely affect the Company’s business, financial condition and results of operations. In addition, competition in the banking industry is intense and the Company’s profitability depends upon its continued ability to successfully compete in its market.
The Company may not be able to maintain a strong core deposit base or other low-cost funding sources.
The Company expects to depend on checking, savings and money market deposit account balances and other forms of deposits as the primary source of funding for its lending activities. The Company’s future growth will largely depend on its ability to maintain a strong core deposit base. There may be competitive pressures to pay higher interest rates on deposits, which would increase the Company’s funding costs. If deposit clients move money out of bank deposits and into other investments (or into similar products at other institutions that may provide a higher rate of return), the Company could lose a relatively low cost source of funds, increasing its funding costs and reducing net interest income and net income. Additionally, any such loss of funds could result in reduced loan originations, which could adversely impact the Company’s results of operations and financial condition.
The Company is subject to significant operational risks that could result in charges, increased operational costs, harm to the Company’s reputation or foregone business opportunities.
Operational risk is the risk of loss from operations, including fraud by employees or outside persons, employees’ execution of incorrect or unauthorized transactions and breaches of internal control systems. Operational risk also encompasses technology, compliance and legal risk, which is the risk of loss from violations of, or noncompliance with, laws, rules, regulations, prescribed practices or ethical standards, as well as the risk of our noncompliance with contractual and other obligations. The Company is also exposed to operational risk through its outsourcing arrangements and the effect that changes in circumstances or capabilities of its outsourcing vendors can have on the Company’s ability to continue to perform operational functions necessary to its business. Control weaknesses or failures or other operational risks could result in charges, increased operational costs, harm to the Company’s reputation or foregone business opportunities.
A failure in or breach of the Company’s security systems or infrastructure, or those of our third-party service providers, could result in financial losses or in the disclosure or misuse of confidential or proprietary information, including client information.
As a financial institution, the Company may be the target of fraudulent activity that may result in financial losses to the Company and its clients, privacy breaches against its clients or damage to its reputation. Such fraudulent activity may take many forms, including check fraud, electronic fraud, wire fraud, phishing, unauthorized intrusion into or use of the Company’s systems and other dishonest acts. The Company provides its customers with the ability to bank remotely, including online over the Internet. The secure transmission of confidential information is a critical element of remote banking. The Company’s network could be vulnerable to unauthorized access, computer viruses, phishing schemes, spam attacks, human error, natural disasters, power loss and other security breaches. The Company may be required to spend significant capital and other resources to protect against the threat of cybersecurity breaches and computer viruses, or to alleviate problems caused by such breaches or viruses. Given the volume of Internet transactions, certain errors may be repeated or compounded before they can be discovered and rectified. To the extent that the Company’s activities or the activities of its customers involve the storage and transmission of confidential information, security breaches and viruses could expose the Company to claims, litigation and other possible liabilities. Any inability to prevent cybersecurity breaches or computer viruses could also cause existing customers to lose confidence in the Company’s systems and could adversely affect its reputation, results of operations and ability to attract and maintain customers and businesses. In addition, a security breach could also subject the Company to additional regulatory scrutiny, expose it to civil litigation and possible financial liability and cause reputational damage. The Company’s risk and exposure to these matters remains heightened because of the evolving nature and complexity of the threats from organized cybercriminals and hackers, and the Company’s plans to continue to provide electronic banking services to its customers.
The Company depends on its key employees.
The Company’s success will, to some extent, depend on the continued employment of its executive officers. The unexpected loss of the services of any of these individuals could have a detrimental effect on the Company’s business. No assurance can be given that these individuals will continue to be employed by the Company. The loss of any of these individuals could negatively affect the Company’s ability to achieve its growth strategy and could have a material adverse effect on the Company’s results of operations and financial condition.
Liquidity risk could impair the Company’s ability to fund operations and jeopardize its financial condition.
Liquidity is essential to the Company’s business. An inability to raise funds through deposits, borrowings, the sale of loans or securities and other sources could have a substantial negative effect on the Company’s liquidity. The Company’s access to funding sources in amounts adequate to finance its activities or on terms that are acceptable to it could be impaired by factors that affect the Company specifically or the banking industry or economy in general. Factors that could detrimentally impact the Company’s access to liquidity sources include a decrease in the level of its business activity as a result of a downturn in the markets in which its loans are concentrated or adverse regulatory action against the Company. The Company’s ability to borrow could also be impaired by factors that are not specific to it, such as a disruption in the financial markets or negative views and expectations about the prospects for the banking or financial services industries.
The Company may elect or be compelled to seek additional capital in the future, but that capital may not be available when it is needed.
The Company is required by federal regulatory authorities to maintain adequate levels of capital to support its operations. At some point, the Company may need to raise additional capital. If the Company raises additional capital, it may seek to do so through the issuance of, among other things, its common stock. The issuance of additional shares of common stock or convertible securities to new stockholders would be dilutive to the Company’s current stockholders.
The Company’s ability to raise additional capital, if needed, will depend on conditions in the capital markets, economic conditions and a number of other factors, many of which are outside the Company’s control, and on the Company’s financial performance. Accordingly, the Company cannot be assured of its ability to raise additional capital if needed or to raise capital on terms acceptable to the Company. If the Company cannot raise additional capital when needed, its ability to further expand its operations could be materially impaired and its financial condition and liquidity could be materially and adversely affected.
The Company is subject to risks associated with litigation that could have a material adverse effect on the Company’s business and financial condition and cause significant reputational harm to the Company.
The Company is subject to litigation risks as a result of a number of factors and from various sources, including the highly regulated nature of the banking industry. Given the inherent uncertainties involved in litigation, and the large or indeterminate damages that may be sought, there can be significant uncertainty as to the ultimate liability the Company may incur from litigation matters. Substantial liability against the Company could have a material adverse effect on the Company’s business and financial condition and cause significant reputational harm to the Company, which could seriously harm the Company’s business.
The price of the Company’s common stock may fluctuate significantly, making it difficult to resell shares of the Company’s common stock at times and prices that stockholders may find attractive.
The Company cannot predict how its common stock will trade in the future. The market value of the Company’s common stock will likely continue to fluctuate in response to a number of factors including the following, many of which are beyond the Company’s control, as well as the other risk factors described herein:
| • |
the market price of People’s United’s common stock, upon which the consideration to be paid to the Company’s stockholders in the merger is based;
|
| • |
actual or anticipated quarterly fluctuations in the Company’s operating and financial results;
|
| • |
developments related to investigations, proceedings or litigation involving the Company;
|
| • |
changes in financial estimates and recommendations by financial analysts;
|
| • |
dispositions, acquisitions and financings;
|
| • |
actions of the Company’s current stockholders, including sales of common stock by existing stockholders and the Company’s directors and executive officers;
|
| • |
fluctuations in the stock price and operating results of the Company’s competitors;
|
| • |
regulatory developments; and
|
| • |
developments related to the financial services industry.
|
The market value of the Company’s common stock may also be affected by conditions affecting the financial markets in general, including price and trading fluctuations. These conditions may result in volatility in the market prices of stocks generally and, in turn, the Company’s common stock and sales of substantial amounts of the Company’s common stock in the market, in each case that could be unrelated or disproportionate to changes in the Company’s operating performance. These broad market fluctuations may adversely affect the market value of the Company’s common stock.
There may be future sales of additional common stock or other dilution of the Company’s stockholders’ equity, which may adversely affect the market price of the Company’s common stock.
Subject to the limitations under the rules of the New York Stock Exchange and the number of shares of the Company’s authorized capital stock, the Company is not restricted from issuing additional common stock, including securities that are convertible into or exchangeable for, or that represent the right to receive, common stock or any substantially similar securities. The market value of the Company’s common stock could decline as a result of sales by the Company of a large number of shares of common stock or similar securities in the market or the perception that such sales could occur.
Anti-takeover provisions could negatively impact the Company’s stockholders.
Provisions in the Company’s charter and bylaws, the corporate law of the State of New York and federal laws and regulations could delay, defer or prevent a third party from acquiring the Company, despite the possible benefit to its stockholders, or otherwise adversely affect the market price of the Company’s common stock. These provisions include the election of directors to staggered terms of three years, advance notice requirements for nominations for election to the Company’s Board of Directors and for proposing matters that stockholders may act on at stockholder meetings and the requirement that directors fill vacancies on the Company’s Board of Directors. In addition, the BHC Act, as amended, and the Change in Bank Control Act of 1978, as amended, together with federal regulations, require that, depending on the particular circumstances, either regulatory approval must be obtained or notice must be furnished to the appropriate regulatory agencies and not disapproved prior to any person or entity acquiring control of a national bank, such as the Bank. These provisions may prevent a merger or acquisition that may be attractive to stockholders and could limit the price investors would be willing to pay in the future for the Company’s common stock. These provisions could also discourage proxy contests and make it more difficult for holders of the Company’s common stock to elect directors other than the candidates nominated by the Company’s Board of Directors.
The following table sets forth certain information relating to properties owned or used in the Company’s banking activities at December 31, 2016:
|
Location
|
Primary Use
|
Owned or Leased
|
|
4 West Second Street, Riverhead, NY
|
Corporate Headquarters
|
Owned
|
|
3880 Veterans Memorial Highway, Bohemia, NY
|
Branch Office
|
Owned
|
|
351 Pantigo Road, East Hampton, NY
|
Branch Office
|
Owned
|
|
168 West Montauk Highway, Hampton Bays, NY
|
Branch Office
|
Owned
|
|
746 Montauk Highway, Montauk, NY
|
Branch Office
|
Owned
|
|
135 West Broadway, Port Jefferson, NY
|
Branch Office
|
Owned
|
|
1201 Ostrander Avenue, Riverhead, NY
|
Branch Office
|
Owned
|
|
6 West Second Street, Riverhead, NY
|
Branch Office
|
Owned
|
|
17 Main Street, Sag Harbor, NY
|
Branch Office
|
Owned
|
|
295 North Sea Road, Southampton, NY
|
Branch Office
|
Owned
|
|
2065 Wading River-Manor Road, Wading River, NY
|
Branch Office
|
Owned
|
|
144 Sunset Avenue, Westhampton Beach, NY
|
Branch Office
|
Owned
|
|
206 Griffing Avenue, Riverhead, NY
|
Administrative Office
|
Owned
|
|
400 Merrick Road, Amityville, NY
|
Branch Office
|
Leased
|
|
502 Main Street, Center Moriches, NY
|
Branch Office
|
Leased
|
|
31525 Main Road, Cutchogue, NY
|
Branch Office
|
Leased
|
|
21 East Industry Court, Deer Park, NY
|
Branch Office
|
Leased
|
|
99 Newtown Lane, East Hampton, NY
|
Branch Office
|
Leased
|
|
110 Marcus Boulevard, Hauppauge, NY
|
Branch Office
|
Leased
|
|
2801 Route 112, Medford, NY
|
Branch Office
|
Leased
|
|
159 Route 25A, Miller Place, NY
|
Branch Office
|
Leased
|
|
228 East Main Street, Port Jefferson, NY
|
Branch Office
|
Leased
|
|
161 North Main Street, Sayville, NY
|
Branch Office
|
Leased
|
|
9926 Route 25A, Shoreham, NY
|
Branch Office
|
Leased
|
|
222 Middle Country Road, Smithtown, NY
|
Branch Office
|
Leased
|
|
955 Little East Neck Road, West Babylon, NY
|
Branch Office
|
Leased
|
|
1055 Franklin Avenue, Garden City, NY
|
Loan Production and Branch Office
|
Leased
|
|
290 Broad Hollow Road, Melville, NY
|
Loan Production and Branch Office
|
Leased
|
|
31-00 47th Avenue, Long Island City, NY
|
Loan Production and Branch Office
|
Leased
|
See the information set forth in Note 17. Legal Proceedings in the Notes to Consolidated Financial Statements under Part II, Item 8, which information is incorporated by reference in response to this item.
PART II
| ITEM 5. |
MARKET FOR REGISTRANT’S COMMON EQUITY, RELATED STOCKHOLDER MATTERS AND ISSUER PURCHASES OF EQUITY SECURITIES
|
At December 31, 2016, the approximate number of common equity stockholders was as follows:
Title of Class: Common Stock
Number of Record Holders: 1,190
The Company’s common stock commenced trading on the New York Stock Exchange under the symbol SCNB on December 18, 2015. Prior to that date, it traded on the NASDAQ Global Select Market under the symbol SUBK. Following are quarterly high and low sale prices of the Company’s common stock for the years ended December 31, 2016 and 2015.
|
2016
|
High Sale
|
Low Sale
|
||||||
|
1st Quarter
|
$
|
28.14
|
$
|
23.80
|
||||
|
2nd Quarter
|
31.36
|
22.88
|
||||||
|
3rd Quarter
|
35.80
|
30.45
|
||||||
|
4th Quarter
|
44.70
|
33.58
|
||||||
|
2015
|
High Sale
|
Low Sale
|
||||||
|
1st Quarter
|
$
|
23.89
|
$
|
20.66
|
||||
|
2nd Quarter
|
26.14
|
23.05
|
||||||
|
3rd Quarter
|
29.99
|
23.91
|
||||||
|
4th Quarter
|
31.75
|
25.97
|
||||||
The following schedule summarizes the Company’s dividends paid for the years ended December 31, 2016 and 2015.
|
Record Date
|
Dividend Payment Date
|
Cash Dividends Paid
Per Common Share
|
|||
|
November 9, 2016
|
November 23, 2016
|
$
|
0.10
|
||
|
August 10, 2016
|
August 24, 2016
|
0.10
|
|||
|
May 11, 2016
|
May 25, 2016
|
0.10
|
|||
|
February 10, 2016
|
February 24, 2016
|
0.10
|
|||
|
November 11, 2015
|
November 25, 2015
|
0.10
|
|||
|
August 12, 2015
|
August 26, 2015
|
0.10
|
|||
|
May 13, 2015
|
May 27, 2015
|
0.06
|
|||
|
February 11, 2015
|
February 25, 2015
|
0.06
|
|||
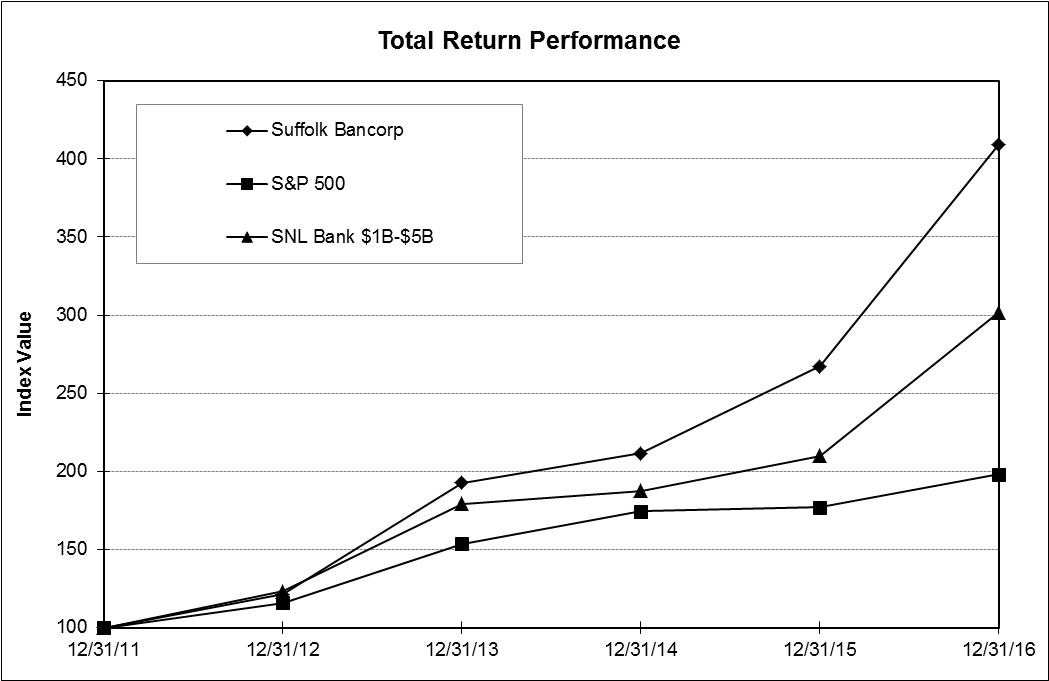
The following Performance Graph compares the yearly percentage change in the Company’s cumulative total stockholder return on its common stock with the cumulative total return of the S&P 500 index and the cumulative total return of the SNL Bank $1B - $5B index.
|
Period Ending
|
|||||||||||||||||||||||||
|
Index
|
12/31/11
|
12/31/12
|
12/31/13
|
12/31/14
|
12/31/15
|
12/31/16
|
|||||||||||||||||||
|
Suffolk Bancorp
|
100.00
|
121.41
|
192.77
|
211.60
|
267.30
|
409.37
|
|||||||||||||||||||
|
SNL Bank $1B-$5B
|
100.00
|
123.31
|
179.31
|
187.48
|
209.86
|
301.92
|
|||||||||||||||||||
| S&P 500 |
100.00
|
116.00
|
153.57
|
174.60
|
177.01
|
198.18
|
|||||||||||||||||||
Source: Performance Graph prepared by SNL Financial, Charlottesville, VA
For information about the Company’s equity compensation plans, please see Part III, Item 12. Security Ownership of Certain Beneficial Owners and Management and Related Stockholder Matters contained in this Form 10-K.
The Company’s selected financial data for the last five years follows.
FIVE-YEAR SUMMARY (dollars in thousands, except per share data)
|
As of or for the year ended December 31,
|
2016
|
2015
|
2014
|
2013
|
2012
|
|||||||||||||||
|
OPERATING RESULTS:
|
||||||||||||||||||||
|
Interest income
|
$
|
77,719
|
$
|
72,780
|
$
|
65,053
|
$
|
59,678
|
$
|
60,447
|
||||||||||
|
Interest expense
|
3,929
|
3,247
|
2,519
|
2,930
|
3,719
|
|||||||||||||||
|
Net interest income
|
73,790
|
69,533
|
62,534
|
56,748
|
56,728
|
|||||||||||||||
|
(Credit) provision for loan losses
|
(500
|
)
|
600
|
1,000
|
1,250
|
8,500
|
||||||||||||||
|
Net interest income after (credit) provision
|
74,290
|
68,933
|
61,534
|
55,498
|
48,228
|
|||||||||||||||
|
Non-interest income
|
8,483
|
8,594
|
10,900
|
19,507
|
10,881
|
|||||||||||||||
|
Operating expenses
|
55,320
|
53,954
|
53,419
|
58,565
|
61,571
|
|||||||||||||||
|
Income (loss) before income taxes
|
27,453
|
23,573
|
19,015
|
16,440
|
(2,462
|
)
|
||||||||||||||
|
Provision (benefit) for income taxes
|
7,622
|
5,886
|
3,720
|
3,722
|
(714
|
)
|
||||||||||||||
|
Net income (loss)
|
$
|
19,831
|
$
|
17,687
|
$
|
15,295
|
$
|
12,718
|
$
|
(1,748
|
)
|
|||||||||
|
FINANCIAL CONDITION:
|
||||||||||||||||||||
|
Investment securities
|
$
|
198,022
|
$
|
308,408
|
$
|
360,940
|
$
|
412,446
|
$
|
410,388
|
||||||||||
|
Loans
|
1,676,564
|
1,666,447
|
1,355,427
|
1,068,848
|
780,780
|
|||||||||||||||
|
Total assets
|
2,092,291
|
2,168,592
|
1,895,283
|
1,699,816
|
1,622,464
|
|||||||||||||||
|
Total deposits
|
1,838,182
|
1,780,623
|
1,556,060
|
1,510,061
|
1,431,114
|
|||||||||||||||
|
Borrowings
|
15,000
|
165,000
|
130,000
|
-
|
-
|
|||||||||||||||
|
Stockholders' equity
|
215,028
|
197,258
|
182,733
|
167,198
|
163,985
|
|||||||||||||||
|
SELECTED FINANCIAL RATIOS:
|
||||||||||||||||||||
|
Performance:
|
||||||||||||||||||||
|
Return on average assets
|
0.90
|
%
|
0.89
|
%
|
0.87
|
%
|
0.76
|
%
|
(0.11
|
)%
|
||||||||||
|
Return on average stockholders' equity
|
9.54
|
9.27
|
8.57
|
7.78
|
(1.22
|
)
|
||||||||||||||
|
Net interest margin (taxable-equivalent)
|
3.77
|
3.98
|
4.07
|
3.91
|
4.19
|
|||||||||||||||
|
Efficiency ratio
|
64.49
|
65.64
|
68.41
|
73.64
|
86.22
|
|||||||||||||||
|
Average stockholders' equity to average assets
|
9.47
|
9.61
|
10.14
|
9.83
|
9.30
|
|||||||||||||||
|
Dividend payout ratio
|
24.10
|
21.48
|
9.16
|
-
|
-
|
|||||||||||||||
|
Asset quality:
|
||||||||||||||||||||
|
Non-performing loans to total loans (1)
|
0.33
|
0.33
|
0.96
|
1.42
|
2.10
|
|||||||||||||||
|
Non-performing assets to total assets
|
0.30
|
0.25
|
0.68
|
0.89
|
1.17
|
|||||||||||||||
|
Allowance for loan losses to non-performing loans (1)
|
362
|
374
|
148
|
114
|
108
|
|||||||||||||||
|
Allowance for loan losses to total loans (1)
|
1.20
|
1.24
|
1.42
|
1.62
|
2.28
|
|||||||||||||||
|
Net charge-offs (recoveries)/average loans
|
0.00
|
(0.06
|
)
|
(0.08
|
)
|
0.20
|
3.57
|
|||||||||||||
|
CAPITAL RATIOS:
|
||||||||||||||||||||
|
Tier 1 leverage ratio
|
10.31
|
%
|
9.77
|
%
|
10.04
|
%
|
9.81
|
%
|
9.79
|
%
|
||||||||||
|
Tier 1 risk-based capital ratio
|
13.50
|
11.68
|
12.10
|
13.77
|
16.89
|
|||||||||||||||
|
Total risk-based capital ratio
|
14.72
|
12.89
|
13.35
|
15.02
|
18.15
|
|||||||||||||||
|
Tangible common equity ratio
|
10.16
|
8.98
|
9.50
|
9.68
|
9.96
|
|||||||||||||||
|
COMMON SHARE DATA:
|
||||||||||||||||||||
|
Net income (loss) per share - fully diluted
|
$
|
1.66
|
$
|
1.49
|
$
|
1.31
|
$
|
1.10
|
$
|
(0.17
|
)
|
|||||||||
|
Cash dividends per share
|
0.40
|
0.32
|
0.12
|
-
|
-
|
|||||||||||||||
|
Book value per share
|
18.01
|
16.72
|
15.66
|
14.45
|
14.18
|
|||||||||||||||
|
Tangible book value per share
|
17.79
|
16.47
|
15.40
|
14.19
|
13.95
|
|||||||||||||||
|
Average common shares outstanding
|
11,882,647
|
11,756,451
|
11,626,354
|
11,570,731
|
10,248,751
|
|||||||||||||||
|
OTHER INFORMATION:
|
||||||||||||||||||||
|
Number of full-time-equivalent employees
|
296
|
337
|
333
|
350
|
373
|
|||||||||||||||
|
Number of branch offices
|
27
|
27
|
26
|
25
|
30
|
|||||||||||||||
|
Number of ATMs
|
24
|
24
|
24
|
25
|
30
|
|||||||||||||||
|
(1)
|
Excluding loans held-for-sale.
|
Safe Harbor Statement Pursuant to the Private Securities Litigation Reform Act of 1995
Certain statements contained in this document are “forward-looking statements” within the meaning of the Private Securities Litigation Reform Act of 1995. These can include remarks about the Company, the proposed merger with People’s United, the banking industry, the economy in general, expectations of the business environment in which the Company operates, projections of future performance, and potential future credit experience. These remarks are based upon current management expectations, and may, therefore, involve risks and uncertainties that cannot be predicted or quantified, that are beyond the Company’s control and that could cause future results to vary materially from the Company’s historical performance or from current expectations. These remarks may be identified by such forward-looking statements as “should,” “expect,” “believe,” “view,” “opportunity,” “allow,” “continues,” “reflects,” “typically,” “usually,” “anticipate,” or similar statements or variations of such terms. Factors that could affect the Company include particularly, but are not limited to: the ability to meet closing conditions to the merger with People’s United; delay in closing the merger; difficulties and delays in integrating the Company’s business or fully realizing cost savings and other benefits of the merger; business disruption following the merger; increased capital requirements mandated by the Company’s regulators, including the individual minimum capital requirements that the OCC established for the Bank; the Bank’s limitation on the growth of its commercial real estate (“CRE”) portfolio and the potentially adverse impact thereof on the Company’s overall business, financial condition and results of operation due to the importance of the Bank’s CRE business to the Company’s overall business, financial condition and results of operation; any failure by the Bank to comply with the individual minimum capital ratios (including as a result of increases to the Bank’s allowance for loan losses), which may result in regulatory enforcement actions; the duration of the Bank’s limitation on the growth of its CRE portfolio, and the potentially adverse impact thereof on the Company’s overall business, financial condition and results of operation; the cost of compliance and significant amount of time required of management to comply with regulatory requirements; results of changes in law, regulations or regulatory practices; the Company’s ability to raise capital; competitive factors, including price competition; changes in interest rates; increases or decreases in retail and commercial economic activity in the Company’s market area; variations in the ability and propensity of consumers and businesses to borrow, repay, or deposit money, or to use other banking and financial services; the Company’s ability to attract and retain key management and staff; any failure by the Company to maintain effective internal control over financial reporting; larger-than-expected losses from the sale of assets; and the potential that net charge-offs are higher than expected or for increases in our provision for loan losses. Further, it could take the Company longer than anticipated to implement its strategic plans to increase revenue and manage non-interest expense, or it may not be possible to implement those plans at all. Finally, new and unanticipated legislation, regulation, or accounting standards may require the Company to change its practices in ways that materially change the results of operations. We have no obligation to update any forward-looking statements to reflect events or circumstances after the date of this document. For more information, see the risk factors described in this Annual Report on Form 10-K and other filings with the Securities and Exchange Commission.
Non-GAAP Disclosure
This discussion includes non-GAAP financial measures of the Company’s tangible common equity (“TCE”) ratio, tangible common equity, tangible assets, core net income, core fully taxable equivalent (“FTE”) net interest income, core FTE net interest margin, core operating expenses, core non-interest income, core FTE non-interest income and core operating efficiency ratio. A non-GAAP financial measure is a numerical measure of historical or future financial performance, financial position or cash flows that excludes or includes amounts that are required to be disclosed in the most directly comparable measure calculated and presented in accordance with generally accepted accounting principles in the United States (“U.S. GAAP”). The Company believes that these non-GAAP financial measures provide both management and investors a more complete understanding of the underlying operational results and trends and the Company’s marketplace performance. The presentation of this additional information is not meant to be considered in isolation or as a substitute for the numbers prepared in accordance with U.S. GAAP and may not be comparable to similarly titled measures used by other financial institutions.
With respect to the calculations and reconciliations of tangible common equity, tangible assets and the TCE ratio, please see Liquidity and Capital Resources contained herein. For the calculation and reconciliation of core FTE net interest margin, please see Material Changes in Results of Operations contained herein. For all other calculations and reconciliations pertaining to non-GAAP financial measures, please see Executive Summary contained herein.
Executive Summary
The Company is a one-bank holding company incorporated in 1985. The Company operates as the parent for its wholly owned subsidiary, the Bank, a national bank founded in 1890. The income of the Company is primarily derived through the operations of the Bank and the REIT.
On June 26, 2016, the Company entered into an Agreement and Plan of Merger (the “merger agreement”) with People’s United pursuant to which the Company will merge into People’s United (the “merger”). People’s United will be the surviving corporation in the merger. Subject to the terms and conditions of the merger agreement, the Company’s shareholders will have the right to receive 2.225 shares of People’s United common stock in exchange for each share of Company common stock. The merger agreement was adopted by the Company’s shareholders, and both the OCC and Federal Reserve Board have approved the merger. The merger remains subject to other customary conditions to closing.
The Bank is a full-service bank serving the needs of its local residents through 27 branch offices in Nassau, Suffolk and Queens Counties, New York. The Bank’s 27 branches include business banking centers in Long Island City, Melville and Garden City. In order to expand the Company geographically into western Suffolk, Nassau and Queens Counties and to diversify the lending business of the Company, loan production offices were opened in recent years in Long Island City, Garden City and Melville. As part of the Company’s strategy to move westward, the loan production office and business banking center branch in Long Island City serves Queens and nearby Brooklyn.
The Bank’s primary market area includes Suffolk County, Nassau County and New York City. The Bank offers a full line of domestic commercial and retail banking services. The Bank makes commercial real estate floating and fixed rate loans, multifamily and mixed use commercial loans primarily in the boroughs of New York City, commercial and industrial loans to manufacturers, wholesalers, distributors, developers/contractors and retailers and agricultural loans. The Bank also makes loans secured by residential mortgages, and both floating and fixed rate second mortgage loans with a variety of plans for repayment. Real estate construction loans are also offered.
The Bank finances most of its activities through a combination of deposits, including demand, savings, N.O.W. and money market deposits as well as time deposits, and borrowings which could include federal funds with correspondent banks, securities sold under agreements to repurchase and Federal Home Loan Bank (“FHLB”) short-term and long-term borrowings. The Company’s chief competition includes local banks within its market area, as well as New York City money center banks and regional banks.
During 2016, the Company became increasingly concerned with conditions in many of its local commercial real estate (“CRE”) markets, particularly those in the boroughs of New York City. The Company saw worrisome signs of markets that were becoming overheated and had also observed deterioration in underwriting standards elsewhere in the industry, which had often translated into borrower expectations for loan terms that the Company was not comfortable with. As it has consistently articulated, the Company will compete fiercely for good deals on price because of the significant cost of funds advantage it has over most of the industry. However, the Company will not compromise on credit quality. As a result of these concerns, the Company stopped accepting new applications for multifamily loans in the boroughs of New York City during the first quarter of 2016. The CRE lending market is also an area which has attracted significant regulatory scrutiny. The OCC, the Company’s primary bank regulator, has publicly expressed broadly applicable concerns over the last year about overheated conditions in many CRE markets. The OCC established individual minimum capital ratios for the Bank as a result of its concentration of CRE loans. In response, the Company decided to temporarily pull back from the CRE lending markets. Following the Company’s implementation of enhanced risk management processes in order to remain compliant with applicable regulatory guidance, the Company re-entered certain commercial real estate markets that it had backed away from, although it has no current plans to re-enter the multifamily lending markets in New York City. While this shift in focus could have a negative impact on the Company’s revenue and earnings growth, the Company believes it is prudent in the current environment.
The OCC has established individual minimum capital ratios for the Bank that requires it to maintain a tier 1 leverage ratio of at least 9%, a tier 1 risk-based capital ratio of at least 11% and a total risk-based capital ratio of at least 12%. At December 31, 2016, the Bank satisfied these capital ratios, although there is no guarantee that the Bank will be able to maintain compliance with these heightened capital ratios. The Company is exploring various options to ensure that it remains compliant with these capital requirements, including possible sales of selected investment securities and multifamily loans.
At December 31, 2016, the Company, on a consolidated basis, had total assets of $2.1 billion, total deposits of $1.8 billion and stockholders’ equity of $215 million. The Company recorded net income of $19.8 million during the full year ended December 31, 2016 versus $17.7 million in the comparable 2015 period. Excluding merger-related charges, net non-accrual interest received and OREO expenses incurred, core net income was $21.5 million for the full year of 2016. The improvement in reported 2016 net income resulted principally from a $4.3 million increase in net interest income coupled with a $1.1 million reduction in the provision for loan losses. Partially offsetting these positive factors was a $1.4 million increase in total operating expenses, a $111 thousand reduction in non-interest income, and a $1.7 million increase in income tax expense reflecting the Company’s higher effective tax rate in 2016. Excluding merger-related expenses incurred in 2016 and systems conversion expenses incurred in 2015, total operating expenses increased by $375 thousand or 0.7% versus 2015.
|
(in thousands)
|
Years Ended December 31,
|
|||||||
|
2016
|
2015
|
|||||||
|
CORE NET INCOME:
|
||||||||
|
Net income, as reported
|
$
|
19,831
|
$
|
17,687
|
||||
|
Adjustments:
|
||||||||
|
Net non-accrual interest adjustment
|
(298
|
)
|
(1,248
|
)
|
||||
|
Merger costs
|
2,434
|
-
|
||||||
|
Nonrecurring project costs
|
-
|
1,443
|
||||||
|
OREO-related expenses
|
113
|
-
|
||||||
|
Total adjustments, before income taxes
|
2,249
|
195
|
||||||
|
Adjustment for reported effective income tax rate
|
624
|
49
|
||||||
|
Total adjustments, after income taxes
|
1,625
|
146
|
||||||
|
Core net income
|
$
|
21,456
|
$
|
17,833
|
||||
The Company’s return on average assets and return on average common stockholders’ equity were 0.90% and 9.54%, respectively, for the year ended December 31, 2016 versus 0.89% and 9.27%, respectively, for the comparable 2015 period.
Total loans at December 31, 2016 were $1.7 billion, representing a 0.6% increase from the comparable 2015 date. The modest loan growth in 2016 compared to 2015 reflected the Company’s previously announced decision to temporarily pull back from certain commercial lending markets during the middle of 2016. In addition, $77 million in multi-family loans were sold during 2016, including approximately $28 million during the fourth quarter, in order to generate non-interest income, protect net interest margin and avoid becoming too concentrated in a single product line. Notwithstanding these factors, the Company believes it is building a strong and diversified loan pipeline for the future.
The credit quality of the Company’s loan portfolio continues to be strong. Management remains vigilant in ensuring that credit quality is not compromised, with lending and credit teams working together to manage risk and maintain strong credit standards. Total non-accrual loans were $5.6 million or 0.33% of loans outstanding at December 31, 2016 versus $5.5 million or 0.33% of loans outstanding at December 31, 2015. Total accruing loans delinquent 30 days or more were $1.2 million or 0.07% of loans outstanding at December 31, 2016 compared to $1.0 million or 0.06% of loans outstanding at December 31, 2015. The allowance for loan losses totaled $20.1 million at December 31, 2016 versus $20.7 million at December 31, 2015, representing 1.20% and 1.24% of total loans, respectively, at such dates. The allowance for loan losses as a percentage of non-accrual loans was 362% and 374% at December 31, 2016 and 2015, respectively.
Total core deposits, consisting of demand, N.O.W., savings and money market accounts were $1.6 billion at December 31, 2016, representing 89% of total deposits at that date. Total deposits, including time deposits, were $1.8 billion at December 31, 2016, representing a 3.2% increase when compared to December 31, 2015. In addition, at December 31, 2016, 47% of the Company’s total deposits were non-interest bearing demand deposits, resulting in a full year cost of funds of 20 basis points and an FTE net interest margin and core FTE net interest margin of 3.77% and 3.71%, respectively, for the full year of 2016. The Company’s cost of funds and resulting margin compared favorably to most of the industry for the same full year period.
The Company’s core operating efficiency ratio improved during the full year of 2016 to 61.9%, from 64.9% in the comparable 2015 period.
|
(dollars in thousands)
|
Years Ended December 31,
|
|||||||
|
2016
|
2015
|
|||||||
|
Core operating expenses:
|
||||||||
|
Total operating expenses
|
$
|
55,320
|
$
|
53,954
|
||||
|
Adjust for merger costs
|
(2,434
|
)
|
-
|
|||||
|
Adjust for nonrecurring project costs
|
-
|
(1,443
|
)
|
|||||
|
Adjust for OREO-related expenses
|
(113
|
)
|
-
|
|||||
|
Core operating expenses
|
52,773
|
52,511
|
||||||
|
Core non-interest income:
|
||||||||
|
Total non-interest income
|
8,483
|
8,594
|
||||||
|
Adjustments
|
-
|
-
|
||||||
|
Core non-interest income
|
8,483
|
8,594
|
||||||
|
Adjust for tax-equivalent basis
|
898
|
833
|
||||||
|
Core FTE non-interest income
|
9,381
|
9,427
|
||||||
|
Core operating efficiency ratio:
|
||||||||
|
Core operating expenses
|
52,773
|
52,511
|
||||||
|
Core FTE net interest income
|
76,543
|
71,845
|
||||||
|
Core FTE non-interest income
|
9,381
|
9,427
|
||||||
|
Adjust for net gain on sale of securities available for sale
|
(617
|
)
|
(319
|
)
|
||||
|
Core total FTE revenue
|
85,307
|
80,953
|
||||||
|
Core operating expenses/core total FTE revenue
|
61.86
|
%
|
64.87
|
%
|
||||
The Company believes it has made significant progress toward ensuring a smooth and successful integration in connection with the pending merger with People’s United. With an effort toward leveraging the strengths of the combined institutions for the benefit of all current and future stakeholders, respective teams from both institutions have continued to work closely and cooperatively.
Critical Accounting Policies, Judgments and Estimates
The Company’s accounting and reporting policies conform to U.S. GAAP and general practices within the banking industry. The preparation of the financial statements in conformity with U.S. GAAP requires management to make estimates and assumptions that affect the amounts reported in the financial statements and the accompanying notes. Actual results could differ from those estimates.
Allowance for Loan Losses - One of the most critical accounting policies impacting the Company’s financial statements is the evaluation of the allowance for loan losses. The allowance for loan losses is a valuation allowance for probable incurred losses, increased by the provision for loan losses and recoveries, and decreased by loan charge-offs. For all classes of loans, when a loan, in full or in part, is deemed uncollectible, it is charged against the allowance for loan losses. This happens when the loan is past due and the borrower has not shown the ability or intent to make the loan current, or the borrower does not have sufficient assets to pay the debt, or the value of the collateral is less than the balance of the loan and is not considered likely to improve soon. The allowance for loan losses is determined by a quarterly analysis of the loan portfolio. Such analysis includes changes in the size and composition of the portfolio, the Company’s own historical loan losses, industry-wide losses, current and anticipated economic trends, and details about individual loans. It also includes estimates of the actual value of collateral, other possible sources of repayment and estimates that are susceptible to significant changes due to changes in appraisal values of collateral, national and regional economic conditions and other relevant factors. All non-accrual loans over $250 thousand in the commercial and industrial, commercial real estate, multifamily, mixed use commercial, real estate construction and residential mortgages loan classes and all troubled debt restructurings (“TDRs”) are evaluated individually for impairment. All other loans are generally evaluated as homogeneous pools with similar risk characteristics. In assessing the adequacy of the allowance for loan losses, management reviews the loan portfolio by separate classes that have similar risk and collateral characteristics. These classes are commercial and industrial, commercial real estate, multifamily, mixed use commercial, real estate construction, residential mortgages, home equity and consumer loans.
The allowance for loan losses consists of specific and general components, as well as an unallocated component. The specific component relates to loans that are individually classified as impaired. Specific reserves are established based on an analysis of the most probable sources of repayment or liquidation of collateral. Impaired loans that are collateral dependent are reviewed based on the fair market value of collateral and the estimated time required to recover the Company’s investment in the loans, as well as the cost of doing so, and the estimate of the recovery. Non-collateral dependent impaired loans are reviewed based on the present value of estimated future cash flows, including balloon payments, if any, using the loan’s effective interest rate. While every impaired loan is evaluated individually, not every loan requires a specific reserve. Specific reserves fluctuate based on changes in the underlying loans, anticipated sources of repayment, and charge-offs. The general component covers non-impaired loans and is based on historical loss experience for each loan class from a rolling twelve quarter period and modifying those percentages, if necessary, after adjusting for current qualitative and environmental factors that reflect changes in the estimated collectability of the loan class not captured by historical loss data. These factors augment actual loss experience and help estimate the probability of loss within the loan portfolio based on emerging or inherent risk trends. These qualitative factors include consideration of the following: levels and trends in various risk rating categories; levels of and trends in delinquencies and impaired loans; levels of and trends in charge-offs and recoveries; trends in volume and terms of loans; effects of any changes in risk selection and underwriting standards; other changes in lending policies, procedures and practices; experience, ability, and depth of lending management and other relevant staff; local, regional and national economic trends and conditions; industry conditions; and effects of changes in credit concentrations. These qualitative factors are applied as an adjustment to historical loss rates and require judgments that cannot be subjected to exact mathematical calculation. These adjustments reflect management’s overall estimate of the extent to which current losses on a pool of loans will differ from historical loss experience. These adjustments are subjective estimates and management reviews them on a quarterly basis. TDRs are also considered impaired with impairment generally measured at the present value of estimated future cash flows using the loan’s effective interest rate at inception or using the fair value of collateral, less estimated costs to sell, if repayment is expected solely from the collateral. An unallocated component is maintained to cover uncertainties that could affect management’s estimate of probable losses. The unallocated component of the allowance reflects the margin of imprecision inherent in the underlying assumptions used in the methodologies for estimating specific and general losses in the portfolio.
Deferred Tax Assets and Liabilities – Deferred tax assets and liabilities are the expected future tax consequences of temporary differences between the carrying amounts and the tax bases of assets and liabilities, computed using enacted tax rates. Deferred tax assets are recognized if it is more likely than not that a future benefit will be realized. A valuation allowance, if needed, reduces deferred tax assets to the amount expected to be realized. The realization of deferred tax assets (net of a recorded valuation allowance) is largely dependent upon future taxable income, future reversals of existing taxable temporary differences and the ability to carryback losses to available tax years. In assessing the need for a valuation allowance, the Company considers all relevant positive and negative evidence, including taxable income in carryback years, scheduled reversals of deferred tax liabilities, expected future taxable income and available tax planning strategies.
Other-Than-Temporary Impairment (“OTTI”) of Investment Securities – Management evaluates securities for OTTI on at least a quarterly basis, and more frequently when economic or market conditions warrant such an evaluation. For securities in an unrealized loss position, management considers the extent and duration of the unrealized loss, and the financial condition and near-term prospects of the issuer. Management also assesses whether it intends to sell, or it is more likely than not that it will be required to sell, a security in an unrealized loss position before recovery of its amortized cost basis. If either of the criteria regarding intent or requirement to sell is met, the entire difference between amortized cost and fair value is recognized as impairment through earnings. For debt securities that do not meet the aforementioned criteria, the amount of impairment is split into two components as follows: 1) OTTI related to credit loss, which must be recognized in the statement of income and 2) OTTI related to other factors, which is recognized in other comprehensive income (loss). The credit loss is defined as the difference between the present value of the cash flows expected to be collected and the amortized cost basis. For equity securities, the entire amount of impairment is recognized through earnings.
Material Changes in Financial Condition
Total assets of the Company were $2.1 billion at December 31, 2016. When compared to December 31, 2015, total assets decreased by $76 million. This change was primarily due to a decrease in the investment portfolio of $110 million, partially offset by loan growth and an increase in total cash and cash equivalents of $10 million and $27 million, respectively.
Total investment securities were $198 million at December 31, 2016 and $308 million at December 31, 2015. The decrease in the investment portfolio largely reflected maturities and calls of municipal obligations and U.S. Government agency securities totaling $105 million, coupled with principal paydowns of CMOs and MBS of U.S. Government-sponsored enterprises totaling $8 million and sales of municipal obligations totaling $7 million during 2016. These decreases were partially offset by purchases of CMOs and MBS of U.S. Government-sponsored enterprises, corporate bonds and municipal obligations totaling $13 million during the same period. The available for sale securities portfolio had an unrealized pre-tax gain of $172 thousand at December 31, 2016 compared to a gain of $2.4 million at year-end 2015.
Total loans were $1.7 billion at December 31, 2016, an increase of 0.6% when compared to December 31, 2015. The modest increase in the loan portfolio was primarily due to the $35 million growth in commercial real estate loans, partially offset by a decrease in multifamily loans of $24 million in 2016.
At December 31, 2016, total deposits were $1.8 billion, an increase of $58 million when compared to December 31, 2015. This increase was primarily due to an increase in core deposit balances of $85 million, partially offset by a decrease in time deposit balances of $27 million over the same period. Core deposit balances, which consist of demand, N.O.W., savings and money market deposits, represented 89% of total deposits at December 31, 2016 and 87% of total deposits at December 31, 2015. Demand deposit balances represented 47% and 44% of total deposits at December 31, 2016 and 2015, respectively. At December 31, 2016 and 2015, the Company had $15 million and $165 million, respectively, in borrowings.
Material Changes in Results of Operations
2016 versus 2015
The Company recorded net income of $19.8 million during the full year ended December 31, 2016 versus $17.7 million in the comparable 2015 period. Excluding merger-related charges, net non-accrual interest received and OREO expenses incurred, core net income was $21.5 million for the full year of 2016. The improvement in reported 2016 net income resulted principally from a $4.3 million increase in net interest income coupled with a $1.1 million reduction in the provision for loan losses. Partially offsetting these positive factors was a $1.4 million increase in total operating expenses, a $111 thousand reduction in non-interest income, and a $1.7 million increase in income tax expense reflecting the Company’s higher effective tax rate in 2016. Excluding merger-related expenses incurred in 2016 and systems conversion expenses incurred in 2015, total operating expenses increased by $375 thousand or 0.7% versus 2015.
The $4.3 million or 6.1% improvement in full year 2016 net interest income resulted from a $201 million increase in average total interest-earning assets, offset in part by a 21 basis point contraction of the Company’s net interest margin to 3.77% in 2016 from 3.98% in 2015. (See also Distribution of Assets, Liabilities and Stockholders’ Equity: Net Interest Income and Rates and Analysis of Changes in Net Interest Income contained herein.) Excluding the impact of net non-accrual interest received in each full year period, the Company’s core FTE net interest margin was 3.71% in 2016 versus 3.91% in 2015.
|
Years Ended December 31,
|
||||||||||||||||
|
($ in thousands)
|
2016
|
2015
|
||||||||||||||
|
CORE NET INTEREST INCOME/MARGIN:
|
||||||||||||||||
|
Net interest income/margin (FTE)
|
$
|
76,841
|
3.77
|
%
|
$
|
73,093
|
3.98
|
%
|
||||||||
|
Net non-accrual interest adjustment
|
(298
|
)
|
(0.06
|
%)
|
(1,248
|
)
|
(0.07
|
%)
|
||||||||
|
Core net interest income/margin (FTE)
|
$
|
76,543
|
3.71
|
%
|
$
|
71,845
|
3.91
|
%
|
||||||||
The Company’s full year 2016 average total interest-earning asset yield was 3.96% versus 4.15% in the comparable 2015 period. A lower average yield on the Company’s loan portfolio in 2016 versus the comparable 2015 period, down 13 basis points to 4.17%, was the primary driver of the reduction in the interest-earning asset yield. The Company’s average loan portfolio increased by $230 million (15.6%) versus 2015 while the average securities portfolio decreased by $86 million (25.4%) to $251 million in the same period. The average yield on the investment portfolio was 3.58% in 2016 versus 3.71% a year ago.
The Company’s average cost of total interest-bearing liabilities increased by three basis points to 0.35% in 2016 versus 0.32% in the comparable 2015 full year period. The Company’s total cost of funds increased by two basis points to 0.20% in 2016 versus 2015. Average core deposits increased by $214 million (14.6%) to $1.7 billion during the 2016 full year period compared to 2015, with average demand deposits representing 44% of full year 2016 average total deposits. Average total deposits increased by $205 million or 12.1% to $1.9 billion during in 2016 versus 2015. Average core deposit balances represented 88% of average total deposits in 2016 compared to 86% in the year ago period.
The Company recorded a $500 thousand credit to the provision for loan losses during 2016 versus a provision expense of $600 thousand a year ago.
Total operating expenses increased by $1.4 million (2.5%) in the full year 2016 versus 2015 principally due to $2.4 million in merger-related expenses coupled with growth in employee compensation and benefits expense (up $1.6 million), offset in part by reductions in non-recurring project costs (systems conversion expenses) and data processing costs of $1.4 million and $1.3 million, respectively.
The Company recorded income tax expense of $7.6 million in the 2016 full year period resulting in an effective tax rate of 27.8% versus income tax expense of $5.9 million and an effective tax rate of 25.0% in the comparable 2015 period. The increase in the effective tax rate in 2016 versus 2015 resulted primarily from a decrease in tax-exempt municipal securities income due to a significant amount of bonds maturing during 2016.
2015 versus 2014
The Company recorded net income of $17.7 million during the full year ended December 31, 2015 versus $15.3 million in the comparable 2014 period. The 15.6% improvement in 2015 net income resulted principally from a $7.0 million increase in net interest income coupled with a $400 thousand decline in the provision for loan losses. Partially offsetting these positive factors was a $2.3 million reduction in non-interest income, an increase in total operating expenses of $535 thousand and a higher effective tax rate in 2015. Excluding the after-tax impact of the $1.4 million fourth quarter 2015 systems conversion expense, net income in 2015 would have been $18.8 million, an increase of 22.7% versus the 2014 full year period.
The $7.0 million or 11.2% improvement in 2015 net interest income resulted from a $206 million increase in average total interest-earning assets, offset in part by a nine basis point contraction of the Company’s net interest margin to 3.98% in 2015 from 4.07% in 2014. Adjusting for the impact of net non-accrual interest received in each period, the Company’s core net interest margin was 3.91% for the year ended December 31, 2015 versus 4.02% for the comparable 2014 period.
The Company’s full year 2015 average total interest-earning asset yield was 4.15% versus 4.23% in the comparable 2014 period. A lower average yield on the Company’s loan portfolio in 2015 versus the comparable 2014 period, down 24 basis points to 4.30%, was the primary contributing factor in the reduction in the interest-earning asset yield. The Company’s average balance sheet mix continued to improve in 2015 as average loans increased by $284 million (23.8%) versus the 2014 full year and low-yielding overnight interest-bearing deposits, federal funds sold and securities purchased under agreements to resell declined by $27 million during the same period. The average securities portfolio decreased by $54 million to $337 million in 2015 versus 2014. The average yield on the investment portfolio was 3.71% in the 2015 period versus 3.73% in 2014.
The Company’s average cost of total interest-bearing liabilities increased by four basis points to 0.32% in 2015 versus 0.28% in the comparable 2014 period. The Company’s total cost of funds was 0.18% in 2015 versus 0.16% in 2014. Average core deposits increased by $140 million to $1.5 billion during 2015 versus the comparable 2014 period, with average demand deposits representing 44% of full year 2015 average total deposits. Average total deposits increased by $143 million or 9.2% to $1.7 billion during 2015 versus 2014. Average core deposit balances represented 86% of average total deposits during the 2015 period. Average borrowings increased by $62 million during 2015 compared to 2014 and represented 4.2% of total average funding during 2015.
Due to a combination of improved credit metrics coupled with $885 thousand in 2015 full year net loan recoveries, the Company’s provision for loan losses declined by $400 thousand in 2015 versus 2014.
Non-interest income declined by $2.3 million or 21.2% in the 2015 full year period when compared to 2014. This reduction was due to several factors, most notably reductions in net gain on sale of premises and equipment (down $751 thousand), fiduciary fees (down $1.0 million), service charges on deposit accounts (down $639 thousand) and other service charges, commissions and fees (down $366 thousand). The reduction in net gain on sale of premises and equipment resulted from gains recorded in 2014 on the sale of two bank properties. Fiduciary fees declined as a result of the Company’s sale of its wealth management business in 2014. Deposit service charges declined principally due to a reduction in overdraft and demand deposit account analysis fees in 2015. Other service charges, commissions and fees were lower than the comparable 2014 period primarily as the result of a reduction in income from the sale of investment products through the Company’s branch network. Partially offsetting the foregoing reductions in non-interest income were increases in net gain on sale of securities available for sale (up $300 thousand) and net gain on sale of portfolio loans (up $351 thousand).
Total operating expenses increased by $535 thousand in 2015 versus 2014 principally due to the $1.4 million fourth quarter 2015 systems conversion expense coupled with a $449 thousand branch consolidation expense credit recorded in 2014. Excluding the impact of these two items, total operating expenses would have declined by $1.4 million or 2.5% when compared to 2014. The net reduction in operating expenses, excluding these items, resulted from reductions in several categories, most notably employee compensation and benefits (down $1.1 million) and consulting and professional services (down $467 thousand). The decrease in employee compensation and benefits reflected lower expense levels for incentive compensation, pension, 401(k) and medical insurance in 2015.
The Company recorded income tax expense of $5.9 million in 2015 resulting in an effective tax rate of 25.0% versus an income tax expense of $3.7 million and an effective tax rate of 19.6% in the comparable 2014 period. The increase in the 2015 effective tax rate resulted from growth in pre-tax income taxed at the 35% federal rate, coupled with a reduction in tax-exempt income versus the comparable 2014 period. The 2014 effective tax rate also reflected a net tax benefit arising from changes in New York State tax law made in that period coupled with an adjustment related to stock-based compensation.
Distribution of Assets, Liabilities and Stockholders’ Equity: Net Interest Income and Rates
The following table presents the average daily balances of the Company’s assets, liabilities and stockholders’ equity, together with an analysis of net interest earnings and average rates, for each major category of interest-earning assets and interest-bearing liabilities. Interest and average rates are computed on a fully taxable-equivalent basis (dollars in thousands):
|
For the Years Ended December 31,
|
2016
|
2015
|
2014
|
|||||||||||||||||||||||||||||||||
|
Average
Balance |
Interest
|
Average
Rate |
Average
Balance |
Interest
|
Average
Rate |
Average
Balance |
Interest
|
Average
Rate |
||||||||||||||||||||||||||||
|
Interest-earning assets
|
||||||||||||||||||||||||||||||||||||
|
Securities:
|
||||||||||||||||||||||||||||||||||||
|
Taxable
|
$
|
154,425
|
$
|
3,712
|
2.40
|
%
|
$
|
202,399
|
$
|
4,750
|
2.35
|
%
|
$
|
226,603
|
$
|
5,369
|
2.37
|
%
|
||||||||||||||||||
|
Tax-exempt
|
96,894
|
5,283
|
5.45
|
134,651
|
7,752
|
5.76
|
164,439
|
9,200
|
5.59
|
|||||||||||||||||||||||||||
|
Total securities
|
251,319
|
8,995
|
3.58
|
337,050
|
12,502
|
3.71
|
391,042
|
14,569
|
3.73
|
|||||||||||||||||||||||||||
|
Federal Reserve and Federal Home Loan Bank stock and other investments
|
6,488
|
332
|
5.12
|
6,505
|
280
|
4.30
|
3,511
|
152
|
4.33
|
|||||||||||||||||||||||||||
|
Federal funds sold, securities purchased under agreements to resell and interest-bearing deposits due from banks
|
74,443
|
354
|
0.48
|
18,649
|
62
|
0.33
|
45,436
|
150
|
0.33
|
|||||||||||||||||||||||||||
|
Loans and performing loans held for sale (including non-accrual loans):
|
||||||||||||||||||||||||||||||||||||
|
Taxable
|
1,660,020
|
68,642
|
4.14
|
1,448,851
|
62,023
|
4.28
|
1,167,719
|
52,766
|
4.52
|
|||||||||||||||||||||||||||
|
Tax-exempt
|
46,243
|
2,447
|
5.29
|
26,922
|
1,473
|
5.47
|
23,972
|
1,287
|
5.37
|
|||||||||||||||||||||||||||
|
Total loans
|
1,706,263
|
71,089
|
4.17
|
1,475,773
|
63,496
|
4.30
|
1,191,691
|
54,053
|
4.54
|
|||||||||||||||||||||||||||
|
Total interest-earning assets
|
2,038,513
|
$
|
80,770
|
3.96
|
%
|
1,837,977
|
$
|
76,340
|
4.15
|
%
|
1,631,680
|
$
|
68,924
|
4.23
|
%
|
|||||||||||||||||||||
|
Cash and due from banks
|
71,727
|
70,995
|
57,917
|
|||||||||||||||||||||||||||||||||
|
Other non-interest-earning assets
|
84,159
|
75,608
|
71,910
|
|||||||||||||||||||||||||||||||||
|
Total assets
|
$
|
2,194,399
|
$
|
1,984,580
|
$
|
1,761,507
|
||||||||||||||||||||||||||||||
|
Interest-bearing liabilities
|
||||||||||||||||||||||||||||||||||||
|
Savings, N.O.W. and money market deposits
|
$
|
846,543
|
$
|
2,084
|
0.25
|
%
|
$
|
721,989
|
$
|
1,383
|
0.19
|
%
|
$
|
665,626
|
$
|
1,162
|
0.17
|
%
|
||||||||||||||||||
|
Time deposits
|
221,695
|
1,305
|
0.59
|
230,546
|
1,422
|
0.62
|
226,998
|
1,309
|
0.58
|
|||||||||||||||||||||||||||
|
Total savings and time deposits
|
1,068,238
|
3,389
|
0.32
|
952,535
|
2,805
|
0.29
|
892,624
|
2,471
|
0.28
|
|||||||||||||||||||||||||||
|
Federal funds purchased
|
3
|
-
|
0.76
|
3
|
-
|
0.45
|
8
|
-
|
0.46
|
|||||||||||||||||||||||||||
|
Other borrowings
|
62,315
|
540
|
0.87
|
74,743
|
442
|
0.59
|
13,051
|
48
|
0.37
|
|||||||||||||||||||||||||||
|
Total interest-bearing liabilities
|
1,130,556
|
3,929
|
0.35
|
1,027,281
|
3,247
|
0.32
|
905,683
|
2,519
|
0.28
|
|||||||||||||||||||||||||||
|
Total cost of funds
|
0.20
|
0.18
|
0.16
|
|||||||||||||||||||||||||||||||||
|
Rate spread
|
3.61
|
3.83
|
3.95
|
|||||||||||||||||||||||||||||||||
|
Demand deposits
|
832,266
|
742,876
|
659,463
|
|||||||||||||||||||||||||||||||||
|
Other non-interest-bearing liabilities
|
23,684
|
23,638
|
17,812
|
|||||||||||||||||||||||||||||||||
|
Total liabilities
|
1,986,506
|
1,793,795
|
1,582,958
|
|||||||||||||||||||||||||||||||||
|
Stockholders' equity
|
207,893
|
190,785
|
178,549
|
|||||||||||||||||||||||||||||||||
|
Total liabilities and stockholders' equity
|
$
|
2,194,399
|
$
|
1,984,580
|
$
|
1,761,507
|
||||||||||||||||||||||||||||||
|
Net interest income (taxable- equivalent basis) and interest rate margin
|
76,841
|
3.77
|
%
|
73,093
|
3.98
|
%
|
66,405
|
4.07
|
%
|
|||||||||||||||||||||||||||
|
Less: taxable-equivalent basis adjustment
|
(3,051
|
)
|
(3,560
|
)
|
(3,871
|
)
|
||||||||||||||||||||||||||||||
|
Net interest income
|
$
|
73,790
|
$
|
69,533
|
$
|
62,534
|
||||||||||||||||||||||||||||||
Interest income on a taxable-equivalent basis includes the additional amount of interest income that would have been earned if the Company’s investment in tax-exempt securities and loans had been subject to federal and New York State income taxes yielding the same after-tax income. The rate used for this adjustment was approximately 35% for federal income taxes in 2016, 2015 and 2014, 4.5% for New York State income taxes in 2016 and 2015, and 3.5% for New York State income taxes in 2014. Loan fees included in interest income amounted to $1.9 million, $1.8 million and $1.5 million in 2016, 2015 and 2014, respectively.
Analysis of Changes in Net Interest Income
The following table presents a comparative analysis of the changes in the Company’s interest income and interest expense due to the changes in the average volume and the average rates earned on interest-earning assets and due to the changes in the average volume and the average rates paid on interest-bearing liabilities. Interest and average rates are computed on a fully taxable-equivalent basis. Variances in rate/volume relationships have been allocated proportionately to the amount of change in average volume and average rate (in thousands):
|
In 2016 over 2015
Changes Due to
|
In 2015 over 2014
Changes Due to
|
|||||||||||||||||||||||
|
Volume
|
Rate
|
Net
Change |
Volume
|
Rate
|
Net
Change |
|||||||||||||||||||
|
Interest-earning assets
|
||||||||||||||||||||||||
|
Securities:
|
||||||||||||||||||||||||
|
Taxable
|
$
|
(1,145
|
)
|
$
|
107
|
$
|
(1,038
|
)
|
$
|
(568
|
)
|
$
|
(51
|
)
|
$
|
(619
|
)
|
|||||||
|
Tax-exempt
|
(2,074
|
)
|
(395
|
)
|
(2,469
|
)
|
(1,708
|
)
|
260
|
(1,448
|
)
|
|||||||||||||
|
Total securities
|
(3,219
|
)
|
(288
|
)
|
(3,507
|
)
|
(2,276
|
)
|
209
|
(2,067
|
)
|
|||||||||||||
|
Federal Reserve and Federal Home Loan Bank stock and other investments
|
(1
|
)
|
53
|
52
|
129
|
(1
|
)
|
128
|
||||||||||||||||
|
Federal funds sold, securities purchased under agreements to resell and interest-bearing deposits due from banks
|
255
|
37
|
292
|
(88
|
)
|
-
|
(88
|
)
|
||||||||||||||||
|
Loans and performing loans held for sale (including non-accrual loans):
|
||||||||||||||||||||||||
|
Taxable
|
8,778
|
(2,159
|
)
|
6,619
|
12,171
|
(2,914
|
)
|
9,257
|
||||||||||||||||
|
Tax-exempt
|
1,023
|
(49
|
)
|
974
|
161
|
25
|
186
|
|||||||||||||||||
|
Total loans
|
9,801
|
(2,208
|
)
|
7,593
|
12,332
|
(2,889
|
)
|
9,443
|
||||||||||||||||
|
Total interest-earning assets
|
6,836
|
(2,406
|
)
|
4,430
|
10,097
|
(2,681
|
)
|
7,416
|
||||||||||||||||
|
Interest-bearing liabilities
|
||||||||||||||||||||||||
|
Savings, N.O.W. and money market deposits
|
251
|
450
|
701
|
101
|
120
|
221
|
||||||||||||||||||
|
Time deposits
|
(47
|
)
|
(70
|
)
|
(117
|
)
|
28
|
85
|
113
|
|||||||||||||||
|
Total savings and time deposits
|
204
|
380
|
584
|
129
|
205
|
334
|
||||||||||||||||||
|
Federal funds purchased
|
-
|
-
|
-
|
-
|
-
|
-
|
||||||||||||||||||
|
Other borrowings
|
(84
|
)
|
182
|
98
|
350
|
44
|
394
|
|||||||||||||||||
|
Total interest-bearing liabilities
|
120
|
562
|
682
|
479
|
249
|
728
|
||||||||||||||||||
|
Net change in net interest income (taxable-equivalent basis)
|
$
|
6,716
|
$
|
(2,968
|
)
|
$
|
3,748
|
$
|
9,618
|
$
|
(2,930
|
)
|
$
|
6,688
|
||||||||||
Investment Securities
The Company’s investment policy is conservative in nature and investment securities are purchased only after a disciplined evaluation to ensure that they are the most appropriate asset available given the Company’s objectives. Several key factors are considered before executing any transaction including:
| · |
Liquidity – the ease with which the security can be pledged or sold.
|
| · |
Credit quality – the likelihood the security will perform according to its original terms with timely payments of principal and interest.
|
| · |
Yield – the rate of return on the investment balanced against liquidity and credit quality.
|
The Company also considers certain key risk factors in its selection of investment securities:
| · |
Market risk – can be defined as the sensitivity of the portfolio’s market value to changes in the level of interest rates. Generally, the market value of fixed-rate securities increases when interest rates fall and decreases when interest rates rise. The longer the duration of the security, the greater sensitivity to changes in interest rates.
|
| · |
Income risk – is identified as the time period over which fixed payments associated with an investment security can be assured. Generally, the shorter the duration of the security, the greater this risk.
|
| · |
Asset/liability management – seeks to limit the change in net interest income as a result of changing interest rates. In a rising rate environment when the maturities or the intervals between the repricing of investments are longer than those of the liabilities that fund them, net interest income will decline. This is referred to as a liability-sensitive position. Conversely, when investments mature or are repriced sooner than their funding sources, net interest income will increase as interest rates rise. This is known as an asset-sensitive position. Asset/liability management attempts to manage the duration of the loan and investment portfolios, as well as that of all funding, to minimize the risk to net interest income while maximizing returns. Security selection is governed by the Company’s investment policy and serves to supplement the Company’s asset/liability position.
|
The Company seeks to create an investment portfolio that is diversified across different classes of assets. At December 31, 2016, the majority of the Company’s portfolio consisted of investments in municipal securities and mortgage-backed securities (“MBS”). To a lesser extent, the Company also has CMOs, corporate bonds and U,S, Government agency obligations. MBS are backed by a pool of mortgages in which investors share payments based on the percentage of the pool they own. The cash flows associated with CMOs are assigned to specific securities, or tranches, in the order in which they are received. Analysis of CMOs requires careful due diligence of the mortgages that serve as the underlying collateral. The Company does not own any mortgage obligations with underlying collateral that could be classified as sub-prime. Tranche structure, final maturity and credit support also provide improved assurance of repayment. The investment portfolio provides collateral for various liabilities to municipal depositors as well as enhances the Company’s liquidity position through cash flows and the ability to pledge these assets to secure various borrowing lines. Management has determined that no OTTI was present at December 31, 2016.
The Company’s average investment portfolio decreased by $86 million to $251 million in 2016 compared to $337 million in 2015. The decrease in the investment portfolio largely reflected maturities and calls of municipal obligations and U.S. Government agency securities totaling $105 million, coupled with principal paydowns of CMOs and MBS of U.S. Government-sponsored enterprises totaling $8 million and sales of municipal obligations totaling $7 million during 2016. These decreases were partially offset by purchases of CMOs and MBS of U.S. Government-sponsored enterprises, corporate bonds and municipal obligations totaling $13 million during the same period. The components of the average investment portfolio and the year-over-year net changes in average balances are presented below (in thousands).
|
For the Years Ended December 31,
|
2016
|
2015
|
||||||||||
|
Average Balance
|
Net Change
|
|||||||||||
|
U.S. Government agency securities
|
$
|
28,048
|
$
|
85,034
|
$
|
(56,986
|
)
|
|||||
|
Corporate bonds
|
14,347
|
8,460
|
5,887
|
|||||||||
|
Collateralized mortgage obligations
|
17,879
|
18,965
|
(1,086
|
)
|
||||||||
|
Mortgage-backed securities
|
94,151
|
89,940
|
4,211
|
|||||||||
|
Obligations of states and political subdivisions
|
96,894
|
134,651
|
(37,757
|
)
|
||||||||
|
Total investment securities
|
$
|
251,319
|
$
|
337,050
|
$
|
(85,731
|
)
|
|||||
The following table summarizes, at carrying value, the Company’s investment securities available for sale and held to maturity for each period (in thousands):
|
At December 31,
|
2016
|
2015
|
||||||
|
Investment securities available for sale:
|
||||||||
|
U.S. Government agency securities
|
$
|
-
|
$
|
28,516
|
||||
|
Corporate bonds
|
8,535
|
5,910
|
||||||
|
Collateralized mortgage obligations
|
17,452
|
15,549
|
||||||
|
Mortgage-backed securities
|
87,961
|
92,442
|
||||||
|
Obligations of states and political subdivisions
|
65,294
|
104,682
|
||||||
|
Total investment securities available for sale
|
179,242
|
247,099
|
||||||
|
Investment securities held to maturity:
|
||||||||
|
U.S. Government agency securities
|
2,380
|
43,570
|
||||||
|
Corporate bonds
|
6,000
|
6,000
|
||||||
|
Obligations of states and political subdivisions
|
10,400
|
11,739
|
||||||
|
Total investment securities held to maturity
|
18,780
|
61,309
|
||||||
|
Total investment securities
|
$
|
198,022
|
$
|
308,408
|
||||
The following table presents the distribution, by contractual maturity and the approximate weighted-average yields, of the Company’s investment portfolio at December 31, 2016 (dollars in thousands). All securities are presented at their carrying amounts.
|
Maturity (in years)
|
||||||||||||||||||||||||||||||||||||||||
|
Within 1
|
Yield
|
After 1 but
within 5
|
Yield
|
After 5 but
within 10
|
Yield
|
After 10
|
Yield
|
Total
|
Yield
|
|||||||||||||||||||||||||||||||
|
Investment securities available for sale:
|
||||||||||||||||||||||||||||||||||||||||
|
Corporate bonds
|
$
|
-
|
-
|
%
|
$
|
-
|
-
|
%
|
$
|
8,535
|
3.69
|
%
|
$
|
-
|
-
|
%
|
$
|
8,535
|
3.69
|
%
|
||||||||||||||||||||
|
Collateralized mortgage obligations (1)
|
-
|
-
|
17,452
|
1.89
|
-
|
-
|
-
|
-
|
17,452
|
1.89
|
||||||||||||||||||||||||||||||
|
Mortgage-backed securities (1)
|
6,221
|
1.52
|
70,226
|
2.01
|
11,514
|
2.45
|
-
|
-
|
87,961
|
2.03
|
||||||||||||||||||||||||||||||
|
Obligations of states and political subdivisions (2)
|
20,610
|
6.04
|
44,089
|
5.55
|
595
|
5.71
|
-
|
-
|
65,294
|
5.71
|
||||||||||||||||||||||||||||||
|
Total investment securities available for sale
|
26,831
|
4.99
|
131,767
|
3.18
|
20,644
|
3.06
|
-
|
-
|
179,242
|
3.44
|
||||||||||||||||||||||||||||||
|
Investment securities held to maturity:
|
||||||||||||||||||||||||||||||||||||||||
|
U.S. Government agency securities
|
-
|
-
|
-
|
-
|
2,380
|
2.30
|
-
|
-
|
2,380
|
2.30
|
||||||||||||||||||||||||||||||
|
Corporate bonds
|
-
|
-
|
-
|
-
|
6,000
|
5.50
|
-
|
-
|
6,000
|
5.50
|
||||||||||||||||||||||||||||||
|
Obligations of states and political subdivisions (2)
|
2,636
|
6.72
|
1,253
|
4.60
|
-
|
-
|
6,511
|
5.23
|
10,400
|
5.53
|
||||||||||||||||||||||||||||||
|
Total investment securities held to maturity
|
2,636
|
6.72
|
1,253
|
4.60
|
8,380
|
4.59
|
6,511
|
5.23
|
18,780
|
5.11
|
||||||||||||||||||||||||||||||
|
Total investment securities
|
$
|
29,467
|
5.15
|
%
|
$
|
133,020
|
3.19
|
%
|
$
|
29,024
|
3.50
|
%
|
$
|
6,511
|
5.23
|
%
|
$
|
198,022
|
3.59
|
%
|
||||||||||||||||||||
|
(1)
|
Assumes maturity dates pursuant to average lives.
|
|
(2)
|
The yields on obligations of states and political subdivisions are on a fully taxable-equivalent basis.
|
As a member of the Federal Reserve Bank (“FRB”) and the FHLB, the Bank owned 28,960 shares and 27,939 shares of FRB and FHLB stock, respectively, with book values of $1.4 million and $2.8 million, respectively, at December 31, 2016. There is no public market for these shares. The last dividends paid were 6.00% on FRB stock in December 2016 and 5.00% on FHLB stock in November 2016.
The Bank was a member of the Visa USA payment network and was issued Class B shares upon Visa’s initial public offering in March 2008. The Visa Class B shares are transferable only under limited circumstances until they can be converted into shares of the publicly traded class of stock. This conversion cannot happen until the settlement of certain litigation, which is indemnified by Visa members. Since its initial public offering, Visa has funded a litigation reserve based upon a change in the conversion ratio of Visa Class B shares into Visa Class A shares. At its discretion, Visa may continue to increase the conversion rate in connection with any settlements in excess of amounts then in escrow for that purpose and reduce the conversion rate to the extent that it adds any funds to the escrow in the future. Based on the existing transfer restriction and the uncertainty of the litigation, the Company has recorded its Visa Class B shares on its balance sheet at zero value.
In conjunction with the sale of Visa Class B shares in 2013, the Company entered into derivative swap contracts with the purchaser of these Visa Class B shares which provide for settlements between the purchaser and the Company based upon a change in the conversion ratio of Visa Class B shares into Visa Class A shares. At December 31, 2016, the Company still owned 38,638 Visa Class B shares.
Loans and the Allowance for Loan Losses
The following table categorizes the Company’s loan portfolio for each period (dollars in thousands):
|
At December 31,
|
2016
|
2015
|
2014
|
2013
|
2012
|
|||||||||||||||||||||||||||||||||||
|
Commercial and industrial
|
$
|
189,410
|
11.3
|
%
|
$
|
189,769
|
11.4
|
%
|
$
|
177,813
|
13.1
|
%
|
$
|
171,199
|
16.0
|
%
|
$
|
168,709
|
21.6
|
%
|
||||||||||||||||||||
|
Commercial real estate
|
731,986
|
43.7
|
696,787
|
41.8
|
560,524
|
41.4
|
464,560
|
43.5
|
359,211
|
46.0
|
||||||||||||||||||||||||||||||
|
Multifamily
|
402,935
|
24.0
|
426,549
|
25.6
|
309,666
|
22.8
|
184,624
|
17.3
|
9,261
|
1.2
|
||||||||||||||||||||||||||||||
|
Mixed use commercial
|
78,807
|
4.7
|
78,787
|
4.7
|
34,806
|
2.6
|
4,797
|
0.4
|
799
|
0.1
|
||||||||||||||||||||||||||||||
|
Real estate construction
|
41,028
|
2.5
|
37,233
|
2.2
|
26,206
|
1.9
|
6,565
|
0.6
|
15,469
|
2.0
|
||||||||||||||||||||||||||||||
|
Residential mortgages
|
185,112
|
11.0
|
186,313
|
11.2
|
187,828
|
13.9
|
169,552
|
15.9
|
146,575
|
18.8
|
||||||||||||||||||||||||||||||
|
Home equity
|
42,419
|
2.5
|
44,951
|
2.7
|
50,982
|
3.8
|
57,112
|
5.3
|
66,468
|
8.5
|
||||||||||||||||||||||||||||||
|
Consumer
|
4,867
|
0.3
|
6,058
|
0.4
|
7,602
|
0.5
|
10,439
|
1.0
|
14,288
|
1.8
|
||||||||||||||||||||||||||||||
|
Total loans
|
$
|
1,676,564
|
100.0
|
%
|
$
|
1,666,447
|
100.0
|
%
|
$
|
1,355,427
|
100.0
|
%
|
$
|
1,068,848
|
100.0
|
%
|
$
|
780,780
|
100.0
|
%
|
||||||||||||||||||||
The following table presents the contractual maturities of selected loans and the sensitivities of those loans to changes in interest rates at December 31, 2016 (in thousands):
|
One Year or
Less
|
One Through
Five Years
|
Over Five
Years
|
Total
|
|||||||||||||
|
Commercial and industrial
|
$
|
98,059
|
$
|
72,106
|
$
|
19,245
|
$
|
189,410
|
||||||||
|
Real estate construction
|
33,205
|
428
|
7,395
|
41,028
|
||||||||||||
|
Total
|
$
|
131,264
|
$
|
72,534
|
$
|
26,640
|
$
|
230,438
|
||||||||
|
Loans maturing after one year with:
|
||||||||||||||||
|
Fixed interest rate
|
$
|
44,155
|
$
|
18,468
|
$
|
62,623
|
||||||||||
|
Variable interest rate
|
$
|
28,379
|
$
|
8,172
|
$
|
36,551
|
||||||||||
Non-performing loans are defined as non-accrual loans and loans 90 days or more past due and still accruing. Recognition of interest income is discontinued when reasonable doubt exists as to whether principal or interest due can be collected. Loans of all classes will generally no longer accrue interest when over 90 days past due unless the loan is well-secured and in process of collection.
The following table shows non-performing loans for each period (in thousands):
|
At December 31,
|
2016
|
2015
|
2014
|
2013
|
2012
|
|||||||||||||||
|
Non-accrual loans
|
$
|
5,560
|
$
|
5,528
|
$
|
12,981
|
$
|
15,183
|
$
|
16,435
|
||||||||||
|
Loans 90 days or more past due and still accruing
|
-
|
-
|
-
|
-
|
-
|
|||||||||||||||
|
Total
|
$
|
5,560
|
$
|
5,528
|
$
|
12,981
|
$
|
15,183
|
$
|
16,435
|
||||||||||
Non-accrual loans totaled $5.6 million or 0.33% of loans outstanding at December 31, 2016 versus $5.5 million or 0.33% of loans outstanding at December 31, 2015. The allowance for loan losses as a percentage of total non-accrual loans amounted to 362% and 374% at December 31, 2016 and December 31, 2015, respectively. Total accruing loans delinquent 30 days or more amounted to $1.2 million or 0.07% of loans outstanding at December 31, 2016 compared to $1.0 million or 0.06% of loans outstanding at December 31, 2015.
Total criticized and classified loans were $30 million at December 31, 2016 versus $21 million at December 31, 2015. Criticized loans are those loans that are not classified but require some degree of heightened monitoring. Classified loans were $25 million at December 31, 2016 as compared to $12 million at December 31, 2015. As a result of the Company’s conservative approach to risk rating its loan portfolio, two performing relationships were downgraded in 2016 which accounted for the majority of the increase in classified loans. The allowance for loan losses as a percentage of total classified loans was 82% and 170%, respectively, at the same dates.
At December 31, 2016, the Company had $12 million in TDRs, primarily consisting of commercial and industrial loans, commercial real estate loans, residential mortgages and home equity loans totaling $4 million, $2 million, $5 million and $1 million, respectively. The Company had TDRs amounting to $12 million at December 31, 2015.
At December 31, 2016, the Company’s allowance for loan losses amounted to $20.1 million or 1.20% of period-end total loans outstanding. The allowance as a percentage of loans outstanding was 1.24% at December 31, 2015. The Company recorded net loan charge-offs of $68 thousand in 2016 versus net loan recoveries of $885 thousand in 2015. As a percentage of average total loans outstanding, these amounts represented 0.00% and (0.06%), respectively, in 2016 and 2015.
The following table presents an analysis of the Company’s allowance for loan losses for each period (dollars in thousands):
|
2016
|
2015
|
2014
|
2013
|
2012
|
||||||||||||||||
|
Balance, January 1
|
$
|
20,685
|
$
|
19,200
|
$
|
17,263
|
$
|
17,781
|
$
|
39,958
|
||||||||||
|
Charge-offs:
|
||||||||||||||||||||
|
Commercial and industrial
|
416
|
744
|
420
|
2,867
|
8,534
|
|||||||||||||||
|
Commercial real estate
|
103
|
-
|
-
|
383
|
15,794
|
|||||||||||||||
|
Real estate construction
|
-
|
-
|
-
|
-
|
3,671
|
|||||||||||||||
|
Residential mortgages
|
-
|
-
|
32
|
126
|
3,727
|
|||||||||||||||
|
Home equity
|
19
|
-
|
-
|
558
|
1,953
|
|||||||||||||||
|
Consumer
|
72
|
14
|
40
|
166
|
267
|
|||||||||||||||
|
Total charge-offs
|
610
|
758
|
492
|
4,100
|
33,946
|
|||||||||||||||
|
Recoveries:
|
||||||||||||||||||||
|
Commercial and industrial
|
264
|
1,524
|
797
|
2,077
|
2,456
|
|||||||||||||||
|
Commercial real estate
|
210
|
39
|
519
|
97
|
-
|
|||||||||||||||
|
Real estate construction
|
-
|
-
|
-
|
-
|
340
|
|||||||||||||||
|
Residential mortgages
|
42
|
32
|
16
|
5
|
115
|
|||||||||||||||
|
Home equity
|
13
|
22
|
50
|
32
|
246
|
|||||||||||||||
|
Consumer
|
13
|
26
|
47
|
121
|
112
|
|||||||||||||||
|
Total recoveries
|
542
|
1,643
|
1,429
|
2,332
|
3,269
|
|||||||||||||||
|
Net charge-offs (recoveries)
|
68
|
(885
|
)
|
(937
|
)
|
1,768
|
30,677
|
|||||||||||||
|
(Credit) provision for loan losses
|
(500
|
)
|
600
|
1,000
|
1,250
|
8,500
|
||||||||||||||
|
Balance, December 31
|
$
|
20,117
|
$
|
20,685
|
$
|
19,200
|
$
|
17,263
|
$
|
17,781
|
||||||||||
|
Year ended December 31,
|
2016
|
2015
|
2014
|
2013
|
2012
|
|||||||||||||||
|
Loans:
|
||||||||||||||||||||
|
Average
|
$
|
1,704,814
|
$
|
1,471,542
|
$
|
1,191,147
|
$
|
905,613
|
$
|
859,790
|
||||||||||
|
At end of period
|
1,676,564
|
1,666,447
|
1,355,427
|
1,068,848
|
780,780
|
|||||||||||||||
|
Non-performing loans/total loans (1)
|
0.33
|
%
|
0.33
|
%
|
0.96
|
%
|
1.42
|
%
|
2.10
|
%
|
||||||||||
|
Non-performing assets/total assets
|
0.30
|
0.25
|
0.68
|
0.89
|
1.17
|
|||||||||||||||
|
Net charge-offs (recoveries)/average loans
|
0.00
|
(0.06
|
)
|
(0.08
|
)
|
0.20
|
3.57
|
|||||||||||||
|
Allowance for loan losses/total loans (1)
|
1.20
|
1.24
|
1.42
|
1.62
|
2.28
|
|||||||||||||||
| (1) Excluding loans held-for-sale. | ||||||||||||||||||||
The following table presents the allocation of the Company’s allowance for loan losses by loan class for each period (dollars in thousands):
|
At December 31,
|
2016
|
% of
Total |
2015
|
% of
Total |
2014
|
% of
Total |
2013
|
% of
Total |
2012
|
% of
Total |
||||||||||||||||||||||||||||||
|
Commercial and industrial
|
$
|
2,132
|
10.6
|
%
|
$
|
1,875
|
9.1
|
%
|
$
|
1,560
|
8.1
|
%
|
$
|
2,615
|
15.1
|
%
|
$
|
6,181
|
34.8
|
%
|
||||||||||||||||||||
|
Commercial real estate
|
8,030
|
39.9
|
7,019
|
33.9
|
6,777
|
35.3
|
6,572
|
38.1
|
5,965
|
33.5
|
||||||||||||||||||||||||||||||
|
Multifamily
|
3,623
|
18.0
|
4,688
|
22.7
|
4,018
|
20.9
|
2,159
|
12.5
|
150
|
0.8
|
||||||||||||||||||||||||||||||
|
Mixed use commercial
|
730
|
3.6
|
766
|
3.7
|
261
|
1.4
|
54
|
0.3
|
34
|
0.2
|
||||||||||||||||||||||||||||||
|
Real estate construction
|
560
|
2.8
|
386
|
1.9
|
383
|
2.0
|
88
|
0.5
|
141
|
0.8
|
||||||||||||||||||||||||||||||
|
Residential mortgages
|
2,001
|
9.9
|
2,476
|
12.0
|
3,027
|
15.8
|
2,463
|
14.3
|
1,576
|
8.9
|
||||||||||||||||||||||||||||||
|
Home equity
|
515
|
2.6
|
639
|
3.1
|
709
|
3.7
|
745
|
4.3
|
907
|
5.1
|
||||||||||||||||||||||||||||||
|
Consumer
|
62
|
0.3
|
106
|
0.4
|
166
|
0.8
|
241
|
1.4
|
189
|
1.1
|
||||||||||||||||||||||||||||||
|
Unallocated
|
2,464
|
12.3
|
2,730
|
13.2
|
2,299
|
12.0
|
2,326
|
13.5
|
2,638
|
14.8
|
||||||||||||||||||||||||||||||
|
Total
|
$
|
20,117
|
100.0
|
%
|
$
|
20,685
|
100.0
|
%
|
$
|
19,200
|
100.0
|
%
|
$
|
17,263
|
100.0
|
%
|
$
|
17,781
|
100.0
|
%
|
||||||||||||||||||||
The Company recorded a $500 thousand credit to the provision for loan losses during 2016 versus a provision expense of $600 thousand in 2015.
For the year ended December 31, 2016, the ending balance of the Company’s allowance for loan losses decreased by $568 thousand when compared to December 31, 2015. During 2016, decreases in the Company’s allowance for loan losses allocated to multifamily loans and residential mortgages of $1.1 million and $475 thousand, respectively, were partially offset by an increase in the allowance for loan losses allocated to commercial real estate (“CRE”) loans of $1.0 million.
The decrease in the allowance for loan losses allocated to multifamily loans during 2016 largely reflected a decrease of $24 million in unimpaired pass rated multifamily loans, coupled with a 0.20% decrease during 2016 in the average combined historical loss and environmental factors rates on such unimpaired pass rated loans. The decrease in the allowance for loan losses allocated to residential mortgages was primarily attributable to a 0.12% decrease during 2016 in the average combined historical loss and environmental factors rates on unimpaired pass rated residential mortgages. The increase in the allowance for loan losses allocated to CRE loans during 2016 largely reflected an increase of $32 million in unimpaired pass rated CRE loans, coupled with a 0.06% increase during 2016 in the average combined historical loss and environmental factors rates on such unimpaired pass rated loans.
The loss factor rates incorporate a rolling twelve quarter look back period used in calculating historical losses for each loan segment. In an effort to more accurately represent the Company’s incurred and probable losses by individual loan segment, a twelve quarter period is used to improve the granularity of individual loan segment charge-off history and reduce the volatility associated with improperly weighting short-term trends in the calculation.
At December 31, 2016, the Company’s allowance for loan losses included an unallocated portion totaling $2.5 million. When compared to December 31, 2015, the ending balance of the Company’s unallocated portion of the allowance for loan losses decreased $266 thousand. Management has determined that the current level of the allowance for loan losses, including the unallocated portion, is adequate in relation to the probable inherent losses present in the portfolio. Management considers many factors in this analysis, among them credit risk grades, delinquency trends, concentrations within segments of the loan portfolio, recent charge-off experience, local and national economic conditions, current real estate market conditions in geographic areas where the Company’s loans are located, changes in the trend of non-performing loans, changes in interest rates and loan portfolio growth. Changes in one or a combination of these factors may adversely affect the Company’s loan portfolio resulting in increased delinquencies, loan losses and future levels of loan loss provisions. Due to these uncertainties, management expects to record loan charge-offs in future periods. (See also Critical Accounting Policies, Judgments and Estimates contained herein.)
Deposits
The following table presents the average balance and the average rate paid on the Company’s deposits for each period (dollars in thousands):
|
2016
|
2015
|
2014
|
||||||||||||||||||||||
|
Average
|
Average
Rate Paid |
Average
|
Average
Rate Paid |
Average
|
Average
Rate Paid |
|||||||||||||||||||
|
Demand deposits
|
$
|
832,266
|
-
|
%
|
$
|
742,876
|
-
|
%
|
$
|
659,463
|
-
|
%
|
||||||||||||
|
Savings deposits
|
345,822
|
0.14
|
315,898
|
0.15
|
302,385
|
0.15
|
||||||||||||||||||
|
N.O.W. and money market deposits
|
500,721
|
0.32
|
406,091
|
0.22
|
363,241
|
0.20
|
||||||||||||||||||
|
Time certificates of $100,000 or more
|
164,511
|
0.60
|
171,394
|
0.62
|
165,389
|
0.55
|
||||||||||||||||||
|
Other time deposits
|
57,184
|
0.56
|
59,152
|
0.62
|
61,609
|
0.64
|
||||||||||||||||||
|
Total
|
$
|
1,900,504
|
0.18
|
%
|
$
|
1,695,411
|
0.17
|
%
|
$
|
1,552,087
|
0.16
|
%
|
||||||||||||
The following table sets forth, by time remaining to maturity, the Company’s certificates of deposit of $100,000 or more at December 31, 2016 (in thousands):
|
3 months or less
|
$
|
100,127
|
||
|
Over 3 through 6 months
|
11,459
|
|||
|
Over 6 through 12 months
|
13,882
|
|||
|
Over 12 months
|
22,627
|
|||
|
Total
|
$
|
148,095
|
||
Borrowings
The Company may utilize both short-term and long-term borrowings which could include lines of credit for federal funds with correspondent banks, securities sold under agreements to repurchase and FHLB borrowings. The Company’s average total borrowings decreased $12 million during 2016 compared to 2015. The Company had borrowings of $15 million outstanding at December 31, 2016 versus $165 million outstanding at December 31, 2015.
The following provides information on the Company’s borrowings for each period (dollars in thousands):
|
Federal Home Loan Bank Borrowings
|
Federal Funds Purchased
|
|||||||||||||||
|
2016
|
2015
|
2016
|
2015
|
|||||||||||||
|
Daily average outstanding
|
$
|
62,315
|
$
|
74,743
|
$
|
3
|
$
|
3
|
||||||||
|
Average interest rate paid
|
0.87
|
%
|
0.59
|
%
|
0.76
|
%
|
0.45
|
%
|
||||||||
|
Maximum amount outstanding at any month-end
|
$
|
175,000
|
$
|
165,000
|
$
|
-
|
$
|
-
|
||||||||
|
December 31 balance
|
15,000
|
165,000
|
-
|
-
|
||||||||||||
|
Weighted-average interest rate on balances outstanding
|
1.76
|
%
|
0.63
|
%
|
-
|
%
|
-
|
%
|
||||||||
Contractual and Off-Balance Sheet Obligations
Shown below are the amounts of payments due under specified contractual obligations, aggregated by category of contractual obligation, for specified time periods. All information is as of December 31, 2016 (in thousands):
|
Contractual Obligations
|
Total
|
Less than 1 year
|
1 - 3 years
|
3 - 5 years
|
More than 5
years
|
|||||||||||||||
|
Time deposits
|
$
|
196,703
|
$
|
159,193
|
$
|
27,485
|
$
|
9,831
|
$
|
194
|
||||||||||
| FHLB borrowings | 15,000 | - | - | 15,000 | - | |||||||||||||||
|
Operating lease obligations
|
7,391
|
1,679
|
2,578
|
1,502
|
1,632
|
|||||||||||||||
|
Capital lease obligations
|
5,748
|
341
|
701
|
737
|
3,969
|
|||||||||||||||
|
Performance and financial letters of credit
|
14,270
|
13,959
|
220
|
-
|
91
|
|||||||||||||||
|
Total
|
$
|
239,112
|
$
|
175,172
|
$
|
30,984
|
$
|
27,070
|
$
|
5,886
|
||||||||||
The Company has not used, and has no intention to use, any significant off-balance sheet financing arrangements for liquidity purposes. Its primary financial instruments with off-balance sheet risk are limited to loan servicing for others and obligations to fund loans to customers pursuant to existing commitments.
Liquidity and Capital Resources
Liquidity management is defined as both the Company’s and the Bank’s ability to meet their financial obligations on a continuous basis without material loss or disruption of normal operations. These obligations include the withdrawal of deposits on demand or at their contractual maturity, the repayment of borrowings as they mature, funding new and existing loan commitments and the ability to take advantage of business opportunities as they arise. Asset liquidity is provided by short-term investments and the marketability of securities available for sale. The Company may also leave excess reserve balances at the FRB if the rate being paid is higher than would be available from other short-term investments. Liquid assets, consisting of federal funds sold, securities available for sale and balances at the FRB, decreased to $265 million at December 31, 2016 compared to $268 million at December 31, 2015. These liquid assets may include assets that have been pledged primarily against municipal deposits or borrowings. In addition, the Company has pledged mortgage-backed securities of U.S. Government-sponsored enterprises held in its available for sale portfolio, with a market value of approximately $3 million at December 31, 2016, as collateral for the derivative swap contracts. Liquidity is also provided by the maintenance of a base of core deposits, maturing short-term assets including cash and due from banks, the ability to sell or pledge marketable assets and access to lines of credit.
Liquidity is continuously monitored, thereby allowing management to better understand and react to emerging balance sheet trends, including temporary mismatches with regard to sources and uses of funds. After assessing actual and projected cash flow needs, management seeks to obtain funding at the most economical cost. These funds can be obtained by converting liquid assets to cash or by attracting new deposits or other sources of funding. Many factors affect the Company’s ability to meet liquidity needs, including variations in the markets served, loan demand, its asset/liability mix, its reputation and credit standing in its markets and general economic conditions. Borrowings and the scheduled amortization of investment securities and loans are more predictable funding sources. Deposit flows and securities prepayments are somewhat less predictable as they are often subject to external factors. Among these are changes in the local and national economies, competition from other financial institutions and changes in market interest rates.
The Company’s primary sources of funds are cash provided by deposits and borrowings, proceeds from maturities and sales of securities available for sale and cash provided by operating activities. At December 31, 2016, total deposits were $1.8 billion, an increase of $58 million when compared to December 31, 2015. Of the $197 million in total time deposits at December 31, 2016, $159 million are scheduled to mature within the next 12 months. Based on historical experience, the Company expects to be able to replace a substantial portion of those maturing deposits with comparable deposit products. At December 31, 2016 and 2015, the Company had $15 million and $165 million, respectively, in borrowings used to fund the growth in the Company’s loan portfolio. For the years ended December 31, 2016 and 2015, proceeds from sales and maturities of securities available for sale totaled $70 million and $51 million, respectively.
The Company’s primary uses of funds are for the origination of loans and the purchase of investment securities. For the year ended December 31, 2016, the Company had net loan originations for portfolio of $87 million compared to $334 million for the same period in 2015. The Company purchased investment securities totaling $13 million and $23 million during the years ended December 31, 2016 and 2015, respectively.
The Bank’s Asset/Liability and Funds Management Policy establishes specific policies and operating procedures governing liquidity levels to assist management in developing plans to address future and current liquidity needs. Management monitors the rates and cash flows from the loan and investment portfolios while also examining the maturity structure and volatility characteristics of liabilities to develop an optimum asset/liability mix. Available funding sources include retail, commercial and municipal deposits, purchased liabilities and stockholders’ equity. At December 31, 2016, access to approximately $662 million in FHLB lines of credit for overnight or term borrowings with maturities of up to thirty years was available. At December 31, 2016, approximately $60 million and $10 million in unsecured and secured lines of credit, respectively, extended by correspondent banks were also available to be utilized, if needed, for short-term funding purposes. At December 31, 2016, borrowings outstanding with the FHLB consisted entirely of $15 million in five-year term borrowings. No borrowings were outstanding under lines of credit with correspondent banks.
The Bank also has the ability to access the brokered deposit market. Deposits gathered through the Certificate of Deposit Account Registry Service (“CDARS”) are considered for regulatory purposes to be brokered deposits. At December 31, 2016, the Bank had $1 million in CDARS deposits outstanding.
The Company strives to maintain an efficient level of capital, commensurate with its risk profile, on which a competitive rate of return to stockholders will be realized over both the short and long term. Capital is managed to enhance stockholder value while providing flexibility for management to act opportunistically in a changing marketplace. Management continually evaluates the Company’s capital position in light of current and future growth objectives and regulatory guidelines. Total stockholders’ equity was $215 million at December 31, 2016 compared to $197 million at December 31, 2015. The increase in stockholders’ equity versus December 31, 2015 was primarily due to net income, net of dividends paid, recorded during 2016.
The Company and the Bank are subject to regulatory capital requirements. The Company’s tier 1 leverage, common equity tier 1 risk-based, tier 1 risk-based and total risk-based capital ratios were 10.31%, 13.50%, 13.50% and 14.72%, respectively, at December 31, 2016, exceeding all regulatory requirements. The Bank’s tier 1 leverage, common equity tier 1 risk-based, tier 1 risk-based and total risk-based capital ratios were 10.25%, 13.41%, 13.41% and 14.64%, respectively, at December 31, 2016. Each of these ratios exceeds the regulatory guidelines for a well-capitalized institution, the highest regulatory capital category. Moreover, capital rules also place limits on capital distributions and certain discretionary bonus payments if a banking organization does not maintain a buffer of common equity tier 1 capital above minimum capital requirements. The capital buffer requirement is being phased in beginning January 1, 2016 at 0.625% per year until it becomes 2.50% in 2019 and thereafter. At December 31, 2016, the Company’s and the Bank’s capital buffers were in excess of both the current and fully phased-in requirements.
In addition, the OCC, the Company’s primary bank regulator, established individual minimum capital ratios for the Bank, which requires the Bank to establish and maintain levels of capital greater than those generally required for a “well capitalized” institution, that requires it to maintain a tier 1 leverage ratio of at least 9%, a tier 1 risk-based capital ratio of at least 11% and a total risk-based capital ratio of at least 12%. At December 31, 2016, the Bank satisfied these capital ratios.
The Company did not repurchase any shares of its common stock during 2016. Repurchase of shares will occur only if management believes that the purchase will be at prices that are accretive to earnings per share and is the most efficient use of the Company’s capital.
The Company’s total stockholders’ equity to total assets ratio and the Company’s tangible common equity to tangible assets ratio (“TCE ratio”) were 10.28% and 10.16%, respectively, at December 31, 2016 versus 9.10% and 8.98%, respectively, at December 31, 2015. The ratio of total stockholders’ equity to total assets is the most comparable U.S. GAAP measure to the non-GAAP TCE ratio presented herein. The ratio of tangible common equity to tangible assets, or TCE ratio, is calculated by dividing total common stockholders’ equity by total assets, after reducing both amounts by intangible assets. The TCE ratio is not required by U.S. GAAP or by applicable bank regulatory requirements, but is a metric used by management to evaluate the adequacy of our capital levels. Since there is no authoritative requirement to calculate the TCE ratio, our TCE ratio is not necessarily comparable to similar capital measures disclosed or used by other companies in the financial services industry. Tangible common equity and tangible assets are non-GAAP financial measures and should be considered in addition to, not as a substitute for or superior to, financial measures determined in accordance with U.S. GAAP. Set forth below are the reconciliations of tangible common equity to U.S. GAAP total common stockholders’ equity and tangible assets to U.S. GAAP total assets at December 31, 2016 (in thousands).
|
|
|
Ratios
|
|||||||||||||||
|
Total stockholders' equity
|
$
|
215,028
|
Total assets
|
$
|
2,092,291
|
10.28
|
%
|
(1)
|
|
||||||||
|
Less: intangible assets
|
(2,722
|
)
|
Less: intangible assets
|
(2,722
|
)
|
||||||||||||
|
Tangible common equity
|
$
|
212,306
|
Tangible assets
|
$
|
2,089,569
|
10.16
|
%
|
(2)
|
|
||||||||
|
(1)
|
The ratio of total stockholders' equity to total assets is the most comparable U.S. GAAP measure to the non-GAAP tangible common equity ratio presented herein.
|
|
|
(2)
|
TCE ratio.
|
All dividends must conform to applicable statutory requirements. The Company’s ability to pay dividends to stockholders depends on the Bank’s ability to pay dividends to the Company. Under 12 USC 56-9, a national bank may not pay a dividend on its common stock if the dividend would exceed net undivided profits then on hand. Further, under 12 USC 60, a national bank must obtain prior approval from the OCC to pay dividends on either common or preferred stock that would exceed the bank’s net profits for the current year combined with retained net profits (net profits minus dividends paid during that period) of the prior two years. The ability of the Bank to pay dividends to the Company is subject to certain regulatory restrictions. Generally, dividends declared in a given year by a national bank are limited to its net profit, as defined by regulatory agencies, for that year, combined with its retained net income for the preceding two years, less any required transfer to surplus or to fund for the retirement of any preferred stock. In addition, a national bank may not pay dividends in an amount greater than its undivided profits or declare any dividends if such declaration would leave the bank inadequately capitalized. At December 31, 2016, $47.3 million was available for dividends from the Bank to the Company.
The Company’s Board of Directors declared four quarterly cash dividends totaling $0.40 per common share in 2016. Dividends totaling $0.32 per common share were declared in 2015.
Asset/Liability Management
The process by which financial institutions manage interest-earning assets and funding sources under different interest rate environments is called asset/liability management. The principal objective of the Company’s asset/liability management program is to maximize net interest income within an acceptable range of overall risk. Management must ensure that liquidity, capital, interest rate and market risk are prudently managed. Monitoring and managing this risk is a crucial part of the Company’s asset/liability management program. The program is governed by policies established by the Company’s Board of Directors. These policies are reviewed and approved no less than annually. The Board of Directors delegates responsibility for asset/liability management to the Asset/Liability Management Committee (“ALCO”). The ALCO develops guidelines and strategies to implement the approved policies. The ALCO includes members of the Board of Directors as well as executive and senior officers of the Bank. It uses computer simulations to quantify interest rate risk and to project liquidity. The simulations also assist the ALCO in developing contingent strategies to increase net interest income. The ALCO assesses the impact of any change in strategy on the Company’s ability to grant loans and repay deposits. The Company has not used forward contracts or interest rate swaps to manage interest rate risk.
Interest Rate Sensitivity
Interest rate sensitivity is determined by the time period when each asset and liability in the Company’s portfolio can be repriced. Sensitivity increases when interest-earning assets and interest-bearing liabilities reprice in different time horizons. While this analysis presents the volume of assets and liabilities repricing in each time period, it does not consider how quickly various assets and liabilities might actually be repriced in response to changes in interest rates. Management reviews its interest rate sensitivity regularly and adjusts its asset/liability management strategy accordingly. Because the interest rates on assets and liabilities vary according to their maturity, management may selectively mismatch the repricing of assets and liabilities to take advantage of temporary or projected differences between short- and long-term interest rates.
The accompanying table sets forth the amounts of interest-earning assets and interest-bearing liabilities outstanding at December 31, 2016 which, based upon certain assumptions, are expected to reprice or mature in each of the time frames shown. When monitoring this interest-sensitivity gap position, management recognizes that these static measurements do not reflect the results of any projected activity and are best utilized as early indicators of potential interest rate exposures. Rather, management relies on net interest income simulation analysis as its primary tool to manage the Company's asset/liability position on a dynamic repricing basis.
|
(dollars in thousands)
|
0 to 3
Months
|
4 to 6
Months
|
7 to 12
Months
|
1 to 3
Years
|
More Than
3 Years
|
Not Rate
Sensitive
|
Total
|
|||||||||||||||||||||
|
Interest-earning assets
|
||||||||||||||||||||||||||||
|
Loans and performing loans held for sale (1)
|
$
|
301,229
|
$
|
73,358
|
$
|
142,567
|
$
|
471,305
|
$
|
682,853
|
$
|
5,252
|
$
|
1,676,564
|
||||||||||||||
|
Federal Reserve and Federal Home Loan
|
||||||||||||||||||||||||||||
|
Bank stock and other investments (2)
|
-
|
-
|
-
|
-
|
-
|
4,524
|
4,524
|
|||||||||||||||||||||
|
Investment securities (3)
|
7,293
|
16,052
|
12,484
|
68,403
|
93,790
|
-
|
198,022
|
|||||||||||||||||||||
|
Interest-bearing deposits with banks and fed funds sold
|
87,282
|
-
|
-
|
-
|
-
|
-
|
87,282
|
|||||||||||||||||||||
|
Total interest-earning assets
|
$
|
395,804
|
$
|
89,410
|
$
|
155,051
|
$
|
539,708
|
$
|
776,643
|
$
|
9,776
|
$
|
1,966,392
|
||||||||||||||
|
Interest-bearing liabilities
|
||||||||||||||||||||||||||||
|
Savings, N.O.W. and money market deposits (4)
|
$
|
336,048
|
$
|
32,381
|
$
|
24,927
|
$
|
108,027
|
$
|
272,692
|
$
|
-
|
$
|
774,075
|
||||||||||||||
|
Time deposits (5)
|
115,483
|
19,816
|
23,894
|
27,485
|
10,025
|
-
|
196,703
|
|||||||||||||||||||||
|
Borrowings
|
-
|
-
|
-
|
-
|
15,000
|
-
|
15,000
|
|||||||||||||||||||||
|
Total interest-bearing liabilities
|
$
|
451,531
|
$
|
52,197
|
$
|
48,821
|
$
|
135,512
|
$
|
297,717
|
$
|
-
|
$
|
985,778
|
||||||||||||||
|
Gap
|
$
|
(55,727
|
)
|
$
|
37,213
|
$
|
106,230
|
$
|
404,196
|
$
|
478,926
|
$
|
9,776
|
$
|
980,614
|
|||||||||||||
|
Cumulative difference between interest earning assets and interest-bearing liabilities
|
$
|
(55,727
|
)
|
$
|
(18,514
|
)
|
$
|
87,716
|
$
|
491,912
|
$
|
970,838
|
$
|
980,614
|
||||||||||||||
|
Cumulative difference/total assets
|
(2.66
|
%)
|
(0.89
|
%)
|
4.19
|
%
|
23.52
|
%
|
46.42
|
%
|
46.89
|
%
|
||||||||||||||||
|
(1)
|
Based on contractual maturity and instrument repricing date if applicable; projected prepayments and prepayments of principal based on experience.
|
| (2) |
Federal Reserve and Federal Home Loan Bank stock and other investments is not considered rate sensitive.
|
|
(3)
|
Based on contractual maturity, instrument repricing dates if applicable and projected prepayments.
|
| (4) |
Savings and N.O.W. deposits decay is calculated using an estimated weighted-average life of 6.4 years. Money market deposits are included in the 0 to 3 months category.
|
| (5) |
Based on contractual maturity.
|
At December 31, 2016, the Company’s balance sheet exhibited an asset sensitive posture over both the one year and longer-term time horizons which may result in an increase in net interest income if interest rates rise. Conversely, if interest rates decline, net interest income may be reduced.
Interest Rate Risk
Interest rate risk is the potential adverse change to earnings or capital arising from movements in interest rates. Interest rate risk arises from repricing risk, basis risk, yield curve risk and option risk, and is measured using financial modeling techniques including interest rate ramp and shock simulations. Interest rate risk depicts the sensitivity of earnings to changes in interest rates. As interest rates change, interest income and expense also change, thereby changing net interest income (“NII”). NII is the primary component of the Company’s earnings. The ALCO uses a detailed, dynamic model to quantify the effect of sustained changes in interest rates on NII. The ALCO routinely monitors simulated NII sensitivity two years into the future in relation to its established policy guidelines. The ALCO will also examine changes in NII under longer time horizons of up to five years and utilize additional tools in monitoring long term interest rate risk. The model simulations are used to determine whether corrective action may be warranted or required in order to adjust the overall interest rate risk profile of the Company. Simulation modeling applies alternative interest rate scenarios to the Company’s balance sheet to estimate the related impact on NII. The use of simulation modeling assists management in its continuing efforts to achieve earnings stability in a variety of interest rate environments.
The Company’s asset/liability and interest rate risk management policy generally limits interest rate risk exposure to ranges of -10% to -20% and -15% to -25% of the base case net interest income for net earnings at risk at the 12-month and 24-month time horizons, respectively. Net earnings at risk is the potential adverse change in net interest income arising from up to -100 and +400 basis point changes in interest rates over a 12 month period, and measured over a 24 month time horizon. The Company’s balance sheet is held flat over the 24 month time horizon with all principal cash flows assumed to be reinvested in similar products and term points at the simulated market interest rates. Any such estimates should not be interpreted as the Company’s forecast, and should not be considered as indicative of management’s expectations for operating results. They are hypothetical estimates that are based on many assumptions including: the nature and timing of changes in interest rates, the shape of the yield curve (variations in interest rates for financial instruments of varying maturity at a given moment in time), prepayments on loans and securities, deposit outflows, pricing on loans and deposits, and the reinvestment of cash flows from assets and liabilities, among other things. While these assumptions are based on management’s best estimate of current economic conditions, the Company cannot give any assurance that they will actually predict results, nor can they anticipate how the behavior of customers and competitors may change in the future.
Generally, the Company may be considered asset sensitive when net interest income increases in a rising interest rate environment or decreases under a falling interest rate scenario. Similarly, the Company may be considered liability sensitive when net interest income increases in a falling interest rate environment or decreases in a rising interest rate environment. At December 31, 2016, the Company’s balance sheet exhibited an asset sensitive posture over both the short-term and long-term time horizons.
The following table presents the Company’s NII sensitivity at December 31, 2016, assuming no growth in assets or liabilities, under a 100 basis point change in interest rates downward and a 200 basis point change upward.
|
Estimated NII Sensitivity
at December 31, 2016
|
||||||||||||
|
Time Horizon
|
-100 basis point rate ramp
|
Base case
|
+200 basis point rate ramp
|
|||||||||
|
Year One
|
(1.8
|
%)
|
0.0
|
%
|
1.0
|
%
|
||||||
|
Year Two
|
(6.3
|
%)
|
0.1
|
%
|
6.1
|
%
|
||||||
When appropriate, ALCO may use off-balance sheet instruments such as interest rate floors, caps, and swaps to hedge its position with regard to interest rate risk. The Board of Directors has approved a hedging policy statement that governs the use of such instruments. At December 31, 2016, there were no derivative financial instruments outstanding for hedging purposes.
Market Risk
Market risk is the possibility that a financial instrument will lose value as the result of adverse changes in market prices, interest rates, foreign currency exchange rates, commodity prices or the prices of equity securities. The Company’s primary exposure to market risk is from changing interest rates. The Company’s operations are subject to market risk resulting from fluctuations in interest rates to the extent that there is a difference between the amounts of interest-earning assets and interest-bearing liabilities that are prepaid, withdrawn, mature or repriced in any given period of time. The Company recognizes that changes in interest rates affect the underlying value of its assets, liabilities and off-balance sheet instruments because the present value of future cash flows (and the cash flows themselves) change when interest rates change.
Economic Value of Equity (“EVE”) is defined as the present value of the Bank’s assets, less the present value of its liabilities, +/- the net present value of any off-balance sheet items. The Company’s earnings or the net value of its portfolio will change under different interest rate scenarios. Management uses scenario analysis on a static basis to assess its equity value at risk by modeling the potential adverse changes in EVE arising from an immediate hypothetical shock in interest rates.
The following table presents the Company’s EVE sensitivity at December 31, 2016.
|
Rate Change
|
Estimated EVE Sensitivity
at December 31, 2016
|
|||
|
+200 basis point shock
|
10.0
|
%
|
||
|
-100 basis point shock
|
(16.3
|
%)
|
||
When modeling EVE at risk, management recognizes the high degree of subjectivity when projecting long-term cash flows and reinvestment rates. The Bank will utilize the EVE sensitivity measurement as a barometer of interest rate risk in conjunction with its primary tool, income simulation. The Bank recognizes that monitoring of its EVE sensitivity ratios may assist in the early identification of exposure to changing interest rates.
REPORT OF INDEPENDENT REGISTERED PUBLIC ACCOUNTING FIRM
Board of Directors and Stockholders
Suffolk Bancorp
Riverhead, New York
We have audited the accompanying consolidated statements of condition of Suffolk Bancorp and subsidiaries (collectively the “Company”) as of December 31, 2016 and 2015 and the related consolidated statements of income, comprehensive income, changes in stockholders’ equity, and cash flows for each of the three years in the period ended December 31, 2016. These financial statements are the responsibility of the Company’s management. Our responsibility is to express an opinion on these financial statements and schedules based on our audits.
We conducted our audits in accordance with the standards of the Public Company Accounting Oversight Board (United States). Those standards require that we plan and perform the audit to obtain reasonable assurance about whether the financial statements are free of material misstatement. An audit includes examining, on a test basis, evidence supporting the amounts and disclosures in the financial statements, assessing the accounting principles used and significant estimates made by management, as well as evaluating the overall financial statement presentation. We believe that our audits provide a reasonable basis for our opinion.
In our opinion, the consolidated financial statements referred to above present fairly, in all material respects, the financial position of Suffolk Bancorp and subsidiaries at December 31, 2016 and 2015, and the results of their operations and their cash flows for each of the three years in the period ended December 31, 2016, in conformity with accounting principles generally accepted in the United States of America.
We also have audited, in accordance with the standards of the Public Company Accounting Oversight Board (United States), Suffolk Bancorp and subsidiaries’ internal control over financial reporting as of December 31, 2016, based on criteria established in Internal Control – Integrated Framework (2013) issued by the Committee of Sponsoring Organizations of the Treadway Commission (COSO) and our report dated March 27, 2017, expressed an unqualified opinion thereon.
/s/ BDO USA, LLP
New York, New York
March 27, 2017
SUFFOLK BANCORP AND SUBSIDIARIES
CONSOLIDATED STATEMENTS OF CONDITION
December 31, 2016 and December 31, 2015
(dollars in thousands, except per share data)
|
December 31, 2016
|
December 31, 2015
|
|||||||
|
ASSETS
|
||||||||
|
Cash and cash equivalents
|
||||||||
|
Cash and non-interest-bearing deposits due from banks
|
$
|
37,572
|
$
|
75,272
|
||||
|
Interest-bearing deposits due from banks
|
87,282
|
22,814
|
||||||
|
Total cash and cash equivalents
|
124,854
|
98,086
|
||||||
|
Federal Reserve and Federal Home Loan Bank stock and other investments
|
4,524
|
10,756
|
||||||
|
Investment securities:
|
||||||||
|
Available for sale, at fair value
|
179,242
|
247,099
|
||||||
|
Held to maturity (fair value of $19,259 and $63,272, respectively)
|
18,780
|
61,309
|
||||||
|
Total investment securities
|
198,022
|
308,408
|
||||||
|
Loans
|
1,676,564
|
1,666,447
|
||||||
|
Allowance for loan losses
|
20,117
|
20,685
|
||||||
|
Net loans
|
1,656,447
|
1,645,762
|
||||||
|
Loans held for sale
|
-
|
1,666
|
||||||
|
Premises and equipment, net
|
24,725
|
23,240
|
||||||
|
Bank-owned life insurance
|
53,756
|
52,383
|
||||||
|
Deferred tax assets, net
|
14,384
|
15,845
|
||||||
|
Accrued interest and loan fees receivable
|
5,742
|
5,859
|
||||||
|
Goodwill and other intangibles
|
2,722
|
2,864
|
||||||
|
Other real estate owned ("OREO")
|
650
|
-
|
||||||
|
Other assets
|
6,465
|
3,723
|
||||||
|
TOTAL ASSETS
|
$
|
2,092,291
|
$
|
2,168,592
|
||||
|
LIABILITIES & STOCKHOLDERS' EQUITY
|
||||||||
|
Demand deposits
|
$
|
867,404
|
$
|
787,944
|
||||
|
Savings, N.O.W. and money market deposits
|
774,075
|
768,036
|
||||||
|
Subtotal core deposits
|
1,641,479
|
1,555,980
|
||||||
|
Time deposits
|
196,703
|
224,643
|
||||||
|
Total deposits
|
1,838,182
|
1,780,623
|
||||||
|
Borrowings
|
15,000
|
165,000
|
||||||
|
Unfunded pension liability
|
7,997
|
6,428
|
||||||
|
Capital leases
|
4,261
|
4,395
|
||||||
|
Other liabilities
|
11,823
|
14,888
|
||||||
|
TOTAL LIABILITIES
|
1,877,263
|
1,971,334
|
||||||
|
COMMITMENTS AND CONTINGENT LIABILITIES STOCKHOLDERS' EQUITY
|
||||||||
|
Common stock (par value $2.50; 15,000,000 shares authorized;issued 14,102,617 and 13,966,292, respectively;outstanding 11,936,879 and 11,800,554, respectively)
|
35,256
|
34,916
|
||||||
|
Surplus
|
49,532
|
46,239
|
||||||
|
Retained earnings
|
145,173
|
130,093
|
||||||
|
Treasury stock at par (2,165,738 shares)
|
(5,414
|
)
|
(5,414
|
)
|
||||
|
Accumulated other comprehensive loss, net of tax
|
(9,519
|
)
|
(8,576
|
)
|
||||
|
TOTAL STOCKHOLDERS' EQUITY
|
215,028
|
197,258
|
||||||
|
TOTAL LIABILITIES AND STOCKHOLDERS' EQUITY
|
$
|
2,092,291
|
$
|
2,168,592
|
||||
See accompanying notes to consolidated financial statements.
SUFFOLK BANCORP AND SUBSIDIARIES
CONSOLIDATED STATEMENTS OF INCOME
For the Years Ended December 31, 2016, 2015 and 2014
(dollars in thousands, except per share data)
|
For the Years Ended December 31,
|
||||||||||||
|
2016
|
2015
|
2014
|
||||||||||
|
INTEREST INCOME
|
||||||||||||
|
Loans and loan fees
|
$
|
70,128
|
$
|
62,914
|
$
|
53,570
|
||||||
|
U.S. Government agency obligations
|
676
|
2,079
|
2,320
|
|||||||||
|
Obligations of states and political subdivisions
|
3,400
|
4,774
|
5,812
|
|||||||||
|
Collateralized mortgage obligations
|
353
|
593
|
860
|
|||||||||
|
Mortgage-backed securities
|
1,846
|
1,767
|
1,936
|
|||||||||
|
Corporate bonds
|
630
|
311
|
253
|
|||||||||
|
Federal funds sold, securities purchased under agreements to resell and interest-bearing deposits due from banks
|
354
|
62
|
150
|
|||||||||
|
Dividends
|
332
|
280
|
152
|
|||||||||
|
Total interest income
|
77,719
|
72,780
|
65,053
|
|||||||||
|
INTEREST EXPENSE
|
||||||||||||
|
Savings, N.O.W. and money market deposits
|
2,084
|
1,383
|
1,162
|
|||||||||
|
Time deposits
|
1,305
|
1,422
|
1,309
|
|||||||||
|
Borrowings
|
540
|
442
|
48
|
|||||||||
|
Total interest expense
|
3,929
|
3,247
|
2,519
|
|||||||||
|
Net interest income
|
73,790
|
69,533
|
62,534
|
|||||||||
|
(Credit) provision for loan losses
|
(500
|
)
|
600
|
1,000
|
||||||||
|
Net interest income after (credit) provision for loan losses
|
74,290
|
68,933
|
61,534
|
|||||||||
|
NON-INTEREST INCOME
|
||||||||||||
|
Service charges on deposit accounts
|
2,449
|
3,042
|
3,681
|
|||||||||
|
Other service charges, commissions and fees
|
2,891
|
2,718
|
3,084
|
|||||||||
|
Fiduciary fees
|
-
|
-
|
1,023
|
|||||||||
|
Net gain on sale of securities available for sale
|
617
|
319
|
19
|
|||||||||
|
Net gain on sale of portfolio loans
|
457
|
568
|
217
|
|||||||||
|
Net gain on sale of mortgage loans originated for sale
|
292
|
356
|
283
|
|||||||||
|
Net gain on sale of premises and equipment
|
-
|
-
|
751
|
|||||||||
|
Income from bank-owned life insurance
|
1,373
|
1,274
|
1,355
|
|||||||||
|
Other operating income
|
404
|
317
|
487
|
|||||||||
|
Total non-interest income
|
8,483
|
8,594
|
10,900
|
|||||||||
|
OPERATING EXPENSES
|
||||||||||||
|
Employee compensation and benefits
|
35,029
|
33,446
|
34,560
|
|||||||||
|
Occupancy expense
|
5,476
|
5,675
|
5,535
|
|||||||||
|
Equipment expense
|
1,829
|
1,636
|
1,730
|
|||||||||
|
Consulting and professional services
|
2,128
|
2,159
|
2,626
|
|||||||||
|
FDIC assessment
|
953
|
1,082
|
1,031
|
|||||||||
|
Data processing
|
811
|
2,123
|
2,204
|
|||||||||
|
Merger costs
|
2,434
|
-
|
-
|
|||||||||
|
Nonrecurring project costs
|
-
|
1,443
|
-
|
|||||||||
|
Other operating expenses
|
6,660
|
6,390
|
5,733
|
|||||||||
|
Total operating expenses
|
55,320
|
53,954
|
53,419
|
|||||||||
|
Income before income tax expense
|
27,453
|
23,573
|
19,015
|
|||||||||
|
Income tax expense
|
7,622
|
5,886
|
3,720
|
|||||||||
|
NET INCOME
|
$
|
19,831
|
$
|
17,687
|
$
|
15,295
|
||||||
|
EARNINGS PER COMMON SHARE - BASIC
|
$
|
1.67
|
$
|
1.50
|
$
|
1.32
|
||||||
|
EARNINGS PER COMMON SHARE - DILUTED
|
$
|
1.66
|
$
|
1.49
|
$
|
1.31
|
||||||
|
WEIGHTED AVERAGE COMMON SHARES - BASIC
|
11,882,647
|
11,756,451
|
11,626,354
|
|||||||||
|
WEIGHTED AVERAGE COMMON SHARES - DILUTED
|
11,972,372
|
11,833,504
|
11,682,142
|
|||||||||
See accompanying notes to consolidated financial statements.
SUFFOLK BANCORP AND SUBSIDIARIES
CONSOLIDATED STATEMENTS OF COMPREHENSIVE INCOME
For the Years Ended December 31, 2016, 2015 and 2014
(in thousands)
|
For the Years Ended December 31,
|
||||||||||||
|
2016
|
2015
|
2014
|
||||||||||
|
Net income
|
$
|
19,831
|
$
|
17,687
|
$
|
15,295
|
||||||
|
Other comprehensive income (loss), net of tax and reclassification adjustments:
|
||||||||||||
|
Net unrealized holding (loss) gain on securities available for sale arising during the period,net of tax of ($887), ($766) and $4,060, respectively
|
(1,334
|
)
|
(1,201
|
)
|
6,732
|
|||||||
|
Change in unrealized gain (loss) on securities transferred from available for sale to held to maturity, net of tax of $881, $250 and ($1,180), respectively
|
1,324
|
410
|
(1,805
|
)
|
||||||||
|
Net actuarial adjustment on pension and post-retirement plan benefit obligation,net of tax of ($648), ($628) and ($2,929), respectively
|
(933
|
)
|
(942
|
)
|
(4,481
|
)
|
||||||
|
Total other comprehensive (loss) income, net of tax
|
(943
|
)
|
(1,733
|
)
|
446
|
|||||||
|
Total comprehensive income
|
$
|
18,888
|
$
|
15,954
|
$
|
15,741
|
||||||
See accompanying notes to consolidated financial statements.
SUFFOLK BANCORP AND SUBSIDIARIES
CONSOLIDATED STATEMENTS OF CHANGES IN STOCKHOLDERS' EQUITY
For the Years Ended December 31, 2016, 2015 and 2014
(dollars in thousands, except per share data)
|
For the Years Ended December 31,
|
||||||||||||
|
2016
|
2015
|
2014
|
||||||||||
|
Common stock
|
||||||||||||
|
Balance, January 1
|
$
|
34,916
|
$
|
34,591
|
$
|
34,348
|
||||||
|
Dividend reinvestment (80,499, 33,566 and 6,671 shares issued, respectively)
|
201
|
85
|
16
|
|||||||||
|
Stock options exercised (11,300, 39,334 and 18,735 shares issued, respectively)
|
28
|
98
|
46
|
|||||||||
|
Stock-based compensation
|
111
|
142
|
181
|
|||||||||
|
Ending balance
|
35,256
|
34,916
|
34,591
|
|||||||||
|
Surplus
|
||||||||||||
|
Balance, January 1
|
46,239
|
44,230
|
43,280
|
|||||||||
|
Dividend reinvestment
|
2,100
|
761
|
120
|
|||||||||
|
Stock options exercised
|
173
|
441
|
200
|
|||||||||
|
Stock-based compensation
|
1,020
|
807
|
630
|
|||||||||
|
Ending balance
|
49,532
|
46,239
|
44,230
|
|||||||||
|
Retained earnings
|
||||||||||||
|
Balance, January 1
|
130,093
|
116,169
|
102,273
|
|||||||||
|
Net income
|
19,831
|
17,687
|
15,295
|
|||||||||
|
Cash dividends on common stock ($0.40, $0.32 and $0.12 per share, respectively)
|
(4,751
|
)
|
(3,763
|
)
|
(1,399
|
)
|
||||||
|
Ending balance
|
145,173
|
130,093
|
116,169
|
|||||||||
|
Treasury stock
|
||||||||||||
|
Balance, January 1
|
(5,414
|
)
|
(5,414
|
)
|
(5,414
|
)
|
||||||
|
Ending balance
|
(5,414
|
)
|
(5,414
|
)
|
(5,414
|
)
|
||||||
|
Accumulated other comprehensive loss, net of tax
|
||||||||||||
|
Balance, January 1
|
(8,576
|
)
|
(6,843
|
)
|
(7,289
|
)
|
||||||
|
Other comprehensive (loss) income
|
(943
|
)
|
(1,733
|
)
|
446
|
|||||||
|
Ending balance
|
(9,519
|
)
|
(8,576
|
)
|
(6,843
|
)
|
||||||
|
Total stockholders' equity
|
$
|
215,028
|
$
|
197,258
|
$
|
182,733
|
||||||
See accompanying notes to consolidated financial statements.
SUFFOLK BANCORP AND SUBSIDIARIES
CONSOLIDATED STATEMENTS OF CASH FLOWS
For the Years Ended December 31, 2016, 2015 and 2014
(in thousands)
|
For the Years Ended December 31,
|
||||||||||||
|
2016
|
2015
|
2014
|
||||||||||
|
NET INCOME
|
$
|
19,831
|
$
|
17,687
|
$
|
15,295
|
||||||
|
ADJUSTMENTS TO RECONCILE NET INCOME TO NET CASH PROVIDED BY OPERATING ACTIVITIES
|
||||||||||||
|
(Credit) provision for loan losses
|
(500
|
)
|
600
|
1,000
|
||||||||
|
Depreciation and amortization
|
2,429
|
2,331
|
2,358
|
|||||||||
|
Stock-based compensation - net
|
1,131
|
949
|
811
|
|||||||||
|
Net amortization of premiums
|
1,155
|
1,136
|
1,188
|
|||||||||
|
Originations of mortgage loans held for sale
|
(37,198
|
)
|
(39,858
|
)
|
(16,582
|
)
|
||||||
|
Proceeds from sale of mortgage loans originated for sale
|
39,157
|
39,907
|
15,682
|
|||||||||
|
Gain on sale of mortgage loans originated for sale
|
(292
|
)
|
(356
|
)
|
(283
|
)
|
||||||
|
Gain on sale of portfolio loans
|
(457
|
)
|
(568
|
)
|
(217
|
)
|
||||||
|
Decrease (increase) in other intangibles
|
142
|
127
|
(13
|
)
|
||||||||
|
Deferred tax expense (benefit)
|
2,118
|
1,014
|
(1,711
|
)
|
||||||||
|
Decrease (increase) in accrued interest and loan fees receivable
|
117
|
(183
|
)
|
(235
|
)
|
|||||||
|
(Increase) decrease in other assets
|
(2,743
|
)
|
651
|
(366
|
)
|
|||||||
|
Adjustment to unfunded pension liability
|
(12
|
)
|
(1,445
|
)
|
(1,365
|
)
|
||||||
|
Decrease in other liabilities
|
(3,066
|
)
|
(789
|
)
|
(2,011
|
)
|
||||||
|
Income from bank-owned life insurance
|
(1,373
|
)
|
(1,274
|
)
|
(1,355
|
)
|
||||||
|
Gain on sale of premises and equipment
|
-
|
-
|
(751
|
)
|
||||||||
|
Net gain on sale of securities available for sale
|
(617
|
)
|
(319
|
)
|
(19
|
)
|
||||||
|
Net cash provided by operating activities
|
19,822
|
19,610
|
11,426
|
|||||||||
|
CASH FLOWS FROM INVESTING ACTIVITIES
|
||||||||||||
|
Principal payments on investment securities - available for sale
|
8,238
|
14,431
|
11,055
|
|||||||||
|
Proceeds from sale of investment securities - available for sale
|
6,615
|
10,080
|
20,604
|
|||||||||
|
Maturities and calls of investment securities - available for sale
|
63,555
|
41,370
|
29,634
|
|||||||||
|
Purchases of investment securities - available for sale
|
(13,188
|
)
|
(16,975
|
)
|
(800
|
)
|
||||||
|
Maturities and calls of investment securities - held to maturity
|
44,611
|
7,502
|
1,084
|
|||||||||
|
Purchases of investment securities - held to maturity
|
-
|
(6,000
|
)
|
(3,434
|
)
|
|||||||
|
Decrease in interest-bearing time deposits in other banks
|
-
|
10,000
|
-
|
|||||||||
|
Decrease (increase) in Federal Reserve and Federal Home Loan Bank stock and other investments
|
6,232
|
(2,156
|
)
|
(5,737
|
)
|
|||||||
|
Proceeds from sale of portfolio loans
|
77,016
|
49,871
|
25,443
|
|||||||||
|
Loan originations - net
|
(87,395
|
)
|
(334,302
|
)
|
(336,005
|
)
|
||||||
|
Proceeds from sale of premises and equipment
|
-
|
-
|
1,064
|
|||||||||
|
Purchases of bank-owned life insurance
|
-
|
(6,000
|
)
|
(5,000
|
)
|
|||||||
|
Purchases of premises and equipment - net
|
(3,914
|
)
|
(1,930
|
)
|
(1,051
|
)
|
||||||
|
Net cash provided by (used in) investing activities
|
101,770
|
(234,109
|
)
|
(263,143
|
)
|
|||||||
|
CASH FLOWS FROM FINANCING ACTIVITIES
|
||||||||||||
|
Net increase in deposit accounts
|
57,559
|
224,563
|
45,999
|
|||||||||
|
Net (decrease) increase in short-term borrowings
|
(150,000
|
)
|
20,000
|
130,000
|
||||||||
|
Proceeds from long-term borrowings
|
-
|
15,000
|
-
|
|||||||||
|
Proceeds from stock options exercised
|
201
|
539
|
246
|
|||||||||
|
Cash dividends paid on common stock
|
(4,751
|
)
|
(3,763
|
)
|
(1,399
|
)
|
||||||
|
Proceeds from shares issued under the dividend reinvestment plan
|
2,301
|
846
|
136
|
|||||||||
|
Decrease in capital lease payable
|
(134
|
)
|
(116
|
)
|
(101
|
)
|
||||||
|
Net cash (used in) provided by financing activities
|
(94,824
|
)
|
257,069
|
174,881
|
||||||||
|
NET INCREASE (DECREASE) IN CASH AND CASH EQUIVALENTS
|
26,768
|
42,570
|
(76,836
|
)
|
||||||||
|
CASH AND CASH EQUIVALENTS, BEGINNING OF PERIOD
|
98,086
|
55,516
|
132,352
|
|||||||||
|
CASH AND CASH EQUIVALENTS, END OF PERIOD
|
$
|
124,854
|
$
|
98,086
|
$
|
55,516
|
||||||
|
SUPPLEMENTAL DATA:
|
||||||||||||
|
Interest paid
|
$
|
3,999
|
$
|
3,185
|
$
|
2,543
|
||||||
|
Income taxes paid
|
$
|
5,813
|
$
|
4,443
|
$
|
6,314
|
||||||
|
Loans transferred to held-for-sale
|
$
|
76,810
|
$
|
24,164
|
$
|
50,363
|
||||||
|
Loans transferred to OREO
|
$
|
650
|
$
|
-
|
$
|
-
|
||||||
|
Investment securities transferred from available for sale to held to maturity
|
$
|
-
|
$
|
-
|
$
|
48,147
|
||||||
See accompanying notes to consolidated financial statements.
NOTES TO CONSOLIDATED FINANCIAL STATEMENTS
1. SUMMARY OF SIGNIFICANT ACCOUNTING POLICIES
Organization and Nature of Operations — Suffolk Bancorp (the “Company”) was incorporated in 1985 as a bank holding company. The Company currently owns all of the outstanding capital stock of Suffolk County National Bank (the “Bank”). The Bank was organized under the national banking laws of the United States in 1890. The Bank formed Suffolk Greenway, Inc. (the “REIT”), a real estate investment trust, and owns 100% of an insurance agency and two corporations used to acquire foreclosed real estate. The insurance agency and the two corporations used to acquire foreclosed real estate are immaterial to the Company’s operations. The consolidated financial statements include the accounts of the Company and the Bank and its subsidiaries. All material intercompany accounts and transactions have been eliminated in consolidation. Unless the context otherwise requires, references herein to the Company include the Company and the Bank and subsidiaries on a consolidated basis.
On June 26, 2016, the Company entered into an Agreement and Plan of Merger (the “merger agreement”) with People’s United Financial, Inc. (“People’s United”) pursuant to which the Company will merge into People’s United (the “merger”). People’s United will be the surviving corporation in the merger. Subject to the terms and conditions of the merger agreement, the Company’s shareholders will have the right to receive 2.225 shares of People’s United common stock in exchange for each share of Company common stock. The merger agreement was adopted by the Company’s shareholders and both the Office of the Comptroller of the Currency and the Board of Governors of the Federal Reserve System have approved the merger. The merger remains subject to other customary conditions to closing.
The accounting and reporting policies of the Company conform to the accounting principles generally accepted in the United States of America (“U.S. GAAP”) and general practices within the banking industry. The preparation of the financial statements in conformity with U.S. GAAP requires management to make estimates and assumptions that affect the amounts reported in the financial statements and the accompanying notes. Actual results could differ from those estimates. The following describe the most significant of these policies.
Cash and Cash Equivalents — For purposes of the consolidated statements of cash flows, cash and due from banks and federal funds sold are considered to be cash equivalents. Generally, federal funds are sold for one-day periods.
Investment Securities — The Company reports investment securities in one of the following categories: (i) held to maturity (management has the intent and ability to hold to maturity), which are reported at amortized cost; (ii) trading (held for current resale), which are reported at fair value, with unrealized gains and losses included in earnings; and (iii) available for sale, which are reported at fair value, with unrealized gains and losses excluded from earnings and reported as a separate component of stockholders’ equity. The Company has classified all of its holdings of investment securities as either held to maturity or available for sale. At the time a security is purchased, a determination is made as to the appropriate classification.
Premiums and discounts on investment securities are amortized as expense and accreted as income over the estimated life of the respective security using a method that generally approximates the level-yield method. Gains and losses on the sales of investment securities are recognized upon realization, using the specific identification method and shown separately in the consolidated statements of income.
Management evaluates securities for other-than-temporary impairment (“OTTI”) on at least a quarterly basis, and more frequently when economic or market conditions warrant such an evaluation. For securities in an unrealized loss position, management considers the extent and duration of the unrealized loss, and the financial condition and near-term prospects of the issuer. Management also assesses whether it intends to sell, or it is more likely than not that it will be required to sell, a security in an unrealized loss position before recovery of its amortized cost basis. If either of the criteria regarding intent or requirement to sell is met, the entire difference between amortized cost and fair value is recognized as impairment through earnings. For debt securities that do not meet the aforementioned criteria, the amount of impairment is split into two components as follows: 1) OTTI related to credit loss, which must be recognized in the statement of income and 2) OTTI related to other factors, which is recognized in other comprehensive income (loss). The credit loss is defined as the difference between the present value of the cash flows expected to be collected and the amortized cost basis. For equity securities, the entire amount of impairment is recognized through earnings.
Loans and Loan Interest Income Recognition — Loans that management has the intent and ability to hold for the foreseeable future or until maturity or payoff are reported at the principal balance outstanding, net of unearned discounts, deferred loan fees and costs. Unearned discounts on installment loans are credited to income using methods that result in a level yield. Loan origination fees, net of certain direct origination costs, are deferred and recognized in interest income over the respective term of the loan without anticipating prepayments.
Interest income is accrued on the unpaid loan principal balance. Recognition of interest income is discontinued when reasonable doubt exists as to whether principal or interest due can be collected. Loans of all classes will generally no longer accrue interest when over 90 days past due unless the loan is well-secured and in process of collection. When a loan is placed on non-accrual status, all interest previously accrued, but not collected, is reversed against current-year interest income. Interest received on such loans is applied against principal or interest, according to management’s judgment as to the collectability of the principal, until qualifying for return to accrual status. Loans may start accruing interest again when they become current as to principal and interest for at least six months, and when, after a well-documented analysis by management, it has been determined that the loans can be collected in full. For all classes of loans, an impaired loan is defined as a loan for which it is probable that the lender will not collect all amounts due under the contractual terms of the loan agreement. Factors considered by management in determining impairment include payment status, collateral value, and the probability of collecting scheduled principal and interest payments when due. Loans that experience insignificant payment delays and payment shortfalls generally are not classified as impaired. Management determines the significance of payment delays and payment shortfalls on a case-by-case basis, taking into consideration all of the circumstances surrounding the loan and the borrower, including the length of the delay, the reasons for the delay, the borrower’s prior payment record, and the amount of the shortfall in relation to the principal and interest owed. Loans for which the terms have been modified resulting in a concession, and for which the borrower is experiencing financial difficulties are considered troubled debt restructurings (“TDRs”) and are classified as impaired. Generally, TDRs are initially classified as non-accrual until sufficient time has passed to assess whether the restructured loan will continue to perform. For impaired, accruing loans, interest income is recognized on an accrual basis with cash offsetting the recorded accruals upon receipt.
Allowance for Loan Losses - The allowance for loan losses is a valuation allowance for probable incurred losses, increased by the provision for loan losses and recoveries, and decreased by loan charge-offs. For all classes of loans, when a loan, in full or in part, is deemed uncollectible, it is charged against the allowance for loan losses. This happens when the loan is past due and the borrower has not shown the ability or intent to make the loan current, or the borrower does not have sufficient assets to pay the debt, or the value of the collateral is less than the balance of the loan and is not considered likely to improve soon. The allowance for loan losses is determined by a quarterly analysis of the loan portfolio. Such analysis includes changes in the size and composition of the portfolio, the Company’s own historical loan losses, industry-wide losses, current and anticipated economic trends, and details about individual loans. It also includes estimates of the actual value of collateral, other possible sources of repayment and estimates that are susceptible to significant changes due to changes in appraisal values of collateral, national and regional economic conditions and other relevant factors. All non-accrual loans over $250 thousand in the commercial and industrial, commercial real estate, multifamily, mixed use commercial, real estate construction and residential mortgages loan classes and all TDRs are evaluated individually for impairment. All other loans are generally evaluated as homogeneous pools with similar risk characteristics. In assessing the adequacy of the allowance for loan losses, management reviews the loan portfolio by separate classes that have similar risk and collateral characteristics. These classes are commercial and industrial, commercial real estate, multifamily, mixed use commercial, real estate construction, residential mortgages, home equity and consumer loans.
The allowance for loan losses consists of specific and general components, as well as an unallocated component. The specific component relates to loans that are individually classified as impaired. Specific reserves are established based on an analysis of the most probable sources of repayment or liquidation of collateral. Impaired loans that are collateral dependent are reviewed based on the fair market value of collateral and the estimated time required to recover the Company’s investment in the loans, as well as the cost of doing so, and the estimate of the recovery. Non-collateral dependent impaired loans are reviewed based on the present value of estimated future cash flows, including balloon payments, if any, using the loan’s effective interest rate. While every impaired loan is evaluated individually, not every loan requires a specific reserve. Specific reserves fluctuate based on changes in the underlying loans, anticipated sources of repayment, and charge-offs. The general component covers non-impaired loans and is based on historical loss experience for each loan class from a rolling twelve quarter period and modifying those percentages, if necessary, after adjusting for current qualitative and environmental factors that reflect changes in the estimated collectability of the loan class not captured by historical loss data. These factors augment actual loss experience and help estimate the probability of loss within the loan portfolio based on emerging or inherent risk trends. These qualitative factors include consideration of the following: levels and trends in various risk rating categories; levels of and trends in delinquencies and impaired loans; levels of and trends in charge-offs and recoveries; trends in volume and terms of loans; effects of any changes in risk selection and underwriting standards; other changes in lending policies, procedures and practices; experience, ability, and depth of lending management and other relevant staff; local, regional and national economic trends and conditions; industry conditions; and effects of changes in credit concentrations. These qualitative factors are applied as an adjustment to historical loss rates and require judgments that cannot be subjected to exact mathematical calculation. These adjustments reflect management’s overall estimate of the extent to which current losses on a pool of loans will differ from historical loss experience. These adjustments are subjective estimates and management reviews them on a quarterly basis. TDRs are also considered impaired with impairment generally measured at the present value of estimated future cash flows using the loan’s effective interest rate at inception or using the fair value of collateral, less estimated costs to sell, if repayment is expected solely from the collateral. An unallocated component is maintained to cover uncertainties that could affect management’s estimate of probable losses. The unallocated component of the allowance reflects the margin of imprecision inherent in the underlying assumptions used in the methodologies for estimating specific and general losses in the portfolio.
Transfers of Financial Instruments - Transfers of financial assets for which the Bank has surrendered control of the financial assets are accounted for as sales to the extent that consideration other than beneficial interests in the transferred assets is received in exchange. Retained interests in a sale or securitization of financial assets are initially measured at fair value and subsequently amortized over the estimated servicing period. The fair values of retained servicing rights and any other retained interests are determined based on the present value of expected future cash flows associated with those interests and by reference to market prices for similar assets. There were no transfers of financial assets to related or affiliated parties for any of the reported periods. The Bank services residential mortgage loans for others which are not included in the accompanying consolidated statements of condition. At December 31, 2016 and 2015, the outstanding principal balance of such loans approximated $189 million and $179 million, respectively. The carrying value, approximating the estimated fair value, of mortgage servicing rights was $2 million as of December 31, 2016 and 2015, and is recorded in goodwill and other intangibles in the Company’s consolidated statements of condition.
Loans Held For Sale – Loans held for sale are carried at the lower of aggregate cost or fair value, based on observable inputs in the secondary market. Changes in fair value of loans held for sale are recognized in earnings.
Other Real Estate Owned (“OREO”) — Property acquired through foreclosure, or OREO, is initially stated at the lower of cost or fair value less estimated selling costs. Losses arising at the time of the acquisition of property are charged against the allowance for loan losses. Any additional write-downs to the carrying value of these assets that may be required, as well as the cost of maintaining and operating these foreclosed properties, are charged to expense. The Company held OREO amounting to $650 thousand at December 31, 2016 resulting from the addition of one residential property during the first quarter of 2016. The Company held no OREO at December 31, 2015.
Premises and Equipment — Premises and equipment are stated at cost, less accumulated depreciation and amortization. Depreciation is calculated by the declining-balance or straight-line method over the estimated useful lives of the assets. Leasehold improvements are amortized using the straight-line method over the term of the lease or the estimated life of the asset, whichever is shorter. The Company periodically evaluates impairment of long-lived assets to be held and used or to be disposed of by sale. There was no impairment of long-lived assets at any of the reported periods.
Bank-Owned Life Insurance – Bank-owned life insurance is recorded at the lower of the cash surrender value or the amount that can be realized under the insurance policy and is included as an asset in the consolidated statements of condition. Changes in the cash surrender value and insurance benefit payments are recorded in non-interest income in the consolidated statements of income.
Goodwill — Goodwill resulting from business combinations represents the excess of the purchase price over the fair value of the net assets of the acquired business and was approximately $814 thousand at each of the Company’s reported periods. Goodwill is not amortized but tested for impairment at least annually or when there is a circumstance that would indicate the need to evaluate between annual tests. Based on these tests, there was no impairment of goodwill as of December 31, 2016 and 2015.
Allowance for Off-Balance Sheet Credit Risk — The balance of the allowance for off-balance sheet credit risk is determined by management’s estimate of the amount of financial risk in outstanding loan commitments and contingent liabilities such as performance and financial letters of credit. The allowance for off-balance sheet credit risk was $240 thousand and $290 thousand at December 31, 2016 and 2015, respectively, and is recorded in other liabilities in the Company’s consolidated statements of condition.
The Company has financial and performance letters of credit. Financial letters of credit require the Company to make payment if the customer’s financial condition deteriorates, as defined in the agreements. Performance letters of credit require the Company to make payments if the customer fails to perform certain non-financial contractual obligations.
Income Taxes — Deferred tax assets and liabilities are the expected future tax consequences of temporary differences between the carrying amounts and the tax bases of assets and liabilities, computed using enacted tax rates. Deferred tax assets are recognized if it is more likely than not that a future benefit will be realized. A valuation allowance, if needed, reduces deferred tax assets to the amount expected to be realized. The realization of deferred tax assets (net of a recorded valuation allowance) is largely dependent upon future taxable income, future reversals of existing taxable temporary differences and the ability to carryback losses to available tax years. In assessing the need for a valuation allowance, the Company considers all relevant positive and negative evidence, including taxable income in carryback years, scheduled reversals of deferred tax liabilities, expected future taxable income and available tax planning strategies.
Summary of Retirement Benefits Accounting — The Company’s retirement plan is noncontributory and covers substantially all eligible employees. The plan conforms to the provisions of the Employee Retirement Income Security Act of 1974, as amended, and the Pension Protection Act of 2006, which requires certain funding rules for defined benefit plans. The Company’s policy is to accrue for all pension costs and to fund the maximum amount allowable for tax purposes. Actuarial gains and losses that arise from changes in assumptions concerning future events are amortized over a period that reflects the long-term nature of pension expense used in estimating pension costs.
In accordance with U.S. GAAP the Company recognizes the funded status of a benefit plan in its consolidated statement of financial condition; recognizes as a component of other comprehensive income, net of tax, the gains or losses and prior service costs or credits that arise during the period but are not recognized as components of net periodic benefit cost; measures defined benefit plan assets and obligation as of the date of fiscal year-end; and discloses in the notes to financial statements additional information about certain effects of net periodic benefit cost for the next fiscal year that arise from delayed recognition of the gains or losses, prior service costs or credits, and transition asset and obligation. Plan assets and benefit obligations shall be measured as of the date of its statement of financial position and in determining the amount of net periodic benefit cost. An employer is required to use the same date for the measurement of plan assets as for the statement of condition. The Company accrues for post-retirement benefits other than pensions by accruing the cost of providing those benefits to an employee during the years that the employee serves.
Stock-Based Compensation — The Company recognizes compensation expense for the fair value of stock options and restricted stock on a straight line basis over the requisite service period of the grants.
Treasury Stock — The balance of treasury stock is computed at par value. Under the par value method, the acquisition cost of treasury shares is compared with the amount received at the time of their original issue. The treasury stock account is debited for the par value (or stated value) of the shares and a pro rata amount of any excess over par (or stated value) on original issuance is charged to the surplus account. Any excess of the acquisition cost over the original issue price is charged to retained earnings. If, however, the original issue price exceeds the acquisition price of the treasury stock, this difference is credited to surplus.
Earnings Per Share — Basic earnings per share is computed based on the weighted average number of common shares and unvested restricted shares outstanding for each period. The Company’s unvested restricted shares are considered participating securities as they contain rights to non-forfeitable dividends and thus they are included in the basic earnings per share computation. Diluted earnings per share include the dilutive effect of additional potential common shares issuable under stock options. In the event a net loss is reported, restricted shares and stock options are excluded from earnings per share computations.
The reconciliation of basic and diluted weighted average number of common shares outstanding for the years ended December 31, 2016, 2015 and 2014 follows.
|
Years Ended December 31,
|
||||||||||||
|
2016
|
2015
|
2014
|
||||||||||
|
Weighted average common shares outstanding
|
11,766,912
|
11,649,240
|
11,582,807
|
|||||||||
|
Weighted average unvested restricted shares
|
115,735
|
107,211
|
43,547
|
|||||||||
|
Weighted average shares for basic earnings per share
|
11,882,647
|
11,756,451
|
11,626,354
|
|||||||||
|
Additional diluted shares:
|
||||||||||||
|
Stock options
|
89,725
|
77,053
|
55,788
|
|||||||||
|
Weighted average shares for diluted earnings per share
|
11,972,372
|
11,833,504
|
11,682,142
|
|||||||||
Comprehensive Income — Comprehensive income includes net income and all other changes in equity during a period except those resulting from investments by owners and distributions to owners. Other comprehensive income includes revenues, expenses, gains and losses that under U.S. GAAP are included in comprehensive income but excluded from net income. Comprehensive income and accumulated other comprehensive income (“AOCI”) are reported net of related income taxes. AOCI for the Company consists of unrealized holding gains or losses on securities available for sale, unrealized holding losses on securities transferred from available for sale to held to maturity and gains or losses on the unfunded projected benefit obligation of the pension plan.
Derivatives - Derivatives are contracts between counterparties that specify conditions under which settlements are to be made. The only derivatives held by the Company are swap contracts with the purchaser of its Visa Class B shares. The Company records its derivatives on the consolidated statements of condition at fair value. The Company’s derivatives do not qualify for hedge accounting. As a result, changes in fair value are recognized in earnings in the period in which they occur. (See also Note 3. Investment Securities contained herein.)
Segment Reporting — U.S. GAAP requires that public companies report certain information about operating segments. It also requires that public companies report certain information about their products and services, the geographic areas in which they operate and their major customers. The Company is a community bank which offers a wide array of products and services to its customers. Pursuant to its banking strategy, emphasis is placed on building relationships with its customers and operations are managed and financial performance is evaluated on a Company-wide basis. As a result, the Company, the only reportable segment, is not organized around discernible lines of business and prefers to work as an integrated unit to customize solutions for its customers, with business line emphasis and product offerings changing over time as needs and demands change.
Recent Accounting Guidance – In August 2016, the Financial Accounting Standards Board (“FASB”) issued Accounting Standards Update (“ASU”) 2016-15, Statement of Cash Flows (Topic 230), “Classification of Certain Cash Receipts and Cash Payments.” ASU 2016-15 clarifies whether the following items should be categorized as operating, investing or financing in the statement of cash flows: (i) debt prepayments and extinguishment costs, (ii) settlement of zero-coupon debt, (iii) settlement of contingent consideration, (iv) insurance proceeds, (v) settlement of corporate-owned life insurance (COLI) and bank-owned life insurance (BOLI) policies, (vi) distributions from equity method investees, (vii) beneficial interests in securitization transactions, and (viii) receipts and payments with aspects of more than one class of cash flows. For public business entities that are U.S. Securities and Exchange Commission filers, like the Company, the amendments are effective for fiscal years beginning after December 15, 2017, and interim periods within those fiscal years. Early adoption is permitted, including adoption in an interim period. An entity that elects early adoption must adopt all of the amendments in the same period. The amendments in this ASU should be applied using a retrospective transition method to each period presented. If it is impracticable to apply the amendments retrospectively for some of the issues, the amendments for those issues would be applied prospectively as of the earliest date practicable. Being disclosure-related only, the Company believes adoption of this ASU in 2018 will not have a material effect on the Company’s consolidated financial statements.
In June 2016, the FASB issued ASU 2016-13, Financial Instruments—Credit Losses (Topic 326), “Measurement of Credit Losses on Financial Instruments.” ASU 2016-13 significantly changes the impairment model for most financial assets that are measured at amortized cost and certain other instruments from an incurred loss model to an expected loss model and provides for recording credit losses on available-for-sale debt securities through an allowance account. The ASU also requires certain incremental disclosures. For public business entities, the amendments are effective for fiscal years beginning after December 15, 2019, including interim periods within those fiscal years. Early adoption is permitted for all entities beginning after December 15, 2018, including interim periods within those fiscal years. The Company is currently evaluating the impact of the pending adoption of the ASU on its consolidated financial statements; however, the materiality of any such impact is not reasonably determinable at this time.
In March 2016, the FASB issued ASU 2016-09, Compensation—Stock Compensation (Topic 718), “Improvements to Employee Share-Based Payment Accounting.” ASU 2016-09 introduces targeted amendments intended to simplify the accounting for stock compensation. Specifically, the ASU requires all excess tax benefits and tax deficiencies (including tax benefits of dividends on share-based payment awards) to be recognized as income tax expense or benefit in the income statement. The tax effects of exercised or vested awards should be treated as discrete items in the reporting period in which they occur. An entity also should recognize excess tax benefits, and assess the need for a valuation allowance, regardless of whether the benefit reduces taxes payable in the current period. The ASU also requires excess tax benefits to be classified along with other income tax cash flows as an operating activity in the statement of cash flows. In addition, the ASU elevates the statutory tax withholding threshold to qualify for equity classification up to the maximum statutory tax rates in the applicable jurisdiction(s). The ASU also clarifies that cash paid by an employer when directly withholding shares for tax withholding purposes should be classified as a financing activity. The ASU provides an optional accounting policy election (with limited exceptions), to be applied on an entity-wide basis, to either estimate the number of awards that are expected to vest (consistent with existing U.S. GAAP) or account for forfeitures when they occur. The amendments were effective for public business entities for annual periods beginning after December 15, 2016, and interim periods within those annual periods. Early adoption was permitted. The Company’s adoption of ASU 2016-09 on January 1, 2017 did not have a material effect on the Company’s consolidated financial statements.
In February 2016, the FASB issued ASU 2016-02, Leases (Topic 842). The ASU establishes a right-of-use (ROU) model that requires a lessee to record a ROU asset and a lease liability on the balance sheet for all leases with terms longer than 12 months. Leases will be classified as either finance or operating, with classification affecting the pattern of expense recognition in the income statement. The ASU is effective for fiscal years beginning after December 15, 2018, including interim periods within those fiscal years. A modified retrospective transition approach is required for lessees for capital and operating leases existing at, or entered into after, the beginning of the earliest comparative period presented in the financial statements, with certain practical expedients available. The Company has not yet evaluated this ASU, thus the impact of its pending adoption on the Company’s consolidated financial statements is not currently known or reasonably estimable.
In January 2016, the FASB issued ASU 2016-01, Financial Instruments - Overall (Subtopic 825-10), “Recognition and Measurement of Financial Assets and Financial Liabilities” which requires an entity to: (i) measure equity investments at fair value through net income, with certain exceptions; (ii) present in other comprehensive income the changes in instrument-specific credit risk for financial liabilities measured using the fair value option; (iii) present financial assets and financial liabilities by measurement category and form of financial asset; (iv) calculate the fair value of financial instruments for disclosure purposes based on an exit price and; (v) assess a valuation allowance on deferred tax assets related to unrealized losses of available for sale debt securities in combination with other deferred tax assets. This ASU provides an election to subsequently measure certain nonmarketable equity investments at cost less any impairment and adjusted for certain observable price changes and also requires a qualitative impairment assessment of such equity investments and amends certain fair value disclosure requirements. For public entities, the amendments in this ASU are effective for fiscal years beginning after December 15, 2017, including interim periods within those fiscal years. Generally, early adoption of the amendments in this ASU is not permitted. The Company believes that adoption in 2018 will not have a material effect on the Company’s consolidated financial statements.
In May 2014, the FASB issued ASU 2014-09, Revenue from Contracts with Customers (Topic 606), “Revenue from Contracts with Customers,” which supersedes nearly all existing revenue recognition guidance under U.S. GAAP. The core principle of the ASU is to recognize revenues when promised goods or services are transferred to customers in an amount that reflects the consideration to which an entity expects to be entitled for those goods or services. The ASU defines a five step process to achieve this core principle and, in doing so, more judgment and estimates may be required within the revenue recognition process than are required under existing U.S. GAAP. The FASB subsequently issued ASU 2016-08 which updates the new standard by clarifying the principal versus agent implementation guidance, ASU 2016-10 which clarifies identifying performance obligations and the licensing implementation guidance, ASU 2016-12 which clarifies the guidance on assessing collectability, presenting sales taxes, measuring noncash consideration and certain transition matters and ASU 2016-20 which addresses technical corrections and improvements, but these do not change the core principle of the new standard. The FASB also subsequently issued ASU 2015-14 to defer the effective date of the new standard by one year. As such, it now takes effect for public entities in fiscal years beginning after December 15, 2017, using either of the following transition methods: (i) a full retrospective approach reflecting the application of the standard in each prior reporting period with the option to elect certain practical expedients, or (ii) a retrospective approach with the cumulative effect of initially adopting the ASU recognized at the date of adoption (which includes additional footnote disclosures). Early adoption is permitted for any entity that chooses to adopt the new standard as of the original effective date. The Company has not yet determined the method by which it will adopt ASU 2014-09 in 2018 and does not believe that the adoption will have a material effect on the Company’s consolidated financial statements.
Reclassifications — Certain reclassifications have been made to prior period information in order to conform to the current period’s presentation. Such reclassifications had no impact on the Company’s consolidated results of operations or financial condition.
2. ACCUMULATED OTHER COMPREHENSIVE INCOME/LOSS (“AOCI”)
The changes in the Company’s AOCI by component, net of tax, for the years ended December 31, 2016 and 2015 follow (in thousands).
|
Year Ended December 31, 2016
|
Year Ended December 31, 2015
|
|||||||||||||||||||||||||||||||
|
Unrealized
Gains and
Losses on
Available for
Sale Securities
|
Unrealized Losses
on Securities
Transferred from
Available for Sale
to Held to
Maturity
|
Pension and
Post-
Retirement
Plan Items
|
Total
|
Unrealized
Gains and
Losses on
Available for
Sale Securities
|
Unrealized Losses
on Securities
Transferred from
Available for Sale
to Held to
Maturity
|
Pension and
Post-
Retirement
Plan Items
|
Total
|
|||||||||||||||||||||||||
|
Beginning balance
|
$
|
1,436
|
$
|
(1,395
|
)
|
$
|
(8,617
|
)
|
$
|
(8,576
|
)
|
$
|
2,637
|
$
|
(1,805
|
)
|
$
|
(7,675
|
)
|
$
|
(6,843
|
)
|
||||||||||
|
Other comprehensive loss before reclassifications
|
(970
|
)
|
-
|
(1,110
|
)
|
(2,080
|
)
|
(1,010
|
)
|
-
|
(1,091
|
)
|
(2,101
|
)
|
||||||||||||||||||
|
Amounts reclassified from AOCI
|
(364
|
)
|
1,324
|
177
|
1,137
|
(191
|
)
|
410
|
149
|
368
|
||||||||||||||||||||||
|
Net other comprehensive (loss) income
|
(1,334
|
)
|
1,324
|
(933
|
)
|
(943
|
)
|
(1,201
|
)
|
410
|
(942
|
)
|
(1,733
|
)
|
||||||||||||||||||
|
Ending balance
|
$
|
102
|
$
|
(71
|
)
|
$
|
(9,550
|
)
|
$
|
(9,519
|
)
|
$
|
1,436
|
$
|
(1,395
|
)
|
$
|
(8,617
|
)
|
$
|
(8,576
|
)
|
||||||||||
Reclassifications out of AOCI for the years ended December 31, 2016, 2015 and 2014 follow (in thousands).
|
Amount Reclassified from AOCI
|
|||||||||||||
|
Years Ended December 31,
|
Affected Line Item in the Statement
|
||||||||||||
|
Details about AOCI Components
|
2016
|
2015
|
2014
|
Where Net Income is Presented
|
|||||||||
|
Unrealized gains and losses on available for sale securities
|
$
|
617
|
$
|
319
|
$
|
19
|
Net gain on sale of securities available for sale
|
||||||
|
Unrealized losses on securities transferred from available for sale to held to maturity
|
(2,205
|
)
|
(660
|
)
|
(218
|
)
|
Interest income - U.S. Government agency obligations
|
||||||
|
Pension and post-retirement plan items
|
(299
|
)
|
(249
|
)
|
(25
|
)
|
Employee compensation and benefits
|
||||||
|
Subtotal, pre-tax
|
(1,887
|
)
|
(590
|
)
|
(224
|
)
|
|||||||
|
Income tax effect
|
750
|
222
|
88
|
Income tax expense
|
|||||||||
|
Total, net of tax
|
$
|
(1,137
|
)
|
$
|
(368
|
)
|
$
|
(136
|
)
|
||||
3. INVESTMENT SECURITIES
At the time of purchase of a security, the Company designates the security as either available for sale, trading or held to maturity, depending upon investment objectives, liquidity needs and intent.
In 2014, investment securities with a fair value of $48 million and an unrealized loss of $3.2 million were transferred from available for sale to held to maturity. In accordance with U.S. GAAP, the securities were transferred at fair value, which became the amortized cost. The discount, equal to the unrealized holding losses at the date of transfer, is being accreted to interest income over the remaining life of the securities. The unrealized holding losses at the date of transfer remained in AOCI and are being amortized simultaneously against interest income. Those amounts offset or mitigate each other.
The amortized cost, fair value and gross unrealized gains and losses of the Company’s investment securities available for sale and held to maturity at December 31, 2016 and 2015 were as follows (in thousands):
|
December 31, 2016
|
December 31, 2015
|
|||||||||||||||||||||||||||||||
|
Amortized
Cost
|
Gross
Unrealized
Gains
|
Gross
Unrealized
Losses
|
Fair
Value
|
Amortized
Cost
|
Gross
Unrealized
Gains
|
Gross
Unrealized
Losses
|
Fair
Value
|
|||||||||||||||||||||||||
|
Available for sale:
|
||||||||||||||||||||||||||||||||
|
U.S. Government agency securities
|
$
|
-
|
$
|
-
|
$
|
-
|
$
|
-
|
$
|
28,977
|
$
|
2
|
$
|
(463
|
)
|
$
|
28,516
|
|||||||||||||||
|
Obligations of states and political subdivisions
|
63,447
|
1,847
|
-
|
65,294
|
100,215
|
4,467
|
-
|
104,682
|
||||||||||||||||||||||||
|
Collateralized mortgage obligations
|
17,854
|
-
|
(402
|
)
|
17,452
|
15,795
|
2
|
(248
|
)
|
15,549
|
||||||||||||||||||||||
|
Mortgage-backed securities
|
88,769
|
79
|
(887
|
)
|
87,961
|
93,719
|
39
|
(1,316
|
)
|
92,442
|
||||||||||||||||||||||
|
Corporate bonds
|
9,000
|
-
|
(465
|
)
|
8,535
|
6,000
|
-
|
(90
|
)
|
5,910
|
||||||||||||||||||||||
|
Total available for sale securities
|
179,070
|
1,926
|
(1,754
|
)
|
179,242
|
244,706
|
4,510
|
(2,117
|
)
|
247,099
|
||||||||||||||||||||||
|
Held to maturity:
|
||||||||||||||||||||||||||||||||
|
U.S. Government agency securities
|
2,380
|
88
|
-
|
2,468
|
43,570
|
1,450
|
-
|
45,020
|
||||||||||||||||||||||||
|
Obligations of states and political subdivisions
|
10,400
|
278
|
-
|
10,678
|
11,739
|
536
|
-
|
12,275
|
||||||||||||||||||||||||
|
Corporate bonds
|
6,000
|
113
|
-
|
6,113
|
6,000
|
7
|
(30
|
)
|
5,977
|
|||||||||||||||||||||||
|
Total held to maturity securities
|
18,780
|
479
|
-
|
19,259
|
61,309
|
1,993
|
(30
|
)
|
63,272
|
|||||||||||||||||||||||
|
Total investment securities
|
$
|
197,850
|
$
|
2,405
|
$
|
(1,754
|
)
|
$
|
198,501
|
$
|
306,015
|
$
|
6,503
|
$
|
(2,147
|
)
|
$
|
310,371
|
||||||||||||||
The amortized cost, contractual maturities and fair value of the Company’s investment securities at December 31, 2016 (in thousands) are presented in the table below. Collateralized mortgage obligations (“CMOs”) and mortgage-backed securities (“MBS”) assume maturity dates pursuant to average lives.
|
December 31, 2016
|
||||||||
|
Amortized
Cost
|
Fair
Value
|
|||||||
|
Securities available for sale:
|
||||||||
|
Due in one year or less
|
$
|
26,650
|
$
|
26,831
|
||||
|
Due from one to five years
|
131,177
|
131,767
|
||||||
|
Due from five to ten years
|
21,243
|
20,644
|
||||||
|
Total securities available for sale
|
179,070
|
179,242
|
||||||
|
Securities held to maturity:
|
||||||||
|
Due in one year or less
|
2,636
|
2,679
|
||||||
|
Due from one to five years
|
1,253
|
1,284
|
||||||
|
Due from five to ten years
|
8,380
|
8,580
|
||||||
|
Due after ten years
|
6,511
|
6,716
|
||||||
|
Total securities held to maturity
|
18,780
|
19,259
|
||||||
|
Total investment securities
|
$
|
197,850
|
$
|
198,501
|
||||
As a member of the Federal Reserve Bank (“FRB”) and the Federal Home Loan Bank (“FHLB”), the Bank owned FRB and FHLB stock with book values of $1.4 million and $2.8 million, respectively, at December 31, 2016. At December 31, 2015, the Bank owned FRB and FHLB stock with a book value of $1.4 million and $9.2 million, respectively. There is no public market for these shares. The last dividends paid were 6.00% on FRB stock in December 2016 and 5.00% on FHLB stock in November 2016.
At December 31, 2016 and 2015, investment securities carried at $144 million and $261 million, respectively, were pledged primarily for public funds on deposit and as collateral for the Company’s derivative swap contracts.
The proceeds from sales of securities available for sale and the associated realized gains and losses are shown below (in thousands) for the years indicated. Realized gains are also inclusive of gains on called securities.
|
Years Ended December 31,
|
||||||||||||
|
2016
|
2015
|
2014
|
||||||||||
|
Proceeds
|
$
|
6,615
|
$
|
10,080
|
$
|
20,604
|
||||||
|
Gross realized gains
|
$
|
617
|
$
|
334
|
$
|
271
|
||||||
|
Gross realized losses
|
-
|
(15
|
)
|
(252
|
)
|
|||||||
|
Net realized gains
|
$
|
617
|
$
|
319
|
$
|
19
|
||||||
Information pertaining to securities with unrealized losses at December 31, 2016 and 2015, aggregated by investment category and length of time that individual securities have been in a continuous loss position, follows (in thousands):
|
Less than 12 months
|
12 months or longer
|
Total
|
||||||||||||||||||||||
|
December 31, 2016
|
Fair
Value
|
Unrealized
Losses
|
Fair
Value
|
Unrealized
Losses
|
Fair
Value
|
Unrealized
Losses
|
||||||||||||||||||
|
Collateralized mortgage obligations
|
$
|
15,716
|
$
|
(359
|
)
|
$
|
1,736
|
$
|
(43
|
)
|
$
|
17,452
|
$
|
(402
|
)
|
|||||||||
|
Mortgage-backed securities
|
73,091
|
(887
|
)
|
-
|
-
|
73,091
|
(887
|
)
|
||||||||||||||||
|
Corporate bonds
|
2,850
|
(150
|
)
|
5,685
|
(315
|
)
|
8,535
|
(465
|
)
|
|||||||||||||||
|
Total
|
$
|
91,657
|
$
|
(1,396
|
)
|
$
|
7,421
|
$
|
(358
|
)
|
$
|
99,078
|
$
|
(1,754
|
)
|
|||||||||
|
Less than 12 months
|
12 months or longer
|
Total
|
||||||||||||||||||||||
|
December 31, 2015
|
Fair
Value
|
Unrealized
Losses
|
Fair
Value
|
Unrealized
Losses
|
Fair
Value
|
Unrealized
Losses
|
||||||||||||||||||
|
U.S. Government agency securities
|
$
|
16,744
|
$
|
(233
|
)
|
$
|
9,770
|
$
|
(230
|
)
|
$
|
26,514
|
$
|
(463
|
)
|
|||||||||
|
Collateralized mortgage obligations
|
1,831
|
(4
|
)
|
8,200
|
(244
|
)
|
10,031
|
(248
|
)
|
|||||||||||||||
|
Mortgage-backed securities
|
66,804
|
(884
|
)
|
17,936
|
(432
|
)
|
84,740
|
(1,316
|
)
|
|||||||||||||||
|
Corporate bonds
|
8,880
|
(120
|
)
|
-
|
-
|
8,880
|
(120
|
)
|
||||||||||||||||
|
Total
|
$
|
94,259
|
$
|
(1,241
|
)
|
$
|
35,906
|
$
|
(906
|
)
|
$
|
130,165
|
$
|
(2,147
|
)
|
|||||||||
The CMOs with unrealized losses for twelve months or longer at December 31, 2016 are issued or guaranteed by U.S. Government agencies or sponsored enterprises. The corporate bonds with unrealized losses for twelve months or longer at December 31, 2016 carry investment grade ratings by all major credit rating agencies including Moody’s and Standard & Poor’s. In all cases, the unrealized losses on these bonds were a result of overall market conditions including the current interest rate environment and general market liquidity. The losses were not related to a deterioration of the quality of the issuer or any company-specific adverse events. The Company does not intend to sell and it is not more likely than not that the Company will be required to sell these securities prior to their recovery to a level equal to or greater than amortized cost. Management has determined that no OTTI was present at December 31, 2016.
The Bank was a member of the Visa USA payment network and was issued Class B shares upon Visa’s initial public offering in March 2008. The Visa Class B shares are transferable only under limited circumstances until they can be converted into shares of the publicly traded class of stock. This conversion cannot happen until the settlement of certain litigation, which is indemnified by Visa members. Since its initial public offering, Visa has funded a litigation reserve based upon a change in the conversion ratio of Visa Class B shares into Visa Class A shares. At its discretion, Visa may continue to increase the conversion rate in connection with any settlements in excess of amounts then in escrow for that purpose and reduce the conversion rate to the extent that it adds any funds to the escrow in the future. Based on the existing transfer restriction and the uncertainty of the litigation, the Company has recorded its Visa Class B shares on its balance sheet at zero value.
In conjunction with the sale of Visa Class B shares in 2013, the Company entered into derivative swap contracts with the purchaser of these Visa Class B shares which provide for settlements between the purchaser and the Company based upon a change in the conversion ratio of Visa Class B shares into Visa Class A shares. The Company’s recorded liability representing the fair value of the derivative was $752 thousand at December 31, 2016 and 2015.
The present value of estimated future fees to be paid to the derivative counterparty, or carrying costs, calculated by reference to the market price of the Visa Class A shares at a fixed rate of interest are expensed as incurred. For the years ended December 31, 2016, 2015 and 2014, $324 thousand, $294 thousand and $239 thousand, respectively, in such carrying costs was expensed. At December 31, 2016, the Company has pledged mortgage-backed securities of U.S. Government-sponsored enterprises held in its available for sale portfolio, with a market value of approximately $3 million, as collateral for the derivative swap contracts. At December 31, 2015, the Company pledged U.S. Government agency securities held in its available for sale portfolio, with a market value of approximately $3 million, as collateral for such contracts.
Subjectivity has been used in estimating the fair value of both the derivative liability and the associated fees, but management believes that these fair value estimates are adequate based on available information. However, future developments in the litigation could require potentially significant changes to these estimates.
At December 31, 2016 and 2015, the Company still owned 38,638 Visa Class B shares subsequent to the sales described here. Upon termination of the existing transfer restriction and settlement of the litigation, and to the extent that the Company continues to own such Visa Class B shares in the future, the Company expects to record its Visa Class B shares at fair value.
4. LOANS
At December 31, 2016 and 2015, net loans disaggregated by class consisted of the following (in thousands):
|
December 31, 2016
|
December 31, 2015
|
|||||||
|
Commercial and industrial
|
$
|
189,410
|
$
|
189,769
|
||||
|
Commercial real estate
|
731,986
|
696,787
|
||||||
|
Multifamily
|
402,935
|
426,549
|
||||||
|
Mixed use commercial
|
78,807
|
78,787
|
||||||
|
Real estate construction
|
41,028
|
37,233
|
||||||
|
Residential mortgages
|
185,112
|
186,313
|
||||||
|
Home equity
|
42,419
|
44,951
|
||||||
|
Consumer
|
4,867
|
6,058
|
||||||
|
Gross loans
|
1,676,564
|
1,666,447
|
||||||
|
Allowance for loan losses
|
(20,117
|
)
|
(20,685
|
)
|
||||
|
Net loans at end of period
|
$
|
1,656,447
|
$
|
1,645,762
|
||||
The Bank’s real estate loans and loan commitments are primarily for properties located throughout Long Island and New York City. Repayment of these loans is dependent in part upon the overall economic health of the Company’s market area and current real estate values. The Bank considers the credit circumstances, the nature of the project and loan to value ratios for all real estate loans.
The Bank makes loans to its directors and executive officers, and other related parties, in the ordinary course of its business. Loans made to directors and executive officers, either directly or indirectly, totaled $21 million and $18 million at December 31, 2016 and 2015, respectively. New loans and advances totaling $85 million and $81 million were extended and payments of $82 million and $74 million were received during 2016 and 2015, respectively, on these loans.
The allowance for loan losses is a valuation allowance for probable incurred credit losses. Loan losses are charged against the allowance when management believes a loan, in full or in part, is uncollectible. Subsequent recoveries, if any, are credited to the allowance. Management estimates the allowance balance required using past loan loss experience, the nature and volume of the portfolio, information about specific borrower situations and estimated collateral values, economic conditions, and other factors. Allocations of the allowance may be made for specific loans, but the entire allowance is available for any loan that, in management’s judgment, should be charged off. The allowance consists of specific and general components. The specific component relates to loans that are individually classified as impaired.
A loan is impaired when, based on current information and events, it is probable that the Company will be unable to collect all amounts due according to the contractual terms of the loan agreement. Loans for which the terms have been modified resulting in a concession, and for which the borrower is experiencing financial difficulties, are considered TDRs and classified as impaired. Generally, TDRs are initially classified as non-accrual until sufficient time has passed to assess whether the restructured loan will continue to perform. Generally, the Company returns a TDR to accrual status upon six months of performance under the new terms.
All non-accrual loans over $250 thousand in the commercial and industrial, commercial real estate, multifamily, mixed use commercial, real estate construction and residential mortgages loan classes and all TDRs are evaluated individually for impairment. All other loans are generally evaluated as homogeneous pools with similar risk characteristics. If a loan is impaired, a specific reserve may be recorded so that the loan is reported, net, at the present value of estimated future cash flows including balloon payments, if any, using the loan’s existing rate or at the fair value of collateral if repayment is expected solely from the collateral. Large groups of homogeneous loans with smaller individual balances, such as consumer loans, are generally evaluated collectively for impairment, and accordingly, are not separately identified for impairment disclosures. TDRs are separately identified for impairment disclosures and are measured at the present value of estimated future cash flows using the loan’s effective rate at inception. If a TDR is considered to be collateral-dependent, the loan is reported at the fair value of the collateral net of estimated costs to sell. For TDRs that subsequently default, the Company determines the allowance amount in accordance with its accounting policy for the allowance for loan losses.
The general component of the allowance covers non-impaired loans and is based on historical loss experience, adjusted for qualitative factors. The historical loss experience is determined by loan class, and is based on the actual loss history experienced by the Company over a rolling twelve quarter period. This actual loss experience is supplemented with other qualitative factors based on the risks present for each loan class. These qualitative factors include consideration of the following: levels and trends in various risk rating categories; levels of and trends in delinquencies and impaired loans; levels of and trends in charge-offs and recoveries; trends in volume and terms of loans; effects of any changes in risk selection and underwriting standards; other changes in lending policies, procedures and practices; experience, ability, and depth of lending management and other relevant staff; local, regional and national economic trends and conditions; industry conditions; and effects of changes in credit concentrations. The following loan classes have been identified: commercial and industrial, commercial real estate, multifamily, mixed use commercial, real estate construction, residential mortgages, home equity and consumer loans.
The qualitative factors utilized by the Company in computing its allowance for loan losses are determined based on the various risk characteristics of each loan class. Relevant risk characteristics are as follows:
Commercial and industrial loans – Loans in this class are typically made to businesses. Generally these loans are secured by assets of the business and repayment is expected from the cash flows of the business. A weakened economy and resultant decreased consumer and/or business spending will have an effect on the credit quality in this loan class.
Commercial real estate loans – Loans in this class include income‑producing investment properties and owner-occupied real estate used for business purposes. The underlying properties are located largely in the Company’s primary market area. The cash flows of the income producing investment properties are adversely impacted by a downturn in the economy as evidenced by increased vacancy rates, which in turn, will have an effect on credit quality. Generally, management seeks to obtain annual financial information for borrowers with loans in excess of $750 thousand in this category. In the case of owner-occupied real estate used for business purposes, a weakened economy and resultant decreased consumer and/or business spending will have an adverse effect on credit quality. Generally, management seeks to obtain annual financial information for borrowers with loans in excess of $750 thousand in this category.
Multifamily loans – Loans in this class are primarily concentrated in the five boroughs of New York City and target buildings with stabilized rent flows. It has been well-established that the incidence of loss in multifamily loan transactions is lower than almost all other loan categories as their performance over time has shown limited defaults. The property value for these buildings is directly attributable to the cash flow from rents and the rate of return investors need on their invested capital. Rental rates are a function of demand for apartments and the vacancy rates in New York City have been at historical lows.
Mixed use commercial loans – Loans in this class are defined as multifamily dwellings with a commercial rents component greater than 50% of total rents. Areas of concentration for loans in this class include the five boroughs of New York City, Nassau County and Suffolk County. As with multifamily loans, there is an extremely low incidence of loan loss in the event of default. Loan to value ratios utilized during the underwriting process offer protection for the lender. In addition, buildings rarely experience significant depreciation in market value as property valuations are derived from capitalization rates based on required investment returns and cash flow.
Real estate construction loans – Loans in this class primarily include land loans to local individuals, contractors and developers for developing the land for sale or for the purpose of making improvements thereon. Repayment is derived from sale of the lots/units including any pre-sold units. Credit risk is affected by market conditions, time to sell at an adequate price and cost overruns. This also includes commercial development projects the Company finances, which in most cases require interest only during construction, and then convert to permanent financing. Credit risk is affected by construction delays, cost overruns, market conditions and the availability of permanent financing, to the extent such permanent financing is not being provided by the Company.
Residential mortgages and home equity loans – Loans in these classes are made to and secured by residential real estate and repayment is dependent on the credit quality of the individual borrower. The overall health of the economy, including unemployment rates and housing prices, will have an effect on the credit quality in this loan class. The Company generally does not originate loans with a loan-to-value ratio greater than 80% and does not grant sub-prime loans.
Consumer loans – Loans in this class may be either secured or unsecured and repayment is dependent on the credit quality of the individual borrower and, if applicable, sale of the collateral securing the loan (such as automobiles and manufactured homes). Therefore, the overall health of the economy, including unemployment rates and housing prices, will have a significant effect on the credit quality in this loan class.
At December 31, 2016 and 2015, the ending balance in the allowance for loan losses disaggregated by class and impairment methodology is as follows (in thousands). Also in the tables below are total loans at December 31, 2016 and 2015 disaggregated by class and impairment methodology (in thousands).
|
Allowance for Loan Losses
|
Loan Balances
|
|||||||||||||||||||||||
|
December 31, 2016
|
Individually
evaluated for
impairment
|
Collectively
evaluated for
impairment
|
Ending
balance
|
Individually
evaluated for
impairment
|
Collectively
evaluated for
impairment
|
Ending
balance
|
||||||||||||||||||
|
Commercial and industrial
|
$
|
4
|
$
|
2,128
|
$
|
2,132
|
$
|
3,592
|
$
|
185,818
|
$
|
189,410
|
||||||||||||
|
Commercial real estate
|
-
|
8,030
|
8,030
|
3,371
|
728,615
|
731,986
|
||||||||||||||||||
|
Multifamily
|
-
|
3,623
|
3,623
|
-
|
402,935
|
402,935
|
||||||||||||||||||
|
Mixed use commercial
|
-
|
730
|
730
|
-
|
78,807
|
78,807
|
||||||||||||||||||
|
Real estate construction
|
-
|
560
|
560
|
-
|
41,028
|
41,028
|
||||||||||||||||||
|
Residential mortgages
|
305
|
1,696
|
2,001
|
4,981
|
180,131
|
185,112
|
||||||||||||||||||
|
Home equity
|
172
|
343
|
515
|
1,579
|
40,840
|
42,419
|
||||||||||||||||||
|
Consumer
|
26
|
36
|
62
|
210
|
4,657
|
4,867
|
||||||||||||||||||
|
Unallocated
|
-
|
2,464
|
2,464
|
-
|
-
|
-
|
||||||||||||||||||
|
Total
|
$
|
507
|
$
|
19,610
|
$
|
20,117
|
$
|
13,733
|
$
|
1,662,831
|
$
|
1,676,564
|
||||||||||||
|
Allowance for Loan Losses
|
Loan Balances
|
|||||||||||||||||||||||
|
December 31, 2015
|
Individually
evaluated for
impairment
|
Collectively
evaluated for
impairment
|
Ending
balance
|
Individually
evaluated for
impairment
|
Collectively
evaluated for
impairment
|
Ending
balance
|
||||||||||||||||||
|
Commercial and industrial
|
$
|
-
|
$
|
1,875
|
$
|
1,875
|
$
|
2,872
|
$
|
186,897
|
$
|
189,769
|
||||||||||||
|
Commercial real estate
|
-
|
7,019
|
7,019
|
4,334
|
692,453
|
696,787
|
||||||||||||||||||
|
Multifamily
|
-
|
4,688
|
4,688
|
-
|
426,549
|
426,549
|
||||||||||||||||||
|
Mixed use commercial
|
-
|
766
|
766
|
-
|
78,787
|
78,787
|
||||||||||||||||||
|
Real estate construction
|
-
|
386
|
386
|
-
|
37,233
|
37,233
|
||||||||||||||||||
|
Residential mortgages
|
559
|
1,917
|
2,476
|
5,817
|
180,496
|
186,313
|
||||||||||||||||||
|
Home equity
|
170
|
469
|
639
|
1,683
|
43,268
|
44,951
|
||||||||||||||||||
|
Consumer
|
48
|
58
|
106
|
379
|
5,679
|
6,058
|
||||||||||||||||||
|
Unallocated
|
-
|
2,730
|
2,730
|
-
|
-
|
-
|
||||||||||||||||||
|
Total
|
$
|
777
|
$
|
19,908
|
$
|
20,685
|
$
|
15,085
|
$
|
1,651,362
|
$
|
1,666,447
|
||||||||||||
At December 31, 2016 and 2015, past due loans disaggregated by class were as follows (in thousands).
|
Past Due
|
||||||||||||||||||||||||
|
December 31, 2016
|
30 - 59 days
|
60 - 89 days
|
90 days and over
|
Total
|
Current
|
Total
|
||||||||||||||||||
|
Commercial and industrial
|
$
|
28
|
$
|
-
|
$
|
3,288
|
$
|
3,316
|
$
|
186,094
|
$
|
189,410
|
||||||||||||
|
Commercial real estate
|
-
|
-
|
1,964
|
1,964
|
730,022
|
731,986
|
||||||||||||||||||
|
Multifamily
|
-
|
-
|
-
|
-
|
402,935
|
402,935
|
||||||||||||||||||
|
Mixed use commercial
|
-
|
-
|
-
|
-
|
78,807
|
78,807
|
||||||||||||||||||
|
Real estate construction
|
-
|
-
|
-
|
-
|
41,028
|
41,028
|
||||||||||||||||||
|
Residential mortgages
|
1,057
|
54
|
143
|
1,254
|
183,858
|
185,112
|
||||||||||||||||||
|
Home equity
|
-
|
-
|
164
|
164
|
42,255
|
42,419
|
||||||||||||||||||
|
Consumer
|
87
|
5
|
1
|
93
|
4,774
|
4,867
|
||||||||||||||||||
|
Total
|
$
|
1,172
|
$
|
59
|
$
|
5,560
|
$
|
6,791
|
$
|
1,669,773
|
$
|
1,676,564
|
||||||||||||
|
% of Total Loans
|
0.1
|
%
|
0.0
|
%
|
0.3
|
%
|
0.4
|
%
|
99.6
|
%
|
100.0
|
%
|
||||||||||||
|
Past Due
|
||||||||||||||||||||||||
|
December 31, 2015
|
30 - 59 days
|
60 - 89 days
|
90 days and over
|
Total
|
Current
|
Total
|
||||||||||||||||||
|
Commercial and industrial
|
$
|
21
|
$
|
-
|
$
|
1,954
|
$
|
1,975
|
$
|
187,794
|
$
|
189,769
|
||||||||||||
|
Commercial real estate
|
-
|
-
|
1,733
|
1,733
|
695,054
|
696,787
|
||||||||||||||||||
|
Multifamily
|
-
|
-
|
-
|
-
|
426,549
|
426,549
|
||||||||||||||||||
|
Mixed use commercial
|
-
|
-
|
-
|
-
|
78,787
|
78,787
|
||||||||||||||||||
|
Real estate construction
|
-
|
-
|
-
|
-
|
37,233
|
37,233
|
||||||||||||||||||
|
Residential mortgages
|
512
|
175
|
1,358
|
2,045
|
184,268
|
186,313
|
||||||||||||||||||
|
Home equity
|
336
|
-
|
406
|
742
|
44,209
|
44,951
|
||||||||||||||||||
|
Consumer
|
2
|
-
|
77
|
79
|
5,979
|
6,058
|
||||||||||||||||||
|
Total
|
$
|
871
|
$
|
175
|
$
|
5,528
|
$
|
6,574
|
$
|
1,659,873
|
$
|
1,666,447
|
||||||||||||
|
% of Total Loans
|
0.1
|
%
|
0.0
|
%
|
0.3
|
%
|
0.4
|
%
|
99.6
|
%
|
100.0
|
%
|
||||||||||||
The following table presents the Company’s impaired loans disaggregated by class at December 31, 2016 and 2015 (in thousands).
|
December 31, 2016
|
December 31, 2015
|
|||||||||||||||||||||||
|
Unpaid
Principal
Balance
|
Recorded
Balance
|
Allowance
Allocated
|
Unpaid
Principal
Balance
|
Recorded
Balance
|
Allowance
Allocated
|
|||||||||||||||||||
|
With no allowance recorded:
|
||||||||||||||||||||||||
|
Commercial and industrial
|
$
|
3,588
|
$
|
3,588
|
$
|
-
|
$
|
2,869
|
$
|
2,869
|
$
|
-
|
||||||||||||
|
Commercial real estate
|
3,617
|
3,371
|
-
|
4,753
|
4,334
|
-
|
||||||||||||||||||
|
Residential mortgages
|
2,451
|
2,451
|
-
|
3,076
|
2,947
|
-
|
||||||||||||||||||
|
Home equity
|
1,176
|
1,176
|
-
|
1,233
|
1,233
|
-
|
||||||||||||||||||
|
Consumer
|
119
|
119
|
-
|
207
|
207
|
-
|
||||||||||||||||||
|
Subtotal
|
10,951
|
10,705
|
-
|
12,138
|
11,590
|
-
|
||||||||||||||||||
|
With an allowance recorded:
|
||||||||||||||||||||||||
|
Commercial and industrial
|
4
|
4
|
4
|
3
|
3
|
-
|
||||||||||||||||||
|
Residential mortgages
|
2,659
|
2,530
|
305
|
2,870
|
2,870
|
559
|
||||||||||||||||||
|
Home equity
|
419
|
403
|
172
|
586
|
450
|
170
|
||||||||||||||||||
|
Consumer
|
91
|
91
|
26
|
172
|
172
|
48
|
||||||||||||||||||
|
Subtotal
|
3,173
|
3,028
|
507
|
3,631
|
3,495
|
777
|
||||||||||||||||||
|
Total
|
$
|
14,124
|
$
|
13,733
|
$
|
507
|
$
|
15,769
|
$
|
15,085
|
$
|
777
|
||||||||||||
The following table presents the Company’s average recorded investment in impaired loans and the related interest income recognized disaggregated by class for the years ended December 31, 2016, 2015 and 2014 (in thousands). No interest income was recognized on a cash basis on impaired loans for any of the periods presented. The interest income recognized on accruing impaired loans is shown in the following table.
|
Years Ended December 31,
|
||||||||||||||||||||||||
|
2016
|
2015
|
2014
|
||||||||||||||||||||||
|
Average
recorded
investment
in impaired
loans
|
Interest
income
recognized
on impaired
loans
|
Average
recorded
investment
in impaired
loans
|
Interest
income
recognized
on impaired
loans
|
Average
recorded
investment
in impaired
loans
|
Interest
income
recognized
on impaired
loans
|
|||||||||||||||||||
|
Commercial and industrial
|
$
|
3,996
|
$
|
166
|
$
|
3,313
|
$
|
533
|
$
|
6,961
|
$
|
730
|
||||||||||||
|
Commercial real estate
|
3,969
|
194
|
7,710
|
688
|
10,823
|
251
|
||||||||||||||||||
|
Real estate construction
|
-
|
-
|
-
|
-
|
-
|
-
|
||||||||||||||||||
|
Residential mortgages
|
5,171
|
200
|
5,645
|
297
|
5,094
|
207
|
||||||||||||||||||
|
Home equity
|
1,642
|
65
|
1,719
|
67
|
804
|
83
|
||||||||||||||||||
|
Consumer
|
256
|
12
|
376
|
16
|
248
|
18
|
||||||||||||||||||
|
Total
|
$
|
15,034
|
$
|
637
|
$
|
18,763
|
$
|
1,601
|
$
|
23,930
|
$
|
1,289
|
||||||||||||
The following table presents a summary of non-performing assets for each period (in thousands):
|
December 31, 2016
|
December 31, 2015
|
|||||||
|
Non-accrual loans
|
$
|
5,560
|
$
|
5,528
|
||||
|
Non-accrual loans held for sale
|
-
|
-
|
||||||
|
Loans 90 days or more past due and still accruing
|
-
|
-
|
||||||
|
OREO
|
650
|
-
|
||||||
|
Total non-performing assets
|
$
|
6,210
|
$
|
5,528
|
||||
|
TDRs accruing interest
|
$
|
7,991
|
$
|
9,239
|
||||
|
TDRs non-accruing
|
$
|
4,348
|
$
|
2,324
|
||||
At December 31, 2016 and 2015, non-accrual loans disaggregated by class were as follows (dollars in thousands):
|
December 31, 2016
|
December 31, 2015
|
|||||||||||||||||||||||||||||||
|
Non-
accrual
loans
|
% of
Total
|
Total Loans
|
% of Total
Loans
|
Non-
accrual
loans
|
% of
Total
|
Total Loans
|
% of Total
Loans
|
|||||||||||||||||||||||||
|
Commercial and industrial
|
$
|
3,288
|
59.2
|
%
|
$
|
189,410
|
0.2
|
%
|
$
|
1,954
|
35.3
|
%
|
$
|
189,769
|
0.1
|
%
|
||||||||||||||||
|
Commercial real estate
|
1,964
|
35.3
|
731,986
|
0.1
|
1,733
|
31.4
|
696,787
|
0.1
|
||||||||||||||||||||||||
|
Multifamily
|
-
|
-
|
402,935
|
-
|
-
|
-
|
426,549
|
-
|
||||||||||||||||||||||||
|
Mixed use commercial
|
-
|
-
|
78,807
|
-
|
-
|
-
|
78,787
|
-
|
||||||||||||||||||||||||
|
Real estate construction
|
-
|
-
|
41,028
|
-
|
-
|
-
|
37,233
|
-
|
||||||||||||||||||||||||
|
Residential mortgages
|
143
|
2.6
|
185,112
|
-
|
1,358
|
24.6
|
186,313
|
0.1
|
||||||||||||||||||||||||
|
Home equity
|
164
|
2.9
|
42,419
|
-
|
406
|
7.3
|
44,951
|
-
|
||||||||||||||||||||||||
|
Consumer
|
1
|
-
|
4,867
|
-
|
77
|
1.4
|
6,058
|
-
|
||||||||||||||||||||||||
|
Total
|
$
|
5,560
|
100.0
|
%
|
$
|
1,676,564
|
0.3
|
%
|
$
|
5,528
|
100.0
|
%
|
$
|
1,666,447
|
0.3
|
%
|
||||||||||||||||
Additional interest income of approximately $365 thousand, $297 thousand and $953 thousand would have been recorded during the years ended December 31, 2016, 2015 and 2014, respectively, if non-accrual loans had performed in accordance with their original terms.
The following summarizes the activity in the allowance for loan losses disaggregated by class for the periods indicated (in thousands).
|
Year Ended December 31, 2016
|
Year Ended December 31, 2015
|
|||||||||||||||||||||||||||||||||||||||
|
Balance at
beginning of
period
|
Charge-
offs
|
Recoveries
|
Provision
(credit) for
loan losses
|
Balance at
end of
period
|
Balance at
beginning of
period
|
Charge-
offs
|
Recoveries
|
(Credit)
provision
for loan
losses
|
Balance at
end of
period
|
|||||||||||||||||||||||||||||||
|
Commercial and industrial
|
$
|
1,875
|
$
|
(416
|
)
|
$
|
264
|
$
|
409
|
$
|
2,132
|
$
|
1,560
|
$
|
(744
|
)
|
$
|
1,524
|
$
|
(465
|
)
|
$
|
1,875
|
|||||||||||||||||
|
Commercial real estate
|
7,019
|
(103
|
)
|
210
|
904
|
8,030
|
6,777
|
-
|
39
|
203
|
7,019
|
|||||||||||||||||||||||||||||
|
Multifamily
|
4,688
|
-
|
-
|
(1,065
|
)
|
3,623
|
4,018
|
-
|
-
|
670
|
4,688
|
|||||||||||||||||||||||||||||
|
Mixed use commercial
|
766
|
-
|
-
|
(36
|
)
|
730
|
261
|
-
|
-
|
505
|
766
|
|||||||||||||||||||||||||||||
|
Real estate construction
|
386
|
-
|
-
|
174
|
560
|
383
|
-
|
-
|
3
|
386
|
||||||||||||||||||||||||||||||
|
Residential mortgages
|
2,476
|
-
|
42
|
(517
|
)
|
2,001
|
3,027
|
-
|
32
|
(583
|
)
|
2,476
|
||||||||||||||||||||||||||||
|
Home equity
|
639
|
(19
|
)
|
13
|
(118
|
)
|
515
|
709
|
-
|
22
|
(92
|
)
|
639
|
|||||||||||||||||||||||||||
|
Consumer
|
106
|
(72
|
)
|
13
|
15
|
62
|
166
|
(14
|
)
|
26
|
(72
|
)
|
106
|
|||||||||||||||||||||||||||
|
Unallocated
|
2,730
|
-
|
-
|
(266
|
)
|
2,464
|
2,299
|
-
|
-
|
431
|
2,730
|
|||||||||||||||||||||||||||||
|
Total
|
$
|
20,685
|
$
|
(610
|
)
|
$
|
542
|
$
|
(500
|
)
|
$
|
20,117
|
$
|
19,200
|
$
|
(758
|
)
|
$
|
1,643
|
$
|
600
|
$
|
20,685
|
|||||||||||||||||
|
Year Ended December 31, 2014
|
||||||||||||||||||||
|
Balance at
beginning of
period
|
Charge-
offs
|
Recoveries
|
(Credit)
provision
for loan
losses
|
Balance at
end of
period
|
||||||||||||||||
|
Commercial and industrial
|
$
|
2,615
|
$
|
(420
|
)
|
$
|
797
|
$
|
(1,432
|
)
|
$
|
1,560
|
||||||||
|
Commercial real estate
|
6,572
|
-
|
519
|
(314
|
)
|
6,777
|
||||||||||||||
|
Multifamily
|
2,159
|
-
|
-
|
1,859
|
4,018
|
|||||||||||||||
|
Mixed use commercial
|
54
|
-
|
-
|
207
|
261
|
|||||||||||||||
|
Real estate construction
|
88
|
-
|
-
|
295
|
383
|
|||||||||||||||
|
Residential mortgages
|
2,463
|
(32
|
)
|
16
|
580
|
3,027
|
||||||||||||||
|
Home equity
|
745
|
-
|
50
|
(86
|
)
|
709
|
||||||||||||||
|
Consumer
|
241
|
(40
|
)
|
47
|
(82
|
)
|
166
|
|||||||||||||
|
Unallocated
|
2,326
|
-
|
-
|
(27
|
)
|
2,299
|
||||||||||||||
|
Total
|
$
|
17,263
|
$
|
(492
|
)
|
$
|
1,429
|
$
|
1,000
|
$
|
19,200
|
|||||||||
The Company utilizes an eight-grade risk-rating system for loans. Loans in risk grades 1- 4 are considered pass loans. The Company’s risk grades are as follows:
Risk Grade 1, Excellent - Loans secured by liquid collateral such as certificates of deposit, reputable bank letters of credit, or other cash equivalents; loans that are guaranteed or otherwise backed by the full faith and credit of the United States government or an agency thereof, such as the Small Business Administration; or loans to any publicly held company with a current long-term debt rating of A or better.
Risk Grade 2, Good - Loans to businesses that have strong financial statements containing an unqualified opinion from a CPA firm and at least three consecutive years of profits; loans supported by un-audited financial statements containing strong balance sheets, five consecutive years of profits, a five-year satisfactory relationship with the Company, and key balance sheet and income statement trends that are either stable or positive; loans secured by publicly traded marketable securities where there is no impediment to liquidation; loans to individuals backed by liquid personal assets, established credit history, and unquestionable character; or loans to publicly held companies with current long-term debt ratings of Baa or better.
Risk Grade 3, Satisfactory - Loans supported by financial statements (audited or un-audited) that indicate average or slightly below average risk and having some deficiency or vulnerability to changing economic conditions; loans with some weakness but offsetting features of other support are readily available; loans that are meeting the terms of repayment, but which may be susceptible to deterioration if adverse factors are encountered. Loans may be graded Satisfactory when there is no recent information on which to base a current risk evaluation and the following conditions apply:
| · |
At inception, the loan was properly underwritten, did not possess an unwarranted level of credit risk, and the loan met the above criteria for a risk grade of Excellent, Good, or Satisfactory.
|
| · |
At inception, the loan was secured with collateral possessing a loan value adequate to protect the Company from loss.
|
| · |
The loan has exhibited two or more years of satisfactory repayment with a reasonable reduction of the principal balance.
|
| · |
During the period that the loan has been outstanding, there has been no evidence of any credit weakness. Some examples of weakness include slow payment, lack of cooperation by the borrower, breach of loan covenants or the borrower is in an industry known to be experiencing problems. If any of these credit weaknesses is observed, a lower risk grade may be warranted.
|
Risk Grade 4, Satisfactory/Monitored - Loans in this category are considered to be of acceptable credit quality, but contain greater credit risk than satisfactory loans due to weak balance sheets, marginal earnings or cash flow, or other uncertainties. These loans warrant a higher than average level of monitoring to ensure that weaknesses do not advance. The level of risk in a Satisfactory/Monitored loan is within acceptable underwriting guidelines so long as the loan is given the proper level of management supervision.
Risk Grade 5, Special Mention - Loans in this category possess potential weaknesses that deserve management’s close attention. If left uncorrected, these potential weaknesses may result in deterioration of the repayment prospects for the loan or in the institution’s credit position at some future date. Special Mention loans are not adversely classified and do not expose an institution to sufficient risk to warrant adverse classification. The key distinctions of a Special Mention classification are that (1) it is indicative of an unwarranted level of risk and (2) weaknesses are considered potential not defined impairments to the primary source of repayment.
Risk Grade 6, Substandard - One or more of the following characteristics may be exhibited in loans classified Substandard:
| · |
Loans which possess a defined credit weakness. The likelihood that a loan will be paid from the primary source of repayment is uncertain. Financial deterioration is under way and very close attention is warranted to ensure that the loan is collected without loss.
|
| · |
Loans are inadequately protected by the current net worth and paying capacity of the obligor.
|
| · |
The primary source of repayment is gone, and the Bank is forced to rely on a secondary source of repayment, such as collateral liquidation or guarantees.
|
| · |
Loans have a distinct possibility that the Company will sustain some loss if deficiencies are not corrected.
|
| · |
Unusual courses of action are needed to maintain a high probability of repayment.
|
| · |
The borrower is not generating enough cash flow to repay loan principal; however, it continues to make interest payments.
|
| · |
The lender is forced into a subordinated or unsecured position due to flaws in documentation.
|
| · |
Loans have been restructured so that payment schedules, terms, and collateral represent concessions to the borrower when compared to the normal loan terms.
|
| · |
The lender is seriously contemplating foreclosure or legal action due to the apparent deterioration in the loan.
|
| · |
There is a significant deterioration in market conditions to which the borrower is highly vulnerable.
|
Risk Grade 7, Doubtful - One or more of the following characteristics may be present in loans classified Doubtful:
| · |
Loans have all of the weaknesses of those classified as Substandard. However, based on existing conditions, these weaknesses make full collection of principal highly improbable.
|
| · |
The primary source of repayment is gone, and there is considerable doubt as to the quality of the secondary source of repayment.
|
| · |
The possibility of loss is high but because of certain important pending factors which may strengthen the loan, loss classification is deferred until the exact status of repayment is known.
|
Risk Grade 8, Loss - Loans are considered uncollectible and of such little value that continuing to carry them as assets is not feasible. Loans will be classified Loss when it is neither practical nor desirable to defer writing off or reserving all or a portion of a basically worthless asset, even though partial recovery may be possible at some time in the future.
The Company annually reviews the ratings on all loans greater than $750 thousand. Annually, the Company engages an independent third-party to review a significant portion of loans within the commercial and industrial, commercial real estate, multifamily, mixed use commercial and real estate construction loan classes. Management uses the results of these reviews as part of its ongoing review process.
The following presents the Company’s loan portfolio credit risk profile by internally assigned grade disaggregated by class of loan at December 31, 2016 and 2015 (in thousands).
|
December 31, 2016
|
December 31, 2015
|
|||||||||||||||||||||||||||||||
|
Grade
|
Grade
|
|||||||||||||||||||||||||||||||
|
Pass
|
Special
mention
|
Substandard
|
Total
|
Pass
|
Special
mention
|
Substandard
|
Total
|
|||||||||||||||||||||||||
|
Commercial and industrial
|
$
|
175,541
|
$
|
1,292
|
$
|
12,577
|
$
|
189,410
|
$
|
180,024
|
$
|
3,088
|
$
|
6,657
|
$
|
189,769
|
||||||||||||||||
|
Commercial real estate
|
719,688
|
2,300
|
9,998
|
731,986
|
687,210
|
6,109
|
3,468
|
696,787
|
||||||||||||||||||||||||
|
Multifamily
|
402,935
|
-
|
-
|
402,935
|
426,549
|
-
|
-
|
426,549
|
||||||||||||||||||||||||
|
Mixed use commercial
|
76,566
|
2,241
|
-
|
78,807
|
78,779
|
-
|
8
|
78,787
|
||||||||||||||||||||||||
|
Real estate construction
|
39,495
|
-
|
1,533
|
41,028
|
37,233
|
-
|
-
|
37,233
|
||||||||||||||||||||||||
|
Residential mortgages
|
184,800
|
-
|
312
|
185,112
|
184,781
|
-
|
1,532
|
186,313
|
||||||||||||||||||||||||
|
Home equity
|
42,255
|
-
|
164
|
42,419
|
44,545
|
-
|
406
|
44,951
|
||||||||||||||||||||||||
|
Consumer
|
4,867
|
-
|
-
|
4,867
|
5,939
|
-
|
119
|
6,058
|
||||||||||||||||||||||||
|
Total
|
$
|
1,646,147
|
$
|
5,833
|
$
|
24,584
|
$
|
1,676,564
|
$
|
1,645,060
|
$
|
9,197
|
$
|
12,190
|
$
|
1,666,447
|
||||||||||||||||
|
% of Total
|
98.2
|
%
|
0.3
|
%
|
1.5
|
%
|
100.0
|
%
|
98.7
|
%
|
0.6
|
%
|
0.7
|
%
|
100.0
|
%
|
||||||||||||||||
TDRs are modifications or renewals where the Company has granted a concession to a borrower in financial distress. The Company reviews all modifications and renewals for determination of TDR status. The Company allocated $340 thousand and $534 thousand of specific reserves to customers whose loan terms have been modified as TDRs as of December 31, 2016 and 2015, respectively. These loans involved the restructuring of terms to allow customers to mitigate the risk of default by meeting a lower payment requirement based upon their current cash flow. These may also include loans that renewed at existing contractual rates, but below market rates for comparable credit.
A total of $45 thousand was committed to be advanced in connection with TDRs as of each year end December 31, 2016 and 2015, representing the amount the Company is legally required to advance under existing loan agreements. These loans are not in default under the terms of the loan agreements and are accruing interest. It is the Company’s policy to evaluate advances on such loans on a case-by-case basis. Absent a legal obligation to advance pursuant to the terms of the loan agreement, the Company generally will not advance funds for which it has outstanding commitments, but may do so in certain circumstances.
Outstanding TDRs, disaggregated by class, at December 31, 2016 and 2015 are as follows (dollars in thousands):
|
December 31, 2016
|
December 31, 2015
|
|||||||||||||||
|
TDRs Outstanding
|
Number of
Loans
|
Outstanding
Recorded
Balance
|
Number of
Loans
|
Outstanding
Recorded
Balance
|
||||||||||||
|
Commercial and industrial
|
13
|
$
|
3,586
|
17
|
$
|
1,116
|
||||||||||
|
Commercial real estate
|
3
|
2,472
|
5
|
4,131
|
||||||||||||
|
Residential mortgages
|
22
|
4,716
|
22
|
4,653
|
||||||||||||
|
Home equity
|
5
|
1,355
|
5
|
1,362
|
||||||||||||
|
Consumer
|
6
|
210
|
8
|
301
|
||||||||||||
|
Total
|
49
|
$
|
12,339
|
57
|
$
|
11,563
|
||||||||||
The following presents, disaggregated by class, information regarding TDRs executed during the years ended December 31, 2016, 2015 and 2014 (dollars in thousands):
|
Years Ended December 31,
|
||||||||||||||||||||||||
|
2016
|
2015
|
|||||||||||||||||||||||
|
New TDRs
|
Number
of
Loans
|
Pre-Modification
Outstanding
Recorded
Balance
|
Post-Modification
Outstanding
Recorded
Balance
|
Number
of
Loans
|
Pre-Modification
Outstanding
Recorded
Balance
|
Post-Modification
Outstanding
Recorded
Balance
|
||||||||||||||||||
|
Commercial and industrial
|
5
|
$
|
3,196
|
$
|
3,082
|
4
|
$
|
388
|
$
|
388
|
||||||||||||||
|
Residential mortgages
|
-
|
-
|
-
|
3
|
300
|
305
|
||||||||||||||||||
|
Home equity
|
-
|
-
|
-
|
1
|
192
|
192
|
||||||||||||||||||
|
Consumer
|
-
|
-
|
-
|
1
|
43
|
43
|
||||||||||||||||||
|
Total
|
5
|
$
|
3,196
|
$
|
3,082
|
9
|
$
|
923
|
$
|
928
|
||||||||||||||
|
Year Ended December 31,
|
||||||||||||
|
2014
|
||||||||||||
|
New TDRs
|
Number
of
Loans
|
Pre-Modification
Outstanding
Recorded
Balance
|
Post-Modification
Outstanding
Recorded
Balance
|
|||||||||
|
Commercial and industrial
|
10
|
$
|
1,877
|
$
|
1,877
|
|||||||
|
Commercial real estate
|
2
|
5,161
|
5,161
|
|||||||||
|
Residential mortgages
|
4
|
581
|
581
|
|||||||||
|
Home equity
|
5
|
1,219
|
1,219
|
|||||||||
|
Consumer
|
4
|
145
|
145
|
|||||||||
|
Total
|
25
|
$
|
8,983
|
$
|
8,983
|
|||||||
Presented below and disaggregated by class is information regarding loans modified as TDRs that had payment defaults of 90 days or more within twelve months of restructuring during the years ended December 31, 2016, 2015 and 2014 (dollars in thousands).
|
Years Ended December 31,
|
||||||||||||||||||||||||
|
2016
|
2015
|
2014
|
||||||||||||||||||||||
|
Defaulted TDRs
|
Number
of Loans
|
Outstanding
Recorded
Balance
|
Number
of Loans
|
Outstanding
Recorded
Balance
|
Number
of Loans
|
Outstanding
Recorded
Balance
|
||||||||||||||||||
|
Commercial real estate
|
-
|
$
|
-
|
-
|
$
|
-
|
2
|
$
|
1,529
|
|||||||||||||||
|
Consumer
|
-
|
-
|
1
|
46
|
-
|
-
|
||||||||||||||||||
|
Total
|
-
|
$
|
-
|
1
|
$
|
46
|
2
|
$
|
1,529
|
|||||||||||||||
Not all loan modifications are TDRs. In some cases, the Company might provide a concession, such as a reduction in interest rate, but the borrower is not experiencing financial distress. This could be the case if the Company is matching a competitor’s interest rate.
5. PREMISES AND EQUIPMENT
At December 31, 2016 and 2015, premises and equipment consisted of the following (in thousands):
|
Estimated
Useful Lives
|
2016
|
2015
|
|||||||
|
Land
|
Indefinite
|
$
|
3,014
|
$
|
3,015
|
||||
|
Premises
|
30 - 40 years
|
33,413
|
33,341
|
||||||
|
Furniture, fixtures & equipment
|
3 - 7 years
|
18,479
|
16,189
|
||||||
|
Leasehold improvements
|
2 - 25 years
|
3,991
|
3,937
|
||||||
|
58,897
|
56,482
|
||||||||
|
Accumulated depreciation and amortization
|
(34,172
|
)
|
(33,242
|
)
|
|||||
|
Balance at end of year
|
|
$
|
24,725
|
$
|
23,240
|
||||
Premises and accumulated depreciation and amortization include amounts related to property under capital leases of approximately $3 million and $4 million at December 31, 2016 and 2015, respectively.
Depreciation and amortization charged to operations amounted to $2.4 million, $2.3 million and $2.4 million during 2016, 2015 and 2014, respectively. Depreciation and amortization charged to operations includes amounts related to property under capital leases of $243 thousand, $242 thousand and $243 thousand in 2016, 2015 and 2014, respectively.
6. DEPOSITS
Scheduled maturities of certificates of deposit are as follows (in thousands):
|
Year During Which Time Deposit Matures
|
Time Deposits
> $250,000
|
Other Time
Deposits
|
||||||
|
2017
|
$
|
98,723
|
$
|
60,470
|
||||
|
2018
|
10,573
|
14,391
|
||||||
|
2019
|
511
|
2,010
|
||||||
|
2020
|
461
|
3,519
|
||||||
|
2021 and thereafter
|
2,502
|
3,543
|
||||||
|
Total
|
$
|
112,770
|
$
|
83,933
|
||||
At December 31, 2016 and 2015, the Bank had $1 million in deposits gathered through the Certificate of Deposit Account Registry Service (“CDARS”) which are considered for regulatory purposes to be brokered deposits.
7. BORROWINGS
The following summarizes borrowed funds at December 31, 2016 and 2015 (dollars in thousands):
|
As of or for the Year Ended
December 31, 2016
|
Federal Home Loan
Bank Borrowings
Short-Term
|
Federal Home Loan
Bank Borrowings
Long-Term
|
Federal Funds
Purchased
|
|||||||||
|
Daily average outstanding
|
$
|
47,315
|
$
|
15,000
|
$
|
3
|
||||||
|
Total interest cost
|
276
|
264
|
-
|
|||||||||
|
Average interest rate paid
|
0.58
|
%
|
1.76
|
%
|
0.76
|
%
|
||||||
|
Maximum amount outstanding at any month-end
|
$
|
160,000
|
$
|
15,000
|
$
|
-
|
||||||
|
Ending balance
|
-
|
15,000
|
-
|
|||||||||
|
Weighted-average interest rate on balances outstanding
|
-
|
%
|
1.76
|
%
|
-
|
%
|
||||||
|
As of or for the Year Ended
December 31, 2015
|
Federal Home Loan
Bank Borrowings
Short-Term
|
Federal Home Loan
Bank Borrowings
Long-Term
|
Federal Funds
Purchased
|
|||||||||
|
Daily average outstanding
|
$
|
63,935
|
$
|
10,808
|
$
|
3
|
||||||
|
Total interest cost
|
252
|
190
|
-
|
|||||||||
|
Average interest rate paid
|
0.39
|
%
|
1.76
|
%
|
0.45
|
%
|
||||||
|
Maximum amount outstanding at any month-end
|
$
|
155,000
|
$
|
15,000
|
$
|
-
|
||||||
|
Ending balance
|
150,000
|
15,000
|
-
|
|||||||||
|
Weighted-average interest rate on balances outstanding
|
0.52
|
%
|
1.76
|
%
|
-
|
%
|
||||||
Assets pledged as collateral to the FHLB, consisting of eligible loans and investment securities, at December 31, 2016 and 2015 resulted in a maximum borrowing potential of $662 million and $746 million, respectively. The Company had $15 million and $165 million in FHLB borrowings at December 31, 2016 and 2015, respectively. Of the total borrowings outstanding at December 31, 2016, no required payments are due in 2017 and $15 million will be made in 2020.
At both December 31, 2016 and 2015, approximately $60 million and $10 million in unsecured and secured lines of credit, respectively, extended by correspondent banks were also available to be utilized, if needed, for short-term funding purposes. At both December 31, 2016 and 2015, no borrowings were outstanding under lines of credit with correspondent banks.
8. STOCKHOLDERS’ EQUITY
The Company has a Dividend Reinvestment Plan to provide stockholders of record with a convenient method of investing cash dividends and optional cash payments in additional shares of the Company’s common stock without payment of any brokerage commission or service charges. At the Company’s discretion, such additional shares may be purchased directly from the Company using either originally issued shares or treasury shares at a 3% discount from market value, or the shares may be purchased in negotiated transactions or on any securities exchange where such shares may be traded at 100% of cost. There were 80,499, 33,566 and 6,671 shares issued in 2016, 2015 and 2014, respectively.
Stock Options
Under the terms of the Company’s stock option plans adopted in 1999 and 2009, options have been granted to key employees and directors to purchase shares of the Company’s stock. Options are awarded by the Compensation Committee of the Board of Directors. Both plans provide that the option price shall not be less than the fair value of the common stock on the date the option is granted.
No options have been granted since 2013. Options granted in 2013 and 2012 were exercisable commencing one year from the date of grant at a rate of one-third per year. Options granted prior to 2012 were generally 100% exercisable commencing one year from the date of grant. All options are exercisable for a period of ten years or less.
The total intrinsic value of options exercised in 2016, 2015 and 2014 was $261 thousand, $438 thousand and $145 thousand, respectively. The total cash received from such option exercises was $201 thousand, $539 thousand and $246 thousand, respectively, excluding the tax benefit realized. In exercising those options, 11,300 shares, 39,334 shares and 18,735 shares, respectively, of the Company’s common stock were issued.
A summary of stock option activity follows:
|
Number
of Shares
|
Weighted-Average
Exercise Price
Per Share
|
|||||||
|
Outstanding, January 1, 2014
|
291,000
|
$
|
16.18
|
|||||
|
Granted
|
-
|
-
|
||||||
|
Exercised
|
(18,735
|
)
|
$
|
13.18
|
||||
|
Forfeited or expired
|
(21,165
|
)
|
$
|
16.95
|
||||
|
Outstanding, December 31, 2014
|
251,100
|
$
|
16.33
|
|||||
|
Granted
|
-
|
-
|
||||||
|
Exercised
|
(39,334
|
)
|
$
|
13.71
|
||||
|
Forfeited or expired
|
(26,666
|
)
|
$
|
24.39
|
||||
|
Outstanding, December 31, 2015
|
185,100
|
$
|
15.73
|
|||||
|
Granted
|
-
|
-
|
||||||
|
Exercised
|
(11,300
|
)
|
$
|
17.82
|
||||
|
Forfeited or expired
|
(3,000
|
)
|
$
|
34.95
|
||||
|
Outstanding, December 31, 2016
|
170,800
|
$
|
15.26
|
|||||
The following summarizes shares subject to purchase from stock options outstanding and exercisable as of December 31, 2016:
|
Outstanding
|
Exercisable
|
|||||||||||||||||||
|
Range of
Exercise Prices
|
Shares
|
Weighted-Average
Remaining
Contractual Life
|
Weighted-Average
Exercise Price
|
Shares
|
Weighted-Average
Remaining
Contractual Life
|
Weighted-Average
Exercise Price
|
||||||||||||||
|
$
|
10.00 - $14.00
|
81,700
|
5.1 years
|
$
|
11.53
|
81,700
|
5.1 years
|
$
|
11.53
|
|||||||||||
|
$
|
14.01 - $20.00
|
83,100
|
6.6 years
|
$
|
17.80
|
83,100
|
6.6 years
|
$
|
17.80
|
|||||||||||
|
$
|
20.01 - $30.00
|
2,000
|
2.1 years
|
$
|
28.30
|
2,000
|
2.1 years
|
$
|
28.30
|
|||||||||||
|
$
|
30.01 - $40.00
|
4,000
|
0.6 years
|
$
|
32.04
|
4,000
|
0.6 years
|
$
|
32.04
|
|||||||||||
|
170,800
|
5.7 years
|
$
|
15.26
|
170,800
|
5.7 years
|
$
|
15.26
|
|||||||||||||
Restricted Stock Awards
Under the Company’s Amended and Restated 2009 Stock Incentive Plan (the “2009 Plan”), the Company can award options, stock appreciation rights (“SARs”) and restricted stock. During 2016, 2015 and 2014, the Company awarded 59,371, 71,612 and 77,000 shares of restricted stock to certain key employees and directors. Generally, the restricted stock awards vest over a three-year period commencing one year from the date of grant at a rate of one-third per year. The fair value at grant date of the 48,899 and 25,948 restricted shares that vested in 2016 and 2015, respectively, was $1.1 million and $585 thousand, respectively. Of the vested shares, 10,380 and 4,787, respectively, were withheld to pay taxes due upon vesting. A summary of restricted stock activity follows:
|
Number
of Shares
|
Weighted-Average
Grant-Date
Fair Value
|
|||||||
|
Unvested, January 1, 2014
|
-
|
-
|
||||||
|
Granted
|
77,000
|
$
|
22.51
|
|||||
|
Vested
|
-
|
-
|
||||||
|
Forfeited or expired
|
(4,650
|
)
|
$
|
22.51
|
||||
|
Unvested, December 31, 2014
|
72,350
|
$
|
22.51
|
|||||
|
Granted
|
71,612
|
$
|
23.18
|
|||||
|
Vested
|
(25,948
|
)
|
$
|
22.55
|
||||
|
Forfeited or expired
|
(9,941
|
)
|
$
|
22.61
|
||||
|
Unvested, December 31, 2015
|
108,073
|
$
|
22.94
|
|||||
|
Granted
|
59,371
|
$
|
26.62
|
|||||
|
Vested
|
(48,899
|
)
|
$
|
22.98
|
||||
|
Forfeited or expired
|
(4,465
|
)
|
$
|
23.43
|
||||
|
Unvested, December 31, 2016
|
114,080
|
$
|
24.81
|
|||||
The Company recognizes compensation expense for the fair value of stock options and restricted stock on a straight line basis over the requisite service period of the grants. Compensation expense related to stock-based compensation amounted to $1.1 million, $949 thousand and $811 thousand for the years ended December 31, 2016, 2015 and 2014, respectively. The remaining unrecognized compensation cost of approximately $1.7 million at December 31, 2016 related to restricted stock will be expensed over the remaining weighted average vesting period of approximately 1.7 years. At December 31, 2016, there was no remaining unrecognized compensation cost related to stock options.
Under the 2009 Plan, a total of 500,000 shares of the Company’s common stock were reserved for issuance, of which 118,404 shares remained for possible issuance at December 31, 2016. There are no remaining shares reserved for issuance under the 1999 Stock Option Plan.
9. INCOME TAXES
The following table presents the expense for income taxes in the consolidated statements of income which is comprised of the following (in thousands):
|
2016
|
2015
|
2014
|
|||||||||||
|
Current:
|
Federal
|
$
|
4,989
|
$
|
4,178
|
$
|
5,208
|
||||||
|
State and local
|
515
|
694
|
223
|
||||||||||
|
|
5,504
|
4,872
|
5,431
|
||||||||||
|
Deferred:
|
Federal
|
2,343
|
1,139
|
(885
|
)
|
||||||||
|
State and local
|
28
|
429
|
(747
|
)
|
|||||||||
|
2,371
|
1,568
|
(1,632
|
)
|
||||||||||
|
Valuation allowance
|
|
(253
|
)
|
(554
|
)
|
(79
|
)
|
||||||
|
Total
|
|
$
|
7,622
|
$
|
5,886
|
$
|
3,720
|
||||||
The total tax expense was different from the amounts computed by applying the federal income tax rate because of the following:
|
2016
|
2015
|
2014
|
||||||||||
|
Federal income tax expense at statutory rates
|
35
|
%
|
35
|
%
|
35
|
%
|
||||||
|
Surtax exemption
|
(1
|
)
|
(1
|
)
|
(1
|
)
|
||||||
|
Tax-exempt income
|
(8
|
)
|
(10
|
)
|
(14
|
)
|
||||||
|
State and local income taxes, net of federal benefit
|
2
|
2
|
1
|
|||||||||
|
Deferred tax asset adjustment and change in rate
|
-
|
(1
|
)
|
(2
|
)
|
|||||||
|
Other
|
-
|
-
|
1
|
|||||||||
|
Total
|
28
|
%
|
25
|
%
|
20
|
%
|
||||||
The effects of temporary differences between tax and financial accounting that create significant deferred tax assets and liabilities and the recognition of income and expense for purposes of tax and financial reporting are presented below (in thousands):
|
2016
|
2015
|
2014
|
||||||||||
|
Deferred tax assets:
|
||||||||||||
|
Allowance for loan losses
|
$
|
8,244
|
$
|
8,392
|
$
|
7,576
|
||||||
|
Deferred compensation
|
1,560
|
1,624
|
1,652
|
|||||||||
|
Stock-based compensation
|
763
|
640
|
459
|
|||||||||
|
Realized losses on securities reclassed from available for sale to held to maturity
|
49
|
930
|
1,180
|
|||||||||
|
Unfunded pension obligation
|
3,277
|
2,529
|
2,496
|
|||||||||
|
Alternative minimum tax credit
|
-
|
2,427
|
3,925
|
|||||||||
|
Net operating loss carryforward
|
699
|
614
|
1,169
|
|||||||||
|
Other
|
1,170
|
1,104
|
992
|
|||||||||
|
Total deferred tax assets
|
15,762
|
18,260
|
19,449
|
|||||||||
|
Deferred tax liabilities:
|
||||||||||||
|
Unrealized gains on securities available for sale
|
(71
|
)
|
(957
|
)
|
(1,724
|
)
|
||||||
|
Other
|
(608
|
)
|
(844
|
)
|
(842
|
)
|
||||||
|
Total deferred tax liabilities
|
(679
|
)
|
(1,801
|
)
|
(2,566
|
)
|
||||||
|
Valuation allowance
|
(699
|
)
|
(614
|
)
|
(1,169
|
)
|
||||||
|
Net deferred tax assets
|
$
|
14,384
|
$
|
15,845
|
$
|
15,714
|
||||||
The deferred tax assets and liabilities are netted and presented in a single amount which is included in deferred taxes in the accompanying consolidated statements of condition. The realization of deferred tax assets (“DTAs”) (net of a recorded valuation allowance) is largely dependent upon future taxable income, future reversals of existing taxable temporary differences and the ability to carry back losses to available tax years. In assessing the need for a valuation allowance, the Company considers positive and negative evidence, including taxable income in carryback years, scheduled reversals of deferred tax liabilities, expected future taxable income and tax planning strategies. At December 31, 2016, the Company had net operating loss carryforwards of approximately $14.4 million for New York State (“NYS”) income tax purposes, which may be applied against future taxable income. The Company has a full valuation allowance of $699 thousand, tax effected, on the NYS net operating loss carryforward due to the Company’s significant tax-exempt investment income. The valuation allowance may be reversed to income in future periods to the extent that the related DTAs are realized or when the Company returns to consistent, taxable earnings in NYS. The NYS unused net operating loss carryforwards are expected to expire in varying amounts through the year 2032.
The Company had no unrecognized tax benefits at December 31, 2016 and 2015 as compared to $34 thousand at December 31, 2014. The Company files income tax returns in the U.S. federal jurisdiction and in New York State. Federal returns are subject to audits by tax authorities. The Company’s Federal tax returns were audited for the tax years 2010 through 2013; there was no change in income taxes as a result of these audits. It is not anticipated that the unrecognized tax benefits will significantly change over the next 12 months.
10. EMPLOYEE BENEFITS
Retirement Plan
The Company’s retirement plan is noncontributory and covers substantially all eligible employees. The plan conforms to the provisions of the Employee Retirement Income Security Act of 1974, as amended, and the Pension Protection Act of 2006, which requires certain funding rules for defined benefit plans. The Company’s policy is to accrue for all pension costs and to fund the maximum amount allowable for tax purposes. Actuarial gains and losses that arise from changes in assumptions concerning future events are amortized over a period that reflects the long-term nature of pension expense used in estimating pension costs.
Certain provisions of the Company’s retirement plan were amended in 2012. These amendments froze the plan such that no additional pension benefits would accumulate.
The tables below set forth the status of the Company’s retirement plan at December 31 for the years presented, the time at which the annual valuation of the plan is made.
The following table sets forth the plan’s change in benefit obligation (in thousands):
|
2016
|
2015
|
2014
|
||||||||||
|
Benefit obligation at beginning of year
|
$
|
47,431
|
$
|
49,734
|
$
|
41,713
|
||||||
|
Interest cost
|
2,185
|
2,099
|
2,158
|
|||||||||
|
Actuarial loss (gain)
|
1,895
|
(2,451
|
)
|
7,709
|
||||||||
|
Benefits paid
|
(2,133
|
)
|
(1,951
|
)
|
(1,846
|
)
|
||||||
|
Benefit obligation at end of year
|
$
|
49,378
|
$
|
47,431
|
$
|
49,734
|
||||||
The following table sets forth the plan’s change in plan assets (in thousands):
|
2016
|
2015
|
2014
|
||||||||||
|
Fair value of plan assets at beginning of year
|
$
|
41,003
|
$
|
43,431
|
$
|
41,456
|
||||||
|
Actual return on plan assets
|
2,919
|
(1,227
|
)
|
2,992
|
||||||||
|
Employer contribution
|
-
|
1,000
|
1,000
|
|||||||||
|
Benefits paid and actual expenses
|
(2,541
|
)
|
(2,201
|
)
|
(2,017
|
)
|
||||||
|
Fair value of plan assets at end of year
|
$
|
41,381
|
$
|
41,003
|
$
|
43,431
|
||||||
The following table presents the plan’s funded status and amounts recognized in the consolidated statements of condition (in thousands):
|
2016
|
2015
|
|||||||
|
Underfunded status
|
$
|
(7,997
|
)
|
$
|
(6,428
|
)
|
||
|
Amount included in other liabilities
|
$
|
(7,997
|
)
|
$
|
(6,428
|
)
|
||
|
Accumulated benefit obligation
|
$
|
49,378
|
$
|
47,431
|
||||
In December 2015, the Company made an optional contribution of $1 million for the plan year ended September 30, 2016. In December 2014, the Company made an optional contribution of $1 million for the plan year ended September 30, 2015. No minimum contributions were required for either period. The Company did not contribute to its retirement plan in 2016. The Company does not presently expect to contribute to its retirement plan in 2017.
The following table presents estimated benefits to be paid during the years indicated (in thousands):
|
2017
|
$
|
2,322
|
||
|
2018
|
2,413
|
|||
|
2019
|
2,502
|
|||
|
2020
|
2,540
|
|||
|
2021
|
2,656
|
|||
|
2022-2026
|
14,120
|
The following table summarizes the net periodic pension credit (in thousands):
|
2016
|
2015
|
2014
|
||||||||||
|
Interest cost on projected benefit obligation
|
$
|
2,185
|
$
|
2,099
|
$
|
2,158
|
||||||
|
Expected return on plan assets
|
(2,497
|
)
|
(2,792
|
)
|
(2,548
|
)
|
||||||
|
Amortization of net loss
|
299
|
249
|
25
|
|||||||||
|
Net periodic pension credit
|
(13
|
)
|
(444
|
)
|
(365
|
)
|
||||||
|
Other changes in plan assets and benefit obligation recognized in other comprehensive income:
|
||||||||||||
|
Net actuarial loss
|
1,880
|
1,819
|
7,435
|
|||||||||
|
Amortization of net loss
|
(299
|
)
|
(249
|
)
|
(25
|
)
|
||||||
|
Total recognized in other comprehensive income
|
1,581
|
1,570
|
7,410
|
|||||||||
|
Total recognized in net periodic pension credit and other comprehensive income
|
$
|
1,568
|
$
|
1,126
|
$
|
7,045
|
||||||
|
Weighted-average discount rate for the period
|
4.74
|
%
|
4.32
|
%
|
5.33
|
%
|
||||||
|
Expected long-term rate of return on assets
|
7.00
|
%
|
7.00
|
%
|
7.00
|
%
|
||||||
The assumptions used in the measurement of the Company’s pension obligation at December 31, 2016 and 2015 were:
|
2016
|
2015
|
|||||||
|
Discount rate
|
4.58
|
%
|
4.74
|
%
|
||||
|
Rate of increase in future compensation
|
0.00
|
%
|
0.00
|
%
|
||||
|
Expected long-term rate of return on assets
|
N/A
|
N/A
|
||||||
The following table summarizes the net periodic pension cost expected for the year ended December 31, 2017. This amount is subject to change if a significant plan-related event should occur before the end of fiscal 2017 (in thousands):
|
Projected
2017
|
||||
|
Interest cost on projected benefit obligation
|
$
|
2,190
|
||
|
Expected return on plan assets
|
(2,373
|
)
|
||
|
Amortization of net loss
|
356
|
|||
|
Net periodic pension cost
|
$
|
173
|
||
|
Weighted-average discount rate for the period
|
4.58
|
%
|
||
|
Expected long-term rate of return on assets
|
7.00
|
%
|
||
To determine the expected return on plan assets, certain variables were considered, such as the long-term historical return information on plan assets, the mix of investments that comprise plan assets and the historical returns on indices comparable to the fund classes in which the plan invests.
During 2013, all of the assets of the Company’s retirement plan were transferred to State Street Bank & Trust from the New York State Bankers Retirement System. An investment manager, Mercer Investment Management, is responsible for the implementation of the plan’s investment policies and for appointing and terminating sub-advisors to manage the plan’s assets which are invested in common collective trust funds. The plan’s overall investment strategy is to invest in a mix of growth assets (primarily equities) with the objective of achieving long-term growth and hedging assets (primarily fixed income) with the objective of matching the plan’s liabilities.
The Company’s pension plan weighted-average asset allocations at December 31, 2016 and 2015, by asset category were as follows:
|
At December 31,
|
||||||||
|
Asset category
|
2016
|
2015
|
||||||
|
Cash
|
-
|
%
|
1
|
%
|
||||
|
Equity securities
|
61
|
59
|
||||||
|
Debt securities
|
39
|
40
|
||||||
|
Total
|
100
|
%
|
100
|
%
|
||||
The following table presents target investment allocations for 2017 by asset category:
|
Asset Category
|
Target
Allocation
2017
|
|||
|
Cash equivalents
|
0 - 5
|
%
|
||
|
Equity securities
|
54 - 64
|
%
|
||
|
Fixed income securities
|
36 - 41
|
%
|
||
The following table summarizes the fair value measurements of the Company’s pension plan assets on a recurring basis as of December 31, 2016 (in thousands):
|
Fair Value Measurements Using
|
||||||||||||
|
Description
|
Active Markets for
Identical Assets
Quoted Prices
(Level 1)
|
Significant
Other
Observable Inputs
(Level 2)
|
Total
|
|||||||||
|
Short-term investment funds
|
$
|
181
|
$
|
-
|
$
|
181
|
||||||
|
Common collective trusts:
|
||||||||||||
|
U.S. equity securities
|
-
|
9,698
|
9,698
|
|||||||||
|
Non - U.S. equity securities
|
-
|
15,382
|
15,382
|
|||||||||
|
U.S. fixed income securities
|
-
|
16,120
|
16,120
|
|||||||||
|
Total
|
$
|
181
|
$
|
41,200
|
$
|
41,381
|
||||||
The following table summarizes the fair value measurements of the Company’s pension plan assets on a recurring basis as of December 31, 2015 (in thousands):
|
Fair Value Measurements Using
|
||||||||||||
|
Description
|
Active Markets for
Identical Assets
Quoted Prices
(Level 1)
|
Significant
Other
Observable Inputs
(Level 2)
|
Total
|
|||||||||
|
Short-term investment funds
|
$
|
323
|
$
|
-
|
$
|
323
|
||||||
|
Common collective trusts:
|
||||||||||||
|
U.S. equity securities
|
-
|
9,200
|
9,200
|
|||||||||
|
Non - U.S. equity securities
|
-
|
15,000
|
15,000
|
|||||||||
|
U.S. fixed income securities
|
-
|
16,480
|
16,480
|
|||||||||
|
Total
|
$
|
323
|
$
|
40,680
|
$
|
41,003
|
||||||
The following is a description of the valuation methodologies used for pension assets measured at fair value:
Level 1 – Valuations based on quoted prices in active markets for identical investments.
Level 2 – Valuations based on quoted prices in markets that are not active or for which all significant inputs are observable, either directly or indirectly. Level 2 inputs include: (i) quoted prices for similar investments in active markets, (ii) quoted prices for identical investments traded in non-active markets (i.e., dealer or broker markets) and (iii) inputs other than quoted prices that are observable or inputs derived from or corroborated by market data for substantially the full term of the investment.
Level 3 – Valuations based on inputs that are unobservable, supported by little or no market activity, and significant to the overall fair value measurement.
Deferred Compensation
In 1999, the Board approved a non-qualified deferred compensation plan. Under this plan, certain employees and Directors of the Company may elect to defer some or all of their compensation in exchange for a future payment of the compensation deferred, with accrued interest, at retirement. Participants deferred compensation totaling $47 thousand, $58 thousand and $132 thousand during 2016, 2015 and 2014, respectively. Expense recognized under this plan totaled $41 thousand, $79 thousand and $84 thousand in 2016, 2015 and 2014, respectively.
Post-Retirement Benefits Other Than Pension
The Company formerly provided life insurance benefits to employees meeting eligibility requirements. Employees hired after December 31, 1997 were not eligible for retiree life insurance. No other welfare benefits were provided. In the second quarter of 2013, the Company terminated all post-retirement life insurance benefits and recorded a non-recurring gain of $1.7 million as a credit to employee compensation and benefits expense in the Company’s consolidated statements of income.
401(k) Retirement Plan
The Bank has a 401(k) Retirement Plan and Trust (“401(k) Plan”). Employees who have attained the age of 21 and have completed one-half month of service and 40 hours worked have the option to participate. Employees may currently elect to contribute up to $18,000. The Bank may match up to one-half of the employee’s contribution up to a maximum of 6% of the employee’s annual gross compensation subject to IRS limits. Employees are fully vested immediately in their own contributions and the Bank’s matching contributions. Bank contributions under the 401(k) Plan amounted to $569 thousand, $563 thousand and $515 thousand during 2016, 2015 and 2014, respectively. The Bank funds all amounts when due. Contributions to the 401(k) Plan may be invested in various bond, equity, money market or diversified funds as directed by each employee. The 401(k) Plan does not allow for investment in the Company’s common stock.
11. COMMITMENTS AND CONTINGENT LIABILITIES
The Bank is a party to financial instruments with off-balance sheet risk in the normal course of business to meet the financing needs of its customers. These financial instruments include commitments to extend credit and standby and documentary letters of credit. Those instruments involve, to varying degrees, elements of credit risk in excess of the amount recognized in the consolidated financial statements. The Bank uses the same credit policies in making commitments and conditional obligations as it does for on-balance sheet instruments.
The Company was contingently liable under standby letters of credit in the amount of $14 million and $15 million at December 31, 2016 and 2015, respectively. Of the outstanding letters of credit at December 31, 2016, $13.9 million expires in 2017, $163 thousand expires in 2018, $57 thousand expires in 2019 and $91 thousand expires in 2025. Amounts due under these letters of credit would be reduced by any proceeds that the Company would be able to obtain in liquidating the collateral for the loans, which varies depending on the customer. At both December 31, 2016 and 2015, commitments to originate loans and commitments under unused lines of credit for which the Company is obligated amounted to $126 million.
The Bank is required to maintain balances with the FRB to satisfy reserve requirements. In addition, the FRB continues to offer higher interest rates on overnight deposits compared to correspondent banks. The average balance maintained at the FRB during 2016 was $53 million compared to $12 million in 2015.
At December 31, 2016, the Company was obligated under a number of non-cancelable leases for land and buildings used for bank purposes. Minimum annual rentals, exclusive of taxes and other charges under non-cancelable operating leases, are as follows (in thousands):
|
Capital
Leases
|
Operating
Leases
|
|||||||
|
2017
|
$
|
341
|
$
|
1,679
|
||||
|
2018
|
347
|
1,359
|
||||||
|
2019
|
354
|
1,219
|
||||||
|
2020
|
360
|
801
|
||||||
|
2021
|
377
|
701
|
||||||
|
Thereafter
|
3,969
|
1,632
|
||||||
|
Total minimum lease payments
|
5,748
|
$
|
7,391
|
|||||
|
Less: amounts representing interest
|
1,487
|
|||||||
|
Present value of minimum lease payments
|
$
|
4,261
|
||||||
Total rental expense for the years ended December 31, 2016, 2015 and 2014 amounted to $1.8 million, $1.5 million and $1.1 million, respectively.
The Company and the Bank are subject to legal proceedings and claims that arise in the ordinary course of business. In the opinion of management, the amount of ultimate liability, if any, with respect to such ordinary course matters will not materially affect future operations and will not have a material impact on the Company’s consolidated financial statements. However, the outcome of litigation and other legal and regulatory matters is inherently uncertain, and it is possible that one or more of such matters currently pending or threatened could have an unanticipated material adverse effect on our liquidity, consolidated financial position, results of operations, and/or our business as a whole, in the future.
12. REGULATORY MATTERS
The Company and the Bank are subject to various regulatory capital requirements administered by the federal banking agencies. Failure to meet minimum capital requirements can initiate certain mandatory and possibly additional discretionary actions by regulators that, if undertaken, could have a direct material effect on the Company’s business, results of operations and financial condition. Under capital adequacy guidelines and the regulatory framework for prompt corrective action, the Company and the Bank must meet specific capital requirements that involve quantitative measures of the Company’s and the Bank’s assets, liabilities and certain off-balance sheet items calculated under regulatory accounting practices. The Company’s and the Bank’s capital amounts and the Bank’s classification are also subject to qualitative judgments by the regulators about components, risk weighting and other factors.
Quantitative measures established by regulation to ensure capital adequacy require the Company and the Bank to maintain minimum amounts and ratios of total, tier 1 and common equity tier 1 capital, as defined in the federal banking regulations, to risk-weighted assets and of tier 1 capital to adjusted average assets (leverage).
The Office of the Comptroller of the Currency (“OCC”), the Company’s primary bank regulator, established higher capital requirements for the Bank than those set forth in its capital regulations that require the Bank to maintain a tier 1 leverage ratio of at least 9%, a tier 1 risk-based capital ratio of at least 11% and a total risk-based capital ratio of at least 12%. At December 31, 2016, the Bank satisfied the OCC’s regulatory capital requirements as well as these individual minimum capital ratios, although there is no guarantee that the Bank will be able to maintain compliance with these heightened capital ratios.
In July 2013, the OCC approved new rules on regulatory capital applicable to national banks, implementing Basel III. Most banking organizations were required to apply the new capital rules on January 1, 2015. The final rules set a new common equity tier 1 requirement and higher minimum tier 1 requirements for all banking organizations. The rules revise the prompt corrective action framework to incorporate the new regulatory capital minimums. They also enhance risk sensitivity and address weaknesses identified over recent years with the measure of risk-weighted assets, including through new measures of creditworthiness to replace references to credit ratings, consistent with section 939A of the Dodd-Frank Wall Street Reform and Consumer Protection Act (the “Dodd-Frank Act”). The Company’s implementation of the new rules on January 1, 2015 did not have a material impact on its capital needs.
The final capital rules also place limits on capital distributions and certain discretionary bonus payments if a banking organization does not maintain a buffer of common equity tier 1 capital above minimum capital requirements. The capital buffer requirement is being phased in beginning January 1, 2016 at 0.625% per year until it becomes 2.50% in 2019 and thereafter. At December 31, 2016, the Company’s and the Bank’s capital buffers were in excess of both the current and fully phased-in requirements.
The Bank’s capital amounts (in thousands) and ratios are as follows:
|
Actual capital ratios
|
Minimum
for capital
adequacy
|
Minimum to be Well
Capitalized under prompt
corrective action provisions
|
||||||||||||||||||||||
|
Amount
|
Ratio
|
Amount
|
Ratio
|
Amount
|
Ratio
|
|||||||||||||||||||
|
December 31, 2016
|
||||||||||||||||||||||||
|
Total capital to risk-weighted assets
|
$
|
242,661
|
14.64
|
%
|
$
|
132,592
|
8.00
|
%
|
$
|
165,740
|
10.00
|
%
|
||||||||||||
|
Tier 1 capital to risk-weighted assets
|
222,304
|
13.41
|
%
|
99,444
|
6.00
|
%
|
132,592
|
8.00
|
%
|
|||||||||||||||
|
Common equity tier 1 capital to risk-weighted assets
|
222,304
|
13.41
|
%
|
74,583
|
4.50
|
%
|
107,731
|
6.50
|
%
|
|||||||||||||||
|
Tier 1 capital to adjusted average assets (leverage)
|
222,304
|
10.25
|
%
|
86,767
|
4.00
|
%
|
108,459
|
5.00
|
%
|
|||||||||||||||
|
December 31, 2015
|
||||||||||||||||||||||||
|
Total capital to risk-weighted assets
|
$
|
219,562
|
12.66
|
%
|
$
|
138,716
|
8.00
|
%
|
$
|
173,395
|
10.00
|
%
|
||||||||||||
|
Tier 1 capital to risk-weighted assets
|
198,587
|
11.45
|
%
|
104,037
|
6.00
|
%
|
138,716
|
8.00
|
%
|
|||||||||||||||
|
Common equity tier 1 capital to risk-weighted assets
|
198,587
|
11.45
|
%
|
78,028
|
4.50
|
%
|
112,706
|
6.50
|
%
|
|||||||||||||||
|
Tier 1 capital to adjusted average assets (leverage)
|
198,587
|
9.58
|
%
|
82,905
|
4.00
|
%
|
103,632
|
5.00
|
%
|
|||||||||||||||
The Company’s tier 1 leverage, common equity tier 1 risk-based, tier 1 risk-based and total risk-based capital ratios were 10.31%, 13.50%, 13.50% and 14.72%, respectively, at December 31, 2016. The Company’s tier 1 leverage, common equity tier 1 risk-based, tier 1 risk-based and total risk-based capital ratios were 9.77%, 11.68%, 11.68% and 12.89%, respectively, at December 31, 2015.
The ability of the Bank to pay dividends to the Company is subject to certain regulatory restrictions. Generally, dividends declared in a given year by a national bank are limited to its net profit, as defined by regulatory agencies, for that year, combined with its retained net income for the preceding two years, less any required transfer to surplus or to fund for the retirement of any preferred stock. In addition, a national bank may not pay dividends in an amount greater than its undivided profits or declare any dividends if such declaration would leave the bank inadequately capitalized. At December 31, 2016, $47.3 million was available for dividends from the Bank to the Company.
13. CONCENTRATIONS
Loans
The following table presents the Company’s loan portfolio disaggregated by class of loan at December 31, 2016 and each class’s percentage of total loans and total assets (dollars in thousands):
|
At December 31,
|
2016
|
% of total
loans
|
% of total
assets
|
|||||||||
|
Commercial and industrial
|
$
|
189,410
|
11.3
|
%
|
9.1
|
%
|
||||||
|
Commercial real estate
|
731,986
|
43.7
|
35.0
|
|||||||||
|
Multifamily
|
402,935
|
24.0
|
19.3
|
|||||||||
|
Mixed use commercial
|
78,807
|
4.7
|
3.8
|
|||||||||
|
Real estate construction
|
41,028
|
2.4
|
2.0
|
|||||||||
|
Residential mortgages
|
185,112
|
11.1
|
8.8
|
|||||||||
|
Home equity
|
42,419
|
2.5
|
2.0
|
|||||||||
|
Consumer
|
4,867
|
0.3
|
0.2
|
|||||||||
|
Total loans
|
$
|
1,676,564
|
100.0
|
%
|
80.2
|
%
|
||||||
Commercial and industrial loans, unsecured or secured by collateral other than real estate, present significantly greater risk than other types of loans. The Company obtains, whenever possible, both the personal guarantees of the principal and cross-guarantees among the principal’s business enterprises. Commercial real estate loans (inclusive of multifamily and mixed use commercial loans) present greater risk than residential mortgages. The Company has attempted to minimize the risks of these loans by considering several factors, including the creditworthiness of the borrower, location, condition, value and the business prospects for the security property.
Investment Securities
The following presents the Company’s investment portfolio disaggregated by category of security at December 31, 2016 and each category’s percentage of total investment securities and total assets (dollars in thousands):
|
At December 31,
|
2016
|
% of total
investment
securities
|
% of total
assets
|
|||||||||
|
U.S. Government agency securities
|
$
|
2,380
|
1.2
|
%
|
0.1
|
%
|
||||||
|
Corporate bonds
|
14,535
|
7.4
|
0.7
|
|||||||||
|
Collateralized mortgage obligations
|
17,452
|
8.8
|
0.8
|
|||||||||
|
Mortgage-backed securities
|
87,961
|
44.4
|
4.2
|
|||||||||
|
Obligations of states and political subdivisions
|
75,694
|
38.2
|
3.6
|
|||||||||
|
Total investment securities
|
$
|
198,022
|
100.0
|
%
|
9.4
|
%
|
||||||
Obligations of states and political subdivisions present slightly greater risk than securities backed by the U.S. Government, but significantly less risk than loans as they are backed by the full faith and taxing power of the issuer, most of which are located in the state of New York. MBS and CMOs are both backed by pools of mortgages. However, CMOs may provide more predictable cash flows since payments are assigned to specific tranches of securities in the order in which they are received.
14. FAIR VALUE
Fair value measurement is determined based on the assumptions that market participants would use in pricing the asset or liability in an exchange. The definition of fair value includes the exchange price which is the price in an orderly transaction between market participants to sell an asset or transfer a liability in the principal market for the asset or liability. Market participant assumptions include assumptions about risk, the risk inherent in a particular valuation technique used to measure fair value and/or the risk inherent in the inputs to the valuation technique, as well as the effect of credit risk on the fair value of liabilities. The Company uses three levels of the fair value inputs to measure assets, as described below.
Basis of Fair Value Measurement:
Level 1 – Valuations based on quoted prices in active markets for identical investments.
Level 2 – Valuations based on quoted prices in markets that are not active or for which all significant inputs are observable, either directly or indirectly. Level 2 inputs include: (i) quoted prices for similar investments in active markets, (ii) quoted prices for identical investments traded in non-active markets (i.e., dealer or broker markets) and (iii) inputs other than quoted prices that are observable or inputs derived from or corroborated by market data for substantially the full term of the investment.
Level 3 – Valuations based on inputs that are unobservable, supported by little or no market activity, and significant to the overall fair value measurement.
The types of instruments valued based on quoted market prices in active markets include most U.S. Treasury securities. Such instruments are generally classified within Level 1 and Level 2 of the fair value hierarchy. The Company does not adjust the quoted price for such instruments.
The types of instruments valued based on quoted prices in markets that are not active, broker or dealer quotations, or alternative pricing sources with reasonable levels of price transparency include U.S. Government agency securities, state and municipal obligations, MBS, CMOs and corporate bonds. Such instruments are generally classified within Level 2 of the fair value hierarchy.
The types of instruments valued based on significant unobservable inputs that reflect the Company’s own assumptions about the assumptions that market participants would use in pricing an asset or liability are generally classified within Level 3 of the fair value hierarchy.
The following table presents the carrying amounts and fair values of the Company’s financial instruments (in thousands).
|
Level in
|
December 31, 2016
|
December 31, 2015
|
|||||||||||||||
|
Fair Value
Hierarchy
|
Carrying
Amount
|
Fair
Value
|
Carrying
Amount
|
Fair
Value
|
|||||||||||||
|
Financial Assets:
|
|||||||||||||||||
|
Cash and due from banks
|
Level 1
|
$
|
124,854
|
$
|
124,854
|
$
|
98,086
|
$
|
98,086
|
||||||||
|
Federal Reserve and Federal Home Loan Bank stock and other investments
|
Level 2
|
4,524
|
4,524
|
10,756
|
10,756
|
||||||||||||
|
Investment securities held to maturity
|
Level 2
|
18,780
|
19,259
|
61,309
|
63,272
|
||||||||||||
|
Investment securities available for sale
|
Level 2
|
179,242
|
179,242
|
247,099
|
247,099
|
||||||||||||
|
Loans held for sale
|
Level 2
|
-
|
-
|
1,666
|
1,666
|
||||||||||||
|
Loans, net of allowance
|
Level 2, 3 (1)
|
1,656,447
|
1,623,380
|
1,645,762
|
1,628,169
|
||||||||||||
|
Accrued interest and loan fees receivable
|
Level 2
|
5,742
|
5,742
|
5,859
|
5,859
|
||||||||||||
|
Financial Liabilities:
|
|||||||||||||||||
|
Non-maturity deposits
|
Level 2
|
1,641,479
|
1,641,479
|
1,555,980
|
1,555,980
|
||||||||||||
|
Time deposits
|
Level 2
|
196,703
|
196,080
|
224,643
|
224,408
|
||||||||||||
|
Borrowings
|
Level 2
|
15,000
|
14,898
|
165,000
|
164,827
|
||||||||||||
|
Accrued interest payable
|
Level 2
|
128
|
128
|
198
|
198
|
||||||||||||
|
Derivatives
|
Level 3
|
752
|
752
|
752
|
752
|
||||||||||||
|
(1)
|
|
Impaired loans are generally classified within Level 3 of the fair value hierarchy.
|
Fair value estimates are made at a specific point in time and may be based on judgments regarding losses expected in the future, risk, and other factors that are subjective in nature. The methods and assumptions used to produce the fair value estimates follow.
For securities held to maturity and securities available for sale, the fair value equals quoted market price if available. If a quoted market price is not available, fair value is estimated using a quoted market price for similar securities. For cash and due from banks, federal funds sold, accrued interest and loan fees receivable, non-maturity deposits and accrued interest payable, the carrying amount is a reasonable estimate of fair value due to the short term nature of these instruments. Determining the fair value of Federal Reserve and Federal Home Loan Bank stock and other investments is not practicable due to restrictions placed on its transferability; thus, carrying amount is a reasonable estimate of fair value. Time deposits and borrowings are valued using a replacement cost of funds approach.
Fair values are estimated for portfolios of loans with similar characteristics. The fair value of performing loans was calculated by discounting projected cash flows through their estimated maturity using market discount rates that reflect the general credit and interest rate characteristics of the loan category. The maturity horizon is based on the Company’s history of repayments for each type of loan and an estimate of the effect of current economic conditions. Assumptions regarding credit risk, cash flows, and discount rates are made using available market information and specific borrower information.
Loans identified as impaired are measured using one of three methods: the fair value of collateral less estimated costs to sell, the present value of expected future cash flows or the loan’s observable market price. Those measured using the fair value of collateral or the loan’s observable market price are recorded at fair value. For each period presented, no impaired loans were measured using the loan’s observable market price. If an impaired loan has had a charge-off or if the fair value of the collateral is less than the recorded investment in the loan, the Company establishes a specific reserve and reports the loan as non-recurring Level 3. The fair value of collateral of impaired loans is generally based on recent real estate appraisals. These appraisals may utilize a single valuation approach or a combination of approaches including comparable sales and the income approach. Adjustments are routinely made in the appraisal process by the appraisers to adjust for differences between the comparable sales and income data available. Such adjustments are usually significant and typically result in a Level 3 classification of the inputs for determining fair value.
For the periods presented, loans held for sale were performing and carried at cost. The carrying cost is a reasonable estimate of fair value due to their short-term nature.
Fair values of OREO are generally based on third party appraisals or realtor evaluations of the property. These appraisals and evaluations may utilize a single valuation approach or a combination of approaches including comparable sales and the income approach. Adjustments are routinely made in the appraisal process by the appraisers to adjust for differences between the comparable sales and income data available. Such adjustments are usually significant and typically result in a Level 3 classification.
In conjunction with the sale of Visa Class B shares in 2013, the Company entered into derivative swap contracts with the purchaser of its Visa Class B shares. The fair value of these derivatives is measured using an internal model that includes the use of probability weighted scenarios for estimates of Visa’s aggregate exposure to the litigation matters, with consideration of amounts funded by Visa into its escrow account for this litigation. At December 31, 2016, the Company estimates a fair value for these derivatives at approximately 10% of the net proceeds from the Company’s sale of the related Visa Class B shares. Since this estimation process requires application of judgment in developing significant unobservable inputs used to determine the possible outcomes and the probability weighting assigned to each scenario, these derivatives have been classified as Level 3 within the valuation hierarchy. (See also Note 3. Investment Securities contained herein.)
The fair value of commitments to extend credit is estimated by either discounting cash flows or using the fees currently charged to enter into similar agreements, taking into account the remaining terms of the agreements and the current creditworthiness of the counter-parties. The estimated fair value of written financial guarantees and letters of credit is based on fees currently charged for similar agreements. The fees charged for the commitments were not material in amount.
Assets measured at fair value on a non-recurring basis are as follows (in thousands):
|
Assets:
|
December 31, 2016
|
Fair Value
Measurements Using
Significant Unobservable
Inputs (Level 3)
|
||||||
|
Impaired loans
|
$
|
2,521
|
$
|
2,521
|
||||
|
OREO
|
650
|
650
|
||||||
|
Total
|
$
|
3,171
|
$
|
3,171
|
||||
|
Assets:
|
December 31, 2015
|
Fair Value
Measurements Using
Significant Unobservable
Inputs (Level 3)
|
||||||
|
Impaired loans
|
$
|
2,715
|
$
|
2,715
|
||||
|
Total
|
$
|
2,715
|
$
|
2,715
|
||||
The Company had no liabilities measured at fair value on a non-recurring basis at December 31, 2016 and 2015.
The following presents quantitative information about Level 3 fair value measurements for financial instruments measured at fair value on a non-recurring basis (dollars in thousands):
|
Fair Value at
|
||||||||||||||||||
|
Assets:
|
December 31,
2016
|
December 31,
2015
|
Valuation
Technique
|
Unobservable
Inputs
|
Discount
|
|||||||||||||
|
Impaired loans:
|
||||||||||||||||||
|
Residential mortgages
|
$
|
2,225
|
$
|
2,311
|
Third party appraisal
|
Discount to appraised value
|
25
|
%
|
(1
|
)
|
||||||||
|
Home equity
|
231
|
280
|
Third party appraisal
|
Discount to appraised value
|
25
|
%
|
(1
|
)
|
||||||||||
|
Consumer
|
65
|
124
|
Third party appraisal
|
Discount to appraised value
|
25
|
%
|
(2
|
)
|
||||||||||
|
Total
|
$
|
2,521
|
$
|
2,715
|
||||||||||||||
|
OREO
|
$
|
650
|
$
|
-
|
Third party appraisal
|
Estimated holding/selling costs
|
11
|
%
|
||||||||||
|
(1)
|
Of which estimated selling costs are approximately 9% - 15% of the total discount.
|
|
(2)
|
Of which estimated selling costs are approximately 10% - 12% of the total discount.
|
The following presents fair value measurements on a recurring basis at December 31, 2016 and 2015 (in thousands):
|
Fair Value Measurements Using
|
||||||||||||
|
Significant Other
Observable Inputs
|
Significant
Unobservable Inputs
|
|||||||||||
|
Assets:
|
December 31, 2016
|
(Level 2)
|
(Level 3)
|
|||||||||
|
Obligations of states and political subdivisions
|
$
|
65,294
|
$
|
65,294
|
$
|
-
|
||||||
|
Collateralized mortgage obligations
|
17,452
|
17,452
|
-
|
|||||||||
|
Mortgage-backed securities
|
87,961
|
87,961
|
-
|
|||||||||
|
Corporate bonds
|
8,535
|
8,535
|
-
|
|||||||||
|
Total
|
$
|
179,242
|
$
|
179,242
|
$
|
-
|
||||||
|
Liabilities:
|
||||||||||||
|
Derivatives
|
$
|
752
|
$
|
-
|
$
|
752
|
||||||
|
Total
|
$
|
752
|
$
|
-
|
$
|
752
|
||||||
|
Fair Value Measurements Using
|
||||||||||||
|
Significant Other
Observable Inputs
|
Significant
Unobservable Inputs
|
|||||||||||
|
Assets:
|
December 31, 2015
|
(Level 2)
|
(Level 3)
|
|||||||||
|
U.S. Government agency securities
|
$
|
28,516
|
$
|
28,516
|
$
|
-
|
||||||
|
Obligations of states and political subdivisions
|
104,682
|
104,682
|
-
|
|||||||||
|
Collateralized mortgage obligations
|
15,549
|
15,549
|
-
|
|||||||||
|
Mortgage-backed securities
|
92,442
|
92,442
|
-
|
|||||||||
|
Corporate bonds
|
5,910
|
5,910
|
-
|
|||||||||
|
Total
|
$
|
247,099
|
$
|
247,099
|
$
|
-
|
||||||
|
Liabilities:
|
||||||||||||
|
Derivatives
|
$
|
752
|
$
|
-
|
$
|
752
|
||||||
|
Total
|
$
|
752
|
$
|
-
|
$
|
752
|
||||||
Reconciliations for assets and liabilities measured at fair value on a recurring basis using significant unobservable inputs (Level 3) follow (in thousands).
|
Fair Value Measurements Using Significant Unobservable
Inputs (Level 3)
|
||||
|
Liabilities
Derivatives
|
||||
|
Balance at January 1, 2014
|
$
|
932
|
||
|
Net change
|
(180
|
)
|
||
|
Balance at December 31, 2014
|
752
|
|||
|
Net change
|
-
|
|||
|
Balance at December 31, 2015
|
752
|
|||
|
Net change
|
-
|
|||
|
Balance at December 31, 2016
|
$
|
752
|
||
15. SUFFOLK BANCORP (PARENT COMPANY ONLY) CONDENSED FINANCIAL STATEMENTS (in thousands)
|
Condensed Statements of Condition at December 31,
|
2016
|
2015
|
2014
|
|||||||||
|
Assets:
|
||||||||||||
|
Due from banks
|
$
|
89
|
$
|
2,988
|
$
|
1,322
|
||||||
|
Investment in the Bank
|
213,599
|
193,252
|
180,926
|
|||||||||
|
Other assets
|
1,340
|
1,018
|
674
|
|||||||||
|
Total Assets
|
$
|
215,028
|
$
|
197,258
|
$
|
182,922
|
||||||
|
Liabilities and Stockholders' Equity:
|
||||||||||||
|
Other liabilities
|
$
|
-
|
$
|
-
|
$
|
189
|
||||||
|
Stockholders' Equity
|
215,028
|
197,258
|
182,733
|
|||||||||
|
Total Liabilities and Stockholders' Equity
|
$
|
215,028
|
$
|
197,258
|
$
|
182,922
|
||||||
|
Condensed Statements of Income and Comprehensive Income for the Years
Ended December 31,
|
2016
|
2015
|
2014
|
|||||||||
|
Income:
|
||||||||||||
|
Dividends from the Bank
|
$
|
1,182
|
$
|
3,763
|
$
|
1,399
|
||||||
|
Other income
|
-
|
-
|
176
|
|||||||||
|
Expense:
|
||||||||||||
|
Other expense
|
41
|
92
|
837
|
|||||||||
|
Income before equity in undistributed net income of the Bank
|
1,141
|
3,671
|
738
|
|||||||||
|
Equity in undistributed earnings of the Bank
|
18,690
|
14,016
|
14,557
|
|||||||||
|
Net income
|
$
|
19,831
|
$
|
17,687
|
$
|
15,295
|
||||||
|
Total Comprehensive Income
|
$
|
18,888
|
$
|
15,954
|
$
|
15,741
|
||||||
|
Condensed Statements of Cash Flows for the Years Ended December 31,
|
2016
|
2015
|
2014
|
|||||||||
|
Cash Flows From Operating Activities:
|
||||||||||||
|
Net income
|
$
|
19,831
|
$
|
17,687
|
$
|
15,295
|
||||||
|
Less: equity in undistributed earnings of the Bank
|
(18,690
|
)
|
(14,016
|
)
|
(14,557
|
)
|
||||||
|
Stock-based compensation
|
1,131
|
949
|
811
|
|||||||||
|
Disqualifying dispositions on stock option exercises
|
-
|
(43
|
)
|
-
|
||||||||
|
Increase in other assets
|
(322
|
)
|
(344
|
)
|
(4
|
)
|
||||||
|
(Decrease) increase in other liabilities
|
-
|
(189
|
)
|
189
|
||||||||
|
Net cash provided by operating activities
|
1,950
|
4,044
|
1,734
|
|||||||||
|
Cash Flows From Investing Activities:
|
||||||||||||
|
Advances to the Bank
|
(2,600
|
)
|
-
|
-
|
||||||||
|
Net cash used in investing activities
|
(2,600
|
)
|
-
|
-
|
||||||||
|
Cash Flows From Financing Activities:
|
||||||||||||
|
Dividend reinvestment and stock option exercises
|
2,502
|
1,385
|
382
|
|||||||||
|
Dividends paid
|
(4,751
|
)
|
(3,763
|
)
|
(1,399
|
)
|
||||||
|
Net cash used in financing activities
|
(2,249
|
)
|
(2,378
|
)
|
(1,017
|
)
|
||||||
|
Net (Decrease) Increase in Cash and Cash Equivalents
|
(2,899
|
)
|
1,666
|
717
|
||||||||
|
Cash and Cash Equivalents, Beginning of Year
|
2,988
|
1,322
|
605
|
|||||||||
|
Cash and Cash Equivalents, End of Year
|
$
|
89
|
$
|
2,988
|
$
|
1,322
|
||||||
16. SELECTED QUARTERLY FINANCIAL DATA (UNAUDITED) (dollars in thousands, except per share data)
|
2016
|
2015
|
|||||||||||||||||||||||||||||||
|
4th
Quarter
|
3rd
Quarter
|
2nd
Quarter
|
1st
Quarter
|
4th
Quarter
|
3rd
Quarter
|
2nd
Quarter
|
1st
Quarter
|
|||||||||||||||||||||||||
|
Interest income
|
$
|
18,934
|
$
|
19,324
|
$
|
20,034
|
$
|
19,427
|
$
|
18,805
|
$
|
18,206
|
$
|
18,576
|
$
|
17,193
|
||||||||||||||||
|
Interest expense
|
878
|
936
|
1,012
|
1,103
|
988
|
828
|
755
|
676
|
||||||||||||||||||||||||
|
Net interest income
|
18,056
|
18,388
|
19,022
|
18,324
|
17,817
|
17,378
|
17,821
|
16,517
|
||||||||||||||||||||||||
|
(Credit) provision for loan losses
|
(400
|
)
|
(350
|
)
|
-
|
250
|
-
|
350
|
-
|
250
|
||||||||||||||||||||||
|
Net interest income after (credit) provision for loan losses
|
18,456
|
18,738
|
19,022
|
18,074
|
17,817
|
17,028
|
17,821
|
16,267
|
||||||||||||||||||||||||
|
Non-interest income
|
2,028
|
2,322
|
2,241
|
1,892
|
2,026
|
2,427
|
2,050
|
2,091
|
||||||||||||||||||||||||
|
Operating expenses (1)
|
15,382
|
13,467
|
13,319
|
13,152
|
15,004
|
12,668
|
13,174
|
13,108
|
||||||||||||||||||||||||
|
Income tax expense
|
1,369
|
2,118
|
2,159
|
1,976
|
1,202
|
1,864
|
1,579
|
1,241
|
||||||||||||||||||||||||
|
Net income
|
$
|
3,733
|
$
|
5,475
|
$
|
5,785
|
$
|
4,838
|
$
|
3,637
|
$
|
4,923
|
$
|
5,118
|
$
|
4,009
|
||||||||||||||||
|
Net income per common share - basic
|
$
|
0.31
|
$
|
0.46
|
$
|
0.49
|
$
|
0.41
|
$
|
0.31
|
$
|
0.42
|
$
|
0.44
|
$
|
0.34
|
||||||||||||||||
|
Net income per common share - diluted
|
$
|
0.31
|
$
|
0.46
|
$
|
0.48
|
$
|
0.41
|
$
|
0.31
|
$
|
0.42
|
$
|
0.43
|
$
|
0.34
|
||||||||||||||||
|
Cash dividends per common share
|
$
|
0.10
|
$
|
0.10
|
$
|
0.10
|
$
|
0.10
|
$
|
0.10
|
$
|
0.10
|
$
|
0.06
|
$
|
0.06
|
||||||||||||||||
|
(1)
|
4th quarter 2016 amount included $1.8 million in merger costs; 4th quarter 2015 amount included $1.4 million in systems conversion expense.
|
17. LEGAL PROCEEDINGS
Certain lawsuits and claims arising in the ordinary course of business may be filed or pending against us or our affiliates from time to time. In accordance with applicable accounting guidance, we establish accruals for all lawsuits, claims and expected settlements when we believe it is probable that a loss has been incurred and the amount of the loss is reasonably estimable. When a loss contingency is not both probable and estimable, we do not establish an accrual. Any such loss estimates are inherently uncertain, based on currently available information and are subject to management’s judgment and various assumptions. Due to the inherent subjectivity of these estimates and unpredictability of outcomes of legal proceedings, any amounts accrued may not represent the ultimate resolution of such matters.
To the extent we believe any potential loss relating to such lawsuits and claims may have a material impact on our liquidity, consolidated financial position, results of operations, and/or our business as a whole and is reasonably possible but not probable, we disclose information relating to any such potential loss, whether in excess of any established accruals or where there is no established accrual. We also disclose information relating to any material potential loss that is probable but not reasonably estimable. Where reasonably practicable, we will provide an estimate of loss or range of potential loss. No disclosures are generally made for any loss contingencies that are deemed to be remote.
On July 1, 2016, July 13, 2016 and August 4, 2016, respectively, actions captioned Thaler/Howell Foundation v. Suffolk Bancorp et al., Index No. 609834/2016 (Sup. Ct., Suffolk Cnty.), Levy v. Suffolk Bancorp et al., Index No. 610475/2016 (Sup. Ct., Suffolk Cnty.), and Parshall v. Suffolk Bancorp, et al., Case No. 2:16-cv-04367 (E.D.N.Y.) were filed on behalf of a putative class of the Company’s shareholders against the Company, its current directors and People’s United (collectively, the “Merger-Related Actions”). An amended complaint in the Thaler/Howell Foundation action was filed on July 29, 2016. The Thaler/Howell Foundation and Levy complaints collectively allege that the Company’s board of directors breached its fiduciary duties by agreeing to the merger and certain terms of the merger agreement, as well as in the case of the Thaler/Howell Foundation complaint by issuing a materially deficient registration statement, and that People’s United aided and abetted those alleged fiduciary breaches. The Parshall complaint alleges violations of Sections 14(a) and 20(a) of the Securities Exchange Act of 1934, as amended. The Merger-Related Actions seek, among other things, to enjoin the defendants from completing the merger on the agreed-upon terms, and rescission of the merger and/or awarding of damages to the extent the merger is completed.
On September 27, 2016, the Company, People’s United and the individual defendants in the Merger-Related Actions entered into a memorandum of understanding (the “MOU”) with the plaintiffs in the Merger-Related Actions regarding the settlement of the Merger-Related Actions, which the Company previously reported on a Current Report on Form 8-K filed on September 28, 2016. The Company, People’s United and the other defendants in the Merger-Related Actions deny all of the allegations in the Merger-Related Actions. Nevertheless, the Company, People’s United and the other defendants have agreed to settle the Merger-Related Actions in order to avoid the costs, disruption and distraction of further litigation. The MOU contemplates that the parties thereto would enter into a stipulation of settlement with respect to the Merger-Related Actions, which would be subject to customary conditions, including court approval following notice to the Company’s shareholders. The MOU also contemplates that in the event that the parties enter into such a stipulation of settlement, a hearing would be scheduled at which a court overseeing the Merger-Related Actions would consider the fairness, reasonableness and adequacy of the settlement. If the settlement is finally approved by the court, it would resolve and release all claims that were brought or could have been brought in the Merger-Related Actions, including claims challenging any disclosure made in connection with the merger. In addition, in connection with the settlement, the MOU contemplates that counsel for the plaintiffs in the Merger-Related Actions will file a petition for an award of attorneys’ fees and expenses in an amount not to exceed $300,000 to be paid by the Company or its successor. If the court approves the settlement contemplated by the MOU, the Merger-Related Actions will be dismissed with prejudice.
Based upon information available to us and our review of lawsuits and claims filed or pending against us to date, we have not recognized a material accrual liability for these matters. However, the outcome of litigation and other legal and regulatory matters is inherently uncertain, and it is possible that one or more of such matters currently pending or threatened could have an unanticipated material adverse effect on our liquidity, consolidated financial position, results of operations, and/or our business as a whole, in the future.
(a) Evaluation of Disclosure Controls and Procedures
The Company carried out an evaluation, under the supervision and with the participation of its principal executive officer and principal financial officer, of the effectiveness of the design and operation of its disclosure controls and procedures as defined in Rule 13a-15(e) and Rule 15d-15(e) under the Securities Exchange Act of 1934, as amended (“Exchange Act”), as of the end of the period covered by this report.
Based on this evaluation, the Company’s principal executive officer and principal financial officer concluded that, as of December 31, 2016, the Company’s disclosure controls and procedures are designed at a reasonable assurance level and are effective to provide reasonable assurance that information required to be disclosed by the Company in reports that it files or submits under the Exchange Act is (i) recorded, processed, summarized and reported within the time periods specified in the Securities and Exchange Commission’s rules and forms and (ii) accumulated and communicated to the Company’s management, including the Company’s principal executive officer and principal financial officer, as appropriate, to allow timely decisions regarding required disclosure. There have been no changes in the Company’s internal controls or in other factors that have materially affected, or are reasonably likely to materially affect, internal controls subsequent to the date the Company carried out its evaluation.
(b) Changes in Internal Controls
There were no changes to the Company’s internal control over financial reporting as defined in Rule 13a-15(f) and Rule 15d-15(f) under the Exchange Act that occurred in the fourth quarter of 2016 that have materially affected, or are reasonably likely to materially affect, the Company’s internal control over financial reporting.
(c) Management’s Report on Internal Control over Financial Reporting
The management of Suffolk Bancorp (the “Company”) is responsible for establishing and maintaining effective internal control over financial reporting as defined in Rules 13a-15(f) and 15d-15(f) under the Exchange Act. The Company’s internal control over financial reporting is designed to provide reasonable assurance regarding the reliability of financial reporting and the preparation of financial statements for external purposes in accordance with generally accepted accounting principles in the United States of America.
Because of its inherent limitations, internal control over financial reporting may not prevent or detect all misstatements. Also, projections of any evaluation of effectiveness to future periods are subject to the risk that controls may become inadequate because of changes in conditions, or that the degree of compliance with the policies or procedures may deteriorate.
Management assessed the effectiveness of the Company’s internal control over financial reporting for financial presentations as of December 31, 2016. In making this assessment, management used the criteria set forth by the Committee of Sponsoring Organizations of the Treadway Commission as described in the 2013 version of Internal Control-Integrated Framework. Based on this assessment, management concluded that the Company maintained effective internal control over financial reporting presented in conformity with generally accepted accounting principles in the United States of America as of December 31, 2016.
The Company’s independent registered public accounting firm has audited and issued their report included below on the effectiveness of the Company’s internal control over financial reporting.
(d) Report of Independent Registered Public Accounting Firm
REPORT OF INDEPENDENT REGISTERED PUBLIC ACCOUNTING FIRM
Board of Directors and Stockholders
Suffolk Bancorp
Riverhead, New York
We have audited Suffolk Bancorp and subsidiaries’ (collectively the “Company”) internal control over financial reporting as of December 31, 2016, based on criteria established in Internal Control – Integrated Framework (2013) issued by the Committee of Sponsoring Organizations of the Treadway Commission (the COSO criteria). The Company’s management is responsible for maintaining effective internal control over financial reporting and for its assessment of the effectiveness of internal control over financial reporting, included in the accompanying Management’s Report on Internal Control over Financial Reporting. Our responsibility is to express an opinion on the Company’s internal control over financial reporting based on our audit.
We conducted our audit in accordance with the standards of the Public Company Accounting Oversight Board (United States). Those standards require that we plan and perform the audit to obtain reasonable assurance about whether effective internal control over financial reporting was maintained in all material respects. Our audit included obtaining an understanding of internal control over financial reporting, assessing the risk that a material weakness exists, and testing and evaluating the design and operating effectiveness of internal control based on assessed risk. Our audit also included performing such other procedures as we considered necessary in the circumstances. We believe that our audit provides a reasonable basis for our opinion.
A company’s internal control over financial reporting is a process designed to provide reasonable assurance regarding the reliability of financial reporting and the preparation of financial statements for external purposes in accordance with generally accepted accounting principles. A company’s internal control over financial reporting includes those policies and procedures that (1) pertain to the maintenance of records that, in reasonable detail, accurately and fairly reflect the transactions and dispositions of the assets of the company; (2) provide reasonable assurance that transactions are recorded as necessary to permit preparation of financial statements in accordance with both generally accepted accounting principles, and that receipts and expenditures of the company are being made only in accordance with authorizations of management and directors of the company; and (3) provide reasonable assurance regarding prevention or timely detection of unauthorized acquisition, use, or disposition of the company’s assets that could have a material effect on the financial statements.
Because of its inherent limitations, internal control over financial reporting may not prevent or detect misstatements. Also, projections of any evaluation of effectiveness to future periods are subject to the risk that controls may become inadequate because of changes in conditions, or that the degree of compliance with the policies or procedures may deteriorate.
In our opinion, Suffolk Bancorp and subsidiaries maintained, in all material respects, effective internal control over financial reporting as of December 31, 2016, based on the COSO criteria.
We also have audited, in accordance with the standards of the Public Company Accounting Oversight Board (United States), the consolidated statements of condition of Suffolk Bancorp and subsidiaries as of December 31, 2016 and 2015, and the related consolidated statements of income, comprehensive income, changes in stockholders’ equity, and cash flows for each of the three years in the period ended December 31, 2016 and our report dated March 27, 2017, expressed an unqualified opinion thereon.
/s/ BDO USA, LLP
New York, New York
March 27, 2017
Not applicable.
PART III
Directors of the Company and the Bank
Following is information about the Directors of the Company and the Bank:
|
DIRECTORS OF THE COMPANY AND THE BANK
|
||||
|
Name
|
Age at
March 23, 2017
|
Position and Offices
With Company
|
Served as Director
Since
|
Present Term
Expires (1)
|
|
Howard C. Bluver
|
60
|
Director, President & Chief
Executive Officer
|
2011
|
2017
|
|
James E. Danowski
|
61
|
Director
|
2002
|
2018
|
|
Brian K. Finneran
|
59
|
Director, Executive Vice
President & Chief Financial
Officer
|
2015
|
2018
|
|
Joseph A. Gaviola
|
61
|
Director, Chairman
|
2004
|
2017
|
|
Edgar F. Goodale
|
63
|
Director
|
1989
|
2019
|
|
David A. Kandell
|
63
|
Director
|
2003
|
2019
|
|
Terence X. Meyer
|
60
|
Director
|
1999
|
2018
|
|
Ramesh N. Shah
|
69
|
Director
|
2013
|
2019
|
|
John D. Stark, Jr.
|
54
|
Director
|
2007
|
2017
|
|
(1) The policy of the Board of Directors of Suffolk Bancorp is that directors shall retire at the end of the term of service during which they attain 72 years of age.
|
||||
Mr. Bluver has served as President and Chief Executive Officer of the Company and the Bank since December 2011. From June 2011 to December 2011, Mr. Bluver provided consulting services to the Company and the Bank. Prior to that time, Mr. Bluver was the founder and President of JDS Financial Group, LLC, a consulting firm, which served the regulatory, transactional, risk management, corporate governance, due diligence and operational needs of the commercial banking, thrift, mortgage and investment banking sectors from 2005 to 2011. From 1994 until 2005, Mr. Bluver was Executive Vice President, General Counsel, and Chief Enterprise Risk Officer at GreenPoint Bank and GreenPoint Financial Corp., New York, New York. Prior to that, he was Deputy Chief Counsel, United States Office of Thrift Supervision, Washington, D.C. from 1987 to 1994. He started his career at the Securities and Exchange Commission in Washington, D.C., finishing as Chief of the branch in the Division of Corporation Finance that covered financial institutions. As President and Chief Executive Officer of the Company and the Bank, and by virtue of his 30-year career in the banking industry as both a participant and regulator, Mr. Bluver is able to provide valuable perspective on the Company’s current position and future strategy, and the Board of Directors believes he is qualified to serve on the Board.
Mr. Danowski is a Senior Partner in the accounting firm, Cullen & Danowski, LLP, a position he has held for almost 40 years. He is a Certified Public Accountant licensed in New York. Mr. Danowski specializes in tax, estate and business matters. Mr. Danowski is a member of the New York State Society of CPAs and the American Institute of Certified Public Accountants and its Tax Practice Division. He is on the Board of Trustees of the John T. Mather Memorial Hospital and the John T. Mather Hospital Foundation and a member of the Board of Jefferson Ferry, a continuing care retirement community located in Suffolk County, New York. The Board of Directors believes that Mr. Danowski is qualified to serve on the Board due to his accounting and business acumen and knowledge of the Suffolk County, Long Island economy. Mr. Danowski received his BBA in accounting from Dowling College.
Mr. Finneran has served as Executive Vice President and Chief Financial Officer of the Company and the Bank since 2012. From 2007 to 2012, Mr. Finneran was Chief Financial Officer of State Bancorp, and from 1997 to 2012, Chief Financial Officer of State Bank of Long Island. He served as Senior Vice President and Comptroller at State Bank of Long Island from 1990 to 1997. Prior thereto, Mr. Finneran held various accounting and finance positions with NatWest Bank USA and Irving Trust Company. On September 30, 2015, the Board of Directors of the Company and Bank appointed Mr. Finneran as a director of the Company and the Bank. The Board of Directors believes that Mr. Finneran is qualified to serve on the Board due to his significant experience in finance, strategy, capital markets and public company operations. Mr. Finneran earned his BBA in Finance from Baruch College and his MBA in Finance from Pace University.
Mr. Gaviola is an entrepreneur who has owned and operated retail and real estate businesses on the east end of Long Island for almost 30 years. Mr. Gaviola has been employed at Janney Montgomery Scott since October 2014 and is currently a Financial Advisor and an Investment Advisor Representative. Prior to establishing his first business almost 30 years ago, Mr. Gaviola held senior management positions with Inspiration Coal Company and Carbon Fuel Corp (a division of ITT) where he was responsible for various operating divisions. Mr. Gaviola is on the Board of Directors and the Director of Finance of the Montauk Pt. Lighthouse Museum. He has in the past served on numerous community and charitable boards on the east end of Long Island. The Board of Directors believes Mr. Gaviola is qualified to serve on the Board due to his particular understanding of the Company’s market and customer base garnered from his lifelong presence on eastern Long Island. Mr. Gaviola holds a BS in economics and business from the University of Rhode Island and completed a graduate course at the ABA Stonier Graduate School of Banking at the Wharton School of the University of Pennsylvania (Capstone Project being completed). Mr. Gaviola holds Series 7 and Series 66 licenses as well as Life and Variable Annuity.
Mr. Goodale served as President of Riverhead Building Supply, one of Long Island’s largest building supply companies, from 1971 to 2013, and has been Chairman of that company since 2013. Mr. Goodale has extensive experience in retailing to the professional building trades and in real estate development, primarily in the Long Island market. Mr. Goodale is a director of the Long Island Builders Institute and Chairman of the Long Island Home Builders Care Development Corp., an organization devoted to establishing homes for returning United States veterans. The Board of Directors believes that Mr. Goodale’s extensive experience in owning, operating and growing a local business on Long Island, in addition to his 27 years as a Director of the Company (five of them as Chairman), qualifies him to serve on the Board. Mr. Goodale studied business administration at the State University of New York, Morrisville.
Mr. Kandell is President and a shareholder of the accounting firm, Kandell, Farnworth & Pubins, CPA’s, PC, a position he has held since 1984. Prior thereto, Mr. Kandell worked for four years at Kandell and Associate and worked for four years at Arthur Andersen & Co., a former “big eight” public accounting firm. He is a Certified Public Accountant licensed in New York. Mr. Kandell belongs to the Riverhead Chamber of Commerce and the Southampton Business Alliance. The Board of Directors believes that Mr. Kandell is qualified to serve on the Board due to his extensive accounting and finance knowledge and his familiarity with the economic and business conditions in the Bank’s market. Mr. Kandell received a BSBA degree from the University of North Carolina at Chapel Hill.
Mr. Meyer is Manager of Meyer & Meyer, PLLC since October 2016. He was a Partner in the law firm, Meyer Meyer and Keneally, Esqs., LLP, from 1983 to 2013, and was Of Counsel to the firm from 2014 to September 2016. Mr. Meyer specializes in trust and estate matters. He is also a Certified Public Accountant licensed in New York (status inactive). Mr. Meyer has prior experience in tax and audit with the former “big eight” public accounting firms of Arthur Andersen & Co. and Peat Marwick Mitchell (predecessor to KPMG). Mr. Meyer is a Trustee of St. Anthony’s High School, located in Suffolk County. The Board of Directors believes that Mr. Meyer is qualified to serve on the Board due to his knowledge of the law and accounting and his civic involvement and prominence in Suffolk County, Long Island. Mr. Meyer received his BS in accounting from Providence College and his JD from Hofstra University Law School.
Mr. Shah currently serves on the board of Safety Services, a leading supplier of OSHA compliant safety products. From 2005 to 2010, Mr. Shah was Chairman of WNS Global Services, a global provider of offshore outsourcing services. Prior thereto, Mr. Shah was CEO of Retail Banking of GreenPoint Bank from 1996 to 2004. From 1978 to 1991, Mr. Shah held executive management positions at Shearson Lehman Bros. and American Express. The Board of Directors believes that Mr. Shah, with his strategic background and specific knowledge and experience with financial service companies, is a valuable resource to the Board in the current environment of increasing business and regulatory demands on financial services boards of directors, and is qualified to serve on the Board. Mr. Shah earned his BA in Economics from Bates College and his MBA in Finance from Columbia University.
Mr. Stark is Vice President of Foxwood Corporation, one of the largest manufactured-home community development and management companies in the Company’s primary market area, a position he has held since 1994. Prior to his current position, Mr. Stark held various engineering positions with industrial machinery and optic companies. A lifelong resident of eastern Long Island, the Board of Directors believes that Mr. Stark is qualified to serve on the Board because he brings a thorough knowledge of the local economy as well as an analytical understanding of business problems to influence his advice to his colleagues on the Board of Directors. Mr. Stark holds a BS in mechanical engineering from Northeastern University.
Executive Officers
The names, ages and positions of the current executive officers of the Company and the Bank are as follows:
|
EXECUTIVE OFFICERS OF THE REGISTRANT
|
||||
|
Name
|
Age at March 23, 2017
|
Position (and Served Since)
|
||
|
Howard C. Bluver
|
60
|
President and Chief Executive Officer of the Company and the Bank since 2011.
|
||
|
Brian K. Finneran
|
59
|
Executive Vice President and Chief Financial Officer of the Company and the Bank since 2012.
|
||
|
Christopher J. Hilton
|
39
|
Executive Vice President and Chief Credit Officer of the Company and the Bank since March 2015; Senior Vice President and Deputy Chief Credit Officer of the Bank from June 2014 to March 2015.
|
||
|
Jeanne P. Kelley
|
56
|
Executive Vice President and Chief Risk Officer of the Company and the Bank since 2013; Senior Vice President and Risk Manager of the Company and the Bank from 2011 to 2013: Senior Vice President and Risk Manager of the Bank from 2002 to 2011; Senior Vice President, Consumer Loan Division of the Bank from 1996 to 2002; prior thereto various credit related positions in the Bank.
|
||
|
Anita J. Nigrel
|
55
|
Executive Vice President and Chief Retail Officer of the Company and the Bank since July 2015; Senior Vice President, Retail Operations of the Bank from 2003 to 2015; Regional Vice President of the Bank from 1998 to 2003; prior thereto held various branch management positions within the Bank's branch network from 1989 to 1998.
|
||
|
Michael R. Orsino
|
66
|
Executive Vice President and Chief Lending Officer of the Company and the Bank since 2012.
|
||
|
James R. Whitehouse
|
54
|
Executive Vice President, Retail Sales, Residential, Multi-Family and Mixed-Use Lending for the Company and the Bank since January 2015; Executive Vice President, Residential, Multi-Family and Mixed-Use Lending for the Company and the Bank since June 2014; Senior Vice President and Department Head of the Bank's Residential Mortgage and Multi-Family Lending Group from 2012 to 2014.
|
||
Mr. Bluver’s biography is included under “Directors of the Company and the Bank” above.
Mr. Finneran’s biography is included under “Directors of the Company and the Bank” above.
Mr. Hilton has served as Executive Vice President and Chief Credit Officer of the Company and the Bank since March 2015. From June 2014 through his recent appointment, Mr. Hilton held the role of Deputy Chief Credit Officer. Prior to joining the Company, Mr. Hilton served as Executive Vice President of Empire National Bank, and was the Chief Credit Officer from 2007 to 2014. Prior to 2007, Mr. Hilton served as Vice President and Commercial Loan Officer for New York Commercial Bank for six years.
Ms. Kelley has served as Executive Vice President and Chief Risk Officer of the Company and the Bank since 2013. From 2011 to 2013, Ms. Kelley served as Senior Vice President, Risk Manager of the Company and the Bank, and from 2002 to 2011 as Senior Vice President and Risk Manager of the Bank with responsibility for Compliance and Bank Secrecy. From 1996 to 2002, Ms. Kelley served as Senior Vice President, Consumer Loan Division of the Bank. Prior thereto, Ms. Kelley held various credit-related positions with the Company.
Ms. Nigrel has served as Executive Vice President and Chief Retail Officer since 2015. From 2003 to 2015, Ms. Nigrel served as Senior Vice President, Retail Operations with responsibility for Branch Operations, Loan Operations, and Physical Security. From 1998 to 2003, Ms. Nigrel served as Regional Vice President of the Bank, managing the Wading River Branch and a region of six other branch locations. From 1989 to 1998, Ms. Nigrel held various branch management positions within the Bank’s branch network.
Mr. Orsino has served as Executive Vice President and Chief Lending Officer of the Company and the Bank since 2012. Prior to joining the Company, Mr. Orsino was President of Key Bank Hudson Valley/Metro NY District from 2007 to 2011 and President of Key Bank Capital Region District from 2005 to 2007. From 2003 to 2005, Mr. Orsino was the National Retail and Business Banking Sales Executive for Key Bank. Prior to 2003, Mr. Orsino served in various executive positions with Key Bank, including President of Key Bank’s Long Island District and Executive Vice President of Key Bank’s East Region Retail Banking Division.
Mr. Whitehouse has served as Executive Vice President, Residential, Multi-family and Mixed-Use Lending for the Company and the Bank since June 2014. In January of 2015, Mr. Whitehouse was given the additional responsibility of managing Retail Sales for the Bank. From 2012 to 2014, Mr. Whitehouse was Senior Vice President and Department Head of the Bank’s Residential Mortgage and Multi-Family Lending Group. Prior to joining the Bank, Mr. Whitehouse was a partner with the Mortgage Capital Group in Bayport, New York, where he brokered commercial mortgages for a highly selective group of top quality lenders. Mr. Whitehouse also served as Senior Vice President and East Coast Sales Director for the multi-family division of Washington Mutual Bank, Regional Vice President for GreenPoint Bank and Northeast Regional Sales Director for GreenPoint Mortgage Co.
Section 16(a) Beneficial Ownership Reporting Compliance
Section 16(a) of the Exchange Act, requires executive officers, directors, and persons who beneficially own more than 10 percent of the stock of the Company to file initial reports of ownership and reports of changes in ownership. Such persons are also required by SEC regulations to furnish the Company with copies of these reports. SEC rules require the Company to identify anyone who filed a required report late during the most recent fiscal year. Based solely on the Company’s review of copies of such forms received, or written representations from certain reporting persons that no filings were required for such persons, the Company believes that, during fiscal year 2016, its directors, executive officers and 10 percent shareholders complied with all Section 16(a) filing requirements.
Code of Conduct
The Company has a Code of Business Conduct and Ethics for its directors, officers and employees which, among other things, requires that such individuals avoid conflicts of interest. We also have adopted Corporate Governance Guidelines, which, in conjunction with our Certificate of Incorporation, By-Laws and respective charters of the Board committees, form the framework for our governance. The Code of Business Conduct and Ethics and Corporate Governance Guidelines are available on the Company’s website at www.scnb.com by selecting “Governance Documents”.
Audit Committee
The Company’s Audit Committee is currently comprised of four directors Messrs. Kandell (Chairman), Danowski, Gaviola and Goodale. The Board of Directors has determined that all of the members of the Audit Committee are “independent” and financially literate as required by the applicable listing standards of the New York Stock Exchange (“NYSE”) and other applicable rules. The Board has also determined that Messrs. Danowski and Kandell are “audit committee financial experts,” and have the requisite accounting or related financial management expertise under the listing standards of the NYSE. None of the members of the Audit Committee serve on more than three audit committees, including that of the Company. The Committee pre-approves all auditing services and permitted non-audit services (including the fees and terms thereof) to be performed for the Company by its independent auditor, subject to the de minimis exceptions for non-audit services described in Section 10A(i)(1)(B) of the Exchange Act which are approved by the Audit Committee prior to the completion of the audit. The Audit Committee may form and delegate authority to subcommittees consisting of one or more members when appropriate, including the authority to grant pre-approvals of audit and permitted non-audit services, provided that decisions of such subcommittee to grant pre-approvals shall be presented to the full Audit Committee at its next scheduled meeting. The Audit Committee operates under a formal charter which is available on the Company’s website at www.scnb.com. The Audit Committee performs the functions described below under “Report of the Audit Committee.”
Compensation Discussion and Analysis
Introduction
This Compensation Discussion and Analysis explains the Company’s compensation philosophy, policies and practices with respect to the following individuals included in the “Summary Compensation Table” section contained herein, referred to collectively as the “named executive officers” or “NEOs.”
| • |
Howard C. Bluver — Director, President and Chief Executive Officer
|
| • |
Brian K. Finneran — Director, Executive Vice President and Chief Financial Officer
|
| • |
Michael R. Orsino — Executive Vice President and Chief Lending Officer
|
| • |
Jeanne P. Kelley — Executive Vice President and Chief Risk Officer
|
| • |
Christopher J. Hilton — Executive Vice President and Chief Credit Officer
|
In addition to the Compensation Discussion and Analysis, the compensation and benefits provided to our NEOs in 2016 are set forth in detail in the “Summary Compensation Table,” section contained herein, and other tables that follow this Compensation Discussion and Analysis, as well as in the footnotes and narrative material that accompany those tables.
EXECUTIVE SUMMARY
Summary of our Pay Philosophy
The Company’s executive compensation philosophy is to pay for performance in a risk-appropriate fashion. The Company balances short- and long-term and fixed and variable compensation through base salary, cash incentives and equity awards. Base salaries are established considering the nature of an executive’s position and his or her individual performance and contributions over time. The Company’s Executive Incentive Plan (“EIP”) provides incentives to NEOs tied to individual and Company performance during the course of the year. Incentive targets are established for each NEO and incentives are paid according to success in achieving those targets. Long-term incentive awards, granted in the form of restricted shares, promote a culture of stock ownership and align the interests of the NEOs with those of shareholders, with the ultimate goal of creating sustained shareholder value.
Summary of 2016 Compensation Actions and Awards
Shareholder Engagement
At the Company’s 2016 annual shareholders’ meeting, we held an advisory, non-binding shareholder vote on the 2015 compensation of our NEOs, commonly referred to as a “say-on-pay” vote. Shareholders overwhelmingly supported this proposal, with 96% approval. We believe this level of support confirms that our executive compensation program is well structured and the actions that were taken were appropriate.
2016 Compensation Awards
The Company’s 2016 compensation actions reflect our successful performance as a Company and the achievements of the individual NEOs. In making incentive compensation determinations for 2016, the Compensation Committee considered multiple factors, including overall Company and segment financial performance, achievement of or progress towards strategic initiatives, and individual performance and accomplishments.
| • |
Base Salary Adjustments. Our NEOs received merit-based base salary increases between 3.3% and 3.9% in February 2016.
|
| • |
Annual Incentive Awards. The Compensation Committee awarded incentives to each of the NEOs in 2017 under the EIP reflecting our 2016 company performance, as well as individual performance achievements. For details regarding the EIP and the determination of payments under the EIP, see section “Annual Incentives” contained herein.
|
| • |
Restricted Stock Awards. Messrs. Bluver, Finneran, Orsino, Hilton, and Ms. Kelley were awarded restricted stock in the amounts of 5,500, 4,000, 3,000, 1,000, and 1,500 shares of common stock of the Company, respectively. These restricted stock awards vest in equal installments annually over three years following the grant date. For details of the grants, see sections “2016 Long-Term Incentive Grants” and the “Grants of Plan-Based Awards” table contained herein. In addition, a portion of each NEOs’ EIP award for 2015 was awarded in the form of restricted stock in February 2016, see section “Grants of Plan-Based Awards” table contained herein.
|
Ongoing Shareholder Friendly Programs and Designs
The Company has many ongoing shareholder friendly executive compensation programs, practices and protocols, including, but not limited to, the following:
| • |
The Compensation Committee is comprised entirely of independent members, and the Compensation Committee engaged its own independent compensation consultant in 2016.
|
| • |
The Company compares its compensation practices relative to a peer group selected by its independent compensation consultant and survey data to ensure that its programs are competitive and consistent with market practices.
|
| • |
The Company does not pay tax gross-ups to our NEOs with respect to “golden parachute” excise taxes.
|
| • |
The Company does not have a history of re-pricing equity incentive awards, and is not permitted to re-price equity incentive awards without shareholder approval under its equity incentive plan.
|
| • |
The Company has a securities trading policy that discourages directors, officers and employees from purchasing Company securities on margin, short selling Company securities and buying derivatives on Company securities.
|
| • |
The Company has established minimum stock ownership requirements for its NEOs.
|
| • |
The Company has adopted claw-back policies with respect to its incentive compensation plans.
|
| • |
The Company attempts to balance both short- and long-term incentives to effectively align our pay with annual operating results and long-term business success and mitigate excessive risk-taking.
|
| • |
The Company does not maintain supplemental executive retirement plans for the exclusive benefit of the NEOs, and does not match or supplement deferrals under its nonqualified deferred compensation plan.
|
DETAILED COMPENSATION PROGRAMS, PROCESSES AND ACTIONS
NEO Compensation Philosophy and Objectives
The Company’s overarching compensation philosophy is to pay for performance in a risk-appropriate fashion. The key objectives of the Company’s compensation programs are to attract and retain qualified, talented individuals to fill key positions and to compensate our NEOs at fair and competitive levels in order to encourage them to work to increase the net worth of the Company, and ultimately shareholder value.
We pursue these objectives by:
| • |
Providing competitive pay opportunities, with actual pay outcomes highly dependent on individual and Company performance;
|
| • |
Balancing fixed and variable compensation by providing a competitive salary and benefits package, while providing a majority of the NEOs’ total compensation opportunity in the form of variable cash and equity compensation; and
|
| • |
Balancing short- and long-term compensation through performance-based annual bonuses awarded in cash and long-term incentive compensation in the form of restricted stock awards.
|
How We Make Decisions Regarding NEO Compensation
The Compensation Committee, with the support of its independent compensation consultant Pearl Meyer (“PM”) and management, determines executive compensation programs, practices, and levels. Specific responsibilities are assigned in accordance with governance best practices. In making its determinations, the Compensation Committee and its partners consider data and analyses regarding peer group compensation as well as other internal studies. Below is an explanation of the key roles and responsibilities of each group, as well as how market data is integrated into the process.
Role of the Compensation Committee
The members of the Company’s Compensation Committee are Chairman Joseph A. Gaviola, Terence X. Meyer, Ramesh N. Shah and John D. Stark, Jr., each of whom is an “independent director” under applicable NYSE listing rules, an “outside director” for purposes of Section 162(m) of the Internal Revenue Code and a “non-employee director” for purposes of Rule 16b-3 under the Exchange Act. The Compensation Committee determines and approves the salaries, cash and equity incentive awards, benefits and employment policies of the Company as they relate to the NEOs and recommends for approval by the Board of Directors, the Chief Executive Officer’s salary, cash and equity incentive awards and benefits as well as employment policies of the Company as they relate to the Chief Executive Officer. The Compensation Committee administers the equity-based plans of the Company and makes recommendations to the Board of Directors concerning the adoption and amendment of cash- and equity-based incentive compensation plans.
The Compensation Committee has the sole authority to retain or obtain the services of compensation consultants or other advisors to provide compensation and benefit consulting services to the Committee. The independence of any such advisor is assessed by the Compensation Committee, on an annual basis, prior to selecting or receiving advice from the advisor.
In making determinations regarding executive compensation, the Compensation Committee weighs an individual’s personal performance, the performance of his or her area of responsibility, and the overall performance of the Company. The performance of the Chief Executive Officer in each of these regards is evaluated by the Compensation Committee. The performance of each of the NEOs (other than the Chief Executive Officer) is evaluated by the Chief Executive Officer, whose assessment is presented to the Compensation Committee. The Compensation Committee reviews performance of the NEOs on an annual basis and examines each named executive officer’s base salary and cash and equity incentive awards at such time. Further information concerning these determinations is included below.
Role of Management
Key members of the Company’s executive management attend Compensation Committee meetings at the Compensation Committee’s request to provide information and their perspective about executive compensation policies and programs. The Compensation Committee holds discussions with management in attendance to ensure that the Compensation Committee makes fully informed decisions with respect to compensation matters that affect the Company’s operations and shareholder returns. Finally, the Company’s Chief Executive Officer participates in deliberations of the Compensation Committee on an ex-officio, non-voting basis, but does not participate during, or attend, deliberations concerning his own compensation. No NEO was present during the portion of any Compensation Committee meeting at which the Compensation Committee made determinations regarding such named executive officer’s compensation.
Role of the Compensation Consultant
The Compensation Committee utilizes the support of outside compensation experts in establishing the policies, programs, and levels of executive compensation. Since 2012, Pearl Meyer (“PM”) has served as the Company’s outside advisor. PM reports directly to the Compensation Committee and, as directed by the Compensation Committee, works with management and the Chairman of the Compensation Committee. PM performed no services outside of those related to executive and director compensation for the Company in 2016. The Compensation Committee assessed the independence of PM in 2016 and believes they are an independent advisor pursuant to the rules and standards promulgated by the SEC and NYSE.
Role of Market Data/External Comparisons
In addition to many other factors considered by the Compensation Committee, it takes into account the compensation practices of comparable companies in formulating the compensation program.
The following companies were selected by PM in 2013 and comprise the Company’s current peer group.
|
·
|
Arrow Financial Corporation
|
|
·
|
BCB Bancorp, Inc.
|
|
·
|
Berkshire Bancorp Inc.
|
|
·
|
Bridge Bancorp, Inc.
|
|
·
|
Bryn Mawr Bank Corporation
|
|
·
|
Center Bancorp, Inc.
|
|
·
|
Financial Institutions, Inc.
|
|
·
|
First of Long Island Corporation
|
|
·
|
Lakeland Bancorp, Inc.
|
|
·
|
Peapack-Gladstone Financial Corporation
|
|
·
|
Republic First Bancorp, Inc.
|
|
·
|
Sterling Bancorp
|
|
·
|
Sun Bancorp, Inc.
|
|
·
|
Unity Bancorp, Inc.
|
|
·
|
Univest Corporation of Pennsylvania
|
This group of peer companies was selected using the following criteria: banks that are publicly traded and subject to public reporting requirements regarding executive compensation, banks with approximately one-half to two times the total assets of the Company, banks headquartered in New York, New Jersey or Pennsylvania, and banks that represent established commercial entities (i.e., generally excluded companies traded on pink sheets, thrifts, etc.).
The Company also participates in comparison surveys conducted by independent firms that provide additional summary compensation data in return for the Company’s participation. The Company participated, on a paid basis, in the 2016 Banking Compensation Survey Report conducted by PM for the New York Bankers Association and the 2016 McLagan Survey for the Northeast Region.
In addition, on a periodic basis, the Board of Directors compares the Company’s operating results and market performance to the commercial banking industry as a whole, all banking companies in the New York metropolitan area, all banking companies of similar size nationwide, and selected regional competitors. The Compensation Committee uses this information to evaluate the reasonableness of its compensation to NEOs.
The Compensation Committee does not apply peer group and survey data in a formulaic manner to determine the compensation of its NEOs. Rather, the peer group and survey data represents one of several factors that the Compensation Committee considers in a holistic assessment when making compensation decisions.
Overview of Compensation Program Elements
Material Elements
The Compensation Committee endeavors to achieve a balance between short- and long-term compensation and uses a mix of cash and equity to compensate its NEOs. Material elements of 2016 compensation include base salary; annual cash bonuses; and restricted stock. Set forth below is a summary of the purpose and performance orientation of the material elements of the Company’s compensation program in 2016.
|
Element
|
Purpose
|
Performance Orientation
|
|||||
|
Base Salary
|
Provide competitive, fixed compensation to attract and retain qualified, talented executives.
|
Adjustments to base salary reflect the individual’s overall performance, as well as contribution to the Company.
|
|||||
|
Annual Bonus
(Executive Incentive Plan)
|
Encourage and reward annual financial, operational and strategic successes at the Company.
|
The entire award is subject to Company and individual performance criteria.
|
|||||
|
Restricted Stock
|
Foster an owner mentality and promote alignment between executives and shareholders.
|
The potential value of the award when it vests is contingent on the stock price at that time.
|
Relative Mix of Material Elements
The following charts depict the compensation mix of the Chief Executive Officer and the average of the other NEOs. It includes 2016 base salary, 2016 EIP awards, and annual long-term incentive grants provided in the form of restricted stock in 2016.
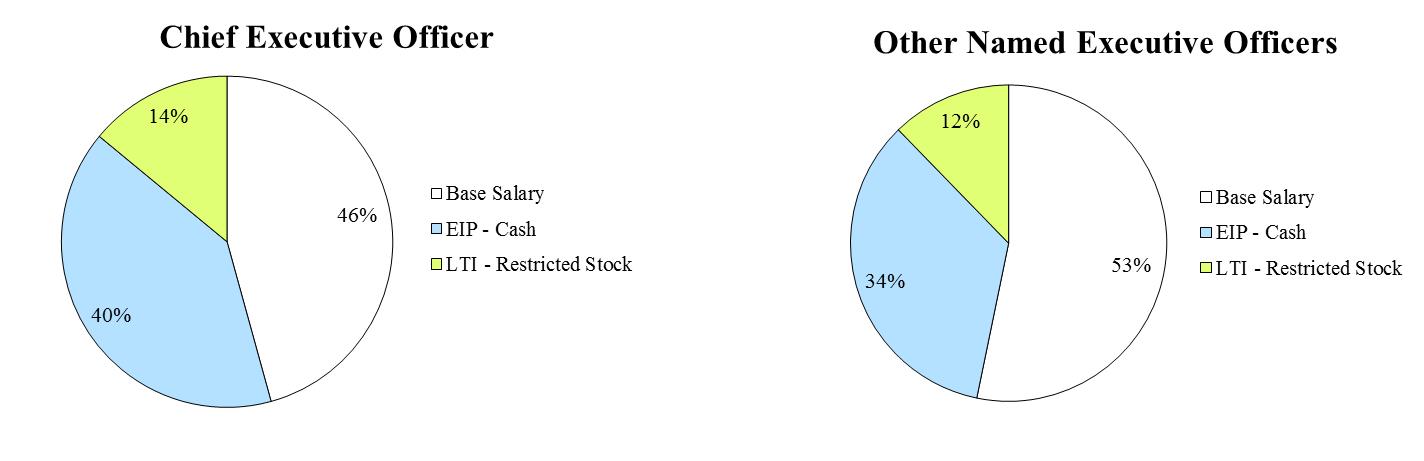
The following table presents how the Compensation Committee viewed 2016 compensation for our NEOs. It includes 2016 base salary, 2016 EIP awards, and annual long-term incentive grants provided in the form of restricted stock in 2016. These elements in combination comprise “Total Direct Compensation.” This table differs from the “Summary Compensation Table,” section contained herein, and is not a substitute for that table.
|
Named
Executive
Officer
|
Base
Salary
|
EIP Award
Cash
|
LTI Award
Restricted
Stock
|
Total
Direct Compensation
|
Total
Direct Compensation
(% Change vs. 2015)
|
|||||
|
Howard C. Bluver
|
$460,000
|
$405,159
|
$141,075
|
$1,006,234
|
1.3%
|
|||||
|
Brian K. Finneran
|
$322,000
|
$260,000
|
$102,600
|
$684,600
|
5.1%
|
|||||
|
Michael R. Orsino
|
$280,000
|
$210,000
|
$76,950
|
$566,950
|
0.5%
|
|||||
|
Jeanne P. Kelley
|
$217,500
|
$120,000
|
$38,475
|
$375,975
|
5.8%
|
|||||
|
Christopher J. Hilton
|
$237,500
|
$95,000
|
$25,650
|
$358,150
|
6.9%
|
Other Elements
In addition, the Company provides the NEOs with the opportunity to participate in a voluntary, defined contribution plan, competitive severance benefits designed to provide security, and limited perquisites, which are described further below. The Compensation Committee evaluates each element of compensation to align with the overall compensation philosophy and strategy.
Base Salary
Base salary represents the annual salary paid to each named executive officer. The Compensation Committee determines an individual’s base salary based on the nature of the position. In making such determination, the Compensation Committee utilizes a number of factors including responsibilities of the position, regional salary surveys, peer group results, industry guidelines, and regional economic conditions.
2016 Merit-based Salary Adjustments
The Compensation Committee, and the full Board of Directors in the case of Mr. Bluver, approved the following base salary increases in February 2016:
|
Named
Executive
Officer
|
2015
Base
Salary
|
2016
Base
Salary
|
% Change
|
|||
|
Howard C. Bluver
|
$445,000
|
$460,000
|
3.4%
|
|||
|
Brian K. Finneran
|
$310,000
|
$322,000
|
3.9%
|
|||
|
Michael R. Orsino
|
$270,000
|
$280,000
|
3.7%
|
|||
|
Jeanne P. Kelley
|
$210,000
|
$217,500
|
3.6%
|
|||
|
Christopher J. Hilton
|
$230,000
|
$237,500
|
3.3%
|
Annual Incentives
The Company maintains the EIP, which provides for awards to the NEOs based on individual and Company performance during the course of the year. For 2016, the Compensation Committee determined to award bonuses in all cash. The EIP’s objectives are to:
| • |
Reward performance that supports the Company’s short- and long-term performance results.
|
| • |
Attract, retain and motivate executives with long-term business perspective.
|
| • |
Encourage a strategic perspective and team orientation.
|
| • |
Balance performance goals and incentives with appropriate risk management objectives.
|
Each named executive officer has an incentive target under the EIP that is determined based on his or her role and which is approved by the Compensation Committee, or the Board of Directors with respect to the Chief Executive Officer. For 2016, the target incentive opportunities under the EIP were determined to be 50% of annual base salary for the Chief Executive Officer, Chief Financial Officer and Chief Lending Officer, 30% of annual base salary for the Chief Risk Officer, and 25% for the Chief Credit Officer. If all performance goals were satisfied at maximum, the Chief Executive Officer would have been eligible to earn up to 200% of his target incentive opportunity under the EIP and the other NEOs would have been eligible to earn up to 175%, of their respective target incentive opportunities under the EIP, with the exception for Ms. Kelley, who was awarded 184% of her target for exceptional performance in 2016. In addition to the items disclosed under “Executive Summary” contained herein, the Compensation Committee considered the success of each NEO in achieving his or her goals in 2016 for each of the following performance measures.
2016 EIP Structure and Awards
2016 was another successful year for the Company. The primary performance measure under the EIP, net income, was $21.5 million in 2016, compared to $17.7 million in 2015, a 21.5% increase. This achievement surpassed target goals for 2016. The Committee determined that net income was an appropriate metric to use for the EIP because it represents the profitability of the Company’s on-going business, and therefore is important to investors and well understood by participants. Net income carries the following weight as a percent of all performance measures for each named executive officer: Mr. Bluver, Ms. Kelley and Mr. Hilton, each (50%), Mr. Orsino (60%), and Mr. Finneran (75%). Financial and strategic goals for each NEO were determined at the beginning of 2016.
|
2016 Net Income Performance
|
|||||||
|
Threshold Goal
|
Target Goal
|
Stretch Goal
|
Actual Performance
|
Actual Performance as a
% of Target Goal
|
|||
|
$15.1mm
|
$18.9mm
|
$22.6mm
|
$21.5mm
|
114
|
%
|
||
In addition to being the primary performance measure of the 2016 EIP, net income performance for 2016 had to be above target for the portion of the 2016 EIP attributable to other performance goals to become payable above target. These other incentive measures were chosen to balance the net income measure, provide line of sight into each NEO’s area of responsibility, and provide an incentive to achieve other important objectives. These other measures carried the following weight, in aggregate, as a percent of all performance measures for each NEO: Mr. Bluver, Ms. Kelley and Mr. Hilton, each (50%), Mr. Orsino (40%), and Mr. Finneran (25%). In certain instances, we do not disclose the targets due to competitive harm.
Mr. Bluver, Chief Executive Officer
|
Performance Measure
|
Mostly Met
|
Met
|
Exceeded
|
Assessment
|
|
|
Credit quality
|
✓
|
Exceeded projections in measured credit metric such as asset quality, non-performing loans, and control of early delinquencies.
|
|||
|
Efficiency Ratio
|
✓
|
Excluding merger-related and other costs, the Company’s core operating efficiency ratio improved to 61.9% in 2016 vs. 64.9% in 2015.
|
|||
|
Loan Growth
|
✓
|
Loan growth slightly exceeded 2016 budget.
|
|||
|
Overall
|
✓
|
Given Mr. Bluver’s achievement on net income and these other performance measures, he was awarded $405,159 (176% of his target incentive opportunity) with respect to the 2016 EIP, payable in cash.
Mr. Finneran, Chief Financial Officer
|
Performance Measure
|
Mostly Met
|
Met
|
Exceeded
|
Assessment
|
|
|
Efficiency Ratio
|
✓
|
Excluding merger-related and other costs, the Company’s core operating efficiency ratio improved to 61.9% in 2016 vs. 64.9% in 2015.
|
|||
|
Financial Metrics
|
✓
|
Identified and executed on corporate initiatives to improve 2016 key financial metrics such as net income, cost of borrowings, effective tax rate and earnings per share.
|
|||
|
Capital Management
|
✓
|
Managed capital efficiently and obtained an investment grade bond rating from outside party for a potential subordinated debt issuance.
|
|||
|
Overall
|
✓
|
Given Mr. Finneran’s achievement on net income and these other performance measures, he was awarded $260,000 (161% of his target incentive opportunity) with respect to the 2016 EIP, payable in cash.
Mr. Orsino, Chief Lending Officer
|
Performance Measure
|
Mostly Met
|
Met
|
Exceeded
|
Assessment
|
|
|
Commercial Loan Growth
|
✓
|
Loan amounts finished above fiscal year 2015 balance.
|
|||
|
Commercial Portfolio Credit Metrics
|
✓
|
Improvement in non-performing loans and early delinquencies.
|
|||
|
Deposits and Fees
|
✓
|
Deposits increased in 2016.
|
|||
|
Overall
|
✓
|
Given Mr. Orsino’s achievement on these performance measures, he was awarded $210,000 (150% of his target incentive opportunity) with respect to the 2016 EIP, payable in cash.
Ms. Kelley, Chief Risk Officer
|
Performance Measure
|
Mostly Met
|
Met
|
Exceeded
|
Assessment
|
|
|
Lending Strategies Support
|
✓
|
Enhanced framework related to lending strategies through detailed reporting and analysis.
|
|||
|
Compliance
|
✓
|
Successfully maintained a strong compliance posture for the Company; successfully assessed and implemented new regulations as required.
|
|||
|
Strategic and Capital Plans
|
✓
|
The Strategic Plan was updated for 2016-2018 in conjunction with the 2016-2018 Capital Plan and budget.
|
|||
|
Risk Management
|
✓
|
Successfully enhanced the Risk Management Program to reflect current operations in conjunction with regulatory requirements; successfully participated in the updates and monitoring of the annual Strategic and Capital Plans.
|
|||
|
Overall
|
✓
|
Ms. Kelley’s achievement on net income and exceptional performance with regards to these other performance measures, she was awarded $120,000 (184% of her target incentive opportunity) with respect to the 2016 EIP, payable in cash.
Mr. Hilton, Chief Credit Officer
|
Performance Measure
|
Mostly Met
|
Met
|
Exceeded
|
Assessment
|
|
|
Non-performing Loans
|
✓
|
Company exceeded (i.e., achieved lower) non-performing loan target.
|
|||
|
Reduce Classified Loans
|
✓
|
Exceeded classified loan targets.
|
|||
|
Underwriting and Regulatory Enhancements
|
✓
|
Enhanced underwriting processes and procedures.
|
|||
|
Overall
|
✓
|
Given Mr. Hilton’s achievement on net income and these other performance measures, he was awarded $95,000 (160% of his target incentive opportunity) with respect to the 2016 EIP, payable in cash.
The annual cash awards were determined after the end of the fiscal year on which they are based.
Long-Term Incentives
Each year, in addition to the performance-based equity awards associated with the EIP, the Compensation Committee considers grants of long-term incentives to the NEOs, which in 2016 were awarded under the Amended and Restated Suffolk Bancorp 2009 Stock Incentive Plan (the “2009 Plan”). Restricted stock awards granted outside the EIP generally vest ratably over a three year period beginning on the first anniversary of the date of grant.
Stock-based incentives are intended to align the interests of the named executive officers with the interests of the Company’s shareholders. These equity awards provide for financial gain derived from appreciation in the Company’s stock price and, because they vest over several years, promote for long-term retention. Further, stock-based awards effectively balance our fixed and short-term variable compensation.
In addition to our annual granting practices, the Compensation Committee can also approve grants, as appropriate, for new hires and other special circumstances.
For specific grants to NEOs, the Compensation Committee considers a variety of factors, including:
| • |
Individual performance and future potential of the executive;
|
| • |
Market data related to long-term incentives;
|
| • |
The overall size of the equity grant pool and shares remaining available for grant under the 2009 Plan;
|
| • |
Award value relative to other Company executives;
|
| • |
The value of previous grants and amount of outstanding unvested equity awards; and
|
| • |
The recommendations of the Chief Executive Officer, other than in connection with grants to the Chief Executive Officer.
|
2016 Long-Term Incentive Grants
NEOs were each granted restricted stock in May 2016. These awards vest ratably over three years. The Company also settled a portion of the 2015 EIP in restricted stock. These grants were awarded in February 2016 and vest semi-annually over two years, starting with the first six month anniversary of the date of grant. For more details see the “Grants of Plan-Based Awards” table contained herein.
Retirement Benefits
The Company maintains a 401(k) defined contribution plan, which is offered to the NEOs on the same terms as all employees of the Company who have at least a half month of service and have worked at least 40 hours. Those terms include contributions up to legal limits established by the Internal Revenue Service. The Company matches 50% of employee contributions up to 6% of salary and cash bonus.
Limited Executive Perquisites
Executive perquisites are not a significant component of the Company’s executive compensation program. NEOs are generally eligible for personal use of Company automobiles or an automobile allowance, which is designed to facilitate business travel and allow the NEOs to focus on business operations. NEOs are also eligible for life insurance coverage on the same terms as are available to employees generally. For additional details see footnote 6 of the “Summary Compensation Table,” section contained herein.
Severance
Each of our NEOs is eligible to participate in the Bank’s Severance Policy, a practice that is customary in the industry, which provides that, upon certain qualifying terminations of employment, a participant is eligible to receive a lump sum severance payment equal to his or her bi-weekly base salary multiplied by the number of full or partial years of service with the Company or the Bank, as applicable, up to a maximum of 52 weeks of base salary. This severance payment is subject to the participant’s execution and non-revocation of a release of claims in favor of the Company and its affiliates.
For a quantification of these severance benefits for the NEOs, please see the subsection titled “Termination of Employment Without Cause” under the section “2016 Potential Payments Upon Termination of Employment or Change of Control,” below.
Change of Control Employment Agreements
Each of the NEOs is a party to a change of control employment agreement that would entitle him or her to severance payments and other benefits in the event of a qualifying termination of employment following a change of control of the Company. These arrangements are customary in our industry and are intended to attract and retain qualified executives that could have other job alternatives during times of uncertainty for the Company. In addition, the Company believes that these arrangements provide an incentive for the Company’s NEOs to successfully execute a change-of-control transaction from its early stages until closing and thereafter for the benefit of the Company’s shareholders. For a description and quantification of these change of control benefits, please see the section titled “2016 Potential Payments Upon Termination of Employment or Change of Control” contained herein.
Other Programs, Policies, and Considerations
Stock Ownership
The Company believes in building deep and enduring linkages between the interests of management and shareholders. An important tool in creating this alignment is use of share awards and share ownership requirements for the Company’s directors and executive officers.
The Company believes it is important that each director and executive officer have a meaningful financial stake in the Company, represented by an investment in the common stock of the Company. In doing so, stock owners can share in the benefits and losses of the Company.
Stock Ownership Requirements
The Company has adopted stock ownership requirements for its NEOs in order to align their interests with those of the Company’s shareholders. The Chief Executive Officer is required to hold common stock of the Company with a fair market value at least equal to two times his then annual base salary. Executive officers (other than the Chief Executive Officer) are required to hold stock with a fair market value at least equal to his or her current annual base salary within five years of becoming an executive officer. Common stock of the Company in which the individual has a pecuniary interest counts towards the minimum stock ownership requirements. Examples include shares owned directly by the individual, shares owned jointly with a spouse or family member and restricted stock. As of the date of this filing, Mr. Bluver owns 63,795 shares of common stock of the Company, which exceeds the ownership requirement. All other NEOs also meet their requirement. The Compensation Committee decides any issues concerning eligibility of shares toward the minimum stock ownership guidelines.
Stock Purchase Plans
To facilitate investment in the Company, the Company also maintains an employee stock purchase plan. All employees are also eligible to have any portion of their compensation, net of deductions, invested in common stock of the Company on the same terms. There is no Company match or purchase price discount.
Claw-Back Policies
The Company has provisions in its incentive plans with respect to the adjustment or recovery of awards or payments if the relative performance measures upon which they are based are restated or otherwise adjusted in a manner that would have reduced the size of an award or payment. The Company will comply with any statutory claw-back requirements, including requirements under the Sarbanes-Oxley Act of 2002 and the Dodd-Frank Wall Street Reform and Consumer Protection Act (“Dodd-Frank”). As of the date of this filing, the SEC has not adopted final rules implementing the claw-back provisions under Dodd-Frank.
Tax Matters
The Company generally endeavors to structure its compensation in a manner intended to be deductible for purposes of the Internal Revenue Code. Nonetheless, the Company reserves the right to award compensation that may be non-deductible under Section 162(m) of the Internal Revenue Code in appropriate circumstances.
Accounting Considerations
The Company’s stock-based awards are accounted for under U.S. Generally Accepted Accounting Principles (“GAAP”). GAAP rules require us to calculate the grant date “fair value” of our equity awards using a variety of assumptions. This calculation is reported in the compensation tables that follow, even though our NEOs may never realize any value from these awards. GAAP rules also require companies to recognize the compensation cost of their stock-based compensation awards in their income statements over the period that a recipient is required to render service in exchange for the option award or restricted share.
Securities Trading Policy
The Company has a securities trading policy whereby directors, officers and employees are not allowed to trade in Company securities while in possession of material, nonpublic information concerning the Company. This policy applies to all of the Company’s directors, officers and employees, including directors, officers and employees of subsidiaries and other affiliates. This policy also applies to information relating to any other company, including our competitors, customers or suppliers, obtained in the course of employment with or by serving as a director, officer or employee of the Company.
Enforcement mechanisms include mandatory trading windows and blackout periods to ensure that trading is not based on material, nonpublic information.
In addition, the Company’s securities trading policy prohibits all of the Company’s directors and officers (and their related parties) from engaging in any transaction which has the effect of hedging Company securities in order to reduce or eliminate downside risk and from pledging Company securities to secure any loan, whether or not the director or officer is in possession of material, nonpublic information concerning the Company.
Compensation Committee Report
The Compensation Committee of the Company has reviewed and discussed the Compensation Discussion and Analysis with Management and, based on such review and discussions, the Compensation Committee recommended to the Board of Directors that the Compensation Discussion and Analysis be included into the Company’s Annual Report on Form 10-K for the last fiscal year.
Joseph A. Gaviola, Chairman
Terence X. Meyer
Ramesh N. Shah
John D. Stark, Jr.
Risk Assessment
The Compensation Committee has taken steps in the design of the Company’s compensation programs, including those programs covering our NEOs, to mitigate the potential of inappropriate risk taking by the Company’s employees. The following represent certain factors that mitigate inappropriate risk taking in our compensation programs:
| • |
Our compensation program for executives includes a balance of fixed and variable, short- and long-term compensation;
|
| • |
The Company has a defensible peer group which it uses as a reference to making compensation decisions;
|
| • |
Written annual plan documents are made available to all incentive plan participants;
|
| • |
Incentive plans contain a claw-back provision for restatement of earnings, fraud or misconduct;
|
| • |
Incentive payouts are made after the year‐end compensation review process is completed;
|
| • |
The Board of Directors has oversight of incentive plans via the Compensation Committee and, where appropriate, the full Board of Directors;
|
| • |
The incentive bonus plans are subject to annual financial and Sarbanes‐Oxley audits for accuracy and completion;
|
| • |
The Compensation Committee approves all cash incentive awards to executive officers; and
|
| • |
The Compensation Committee approves all restricted stock or stock option grants to executive officers.
|
Based on the above, the Company has concluded that its compensation policies and practices do not create inappropriate or unintended material risk to the Company as a whole, and that, consequently, our compensation plans do not create risks that are reasonably likely to have a material adverse effect on the Company.
The following table sets forth compensation to the NEOs for the years ended December 31, 2016, 2015, and 2014:
|
SUMMARY COMPENSATION TABLE
|
||||||||||||||||||||||||||
|
Name and Principal Position
|
Year
|
Salary(1)
|
Stock
Awards (2)
|
Non-Equity
Incentive Plan
Compensation
(3)
|
Change in
Pension Value
and
Nonqualified
Deferred
Compensation
Earnings
|
All Other
Compensation
(4)(5)(6)
|
Total
|
|||||||||||||||||||
|
($)
|
($)
|
($)
|
($)
|
($)
|
($)
|
|||||||||||||||||||||
|
Howard C. Bluver
|
2016
|
458,269
|
239,962
|
405,159
|
-
|
27,507
|
1,130,897
|
|||||||||||||||||||
|
President &
|
2015
|
460,577
|
370,333
|
296,680
|
-
|
23,951
|
1,151,541
|
|||||||||||||||||||
|
Chief Executive Officer
|
2014
|
433,077
|
157,570
|
217,505
|
-
|
20,562
|
828,714
|
|||||||||||||||||||
|
Brian K. Finneran
|
2016
|
320,615
|
160,726
|
260,000
|
-
|
30,417
|
771,758
|
|||||||||||||||||||
|
Executive Vice President &
|
2015
|
320,385
|
174,787
|
174,378
|
-
|
18,945
|
688,495
|
|||||||||||||||||||
|
Chief Financial Officer
|
2014
|
298,846
|
112,550
|
196,883
|
-
|
16,435
|
624,714
|
|||||||||||||||||||
|
Michael R. Orsino
|
2016
|
278,846
|
129,246
|
210,000
|
-
|
36,912
|
655,003
|
|||||||||||||||||||
|
Executive Vice President &
|
2015
|
278,846
|
141,764
|
156,957
|
-
|
17,826
|
595,394
|
|||||||||||||||||||
|
Chief Lending Officer
|
2014
|
257,692
|
90,040
|
170,646
|
-
|
13,837
|
532,215
|
|||||||||||||||||||
|
Jeanne P. Kelley
|
2016
|
216,635
|
63,404
|
120,000
|
6,340
|
21,343
|
427,722
|
|||||||||||||||||||
|
Executive Vice President &
|
2015
|
216,538
|
45,520
|
74,823
|
4,752
|
11,131
|
352,764
|
|||||||||||||||||||
|
Chief Risk Officer
|
||||||||||||||||||||||||||
|
Christopher J. Hilton (7)
|
2016
|
236,635
|
45,628
|
95,000
|
8,622
|
385,885
|
||||||||||||||||||||
|
Executive Vice President &
|
2015
|
235,962
|
25,036
|
59,947
|
-
|
8,653
|
329,597
|
|||||||||||||||||||
|
Chief Credit Officer
|
||||||||||||||||||||||||||
|
|
||
|
(1) Base salary includes an extra payroll period in 2015 (27 payroll periods) given the start of the calendar year relative to the first payroll period.
|
||
|
(2) The amounts included in this column reflect the grant date fair value of restricted stock awards granted to our named executive officers in 2016. This includes (i) the annual award of long term incentives made in the form of restricted stock, provided in May 2016, and (ii) the portion of the EIP awarded as restricted stock with respect to 2015 performance, which was granted in February 2016,. The value is equal to the grant date fair value closing price of the Company’s stock (based on the closing price per share on the grant date of $25.65 for the May 2016 awards and $25.13 for the February 2016 awards) multiplied by the amount of restricted stock for each named executive officer.
|
||
|
(3) The amounts in this column are the dollar value of cash incentive awards earned under the EIP for 2016, 2015 and 2014.
|
||
|
(4) Includes company matching contributions to 401(k) plan for each named executive officer.
|
||
|
(5) Includes IRS calculated life insurance value, use of a Company car or car allowance for Messrs. Bluver, Finneran, and Orsino, and dividends paid on previously awarded restricted stock, with value of $6,511, $4,512, $3,638, $1,772, and $749 for Messrs. Bluver, Finneran, Orsino, Kelley and Hilton, respectively.
|
||
|
(6) The total value of perquisites and personal benefits exceeded $10,000 for Messrs. Bluver, Finneran and Orsino whose car allowance for 2016 was $9,600, $9,373 and $9,619, respectively, Company-paid term life insurance premium for 2016 was $2,322, $2,322 and $3,810, respectively, and costs associated with Company owned car use of $0, $789 and $1,971, respectively.
|
||
|
(7) Mr. Hilton assumed the role of Executive Vice President and Chief Credit Officer on March 25, 2015.
|
||
Grants of Plan-Based Awards
At the annual meeting of shareholders on April 14, 2009, shareholders approved the 2009 Plan, a successor to the 1999 Stock Option Plan. The 2009 Plan has since been amended and restated after shareholder approval on April 29, 2014. The Company may grant incentive stock options, non-qualified stock options, stock appreciation rights, and restricted stock under the 2009 Plan.
|
GRANTS OF PLAN-BASED AWARDS
|
||||||||||||||||||||||||
|
Name
|
Grant Date
|
Estimated Future Payouts
Under Non-Equity Incentive
Plan Awards (1)
|
All
Other
Stock
Awards:
Number
of
Shares
of Stock
or Units
|
Grant Date
Fair Value of
Stock and
Option
Awards
|
||||||||||||||||||||
|
Threshold
|
Target
|
Maximum
|
||||||||||||||||||||||
|
($)
|
($)
|
($)
|
(#)
|
|
($)
|
|||||||||||||||||||
|
Howard C. Bluver
|
-
|
115,000
|
230,000
|
460,000
|
-
|
-
|
||||||||||||||||||
|
2/25/2016
|
-
|
-
|
-
|
3,935
|
98,887
|
|||||||||||||||||||
|
5/25/2016
|
-
|
-
|
-
|
5,500
|
141,075
|
|||||||||||||||||||
|
Brian K. Finneran
|
-
|
80,500
|
161,000
|
281,750
|
-
|
-
|
||||||||||||||||||
|
2/25/2016
|
-
|
-
|
-
|
2,313
|
58,126
|
|||||||||||||||||||
|
5/25/2016
|
-
|
-
|
-
|
4,000
|
102,600
|
|||||||||||||||||||
|
Michael R. Orsino
|
-
|
70,000
|
140,000
|
245,000
|
-
|
-
|
||||||||||||||||||
|
2/25/2016
|
-
|
-
|
-
|
2,081
|
52,296
|
|||||||||||||||||||
|
5/25/2016
|
-
|
-
|
-
|
3,000
|
76,950
|
|||||||||||||||||||
|
Jeanne P. Kelley
|
-
|
32,625
|
65,250
|
114,188
|
-
|
-
|
||||||||||||||||||
|
2/25/2016
|
992
|
24,929
|
||||||||||||||||||||||
|
5/25/2016
|
-
|
-
|
-
|
1,500
|
38,475
|
|||||||||||||||||||
|
Christopher J. Hilton
|
-
|
29,688
|
59,375
|
89,063
|
-
|
-
|
||||||||||||||||||
|
2/25/2016
|
795
|
19,978
|
||||||||||||||||||||||
|
5/25/2016
|
-
|
-
|
-
|
1,000
|
25,650
|
|||||||||||||||||||
|
(1) The amounts included in these columns are with respect to the EIP awarded for 2016.
|
||||||||||||||||||||||||
Under the 2009 Plan, the Compensation Committee determines the awardee and the amount of restricted stock. Restricted stock generally vests in three equal annual installments on each of the first, second and third anniversaries of the grant date, subject to continued employment. Restricted stock granted under the 2009 Plan in settlement of incentive opportunities under the EIP is subject to a two-year semi-annual vesting schedule.
Outstanding Equity Awards at Fiscal Year-End
The following table details outstanding equity awards held by the NEOs on December 31, 2016:
|
OUTSTANDING EQUITY AWARDS AT FISCAL YEAR-END
|
||||||||||||||||||||||||
|
OPTION AWARDS
|
STOCK AWARDS
|
|||||||||||||||||||||||
|
Number of
Securities
Underlying
Unexercised
Options
|
Number of
Securities
Underlying
Unexercised
Options
|
Option
Exercise
Price
|
Option
Expiration
Date
|
Number of
Shares or
Units of
Stock That
Have Not
Vested
|
Market
Value of
Shares or
Units of
Stock That
Have Not
Vested
|
|||||||||||||||||||
|
(#)
|
|
(#)
|
|
|||||||||||||||||||||
|
Name
|
Exercisable
|
Unexercisable
|
($)
|
(#)
|
|
($)
|
||||||||||||||||||
|
Howard C. Bluver
|
50,000
|
(1)
|
-
|
10.79
|
12/30/2021
|
n/a
|
n/a
|
|||||||||||||||||
|
20,000
|
(2)
|
-
|
18.14
|
8/6/2023
|
n/a
|
n/a
|
||||||||||||||||||
|
-
|
-
|
-
|
-
|
2,333
|
(3)
|
99,899
|
(3)
|
|||||||||||||||||
|
-
|
-
|
-
|
-
|
4,200
|
(4)
|
179,844
|
(4)
|
|||||||||||||||||
|
-
|
-
|
-
|
-
|
2,389
|
(5)
|
102,297
|
(5)
|
|||||||||||||||||
|
-
|
-
|
-
|
-
|
5,500
|
(7)
|
235,510
|
(7)
|
|||||||||||||||||
|
-
|
-
|
-
|
-
|
2,951
|
(6)
|
126,362
|
(6)
|
|||||||||||||||||
|
Brian K. Finneran
|
11,700
|
(8)
|
-
|
13.13
|
2/3/2022
|
n/a
|
n/a
|
|||||||||||||||||
|
5,000
|
(9)
|
14.03
|
2/4/2023
|
n/a
|
n/a
|
|||||||||||||||||||
|
-
|
-
|
-
|
-
|
1,666
|
(3)
|
71,338
|
(3)
|
|||||||||||||||||
|
-
|
-
|
-
|
-
|
3,000
|
(4)
|
128,460
|
(4)
|
|||||||||||||||||
|
-
|
-
|
-
|
-
|
720
|
(5)
|
30,830
|
(5)
|
|||||||||||||||||
|
-
|
-
|
-
|
-
|
4000
|
(7)
|
171,280
|
(7)
|
|||||||||||||||||
|
-
|
-
|
-
|
-
|
1,734
|
(6)
|
74,250
|
(6)
|
|||||||||||||||||
|
Michael R. Orsino
|
20,000
|
(10)
|
-
|
12.44
|
3/9/2022
|
n/a
|
n/a
|
|||||||||||||||||
|
5,000
|
(9)
|
-
|
14.03
|
2/4/2023
|
n/a
|
n/a
|
||||||||||||||||||
|
-
|
-
|
-
|
-
|
1,333
|
(3)
|
57,079
|
(3)
|
|||||||||||||||||
|
-
|
-
|
-
|
-
|
2,333
|
(4)
|
99,899
|
(4)
|
|||||||||||||||||
|
-
|
-
|
-
|
-
|
623
|
(5)
|
26,677
|
(5)
|
|||||||||||||||||
|
-
|
-
|
-
|
-
|
3,000
|
(7)
|
128,460
|
(7)
|
|||||||||||||||||
|
-
|
-
|
-
|
-
|
1,560
|
(6)
|
66,799
|
(6)
|
|||||||||||||||||
|
Jeanne. P. Kelley
|
4,600
|
(11)
|
-
|
16.56
|
6/26/2023
|
-
|
-
|
|||||||||||||||||
|
-
|
-
|
-
|
1,000
|
(3)
|
42,820
|
(3)
|
||||||||||||||||||
|
-
|
-
|
-
|
1,333
|
(5)
|
57,079
|
(5)
|
||||||||||||||||||
|
-
|
-
|
-
|
1,500
|
(7)
|
62,230
|
(7)
|
||||||||||||||||||
|
-
|
-
|
-
|
-
|
744
|
(6)
|
31,858
|
(6)
|
|||||||||||||||||
|
Christopher J. Hilton
|
-
|
-
|
-
|
-
|
733
|
(5)
|
31,387
|
(5)
|
||||||||||||||||
|
-
|
-
|
-
|
-
|
1,000
|
(7)
|
42,820
|
(7)
|
|||||||||||||||||
|
-
|
-
|
-
|
-
|
596
|
(6)
|
25,521
|
(6)
|
|||||||||||||||||
|
(1) Represents a grant on December 30, 2011 of stock options to acquire 50,000 shares of common stock of the Company. 16,667 options vested on December 30, 2014; 16,667 options vested on December 30, 2015; and the remaining 16,666 options vested on December 30, 2016.
|
|
|
(2) Represents a grant on August 6, 2013 of stock options to acquire 20,000 shares of common stock of the Company. 6,667 options vested on August 6, 2014; 6,667 options vested on August 6, 2015; and the remaining 6,666 options vested on August 6, 2016.
|
|
|
(3) Represents the unvested portion of grants on June 2, 2014 of restricted stock awards in respect of 7,000, 5,000, 4,000, and 3,000 shares of common stock of the Company to Messrs. Bluver, Finneran, Orsino, and Ms. Kelley respectively. Restricted stock vests in three equal annual installments on each of the first, second and third anniversaries of the grant date.
|
|
|
(4) Represents the unvested portion of grants on June 2, 2015 of restricted stock awards in respect of 6,300, 4,500, and 3,500 shares of common stock of the Company to Messrs. Bluver, Finneran, and Orsino, respectively. Restricted stock vests in three equal annual installments on each of the first, second and third anniversaries of the grant date.
|
|
|
(5) Represents the unvested portion of grants on February 25, 2015 of restricted stock awards in respect of 9,556, 2,883 and 2,498, shares of common stock of the Company to Messrs. Bluver, Finneran, and Orsino, respectively. The restricted stock awards, which were granted in respect of the EIP, vests every six months, over two years, starting with the first six month anniversary of the date of grant. For Ms. Kelley and Mr. Hilton, this amount represents the unvested portion of grants on February 25, 2015 of restricted stock awards in respect of 2,000 and 1,100 shares of common stock of the Company, respectively, vesting in three equal annual installments on each of the first, second and third anniversaries of the grant date.
|
|
(6) Represents the grants on February 25, 2016 of restricted stock awards. The restricted stock awards vest every six months, over two years, starting with the first six month anniversary of the date of grant.
|
|
|
(7) Represents the annual long-term incentive award of restricted stock awarded on May 25, 2016, vesting in three equal annual installments on each of the first, second and third anniversaries of the grant date.
|
|
|
(8) Represents a grant on March 9, 2012 of stock options to acquire 20,000 shares of common stock of the Company. 6,667 options vested on March 9, 2013, 6,667 vested on March 9, 2014, and 6,666 vested on March 9, 2015.
|
|
|
(9) Represents a grant on February 4, 2013 of stock options to acquire 5,000 shares of common stock of the Company, 1,667 options vested on February 4, 2014, 1,667 vested on February 4, 2015, and the remaining 1,666 vested on February 4, 2016.
|
|
|
(10) Represents a grant on March 9, 2012 of stock options to acquire 20,000 shares of common stock of the Company, 6,667 options vested on March 9, 2013, 6,667 options vested on March 9, 2014, and 6,666 options vested on March 9, 2015.
|
|
|
(11) Represents a portion of a grant on June 26, 2013 of stock options to acquire 5,000 shares of common stock of the Company. 1,667 options vested on June 26, 2014; 1,667 options vested on June 26, 2015, and the remaining 1,666 options vested on June 26, 2016.
|
Option Exercises and Stock Vested
In 2016, 8,300 and 3,000 option awards held by Mr. Finneran and Ms. Kelley, respectively, were exercised. The following table details restricted stock that vested for the NEOs during the fiscal year end December 31, 2016:
|
OPTION EXERCISES AND STOCK VESTED
|
||||
|
OPTION AWARDS
|
STOCK AWARDS
|
|||
|
Name
|
Acquired on Exercise
|
Exercise
|
Acquired on Vesting
|
Vesting
|
| (#) |
($)
|
(#)
|
($)
|
|
|
Howard C. Bluver
|
-
|
-
|
10,195
|
289,258
|
|
Brian K. Finneran
|
8,300
|
231,381
|
5,188
|
143,582
|
|
Michael R. Orsino
|
-
|
-
|
4,271
|
118,880
|
|
Jeanne P. Kelley
|
3,000
|
29,959
|
1,915
|
50,770
|
|
Christopher J. Hilton
|
-
|
-
|
566
|
16,090
|
Compensation Pursuant to Pension and Retirement Plans
The Company maintains a defined benefit pension plan covering substantially all of its employees. The plan was frozen as of December 31, 2012. Benefits are based on years of service and the employee’s highest average compensation during five consecutive years of employment. Compensation used to determine benefits is all compensation as reported on Form W-2. A participant’s normal retirement benefit is an annual pension benefit commencing on his or her normal retirement date, payable in the normal benefit form in an amount equal to: (1) 1.75 percent of his or her average annual compensation, multiplied by creditable service up to 35 years; plus (2) 1.25 percent of his or her average annual compensation, multiplied by creditable service in excess of 35 years up to 5 years; minus (3) 0.49 percent of his or her final average compensation (up to covered compensation) multiplied by creditable service up to 35 years. The normal benefit form is payable as a single life pension. An employee became a participant in the plan on the 1st of the month that coincided with or next followed the completion of 12 months of eligible service and attainment of age 21. There are a number of optional forms of benefit available to the participants, all of which are adjusted actuarially. Participants are eligible for early retirement under the plan upon obtaining age 55. Normal retirement age is 65. Early retirement benefits are determined by reducing the basic benefit by 3 percent per annum and reducing the offset benefit by 6 percent per annum. Ms. Kelley is the only named executive officer who participates in the plan and is eligible for early retirement under the plan. The following table details pension benefits earned as of December 31, 2016:
|
PENSION BENEFITS
|
|||||||||||||
|
Name
|
Plan Name
|
|
Number of
Years
Credited
Service
|
Present
Value of
Accumulated
Benefit (1)
|
|
Payments
During Last
Fiscal Year
|
|||||||
|
(#)
|
|
($) |
($)
|
||||||||||
|
Jeanne P. Kelley
|
The Suffolk County National Bank Pension Plan
|
24.83
|
527,241
|
-
|
|||||||||
|
(1) The present value of accumulated benefits was determined using the same assumptions used for financial reporting purposes under GAAP for 2016. Pension benefits are discussed in Note 10 of the 10-K disclosure.
|
2016 Potential Payments Upon Termination of Employment or Change of Control
Termination of Employment Without “Cause” not in Connection With a “Change of Control”
Each of our NEOs is eligible to participate in the Bank’s Severance Policy, which provides that, upon certain qualifying terminations of employment, the NEO is eligible to receive a lump sum severance payment equal to two weeks base salary multiplied by the number of full or partial years of service with the Company or the Bank, as applicable, up to a maximum of 52 weeks of base salary (subject to the execution and non-revocation of a release of claims). In the event of a qualifying termination of employment as of December 31, 2016 each NEO would be entitled to a lump sum severance payment in the following amounts: Mr. Bluver, $88,558; Mr. Finneran, $60,871; Mr. Orsino, $51,899; Ms. Kelley, $217,500; and Mr. Hilton, $23,600.
Termination of Employment Without “Cause” or For “Good Reason” in Connection With a “Change of Control”
As of December 31, 2016, the Company had entered into Change of Control Employment Agreement with each of our NEOs that generally provide for certain benefits in the event that the Company terminates the executive’s employment without cause or if the executive terminates employment for good reason within three years for Messrs. Bluver and Finneran, and two years for Messrs. Orsino and Hilton and Ms. Kelley, of a “change of control” of the Company.
For the purposes of these agreements, the Company generally defines a change of control as follows:
| 1) |
The acquisition by any individual, entity or group of beneficial ownership of 20 percent or more of outstanding shares of common stock of the Company, subject to customary exceptions;
|
| 2) |
Individuals who constitute the Board of Directors cease for any reason to constitute at least a majority of the Board of Directors;
|
| 3) |
Consummation of a reorganization, merger or consolidation or similar transaction involving the Company or any of its subsidiaries or sale or other disposition of all or substantially all of the assets of the Company, subject to customary exceptions; or
|
| 4) |
Approval by the shareholders of the Company of a complete liquidation or dissolution of the Company.
|
Messrs. Bluver and Finneran are each party to a Change of Control Employment Agreement that provides for a minimum level of compensation and benefits during the three-year period immediately following a “change of control” of the Company and provides for severance equal to three times the sum of his base salary and target annual bonus, as well as three years of continued medical and dental benefits in the event that the executive’s employment is terminated without “cause” or he resigns with “good reason” during the three-year period immediately following a “change of control” of the Company.
Messrs. Orsino and Hilton and Ms. Kelley are each party to a Change of Control Employment Agreement that provides for a minimum level of compensation and benefits during the two-year period immediately following a “change of control” of the Company and provides for severance equal to two times the sum of his or her base salary and target annual bonus, as well as two years of continued medical and dental benefits in the event that the executive’s employment is terminated without “cause” or he resigns with “good reason” during the two-year period immediately following a “change of control” of the Company.
In the event of a “change of control” of the Company, all outstanding, unvested stock options and restricted stock immediately vest and become exercisable pursuant to the terms of the Company’s equity compensation plans.
The agreements do not provide for tax “gross-ups.” If payments and benefits due to an executive under his or her Change of Control Employment Agreement would be subject to the golden parachute excise tax under Section 280G of the Internal Revenue Code, such payments and benefits would be reduced to an amount that is $1 less than such amount that would trigger the excise tax if doing so would result in a more favorable after-tax position to the executive.
The following is a summary of the amounts that would have been payable to the NEOs in the event of a qualifying termination of employment immediately following a “change of control” of the Company on December 31, 2016:
|
POTENTIAL COST OF CHANGE OF CONTROL AGREEMENTS
|
||||||||||||||||||||||||
|
Name
|
Cash Severance
Value (1)
|
Pro-rata Bonus
(2)
|
Benefits
Continuation (3)
|
Equity
Acceleration (4)
|
280G
Scaleback(5)
(If applicable)
|
Total
|
||||||||||||||||||
|
($)
|
($)
|
($)
|
($)
|
($)
|
($)
|
|||||||||||||||||||
|
Howard C. Bluver
|
2,070,000
|
230,000
|
-
|
743,912
|
(208,778)
|
2,835,134
|
||||||||||||||||||
|
Brian K. Finneran
|
1,449,000
|
161,000
|
51,801
|
476,158
|
(262,113)
|
1,875,846
|
||||||||||||||||||
|
Michael R. Orsino
|
840,000
|
140,000
|
33,564
|
378,914
|
-
|
1,392,478
|
||||||||||||||||||
|
Jeanne P. Kelley
|
565,500
|
65,250
|
33,604
|
195,987
|
-
|
860,341
|
||||||||||||||||||
|
Christopher J. Hilton
|
593,750
|
59,375
|
-
|
99,728
|
-
|
752,853
|
||||||||||||||||||
|
(1) Multiple of base salary and target bonus, payable in a lump sum
|
|
|
(2) Pro-rated target bonus for 2016; value reflects a full year.
|
|
|
(3) Reflects the annual cost to the Company for three years of continued medical and dental benefits for Mr. Finneran; and two years for Mr. Orsino and Ms. Kelley.
|
|
|
(4) In the event of a change in control of the Company, all outstanding, unvested stock options and restricted stock immediately vest and become exercisable under the terms of the Company’s equity compensation plans. Executives would receive an additional year to exercise outstanding stock options upon termination due to a change in control; however, for purposes of the calculation, we assume a cash out of all outstanding stock options at the time of the termination. Calculation uses closing common stock of the Company price on December 31, 2016 of $42.82 per share.
|
|
|
(5) The New York state supplemental withholding tax rate (9.62%) was used when calculating the potential 280G impact.
|
Directors’ Compensation
For their service to the Board of Directors in 2016, independent directors received the following compensation:
| · |
The Chairman of the Board of Directors received an annual retainer of $125,000, payable in cash monthly.
|
| · |
Members of the Board of Directors other than the Chairman received an annual retainer of $55,000, payable in cash monthly. Members are expected to attend 11 regular meetings of the Board of Directors, one organizational meeting of the Board of Directors, the annual meeting of shareholders, all other committee meetings as assigned, and any special meetings that the Board of Directors deems necessary.
|
| · |
Members of the Audit Committee received an additional annual retainer of $4,000, payable in cash monthly.
|
| · |
The Chairman of the Audit Committee received an additional annual retainer of $15,000, payable in cash monthly.
|
| · |
Members of the Loan Committee received an annual retainer of $4,000, payable in cash monthly.
|
| · |
Members of the Compensation Committee received an annual retainer of $4,000, payable in cash monthly.
|
The Chairman of the Board of Directors also receives an annual travel allowance of $10,000, payable in cash monthly, as reimbursement for travel and commuting on behalf of the Company.
On recommendation of the Compensation Committee, the Board of Directors also decided to grant, effective May 25, 2016, each independent director 750 shares of restricted stock, vesting in equal three annual installments on each of the first, second and third anniversaries of the grant subject to continued service as a director through the applicable vesting dates.
Messrs. Bluver and Finneran did not receive compensation for service as a director during 2016.
All retainers would be recovered from any director who attended less than 75% of the meetings of the Board of Directors or any committee thereof to which he or she had been assigned.
Deferred Compensation
The Company maintains a Directors’ Deferred Compensation Plan, under which a director may defer receipt of his or her fees as a director of the Bank until retirement or age 72, termination of service, or death. The deferral accrues interest at a rate tied to the prime interest rate as of December 31 of the prior year, as published in the Wall Street Journal, currently prime minus one percent.
Director Stock Ownership Requirements
Within five years of initial election to the Board of Directors, or the adoption of the guidelines, whichever is later, a director is expected to hold common stock of the Company with a fair market value at least equal to the then annual board member retainer. All directors have met this requirement.
Director Stock Purchase Plan
In an effort to further align the interests of directors with those of the Company and its shareholders, effective 2015, independent directors are required to use 25% of their cash retainer to purchase Company stock at current market prices. Each independent director now must purchase Company shares each month at prevailing market prices. Beginning September 30, 2015, the seven independent directors now purchase shares each month on the day their fees are paid.
The following table details compensation paid to directors during the year ending December 31, 2016:
|
DIRECTORS' COMPENSATION
|
||||||||||||||||
|
Name
|
Fees Earned
or Paid in Cash
|
Stock Awards (1)
|
All Other
Compensation (2)
|
Total
|
||||||||||||
|
($)
|
($)
|
($)
|
($)
|
|||||||||||||
|
James E. Danowski (3)
|
59,000
|
19,238
|
29
|
78,226
|
||||||||||||
|
Joseph A. Gaviola (4)
|
135,000
|
19,238
|
29
|
154,267
|
||||||||||||
|
Edgar F. Goodale (3)(5)
|
63,000
|
19,238
|
29
|
82,266
|
||||||||||||
|
David A. Kandell (3)
|
70,000
|
19,238
|
29
|
89,266
|
||||||||||||
|
Terence X. Meyer (5)(6)
|
63,000
|
19,238
|
29
|
82,266
|
||||||||||||
|
Ramesh N. Shah (6)
|
59,000
|
19,238
|
29
|
78,266
|
||||||||||||
|
John D. Stark, Jr. (6)
|
59,000
|
19,238
|
29
|
78,266
|
||||||||||||
|
(1) The amounts included in this column reflect the grant date fair value of restricted stock awards granted to our directors based on the closing price per share on the date of grant of $25.65. As of December 31, 2016 Messrs. Danowski, Gaviola, Goodale, Kandell, Meyer, Shah and Stark had 5,000 options outstanding and 1,583 restricted stock outstanding.
|
|
|
(2) Includes life insurance of $25,000 per independent director at a premium of $29 per annum.
|
|
|
(3) Messrs. Danowski and Goodale were assigned additional duties as a member of the Audit Committee for an additional annual retainer of $4,000, payable monthly, and Mr. Kandell was assigned additional duties as Chairman of the Audit Committee for an additional annual retainer of $15,000 payable monthly.
|
|
|
(4) In lieu of all other director fees, Mr. Gaviola receives an annual retainer of $125,000 and a $10,000 annual travel allowance.
|
|
|
(5) Messrs. Goodale and Meyer received an annual retainer of $4,000, payable monthly, for service on the Loan Committee.
|
|
|
(6) Messrs. Meyer, Shah and Stark received an annual retainer of $4,000, payable monthly, for service on the Compensation Committee.
|
|
| ITEM 12. |
Directors and Executive Officers
The following table sets forth the beneficial ownership of Common Stock as of March 23, 2017 by each director, each of the Company’s named executive officers and by all directors and executive officers as a group. Each director and officer has sole voting and investment power over his or her shares of Common Stock except as otherwise indicated below:
|
SECURITY OWNERSHIP
|
|||||||
|
Name of Beneficial Owner
|
Amount and Nature of
Beneficial Ownership (1)
|
Percent of Class (7)
|
|||||
|
Directors:
|
|||||||
|
Howard C. Bluver (1)
|
133,795
|
*
|
|||||
|
James E. Danowski (1) (2)
|
45,715
|
*
|
|||||
|
Brian K. Finneran (1) (3)
|
70,442
|
*
|
|||||
|
Joseph A. Gaviola (1)
|
10,854
|
*
|
|||||
|
Edgar F. Goodale (1) (4)
|
94,563
|
*
|
|||||
|
David A. Kandell (1)
|
32,844
|
*
|
|||||
|
Terence X. Meyer (1)
|
19,930
|
*
|
|||||
|
Ramesh N. Shah (1)
|
15,304
|
*
|
|||||
|
John D. Stark, Jr. (1)
|
38,494
|
*
|
|||||
|
Current named executive officers who are not directors:
|
|||||||
|
Christopher J. Hilton (1) (5)
|
6,144
|
*
|
|||||
|
Jeanne P. Kelley (1) (6)
|
17,451
|
*
|
|||||
|
Michael R. Orsino (1)
|
45,778
|
*
|
|||||
|
Directors and executive officers as a group (15 people) (1)
|
558,842
|
4.68%
|
|||||
|
* less than 1%
|
|
|
(1) Includes the following number of shares issuable upon the exercise of stock options by the person named to purchase Common Stock which are exercisable within 60 days of March 23, 2017: Mr. Bluver, 70,000 shares; Mr. Danowski, 5,000 shares; Mr. Finneran, 16,700 shares; Mr. Gaviola, 5,000 shares; Mr. Goodale, 5,000 shares; Mr. Kandell, 5,000 shares; Mr. Meyer, 5,000 shares; Mr. Shah, 5,000 shares; Mr. Stark, 5,000 shares; Ms. Kelley, 4,600 shares; and Mr. Orsino, 25,000 shares.
|
|
|
(2) Includes 19,222 shares to which Mr. Danowski shares voting and investment power.
|
|
|
(3) Includes 14,241 shares to which Mr. Finneran shares voting and investment power.
|
|
|
(4) Includes 85,316 shares to which Mr. Goodale shares voting and investment power.
|
|
|
(5) Includes 10 shares to which Mr. Hilton shares voting and investment power.
|
|
|
(6) Includes 3,787 shares to which Ms. Kelley shares voting and investment power.
|
|
|
(7) There were 11,935,752 shares of Common Stock outstanding as of March 23, 2017. The "Percent of Class" for each of the directors and named executive officers and for the directors and executive officers as a group was calculated using the amount of ownership as the numerator and the total shares outstanding as of March 23, 2017 plus the amount of shares which such persons can acquire upon the exercise of stock options within 60 days of March 23, 2017 as the denominator.
|
Five Percent Shareholders
As of March 23, 2017, there were 11,935,752 shares of common stock, $2.50 par value per share, of the Company (the “Common Stock”) outstanding. To the best knowledge of the Company, the following table presents the total number of shares and percent beneficially owned by shareholders who own more than five percent of the Company’s Common Stock as of March 23, 2017:
|
SECURITY OWNERSHIP OF CERTAIN BENEFICIAL OWNERS
|
||||||
|
Name and Address of Beneficial Owner
|
Amount and Nature of Beneficial Ownership
|
Percent of Class (1)
|
||||
|
The Banc Funds Company, L.L.C.
|
932,743 (2)
|
7.80%
|
||||
|
20 North Wacker Drive, Suite 3300
|
||||||
|
Chicago, IL 60606
|
||||||
|
BlackRock Inc.
|
854,556 (3)
|
7.20%
|
||||
|
55 East 52nd Street
|
||||||
|
New York, NY 10022
|
||||||
|
(1) There were 11,935,752 shares of Common Stock outstanding as of March 23, 2017. The "Percent of Class" for each of the shareholders in the table was calculated by using the disclosed number of beneficially owned shares of Common Stock as the numerator and the number of the Company's outstanding shares of Common Stock as of March 23, 2017 as the denominator.
|
|
|
(2) Based on Schedule 13G filed with the Securities and Exchange Commission on February 14, 2017. Schedule 13G was filed jointly by Banc Fund VI L.P., Banc Fund VII L.P., Banc Fund VIII L.P. and Banc Fund IX L.P. Banc Fund VII L.P. has sole voting and sole dispositive power with respect to 291,500 shares of Common Stock, Banc Fund VIII L.P. has sole voting and sole dispositive power with respect to 604,723 shares of Common Stock and Banc Fund IX L.P. has sole voting and sole dispositive power with respect to 36,520 shares of Common Stock. Banc Fund VI L.P. claims no beneficial ownership.
|
|
|
(3) Based on Schedule 13G filed with the Securities and Exchange Commission on January 27, 2017. Beneficial owner has sole voting power with respect to 828,895 and sole dispositive power with respect to 854,556 shares of Common Stock.
|
Equity Compensation Plan Table
Additionally, information about the Company’s equity compensation plans is as follows:
|
At December 31, 2016
|
||||||||||||
|
Number of securities
to be issued upon exercise of
outstanding options,
warrants and rights
|
Weighted-average
exercise price of
outstanding options,
warrants and rights ($)
|
Number of securities
remaining available for
future issuance under
equity compensation
plans (excluding
securities reflected in
column (a))
|
||||||||||
|
Plan category
|
(a)
|
(b)
|
(c)
|
|||||||||
|
Equity compensation plans approved by security holders
|
140,800
|
16.21
|
118,404
|
|||||||||
|
Equity compensation plans not approved by security holders
|
30,000
|
10.79
|
-
|
|||||||||
|
Total
|
170,800
|
15.26
|
118,404
|
|||||||||
Related Party Transactions and Policies
Some of the directors and executive officers of the Company, as well as members of their immediate families and the corporations, organizations, trusts and other entities with which they are associated, are also customers of the Bank in the ordinary course of business. They may also be indebted to the Bank in respect of loans of $120,000 or more. It is anticipated that these people and their associates may continue to be customers of, and indebted to, the Bank in the future. All loans extended to such individuals, corporations and firms (1) were made in the ordinary course of business, (2) did not involve more than normal risk of collectability or present other unfavorable features, and (3) were made on substantially the same terms, including interest rates and collateral, as those prevailing at the time for comparable transactions with unaffiliated persons. All such loans are reviewed and approved by the full Board of Directors of the Bank. At present, none of these loans to directors, executive officers or their associates is non-performing.
We have adopted a policy concerning related party transactions. Pursuant to this policy, the Nominating and Governance Committee reviews all related party transactions between the Company and any of its directors, officers, holders of more than five percent of our common stock or their family members or in which any of such persons directly or indirectly is interested or derives a benefit. The Nominating and Governance Committee determines whether a particular transaction serves the best interests of the Company and its shareholders and approves or disapproves the transaction. In addition, the Company has a Code of Business Conduct and Ethics for its directors, officers and employees which, among other things, requires that such individuals avoid conflicts of interest. We also have adopted Corporate Governance Guidelines, which, in conjunction with our Certificate of Incorporation, By-Laws and respective charters of the Board committees, form the framework for our governance. The Code of Business Conduct and Ethics and Corporate Governance Guidelines are available on the Company’s website at www.scnb.com by selecting “Governance Documents”.
Director Independence
The Nominating and Governance Committee assesses and advises the Board of Directors of its assessment of the independence of both current and prospective directors in accordance with the Exchange Act, and the rules promulgated thereunder, and the applicable listing requirements of the NYSE. Pursuant to these independence standards, a director must not have a relationship with the Company, other than as a director, which would interfere with the director’s exercise of independent judgment.
The Board of Directors has determined that James E. Danowski, Joseph A. Gaviola, Edgar F. Goodale, David A. Kandell, Terence X. Meyer, Ramesh N. Shah and John D. Stark, Jr. are independent. Messrs. Bluver and Finneran are not independent because they are executive officers of the Company.
Board Committees
The Boards of Directors of each of the Company and the Bank have standing Audit, Nominating and Governance, and Compensation Committees, composed as follows:
|
COMMITTEE MEMBERSHIP
|
||
|
Audit
|
Nominating and Governance
|
Compensation
|
|
David A. Kandell, Chairman
|
Edgar F. Goodale, Chairman
|
Joseph A. Gaviola, Chairman
|
|
James E. Danowski
|
James E. Danowski
|
Terence X. Meyer
|
|
Joseph A. Gaviola
|
David A. Kandell
|
Ramesh N. Shah
|
|
Edgar F. Goodale
|
John D. Stark, Jr.
|
|
The Audit Committee operates under a formal charter which is available on the Company’s website at www.scnb.com. The Audit Committee performs the functions described below under “Report of the Audit Committee.” The Board of Directors has determined that all of the members of the Audit Committee are “independent” and financially literate as required by the applicable listing standards of NYSE and other applicable rules. The Board has also determined that Messrs. Danowski and Kandell are “audit committee financial experts,” and have the requisite accounting or related financial management expertise under the listing standards of the NYSE.
The Nominating and Governance Committee operates under a formal charter which is available on the Company’s website at www.scnb.com. The Board of Directors has determined that all members of the Nominating and Governance Committee are “independent” under the applicable listing standards of NYSE.
The Compensation Committee operates under a formal charter which is available on the Company’s website at www.scnb.com. The Board of Directors has determined that all members of the Compensation Committee are “independent” as required by the applicable listing standards of NYSE and other applicable rules.
Report of the Audit Committee
The role of the Audit Committee is to assist the Board of Directors in its oversight of the Company’s financial reporting process. The Audit Committee operates pursuant to a charter whose adequacy is reviewed and reassessed by the Audit Committee on an annual basis. As set forth in the charter, management of the Company is responsible for the preparation, presentation, and integrity of the Company’s financial statements; the Company’s accounting and financial reporting principles; and the Company’s internal controls and procedures designed to assure compliance with accounting standards and applicable laws and regulations. The independent auditors are responsible for auditing the Company’s financial statements and expressing an opinion as to their conformity with generally accepted accounting principles.
In the performance of its oversight function, the Audit Committee has reviewed and discussed the audited financial statements for the year ended December 31, 2016 with management. The Audit Committee also has discussed with the independent auditors the matters required to be discussed by Statement of Auditing Standards No. 61, Communications with Audit Committees, as currently in effect. The Audit Committee has received the written disclosures and the letter from the independent auditors required by applicable requirements of the Public Company Accounting Oversight Board regarding the independent auditors’ communications with the Audit Committee concerning independence, and has discussed with the independent auditors the independent auditors’ independence. Based upon the review and discussions described in this report, the Audit Committee recommended to the Board of Directors that the Company’s audited consolidated financial statements be included in the Company’s Annual Report on Form 10-K for the year ended December 31, 2016 for filing with the SEC.
| Submitted by: |
David A. Kandell, Chairman of the Committee; James E. Danowski; Joseph A. Gaviola; Edgar F. Goodale.
|
The information contained in the Report of the Audit Committee is not deemed filed for purposes of the Exchange Act, shall not be deemed incorporated by reference by any general statement incorporating this document by reference into any filing under the Securities Act of 1933, as amended, or the Exchange Act, except to the extent that the Company specifically incorporates such information by reference, and shall not otherwise be deemed filed under such Acts.
Audit and Non-Audit Fees
It is the policy of the Audit Committee that all non-audit services be approved by the Audit Committee prior to engagement, and all such services were so approved. The following aggregate fees were billed by BDO USA, LLP during 2016 and 2015:
|
AUDIT FEES
|
||||||||
|
2016
|
2015
|
|||||||
|
Audit fees (1)
|
$
|
506,903
|
$
|
405,895
|
||||
|
Audit-related fees (2)
|
35,625
|
31,610
|
||||||
|
Tax fees
|
-
|
-
|
||||||
|
All other fees
|
-
|
-
|
||||||
|
$
|
542,528
|
$
|
437,505
|
|||||
|
(1) Consists of fees for professional services rendered for the audit of Suffolk’s annual financial statements and review of interim financial statements, and services that are normally provided by Suffolk’s registered independent public accounting firm in connection with statutory and regulatory filings or engagements, work related to section 404 of SOX, consents and audits of subsidiary companies.
|
|
|
(2) Consists of fees billed for the audit of the Suffolk County National Bank 401(k) Savings and Protection Plan and the Suffolk County National Bank Employees' Retirement Plan. In 2015, all of the fees, except what is noted above, were paid directly out of those plans.
|
PART IV
The Report of Independent Registered Public Accounting Firm, the Consolidated Financial Statements and the Notes to Consolidated Financial Statements may be found in Part II, Item 8 of this 10-K. As to any schedules omitted, they are not applicable or the required information is shown in the Consolidated Financial Statements or the Notes thereto.
Exhibits:
|
2.1
|
Agreement and Plan of Merger, by and between Suffolk Bancorp and People’s United Financial, Inc., dated as of June 26, 2016 (incorporated by reference from Exhibit 2.1 to the Company’s Current Report on Form 8-K, filed June 28, 2016)
|
|
3.1
|
Certificate of Incorporation of Suffolk Bancorp (incorporated by reference from Exhibit 3.(i) to the Company’s Annual Report on Form 10-K for the fiscal year ended December 31, 1999, filed March 10, 2000)
|
|
3.2
|
Bylaws of Suffolk Bancorp (incorporated by reference from Exhibit 3.(ii) to the Company’s Form 10-K for the fiscal year ended December 31, 1999, filed March 10, 2000)
|
|
3.3
|
Amendment to Bylaws of Suffolk Bancorp (incorporated by reference from Exhibit 3.1 to the Company’s Current Report on Form 8-K, filed June 28, 2016)
|
|
10.1*
|
Suffolk Bancorp 2009 Stock Incentive Plan (incorporated by reference from Exhibit C to the Company’s Form 10-K for the fiscal year ended December 31, 2008, filed March 13, 2009)
|
|
10.2*
|
Suffolk Bancorp Form of Change-of-Control Employment Contract (incorporated by reference from Exhibit D to the Company’s Annual Report on Form 10-K for the fiscal year ended December 31, 2008, filed March 13, 2009)
|
|
10.3*
|
Suffolk Bancorp Form of Change-of-Control Employment Contract (incorporated by reference from Exhibit 10.3 to the Company's Annual Report on Form 10-K for the year ended December 31, 2011, filed March 30, 2012)
|
|
10.4*
|
Suffolk Bancorp Form of Option Agreement (incorporated by reference from Exhibit 10.4 to the Company's Annual Report on Form 10-K for the year ended December 31, 2011, filed March 30, 2012)
|
|
10.5*
|
Suffolk Bancorp Severance Agreement (incorporated by reference from Exhibit 99.1 to the Company’s report on Form 10-Q for the quarterly period ended June 30, 2011, filed December 20, 2011)
|
|
10.6*
|
Suffolk Bancorp Letter Agreement (incorporated by reference from Exhibit 10.1 to the Company’s report on Form 8-K, filed January 3, 2012)
|
|
21.1
|
Subsidiaries of the Registrant (incorporated by reference from Exhibit 21.1 to the Company's Annual Report on Form 10-K for the year ended December 31, 2013, filed March 4, 2014)
|
|
Consent of Independent Registered Public Accounting Firm (filed herein)
|
|
|
Certification of principal executive officer pursuant to Rule 13a-14(a) or 15d-14(a) of the Securities Exchange Act of 1934, as adopted pursuant to Section 302 of the Sarbanes-Oxley Act of 2002 (filed herein)
|
|
|
Certification of principal financial officer pursuant to Rule 13a-14(a) or 15d-14(a) of the Securities Exchange Act of 1934, as adopted pursuant to Section 302 of the Sarbanes-Oxley Act of 2002 (filed herein)
|
|
|
Certification of principal executive officer pursuant to 18 U.S.C. Section 1350, as adopted pursuant to Section 906 of the Sarbanes-Oxley Act of 2002 (filed herein)
|
|
|
Certification of principal financial officer pursuant to 18 U.S.C. Section 1350, as adopted pursuant to Section 906 of the Sarbanes-Oxley Act of 2002 (filed herein)
|
|
|
101.INS
|
XBRL Instance Document (filed herein)
|
|
101.SCH
|
XBRL Taxonomy Extension Schema Document (filed herein)
|
|
101.CAL
|
XBRL Taxonomy Extension Calculation Linkbase Document (filed herein)
|
|
101.LAB
|
XBRL Taxonomy Extension Label Linkbase Document (filed herein)
|
|
101.PRE
|
XBRL Taxonomy Extension Presentation Linkbase Document (filed herein)
|
|
101.DEF
|
XBRL Taxonomy Extension Definition Linkbase Document (filed herein)
|
|
*
|
Denotes management contract or compensatory plan or arrangement.
|
Not applicable.
Pursuant to the requirements of Section 13 or 15(d) of the Securities Exchange Act of 1934, the Registrant has duly caused this report to be signed on its behalf by the undersigned, thereunto duly authorized.
|
Suffolk Bancorp
|
|
|
Registrant
|
|
|
/s/ Howard C. Bluver
|
|
|
Howard C. Bluver
|
|
|
President & Chief Executive Officer
|
|
|
(principal executive officer)
|
|
|
/s/ Brian K. Finneran
|
|
|
Brian K. Finneran
|
|
|
Executive Vice President & Chief Financial Officer
|
|
|
(principal financial and accounting officer)
|
Dated: March 27, 2017
Pursuant to the requirements of the Securities Exchange Act of 1934, this report has been signed below by the following persons on behalf of the Registrant and in the capacities and on the date indicated.
|
By:
|
/s/ JOSEPH A. GAVIOLA
|
|
|
Joseph A. Gaviola
|
||
|
Chairman of the Board & Director
|
||
|
By:
|
/s/ HOWARD C. BLUVER
|
|
|
Howard C. Bluver
|
||
|
President, Chief Executive Officer & Director
|
||
|
By:
|
/s/ BRIAN K. FINNERAN
|
|
|
Brian K. Finneran
|
||
|
Executive Vice President, Chief Financial Officer & Director
|
||
|
By:
|
/s/ JAMES E. DANOWSKI
|
|
|
James E. Danowski
|
||
|
Director
|
||
|
By:
|
/s/ EDGAR F. GOODALE
|
|
|
Edgar F. Goodale
|
||
|
Director
|
||
|
By:
|
/s/ DAVID A. KANDELL
|
|
|
David A. Kandell
|
||
|
Director
|
||
|
By:
|
/s/ TERENCE X. MEYER
|
|
|
Terence X. Meyer
|
||
|
Director
|
||
|
By:
|
/s/ RAMESH N. SHAH
|
|
|
Ramesh N. Shah
|
||
|
Director
|
||
|
By:
|
/s/ JOHN D. STARK, JR.
|
|
|
John D. Stark, Jr.
|
||
|
Director
|
Dated: March 27, 2017
104