Attached files
| file | filename |
|---|---|
| EXCEL - IDEA: XBRL DOCUMENT - SUFFOLK BANCORP | Financial_Report.xls |
| EX-32.2 - EXHIBIT 32.2 - SUFFOLK BANCORP | ex32_2.htm |
| EX-31.1 - EXHIBIT 31.1 - SUFFOLK BANCORP | ex31_1.htm |
| EX-32.1 - EXHIBIT 32.1 - SUFFOLK BANCORP | ex32_1.htm |
| EX-31.2 - EXHIBIT 31.2 - SUFFOLK BANCORP | ex31_2.htm |
UNITED STATES SECURITIES AND EXCHANGE COMMISSION
WASHINGTON, D.C. 20549
FORM 10-Q
☒ QUARTERLY REPORT PURSUANT TO SECTION 13 OR 15(d) OF
THE SECURITIES EXCHANGE ACT OF 1934
For the quarterly period ended: MARCH 31, 2015
OR
☐ TRANSITION REPORT PURSUANT TO SECTION 13 OR 15(d) OF
THE SECURITIES EXCHANGE ACT OF 1934
For the transition period from ______ to ______
Commission File No. 000-13580
SUFFOLK BANCORP
(Exact Name of Registrant as Specified in Its Charter)
|
NEW YORK
|
11-2708279
|
|
|
(State or Other Jurisdiction of Incorporation or Organization)
|
(I.R.S. Employer Identification No.)
|
4 WEST SECOND STREET, P.O. BOX 9000, RIVERHEAD, NY 11901
(Address of Principal Executive Offices) (Zip Code)
(631) 208-2400
(Registrant’s Telephone Number, Including Area Code)
Indicate by check mark whether the registrant (1) has filed all reports required to be filed by Section 13 or 15(d) of the Securities Exchange Act of 1934 during the preceding 12 months (or for such shorter period that the registrant was required to file such reports), and (2) has been subject to such filing requirements for the past 90 days.
Yes ☒ No ☐
Indicate by check mark whether the registrant has submitted electronically and posted on its corporate Web site, if any, every Interactive Data File required to be submitted and posted pursuant to Rule 405 of Regulation S-T (§232.405 of this chapter) during the preceding 12 months (or for such shorter period that the registrant was required to submit and post such files).
Yes ☒ No ☐
Indicate by check mark whether the registrant is a large accelerated filer, an accelerated filer, a non-accelerated filer, or a smaller reporting company. See the definitions of “large accelerated filer,” “accelerated filer” and “smaller reporting company” in Rule 12b-2 of the Exchange Act.
|
Large accelerated filer ☐
|
Accelerated filer ☒
|
|
Non-accelerated filer ☐
|
Smaller reporting company ☐
|
Indicate by check mark whether the registrant is a shell company (as defined in Rule 12b-2 of the Exchange Act).
Yes ☐ No ☒
As of April 15, 2015, there were 11,728,384 shares of registrant’s Common Stock outstanding.
SUFFOLK BANCORP
Form 10-Q
For the Quarterly Period Ended March 31, 2015
|
Page
|
||
|
PART I
|
||
|
Item 1.
|
2 | |
|
2
|
||
|
3
|
||
|
4
|
||
|
5
|
||
|
6
|
||
|
7
|
||
|
Item 2.
|
27
|
|
|
Item 3.
|
40
|
|
|
Item 4.
|
41
|
|
|
PART II
|
||
|
Item 1.
|
41
|
|
|
Item 1A.
|
41
|
|
|
Item 2.
|
42
|
|
|
Item 3.
|
42
|
|
|
Item 4.
|
42
|
|
|
Item 5.
|
42
|
|
|
Item 6.
|
42
|
|
|
43
|
PART I
SUFFOLK BANCORP AND SUBSIDIARIES
March 31, 2015 and December 31, 2014
(dollars in thousands, except per share data)
|
March 31, 2015
|
December 31, 2014
|
|||||||
|
ASSETS
|
||||||||
|
Cash and cash equivalents
|
||||||||
|
Cash and non-interest-bearing deposits due from banks
|
$
|
46,886
|
$
|
41,140
|
||||
|
Interest-bearing deposits due from banks
|
12,138
|
13,376
|
||||||
|
Federal funds sold
|
-
|
1,000
|
||||||
|
Total cash and cash equivalents
|
59,024
|
55,516
|
||||||
|
Interest-bearing time deposits in other banks
|
10,000
|
10,000
|
||||||
|
Federal Reserve Bank, Federal Home Loan Bank and other stock
|
6,800
|
8,600
|
||||||
|
Investment securities:
|
||||||||
|
Available for sale, at fair value
|
291,557
|
298,670
|
||||||
|
Held to maturity (fair value of $65,414 and $64,796, respectively)
|
62,191
|
62,270
|
||||||
|
Total investment securities
|
353,748
|
360,940
|
||||||
|
Loans
|
1,382,160
|
1,355,427
|
||||||
|
Allowance for loan losses
|
19,325
|
19,200
|
||||||
|
Net loans
|
1,362,835
|
1,336,227
|
||||||
|
Loans held for sale
|
2,836
|
26,495
|
||||||
|
Premises and equipment, net
|
23,219
|
23,641
|
||||||
|
Bank owned life insurance
|
45,418
|
45,109
|
||||||
|
Deferred taxes
|
14,886
|
15,714
|
||||||
|
Accrued interest and loan fees receivable
|
6,482
|
5,676
|
||||||
|
Goodwill and other intangibles
|
3,043
|
2,991
|
||||||
|
Other assets
|
3,666
|
4,374
|
||||||
|
TOTAL ASSETS
|
$
|
1,891,957
|
$
|
1,895,283
|
||||
|
LIABILITIES & STOCKHOLDERS' EQUITY
|
||||||||
|
Demand deposits
|
$
|
682,593
|
$
|
683,634
|
||||
|
Savings, N.O.W. and money market deposits
|
685,891
|
653,667
|
||||||
|
Subtotal core deposits
|
1,368,484
|
1,337,301
|
||||||
|
Time deposits
|
223,188
|
218,759
|
||||||
|
Total deposits
|
1,591,672
|
1,556,060
|
||||||
|
Borrowings
|
90,000
|
130,000
|
||||||
|
Unfunded pension liability
|
6,192
|
6,303
|
||||||
|
Capital leases
|
4,483
|
4,511
|
||||||
|
Other liabilities
|
12,050
|
15,676
|
||||||
|
TOTAL LIABILITIES
|
1,704,397
|
1,712,550
|
||||||
|
COMMITMENTS AND CONTINGENT LIABILITIES
|
||||||||
|
STOCKHOLDERS' EQUITY
|
||||||||
|
Common stock (par value $2.50; 15,000,000 shares authorized; 13,891,390 shares and 13,836,508 shares issued at March 31, 2015 and December 31, 2014, respectively; 11,725,652 shares and 11,670,770 shares outstanding at March 31, 2015 and December 31, 2014, respectively)
|
34,728
|
34,591
|
||||||
|
Surplus
|
44,495
|
44,230
|
||||||
|
Retained earnings
|
119,478
|
116,169
|
||||||
|
Treasury stock at par (2,165,738 shares)
|
(5,414
|
)
|
(5,414
|
)
|
||||
|
Accumulated other comprehensive loss, net of tax
|
(5,727
|
)
|
(6,843
|
)
|
||||
|
TOTAL STOCKHOLDERS' EQUITY
|
187,560
|
182,733
|
||||||
|
TOTAL LIABILITIES AND STOCKHOLDERS' EQUITY
|
$
|
1,891,957
|
$
|
1,895,283
|
||||
See accompanying notes to unaudited condensed consolidated financial statements.
SUFFOLK BANCORP AND SUBSIDIARIES
For the Three Months Ended March 31, 2015 and 2014
(dollars in thousands, except per share data)
|
Three Months Ended March 31,
|
||||||||
|
2015
|
2014
|
|||||||
|
INTEREST INCOME
|
||||||||
|
Loans and loan fees
|
$
|
14,569
|
$
|
12,877
|
||||
|
U.S. Government agency obligations
|
541
|
628
|
||||||
|
Obligations of states and political subdivisions
|
1,335
|
1,505
|
||||||
|
Collateralized mortgage obligations
|
182
|
250
|
||||||
|
Mortgage-backed securities
|
445
|
501
|
||||||
|
Corporate bonds
|
38
|
90
|
||||||
|
Federal funds sold and interest-bearing deposits due from banks
|
23
|
46
|
||||||
|
Dividends
|
60
|
38
|
||||||
|
Total interest income
|
17,193
|
15,935
|
||||||
|
INTEREST EXPENSE
|
||||||||
|
Savings, N.O.W. and money market deposits
|
274
|
292
|
||||||
|
Time deposits
|
294
|
345
|
||||||
|
Borrowings
|
108
|
-
|
||||||
|
Total interest expense
|
676
|
637
|
||||||
|
Net interest income
|
16,517
|
15,298
|
||||||
|
Provision for loan losses
|
250
|
250
|
||||||
|
Net interest income after provision for loan losses
|
16,267
|
15,048
|
||||||
|
NON-INTEREST INCOME
|
||||||||
|
Service charges on deposit accounts
|
747
|
1,003
|
||||||
|
Other service charges, commissions and fees
|
593
|
679
|
||||||
|
Fiduciary fees
|
-
|
279
|
||||||
|
Net gain on sale of securities available for sale
|
26
|
-
|
||||||
|
Net gain on sale of portfolio loans
|
198
|
-
|
||||||
|
Net gain on sale of mortgage loans originated for sale
|
144
|
93
|
||||||
|
Net gain on sale of premises and equipment
|
-
|
642
|
||||||
|
Income from bank owned life insurance
|
309
|
354
|
||||||
|
Other operating income
|
74
|
42
|
||||||
|
Total non-interest income
|
2,091
|
3,092
|
||||||
|
OPERATING EXPENSES
|
||||||||
|
Employee compensation and benefits
|
8,606
|
8,861
|
||||||
|
Occupancy expense
|
1,462
|
1,435
|
||||||
|
Equipment expense
|
385
|
449
|
||||||
|
Consulting and professional services
|
338
|
551
|
||||||
|
FDIC assessment
|
290
|
267
|
||||||
|
Data processing
|
570
|
573
|
||||||
|
Branch consolidation costs (credits)
|
-
|
(170
|
)
|
|||||
|
Other operating expenses
|
1,457
|
1,343
|
||||||
|
Total operating expenses
|
13,108
|
13,309
|
||||||
|
Income before income tax expense
|
5,250
|
4,831
|
||||||
|
Income tax expense
|
1,241
|
1,111
|
||||||
|
NET INCOME
|
$
|
4,009
|
$
|
3,720
|
||||
|
EARNINGS PER COMMON SHARE - BASIC
|
$
|
0.34
|
$
|
0.32
|
||||
|
EARNINGS PER COMMON SHARE - DILUTED
|
$
|
0.34
|
$
|
0.32
|
||||
|
WEIGHTED AVERAGE COMMON SHARES - BASIC
|
11,694,427
|
11,573,014
|
||||||
|
WEIGHTED AVERAGE COMMON SHARES - DILUTED
|
11,763,099
|
11,631,462
|
||||||
|
CASH DIVIDENDS DECLARED PER COMMON SHARE
|
$
|
0.06
|
$
|
-
|
||||
See accompanying notes to unaudited condensed consolidated financial statements.
SUFFOLK BANCORP AND SUBSIDIARIES
For the Three Months Ended March 31, 2015 and 2014
(in thousands)
|
Three Months Ended March 31,
|
||||||||
|
2015
|
2014
|
|||||||
|
Net income
|
$
|
4,009
|
$
|
3,720
|
||||
|
Other comprehensive income, net of tax and reclassification adjustments:
|
||||||||
|
Change in unrealized gain on securities available for sale arising during the period, net of tax of $703 and $2,681, respectively
|
1,075
|
4,700
|
||||||
|
Change in unrealized gain (loss) on securities transferred from available for sale to held to maturity, net of tax of $27 and ($920), respectively
|
41
|
(1,612
|
)
|
|||||
|
Total other comprehensive income, net of tax
|
1,116
|
3,088
|
||||||
|
Total comprehensive income
|
$
|
5,125
|
$
|
6,808
|
||||
See accompanying notes to unaudited condensed consolidated financial statements.
SUFFOLK BANCORP AND SUBSIDIARIES
For the Three Months Ended March 31, 2015 and 2014
(in thousands, except per share data)
|
Three Months Ended March 31,
|
||||||||
|
2015
|
2014
|
|||||||
|
Common stock
|
||||||||
|
Balance, January 1
|
$
|
34,591
|
$
|
34,348
|
||||
|
Dividend reinvestment (7,295 shares issued in 2015)
|
18
|
-
|
||||||
|
Stock options exercised (1,000 shares issued in 2015)
|
3
|
-
|
||||||
|
Stock-based compensation (46,587 shares issued, net of forfeitures, in 2015)
|
116
|
-
|
||||||
|
Ending balance
|
34,728
|
34,348
|
||||||
|
Surplus
|
||||||||
|
Balance, January 1
|
44,230
|
43,280
|
||||||
|
Dividend reinvestment
|
143
|
-
|
||||||
|
Stock options exercised
|
16
|
-
|
||||||
|
Stock-based compensation
|
106
|
165
|
||||||
|
Ending balance
|
44,495
|
43,445
|
||||||
|
Retained earnings
|
||||||||
|
Balance, January 1
|
116,169
|
102,273
|
||||||
|
Net income
|
4,009
|
3,720
|
||||||
|
Cash dividend on common stock ($0.06 per share in 2015)
|
(700
|
)
|
-
|
|||||
|
Ending balance
|
119,478
|
105,993
|
||||||
|
Treasury stock
|
||||||||
|
Balance, January 1
|
(5,414
|
)
|
(5,414
|
)
|
||||
|
Ending balance
|
(5,414
|
)
|
(5,414
|
)
|
||||
|
Accumulated other comprehensive loss, net of tax
|
||||||||
|
Balance, January 1
|
(6,843
|
)
|
(7,289
|
)
|
||||
|
Other comprehensive income
|
1,116
|
3,088
|
||||||
|
Ending balance
|
(5,727
|
)
|
(4,201
|
)
|
||||
|
Total stockholders' equity
|
$
|
187,560
|
$
|
174,171
|
||||
See accompanying notes to unaudited condensed consolidated financial statements.
SUFFOLK BANCORP AND SUBSIDIARIES
For the Three Months Ended March 31, 2015 and 2014
(in thousands)
|
Three Months Ended March 31,
|
||||||||
|
2015
|
2014
|
|||||||
|
NET INCOME
|
$
|
4,009
|
$
|
3,720
|
||||
|
ADJUSTMENTS TO RECONCILE NET INCOME TO NET CASH PROVIDED BY (USED IN) OPERATING ACTIVITIES
|
||||||||
|
Provision for loan losses
|
250
|
250
|
||||||
|
Depreciation and amortization
|
565
|
604
|
||||||
|
Stock-based compensation
|
222
|
165
|
||||||
|
Net amortization of premiums
|
297
|
293
|
||||||
|
Originations of mortgage loans held for sale
|
(9,314
|
)
|
(4,061
|
)
|
||||
|
Proceeds from sale of mortgage loans originated for sale
|
9,281
|
4,139
|
||||||
|
Gain on sale of mortgage loans originated for sale
|
(144
|
)
|
(93
|
)
|
||||
|
Gain on sale of portfolio loans
|
(198
|
)
|
-
|
|||||
|
Increase in other intangibles
|
(52
|
)
|
(16
|
)
|
||||
|
Deferred tax expense (benefit)
|
99
|
(78
|
)
|
|||||
|
Increase in accrued interest and loan fees receivable
|
(806
|
)
|
(881
|
)
|
||||
|
Decrease in other assets
|
708
|
372
|
||||||
|
Adjustment to unfunded pension liability
|
(111
|
)
|
(91
|
)
|
||||
|
Decrease in other liabilities
|
(3,626
|
)
|
(4,230
|
)
|
||||
|
Income from bank owned life insurance
|
(309
|
)
|
(354
|
)
|
||||
|
Gain on sale of premises and equipment
|
-
|
(642
|
)
|
|||||
|
Net gain on sale of securities available for sale
|
(26
|
)
|
-
|
|||||
|
Net cash provided by (used in) operating activities
|
845
|
(903
|
)
|
|||||
|
CASH FLOWS FROM INVESTING ACTIVITIES
|
||||||||
|
Principal payments on investment securities
|
1,413
|
3,854
|
||||||
|
Proceeds from sale of investment securities - available for sale
|
531
|
-
|
||||||
|
Maturities of investment securities - available for sale
|
6,705
|
6,040
|
||||||
|
Maturities of investment securities - held to maturity
|
117
|
315
|
||||||
|
Purchases of investment securities - held to maturity
|
-
|
(2,834
|
)
|
|||||
|
Decrease in Federal Reserve Bank, Federal Home Loan Bank and other stock
|
1,800
|
-
|
||||||
|
Proceeds from sale of portfolio loans
|
23,986
|
-
|
||||||
|
Loan originations - net
|
(26,810
|
)
|
(60,746
|
)
|
||||
|
Proceeds from sale of premises and equipment
|
-
|
900
|
||||||
|
Increase in bank owned life insurance
|
-
|
(5,000
|
)
|
|||||
|
Purchases of premises and equipment - net
|
(143
|
)
|
(124
|
)
|
||||
|
Net cash provided by (used in) investing activities
|
7,599
|
(57,595
|
)
|
|||||
|
CASH FLOWS FROM FINANCING ACTIVITIES
|
||||||||
|
Net increase in deposit accounts
|
35,612
|
13,373
|
||||||
|
Net decrease in borrowings
|
(40,000
|
)
|
-
|
|||||
|
Proceeds from stock options exercised
|
19
|
-
|
||||||
|
Cash dividends paid on common stock
|
(700
|
)
|
-
|
|||||
|
Proceeds from shares issued under the dividend reinvestment plan
|
161
|
-
|
||||||
|
Decrease in capital lease payable
|
(28
|
)
|
(24
|
)
|
||||
|
Net cash (used in) provided by financing activities
|
(4,936
|
)
|
13,349
|
|||||
|
NET INCREASE (DECREASE) IN CASH AND CASH EQUIVALENTS
|
3,508
|
(45,149
|
)
|
|||||
|
CASH AND CASH EQUIVALENTS, BEGINNING OF PERIOD
|
55,516
|
132,352
|
||||||
|
CASH AND CASH EQUIVALENTS, END OF PERIOD
|
$
|
59,024
|
$
|
87,203
|
||||
|
SUPPLEMENTAL DATA:
|
||||||||
|
Interest paid
|
$
|
681
|
$
|
637
|
||||
|
Income taxes paid
|
$
|
340
|
$
|
329
|
||||
|
Investment securities transferred from available for sale to held to maturity
|
$
|
-
|
$
|
31,286
|
||||
See accompanying notes to unaudited condensed consolidated financial statements.
1. FINANCIAL STATEMENT PRESENTATION AND SIGNIFICANT ACCOUNTING POLICIES
Suffolk Bancorp (the “Company”) was incorporated in 1985 as a bank holding company. The Company currently owns all of the outstanding capital stock of Suffolk County National Bank (the “Bank”). The Bank was organized under the national banking laws of the United States in 1890. The Bank formed Suffolk Greenway, Inc. (the “REIT”), a real estate investment trust, and owns 100% of an insurance agency and two corporations used to acquire foreclosed real estate. The insurance agency and the two corporations used to acquire foreclosed real estate are immaterial to the Company’s operations. The unaudited interim condensed consolidated financial statements include the accounts of the Company and the Bank and its subsidiaries. All material intercompany accounts and transactions have been eliminated in consolidation. Unless the context otherwise requires, references herein to the Company include the Company and the Bank and subsidiaries on a consolidated basis.
In the opinion of the Company’s management, the preceding unaudited interim condensed consolidated financial statements contain all adjustments, consisting of normal accruals, necessary for a fair presentation of its condensed consolidated statement of condition as of March 31, 2015, its condensed consolidated statements of income for the three months ended March 31, 2015 and 2014, its condensed consolidated statements of comprehensive income for the three months ended March 31, 2015 and 2014, its condensed consolidated statements of changes in stockholders’ equity for the three months ended March 31, 2015 and 2014 and its condensed consolidated statements of cash flows for the three months ended March 31, 2015 and 2014.
The preceding unaudited interim condensed consolidated financial statements have been prepared in accordance with accounting principles generally accepted in the United States of America (“U.S. GAAP”) for interim financial information and with the instructions to Form 10-Q and Article 10 of Regulation S-X, as well as in accordance with predominant practices within the banking industry. They do not include all of the information and footnotes required by U.S. GAAP for complete financial statements. The preparation of the financial statements in conformity with U.S. GAAP requires management to make estimates and assumptions that affect the amounts reported in the financial statements and the accompanying notes. Actual results could differ from those estimates. The results of operations for the three months ended March 31, 2015 are not necessarily indicative of the results of operations to be expected for the remainder of the year. For further information, please refer to the audited consolidated financial statements and footnotes thereto included in the Company’s 2014 Annual Report on Form 10-K.
Earnings Per Share - Basic earnings per share is computed based on the weighted average number of common shares and unvested restricted shares outstanding for each period. The Company’s unvested restricted shares are considered participating securities as they contain rights to non-forfeitable dividends and thus they are included in the basic earnings per share computation. Diluted earnings per share include the dilutive effect of additional potential common shares issuable under stock options. In the event a net loss is reported, restricted shares and stock options are excluded from earnings per share computations.
The reconciliation of basic and diluted weighted average number of common shares outstanding for the three months ended March 31, 2015 and 2014 follows.
|
Three Months Ended March 31,
|
||||||||
|
2015
|
2014
|
|||||||
|
Weighted average common shares outstanding
|
11,602,924
|
11,573,014
|
||||||
|
Weighted average unvested restricted shares
|
91,503
|
-
|
||||||
|
Weighted average shares for basic earnings per share
|
11,694,427
|
11,573,014
|
||||||
|
Additional diluted shares:
|
||||||||
|
Stock options
|
68,672
|
58,448
|
||||||
|
Weighted average shares for diluted earnings per share
|
11,763,099
|
11,631,462
|
||||||
Loans and Loan Interest Income Recognition – Loans that management has the intent and ability to hold for the foreseeable future or until maturity or payoff are reported at the principal balance outstanding, net of unearned discounts, deferred loan fees and costs. Unearned discounts on installment loans are credited to income using methods that result in a level yield. Loan origination fees, net of certain direct origination costs, are deferred and recognized in interest income over the respective term of the loan without anticipating prepayments.
Interest income is accrued on the unpaid loan principal balance. Recognition of interest income is discontinued when reasonable doubt exists as to whether principal or interest due can be collected. Loans of all classes will generally no longer accrue interest when over 90 days past due unless the loan is well-secured and in process of collection. When a loan is placed on non-accrual status, all interest previously accrued, but not collected, is reversed against current-year interest income. Interest received on such loans is applied against principal or interest, according to management’s judgment as to the collectability of the principal, until qualifying for return to accrual status. Loans may start accruing interest again when they become current as to principal and interest for at least six months, and when, after a well-documented analysis by management, it has been determined that the loans can be collected in full. For all classes of loans, an impaired loan is defined as a loan for which it is probable that the lender will not collect all amounts due under the contractual terms of the loan agreement. Loans for which the terms have been modified resulting in a concession, and for which the borrower is experiencing financial difficulties are considered troubled debt restructurings (“TDRs”) and are classified as impaired. Generally, TDRs are initially classified as non-accrual until sufficient time has passed to assess whether the restructured loan will continue to perform. For impaired, accruing loans, interest income is recognized on an accrual basis with cash offsetting the recorded accruals upon receipt.
Allowance for Loan Losses - The allowance for loan losses is a valuation allowance for probable incurred losses, increased by the provision for loan losses and recoveries, and decreased by loan charge-offs. For all classes of loans, when a loan, in full or in part, is deemed uncollectible, it is charged against the allowance for loan losses. This happens when the loan is past due and the borrower has not shown the ability or intent to make the loan current, or the borrower does not have sufficient assets to pay the debt, or the value of the collateral is less than the balance of the loan and is not considered likely to improve soon. The allowance for loan losses is determined by a quarterly analysis of the loan portfolio. Such analysis includes changes in the size and composition of the portfolio, the Company’s own historical loan losses, industry-wide losses, current and anticipated economic trends, and details about individual loans. It also includes estimates of the actual value of collateral, other possible sources of repayment and estimates that are susceptible to significant changes due to changes in appraisal values of collateral, national and regional economic conditions and other relevant factors. All non-accrual loans over $250 thousand in the commercial and industrial, commercial real estate and real estate construction loan classes and all TDRs are evaluated individually for impairment. All other loans are generally evaluated as homogeneous pools with similar risk characteristics. In assessing the adequacy of the allowance for loan losses, management reviews the loan portfolio by separate classes that have similar risk and collateral characteristics. These classes are commercial and industrial, commercial real estate, multifamily, mixed use commercial, real estate construction, residential mortgages, home equity and consumer loans.
The allowance for loan losses consists of specific and general components, as well as an unallocated component. The specific component relates to loans that are individually classified as impaired. Specific reserves are established based on an analysis of the most probable sources of repayment or liquidation of collateral. Impaired loans that are collateral dependent are reviewed based on the fair market value of collateral and the estimated time required to recover the Company’s investment in the loans, as well as the cost of doing so, and the estimate of the recovery. Non-collateral dependent impaired loans are reviewed based on the present value of estimated future cash flows, including balloon payments, if any, using the loan’s effective interest rate. While every impaired loan is evaluated individually, not every loan requires a specific reserve. Specific reserves fluctuate based on changes in the underlying loans, anticipated sources of repayment, and charge-offs. The general component covers non-impaired loans and is based on historical loss experience for each loan class from a rolling twelve quarter period and modifying those percentages, if necessary, after adjusting for current qualitative and environmental factors that reflect changes in the estimated collectability of the loan class not captured by historical loss data. These factors augment actual loss experience and help estimate the probability of loss within the loan portfolio based on emerging or inherent risk trends. These qualitative factors are applied as an adjustment to historical loss rates and require judgments that cannot be subjected to exact mathematical calculation. These adjustments reflect management’s overall estimate of the extent to which current losses on a pool of loans will differ from historical loss experience. These adjustments are subjective estimates and management reviews them on a quarterly basis. TDRs are also considered impaired with impairment generally measured at the present value of estimated future cash flows using the loan’s effective interest rate at inception or using the fair value of collateral, less estimated costs to sell, if repayment is expected solely from the collateral. An unallocated component is maintained to cover uncertainties that could affect management’s estimate of probable losses. The unallocated component of the allowance reflects the margin of imprecision inherent in the underlying assumptions used in the methodologies for estimating specific and general losses in the portfolio.
Loans Held For Sale – Loans held for sale are carried at the lower of aggregate cost or fair value, based on observable inputs in the secondary market. Changes in fair value of loans held for sale are recognized in earnings.
Bank Owned Life Insurance – Bank owned life insurance is recorded at the lower of the cash surrender value or the amount that can be realized under the insurance policy and is included as an asset in the consolidated statements of condition. Changes in the cash surrender value and insurance benefit payments are recorded in non-interest income in the consolidated statements of income.
Derivatives - Derivatives are contracts between counterparties that specify conditions under which settlements are to be made. The only derivatives held by the Company are swap contracts with the purchaser of its Visa Class B shares. The Company records its derivatives on the consolidated statements of condition at fair value. The Company’s derivatives do not qualify for hedge accounting. As a result, changes in fair value are recognized in earnings in the period in which they occur. (See also Note 3. Investment Securities contained herein.)
Recent Accounting Guidance – In January 2015, the Financial Accounting Standards Board (“FASB”) issued Accounting Standards Update (“ASU”) 2015-01, Income Statement—Extraordinary and Unusual Items (Subtopic 225-20), “Simplifying Income Statement Presentation by Eliminating the Concept of Extraordinary Items,” as part of its initiative to reduce complexity in accounting standards (the Simplification Initiative). This ASU eliminates from U.S. GAAP the concept of extraordinary items. Eliminating the concept of extraordinary items will save time and reduce costs for preparers because they will not have to assess whether a particular event or transaction event is extraordinary (even if they ultimately would conclude it is not). This also alleviates uncertainty for preparers, auditors, and regulators because auditors and regulators no longer will need to evaluate whether a preparer treated an unusual and/or infrequent item appropriately. The amendments in this ASU are effective for fiscal years, and interim periods within those fiscal years, beginning after December 15, 2015. A reporting entity may apply the amendments prospectively. A reporting entity also may apply the amendments retrospectively to all prior periods presented in the financial statements. Early adoption is permitted provided that the guidance is applied from the beginning of the fiscal year of adoption. Management intends to adopt ASU 2015-01 on January 1, 2016 and does not believe that the adoption will have a material effect on the Company’s consolidated financial statements.
In May 2014, the FASB issued ASU 2014-09, Revenue from Contracts with Customers (Topic 606), “Revenue from Contracts with Customers,” which supersedes nearly all existing revenue recognition guidance under U.S. GAAP. The core principle of the ASU is to recognize revenues when promised goods or services are transferred to customers in an amount that reflects the consideration to which an entity expects to be entitled for those goods or services. The ASU defines a five step process to achieve this core principle and, in doing so, more judgment and estimates may be required within the revenue recognition process than are required under existing U.S. GAAP. The ASU is effective for annual periods beginning after December 15, 2016, and interim periods therein, using either of the following transition methods: (i) a full retrospective approach reflecting the application of the standard in each prior reporting period with the option to elect certain practical expedients, or (ii) a retrospective approach with the cumulative effect of initially adopting the ASU recognized at the date of adoption (which includes additional footnote disclosures). The Company has not yet determined the method by which it will adopt ASU 2014-09 in 2017 and does not believe that the adoption will have a material effect on the Company’s consolidated financial statements. On April 2, 2015, the FASB decided to propose a one-year delay of the effective date for the new revenue recognition standard. If the proposal is finalized, the revenue recognition standard would take effect in 2018 for calendar year-end public entities. The proposal is expected to be released soon with a 30 day comment period.
In January 2014, the FASB issued ASU 2014-04, Receivables—Troubled Debt Restructurings by Creditors (Topic 310), “Reclassification of Residential Real Estate Collateralized Consumer Mortgage Loans upon Foreclosure,” to clarify when an in substance repossession or foreclosure occurs, that is, when a creditor should be considered to have received physical possession of residential real estate property collateralizing a consumer mortgage loan such that the loan receivable should be derecognized and the real estate property recognized. The ASU requires interim and annual disclosure of both (1) the amount of foreclosed residential real estate property held by the creditor and (2) the recorded investment in consumer mortgage loans collateralized by residential real estate property that are in the process of foreclosure according to local requirements of the applicable jurisdiction. The ASU is effective for fiscal years, and interim periods within those years, beginning after December 15, 2014. The Company’s adoption of ASU 2014-04 on January 1, 2015 did not have a material effect on the Company’s consolidated financial statements.
Reclassifications — Certain reclassifications have been made to prior period information in order to conform to the current period’s presentation. Such reclassifications had no impact on the Company’s consolidated results of operations or financial condition.
2. ACCUMULATED OTHER COMPREHENSIVE INCOME (“AOCI”)
The changes in the Company’s AOCI by component, net of tax, for the three months ended March 31, 2015 and 2014 follow (in thousands).
|
Three Months Ended March 31, 2015
|
||||||||||||||||
|
Unrealized Gains and
Losses on Available
for Sale Securities
|
Unrealized Losses on
Securities Transferred
from Available for
Sale to Held to
Maturity
|
Pension and Post-
Retirement Plan
Items
|
Total
|
|||||||||||||
|
Beginning balance
|
$
|
2,637
|
$
|
(1,805
|
)
|
$
|
(7,675
|
)
|
$
|
(6,843
|
)
|
|||||
|
Other comprehensive income before reclassifications
|
1,091
|
-
|
-
|
1,091
|
||||||||||||
|
Amounts reclassified from AOCI
|
(16
|
)
|
41
|
-
|
25
|
|||||||||||
|
Net other comprehensive income
|
1,075
|
41
|
-
|
1,116
|
||||||||||||
|
Ending balance
|
$
|
3,712
|
$
|
(1,764
|
)
|
$
|
(7,675
|
)
|
$
|
(5,727
|
)
|
|||||
|
Three Months Ended March 31, 2014
|
||||||||||||||||
|
Unrealized Gains and
Losses on Available
for Sale Securities
|
Unrealized Losses on
Securities Transferred
from Available for
Sale to Held to
Maturity
|
Pension and Post-
Retirement Plan
Items
|
Total
|
|||||||||||||
|
Beginning balance
|
$
|
(4,095
|
)
|
$
|
-
|
$
|
(3,194
|
)
|
$
|
(7,289
|
)
|
|||||
|
Other comprehensive income (loss) before reclassifications
|
4,700
|
(1,633
|
)
|
-
|
3,067
|
|||||||||||
|
Amounts reclassified from AOCI
|
-
|
21
|
-
|
21
|
||||||||||||
|
Net other comprehensive income (loss)
|
4,700
|
(1,612
|
)
|
-
|
3,088
|
|||||||||||
|
Ending balance
|
$
|
605
|
$
|
(1,612
|
)
|
$
|
(3,194
|
)
|
$
|
(4,201
|
)
|
|||||
The table below presents reclassifications out of AOCI for the three months ended March 31, 2015 and 2014 (in thousands).
|
Amount Reclassified from AOCI
|
|||||||||
|
Three Months Ended March 31,
|
Affected Line Item in the Statement
|
||||||||
|
Details about AOCI Components
|
2015
|
2014
|
Where Net Income is Presented
|
||||||
|
Unrealized gains and losses on available for sale securities
|
$
|
26
|
$
|
-
|
Net gain on sale of securities available for sale
|
||||
|
Unrealized losses on securities transferred from available for sale to held to maturity
|
(68
|
)
|
(33
|
)
|
Interest income - U.S. Government agency obligations
|
||||
|
17
|
12
|
Income tax expense
|
|||||||
|
Total reclassifications, net of tax
|
$
|
(25
|
)
|
$
|
(21
|
)
|
|||
3. INVESTMENT SECURITIES
At the time of purchase of a security, the Company designates the security as either available for sale or held to maturity, depending upon investment objectives, liquidity needs and intent. Securities held to maturity are stated at cost, adjusted for premium amortized or discount accreted, if any. The Company has the positive intent and ability to hold such securities to maturity. Securities available for sale are stated at estimated fair value. Unrealized gains and losses are excluded from income and reported net of tax in AOCI as a separate component of stockholders’ equity until realized. Changes in unrealized gains and losses are reported, net of tax, in the consolidated statements of comprehensive income. Interest earned on securities is included in interest income. Realized gains and losses on the sale of securities are reported in the consolidated statements of income and determined using the adjusted cost of the specific security sold.
During the full year of 2014, investment securities with a fair value of $48 million and unrealized loss of $3.2 million were transferred from available for sale to held to maturity. In accordance with U.S. GAAP, the securities were transferred at fair value, which became the amortized cost. The discount will be accreted to interest income over the remaining life of the security. The unrealized holding losses at the date of transfer remained in AOCI and will be amortized simultaneously against interest income. Those entries will offset or mitigate each other.
The amortized cost, fair value and gross unrealized gains and losses of the Company’s investment securities available for sale and held to maturity at March 31, 2015 and December 31, 2014 were as follows (in thousands):
|
March 31, 2015
|
December 31, 2014
|
|||||||||||||||||||||||||||||||
|
Amortized
Cost |
Gross
Unrealized |
Gross
Unrealized |
Fair
Value |
Amortized
Cost |
Gross
Unrealized |
Gross
Unrealized |
Fair
Value |
|||||||||||||||||||||||||
|
Available for sale:
|
||||||||||||||||||||||||||||||||
|
U.S. Government agency securities
|
$
|
38,974
|
$
|
8
|
$
|
(273
|
)
|
$
|
38,709
|
$
|
42,474
|
$
|
-
|
$
|
(897
|
)
|
$
|
41,577
|
||||||||||||||
|
Obligations of states and political subdivisions
|
127,440
|
6,484
|
-
|
133,924
|
131,300
|
6,469
|
-
|
137,769
|
||||||||||||||||||||||||
|
Collateralized mortgage obligations
|
21,470
|
273
|
(352
|
)
|
21,391
|
22,105
|
423
|
(531
|
)
|
21,997
|
||||||||||||||||||||||
|
Mortgage-backed securities
|
91,211
|
388
|
(515
|
)
|
91,084
|
92,095
|
88
|
(1,264
|
)
|
90,919
|
||||||||||||||||||||||
|
Corporate bonds
|
6,324
|
142
|
(17
|
)
|
6,449
|
6,336
|
90
|
(18
|
)
|
6,408
|
||||||||||||||||||||||
|
Total available for sale securities
|
285,419
|
7,295
|
(1,157
|
)
|
291,557
|
294,310
|
7,070
|
(2,710
|
)
|
298,670
|
||||||||||||||||||||||
|
Held to maturity:
|
||||||||||||||||||||||||||||||||
|
U.S. Government agency securities
|
48,433
|
2,431
|
-
|
50,864
|
48,365
|
1,717
|
-
|
50,082
|
||||||||||||||||||||||||
|
Obligations of states and political subdivisions
|
13,758
|
792
|
-
|
14,550
|
13,905
|
809
|
-
|
14,714
|
||||||||||||||||||||||||
|
Total held to maturity securities
|
62,191
|
3,223
|
-
|
65,414
|
62,270
|
2,526
|
-
|
64,796
|
||||||||||||||||||||||||
|
Total investment securities
|
$
|
347,610
|
$
|
10,518
|
$
|
(1,157
|
)
|
$
|
356,971
|
$
|
356,580
|
$
|
9,596
|
$
|
(2,710
|
)
|
$
|
363,466
|
||||||||||||||
At March 31, 2015 and December 31, 2014, investment securities carried at $246 million and $245 million, respectively, were pledged for public funds on deposit and as collateral for the Company’s derivative swap contracts.
The amortized cost, contractual maturities and fair value of the Company’s investment securities at March 31, 2015 (in thousands) are presented in the table below. Collateralized mortgage obligations (“CMOs”) and mortgage-backed securities (“MBS”) assume maturity dates pursuant to average lives.
|
March 31, 2015
|
||||||||
|
Amortized
Cost |
Fair
Value |
|||||||
|
Securities available for sale:
|
||||||||
|
Due in one year or less
|
$
|
28,100
|
$
|
28,595
|
||||
|
Due from one to five years
|
143,494
|
147,769
|
||||||
|
Due from five to ten years
|
113,825
|
115,193
|
||||||
|
Total securities available for sale
|
285,419
|
291,557
|
||||||
|
Securities held to maturity:
|
||||||||
|
Due in one year or less
|
1,630
|
1,644
|
||||||
|
Due from one to five years
|
5,392
|
5,792
|
||||||
|
Due from five to ten years
|
32,073
|
33,256
|
||||||
|
Due after ten years
|
23,096
|
24,722
|
||||||
|
Total securities held to maturity
|
62,191
|
65,414
|
||||||
|
Total investment securities
|
$
|
347,610
|
$
|
356,971
|
||||
The proceeds from sales of securities available for sale and the associated realized gains and losses are shown below for the periods indicated (in thousands). Realized gains are also inclusive of gains on called securities.
|
Three Months Ended March 31,
|
||||||||
|
2015
|
2014
|
|||||||
|
Proceeds
|
$
|
531
|
$
|
-
|
||||
|
Gross realized gains
|
$
|
26
|
$
|
-
|
||||
|
Gross realized losses
|
-
|
-
|
||||||
|
Net realized gains
|
$
|
26
|
$
|
-
|
||||
Information pertaining to securities with unrealized losses at March 31, 2015 and December 31, 2014, aggregated by investment category and length of time that individual securities have been in a continuous loss position, follows (in thousands):
|
Less than 12 months
|
12 months or longer
|
Total
|
||||||||||||||||||||||
|
March 31, 2015
|
Fair
Value |
Unrealized
Losses |
Fair
Value |
Unrealized
Losses |
Fair
Value |
Unrealized
Losses |
||||||||||||||||||
|
U.S. Government agency securities
|
$
|
13,919
|
$
|
(60
|
)
|
$
|
19,787
|
$
|
(213
|
)
|
$
|
33,706
|
$
|
(273
|
)
|
|||||||||
|
Collateralized mortgage obligations
|
-
|
-
|
8,476
|
(352
|
)
|
8,476
|
(352
|
)
|
||||||||||||||||
|
Mortgage-backed securities
|
20,712
|
(115
|
)
|
27,159
|
(400
|
)
|
47,871
|
(515
|
)
|
|||||||||||||||
|
Corporate bonds
|
-
|
-
|
2,983
|
(17
|
)
|
2,983
|
(17
|
)
|
||||||||||||||||
|
Total
|
$
|
34,631
|
$
|
(175
|
)
|
$
|
58,405
|
$
|
(982
|
)
|
$
|
93,036
|
$
|
(1,157
|
)
|
|||||||||
|
Less than 12 months
|
12 months or longer
|
Total
|
||||||||||||||||||||||
|
December 31, 2014
|
Fair
Value |
Unrealized
Losses |
Fair
Value |
Unrealized
Losses |
Fair
Value |
Unrealized
Losses |
||||||||||||||||||
|
U.S. Government agency securities
|
$
|
-
|
$
|
-
|
$
|
41,577
|
$
|
(897
|
)
|
$
|
41,577
|
$
|
(897
|
)
|
||||||||||
|
Collateralized mortgage obligations
|
-
|
-
|
8,417
|
(531
|
)
|
8,417
|
(531
|
)
|
||||||||||||||||
|
Mortgage-backed securities
|
-
|
-
|
81,510
|
(1,264
|
)
|
81,510
|
(1,264
|
)
|
||||||||||||||||
|
Corporate bonds
|
-
|
-
|
2,982
|
(18
|
)
|
2,982
|
(18
|
)
|
||||||||||||||||
|
Total
|
$
|
-
|
$
|
-
|
$
|
134,486
|
$
|
(2,710
|
)
|
$
|
134,486
|
$
|
(2,710
|
)
|
||||||||||
The corporate bonds with unrealized losses for twelve months or longer at March 31, 2015 in the table above carry investment grade ratings by all major credit rating agencies including both Moody’s and Standard & Poor’s. The unrealized losses on these bonds were a result of the current interest rate environment and the corresponding shape of the yield curve. The losses were not related to a deterioration of the quality of the issuer or any company-specific adverse events. All other securities with unrealized losses for twelve months or longer at March 31, 2015 are issued or guaranteed by U.S. Government agencies or sponsored enterprises and the related unrealized losses resulted solely from the current interest rate environment and the corresponding shape of the yield curve. The Company does not intend to sell and it is not more likely than not that the Company will be required to sell these securities prior to their recovery to a level equal to or greater than amortized cost. Management has determined that no other-than-temporary impairment (“OTTI”) was present at March 31, 2015.
The Bank was a member of the Visa USA payment network and was issued Class B shares upon Visa’s initial public offering in March 2008. The Visa Class B shares are transferable only under limited circumstances until they can be converted into shares of the publicly traded class of stock. This conversion cannot happen until the settlement of certain litigation, which is indemnified by Visa members. Since its initial public offering, Visa has funded a litigation reserve based upon a change in the conversion ratio of Visa Class B shares into Visa Class A shares. At its discretion, Visa may continue to increase the conversion rate in connection with any settlements in excess of amounts then in escrow for that purpose and reduce the conversion rate to the extent that it adds any funds to the escrow in the future. Based on the existing transfer restriction and the uncertainty of the litigation, the Company has recorded its Visa Class B shares on its balance sheet at zero value.
During 2013, the Bank sold 100,000 Visa Class B shares to another Visa USA member financial institution at a gross pre-tax gain of approximately $7.8 million which was recorded in non-interest income in the Company’s statement of income. In conjunction with the sale, the Company entered into derivative swap contracts with the purchaser of these Visa Class B shares which provide for settlements between the purchaser and the Company based upon a change in the conversion ratio of Visa Class B shares into Visa Class A shares.
In the fourth quarter of 2014, the Bank received notification of a change in the conversion ratio of Visa Class B shares into Visa Class A shares and was required to make a payment of $180 thousand to the purchaser of the Visa Class B shares it sold in 2013. The Company’s recorded liability representing the fair value of the derivative was $752 thousand at March 31, 2015 and December 31, 2014.
The present value of estimated future fees to be paid to the derivative counterparty, or carrying costs, calculated by reference to the market price of the Visa Class A shares at a fixed rate of interest are expensed as incurred. For the three months ended March 31, 2015 and 2014, $70 thousand and $59 thousand, respectively, in such carrying costs was expensed. The Company has pledged U.S. Government agency securities held in its available for sale portfolio, with a market value of approximately $3 million at March 31, 2015, as collateral for the derivative swap contracts.
Subjectivity has been used in estimating the fair value of both the derivative liability and the associated fees, but management believes that these fair value estimates are adequate based on available information. However, future developments in the litigation could require potentially significant changes to these estimates.
At March 31, 2015, the Company still owned 38,638 Visa Class B shares subsequent to the sales described here. Upon termination of the existing transfer restriction and settlement of the litigation, and to the extent that the Company continues to own such Visa Class B shares in the future, the Company expects to record its Visa Class B shares at fair value.
4. LOANS
At March 31, 2015 and December 31, 2014, net loans disaggregated by class consisted of the following (in thousands):
|
March 31, 2015
|
December 31, 2014
|
|||||||
|
Commercial and industrial
|
$
|
178,812
|
$
|
177,813
|
||||
|
Commercial real estate
|
579,873
|
560,524
|
||||||
|
Multifamily
|
322,229
|
309,666
|
||||||
|
Mixed use commercial
|
35,333
|
34,806
|
||||||
|
Real estate construction
|
24,608
|
26,206
|
||||||
|
Residential mortgages
|
184,977
|
187,828
|
||||||
|
Home equity
|
49,440
|
50,982
|
||||||
|
Consumer
|
6,888
|
7,602
|
||||||
|
Gross loans
|
1,382,160
|
1,355,427
|
||||||
|
Allowance for loan losses
|
(19,325
|
)
|
(19,200
|
)
|
||||
|
Net loans at end of period
|
$
|
1,362,835
|
$
|
1,336,227
|
||||
The following summarizes the activity in the allowance for loan losses disaggregated by class for the periods indicated (in thousands).
|
Three Months Ended March 31, 2015
|
Three Months Ended March 31, 2014
|
|||||||||||||||||||||||||||||||||||||||
|
Balance at
beginning of
period
|
Charge-offs
|
Recoveries
|
Provision
(credit) for
loan losses
|
Balance at
end of
period
|
Balance at
beginning of
period
|
Charge-offs
|
Recoveries
|
(Credit)
provision
for loan
losses
|
Balance at
end of
period
|
|||||||||||||||||||||||||||||||
|
Commercial and industrial
|
$
|
1,560
|
$
|
(492
|
)
|
$
|
343
|
$
|
587
|
$
|
1,998
|
$
|
2,615
|
$
|
(115
|
)
|
$
|
293
|
$
|
(312
|
)
|
$
|
2,481
|
|||||||||||||||||
|
Commercial real estate
|
6,777
|
-
|
7
|
568
|
7,352
|
6,572
|
-
|
12
|
624
|
7,208
|
||||||||||||||||||||||||||||||
|
Multifamily
|
4,018
|
-
|
-
|
449
|
4,467
|
2,159
|
-
|
-
|
481
|
2,640
|
||||||||||||||||||||||||||||||
|
Mixed use commercial
|
261
|
-
|
-
|
12
|
273
|
54
|
-
|
-
|
33
|
87
|
||||||||||||||||||||||||||||||
|
Real estate construction
|
383
|
-
|
-
|
(23
|
)
|
360
|
88
|
-
|
-
|
129
|
217
|
|||||||||||||||||||||||||||||
|
Residential mortgages
|
3,027
|
-
|
11
|
(420
|
)
|
2,618
|
2,463
|
-
|
4
|
160
|
2,627
|
|||||||||||||||||||||||||||||
|
Home equity
|
709
|
-
|
2
|
17
|
728
|
745
|
-
|
27
|
(54
|
)
|
718
|
|||||||||||||||||||||||||||||
|
Consumer
|
166
|
(1
|
)
|
5
|
(15
|
)
|
155
|
241
|
(2
|
)
|
5
|
(58
|
)
|
186
|
||||||||||||||||||||||||||
|
Unallocated
|
2,299
|
-
|
-
|
(925
|
)
|
1,374
|
2,326
|
-
|
-
|
(753
|
)
|
1,573
|
||||||||||||||||||||||||||||
|
Total
|
$
|
19,200
|
$
|
(493
|
)
|
$
|
368
|
$
|
250
|
$
|
19,325
|
$
|
17,263
|
$
|
(117
|
)
|
$
|
341
|
$
|
250
|
$
|
17,737
|
||||||||||||||||||
Factors considered by management in determining loan impairment include payment status, collateral value, and the probability of collecting scheduled principal and interest payments when due. Loans that experience insignificant payment delays and payment shortfalls generally are not classified as impaired. Management determines the significance of payment delays and payment shortfalls on a case-by-case basis, taking into consideration all of the circumstances surrounding the loan and the borrower, including the length of the delay, the reasons for the delay, the borrower’s prior payment record, and the amount of the shortfall in relation to the principal and interest owed.
The general component of the allowance covers non-impaired loans and is based on historical loss experience, adjusted for qualitative factors. These qualitative factors include consideration of the following: levels of and trends in delinquencies and impaired loans; levels of and trends in charge-offs and recoveries; trends in volume and terms of loans; effects of any changes in risk selection and underwriting standards; other changes in lending policies, procedures and practices; experience, ability, and depth of lending management and other relevant staff; local, regional and national economic trends and conditions; industry conditions; and effects of changes in credit concentrations.
At March 31, 2015 and December 31, 2014, the ending balance in the allowance for loan losses disaggregated by class and impairment methodology is as follows (in thousands). Also in the tables below are total loans at March 31, 2015 and December 31, 2014 disaggregated by class and impairment methodology (in thousands).
|
Allowance for Loan Losses
|
Loan Balances
|
|||||||||||||||||||||||
|
March 31, 2015
|
Individually evaluated for impairment
|
Collectively evaluated for impairment
|
Ending balance
|
Individually evaluated for impairment
|
Collectively evaluated for impairment
|
Ending balance
|
||||||||||||||||||
|
Commercial and industrial
|
$
|
10
|
$
|
1,988
|
$
|
1,998
|
$
|
3,764
|
$
|
175,048
|
$
|
178,812
|
||||||||||||
|
Commercial real estate
|
-
|
7,352
|
7,352
|
10,302
|
569,571
|
579,873
|
||||||||||||||||||
|
Multifamily
|
-
|
4,467
|
4,467
|
-
|
322,229
|
322,229
|
||||||||||||||||||
|
Mixed use commercial
|
-
|
273
|
273
|
-
|
35,333
|
35,333
|
||||||||||||||||||
|
Real estate construction
|
-
|
360
|
360
|
-
|
24,608
|
24,608
|
||||||||||||||||||
|
Residential mortgages
|
771
|
1,847
|
2,618
|
5,651
|
179,326
|
184,977
|
||||||||||||||||||
|
Home equity
|
159
|
569
|
728
|
1,670
|
47,770
|
49,440
|
||||||||||||||||||
|
Consumer
|
88
|
67
|
155
|
398
|
6,490
|
6,888
|
||||||||||||||||||
|
Unallocated
|
-
|
1,374
|
1,374
|
-
|
-
|
-
|
||||||||||||||||||
|
Total
|
$
|
1,028
|
$
|
18,297
|
$
|
19,325
|
$
|
21,785
|
$
|
1,360,375
|
$
|
1,382,160
|
||||||||||||
|
Allowance for Loan Losses
|
Loan Balances
|
|||||||||||||||||||||||
|
December 31, 2014
|
Individually evaluated for impairment
|
Collectively evaluated for impairment
|
Ending balance
|
Individually evaluated for impairment
|
Collectively evaluated for impairment
|
Ending balance
|
||||||||||||||||||
|
Commercial and industrial
|
$
|
16
|
$
|
1,544
|
$
|
1,560
|
$
|
4,889
|
$
|
172,924
|
$
|
177,813
|
||||||||||||
|
Commercial real estate
|
-
|
6,777
|
6,777
|
10,214
|
550,310
|
560,524
|
||||||||||||||||||
|
Multifamily
|
-
|
4,018
|
4,018
|
-
|
309,666
|
309,666
|
||||||||||||||||||
|
Mixed use commercial
|
-
|
261
|
261
|
-
|
34,806
|
34,806
|
||||||||||||||||||
|
Real estate construction
|
-
|
383
|
383
|
-
|
26,206
|
26,206
|
||||||||||||||||||
|
Residential mortgages
|
809
|
2,218
|
3,027
|
5,422
|
182,406
|
187,828
|
||||||||||||||||||
|
Home equity
|
92
|
617
|
709
|
1,567
|
49,415
|
50,982
|
||||||||||||||||||
|
Consumer
|
88
|
78
|
166
|
323
|
7,279
|
7,602
|
||||||||||||||||||
|
Unallocated
|
-
|
2,299
|
2,299
|
-
|
-
|
-
|
||||||||||||||||||
|
Total
|
$
|
1,005
|
$
|
18,195
|
$
|
19,200
|
$
|
22,415
|
$
|
1,333,012
|
$
|
1,355,427
|
||||||||||||
The following table presents the Company’s impaired loans disaggregated by class at March 31, 2015 and December 31, 2014 (in thousands).
|
March 31, 2015
|
December 31, 2014
|
|||||||||||||||||||||||
|
Unpaid Principal Balance
|
Recorded Balance
|
Allowance Allocated
|
Unpaid Principal Balance
|
Recorded Balance
|
Allowance Allocated
|
|||||||||||||||||||
|
With no allowance recorded:
|
||||||||||||||||||||||||
|
Commercial and industrial
|
$
|
3,723
|
$
|
3,723
|
$
|
-
|
$
|
4,833
|
$
|
4,833
|
$
|
-
|
||||||||||||
|
Commercial real estate
|
10,721
|
10,302
|
-
|
10,632
|
10,214
|
-
|
||||||||||||||||||
|
Residential mortgages
|
1,919
|
1,773
|
-
|
1,645
|
1,516
|
-
|
||||||||||||||||||
|
Home equity
|
1,407
|
1,407
|
-
|
1,377
|
1,377
|
-
|
||||||||||||||||||
|
Consumer
|
214
|
214
|
-
|
137
|
137
|
-
|
||||||||||||||||||
|
Subtotal
|
17,984
|
17,419
|
-
|
18,624
|
18,077
|
-
|
||||||||||||||||||
|
With an allowance recorded:
|
||||||||||||||||||||||||
|
Commercial and industrial
|
42
|
41
|
10
|
57
|
56
|
16
|
||||||||||||||||||
|
Residential mortgages
|
3,877
|
3,878
|
771
|
3,906
|
3,906
|
809
|
||||||||||||||||||
|
Home equity
|
400
|
263
|
159
|
326
|
190
|
92
|
||||||||||||||||||
|
Consumer
|
182
|
184
|
88
|
185
|
186
|
88
|
||||||||||||||||||
|
Subtotal
|
4,501
|
4,366
|
1,028
|
4,474
|
4,338
|
1,005
|
||||||||||||||||||
|
Total
|
$
|
22,485
|
$
|
21,785
|
$
|
1,028
|
$
|
23,098
|
$
|
22,415
|
$
|
1,005
|
||||||||||||
The following table presents the Company’s average recorded investment in impaired loans and the related interest income recognized disaggregated by class for the three months ended March 31, 2015 and 2014 (in thousands). No interest income was recognized on a cash basis on impaired loans for any of the periods presented. The interest income recognized on accruing impaired loans is shown in the following table.
|
Three Months Ended March 31,
|
||||||||||||||||
|
2015
|
2014
|
|||||||||||||||
|
Average recorded
investment in
impaired loans
|
Interest income
recognized on
impaired loans
|
Average recorded
investment in
impaired loans
|
Interest income
recognized on
impaired loans
|
|||||||||||||
|
Commercial and industrial
|
$
|
4,551
|
$
|
33
|
$
|
7,567
|
$
|
107
|
||||||||
|
Commercial real estate
|
10,208
|
50
|
11,558
|
99
|
||||||||||||
|
Residential mortgages
|
5,411
|
38
|
5,036
|
36
|
||||||||||||
|
Home equity
|
1,662
|
13
|
771
|
17
|
||||||||||||
|
Consumer
|
383
|
3
|
170
|
2
|
||||||||||||
|
Total
|
$
|
22,215
|
$
|
137
|
$
|
25,102
|
$
|
261
|
||||||||
TDRs are modifications or renewals where the Company has granted a concession to a borrower in financial distress. The Company reviews all modifications and renewals for determination of TDR status. The Company allocated $745 thousand and $790 thousand of specific reserves to customers whose loan terms have been modified as TDRs as of March 31, 2015 and December 31, 2014, respectively. These loans involved the restructuring of terms to allow customers to mitigate the risk of default by meeting a lower payment requirement based upon their current cash flow. These may also include loans that renewed at existing contractual rates, but below market rates for comparable credit.
A total of $45 thousand and $100 thousand were committed to be advanced in connection with TDRs as of March 31, 2015 and December 31, 2014, respectively, representing the amount the Company is legally required to advance under existing loan agreements. These loans are not in default under the terms of the loan agreements and are accruing interest. It is the Company’s policy to evaluate advances on such loans on a case by case basis. Absent a legal obligation to advance pursuant to the terms of the loan agreement, the Company generally will not advance funds for which it has outstanding commitments, but may do so in certain circumstances.
Outstanding TDRs, disaggregated by class, at March 31, 2015 and December 31, 2014 are as follows (dollars in thousands):
|
March 31, 2015
|
December 31, 2014
|
|||||||||||||||
|
TDRs Outstanding
|
Number of Loans
|
Outstanding Recorded Balance
|
Number of Loans
|
Outstanding Recorded Balance
|
||||||||||||
|
Commercial and industrial
|
30
|
$
|
2,721
|
31
|
$
|
3,683
|
||||||||||
|
Commercial real estate
|
8
|
10,057
|
8
|
10,179
|
||||||||||||
|
Residential mortgages
|
21
|
4,478
|
19
|
4,314
|
||||||||||||
|
Home equity
|
5
|
1,208
|
5
|
1,216
|
||||||||||||
|
Consumer
|
7
|
277
|
7
|
281
|
||||||||||||
|
Total
|
71
|
$
|
18,741
|
70
|
$
|
19,673
|
||||||||||
The following presents, disaggregated by class, information regarding TDRs executed during the three months ended March 31, 2015 and 2014 (dollars in thousands):
|
Three Months Ended March 31,
|
||||||||||||||||||||||||
|
2015
|
2014
|
|||||||||||||||||||||||
|
New TDRs
|
Number
of |
Pre-Modification
Outstanding |
Post-Modification
Outstanding |
Number
of |
Pre-Modification
Outstanding |
Post-Modification
Outstanding |
||||||||||||||||||
|
Commercial and industrial
|
1
|
$
|
12
|
$
|
12
|
3
|
$
|
377
|
$
|
377
|
||||||||||||||
|
Residential mortgages
|
2
|
194
|
199
|
-
|
-
|
-
|
||||||||||||||||||
|
Total
|
3
|
$
|
206
|
$
|
211
|
3
|
$
|
377
|
$
|
377
|
||||||||||||||
Presented below and disaggregated by class is information regarding loans modified as TDRs that had payment defaults of 90 days or more within twelve months of restructuring during the three months ended March 31, 2015 and 2014 (dollars in thousands).
|
Three Months Ended March 31,
|
||||||||||||||||
|
2015
|
2014
|
|||||||||||||||
|
Defaulted TDRs
|
Number
of Loans |
Outstanding
Recorded |
Number
of Loans |
Outstanding
Recorded |
||||||||||||
|
Commercial real estate
|
-
|
$
|
-
|
2
|
$
|
1,596
|
||||||||||
|
Total
|
-
|
$
|
-
|
2
|
$
|
1,596
|
||||||||||
Not all loan modifications are TDRs. In some cases, the Company might provide a concession, such as a reduction in interest rate, but the borrower is not experiencing financial distress. This could be the case if the Company is matching a competitor’s interest rate.
The following table presents a summary of non-performing assets for each period (in thousands):
|
March 31, 2015
|
December 31, 2014
|
|||||||
|
Non-accrual loans
|
$
|
12,292
|
$
|
12,981
|
||||
|
Non-accrual loans held for sale
|
-
|
-
|
||||||
|
Loans 90 days past due and still accruing
|
-
|
-
|
||||||
|
OREO
|
-
|
-
|
||||||
|
Total non-performing assets
|
$
|
12,292
|
$
|
12,981
|
||||
|
TDRs accruing interest
|
$
|
9,418
|
$
|
9,380
|
||||
|
TDRs non-accruing
|
$
|
9,323
|
$
|
10,293
|
||||
At March 31, 2015 and December 31, 2014, non-accrual loans disaggregated by class were as follows (dollars in thousands):
|
March 31, 2015
|
December 31, 2014
|
|||||||||||||||||||||||||||||||
|
Non-accrual loans
|
% of
Total
|
Total Loans
|
% of Total Loans
|
Non-accrual loans
|
% of
Total
|
Total Loans
|
% of Total Loans
|
|||||||||||||||||||||||||
|
Commercial and industrial
|
$
|
3,035
|
24.7
|
%
|
$
|
178,812
|
0.2
|
%
|
$
|
4,060
|
31.3
|
%
|
$
|
177,813
|
0.3
|
%
|
||||||||||||||||
|
Commercial real estate
|
6,647
|
54.1
|
579,873
|
0.5
|
6,556
|
50.5
|
560,524
|
0.5
|
||||||||||||||||||||||||
|
Multifamily
|
-
|
-
|
322,229
|
-
|
-
|
-
|
309,666
|
-
|
||||||||||||||||||||||||
|
Mixed use commercial
|
-
|
-
|
35,333
|
-
|
-
|
-
|
34,806
|
-
|
||||||||||||||||||||||||
|
Real estate construction
|
-
|
-
|
24,608
|
-
|
-
|
-
|
26,206
|
-
|
||||||||||||||||||||||||
|
Residential mortgages
|
2,074
|
16.9
|
184,977
|
0.2
|
2,020
|
15.6
|
187,828
|
0.1
|
||||||||||||||||||||||||
|
Home equity
|
414
|
3.3
|
49,440
|
-
|
303
|
2.3
|
50,982
|
0.1
|
||||||||||||||||||||||||
|
Consumer
|
122
|
1.0
|
6,888
|
-
|
42
|
0.3
|
7,602
|
-
|
||||||||||||||||||||||||
|
Total
|
$
|
12,292
|
100.0
|
%
|
$
|
1,382,160
|
0.9
|
%
|
$
|
12,981
|
100.0
|
%
|
$
|
1,355,427
|
1.0
|
%
|
||||||||||||||||
Additional interest income of approximately $180 thousand and $494 thousand would have been recorded during the three months ended March 31, 2015 and 2014, respectively, if non-accrual loans had performed in accordance with their original terms.
At March 31, 2015 and December 31, 2014, past due loans disaggregated by class were as follows (in thousands).
|
Past Due
|
||||||||||||||||||||||||
|
March 31, 2015
|
30 - 59 days
|
60 - 89 days
|
90 days and over
|
Total
|
Current
|
Total
|
||||||||||||||||||
|
Commercial and industrial
|
$
|
8
|
$
|
379
|
$
|
3,035
|
$
|
3,422
|
$
|
175,390
|
$
|
178,812
|
||||||||||||
|
Commercial real estate
|
-
|
-
|
6,647
|
6,647
|
573,226
|
579,873
|
||||||||||||||||||
|
Multifamily
|
-
|
-
|
-
|
-
|
322,229
|
322,229
|
||||||||||||||||||
|
Mixed use commercial
|
-
|
-
|
-
|
-
|
35,333
|
35,333
|
||||||||||||||||||
|
Real estate construction
|
-
|
-
|
-
|
-
|
24,608
|
24,608
|
||||||||||||||||||
|
Residential mortgages
|
505
|
-
|
2,074
|
2,579
|
182,398
|
184,977
|
||||||||||||||||||
|
Home equity
|
199
|
-
|
414
|
613
|
48,827
|
49,440
|
||||||||||||||||||
|
Consumer
|
10
|
-
|
122
|
132
|
6,756
|
6,888
|
||||||||||||||||||
|
Total
|
$
|
722
|
$
|
379
|
$
|
12,292
|
$
|
13,393
|
$
|
1,368,767
|
$
|
1,382,160
|
||||||||||||
|
% of Total Loans
|
0.1
|
%
|
0.0
|
%
|
0.9
|
%
|
1.0
|
%
|
99.0
|
%
|
100.0
|
%
|
||||||||||||
|
Past Due
|
||||||||||||||||||||||||
|
December 31, 2014
|
30 - 59 days
|
60 - 89 days
|
90 days and over
|
Total
|
Current
|
Total
|
||||||||||||||||||
|
Commercial and industrial
|
$
|
52
|
$
|
241
|
$
|
4,060
|
$
|
4,353
|
$
|
173,460
|
$
|
177,813
|
||||||||||||
|
Commercial real estate
|
-
|
-
|
6,556
|
6,556
|
553,968
|
560,524
|
||||||||||||||||||
|
Multifamily
|
-
|
-
|
-
|
-
|
309,666
|
309,666
|
||||||||||||||||||
|
Mixed use commercial
|
-
|
-
|
-
|
-
|
34,806
|
34,806
|
||||||||||||||||||
|
Real estate construction
|
-
|
-
|
-
|
-
|
26,206
|
26,206
|
||||||||||||||||||
|
Residential mortgages
|
822
|
-
|
2,020
|
2,842
|
184,986
|
187,828
|
||||||||||||||||||
|
Home equity
|
-
|
112
|
303
|
415
|
50,567
|
50,982
|
||||||||||||||||||
|
Consumer
|
59
|
77
|
42
|
178
|
7,424
|
7,602
|
||||||||||||||||||
|
Total
|
$
|
933
|
$
|
430
|
$
|
12,981
|
$
|
14,344
|
$
|
1,341,083
|
$
|
1,355,427
|
||||||||||||
|
% of Total Loans
|
0.1
|
%
|
0.0
|
%
|
1.0
|
%
|
1.1
|
%
|
98.9
|
%
|
100.0
|
%
|
||||||||||||
The Bank utilizes an eight-grade risk-rating system for commercial and industrial loans, commercial real estate and construction loans. Loans in risk grades 1- 4 are considered pass loans. The Bank’s risk grades are as follows:
Risk Grade 1, Excellent - Loans secured by liquid collateral such as certificates of deposit, reputable bank letters of credit, or other cash equivalents; loans that are guaranteed or otherwise backed by the full faith and credit of the United States government or an agency thereof, such as the Small Business Administration; or loans to any publicly held company with a current long-term debt rating of A or better.
Risk Grade 2, Good - Loans to businesses that have strong financial statements containing an unqualified opinion from a CPA firm and at least three consecutive years of profits; loans supported by un-audited financial statements containing strong balance sheets, five consecutive years of profits, a five-year satisfactory relationship with the Bank, and key balance sheet and income statement trends that are either stable or positive; loans secured by publicly traded marketable securities where there is no impediment to liquidation; loans to individuals backed by liquid personal assets, established credit history, and unquestionable character; or loans to publicly held companies with current long-term debt ratings of Baa or better.
Risk Grade 3, Satisfactory - Loans supported by financial statements (audited or un-audited) that indicate average or slightly below average risk and having some deficiency or vulnerability to changing economic conditions; loans with some weakness but offsetting features of other support are readily available; loans that are meeting the terms of repayment, but which may be susceptible to deterioration if adverse factors are encountered. Loans may be graded Satisfactory when there is no recent information on which to base a current risk evaluation and the following conditions apply:
| · | At inception, the loan was properly underwritten, did not possess an unwarranted level of credit risk, and the loan met the above criteria for a risk grade of Excellent, Good, or Satisfactory. |
| · | At inception, the loan was secured with collateral possessing a loan value adequate to protect the Bank from loss. |
| · | The loan has exhibited two or more years of satisfactory repayment with a reasonable reduction of the principal balance. |
| · | During the period that the loan has been outstanding, there has been no evidence of any credit weakness. Some examples of weakness include slow payment, lack of cooperation by the borrower, breach of loan covenants or the borrower is in an industry known to be experiencing problems. If any of these credit weaknesses is observed, a lower risk grade may be warranted. |
Risk Grade 4, Satisfactory/Monitored - Loans in this category are considered to be of acceptable credit quality, but contain greater credit risk than satisfactory loans due to weak balance sheets, marginal earnings or cash flow, or other uncertainties. These loans warrant a higher than average level of monitoring to ensure that weaknesses do not advance. The level of risk in a Satisfactory/Monitored loan is within acceptable underwriting guidelines so long as the loan is given the proper level of management supervision.
Risk Grade 5, Special Mention - Loans in this category possess potential weaknesses that deserve management’s close attention. If left uncorrected, these potential weaknesses may result in deterioration of the repayment prospects for the loan or in the institution’s credit position at some future date. Special Mention loans are not adversely classified and do not expose an institution to sufficient risk to warrant adverse classification. The key distinctions of a Special Mention classification are that (1) it is indicative of an unwarranted level of risk and (2) weaknesses are considered potential not defined impairments to the primary source of repayment.
Risk Grade 6, Substandard - One or more of the following characteristics may be exhibited in loans classified Substandard:
| · | Loans which possess a defined credit weakness. The likelihood that a loan will be paid from the primary source of repayment is uncertain. Financial deterioration is under way and very close attention is warranted to ensure that the loan is collected without loss. |
| · | Loans are inadequately protected by the current net worth and paying capacity of the obligor. |
| · | The primary source of repayment is gone, and the Bank is forced to rely on a secondary source of repayment, such as collateral liquidation or guarantees. |
| · | Loans have a distinct possibility that the Bank will sustain some loss if deficiencies are not corrected. |
| · | Unusual courses of action are needed to maintain a high probability of repayment. |
| · | The borrower is not generating enough cash flow to repay loan principal; however, it continues to make interest payments. |
| · | The lender is forced into a subordinated or unsecured position due to flaws in documentation. |
| · | Loans have been restructured so that payment schedules, terms, and collateral represent concessions to the borrower when compared to the normal loan terms. |
| · | The lender is seriously contemplating foreclosure or legal action due to the apparent deterioration in the loan. |
| · | There is a significant deterioration in market conditions to which the borrower is highly vulnerable. |
Risk Grade 7, Doubtful - One or more of the following characteristics may be present in loans classified Doubtful:
| · | Loans have all of the weaknesses of those classified as Substandard. However, based on existing conditions, these weaknesses make full collection of principal highly improbable. |
| · | The primary source of repayment is gone, and there is considerable doubt as to the quality of the secondary source of repayment. |
| · | The possibility of loss is high but because of certain important pending factors which may strengthen the loan, loss classification is deferred until the exact status of repayment is known. |
Risk Grade 8, Loss - Loans are considered uncollectible and of such little value that continuing to carry them as assets is not feasible. Loans will be classified Loss when it is neither practical nor desirable to defer writing off or reserving all or a portion of a basically worthless asset, even though partial recovery may be possible at some time in the future.
The Bank annually reviews the ratings on all loans greater than $500 thousand. Semi-annually, the Bank engages an independent third-party to review a significant portion of loans within the commercial and industrial, commercial real estate and real estate construction loan classes. Management uses the results of these reviews as part of its ongoing review process.
The following presents the Company’s loan portfolio credit risk profile by internally assigned grade disaggregated by class of loan at March 31, 2015 and December 31, 2014 (in thousands).
|
March 31, 2015
|
December 31, 2014
|
|||||||||||||||||||||||||||||||
|
Grade
|
Grade
|
|||||||||||||||||||||||||||||||
|
Pass
|
Special mention
|
Substandard
|
Total
|
Pass
|
Special mention
|
Substandard
|
Total
|
|||||||||||||||||||||||||
|
Commercial and industrial
|
$
|
165,527
|
$
|
3,543
|
$
|
9,742
|
$
|
178,812
|
$
|
167,922
|
$
|
1,225
|
$
|
8,666
|
$
|
177,813
|
||||||||||||||||
|
Commercial real estate
|
553,861
|
15,395
|
10,617
|
579,873
|
536,536
|
9,182
|
14,806
|
560,524
|
||||||||||||||||||||||||
|
Multifamily
|
322,229
|
-
|
-
|
322,229
|
309,666
|
-
|
-
|
309,666
|
||||||||||||||||||||||||
|
Mixed use commercial
|
35,313
|
-
|
20
|
35,333
|
34,806
|
-
|
-
|
34,806
|
||||||||||||||||||||||||
|
Real estate construction
|
24,608
|
-
|
-
|
24,608
|
26,206
|
-
|
-
|
26,206
|
||||||||||||||||||||||||
|
Residential mortgages
|
181,809
|
-
|
3,168
|
184,977
|
183,263
|
-
|
4,565
|
187,828
|
||||||||||||||||||||||||
|
Home equity
|
48,021
|
-
|
1,419
|
49,440
|
49,569
|
-
|
1,413
|
50,982
|
||||||||||||||||||||||||
|
Consumer
|
6,766
|
-
|
122
|
6,888
|
7,279
|
-
|
323
|
7,602
|
||||||||||||||||||||||||
|
Total
|
$
|
1,338,134
|
$
|
18,938
|
$
|
25,088
|
$
|
1,382,160
|
$
|
1,315,247
|
$
|
10,407
|
$
|
29,773
|
$
|
1,355,427
|
||||||||||||||||
|
% of Total
|
96.8
|
%
|
1.4
|
%
|
1.8
|
%
|
100.0
|
%
|
97.0
|
%
|
0.8
|
%
|
2.2
|
%
|
100.0
|
%
|
||||||||||||||||
5. EMPLOYEE BENEFITS
Retirement Plan - The Company’s retirement plan is noncontributory and covers substantially all eligible employees. The plan conforms to the provisions of the Employee Retirement Income Security Act of 1974, as amended, and the Pension Protection Act of 2006, which requires certain funding rules for defined benefit plans. The Company’s policy is to accrue for all pension costs and to fund the maximum amount allowable for tax purposes. Actuarial gains and losses that arise from changes in assumptions concerning future events are amortized over a period that reflects the long-term nature of pension expense used in estimating pension costs. On December 31, 2012, the Company’s retirement plan was frozen such that no additional pension benefits would accumulate. For the three months ended March 31, 2015 and 2014, the Company’s net periodic pension credit was $111 thousand and $91 thousand, respectively.
In December 2014, the Company made an optional contribution of $1 million for the plan year ended September 30, 2015. No minimum contribution was required. The Company does not presently expect to contribute to its pension plan in 2015.
6. STOCK-BASED COMPENSATION
Stock Options
Under the terms of the Company’s stock option plans adopted in 1999 and 2009, options have been granted to key employees and directors to purchase shares of the Company’s stock. Options are awarded by the Compensation Committee of the Board of Directors. Both plans provide that the option price shall not be less than the fair value of the common stock on the date the option is granted. All options are exercisable for a period of ten years or less.
No options were granted in 2015 or 2014. Options granted in 2013 and 2012 are exercisable over a three-year period commencing one year from the date of grant at a rate of one-third per year. Options granted in 2011 are exercisable over a three-year period commencing three years from the date of grant at a rate of one-third per year.
The total intrinsic value of options exercised during the first three months of 2015 was $6 thousand. The total cash received from such option exercises was $19 thousand, excluding the tax benefit realized. In exercising those options, 1,000 shares of the Company’s common stock were issued. No stock options were exercised during the first three months of 2014.
Both plans provide for but do not require the grant of stock appreciation rights (“SARs”) that the holder may exercise instead of the underlying option. At March 31, 2015, there were 6,000 SARs outstanding related to options granted before 2011. The SARs had no intrinsic value at March 31, 2015. When the SAR is exercised, the underlying option is canceled. The optionee receives shares of common stock or cash with a fair market value equal to the excess of the fair value of the shares subject to the option at the time of exercise (or the portion thereof so exercised) over the aggregate option price of the shares set forth in the option agreement. The exercise of SARs is treated as the exercise of the underlying option.
A summary of stock option activity follows:
|
Number
of Shares |
Weighted-Average
Exercise Price |
|||||||
|
Outstanding, January 1, 2015
|
251,100
|
$
|
16.33
|
|||||
|
Granted
|
-
|
-
|
||||||
|
Exercised
|
(1,000
|
)
|
$
|
18.18
|
||||
|
Forfeited or expired
|
(10,000
|
)
|
$
|
22.84
|
||||
|
Outstanding, March 31, 2015
|
240,100
|
$
|
16.06
|
|||||
The following summarizes shares subject to purchase from stock options outstanding and exercisable as of March 31, 2015:
|
Outstanding
|
Exercisable
|
|||||||||||||||||||
|
Range of
Exercise Prices |
Shares
|
Weighted-Average
Remaining |
Weighted-Average
Exercise Price |
Shares
|
Weighted-Average
Remaining |
Weighted-Average
Exercise Price |
||||||||||||||
|
$
|
10.00 - $14.00
|
120,000
|
6.9 years
|
$
|
11.97
|
83,334
|
6.9 years
|
$
|
12.45
|
|||||||||||
|
$
|
14.01 - $20.00
|
98,100
|
8.3 years
|
$
|
17.47
|
42,438
|
8.2 years
|
$
|
16.73
|
|||||||||||
|
$
|
20.01 - $30.00
|
5,000
|
3.8 years
|
$
|
28.30
|
5,000
|
3.8 years
|
$
|
28.30
|
|||||||||||
|
$
|
30.01 - $40.00
|
17,000
|
1.8 years
|
$
|
33.12
|
17,000
|
1.8 years
|
$
|
33.12
|
|||||||||||
|
240,100
|
7.0 years
|
$
|
16.06
|
147,772
|
6.6 years
|
$
|
16.59
|
|||||||||||||
Restricted Stock Awards
Under the Company’s Amended and Restated 2009 Stock Incentive Plan (the “2009 Plan”), the Company can award options, SARs and restricted stock. During the first three months of 2015, the Company awarded 51,562 shares of restricted stock to certain key employees. Generally, the restricted stock awards currently outstanding vest over a three-year period commencing one year from the date of grant at a rate of one-third per year. A summary of restricted stock activity follows:
|
Number
of Shares |
Weighted-Average
Grant-Date |
|||||||
|
Nonvested, January 1, 2015
|
72,350
|
$
|
22.51
|
|||||
|
Granted
|
51,562
|
$
|
22.76
|
|||||
|
Vested
|
-
|
-
|
||||||
|
Forfeited or expired
|
(4,975
|
)
|
$
|
22.52
|
||||
|
Nonvested, March 31, 2015
|
118,937
|
$
|
22.62
|
|||||
The Company recognizes compensation expense for the fair value of stock options and restricted stock on a straight line basis over the requisite service period of the grants. Compensation expense related to stock-based compensation amounted to $222 thousand and $165 thousand for the three months ended March 31, 2015 and 2014, respectively. The remaining unrecognized compensation cost of approximately $211 thousand and $2.1 million at March 31, 2015 related to stock options and restricted stock, respectively, will be expensed over the remaining weighted average vesting period of approximately 1.5 years and 2.4 years, respectively.
Under the 2009 Plan, a total of 500,000 shares of the Company’s common stock were reserved for issuance, of which 166,561 shares remain for possible issuance at March 31, 2015. There are no remaining shares reserved for issuance under the 1999 Stock Option Plan.
7. INCOME TAXES
The deferred tax assets and liabilities are netted and presented in a single amount which is included in deferred taxes in the accompanying consolidated statements of condition. The realization of deferred tax assets (“DTAs”) (net of a recorded valuation allowance) is largely dependent upon future taxable income, future reversals of existing taxable temporary differences and the ability to carry back losses to available tax years. In assessing the need for a valuation allowance, the Company considers positive and negative evidence, including taxable income in carryback years, scheduled reversals of deferred tax liabilities, expected future taxable income and tax planning strategies. At March 31, 2015 the Company had no remaining Federal net operating loss carryforwards and had net operating loss carryforwards of approximately $23.0 million for New York State (“NYS”) income tax purposes, which may be applied against future taxable income. The Company has a full valuation allowance of $1.0 million, tax effected, on the NYS net operating loss carryforward due to the Company’s significant tax-exempt investment income. The valuation allowance may be reversed to income in future periods to the extent that the related DTAs are realized or when the Company returns to consistent, taxable earnings in NYS. The NYS unused net operating loss carryforwards are expected to expire in varying amounts through the year 2032.
The Company recorded income tax expense of $1.2 million in the first quarter of 2015 resulting in an effective tax rate of 23.6% versus an income tax expense of $1.1 million and an effective tax rate of 23.0% in the comparable period a year ago. On March 31, 2014, the Governor of NYS signed legislation which includes major reforms to the state’s corporate income tax system. In addition, the new budget law simplifies the code by setting forth a single apportionment factor. The corporate tax rate will be lowered from 7.1% to 6.5% in 2016. Furthermore, for community banks (all banks and thrifts with $8 billion or less in assets) there is a subtraction modification for a portion of interest earned on all residential and small business loans with a principal amount of up to $5 million made to New York borrowers. All banks in this category that had a REIT on April 1, 2014, and in the applicable tax year would instead get a deduction based on their REIT's dividends paid deduction. The Company had a qualifying REIT on April 1, 2014 and has less than $8 billion in assets. If a change in a tax law or rate occurs, any existing deferred tax liability or asset must be adjusted. The effect is reflected in operations in the period of the enactment of the change in the tax law or rate. As such, the Company made an adjustment to increase its DTAs resulting in a net income tax benefit of $462 thousand in the first quarter of 2014. Offsetting the net income tax benefit was a $454 thousand income tax expense related to an adjustment of the Company’s stock based compensation included in the DTA, primarily for stock options that had expired or been forfeited by former employees. The adjustment relates primarily to prior periods, but management has determined that it is not material, and as such, included it in the 2014 first quarter’s results.
The Company had unrecognized tax benefits of approximately $34 thousand for all periods presented. There is no accrued interest relating to uncertain tax positions as of March 31, 2015.
The Company files income tax returns in the U.S. federal jurisdiction and in New York State. Federal returns are subject to audits by tax authorities beginning with the tax year 2013. New York State returns are subject to audits beginning with the 2011 tax year. It is not anticipated that the unrecognized tax benefits will significantly change over the next 12 months.
8. REGULATORY MATTERS
The Company and the Bank are subject to various regulatory capital requirements administered by the federal banking agencies. Failure to meet minimum capital requirements can initiate certain mandatory and possibly additional discretionary actions by regulators that, if undertaken, could have a direct material effect on the Company’s financial statements. Under capital adequacy guidelines and the regulatory framework for prompt corrective action, the Company and the Bank must meet specific capital requirements that involve quantitative measures of the Company’s and the Bank’s assets, liabilities and certain off-balance sheet items calculated under regulatory accounting practices. The Company’s and the Bank’s capital amounts and the Bank’s classification are also subject to qualitative judgments by the regulators about components, risk weighting and other factors.
Quantitative measures established by regulation to ensure capital adequacy require the Company and the Bank to maintain minimum amounts and ratios of total, tier 1 and common equity tier 1 capital, as defined in the federal banking regulations, to risk-weighted assets and of tier 1 capital to adjusted average assets (leverage). Management believes, as of March 31, 2015, that the Company and the Bank met all such capital adequacy requirements to which it is subject.
In July 2013, the Office of the Comptroller of the Currency (“OCC”) approved new rules on regulatory capital applicable to national banks, implementing Basel III. Most banking organizations were required to apply the new capital rules on January 1, 2015. The final rules set a new common equity tier 1 requirement and higher minimum tier 1 requirements for all banking organizations. They also place limits on capital distributions and certain discretionary bonus payments if a banking organization does not maintain a buffer of common equity tier 1 capital above minimum capital requirements. The rules revise the prompt corrective action framework to incorporate the new regulatory capital minimums. They also enhance risk sensitivity and address weaknesses identified over recent years with the measure of risk-weighted assets, including through new measures of creditworthiness to replace references to credit ratings, consistent with section 939A of the Dodd-Frank Wall Street Reform and Consumer Protection Act (the “Dodd-Frank Act”). The Company’s implementation of the new rules on January 1, 2015 did not have a material impact on our capital needs.
The Bank’s capital amounts (in thousands) and ratios are as follows:
|
Actual capital ratios
|
Minimum
for capital
adequacy
|
Minimum to be Well
Capitalized under prompt corrective action provisions
|
||||||||||||||||||||||
|
Amount
|
Ratio
|
Amount
|
Ratio
|
Amount
|
Ratio
|
|||||||||||||||||||
|
March 31, 2015
|
||||||||||||||||||||||||
|
Total capital to risk-weighted assets
|
$
|
209,314
|
13.63
|
%
|
$
|
122,866
|
8.00
|
%
|
$
|
153,582
|
10.00
|
%
|
||||||||||||
|
Tier 1 capital to risk-weighted assets
|
190,111
|
12.38
|
%
|
92,149
|
6.00
|
%
|
122,866
|
8.00
|
%
|
|||||||||||||||
|
Common equity tier 1 capital to risk-weighted assets
|
190,111
|
12.38
|
%
|
69,112
|
4.50
|
%
|
99,829
|
6.50
|
%
|
|||||||||||||||
|
Tier 1 capital to adjusted average assets (leverage)
|
190,111
|
10.02
|
%
|
75,915
|
4.00
|
%
|
94,894
|
5.00
|
%
|
|||||||||||||||
|
December 31, 2014
|
||||||||||||||||||||||||
|
Total capital to risk-weighted assets
|
$
|
201,476
|
13.25
|
%
|
$
|
121,608
|
8.00
|
%
|
$
|
152,010
|
10.00
|
%
|
||||||||||||
|
Tier 1 capital to risk-weighted assets
|
182,469
|
12.00
|
%
|
60,804
|
4.00
|
%
|
91,206
|
6.00
|
%
|
|||||||||||||||
|
Tier 1 capital to adjusted average assets (leverage)
|
182,469
|
9.96
|
%
|
73,312
|
4.00
|
%
|
91,640
|
5.00
|
%
|
|||||||||||||||
The Company’s tier 1 leverage, common equity tier 1 risk-based, tier 1 risk-based and total risk-based capital ratios were 10.13%, 12.52%, 12.52% and 13.77%, respectively, at March 31, 2015. The Company’s tier 1 leverage, tier 1 risk-based and total risk-based capital ratios were 10.04%, 12.10% and 13.35%, respectively, at December 31, 2014.
The ability of the Bank to pay dividends to the Company is subject to certain regulatory restrictions. Generally, dividends declared in a given year by a national bank are limited to its net profit, as defined by regulatory agencies, for that year, combined with its retained net income for the preceding two years, less any required transfer to surplus or to fund for the retirement of any preferred stock. In addition, a national bank may not pay dividends in an amount greater than its undivided profits or declare any dividends if such declaration would leave the bank inadequately capitalized.
9. FAIR VALUE
Fair value measurement is determined based on the assumptions that market participants would use in pricing the asset or liability in an exchange. The definition of fair value includes the exchange price which is the price in an orderly transaction between market participants to sell an asset or transfer a liability in the principal market for the asset or liability. Market participant assumptions include assumptions about risk, the risk inherent in a particular valuation technique used to measure fair value and/or the risk inherent in the inputs to the valuation technique, as well as the effect of credit risk on the fair value of liabilities. The Company uses three levels of the fair value inputs to measure assets, as described below.
Basis of Fair Value Measurement:
Level 1 – Valuations based on quoted prices in active markets for identical investments.
Level 2 – Valuations based on quoted prices in markets that are not active or for which all significant inputs are observable, either directly or indirectly. Level 2 inputs include: (i) quoted prices for similar investments in active markets, (ii) quoted prices for identical investments traded in non-active markets (i.e., dealer or broker markets) and (iii) inputs other than quoted prices that are observable or inputs derived from or corroborated by market data for substantially the full term of the investment.
Level 3 – Valuations based on inputs that are unobservable, supported by little or no market activity, and significant to the overall fair value measurement.
The types of instruments valued based on quoted market prices in active markets include most U.S. Treasury securities. Such instruments are generally classified within Level 1 and Level 2 of the fair value hierarchy. The Company does not adjust the quoted price for such instruments.
The types of instruments valued based on quoted prices in markets that are not active, broker or dealer quotations, or alternative pricing sources with reasonable levels of price transparency include U.S. Government agency securities, state and municipal obligations, MBS, CMOs and corporate bonds. Such instruments are generally classified within Level 2 of the fair value hierarchy.
The types of instruments valued based on significant unobservable inputs that reflect the Company’s own assumptions about the assumptions that market participants would use in pricing an asset or liability are generally classified within Level 3 of the fair value hierarchy.
The following table presents the carrying amounts and fair values of the Company’s financial instruments (in thousands).
|
Level in
|
March 31, 2015
|
December 31, 2014
|
||||||||||||||||||
|
Fair Value
Hierarchy |
Carrying
Amount |
Fair
Value |
Carrying
Amount |
Fair
Value |
||||||||||||||||
|
Financial Assets:
|
||||||||||||||||||||
|
Cash and due from banks
|
Level 1
|
$
|
59,024
|
$
|
59,024
|
$
|
54,516
|
$
|
54,516
|
|||||||||||
|
Federal funds sold
|
Level 2
|
-
|
-
|
1,000
|
1,000
|
|||||||||||||||
|
Interest-bearing time deposits in other banks
|
Level 2
|
10,000
|
10,009
|
10,000
|
10,017
|
|||||||||||||||
|
Federal Reserve Bank, Federal Home Loan Bank and other stock
|
N/A
|
6,800
|
N/A
|
|
8,600
|
N/A
|
|
|||||||||||||
|
Investment securities held to maturity
|
Level 2
|
62,191
|
65,414
|
62,270
|
64,796
|
|||||||||||||||
|
Investment securities available for sale
|
Level 2
|
291,557
|
291,557
|
298,670
|
298,670
|
|||||||||||||||
|
Loans held for sale
|
Level 2
|
2,836
|
2,836
|
26,495
|
26,495
|
|||||||||||||||
|
Loans, net of allowance
|
Level 2, 3 (1)
|
1,362,835
|
1,364,305
|
1,336,227
|
1,329,041
|
|||||||||||||||
|
Accrued interest and loan fees receivable
|
Level 2
|
6,482
|
6,482
|
5,676
|
5,676
|
|||||||||||||||
|
Financial Liabilities:
|
||||||||||||||||||||
|
Non-maturity deposits
|
Level 2
|
1,368,484
|
1,368,484
|
1,337,301
|
1,337,301
|
|||||||||||||||
|
Time deposits
|
Level 2
|
223,188
|
223,570
|
218,759
|
219,089
|
|||||||||||||||
|
Borrowings
|
Level 2
|
90,000
|
90,003
|
130,000
|
130,004
|
|||||||||||||||
|
Accrued interest payable
|
Level 2
|
131
|
131
|
136
|
136
|
|||||||||||||||
|
Derivatives
|
Level 3
|
752
|
752
|
752
|
752
|
|||||||||||||||
| (1) | Impaired loans are generally classified within Level 3 of the fair value hierarchy. |
Fair value estimates are made at a specific point in time and may be based on judgments regarding losses expected in the future, risk, and other factors that are subjective in nature. The methods and assumptions used to produce the fair value estimates follow.
For securities held to maturity and securities available for sale, the fair value equals quoted market price if available. If a quoted market price is not available, fair value is estimated using a quoted market price for similar securities. For cash and due from banks, federal funds sold, accrued interest and loan fees receivable, non-maturity deposits and accrued interest payable, the carrying amount is a reasonable estimate of fair value. Determining the fair value of Federal Reserve Bank, Federal Home Loan Bank and other stock is not practicable due to restrictions placed on its transferability. Interest-bearing time deposits in other banks, time deposits and borrowings are valued using a replacement cost of funds approach.
Fair values are estimated for portfolios of loans with similar characteristics. The fair value of performing loans was calculated by discounting projected cash flows through their estimated maturity using market discount rates that reflect the general credit and interest rate characteristics of the loan category. The maturity horizon is based on the Bank’s history of repayments for each type of loan and an estimate of the effect of current economic conditions. Assumptions regarding credit risk, cash flows, and discount rates are made using available market information and specific borrower information.
Loans identified as impaired are measured using one of three methods: the fair value of collateral less estimated costs to sell, the present value of expected future cash flows or the loan’s observable market price. Those measured using the fair value of collateral or the loan’s observable market price are recorded at fair value. For each period presented, no impaired loans were measured using the loan’s observable market price. If an impaired loan has had a charge-off or if the fair value of the collateral is less than the recorded investment in the loan, the Company establishes a specific reserve and reports the loan as non-recurring Level 3. The fair value of collateral of impaired loans is generally based on recent real estate appraisals. These appraisals may utilize a single valuation approach or a combination of approaches including comparable sales and the income approach. Adjustments are routinely made in the appraisal process by the appraisers to adjust for differences between the comparable sales and income data available. Such adjustments are usually significant and typically result in a Level 3 classification of the inputs for determining fair value.
For the periods presented, loans held for sale were performing and carried at cost. The carrying cost is a reasonable estimate of fair value due to their short-term nature.
During 2013, the Company entered into derivative swap contracts with the purchaser of its Visa Class B shares. The fair value of these derivatives is measured using an internal model that includes the use of probability weighted scenarios for estimates of Visa’s aggregate exposure to the litigation matters, with consideration of amounts funded by Visa into its escrow account for this litigation. At March 31, 2015, the Company estimates a fair value for these derivatives at approximately 10% of the net proceeds from the Company’s sale of the related Visa Class B shares. Since this estimation process requires application of judgment in developing significant unobservable inputs used to determine the possible outcomes and the probability weighting assigned to each scenario, these derivatives have been classified as Level 3 within the valuation hierarchy. (See also Note 3. Investment Securities contained herein.)
The fair value of commitments to extend credit is estimated by either discounting cash flows or using the fees currently charged to enter into similar agreements, taking into account the remaining terms of the agreements and the current creditworthiness of the counter-parties. The estimated fair value of written financial guarantees and letters of credit is based on fees currently charged for similar agreements. The fees charged for the commitments were not material in amount.
Assets measured at fair value on a non-recurring basis are as follows (in thousands):
|
Assets:
|
March 31, 2015
|
Fair Value
Measurements Using
Significant Unobservable
Inputs (Level 3)
|
||||||
|
Impaired loans
|
$
|
3,338
|
$
|
3,338
|
||||
|
Total
|
$
|
3,338
|
$
|
3,338
|
||||
|
Assets:
|
December 31, 2014
|
Fair Value
Measurements Using
Significant Unobservable
Inputs (Level 3)
|
||||||
|
Impaired loans
|
$
|
3,333
|
$
|
3,333
|
||||
|
Total
|
$
|
3,333
|
$
|
3,333
|
||||
The Company had no liabilities measured at fair value on a non-recurring basis at March 31, 2015 and December 31, 2014.
The following presents quantitative information about Level 3 fair value measurements for financial instruments measured at fair value on a non-recurring basis (dollars in thousands):
|
Fair Value at
|
||||||||||||||
|
Assets:
|
March 31,
2015 |
December 31,
2014 |
Valuation
Technique |
Unobservable
Inputs |
Discount
|
|||||||||
|
Impaired loans:
|
||||||||||||||
|
Commercial and industrial
|
$
|
31
|
$
|
40
|
Third party appraisal and/or internal evaluation
|
Discount to appraised value (1); estimated selling costs
|
5.6% to 50%
|
|||||||
|
Residential mortgages
|
3,107
|
3,097
|
Third party appraisal
|
Discount to appraised value
|
25%
|
|||||||||
|
Home equity
|
104
|
98
|
Third party appraisal
|
Discount to appraised value
|
25%
|
|||||||||
|
Consumer
|
96
|
98
|
Third party appraisal
|
Discount to appraised value
|
25%
|
|||||||||
|
Total
|
$
|
3,338
|
$
|
3,333
|
||||||||||
| (1) | The Company also makes adjustments to the appraised value based upon evaluation of corporate assets, such as inventory and accounts receivable, and various other information, such as market conditions and other factors. Higher discounts may be applied to certain assets, such as inventory and accounts receivable. |
The following presents fair value measurements on a recurring basis at March 31, 2015 and December 31, 2014 (in thousands):
|
Fair Value Measurements Using
|
||||||||||||
|
Assets:
|
March 31, 2015
|
Significant Other
Observable Inputs |
Significant
Unobservable Inputs |
|||||||||
|
U.S. Government agency securities
|
$
|
38,709
|
$
|
38,709
|
$
|
-
|
||||||
|
Obligations of states and political subdivisions
|
133,924
|
133,924
|
-
|
|||||||||
|
Collateralized mortgage obligations
|
21,391
|
21,391
|
-
|
|||||||||
|
Mortgage-backed securities
|
91,084
|
91,084
|
-
|
|||||||||
|
Corporate bonds
|
6,449
|
6,449
|
-
|
|||||||||
|
Total
|
$
|
291,557
|
$
|
291,557
|
$
|
-
|
||||||
|
Liabilities:
|
||||||||||||
|
Derivatives
|
752
|
$
|
-
|
$
|
752
|
|||||||
|
Total
|
$
|
752
|
$
|
-
|
$
|
752
|
||||||
|
Fair Value Measurements Using
|
||||||||||||
|
Assets:
|
December 31, 2014
|
Significant Other
Observable Inputs |
Significant
Unobservable Inputs |
|||||||||
|
U.S. Government agency securities
|
$
|
41,577
|
$
|
41,577
|
$
|
-
|
||||||
|
Obligations of states and political subdivisions
|
137,769
|
137,769
|
-
|
|||||||||
|
Collateralized mortgage obligations
|
21,997
|
21,997
|
-
|
|||||||||
|
Mortgage-backed securities
|
90,919
|
90,919
|
-
|
|||||||||
|
Corporate bonds
|
6,408
|
6,408
|
-
|
|||||||||
|
Total
|
$
|
298,670
|
$
|
298,670
|
$
|
-
|
||||||
|
Liabilities:
|
||||||||||||
|
Derivatives
|
752
|
$
|
-
|
$
|
752
|
|||||||
|
Total
|
$
|
752
|
$
|
-
|
$
|
752
|
||||||
Reconciliations for assets and liabilities measured at fair value on a recurring basis using significant unobservable inputs (Level 3) follow (in thousands).
|
Fair Value Measurements Using Significant Unobservable Inputs (Level 3)
|
||||||||
|
Three Months Ended March 31,
|
||||||||
|
2015
|
2014
|
|||||||
|
Liabilities
Derivatives |
Liabilities
Derivatives |
|||||||
|
Balance, January 1
|
$
|
752
|
$
|
932
|
||||
|
Net change
|
-
|
-
|
||||||
|
Balance, March 31
|
$
|
752
|
$
|
932
|
||||
10. LEGAL PROCEEDINGS
Certain lawsuits and claims arising in the ordinary course of business may be filed or pending against us or our affiliates from time to time. In accordance with applicable accounting guidance, we establish accruals for all lawsuits, claims and expected settlements when we believe it is probable that a loss has been incurred and the amount of the loss is reasonably estimable. When a loss contingency is not both probable and estimable, we do not establish an accrual. Any such loss estimates are inherently uncertain, based on currently available information and are subject to management’s judgment and various assumptions. Due to the inherent subjectivity of these estimates and unpredictability of outcomes of legal proceedings, any amounts accrued may not represent the ultimate resolution of such matters.
To the extent we believe any potential loss relating to such lawsuits and claims may have a material impact on our liquidity, consolidated financial position, results of operations, and/or our business as a whole and is reasonably possible but not probable, we disclose information relating to any such potential loss, whether in excess of any established accruals or where there is no established accrual. We also disclose information relating to any material potential loss that is probable but not reasonably estimable. Where reasonably practicable, we will provide an estimate of loss or range of potential loss. No disclosures are generally made for any loss contingencies that are deemed to be remote.
Based upon information available to us and our review of lawsuits and claims filed or pending against us to date, we have not recognized a material accrual liability for these matters, nor do we currently expect it is reasonably possible that these matters will result in a material liability to the Company. However, the outcome of litigation and other legal and regulatory matters is inherently uncertain, and it is possible that one or more of such matters currently pending or threatened could have an unanticipated material adverse effect on our liquidity, consolidated financial position, results of operations, and/or our business as a whole, in the future.
11. BORROWINGS
The following summarizes borrowed funds at March 31, 2015 and December 31, 2014 (dollars in thousands):
|
March 31, 2015
|
Federal Home Loan
Bank Borrowings |
Federal Funds
Purchased |
Total
|
|||||||||
|
Daily average outstanding
|
$
|
124,111
|
$
|
-
|
$
|
124,111
|
||||||
|
Total interest cost
|
108
|
-
|
108
|
|||||||||
|
Average interest rate paid
|
0.35
|
%
|
-
|
%
|
0.35
|
%
|
||||||
|
Maximum amount outstanding at any month-end
|
$
|
155,000
|
$
|
-
|
$
|
155,000
|
||||||
|
March 31 balance
|
90,000
|
-
|
90,000
|
|||||||||
|
Weighted-average interest rate on balances outstanding
|
0.34
|
%
|
-
|
%
|
0.34
|
%
|
||||||
|
December 31, 2014
|
Federal Home Loan
Bank Borrowings |
Federal Funds
Purchased |
Total
|
|||||||||
|
Daily average outstanding
|
$
|
13,051
|
$
|
8
|
$
|
13,059
|
||||||
|
Total interest cost
|
48
|
-
|
48
|
|||||||||
|
Average interest rate paid
|
0.37
|
%
|
0.46
|
%
|
0.37
|
%
|
||||||
|
Maximum amount outstanding at any month-end
|
$
|
130,000
|
$
|
-
|
$
|
130,000
|
||||||
|
December 31 balance
|
130,000
|
-
|
130,000
|
|||||||||
|
Weighted-average interest rate on balances outstanding
|
0.32
|
%
|
-
|
%
|
0.32
|
%
|
||||||
Assets pledged as collateral to the Federal Home Loan Bank (“FHLB”) at March 31, 2015 and December 31, 2014 totaled $567 million and $505 million, respectively, consisting of eligible loans and investment securities as determined under FHLB borrowing guidelines. The Company had $90 million and $130 million in FHLB borrowings at March 31, 2015 and December 31, 2014, respectively.
Safe Harbor Statement Pursuant to the Private Securities Litigation Reform Act of 1995 - Certain statements contained in this discussion are “forward-looking statements” within the meaning of the Private Securities Litigation Reform Act of 1995. These can include remarks about the Company, the banking industry, the economy in general, expectations of the business environment in which the Company operates, projections of future performance, and potential future credit experience. These remarks are based upon current management expectations, and may, therefore, involve risks and uncertainties that cannot be predicted or quantified, that are beyond the Company’s control and that could cause future results to vary materially from the Company’s historical performance or from current expectations. These remarks may be identified by such forward-looking statements as “should,” “expect,” “believe,” “view,” “opportunity,” “allow,” “continues,” “reflects,” “typically,” “usually,” “anticipate,” or similar statements or variations of such terms. Factors that could affect the Company include particularly, but are not limited to: increased capital requirements mandated by the Company’s regulators; the Company’s ability to raise capital; competitive factors, including price competition; changes in interest rates; increases or decreases in retail and commercial economic activity in the Company’s market area; variations in the ability and propensity of consumers and businesses to borrow, repay, or deposit money, or to use other banking and financial services; results of regulatory examinations or changes in law, regulations or regulatory practices; the Company’s ability to attract and retain key management and staff; any failure by the Company to maintain effective internal control over financial reporting; larger-than-expected losses from the sale of assets; and the potential that net charge-offs are higher than expected or for further increases in our provision for loan losses. Further, it could take the Company longer than anticipated to implement its strategic plans to increase revenue and manage non-interest expense, or it may not be possible to implement those plans at all. Finally, new and unanticipated legislation, regulation, or accounting standards may require the Company to change its practices in ways that materially change the results of operations. We have no obligation to update any forward-looking statements to reflect events or circumstances after the date of this document. For more information, see the risk factors described in the Company’s Annual Report on Form 10-K and other filings with the Securities and Exchange Commission.
Non-GAAP Disclosure - This discussion includes non-GAAP financial measures of the Company’s tangible common equity (“TCE”) ratio, tangible common equity, tangible assets, core net income, core FTE net interest income, core FTE net interest margin, core operating expenses, core non-interest income, core FTE non-interest income and core operating efficiency ratio. A non-GAAP financial measure is a numerical measure of historical or future financial performance, financial position or cash flows that excludes or includes amounts that are required to be disclosed in the most directly comparable measure calculated and presented in accordance with generally accepted accounting principles in the United States (“U.S. GAAP”). The Company believes that these non-GAAP financial measures provide both management and investors a more complete understanding of the underlying operational results and trends and the Company’s marketplace performance. The presentation of this additional information is not meant to be considered in isolation or as a substitute for the numbers prepared in accordance with U.S. GAAP and may not be comparable to similarly titled measures used by other financial institutions.
With respect to the calculations and reconciliations of tangible common equity, tangible assets and the TCE ratio, please see Liquidity and Capital Resources contained herein. For the calculation and reconciliation of core FTE net interest margin, please see Material Changes in Results of Operations contained herein. For all other calculations and reconciliations pertaining to non-GAAP financial measures, please see Executive Summary contained herein.
Executive Summary - The Company is a one-bank holding company incorporated in 1985. The Company operates as the parent for its wholly owned subsidiary, the Bank, a national bank founded in 1890. The income of the Company is primarily derived through the operations of the Bank and the REIT.
The Bank is a full-service bank serving the needs of its local residents through 26 branches in Nassau and Suffolk Counties, New York and loan production offices in Garden City and Melville, New York. The Bank’s 26 branches include the two opened in Melville and Garden City in June 2014 and December 2013, respectively. The Bank offers a full line of domestic commercial and retail banking services. The Bank’s primary market area includes all of Suffolk County and the adjacent markets of Nassau County and New York City. The Bank makes commercial real estate floating and fixed rate loans, multifamily and mixed use commercial loans primarily in the boroughs of New York City, commercial and industrial loans to manufacturers, wholesalers, distributors, developers/contractors and retailers and agricultural loans. The Bank also makes loans secured by residential mortgages, and both floating and fixed rate second mortgage loans with a variety of plans for repayment. Real estate construction loans are also offered.
In order to expand the Company geographically into western Suffolk and Nassau Counties and to diversify the lending business of the Company, loan production offices were recently opened in Garden City and Melville. As part of the Company’s strategy to move westward, the loan production office in Garden City serves the major business markets in central and western Long Island. Consistent with that strategy, the Company expects to open a loan production office and business banking center branch in Long Island City, Queens, in the second quarter of this year to serve Queens and nearby Brooklyn.
The Bank finances most of its activities through a combination of deposits, including demand, savings, N.O.W. and money market deposits as well as time deposits, and short-term borrowings which could include federal funds with correspondent banks, securities sold under agreements to repurchase and Federal Home Loan Bank (“FHLB”) borrowings. The Company’s chief competition includes local banks within its market area, as well as New York City money center banks and regional banks.
Financial Performance Summary
As of or for the quarters ended March 31, 2015 and 2014
(dollars in thousands, except per share data)
|
Quarters ended March 31,
|
Over/
(under)
|
|||||||||||
|
2015
|
2014
|
2014
|
||||||||||
|
Revenue (1)
|
$
|
18,608
|
$
|
18,390
|
1.2
|
%
|
||||||
|
Operating expenses
|
$
|
13,108
|
$
|
13,309
|
(1.5
|
%)
|
||||||
|
Provision for loan losses
|
$
|
250
|
$
|
250
|
0.0
|
%
|
||||||
|
Net income
|
$
|
4,009
|
$
|
3,720
|
7.8
|
%
|
||||||
|
Net income per common share - diluted
|
$
|
0.34
|
$
|
0.32
|
6.3
|
%
|
||||||
|
Return on average assets
|
0.85
|
%
|
0.89
|
%
|
(4
|
) bp
|
||||||
|
Return on average stockholders' equity
|
8.79
|
%
|
8.81
|
%
|
(2
|
) bp
|
||||||
|
Tier 1 leverage ratio
|
10.13
|
%
|
10.27
|
%
|
(14
|
) bp
|
||||||
|
Common equity tier 1 risk-based capital ratio
|
12.52
|
%
|
N/A
|
|
N/A
|
|
||||||
|
Tier 1 risk-based capital ratio
|
12.52
|
%
|
13.57
|
%
|
(105
|
) bp
|
||||||
|
Total risk-based capital ratio
|
13.77
|
%
|
14.82
|
%
|
(105
|
) bp
|
||||||
|
Tangible common equity ratio (non-GAAP)
|
9.77
|
%
|
9.99
|
%
|
(22
|
) bp
|
||||||
|
Total stockholders' equity/total assets (2)
|
9.91
|
%
|
10.15
|
%
|
(24
|
) bp
|
||||||
bp - denotes basis points; 100 bp equals 1%.
| (1) | Represents net interest income plus total non-interest income. |
| (2) | The ratio of total stockholders' equity to total assets is the most comparable U.S. GAAP measure to the non-GAAP tangible common equity ratio presented herein. |
At March 31, 2015, the Company, on a consolidated basis, had total assets of $1.9 billion, total deposits of $1.6 billion and total stockholders’ equity of $188 million. The Company recorded net income of $4.0 million, or $0.34 per diluted common share, for the first quarter of 2015, compared to $3.7 million, or $0.32 per diluted common share, for the same period in 2014. The 7.8% increase in first quarter 2015 reported earnings versus the comparable 2014 period resulted principally from a $1.2 million increase in net interest income coupled with a $201 thousand reduction in total operating expenses in 2015. Partially offsetting these positive factors was a $1.0 million reduction in non-interest income in 2015 when compared to the first quarter of 2014. Excluding the first quarter 2014 gain on the sale of a closed branch building and an expense credit associated with branch consolidation costs previously recorded, core net income increased by 29.5% to $4.0 million in the first quarter of 2015 from $3.1 million in the comparable 2014 period. (See also Non-GAAP Disclosure contained herein.)
|
Three Months Ended March 31,
|
||||||||
|
(in thousands)
|
2015
|
2014
|
||||||
|
CORE NET INCOME:
|
||||||||
|
Net income, as reported
|
$
|
4,009
|
$
|
3,720
|
||||
|
Less:
|
||||||||
|
Gain on sale of branch building
|
-
|
(642
|
)
|
|||||
|
Branch consolidation costs (credits)
|
-
|
(170
|
)
|
|||||
|
Total adjustments, before income taxes
|
-
|
(812
|
)
|
|||||
|
Adjustment for reported effective income tax rate
|
-
|
(187
|
)
|
|||||
|
Total adjustments, after income taxes
|
-
|
(625
|
)
|
|||||
|
Core net income
|
$
|
4,009
|
$
|
3,095
|
||||
The Company’s return on average assets and return on average common stockholders’ equity were 0.85% and 8.79%, respectively, in the first quarter of 2015 versus 0.89% and 8.81%, respectively, in the first quarter of 2014.
The Company continues to increase market share by preserving our eastern Suffolk lending franchise while simultaneously expanding west. This strategy has allowed the Company to expand into markets in Nassau County and New York City that are very attractive from a demographic standpoint and have an abundance of small and middle market businesses, the kinds of businesses that have comprised the Company’s core customer base throughout its history.
The Company experienced an increase in the total loan portfolio of $27 million, from $1.355 billion at December 31, 2014 to $1.382 billion at March 31, 2015, a 2.0% quarterly growth rate. Total loans at March 31, 2015 represented a 22.3% increase from the comparable quarter in 2014. Considering the unusually harsh weather experienced in the Company’s local markets during the first quarter of 2015, this performance is noteworthy. Many loans originally scheduled to close in the first quarter of 2015 slipped into the second quarter, as many customers experienced delays in normal business activity as a consequence of the severe winter weather. As a result, the Company’s loan pipeline is currently at the highest level it has been in several years and the Company remains optimistic about the prospect for strong loan growth during the remainder of 2015.
The credit quality of the Company’s loan portfolio remains strong. Total non-accrual loans at March 31, 2015 were $12.3 million, or 0.89% of total loans, with a substantial majority of these loans both well collateralized and performing under negotiated workout agreements with cooperative borrowers. Early delinquencies (30-89 days past due), which are managed aggressively as a potential harbinger of future credit issues, continue to be well controlled at $1.1 million, or 0.08% of total loans. Given the improving economic conditions in its markets, as well as the current profile of its loan portfolio, the Company believes it is well reserved. The allowance for loan losses at March 31, 2015 was $19.3 million, or 1.40% of total loans and 157% of total non-accrual loans.
The Company believes its core deposit franchise is one of the strongest among all community banks, both within the Company’s region and beyond its markets. This will serve the Company well when interest rates inevitably rise. The first quarter has traditionally been the Company’s slowest time of the year for deposit generation because of the seasonality associated with businesses on the east end of Long Island, including the Hamptons. But it is clear that, as the Company expands west and generates a growing percentage of deposits from new lending customers, the seasonal winter downturn in overall deposit levels is becoming less pronounced. It is also important to note that, as excess liquidity is utilized and the funding mix starts to reflect increased borrowings, growth in core deposits will become increasingly important to the Company. As a result, new incentives for core deposit generation for both lending and retail teams have recently been implemented by the Company, and the initial results are encouraging.
Core deposits, consisting of demand, N.O.W., savings and money market deposits, totaled $1.4 billion at March 31, 2015, representing 86% of total deposits at that date. Demand deposits totaled $683 million at March 31, 2015, or 43% of total deposits. The deposit product mix continues to be an important strength of the Company and resulted in an exceptionally low overall average cost of funds of 16 basis points during the first quarter of 2015.
The Company’s management continues to work hard to reduce operating expenses and increase efficiency. The expansion strategies that have resulted in the strong financial performance of the last few years require significant investment, particularly in technology upgrades, office space as the Company moves west, regulatory resources and, most importantly, attracting the best lending and credit professionals to drive performance. Nevertheless, management has been successful in finding ways to fund these investments by reducing expenses in other areas. Total operating expenses during the first quarter of 2015 were $13.1 million, compared to $13.3 million in the first quarter of 2014, a reduction of $201 thousand notwithstanding the significant investments made over the last year to generate increased revenues. This improvement in operating leverage translated into an improvement in the Company’s core operating efficiency ratio during the first quarter of 2015 to 66.4%, from 72.5% during the first quarter of 2014. (See also Non-GAAP Disclosure contained herein.) As the Company moves forward, management will continue to balance the need for investment to generate revenue with expense reductions in other areas. The Company’s management has proven its ability to do this and believes it will build shareholder value over the long term.
|
Three Months Ended March 31,
|
||||||||
|
($ in thousands)
|
2015
|
2014
|
||||||
|
Core operating expenses:
|
||||||||
|
Total operating expenses
|
$
|
13,108
|
$
|
13,309
|
||||
|
Adjust for branch consolidation costs (credits)
|
-
|
170
|
||||||
|
Core operating expenses
|
13,108
|
13,479
|
||||||
|
Core non-interest income:
|
||||||||
|
Total non-interest income
|
2,091
|
3,092
|
||||||
|
Adjust for gain on sale of branch building
|
-
|
(642
|
)
|
|||||
|
Core non-interest income
|
2,091
|
2,450
|
||||||
|
Adjust for tax-equivalent basis
|
202
|
212
|
||||||
|
Core FTE non-interest income
|
2,293
|
2,662
|
||||||
|
Core net interest income:
|
||||||||
|
FTE net interest income
|
17,496
|
16,273
|
||||||
|
Less interest on loans returning to accrual status
|
(20
|
)
|
(341
|
)
|
||||
|
Core FTE net interest income
|
17,476
|
15,932
|
||||||
|
Core operating efficiency ratio:
|
||||||||
|
Core operating expenses
|
13,108
|
13,479
|
||||||
|
Core FTE net interest income
|
17,476
|
15,932
|
||||||
|
Core FTE non-interest income
|
2,293
|
2,662
|
||||||
|
Less net gain on sale of securities available for sale
|
(26
|
)
|
-
|
|||||
|
Core operating expenses/sum of other items above
|
66.39
|
%
|
72.49
|
%
|
||||
Critical Accounting Policies, Judgments and Estimates - The Company’s accounting and reporting policies conform to U.S. GAAP and general practices within the banking industry. The preparation of the financial statements in conformity with U.S. GAAP requires management to make estimates and assumptions that affect the amounts reported in the financial statements and the accompanying notes. Actual results could differ from those estimates.
Allowance for Loan Losses - One of the most critical accounting policies impacting the Company’s financial statements is the evaluation of the allowance for loan losses. The allowance for loan losses is a valuation allowance for probable incurred losses, increased by the provision for loan losses and recoveries, and decreased by loan charge-offs. For all classes of loans, when a loan, in full or in part, is deemed uncollectible, it is charged against the allowance for loan losses. This happens when the loan is past due and the borrower has not shown the ability or intent to make the loan current, or the borrower does not have sufficient assets to pay the debt, or the value of the collateral is less than the balance of the loan and is not considered likely to improve soon. The allowance for loan losses is determined by a quarterly analysis of the loan portfolio. Such analysis includes changes in the size and composition of the portfolio, the Company’s own historical loan losses, industry-wide losses, current and anticipated economic trends, and details about individual loans. It also includes estimates of the actual value of collateral, other possible sources of repayment and estimates that are susceptible to significant changes due to changes in appraisal values of collateral, national and regional economic conditions and other relevant factors. All non-accrual loans over $250 thousand in the commercial and industrial, commercial real estate and real estate construction loan classes and all troubled debt restructurings (“TDRs”) are evaluated individually for impairment. All other loans are generally evaluated as homogeneous pools with similar risk characteristics. In assessing the adequacy of the allowance for loan losses, management reviews the loan portfolio by separate classes that have similar risk and collateral characteristics. These classes are commercial and industrial, commercial real estate, multifamily, mixed use commercial, real estate construction, residential mortgages, home equity and consumer loans.
The allowance for loan losses consists of specific and general components, as well as an unallocated component. The specific component relates to loans that are individually classified as impaired. Specific reserves are established based on an analysis of the most probable sources of repayment or liquidation of collateral. Impaired loans that are collateral dependent are reviewed based on the fair market value of collateral and the estimated time required to recover the Company’s investment in the loans, as well as the cost of doing so, and the estimate of the recovery. Non-collateral dependent impaired loans are reviewed based on the present value of estimated future cash flows, including balloon payments, if any, using the loan’s effective interest rate. While every impaired loan is evaluated individually, not every loan requires a specific reserve. Specific reserves fluctuate based on changes in the underlying loans, anticipated sources of repayment, and charge-offs. The general component covers non-impaired loans and is based on historical loss experience for each loan class from a rolling twelve quarter period and modifying those percentages, if necessary, after adjusting for current qualitative and environmental factors that reflect changes in the estimated collectability of the loan class not captured by historical loss data. These factors augment actual loss experience and help estimate the probability of loss within the loan portfolio based on emerging or inherent risk trends. These qualitative factors are applied as an adjustment to historical loss rates and require judgments that cannot be subjected to exact mathematical calculation. These adjustments reflect management’s overall estimate of the extent to which current losses on a pool of loans will differ from historical loss experience. These adjustments are subjective estimates and management reviews them on a quarterly basis. TDRs are also considered impaired with impairment generally measured at the present value of estimated future cash flows using the loan’s effective interest rate at inception or using the fair value of collateral, less estimated costs to sell, if repayment is expected solely from the collateral. An unallocated component is maintained to cover uncertainties that could affect management’s estimate of probable losses. The unallocated component of the allowance reflects the margin of imprecision inherent in the underlying assumptions used in the methodologies for estimating specific and general losses in the portfolio.
Deferred Tax Assets and Liabilities – Deferred tax assets and liabilities are the expected future tax consequences of temporary differences between the carrying amounts and the tax bases of assets and liabilities, computed using enacted tax rates. Deferred tax assets are recognized if it is more likely than not that a future benefit will be realized. A valuation allowance, if needed, reduces deferred tax assets to the amount expected to be realized. The realization of deferred tax assets (net of a recorded valuation allowance) is largely dependent upon future taxable income, future reversals of existing taxable temporary differences and the ability to carryback losses to available tax years. In assessing the need for a valuation allowance, the Company considers all relevant positive and negative evidence, including taxable income in carryback years, scheduled reversals of deferred tax liabilities, expected future taxable income and available tax planning strategies.
Other-Than-Temporary Impairment (“OTTI”) of Investment Securities – Management evaluates securities for OTTI on at least a quarterly basis, and more frequently when economic or market conditions warrant such an evaluation. For securities in an unrealized loss position, management considers the extent and duration of the unrealized loss, and the financial condition and near-term prospects of the issuer. Management also assesses whether it intends to sell, or it is more likely than not that it will be required to sell, a security in an unrealized loss position before recovery of its amortized cost basis. If either of the criteria regarding intent or requirement to sell is met, the entire difference between amortized cost and fair value is recognized as impairment through earnings. For debt securities that do not meet the aforementioned criteria, the amount of impairment is split into two components as follows: 1) OTTI related to credit loss, which must be recognized in the statement of income and 2) OTTI related to other factors, which is recognized in other comprehensive income (loss). The credit loss is defined as the difference between the present value of the cash flows expected to be collected and the amortized cost basis. For equity securities, the entire amount of impairment is recognized through earnings.
Material Changes in Financial Condition - Total assets of the Company were $1.9 billion at March 31, 2015. When compared to December 31, 2014, total assets decreased by $3 million. This change was primarily due to decreases in loans held for sale and investment securities of $24 million and $7 million, respectively, largely offset by loan growth of $27 million.
The decrease in loans held for sale reflected the sale of $24 million in multifamily loans, at a premium, in the first quarter of 2015. Total investment securities were $354 million at March 31, 2015 and $361 million at December 31, 2014. The decrease in the investment portfolio largely reflected maturities and calls of municipal obligations and U.S. Government agency securities totaling $7 million coupled with principal paydowns of collateralized mortgage obligations and mortgage-backed securities of U.S. Government-sponsored enterprises totaling $2 million for the first three months of 2015. The interest rate environment had a positive impact of $2 million on the fair value of the Company’s available for sale investment portfolio at March 31, 2015 compared to year-end 2014.
Total loans were $1.382 billion at March 31, 2015 compared to $1.355 billion at December 31, 2014. The increase in the loan portfolio was primarily due to growth of commercial real estate and multifamily loans of $19 million and $13 million, respectively, in the first quarter of 2015.
At March 31, 2015, total deposits were $1.6 billion, an increase of $36 million when compared to December 31, 2014. This increase was primarily due to higher balances of savings, N.O.W. and money market deposits of $13 million, $11 million and $8 million, respectively. Core deposit balances, which consist of demand, savings, N.O.W. and money market deposits, represented 86% of total deposits at March 31, 2015 and December 31, 2014. Demand deposit balances represented 43% and 44% of total deposits at March 31, 2015 and December 31, 2014, respectively. At March 31, 2015 and December 31, 2014, the Company had $90 million and $130 million, respectively, in overnight borrowings used to fund the growth in the Company’s loan portfolio.
Liquidity and Capital Resources - Liquidity management is defined as both the Company’s and the Bank’s ability to meet their financial obligations on a continuous basis without material loss or disruption of normal operations. These obligations include the withdrawal of deposits on demand or at their contractual maturity, the repayment of borrowings as they mature, funding new and existing loan commitments and the ability to take advantage of business opportunities as they arise. Asset liquidity is provided by short-term investments and the marketability of securities available for sale. The Company may also leave excess reserve balances at the Federal Reserve Bank (“FRB”) if the rate being paid is higher than would be available from other short-term investments. Liquid assets, consisting of federal funds sold, securities available for sale and balances at the FRB, decreased to $302 million at March 31, 2015 compared to $311 million at December 31, 2014. These liquid assets may include assets that have been pledged against municipal deposits or short-term borrowings. In addition, the Company has pledged U.S. Government agency securities held in its available for sale portfolio, with a market value of approximately $3 million at March 31, 2015, as collateral for the derivative swap contracts. Liquidity is also provided by the maintenance of a base of core deposits, maturing short-term assets including cash and due from banks, the ability to sell or pledge marketable assets and access to lines of credit.
Liquidity is continuously monitored, thereby allowing management to better understand and react to emerging balance sheet trends, including temporary mismatches with regard to sources and uses of funds. After assessing actual and projected cash flow needs, management seeks to obtain funding at the most economical cost. These funds can be obtained by converting liquid assets to cash or by attracting new deposits or other sources of funding. Many factors affect the Company’s ability to meet liquidity needs, including variations in the markets served, loan demand, its asset/liability mix, its reputation and credit standing in its markets and general economic conditions. Borrowings and the scheduled amortization of investment securities and loans are more predictable funding sources. Deposit flows and securities prepayments are somewhat less predictable as they are often subject to external factors. Among these are changes in the local and national economies, competition from other financial institutions and changes in market interest rates.
The Company’s primary sources of funds are cash provided by deposits and borrowings, proceeds from maturities and sales of securities available for sale and cash provided by operating activities. At March 31, 2015, total deposits were $1.6 billion, an increase of $36 million when compared to December 31, 2014. Of the $223 million in total time deposits at March 31, 2015, $191 million are scheduled to mature within the next 12 months. Based on historical experience, the Company expects to be able to replace a substantial portion of those maturing deposits with comparable deposit products. At March 31, 2015 and December 31, 2014, the Company had $90 million and $130 million, respectively, in overnight borrowings used to fund the growth in the Company’s loan portfolio. For the three months ended March 31, 2015 and 2014, proceeds from sales and maturities of securities available for sale totaled $7 million and $6 million, respectively.
The Company’s primary uses of funds are for the origination of loans and the purchase of investment securities. For the three months ended March 31, 2015, the Company had net loan originations for portfolio of $27 million compared to $61 million for the same period in 2014. The Company did not purchase any investment securities during the three months ended March 31, 2015. For the three months ended March 31, 2014, the Company purchased investment securities totaling $3 million.
The Bank’s Asset/Liability and Funds Management Policy establishes specific policies and operating procedures governing liquidity levels to assist management in developing plans to address future and current liquidity needs. Management monitors the rates and cash flows from the loan and investment portfolios while also examining the maturity structure and volatility characteristics of liabilities to develop an optimum asset/liability mix. Available funding sources include retail, commercial and municipal deposits, purchased liabilities and stockholders’ equity. At March 31, 2015, access to approximately $567 million in FHLB lines of credit for overnight or term borrowings with maturities of up to thirty years was available. At March 31, 2015, approximately $60 million and $10 million in unsecured and secured lines of credit, respectively, extended by correspondent banks were also available to be utilized, if needed, for short-term funding purposes. At March 31, 2015, $90 million in overnight borrowings were outstanding with the FHLB. No borrowings were outstanding under lines of credit with correspondent banks.
The Bank also has the ability to access the brokered deposit market. Deposits gathered through the Certificate of Deposit Account Registry Service (“CDARS”) are considered for regulatory purposes to be brokered deposits. At March 31, 2015, the Bank had $5 million in CDARS deposits outstanding.
The Company strives to maintain an efficient level of capital, commensurate with its risk profile, on which a competitive rate of return to stockholders will be realized over both the short and long term. Capital is managed to enhance stockholder value while providing flexibility for management to act opportunistically in a changing marketplace. Management continually evaluates the Company’s capital position in light of current and future growth objectives and regulatory guidelines. Total stockholders’ equity was $188 million at March 31, 2015 compared to $183 million at December 31, 2014. The increase in stockholders’ equity versus December 31, 2014 was due to net income, net of dividends paid, recorded during 2015 coupled with a $1 million decrease in accumulated other comprehensive loss, net of tax. The decrease in accumulated other comprehensive loss at March 31, 2015 resulted primarily from the positive impact of the interest rate environment in 2015 on the value of the Company’s available for sale investment portfolio.
The Company and the Bank are subject to regulatory capital requirements. The Company’s tier 1 leverage, common equity tier 1 risk-based, tier 1 risk-based and total risk-based capital ratios were 10.13%, 12.52%, 12.52% and 13.77%, respectively, at March 31, 2015. The Company’s capital ratios exceeded all regulatory requirements at March 31, 2015. The Bank’s tier 1 leverage, common equity tier 1 risk-based, tier 1 risk-based and total risk-based capital ratios were 10.02%, 12.38%, 12.38% and 13.63%, respectively, at March 31, 2015. Each of these ratios exceeds the regulatory guidelines for a well-capitalized institution, the highest regulatory capital category.
The Company did not repurchase any shares of its common stock during the first three months of 2015. Repurchase of shares will occur only if management believes that the purchase will be at prices that are accretive to earnings per share and is the most efficient use of the Company’s capital.
The Company’s tangible common equity ratio was 9.77% at March 31, 2015 compared to 9.50% at December 31, 2014 and 9.99% at March 31, 2014. The ratio of tangible common equity to tangible assets, or TCE ratio, is calculated by dividing total common stockholders’ equity by total assets, after reducing both amounts by intangible assets. The TCE ratio is not required by U.S. GAAP or by applicable bank regulatory requirements, but is a metric used by management to evaluate the adequacy of our capital levels. Since there is no authoritative requirement to calculate the TCE ratio, our TCE ratio is not necessarily comparable to similar capital measures disclosed or used by other companies in the financial services industry. Tangible common equity and tangible assets are non-GAAP financial measures and should be considered in addition to, not as a substitute for or superior to, financial measures determined in accordance with U.S. GAAP. Set forth below are the reconciliations of tangible common equity to U.S. GAAP total common stockholders’ equity and tangible assets to U.S. GAAP total assets at March 31, 2015 (in thousands). (See also Non-GAAP Disclosure contained herein.)
|
Total stockholders' equity
|
$
|
187,560
|
Total assets
|
$
|
1,891,957
|
9.91
|
% (1)
|
||||||
|
Less: intangible assets
|
(3,043
|
)
|
Less: intangible assets
|
(3,043
|
)
|
||||||||
|
Tangible common equity
|
$
|
184,517
|
Tangible assets
|
$
|
1,888,914
|
9.77
|
%
|
(1) The ratio of total stockholders' equity to total assets is the most comparable U.S. GAAP measure to the non-GAAP tangible common equity ratio presented herein.
All dividends must conform to applicable statutory requirements. The Company’s ability to pay dividends to stockholders depends on the Bank’s ability to pay dividends to the Company. Under 12 USC 56-9, a national bank may not pay a dividend on its common stock if the dividend would exceed net undivided profits then on hand. Further, under 12 USC 60, a national bank must obtain prior approval from the OCC to pay dividends on either common or preferred stock that would exceed the bank’s net profits for the current year combined with retained net profits (net profits minus dividends paid during that period) of the prior two years. The ability of the Bank to pay dividends to the Company is subject to certain regulatory restrictions. Generally, dividends declared in a given year by a national bank are limited to its net profit, as defined by regulatory agencies, for that year, combined with its retained net income for the preceding two years, less any required transfer to surplus or to fund for the retirement of any preferred stock. In addition, a national bank may not pay dividends in an amount greater than its undivided profits or declare any dividends if such declaration would leave the bank inadequately capitalized. The Company’s Board of Directors declared a quarterly cash dividend of $0.06 per share in the first quarter of 2015. No dividends were declared in the first quarter of 2014.
Off-Balance Sheet Arrangements - The Bank is a party to financial instruments with off-balance sheet risk in the normal course of business to meet the financing needs of its customers. These financial instruments include commitments to extend credit and standby and documentary letters of credit. Those instruments involve, to varying degrees, elements of credit risk in excess of the amount recognized in the consolidated financial statements. The Bank uses the same credit policies in making commitments and conditional obligations as it does for on-balance sheet instruments.
Commitments to extend credit are agreements to lend to a customer as long as there is no violation of any condition established in the contract. Commitments generally have fixed expiration dates or other termination clauses and may require payment of a fee. Since many of the commitments are expected to expire without being drawn upon, the total commitment amounts do not necessarily represent future cash requirements. The Bank evaluates each customer’s creditworthiness on a case-by-case basis. The amount of collateral obtained, if deemed necessary by the Bank upon extension of credit, is based on management’s credit evaluation of the customer. Collateral required varies, but may include accounts receivable, inventory, equipment, real estate and income-producing commercial properties. At March 31, 2015 and December 31, 2014, commitments to originate loans and commitments under unused lines of credit for which the Bank is obligated amounted to approximately $158 million and $180 million, respectively.
Letters of credit are conditional commitments guaranteeing payments of drafts in accordance with the terms of the letter of credit agreements. Commercial letters of credit are used primarily to facilitate trade or commerce and are also issued to support public and private borrowing arrangements, bond financing and similar transactions. Collateral may be required to support letters of credit based upon management’s evaluation of the creditworthiness of each customer. The credit risk involved in issuing letters of credit is essentially the same as that involved in extending loan facilities to customers. Most letters of credit expire within one year. At March 31, 2015 and December 31, 2014, letters of credit outstanding were approximately $16 million and $17 million, respectively.
Material Changes in Results of Operations – Comparison of the Quarters Ended March 31, 2015 and 2014 - The Company recorded net income of $4.0 million during the first quarter of 2015 versus $3.7 million in the comparable year ago period. The 7.8% improvement in first quarter 2015 net income resulted principally from a $1.2 million increase in net interest income coupled with a $201 thousand decrease in total operating expenses in 2015. Partially offsetting the foregoing improvements was a $1.0 million decrease in non-interest income in the first quarter of 2015, largely the result of a $642 thousand gain on the sale of a branch building in the first quarter of 2014 and a $279 thousand reduction in fiduciary fee income due to the sale of the Company’s wealth management business in the fourth quarter of 2014. The Company’s effective tax rate increased nominally to 23.6% in 2015 from 23.0% a year ago. A $250 thousand provision for loan losses was recorded in the first quarter of 2015 and 2014.
The $1.2 million or 8.0% improvement in first quarter 2015 net interest income resulted from a $199 million increase in average total interest-earning assets, offset in part by a 19 basis point contraction in the Company’s net interest margin to 4.02% in 2015 from 4.21% in 2014. Excluding the receipt of interest income on loans returning to accrual status, the Company’s core net interest margin was 4.01% in the first quarter of 2015 as compared to 4.12% in the first quarter of 2014. (See also Non-GAAP Disclosure contained herein.)
|
Three Months Ended March 31,
|
||||||||
|
2015
|
2014
|
|||||||
|
Core net interest margin:
|
||||||||
|
FTE net interest margin
|
4.02
|
%
|
4.21
|
%
|
||||
|
Less interest on loans returning to accrual status
|
(0.01
|
)
|
(0.09
|
)
|
||||
|
Core FTE net interest margin
|
4.01
|
%
|
4.12
|
%
|
||||
The Company’s first quarter 2015 average total interest-earning asset yield was 4.17% versus 4.38% in the comparable 2014 quarterly period. A lower average yield on the Company’s loan portfolio in the first quarter of 2015 versus the first quarter of 2014, down 49 basis points to 4.35%, was the primary driver of the reduction in the interest-earning assets yield. The Company’s average balance sheet mix continued to improve as average loans increased by $284 million (26.1%) versus first quarter 2014 and low-yielding overnight interest-bearing deposits and federal funds sold declined by $34 million (56.8%) during the same period. Federal funds sold and interest-bearing deposits represented 1% of average total interest-earning assets in the first quarter of 2015 versus 4% a year ago. The average securities portfolio decreased by $56 million to $359 million in the first quarter of 2015 versus the comparable 2014 period. The average yield on the investment portfolio was 3.81% in the first quarter of 2015 versus 3.76% a year ago.
The Company’s average cost of total interest-bearing liabilities declined by two basis points to 0.27% in the first quarter of 2015 versus 0.29% in the first quarter of 2014. The Company’s total cost of funds, among the lowest in the industry, declined to 0.16% in the first quarter of 2015 from 0.17% a year ago, largely because of the Company’s continued focus on lower-cost core deposits. Average core deposits increased $78 million to $1.4 billion during the first quarter of 2015 versus the comparable 2014 period, with average demand deposits representing 43% of first quarter 2015 average total deposits. Total deposits increased by $68 million or 4.5% to $1.6 billion at March 31, 2015 versus March 31, 2014. Core deposit balances, which represented 86% of total deposits at March 31, 2015, grew by $73 million or 5.7% during the same period. Average borrowings increased $124 million during the first quarter of 2015 compared to 2014 and were used to fund the growth in the Company’s loan portfolio, which increased $284 million on average during that same period.
NET INTEREST INCOME ANALYSIS
For the Three Months Ended March 31, 2015 and 2014
(unaudited, dollars in thousands)
|
2015
|
2014
|
|||||||||||||||||||||||
|
Average
Balance |
Interest
|
Average
Yield/Cost |
Average
Balance |
Interest
|
Average
Yield/Cost |
|||||||||||||||||||
|
Assets:
|
||||||||||||||||||||||||
|
Interest-earning assets:
|
||||||||||||||||||||||||
|
Investment securities (1)
|
$
|
359,413
|
$
|
3,378
|
3.81
|
%
|
$
|
415,385
|
$
|
3,850
|
3.76
|
%
|
||||||||||||
|
Federal Reserve Bank, Federal Home Loan Bank and other stock
|
8,335
|
60
|
2.92
|
2,863
|
38
|
5.38
|
||||||||||||||||||
|
Federal funds sold and interest-bearing deposits
|
26,163
|
23
|
0.36
|
60,551
|
46
|
0.31
|
||||||||||||||||||
|
Loans (2)
|
1,372,365
|
14,711
|
4.35
|
1,088,253
|
12,976
|
4.84
|
||||||||||||||||||
|
Total interest-earning assets
|
1,766,276
|
$
|
18,172
|
4.17
|
%
|
1,567,052
|
$
|
16,910
|
4.38
|
%
|
||||||||||||||
|
Non-interest-earning assets
|
139,127
|
128,434
|
||||||||||||||||||||||
|
Total assets
|
$
|
1,905,403
|
$
|
1,695,486
|
||||||||||||||||||||
|
Liabilities and stockholders' equity:
|
||||||||||||||||||||||||
|
Interest-bearing liabilities:
|
||||||||||||||||||||||||
|
Savings, N.O.W. and money market deposits
|
$
|
688,628
|
$
|
274
|
0.16
|
%
|
$
|
668,941
|
$
|
292
|
0.18
|
%
|
||||||||||||
|
Time deposits
|
215,160
|
294
|
0.55
|
226,191
|
345
|
0.62
|
||||||||||||||||||
|
Total savings and time deposits
|
903,788
|
568
|
0.25
|
895,132
|
637
|
0.29
|
||||||||||||||||||
|
Borrowings
|
124,111
|
108
|
0.35
|
-
|
-
|
-
|
||||||||||||||||||
|
Total interest-bearing liabilities
|
1,027,899
|
676
|
0.27
|
895,132
|
637
|
0.29
|
||||||||||||||||||
|
Demand deposits
|
668,613
|
610,739
|
||||||||||||||||||||||
|
Other liabilities
|
23,949
|
18,423
|
||||||||||||||||||||||
|
Total liabilities
|
1,720,461
|
1,524,294
|
||||||||||||||||||||||
|
Stockholders' equity
|
184,942
|
171,192
|
||||||||||||||||||||||
|
Total liabilities and stockholders' equity
|
$
|
1,905,403
|
$
|
1,695,486
|
||||||||||||||||||||
|
Total cost of funds
|
0.16
|
%
|
0.17
|
%
|
||||||||||||||||||||
|
Net interest rate spread
|
3.90
|
%
|
4.09
|
%
|
||||||||||||||||||||
|
Net interest income/margin
|
17,496
|
4.02
|
%
|
16,273
|
4.21
|
%
|
||||||||||||||||||
|
Less tax-equivalent basis adjustment
|
(979
|
)
|
(975
|
)
|
||||||||||||||||||||
|
Net interest income
|
$
|
16,517
|
$
|
15,298
|
||||||||||||||||||||
(1) Interest on securities includes the effects of tax-equivalent basis adjustments of $837 and $876 in 2015 and 2014, respectively.
(2) Interest on loans includes the effects of tax-equivalent basis adjustments of $142 and $99 in 2015 and 2014, respectively.
The $250 thousand provision for loan losses recorded during the first quarter of 2015 was primarily due to the growth in the loan portfolio experienced during the past three months. The Company also recorded a provision for loan losses of $250 thousand in the first quarter of 2014. The adequacy of the provision and the resulting allowance for loan losses, which was $19.3 million at March 31, 2015, is determined by management’s ongoing review of the loan portfolio, including identification and review of individual problem situations that may affect a borrower’s ability to repay, delinquency and non-performing loan data including the current status of criticized and classified loans, collateral values and changes in the size and mix of the loan portfolio. (See also Critical Accounting Policies, Judgments and Estimates and Asset Quality contained herein.)
Non-interest income declined by $1.0 million or 32.4% in the first quarter of 2015 versus the comparable 2014 period. This reduction was due principally to a $642 thousand pre-tax gain recorded in 2014 on the sale of a closed branch facility coupled with a $279 thousand reduction in fiduciary fee income. Excluding the impact of these two items, non-interest income declined by $80 thousand or 3.7% in 2015. This decline was principally due to a reduction in deposit service charge income resulting from lower overdraft and DDA analysis fees in 2015. Fiduciary fees declined as a result of the Company’s decision to exit the wealth management market during the fourth quarter of 2014 through the sale of its wealth management business. Partially offsetting the foregoing reductions in non-interest income were increases in net gain on the sale of portfolio loans (up $198 thousand) and net gain on the sale of mortgage loans originated for sale (up $51 thousand).
Non-Interest Income
For the quarters ended March 31, 2015 and 2014
(dollars in thousands)
|
Quarters ended March 31,
|
Over/
(under) |
|||||||||||
|
2015
|
2014
|
2014
|
||||||||||
|
Service charges on deposit accounts
|
$
|
747
|
$
|
1,003
|
(25.5
|
)%
|
||||||
|
Other service charges, commissions and fees
|
593
|
679
|
(12.7
|
)
|
||||||||
|
Fiduciary fees
|
-
|
279
|
(100.0
|
)
|
||||||||
|
Net gain on sale of securities available for sale
|
26
|
-
|
N/M
|
(1)
|
||||||||
|
Net gain on sale of portfolio loans
|
198
|
-
|
N/M
|
(1)
|
||||||||
|
Net gain on sale of mortgage loans originated for sale
|
144
|
93
|
54.8
|
|||||||||
|
Net gain on sale of premises and equipment
|
-
|
642
|
(100.0
|
)
|
||||||||
|
Income from bank owned life insurance
|
309
|
354
|
(12.7
|
)
|
||||||||
|
Other operating income
|
74
|
42
|
76.2
|
|||||||||
|
Total non-interest income
|
$
|
2,091
|
$
|
3,092
|
(32.4
|
)%
|
||||||
(1) N/M - denotes % variance not meaningful for statistical purposes.
The $201 thousand reduction in total operating expenses in the first quarter of 2015 versus 2014 was principally the result of a $255 thousand (2.9%) reduction in compensation and benefits expense and a $213 thousand (38.7%) reduction in consulting and professional fees. Excluding a $170 thousand expense credit recorded in the first quarter of 2014 related to branch closures, total operating expenses declined by $371 thousand or 2.8% in the first quarter of 2015 versus the comparable 2014 period.
The Company’s core operating efficiency ratio improved to 66.4% in the first quarter of 2015 from 72.5% a year ago. The core operating efficiency ratio is calculated by making certain adjustments to the operating efficiency ratio calculation. The core operating efficiency ratio is not required by U.S. GAAP or by applicable bank regulatory requirements, but is a metric used by management to evaluate core operating efficiency. Since there is no authoritative requirement to calculate this ratio, our ratio is not necessarily comparable to similar efficiency measures disclosed or used by other companies in the financial services industry. The core operating efficiency ratio is a non-GAAP financial measure and should be considered in addition to, not as a substitute for or superior to, financial measures determined in accordance with U.S. GAAP. The calculation of the core operating efficiency ratio, the reconciliation of core operating expenses to U.S. GAAP total operating expenses, core non-interest income to U.S. GAAP total non-interest income and core FTE net interest income to FTE net interest income are provided elsewhere herein. (See also Non-GAAP Disclosure contained herein.)
Operating Expenses
For the quarters ended March 31, 2015 and 2014
(dollars in thousands)
|
Quarters ended March 31,
|
Over/
(under)
|
|||||||||||
|
2015
|
2014
|
2014
|
||||||||||
|
Employee compensation and benefits
|
$
|
8,606
|
$
|
8,861
|
(2.9
|
)%
|
||||||
|
Occupancy expense
|
1,462
|
1,435
|
1.9
|
|||||||||
|
Equipment expense
|
385
|
449
|
(14.3
|
)
|
||||||||
|
Consulting and professional services
|
338
|
551
|
(38.7
|
)
|
||||||||
|
FDIC assessment
|
290
|
267
|
8.6
|
|||||||||
|
Data processing
|
570
|
573
|
(0.5
|
)
|
||||||||
|
Branch consolidation costs (credits)
|
-
|
(170
|
)
|
(100.0
|
)
|
|||||||
|
Other operating expenses
|
1,457
|
1,343
|
8.5
|
|||||||||
|
Total operating expenses
|
$
|
13,108
|
$
|
13,309
|
(1.5
|
)%
|
||||||
The Company recorded income tax expense of $1.2 million in the first quarter of 2015 resulting in an effective tax rate of 23.6% versus an income tax expense of $1.1 million and an effective tax rate of 23.0% in the comparable period a year ago.
Asset Quality - Non-accrual loans totaled $12.3 million or 0.89% of loans outstanding at March 31, 2015 versus $13.0 million or 0.96% of total loans outstanding at December 31, 2014 and $14.1 million or 1.24% of loans outstanding at March 31, 2014. The allowance for loan losses as a percentage of total non-accrual loans amounted to 157%, 148% and 126% at March 31, 2015, December 31, 2014 and March 31, 2014, respectively.
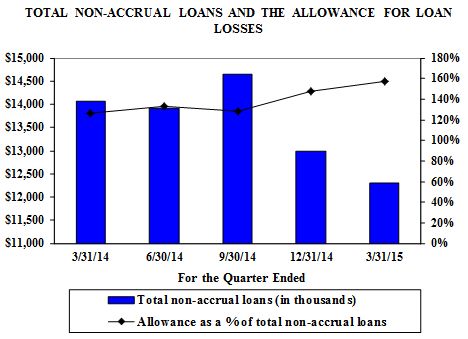
The Company had no loans 90 days or more past due and still accruing at any of the reported dates. Total loans 30 - 89 days past due and accruing amounted to $1.1 million or 0.08% of loans outstanding at March 31, 2015 as compared to $1.4 million or 0.10% of loans outstanding at December 31, 2014 and $3.8 million or 0.33% of loans outstanding at March 31, 2014. The Company held no OREO during any of the reported periods.
Total criticized and classified loans were $44 million at March 31, 2015 versus $40 million at December 31, 2014 and March 31, 2014. Criticized loans are those loans that are not classified but require some degree of heightened monitoring. Classified loans were $25 million at March 31, 2015 as compared to $30 million at December 31, 2014 and $33 million at March 31, 2014. The allowance for loan losses as a percentage of total classified loans was 77%, 64% and 53%, respectively, at the same dates.
At March 31, 2015, the Company had $19 million in TDRs, primarily consisting of commercial and industrial loans, commercial real estate loans and residential mortgages totaling $3 million, $10 million and $4 million, respectively. The Company had TDRs amounting to $20 million at December 31, 2014 and $16 million at March 31, 2014.
The Company recorded net loan charge-offs of $125 thousand in the first quarter of 2015 versus net loan recoveries of $150 thousand in the fourth quarter of 2014 and net loan recoveries of $224 thousand in the first quarter of 2014. As a percentage of average total loans outstanding, these net amounts represented, on an annualized basis, 0.04% for the first quarter of 2015, (0.05%) for the fourth quarter of 2014 and (0.08%) for the first quarter of 2014.
At March 31, 2015, the Company’s allowance for loan losses amounted to $19.3 million or 1.40% of period-end loans outstanding. The allowance as a percentage of loans outstanding was 1.42% and 1.57% at December 31, 2014 and March 31, 2014, respectively.
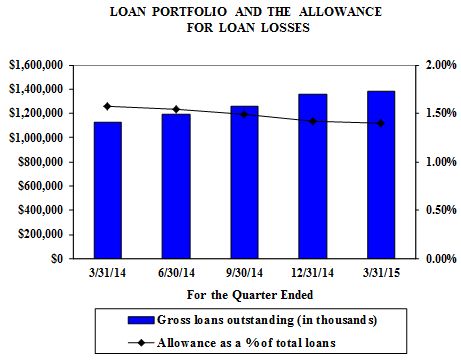
The $250 thousand provision for loan losses recorded during the first quarter of 2015 was due to the growth in the loan portfolio experienced during the past three months. The Company also recorded a provision for loan losses of $250 thousand in the first quarter of 2014.
For the three months ended March 31, 2015, the ending balance of the Company’s allowance for loan losses increased by $125 thousand when compared to December 31, 2014. During the first quarter of 2015, the Company increased its allowance for loan losses allocated to commercial and industrial (“C&I”), commercial real estate (“CRE”) and multifamily loans by $438 thousand, $575 thousand and $449 thousand, respectively.
The increase in the allowance for loan losses allocated to C&I loans was primarily due to an increase of 0.16% versus December 31, 2014, in the average combined historical loss and environmental factors rates on unimpaired pass rated C&I loans, partially offset by a decrease of $2 million in the balance of such unimpaired pass rated loans. The increases in the allowance for loan losses allocated to multifamily and CRE loans during the first three months of 2015 largely reflected increases of $13 million and $17 million, respectively, in the balances of unimpaired pass rated multifamily and CRE loans.
The loss factors rates incorporate a rolling twelve quarter look back period used in calculating historical losses for each loan segment. In an effort to more accurately represent the Company’s incurred and expected losses by individual loan segment, a twelve quarter period is used to improve the granularity of individual loan segment charge-off history and reduce the volatility associated with improperly weighting short-term trends in the calculation.
At March 31, 2015, the Company’s allowance for loan losses included an unallocated portion totaling $1.4 million. For the three months ended March 31, 2015, the ending balance of the Company’s unallocated portion of the allowance for loan losses decreased $925 thousand versus December 31, 2014. Loan portfolio growth was 2.0% during the first quarter of 2015, primarily in multifamily and CRE loans. Loan growth, including multifamily loans, is expected to continue throughout 2015. An unallocated portion of the reserve is considered a prudent option until these loans to new borrowers establish longer-term payment patterns.
Management has determined that the current level of the allowance for loan losses is adequate in relation to the probable inherent losses present in the portfolio. Management considers many factors in this analysis, among them credit risk grades, delinquency trends, concentrations within segments of the loan portfolio, recent charge-off experience, local and national economic conditions, current real estate market conditions in geographic areas where the Company’s loans are located, changes in the trend of non-performing loans, changes in interest rates and loan portfolio growth. Changes in one or a combination of these factors may adversely affect the Company’s loan portfolio resulting in increased delinquencies, loan losses and future levels of loan loss provisions. Due to these uncertainties, management expects to record loan charge-offs in future periods. (See also Critical Accounting Policies, Judgments and Estimates contained herein.)
ANALYSIS OF NON-PERFORMING ASSETS
AND THE ALLOWANCE FOR LOAN LOSSES
March 31, 2015 versus December 31, 2014 and March 31, 2014
(dollars in thousands)
NON-PERFORMING ASSETS BY TYPE:
|
At
|
||||||||||||
|
3/31/2015
|
12/31/2014
|
3/31/2014
|
||||||||||
|
Non-accrual loans
|
$
|
12,292
|
$
|
12,981
|
$
|
14,059
|
||||||
|
Non-accrual loans held for sale
|
-
|
-
|
-
|
|||||||||
|
Loans 90 days or more past due and still accruing
|
-
|
-
|
-
|
|||||||||
|
OREO
|
-
|
-
|
-
|
|||||||||
|
Total non-performing assets
|
$
|
12,292
|
$
|
12,981
|
$
|
14,059
|
||||||
|
Gross loans outstanding
|
$
|
1,382,160
|
$
|
1,355,427
|
$
|
1,129,818
|
||||||
|
Total loans held for sale
|
$
|
2,836
|
$
|
26,495
|
$
|
190
|
||||||
ANALYSIS OF THE ALLOWANCE FOR LOAN LOSSES:
|
Quarter Ended
|
||||||||||||
|
3/31/2015
|
12/31/2014
|
3/31/2014
|
||||||||||
|
Beginning balance
|
$
|
19,200
|
$
|
18,800
|
$
|
17,263
|
||||||
|
Provision
|
250
|
250
|
250
|
|||||||||
|
Charge-offs
|
(493
|
)
|
(22
|
)
|
(117
|
)
|
||||||
|
Recoveries
|
368
|
172
|
341
|
|||||||||
|
Ending balance
|
$
|
19,325
|
$
|
19,200
|
$
|
17,737
|
||||||
KEY RATIOS:
|
At
|
||||||||||||
|
3/31/2015
|
12/31/2014
|
3/31/2014
|
||||||||||
|
Allowance as a % of total loans (1)
|
1.40
|
%
|
1.42
|
%
|
1.57
|
%
|
||||||
|
Non-accrual loans as a % of total loans (1)
|
0.89
|
%
|
0.96
|
%
|
1.24
|
%
|
||||||
|
Non-performing assets as a % of total loans, loans held for sale and OREO
|
0.89
|
%
|
0.94
|
%
|
1.24
|
%
|
||||||
|
Allowance for loan losses as a % of non-accrual loans (1)
|
157
|
%
|
148
|
%
|
126
|
%
|
||||||
|
Allowance for loan losses as a % of non-accrual loans and loans 90 days or more past due and still accruing (1)
|
157
|
%
|
148
|
%
|
126
|
%
|
||||||
(1) Excludes loans held for sale.
The Company originates and invests in interest-earning assets and solicits interest-bearing deposit accounts. The Company’s operations are subject to market risk resulting from fluctuations in interest rates to the extent that there is a difference between the amounts of interest-earning assets and interest-bearing liabilities that are prepaid, withdrawn, mature, or repriced in any given period of time. The Company’s earnings or the net value of its portfolio will change under different interest rate scenarios. The principal objective of the Company’s asset/liability management program is to maximize net interest income within an acceptable range of overall risk, including both the effect of changes in interest rates and liquidity risk. The Company’s assessment of market risk at March 31, 2015 indicated there were no material changes in the quantitative and qualitative disclosures from those in the Company’s Annual Report on Form 10-K for the year ended December 31, 2014.
Evaluation of Disclosure Controls and Procedures
The Company carried out an evaluation, under the supervision and with the participation of its principal executive officer and principal financial officer, of the effectiveness of the design and operation of its disclosure controls and procedures as defined in Rule 13a-15(e) and Rule 15d-15(e) under the Securities Exchange Act of 1934, as amended (“Exchange Act”), as of the end of the period covered by this report.
Based on this evaluation, the Company’s principal executive officer and principal financial officer concluded that, as of March 31, 2015, the Company’s disclosure controls and procedures are designed at a reasonable assurance level and are effective to provide reasonable assurance that information required to be disclosed by the Company in reports that it files or submits under the Exchange Act is (i) recorded, processed, summarized and reported within the time periods specified in the Securities and Exchange Commission’s rules and forms and (ii) accumulated and communicated to the Company’s management, including the Company’s principal executive officer and principal financial officer, as appropriate, to allow timely decisions regarding required disclosure. There have been no changes in the Company’s internal controls or in other factors that have materially affected, or are reasonably likely to materially affect, internal controls subsequent to the date the Company carried out its evaluation.
Changes in Internal Control Over Financial Reporting
There were no changes to the Company’s internal control over financial reporting as defined in Rule 13a-15(f) and Rule 15d-15(f) under the Exchange Act that occurred in the first quarter of 2015 that have materially affected, or are reasonably likely to materially affect, the Company’s internal control over financial reporting.
Limitations on Effectiveness of Controls and Procedures
In designing and evaluating the disclosure controls and procedures, the Company’s management recognizes that any controls and procedures, no matter how well designed and operated, can provide only reasonable assurance of achieving the desired control objectives. In addition, the design of disclosure controls and procedures must reflect the fact that there are resource constraints and that the Company’s management is required to apply its judgment in evaluating the benefits of possible controls and procedures relative to their costs.
PART II
See the information set forth in Note 10—Legal Proceedings in the Notes to Unaudited Condensed Consolidated Financial Statements under Part I, Item I, which information is incorporated by reference in response to this item.
There are no material changes from the risks disclosed in the Risk Factors section of our Annual Report on Form 10-K for the year ended December 31, 2014, except as discussed below.
The Company’s loan portfolio has a high concentration of commercial real estate loans (exclusive of multifamily and mixed use commercial loans) and its business may be adversely affected by credit risk associated with commercial real estate and a decline in property values.
At March 31, 2015, $580 million, or 42% of the Company’s total gross loan portfolio, was comprised of commercial real estate (exclusive of multifamily and mixed use commercial loans). This type of lending is generally sensitive to regional and local economic conditions that significantly impact the ability of borrowers to meet their loan payment obligations, making loss levels difficult to predict. Although real estate prices have shown signs of improvement, a decline in real estate values may reduce the value of the real estate collateral securing these types of loans and increase the risk that the Company would incur losses if borrowers default on their loans.
Not applicable.
Not applicable.
Not applicable.
Not applicable.
|
31.1
|
Certification of principal executive officer pursuant to Rule 13a-14(a) or 15d-14(a) of the Securities Exchange Act of 1934, as adopted pursuant to Section 302 of the Sarbanes-Oxley Act of 2002
|
|
31.2
|
Certification of principal financial officer pursuant to Rule 13a-14(a) or 15d-14(a) of the Securities Exchange Act of 1934, as adopted pursuant to Section 302 of the Sarbanes-Oxley Act of 2002
|
|
32.1
|
Certification of principal executive officer pursuant to 18 U.S.C. Section 1350, as adopted pursuant to Section 906 of the Sarbanes-Oxley Act of 2002
|
|
32.2
|
Certification of principal financial officer pursuant to 18 U.S.C. Section 1350, as adopted pursuant to Section 906 of the Sarbanes-Oxley Act of 2002
|
|
101.INS
|
XBRL Instance Document
|
|
101.SCH
|
XBRL Taxonomy Extension Schema Document
|
|
101.CAL
|
XBRL Taxonomy Extension Calculation Linkbase Document
|
|
101.LAB
|
XBRL Taxonomy Extension Label Linkbase Document
|
|
101.PRE
|
XBRL Taxonomy Extension Presentation Linkbase Document
|
|
101.DEF
|
XBRL Taxonomy Extension Definition Linkbase Document
|
Pursuant to the requirements of the Securities Exchange Act of 1934, the Registrant has duly caused this report to be signed on its behalf by the undersigned, thereunto duly authorized.
| SUFFOLK BANCORP | |
|
Date: April 30, 2015
|
/s/ Howard C. Bluver
|
|
Howard C. Bluver
|
|
|
President & Chief Executive Officer
|
|
|
(principal executive officer)
|
|
|
Date: April 30, 2015
|
/s/ Brian K. Finneran
|
|
Brian K. Finneran
|
|
|
Executive Vice President & Chief Financial Officer
|
|
|
(principal financial and accounting officer)
|
|
EXHIBIT INDEX
|
Exhibit
Number
|
Description
|
|
Certification of principal executive officer pursuant to Rule 13a-14(a) or 15d-14(a) of the Securities Exchange Act of 1934, as adopted pursuant to Section 302 of the Sarbanes-Oxley Act of 2002
|
|
|
Certification of principal financial officer pursuant to Rule 13a-14(a) or 15d-14(a) of the Securities Exchange Act of 1934, as adopted pursuant to Section 302 of the Sarbanes-Oxley Act of 2002
|
|
|
Certification of principal executive officer pursuant to 18 U.S.C. Section 1350, as adopted pursuant to Section 906 of the Sarbanes-Oxley Act of 2002
|
|
|
Certification of principal financial officer pursuant to 18 U.S.C. Section 1350, as adopted pursuant to Section 906 of the Sarbanes-Oxley Act of 2002
|
|
|
101.INS
|
XBRL Instance Document
|
|
101.SCH
|
XBRL Taxonomy Extension Schema Document
|
|
101.CAL
|
XBRL Taxonomy Extension Calculation Linkbase Document
|
|
101.LAB
|
XBRL Taxonomy Extension Label Linkbase Document
|
|
101.PRE
|
XBRL Taxonomy Extension Presentation Linkbase Document
|
|
101.DEF
|
XBRL Taxonomy Extension Definition Linkbase Document
|
44