Attached files
| file | filename |
|---|---|
| EX-99.1 - EX-99.1 - Williams Industrial Services Group Inc. | a17-8357_1ex99d1.htm |
| EX-10.1 - EX-10.1 - Williams Industrial Services Group Inc. | a17-8357_1ex10d1.htm |
| 8-K - 8-K - Williams Industrial Services Group Inc. | a17-8357_18k.htm |
Exhibit 99.2
March 16, 2017 2015 Results with Restated Prior Periods Terence J. Cryan President and CEO Craig E. Holmes Senior Vice President of Finance
Forward-Looking Statements 1 This presentation contains “forward-looking statements” within the meaning of the term set forth in the Private Securities Litigation Reform Act of 1995. The forward-looking statements include statements or expectations regarding all 2016 and future expectations regarding among other things, the preliminary estimates for the Company’s 2016 revenue, adjusted EBITDA, backlog, liquidity, customer relationships, the timing and the Company’s ability to prepare and file its 2016 SEC reports, regain SEC reporting compliance, identify new sources of debt financing, and related matters. These statements reflect the Company’s current views of future events and financial performance and are subject to a number of risks and uncertainties. The Company’s actual results, performance or achievements may differ materially from those expressed or implied in the forward-looking statements. For example, even if the Company extends the maturity date of the Credit Agreement beyond May 15th 2017, it may not be able to access additional borrowing or generate sufficient cash from operations to fund its ongoing business, which could have a material adverse effect on the Company’s business and future prospects. Additional risks and uncertainties that could cause or contribute to such material differences include, but are not limited to, decreased demand for new gas turbine power plants, reduced demand for, or increased regulation of, nuclear power, loss or bankruptcy of any of the Company’s major customers, whether pursuant to the loss of pending or future bids for either new business or an extension of existing business, termination of customer or vendor relationships, contraction of the Company’s trade terms with vendors, delay by customers in the payment of accounts receivable, cost increases and project cost overruns, unforeseen schedule delays, poor performance by the Company’s subcontractors, cancellation of projects, competition for the sale of our products and services, including competitors being awarded business by our customers that had previously been provided by Global Power, shortages in, or increases in prices for, energy and materials such as steel that the Company uses to manufacture our products, damage to our reputation, warranty or product liability claims, increased exposure to environmental or other liabilities, failure to comply with various laws and regulations, failure to attract and retain highly-qualified personnel, loss of customer relationships with critical personnel, effective integration of acquisitions, volatility of our stock price, deterioration or uncertainty of credit markets, changes in the economic, social and political conditions in the United States and other countries in which we operate, including fluctuations in foreign currency exchange rates, the banking environment or monetary policy, and the factors set forth herein under the caption “Cautionary Note Regarding Preliminary Estimates.” Other important factors that may cause actual results to differ materially from those expressed in the forward-looking statements are discussed in our filings with the SEC, including the sections of the 2015 10-K titled “Risk Factors”, “Management’s Discussion and Analysis of Financial Condition“, “Results of Operation – Liquidity and Capital Resources” and “Commitments and Contingencies” footnote. Any forward-looking statement speaks only as of the date of this presentation. Except as may be required by applicable law, the Company undertakes no obligation to publicly update or revise any forward-looking statements, whether as a result of new information, future events or otherwise, and investors are cautioned not to rely upon them unduly.
Forward-Looking Statements 2 Cautionary Note Regarding Preliminary Estimates All statements in this presentation regarding the Company’s preliminary 2016 financial results, including its revenue, Adjusted EBITDA and backlog are forward-looking statements based on the Company’s initial review of its 2016 financial results. Due to emphasis on the prior-period restatements, the Company has not yet completed its typical quarter- and year-end closing and review processes for any 2016 periods. The completion of such procedures, final adjustments, and other developments arising between the date of this presentation and the time that the Company’s 2016 financial results are issued may cause actual results to differ materially from the estimates set forth above. The Company’s independent registered public accounting firm has not audited or reviewed the preliminary 2016 estimates. In addition, the Company previously disclosed that its internal controls over financial reporting were not effective as of December 31, 2015, due to the material weaknesses described in the 2015 10-K, and those material weaknesses have not been remediated as of the date of this presentation. The material weaknesses in the Company’s internal controls significantly increase the risk that the preliminary 2016 information provided herein may need to change. For additional information about the Company’s internal control over financial reporting, see the 2015 10-K. In light of the foregoing, there is significant risk that actual 2016 financial results may differ materially from the preliminary estimates contained in this presentation. Investors are cautioned not to place undue reliance on the foregoing guidance. The preliminary information contained in this presentation should not be viewed as a substitute for full financial statements prepared in accordance with generally accepted accounting principles and is not necessarily indicative of the results to be achieved for any periods.
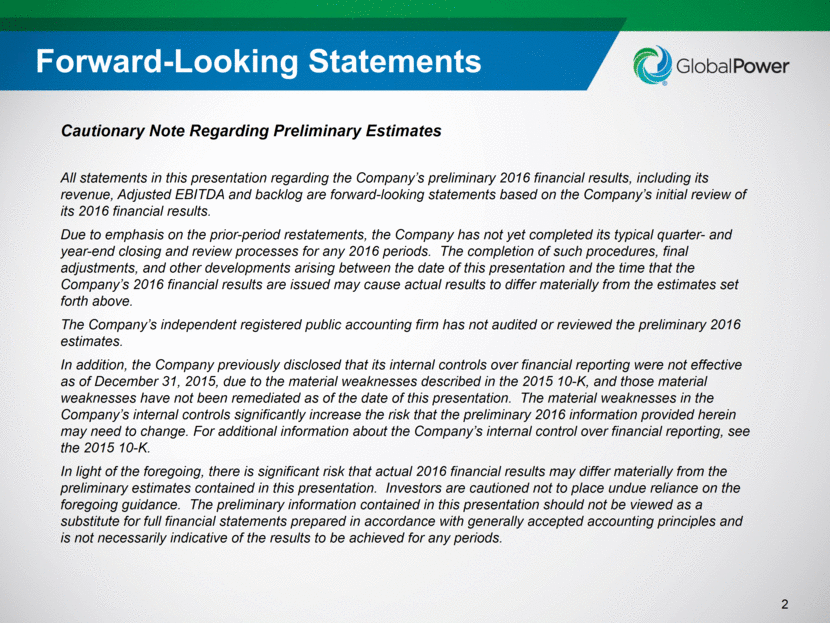
Restatement Process Overview 3 Conversion to percentage-of-completion accounting in Mechanical Solutions segment and revenue adjusted for contractual liquidated damages Virtually all revenue and COGS transactions over past 4 years were recalculated and restated Completed contract revenue recognition errors corrected in Electrical Solutions segment Job cost capitalization, estimation and expensing errors corrected Warranty reserves corrected for proper accounting interpretations Goodwill adjusted for incorrect treatment related to a 2011 divestiture Other various adjustments, including recalculation of interest expense with a higher rate based on restated results and applicable tiers Timeline Adjustments Date Event May 2015 Announced previously reported financials for 2014 to be restated October 2015 Announced 2013 also required restatement January 2016 Special Committee finds no evidence of fraud or intentional misconduct in connection with the preparation of the financial information; 2012 and prior period financial statements not to be relied upon March 2016 Delayed reporting triggers NYSE delisting; new auditors retained February 2017 Determination to report as three business segments 2015 - Present Obtained temporary waivers from lenders
Operational Enhancements 4 Added five new independent directors to Board Appointed new executive leadership New business unit leaders Focus on customer service, accountability, responsiveness, productivity and profitability Upgraded financial talent Implementing improved reporting structure, financial policies, procedures, internal controls and training Restructuring operations Eliminated over 1,000 positions during 2016; approximately 1,600 personnel employed at the end of 2016 Sold non-core assets Closed certain facilities – streamlined operations or outsourced Vacated under-utilized leased space in Oxford, MA Consolidated under-utilized warehouse and office space at Tulsa, OK operations Ceased manufacturing operations at Mexico facility Ceased manufacturing operations in Chattanooga Changes Accomplished
Progress in Commercial Markets 5 Working to win back customers Progress with OEM relationships within Mechanical Solutions Improved relations with key Electrical Solutions customers Focused on basic operational and sales improvement Weekly project reviews: identify issues early with time to repair Clear understanding of costs resulting in improved estimating and gross margins Reorganized to improve competitive position Leverage success of Braden Europe with key OEM customers Build out aftermarket effort in Mechanical Solutions to reduce customer concentration and gain exposure to large, legacy installed base of Braden Reestablishing customer relationships and gaining new customers Mechanical Solutions has 9 to 12 month order-to-delivery cycle: Backlog growth will take time Have begun to win some orders for higher value products in U.S. Continue to provide excellent customer service and serve leading OEMs in Europe Macro factors underlying the energy and industrial markets we serve continue to support expectation of increasing future opportunities Natural gas positioned to be fuel of choice Increased infrastructure spending in key end markets should enable us to leverage improved capabilities and grow our business
Strategy 6 Continue to leverage strong brands Diversify customer base Enhance sales execution and customer retention processes Increase margins through application of lean manufacturing processes and continuous improvement Streamline and consolidate operations Utilize state-of-the-art estimating and engineering technologies Deploy rigorous project management techniques Initiate various process improvement projects Employ experienced industry-recognized sales professionals Improve quality and on-time delivery Streamline selling and administrative functions Retain and augment talent Become an employer of choice Operational Excellence and Customer-centric Focus
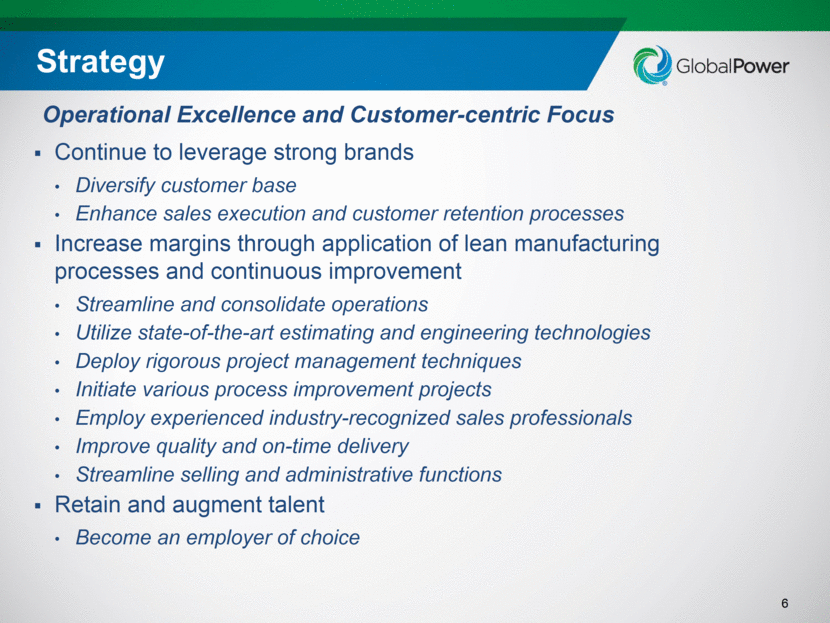
($ in millions) 7 2015 vs 2014 Financial Summary Mechanical Solutions Low order volume from two major OEM customers Unfavorable FX move of $5.4 million $3.9 million in contractual liquidated damages, up $2.7 million Electrical Solutions Augmented by $13.4 million of acquired revenue of eHouse Greater throughput capacity supported growth Services $74.4 million related to new-build nuclear site and other non-recurring projects Non-renewal of a maintenance and modification contract had negative $19.0 million impact
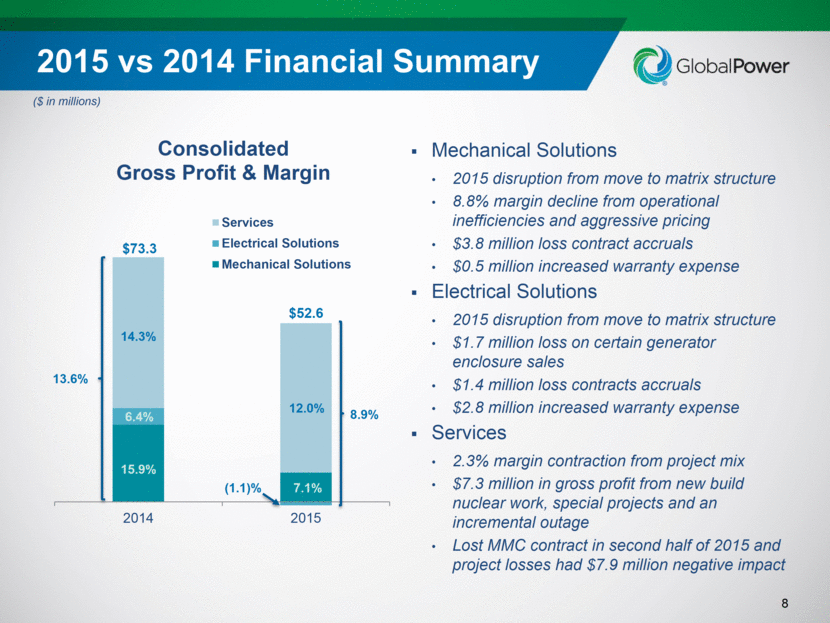
($ in millions) 8 2015 vs 2014 Financial Summary Mechanical Solutions 2015 disruption from move to matrix structure 8.8% margin decline from operational inefficiencies and aggressive pricing $3.8 million loss contract accruals $0.5 million increased warranty expense Electrical Solutions 2015 disruption from move to matrix structure $1.7 million loss on certain generator enclosure sales $1.4 million loss contracts accruals $2.8 million increased warranty expense Services 2.3% margin contraction from project mix $7.3 million in gross profit from new build nuclear work, special projects and an incremental outage Lost MMC contract in second half of 2015 and project losses had $7.9 million negative impact 13.6%
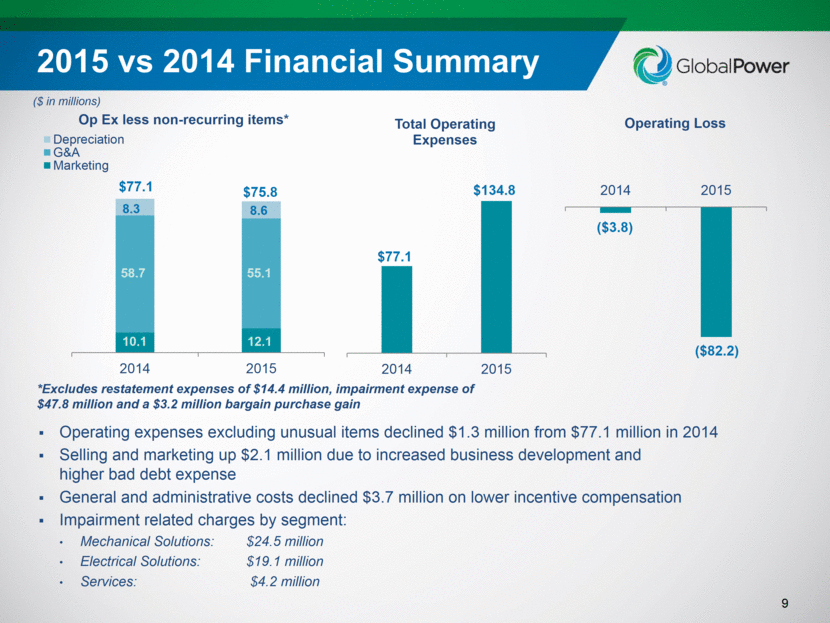
($ in millions) 9 2015 vs 2014 Financial Summary Operating expenses excluding unusual items declined $1.3 million from $77.1 million in 2014 Selling and marketing up $2.1 million due to increased business development and higher bad debt expense General and administrative costs declined $3.7 million on lower incentive compensation Impairment related charges by segment: Mechanical Solutions: $24.5 million Electrical Solutions: $19.1 million Services: $4.2 million *Excludes restatement expenses of $14.4 million, impairment expense of $47.8 million and a $3.2 million bargain purchase gain
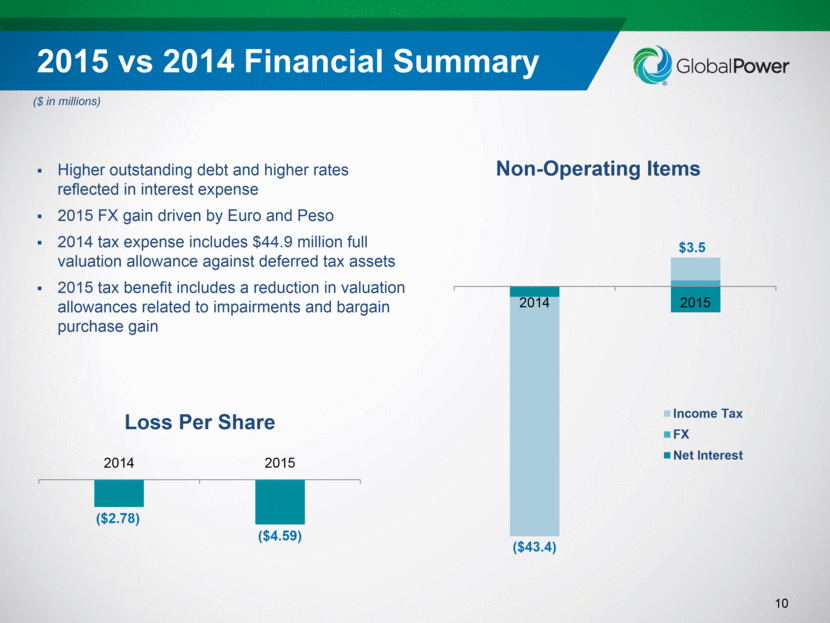
($ in millions) 10 2015 vs 2014 Financial Summary Higher outstanding debt and higher rates reflected in interest expense 2015 FX gain driven by Euro and Peso 2014 tax expense includes $44.9 million full valuation allowance against deferred tax assets 2015 tax benefit includes a reduction in valuation allowances related to impairments and bargain purchase gain
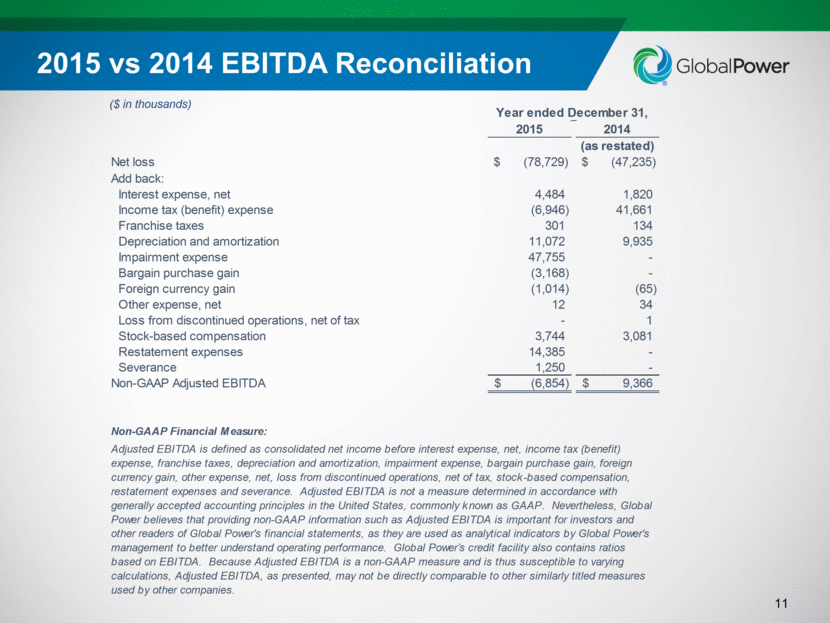
($ in thousands) 11 2015 vs 2014 EBITDA Reconciliation 2015 2014 (as restated) Net loss $ (78,729) $ (47,235) Add back: Interest expense, net 4,484 1,820 Income tax (benefit) expense (6,946) 41,661 Franchise taxes 301 134 Depreciation and amortization 11,072 9,935 Impairment expense 47,755 - Bargain purchase gain (3,168) - Foreign currency gain (1,014) (65) Other expense, net 12 34 Loss from discontinued operations, net of tax - 1 Stock-based compensation 3,744 3,081 Restatement expenses 14,385 - Severance 1,250 - Non-GAAP Adjusted EBITDA (6,854) $ 9,366 $ Non-GAAP Financial Measure: Year ended December 31, Adjusted EBITDA is defined as consolidated net income before interest expense, net, income tax (benefit) expense, franchise taxes, depreciation and amortization, impairment expense, bargain purchase gain, foreign currency gain, other expense, net, loss from discontinued operations, net of tax, stock-based compensation, restatement expenses and severance. Adjusted EBITDA is not a measure determined in accordance with generally accepted accounting principles in the United States, commonly known as GAAP. Nevertheless, Global Power believes that providing non-GAAP information such as Adjusted EBITDA is important for investors and other readers of Global Power's financial statements, as they are used as analytical indicators by Global Power's management to better understand operating performance. Global Power’s credit facility also contains ratios based on EBITDA. Because Adjusted EBITDA is a non-GAAP measure and is thus susceptible to varying calculations, Adjusted EBITDA, as presented, may not be directly comparable to other similarly titled measures used by other companies.
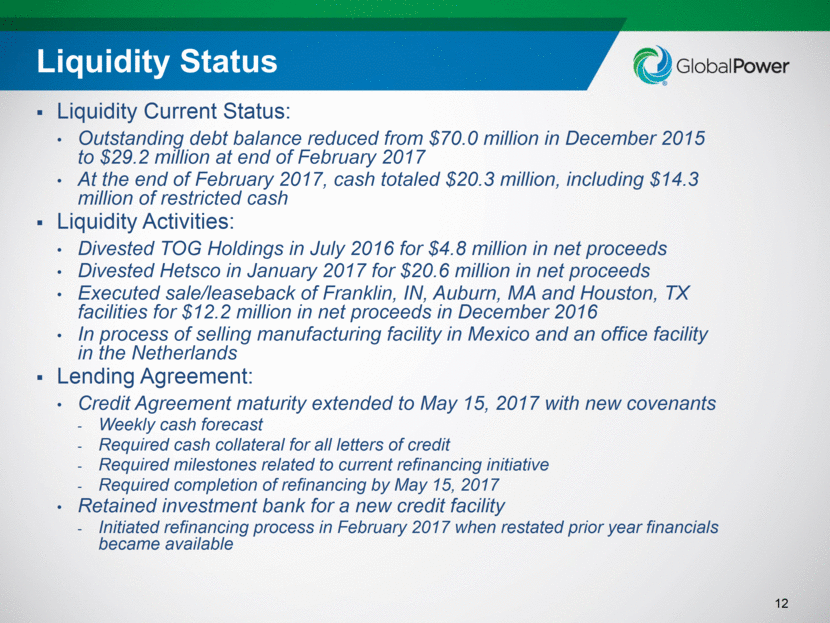
Liquidity Status 12 Liquidity Current Status: Outstanding debt balance reduced from $70.0 million in December 2015 to $29.2 million at end of February 2017 At the end of February 2017, cash totaled $20.3 million, including $14.3 million of restricted cash Liquidity Activities: Divested TOG Holdings in July 2016 for $4.8 million in net proceeds Divested Hetsco in January 2017 for $20.6 million in net proceeds Executed sale/leaseback of Franklin, IN, Auburn, MA and Houston, TX facilities for $12.2 million in net proceeds in December 2016 In process of selling manufacturing facility in Mexico and an office facility in the Netherlands Lending Agreement: Credit Agreement maturity extended to May 15, 2017 with new covenants Weekly cash forecast Required cash collateral for all letters of credit Required milestones related to current refinancing initiative Required completion of refinancing by May 15, 2017 Retained investment bank for a new credit facility Initiated refinancing process in February 2017 when restated prior year financials became available
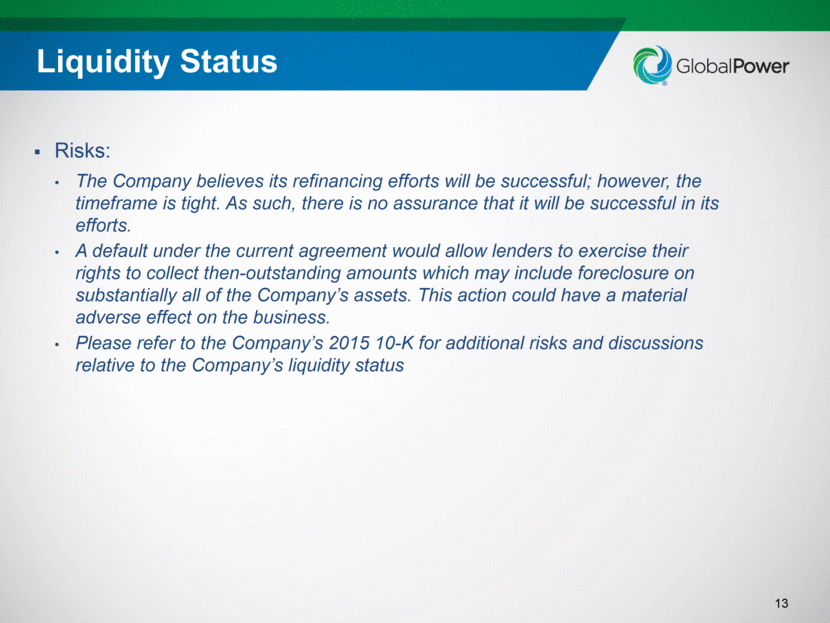
Liquidity Status 13 Risks: The Company believes its refinancing efforts will be successful; however, the timeframe is tight. As such, there is no assurance that it will be successful in its efforts. A default under the current agreement would allow lenders to exercise their rights to collect then-outstanding amounts which may include foreclosure on substantially all of the Company’s assets. This action could have a material adverse effect on the business. Please refer to the Company’s 2015 10-K for additional risks and discussions relative to the Company’s liquidity status
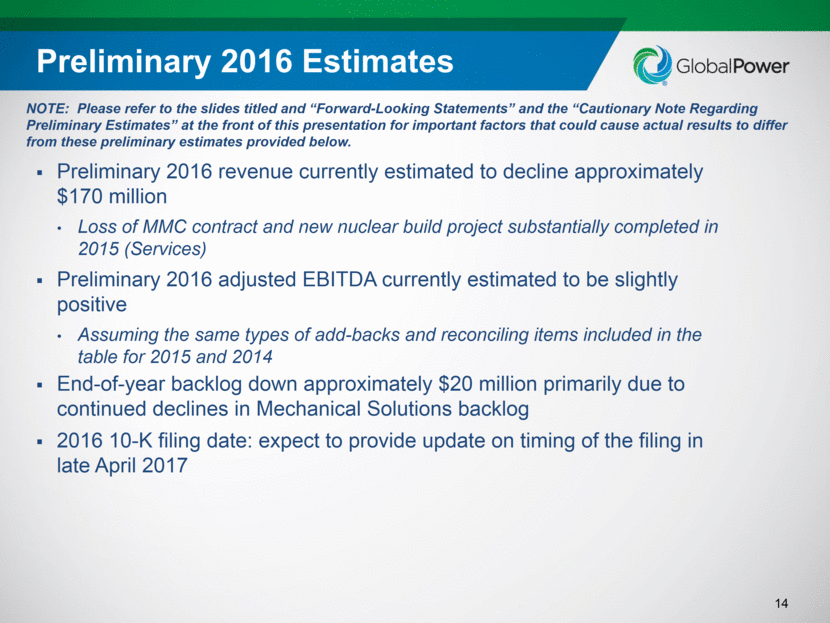
Preliminary 2016 Estimates 14 Preliminary 2016 revenue currently estimated to decline approximately $170 million Loss of MMC contract and new nuclear build project substantially completed in 2015 (Services) Preliminary 2016 adjusted EBITDA currently estimated to be slightly positive Assuming the same types of add-backs and reconciling items included in the table for 2015 and 2014 End-of-year backlog down approximately $20 million primarily due to continued declines in Mechanical Solutions backlog 2016 10-K filing date: expect to provide update on timing of the filing in late April 2017 NOTE: Please refer to the slides titled and “Forward-Looking Statements” and the “Cautionary Note Regarding Preliminary Estimates” at the front of this presentation for important factors that could cause actual results to differ from these preliminary estimates provided below.
Supplemental Information 15
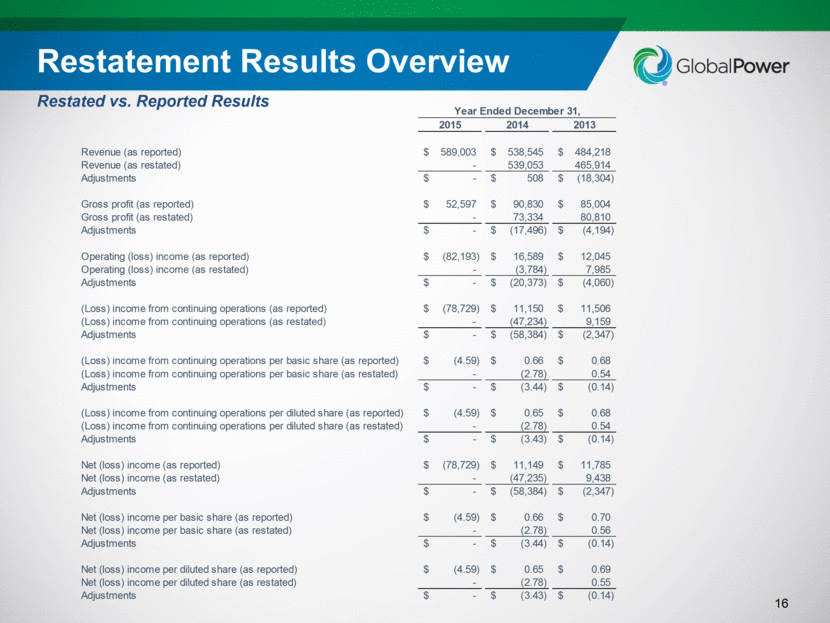
Restatement Results Overview 16 Restated vs. Reported Results 2015 2014 2013 Revenue (as reported) 589,003 $ 538,545 $ 484,218 $ Revenue (as restated) - 539,053 465,914 Adjustments - $ 508 $ (18,304) $ Gross profit (as reported) 52,597 $ 90,830 $ 85,004 $ Gross profit (as restated) - 73,334 80,810 Adjustments - $ (17,496) $ (4,194) $ Operating (loss) income (as reported) (82,193) $ 16,589 $ 12,045 $ Operating (loss) income (as restated) - (3,784) 7,985 Adjustments - $ (20,373) $ (4,060) $ (Loss) income from continuing operations (as reported) (78,729) $ 11,150 $ 11,506 $ (Loss) income from continuing operations (as restated) - (47,234) 9,159 Adjustments - $ (58,384) $ (2,347) $ (Loss) income from continuing operations per basic share (as reported) (4.59) $ 0.66 $ 0.68 $ (Loss) income from continuing operations per basic share (as restated) - (2.78) 0.54 Adjustments - $ (3.44) $ (0.14) $ (Loss) income from continuing operations per diluted share (as reported) (4.59) $ 0.65 $ 0.68 $ (Loss) income from continuing operations per diluted share (as restated) - (2.78) 0.54 Adjustments - $ (3.43) $ (0.14) $ Net (loss) income (as reported) (78,729) $ 11,149 $ 11,785 $ Net (loss) income (as restated) - (47,235) 9,438 Adjustments - $ (58,384) $ (2,347) $ Net (loss) income per basic share (as reported) (4.59) $ 0.66 $ 0.70 $ Net (loss) income per basic share (as restated) - (2.78) 0.56 Adjustments - $ (3.44) $ (0.14) $ Net (loss) income per diluted share (as reported) (4.59) $ 0.65 $ 0.69 $ Net (loss) income per diluted share (as restated) - (2.78) 0.55 Adjustments - $ (3.43) $ (0.14) $ Year Ended December 31,
[LOGO]

