Attached files
UNITED STATES
SECURITIES AND EXCHANGE COMMISSION
Washington, D.C. 20549
FORM 10-K
(Mark One) | |
☒ | ANNUAL REPORT PURSUANT TO SECTION 13 OR 15(d) OF THE SECURITIES EXCHANGE ACT OF 1934 |
For the Fiscal Year Ended December 31, 2016 Or | |
☐ | TRANSITION REPORT PURSUANT TO SECTION 13 OR 15(d) OF THE SECURITIES EXCHANGE ACT OF 1934 |
For the transition period from to | |
Commission file number 001-35901 | |
FTD Companies, Inc.
(Exact name of registrant as specified in its charter)
Delaware (State or other jurisdiction of incorporation or organization) | 32-0255852 (I.R.S. Employer Identification No.) |
3113 Woodcreek Drive Downers Grove, Illinois (Address of principal executive office) | 60515 (Zip Code) |
(630) 719-7800
(Registrant’s telephone number, including area code)
Securities registered pursuant to Section 12(b) of the Act:
Title of Each Class | Name of Exchange on Which Registered | |
Common Stock, par value $0.0001 per share | The NASDAQ Stock Market LLC (NASDAQ Global Select Market) | |
Securities registered pursuant to Section 12(g) of the Act: None
Indicate by check mark if the registrant is a well-known seasoned issuer, as defined in Rule 405 of the Securities Act. Yes ☐ No ☒
Indicate by check mark if the registrant is not required to file reports pursuant to Section 13 or Section 15(d) of the Act. Yes ☐ No ☒
Indicate by check mark whether the registrant (1) has filed all reports required to be filed by Section 13 or 15(d) of the Securities Exchange Act of 1934 during the preceding 12 months (or for such shorter period that the registrant was required to file such reports), and (2) has been subject to such filing requirements for the past 90 days. Yes ☒ No ☐
Indicate by check mark whether the registrant has submitted electronically and posted on its corporate website, if any, every Interactive Data File required to be submitted and posted pursuant to Rule 405 of Regulation S-T (§232.405 of this chapter) during the preceding 12 months (or for such shorter period that the registrant was required to submit and post such files). Yes ☒ No ☐
Indicate by check mark if disclosure of delinquent filers pursuant to Item 405 of Regulation S-K is not contained herein, and will not be contained, to the best of registrant’s knowledge, in definitive proxy or information statements incorporated by reference in Part III of this Form 10-K or any amendment to this Form 10-K. ☒
Indicate by check mark whether the registrant is a large accelerated filer, an accelerated filer, a non-accelerated filer, or a smaller reporting company. See the definitions of “large accelerated filer,” “accelerated filer,” and “smaller reporting company” in Rule 12b-2 of the Exchange Act. (Check one):
Large accelerated filer ☐ | Accelerated filer ☒ | Non-accelerated filer ☐ | Smaller reporting company ☐ |
Indicate by check mark whether the registrant is a shell company (as defined in Rule 12b-2 of the Exchange Act). Yes ☐ No ☒
The aggregate market value of the voting stock held by non-affiliates of the registrant as of the last business day of the registrant’s most recently completed second fiscal quarter (June 30, 2016), based upon the closing sale price of the registrant’s common stock as reported on the NASDAQ Global Select Market was $424.3 million. At March 6, 2017, there were 27,434,082 shares of the Registrant’s common stock outstanding.
DOCUMENTS INCORPORATED BY REFERENCE
The information required by Part III of this Form 10-K, to the extent not set forth herein, is incorporated herein by reference to the registrant’s definitive proxy statement relating to the 2017 annual meeting of stockholders to be filed with the Securities and Exchange Commission not later than 120 days after the end of the registrant’s fiscal year ended December 31, 2016.
FTD COMPANIES, INC.
INDEX TO FORM 10-K
For the Year Ended December 31, 2016
Page | |||
In this document, references to “FTD Companies,” “FTD,” the “Company,” “we,” “us,” and “our” refer to FTD Companies, Inc. and its consolidated subsidiaries, unless the context otherwise requires.
2
Forward-Looking Statements
This Annual Report on Form 10-K (this “Form 10-K”) and the documents incorporated herein by reference contain certain forward-looking statements within the meaning of the “safe harbor” provisions of the Private Securities Litigation Reform Act of 1995, as amended, based on our current expectations, estimates and projections about our operations, industry, financial condition, performance, results of operations, and liquidity. Statements containing words such as “may,” “believe,” “anticipate,” “expect,” “intend,” “plan,” “project,” “projections,” “business outlook,” “estimate,” or similar expressions constitute forward-looking statements. These forward-looking statements include, but are not limited to, statements about our strategies; expectations about future business plans, prospective performance and opportunities, including potential acquisitions; future financial performance; revenues; segment metrics; operating expenses; market trends, including those in the markets in which we compete; liquidity; cash flows and uses of cash; dividends; capital expenditures; depreciation and amortization; tax payments; foreign currency exchange rates; hedging arrangements; our ability to repay indebtedness and invest in initiatives; our products and services; pricing; marketing plans; competition; settlement of legal matters; and the impact of accounting changes and other pronouncements. Potential factors that could affect such forward-looking statements include, among others, the factors disclosed in the section entitled “Risk Factors” in this Form 10-K and additional factors that accompany the related forward-looking statements in this Form 10-K and our other filings with the U.S. Securities and Exchange Commission (“SEC”), as updated from time to time in our subsequent filings with the SEC. Readers are cautioned not to place undue reliance on these forward-looking statements, which reflect management’s analysis only as of the date hereof. Such forward-looking statements are not guarantees of future performance or results and involve risks and uncertainties that may cause actual performance and results to differ materially from those predicted. Reported results should not be considered an indication of future performance. Except as required by law, we undertake no obligation to publicly release the results of any revision to these forward-looking statements that may be made to reflect events or circumstances after the date hereof or to reflect the occurrence of unanticipated events.
3
PART I
ITEM 1. BUSINESS
Overview
FTD Companies, Inc., together with its subsidiaries (referred to herein as the “Company,” “FTD,” “we,” “us,” or “our”) is a premier floral and gifting company with a vision to be the leading and most trusted floral and gifting company in the world. Our mission is to inspire, support, and delight our customers when expressing life’s most important sentiments. We provide floral, specialty foods, gift and related products and services to consumers, retail florists, and other retail locations and companies in need of floral and gifting solutions. Our business uses the highly recognized FTD® and Interflora® brands, both of which are supported by the iconic Mercury Man logo®. While we operate primarily in the United States (“U.S.”), Canada, the United Kingdom (“U.K.”), and the Republic of Ireland, we have worldwide presence as our iconic Mercury Man logo is displayed in approximately 35,000 floral shops in nearly 150 countries. Today, the “Mercury Man” is one of the most recognized logos in the world, and we are one of the largest and most trusted e-commerce floral and gift retailers in the world. Our diversified portfolio of brands also includes ProFlowers®, ProPlants®, Shari’s Berries®, Personal Creations®, RedEnvelope®, Flying Flowers®, Flowers Direct®, Ink Cards™, Postagram™, and Gifts.com™. While floral arrangements and plants are our primary offerings, we also market and sell gift items, including gourmet-dipped berries and other specialty foods, personalized gifts, premium fresh fruit baskets, gift baskets, wine and champagne, jewelry, and spa products.
About FTD
On August 18, 1910, thirteen American retail florists, led by John Valentine, agreed to exchange orders for out-of-town deliveries. In telegraphing orders to each other from opposite sides of the country, they hoped to eliminate their reliance on trains to send flowers to far away recipients. At the time, lengthy transit times made sending flowers to friends and relatives in distant locations almost impossible. The flowers could not survive the long journey. Soon independent florists all over America were telegraphing and telephoning orders to each other using the FTD network. They found that, by working together, they were able to make the seemingly impossible, possible. For the first time, beautiful bouquets could be made and personally hand-delivered anywhere in the country within a day. The idea revolutionized the way flowers could be sent; customers could now mark special occasions with flowers from afar. Originally called “Florists’ Telegraph Delivery Association,” FTD was the world’s first flowers-by-wire service. In 1914, FTD adopted the Roman messenger god as its logo, and the Mercury Man has ever since been our iconic logo. In 1965, FTD expanded to include international transactions, and the company was renamed “Florists’ Transworld Delivery” to reflect its growing worldwide presence.
Not surprisingly, it was not long before florists outside of the U.S. wanted to provide the same delivery service to distant locations. In the U.K., a nursery owner from Essex and a florist in Glasgow brought the concept to the U.K., and on May 30, 1923, Florists’ Telegraph Delivery Association launched in the U.K. In the 1950’s, the name Interflora was adopted, which is one of the most recognized brands in the U.K. and the Republic of Ireland. FTD acquired Interflora in July 2006. Our Interflora brand recognition within the U.K. flower delivery market has prompted awareness more than twice that of our competitors. In April 2012, Interflora acquired certain assets of the Gifts Division of Flying Brands Limited, including the Flying Flowers and Flowers Direct businesses.
FTD Companies, Inc. is a Delaware corporation headquartered in Downers Grove, Illinois that was formed in April 2008 in connection with United Online Inc.’s (“United Online”) acquisition of FTD Group, Inc. (“FTD Group”). FTD Group, a wholly owned subsidiary of FTD Companies, Inc., is a Delaware corporation that was formed in 2003 by a private investment fund affiliated with Leonard Green & Partners, L.P. solely for the purpose of acquiring majority ownership of FTD, Inc. FTD, Inc., a wholly owned subsidiary of FTD Group, is a Delaware corporation that commenced operations in 1994 when FTD converted from a not-for-profit cooperative to a for-profit corporation. FTD, Inc.’s principal operating subsidiaries are Florists’ Transworld Delivery, Inc., FTD.COM Inc. (“FTD.COM”), Interflora, and Provide Commerce, Inc. (“Provide Commerce”).
On November 1, 2013, FTD Companies, Inc. became an independent, publicly traded company on the NASDAQ Global Select Market (“NASDAQ”) under the symbol “FTD.” Prior to November 1, 2013, FTD was a wholly owned subsidiary of United Online. On November 1, 2013, as a result of a spin-off, United Online separated into two independent, publicly traded companies: FTD Companies, Inc. and United Online, Inc. (the “Separation”). The Separation was consummated through a tax-free dividend involving the distribution of all shares of FTD common stock to United Online’s stockholders. For additional information and risks associated with our separation from United Online, see “Risk Factors,” which appears in Item 1A of this Form 10-K.
4
On December 31, 2014, we acquired from a wholly owned subsidiary of Liberty Interactive Corporation (“Liberty”) all of the issued and outstanding shares of common stock of Provide Commerce, an indirect wholly owned subsidiary of Liberty (the “Acquisition”). Provide Commerce was founded in 1998 under the name ProFlowers, Inc. In 2003, ProFlowers, Inc. changed its name to Provide Commerce, Inc. Subsequent to its initial public offering in 2003 and prior to its acquisition by Liberty in 2006, Provide Commerce was an independent, publicly traded company. At December 31, 2016, Liberty holds 37.4% of the outstanding shares of FTD common stock. For additional information and risks associated with the Acquisition, see “Risk Factors,” which appears in Item 1A of this Form 10-K.
We believe the Acquisition furthers our vision to become the leading and most trusted floral and gifting company in the world as it brought together two complementary businesses to offer customers a greater variety of floral and gifting products and an enhanced shopping experience. The Acquisition expanded the breadth of our brands and, we believe, resulted in the following strategic benefits, among others:
• | enhanced consumer floral and gifting categories by combining FTD’s iconic brands, FTD and Interflora, and the Mercury Man logo with Provide Commerce’s respected and highly recognizable e-commerce brands, as described above; |
• | diversified revenue streams and broadened consumer demographics through the combination of FTD’s and Provide Commerce’s complementary businesses and customer bases, with opportunities for cross-selling brands; and |
• | generation of significant cost synergies to increase stockholder value through efficiencies in operations, including procurement and fulfillment, general and administrative, marketing, and information technology costs. |
Our Businesses
Our FTD Consumer business in the U.S. and Canada operates primarily through our www.ftd.com website, associated mobile sites, and the 1-800-SEND-FTD telephone number. While floral arrangements and plants are our primary offerings, we also market and sell gift items, including gourmet-dipped berries and other specialty foods, personalized gifts, premium fresh fruit baskets, gift baskets, wine and champagne, jewelry, and spa products. The majority of consumer orders for this segment are hand delivered by our floral network members, with same-day delivery available in most locations. The other consumer orders are fulfilled and shipped directly to the recipient in a special, elegant FTD gift box through our company-operated distribution network or by third parties via next-day and future-day delivery services.
Our Provide Commerce business operates primarily through the www.proflowers.com, www.berries.com, www.personalcreations.com, www.proplants.com, and www.gifts.com websites, associated mobile sites and applications, and various telephone numbers. Floral and gift offerings include fresh-cut flowers, floral arrangements, plants, gourmet-dipped berries and other specialty foods, personalized gifts, premium fresh fruit baskets, and other gifting products. Consumer orders for this segment are fulfilled and shipped directly to the recipient primarily through our company-operated distribution network or by third-party suppliers.
Our FTD Florist business operates in the business-to-business market. We provide a comprehensive suite of products and services to members of our floral network, including services that enable our floral network members to send, receive, and deliver floral orders. Floral network members include traditional retail florists, as well as other retail locations offering floral and related products, that are located primarily in the U.S. and Canada. We also provide products and services to other companies in need of floral and gifting solutions. Our large floral network provides an order fulfillment vehicle for our consumer businesses that generally allows us to offer same-day delivery capability to recipients throughout the U.S. and Canada.
Our Interflora business is a premier floral and gifting company in the U.K., offering one of the widest range of products and delivery options while providing one of the highest service levels in the U.K. and the Republic of Ireland. Interflora operates primarily through its www.interflora.co.uk, www.flyingflowers.co.uk, www.flowersdirect.co.uk, and www.interflora.ie websites, associated mobile sites and applications, and various telephone numbers. Interflora’s floral and gift offerings include fresh-cut flower arrangements, occasion-specific gifts and plants, bears, chocolates, and wine. Consumers can also design their own bouquet, stem by stem, or tailor food gifts online using My Interflora Creation™. The majority of Interflora’s floral gift offerings are delivered through its network of florists in the U.K. and the Republic of Ireland. Consumers also have the option of ordering specific products for delivery in elegant gift boxes by third-party couriers. We also provide products and services to floral network members, funeral directors, independent gift shops, other retailers, and other companies in need of floral and gifting solutions.
5
Industry Background
Floral Industry
Floral industry retail purchases in the U.S., including flowers, potted plants, and seeds, were approximately $30 billion in 2016, according to the U.S. Department of Commerce. Floral industry retail purchases in the U.K., including fresh-cut flowers and indoor plants, were approximately £2.2 billion in 2014, according to the latest available study by Mintel, a market research company. Both the U.S. and U.K. markets are highly fragmented, with thousands of floral industry participants. Trends in the floral retail markets include the following:
• | Floral mass marketers, such as our consumer businesses, capture floral orders from consumers through websites, associated mobile sites and applications, and telephone. The floral mass marketers’ share of retail floral purchases has expanded due to shifting consumer preferences towards purchasing floral products online and through mobile sites and applications, and the emergence of prominent brands with national or international exposure. |
• | Increasing consumer interest in floral arrangements shipped directly to consumer recipients via common carrier has also benefited floral mass marketers. |
There were approximately 14,000 retail florists in the U.S. in 2016, according to Dun & Bradstreet’s industry profile. Supermarkets, mass merchants, and other retailers have established or increased their presence in the floral retail market by adding a variety of floral and related gift products to their merchandise assortments. The growth of supermarkets and mass merchants as important distribution channels within the floral retail market has led many traditional retail florists to expand their merchandise offerings to include a larger selection of gift items, outdoor nursery stock, and seasonal decorations, among other items.
Floral wire services utilize proprietary network communication systems to enable the transmission and fulfillment of orders among floral network members. Floral wire services may include order transmission, clearinghouse services, marketing, and other services in support of the floral network. Order clearinghouse services play an important role by ensuring the flow of payment between a floral network member sending an order received from a consumer and the member receiving and fulfilling the order, thereby eliminating counterparty credit risk for the floral network members. Providers of floral wire services may offer a broad range of services that are designed to promote revenue growth and facilitate the efficient operation of a retail florist’s business. Traditional retail florists often rely on floral network services to provide incoming order volume.
Specialty Food and Gift Industry
The total U.S. gifting market is estimated at $131 billion in 2014 (Unity Marketing Gifting Report 2015) and is a highly fragmented market with consumers purchasing gifts in retail stores and online. In 2015, according to Unity Marketing, over 50% of consumers purchased gifts online, which increased from 39% in 2010.
Food gifting sales were estimated to reach $21 billion in 2014 and further projected to reach $23 billion in 2016, according to a study by Packaged Facts in 2014. Of these amounts, approximately 60% are attributed to consumer sales. Consumers purchase food gifts for many reasons, including convenience, which has been cited as a reason for purchasing a food gift by 34% of the people surveyed, an increase from 22% in 2010. According to the Packaged Facts study, of the food gifts purchased, boxed chocolates/candies remain as the most prevalent gift for others totaling 25% of purchases in a twelve month period. Other purchased food gifts include sweet baked foods (13%), coffee/tea/hot chocolate gifts (13%), and nut/salty foods (11%).
Personalized gifts are also important to consumers as they look to purchase a special, memorable gift for others. Consumers may purchase personalized gifts for a variety of reasons, but primarily for the winter holidays, religious events, new baby, and anniversaries, based on research conducted by a third-party market research firm retained by Provide Commerce. Within the same study, it was noted that over 85% of the consumers purchasing personalized gifts did so online in order to provide additional personalization and customization.
6
Our Business Strategy
Our vision is to be the leading and most trusted floral and gifting company in the world. Our mission is to inspire, support, and delight our customers when expressing life’s most important sentiments. We strive to attain these goals through the following key strategies:
• | Innovative Product Selection: Our extensive range of fresh-cut flowers and floral arrangements, plants, gourmet-dipped berries and other specialty foods, personalized gifts, wine and champagne, jewelry, and other gifting items provides our customers with innovative offerings in expressing life’s most important sentiments. We offer exclusive products by FTD, Interflora, ProFlowers, Shari’s Berries, and Personal Creations, and other exclusive products designed with our strategic partners. Our premium and branded floral gift products include FTD Luxe Collection, My Interflora Creation, FTD Color Confection Collection, The FTD Expressions Collection®, FTD Color Your Day® Collection, Better Homes and Gardens® Collection, USO® Collection, and Vera Wang Flowers, along with Baccarat®, Waterford®, and DaySpring®, among others. Any third party trademarks are the property of their respective owners. |
• | Strong Brand Awareness: We believe that building greater awareness of our brands and communicating brand differentiation, both within and beyond the existing customer base, are important for growth. We promote our brands through a variety of traditional and digital marketing and promotional techniques, including online, social, print, radio, email, direct mail, public relations, and television. |
• | High-Quality, Consistent Fulfillment Capabilities: We believe a key differentiator for our brands is delivering high-quality, consistent products and services to our customers. Having strong relationships with quality suppliers is crucial to the success of our platforms. To maintain high standards, we have established quality assurance programs to review and test our suppliers on an ongoing basis. We continue to work with suppliers to explore new methods to preserve quality and freshness, ensure a diverse product offering, maintain efficient technology, and reduce costs. In addition, we regularly seek out new suppliers to provide the broadest available selection of quality products for the benefit of our customers. Our extensive flower selection is largely sourced from Colombia, the U.S., Kenya, Holland, Ecuador, Thailand, and Costa Rica. In addition, our strawberries are largely sourced from the U.S. and Mexico. Further, we offer a variety of delivery options, including same-day delivery to the U.S., Canada, the U.K., and the Republic of Ireland, next-day and future-day delivery service throughout the world (subject to certain limitations), and three-hour, as well as morning and afternoon delivery options in the U.K. |
Our fulfillment model includes independent retail florists, company-operated distribution facilities that ship product directly to our customers, and third-party suppliers who also ship directly to our customers. Further, we are part of an international network with approximately 35,000 floral shops displaying our iconic Mercury Man logo, enabling consumers to purchase products for delivery in approximately 150 countries. We will continue to optimize our distribution network, enabling us to deliver our products to customers in a high-quality manner while improving the efficiency of our fulfillment and logistics operations.
• | Strong Relationships with Our Floral Network Members: Maintaining strong relationships with our floral network members is key to our success. FTD has both customer and supplier relationships with our florist network members. To maintain high standards among our floral network members, we have member training programs and have established a quality assurance program to review and test the quality of our floral network members. We believe that our florist network members have the blend of skills, creativity and attention to detail needed to create unique and special handmade arrangements. Further, our floral network members have important roles in supporting our brands. |
• | Customer Satisfaction and Loyalty: We believe that by continuing to offer innovative product and service offerings and delivering high-quality, consistent products to consumers, we can increase customer satisfaction, and, in turn, increase customer loyalty, thereby enabling growth. We offer our customers a satisfaction guarantee for fresh, beautiful floral arrangements, plants, and gifts. We strive to deliver high-caliber customer service to our consumer customers, floral network members, and other customers. We operate customer service centers at our headquarters in Downers Grove, Illinois; in San Diego, California; in other locations in the U.S. and U.K.; and in outsourced locations. High-quality products and excellent customer service are critical to our brand strength and brand loyalty. |
• | Strong Operating Performance and Cash Flow Generation: We manage our business with a focus on growth, profitability, and cash flow generation. |
7
As part of our business strategy, we intend to continue to expand the breadth of our brands through organic growth and, where appropriate, through the acquisition of complementary businesses. We will explore opportunities to differentiate our floral and gift branded product offerings with a mind to providing customers greater options in expressing life’s most important sentiments. We also seek to provide higher value offerings to our customers, which may, for example, include bundled floral and gift product offerings. In addition, we believe our ability to acquire and retain customers effectively is critical to our success. We continue to seek expansion of our business by, among other things, marketing to our current and potential consumer and floral network customers. Our marketing efforts are primarily focused on generating orders from new and existing customers; increasing the value of our offerings to our customers thereby increasing average order value; increasing the penetration of sales of our services and products to our floral network members; attracting new members to our floral networks; and marketing our products and services to alternative channels such as supermarkets, mass merchants, and other retail locations.
In an effort to acquire and retain consumers, we engage in multi-channel, integrated marketing efforts, which include online advertising and marketing, including search engine marketing and optimization; social media and group-buying programs; co-marketing and affiliate partnerships and loyalty programs such as airlines and other corporate and travel companies; email promotions to existing consumer customers; direct mail and other forms of print advertising; an email-based reminder service that provides consumers with personalized reminders of occasions such as birthdays, anniversaries, and key gift-giving holidays; and radio, public relations, television, and other offline advertising. As consumer shopping continues to migrate from computers to mobile devices, we are committed to providing the best shopping experience from all types of devices. In addition, we modify our website formats and redesign our offerings based on customer purchasing patterns. Our objective is to continually innovate and evolve the customer experience, inspiring brand loyalty and passion.
Marketing efforts related to our floral network members include member appreciation and training events; sponsorship and participation in floral and retail industry trade shows; and offline media campaigns. In addition, many of our consumer marketing efforts are also designed to integrate with and enhance the businesses of our floral network members. By enhancing the FTD and Interflora brands, we increase the possibility that a consumer will place an order directly with one of our floral network members since floral retailers frequently highlight their association with our floral networks in their own marketing efforts. We also employ dedicated sales forces to market our products and services to our floral network members and to encourage other floral retailers to buy floral and gift products and services from us.
Reportable Segments
We report our business operations in four reportable segments: Consumer, Provide Commerce, Florist, and International.
For the years ended December 31, 2016 and 2015, the Management’s Discussion and Analysis of Financial Condition and Results of Operations (“MD&A”) presented reflects our four operating and reportable segment presentation. For additional information about our reportable segments refer to MD&A in Part II, Item 7 of this Form 10-K and Note 3—“Segment Information” of the Notes to the Consolidated Financial Statements included in Part II, Item 8 of this Form 10-K.
Consumer Segment. Through our Consumer segment, we are a leading direct marketer of floral and gift products for consumers, primarily in the U.S. and Canada. We operate primarily through our www.ftd.com website, associated mobile sites, and the 1-800-SEND-FTD telephone number. The majority of consumer orders are hand delivered by our floral network members, who provide same-day and future-day delivery services. The other consumer orders are fulfilled and shipped directly to the recipient in an elegant FTD gift box by third parties, who provide next-day and future-day delivery services. This segment has a negative working capital model as consumers generally pay us before payment is required to be made to the floral network members and other third-party vendors.
Provide Commerce Segment. Through our Provide Commerce segment, we are a leading direct marketer of floral and gift products for consumers, including specialty foods, personalized gifts, and other gifting products, primarily in the U.S. We operate primarily through our www.proflowers.com, www.berries.com, www.personalcreations.com, www.proplants.com, and www.gifts.com websites, associated mobile sites and applications, and various telephone numbers. Consumer orders for this segment are fulfilled primarily by us or third-party suppliers and shipped directly to the recipient in a gift box on the delivery date specified by the sender. A smaller portion of the consumer orders for this segment are fulfilled by the FTD floral network members.
8
Florist Segment. Through our Florist segment together with Interflora, we are the world’s largest and most experienced floral network, offering products and services to our floral network members, funeral directors, independent gift shops, other retailers, and to other companies in need of floral and gifting solutions. Our floral network members include traditional retail florists and other non-florist retail locations, primarily in the U.S. and Canada. Our comprehensive suite of services includes, among other things, access to the FTD brand and the Mercury Man logo, which are supported by various FTD marketing campaigns; clearinghouse and order transmission services that enable our members to send, receive, and deliver floral and gift orders; access to the floral network; directory publication services; credit card processing services; e-commerce website services; online advertising tools; and system support services. Our large floral network provides an order fulfillment vehicle for our consumer businesses that allows us to offer same-day delivery capability (subject to certain limitations) to recipients throughout the U.S. and Canada.
We sell products to floral network members, including fresh-cut flowers, branded and non-branded containers, packaging, marketing products, and a wide variety of other floral-related supplies. Selling branded containers to our members helps to ensure that the consumer orders fulfilled by our floral network members are consistent with the product imagery displayed on our websites. We also provide point-of-sale systems and related technology services that enable our floral network members to transmit and receive orders and manage several back-office functions of a retailer’s business, including accounting, customer relationship management, direct marketing campaigns, delivery route management, and event planning.
International Segment. Our International segment consists of Interflora, which operates primarily in the U.K. and the Republic of Ireland. Interflora is a leading direct marketer of floral and gift products to consumers and operates primarily through its www.interflora.co.uk, www.flyingflowers.co.uk, www.flowersdirect.co.uk, and www.interflora.ie websites, associated mobile sites and applications, and various telephone numbers. Orders are transmitted to floral network members or third-party suppliers for processing and delivery. The majority of consumer orders are hand-delivered by our floral network members, who provide same-day delivery, including three-hour delivery. The members also provide evening and Sunday delivery options as well as timed delivery services. The remaining consumer orders are fulfilled and shipped in an elegant gift box directly to the recipient by third parties, who provide next-day and future-day delivery services. This segment has a negative working capital model, as consumers generally pay us before payment is required to be made to floral network members or other third-party vendors. Our Interflora segment offers our floral network members access to the Interflora brand and the Mercury Man logo; services that enable our members to send, receive, and deliver floral and gift orders; and e-commerce website services. In addition, we sell fresh-cut flowers, certain associated gift products, and floral-related supplies to our floral network members and other customers.
As the Acquisition was completed on December 31, 2014, no results of operations of Provide Commerce were included in the Company’s consolidated statements of operations for the year ended December 31, 2014. Segment revenues from external customers, as a percentage of total revenues, for the years ended December 31, 2016, 2015, and 2014 were as follows:
Year Ended December 31, | ||||||||
2016 | 2015 | 2014 | ||||||
Consumer | 24 | % | 25 | % | 47 | % | ||
Provide Commerce | 47 | % | 48 | % | — | % | ||
Florist | 15 | % | 13 | % | 25 | % | ||
International | 14 | % | 14 | % | 28 | % | ||
Total revenues | 100 | % | 100 | % | 100 | % | ||
Competition
Consumer market. The consumer market for flowers and gifts is highly competitive as consumers can purchase the products we offer from numerous sources, including traditional local retail florists, supermarkets, mass merchants, gift retailers, floral and gift mass marketers, specialty markets, and catalog companies. The nature of the internet as a marketplace facilitates competitive entry and comparative shopping, which further drives competition. We believe the primary competitive factors in the consumer market are strength of brand, price, quality of products, selection, fulfillment capabilities, customer service, website performance, and ordering convenience. The U.S. consumer floral and gift market continues to be very large and fragmented. In the U.S., our key competitors include online, catalog, floral and gift retailers, and mass market retailers, including such companies as 1-800-FLOWERS.COM, Inc. In addition, in the gourmet foods category we also compete with online and specialty companies. Further, we compete with personalized gift retailers and other general gift companies which also offer personalized products.
9
Floral network services market. The floral network services market is highly competitive as well, and retail florists and other companies may choose from a variety of providers that offer similar products and services. We believe the primary competitive factors in this market are price, order volume, customer service, services offered, strength of brand, and fulfillment capabilities. Our key competitors in the U.S. floral network services market include providers of online or e-commerce services, retailers and wholesalers of floral-related products, and other floral network services providers, such as Teleflora and BloomNet Wire Service, a subsidiary of 1-800-FLOWERS.COM, Inc. The number of retail florists has been declining for more than a decade. As the number of retail florists decreases, competition for the business of the remaining retail florists may intensify. However, other non-florist retail locations and other companies may continue to expand their floral and gifting needs.
International market. We face strong competition in the consumer markets in the U.K. and the Republic of Ireland, with similar trends and competitive factors as those seen in the U.S. The markets in the U.K. and Republic of Ireland are also large and highly fragmented. Key competitors in the international consumer market include mass market retailers, grocery chains, and online catalog and specialty gift retailers. We also face competition in the business-to-business market for floral network services.
Although we believe that we can compete favorably with respect to many competitive factors, in both the consumer and the floral network services markets, some of our competitors may have an advantage over us with respect to certain factors. Some of our competitors may engage in more aggressive pricing, may devote significantly greater resources to marketing campaigns or other aspects of their business, or may respond more quickly and effectively than we can to new or changing opportunities or customer requirements.
Seasonality and Cyclicality
Our revenues, operating results, and cash flows across all four of our segments typically exhibit seasonality. Revenues, operating results, and cash flows tend to be lower for the quarter ending September 30 because none of the most popular floral and gift-giving holidays, which include Mother’s Day, Valentine’s Day, Christmas, Easter, and Thanksgiving, fall within that quarter. In addition, depending on the year, Easter and the U.K. Mother’s Day sometimes fall within the quarter ending March 31 and sometimes fall within the quarter ending June 30. Furthermore, depending on the year, certain of the most popular floral and gift-giving holidays, such as Valentine’s Day, may occur on a weekend or government holiday, which historically has negatively impacted orders. The Provide Commerce business experiences a greater level of seasonality than the legacy FTD business. The Provide Commerce business has historically generated an operating loss and used cash for operations during the third quarter. Historically, almost two-thirds of the Provide Commerce revenues and three-quarters to all of its operating profit have been generated in the first half of the year. Within the Provide Commerce segment, the Personal Creations business is highly seasonal with approximately half of its revenues and substantially all of its operating profit generated in the fourth quarter with the Christmas season. As a result of these variations, we believe that comparisons of our revenues and operating results for any period with those of the immediately preceding period, or in some instances, the same period of the preceding fiscal year, may be of limited relevance in evaluating our historical performance and predicting our future financial performance. Our working capital and any short-term borrowings may also fluctuate during the year as a result of the factors described above.
Revenue Sources
We generate revenues primarily from the sale of products and services, as further described below:
• | Products revenues. Products revenues are derived primarily from selling floral, specialty foods, gourmet-dipped berries and other specialty foods, personalized gifts, and other gift items to consumers and include the related shipping and service fees. Products revenues also include revenues generated from sales of fresh flowers, branded and non-branded containers, packaging and promotional products, and a wide variety of other floral-related supplies to floral network members. |
• | Services revenues. Services revenues related to orders sent through the floral network are variable based on the number of orders and/or on the value of orders and are recognized in the period in which the orders are delivered. Services revenues also include membership and other subscription-based fees from floral network members that are recognized as earned, on a month-to-month basis. |
10
International Operations
We have international operations primarily in the U.K. through which we provide floral, gift, and related products and services to consumers and to floral network members and other companies in need of floral and gifting solutions in the U.K. and the Republic of Ireland.
We also have a wholly owned subsidiary in the Republic of India, FTD India Private Limited. Our operations in India are primarily responsible for technology development and support. We do not generate revenues directly from our operations in India. For information regarding risks associated with our international operations, see “Risk Factors,” which appears in Part I, Item 1A of this Form 10-K. For information regarding international long-lived assets, see Note 3—“Segment Information” of the Notes to the Consolidated Financial Statements included in Part II, Item 8 of this Form 10-K.
We have revised the previously reported consolidated financial statements and related metrics for the years ended December 31, 2015 and 2014 for certain errors that were not material in any of the years revised. See Note 17—Immaterial Restatement of Prior Period Financial Statements in the Notes to Financial Statements in Part II, Item 8 of this Form 10-K. Geographic revenues from sales to external customers were as follows for the periods presented (in thousands):
Year Ended December 31, | |||||||||||
2016 | 2015 | 2014 | |||||||||
U.S. | $ | 969,299 | $ | 1,051,417 | $ | 462,504 | |||||
U.K. | 152,700 | 166,916 | 176,501 | ||||||||
Consolidated revenues | $ | 1,121,999 | $ | 1,218,333 | $ | 639,005 | |||||
Technology
Our floral network services use internally-developed order processing, order transmission, message processing, and customer service systems which provide communication to our floral network members and third-party suppliers. We also have developed reliable and secure e-commerce, supply chain, customer relationship and transaction processing systems utilizing custom-built and third-party technologies, and have developed software to enhance the functionality of certain components of our services, including billing, email, customer support, logistics, and fulfillment for floral and gift products. We have multiple systems and platforms currently in place related to many of these technologies.
For all systems, we maintain data centers in multiple locations in the U.S. and the U.K. In most cases, we have redundant systems to provide high levels of service availability and connectivity. We host some of our data center services in third-party co-location facilities.
In addition to our proprietary technology, we license from third parties a number of our software applications and components, including applications for our customer support, as well as some of our client and server applications. These licenses generally have terms ranging from several years to perpetual.
Government Regulations
We are subject to a number of international, federal, state, and local laws and regulations, including, without limitation, those relating to taxation, bulk email or “spam” advertising, user privacy and data protection, food production, safety, storage, marketing and distribution, consumer protection, supply chain operations, anti-bribery, labor, antitrust, and unclaimed property. In addition, proposed laws and regulations relating to some or all of the foregoing, as well as to other areas affecting our businesses, are continuously debated and considered for adoption in the U.S. and other countries, and such laws and regulations could be adopted in the future. For additional information regarding risks related to international, federal, state, and local laws and regulations, see “Risk Factors” which appears in Part I, Item 1A of this Form 10-K.
Proprietary Rights
Our trade names, trademarks, including the Mercury Man logo, service marks, patents, copyrights, domain names, trade secrets, and other intellectual property are important to the success of our business. We consider our trade names and trademarks, including the Mercury Man logo, FTD, Interflora, ProFlowers, ProPlants, Shari’s Berries, Personal Creations, RedEnvelope, Flying Flowers, Flowers Direct, Ink Cards, Postagram, and Gifts.com to be very valuable assets. Most of these trademarks have been registered in the U.S., the U.K. and/or, in certain cases, in other countries. We principally rely upon
11
patent, trademark, copyright, trade secret, domain name laws, and contract laws to protect our intellectual property and proprietary rights. We also license rights to use some of our intellectual property, including the Mercury Man logo, to third parties. We continuously assess whether to seek patent and other intellectual property protections for those aspects of our business and technologies that we believe constitute innovations providing competitive advantages. We generally enter into confidentiality or license agreements with our employees, consultants, and corporate partners, and generally seek to control access to, and distribution of, our technologies, documentation, and other proprietary information. Additionally, we hold a patent relating to certain manufacturing techniques. We also have pending patent applications relating to certain products and manufacturing techniques. Patents are generally valid for 14-20 years as long as their registrations are properly maintained. If the patents for which applications have been pending for numerous years are issued, the length of their validity may be shortened.
Employees
As of December 31, 2016, we had 1,528 employees, of which 1,165 were located in North America, 223 were located in the U.K., and 140 were located in India. In addition, we utilize part-time and temporary employees to respond to fluctuating seasonal demand around holidays and peak periods. None of our employees are subject to collective bargaining agreements, and we consider our relationship with our employees to be good.
Available Information
FTD’s Annual Reports on Form 10-K, Quarterly Reports on Form 10-Q, Current Reports on Form 8-K, and amendments to those reports filed or furnished pursuant to Section 13(a) or 15(d) of the Securities Exchange Act of 1934, as amended, changes in the stock ownership of our directors and executive officers, our code of ethics, and any other documents filed with, or furnished to, the SEC are available free of charge at FTD’s investor relations website at www.ftdcompanies.com. You can access our filings at our website as soon as reasonably practicable after such reports have been electronically filed with or furnished to the SEC. In addition, the SEC maintains a website at www.sec.gov that contains reports, proxy and information statements, and other information regarding the Company that we file electronically with the SEC. The information on our website is not, and shall not be deemed to be, a part of this Form 10-K or incorporated into any other filings we make with the SEC. Throughout this Form 10-K, we incorporate by reference information from other documents filed with the SEC.
By referring to our websites, including, without limitation, www.ftdcompanies.com, www.ftd.com, www.ftd.ca, www.interflora.co.uk, www.interflora.ie, www.flyingflowers.co.uk, www.flowersdirect.co.uk,www.proflowers.com, www.berries.com, www.personal creations.com, www.roses.com, www.proplants.com, and www.gifts.com, we do not incorporate these websites or their contents into this Form 10-K.
ITEM 1A. RISK FACTORS
Our business and our common stock are subject to a number of risks and uncertainties. In addition, there are a number of risks and uncertainties associated with our December 2014 acquisition of Provide Commerce and our November 2013 separation from United Online. You should carefully consider the risks and uncertainties described below, together with all of the other information in this Form 10-K. Based on information currently known, we believe that the following information identifies the most significant risk factors relating to our business and our common stock, including risks related to our acquisition of Provide Commerce and our separation from United Online.
If any of the following events occur, our business, financial condition, results of operations, and cash flows could be materially and adversely affected, and the trading price of our common stock could materially decline.
Risks Relating to Our Business
Competition could materially and adversely affect our business, financial condition, results of operations, and cash flows.
The consumer market for flowers and gifts is highly competitive and fragmented, as consumers can purchase the products we offer from numerous sources, including traditional local retail florists, supermarkets, mass merchants, gift retailers, floral and gift mass marketers, specialty markets, and catalog companies. We believe the primary competitive factors in the consumer market are strength of brand, price, quality of products, selection, fulfillment capabilities, customer service, website performance, and ordering convenience. In both the U.S. and the U.K., our key competitors in the consumer market include online, specialty catalog, floral and gift retailers, and mass market retailers with floral departments. In addition, in the gourmet foods category we also compete with online and specialty companies.
12
We face intense competition in the consumer market. We expect that the sales volumes at supermarkets and mass merchants will continue to increase, and that other online floral mass marketers will continue to increase their competition with us. In particular, the nature of the internet as a marketplace facilitates competitive entry and comparative shopping, which further drives competition. Some of our competitors may have significant competitive advantages over us, may engage in more significant discounting, may devote significantly greater resources to marketing campaigns or other aspects of their business, or may respond more quickly and effectively than we can to new or changing opportunities or customer requirements.
The floral network services market is highly competitive as well, and retail florists and supermarkets may choose from a variety of providers that offer similar products and services. In addition, the number of retail florists has been declining over a number of years. As the number of retail florists decline, competition for the business of the remaining retail florists may intensify.We believe the primary competitive factors in this market are price, order volume, customer service, services offered, strength of brand, and fulfillment capabilities. Our key competitors in the U.S. floral network services market include providers of online or e-commerce services, retailers and wholesalers of floral-related products, and other floral network services. In the international market, our key competitors include other floral network service providers.
Increased competition in the consumer market or the floral network services market may result in lower revenues, reduced gross margins, loss of market share, and increased marketing expenditures. We cannot provide assurances that we will be able to compete successfully or that competitive pressures will not materially and adversely affect our business, financial condition, results of operations, and cash flows.
Our operations could be adversely affected if we fail to integrate and retain our executive leadership team.
Beginning in the latter half of 2016, we have hired a new chief executive officer, a new chief financial officer, and other key executives. Our success depends, in part, upon the performance of our executive leadership team. If we are unable to integrate new senior executives, if they fail to perform effectively, if we are unable to retain them, or if we are unable to attract additional qualified senior executives as needed, our strategic initiatives could be adversely impacted and our business, financial condition, results of operations and cash flows could be materially and adversely affected.
If we are unable to successfully complete the integration of the Provide Commerce business with our legacy business, the anticipated benefits of the Acquisition may not be realized. In addition, future results will suffer if we do not effectively manage our expanded operations.
The Acquisition involved the combination of two companies that formerly operated as independent companies. Integration has required and will continue to require substantial management attention and could detract attention from the day-to-day business of the combined company. Potential difficulties we may encounter, which could materially and adversely affect our business, financial condition, results of operations, and cash flows, and include the following:
• | challenges implementing our diversification strategy, including challenges achieving revenue growth from sales of each company’s products and services to the customers of the other company; |
• | the potential inability to complete the integration of Provide Commerce’s customer-facing products and services, such as its direct-to-consumer marketing programs, various web-based applications, and enhanced technology applications; |
• | challenges leveraging the customer information and technology of the two companies; |
• | challenges offering products and services across our expanded brand portfolio; and |
• | complexities associated with managing the combined businesses, including difficulty addressing possible differences in corporate culture, management philosophies, inventory management, product delivery and distribution, and the challenge of integrating complex systems, technology, networks, and other assets of each of the companies in a seamless manner that minimizes any adverse impact on customers, florists, employees, and other constituencies. |
Our future success depends, in part, upon our ability to manage this expanded business, which will pose substantial challenges for our leadership team, including challenges related to the diversification strategy and revenue growth, management and monitoring of new operations and associated increased costs and complexity. In this regard, there can be no assurances that all of the goals and anticipated benefits of the Acquisition will be achievable.
13
Our business is subject to online security risks, and a security breach or inappropriate access to, or use of, our networks, computer systems, or services or those of third-party vendors could expose us to liability, claims, and a loss of revenue.
The success of our business depends on the security of our networks and, in part, on the security of the network infrastructures of our third-party vendors. In connection with conducting our business in the ordinary course, we store and transmit customer and member information, including personally identifiable information. Unauthorized or inappropriate access to, or use of, our networks, computer systems, or services, whether intentional, unintentional or as a result of criminal activity, could potentially jeopardize the security of confidential information, including credit card information, of our customers and of third parties. A number of other websites have publicly disclosed breaches of their security, some of which have involved sophisticated and highly targeted attacks on portions of their sites. Because the techniques used to obtain unauthorized access, disable or degrade service, or sabotage systems change frequently and often are not recognized until launched against a target, we may be unable to anticipate these techniques or to implement adequate preventative measures. If an actual or perceived breach of our security occurs, the perception of the effectiveness of our security measures could be harmed and we could lose members, customers, or vendors. A party that is able to circumvent our security measures could misappropriate our proprietary information or the information of our members or customers, cause interruption in our operations, or damage our computers or those of our members or customers.
A significant number of our members and customers authorize us to bill their payment card accounts (credit or debit) directly for all amounts charged by us. These members and customers provide payment card information and other personally identifiable information which, depending on the particular payment plan, may be maintained to facilitate future payment card transactions. We rely on third-party and internally-developed encryption and authentication technology to provide the security and authentication to effectively secure transmission of confidential information, including payment card numbers. Advances in computer capabilities, new discoveries in the field of cryptography, or other developments may result in the technology used by us to protect transaction data being breached or compromised. Non-technical means, for example, actions by an employee, can also result in a data breach. Under payment card rules and our contracts with our card processors, if there is a breach of payment card information that we store, we could be liable to the banks that issue the payment cards for their related expenses and penalties. In addition, if we fail to follow payment card industry security standards, even if there is no compromise of customer information, we could incur significant fines or lose our ability to give our members and customers the option of using payment cards. If we were unable to accept payment cards or are limited in our acceptance of payment cards, our businesses could be materially and adversely affected.
We may need to expend significant resources to protect against security breaches or to address problems caused by breaches. Security breaches, including any breach related to us or the parties with which we have commercial relationships, could damage our reputation and expose us to a risk of loss, litigation, and possible liability. We cannot assure you that the security measures we take will be effective in preventing these types of activities. We also cannot assure you that the security measures of our third-party vendors, including network providers, providers of customer and billing support services, and other vendors, will be adequate. In addition to potential legal liability, these activities may adversely impact our reputation or our revenues and may interfere with our ability to provide our products and services, all of which could materially and adversely affect our business. In addition, the coverage and limits of our insurance policies may not be adequate to reimburse us for losses caused by security breaches.
Significant problems with our key systems or those of our third-party vendors could materially and adversely affect our business, financial condition, results of operations, and cash flows.
The systems underlying the operations of our business are complex and diverse and must efficiently integrate with third-party systems, such as credit card processors. Key systems include, without limitation, order transmission, distribution, fulfillment and processing, including the systems for transmitting orders through our floral networks and to third-party suppliers; billing; website and database management; customer support; telecommunications network management; and internal financial systems. Some of these systems are outsourced to third parties, and others, such as certain of our customer service telephone systems, are not redundant. All information technology and communication systems are subject to reliability issues, denial of service attacks, integration and compatibility concerns, and security threatening intrusions. The continued and uninterrupted performance of our key systems is critical to our success. Unanticipated problems affecting these systems could cause interruptions in our services. In addition, if our third-party vendors face financial or other difficulties, our business could be adversely impacted. Any significant errors, damage, failures, interruptions, delays, or other problems with our systems or those of our third-party vendors could adversely impact our ability to satisfy our customers and could materially and adversely affect our business, financial condition, results of operations, and cash flows.
14
Our revenues, operating results, and cash flows fluctuate on a seasonal basis and may suffer if revenues during peak seasons do not meet our expectations, which could materially and adversely affect our business, financial condition, results of operations, and cash flows.
Our business is seasonal, and our quarterly revenues and operating results typically exhibit seasonality. Revenues, operating results, and cash flows tend to be lower for the quarter ending September 30 because none of the most popular floral and gift-giving holidays, which include Mother’s Day, Valentine’s Day, Christmas, Easter, and Thanksgiving, falls within that quarter. In addition, depending on the year, Easter and the U.K. Mother’s Day sometimes fall within the quarter ending March 31 and sometimes fall within the quarter ending June 30. Furthermore, depending on the year, certain of the most popular floral and gift-giving holidays, such as Valentine’s Day, may occur on a weekend or government holiday, which historically has negatively impacted orders.
The Provide Commerce business experiences a greater level of seasonality than our legacy business. The Provide Commerce business has historically generated an operating loss and used cash in operations during the third quarter. Historically, about two-thirds of its revenue and three-quarters to all of its operating profit have been generated in the first half of the year. Within the Provide Commerce segment, the Personal Creations business is highly seasonal with approximately half of its revenues and substantially all of its operating profit is generated in the fourth quarter during the Christmas season. Any heightened seasonality of our business as a result of the Acquisition could materially and adversely affect our business, financial condition, results of operations, and cash flows.
Our operating results may suffer if revenues during our peak seasons do not meet expectations, as we may not generate sufficient revenues to offset increased costs incurred in preparation for peak seasons. Our working capital and level of indebtedness may also fluctuate during the year as a result of the factors set forth above. Moreover, the operational risks described elsewhere in these risk factors may be significantly exacerbated if those risks were to occur during a peak season. For example, severe weather prior to or on Valentine’s Day, Mother’s Day, or another popular floral or gift-giving holiday could materially and adversely affect our business, financial condition, results of operations, and cash flows. Similarly, we could be materially and adversely affected if we do not accurately estimate customer demand and appropriately manage inventory levels in the Provide Commerce business.
We are dependent on third parties who fulfill orders and deliver goods and services to our customers, and their failure to provide our customers with high-quality products within the required timeframe and maintain a high level of customer service may harm our brands and could materially and adversely affect our business, financial condition, results of operations, and cash flows.
We believe that our success in promoting and enhancing our brands depends on our ability to provide our customers high-quality products within the required timeframe and maintain a high level of customer service. Our business depends, in part, on the ability of our floral network members and third-party suppliers that fulfill our orders to do so at high-quality levels. We work with our floral network members and third-party suppliers to develop best practices for quality assurance; however, we generally do not directly control or continuously monitor any floral network member or third-party supplier. A failure to maintain our relationships with key floral network members and third-party suppliers or the failure of our floral network members and third-party suppliers to fulfill orders to our customers’ satisfaction, at an acceptable level of quality, and within the required timeframe, could adversely impact our brands and cause us to lose customers, which could materially and adversely affect our business, financial condition, results of operations, and cash flows.
Additionally, because we depend upon third parties for the delivery of our products, strikes or other service interruptions affecting these shippers could have an adverse effect on our ability to deliver our products on a timely basis. If any of our shippers are unable or unwilling to deliver our products, we would have to engage alternative shippers, which could increase our costs. A disruption in any of our shippers’ delivery of our products could cause us to lose customers or could increase our costs, which could materially and adversely affect our business, financial condition, results of operations, and cash flows.
15
If the supply of flowers and/or strawberries becomes limited, the price of our floral and/or strawberry products could rise or our products may become unavailable, which could result in our not being able to meet consumer demand and could materially and adversely affect our business, financial condition, results of operations, and cash flows.
Many factors, such as weather conditions, agricultural limitations, restrictions relating to the management of pests and disease, and fair trade and other social or environmental issues, affect the supply of flowers and strawberries and the price of our floral and strawberry products. If the supply of high-quality flowers and/or strawberries available for sale is limited, the wholesale prices of flowers and strawberries could rise, which would cause us to increase our prices or could result in a reduction in our profits. An increase in our prices could result in a decline in consumer demand for our floral and strawberry products, which would decrease our revenues. Alternatively, we may not be able to obtain high-quality flowers and/or strawberries in an amount sufficient to meet consumer demand. Even if available, flowers and strawberries from alternative sources may be of lesser quality or be more expensive than those we currently offer. A large portion of our supply of flowers is sourced from Colombia, the U.S., Kenya, Holland, Ecuador, Thailand, and Costa Rica. In addition, a large portion of our supply of strawberries is sourced from the U.S. and Mexico.
The availability and price of our products could be affected by a number of other factors affecting suppliers, including:
• | severe weather; |
• | agricultural limitations; |
• | disease, infestation, and other biological problems; |
• | import duties and quotas; |
• | time-consuming import regulations or controls at ports; |
• | changes in trading status; |
• | economic uncertainties and currency fluctuations; |
• | foreign government laws and regulations; |
• | political, social, and economic instability, terrorist attacks, and security concerns in general; |
• | nationalization; |
• | availability of adequate labor resources for our suppliers; |
• | fair trade and other social or environmental certifications, requirements, or practices; |
• | governmental bans or quarantines; |
• | disruption in transportation and delivery; |
• | trade restrictions, including U.S. retaliation against foreign trade practices or withdrawal from, or renegotiation of, the North American Free Trade Agreement or other international trade agreements; and |
• | transportation availability and costs. |
Our consumer businesses rely heavily on email campaigns, and any disruptions or restrictions on the sending of emails or increase in the associated costs could materially and adversely affect our business, financial condition, results of operations, and cash flows.
We generate a significant portion of our consumer orders from the emails we send to customers who have previously ordered products from us. We also engage in a number of third-party email marketing campaigns in which such third parties include our marketing offers in the emails they send.
16
An increase in the number of customers to whom we are not able to send emails, or who elect to not receive or are unable to receive our emails could adversely affect our business, financial condition, results of operations, and cash flows. From time to time, internet service providers block bulk email transmissions or otherwise experience technical difficulties that result in our inability to successfully deliver emails to our customers. Third parties may also block, impose restrictions on, or start to charge for the delivery of emails through their email systems. Due to the importance of email to our businesses, any disruption or restriction on the distribution of emails or increase in the associated costs could materially and adversely affect our business, financial condition, results of operations, and cash flows.
We rely on our own distribution facilities to fulfill certain of our customers’ orders and to distribute our products into the carrier delivery system. A disruption in service at one or more of our distribution facilities, delivery failures, or delays could materially and adversely affect our business, financial condition, results of operations, and cash flows.
Our Provide Commerce and Consumer businesses fulfill many customer orders through company-operated distribution facilities. We may be unable to fulfill our customers’ orders through one or more of our various distribution facilities in a timely manner, or at all, due to a number of factors that may affect one or more of such distribution facilities, including:
• | a failure to maintain or renew one or more of our existing lease agreements for any of our company-operated distribution facilities; |
• | a prolonged power or equipment failure; |
• | a lack of availability of labor resources; |
• | an employee strike or other labor stoppage; |
• | a disruption in the transportation infrastructure; |
• | weather issues at our distribution facilities or along the delivery routes; |
• | a refrigeration failure; or |
• | a fire, flood, hurricane, tornado, or other natural disaster. |
In the event we are unable to fulfill our customers’ orders through one or more of our distribution facilities, we will attempt to fulfill the orders via another source to ensure timely delivery. However, we cannot guarantee that our other distribution facilities or third-party suppliers will have the capacity or the variety of flowers, strawberries, or gifts to fulfill all affected orders in a timely manner. In addition, if operations from one or more of our distribution facilities become permanently disrupted due to any of the factors noted above or other factors, we may not be able to secure a replacement distribution facility in a location on terms acceptable to us or at all. Our business, financial condition, results of operations, and cash flows could be materially and adversely affected if we experience temporary or permanent disruptions at one or more of our distribution facilities.
The success of our business is dependent on our floral network members and on the financial performance of the retail floral industry.
A significant portion of our profitability is dependent on our floral network members. Certain relationships with floral network members are non-exclusive and subject to their discretion in terms of network participation. The amount of revenues and profits we generate from individual floral network members can vary significantly. We have lost, and may continue to lose, floral network members as a result of declines in the number of local retail florists as a result of economic factors and competition, as well as our members choosing not to do business with us. There can be no assurance that the decline in the number of floral network members will not increase in the future or that we will not lose floral network members that generate significant revenues for our business, either of which could materially and adversely affect our business, financial condition, results of operations, and cash flows.
17
In addition, the operating and financial success of our business has been, and is expected to continue to be, dependent on the financial performance of the retail floral industry. There can be no assurance that the retail floral industry will not decline, that consumer preferences for and purchases of floral products will not decline, or that retail florist revenues or inter-city floral delivery transactions will not decline in absolute terms. A sustained decline in the sales volume of the retail floral industry could materially and adversely affect our business, financial condition, results of operations, and cash flows.
We are exposed to the credit risk of our floral network members.
When an FTD or Interflora floral network member fulfills an order from an originating member, we become liable to the fulfilling member for payment on the order, even if we do not receive payment from the originating member. Accordingly, we are exposed to the credit risk of our floral network members. We cannot provide assurances that the exposure will not be greater than the amounts we have reserved for this exposure. An increase in this exposure, coupled with material instances of defaults, could materially and adversely affect our business, financial condition, results of operations, and cash flows.
We are dependent on our strategic relationships to help promote our consumer websites. Failure to establish, maintain, or enhance such relationships could materially and adversely affect our business, financial condition, results of operations, and cash flows.
We believe that our strategic relationships with leading online retailers, direct marketers, and other strategic partners are critical to attract customers, facilitate broad market acceptance of our products and brands, and enhance our sales and marketing capabilities. A failure to maintain existing strategic relationships or to establish additional relationships that generate a significant amount of traffic from other websites could limit the growth of our business. Establishing and maintaining relationships with leading online retailers and direct marketers is competitive and expensive. We may not successfully enter into additional strategic relationships. We may not be able to renew existing strategic relationships beyond their current terms or may be required to pay significant fees to maintain and expand these strategic relationships. In addition, our business may be impacted by changes that our strategic partners make to their marketing practices. Further, many online retailers, direct marketers, and other strategic partners that we may approach to establish an advertising presence or with whom we already have an existing relationship may also provide advertising services for our competitors. As a result, these companies may be reluctant to enter into, maintain, or expand a strategic relationship with us. Our business, financial condition, results of operations, and cash flows may suffer if we fail to enter into new strategic relationships, maintain or expand existing strategic relationships, or if these strategic relationships do not result in traffic on our websites sufficient to justify costs.
In addition, we are subject to many risks beyond our control that influence the success or failure of our strategic relationships. For example, if any of the online retailers or direct marketers with which we have strategic relationships experience financial or operational difficulties that materially and adversely affect their ability to satisfy their obligations under their agreements with us, our business, financial condition, results of operations, and cash flows could be materially and adversely affected.
Our marketing efforts may not be successful or may become more expensive, either of which could increase our costs and materially and adversely affect our business, financial condition, results of operations, and cash flows.
We spend significant resources marketing our brands, products, and services. We rely on relationships with a wide variety of third parties, including internet search providers such as Google, internet advertising networks, retailers, and direct marketers, to source new customers and to promote our products and services. From time to time, we may spend additional amounts on television advertising. With any of our brands, products, and services, our business, financial condition, results of operations, or cash flows could be materially and adversely affected if:
• | our marketing activities are inefficient or unsuccessful; |
• | important third-party relationships or marketing strategies, such as internet search engine marketing and search engine optimization, become more expensive or unavailable, or are suspended or terminated, for any reason; |
• | there is an increase in the proportion of consumers visiting our websites or purchasing our products and services by way of marketing channels with higher marketing costs as compared to channels that have lower or no associated marketing costs; or |
• | if our marketing efforts do not result in our products and services being prominently ranked in internet search listings. |
18
Adverse economic conditions could materially and adversely affect our business, financial condition, results of operations, and cash flows.
Our products and services are discretionary and dependent upon levels of consumer spending. Consumer spending patterns are difficult to predict and are sensitive to, among other factors, the general economic climate, consumer levels of disposable income, consumer debt, and overall consumer confidence. Periods of challenging economic conditions have adversely impacted certain aspects of our businesses in a number of ways, including reduced demand, more aggressive pricing for similar products and services by our competitors, increased credit risks, increased credit card failures, a loss of customers, and increased use of discounted pricing for certain of our products and services. Periods of challenging economic conditions also may adversely impact our key vendors and customers. Such economic conditions and periods of decline in consumer spending have, in certain cases, resulted in, and may in the future result in, a variety of negative effects such as a reduction in revenues, increased costs, lower gross margin and operating margin percentages, increased allowances for doubtful accounts and write-offs of accounts receivable, increased provisions for excess and obsolete inventories, and recognition of impairments of assets, including goodwill and other intangible and long-lived assets. Any of these negative effects could materially and adversely affect our business, financial condition, results of operations, and cash flows.
Shifts in the mix of products versus services sold and types of products and services sold could materially and adversely affect our financial results.
The cost of revenues associated with our products revenues is generally higher than that associated with our services revenues. In addition, the cost of revenues associated with certain products and services may be higher than that associated with other products and services. As a result, changes in the proportion of revenues that is represented by products revenues versus services revenues, and certain types of products and services versus others, could materially and adversely affect our revenues, cost of revenues, cost of revenues as a percentage of revenues, and operating income.
Shifts in the mix of products and services sold at standard pricing as compared to discounted pricing or the failure to maintain our standard pricing for products and services could materially and adversely affect our financial results.
Due to economic conditions and for competitive and other reasons, we have been offering broader and greater discounts to the consumer, both on a promotional basis to consumers generally, as well as through strategic arrangements with third parties that have a fixed, and in certain cases greater, discount or other associated costs. We also offer discounts on our floral network service fees from time to time on a promotional basis. Shifts in the mix of products and services sold that have resulted in increases in the proportion of products and services sold at a discount, and at times at greater discounts, including through such strategic arrangements, have resulted, and may in the future result, in reduced revenues, an increase in cost of revenues as a percentage of revenues, and a decrease in operating income. We currently intend to continue selling a portion of our products and services at a discount, including through such strategic arrangements, and there are no assurances that the portion of products and services sold at a discount will not continue to increase. The continued use of discounts, including through such strategic arrangements, for our products and services may result in our becoming more reliant upon offering discounts in order to sell our products and services, which could result in our having to reduce our standard pricing, and could materially and adversely affect our financial results.
We have identified a material weakness in our internal control over financial reporting, and our business and stock price may be adversely affected if we do not adequately address the weakness or if we have other material weaknesses or significant deficiencies in our internal control over financial reporting.
We did not adequately design the control over the completeness and precision of our assessment of certain cross-border indirect taxes, the periodic monitoring of these positions, and the appropriate accounting related to these positions. The errors were the result of an incorrect assessment of certain cross-border indirect taxes and required an immaterial restatement of our previously issued consolidated financial statements for the years ended December 31, 2015 and 2014 and for the quarters within the years ended December 31, 2016 and 2015. Management reviewed the control related to the completeness and precision of its assessment as well as the periodic monitoring of cross-border indirect taxes and concluded that there was a reasonable possibility that a material misstatement of the annual or interim financial statements would not be prevented or detected on a timely basis. The existence of this or one or more other material weaknesses could result in errors in our financial statements, and substantial costs and resources may be required to rectify any internal control deficiencies. If we cannot produce reliable financial reports, investors could lose confidence in our reported financial information, the market price of our stock could decline significantly, we may be unable to obtain additional financing as needed, and our business and financial condition could be harmed.
19
The United Kingdom vote to leave the European Union could adversely impact our business, financial condition, results of operations, and cash flows.
On June 23, 2016, the U.K. held a referendum in which a majority of voters voted to leave the European Union (“E.U.”), commonly referred to as “Brexit.” The U.K. government is working towards triggering Article 50 of the Treaty on European Union, which would commence the official E.U. withdrawal process. A withdrawal could, among other outcomes, disrupt the free movement of goods, services and people between the U.K. and the E.U., undermine bilateral cooperation in key geographic areas and significantly disrupt trade between the U.K. and the E.U. or other nations as the U.K. pursues independent trade relations. In addition, Brexit could lead to legal uncertainty and potentially divergent national laws and regulations as the U.K. determines which E.U. laws to replace or replicate. The effects of Brexit will depend on any agreements the U.K. makes to retain access to the E.U. or other markets either during a transitional period or more permanently. Compliance with new laws or regulations regarding trade, delivery and other cross-border activities between the U.K. and the E.U. could be costly, negatively impacting our business, financial condition, operating results and cash flows. Our International segment operates principally in the U.K. For the year ended December 31, 2016, our International segment contributed approximately 14% of our consolidated revenues.
In addition, the announcement of the referendum results was followed by significant volatility in global stock markets and currency exchange rates, including in particular a decline in the value of the GBP in comparison to both the USD and EUR. Uncertainty before, during and after the period of negotiation could have a negative economic impact and result in further market and exchange rate volatility for several years. Any of these effects, and others that the Company cannot anticipate, could adversely impact the Company’s business, financial condition, results of operations, and cash flows.
Fluctuations in foreign currency exchange rates could materially and adversely affect comparisons of our operating results.
We transact business in different foreign currencies and may be exposed to financial market risk resulting from fluctuations in foreign currency exchange rates, primarily the British Pound and the Euro. Revenues and expenses in foreign currencies translate into higher or lower revenues and expenses in U.S. Dollars as the U.S. Dollar weakens or strengthens against such other currencies. Substantially all of the revenues of our international businesses are received, and substantially all expenses are incurred, in currencies other than the U.S. Dollar, which increases or decreases the related U.S. Dollar-reported revenues and expenses depending on the fluctuations in foreign currency exchange rates. Certain of our key business metrics, such as average order value, are similarly affected by such foreign currency exchange rate fluctuations. Changes in global economic conditions, market factors, and governmental actions, among other factors, can affect the value of these currencies in relation to the U.S. Dollar. A strengthening of the U.S. Dollar compared to these currencies and, in particular, to the British Pound and the Euro, has had, as noted since the Brexit announcement, and in future periods could have, an adverse effect on the comparisons of our revenues and operating income against prior periods. We cannot accurately predict the impact of future foreign currency exchange rate fluctuations on our operating results, and such fluctuations could materially and adversely affect the comparisons of such results against prior periods.
We face risks relating to operating and doing business internationally that could materially and adversely affect our business, financial condition, results of operations, and cash flows.
Our businesses operate in a number of countries outside the U.S., principally the U.K. and the Republic of Ireland for our Interflora subsidiary, and India for our technology development and support operations. Conducting international operations involves risks and uncertainties, including:
• | adverse fluctuations in foreign currency exchange rates; |
• | difficulties in managing and staffing international operations; |
• | potentially adverse tax consequences, including the complexities of foreign value added taxes and restrictions on the repatriation of earnings; |
• | increased financial accounting, tax, and reporting burdens and complexities; |
• | compliance with U.S. laws affecting operations outside the U.S., such as the Foreign Corrupt Practices Act; |
• | lack of familiarity with and unexpected changes in foreign regulatory requirements; |
• | the burdens of complying with a wide variety of foreign laws, regulations, and legal and regulatory standards; |
20
• | political, social, and economic instability abroad, terrorist attacks, and security concerns in general; and |
• | reduced or varied protection for intellectual property and proprietary rights. |
The occurrence of any one of these risks could materially and adversely affect our business, financial condition, results of operations, and cash flows.
Our success is dependent on the intellectual property (“IP”) that we use, and any infringement or misappropriation of our IP could materially and adversely affect our business, financial condition, results of operations, and cash flows.
We regard the “FTD®”, “Interflora®”, “ProFlowers®”, “Shari’s Berries®”, “Personal Creations®”, “RedEnvelope®”, “Flying Flowers®”, “Flowers Direct™”, “Roses.com™”, “Gifts.com™”, “ProPlants®”, “Sincerely™”, “Ink Cards™”, and “Postagram™” trademarks, the “Mercury Man” logo®, the “www.ftd.com”, the “www.proflowers.com”, “www.berries.com”, “www.personalcreations.com”, “www.proplants.com”, “www.Interflora.co.uk”, and other internet domain names and the other service marks, trademarks, and other intellectual property that we use in our business as being critical to our success. Our company and our subsidiaries have applied for the registration of and have been issued trademark registrations for trademarks and service marks used in our business in the U.S., the U.K., and various other foreign countries; however, in some other countries, there are certain pre-existing and potentially conflicting trademark registrations held by third parties. We rely on a combination of copyright, trademark, and trade secret laws, confidentiality procedures, contractual provisions, and license and other agreements with employees, customers, and others to protect our intellectual property rights. In addition, we may also rely on the third-party owners of the intellectual property rights we license to protect those rights. We license some of our intellectual property rights, including the Mercury Man logo, to third parties. The steps taken by us and those third parties to protect our intellectual property rights may not be adequate, and other third parties may infringe or misappropriate our intellectual property rights. This could materially and adversely affect our business, financial condition, results of operations, and cash flows. Furthermore, the validity, enforceability, and scope of protection of intellectual property in internet-related industries are uncertain and still evolving.
We are also subject to the risk of claims alleging that our business practices infringe on the intellectual property rights of others. These claims could result in lengthy and costly litigation. Moreover, resolution of any such claim against us may require our company or one of our subsidiaries to obtain a license to use the intellectual property rights at issue or possibly to cease using those rights altogether. Any of those events could materially and adversely affect our business, financial condition, results of operations, and cash flows.
We have a substantial amount of indebtedness. This level of indebtedness could adversely affect our ability to raise additional capital to fund operations, our flexibility in operating our business and our ability to react to changes in the economy or our industry.
At December 31, 2016, we had $280.0 million of principal indebtedness outstanding, on which quarterly payments of $5 million are due from 2017 through July 1, 2019, with the remaining balance due upon maturity in September 2019. Such indebtedness includes $160.0 million outstanding under a term loan and $120.0 million outstanding under revolving loans. Our substantial indebtedness could have significant consequences for our business and financial condition. For example:
• | If we fail to meet payment obligations or otherwise default under our debt, the lenders will have the right to accelerate the indebtedness and exercise other rights and remedies against us. |
• | We will be required to dedicate a greater percentage of our cash flows to payments on our debt, thereby reducing the availability of cash flows to fund capital expenditures, pursue other acquisitions or investments in new technologies, make stock repurchases, and fund other general corporate requirements. |
• | Our ability to obtain additional financing to fund future working capital needs, capital expenditures, acquisitions, and other general corporate requirements could be limited. If we are unable to raise additional capital when required, it could affect our liquidity, business, financial condition, results of operations, and cash flows. In addition, our ability to borrow additional amounts under our revolving credit facility, which is a significant source of liquidity, is subject to the absence of defaults and our ability to make representations contained in our revolving credit facility. Failure to meet our borrowing conditions under our revolving credit facility could materially and adversely impact our liquidity. |
• | Our debt imposes operating and financial covenants and restrictions on us, including limitations on our ability to use cash flows for the benefit of our subsidiaries. Compliance with such covenants and restrictions may adversely affect our ability to adequately finance our operations or capital needs, pursue attractive business opportunities that may arise, redeem or repurchase capital stock, pay dividends, sell assets, and make capital expenditures. |
21
• | Our failure to comply with the covenants in our debt, including failure as a result of events beyond our control, could result in an event of default on our debt. Upon an event of default, the lenders of that debt could elect to cause all amounts outstanding with respect to that debt to become immediately due and payable, and we would be unable to access our revolving credit facility. An event of default could materially and adversely affect our operating results, financial condition, and liquidity. |
• | We may continue to experience increased vulnerability to and limited flexibility in planning for or reacting to changes in or challenges relating to our business and industry, thus creating competitive disadvantages compared to other competitors with lower debt levels and borrowing costs. |
• | We may continue to experience increased vulnerability to general adverse economic conditions, including increases in interest rates if our borrowings bear interest at variable rates or if such indebtedness is refinanced at a time when interest rates are higher. |
We cannot assure you that our cash flows, combined with additional borrowings under the current and any future credit agreements, will be available in an amount sufficient to enable us to repay our indebtedness or to fund other liquidity needs. For additional information regarding our credit agreement see Note 7—“Financing Arrangements” of the Notes to the Consolidated Financial Statements included in Part II, Item 8 of this Form 10 K.
In addition, we may incur substantial additional indebtedness in the future, which could cause the related risks to intensify. We may need to refinance all or a portion of our indebtedness on or before their respective maturities. We cannot assure you that we will be able to refinance any of our indebtedness on commercially reasonable terms or at all. The terms of any additional debt may give the holders rights, preferences, and privileges senior to those of holders of our common stock, particularly in the event of liquidation. The terms of any new debt may also impose additional and more stringent restrictions on our operations than are currently in place. If we are unable to refinance our debt, we may default under the terms of our indebtedness, which could lead to an acceleration of the debt. We do not expect that we could repay all of our outstanding indebtedness if the repayment of such indebtedness was accelerated.
Incidents involving or allegations of food-borne illnesses, food tampering, food contamination, or mislabeling relating to our products, whether or not accurate, could harm our business.
Our product offerings include food products, which may expose us to risks posed by food spoilage and contamination, misbranding, product tampering or other adulteration, allergens, product recall, and consumer product liability claims. Issues related to quality and safety of our products, ingredients, or packaging could jeopardize our image and reputation. Instances or reports, whether true or not, of food-safety issues, such as food-borne illnesses, food tampering, food contamination or mislabeling, either during manufacturing, packaging, storing, or preparation, have in the past severely injured the reputations of companies in the food processing, grocery, and quick-service restaurant sectors and could affect us as well. Any report linking us to food-borne illnesses or food tampering, contamination, mislabeling, or other food-safety issues could damage our brand value and severely hurt sales of our food products and possibly lead to product liability claims, litigation (including class actions), or damages. If customers become ill from food-borne illnesses, tampering, contamination, mislabeling, or other food-safety issues, we could be forced to temporarily close some supply chain facilities, as well as recall products. In addition, instances of food-safety issues, even those involving solely the products or stores of competitors or of suppliers or distributors (regardless of whether we use or have used those suppliers or distributors), could, by resulting in negative publicity about us or the foodservice industry in general, adversely affect our sales. A decrease in customer orders as a result of food-safety concerns or negative publicity, the payment of fines or damages relating to product recalls or food-safety claims, or litigation or government actions, could materially and adversely affect our business, financial condition, results of operations, and cash flows.
Product recall or liability claims could harm our business.
Products that we sell, including glass, ceramic, and other personalized gift products, could contain defects and/or may expose us to product liability claims in the event the use of these products results in personal injury or property damage. We have been in the past, and may be in the future, subject to product liability claims and we may incur significant costs related to such claims. Even if a product liability claim is not successful, or if we conduct a voluntary recall, we may incur substantial costs in defending the claim or conducting the recall. The insurance we maintain against product liability claims may be inadequate to cover any liabilities we may incur, which could materially and adversely affect our business, financial condition, results of operation, and cash flows. In addition, product liability claims often create negative publicity, which could materially damage our reputation and our brands.
22
We may be unable to increase capacity or introduce enhancements to our consumer websites, mobile sites and applications, or various telephone numbers in a timely manner or without service interruptions, which could materially and adversely affect our business, financial condition, results of operations, and cash flows.
A key element of our business strategy is to generate a high volume of traffic on our consumer websites, through our mobile sites and applications, and through our various telephone numbers. However, we may not be able to accommodate all of the growth in user demand through our consumer websites, mobile sites and applications, or through various telephone numbers. Our inability to add additional hardware and software to upgrade our existing technology or network infrastructure to accommodate, in a timely manner, increased traffic through our consumer websites, our mobile sites and applications, or our various telephone numbers, may cause decreased levels of customer service and satisfaction. Failure to implement new systems effectively or within a reasonable period of time could materially and adversely affect our business, financial condition, results of operations, and cash flows.
We also regularly introduce additional or enhanced features and services to retain current customers and attract new customers to our consumer websites and mobile sites and applications. If we introduce a feature or a service that is not favorably received, our current customers may not use our consumer websites or mobile sites and applications as frequently or we may not be successful in attracting new customers. We may also experience difficulties that could delay or prevent us from introducing new services and features. Furthermore, these new services or features may contain errors that are discovered only after they are introduced. We may need to significantly modify the design of these services or features to correct errors. If customers encounter difficulty with or do not accept new services or features, our business, financial condition, results of operations, and cash flows could be materially and adversely affected.
Our business could suffer as a result of significant credit card or debit card fraud.
Orders placed through our consumer websites, mobile sites and applications, or various telephone numbers typically are paid for using a credit or debit card. Our revenues and gross margins could decrease if we experience significant credit or debit card fraud. Failure to adequately detect and avoid fraudulent credit or debit card transactions could cause us to lose our ability to accept credit or debit cards as forms of payment and result in charge-backs of the fraudulently charged amounts. Furthermore, widespread credit or debit card fraud may lessen our customers’ willingness to purchase products on our consumer websites, through our mobile sites and applications, or through our various telephone numbers. As a result, such failure could materially and adversely affect our business, financial condition, results of operations, and cash flows.
We utilize outsourced staff and temporary employees, who may not be as well-trained or committed to our customers as our permanent employees, and their failure to provide our customers with high-quality customer service may cause our customers not to return, which could materially and adversely affect our business, financial condition, results of operations, and cash flows.
We utilize and rely on a significant number of outsourced staff and temporary employees, in addition to our permanent employees, to take orders, respond to customer inquiries, and work in our distribution facilities to process and fulfill orders. These outsourced staff and temporary employees may not have the same level of commitment to our customers or be as well-trained as our permanent employees. In addition, we may not hire enough outsourced staff or temporary employees to adequately handle the increased volume of telephone calls we receive and orders we fulfill and ship during peak periods. We maintain only a limited number of permanent customer support and distribution center employees and rely on third-party vendors for outsourced customer support. Our permanent employees may not be able to provide the necessary range or level of customer support services in the event that one or more of our third-party vendors unexpectedly become unable or unwilling to provide some or all of these services to us. In addition, we may not be able to adequately staff our distribution centers during peak periods to enable us to fulfill and ship orders on a timely basis. If our customers are dissatisfied with the quality of the customer service they receive, they may not place orders with us again, which could materially and adversely affect our business, financial condition, results of operations, and cash flows.
Our business could be shut down or could be materially and adversely affected by a catastrophic event.
Our business could be materially and adversely affected by a catastrophic event. A disaster such as a fire, earthquake, flood, power loss, terrorism, or other similar event, affecting any of our facilities, data centers, or computer systems, or those of our third-party vendors, or a system interruption or delay that slows down the internet or makes the internet or our websites temporarily unavailable, could result in a significant and extended disruption of our operations and services. Any prolonged disruption of our services due to these or other events would severely impact our business. We do not carry flood insurance for our facilities, and the property, business interruption, and other insurance we do carry may not be sufficient to cover all losses, if any, that may occur as a result of any events which cause interruptions in our services.
23
Legal actions or investigations could subject us to substantial liability, require us to change our business practices, and materially and adversely affect our business, financial condition, results of operations, and cash flows.
We are currently, and have been in the past, party to various legal actions and investigations. These actions may include, without limitation, claims by private parties in connection with consumer protection and other laws; claims that we infringe third-party patents, trademarks, copyrights, or other intellectual property or proprietary rights; securities laws claims; claims involving marketing practices or unfair competition; claims in connection with employment practices; breach of contract claims; and other business-related claims. The nature of our business could subject us to additional claims for similar matters, as well as a wide variety of other claims, including, without limitation, for privacy and security matters. The failure to successfully defend against these and other types of claims, including claims relating to our business practices, could result in our incurring significant liabilities related to judgments or settlements or require us to change our business practices. Infringement claims may also result in our being required to obtain licenses from third parties, which licenses may not be available on acceptable terms, if at all. Both the cost of defending claims, as well as the effect of settlements and judgments, could cause our results of operations to fluctuate significantly from period to period and could materially and adversely affect our business, financial condition, results of operations, and cash flows. In addition, we also file actions against third parties from time to time for various reasons, including, without limitation, to protect our intellectual property rights, enforce our contractual rights, or make other business-related claims. The legal fees, costs, and expenses associated with these actions may be significant, and if we were to lose these actions, we may be required to pay the other party’s legal fees, costs, and expenses, which also may be significant and could materially and adversely affect our business, financial condition, results of operations, and cash flows.
Various governmental agencies have in the past asserted claims, instituted legal actions, inquiries or investigations, or imposed obligations relating to our business practices, such as our marketing, billing, customer retention, renewal, cancellation, refund, and disclosure practices, and they may continue to do so in the future. For example, in 2015, we entered into settlements and made settlement payments relating to an inquiry by a multi-state group of Attorneys General. The primary focus of the underlying inquiry concerned the Company’s former post-transaction sales practices. We may not prevail in existing or future claims, and any judgment against us, settlement, or resolution of such claims may involve the payment of significant sums, including damages, fines, penalties, or assessments, or changes to our business practices. Defending against lawsuits, inquiries, and investigations also involves significant expense and diversion of management’s attention and resources from other matters.
Additional governmental investigations or other legal actions may be instituted in connection with prior sales practices or other current or former business practices. Enforcement actions or changes in enforcement policies and procedures could result in changes to our business practices, as well as significant damages, fines, penalties, or assessments, which could decrease our revenues or increase the costs of operating our business. To the extent that our services and business practices change as a result of claims or actions by governmental agencies or private parties, or we are required to pay significant sums, including damages, fines, penalties, or assessments, our business, financial condition, results of operations, and cash flows could be materially and adversely affected.
The Separation and Distribution Agreement which was executed between FTD and United Online in connection with the Company’s November 2013 separation from United Online (the “Separation”) provides United Online with the right to control the litigation and settlement of certain litigation matters that relate to United Online, its predecessors, and its consolidated subsidiaries and the Company, its predecessors, and its consolidated subsidiaries, and which were asserted before the Separation, as well as specified litigation matters which are asserted after the Separation. These matters include matters relating to the Company’s former post-transaction sales practices or other current or former business practices described above. The Separation and Distribution Agreement also provides for the allocation of liabilities and expenses between United Online and the Company with respect to these matters. In May 2015, FTD and United Online entered into an amendment to the Separation and Distribution Agreement providing for the parties to jointly coordinate the litigation and settlement of certain specified litigation matters which are asserted after the Separation. In addition, pursuant to such amendment, the foregoing obligations of the parties will terminate on May 20, 2017, provided that for certain matters that may be pending as of such date, such obligations will terminate no later than May 20, 2019. The Separation and Distribution Agreement also establishes procedures with respect to claims subject to indemnification, insurance claims, and related matters. The Company and United Online may not prevail in future claims and any judgments against the Company, or settlement or resolution of such claims may involve the payment of significant sums, including damages, fines, penalties, or assessments, or changes to the Company’s business practices. See Note 15—“Commitments and Contingencies—Legal Matters” to the Notes to the Consolidated Financial Statements included in Part II, Item 8 of this Form 10-K.
24
We may be unsuccessful at acquiring future additional businesses, services, or technologies. Even if we make acquisitions in the future, it may not improve our results of operations and could also materially and adversely affect our business, financial condition, results of operations, and cash flows.
Acquisitions of businesses, services, or technologies may provide us with an opportunity to diversify the products and services we offer, leverage our assets and core competencies, complement our existing business, or expand our geographic reach. We may evaluate a wide variety of potential strategic transactions that we believe may complement our existing business. However, we may not realize the anticipated benefits and synergies of an acquisition, and our attempts at integrating an acquired business may not be successful. Acquiring businesses, services, or technologies involves many operational and financial risks, including risks relating to:
• | disruption of our ongoing business and significant diversion of resources and management time from day-to-day responsibilities; |
• | acquisition financings that involve the issuance of potentially dilutive equity or the incurrence of debt; |
• | reduction of cash and other resources available for operations and other uses; |
• | exposure to risks specific to the acquired businesses, services, or technologies to which we are not currently exposed; |
• | risks of entering markets in which we have little or no direct prior experience; |
• | unforeseen obligations or liabilities; |
• | difficulty assimilating the acquired customer bases, technologies, and operations; |
• | difficulty assimilating and retaining management and employees of the acquired businesses; |
• | potential impairment of relationships with customers or vendors as a result of changes in management of the acquired businesses or other factors; |
• | large write-offs, either at the time of the acquisition or in the future, the incurrence of restructuring and other exit costs, the amortization of identifiable intangible assets, and the impairment of amounts capitalized as goodwill, intangible assets, and other long-lived assets; and |
• | lack of, or inadequate, controls, policies, and procedures appropriate for a public company, and the time, cost, and difficulties related to the implementation of such controls, policies, and procedures or the remediation of any deficiencies. |
In addition to the risks set forth above, an acquisition of a foreign business involves risks associated with foreign currency exchange rates, potentially unfamiliar economic, political, and regulatory environments, and integration difficulties due to language, cultural, and geographic differences. Any of these risks, whether the acquired business is domestic or foreign, could materially and adversely affect our business, financial condition, results of operations, and cash flows.
Certain of our directors may have actual or potential conflicts of interest because of their employment with and possible stock ownership of Liberty.
We have employees of Liberty on our board of directors, which may lead to conflicting interests. Our board of directors includes Robin Pringle Hickenlooper and Christopher W. Shean, our former Interim President and Chief Executive Officer between November 1, 2016 and February 28, 2017, who are employees of Liberty. These individuals may have actual or apparent conflicts of interest with respect to matters involving or affecting each company.
25
Governmental regulation of the collection and use of personal information or our failure to comply with these regulations could materially and adversely affect our business.
The FTC regulates the collection and use of personal information obtained from individuals when accessing websites, with particular emphasis on access by minors. In addition, other governmental authorities have regulations to govern the collection and use of personal information that may be obtained from customers or visitors to websites. These regulations include requirements that procedures be established to disclose and notify users of our websites of our privacy and security policies, obtain consent from users for collection and use of personal information, and provide users with the ability to access, correct, or delete personal information stored by us. In addition, the FTC and other governmental authorities have made inquiries and investigations of companies’ practices with respect to their users’ personal information collection and dissemination practices to confirm these are consistent with stated privacy policies and to determine whether precautions are taken to secure consumers’ personal information. The FTC and certain state agencies also have made inquiries, and in a number of situations, brought actions against companies to enforce the privacy policies of these companies, including policies relating to security of consumers’ personal information.
Becoming subject to the regulatory and enforcement efforts of the FTC, a state agency, or other governmental authority could have a material adverse effect on our ability to collect demographic and personal information from users, which, in turn, could have a material adverse effect on our marketing efforts, business, financial condition, results of operations, and cash flows. In addition, the negative publicity regarding the existence or results of an investigation could have an adverse impact on customers’ willingness to use our websites and services and thus could adversely impact our future revenues.
Certain of our international businesses, such as our international consumer and floral network businesses, must also comply with international data protection and privacy laws, including the U.K. Data Protection Act 1998. If we or any of the third-party service providers on which we rely fail to transmit customer information and payment details in a secure manner, or if they otherwise fail to protect customer privacy in online transactions, or if they transfer personal information outside the European Economic Area without complying with certain required conditions, then we risk being exposed to civil and criminal
liability in the U.K., usually in the form of fines, as well as claims from individuals alleging damages as a result of the alleged non-compliance. Additionally, in April 2016, the European Parliament adopted the General Data Protection Regulation. Expected to go into full effect in May 2018, this new regulation will create new individual privacy rights and obligations for companies handling personal data. We may also be required to alter our data collection and use practices. Any of the foregoing could materially and adversely affect our business, financial condition, results of operations, and cash flows.
Changes in laws and regulations and new laws and regulations could materially and adversely affect our business, financial condition, results of operations, and cash flows.
We are subject to a variety of international, federal, state, and local laws and regulations, including, without limitation, those relating to taxation; bulk email, or “spam,” advertising, including, without limitation, targeted or behavioral advertising, user privacy and data protection; food production, safety, storage, marketing and distribution; consumer protection; supply chain operations; anti-bribery; labor; antitrust; and unclaimed property. Compliance with the various laws and regulations, which in many instances are either unclear or unsettled, is complex. New laws and regulations, such as those being considered or recently enacted by certain states or the federal government related to automatic renewal practices, user privacy, targeted or behavioral advertising, floral related fees and advertising, and taxation, could impact our revenues or certain of our business practices or those of our advertisers. Any changes in the laws and regulations applicable to us, the enactment of any additional laws or regulations, or the failure to comply with, or increased enforcement activity of, such laws and regulations, could significantly impact our products and services, our costs, or the manner in which we or our advertisers conduct business, all of which could materially and adversely affect our business, financial condition, results of operations, and cash flows.
Proposed changes in U.S. federal tax legislation could adversely affect our financial condition, results of operations, and cash flows.
Future legislation, regulatory reform, or policy changes under the current U.S. administration could have a material effect on our business and results of operations. There exists the potential for comprehensive tax reform in the United States that may significantly change the tax rules applicable to U.S. domiciled corporations. Changes such as lower corporate tax rates, repatriation allowances, removal of the interest expense deduction, or the introduction of a border adjustment tax could impact the Company as a U.S. taxpayer, as well as the demand for our products and services. At this time, we cannot assess what the overall effect of such potential legislation could be on our results of operations or cash flows.
26
Foreign, state, and local governments may attempt to impose additional sales and use taxes, value added taxes, or other taxes on our business activities, including our past sales, which could decrease our ability to compete, reduce our sales, and could materially and adversely affect our business, financial condition, results of operations, and cash flows.
In accordance with current industry practice by domestic floral and gift order gatherers and our interpretation of applicable law, our consumer businesses collect and remit sales and use taxes on consumer orders that are delivered in a limited number of states where it has a physical presence or other form of jurisdictional nexus. If states successfully challenge this practice and impose sales and use taxes on orders delivered in states where we do not have physical presence or another form of jurisdictional nexus, we could incur substantial tax liabilities for past sales and lose future sales as a result of the increased tax cost that would be borne by the customer. Also, states may seek to reclassify the status of internet order gatherers, such as our consumer businesses, as persons that are deemed to fulfill the underlying order, in which case, a state may seek to impose taxes on the receipts generated from consumer orders fulfilled and delivered by florists or other third parties outside such state. In addition, future changes in the operation of our online, mobile sites and applications, and telephonic sales channels could result in the imposition of additional sales and use tax or other tax obligations.
Additionally, in accordance with current industry practice by international floral and gift direct marketers and our interpretation of applicable law, we collect and remit value added taxes on certain consumer orders placed through Interflora. Future changes in the operation of our business could result in the imposition of additional tax obligations. Moreover, if a foreign taxing authority successfully challenges our current practice or implements new legislative initiatives, we could incur substantial tax liabilities for past sales and lose future sales as a result of the increased tax costs that would be borne by the customer. The imposition of additional tax liabilities for past or future sales could decrease our ability to compete with traditional retailers and reduce our sales, which could materially and adversely affect our business, financial condition, results of operations, and cash flows.
We are subject to income and various other taxes in the U.S. and numerous foreign jurisdictions. Significant judgment is required in evaluating our consolidated provision for income taxes. During the ordinary course of business, there are many transactions for which the ultimate tax determination is uncertain. We are subject to audit in various jurisdictions, and such jurisdictions may assess additional income and other taxes against us. The final determination of tax audits and any related litigation could be materially different from our historical income tax provisions and our historical recognition of other tax matters. The results of an audit or litigation could materially and adversely affect our business, financial condition, results of operations, and cash flows.
In connection with our internet-based transactions, a number of states have been considering adopting legislation or instituting policy initiatives, including those that would facilitate a finding of nexus to exist between internet companies with the states, aimed at expanding the reach of sales and use taxes or imposing state income or other taxes on various innovative theories, including agency attribution from independent third-party service providers. Such legislation or initiatives could result in the imposition of additional sales and use taxes, or the payment of state income or other taxes, on certain transactions conducted over the internet. In addition, advertisers and other third parties may choose to not do business with us in order to avoid nexus with certain states. If such legislation is enacted, or such initiatives are instituted, and unless overturned by the courts, the legislation or initiatives could subject us to substantially increased tax liabilities for past and future sales or state income or other taxes, require us to collect additional sales and use taxes, cause our future sales to decrease, or otherwise materially and adversely affect our business, financial condition, results of operations, and cash flows.
Risks Relating to Our Common Stock
The limited public float and trading volume for FTD common stock may have an adverse impact and cause significant fluctuation of market price.
Our common stock is held by a relatively small number of stockholders. Liberty holds 37.4% of our outstanding shares and four institutional stockholders hold significant blocks of 5.3% to 8.2%. Our officers, directors, and members of management acquire stock or have the potential to own stock through previously granted equity awards. Consequently, our common stock has a relatively small float and low average daily trading volume, which could affect a stockholder’s ability to sell our stock or the price at which it can be sold. In addition, future sales of substantial amounts of our common stock in the public market by those larger stockholders, or the perception that these sales could occur, may adversely impact the market price of the stock and our stock could be difficult for a stockholder to liquidate.
There can be no assurance that an active trading market for our common stock will be sustained in the future. The lack of an active trading market may make it more difficult for you to sell our shares and could lead to our share price being depressed or more volatile.
27
The market price of our common stock may fluctuate significantly.
We cannot predict the prices at which our common stock may trade in the future. The market price of our common stock may fluctuate significantly, depending upon many factors, some of which may be beyond our control, including, but not limited to:
• | our limited public float as discussed above; |
• | a shift in our investor base; |
• | our quarterly or annual earnings or those of other companies in our industry; |
• | actual or anticipated fluctuations in our operating results; |
• | success or failure of our business strategy; |
• | our ability to obtain financing as needed; |
• | changes in accounting standards, policies, guidance, interpretations, or principles; |
• | changes in laws and regulations affecting our business, including tax legislation; |
• | announcements by us or our competitors of significant acquisitions or dispositions; |
• | the failure of securities analysts to cover our common stock; |
• | changes in earnings estimates by securities analysts or our ability to meet our earnings guidance; |
• | the operating and stock price performance of other comparable companies; |
• | investor perception of us and the floral and gift retail industry; |
• | overall market fluctuations; and |
• | general economic conditions and other external factors. |
Stock markets in general have also experienced volatility that has often been unrelated to the operating performance of a particular company. These broad market fluctuations could materially and adversely affect the trading price of our common stock.
As a significant stockholder of us, Liberty has significant influence over us, its presence may affect the ability of a third party to acquire control of us, and its interests may not coincide with yours.
As of December 31, 2016, Liberty beneficially owned 37.4% of the outstanding shares of FTD common stock. In connection with the close of the acquisition of Provide Commerce, Liberty selected four new directors for appointment to the FTD board, increasing the board from seven to eleven directors. In addition, the Investor Rights Agreement contains certain rights in favor of Liberty with regard to the appointment and election of Liberty nominees to the FTD board. Although the Liberty directors do not constitute a majority of the FTD board, they may exercise influence over the decisions of the FTD board. This composition of the FTD board may affect our business strategy and operating decisions, as Liberty has significant influence over our affairs, policies, and operations, such as the appointment of management, and the strategic direction of the company, including decisions as to whether to enter into or otherwise pursue strategic transactions. Liberty’s interests may not in all cases be aligned with the interests of other FTD stockholders.
Furthermore, having Liberty as a significant stockholder may have the effect of making it more difficult for a third-party to acquire, or of discouraging a third-party from seeking to acquire, a majority of the outstanding shares of FTD common stock or control of the FTD board of directors through a proxy solicitation. In that regard, the Investor Rights Agreement contains certain provisions that may magnify these risks, including Liberty’s right, in certain circumstances in response to a third-party tender offer for shares of FTD common stock, to commence its own tender offer, restrictions on Liberty’s ability to transfer shares of FTD common stock, the waiver of Section 203 of the General Corporation Law of the State of Delaware (“DGCL”) with respect to Liberty and its affiliates and the prohibition upon FTD from implementing a stockholder rights plan, unless the plan exempts certain actions by Liberty in accordance with the terms of the Investor Rights Agreement.
28
Future sales of FTD common stock by Liberty, or the perception that such sales could occur, could cause our stock price to decline.
In connection with the Acquisition, FTD and Liberty entered into an investor rights agreement (the “Investor Rights Agreement”). The Investor Rights Agreement imposes certain restrictions on Liberty’s ability to transfer its shares of FTD common stock. However, the Investor Rights Agreement does grant Liberty certain registration rights that, if exercised, would permit Liberty to sell a large number of shares of our common stock in a short period of time. The sale of a substantial number of shares of our common stock by Liberty or our other stockholders within a short period of time, or the perception that such sales could occur, could cause our stock price to decline, make it more difficult for us to raise funds through future offerings of our common stock or acquire other businesses using our common stock as consideration.
Our ability to repurchase shares of our common stock is limited due to our Investor Rights Agreement.
The Investor Rights Agreement with Liberty provides that Liberty’s ownership in FTD is capped at 40.0% of FTD’s common stock outstanding beginning January 1, 2017, subject to certain exceptions, including with respect to third-party tender offers. Liberty’s ownership in FTD was 37.4% at December 31, 2016. In March of 2016, our board of directors approved a new share repurchase program (the “2016 Repurchase Program”) which authorized us to repurchase up to $60 million of our common stock over a two year period. Through December 31, 2016, we repurchased 600,000 shares at an aggregate cost of $15.2 million, leaving $44.8 million available under the 2016 Repurchase Program. Due to the Liberty ownership cap, the amount of common stock we can repurchase may be limited in the future. Our ability to repurchase our shares is a component of our capital management and shareholder return practices that we believe is important to our shareholders, and any restriction on our ability to repurchase our shares could make our stock less attractive to investors.
Your percentage ownership in our company may be diluted in the future.
We have established equity incentive plans that will provide for the grant of common stock-based equity awards to our directors, officers, and employees. Your percentage ownership in our company may be diluted in the future because of equity awards that we expect to grant under these plans. In addition, we may issue equity as all or part of the consideration paid for acquisitions and strategic investments we may make in the future. If we issue additional common equity, either through public or private offerings or rights offerings, your percentage ownership in our company would decline if you do not participate on a ratable basis.
Provisions in our charter documents and the DGCL could discourage potential acquisition proposals, could delay, deter, or prevent a change in control, and could limit the price certain investors might be willing to pay for our common stock.
Certain provisions of the DGCL and our certificate of incorporation and bylaws may inhibit a change of control not approved by our board of directors or changes in the composition of our board of directors, which could result in the entrenchment of current management. These provisions include:
• | advance notice requirements for nominations of candidates for election to our board of directors or for proposing matters that can be acted on by stockholders at annual meetings of stockholders; |
• | limitations on who may call special meetings of stockholders; |
• | limitations on the ability of stockholders to amend, alter, or repeal our bylaws; |
• | the division of our board of directors into three classes with staggered terms; |
• | limitations on the removal of directors; |
• | the inability of the stockholders to act by written consent; and |
• | the authority of our board of directors to issue, without stockholder approval, “blank check” preferred stock with such terms as the board of directors may determine to increase the number of outstanding shares and thwart a takeover attempt. |
29
We believe these provisions protect our stockholders from coercive or harmful takeover tactics by requiring potential acquirers to negotiate with our board of directors and by providing our board of directors with adequate time to assess any acquisition proposal and are not intended to make our company immune from takeovers. However, these provisions apply even if the offer may be considered beneficial by some stockholders and could delay or prevent an acquisition that our board of directors determines is not in the best interests of our company and our stockholders.
We currently do not expect to pay any cash dividends and the price of our stock may not appreciate.
We presently intend to retain future earnings, if any, to reinvest in the growth of our businesses, to make interest payments on or pay down our debt, and to fund potential acquisitions. As a result, we do not currently expect to pay any cash dividends. If we do not pay dividends, the price of our common stock must appreciate for you to recognize a gain on your investment upon sale. This appreciation may not occur.
We may issue preferred stock with terms that could dilute the voting power or reduce the value of our common stock.
While we have no specific plan to issue preferred stock, our certificate of incorporation authorizes us to issue, without the approval of our stockholders, one or more classes or series of preferred stock having such designation, powers, privileges, preferences, including preferences over our common stock with respect to dividends and distributions, terms of redemption and relative participation, or other rights, if any, of the shares of each such series of preferred stock and any qualifications, limitations or restrictions thereof, as our board of directors may determine. The terms of one or more classes or series of preferred stock could dilute the voting power or reduce the value of our common stock. For example, the repurchase or redemption rights or liquidation preferences we could assign to holders of preferred stock could affect the residual value of the common stock.
Risks Relating to Our Relationship with Our Former Parent
If the Separation and related distribution of FTD common stock fails to qualify as a tax-free transaction for U.S. federal income tax purposes, then the distribution could result in significant tax liabilities.
United Online received a private letter ruling from the Internal Revenue Service (“IRS”) and an opinion of tax counsel, each substantially to the effect that the Separation and the distribution of shares of FTD common stock qualifies as a transaction that is tax free for U.S. federal income tax purposes and will not result in the recognition, for U.S. federal income tax purposes, of income, gain, or loss by United Online or its stockholders. The IRS ruling and the tax opinion rely on certain facts, assumptions, and undertakings, and certain representations from United Online and us, regarding the past and future conduct of both respective businesses and other matters, and the tax opinion relies on the IRS ruling. Notwithstanding the IRS ruling and the tax opinion, the IRS could determine that the distribution should be treated as a taxable transaction if it determines that any of these facts, assumptions, representations, or undertakings is not correct, or that the distribution should be taxable for other reasons, including if the IRS were to disagree with the conclusions in the tax opinion that are not covered by the IRS ruling.
If the distribution ultimately were to be determined to be taxable, then a stockholder of United Online that received shares of our common stock in the distribution would be treated as having received a distribution of property in an amount equal to the fair market value of such shares on the distribution date and could incur significant income tax liabilities. Such distribution would be taxable to such stockholder as a dividend to the extent of United Online’s current and accumulated earnings and profits. Any amount that exceeded United Online’s earnings and profits would be treated first as a non-taxable return of capital to the extent of such stockholder’s tax basis in its shares of United Online stock with any remaining amount being taxed as a capital gain. In addition, United Online would recognize a taxable gain in an amount equal to the excess, if any, of the fair market value of the shares of common stock of our company held by United Online on the distribution date over United Online’s tax basis in such shares.
In addition, under the terms of the Tax Sharing Agreement that we entered into with United Online, we are generally responsible for any taxes imposed on United Online that arise from the failure of the distribution to qualify as tax free for U.S. federal income tax purposes within the meaning of Section 355 of the Internal Revenue Code (the “Code”) to the extent such failure to qualify is attributable to actions, events or transactions relating to our stock, assets or business, or a breach of the relevant representations or any covenants made by us in the Tax Sharing Agreement, the materials submitted to the IRS in connection with the request for the IRS ruling or the representation letter provided to counsel in connection with the tax opinion. The amounts of such taxes could be significant.
30
We are bound by a number of agreements, including the Separation and Distribution Agreement and the Tax Sharing Agreement, that we entered into with United Online in connection with the Separation.
In connection with the Separation, we entered into a number of agreements with United Online that govern the ongoing relationships between United Online and its subsidiaries and us after the Separation. As described more fully above, the Separation and Distribution Agreement governs the rights and obligations of our company and United Online regarding the Separation and provides United Online with the right to control the litigation and settlement of certain litigation matters that relate to us, United Online, and our respective predecessors and consolidated subsidiaries.
The Tax Sharing Agreement governs the rights, responsibilities, and obligations of United Online and our company with regard to various tax matters, including the payment of taxes, the preparation of tax returns, and the administration of tax audits and disputes. There are certain significant areas where the tax liabilities of our former parent may become our obligations. For example, under the Code and the related rules and regulations, each corporation that was a member of the United Online consolidated tax reporting group during any full or partial taxable period ending on or before the effective time of the distribution is jointly and severally liable for the U.S. federal income tax liability of the entire United Online consolidated tax reporting group for such taxable period. The Tax Sharing Agreement allocates the responsibility for prior period taxes of the United Online consolidated tax reporting group between us and United Online. If however, United Online were unable to pay any prior period taxes for which it is responsible, we could be required to pay the entire amount of such taxes, and such amounts could be significant. Other provisions of federal, state, local, or foreign law may establish similar liability for other matters, including laws governing tax-qualified pension plans, as well as other contingent liabilities.
ITEM 1B. UNRESOLVED STAFF COMMENTS
None.
ITEM 2. PROPERTIES
We own our corporate headquarters located in Downers Grove, Illinois, which houses our executive offices and our Consumer and Florist segments. We also own the building that is occupied by Interflora in Sleaford, England.
We lease two facilities in the U.S. that serve as call centers for our Consumer and Provide Commerce segments. We also lease nine facilities in the U.S. that serve as distribution centers for our Provide Commerce and Florist segments and two warehouse facilities in the U.S. for our Provide Commerce segment.
We lease office space in San Diego and San Francisco, California and Woodridge, Illinois, for our Provide Commerce segment, in Quebec, Canada, for our Florist segment, and in Hyderabad, India, for technology development and support related to all our segments. We believe that our existing facilities are in good condition and adequate to meet our current requirements, and that suitable additional or substitute space will be available, as needed, to accommodate any physical expansion of our corporate and operations facilities.
The Credit Agreement includes a security interest in substantially all of our assets, including a mortgage on the owned real property at our Downers Grove, Illinois location. For additional information regarding our obligations under leases, see Note 15—“Commitments and Contingencies” of the Notes to the Consolidated Financial Statements included in Part II, Item 8 of this Form 10-K.
ITEM 3. LEGAL PROCEEDINGS
Commencing on August 19, 2009, the first of a series of putative consumer class action lawsuits was brought against Provide Commerce, Inc. and co-defendant Regent Group, Inc. d/b/a Encore Marketing International (“EMI”). These cases were ultimately consolidated during the next three years into Case No. 09 CV 2094 in the United States District Court for the Southern District of California under the title In re EasySaver Rewards Litigation. Plaintiffs’ claims arise from their online enrollment in subscription based membership programs known as EasySaver Rewards, RedEnvelope Rewards, and Preferred Buyers Pass (collectively the “Membership Programs”). Plaintiffs claim that after they ordered items from certain of Provide Commerce’s websites, they were presented with an offer to enroll in one of the Membership Programs, each of which is offered and administered by EMI. Plaintiffs purport to represent a nationwide class of consumers allegedly damaged by Provide Commerce’s purported unauthorized or otherwise allegedly improper transferring of billing information to EMI, who then posted allegedly unauthorized charges to their credit or debit card accounts for membership fees for the Membership Programs. In the operative fourth amended complaint, plaintiffs assert ten claims against Provide Commerce and EMI: (1) breach of contract (against Provide Commerce only); (2) breach of contract (against EMI only); (3) breach of implied covenant of good
31
faith and fair dealing; (4) fraud; (5) violations of the California Consumers Legal Remedies Act; (6) unjust enrichment; (7) violation of the Electronic Funds Transfer Act (against EMI only); (8) invasion of privacy; (9) negligence; and (10) violations of the Unfair Competition Law. Plaintiffs seek damages, attorneys’ fees, and costs. After motion practice regarding the claims asserted and numerous settlement conferences and mediations in an effort to informally resolve the matter the parties reached an agreement on the high level terms of a settlement on April 9, 2012, conditioned on the parties negotiating and executing a complete written agreement. In the weeks following April 9, 2012, the parties negotiated a formal written settlement agreement (“Settlement”), which the court preliminarily approved on June 13, 2012. After notice to the class and briefing by the parties, the court conducted a final approval hearing (also known as a fairness hearing) on January 28, 2013, but did not rule. On February 4, 2013, the court entered its final order approving the Settlement, granting plaintiffs’ motion for attorneys’ fees, costs, and incentive awards, and overruling objections filed by a single objector. The court entered judgment on the Settlement on February 21, 2013. The objector filed a notice of appeal with the Ninth Circuit Court of Appeals on March 4, 2013. After the completion of briefing, the Ninth Circuit set oral argument for February 2, 2015. But on January 29, 2015, the Ninth Circuit entered an order deferring argument and resolution of the appeal pending the Ninth Circuit’s decision in a matter captioned Frank v. Netflix, No. 12 15705+. On March 19, 2015, the Ninth Circuit entered an order vacating the judgment in this matter and remanding it to the district court for further proceedings consistent with its opinion in Frank v. Netflix issued on February 27, 2015. The district court ordered supplemental briefing on the issue of final Settlement approval May 21, 2015. After briefing, the district court conducted a hearing on July 27, 2016 and took the matter under submission. On August 9, 2016, the district court entered an order reapproving the Settlement without any changes, and accordingly entered judgment and dismissed the case with prejudice. On September 6, 2016, the objector filed a notice of appeal. On November 22, 2016, plaintiffs filed a motion for summary affirmance of the district court’s judgment, to which the objector responded and filed a cross-motion for sanctions. Plaintiffs’ motion for summary affirmance temporarily stayed briefing on the appeal. On March 2, 2017, the Ninth Circuit denied plaintiffs’ motion for summary affirmance and objector’s cross-motion for sanctions, and reset the briefing schedule. Objector’s opening brief is due May 1, 2017. Absent an extension, the parties’ answering briefs are due May 31, 2017. Objector’s optional reply brief is presently due June 14, 2017. The date for oral argument on the appeal has not yet been set.
There are no assurances that other legal actions or governmental investigations will not be instituted in connection with the Company’s current or former business practices. The Company cannot predict the outcome of governmental investigations or other legal actions or their potential implications for its business.
The Company records a liability when it believes that it is both probable that a loss has been incurred, and the amount of loss can be reasonably estimated. The Company evaluates at least quarterly, developments in its legal matters that could affect the assessment of the probability of loss or the amount of liability and makes adjustments as appropriate. Significant judgment is required to determine both probability and the estimated amount. The Company may be unable to estimate a possible loss or range of possible loss due to various reasons, including, among others: (i) if the damages sought are indeterminate, (ii) if the proceedings are in early stages, (iii) if there is uncertainty as to the outcome of pending appeals, motions or settlements, (iv) if there are significant factual issues to be determined or resolved, and (v) if there are novel or unsettled legal theories presented. In such instances, there is considerable uncertainty regarding the ultimate resolution of such matters, including a possible eventual loss, if any. Legal matters are inherently unpredictable and subject to significant uncertainties, some of which are beyond the Company’s control. As such, there can be no assurance that the final outcome of these matters will not materially and adversely affect the Company’s business, financial condition, results of operations, or cash flows.
ITEM 4. MINE SAFETY DISCLOSURES
Not applicable.
32
PART II
ITEM 5. MARKET FOR REGISTRANT’S COMMON EQUITY, RELATED STOCKHOLDER MATTERS AND ISSUER PURCHASES OF EQUITY SECURITIES
Principal Market
Our common stock is listed on the NASDAQ Global Select Market under the symbol “FTD”. The following table sets forth, for the periods presented, the high and low sales prices of FTD common stock on the NASDAQ. The quotations are as reported in published financial sources.
Sales Price | |||||||
High | Low | ||||||
Fiscal 2016: | |||||||
First Quarter | $ | 26.90 | $ | 21.79 | |||
Second Quarter | $ | 28.70 | $ | 23.75 | |||
Third Quarter | $ | 27.68 | $ | 16.86 | |||
Fourth Quarter | $ | 26.19 | $ | 17.40 | |||
Fiscal 2015: | |||||||
First Quarter | $ | 35.45 | $ | 29.22 | |||
Second Quarter | $ | 30.56 | $ | 26.63 | |||
Third Quarter | $ | 31.99 | $ | 27.50 | |||
Fourth Quarter | $ | 30.34 | $ | 23.18 | |||
Shareholders
In connection with the Acquisition, we issued 10.2 million shares of FTD common stock to Liberty. Concurrent with the closing of the Acquisition, FTD and Liberty entered into an Investor Rights Agreement governing certain rights of and restrictions on Liberty in connection with the shares of FTD common stock that Liberty owns as a result of the Acquisition. As of December 31, 2016, Liberty holds 37.4% of FTD’s outstanding shares of common stock.
As of March 6, 2017, there were approximately 388 shareholders of record of FTD common stock.
Dividends
We have not paid any cash dividends on our common stock since the Separation on November 1, 2013. We do not currently anticipate paying any future cash dividends.
Issuer Purchases of Equity Securities
On February 27, 2014, the Company’s board of directors authorized a common stock repurchase program (the “2014 Repurchase Program”) that allowed us to repurchase up to $50 million of FTD common stock from time to time over a two-year period in both open market and privately negotiated transactions. No purchases were made under the 2014 Repurchase Program prior to 2015. During the year ended December 31, 2015, we had repurchased 1.8 million shares under the 2014 Repurchase Program at an average cost per share of $27.31, fully utilizing the $50 million authorization. On March 8, 2016, the FTD board of directors authorized a new common stock repurchase program (the “2016 Repurchase Program”) that allows us to repurchase up to $60 million of FTD common stock from time to time over a two-year period in both open market and privately negotiated transactions. As of December 31, 2016, the company has repurchased 0.6 million shares under the 2016 Repurchase Program at an average per share cost of $25.37 utilizing $15.2 million of the program authorization. Repurchased shares are held in treasury pending use for general corporate purposes, including issuances under various employee and director stock plans.
33
Upon vesting of restricted stock units (“RSUs”) or exercise of stock options, we do not collect the minimum statutory withholding taxes in cash from employees. Instead, we automatically withhold, from the RSUs that vest or stock options exercised, the portion of those shares with a fair market value equal to the amount of the minimum statutory withholding taxes due. The withheld shares are accounted for as repurchases of common stock but are not considered repurchases under the Program. We then pay the minimum statutory withholding taxes in cash.
Purchases of Equity Securities by the Issuer and Affiliated Purchases
The following table provides information regarding repurchases of our common stock during the quarter ended December 31, 2016:
(In thousands, except for share and per share amounts) | ||||||||||||||
Period | Total Number of Shares Purchased | Average Price Paid Per Share | Number of Shares Purchased as Part of Publicly Announced Plans or Programs(a) | Approximate Dollar Value of Shares that May Yet Be Purchased Under the Plans or Programs | ||||||||||
October 1 - October 31 | 150,000 | $ | 21.24 | 150,000 | $ | 44,778 | ||||||||
November 1 - November 30 | — | — | — | 44,778 | ||||||||||
December 1 - December 31 | — | — | — | 44,778 | ||||||||||
Total | 150,000 | $ | 21.24 | 150,000 | $ | 44,778 | ||||||||
(a) | On March 8, 2016, the Company’s board of directors authorized the 2016 Repurchase Program, a common stock repurchase program that allows FTD Companies, Inc. to repurchase up to $60 million of its common stock from time to time over a two-year period in both open market and privately negotiated transactions. |
34
Stock Performance Graph
The following graph compares the relative performance of our common stock, the Russell 2000 Index and the S&P SmallCap 600 Consumer Discretionary Index, our Peer Group Index. This graph covers the period from October 10, 2013 (the first day FTD common stock began “when-issued” trading on the NASDAQ Global Select Market) through December 31, 2016. The graph assumes that $100 was invested on October 10, 2013 in the common stock of FTD, the Russell 2000 Index, and our Peer Group Index, and also assumes the reinvestment of dividends. The stock price performance on the following graph is not necessarily indicative of future stock price performance.
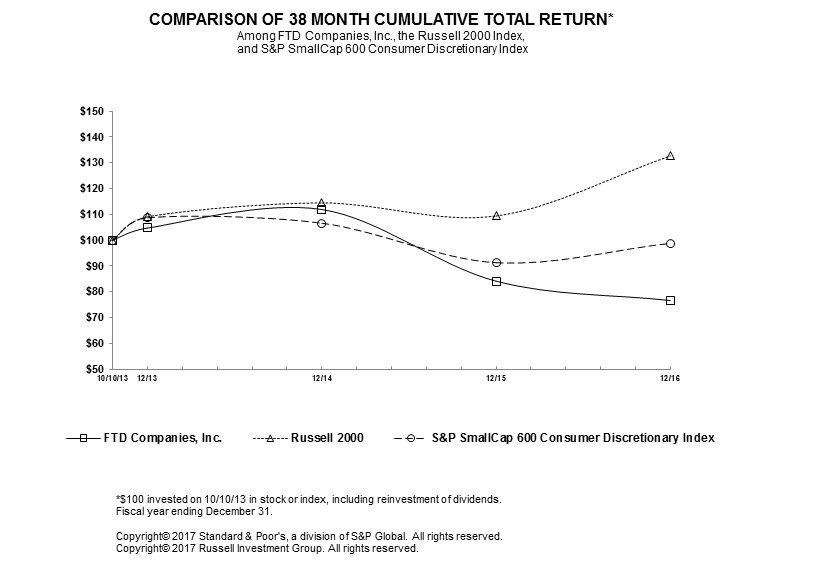
10/10/2013 | 12/31/2013 | 12/31/2014 | 12/31/2015 | 12/31/2016 | |||||||||||||||
FTD Companies, Inc | $ | 100.00 | $ | 104.73 | $ | 111.93 | $ | 84.12 | $ | 76.63 | |||||||||
Russell 2000 Index | $ | 100.00 | $ | 109.13 | $ | 114.47 | $ | 109.42 | $ | 132.73 | |||||||||
S&P SmallCap 600 Consumer Discretionary Index | $ | 100.00 | $ | 108.74 | $ | 106.63 | $ | 91.30 | $ | 98.83 | |||||||||
ITEM 6. SELECTED FINANCIAL DATA
The following table presents selected consolidated financial data, which should be read in conjunction with our consolidated financial statements and related notes and MD&A included elsewhere in this Form 10-K. The table presents the consolidated statements of operations and cash flow data for the three years ended December 31, 2016 and the consolidated balance sheet data at December 31, 2016 and 2015 derived from our audited consolidated financial statements included elsewhere in this Form 10-K, which have been revised to correct immaterial errors identified in the previously issued financial statements. For additional information, see Note 17—Immaterial Restatement of Prior Period Financial Statements in the Notes to Financial Statements in Part II, Item 8 of this Form 10-K. The table also presents the consolidated statements of operations and cash flow data for the years ended December 31, 2013 and 2012, and the consolidated balance sheet data at December 31, 2014 and 2013, which were derived from our audited consolidated financial statements that are not included in this Form 10-K and have also been revised for similar corrections in those periods.
35
Our historical consolidated financial statements prior to November 1, 2013 included allocations of certain corporate costs from United Online, including costs related to senior management, legal, human resources, finance, information technology, and centrally-managed employee benefit arrangements. We believe the allocations of corporate costs from United Online were reasonable and do not believe our costs would have been significantly different on a stand-alone basis prior to the Separation. The historical financial information presented may not necessarily reflect our financial position, results of operations, and cash flows as if we had operated as a stand-alone public company during the periods prior to November 1, 2013. Accordingly, our historical results should not be relied upon as an indicator of our future performance.
As the acquisition of Provide Commerce was completed on December 31, 2014, the Company’s consolidated balance sheet included Provide Commerce as of December 31, 2014, but no results of operations of Provide Commerce were included in the Company’s consolidated statements of operations and cash flow data for the year ended December 31, 2014.
The following amounts are in thousands, except per share data:
Year Ended December 31, | |||||||||||||||||||
2016 | 2015 | 2014 | 2013 | 2012 | |||||||||||||||
Consolidated Statements of Operations and Cash Flow Data: | |||||||||||||||||||
Revenues | $ | 1,121,999 | $ | 1,218,333 | $ | 639,005 | $ | 625,879 | $ | 612,048 | |||||||||
Impairment of goodwill and intangible assets(a) | $ | (84,000 | ) | $ | (85,000 | ) | $ | — | $ | — | $ | — | |||||||
Operating income/(loss)(b)(c)(d) | $ | (80,740 | ) | $ | (72,703 | ) | $ | 36,160 | $ | 32,362 | $ | 42,587 | |||||||
Net income/(loss) | $ | (83,191 | ) | $ | (80,142 | ) | $ | 21,528 | $ | 11,343 | $ | 19,622 | |||||||
Earnings/(loss) per common share(e): | |||||||||||||||||||
Basic | $ | (3.03 | ) | $ | (2.79 | ) | $ | 1.11 | $ | 0.61 | $ | 1.06 | |||||||
Diluted | $ | (3.03 | ) | $ | (2.79 | ) | $ | 1.11 | $ | 0.61 | $ | 1.06 | |||||||
Net cash provided by operating activities | $ | 76,949 | $ | 82,325 | $ | 47,384 | $ | 34,203 | $ | 66,955 | |||||||||
Cash dividends paid to United Online(f) | $ | — | $ | — | $ | — | $ | 18,201 | $ | 19,299 | |||||||||
Capital expenditures(g) | $ | 18,503 | $ | 18,255 | $ | 7,486 | $ | 10,830 | $ | 6,507 | |||||||||
As of December 31, | |||||||||||||||||||
2016 | 2015 | 2014(h) | 2013 | 2012 | |||||||||||||||
Consolidated Balance Sheet Data: | |||||||||||||||||||
Cash and cash equivalents | $ | 81,002 | $ | 57,892 | $ | 95,595 | $ | 48,162 | $ | 67,347 | |||||||||
Total assets(i) | $ | 962,314 | $ | 1,121,728 | $ | 1,328,967 | $ | 646,400 | $ | 677,279 | |||||||||
Long-term debt(d)(i)(j) | $ | 256,306 | $ | 274,946 | $ | 313,587 | $ | 216,495 | $ | 231,676 | |||||||||
Common shares outstanding(e) | 29,731 | 29,427 | 29,193 | 18,829 | 18,584 | ||||||||||||||
(a) | During the years ended December 31, 2016 and 2015, the Company recorded goodwill impairment charges related to the Provide Commerce segment. For additional information regarding goodwill, see “Critical Accounting Policies, Estimates, and Assumptions—Goodwill and Indefinite-Lived Intangible Assets,” which appears in Item 7 of this Form 10-K. |
(b) | During the year ended December 31, 2016, the Company incurred transaction-related and restructuring and other exit costs, primarily associated with the executive management changes and the Acquisition, that negatively impacted operating income by $15.4 million. During the years ended December 31, 2015 and 2014, the Company incurred transaction-related and restructuring and other exit costs associated with the Acquisition that negatively impacted operating income by $12.7 million and $12.4 million, respectively. During the year ended December 31, 2013, the Company incurred transaction-related costs associated with the Separation that negatively impacted operating income by $13.4 million. |
(c) | During the years ended December 31, 2016 and 2015, the Company recorded $60.9 million and $61.2 million, respectively, in amortization expense related to the intangibles recorded with the acquisition of Provide Commerce. The Company incurred amortization expense of $11.8 million, $22.9 million, and $25.5 million, in 2014, 2013, and 2012, respectively, related to intangibles recorded by the Company as a result of United Online’s acquisition of the Company. |
36
(d) | On July 17, 2013, FTD Companies, Inc. entered into a credit agreement (the “2013 Credit Agreement”) with Interflora British Unit, certain wholly owned domestic subsidiaries of FTD Companies, Inc. party thereto as guarantors, the financial institutions party thereto from time to time, Bank of America Merrill Lynch and Wells Fargo Securities, LLC, as joint lead arrangers and book managers, and Bank of America, N.A., as the administrative agent for the lenders, which provided for a $350 million five-year revolving credit facility. The Company repaid its previously outstanding credit facility in full and, in connection with such transaction, recorded a $2.3 million loss on extinguishment of debt during the year ended December 31, 2013, which was recorded in interest expense. |
(e) | As of December 31, 2016 and 2015, the Company held 2.4 million and 1.8 million shares of treasury stock, respectively. In connection with the 2014 acquisition of Provide Commerce, the Company issued 10.2 million shares of its common stock to Liberty. In addition, in connection with the Separation, the Company’s previously outstanding shares of common stock were automatically reclassified and became 18.6 million shares of common stock. The same number of shares was used to calculate basic and diluted earnings per share for the 2012 period, which was prior to the Separation. |
(f) | Prior to the Separation, FTD paid cash dividends to United Online in the amounts noted. |
(g) | Capital expenditures for the year ended December 31, 2013 included $2.3 million of capital expenditures related to the Separation and $1.2 million of payments for capital expenditures that were accrued at December 31, 2012. |
(h) | As the Acquisition closed on December 31, 2014, the Company’s consolidated balance sheet included Provide Commerce as of December 31, 2014, including acquired cash of $38.1 million. |
(i) | As of January 1, 2016, the Company adopted the accounting guidance related to the presentation of debt issuance costs. Total assets and long-term debt for all periods presented reflect the reclassifications of debt issuance costs from Total Assets to Long-term debt. |
(j) | On September 19, 2014, the Company amended and restated its Credit Agreement in its entirety (as amended and restated the “Credit Agreement”). The Credit Agreement provided for a $200 million term loan, the proceeds of which were used to repay a portion of outstanding revolving loans under the Credit Agreement. On December 31, 2014, the Company borrowed $120 million under the Credit Agreement to finance the cash portion of the Acquisition purchase price. |
ITEM 7. MANAGEMENT’S DISCUSSION AND ANALYSIS OF FINANCIAL CONDITION AND RESULTS OF OPERATIONS
This MD&A is a supplement to the accompanying consolidated financial statements and provides additional information on our business, recent developments, financial condition, liquidity and capital resources, cash flows, and results of operations. This MD&A should be read in conjunction with the consolidated financial statements and related notes included in Part II, Item 8 of this Form 10-K, and the other sections of this Form 10-K.
We have revised the previously reported consolidated financial statements and related metrics for the years ended December 31, 2015 and 2014 for certain errors that were not material in any of the years revised. See Note 17—Immaterial Restatement of Prior Period Financial Statements in the Notes to Financial Statements in Part II, Item 8 of this Form 10-K.
OVERVIEW
FTD Companies, Inc. (together with its subsidiaries may be referred to herein as the “Company,” “FTD,” “we,” “us,” or “our”) is a premier floral and gifting company with a vision to be the leading and most trusted floral and gifting company in the world. Our mission is to inspire, support, and delight our customers when expressing life’s most important sentiments. We provide floral, specialty foods, gift, and related products and services to consumers, retail florists, and other retail locations and companies in need of floral and gifting solutions. Our business uses the highly recognized FTD® and Interflora® brands, both supported by the iconic Mercury Man® logo. While we operate primarily in the United States (“U.S.”), Canada, the United Kingdom (“U.K.”), and the Republic of Ireland, we have worldwide presence as our Mercury Man logo is displayed in approximately 35,000 floral shops in nearly 150 countries. Our diversified portfolio of brands also includes ProFlowers®, ProPlants®, Shari’s Berries®, Personal Creations®, RedEnvelope®, Flying Flowers®, Flowers Direct®, Ink Cards™, Postagram™, and Gifts.com™. While floral arrangements and plants are our primary offerings, we also market and sell gift items, including gourmet-dipped berries and other specialty foods, personalized gifts, gift baskets, wine and champagne, jewelry, and spa products.
37
Acquisition of Provide Commerce
On December 31, 2014, we acquired from a wholly owned subsidiary of Liberty Interactive Corporation (“Liberty”) all of the issued and outstanding shares of common stock of Provide Commerce, Inc. (“Provide Commerce”), an indirect wholly owned subsidiary of Liberty, for a purchase price consisting of (i) cash consideration of $106.6 million, excluding acquired cash on hand of $38.1 million and a post-closing working capital adjustment of $9.9 million, and (ii) 10.2 million shares of FTD common stock (the “Acquisition”). At the closing of the Acquisition, these shares represented approximately 35% of the issued and outstanding shares of FTD common stock. In April 2015, FTD made a payment to Liberty in full satisfaction of the post-closing working capital adjustment. Upon the closing of the Acquisition, Provide Commerce became an indirect wholly owned subsidiary of FTD.
Reportable Segments
Prior to the Acquisition, we reported our business operations in three reportable segments: Consumer, Florist, and International. As a result of the Acquisition, which was completed on December 31, 2014, we began reporting our business in four reportable segments: Consumer, Provide Commerce, Florist, and International.
Through our Consumer segment, we are a leading direct marketer of floral and gift products for consumers, primarily in the U.S. and Canada. Our Consumer segment operates primarily through the www.ftd.com website, associated mobile sites, and the 1-800-SEND-FTD telephone number. Through our Provide Commerce segment, we are a leading direct marketer of floral and gift products for consumers, including food gifts, personalized gifts, and other gifting products, primarily in the U.S. Our Provide Commerce segment operates primarily through our www.proflowers.com, www.berries.com, www.personalcreations.com, www.proplants.com, and www.gifts.com websites, associated mobile sites and applications, and various telephone numbers. Through our Florist segment, we are a leading provider of products and services to our floral network members, including services that enable our floral network members to send, receive, and deliver floral orders. Floral network members include traditional retail florists, as well as other non-florist retail locations, primarily in the U.S. and Canada. Our Florist segment also provides products and services to other companies in need of floral and gifting solutions. Our International segment consists of Interflora, which operates primarily in the U.K. and the Republic of Ireland. Interflora is a premier direct marketer of floral and non-floral gift products, including bears, chocolates, wine, and tailored food products for consumers and operates primarily through the www.interflora.co.uk, www.flyingflowers.co.uk, www.flowersdirect.co.uk, and www.interflora.ie websites, associated mobile sites and applications, and various telephone numbers. Interflora also provides products and services to floral network members, funeral directors, independent gift shops, other retailers, and to other companies in need of floral and gifting solutions.
For additional information about our reportable segments refer to Note 3—“Segment Information” of the Notes to the Consolidated Financial Statements included in Part II, Item 8 of this Form 10-K.
Items Affecting Comparability of Financial Results
As a result of the Acquisition, our operating and reportable segments changed to include a fourth segment, Provide Commerce. Accordingly, beginning December 31, 2014, our operating and reportable segments consist of Consumer, Provide Commerce, Florist, and International. However, as the Acquisition was completed on December 31, 2014, no results of operations of Provide Commerce were included in the Company’s consolidated statements of operations for the year ended December 31, 2014. For additional information about our reportable segments refer to MD&A and Note 3—“Segment Information” of the Notes to the Consolidated Financial Statements included in Part II, Item 8 of this Form 10-K.
38
KEY BUSINESS METRICS
We review a number of key business metrics to help us monitor our performance and trends affecting our segments and to develop forecasts and budgets. These key metrics include the following:
Segment operating income. Our chief operating decision maker uses segment operating income to evaluate the performance of our business segments and to make decisions about allocating resources among segments. Segment operating income is operating income excluding depreciation, amortization, litigation and dispute settlement charges and gains, transaction-related costs, restructuring and other exit costs, and impairment of goodwill and intangible assets. Stock-based compensation and general corporate expenses are not allocated to the segments. Segment operating income is prior to intersegment eliminations and excludes other income (expense), net. See Note 3—“Segment Information” of the Notes to the Consolidated Financial Statements included in Part II, Item 8 of this Form 10-K for a reconciliation of segment operating income to consolidated operating income and consolidated income before income taxes.
Consumer orders. We monitor the number of consumer orders for floral, gift, and related products during a given period. Consumer orders are individual units delivered during the period that originated in the U.S. and Canada, primarily through the www.ftd.com, www.proflowers.com, www.berries.com, and www.personalcreations.com websites, associated mobile sites and applications, the 1-800-SEND-FTD telephone number and various other telephone numbers; and in the U.K. and the Republic of Ireland, primarily through the www.interflora.co.uk, www.flyingflowers.co.uk, and www.interflora.ie websites, associated mobile sites and applications, and various telephone numbers. The number of consumer orders is not adjusted for non-delivered orders that are refunded on or after the scheduled delivery date. Orders originating with a florist or other retail location for delivery to consumers are not included as part of this number.
Average order value. We monitor the average value for consumer orders delivered in a given period, which we refer to as the average order value. Average order value represents the average amount received for consumer orders delivered during a period. The average order value of consumer orders within our Consumer, Provide Commerce, and International segments is tracked in their local currency, the U.S. Dollar (“USD”) for both the Consumer and Provide Commerce segments and the British Pound (“GBP”) for the International segment. The local currency amounts received for the International segment are then translated into USD at the average currency exchange rate for the period. Average order value includes merchandise revenues and shipping or service fees paid by the consumer less discounts and refunds (net of refund-related fees charged to floral network members).
Average revenues per member. We monitor average revenues per member for our floral network members in the Florist segment. Average revenues per member represents the average revenues earned from a member of our floral network during a period. Revenues include services revenues and products revenues but exclude revenues from sales to non-members. Floral network members include our retail florists and other non-florist retail locations who offer floral and gifting solutions. Average revenues per member is calculated by dividing Florist segment revenues for the period, excluding sales to non-members, by the average number of floral network members for the period.
39
The table below sets forth, for the periods presented, our consolidated revenues, segment revenues, segment operating income, consumer orders, average order values, average revenues per member, and average currency exchange rates. Since the acquisition of Provide Commerce was completed on December 31, 2014, no results of operations were included for this segment for the year ended December 31 2014.
Year Ended December 31, | |||||||||||
2016 | 2015 | 2014 | |||||||||
(in thousands, except for average order values, average revenues per member, and average currency exchange rates) | |||||||||||
Consolidated: | |||||||||||
Consolidated revenues | $ | 1,121,999 | $ | 1,218,333 | $ | 639,005 | |||||
Consumer: | |||||||||||
Segment revenues(a) | $ | 291,275 | $ | 321,413 | $ | 318,343 | |||||
Segment operating income | $ | 30,210 | $ | 36,804 | $ | 31,310 | |||||
Consumer orders | 3,821 | 4,229 | 4,335 | ||||||||
Average order value | $ | 71.76 | $ | 70.83 | $ | 69.25 | |||||
Provide Commerce: | |||||||||||
Segment revenues(a) | $ | 529,733 | $ | 583,326 | NA | ||||||
Segment operating income | $ | 40,514 | $ | 41,802 | NA | ||||||
Consumer orders | 11,472 | 12,549 | NA | ||||||||
Average order value | $ | 45.50 | $ | 46.02 | NA | ||||||
Florist: | |||||||||||
Segment revenues(a) | $ | 166,881 | $ | 165,782 | $ | 162,552 | |||||
Segment operating income | $ | 48,406 | $ | 47,162 | $ | 47,077 | |||||
Average revenues per member | $ | 14,425 | $ | 13,493 | $ | 12,504 | |||||
International: | |||||||||||
Segment revenues (in USD) | $ | 152,700 | $ | 166,916 | $ | 176,501 | |||||
Segment revenues (in GBP) | £ | 112,330 | £ | 109,445 | £ | 107,271 | |||||
Segment operating income | $ | 19,128 | $ | 18,380 | $ | 18,544 | |||||
Consumer orders | 2,690 | 2,694 | 2,718 | ||||||||
Average order value (in USD) | $ | 46.67 | $ | 50.94 | $ | 54.01 | |||||
Average order value (in GBP) | £ | 34.36 | £ | 33.41 | £ | 32.84 | |||||
Average currency exchange rate: GBP to USD | 1.36 | 1.53 | 1.64 | ||||||||
(a) | Segment revenues are prior to intersegment eliminations. See Note 3—“Segment Information” of the Notes to the Consolidated Financial Statements included in Part II, Item 8 of this Form 10-K for a reconciliation of segment revenues to consolidated revenues. |
40
CONSOLIDATED OPERATING RESULTS
The following table sets forth, for the periods presented, selected historical consolidated statements of operations data. The information contained in the table below should be read in conjunction with “Critical Accounting Policies, Estimates and Assumptions,” “Liquidity and Capital Resources,” and “Contractual Obligations, Other Commitments and Off-Balance Sheet Arrangements,” included in this Item 7, and “Quantitative and Qualitative Disclosures About Market Risk” and the consolidated financial statements and accompanying notes thereto included elsewhere in this Form 10-K.
Year Ended December 31, | |||||||||||
2016 | 2015 | 2014 | |||||||||
(in thousands) | |||||||||||
Revenues | $ | 1,121,999 | $ | 1,218,333 | $ | 639,005 | |||||
Operating expenses: | |||||||||||
Cost of revenues | 703,642 | 766,619 | 403,566 | ||||||||
Sales and marketing | 229,569 | 248,627 | 111,368 | ||||||||
General and administrative | 112,720 | 123,244 | 75,922 | ||||||||
Amortization of intangible assets | 61,050 | 61,481 | 11,769 | ||||||||
Restructuring and other exit costs | 11,758 | 6,065 | 220 | ||||||||
Impairment of goodwill and intangible assets | 84,000 | 85,000 | — | ||||||||
Total operating expenses | 1,202,739 | 1,291,036 | 602,845 | ||||||||
Operating income/(loss) | (80,740 | ) | (72,703 | ) | 36,160 | ||||||
Interest expense, net | (9,195 | ) | (9,243 | ) | (5,474 | ) | |||||
Other income, net | 1,678 | 686 | 330 | ||||||||
Income/(loss) before income taxes | (88,257 | ) | (81,260 | ) | 31,016 | ||||||
Provision/(benefit) for income taxes | (5,066 | ) | (1,118 | ) | 9,488 | ||||||
Net income/(loss) | $ | (83,191 | ) | $ | (80,142 | ) | $ | 21,528 | |||
Year Ended December 31, 2016 compared to Year Ended December 31, 2015
We present certain results from our International segment on a constant currency basis. Constant currency information compares results between periods as if foreign currency exchange rates had remained constant period-over-period. Our International segment operates principally in the U.K. We calculate constant currency by applying the foreign currency exchange rate for the prior period to the local currency results for the current period. In addition, we have excluded intersegment revenues and expenses in the discussion below.
Consolidated Revenues
Consolidated revenues decreased $96.3 million for the year ended December 31, 2016, compared to the year ended December 31, 2015. The decrease in consolidated revenues was primarily due to a decrease of $53.6 million in revenues from our Provide Commerce segment, a $30.1 million decrease in revenues from our Consumer segment, and a $14.2 million decrease in revenues from our International segment (increase of $4.5 million in constant currency). Foreign currency exchange rates unfavorably impacted revenues by $18.7 million during the year ended December 31, 2016.
Consolidated Cost of Revenues
Consolidated cost of revenues decreased $63.0 million for the year ended December 31, 2016, compared to the year ended December 31, 2015. The decrease in consolidated cost of revenues was primarily due a decrease of $33.4 million in costs associated with our Provide Commerce segment, a decrease of $17.4 million in costs associated with our Consumer segment, and a decrease of $10.1 million (increase of $2.8 million in constant currency) in costs associated with our International segment. Foreign currency exchange rates had a $12.8 million favorable impact on cost of revenues for the year ended December 31, 2016. Consolidated cost of revenues, as a percentage of consolidated revenues, remained constant at 63% for the years ended December 31, 2016 and 2015.
41
Consolidated Sales and Marketing
Consolidated sales and marketing expenses decreased $19.1 million for the year ended December 31, 2016, compared to the year ended December 31, 2015. The decrease in consolidated sales and marketing expenses was primarily due to a decrease of $12.5 million in sales and marketing expenses associated with our Provide Commerce segment, a decrease of $4.5 million related to our Consumer segment, and a decrease of $3.1 million (decrease of $0.9 million in constant currency) associated with our International segment. Foreign currency exchange rates had a $2.2 million favorable impact on sales and marketing expenses for the year ended December 31, 2016. Consolidated sales and marketing expenses, as a percentage of consolidated revenues, was 20% for the years ended December 31, 2016 and 2015.
Consolidated General and Administrative
Consolidated general and administrative expenses decreased $10.5 million for the year ended December 31, 2016, compared to the year ended December 31, 2015. The decrease in consolidated general and administrative expenses was primarily due to a decrease in personnel related costs of $6.5 million, which included a decrease in headcount, incentive compensation expense, and stock-based compensation. In addition, transaction-related costs also decreased $2.9 million, facility costs decreased $1.0 million, and technology costs decreased $0.5 million for the year ended December 31, 2016 compared to the year ended December 31, 2015. Legal costs, including litigation and dispute settlement charges (net of insurance recoveries), also decreased $1.5 million during the year ended December 31, 2016 compared to the year ended December 31, 2015. These decreases were partially offset by increases in bad debt expense of $1.8 million and depreciation expense of $0.6 million. Consolidated general and administrative expenses, as a percentage of consolidated revenues, was stable at 10% for the years ended December 31, 2016 and 2015.
Restructuring and Other Exit Costs
During the year ended December 31, 2016, the Company incurred restructuring and other exit costs of $11.8 million, primarily related to senior management changes, including expenses for severance and related accelerated vesting of equity awards. In addition, we incurred restructuring charges related to the consolidation of certain office and distribution facilities for the Provide Commerce segment. During the year ended December 31, 2015, we incurred restructuring and other exit costs of $6.1 million, primarily related to the closure of the Provide Commerce developing businesses and certain distribution and call center locations.
Impairment of Goodwill and Intangible Assets
During the year ended December 31, 2016, the Company recognized a goodwill impairment charge of $84.0 million related to the Provide Commerce segment compared to a goodwill impairment charge of $85.0 million for the year ended December 31, 2015.
Interest Expense, Net
Interest expense was consistent for the year ended December 31, 2016, compared to the year ended December 31, 2015. The savings related to the lower level of debt principal balances were offset by slightly higher interest rates and amortization of the interest rate cap.
Provision for Income Taxes
During the year ended December 31, 2016, we recorded a tax benefit of $5.1 million on a pre-tax loss of $88.3 million, compared to a tax benefit of $1.1 million on a pre-tax loss of $81.3 million for the year ended December 31, 2015. During the years ended December 31, 2016 and 2015, the impairment of goodwill is not tax deductible, and therefore, there is no tax benefit recorded on the charges. For the year ended December 31, 2016, the effective tax rate increased primarily due to the higher pre-tax loss and lower non-deductible expenses.
42
Year Ended December 31, 2015 compared to Year Ended December 31, 2014
Consolidated Revenues
Consolidated revenues increased $579.3 million for the year ended December 31, 2015, compared to the year ended December 31, 2014. The increase in consolidated revenues was primarily due to $583.3 million of revenues associated with the addition of our Provide Commerce segment, a $3.1 million increase in revenues from our Consumer segment, and a $3.2 million increase in revenues from our Florist segment, partially offset by a $9.6 million decrease ($3.5 million increase in constant currency) in revenues from our International segment. Foreign currency exchange rates unfavorably impacted revenues by $13.1 million during the year ended December 31, 2015.
Consolidated Cost of Revenues
Consolidated cost of revenues increased $363.1 million for the year ended December 31, 2015, compared to the year ended December 31, 2014. The increase in consolidated cost of revenues was primarily due to $368.4 million of costs associated with the addition of our Provide Commerce segment and a $0.2 million increase in costs associated with our Florist segment, offset by a $7.7 million decrease (increase $1.3 in constant currency) in costs associated with our International segment and a $2.1 million decrease in costs associated with our Consumer segment. Foreign currency exchange rates had a $9.0 million favorable impact on cost of revenues for the year ended December 31, 2015. In addition, depreciation expense increased $4.5 million for the year ended December 31, 2015, compared to the year ended December 31, 2014. Consolidated cost of revenues, as a percentage of consolidated revenues, remained consistent at 63% for both the years ended December 31, 2015 and December 31, 2014.
Consolidated Sales and Marketing
Consolidated sales and marketing expenses increased $137.3 million for the year ended December 31, 2015, compared to the year ended December 31, 2014. The increase in consolidated sales and marketing expenses was primarily due to $136.0 million of sales and marketing expenses associated with the addition of our Provide Commerce segment and an increase of $3.0 million in sales and marketing expenses associated with our Florist segment. These increases were partially offset by decreases of $1.5 million (increase $0.1 million in constant currency) and $0.4 million in sales and marketing expenses associated with our International and Consumer segments, respectively. Foreign currency exchange rates had a $1.6 million favorable impact on sales and marketing expenses for the year ended December 31, 2015. Consolidated sales and marketing expenses, as a percentage of consolidated revenues, was 20% for the year ended December 31, 2015, compared to 17% for the year ended December 31, 2014.
Consolidated General and Administrative
Consolidated general and administrative expenses increased $47.3 million for the year ended December 31, 2015, compared to the year ended December 31, 2014. The increase in consolidated general and administrative expenses was primarily due to $37.2 million of general and administrative expenses associated with the addition of our Provide Commerce segment, excluding depreciation and transaction-related costs. In addition, for the year ended December 31, 2015, depreciation expense increased $9.3 million primarily due to assets acquired in the Acquisition. Further, personnel-related costs, excluding those directly related to the Provide Commerce segment, increased $7.9 million, primarily due to increased stock-based compensation. Partially offsetting these increases was a decrease in transaction-related costs of $5.7 million due to a majority of the transaction costs related to the Acquisition being recognized in the year ended December 31, 2014. In addition, litigation and dispute settlement charges (net of insurance recoveries) were $3.1 million lower for the year ended December 31, 2015, than the year ended December 31, 2014. Consolidated general and administrative expenses, as a percentage of consolidated revenues, was 10% for the year ended December 31, 2015, compared to 12% for the year ended December 31, 2014.
Amortization of Intangible Assets
Amortization of intangible assets increased $49.7 million for the year ended December 31, 2015, compared to the year ended December 31, 2014, primarily due to the intangible assets acquired in the Acquisition.
43
Restructuring and Other Exit Costs
During the year ended December 31, 2015, the Company incurred restructuring and other exit costs of $6.1 million, primarily related to the closure of the Provide Commerce developing businesses certain distribution and call center locations. During the year ended December 31, 2014, we incurred restructuring and other exit costs of $0.2 million, primarily related to the closure of various U.K. garden center concession stands.
Impairment of Goodwill and Intangible Assets
During the year ended December 31, 2015, the Company recognized a goodwill impairment charge of $85.0 million related to the Provide Commerce segment.
Interest Expense, Net
Interest expense increased $3.8 million for the year ended December 31, 2015, compared to the year ended December 31, 2014. The increases were due to higher debt principal balances outstanding, associated with the incremental borrowing for the Acquisition, as well as higher interest rates and increased amortization of both the interest rate cap and deferred financing fees.
Provision for Income Taxes
During the year ended December 31, 2015, we recorded a tax benefit of $1.1 million on pre-tax loss of $81.3 million, compared to a tax provision of $9.5 million on pre-tax income of $31.0 million for the year ended December 31, 2014. During the year ended December 31, 2015, the impairment of goodwill is not tax deductible, and therefore, there is no tax benefit recorded on the charge. The decrease in the effective tax rate is primarily due to book losses in the U.S. resulting from the goodwill impairment and the amortization of the intangibles acquired in the Acquisition.
BUSINESS SEGMENT OPERATING RESULTS
Prior to the Acquisition, the Company reported its business operations in three reportable segments: Consumer, Florist, and International. As a result of the Acquisition, the Company began reporting its business in four reportable segments: Consumer, Provide Commerce, Florist, and International. Segment operating income is operating income excluding depreciation, amortization, litigation and dispute settlement charges or gains, transaction-related costs, restructuring and other exit costs, and impairment of goodwill and intangible assets. Stock-based compensation and general corporate expenses are not allocated to the segments. Segment operating income is prior to intersegment eliminations and excludes other income, net.
The segment results included in MD&A are presented on a basis consistent with our internal management reporting. Segment information appearing in Note 3—Segment Information to the Notes to Financial Statements in Part II, Item 8 of this Form 10-K is also presented on this basis.
44
CONSUMER SEGMENT
Year Ended December 31, | 2016 to 2015 | 2015 to 2014 | |||||||||||||||||||||||
2016 | 2015 | 2014 | $ Change | % Change | $ Change | % Change | |||||||||||||||||||
(in thousands, except for percentages and average order values) | |||||||||||||||||||||||||
Segment revenues | $ | 291,275 | $ | 321,413 | $ | 318,343 | $ | (30,138 | ) | (9 | )% | $ | 3,070 | 1 | % | ||||||||||
Segment operating income | $ | 30,210 | $ | 36,804 | $ | 31,310 | $ | (6,594 | ) | (18 | )% | $ | 5,494 | 18 | % | ||||||||||
Key metrics and other financial data: | |||||||||||||||||||||||||
Consumer orders | 3,821 | 4,229 | 4,335 | (408 | ) | (10 | )% | (106 | ) | (2 | )% | ||||||||||||||
Average order value | $ | 71.76 | $ | 70.83 | $ | 69.25 | $ | 0.93 | 1 | % | $ | 1.58 | 2 | % | |||||||||||
Segment operating margin | 10 | % | 11 | % | 10 | % | |||||||||||||||||||
Year Ended December 31, 2016 compared to Year Ended December 31, 2015
Consumer Segment Revenues
Consumer segment revenues decreased $30.1 million, or 9%, for the year ended December 31, 2016, compared to the year ended December 31, 2015 primarily driven by a 10% decrease in order volume, partially offset by a 1% increase in average order value. In 2016, consumer order volume was negatively impacted by the Sunday timing of the Valentine’s Day holiday, which worsened from the Saturday placement of the holiday in 2015. During 2016, we elected to shift certain group buying placements to the Provide Commerce segment and also reduce the number of partners due to changes in some partners’ marketing strategies. Both of these changes had an impact on revenues in these programs for 2016. In addition, revenue was lower for the year ended December 31, 2016 due to $4.1 million of breakage revenue which was recognized in the third quarter of 2015 as a result of our determination, based on a change in circumstances, that there was no longer a requirement to remit to relevant jurisdictions, under unclaimed property laws, the value of certain gift cards and vouchers which are not expected to be redeemed (“breakage”). Breakage revenue recognized during the year ended December 31, 2016 was not significant.
Consumer Segment Operating Income
Consumer segment operating income decreased $6.6 million for the year ended December 31, 2016, compared to the year ended December 31, 2015, primarily due to the decrease in revenues of $30.1 million, as previously described, partially offset by a $23.5 million decrease in operating expenses. Operating expenses were lower primarily due to a decrease in cost of revenues of $17.4 million, which was driven by reduced spending associated with lower order volume. Other operating expenses decreased $6.2 million primarily due to reduced spending associated with lower order volume, lower fixed costs in the customer service area, and lower technology and development costs. In addition, segment operating income for the year ended December 31, 2016 was lower compared to the year ended December 31, 2015 due to the breakage adjustment. The consumer segment operating margin decreased to 10% for the year ended December 31, 2016, compared to 11% for the year ended December 31, 2015.
Year Ended December 31, 2015 compared to Year Ended December 31, 2014
Consumer Segment Revenues
Consumer segment revenues slightly increased $3.1 million, or 1%, for the year ended December 31, 2015, compared to the year ended December 31, 2014. The Consumer segment recognized breakage revenue of $4.1 million during the third quarter of 2015 as noted above. Segment revenues improved as average order value increased 2% primarily driven by consumers selecting higher value offerings, our sympathy business, which typically carries higher average order values, and other merchandising improvements. Revenue increases were partially offset by the consumer order volume decrease of 2%, primarily related to declines during the Valentine’s Day, Mother’s Day, and Christmas holiday periods. During the year ended December 31, 2015, the Saturday placement of the Valentine’s Day holiday had a negative impact on revenues.
45
Consumer Segment Operating Income
Consumer segment operating income increased $5.5 million for the year ended December 31, 2015, compared to the year ended December 31, 2014, as revenue increased $3.1 million, as previously described, coupled with a $2.4 million decrease in operating expenses. Operating expenses were lower primarily due to decreases in cost of revenues of $2.1 million. The decrease in costs of revenues was driven by lower consumer orders as well as product and shipping cost savings. Further, segment operating income for the year ended December 31, 2015 improved due to the breakage adjustment recorded in the third quarter of 2015 as noted above. The consumer segment operating margin increased to 11% for the year ended December 31, 2015, compared to 10% for the year ended December 31, 2014.
PROVIDE COMMERCE SEGMENT
The results of operations for Provide Commerce for the years ended December 31, 2016 and 2015 are presented below. The Acquisition was completed as of December 31, 2014. Therefore, no results for the year ended December 31, 2014 are included in our analysis.
Year Ended December 31, | 2016 to 2015 | |||||||||||||
2016 | 2015 | $ Change | % Change | |||||||||||
(in thousands, except for percentages and average order values) | ||||||||||||||
Segment revenues | $ | 529,733 | $ | 583,326 | $ | (53,593 | ) | (9 | )% | |||||
Segment operating income | $ | 40,514 | $ | 41,802 | $ | (1,288 | ) | (3 | )% | |||||
Key metrics and other financial data: | ||||||||||||||
Consumer orders | 11,472 | 12,549 | (1,077 | ) | (9 | )% | ||||||||
Average order value | $ | 45.50 | $ | 46.02 | $ | (0.52 | ) | (1 | )% | |||||
Segment operating margin | 8 | % | 7 | % | ||||||||||
Year Ended December 31, 2016 compared to Year Ended December 31, 2015
Provide Commerce Segment Revenues
Provide Commerce segment revenues decreased $53.6 million, or 9%, for the year ended December 31, 2016, compared to the year ended December 31, 2015, primarily driven by a 9% decrease in consumer order volume combined with a 1% decrease in average order value. The revenue decline was largely due to a 17% decline in the ProFlowers revenues for the year ended December 31, 2016 as compared to the year ended December 31, 2015. The Gourmet Foods business reported a 2% decrease in revenues for the year ended December 31, 2016 as compared to the year ended December 31, 2015. Partially offsetting the decrease in revenues, the Personal Creations business reported 8% growth in revenues for the year ended December 31, 2016 from the year ended December 31, 2015. Both ProFlowers and Gourmet Foods revenues were negatively impacted by the Sunday timing of the Valentine’s Day holiday period during 2016, which worsened from the Saturday timing in 2015. ProFlowers was also impacted by an overall decline in revenues due to lower investment in customer acquisition marketing, which reduced order volume during 2016.
Provide Commerce Segment Operating Income
Provide Commerce segment operating income decreased $1.3 million, or 3%, for the year ended December 31, 2016, compared to the year ended December 31, 2015. Revenues decreased $53.6 million, which was partially offset by a decrease in operating expenses of $52.3 million. The decrease in operating expenses was primarily due to lower cost of revenues associated with the lower order volume, partially offset by higher shipping costs. Lower marketing and selling costs and personnel-related costs also reduced operating expenses during the year ended December 31, 2016. Further, segment operating income for the year ended December 31, 2016 benefited from the second quarter 2015 actions associated with the restructuring of the Gifts.com business and the closure of the Kalla business as compared to the year ended December 31, 2015. Provide Commerce segment operating margin increased to 8% for the year ended December 31, 2016, compared to 7% for the year ended December 31, 2015.
46
FLORIST SEGMENT
Year Ended December 31, | 2016 to 2015 | 2015 to 2014 | |||||||||||||||||||||||
2016 | 2015 | 2014 | $ Change | % Change | $ Change | % Change | |||||||||||||||||||
(in thousands, except for percentages and average revenues per member) | |||||||||||||||||||||||||
Segment revenues | $ | 166,881 | $ | 165,782 | $ | 162,552 | $ | 1,099 | 1 | % | $ | 3,230 | 2 | % | |||||||||||
Segment operating income | $ | 48,406 | $ | 47,162 | $ | 47,077 | $ | 1,244 | 3 | % | $ | 85 | — | % | |||||||||||
Key metrics and other financial data: | |||||||||||||||||||||||||
Average revenues per member | $ | 14,425 | $ | 13,493 | $ | 12,504 | $ | 932 | 7 | % | $ | 989 | 8 | % | |||||||||||
Segment operating margin | 29 | % | 28 | % | 29 | % | |||||||||||||||||||
Year Ended December 31, 2016 compared to Year Ended December 31, 2015
Florist Segment Revenues
Florist segment revenues increased $1.1 million, or 1%, for the year ended December 31, 2016, compared to the year ended December 31, 2015. Services revenues increased $1.8 million due to a $1.0 million increase in subscription and other services revenues and an $0.8 million increase in order-related revenues. Products revenues decreased $0.7 million primarily due to a decrease in sales of fresh flowers. Average revenues per member increased 7% for the year ended December 31, 2016, compared to the year ended December 31, 2015.
Florist Segment Operating Income
Florist segment operating income increased $1.2 million for the year ended December 31, 2016, compared to the year ended December 31, 2015, due to the revenue increase of $1.1 million and a $1.6 million decrease in the cost of revenues. The cost of revenues decrease was primarily driven by a decrease in sales of fresh flowers and continued cost efficiencies realized across the business. General and administrative expenses increased $1.6 million driven largely by an increase in bad debt expense primarily related to one member and was partially offset by lower personnel costs. Florist segment operating margin increased to 29% for year ended December 31, 2016, compared to 28% for the year ended December 31, 2015.
Year Ended December 31, 2015 compared to Year Ended December 31, 2014
Florist Segment Revenues
Florist segment revenues increased $3.2 million, or 2%, for the year ended December 31, 2015, compared to the year ended December 31, 2014. Products revenues increased $3.2 million primarily due to an increase in sales of fresh flowers and technology systems. Services revenues were flat due to a $2.6 million decrease in subscription and other services revenues, offset by a $2.6 million increase in order-related revenues. Average revenues per member increased 8% for the year ended December 31, 2015, compared to the year ended December 31, 2014.
Florist Segment Operating Income
Florist segment operating income increased $0.1 million for the year ended December 31, 2015, compared to the year ended December 31, 2014, as the revenue increase of $3.2 million was largely offset by a $3.1 million increase in operating expenses. Cost of revenues increased $0.2 million for the year ended December 31, 2015, compared to the year ended December 31, 2014, primarily driven by the increase in sales of fresh flowers offset by declines in services revenues. In addition, sales and marketing expenses were $3.0 million higher, primarily due to $3.4 million of incremental costs associated with increased order-related revenues, which was partially offset by a $0.4 million reduction in personnel-related costs. Florist segment operating margin decreased to 28% for year ended December 31, 2015, compared to 29% for the year ended December 31, 2014.
47
INTERNATIONAL SEGMENT
Year Ended December 31, | Year Ended December 31, | ||||||||||||||||||||||||||||
2016 | 2015 | $ Change | % Change | 2015 | 2014 | $ Change | % Change | ||||||||||||||||||||||
(in thousands, except for percentages, average order values and average currency exchange rates) | |||||||||||||||||||||||||||||
Segment revenues (in USD) | $ | 152,700 | $ | 166,916 | $ | (14,216 | ) | (9 | )% | $ | 166,916 | $ | 176,501 | $ | (9,585 | ) | (5 | )% | |||||||||||
Impact of foreign currency (1) | 18,729 | — | 18,729 | 13,124 | — | 13,124 | |||||||||||||||||||||||
Segment revenues (in constant currency) | $ | 171,429 | $ | 166,916 | $ | 4,513 | 3 | % | $ | 180,040 | $ | 176,501 | $ | 3,539 | 2 | % | |||||||||||||
Segment revenues (in GBP) | £ | 112,330 | £ | 109,445 | £ | 2,885 | 3 | % | £ | 109,445 | £ | 107,271 | £ | 2,174 | 2 | % | |||||||||||||
Segment operating income (in USD) | $ | 19,128 | $ | 18,380 | $ | 748 | 4 | % | $ | 18,380 | $ | 18,544 | $ | (164 | ) | (1 | )% | ||||||||||||
Impact of foreign currency (a) | 2,240 | — | 2,240 | 1,459 | — | 1,459 | |||||||||||||||||||||||
Segment operating income (in constant currency) | $ | 21,368 | $ | 18,380 | $ | 2,988 | 16 | % | $ | 19,839 | $ | 18,544 | $ | 1,295 | 7 | % | |||||||||||||
Key metrics and other financial data: | |||||||||||||||||||||||||||||
Consumer orders | 2,690 | 2,694 | (4 | ) | — | % | 2,694 | 2,718 | (24 | ) | (1 | )% | |||||||||||||||||
Average order value (in USD) | $ | 46.67 | $ | 50.94 | $ | (4.27 | ) | (8 | )% | $ | 50.94 | $ | 54.01 | $ | (3.07 | ) | (6 | )% | |||||||||||
Average order value (in GBP) | £ | 34.36 | £ | 33.41 | £ | 0.95 | 3 | % | £ | 33.41 | £ | 32.84 | £ | 0.57 | 2 | % | |||||||||||||
Segment operating margin | 13 | % | 11 | % | 11 | % | 11 | % | |||||||||||||||||||||
Average currency exchange rate: GBP to USD | 1.36 | 1.53 | 1.53 | 1.64 | |||||||||||||||||||||||||
(a) | The impact of foreign currency reflects the impact of the change in the foreign currency exchange rate from the prior period to the current period. We calculate the impact by applying the foreign currency exchange rate for the prior period to the local currency results for the current period. |
We present certain results from our International segment on a constant currency basis. Constant currency information permits the comparison of results between periods as if foreign currency exchange rates had remained constant period-over-period. Our International segment operates principally in the U.K. We calculate constant currency by applying the foreign currency exchange rate for the prior period to the local currency results for the current period.
Year Ended December 31, 2016 compared to Year Ended December 31, 2015
International Segment Revenues
International segment revenues decreased $14.2 million, or 9%, (increased $4.5 million, or 3%, in constant currency), for the year ended December 31, 2016, compared to the year ended December 31, 2015. The increase in revenues in constant currency was primarily due to an increase in average order value of 3%. Consumer order volume for the year ended December 31, 2016 was relatively consistent with that of the year ended December 31, 2015 as modest growth in everyday order volume was offset by the Sunday placement of the Valentine’s Day holiday in 2016 compared to the Saturday placement in 2015.
48
International Segment Operating Income
International segment operating income increased by $0.7 million (increased $3.0 million, or 16%, in constant currency) for the year ended December 31, 2016 compared to the year ended December 31, 2015. Revenues decreased $14.2 million (increased $4.5 million in constant currency) which was offset by a decrease in operating expenses of $15.0 million (increased $1.5 million in constant currency). Cost of revenues decreased $10.1 million (increased $2.8 million in constant currency). In constant currency, the increase in cost of revenues related to an increase in average order value. Sales and marketing expenses decreased $3.1 million ($0.9 million in constant currency) related to lower brand and direct marketing costs during 2016. General and administrative expenses decreased $1.8 million (decreased $0.4 million, or 3%, in constant currency). The decrease in constant currency was driven by a decrease in legal expenses partially offset by an increase in technology and personnel-related costs. International segment operating margin increased to 13% for the year ended December 31, 2016, compared to 11% for the year ended December 31, 2015.
Year Ended December 31, 2015 compared to Year Ended December 31, 2014
International Segment Revenues
International segment revenues decreased $9.6 million, or 5%, (increased $3.5 million, or 2%, in constant currency), for the year ended December 31, 2015, compared to the year ended December 31, 2014. The increase in revenues in constant currency was primarily due to an increase in average order value of 2%. In addition, revenues increased in Interflora’s florist business, driven by sales of wholesale products and increases in member fee revenues. Consumer order volume decreased 1%, primarily related to declines in the Valentine’s Day and U.K. Mother’s Day holiday periods, offset in part by overall growth in order volume outside of these holiday periods. During the year ended December 31, 2015, the Saturday placement of the Valentine’s Day holiday had a negative impact on revenues as expected.
International Segment Operating Income
International segment operating income decreased slightly by $0.2 million (increased $1.3 million, or 7%, in constant currency) for the year ended December 31, 2015, compared to the year ended December 31, 2014. Revenues decreased $9.6 million (increased $3.5 million in constant currency) which was offset in part by a decrease in operating expenses of $9.4 million (increased $2.2 million in constant currency). Cost of revenues decreased $7.7 million (increased $1.4 million in constant currency). In constant currency, the increase in cost of revenues related to an increase in average order value as well as costs associated with increased wholesale revenues. Sales and marketing expenses decreased $1.5 million (flat in constant currency) related to lower consumer order volume and closure of the U.K. garden center concession stands in 2014, partially offset by investments related to improving customer service and the customer experience. International segment operating margin was 11% for the years ended December 31, 2015 and 2014.
UNALLOCATED EXPENSES
The Company incurs certain expenses which are not allocated to its four reportable segments.
Year Ended December 31, | % Change | ||||||||||||||||
2016 | 2015 | 2014 | 2016 to 2015 | 2015 to 2014 | |||||||||||||
(in thousands, except for percentages) | |||||||||||||||||
Unallocated expenses | $ | 49,899 | $ | 46,600 | $ | 39,012 | 7 | % | 19 | % | |||||||
Unallocated expenses include various corporate costs, such as executive management, corporate finance, legal, and certain human resources costs. In addition, unallocated expenses include stock-based compensation for all eligible Company employees, restructuring and other exit costs, transaction-related costs, and litigation and dispute settlement charges and gains.
Unallocated expenses increased $3.3 million for the year ended December 31, 2016, compared to the year ended December 31, 2015. During the year ended December 31, 2016, we incurred restructuring and other exit costs of $11.8 million, primarily associated with senior management changes and related accelerated vesting of equity awards and the closure and consolidation of certain locations. During the year ended December 31, 2015, we incurred restructuring costs of $6.1 million related to the closure of certain Provide Commerce developing businesses and locations. Litigation and dispute settlement charges (net of insurance recoveries) increased $1.2 million during the year ended December 31, 2016 when compared to the year ended December 31, 2015. Partially offsetting these increases was a $3.0 million decrease in transaction-related costs and a decrease in personnel-related costs of $0.3 million.
49
Unallocated expenses increased $7.6 million for the year ended December 31, 2015, compared to the year ended December 31, 2014. During the year ended December 31, 2015, we incurred restructuring and other exit costs of $6.1 million, primarily associated with the closure of certain Provide Commerce developing businesses and locations. In the year ended December 31, 2014, we incurred $0.2 million of restructuring costs. During the year ended December 31, 2015, personnel-related costs increased $8.8 million, primarily due to stock-based compensation increases of $5.6 million. In addition, costs related to audit and other professional fees and insurance increased $2.1 million. Partially offsetting these increases were decreases in transaction-related costs of $5.7 million and in litigation and dispute settlement charges (net of insurance recoveries) of $3.1 million in the year ended December 31, 2015, compared to the year ended December 31, 2014.
LIQUIDITY AND CAPITAL RESOURCES
Credit Agreement
On September 19, 2014, FTD Companies, Inc. entered into a credit agreement (the “Credit Agreement”) with Interflora British Unit, certain wholly owned domestic subsidiaries of FTD Companies, Inc. party thereto as guarantors, the financial institutions party thereto from time to time, Bank of America Merrill Lynch and Wells Fargo Securities, LLC, as joint lead arrangers and book managers, and Bank of America, N.A., as the administrative agent for the lenders, which provided for a term loan in an aggregate principal amount of $200 million, the proceeds of which were used to repay a portion of outstanding revolving loans and also provided for a revolving loan advance (the “Acquisition Advance”) to finance the cash portion of the Acquisition purchase price. On December 31, 2014, we borrowed $120 million under the Acquisition Advance to fund the cash portion of the Acquisition purchase price.
The obligations under the Credit Agreement are guaranteed by certain of FTD Companies, Inc.’s wholly owned domestic subsidiaries (together with FTD Companies, Inc., the “U.S. Loan Parties”). In addition, the obligations under the Credit Agreement are secured by a lien on substantially all of the assets of the U.S. Loan Parties, including a pledge of all of the outstanding capital stock of certain direct subsidiaries of the U.S. Loan Parties (except with respect to foreign subsidiaries and certain domestic subsidiaries whose assets consist primarily of foreign subsidiary equity interests, in which case such pledge is limited to 66% of the outstanding capital stock).
The interest rates applicable to borrowings under the Credit Agreement are based on either LIBOR plus a margin ranging from 1.50% per annum to 2.50% per annum, or a base rate plus a margin ranging from 0.50% per annum to 1.50% per annum, calculated according to the Company’s net leverage ratio. At December 31, 2016, the base rate margin was 0.75% per annum and the LIBOR margin was 1.75% per annum. In addition, the Company pays a commitment fee ranging from 0.20% per annum to 0.40% per annum on the unused portion of the revolving credit facility. The stated interest rates (based on LIBOR) at December 31, 2016 under the term loan and the revolving credit facility were 2.75% and 2.52%, respectively. The effective interest rates at December 31, 2016 under the term loan and the revolving credit facility were 3.46% and 3.06%, respectively. The commitment fee rate at December 31, 2016 was 0.25%. The Credit Agreement contains customary representations and warranties, events of default, affirmative covenants, and negative covenants, that, among other things, require the Company to maintain compliance with a maximum net leverage ratio and a minimum consolidated fixed charge coverage ratio, and impose restrictions and limitations on, among other things, investments, dividends, share repurchases, and asset sales, and the Company’s ability to incur additional debt and additional liens. The Company was in compliance with all covenants under the Credit Agreement at December 31, 2016.
The term loan is subject to amortization payments of $5 million per quarter and customary mandatory prepayments under certain conditions. During the year ended December 31, 2016, the Company made scheduled payments of $20 million under the term loan. The outstanding balance of the term loan and all amounts outstanding under the revolving credit facility are due upon maturity in September 2019. At December 31, 2016, the remaining borrowing capacity under the Credit Agreement, which was reduced by $2.4 million in outstanding letters of credit, was $227.6 million.
The degree to which our assets are leveraged and the terms of our debt could materially and adversely affect our ability to obtain additional capital, as well as the terms at which such capital might be offered to us. We currently expect to have sufficient liquidity to meet our obligations for at least the next twelve months, including interest payment obligations, quarterly amortization payments, and mandatory prepayments, if any, under the Credit Agreement.
50
Year Ended December 31, 2016 compared to Year Ended December 31, 2015
Our total cash and cash equivalents balance increased by $23.1 million to $81.0 million at December 31, 2016, compared to $57.9 million at December 31, 2015. Our summary cash flows for the periods presented were as follows (in thousands):
Year Ended December 31, | |||||||||||
2016 | 2015 | 2014 | |||||||||
Net cash provided by operating activities | $ | 76,949 | $ | 82,325 | $ | 47,384 | |||||
Net cash used for investing activities | $ | (16,557 | ) | $ | (28,190 | ) | $ | (114,102 | ) | ||
Net cash provided by/(used for) financing activities | $ | (35,991 | ) | $ | (90,692 | ) | $ | 114,901 | |||
Net cash provided by operating activities decreased by $5.4 million. Net cash provided by operating activities is driven by our net income/(loss) adjusted for non-cash items including, but not limited to, depreciation and amortization, impairment of goodwill and intangible assets, deferred taxes, stock-based compensation, and changes in operating assets and liabilities. The change in net cash provided by operating activities was due to a higher net loss of $3.0 million, a decrease of $11.0 million in accounts payable and accrued liabilities due to timing of payments to vendors and lower accrued compensation during 2016, a $6.2 million decrease in accounts receivable, net, and a decrease of $4.4 million in non-cash items. The change in non-cash items was primarily related to decreases in deferred tax assets, gains on life insurance contracts, goodwill impairment, and depreciation and amortization, which were partially offset by increases in stock-based compensation due to accelerated vesting from senior management changes and the provision for doubtful accounts receivable. The decreases in net cash provided by operating activities were partially offset by a $10.8 million increase in income taxes receivable and a $7.3 million increase in other liabilities. Changes in working capital can cause variation in our cash flows provided by operating activities due to seasonality, timing, and other factors.
Net cash used for investing activities decreased by $11.6 million. Net cash used for investing activities decreased due to cash paid related to the Provide Commerce acquisition in 2015 combined with an increase in life insurance proceeds as compared to 2015. We currently anticipate that our total capital expenditures for 2017 will be approximately $28 million. The actual amount of future capital expenditures may fluctuate due to a number of factors, including, without limitation, potential future acquisitions and new business initiatives, which are difficult to predict and which could change significantly over time. Additionally, technological advances may require us to make capital expenditures to develop or acquire new equipment or technology in order to replace aging or technologically obsolete equipment.
Net cash used for financing activities decreased by $54.7 million for the year ended December 31, 2016 as compared to the year ended December 31, 2015. The decrease in net cash used for financing activities was primarily due to the repurchase of 0.6 million shares of common stock totaling $15.2 million during the year ended December 31, 2016 compared to $50.0 million of repurchases during the year ended December 31, 2015. In addition, repayments of $20.0 million of outstanding amounts under the Credit Agreement during the year ended December 31, 2016 were lower than net repayments of $40.0 million during 2015. During the year ended December 31, 2016, we also repurchased $2.3 million of our common stock related to withholding taxes on vested restricted stock units. We withhold shares to cover withholding taxes on vested restricted stock units and pay these taxes in cash. Proceeds of $2.2 million were received from the sale of shares through our employee stock purchase plan.
We currently expect to generate positive cash flows from operations at least for the next twelve months. We may use our existing cash balances and future cash generated from operations to fund, among other things, working capital, stock repurchases, interest payment obligations, quarterly amortization payments and mandatory prepayments, if any, under the Credit Agreement, capital expenditures, and acquisitions.
If we need to raise additional capital through public or private debt or equity financings, strategic relationships, or other arrangements, this capital might not be available to us in a timely manner, on acceptable terms, or at all. Our failure to raise sufficient capital when needed could severely constrain or prevent us from, among other factors, developing new or enhancing existing services or products, acquiring other services, businesses, or technologies, or funding significant capital expenditures and may have a material adverse effect on our business, financial position, results of operations, and cash flows, as well as impair our ability to service our debt obligations. If additional funds were raised through the issuance of equity or convertible debt securities, the percentage of stock owned by the then-current stockholders could be reduced. Furthermore, such equity or any debt securities that we issue might have rights, preferences, or privileges senior to holders of our common stock. In addition, trends in the securities and credit markets may restrict our ability to raise any such additional funds, at least in the near term.
51
On February 27, 2014, our board of directors authorized a common stock repurchase program (the “2014 Repurchase Program”) that allows us to repurchase up to $50 million of FTD common stock from time to time over a two-year period in both open market and privately negotiated transactions. No purchases were made under the 2014 Repurchase Program prior to 2015. As of December 31, 2015, the Company had repurchased 1.8 million shares under the 2014 Repurchase Program at an average cost per share of $27.31, fully utilizing the $50 million authorization.
On March 8, 2016, our board of directors authorized a new common stock repurchase program (the “2016 Repurchase Program”) that allows us to repurchase up to $60 million of FTD common stock from time to time over a two-year period in both open market and privately negotiated transactions. At December 31, 2016, the Company had repurchased 0.6 million shares under the 2016 Repurchase Program at an average cost of $25.37. The Company has $44.8 million of availability under this program for future repurchases. The objective of the 2016 Repurchase Program is to offset the dilutive effect on earnings per share from stock-based compensation and allow for opportunistic stock purchases to return capital to shareholders.
Our ability to repurchase our common stock may be limited under our Investor Rights Agreement with Liberty, which provides that Liberty’s ownership in the Company is capped at 40.0% of our common stock outstanding beginning January 1, 2017, subject to certain exceptions, including with respect to third-party tender offers. Liberty’s ownership in FTD was 37.4% at December 31, 2016.
Year Ended December 31, 2015 compared to Year Ended December 31, 2014
Net cash provided by operating activities increased by $34.9 million. Net cash provided by operating activities is driven by our net income adjusted for non-cash items including, but not limited to, depreciation and amortization, deferred taxes, stock-based compensation, impairment of goodwill and intangible assets, and changes in operating assets and liabilities. The change in net cash provided by operating activities was due to a $101.7 million decrease in net income and a $10.8 million change in operating assets and liabilities which was more than offset by an increase of $147.4 million in non-cash items, primarily related to impairment of goodwill and intangible assets and depreciation and amortization. Changes in working capital can cause variation in our cash flows provided by operating activities due to seasonality, timing, and other factors.
Net cash used for investing activities decreased by $85.9 million. The decrease was primarily due to a $96.7 million decrease in cash paid for acquisitions, as the acquisition of Provide Commerce was completed in the year ended December 31, 2014. This decrease was somewhat offset by an increase in purchases of property and equipment.
Net cash used for financing activities was $90.7 million for the year ended December 31, 2015 as compared to net cash provided by financing activities of $114.9 million for the year ended December 31, 2014. The change in net cash used for/provided by financing activities was primarily due to net repayments of $40.0 million of outstanding amounts under the Credit Agreement during the year ended December 31, 2015. In addition, we paid $50.0 million to repurchase 1.8 million shares of our common stock under the 2014 Repurchase Program and $2.6 million related to withholding taxes on vested restricted stock units during the year ended December 31, 2015. Proceeds of $1.6 million were received from the sale of shares through our employee stock purchase plan. During the year ended December 31, 2014, under the Credit Agreement, we entered into a term loan in an aggregate principal amount of $200 million, the proceeds of which were used to repay a portion of outstanding revolving loans. In addition, we borrowed $120 million under the Acquisition Advance, as provided for in the Credit Agreement, to finance the cash portion of the Acquisition purchase price. During the year ended December 31, 2014, we paid $3.9 million of debt issuance costs associated with the Credit Agreement as well as $2.4 million related to withholding taxes on vested restricted stock units.
52
CONTRACTUAL OBLIGATIONS, OTHER COMMITMENTS AND OFF-BALANCE SHEET ARRANGEMENTS
Contractual Obligations
Contractual obligations at December 31, 2016 were as follows (in thousands):
Total | Less than 1 Year | 1 Year to Less than 3 Years | 3 years to Less than 5 Years | More than 5 Years | |||||||||||||||
Debt, including interest(a) | $ | 307,488 | $ | 29,259 | $ | 278,229 | $ | — | $ | — | |||||||||
Noncancelable operating leases | 44,529 | 9,542 | 15,411 | 12,347 | 7,229 | ||||||||||||||
Purchase obligations | 24,765 | 17,248 | 5,909 | 1,608 | — | ||||||||||||||
Deferred compensation plans | 2,371 | 1,168 | 412 | 215 | 576 | ||||||||||||||
Other liabilities | 726 | 293 | 136 | 93 | 204 | ||||||||||||||
Total | $ | 379,879 | $ | 57,510 | $ | 300,097 | $ | 14,263 | $ | 8,009 | |||||||||
(a) | Interest obligations were estimated using implied forward interest rates for 3-month LIBOR based on quoted market rates from the U.S. dollar-denominated interest-rate swap curve. |
At December 31, 2016, we had liabilities for uncertain tax positions totaling $0.4 million, none of which is included in the table above, as we are not able to reasonably estimate when or if cash payments for long-term liabilities related to uncertain tax positions will occur.
We had $2.4 million of commitments under letters of credit at December 31, 2016 which were scheduled to expire within one year. Standby letters of credit are maintained by FTD to secure credit card processing activity and additional letters of credit are maintained related to inventory purchases, insurance policies and lease obligations.
Other Commitments
In the ordinary course of business, we may provide indemnifications of varying scope and terms to customers, vendors, lessors, sureties and insurance companies, business partners, and other parties with respect to certain matters, including, but not limited to, losses arising out of our breach of such agreements, services to be provided by us, or from intellectual property infringement claims made by third parties. We have entered into indemnification agreements with our current and former directors and certain of our officers and employees that require FTD, among other things, to indemnify them against certain liabilities that may arise by reason of their status or service as directors, officers, or employees. In addition, we have also agreed to indemnify certain former officers, directors, and employees of acquired companies in connection with the acquisition of such companies. We maintain director and officer insurance, which may, in certain circumstances, cover specified liabilities, including those arising from our obligation to indemnify our current and former directors, certain of our officers and employees, and certain former officers, directors, and employees of acquired companies.
It is not possible to determine the maximum potential amount of exposure under these indemnification agreements due to the limited history of prior indemnification claims and the unique facts and circumstances involved in each particular agreement. Such indemnification agreements may not be subject to maximum loss clauses.
Off-Balance Sheet Arrangements
At December 31, 2016, we did not have any off-balance sheet arrangements, as defined in Item 303(a)(4)(ii) of Regulation S-K promulgated by the SEC, that have, or are reasonably likely to have, a current or future material effect on our consolidated financial condition, results of operations, liquidity, capital expenditures, or capital resources.
53
CRITICAL ACCOUNTING POLICIES, ESTIMATES, AND ASSUMPTIONS
General
Our discussion and analysis of our financial condition and results of operations is based upon our audited consolidated financial statements, which have been prepared in accordance with accounting principles generally accepted in the United States of America (“GAAP”). The preparation of financial statements in accordance with GAAP requires management to make accounting policy elections, estimates and assumptions that affect a number of reported amounts and related disclosures in the consolidated financial statements. Actual results could differ from those estimates and assumptions. Management believes that the following accounting policies, and estimates and assumptions made by management thereunder, are the most critical to aid in fully understanding and evaluating our reported financial results. These estimates and assumptions require management’s most difficult, subjective or complex judgment and may be based on matters the effects of which are inherently uncertain.
Revenue Recognition
We apply the provisions of Financial Accounting Standards Board (“FASB”) Accounting Standards Codification (“ASC”) 605, Revenue Recognition (“ASC 605”), which provides guidance on the recognition, presentation, and disclosure of revenue in financial statements. ASC 605 outlines the basic criteria that must be met to recognize revenue and provides guidance for disclosure related to revenue recognition policies. We recognize revenue when persuasive evidence of an arrangement exists, delivery has occurred or services have been rendered and no significant company obligations remain, the fee is fixed or determinable, and collectability is reasonably assured. Revenues exclude sales taxes.
Products revenues, less discounts and refunds, and the related cost of revenues are recognized when products are delivered to the customers. Shipping and service fees charged to customers are recognized at the time the related products revenues are recognized and are included in products revenues. Shipping and delivery costs are included in cost of revenues. Our consumer businesses generally recognize revenues on a gross basis because we bear the risks and rewards associated with the revenue-generating activities by (i) acting as a principal in the transaction; (ii) establishing prices; (iii) being responsible for fulfillment of the order by the floral network members and third-party suppliers; (iv) taking the risk of loss for collection, delivery and returns; and (v) marketing the products and services.
Services revenues related to orders sent through the floral network are variable based on either the number of orders or on the value of orders and are recognized in the period in which the orders are delivered. Membership and other subscription-based fees are recognized monthly as earned, on a month-to-month basis.
Probability of collection is assessed based on a number of factors, including past transaction history with the customer and the creditworthiness of the customer. If it is determined that collectability is not reasonably assured, revenues are not recognized until collectability becomes reasonably assured, which is generally upon receipt of cash.
Acquisitions
We allocate the purchase price of acquired businesses to the assets acquired and liabilities assumed in the transaction at their estimated fair values. The estimates used to determine the fair value of long-lived assets, such as intangible assets, can be complex and require significant judgments. We use information available to us to make fair value determinations and engage independent valuation specialists, when necessary, to assist in the fair value determination of significant acquired long-lived assets. While we use our best estimates and assumptions as a part of the purchase price allocation process, our estimates are inherently uncertain and subject to refinement. As a result, during the measurement period, which may be up to one year from the acquisition date, we record adjustments to the assets acquired and liabilities assumed, with the corresponding offset to goodwill. Upon the conclusion of the measurement period or final determination of the values of assets acquired or liabilities assumed, whichever comes first, any subsequent adjustments are recorded to our consolidated statements of operations. We are also required to estimate the useful lives of intangible assets to determine the amount of acquisition-related intangible asset amortization expense to record in future periods. We periodically review the estimated useful lives assigned to our intangible assets to determine whether such estimated useful lives continue to be appropriate.
54
Goodwill and Indefinite-Lived Intangible Assets
Goodwill is tested for impairment at the reporting unit level. A reporting unit is a business or a group of businesses for which discrete financial information is available and is regularly reviewed by management. An operating segment is made up of one or more reporting units. The Company reports its business operations in four operating and reportable segments: Consumer, Provide Commerce, Florist, and International. Each of the Consumer, Florist, and International segments is a reporting unit. The Provide Commerce segment is comprised of two reporting units, ProFlowers/Gourmet Foods and Personal Creations. ProFlowers and Gourmet Foods businesses have similar margins and share operations and business team structure, among other similarities. Therefore these businesses meet the aggregation criteria, and as such, we have aggregated these two businesses into one reporting unit. We performed our annual goodwill impairment assessment for these five reporting units. We elected to perform the two-step quantitative impairment test.
Goodwill represents the excess of the purchase price of an acquired entity over the fair value of the net tangible and intangible assets acquired and liabilities assumed. Indefinite-lived intangible assets acquired in a business combination are initially recorded at management’s estimate of their fair value. We account for goodwill and indefinite-lived intangible assets in accordance with ASC 350, Intangibles, Goodwill and Other. Goodwill and indefinite-lived intangible assets are not subject to amortization but are reviewed for impairment in the fourth quarter of each year, or more frequently if events or circumstances change that would indicate it is more likely than not that the goodwill and/or indefinite-lived intangible assets might be impaired. Testing goodwill and indefinite-lived intangible assets for impairment involves comparing the fair value of the reporting unit or intangible asset to its carrying value. If the carrying amount of a reporting unit exceeds its fair value, the fair value of the net assets of the reporting unit excluding goodwill is compared to the net assets including goodwill. If the carrying amount of the goodwill or intangible asset exceeds its implied fair value, an impairment loss is recognized in an amount equal to the excess.
In calculating the fair value of the reporting units, we used a combination of the market approach and the income approach valuation methodologies. The income approach was used primarily, as we believe that a discounted cash flow approach is the most reliable indicator of the fair values of the businesses. Under the market approach we used the guideline company method, which focuses on comparing our risk profile and growth prospects to select reasonably similar companies based on business description, revenue size, markets served and profitability. The key assumptions used in the income approach discounted cash flow valuation model included discount rates, growth rates, cash flow projections, and terminal growth rates. The discount rate utilized is indicative of the return an investor would expect to receive for investing in a similar business. Considering industry and company specific historical data and internal forecasts and projections, management developed growth rates and cash flow projections for each reporting unit. In determining the terminal growth rates, we considered GDP growth, consumer price inflation and the long term growth prospects of each reporting unit. The discount rate, growth rates, royalty rates, cash flow projections and terminal growth rates are also significant estimates used in the determination of the fair value of the indefinite-lived intangible assets.
The determination of whether or not goodwill and/or indefinite-lived intangible assets are impaired involves a significant level of judgment and estimates in the assumptions underlying the approaches used to determine the fair values of our reporting units and indefinite-lived intangible assets. We believe our analysis included sufficient tolerance for sensitivity in key assumptions. We believe the assumptions and rates used in our impairment assessments are reasonable, but they are judgmental, and variations in any assumptions could result in materially different calculations of fair value. Factors that have the potential to create variances in the estimated fair value of the reporting units include, but are not limited to, fluctuations in (1) forecasted order volumes and average order values, which can be driven by multiple external factors affecting demand, including macroeconomic factors, competitive dynamics, and changes in consumer preferences; (2) marketing costs to generate orders; (3) product and fulfillment costs; (4) operational efficiency; and (5) equity valuations of peer companies.
During the year ended December 31, 2016, the fair value of each of the Consumer, Florist, International, and Personal Creations reporting units significantly exceeded their carrying values. Therefore, each of these reporting units passed step one of the goodwill impairment test and their goodwill was not determined to be impaired. The ProFlowers/Gourmet Foods reporting unit, a significant portion of the Provide Commerce reporting segment, failed step one of the goodwill impairment test and, based on the second step of the assessment, the Company recorded a goodwill impairment charge of $84.0 million related to that reporting unit. Refer to Note 6—“Goodwill, Intangible Assets, and Other Long-Lived Assets” of the Notes to the Consolidated Financial Statements included in Part II, Item 8 of this Form 10-K for more information.
55
Certain key assumptions used in determining the fair value for the Company’s reporting units were as follows:
Discount Rates | Terminal Growth Rates | ||||
Consumer | 10.5 | % | 2.5 | % | |
Florist | 8.5 | % | 1.0 | % | |
International | 11.0 | % | 3.5 | % | |
ProFlowers/Gourmet Foods | 10.5 | % | 2.5 | % | |
Personal Creations | 10.0 | % | 2.5 | % | |
We elected to perform the one-step quantitative impairment test for our indefinite-lived intangible assets under ASC 350. Under the one-step quantitative impairment test, the fair values of indefinite-lived intangible assets are compared to their respective carrying amounts and, if the carrying amount of an indefinite-lived intangible asset exceeds its fair value, an impairment loss is recognized equal to the excess. The annual quantitative indefinite-lived intangible assets impairment test resulted in the determination that the fair values of the indefinite-lived intangible assets exceeded their carrying amounts. Accordingly, we did not record any impairment charges related to our indefinite-lived intangible assets in the year ended December 31, 2016. Certain key assumptions used in determining the fair value of the indefinite-lived intangible assets were discount rates of 10.5% to 11% and average royalty rates of 2.5% to 3.7%.
Finite-Lived Intangible Assets and Other Long-Lived Assets
We account for finite-lived intangible assets and other long-lived assets in accordance with ASC 360, Property, Plant and Equipment. Intangible assets acquired in a business combination are initially recorded at management’s estimate of their fair values. We evaluate the recoverability of identifiable intangible assets and other long-lived assets, other than indefinite-lived intangible assets, for impairment when events occur or circumstances change that would indicate that the carrying amount of an asset may not be recoverable. Events or circumstances that may indicate that an asset is impaired include, but are not limited to, significant decreases in the market value of an asset, significant underperformance relative to expected historical or projected future operating results, a change in the extent or manner in which an asset is used, shifts in technology, significant negative industry or economic trends, changes in our operating model or strategy, and competitive forces. In determining if an impairment exists, we estimate the undiscounted cash flows to be generated from the use and ultimate disposition of these assets. If an impairment is indicated based on a comparison of the assets’ carrying amounts and the undiscounted cash flows, the impairment loss is measured as the amount by which the carrying amounts of the assets exceed the respective fair values of the assets. Finite-lived intangible assets are amortized on a straight-line basis over their estimated useful lives, ranging from two to fifteen years. Our identifiable intangible assets were acquired primarily in connection with business combinations.
The process of evaluating the potential impairment of long-lived intangible assets is subjective and requires significant judgment on matters such as, but not limited to, the asset group to be tested for recoverability. We are also required to make estimates that may significantly impact the outcome of the analyses. Such estimates include, but are not limited to, future operating performance and cash flows, cost of capital, terminal values, and remaining economic lives of assets.
As a result of the impairment of the ProFlowers/Gourmet Foods’ goodwill, we assessed if there was any impairment of intangible or other long-term assets within the ProFlowers/Gourmet Foods’ reporting unit and concluded that such assets were not impaired.
Income Taxes
The Company applies the provisions of ASC 740, Income Taxes (“ASC 740”). Under ASC 740, deferred tax assets and liabilities are determined based on differences between the financial reporting and tax bases of assets and liabilities and are measured using the enacted tax rates and laws that will be in effect when the differences are expected to reverse. We record a valuation allowance to reduce our deferred tax assets to the amount that is more-likely-than-not to be realized. In evaluating our ability to recover our deferred tax assets, we consider all available positive and negative evidence, including our operating results, ongoing tax planning, and forecasts of future taxable income on a jurisdiction-by-jurisdiction basis. In accordance with ASC 740, we recognize, in our consolidated financial statements, the impact of our tax positions that are more-likely-than-not to be sustained upon examination based on the technical merits of the positions. We recognize interest and penalties for uncertain tax positions in income tax expense.
56
Legal Contingencies
We are currently involved in certain legal proceedings and investigations. The Company records a liability when it believes that it is both probable that a loss has been incurred, and the amount of loss can be reasonably estimated. The Company evaluates at least quarterly, developments in its legal matters that could affect the assessment of the probability of loss or the amount of liability, and makes adjustments as appropriate. Significant judgment is required to determine both probability and the estimated amount. The Company may be unable to estimate a possible loss or range of possible loss due to various reasons, including, among others: (i) if the damages sought are indeterminate, (ii) if the proceedings are in early stages, (iii) if there is uncertainty as to the outcome of pending appeals, motions or settlements, (iv) if there are significant factual issues to be determined or resolved, and (v) if there are novel or unsettled legal theories presented. In such instances, there is considerable uncertainty regarding the ultimate resolution of such matters, including a possible eventual loss, if any. We continually assess the potential liability related to such pending matters. Legal matters are inherently unpredictable and subject to significant uncertainties, some of which are beyond the Company’s control. As such, there can be no assurance that the final outcome of these matters will not materially and adversely affect the Company’s business, financial condition, results of operations, or cash flows.
RECENT ACCOUNTING PRONOUNCEMENTS
For information about recently adopted and recently issued accounting pronouncements refer to Note 1—“Description of Business, Basis of Presentation, Accounting Policies, and Recent Accounting Pronouncements” of the Notes to the Consolidated Financial Statements included in Part II, Item 8 of this Form 10-K.
ITEM 7A. QUANTITATIVE AND QUALITATIVE DISCLOSURES ABOUT MARKET RISK
We are exposed to certain market risks arising from transactions in the normal course of business; principally risk associated with interest rate and foreign currency exchange rate fluctuations.
Interest Rate Risk
We are exposed to interest rate risk on our cash and cash equivalents and the outstanding balance under the Credit Agreement. The interest rates applicable to borrowings under the Credit Agreement are based on either LIBOR plus a margin ranging from 1.50% per annum to 2.50% per annum, or a base rate plus a margin ranging from 0.50% per annum to 1.50% per annum, calculated according to the Company’s net leverage ratio. In March 2012, the Company entered into forward starting interest rate cap instruments based on 3-month LIBOR that are effective through June 2018 and have aggregated notional values totaling $130 million. The interest rate cap instruments are designated as cash flow hedges to hedge against expected future cash flows attributable to future 3-month LIBOR interest payments on a portion of the outstanding borrowings under the Credit Agreement. The gains or losses on the instruments are reported in other comprehensive income to the extent that they are effective and are reclassified into earnings when the expected future cash flows through June 2018 and attributable to future 3-month LIBOR interest payments, are recognized in earnings. A 100 basis point increase in LIBOR rates at December 31, 2016 and 2015 would result in an estimated annual increase in our interest expense related to the outstanding debt under the Credit Agreement of approximately $2.8 million and $3.0 million, respectively.
While we do not currently maintain any short-term investments, we still maintain deposits, which are classified as cash equivalents. Therefore, our interest income is sensitive to changes in the general level of U.S. and certain foreign interest rates.
Foreign Currency Exchange Risk
We transact business in foreign currencies, and we are exposed to risk resulting from fluctuations in foreign currency exchange rates, particularly the British Pound (“GBP”) and the Euro (“EUR”), which may result in gains or losses being reported in our results of operations. Volatilities in GBP and EUR and other relevant foreign currencies are monitored by us throughout the year. We face two primary risks related to foreign currency exchange rates—translation risk and transaction risk. Amounts invested in our foreign operations are translated into U.S. Dollars using period-end exchange rates. The resulting translation adjustments are recorded as a component of accumulated other comprehensive loss in the consolidated balance sheets. Revenues and expenses in foreign currencies translate into higher or lower revenues and expenses in U.S. Dollars as the U.S. Dollar weakens or strengthens against other currencies. Substantially all of the revenues of our foreign subsidiaries are received, and substantially all expenses are incurred, in currencies other than the U.S. Dollar, which increases or decreases the related U.S. Dollar-reported revenues and expenses depending on the exchange rate used to translate these revenues and expenses. Therefore, changes in foreign currency exchange rates may negatively affect our consolidated revenues and net
57
income. A 10% adverse change in overall foreign currency exchange rates over an entire year would not have a material impact on estimated annual revenues or estimated annual income before income taxes. These estimates assume an adverse shift in all foreign currency exchange rates against the U.S. Dollar, which do not always move in the same direction or in the same degrees, and actual results may differ materially. Net foreign currency transaction gains or losses arising from transactions denominated in currencies other than the local functional currency are included in other income, net, in the consolidated statements of operations.
At times, we utilize forward foreign currency exchange contracts to protect the value of our net investments in certain foreign subsidiaries denominated in currencies other than the U.S. Dollar. These contracts are designated as hedges of net investments in foreign entities. At both December 31, 2016 and 2015, we had no forward foreign currency exchange contracts outstanding.
ITEM 8. FINANCIAL STATEMENTS AND SUPPLEMENTARY DATA
See Index to Consolidated Financial Statements and Supplemental Schedule on page F-1.
ITEM 9. CHANGES IN AND DISAGREEMENTS WITH ACCOUNTANTS ON ACCOUNTING AND FINANCIAL DISCLOSURE
None.
ITEM 9A. CONTROLS AND PROCEDURES
Disclosure Controls and Procedures
Our management, with the participation of our Chief Executive Officer and Chief Financial Officer, has evaluated the effectiveness of the Company’s disclosure controls and procedures (as such term is defined in Rules 13a-15(e) and 15d-15(e) under the Exchange Act) as of the end of the period covered by this report. Based on such evaluation, our Chief Executive Officer and Chief Financial Officer have concluded that, as of the end of such period, due to the material weakness in our internal control over financial reporting as described below, the Company’s disclosure controls and procedures are not effective in recording, processing, summarizing, and reporting, on a timely basis, information required to be disclosed by the Company in the reports that it files or submits under the Exchange Act and are not effective in ensuring that information required to be disclosed by the Company in the reports that it files or submits under the Exchange Act is accumulated and communicated to our management, including our Chief Executive Officer and Chief Financial Officer, as appropriate to allow timely decisions regarding required disclosure.
Changes in Internal Control over Financial Reporting
There have been no changes in our internal control over financial reporting identified in connection with the evaluation required by Rule 13a-15(d) and 15d-15(d) of the Exchange Act that occurred during the three months ended December 31, 2016 that have materially affected, or are reasonably likely to materially affect, our internal control over financial reporting.
Management’s Report on Internal Control Over Financial Reporting
Our management is responsible for establishing and maintaining adequate internal control over financial reporting, as such term is defined in Rules 13a-15(f) and 15d-15(f) under the Exchange Act. Under the supervision and with the participation of our management, including the Chief Executive Officer and the Chief Financial Officer, we conducted an evaluation of the effectiveness of the Company’s internal control over financial reporting as of December 31, 2016 based on the 2013 framework established in Internal Control-Integrated Framework issued by the Committee of Sponsoring Organizations of the Treadway Commission (COSO). The Company’s internal control over financial reporting includes policies and procedures that provide reasonable assurance regarding the reliability of financial reporting and the preparation of financial statements for external reporting purposes in accordance with GAAP.
Subsequent to the issuance of the Company’s consolidated financial statements for the quarterly period ended September 30, 2016, we identified and concluded that there was a material weakness in our internal control over financial reporting. The material weakness related to our control over the assessment of cross-border indirect taxes that allowed immaterial errors to occur that were not detected in a timely manner. The errors were the result of an incorrect assessment of certain cross-border indirect taxes and required an immaterial restatement of our previously issued consolidated financial
58
statements for the years ended December 31, 2015 and 2014 and for the quarters within the years ended December 31, 2016 and 2015. This material weakness existed in those prior years. Management reviewed the control related to the completeness and precision of its assessment as well as the periodic monitoring of cross-border indirect taxes and concluded that there was a reasonable possibility that a material misstatement of the annual or interim financial statements would not be prevented or detected on a timely basis.
Based on this evaluation, the control over the completeness and precision of management’s assessment of cross-border indirect taxes, the periodic monitoring of these positions, and the appropriate accounting related to these positions was not designed effectively and, therefore, the operating effectiveness of the control was ineffective. Management concluded that this control deficiency is a material weakness. As a result of the material weakness, we have concluded that we did not maintain effective internal control over financial reporting as of December 31, 2016. The material weakness impacts the overall effectiveness of our internal controls over financial reporting as set forth above.
Deloitte & Touche LLP, an independent registered public accounting firm, which audited our consolidated financial statements included in this Annual Report on Form 10-K, has also audited the effectiveness of the Company’s internal control over financial reporting as stated in its report appearing in Item 8 of this Form 10-K.
Remediation Plan
With the oversight of senior management, the Company’s disclosure committee comprised of members of the Company’s management team, and the audit committee, subsequent to December 31, 2016, we have begun to develop plans to remediate the underlying cause of the material weakness and improve the design of this control. Those plans include the following:
• | Enhance control procedures to ensure completeness of analyses supporting significant tax positions taken by the Company related to cross-border indirect taxes. |
• | Enhance monitoring activities over highly technical tax-related aspects of cross-border transactions, including implementation of formal periodic meetings attended by the Chief Financial Officer, Corporate and divisional controllers, and members of the Company’s legal and tax departments, coupled with external international legal and tax experts, to ensure that significant tax positions related to cross-border indirect taxes are fully reviewed and continuously monitored for appropriate accounting and disclosure. |
ITEM 9B. OTHER INFORMATION
None.
PART III
ITEM 10. DIRECTORS, EXECUTIVE OFFICERS AND CORPORATE GOVERNANCE
The information required by Item 10 is included under the following captions in our definitive proxy statement relating to our 2017 annual meeting of stockholders to be filed with the SEC within 120 days after the end of our fiscal year ended December 31, 2016 and is incorporated herein by reference: “Matters to Be Considered at Annual Meeting—Proposal One: Election of Directors,” “Executive Officers,” and “Executive Compensation and Other Information—Section 16(a) Beneficial Ownership Reporting Compliance.”
ITEM 11. EXECUTIVE COMPENSATION
The information required by Item 11 is included under the following captions in our definitive proxy statement relating to our 2017 annual meeting of stockholders to be filed with the SEC within 120 days after the end of our fiscal year ended December 31, 2016 and is incorporated herein by reference: “Compensation Discussion and Analysis,” “Executive Compensation and Other Information,” “Matters to be Considered at Annual Meeting—Proposal One: Election of Directors—Director Compensation,” and “Matters to Be Considered at Annual Meeting—Proposal One: Election of Directors—Compensation Committee Interlocks and Insider Participation.”
59
ITEM 12. SECURITY OWNERSHIP OF CERTAIN BENEFICIAL OWNERS AND MANAGEMENT AND RELATED STOCKHOLDER MATTERS
The information required by Item 12 is included under the following captions in our definitive proxy statement relating to our 2017 annual meeting of stockholders to be filed with the SEC within 120 days after the end of our fiscal year ended December 31, 2016 and is incorporated herein by reference: “Equity Compensation Plan Information” and “Ownership of Securities.”
ITEM 13. CERTAIN RELATIONSHIPS AND RELATED TRANSACTIONS, AND DIRECTOR INDEPENDENCE
The information required by Item 13 is included under the following captions in our definitive proxy statement relating to our 2017 annual meeting of stockholders to be filed with the SEC within 120 days after the end of our fiscal year ended December 31, 2016 and is incorporated herein by reference: “Related-Party Transactions,” “Matters to Be Considered at Annual Meeting—Proposal One: Election of Directors—Board Independence” and “Matters to Be Considered at Annual Meeting—Proposal One: Election of Directors—Board Committees and Meetings.”
ITEM 14. PRINCIPAL ACCOUNTING FEES AND SERVICES
The information required by Item 14 is included under the caption “Matters to Be Considered at Annual Meeting—Proposal Two: Ratification of Independent Registered Public Accounting Firm” in our definitive proxy statement relating to our 2017 annual meeting of stockholders to be filed with the SEC within 120 days after the end of our fiscal year ended December 31, 2016 and is incorporated herein by reference.
PART IV
ITEM 15. EXHIBITS, FINANCIAL STATEMENT SCHEDULES
(a) | The following documents are filed as part of this report: |
1.Consolidated Financial Statements:
Page | |
2.Financial Statement Schedule:
All other schedules have been omitted because the information required to be set forth therein is not applicable, not required or is shown in the consolidated financial statements or notes related thereto.
3. | Exhibits: |
(b) | Exhibits |
See the Exhibit Index following the signature page to this Annual Report on Form 10-K for a list of exhibits filed or furnished with this report, which Exhibit Index is incorporated herein by reference.
60
The agreements included as exhibits to this Annual Report on Form 10-K contain representations and warranties by each of the parties to the applicable agreement. These representations and warranties have been made solely for the benefit of the other parties to the applicable agreement and:
• | should not be treated as categorical statements of fact, but rather as a way of allocating the risk to one of the parties if those statements prove to be inaccurate; |
• | may have been qualified in such agreement by disclosures that were made to the other party in connection with the negotiation of the applicable agreement; |
• | may apply contract standards of “materiality” that are different from “materiality” under the applicable securities laws; and |
• | were made only as of the date of the applicable agreement or such other date or dates as may be specified in the agreement. |
The Company acknowledges that, notwithstanding the inclusion of the foregoing cautionary statements, it is responsible for considering whether additional specific disclosures of material information regarding material contractual provisions are required to make the statements in this Annual Report on Form 10-K not misleading.
Additional information about the Company may be found elsewhere in this Annual Report on Form 10-K and in the Company’s other public filings, which are available without charge through the SEC’s website at www.sec.gov.
(c) | Financial Statement Schedules |
The financial statement schedules required by Regulation S-X and Item 8 of this Annual Report on Form 10-K are listed in Item 15(a)(2) of this Annual Report on Form 10-K.
61
SIGNATURES
Pursuant to the requirements of the Securities Exchange Act of 1934, as amended, the Registrant has duly caused this report to be signed on its behalf by the undersigned, thereunto duly authorized.
Date: | March 15, 2017 | FTD Companies, Inc. (Registrant) | |
By: | /s/ John C. Walden | ||
John C. Walden | |||
President and Chief Executive Officer | |||
POWER OF ATTORNEY
KNOW ALL PERSONS BY THESE PRESENTS, that each person whose signature appears below constitutes and appoints John C. Walden and Scott D. Levin, as his or her attorneys-in-fact, each with the power of substitution, for him or her in any and all capacities, to sign any amendment to this Annual Report on Form 10-K, and to file the same, with exhibits thereto and other documents in connection therewith with the Securities and Exchange Commission, hereby ratifying and confirming all that each of said attorneys-in-fact, or his substitute or substitutes, may do or cause to be done by virtue hereof.
Pursuant to the requirements of the Securities Exchange Act of 1934, this report has been signed below by the following persons on behalf of the Company and in the capacities and on the dates indicated below.
Signature | Title | Date | ||
/s/ John C. Walden | President and Chief Executive Officer and Director (Principal Executive Officer) | March 15, 2017 | ||
John C. Walden | ||||
/s/ Stephen Tucker | Executive Vice President and Chief Financial Officer (Principal Financial Officer and Principal Accounting Officer) | March 15, 2017 | ||
Stephen Tucker | ||||
/s/ Robert Berglass | Chairman of the Board, Director | March 15, 2017 | ||
Robert Berglass | ||||
/s/ James T. Armstrong | Director | March 15, 2017 | ||
James T. Armstrong | ||||
/s/ Tracey Belcourt | Director | March 15, 2017 | ||
Tracey Belcourt | ||||
/s/ Candace Duncan | Director | March 15, 2017 | ||
Candace Duncan | ||||
/s/ Sue Ann Hamilton | Director | March 15, 2017 | ||
Sue Ann Hamilton | ||||
/s/ Joseph W. Harch | Director | March 15, 2017 | ||
Joseph W. Harch | ||||
/s/ Dennis Holt | Director | March 15, 2017 | ||
Dennis Holt | ||||
/s/ Robin Hickenlooper | Director | March 15, 2017 | ||
Robin Hickenlooper | ||||
/s/ Christopher W. Shean | Director | March 15, 2017 | ||
Christopher W. Shean | ||||
/s/ Michael J. Silverstein | Director | March 15, 2017 | ||
Michael J. Silverstein | ||||
62
EXHIBIT INDEX
The agreements included as exhibits to this Annual Report on Form 10-K contain representations and warranties by each of the parties to the applicable agreement. These representations and warranties have been made solely for the benefit of the other parties to the applicable agreement and:
• | should not be treated as categorical statements of fact, but rather as a way of allocating the risk to one of the parties if those statements prove to be inaccurate; |
• | may have been qualified in such agreement by disclosures that were made to the other party in connection with the negotiation of the applicable agreement; |
• | may apply contract standards of “materiality” that are different from “materiality” under the applicable securities laws; and |
• | were made only as of the date of the applicable agreement or such other date or dates as may be specified in the agreement. |
The Company acknowledges that, notwithstanding the inclusion of the foregoing cautionary statements, it is responsible for considering whether additional specific disclosures of material information regarding material contractual provisions are required to make the statements in this Annual Report on Form 10-K not misleading.
Additional information about the Company may be found elsewhere in this Annual Report on Form 10-K and in the Company’s other public filings, which are available without charge through the SEC’s website at www.sec.gov.
Incorporated by Reference to | ||||||||||||
No. | Exhibit Description | Filed with this Form 10-K | Form | File No. | Date Filed | Exhibit Number (if different) | ||||||
2.1 | Separation and Distribution Agreement by and Between United Online, Inc. and FTD Companies, Inc. | 10-Q | 001-35901 | 11/6/2013 | ||||||||
2.2 | Stock Purchase Agreement, by and among FTD Companies, Inc., Liberty Interactive Corporation and Provide Commerce, Inc., dated July 30, 2014* | 8-K/A | 001-35901 | 7/31/2014 | 2.1 | |||||||
3.1 | Amended and Restated Certificate of Incorporation of FTD Companies, Inc. | 10-Q | 001-35901 | 11/6/2013 | ||||||||
3.2 | Second Amended and Restated Bylaws of FTD Companies, Inc. | 10-Q | 001-35901 | 11/6/2013 | ||||||||
4.1 | Investor Rights Agreement, by and between Liberty Interactive Corporation and FTD Companies, Inc., dated December 31, 2014 | 8-K | 001-35901 | 12/31/2014 | 10.1 | |||||||
10.1 | Tax Sharing Agreement by and between United Online Inc. and FTD Companies, Inc. | 10-Q | 001-35901 | 11/6/2013 | 10.3 | |||||||
10.2 | FTD Companies, Inc. Amended and Restated 2013 Incentive Compensation Plan** | 8-K | 001-35901 | 11/13/2013 | 10.1 | |||||||
10.3 | Form of Restricted Stock Unit Issuance Agreement for Officers With Employment Agreements** | 8-K | 001-35901 | 11/13/2013 | 10.3 | |||||||
10.4 | Form of Option Agreement for Officers With Employment Agreements** | 8-K | 001-35901 | 11/13/2013 | 10.4 | |||||||
10.5 | Form of Restricted Stock Unit Issuance Agreement for Non-Employee Directors (Initial Grant)** | 8-K | 001-35901 | 11/13/2013 | 10.5 | |||||||
10.6 | Form of Restricted Stock Unit Issuance Agreement for Non-Employee Directors (Annual Grant)** | 8-K | 001-35901 | 11/13/2013 | 10.6 | |||||||
10.7 | Service Agreement by and between Interflora Holdings Limited and Rhys J. Hughes, as amended** | 10/A | 001-35901 | 9/9/2013 | 10.8 | |||||||
10.8 | FTD Companies, Inc. 2014 Management Bonus Plan** | 10-Q | 001-35901 | 5/9/2014 | 10.1 | |||||||
63
Incorporated by Reference to | ||||||||||||
No. | Exhibit Description | Filed with this Form 10-K | Form | File No. | Date Filed | Exhibit Number (if different) | ||||||
10.9 | First Amendment to Credit Agreement, dated as of September 19, 2014, among FTD Companies, Inc., Interflora British Unit, the guarantors party thereto, the lenders party thereto, and Bank of America, N.A., as administrative agent for the lenders (including as Annex A thereto the amendment and restatement of the Credit Agreement, dated as of July 17, 2013, by and among FTD Companies, Inc., Interflora British Unit, the material wholly owned domestic subsidiaries of FTD Companies, Inc. party thereto as guarantors, the financial institutions party thereto from time to time, Bank of America Merrill Lynch and Wells Fargo Securities, LLC, as joint lead arrangers and book managers, and Bank of America, N.A., as administrative agent for the lenders) | 8-K | 001-35901 | 9/23/2014 | 10.1 | |||||||
10.10 | Employment Agreement by and between FTD Companies, Inc. and Robert S. Apatoff** | 10-Q | 001-35901 | 11/13/2014 | 10.1 | |||||||
10.11 | Employment Agreement by and between FTD Companies, Inc. and Becky A. Sheehan** | 10-Q | 001-35901 | 11/13/2014 | 10.2 | |||||||
10.12 | Employment Agreement by and between FTD Companies, Inc. and Scott D. Levin** | 10-Q | 001-35901 | 11/13/2014 | 10.3 | |||||||
10.13 | FTD Companies, Inc. 2015 Management Bonus Plan** | 10-Q | 001-35901 | 5/8/2015 | 10.1 | |||||||
10.14 | FTD Companies, Inc. Amended and Restated 2013 Incentive Compensation Plan (amended and restated as of June 9, 2015)** | DEF-14A | 001-35901 | 4/28/2015 | Exhibit A | |||||||
10.15 | FTD Companies, Inc. 2015 Employee Stock Purchase Plan** | DEF-14A | 001-35901 | 4/28/2015 | Exhibit B | |||||||
10.16 | Amendment to Service Agreement between Liberty Interactive Corporation and Provide Commerce, Inc. | 10-Q | 001-35901 | 5/8/2015 | 10.2 | |||||||
10.17 | Purchase and Sale Agreement dated as of April 30, 2015 by and between Provide Creations, Inc. and Provide Gifts, Inc. | 10-Q | 001-35901 | 5/8/2015 | 10.3 | |||||||
10.18 | Amendment No. 1 to Separation and Distribution Agreement by and between United Online, Inc. and FTD Companies, Inc. | 10-Q | 001-35901 | 8/6/2015 | 10.3 | |||||||
10.19 | Form of Restricted Stock Unit Issuance Agreement for Non-Employee Directors (Annual Grant) ** | 10-Q | 001-35901 | 8/6/2015 | 10.4 | |||||||
10.20 | Form of Option Agreement for Officers with Employment Agreements** | 10-Q | 001-35901 | 11/6/2015 | 10.1 | |||||||
10.21 | Form of Option Agreement for Domestic Employees** | 10-Q | 001-35901 | 11/6/2015 | 10.2 | |||||||
10.22 | Form of Option Agreement for UK and Canadian Employees** | 10-Q | 001-35901 | 11/6/2015 | 10.3 | |||||||
10.23 | Form of Restricted Stock Unit Issuance Agreement for Officers with Employment Agreements** | 10-K | 001-35901 | 3/10/2016 | ||||||||
10.24 | Employment Agreement by and between Florists’ Transworld Delivery, Inc. and Tom D. Moeller** | 10-K | 001-35901 | 3/10/2016 | ||||||||
10.25 | Amendment to Employment Agreement by and between Florists’ Transworld Delivery, Inc. and Tom D. Moeller** | 10-K | 001-35901 | 3/10/2016 | ||||||||
10.26 | FTD Companies, Inc. 2016 Management Bonus Plan** | 10-Q | 001-35901 | 5/5/2016 | 10.1 | |||||||
10.27 | Rhys Hughes Service Agreement Amendment** | 10-Q | 001-35901 | 8/4/2016 | 10.1 | |||||||
10.28 | First Amendment to the FTD Companies, Inc. 2016 Management Bonus Plan** | 10-Q | 001-35901 | 8/4/2016 | 10.2 | |||||||
10.29 | Rhys Hughes Service Agreement Second Amendment** | 10-Q | 001-35901 | 11/7/2016 | 10.1 | |||||||
10.30 | Employment Agreement by and between Helen Quinn and FTD Companies, Inc.** | 10-Q | 001-35901 | 11/7/2016 | 10.2 | |||||||
10.31 | Second Amendment to the FTD Companies, Inc. 2016 Management Bonus Plan** | 10-Q | 001-35901 | 11/7/2016 | 10.3 | |||||||
10.32 | Employment Agreement by and between FTD Companies, Inc. and Stephen Tucker** | X | ||||||||||
64
Incorporated by Reference to | ||||||||||||
No. | Exhibit Description | Filed with this Form 10-K | Form | File No. | Date Filed | Exhibit Number (if different) | ||||||
10.33 | Second Amendment to the Employment Agreement by and between Florists’ Transworld Delivery, Inc. and Tom D. Moeller** | X | ||||||||||
10.34 | Amendment to the Employment Agreement by and between FTD Companies, Inc. and Scott D. Levin** | X | ||||||||||
10.35 | Rhys Hughes Service Agreement Third Amendment** | X | ||||||||||
10.36 | Letter Agreement Regarding Executive Severance Benefits by and between FTD Companies, Inc. and Eric Vratimos** | X | ||||||||||
10.37 | Amendment to Employment Agreement by and between Helen Quinn and FTD Companies, Inc.** | X | ||||||||||
10.38 | Employment Agreement by and between FTD Companies, Inc. and John C. Walden** | X | ||||||||||
21.1 | List of Subsidiaries of FTD Companies, Inc. | X | ||||||||||
23.1 | Consent of Independent Registered Public Accounting Firm | X | ||||||||||
24.1 | Power of Attorney (see signature page of this Annual Report on Form 10-K) | X | ||||||||||
31.1 | Certification of the Chief Executive Officer pursuant to Section 302 of the Sarbanes-Oxley Act of 2002 | X | ||||||||||
31.2 | Certification of the Chief Financial Officer pursuant to Section 302 of the Sarbanes-Oxley Act of 2002 | X | ||||||||||
32.1 | Certification of the Chief Executive Officer pursuant to Section 906 of the Sarbanes-Oxley Act of 2002 | X | ||||||||||
32.2 | Certification of the Chief Financial Officer pursuant to Section 906 of the Sarbanes-Oxley Act of 2002 | X | ||||||||||
101.INS | XBRL Instance Document | X | ||||||||||
101.SCH | XBRL Taxonomy Extension Schema Document | X | ||||||||||
101.CAL | XBRL Taxonomy Calculation Linkbase Document | X | ||||||||||
101.LAB | XBRL Taxonomy Label Linkbase Document | X | ||||||||||
101.PRE | XBRL Taxonomy Presentation Linkbase Document | X | ||||||||||
101.DEF | XBRL Taxonomy Extension Definition Document | X | ||||||||||
* | Schedules and other similar attachments have been omitted pursuant to Item 601(b)(2) of Regulation S-K. The registrant hereby undertakes to furnish supplemental copies of any of the omitted schedules and other similar attachments upon request by the Securities and Exchange Commission, provided that the registrant may request confidential treatment for any schedule or other similar attachment so furnished. |
** Management contract or compensatory plan or arrangement.
65
FTD COMPANIES, INC.
INDEX TO CONSOLIDATED FINANCIAL STATEMENTS & SUPPLEMENTAL SCHEDULE
Page | |
F-1
REPORT OF INDEPENDENT REGISTERED PUBLIC ACCOUNTING FIRM
To the Board of Directors and Stockholders of
FTD Companies, Inc.
Downers Grove, Illinois
We have audited the accompanying consolidated balance sheets of FTD Companies, Inc. and subsidiaries (the “Company”) as of December 31, 2016 and 2015, and the related consolidated statements of operations, comprehensive income (loss), stockholders’ equity, and cash flows for each of the three years in the period ended December 31, 2016. Our audits also included the financial statement schedule listed in the Index at Item 15. These financial statements and financial statement schedule are the responsibility of the Company’s management. Our responsibility is to express an opinion on the financial statements and financial statement schedule based on our audits.
We conducted our audits in accordance with the standards of the Public Company Accounting Oversight Board (United States). Those standards require that we plan and perform the audit to obtain reasonable assurance about whether the financial statements are free of material misstatement. An audit includes examining, on a test basis, evidence supporting the amounts and disclosures in the financial statements. An audit also includes assessing the accounting principles used and significant estimates made by management, as well as evaluating the overall financial statement presentation. We believe that our audits provide a reasonable basis for our opinion.
In our opinion, such consolidated financial statements present fairly, in all material respects, the financial position of FTD Companies, Inc. and subsidiaries as of December 31, 2016 and 2015, and the results of their operations and their cash flows for each of the three years in the period ended December 31, 2016, in conformity with accounting principles generally accepted in the United States of America. Also, in our opinion, such financial statement schedule, when considered in relation to the basic consolidated financial statements taken as a whole, presents fairly, in all material respects, the information set forth therein.
We have also audited, in accordance with the standards of the Public Company Accounting Oversight Board (United States), the Company’s internal control over financial reporting as of December 31, 2016, based on the criteria established in Internal Control — Integrated Framework (2013) issued by the Committee of Sponsoring Organizations of the Treadway Commission and our report dated March 15, 2017 expressed an adverse opinion on the Company’s internal control over financial reporting because of a material weakness.
/s/ DELOITTE & TOUCHE LLP
Chicago, Illinois
March 15, 2017
F-2
REPORT OF INDEPENDENT REGISTERED PUBLIC ACCOUNTING FIRM
To the Board of Directors and Stockholders of
FTD Companies, Inc.
Downers Grove, Illinois
We have audited the internal control over financial reporting of FTD Companies, Inc. and subsidiaries (the “Company”) as of December 31, 2016, based on criteria established in Internal Control — Integrated Framework (2013) issued by the Committee of Sponsoring Organizations of the Treadway Commission. The Company’s management is responsible for maintaining effective internal control over financial reporting and for its assessment of the effectiveness of internal control over financial reporting, included in the accompanying Management’s Report on Internal Control over Financial Reporting. Our responsibility is to express an opinion on the Company’s internal control over financial reporting based on our audit.
We conducted our audit in accordance with the standards of the Public Company Accounting Oversight Board (United States). Those standards require that we plan and perform the audit to obtain reasonable assurance about whether effective internal control over financial reporting was maintained in all material respects. Our audit included obtaining an understanding of internal control over financial reporting, assessing the risk that a material weakness exists, testing and evaluating the design and operating effectiveness of internal control based on the assessed risk, and performing such other procedures as we considered necessary in the circumstances. We believe that our audit provides a reasonable basis for our opinion.
A company’s internal control over financial reporting is a process designed by, or under the supervision of, the company’s principal executive and principal financial officers, or persons performing similar functions, and effected by the company’s board of directors, management, and other personnel to provide reasonable assurance regarding the reliability of financial reporting and the preparation of financial statements for external purposes in accordance with generally accepted accounting principles. A company’s internal control over financial reporting includes those policies and procedures that (1) pertain to the maintenance of records that, in reasonable detail, accurately and fairly reflect the transactions and dispositions of the assets of the company; (2) provide reasonable assurance that transactions are recorded as necessary to permit preparation of financial statements in accordance with generally accepted accounting principles, and that receipts and expenditures of the company are being made only in accordance with authorizations of management and directors of the company; and (3) provide reasonable assurance regarding prevention or timely detection of unauthorized acquisition, use, or disposition of the company’s assets that could have a material effect on the financial statements.
Because of the inherent limitations of internal control over financial reporting, including the possibility of collusion or improper management override of controls, material misstatements due to error or fraud may not be prevented or detected on a timely basis. Also, projections of any evaluation of the effectiveness of the internal control over financial reporting to future periods are subject to the risk that the controls may become inadequate because of changes in conditions, or that the degree of compliance with the policies or procedures may deteriorate.
A material weakness is a deficiency, or a combination of deficiencies, in internal control over financial reporting, such that there is a reasonable possibility that a material misstatement of the company’s annual or interim financial statements will not be prevented or detected on a timely basis. The following material weakness has been identified and included in management’s assessment:
The control over the completeness and precision of management’s assessment of cross-border indirect taxes, the periodic monitoring of these positions, and the appropriate accounting related to these positions was not designed effectively and, therefore, the operating effectiveness of this control was ineffective. This control deficiency allowed immaterial errors to occur that were not detected in a timely manner.
This material weakness was considered in determining the nature, timing, and extent of audit tests applied in our audit of the consolidated financial statements and financial statement schedule as of and for the year ended December 31, 2016, and this report does not affect our report on such financial statements and financial statement schedule of the Company.
F-3
In our opinion, because of the effect of the material weakness identified above on the achievement of the objectives of the control criteria, the Company has not maintained effective internal control over financial reporting as of December 31, 2016, based on the criteria established in Internal Control — Integrated Framework (2013) issued by the Committee of Sponsoring Organizations of the Treadway Commission.
We have also audited, in accordance with the standards of the Public Company Accounting Oversight Board (United States), the consolidated financial statements and financial statement schedule as of and for the year ended December 31, 2016 of the Company and our report dated March 15, 2017 expressed an unqualified opinion on those consolidated financial statements and financial statement schedule.
/s/ DELOITTE & TOUCHE LLP
Chicago, Illinois
March 15, 2017
F-4
FTD COMPANIES, INC.
CONSOLIDATED BALANCE SHEETS
(in thousands, except share and per share amounts)
December 31, | |||||||
2016 | 2015 | ||||||
ASSETS | |||||||
Current assets: | |||||||
Cash and cash equivalents | $ | 81,002 | $ | 57,892 | |||
Accounts receivable, net of allowances of $4,962 and $4,802 at December 31, 2016 and December 31, 2015, respectively | 26,659 | 28,177 | |||||
Inventories | 24,996 | 25,611 | |||||
Income taxes receivable | — | 5,450 | |||||
Prepaid expenses and other current assets | 13,697 | 15,767 | |||||
Total current assets | 146,354 | 132,897 | |||||
Property and equipment, net | 57,559 | 64,753 | |||||
Intangible assets, net | 272,798 | 340,559 | |||||
Goodwill | 463,465 | 561,656 | |||||
Other assets | 22,138 | 21,863 | |||||
Total assets | $ | 962,314 | $ | 1,121,728 | |||
LIABILITIES AND STOCKHOLDERS’ EQUITY | |||||||
Current liabilities: | |||||||
Accounts payable | $ | 70,254 | $ | 82,448 | |||
Accrued liabilities | 68,274 | 68,622 | |||||
Accrued compensation | 19,165 | 21,193 | |||||
Deferred revenue | 4,911 | 5,421 | |||||
Income taxes payable | 2,005 | — | |||||
Current portion of long-term debt | 20,000 | 20,000 | |||||
Total current liabilities | 184,609 | 197,684 | |||||
Long-term debt | 256,306 | 274,946 | |||||
Deferred tax liabilities, net | 85,932 | 112,769 | |||||
Other liabilities | 7,740 | 8,798 | |||||
Total liabilities | 534,587 | 594,197 | |||||
Commitments and contingencies (Note 15) | |||||||
Stockholders’ equity: | |||||||
Preferred stock, 5,000,000 shares, par value $0.0001, authorized; no shares issued and outstanding | |||||||
Common stock, 60,000,000 shares, par value $0.0001, authorized; 29,731,189 and 29,427,365 shares issued at December 31, 2016 and December 31, 2015, respectively | 3 | 3 | |||||
Treasury stock, 2,430,897 and 1,830,897 shares at December 31, 2016 and December 31, 2015, respectively | (65,221 | ) | (50,000 | ) | |||
Additional paid-in capital | 694,773 | 678,558 | |||||
Accumulated deficit | (150,191 | ) | (67,000 | ) | |||
Accumulated other comprehensive loss | (51,637 | ) | (34,030 | ) | |||
Total stockholders’ equity | 427,727 | 527,531 | |||||
Total liabilities and stockholders’ equity | $ | 962,314 | $ | 1,121,728 | |||
The accompanying notes are an integral part of these consolidated financial statements.
F-5
FTD COMPANIES, INC.
CONSOLIDATED STATEMENTS OF OPERATIONS
(in thousands, except per share amounts)
Year Ended December 31, | |||||||||||
2016 | 2015 | 2014 | |||||||||
Revenues: | |||||||||||
Products | $ | 984,957 | $ | 1,081,217 | $ | 501,107 | |||||
Services | 137,042 | 137,116 | 137,898 | ||||||||
Total revenues | 1,121,999 | 1,218,333 | 639,005 | ||||||||
Operating expenses: | |||||||||||
Cost of revenues—products | 685,176 | 747,046 | 383,339 | ||||||||
Cost of revenues—services | 18,466 | 19,573 | 20,227 | ||||||||
Sales and marketing | 229,569 | 248,627 | 111,368 | ||||||||
General and administrative | 112,720 | 123,244 | 75,922 | ||||||||
Amortization of intangible assets | 61,050 | 61,481 | 11,769 | ||||||||
Restructuring and other exit costs | 11,758 | 6,065 | 220 | ||||||||
Impairment of goodwill and intangible assets | 84,000 | 85,000 | — | ||||||||
Total operating expenses | 1,202,739 | 1,291,036 | 602,845 | ||||||||
Operating income/(loss) | (80,740 | ) | (72,703 | ) | 36,160 | ||||||
Interest income | 519 | 472 | 589 | ||||||||
Interest expense | (9,714 | ) | (9,715 | ) | (6,063 | ) | |||||
Other income, net | 1,678 | 686 | 330 | ||||||||
Income/(loss) before income taxes | (88,257 | ) | (81,260 | ) | 31,016 | ||||||
Provision/(benefit) for income taxes | (5,066 | ) | (1,118 | ) | 9,488 | ||||||
Net income/(loss) | $ | (83,191 | ) | $ | (80,142 | ) | $ | 21,528 | |||
Earnings/(loss) per common share | |||||||||||
Basic earnings/(loss) per share | $ | (3.03 | ) | $ | (2.79 | ) | $ | 1.11 | |||
Diluted earnings/(loss) per share | $ | (3.03 | ) | $ | (2.79 | ) | $ | 1.11 | |||
The accompanying notes are an integral part of these consolidated financial statements.
F-6
FTD COMPANIES, INC.
CONSOLIDATED STATEMENTS OF COMPREHENSIVE INCOME/(LOSS)
(in thousands)
Year Ended December 31, | |||||||||||
2016 | 2015 | 2014 | |||||||||
Net income/(loss) | $ | (83,191 | ) | $ | (80,142 | ) | $ | 21,528 | |||
Other comprehensive loss: | |||||||||||
Foreign currency translation | (17,934 | ) | (6,868 | ) | (8,409 | ) | |||||
Cash flow hedges: | |||||||||||
Changes in net gains/(losses) on derivatives, net of tax of $196, $68, and $(341) for the years ended December 31, 2016, 2015, and 2014, respectively | 327 | 109 | (533 | ) | |||||||
Other comprehensive loss | (17,607 | ) | (6,759 | ) | (8,942 | ) | |||||
Total comprehensive income/(loss) | $ | (100,798 | ) | $ | (86,901 | ) | $ | 12,586 | |||
The accompanying notes are an integral part of these consolidated financial statements.
F-7
FTD COMPANIES, INC.
CONSOLIDATED STATEMENTS OF STOCKHOLDERS’ EQUITY
(in thousands)
Common Stock | Treasury Stock | Additional Paid-In Capital | Accumulated Other Comprehensive Loss | Accumulated Deficit | Total Stockholders’ Equity | ||||||||||||||||||||||||
Shares | Amount | Shares | Amount | ||||||||||||||||||||||||||
Balance at January 1, 2014 | 18,829 | $ | 2 | — | $ | — | $ | 304,870 | $ | (18,329 | ) | $ | (8,386 | ) | $ | 278,157 | |||||||||||||
Net income | — | — | — | — | — | — | 21,528 | 21,528 | |||||||||||||||||||||
Other comprehensive loss | — | — | — | — | — | (8,942 | ) | — | (8,942 | ) | |||||||||||||||||||
Stock-based compensation | — | — | — | — | 7,351 | — | — | 7,351 | |||||||||||||||||||||
Tax benefits from equity awards | — | — | — | — | 468 | — | — | 468 | |||||||||||||||||||||
Vesting of restricted stock units | 132 | — | — | — | — | — | — | — | |||||||||||||||||||||
Repurchases of common stock | — | — | — | — | (2,373 | ) | — | — | (2,373 | ) | |||||||||||||||||||
Purchases from employee stock plans | 29 | — | — | — | 754 | — | — | 754 | |||||||||||||||||||||
Issuance of common stock in connection with acquisition of Provide Commerce, Inc. | 10,203 | 1 | — | — | 355,268 | — | — | 355,269 | |||||||||||||||||||||
Balance at December 31, 2014 | 29,193 | $ | 3 | — | $ | — | $ | 666,338 | $ | (27,271 | ) | $ | 13,142 | $ | 652,212 | ||||||||||||||
Net loss | — | — | — | — | — | — | (80,142 | ) | (80,142 | ) | |||||||||||||||||||
Other comprehensive loss | — | — | — | — | — | (6,759 | ) | — | (6,759 | ) | |||||||||||||||||||
Stock-based compensation | — | — | — | — | 12,912 | — | — | 12,912 | |||||||||||||||||||||
Tax benefits from equity awards | — | — | — | — | 269 | — | — | 269 | |||||||||||||||||||||
Vesting of restricted stock units and related repurchases of common stock | 162 | — | — | — | (2,605 | ) | — | — | (2,605 | ) | |||||||||||||||||||
Repurchases of common stock | — | — | (1,831 | ) | (50,000 | ) | — | — | — | (50,000 | ) | ||||||||||||||||||
Issuance of common stock through employee stock purchase plan | 72 | — | — | — | 1,637 | — | — | 1,637 | |||||||||||||||||||||
Exercise of stock options | — | — | — | — | 7 | — | — | 7 | |||||||||||||||||||||
Balance at December 31, 2015 | 29,427 | $ | 3 | (1,831 | ) | $ | (50,000 | ) | $ | 678,558 | $ | (34,030 | ) | $ | (67,000 | ) | $ | 527,531 | |||||||||||
Net loss | — | — | — | — | — | — | (83,191 | ) | (83,191 | ) | |||||||||||||||||||
Other comprehensive loss | — | — | — | — | — | (17,607 | ) | — | (17,607 | ) | |||||||||||||||||||
Stock-based compensation | — | — | — | — | 16,985 | — | — | 16,985 | |||||||||||||||||||||
Tax shortfalls from equity awards | — | — | — | — | (705 | ) | — | — | (705 | ) | |||||||||||||||||||
Vesting of restricted stock units and related repurchases of common stock | 196 | — | — | — | (2,302 | ) | — | — | (2,302 | ) | |||||||||||||||||||
Repurchases of common stock | — | — | (600 | ) | (15,221 | ) | — | — | — | (15,221 | ) | ||||||||||||||||||
Issuance of common stock through employee stock purchase plan | 108 | — | — | — | 2,237 | — | — | 2,237 | |||||||||||||||||||||
Balance at December 31, 2016 | 29,731 | $ | 3 | (2,431 | ) | $ | (65,221 | ) | $ | 694,773 | $ | (51,637 | ) | $ | (150,191 | ) | $ | 427,727 | |||||||||||
The accompanying notes are an integral part of these consolidated financial statements.
F-8
FTD COMPANIES, INC.
CONSOLIDATED STATEMENTS OF CASH FLOWS
(in thousands)
Year Ended December 31, | |||||||||||
2016 | 2015 | 2014 | |||||||||
Cash flows from operating activities: | |||||||||||
Net income/(loss) | $ | (83,191 | ) | $ | (80,142 | ) | $ | 21,528 | |||
Adjustments to reconcile net income/(loss) to net cash provided by operating activities: | |||||||||||
Depreciation and amortization | 85,099 | 85,251 | 21,759 | ||||||||
Impairment of goodwill and intangible assets | 84,000 | 85,000 | — | ||||||||
Stock-based compensation | 16,985 | 12,912 | 7,351 | ||||||||
Provision for doubtful accounts receivable | 3,423 | 1,690 | 1,721 | ||||||||
Accretion of discounts and amortization of deferred financing and debt issue costs | 1,360 | 1,360 | 938 | ||||||||
Impairment of fixed assets | 723 | 1,282 | — | ||||||||
Deferred taxes, net | (25,992 | ) | (17,984 | ) | (9,637 | ) | |||||
Excess tax (benefits)/shortfalls from equity awards | 705 | (269 | ) | (468 | ) | ||||||
Gains on life insurance | (1,583 | ) | — | — | |||||||
Other, net | 133 | 45 | 185 | ||||||||
Changes in operating assets and liabilities, net of acquisition related purchase accounting adjustments: | |||||||||||
Accounts receivable | (2,371 | ) | 3,837 | (2,212 | ) | ||||||
Inventories | 461 | 701 | (140 | ) | |||||||
Prepaid expenses and other assets | 598 | 3,518 | 2,247 | ||||||||
Accounts payable and accrued liabilities | (9,196 | ) | 1,825 | 2,739 | |||||||
Deferred revenue | (308 | ) | (4,744 | ) | 1,181 | ||||||
Income taxes receivable or payable | 6,741 | (4,026 | ) | 269 | |||||||
Other liabilities | (638 | ) | (7,931 | ) | (77 | ) | |||||
Net cash provided by operating activities | 76,949 | 82,325 | 47,384 | ||||||||
Cash flows from investing activities: | |||||||||||
Cash paid for acquisitions, net of cash acquired | — | (9,935 | ) | (106,616 | ) | ||||||
Purchases of property and equipment and intangible assets | (18,503 | ) | (18,255 | ) | (7,486 | ) | |||||
Proceeds from life insurance | 1,946 | — | — | ||||||||
Net cash used for investing activities | (16,557 | ) | (28,190 | ) | (114,102 | ) | |||||
Cash flows from financing activities: | |||||||||||
Proceeds from issuance of long-term debt | — | 10,000 | 320,000 | ||||||||
Payments on long-term debt | (20,000 | ) | (50,000 | ) | (200,000 | ) | |||||
Payments for debt issue costs | — | — | (3,948 | ) | |||||||
Exercise of stock options and purchases from employee stock plans | 2,237 | 1,644 | 754 | ||||||||
Repurchases of common stock | (17,523 | ) | (52,605 | ) | (2,373 | ) | |||||
Excess tax benefits/(shortfalls) from equity awards | (705 | ) | 269 | 468 | |||||||
Net cash provided by/(used for) financing activities | (35,991 | ) | (90,692 | ) | 114,901 | ||||||
Effect of foreign currency exchange rate changes on cash and cash equivalents | (1,291 | ) | (1,146 | ) | (750 | ) | |||||
Change in cash and cash equivalents | 23,110 | (37,703 | ) | 47,433 | |||||||
Cash and cash equivalents, beginning of period | 57,892 | 95,595 | 48,162 | ||||||||
Cash and cash equivalents, end of period | $ | 81,002 | $ | 57,892 | $ | 95,595 | |||||
The accompanying notes are an integral part of these consolidated financial statements.
F-9
FTD COMPANIES, INC.
NOTES TO CONSOLIDATED FINANCIAL STATEMENTS
1. DESCRIPTION OF BUSINESS, BASIS OF PRESENTATION, ACCOUNTING POLICIES, AND RECENT ACCOUNTING PRONOUNCEMENTS
Description of Business
FTD Companies, Inc. (together with its subsidiaries, “FTD” or the “Company”), is a premier floral and gifting company with a vision to be the leading and most trusted floral and gifting company in the world. Our mission is to inspire, support, and delight our customers when expressing life’s most important sentiments. We provide floral, specialty foods, gift and related products and services to consumers, retail florists, and other retail locations and companies in need of floral and gifting solutions. Our business uses the highly recognized FTD® and Interflora® brands, both supported by the iconic Mercury Man® logo. While we operate primarily in the United States (“U.S.”), Canada, the United Kingdom (“U.K.”), and the Republic of Ireland, we have worldwide presence as our Mercury Man logo is displayed in approximately 35,000 floral shops in nearly 150 countries. Our diversified portfolio of brands also includes ProFlowers®, ProPlants®, Shari’s Berries®, Personal Creations®, RedEnvelope®, Flying Flowers®, Flowers Direct®, Ink Cards™, Postagram™, and Gifts.com™. While floral arrangements and plants are our primary offerings, we also market and sell gift items, including gourmet-dipped berries and other specialty foods, personalized gifts, premium fresh fruit baskets, gift baskets, wine and champagne, jewelry, and spa products.
The principal operating subsidiaries of FTD Companies, Inc. are Florists’ Transworld Delivery, Inc., FTD.COM Inc. (“FTD.COM”), Interflora British Unit (“Interflora”), and Provide Commerce, Inc. (“Provide Commerce”). The operations of the Company include those of its subsidiary, Interflora, Inc., of which one-third is owned by a third party. The Company’s corporate headquarters is located in Downers Grove, Illinois. The Company also maintains offices in San Diego and San Francisco, California; Woodridge, Illinois; Centerbrook, Connecticut; Sleaford, England; Quebec, Canada; and Hyderabad, India; and distribution centers in various locations throughout the U.S.
Separation from United Online
Prior to November 1, 2013, FTD was a wholly owned subsidiary of United Online, Inc. (“United Online”). On November 1, 2013, United Online separated into two independent, publicly traded companies: FTD Companies, Inc. and United Online, Inc. (the “Separation”). The Separation was consummated through a tax free dividend involving the distribution of all shares of FTD common stock to United Online’s stockholders. Following completion of the Separation, FTD Companies, Inc. became an independent, publicly traded company on the NASDAQ Global Select Market under the symbol “FTD”.
Acquisition of Provide Commerce, Inc.
On December 31, 2014, the Company acquired from a wholly owned subsidiary of Liberty Interactive Corporation (“Liberty”) all of the issued and outstanding shares of common stock of Provide Commerce, an indirect wholly owned subsidiary of Liberty, for a purchase price consisting of (i) cash consideration of $106.6 million, excluding acquired cash on hand of $38.1 million and a post-closing working capital adjustment of $9.9 million, and (ii) 10.2 million shares of FTD common stock (the “Acquisition”). These shares represented approximately 35% of the issued and outstanding shares of FTD common stock at the close of the Acquisition. In April 2015, FTD made a payment to Liberty in full satisfaction of the post-closing working capital adjustment. Upon the closing of the Acquisition, Provide Commerce became an indirect wholly owned subsidiary of FTD, see Note 2 – “Acquisition”.
Basis of Presentation
The Company’s consolidated financial statements have been prepared in accordance with accounting principles generally accepted in the United States of America (“GAAP”). All intercompany accounts and transactions have been eliminated in consolidation.
The preparation of financial statements in accordance with GAAP requires management to make accounting policy elections, estimates and assumptions that affect a number of reported amounts and related disclosures in the consolidated financial statements. Management bases its estimates on historical experience and assumptions that it believes are reasonable. Actual results could differ from those estimates and assumptions.
F-10
Accounting Policies
Cash and Cash Equivalents
The Company considers cash equivalents to be only those investments which are highly liquid, readily convertible to cash and which have a maturity date within three months from the date of purchase. At December 31, 2016 and 2015, the Company’s cash and cash equivalents were maintained primarily with major U.S. and U.K. financial institutions and brokerage firms. Deposits with these institutions are generally in excess of the amount insured by the respective government on such deposits.
Accounts Receivable, including Financing Receivables
The Company’s accounts receivable are derived primarily from revenues earned from floral network members located in the U.S. and the U.K. The Company extends credit based upon an evaluation of the customer’s financial condition and, generally, collateral is not required. The Company maintains an allowance for doubtful accounts receivable based upon the expected collectability of accounts receivable and, to date, such losses have been within management’s expectations.
The Company evaluates specific accounts receivable where information exists that the customer may have an inability to meet its financial obligations. In these cases, based on reasonably available facts and circumstances, a specific allowance is recorded for that customer against amounts due to reduce the receivable to the amount the Company believes is probable of collection. These specific allowances are re-evaluated and adjusted as additional information is received that impacts the amount of the allowance. Also, an allowance is established for all customers based on the aging of the receivables. If circumstances change (i.e., higher or lower than expected delinquencies or an unexpected material adverse change in a customer’s ability to meet its financial obligations), the estimates of the recoverability of amounts due to the Company are adjusted. The Company aggressively pursues collection of past due receivables through a number of avenues prior to writing off receivables. Past due receivables are those that remain outstanding beyond the payment due date.
The Company has financing receivables related to equipment sales to floral network members. The Company records all financing receivables at fair value and amortizes such receivables to stated value. The current and noncurrent portions of financing receivables are included in accounts receivable and other assets, respectively, in the consolidated balance sheets. The Company recognizes interest income as earned. The Company assesses credit quality indicators based on whether financing receivables are current or past due. Financing receivables are placed on nonaccrual status, with interest no longer accruing, when a floral network member ceases to be a member, either due to the member terminating its membership or due to the Company terminating such member’s membership, generally as a result of delinquent payments or violations of FTD’s network standards. The Company would not expect to resume the accrual of interest income unless a member who had terminated its membership chooses to be reinstated as a member at a later date and agrees to a plan to pay its balance, if any, that remains outstanding. The Company assesses financing receivables individually for balances due from current floral network members and collectively for balances due from terminated floral network members. A financing receivable is considered to be impaired when the Company determines that it is probable that it will not be able to collect amounts due under the contractual terms. The Company does not record interest income for impaired receivables. If cash is received, the receivable balance is reduced and related credit allowance adjusted accordingly. Fair value approximates the carrying amount of financing receivables because such receivables are discounted at a rate comparable to market rates for similar receivables.
Inventory
The Company’s inventories, which consist primarily of products held for sale, are stated at the lower of cost or market value. Inventory is valued using the first-in, first-out or weighted-average cost method. The Company regularly assesses the valuation of inventory and reviews inventory quantities on hand and, if necessary, writes down excess and obsolete inventory based primarily on the age of the inventory and forecasts of product demand, as well as markdowns for the excess of cost over the amount the Company expects to realize from the sale of certain inventory. As of December 31, 2016 and 2015, inventory reserves were approximately 7% and 5%, respectively, of the inventory balance.
F-11
Property and Equipment
Property and equipment are stated at historical cost or fair value at the acquisition date less accumulated depreciation and amortization. Depreciation is computed using the straight-line method over the estimated useful lives of the assets, which is generally three years for computer software and computer equipment, five years for furniture and fixtures, ten years for equipment, and forty years for buildings. Building improvements are depreciated using the straight-line method over the shorter of the remaining building life or the life of the building improvement. Leasehold improvements, which are included in furniture and fixtures, are amortized using the straight-line method over the shorter of the lease term or ten years. Upon the sale or retirement of property or equipment, the cost and related accumulated depreciation or amortization is removed from the Company’s consolidated financial statements with the resulting gain or loss reflected in the Company’s consolidated statements of operations. Repairs and maintenance costs are expensed as incurred.
Derivative Instruments
The Company applies the provisions of Financial Accounting Standards Board (“FASB”) Accounting Standards Codification (“ASC”) 815, Derivatives and Hedging. The Company maintains interest rate cap instruments to reduce its interest rate risk associated with future cash interest payments on a portion of its outstanding borrowings under the Credit Agreement (as defined below). In addition, at times the Company enters into forward foreign currency exchange contracts to reduce the risk that its net investments in foreign subsidiaries, cash flows and earnings will be adversely affected by foreign currency exchange rate fluctuations. The Company records derivative instruments at fair value in other current assets, other assets or accrued liabilities in the consolidated balance sheets. The Company records changes in the fair value (i.e., gains or losses) of derivative instruments as interest expense or other expense, net, in the consolidated statements of operations or in accumulated other comprehensive loss in the consolidated balance sheets. Neither the interest rate caps nor the forward foreign currency exchange contracts contain any credit risk related contingent features. The Company’s hedging program is not designed for trading or speculative purposes.
Cash Flow Hedges—The Company’s interest rate cap instruments are designated as cash flow hedges against expected future cash flows attributable to future interest payments on a portion of its outstanding borrowings under the Credit Agreement. The Company initially reports the gains or losses related to the effective portion of the hedges as a component of accumulated other comprehensive loss in the consolidated balance sheets and subsequently reclassifies the interest rate caps’ gains or losses to interest expense when the hedged expenses are recorded. The Company includes the change in the time value of the interest rate caps in its assessment of their hedge effectiveness. The Company presents the cash flows from cash flow hedges in the same category in the consolidated statements of cash flows as the category for the cash flows from the hedged items.
For additional information related to derivative instruments, see Note 8—“Derivative Instruments.”
Fair Value Measurements
ASC 820, Fair Value Measurements and Disclosures (“ASC 820”), establishes a three-tiered hierarchy that draws a distinction between market participant assumptions based on (i) quoted prices (unadjusted) in active markets for identical assets and liabilities (Level 1); (ii) inputs other than quoted prices in active markets that are observable either directly or indirectly (Level 2); and (iii) unobservable inputs that require the Company to use present value and other valuation techniques in the determination of fair value (Level 3). In accordance with ASC 820, the Company maximizes the use of observable inputs and minimizes the use of unobservable inputs when developing fair value measurements. When available, the Company uses quoted market prices to measure fair value. If market prices are not available, fair value measurement is based upon models that use primarily market-based or independently-sourced market parameters. If market observable inputs for model-based valuation techniques are not available, the Company will be required to make judgments about assumptions market participants would use in estimating the fair value of the financial instrument. Fair values of cash and cash equivalents, short-term accounts receivable, accounts payable, accrued liabilities, and short-term borrowings approximate their carrying amounts because of their short-term nature. Derivative instruments are recognized in the consolidated balance sheets at their fair values. The fair values for the interest rate caps are calculated using an option pricing model based on available forward yield curves for caplets
F-12
with the same characteristics adjusted for the counterparty risk of nonperformance based on the credit spread derived from the applicable five-year default swap rates. The fair values of the forward foreign currency exchange contracts are calculated based on quoted market prices of similar instruments adjusted for counterparty risk of nonperformance. The key assumptions used in calculating the fair value of these derivative instruments are the forward rates, discount rate and implied volatility. Long-term debt is carried at amortized cost. However, the Company is required to estimate the fair value of long-term debt under ASC 825, Financial Instruments, based on the discounted cash flow method. The Company estimates the fair value of its long-term debt using Level 2 inputs based on quoted prices of comparable risk bonds using market prices and expected future interest rates based on quoted market rates from the U.S. dollar-denominated interest rate swap curve.
Acquisitions
The Company allocates the purchase price of acquired businesses to the assets acquired and liabilities assumed in the transaction at their estimated fair values. The estimates used to determine the fair value of long-lived assets, such as intangible assets, can be complex and require significant judgments. The Company uses information available to it to make fair value determinations and engages independent valuation specialists, when necessary, to assist in the fair value determination of significant acquired long-lived assets. While the Company uses its best estimates and assumptions as a part of the purchase price allocation process, such estimates are inherently uncertain and subject to refinement. As a result, during the measurement period, which may be up to one year from the acquisition date, the Company records adjustments to the assets acquired and liabilities assumed, with the corresponding offset to goodwill. Upon the conclusion of the measurement period or final determination of the values of assets acquired or liabilities assumed, whichever comes first, any subsequent adjustments are recorded to the Company’s consolidated statements of operations. The Company is also required to estimate the useful lives of intangible assets to determine the amount of acquisition-related intangible asset amortization expense to record in future periods. The Company periodically reviews the estimated useful lives assigned to its intangible assets to determine whether such estimated useful lives continue to be appropriate.
Goodwill and Indefinite-Lived Intangible Assets
Goodwill is tested for impairment at the reporting unit level. A reporting unit is a business or a group of businesses for which discrete financial information is available and is regularly reviewed by management. An operating segment is made up of one or more reporting units. Until the Acquisition, the Company reported its business operations in three operating and reportable segments: Consumer, Florist, and International. As a result of the Acquisition, the Company’s operating and reportable segments changed to include a fourth segment, Provide Commerce. Each of the Consumer, Florist, and International segments is a reporting unit. The Provide Commerce segment is comprised of two reporting units, ProFlowers/Gourmet Foods and Personal Creations. ProFlowers and Gourmet Foods businesses have similar margins and share operations and business team structure, among other similarities. Therefore these businesses meet the aggregation criteria, and as such, we have aggregated these two businesses into one reporting unit. The Company performed its annual goodwill assessment for these five reporting units. The Company elected to perform the two-step quantitative impairment test.
Goodwill represents the excess of the purchase price of an acquired entity over the fair value of the net tangible and intangible assets acquired and liabilities assumed. Indefinite-lived intangible assets acquired in a business combination are initially recorded at management’s estimate of their fair value. The Company accounts for goodwill and indefinite-lived intangible assets in accordance with ASC 350, Intangibles, Goodwill and Other. Goodwill and indefinite-lived intangible assets are not subject to amortization but are reviewed for impairment in the fourth quarter of each year, or more frequently if events or circumstances change that would indicate it is more likely than not that the goodwill and/or indefinite-lived intangible assets might be impaired. Testing goodwill and indefinite-lived intangible assets for impairment involves comparing the fair value of the reporting unit or intangible asset to its carrying value. If the carrying amount of a reporting unit exceeds its fair value, the Company compares the fair value of the net assets of the reporting unit excluding goodwill to the net assets including goodwill. If the carrying amount of the goodwill or intangible asset exceeds its implied fair value, an impairment loss is recognized in an amount equal to the excess.
F-13
In calculating the fair value of the reporting units, the Company used a combination of the market approach and the income approach valuation methodologies. The income approach was used primarily, as the Company believes that a discounted cash flow approach is the most reliable indicator of the fair values of the businesses. Under the market approach the Company used the guideline company method, which focuses on comparing the risk profile and growth prospects to select reasonably similar companies based on business description, revenue size, markets served and profitability. The key assumptions used in the income approach discounted cash flow valuation model included discount rates, growth rates, cash flow projections, and terminal growth rates. The discount rate utilized is indicative of the return an investor would expect to receive for investing in a similar business. Considering industry and company specific historical data and internal forecasts and projections, management developed growth rates and cash flow projections for each reporting unit. In determining the terminal growth rates, the Company considered GDP growth, consumer price inflation and the long term growth prospects of each reporting unit. The discount rate, growth rates, royalty rates, cash flow projections and terminal growth rates are also significant estimates used in the determination of the fair value of the indefinite-lived intangible assets.
Finite-Lived Intangible Assets and Other Long-Lived Assets
The Company accounts for finite-lived intangible assets and other long-lived assets in accordance with ASC 360, Property, Plant and Equipment. Intangible assets acquired in a business combination are initially recorded at management’s estimate of their fair values. The Company evaluates the recoverability of identifiable intangible assets and other long-lived assets, other than indefinite-lived intangible assets, for impairment when events occur or circumstances change that would indicate that the carrying amount of an asset may not be recoverable. Events or circumstances that may indicate that an asset is impaired include, but are not limited to, significant decreases in the market value of an asset, significant underperformance relative to expected historical or projected future operating results, a change in the extent or manner in which an asset is used, shifts in technology, significant negative industry or economic trends, changes in the Company’s operating model or strategy, and competitive forces. In determining if an impairment exists, the Company estimates the undiscounted cash flows to be generated from the use and ultimate disposition of these assets. If an impairment is indicated based on a comparison of the assets’ carrying amounts and the undiscounted cash flows, the impairment loss is measured as the amount by which the carrying amounts of the assets exceed the respective fair values of the assets. Finite-lived intangible assets are amortized on a straight-line basis over their estimated useful lives, ranging from two to fifteen years. The Company’s identifiable intangible assets were acquired primarily in connection with business combinations.
Revenue Recognition
The Company applies the provisions of ASC 605, Revenue Recognition (“ASC 605”). The Company recognizes revenues when persuasive evidence of an arrangement exists, delivery has occurred or services have been rendered and no significant Company obligations remain, the fee is fixed or determinable, and collectability is reasonably assured. Revenues exclude sales taxes.
Products revenues, less discounts and refunds, and the related cost of revenues are recognized when products are delivered to the customers. Shipping and service fees charged to customers are recognized at the time the related products revenues are recognized and are included in products revenues. Shipping and delivery costs are included in cost of revenues. The Company generally recognizes revenues for sales to consumers on a gross basis because the Company bears the risks and rewards associated with the revenue-generating activities by (i) acting as a principal in the transaction; (ii) establishing prices; (iii) being responsible for fulfillment of the order by the floral network members, third-party suppliers; (iv) taking the risk of loss for collection, delivery and returns; and (v) marketing the products and services.
The Company also sells point-of-sale systems and related technology services to its floral network members and recognizes revenue in accordance with ASC 605 and ASC 985, Software. The Company recognizes revenues on hardware which is sold without software at the time of delivery. For hardware sales that include software, revenues are recognized when delivery, installation and customer acceptance have all occurred.
Services revenues related to orders sent through the floral network are variable based on either the number of orders or on the value of orders and are recognized in the period in which the orders are delivered. Membership and other subscription-based fees are recognized monthly as earned, on a month-to-month basis.
F-14
Probability of collection is assessed based on a number of factors, including past transaction history with the customer and the creditworthiness of the customer. If it is determined that collectability is not reasonably assured, revenues are not recognized until collectability becomes reasonably assured.
Cost of Revenues
Cost of revenues primarily include product costs; shipping and delivery costs; costs associated with taking orders; printing and postage costs; systems installation, training and support costs; telecommunications and data center costs; depreciation of network computers and equipment; license fees; costs related to customer billing and billing support for the Company’s floral network members; fees associated with the storage and processing of customer credit cards and associated bank fees; and personnel and overhead-related costs associated with operating the Company’s networks.
Sales and Marketing
Sales and marketing expenses include expenses associated with promoting the Company’s brands, products and services. Such expenses include advertising and promotion expenses; fees paid to online and other corporate partners and to floral network members related to order volume sent through the Company’s floral network; and personnel and overhead-related expenses for marketing, merchandising, customer service and sales personnel. In addition, sales and marketing expenditures also include branding and customer acquisition campaigns consisting of television, internet, radio, public relations, sponsorships, print and outdoor advertising, and retail and other performance-based distribution relationships. Marketing and advertising costs to promote the Company’s brands, products and services are expensed in the period incurred. Advertising expenses include media, agency and promotion expenses. Media production costs are expensed the first time the advertisement is run. Media and agency costs are expensed over the period the advertising runs. Advertising and promotion expenses for the years ended December 31, 2016, 2015, and 2014, were $173.7 million, $188.5 million, and $69.5 million, respectively. At December 31, 2016, and 2015, $1.8 million and $2.8 million, respectively, of prepaid advertising and promotion expenses were included in other current assets in the consolidated balance sheets.
Software Development Costs
The Company accounts for costs incurred to develop software for internal-use in accordance with ASC 350, which requires such costs be capitalized and amortized over the estimated useful life of the software. Such capitalized costs include external direct costs incurred in developing or obtaining the applications and payroll and payroll related expenses for employees who are directly associated with developing the applications. Capitalization of such costs begins when the preliminary project stage is complete and ceases at the point in which the project is substantially complete and ready for its intended purpose. The Company capitalized costs associated with internal-use software totaling $10.7 million and $8.6 million in the years ended December 31, 2016 and 2015, respectively, which are being depreciated on a straight-line basis over each project’s estimated useful life, which is generally three to five years. The fair value of capitalized internal use software valued in connection with the Acquisition is also included in the complete technology category within intangible assets, net, in the consolidated balance sheets and is being amortized on a straight line basis over the estimated useful life of five years. All other capitalized internal use software is included in the computer software category within property and equipment, net, in the consolidated balance sheets.
Software to be Sold, Leased, or Marketed
The Company follows the provisions of ASC 985 Software, which requires that all costs relating to the purchase or internal development and production of computer software products to be sold, leased or otherwise marketed be expensed in the period incurred unless the requirements for technological feasibility have been established. The Company capitalizes all eligible computer software costs incurred once technological feasibility is established. The Company amortizes these costs using the straight-line method over a period of three to five years. At December 31, 2016 and 2015, the carrying amount of capitalized computer software costs related to the purchase or internal development and production of computer software to be sold, leased or otherwise marketed was $0.9 million and $0.7 million, respectively, and is included within property and equipment, net, in the consolidated balance sheets. During the years ended December 31, 2016, 2015, and 2014, the Company amortized and recognized associated depreciation expense of $0.4 million, $0.3 million, and $0.4 million, respectively, related to these capitalized computer software costs.
F-15
General and Administrative
General and administrative expenses include personnel-related expenses for executive, finance, legal, human resources, technology, facilities, and internal audit. In addition, general and administrative expenses include, among other costs, maintenance of existing software, technology and websites; development of new or improved software technology; professional fees for legal, accounting, and financial services; insurance; occupancy and other overhead-related costs; non-income taxes; bad debt expense; reserves or expenses related to litigation, investigations, or similar matters; and gains and losses on sales of assets. General and administrative expenses also include expenses resulting from actual or potential transactions such as acquisitions, spin-offs, financing transactions, and other strategic transactions.
Restructuring and Other Exit Costs
Restructuring and other exit costs consist of costs associated with the realignment and reorganization of the Company’s operations and other employee termination events. Restructuring and other exit costs include employee termination costs, facility closure and relocation costs, impairments of fixed assets related to restructuring actions, and contract termination costs. The timing of associated cash payments is dependent upon the type of exit cost and can extend over a 12-month period. The Company records restructuring and other exit costs liabilities in accrued liabilities or other liabilities in the consolidated balance sheets.
Stock-Based Compensation
The Company’s employees and non-employee directors are generally eligible to participate in the Company’s stock-based compensation plans. Under these plans, certain employees and non-employee directors of the Company received grants of restricted stock units (“RSUs”) and stock options for FTD common stock. For additional information related to equity awards, see Note 11—“Incentive Compensation Plans.”
Stock-based compensation expense is recognized on a straight-line basis over the vesting period of the award. The fair value of RSUs is based on the closing stock price on the date of grant. The fair value of stock options is determined using the Black-Scholes option-pricing model, which utilizes various assumptions including expected volatility and expected term. For awards issued by the Company, the simplified method was used to determine the term and the forfeiture rates were based on historical trends for the Company’s employees. Volatility is determined based on a combination of the Company’s and United Online’s historical volatility as the Company represented a significant portion of consolidated United Online prior to the Separation and the Company does not yet have sufficient history to base the assumption on solely its historical volatility.
Comprehensive Income/(Loss)
The Company follows the provisions of ASC 220, Comprehensive Income, which establishes standards for reporting comprehensive income and its components in financial statements. Comprehensive income, as defined, includes all changes in equity during a period from non-owner sources. For the Company, comprehensive income/(loss) primarily consists of its reported net income, changes in unrealized gains or losses on derivatives, net of tax, and foreign currency translation.
Foreign Currency Translation
The Company accounts for foreign currency translation in accordance with ASC 830, Foreign Currency Matters. The functional currency of each of the Company’s international subsidiaries is its respective local currency, with the exception of India for which it is the U.S. dollar. The financial statements of these subsidiaries are translated to U.S. Dollars using period-end rates of exchange for assets and liabilities, and average rates of exchange for the period for revenues and expenses. Translation gains and losses are recorded in accumulated other comprehensive loss as a component of equity in the consolidated balance sheets.
F-16
Income Taxes
The Company applies the provisions of ASC 740, Income Taxes (“ASC 740”), and computes the provision for income taxes on a separate return basis. Under ASC 740, deferred tax assets and liabilities are determined based on differences between the financial reporting and tax bases of assets and liabilities and are measured using the enacted tax rates and laws that will be in effect when the differences are expected to reverse. The Company records a valuation allowance to reduce its deferred tax assets to the amount that is more-likely-than-not to be realized. In evaluating the Company’s ability to recover its deferred tax assets, the Company considers all available positive and negative evidence, including its operating results, ongoing tax planning and forecasts of future taxable income on a jurisdiction by jurisdiction basis. In accordance with ASC 740, the Company recognizes, in its consolidated financial statements, the impact of the Company’s tax positions that are more-likely-than-not to be sustained upon examination based on the technical merits of the positions. The Company recognizes interest and penalties for uncertain tax positions in income tax expense.
Earnings Per Share
The Company computes earnings per share in accordance with ASC 260, Earnings Per Share (“ASC 260”). ASC 260 provides that unvested share-based payment awards that contain non-forfeitable rights to dividends are participating securities and shall be included in the computation of earnings per share pursuant to the two-class method. The two-class method of computing earnings per share is an earnings allocation formula that determines earnings per share for common stock and any participating securities according to dividends declared (whether paid or unpaid) and participation rights in undistributed earnings. Certain of the Company’s RSUs are considered participating securities because they contain non-forfeitable rights to dividends irrespective of whether dividends are actually declared or paid or the awards ultimately vest.
Legal Contingencies
The Company is currently involved in certain legal proceedings and investigations. The Company records a liability when it believes that it is both probable that a loss has been incurred, and the amount of loss can be reasonably estimated. The Company evaluates at least quarterly, developments in its legal matters that could affect the assessment of the probability of loss or the amount of liability, and makes adjustments as appropriate. Significant judgment is required to determine both probability and the estimated amount. The Company may be unable to estimate a possible loss or range of possible loss due to various reasons, including, among others: (i) if the damages sought are indeterminate, (ii) if the proceedings are in early stages, (iii) if there is uncertainty as to the outcome of pending appeals, motions or settlements, (iv) if there are significant factual issues to be determined or resolved, and (v) if there are novel or unsettled legal theories presented. In such instances, there is considerable uncertainty regarding the ultimate resolution of such matters, including a possible eventual loss, if any. The Company continually assesses the potential liability related to such pending matters.
Operating Leases
The Company leases space for warehouses, call center facilities, office space, distribution facilities, technology development and support, and data centers, and leases certain vehicles and office equipment under operating lease agreements with original lease periods of up to thirteen years. Certain of the lease agreements contain rent holidays and rent escalation provisions. Rent holidays and rent escalation provisions are considered in determining straight-line rent expense to be recorded over the lease term. The lease term begins on the date of initial possession of the leased property for purposes of recognizing lease expense on a straight-line basis over the term of the lease.
F-17
Recent Accounting Pronouncements
Recently Adopted Accounting Standards
Accounting Standards Update (“ASU”) 2015-03, Interest-Imputation of Interest, became effective as of January 1, 2016. This update requires that debt issuance costs related to a debt liability be presented in the balance sheet as a direct deduction from the carrying amount of that debt liability. ASU 2015-15, Presentation and Subsequent Measurement of Debt Issuance Costs Associated with Line-of-Credit Arrangements, also became effective as of January 1, 2016. This update clarifies that an entity may elect to present debt issuance costs related to a line-of-credit arrangement as an asset, regardless of whether or not there are any outstanding borrowings on the line-of-credit arrangement. The Company elected to present all debt issuance costs, including those associated with the Company’s revolving credit facility, consistently as a direct deduction from the carrying amount of the liability. The Company adopted the provisions of ASU 2015-03 effective January 1, 2016 and retrospectively applied the ASU to all periods presented, as required by the update. This resulted in a reclassification which reduced both other assets and the related outstanding debt by $5.1 million at December 31, 2015.
In March 2016, the Financial Accounting Standards Board (“FASB”) issued ASU 2016-04, Liabilities-Extinguishment of Liabilities-Recognition of Breakage for Certain Prepaid Stored-Value Products. The amendments in this ASU specify how a company should derecognize amounts related to expected breakage of prepaid store-value products. Breakage should be recognized in proportion to the pattern of rights expected to be exercised by the product holder to the extent that it is probable a significant reversal of the recognized breakage amount will not subsequently occur. The new standard is effective for fiscal years, and interim periods within those years, beginning after December 15, 2017, with early adoption permitted, and is to be applied retrospectively or using a modified retrospective approach. The Company’s accounting for breakage already follows the guidance in this ASU. Therefore, the Company considered this ASU to have been adopted upon issuance.
Recently Issued Accounting Standards
In May 2014, the FASB issued ASU 2014-09, Revenue from Contracts with Customers: Topic 606 and issued subsequent amendments to the initial guidance in August 2015, March 2016, April 2016, May 2016, and December 2016 within ASU 2015-14, ASU 2016-08, ASU 2016-10, ASU 2016-12, and ASU 2016-20, respectively (collectively, “Topic 606”). Topic 606 supersedes nearly all existing revenue recognition guidance under GAAP. The core principle of Topic 606 is to recognize revenues when promised goods or services are transferred to customers in an amount that reflects the consideration that is expected to be received for those goods or services. In addition, new and enhanced disclosures will be required. The guidance under this topic was deferred by ASU 2015-14 and is now effective for fiscal years and interim periods beginning on or after December 15, 2017, with early adoption permitted as of the original effective date for periods beginning after December 15, 2016. The Company plans to adopt Topic 606 in the first quarter of 2018, either on a full retrospective basis for each prior reporting period presented or on a modified retrospective basis with the cumulative effect of initially applying the new guidance recognized at the date of initial application. Preliminarily, the Company does not believe there will be a material impact to its consolidated financial statements upon adoption. The Company is continuing to evaluate the impacts of its pending adoption of Topic 606, and its preliminary assessments are subject to change.
In July 2015, FASB issued ASU No. 2015-11, Inventory—Simplifying the Measurement of Inventory. This update changes the measurement principle for inventory from the lower of cost or market to the lower of cost and net realizable value. The ASU defines net realizable value as the estimated selling prices in the ordinary course of business, less reasonably predictable costs of completion, disposal, and transportation. The update does not apply to inventory that is measured using last-in, first-out (LIFO) or the retail inventory method. The update applies to all other inventory, which includes inventory that is measured using first-in, first-out (FIFO) or average cost methods. The amendments in this ASU will be effective for the Company for fiscal years, and the interim periods within those years, beginning after December 15, 2016. The amendments must be applied prospectively and early adoption is permitted. The Company does not expect this update to have a significant impact on our consolidated financial statements.
F-18
In January 2016, FASB issued ASU No. 2016-01, Financial Instruments - Overall: Recognition and Measurement of Financial Assets and Financial Liabilities. The updated guidance enhances the reporting model for financial instruments, which includes amendments to address aspects of recognition, measurement, presentation and disclosure. The amendments in this ASU will be effective for the Company for fiscal years, and interim periods within those years, beginning after December 15, 2017. The amendments must be applied prospectively and early adoption is permitted for certain measurement enhancements within this amendment, early adoption is not permitted for other aspects updated in this amendment. The Company is currently assessing the impact of this update on its consolidated financial statements.
In February 2016, FASB issued ASU No. 2016-02, Leases. This update requires the recognition of certain lease assets and lease liabilities on the balance sheet as well as the disclosure of key information about leasing arrangements. The amendments in this ASU require the recognition and measurement of leases at the beginning of the earliest period presented using a modified retrospective approach. The modified retrospective approach includes a number of optional practical expedients which may be elected by the Company. The amendments in this ASU will be effective for the Company for fiscal years, and the interim periods within those years, beginning after December 15, 2018, and early adoption is permitted. The Company is currently assessing the impact of this update on its consolidated financial statements.
In March 2016, the FASB issued ASU 2016-09, Compensation-Stock Compensation. The amendments in this ASU simplify several aspects of the accounting for stock-based compensation, including the income tax consequences, the accounting for forfeitures, classification of awards as either equity or liabilities, and the classification on the statement of cash flows. The Company will adopt the guidance in the first quarter of 2017. The primary impact to the Company of adoption will be the recognition of excess tax benefits (shortfalls) within the provision for income taxes rather than within additional-paid-in-capital. The Company will adopt this provision on a prospective basis. Adoption of this update could increase the Company’s reported income taxes and reduce cash flows from operating activities depending on the difference between the future price of the Company’s common stock and the grant or exercise price at vesting or exercise dates.
In June 2016, the FASB issued ASU 2016-13, Financial Instruments-Credit Losses. This update seeks to provide financial statement users with more decision-useful information about the expected credit losses on financial instruments, including trade receivables, and other commitments to extend credit held by a reporting entity at each reporting date. The amendments require an entity to replace the incurred loss impairment methodology in current U.S. GAAP with a methodology that reflects current expected credit losses and requires consideration of a broader range of reasonable and supportable information to inform credit loss estimates. The amendments are effective for fiscal years, and interim periods within those fiscal years, beginning after December 15, 2019. Early adoption is permitted for fiscal years, and interim periods within those fiscal years, beginning after December 15, 2018. The amendments will be applied through a cumulative-effect adjustment to retained earnings as of the beginning of the first reporting period in which guidance is effective, which is a modified-retrospective approach. The Company is currently assessing the impact of this update on its consolidated financial statements.
In August 2016, the FASB issued ASU 2016-15, Statement of Cash Flows (Topic 230): Clarification of Certain Cash Receipts and Cash Payments. This update was issued to address the diversity in practice related to the classification of certain cash receipts and payments in the statement of cash flows by adding or clarifying guidance on eight specific cash flow issues. The amendments in this ASU will be effective for the Company for fiscal years, and interim periods within those fiscal years, beginning after December 15, 2017, with early adoption permitted. The amendments should be applied retrospectively to all periods presented, unless deemed impracticable, in which case, prospective application is permitted. The Company is currently assessing the impact of this update on its consolidated financial statements.
In January 2017, the FASB issued ASU 2017-04, Intangibles - Goodwill and Other (Topic 350): Simplifying the Test for Goodwill Impairment, which simplifies the subsequent measurement of goodwill by eliminating Step 2 from the goodwill impairment test. Under the new guidance, an entity will recognize an impairment charge for the amount by which the carrying value exceeds the fair value. This standard is effective for annual or any interim goodwill impairment tests in fiscal years beginning after December 15, 2019. Early adoption is permitted for interim or annual goodwill impairment tests performed on testing dates after January 1, 2017. The Company expects the adoption of ASU 2017-04 to reduce the complexity surrounding the evaluation of our goodwill for impairment. While the Company is still assessing the impact of ASU 2017-04, it does not believe that the adoption of this guidance will have a material impact on its consolidated financial statements.
F-19
2. ACQUISITION
Acquisition of Provide Commerce
On December 31, 2014, the Company acquired all of the issued and outstanding shares of common stock of Provide Commerce from Liberty. Provide Commerce’s portfolio of brands primarily includes ProFlowers and ProPlants for fresh-cut flowers, floral arrangements, and plants; Shari’s Berries for gourmet-dipped berries and other specialty foods; Personal Creations for personalized gifts; and Ink Cards and Postagram for mobile gifting applications. The Acquisition expanded the breadth of the Company’s brand by combining two complementary businesses to offer customers a greater variety of floral and gifting products and an enhanced shopping experience.
The purchase price consisted of (i) cash consideration of $106.6 million, excluding acquired cash on hand of $38.1 million, and a post-closing working capital adjustment of $9.9 million, and (ii) 10.2 million shares of FTD common stock. These shares represented approximately 35% of the issued and outstanding shares of FTD common stock at the close of the Acquisition. The FTD common stock was valued at $34.82 per share, the closing price on December 31, 2014, the date of the Acquisition, for purposes of determining the purchase price. In April 2015, FTD made a payment to Liberty in full satisfaction of the post-closing working capital adjustment. The purchase price was allocated to the tangible and intangible assets acquired and liabilities assumed based on management’s estimates of their respective fair values as of the closing date of the Acquisition. The Company believes that the fair values assigned to the assets acquired and the liabilities assumed were based on reasonable assumptions.
The following table summarizes the fair value of the assets acquired and liabilities assumed (in thousands):
Fair Value | |||
Net liabilities assumed: | |||
Cash | $ | 38,081 | |
Accounts receivable | 8,300 | ||
Inventories | 17,821 | ||
Prepaid expenses | 11,550 | ||
Other assets | 14,918 | ||
Property and equipment | 42,212 | ||
Accounts payable and accrued liabilities | (82,174 | ) | |
Deferred tax liabilities, net | (90,766 | ) | |
Other liabilities | (13,342 | ) | |
Total net liabilities assumed | (53,400 | ) | |
Intangible assets acquired: | |||
Trademarks and trade names | 119,400 | ||
Customer contracts and relationships | 91,100 | ||
Complete technology | 36,300 | ||
Total intangible assets acquired | 246,800 | ||
Goodwill | 316,501 | ||
Total purchase price | $ | 509,901 | |
The acquired intangibles are being amortized on a straight-line basis over their estimated useful lives, which range from two to fifteen years. The goodwill acquired in the Acquisition is not deductible for federal tax purposes.
As the Acquisition was completed on December 31, 2014, no results of operations of Provide Commerce were included in the consolidated statement of operations of the Company for the year ended December 31, 2014. The Company’s consolidated balance sheet at December 31, 2014 included the assets acquired and liabilities assumed in the Acquisition.
F-20
3. SEGMENT INFORMATION
Prior to the Acquisition, the Company reported its business operations in three reportable segments: Consumer, Florist, and International. As a result of the Acquisition, the Company began reporting its business in four reportable segments: Consumer, Florist, International, and Provide Commerce. As the Acquisition was completed on December 31, 2014, no results of operations of Provide Commerce were included in the Company’s consolidated statement of operations for the year ended December 31, 2014.
The Company follows the reporting requirements of ASC 280, Segment Reporting. Management measures and reviews the Company’s operating results by segment in accordance with the “management approach” defined in ASC 280. The reportable segments identified below were the segments of the Company, for which separate financial information was available and for which segment results were regularly reviewed by the Company’s chief operating decision maker (“CODM”) to make decisions about the allocation of resources and to assess performance. The CODM uses segment operating income to evaluate the performance of the business segments and make decisions about allocating resources among segments. Segment operating income is operating income excluding depreciation, amortization, litigation and dispute settlement charges or gains, transaction-related costs, restructuring and other exit costs, and impairment of goodwill and intangible assets. Stock-based compensation and general corporate expenses are not allocated to the segments. Segment operating income is prior to intersegment eliminations and excludes other expense, net.
Below is a reconciliation of segment revenues to consolidated revenues (in thousands):
Year Ended December 31, | |||||||||||
2016 | 2015 | 2014 | |||||||||
Products revenues: | |||||||||||
Consumer | $ | 291,275 | $ | 321,413 | $ | 318,343 | |||||
Provide Commerce | 529,733 | 583,326 | — | ||||||||
Florist | 48,952 | 49,605 | 46,397 | ||||||||
International | 133,249 | 145,679 | 154,428 | ||||||||
Segment products revenues | $ | 1,003,209 | $ | 1,100,023 | $ | 519,168 | |||||
Services revenues: | |||||||||||
Florist | $ | 117,929 | $ | 116,177 | $ | 116,155 | |||||
International | 19,451 | 21,237 | 22,073 | ||||||||
Segment services revenues | $ | 137,380 | $ | 137,414 | $ | 138,228 | |||||
Intersegment eliminations | (18,590 | ) | (19,104 | ) | (18,391 | ) | |||||
Consolidated revenues | $ | 1,121,999 | $ | 1,218,333 | $ | 639,005 | |||||
Intersegment revenues represent amounts charged from one segment to the other for services provided based on order volume at a set rate per order. Intersegment revenues by segment were as follows (in thousands):
Year Ended December 31, | |||||||||||
2016 | 2015 | 2014 | |||||||||
Intersegment revenues: | |||||||||||
Consumer | $ | (16,155 | ) | $ | (17,561 | ) | $ | (18,061 | ) | ||
Provide Commerce | (2,097 | ) | (1,245 | ) | — | ||||||
Florist | (338 | ) | (298 | ) | (330 | ) | |||||
Total intersegment revenues | $ | (18,590 | ) | $ | (19,104 | ) | $ | (18,391 | ) | ||
F-21
The Provide Commerce segment is comprised of the ProFlowers, Gourmet Foods, and Personal Creations business units. The revenues for the business units were as follows:
Year Ended December 31, | |||||||
2016 | 2015 | ||||||
Provide Commerce revenues: | |||||||
ProFlowers | $ | 284,360 | $ | 342,805 | |||
Gourmet Foods | 135,796 | 138,747 | |||||
Personal Creations | 109,577 | 101,774 | |||||
Total Provide Commerce revenues | $ | 529,733 | $ | 583,326 | |||
Geographic revenues from sales to external customers were as follows for the periods presented (in thousands):
Year Ended December 31, | |||||||||||
2016 | 2015 | 2014 | |||||||||
U.S. | $ | 969,299 | $ | 1,051,417 | $ | 462,504 | |||||
U.K. | 152,700 | 166,916 | 176,501 | ||||||||
Consolidated revenues | $ | 1,121,999 | $ | 1,218,333 | $ | 639,005 | |||||
Below is a reconciliation of segment operating income to consolidated operating income and income before income taxes (in thousands):
Year Ended December 31, | |||||||||||
2016 | 2015 | 2014 | |||||||||
Segment Operating income (a) | |||||||||||
Consumer | $ | 30,210 | $ | 36,804 | $ | 31,310 | |||||
Provide Commerce | 40,514 | 41,802 | — | ||||||||
Florist | 48,406 | 47,162 | 47,077 | ||||||||
International | 19,128 | 18,380 | 18,544 | ||||||||
Total segment operating income | 138,258 | 144,148 | 96,931 | ||||||||
Unallocated expenses(b) | (49,899 | ) | (46,600 | ) | (39,012 | ) | |||||
Impairment of goodwill and intangible assets | (84,000 | ) | (85,000 | ) | — | ||||||
Depreciation expense and amortization of intangible assets | (85,099 | ) | (85,251 | ) | (21,759 | ) | |||||
Operating income/(loss) | (80,740 | ) | (72,703 | ) | 36,160 | ||||||
Interest expense, net | (9,195 | ) | (9,243 | ) | (5,474 | ) | |||||
Other income, net | 1,678 | 686 | 330 | ||||||||
Income/(loss) before income taxes | $ | (88,257 | ) | $ | (81,260 | ) | $ | 31,016 | |||
(a) | Segment operating income is operating income excluding depreciation, amortization, litigation and dispute settlement charges or gains, transaction-related costs, restructuring and other exit costs, and impairment of goodwill and intangible assets. Stock-based compensation and general corporate expenses are not allocated to the segments. Segment operating income is prior to intersegment eliminations and excludes other expense, net. |
(b) | Unallocated expenses include various corporate costs, such as executive management, corporate finance, legal, and certain human resources costs. In addition, unallocated expenses include stock-based compensation for all eligible Company employees, restructuring and other exit costs, transaction-related costs, and litigation and dispute settlement charges or gains. |
F-22
Assets and liabilities are reviewed at the consolidated level by management. Segment assets are not reported to, or used by, the Company’s chief operating decision maker to allocate resources to or assess performance of the segments, and therefore, total segment assets have not been disclosed. Geographic information for long-lived assets, consisting of amortizable intangible assets, property and equipment and other non-current assets, was as follows (in thousands):
December 31, | |||||||
2016 | 2015 | ||||||
U.S | $ | 198,486 | $ | 265,201 | |||
U.K. | 6,465 | 7,743 | |||||
Total long-lived assets | $ | 204,951 | $ | 272,944 | |||
4. BALANCE SHEET COMPONENTS
Financing Receivables
The Company has financing receivables related to equipment sales to its floral network members. The current and noncurrent portions of financing receivables are included in accounts receivable and other assets, respectively, in the consolidated balance sheets. The Company assesses financing receivables individually for balances due from current floral network members and collectively for balances due from terminated floral network members.
Credit quality of financing receivables was as follows (in thousands):
December 31, | |||||||
2016 | 2015 | ||||||
Current | $ | 11,490 | $ | 11,102 | |||
Past due | 865 | 746 | |||||
Total | $ | 12,355 | $ | 11,848 | |||
The aging of past due financing receivables was as follows (in thousands):
December 31, | |||||||
2016 | 2015 | ||||||
Current | $ | 11,490 | $ | 11,102 | |||
Past due: | |||||||
1 - 150 days past due | 120 | 152 | |||||
151 - 364 days past due | 129 | 175 | |||||
365 - 730 days past due | 230 | 242 | |||||
731 or more days past due | 386 | 177 | |||||
Total | $ | 12,355 | $ | 11,848 | |||
Financing receivables on nonaccrual status at December 31, 2016 and December 31, 2015, totaled $1.0 million and $0.8 million, respectively. For further information, see table below “Allowance for Credit Losses.”
F-23
The allowance for credit losses and the recorded investment in financing receivables were as follows (in thousands):
Year Ended December 31, | |||||||
2016 | 2015 | ||||||
Allowance for credit losses: | |||||||
Balance at January 1 | $ | 706 | $ | 3,200 | |||
Provision | 220 | 312 | |||||
Write-offs charged against allowance | (80 | ) | (2,806 | ) | |||
Balance at December 31 | $ | 846 | $ | 706 | |||
Ending balance collectively evaluated for impairment | $ | 838 | $ | 674 | |||
Ending balance individually evaluated for impairment | $ | 8 | $ | 32 | |||
Recorded investments in financing receivables: | |||||||
Balance collectively evaluated for impairment | $ | 956 | $ | 790 | |||
Balance individually evaluated for impairment | $ | 11,399 | $ | 11,058 | |||
Individually evaluated impaired loans, including the recorded investment in such loans, the unpaid principal balance, and the allowance related to such loans, each totaled less than $0.1 million at both December 31, 2016 and December 31, 2015. The average recorded investment in such loans was less than $0.1 million in each of the years ended December 31, 2016 and 2015. Interest income recognized on impaired loans was less than $0.1 million in each of the years ended December 31, 2016 and 2015.
Property and Equipment
Property and equipment consisted of the following (in thousands):
December 31, | |||||||
2016 | 2015 | ||||||
Land and improvements | $ | 1,565 | $ | 1,601 | |||
Buildings and improvements | 16,080 | 16,303 | |||||
Leasehold improvements | 16,290 | 16,691 | |||||
Equipment | 14,771 | 13,711 | |||||
Computer equipment | 26,633 | 27,067 | |||||
Computer software | 61,332 | 50,897 | |||||
Furniture and fixtures | 3,310 | 3,564 | |||||
139,981 | 129,834 | ||||||
Accumulated depreciation | (82,422 | ) | (65,081 | ) | |||
Total | $ | 57,559 | $ | 64,753 | |||
Depreciation expense, including the amortization of leasehold improvements, for the years ended December 31, 2016, 2015 and 2014 was $24.0 million, $23.8 million and $10.0 million, respectively. As the Acquisition was completed on December 31, 2014, no depreciation expense related to the acquired assets is included in the Company’s consolidated statement of operations for the year ended December 31, 2014.
F-24
5. TRANSACTIONS WITH RELATED PARTIES
Transactions with Liberty
As a result of the Acquisition, Liberty entered into an Investor Rights Agreement, which governs certain rights of and restrictions on Liberty in connection with the shares of FTD common stock that Liberty. As of December 31, 2016, Liberty holds 37.4% of the outstanding shares of FTD common stock. In addition, Provide Commerce and Liberty entered into a services agreement (the “Services Agreement”), under which Provide Commerce, on a short-term transitional basis, provided Liberty with certain support service and other assistance after the Acquisition in respect of the RedEnvelope business, an online e-commerce business that was not acquired by FTD as part of the Acquisition. Fees of $0.3 million were earned during the term of the Services Agreement. On April 1, 2015, Provide Commerce and Liberty entered into an amendment to the Services Agreement to extend the term of the Services Agreement to June 30, 2015. The Services Agreement terminated on June 30, 2015.
The Acquisition purchase price was subject to adjustment based upon the final closing working capital, which adjustment was determined to be $9.9 million. In April 2015, FTD made a payment to Liberty in full satisfaction of this adjustment.
On April 30, 2015, the Company, through a wholly owned subsidiary, entered into a Purchase and Sale Agreement with an indirect wholly owned subsidiary of Liberty, pursuant to which the Company acquired certain residual assets previously used by Liberty in the online e-commerce business operated under the trade name of RedEnvelope for a cash purchase price of $0.3 million. The purchase price was allocated to the assets acquired based on their relative fair values, resulting in allocated values of $0.1 million to fixed assets, $0.1 million to inventory, and $0.1 million to the trademark and trade name.
The I.S. Group Limited
Interflora holds an equity investment of 20.4% in The I.S. Group Limited (“I.S. Group”). The investment was $1.4 million at December 31, 2016 and $1.6 million at December 31, 2015, and is included in other assets in the consolidated balance sheets. I.S. Group supplies floral-related products to Interflora’s floral network members in both the U.K. and the Republic of Ireland as well as to other customers. Interflora derives revenues from I.S. Group from (i) the sale of products (sourced from third-party suppliers) to I.S. Group for which revenue is recognized on a gross basis, (ii) commissions on products sold by I.S. Group (sourced from third-party suppliers) to floral network members, and (iii) commissions for acting as a collection agent on behalf of I.S. Group. Revenues related to products sold to and commissions earned from I.S. Group were $2.4 million, $2.8 million, and $3.0 million in the years ended December 31, 2016, 2015, and 2014, respectively. In addition, Interflora purchases products from I.S. Group for sale to consumers. The cost of revenues related to products purchased from I.S. Group was $0.4 million, $0.4 million, and $0.3 million in the years ended December 31, 2016, 2015, and 2014, respectively. Amounts due from I.S. Group were $0.3 million at both December 31, 2016 and 2015, and amounts payable to I.S. Group were $1.2 million and $1.4 million at December 31, 2016 and December 31, 2015, respectively.
6. GOODWILL, INTANGIBLE ASSETS, AND OTHER LONG-LIVED ASSETS
Goodwill
The Company tests goodwill for impairment annually during the fourth quarter of each year at the reporting unit level and on an interim basis if events or substantive changes in circumstances indicate that the carrying amount of a reporting unit may exceed its fair value. The fair value of each of the Consumer, Florist, International, and Personal Creations reporting units significantly exceeded their carrying values. Therefore, each of these reporting units passed step one of the goodwill impairment test and their goodwill was determined not to be impaired. The ProFlowers/Gourmet Foods reporting unit, a significant portion of the Provide Commerce reporting segment, failed step one of the goodwill impairment test. Since the Acquisition, the Company’s focus for this reporting unit has been on disciplined cost management and decisions to reduce operating expenses resulted in reductions in revenue. Through the third quarter, the reporting unit maintained its planned profitability levels. However, beginning in the fourth quarter, profitability for the ProFlowers/Gourmet Foods reporting unit fell
F-25
significantly behind budget due to increasingly competitive market conditions. Therefore, during the fourth quarter, in conjunction with the annual planning process, management reassessed its expectations for the next fiscal year budget for this reporting unit. The competitive market conditions resulted in lower expected future revenues, profitability, and cash flows. Due to the reduction in the expected cash flows, which were used to estimate the fair value of the ProFlowers/Gourmet Foods reporting unit, the reporting unit failed step one of the annual impairment test.
Because our annual test indicated that the ProFlowers/Gourmet Foods’ carrying value exceeded its estimated fair value, a second phase of the goodwill impairment test was performed. Under step two, the fair value of all ProFlowers/Gourmet Foods assets and liabilities were estimated, including tangible assets, developed technology, customer relationships, and trade names, for the purpose of deriving an estimate of the implied fair value of goodwill. The implied fair value of the goodwill was then compared to the recorded goodwill to determine the amount of the impairment.
The changes in the net carrying amount of goodwill the years ended December 31, 2016 and 2015 were as follows (in thousands):
Consumer | Florist | International | Provide Commerce | Total | |||||||||||||||
Goodwill at December 31, 2014 | $ | 133,226 | $ | 109,651 | $ | 92,259 | $ | 297,076 | $ | 632,212 | |||||||||
Foreign currency translation | — | — | (4,981 | ) | — | (4,981 | ) | ||||||||||||
Provide Commerce acquisition(a) | — | — | — | 19,425 | 19,425 | ||||||||||||||
Impairment of Goodwill(b) | — | — | — | (85,000 | ) | (85,000 | ) | ||||||||||||
Goodwill at December 31, 2015 | $ | 133,226 | $ | 109,651 | $ | 87,278 | $ | 231,501 | $ | 561,656 | |||||||||
Consumer | Florist | International | Provide Commerce | Total | |||||||||||||||
Goodwill at December 31, 2015 | $ | 133,226 | $ | 109,651 | $ | 87,278 | $ | 231,501 | $ | 561,656 | |||||||||
Foreign currency translation | — | — | (14,191 | ) | — | (14,191 | ) | ||||||||||||
Impairment of Goodwill(b) | — | — | — | (84,000 | ) | (84,000 | ) | ||||||||||||
Goodwill at December 31, 2016 | $ | 133,226 | $ | 109,651 | $ | 73,087 | $ | 147,501 | $ | 463,465 | |||||||||
(a) | Adjustments to goodwill include revisions to fair value amounts and the final working capital adjustment, which were recorded during the year ended December 31, 2015. |
(b) | During the years ended December 31, 2016 and 2015, the Company recorded impairment charges of $84.0 million and $85.0 million, respectively, related to the ProFlowers/Gourmet Foods reporting unit. |
In 2008, the Company recorded an impairment charge of $116.3 million. The accumulated total goodwill impairment was $285.3 million at December 31, 2016. The table above reflects the Company’s goodwill balances net of these accumulated impairment charges.
F-26
Intangible Assets
Intangible assets are primarily related to the acquisition of the Company by United Online in August 2008 and the acquisition of Provide Commerce in December 2014 and consist of the following (in thousands):
December 31, 2016 | December 31, 2015 | ||||||||||||||||||||||
Gross Value | Accumulated Amortization | Net | Gross Value | Accumulated Amortization | Net | ||||||||||||||||||
Complete technology | $ | 76,486 | $ | (54,705 | ) | $ | 21,781 | $ | 77,494 | $ | (48,438 | ) | $ | 29,056 | |||||||||
Customer contracts and relationships | 192,183 | (192,183 | ) | — | 195,209 | (149,636 | ) | 45,573 | |||||||||||||||
Trademarks and trade names | 267,834 | (16,817 | ) | 251,017 | 274,606 | (8,676 | ) | 265,930 | |||||||||||||||
Total | $ | 536,503 | $ | (263,705 | ) | $ | 272,798 | $ | 547,309 | $ | (206,750 | ) | $ | 340,559 | |||||||||
Some of the Company’s trademarks and trade names are indefinite-lived for which there is no associated amortization expense or accumulated amortization. At December 31, 2016 and December 31, 2015, such indefinite-lived assets, after impairment and foreign currency translation adjustments, totaled $147.5 million and $154.2 million, respectively. Included in the above intangible assets are $36.3 million of complete technology, $91.1 million of customer contracts and relationships, and $119.4 million of trademarks and trade names acquired in connection with the Acquisition.
The Company elected to perform the one step quantitative impairment test for our indefinite-lived intangible assets under ASC 350. Under the one step quantitative impairment test, the fair values of indefinite-lived intangible assets are compared to their respective carrying amounts and, if the carrying amount of an indefinite-lived intangible asset exceeds its fair value, an impairment loss is recognized equal to the excess. The annual quantitative indefinite-lived intangible assets impairment test resulted in the determination that the fair values of the indefinite-lived intangible assets exceeded their carrying amounts.
As a result of the impairment of the ProFlowers/Gourmet Foods’ goodwill, the Company assessed if there was any impairment of intangible or other long-lived assets within the ProFlowers/Gourmet Foods’ reporting unit and concluded that such assets were not impaired.
As of December 31, 2016, estimated future intangible assets amortization expense for each of the next five years and thereafter, was as follows (in thousands):
For the Year Ended | Future Amortization Expense | ||
2017 | $ | 15,274 | |
2018 | 15,274 | ||
2019 | 15,274 | ||
2020 | 8,006 | ||
2021 | 8,001 | ||
Thereafter | 63,425 | ||
Total | $ | 125,254 | |
7. FINANCING ARRANGEMENTS
Credit Agreement
On September 19, 2014, FTD Companies, Inc. entered into a credit agreement (the “Credit Agreement”) with Interflora, certain wholly owned domestic subsidiaries of FTD Companies, Inc. party thereto as guarantors, the financial institutions party thereto from time to time, Bank of America Merrill Lynch and Wells Fargo Securities, LLC, as joint lead arrangers and book managers, and Bank of America, N.A., as administrative agent (in such capacity, the “Administrative Agent”). The Credit Agreement provided for a term loan in an aggregate principal amount of $200 million, the proceeds of
F-27
which were used to repay a portion of outstanding revolving loans, and also provided for a revolving loan advance (the “Acquisition Advance”) to finance the cash portion of the Provide Commerce purchase price.
The proceeds of the term loan were used to repay a portion of outstanding revolving loans and, on December 31, 2014, the Company borrowed $120 million under the Acquisition Advance to fund the cash portion of the acquisition purchase price of Provide Commerce. The obligations under the Credit Agreement are guaranteed by certain of FTD Companies, Inc.’s wholly owned domestic subsidiaries (together with FTD Companies, Inc., the “U.S. Loan Parties”). In addition, the obligations under the Credit Agreement are secured by a lien on substantially all of the assets of the U.S. Loan Parties, including a pledge of all of the outstanding capital stock of certain direct subsidiaries of the U.S. Loan Parties (except with respect to foreign subsidiaries and certain domestic subsidiaries whose assets consist primarily of foreign subsidiary equity interests, in which case such pledge is limited to 66% of the outstanding capital stock).
The interest rates applicable to borrowings under the Credit Agreement are based on either LIBOR plus a margin ranging from 1.50% per annum to 2.50% per annum, or a base rate plus a margin ranging from 0.50% per annum to 1.50% per annum, calculated according to the Company’s net leverage ratio. At December 31, 2016, the base rate margin was .75% per annum and the LIBOR margin was 1.75% per annum. In addition, the Company pays a commitment fee ranging from 0.20% per annum to 0.40% per annum on the unused portion of the revolving credit facility. The stated interest rates (based on LIBOR) at December 31, 2016, under the term loan and the revolving credit facility were 2.75% and 2.52%, respectively. The effective interest rates at December 31, 2016, under the term loan and the revolving credit facility were 3.46% and 3.06%, respectively. The commitment fee rate at December 31, 2016, was 0.25%. The Credit Agreement contains customary representations and warranties, events of default, affirmative covenants and negative covenants, that, among other things, require the Company to maintain compliance with a maximum net leverage ratio and a minimum consolidated fixed charge coverage ratio, and impose restrictions and limitations on, among other things, investments, dividends, share repurchases, and asset sales, and the Company’s ability to incur additional debt and additional liens.
The term loan is subject to amortization payments of $5 million per quarter and customary mandatory prepayments under certain conditions. During the year ended December 31, 2016, the Company made scheduled payments of $20 million under the term loan. The outstanding balance of the term loan and all amounts outstanding under the revolving credit facility are due upon maturity in September 2019. The future minimum principal payments through the maturity date of the Credit Agreement were as follows for each of the next five years (in thousands):
For the Year Ended | Future Minimum Principal Payments | ||
2017 | $ | 20,000 | |
2018 | 20,000 | ||
2019 | 240,000 | ||
2020 | — | ||
2021 | — | ||
Total | $ | 280,000 | |
The refinancing of the Credit Agreement was accounted for in accordance with ASC 470, Debt. Losses on the extinguishment of debt of $0.1 million was recorded in interest expense in connection with the refinancing during the year ended December 31, 2014.
F-28
The changes in the Company’s debt balances for the years ended December 31, 2016 and 2015 were as follows for the Credit Agreement (in thousands):
Balance at December 31, 2014 | Draw Down of Debt | Repayments of Debt | Balance at December 31, 2015 | ||||||||||||
Revolving Credit Facility | $ | 140,000 | $ | 10,000 | $ | (30,000 | ) | $ | 120,000 | ||||||
Term Loan | 200,000 | — | (20,000 | ) | 180,000 | ||||||||||
Total Principal Outstanding | $ | 340,000 | $ | 10,000 | $ | (50,000 | ) | $ | 300,000 | ||||||
Debt Issuance Costs | (6,413 | ) | (5,054 | ) | |||||||||||
Total Debt, Net of Debt Issuance Costs | $ | 333,587 | $ | 294,946 | |||||||||||
Balance at December 31, 2015 | Draw Down of Debt | Repayments of Debt | Balance at December 31, 2016 | ||||||||||||
Revolving Credit Facility | $ | 120,000 | $ | — | $ | — | $ | 120,000 | |||||||
Term Loan | 180,000 | — | (20,000 | ) | 160,000 | ||||||||||
Total Principal Outstanding | $ | 300,000 | $ | — | $ | (20,000 | ) | $ | 280,000 | ||||||
Debt Issuance Costs | (5,054 | ) | (3,694 | ) | |||||||||||
Total Debt, Net of Debt Issuance Costs | $ | 294,946 | $ | 276,306 | |||||||||||
At December 31, 2016, the remaining borrowing capacity under the Credit Agreement, which was reduced by $2.4 million in outstanding letters of credit, was $227.6 million.
8. DERIVATIVE INSTRUMENTS
In March 2012, the Company purchased, for $1.9 million, forward starting interest rate cap instruments based on 3-month LIBOR, effective January 2015 through June 2018. The forward starting interest rate cap instruments have aggregated notional values totaling $130 million. The interest rate cap instruments are designated as cash flow hedges against expected future cash flows attributable to future 3-month LIBOR interest payments on a portion of the outstanding borrowings under the Company’s Credit Agreement. The gains or losses on the instruments are reported in other comprehensive income/(loss) to the extent that they are effective and are reclassified into earnings when the cash flows attributable to 3-month LIBOR interest payments are recognized in earnings.
The estimated fair values and notional values of outstanding derivative instruments at December 31, 2016 and December 31, 2015 were as follows (in thousands):
Estimated Fair Value of Derivative Instruments | Notional Value of Derivative Instruments | ||||||||||||||||
December 31, | December 31, | ||||||||||||||||
Balance Sheet Location | 2016 | 2015 | 2016 | 2015 | |||||||||||||
Derivative Assets: | |||||||||||||||||
Interest rate caps | Other assets | $ | 1 | $ | 35 | $ | 130,000 | $ | 130,000 | ||||||||
The Company recognized the following gains/(losses) from derivatives, before tax, in other comprehensive income/(loss) (in thousands):
Year Ended December 31, | |||||||||||
2016 | 2015 | 2014 | |||||||||
Derivatives Designated as Cash Flow Hedging Instruments: | |||||||||||
Interest rate caps | $ | (34 | ) | $ | (335 | ) | $ | (874 | ) | ||
F-29
The effective portion, before tax effect, of the Company’s interest rate caps designated as cash flow hedging instruments was $0.8 million, $1.4 million, and $1.5 million at December 31, 2016, 2015, and 2014. At December 31, 2016, $0.6 million of this amount was expected to be reclassified from accumulated other comprehensive loss into interest expense in the consolidated statements of operations within the next twelve months. During the years ended December 31, 2016 and 2015, $0.6 million and $0.5 million, respectively, was reclassified from accumulated other comprehensive loss into interest expense in the consolidated statements of operations. No amounts were reclassified during the year ended December 31, 2014.
During the years ended December 31, 2016 and 2014, the Company entered into forward foreign currency exchange contracts which were not designated as hedging instruments. Accordingly, gains and losses related to changes in the fair value of such contracts are reflected in other income, net in the consolidated statement of operations for the years ended December 31, 2016 and 2014. During the year ended 2015, the Company had no forward foreign currency exchange contracts outstanding.
9. FAIR VALUE MEASUREMENTS
The following table presents estimated fair values of financial assets and liabilities and derivative instruments that were required to be measured at fair value on a recurring basis (in thousands):
December 31, 2016 | December 31, 2015 | ||||||||||||||||||||||
Total | Level 1 | Level 2 | Total | Level 1 | Level 2 | ||||||||||||||||||
Assets: | |||||||||||||||||||||||
Money market funds | $ | 13,197 | $ | 13,197 | $ | — | $ | 7,024 | $ | 7,024 | $ | — | |||||||||||
Derivative assets | 1 | — | 1 | 35 | — | 35 | |||||||||||||||||
Total | $ | 13,198 | $ | 13,197 | $ | 1 | $ | 7,059 | $ | 7,024 | $ | 35 | |||||||||||
Liabilities: | |||||||||||||||||||||||
Non-qualified deferred compensation plan | $ | 2,371 | $ | — | $ | 2,371 | $ | 3,950 | $ | — | $ | 3,950 | |||||||||||
Total | $ | 2,371 | $ | — | $ | 2,371 | $ | 3,950 | $ | — | $ | 3,950 | |||||||||||
Provide Commerce has an executive deferred compensation plan for key management level employees under which such employees could elect to defer receipt of current compensation. This plan is intended to be an unfunded, non-qualified deferred compensation plan that complies with the provisions of section 409A of the Internal Revenue Code. At the time of the Acquisition, contributions to the plan were suspended except those relating to any compensation earned but not yet paid as of the date of the Acquisition. The plan assets, which consist primarily of life insurance contracts recorded at their cash surrender value, were $11.6 million and $12.0 million at December 31, 2016 and December 31, 2015, respectively, and are included in other assets in the accompanying consolidated balance sheets.
The Company estimated the fair value of its long-term debt using a discounted cash flow approach that incorporates a market interest yield curve with adjustments for duration and risk profile. In determining the market interest yield curve, the Company considered, among other factors, its estimated credit spread. At December 31, 2016, the Company estimated its credit spread as 1.4% and 2.0% for the term loan and revolving credit facility, respectively, resulting in yield-to-maturity estimates for the term loan and revolving credit facility of 2.8% and 3.4% respectively. At December 31, 2015, the Company estimated its credit spread as 2.1% and 2.7% for the term loan and revolving credit facility, respectively, resulting in yield-to-maturity estimates for the term loan and revolving credit facility of 3.5% and 4.1%, respectively.
The table below summarizes the carrying amounts and estimated fair values for long-term debt (in thousands):
December 31, 2016 | December 31, 2015 | ||||||||||||||
Carrying Amount | Estimated Fair Value | Carrying Amount | Estimated Fair Value | ||||||||||||
Level 2 | Level 2 | ||||||||||||||
Long-term debt, including current portion | $ | 280,000 | $ | 280,000 | $ | 300,000 | $ | 297,876 | |||||||
Fair value approximates the carrying amount of financing receivables because such receivables are discounted at a rate comparable to market. Fair values of cash and cash equivalents, short-term accounts receivable, and accounts payable approximate their carrying amounts because of their short-term nature.
F-30
10. STOCKHOLDERS’ EQUITY
Capital Stock
The Company’s authorized shares of capital stock of 65.0 million are divided into 60.0 million shares of common stock, par value $0.0001 per share, and 5.0 million shares of preferred stock, par value $0.0001 per share. In connection with the acquisition of Provide Commerce, the Company issued 10.2 million shares of FTD common stock to Liberty. As of December 31, 2016, Liberty holds 37.4% of the outstanding shares of FTD common stock.
At December 31, 2016, none of the 5.0 million shares of preferred stock were outstanding, and the Company has no present plans to issue any shares of preferred stock. The Company’s board of directors has the authority, without action by the Company’s stockholders, to designate and issue the preferred stock in one or more series and to designate the rights, preferences, limitations and privileges of each series of preferred stock, which may be greater than the rights of the Company’s common stock.
Dividends
The Company has not paid any cash dividends on its common stock during the periods presented.
Common Stock Repurchases
On February 27, 2014, the Company’s board of directors authorized a common stock repurchase program (the “2014 Repurchase Program”) that allows FTD Companies, Inc. to repurchase up to $50 million of its common stock from time to time over a two-year period in both open market and privately negotiated transactions. No purchases were made under the 2014 Repurchase Program prior to 2015. During the year ended December 31, 2015, the Company repurchased 1.8 million shares under the 2014 Repurchase Program at an average cost per share of $27.31, fully utilizing the $50 million authorization. On March 8, 2016, the Company’s board of directors authorized a new common stock repurchase program (the “2016 Repurchase Program”) that allows FTD Companies, Inc. to repurchase up to $60 million of its common stock from time to time over a two-year period in both open market and privately negotiated transactions. As of December 31, 2016, the company has repurchased 0.6 million shares under the 2016 Repurchase Program at an average per share cost of $25.37. Repurchased shares are generally held in treasury pending use for general corporate purposes, including issuances under various employee and director stock plans.
Upon vesting of restricted stock units (“RSUs”) or exercise of stock options, the Company does not collect the minimum statutory withholding taxes in cash from employees. Instead, the Company automatically withholds, from the RSUs that vest or stock options exercised, the portion of those shares with a fair market value equal to the amount of the minimum statutory withholding taxes due. The withheld shares are accounted for as repurchases of common stock but are not counted against the limits under any repurchase program. The Company then pays the minimum statutory withholding taxes in cash. During the year ended December 31, 2016, 0.3 million RSUs vested for which 0.1 million shares were withheld to cover the minimum statutory withholding taxes of $2.3 million. During the year ended December 31, 2015, 0.2 million RSUs vested for which 0.1 million shares were withheld to cover the minimum statutory withholding taxes of $2.6 million.
11. INCENTIVE COMPENSATION PLANS
FTD Companies, Inc. Amended and Restated 2013 Incentive Compensation Plan
In June 2015, stockholders approved the amendment and restatement of the FTD Companies, Inc. Amended and Restated 2013 Incentive Compensation Plan (as so amended, the “Amended and Restated 2013 Plan”), which provides for the granting of awards to employees and non-employee directors, including stock options, stock appreciation rights, RSUs and other stock-based awards. Under the Amended and Restated 2013 Plan, 5.2 million shares of FTD common stock have been reserved for issuance of awards. At December 31, 2016, the Company had 2.4 million shares available for issuance under the Amended and Restated 2013 Plan.
F-31
Stock-Based Compensation
The following table summarizes the non-cash stock-based compensation incurred under the 2013 Plan that has been included in the consolidated statements of operations (in thousands):
Year Ended December 31, | |||||||||||
2016 | 2015 | 2014 | |||||||||
Cost of revenues | $ | 135 | $ | 109 | $ | 95 | |||||
Sales and marketing | 4,128 | 3,344 | 2,457 | ||||||||
General and administrative | 9,349 | 9,459 | 4,799 | ||||||||
Restructuring and other exit costs | 3,373 | — | — | ||||||||
Total stock-based compensation | $ | 16,985 | $ | 12,912 | $ | 7,351 | |||||
Tax benefit recognized | $ | 6,240 | $ | 3,580 | $ | 2,158 | |||||
Restricted Stock Units
RSUs have been granted to certain employees and non-employee directors of the Company and represent the right to receive unrestricted shares of common stock based on service. Compensation cost is recognized over the service period. The fair value of each grant is equal to the share price at the date of grant. RSUs generally vest over a one- to four-year period under a variety of vesting schedules and are canceled upon termination of employment or board membership.
The following table summarizes activity for RSUs awarded to the Company’s eligible employees and non-employee directors during the years ended December 31, 2016, 2015 and 2014:
FTD Restricted Stock Units | Weighted-Average Grant Date Fair Value | |||||
(in thousands) | ||||||
Nonvested at December 31, 2013 | 532 | $ | 24.08 | |||
Granted | 277 | 32.13 | ||||
Vested | (206 | ) | 24.51 | |||
Cancelled | (19 | ) | 25.77 | |||
Nonvested at December 31, 2014 | 584 | 27.68 | ||||
Granted | 388 | 33.54 | ||||
Vested | (245 | ) | 27.19 | |||
Cancelled | (78 | ) | 31.58 | |||
Nonvested at December 31, 2015 | 649 | 30.91 | ||||
Granted | 413 | 24.36 | ||||
Vested | (289 | ) | 28.96 | |||
Cancelled | (145 | ) | 29.16 | |||
Nonvested at December 31, 2016 | 628 | $ | 27.90 | |||
The fair value of RSUs that vested during the years ended December 31, 2016, 2015, and 2014 was $8.4 million, $6.6 million, and $5.0 million, respectively. The intrinsic value of nonvested RSUs awarded to the Company’s eligible employees and non-employee directors was $15.0 million at December 31, 2016. At December 31, 2016, 0.6 million nonvested RSUs were expected to vest, with an intrinsic value totaling $13.9 million. At December 31, 2016, total unrecognized compensation cost related to nonvested RSUs, net of expected forfeitures, was $10.8 million, which was expected to be recognized over a weighted-average period of 1.3 years.
F-32
Stock Option Awards
Stock options are granted with an exercise price equal to the market value of the underlying stock on the grant date, and generally vest over a three- or four-year period under a variety of vesting schedules and are canceled upon termination of employment. Stock option grants expire after 5-10 years unless canceled earlier due to termination of employment. Upon the exercise of a stock option award, shares of common stock are issued from authorized but unissued shares. Stock-based compensation is measured at fair value and expensed on a straight-line basis over the requisite service period.
The following table summarizes stock option activity for the years ended December 31, 2016, 2015, and 2014 and stock options outstanding and exercisable at December 31, 2016:
FTD Options Outstanding | Weighted-Average Exercise Price | Weighted-Average Remaining Contractual Life | Aggregate Intrinsic Value | |||||||||
(in thousands) | (in years) | (in thousands) | ||||||||||
Outstanding options at December 31, 2013 | 212 | $ | 32.04 | |||||||||
Options granted | 194 | 31.28 | ||||||||||
Options exercised | — | — | ||||||||||
Options forfeited | (8 | ) | 31.40 | |||||||||
Options expired | (17 | ) | 66.93 | |||||||||
Outstanding options at December 31, 2014 | 381 | 30.15 | 8.2 | |||||||||
Options granted | 1,850 | 29.97 | ||||||||||
Options exercised | 0 | 31.40 | ||||||||||
Options forfeited | (88 | ) | 30.18 | |||||||||
Options expired | (5 | ) | 36.81 | |||||||||
Outstanding options at December 31, 2015 | 2,138 | 29.98 | 5.4 | |||||||||
Options granted | 1,113 | 23.08 | ||||||||||
Options exercised | — | — | ||||||||||
Options forfeited | (516 | ) | 28.53 | |||||||||
Options expired | (77 | ) | 30.06 | |||||||||
Outstanding options at December 31, 2016 | 2,658 | 27.37 | 4.2 | $ | 1.5 | |||||||
Exercisable at December 31, 2016 | 645 | 29.80 | 4.1 | $ | — | |||||||
Expected to vest December 31, 2016 | 1,914 | $ | 26.69 | 4.3 | $ | 1.4 | ||||||
The weighted-average grant date fair value of these stock options was $5.28, $7.63, and $13.77 for the years ended December 31, 2016, 2015, and 2014, respectively. At December 31, 2016 total unrecognized compensation cost related to nonvested stock options awarded to the Company’s eligible employees, net of expected forfeitures, was $6.7 million, which was expected to be recognized over a weighted-average period of 1.3 years. No options were exercised during the years ended December 31, 2016 and 2014. Cash of less than $0.1 million was received from the exercise of stock options during the year ended December 31, 2015. The total intrinsic value of stock options exercised during the year ended December 31, 2015 was $0.1 million.
F-33
For stock options granted by the Company for the years ended December 31, 2016, 2015, and 2014, the fair value of stock options granted were estimated at the date of grant using the Black-Scholes option-pricing model. The table below summarizes the weighted average assumptions used by the Company to estimate the fair value of stock options at the grant date:
For the Year Ended December 31, | ||||||||
2016 | 2015 | 2014 | ||||||
Risk-free interest rate | 1.2 | % | 1.3 | % | 2.0 | % | ||
Expected term (in years) | 3.12 | 3.63 | 6.25 | |||||
Dividend yield | — | % | — | % | — | % | ||
Expected volatility | 30.6 | % | 31.7 | % | 42.1 | % | ||
The risk-free interest rate assumed by the Company in valuing stock options was based on the U.S. Treasury yield curve in effect at the time of the grant. The Company used the simplified method for estimating the expected term because the Company did not have adequate historical data to estimate expected term. The Company estimated the dividend yield as 0% as the Company does not currently intend to pay dividends. The Company calculated expected stock price volatility based on a combination of the historical volatility of both the Company’s and United Online’s common stock as the Company represented a significant portion of consolidated United Online prior to the Separation and the Company does not yet have sufficient history on which to base an assumption solely on its historical volatility.
Employee Stock Purchase Plans
In January 2014, eligible employees of the Company were able to begin participating in the FTD Amended and Restated 2013 Employee Stock Purchase Plan (the “2013 ESPP”). Under such plan, eligible employees could authorize payroll deductions of up to the lower of 15% of their compensation or $25,000 to purchase shares of FTD common stock on two purchase dates each year at a purchase price per share equal to 85% of the lower of (i) the closing market price per share of FTD common stock on the employee’s entry date into the two-year offering period in which the purchase date occurs or (ii) the closing market price per share of FTD common stock on the purchase date. Each offering period generally had a 24-month duration and purchase intervals of six months. On October 30, 2014, the FTD board of directors approved the termination of the 2013 ESPP, which termination was effective as of May 1, 2015, following the close of the six-month purchase interval under the 2013 ESPP that ended on April 30, 2015.
At the Company’s 2015 annual meeting, stockholders approved FTD Companies, Inc. 2015 Employee Stock Purchase Plan (the “2015 ESPP”), which opened to eligible employees in July 2015. Under the 2015 ESPP, eligible employees could authorize payroll deductions of up to the lower of 15% of their compensation or $25,000 to purchase shares of FTD common stock on one purchase date each six months at a purchase price per share equal to 85% of the lower of (i) the closing market price per share of FTD common stock on the employee’s entry date or (ii) the closing market price per share of FTD common stock on the purchase date. Each offering period has a six-month duration and purchase interval.
The fair value of the 2015 ESPP and 2013 ESPP shares were estimated using the Black-Scholes option-pricing model with the following weighted-average assumptions:
For the Year Ended December 31, | |||||
2016 | 2015 | 2014 | |||
Risk-free interest rate | 0.4% | 0.1% | 0.2% | ||
Expected term (in years) | 0.5 | 0.5 - 1.0 | 0.5 - 2.0 | ||
Dividend yield | —% | —% | —% | ||
Expected Volatility | 32.4% | 30.0% | 29.7% | ||
F-34
The risk-free interest rate assumed by the Company in valuing stock options was based on the U.S. Treasury yield curve in effect at the time of the grant. The expected term represents the amount of time remaining in the respective offering period. The Company estimated the dividend yield as 0% as the Company does not currently intend to pay dividends. Under the 2015 ESPP, volatility was determined based on the Company’s historical volatility. Under the 2013 ESPP, volatility was determined based on a combination of the Company’s and United Online’s historical volatility as the Company represented a significant portion of consolidated United Online prior to the Separation and the Company did not yet have sufficient history to base an assumption on solely its historical volatility.
For the years ended December 31, 2016, 2015, and 2014, the Company recognized $0.6 million, $0.4 million, and $0.4 million of stock-based compensation related to the ESPP.
12. INCOME TAXES
The Company files tax returns as a separate company in various local and state jurisdictions, the U.K. and certain other foreign jurisdictions.
Income/(loss) before income taxes was comprised of the following (in thousands):
Year Ended December 31, | |||||||||||
2016 | 2015 | 2014 | |||||||||
Domestic | $ | (101,943 | ) | $ | (93,156 | ) | $ | 21,432 | |||
Foreign | 13,686 | 11,896 | 9,584 | ||||||||
Income/(loss) before income taxes | $ | (88,257 | ) | $ | (81,260 | ) | $ | 31,016 | |||
The provision/(benefit) for income taxes was comprised of the following (in thousands):
Year Ended December 31, | |||||||||||
2016 | 2015 | 2014 | |||||||||
Current: | |||||||||||
Federal | $ | 16,297 | $ | 11,588 | $ | 14,433 | |||||
State | 2,116 | 2,423 | 1,691 | ||||||||
Foreign | 2,709 | 2,379 | 2,494 | ||||||||
21,122 | 16,390 | 18,618 | |||||||||
Deferred: | |||||||||||
Federal | (20,895 | ) | (13,003 | ) | (8,411 | ) | |||||
State | (4,809 | ) | (3,562 | ) | (286 | ) | |||||
Foreign | (484 | ) | (943 | ) | (433 | ) | |||||
(26,188 | ) | (17,508 | ) | (9,130 | ) | ||||||
Provision/(benefit) for income taxes | $ | (5,066 | ) | $ | (1,118 | ) | $ | 9,488 | |||
F-35
The provision for income taxes reconciled to the amount computed by applying the statutory federal rate to income before taxes as follows (in thousands):
Year Ended December 31, | |||||||||||
2016 | 2015 | 2014 | |||||||||
Federal taxes at statutory rate of 35% | $ | (30,890 | ) | $ | (28,441 | ) | $ | 10,855 | |||
State income taxes, net | (749 | ) | (326 | ) | 998 | ||||||
Nondeductible goodwill | 29,336 | 29,678 | — | ||||||||
Effects of foreign income | (3,283 | ) | (2,972 | ) | (2,538 | ) | |||||
Foreign distribution | 4,723 | 3,574 | 3,931 | ||||||||
Foreign tax credit | (2,664 | ) | (2,232 | ) | (3,562 | ) | |||||
Deferred tax adjustment - U.K. statutory rate reduction | (354 | ) | (819 | ) | — | ||||||
Deferred tax adjustment - statutory state rate change | (726 | ) | (550 | ) | — | ||||||
Change in valuation allowance | — | — | (2,824 | ) | |||||||
Transaction-related costs | — | 61 | 1,803 | ||||||||
Other items, net | (459 | ) | 909 | 825 | |||||||
Provision/(benefit) for income taxes | $ | (5,066 | ) | $ | (1,118 | ) | $ | 9,488 | |||
The significant components of net deferred tax balances were as follows (in thousands):
December 31, | |||||||
2016 | 2015 | ||||||
Deferred tax assets: | |||||||
Net operating loss and foreign tax credit carryforwards | $ | 2,538 | $ | 3,333 | |||
Allowances and reserves | 4,253 | 4,457 | |||||
Stock-based compensation | 6,671 | 3,724 | |||||
Deferred compensation | 6,072 | 8,038 | |||||
Other, net | 4,624 | 4,422 | |||||
Total gross deferred tax assets | 24,158 | 23,974 | |||||
Less: valuation allowance | — | — | |||||
Total deferred tax assets, net of valuation allowance | 24,158 | 23,974 | |||||
Deferred tax liabilities: | |||||||
Amortization of intangible assets | (88,304 | ) | (110,392 | ) | |||
Depreciation and amortization | (20,297 | ) | (24,593 | ) | |||
Other, net | (1,489 | ) | (1,758 | ) | |||
Total deferred tax liabilities | (110,090 | ) | (136,743 | ) | |||
Total net deferred tax liabilities | $ | (85,932 | ) | $ | (112,769 | ) | |
In evaluating our ability to recover our deferred tax assets, we consider all available positive and negative evidence, including our operating results, ongoing tax planning, and forecasts of future taxable income on a jurisdiction-by-jurisdiction basis.
F-36
At December 31, 2016, 2015 and 2014, the Company had gross unrecognized tax benefits totaling $0.1 million, $0.3 million and $0.6 million, respectively, of which $0.1 million, $0.2 million, and $0.5 million, respectively, would have an impact on the Company’s effective income tax rate, if recognized. A reconciliation of the beginning and ending amounts of gross unrecognized tax benefits (before federal impact of state items), excluding interest and penalties, was as follows (in thousands):
Year Ended December 31, | |||||||||||
2016 | 2015 | 2014 | |||||||||
Beginning balance | $ | 269 | $ | 542 | $ | 620 | |||||
Additions for prior year tax positions | 115 | 107 | — | ||||||||
Reductions for prior year tax positions | (110 | ) | (32 | ) | (30 | ) | |||||
Settlements | (78 | ) | (184 | ) | — | ||||||
Reductions due to lapse in statutes of limitations | (56 | ) | (164 | ) | (48 | ) | |||||
Ending balance | $ | 140 | $ | 269 | $ | 542 | |||||
The Company is currently under audit by the Internal Revenue Service (“IRS”) and certain state, local, and foreign tax authorities. The examinations are in varying stages of completion. The Company evaluates its tax positions and establishes liabilities for uncertain tax positions that may be challenged by tax authorities. Uncertain tax positions are reviewed on an ongoing basis and are adjusted in light of changing facts and circumstances, including progress of tax audits, case law developments and closing of statutes of limitations. Such adjustments are reflected in the provision for income taxes, as appropriate. Tax years prior to 2012 are generally not subject to examination by the IRS except for items involving tax attributes that have been carried forward to tax years whose statute of limitations remains open. With few exceptions, the Company is not subject to state or local examinations for years prior to 2009. In the U.K., tax years 2012 and prior are closed to audit due to the expiration of the statute of limitations. The Company is generally not able to reliably estimate the ultimate settlement amounts until the close of the audit. While the Company does not expect material changes, it is possible that the amount of unrecognized benefit with respect to its uncertain tax positions could significantly increase or decrease within the next 12 months related to the Company’s ongoing audits. At this time, the Company is unable to make a reasonable estimate of the range of impact on the balance of uncertain tax positions or the impact on the effective income tax rate related to such positions.
The Company had $0.3 million accrued for interest and penalties relating to uncertain tax positions at December 31, 2016, which is included in income taxes payable. At December 31, 2015 and 2014, the Company had immaterial amounts accrued for interest and penalties relating to uncertain tax positions. The Company recognized immaterial amounts of net interest and penalties relating to uncertain tax positions for the years ended December 31, 2016, 2015, and 2014, respectively.
F-37
13. EARNINGS PER SHARE
Certain of the Company’s RSUs are considered participating securities because they contain a non-forfeitable right to dividends irrespective of whether dividends are actually declared or paid or the awards ultimately vest. Accordingly, the Company computes earnings per share pursuant to the two-class method in accordance with ASC 260, Earnings Per Share.
The following table sets forth the computation of basic and diluted earnings per common share (in thousands, except per share amounts):
Year Ended December 31, | |||||||||||
2016 | 2015 | 2014 | |||||||||
Numerator: | |||||||||||
Net income/(loss) | $ | (83,191 | ) | $ | (80,142 | ) | $ | 21,528 | |||
Income allocated to participating securities | — | — | (483 | ) | |||||||
Net income/(loss) attributable to common stockholders | $ | (83,191 | ) | $ | (80,142 | ) | $ | 21,045 | |||
Denominator: | |||||||||||
Basic average common shares outstanding | 27,483 | 28,722 | 18,962 | ||||||||
Add: Dilutive effect of non-participating securities | — | — | 51 | ||||||||
Diluted average common shares outstanding | 27,483 | 28,722 | 19,013 | ||||||||
Basic earnings/(loss) per common share | $ | (3.03 | ) | $ | (2.79 | ) | $ | 1.11 | |||
Diluted earnings/(loss) per common share | $ | (3.03 | ) | $ | (2.79 | ) | $ | 1.11 | |||
The authorized shares of FTD Companies, Inc. capital stock total 65.0 million, which is divided into 60.0 million shares of common stock, par value $0.0001 per share, and 5.0 million shares of preferred stock, par value $0.0001 per share. In connection with the Acquisition, the Company issued 10.2 million shares of FTD common stock to Liberty. The diluted earnings per common share computations exclude stock options and RSUs which are antidilutive. Weighted-average antidilutive shares for the years ended December 31, 2016, 2015, and 2014 were 2.3 million, 1.1 million, and 0.3 million, respectively.
14. RESTRUCTURING AND OTHER EXIT COSTS
Restructuring and other exit costs were as follows (in thousands):
Employee Termination Costs | Facility Closure Costs | Asset Impairments | Total | ||||||||||||
Accrued as of December 31, 2014 | $ | 2,144 | $ | — | $ | — | $ | 2,144 | |||||||
Charges | 2,369 | 2,414 | 1,282 | 6,065 | |||||||||||
Cash paid | (4,498 | ) | (863 | ) | — | (5,361 | ) | ||||||||
Other adjustments | 25 | (99 | ) | (1,282 | ) | (1,356 | ) | ||||||||
Accrued as of December 31, 2015 | 40 | 1,452 | — | 1,492 | |||||||||||
Charges | 8,918 | 1,942 | 898 | 11,758 | |||||||||||
Cash paid | (404 | ) | (1,970 | ) | — | (2,374 | ) | ||||||||
Other adjustments | 12 | (46 | ) | (898 | ) | (932 | ) | ||||||||
Accrued as of December 31, 2016 | $ | 8,566 | $ | 1,378 | $ | — | $ | 9,944 | |||||||
During the year ended December 31, 2016, the Company incurred restructuring and other exit costs of $11.8 million primarily related to senior management changes and related accelerated vesting of equity awards. In addition, we incurred restructuring charges related to the consolidation of certain office and distribution facilities for the Provide Commerce segment.
F-38
15. COMMITMENTS AND CONTINGENCIES
Leases
Future minimum lease payments at December 31, 2016 under non-cancelable operating leases with initial lease terms in excess of one year were as follows (in thousands):
Year Ending December 31, | |||||||||||||||||||||||||||
Total | 2017 | 2018 | 2019 | 2020 | 2021 | Thereafter | |||||||||||||||||||||
Operating leases | $ | 44,529 | $ | 9,542 | $ | 8,476 | $ | 6,935 | $ | 6,271 | $ | 6,076 | $ | 7,229 | |||||||||||||
The Company leases certain office space, data centers, distribution centers, vehicles, and office equipment under operating leases expiring at various periods through 2023. Certain of the Company’s operating leases include rent holidays, as well as rent escalation provisions. The Company records rent expense on a straight-line basis over the lease term. Rent expense under operating leases for the years ended December 31, 2016, 2015, and 2014 was $9.8 million, $10.1 million, and $2.4 million, respectively,
Letters of Credit
Standby letters of credit are maintained by the Company to secure credit card processing activity and certain inventory purchases. The Company had $2.4 million of commitments under letters of credit at December 31, 2016 which were scheduled to expire within one year.
Other Commitments
In the ordinary course of business, the Company may provide indemnifications of varying scope and terms to customers, vendors, lessors, sureties and insurance companies, business partners, and other parties with respect to certain matters, including, but not limited to, losses arising out of the Company’s breach of such agreements, services to be provided by the Company, or from intellectual property infringement claims made by third parties. FTD has entered into indemnification agreements with its current and former directors and certain of its officers and employees that require FTD, among other things, to indemnify them against certain liabilities that may arise by reason of their status or service as directors, officers or employees. In addition, FTD has also agreed to indemnify certain former officers, directors and employees of acquired companies in connection with the acquisition of such companies. FTD maintains director and officer insurance, which may, in certain circumstances, cover specified liabilities, including those arising from its obligation to indemnify its current and former directors, certain of its officers and employees, and certain former officers, directors and employees of acquired companies.
It is not possible to determine the maximum potential amount of exposure under these indemnification agreements due to the limited history of prior indemnification claims and the unique facts and circumstances involved in each particular agreement. Such indemnification agreements may not be subject to maximum loss clauses.
Legal Matters
Commencing on August 19, 2009, the first of a series of putative consumer class action lawsuits was brought against Provide Commerce, Inc. and co-defendant Regent Group, Inc. d/b/a Encore Marketing International (“EMI”). These cases were ultimately consolidated during the next three years into Case No. 09 CV 2094 in the United States District Court for the Southern District of California under the title In re EasySaver Rewards Litigation. Plaintiffs’ claims arise from their online enrollment in subscription based membership programs known as EasySaver Rewards, RedEnvelope Rewards, and Preferred Buyers Pass (collectively the “Membership Programs”). Plaintiffs claim that after they ordered items from certain of Provide Commerce’s websites, they were presented with an offer to enroll in one of the Membership Programs, each of which is offered and administered by EMI. Plaintiffs purport to represent a nationwide class of consumers allegedly damaged by Provide Commerce’s purported unauthorized or otherwise allegedly improper transferring of billing information to EMI, who then posted allegedly unauthorized charges to their credit or debit card accounts for membership fees for the Membership Programs. In the operative fourth amended complaint, plaintiffs assert ten claims against Provide Commerce and EMI: (1) breach of contract (against Provide Commerce only); (2) breach of contract (against EMI only); (3) breach of implied covenant of good faith and fair dealing; (4) fraud; (5) violations of the California Consumers Legal Remedies Act; (6) unjust enrichment; (7) violation of the Electronic Funds Transfer Act (against EMI only); (8) invasion of privacy; (9) negligence; and (10) violations
F-39
of the Unfair Competition Law. Plaintiffs seek damages, attorneys’ fees, and costs. After motion practice regarding the claims asserted and numerous settlement conferences and mediations in an effort to informally resolve the matter, the parties reached an agreement on the high level terms of a settlement on April 9, 2012, conditioned on the parties negotiating and executing a complete written agreement. In the weeks following April 9, 2012, the parties negotiated a formal written settlement agreement (“Settlement”, which the court preliminarily approved on June 13, 2012. After notice to the class and briefing by the parties, the court conducted a final approval hearing (also known as a fairness hearing) on January 28, 2013, but did not rule. On February 4, 2013, the court entered its final order approving the Settlement, granting plaintiffs’ motion for attorneys’ fees, costs, and incentive awards, and overruling objections filed by a single objector. The court entered judgment on the Settlement on February 21, 2013. The objector filed a notice of appeal with the Ninth Circuit Court of Appeals on March 4, 2013. After the completion of briefing, the Ninth Circuit set oral argument for February 2, 2015. But on January 29, 2015, the Ninth Circuit entered an order deferring argument and resolution of the appeal pending the Ninth Circuit’s decision in a matter captioned Frank v. Netflix, No. 12 15705+. On March 19, 2015, the Ninth Circuit entered an order vacating the judgment in this matter and remanding it to the district court for further proceedings consistent with its opinion in Frank v. Netflix issued on February 27, 2015. The district court ordered supplemental briefing on the issue of final Settlement approval May 21, 2015. After briefing, the district court conducted a hearing on July 27, 2016 and took the matter under submission. On August 9, 2016, the district court entered an order reapproving the Settlement without any changes, and accordingly entered judgment and dismissed the case with prejudice. On September 6, 2016, the objector filed a notice of appeal. On November 22, 2016, plaintiffs filed a motion for summary affirmance of the district court’s judgment, to which the objector responded and filed a cross-motion for sanctions. Plaintiffs’ motion for summary affirmance temporarily stayed briefing on the appeal. On March 2, 2017, the Ninth Circuit denied plaintiffs’ motion for summary affirmance and objector’s cross-motion for sanctions, and reset the briefing schedule. Objector’s opening brief is due May 1, 2017. Absent an extension, the parties’ answering briefs are due May 31, 2017. Objector’s optional reply brief is presently due June 14, 2017. The date for oral argument on the appeal has not yet been set.
There are no assurances that other legal actions or governmental investigations will not be instituted in connection with the Company’s current or former business practices. The Company cannot predict the outcome of governmental investigations or other legal actions or their potential implications for its business.
The Company records a liability when it believes that it is both probable that a loss has been incurred, and the amount of loss can be reasonably estimated. The Company evaluates at least quarterly, developments in its legal matters that could affect the assessment of the probability of loss or the amount of liability and makes adjustments as appropriate. Significant judgment is required to determine both probability and the estimated amount. The Company may be unable to estimate a possible loss or range of possible loss due to various reasons, including, among others: (i) if the damages sought are indeterminate, (ii) if the proceedings are in early stages, (iii) if there is uncertainty as to the outcome of pending appeals, motions or settlements, (iv) if there are significant factual issues to be determined or resolved, and (v) if there are novel or unsettled legal theories presented. In such instances, there is considerable uncertainty regarding the ultimate resolution of such matters, including a possible eventual loss, if any. At December 31, 2016 and 2015, the Company had reserves totaling $3.0 million and $2.6 million, respectively, for estimated losses related to certain legal matters. With respect to other legal matters, the Company has determined, based on its current knowledge, that the amount of possible loss or range of loss, including any reasonably possible losses in excess of amounts already accrued, is not reasonably estimable. However, legal matters are inherently unpredictable and subject to significant uncertainties, some of which are beyond the Company’s control. As such, there can be no assurance that the final outcome of these matters will not materially and adversely affect the Company’s business, financial condition, results of operations, or cash flows.
16. SUPPLEMENTAL CASH FLOW INFORMATION
The following table sets forth supplemental cash flow disclosures (in thousands):
Year Ended December 31, | |||||||||||
2016 | 2015 | 2014 | |||||||||
Cash paid for interest | $ | 7,556 | $ | 7,948 | $ | 5,574 | |||||
Cash paid for income taxes, net | $ | 13,972 | $ | 21,277 | $ | 18,800 | |||||
For the year ended December 31, 2014, non-cash investing items included 10.2 million shares of FTD common stock that were issued to Liberty as a portion of the purchase price for the Acquisition. Such shares were valued at $355.3 million based on the closing price on December 31, 2014, the Acquisition date.
F-40
17. IMMATERIAL RESTATEMENT OF PRIOR PERIOD FINANCIAL STATEMENTS
Subsequent to the issuance of the Company’s consolidated financial statements for the quarterly period ended September 30, 2016, the Company identified immaterial errors that were the result of an incorrect assessment of certain cross-border indirect taxes and required an immaterial restatement of the Company’s previously issued consolidated financial statements for the years ended December 31, 2015 and 2014 and for the quarters within the years ended December 31, 2016 and 2015.
The impact of these errors in the prior years are not material to the consolidated financial statements in any of these years; however, the aggregate impact of correcting these prior period errors all within the year ended December 31, 2016 would have been material to the Company’s current year consolidated financial statements. Consequently, the Company has corrected these immaterial errors in the periods to which they relate.
The revisions to our consolidated statements of operations for the years ended December 31, 2015 and 2014 were as follows:
For the Year Ended December 31, | |||||||||||||||
2015 | 2014 | ||||||||||||||
As Reported | As Revised | As Reported | As Revised | ||||||||||||
(in thousands, except per share amounts) | |||||||||||||||
Revenues: | |||||||||||||||
Products | $ | 1,082,637 | $ | 1,081,217 | $ | 502,615 | $ | 501,107 | |||||||
Total revenues | 1,219,753 | 1,218,333 | 640,513 | 639,005 | |||||||||||
Operating expenses: | |||||||||||||||
Cost of revenues—products | 748,020 | 747,046 | 384,382 | 383,339 | |||||||||||
General and administrative | 122,239 | 123,244 | 74,943 | 75,922 | |||||||||||
Total operating expenses | 1,291,005 | 1,291,036 | 602,909 | 602,845 | |||||||||||
Operating income/(loss) | (71,252 | ) | (72,703 | ) | 37,604 | 36,160 | |||||||||
Income/(loss) before income taxes | (79,809 | ) | (81,260 | ) | 32,460 | 31,016 | |||||||||
Provision/(benefit) for income taxes | (983 | ) | (1,118 | ) | 9,630 | 9,488 | |||||||||
Net income/(loss) | (78,826 | ) | (80,142 | ) | 22,830 | 21,528 | |||||||||
Earnings/(loss) per common share | |||||||||||||||
Basic earnings/(loss) per share | $ | (2.74 | ) | $ | (2.79 | ) | $ | 1.18 | $ | 1.11 | |||||
Diluted earnings/(loss) per share | $ | (2.74 | ) | $ | (2.79 | ) | $ | 1.17 | $ | 1.11 | |||||
The revisions to our consolidated balance sheet as of December 31, 2015 were as follows:
As Reported | As Revised | ||||||
(in thousands) | |||||||
Accrued liabilities | $ | 54,087 | $ | 68,622 | |||
Income taxes payable | 840 | — | |||||
Total current liabilities | 183,989 | 197,684 | |||||
Total liabilities(a) | 580,502 | 594,197 | |||||
Accumulated deficit | (52,119 | ) | (67,000 | ) | |||
Accumulated other comprehensive loss | (35,216 | ) | (34,030 | ) | |||
Total stockholders’ equity | 541,226 | 527,531 | |||||
(a) | During the first quarter of 2016, the Company adopted the accounting guidance related to the presentation of debt issuance costs. The As Reported Total Liabilities is after the reclassification of $5.1 million of debt issuance costs. |
F-41
The revisions had no impact on cash flows from operating activities, cash flows from investing activities, or cash flows from financing activities for the years ended December 31, 2015 and 2014.
The revisions to the Company’s consolidated statements of comprehensive income/(loss) were as follows:
For the Year Ended December 31, | |||||||||||||||
2015 | 2014 | ||||||||||||||
As Reported | As Revised | As Reported | As Revised | ||||||||||||
(in thousands, except per share amounts) | |||||||||||||||
Net income/(loss) | $ | (78,826 | ) | $ | (80,142 | ) | $ | 22,830 | $ | 21,528 | |||||
Other comprehensive loss: | |||||||||||||||
Foreign currency translation | (7,490 | ) | (6,868 | ) | (9,075 | ) | (8,409 | ) | |||||||
Other comprehensive loss | (7,381 | ) | (6,759 | ) | (9,608 | ) | (8,942 | ) | |||||||
Total comprehensive income/(loss) | (86,207 | ) | (86,901 | ) | 13,222 | 12,586 | |||||||||
The revisions to the consolidated statement of stockholders’ equity include the change to net income/(loss) and the changes to other comprehensive loss, as noted above, and a $12.3 million revision to beginning retained earnings and a $0.1 million revision to accumulated other comprehensive income as of January 1, 2014.
18. QUARTERLY FINANCIAL DATA (UNAUDITED)
This unaudited financial information has been revised to reflect the effect of the revisions described in Note 17—Immaterial Restatement of Prior Period Financial Statements. The following tables have been prepared on a basis consistent with our annual consolidated financial statements and include all adjustments necessary for the fair presentation of the unaudited quarterly data.
Quarter | |||||||||||||||
First | Second | Third | Fourth | ||||||||||||
(in thousands, except per share data) | |||||||||||||||
Year Ended December 31, 2016—As Revised: | |||||||||||||||
Revenues | $ | 330,214 | $ | 338,239 | $ | 172,879 | $ | 280,667 | |||||||
Operating income/(loss) | 2,939 | 17,747 | (12,023 | ) | (89,403 | ) | |||||||||
Net income/(loss) | 1,751 | 11,775 | (10,269 | ) | (86,448 | ) | |||||||||
Basic earnings/(loss) per common share | 0.06 | 0.42 | (0.37 | ) | (3.17 | ) | |||||||||
Diluted earnings/(loss) per common share | 0.06 | 0.42 | (0.37 | ) | (3.17 | ) | |||||||||
Quarter | |||||||||||||
First | Second | Third | |||||||||||
(in thousands, except per share data) | |||||||||||||
Year Ended December 31, 2016—As Reported: | |||||||||||||
Revenues | $ | 330,602 | $ | 338,571 | $ | 173,154 | |||||||
Operating income/(loss) | 3,316 | 18,109 | (11,698 | ) | |||||||||
Net income/(loss) | 2,091 | 12,103 | (9,973 | ) | |||||||||
Basic earnings/(loss) per common share | 0.07 | 0.43 | (0.36 | ) | |||||||||
Diluted earnings/(loss) per common share | 0.07 | 0.43 | (0.36 | ) | |||||||||
F-42
Quarter | |||||||||||||||
First | Second | Third | Fourth | ||||||||||||
(in thousands, except per share data) | |||||||||||||||
Year Ended December 31, 2015—As Revised: | |||||||||||||||
Revenues | $ | 367,339 | $ | 365,497 | $ | 188,223 | $ | 297,274 | |||||||
Operating income/(loss) | 3,847 | 19,861 | (15,395 | ) | (81,016 | ) | |||||||||
Net income/(loss) | 1,680 | 17,518 | (16,782 | ) | (82,558 | ) | |||||||||
Basic earnings/(loss) per common share | 0.06 | 0.60 | (0.59 | ) | (2.92 | ) | |||||||||
Diluted earnings/(loss) per common share | 0.06 | 0.60 | (0.59 | ) | (2.92 | ) | |||||||||
Quarter | |||||||||||||||
First | Second | Third | Fourth | ||||||||||||
(in thousands, except per share data) | |||||||||||||||
Year Ended December 31, 2015—As Reported: | |||||||||||||||
Revenues | $ | 367,781 | $ | 365,801 | $ | 188,519 | $ | 297,652 | |||||||
Operating income/(loss) | 4,240 | 20,193 | (15,061 | ) | (80,624 | ) | |||||||||
Net income/(loss) | 2,034 | 17,819 | (16,479 | ) | (82,200 | ) | |||||||||
Basic earnings/(loss) per common share | 0.07 | 0.61 | (0.57 | ) | (2.90 | ) | |||||||||
Diluted earnings/(loss) per common share | 0.07 | 0.61 | (0.57 | ) | (2.90 | ) | |||||||||
F-43
SCHEDULE II—VALUATION AND QUALIFYING ACCOUNTS
FTD COMPANIES, INC.
(in thousands)
Balance at Beginning of Period | Additions Charged to Expense | Charged to Other Accounts | Write-offs | Balance at End of Period | |||||||||||||||
Allowance for doubtful accounts and sales allowances: | |||||||||||||||||||
Year Ended December 31, 2016 | $ | 4,802 | $ | 3,386 | $ | 744 | $ | (3,970 | ) | $ | 4,962 | ||||||||
Year Ended December 31, 2015 | $ | 8,991 | $ | 1,685 | $ | 640 | $ | (6,514 | ) | $ | 4,802 | ||||||||
Year Ended December 31, 2014 | $ | 8,757 | $ | 1,659 | $ | 367 | $ | (1,792 | ) | $ | 8,991 | ||||||||
Balance at Beginning of Period | Tax Valuation Allowance Charged (Credited) to Income Tax Provision | Charged to Other Accounts | Balance at End of Period | ||||||||||||
Valuation allowance for deferred tax assets: | |||||||||||||||
Year Ended December 31, 2016 | $ | — | $ | — | $ | — | $ | — | |||||||
Year Ended December 31, 2015 | $ | — | $ | — | $ | — | $ | — | |||||||
Year Ended December 31, 2014 | $ | 3,612 | $ | (3,612 | ) | $ | — | $ | — | ||||||
F-44