Attached files
| file | filename |
|---|---|
| 8-K - FORM 8-K - EAGLE BANCORP INC | f8k_031617.htm |
Exhibit 99.1

Ticker: EGBN www.eaglebankcorp.com Investor Presentation Keefe, Bruyette & Woods Field Trip Visit March 16 , 2017
1 Forward Looking Statements This presentation contains forward looking statements within the meaning of the Securities and Exchange Act of 1934 , as amended, including statements of goals, intentions, and expectations as to future trends, plans, events or results of Company operations and policies and regarding general economic conditions . In some cases, forward - looking statements can be identified by use of words such as “may,” “will,” “anticipates,” “believes,” “expects,” “plans,” “estimates,” “potential,” “continue,” “should,” and similar words or phrases . These statements are based upon current and anticipated economic conditions, nationally and in the Company’s market, interest rates and interest rate policy, competitive factors and other conditions which by their nature, are not susceptible to accurate forecast and are subject to significant uncertainty . For details on factors that could affect these expectations, see the risk factors and other cautionary language included in the Company’s Annual Report on Form 10 - K and other periodic and current reports filed with the SEC . Because of these uncertainties and the assumptions on which this discussion and the forward - looking statements are based, actual future operations and results in the future may differ materially from those indicated herein . Readers are cautioned against placing undue reliance on any such forward - looking statements . The Company’s past results are not necessarily indicative of future performance . The Company does not undertake to publicly revise or update forward - looking statements in this presentation to reflect events or circumstances that arise after the date of this presentation, except as may be required under applicable law . This presentation was delivered digitally . The Company makes no representation that subsequent to delivery of the presentation it was not altered . For the most current, accurate information, please refer to www . eaglebankcorp . com and go to the Investor Relations tab . For further information on the Company please contact : Michael T . Flynn 240 - 497 - 2040 mflynn@eaglebankcorp . com

2 Company Overview ▪ Eagle Bancorp, Inc. is a growth - oriented community bank headquartered in Bethesda, Maryland ▪ Focused on the Washington, DC metropolitan area, with 21 branches ▪ Commercially - oriented business model with deep relationships of loans, core deposits and related products ▪ #1 in deposit market share among community banks headquartered in the Washington, DC metropolitan area ▪ Largest market capitalization of any community bank based in the Washington, DC metropolitan area ▪ L argest and most profitable bank headquartered and operating in the state of Maryland

3 Investment Highlights ▪ Focused on Profitability and Balanced Financial Performance ▪ Strong Net Interest Margin = 3.96% ▪ Clean Asset Quality: NPAs/Assets = 0.30% ▪ Low Charge - Off History: NCOs/Average Loans = (0.01%) ▪ Driven by Long - Term, Deep Customer Relationships ▪ Demonstrated Consistent Organic Growth ▪ Strategic Geographic Market Positioning ▪ Dedicated Board Focused on Vision ▪ Proven Ability to Evaluate and Execute Acquisitions NOTE: Financial data at or for the quarter ended December 31, 2016.

Experienced Senior Management Team 4 Years Years in with Name Title/Function Banking EGBN Ronald D. Paul Chairman, President & CEO 29 18 Susan G. Riel Sr. EVP & COO - EagleBank 40 18 James H. Langmead* EVP & Chief Financial Officer - Eagle Bancorp & EagleBank 45 11 Laurence E. Bensignor EVP & General Counsel 6 6 Antonio F. Marquez EVP & Chief Real Estate Lending Officer 31 5 Lindsey S. Rheaume EVP & Chief C&I Lending Officer 31 2 Janice L. Williams EVP & Chief Credit Officer 22 13 * Will be retiring on March 31, 2017.
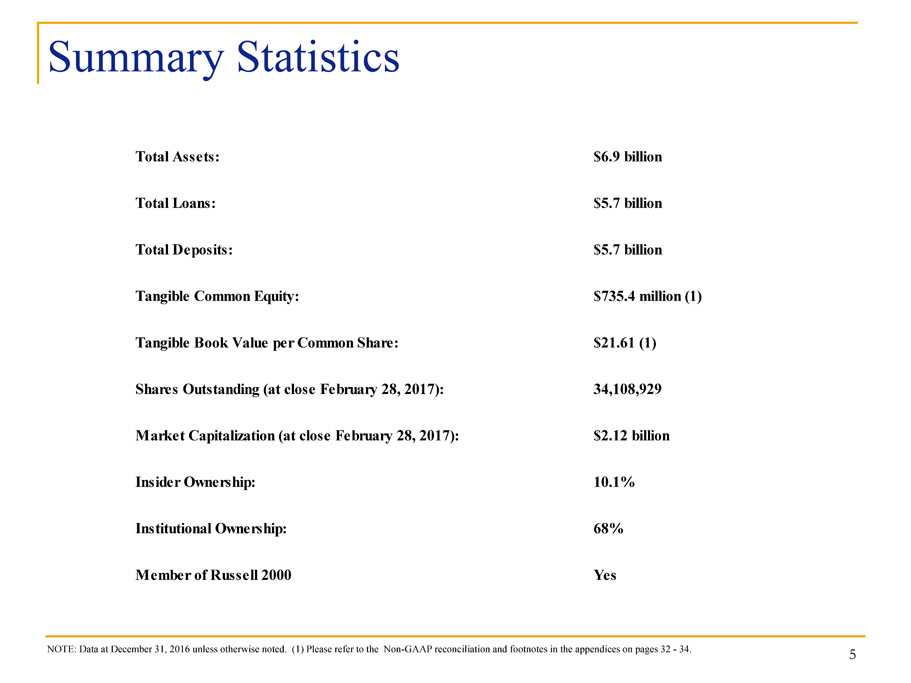
5 Summary Statistics NOTE: Data at December 31, 2016 unless otherwise noted. (1) Please refer to the Non - GAAP reconciliation and footnotes in the a ppendices on pages 32 - 34. Total Assets: $6.9 billion Total Loans: $5.7 billion Total Deposits: $5.7 billion Tangible Common Equity: $735.4 million (1) Tangible Book Value per Common Share: $21.61 (1) Shares Outstanding (at close February 28, 2017): 34,108,929 Market Capitalization (at close February 28, 2017): $2.12 billion Insider Ownership: 10.1% Institutional Ownership: 68% Member of Russell 2000 Yes

EagleBank Branch Locations Montgomery County Prince George’s County Fairfax County Loudoun County Washington, DC N I - 270 I - 95 I - 495 US 50 I - 95 I - 495 I - 66 I - 495 Branch System Virginia 9 Maryland 7 Washington, DC 5 Total 21 NOTE: Branch total as of October 31, 2016. Arlington Alexandria 6

7 Deposit Market Share NOTE: Washington , D.C. Metro Area as defined in FDIC Summary of Deposits Report. Data excludes: E*Trade whose deposits are substantially from outside of the defined market area. SOURCE: FDIC , as of June 30, 2015 and June 30, 2016. 74.1% Washington, DC Metropolitan Area Local June 30, June 30, 2016 Community 2015 2016 Annual Market Rank Banks Company Name Branches Balance Balance Growth Share 1 Wells Fargo & Co. 167 31,032,284 31,572,851 1.7% 16.9% 2 Bank of America Corp. 159 28,522,101 30,275,134 6.1% 16.2% 3 Capital One Financial Corp. 169 22,004,362 25,654,173 16.6% 13.7% 4 SunTrust Banks Inc. 167 18,715,435 18,602,750 -0.6% 9.9% 5 BB&T Corp. 185 14,163,943 13,470,334 -4.9% 7.2% 6 PNC Financial Services Group Inc. 185 12,380,099 12,496,495 0.9% 6.7% 7 Citigroup Inc. 36 7,085,409 6,677,000 -5.8% 3.6% 8 1 Eagle Bancorp Inc. 20 4,958,516 5,404,317 9.0% 2.9% 9 United Bankshares Inc. 54 4,461,891 5,386,027 20.7% 2.9% 10 M&T Bank Corp. 79 4,238,739 4,241,489 0.1% 2.3% 11 2 Cardinal Financial Corp. 31 2,957,224 3,273,440 10.7% 1.7% 12 Toronto-Dominion Bank 46 2,761,470 3,146,013 13.9% 1.7% 13 3 Sandy Spring Bancorp Inc. 35 2,544,621 2,741,591 7.7% 1.5% 14 HSBC Holdings Plc 12 2,143,621 2,289,874 6.8% 1.2% 15 4 Burke & Herbert Bank & Trust Co. 25 2,232,564 2,262,071 1.3% 1.2% 16 5 WashingtonFirst Bankshares Inc. 19 1,254,381 1,563,287 24.6% 0.8% 17 Union Bank & Trust 18 1,039,361 1,166,512 12.2% 0.6% 18 6 Access National Corp. 5 913,515 1,054,862 15.5% 0.6% 19 7 Middleburg Financial Corp. 10 958,543 993,347 3.6% 0.5% 20 8 Old Line Bank 15 871,198 961,395 10.4% 0.5% 21 9 Revere Bank 4 531,966 802,715 50.9% 0.4% 22 10 John Marshall Bank 6 668,015 762,331 14.1% 0.4% 23 11 Capital Bank 3 561,058 718,690 28.1% 0.4% 24 12 Community Bank of the Chesapeake 6 634,651 714,776 12.6% 0.4% 25 13 First Virginia Community Bank 5 588,080 678,504 15.4% 0.4% All Other Market Participants 210 10,301,562 10,220,383 -0.8% 5.5% Market Total 1,671 178,524,609 187,130,361 4.8% 100.0%

Performance Statistics NOTE: (1) Bank Holding Company Performance Report Peer Group represents companies with consolidated assets between $3 billion an d $10 billion. (2) Please refer to the Non - GAAP reconciliation and footnotes in the appendices on pages 32 - 34. * Impact of Q3 2016 Sub - Debt raise was (0.15%). 8 Peer Group (1) Key Ratios (at or for the quarter ended) 2016Q1 2016Q2 2016Q3 2016Q4 2016Q4 ■ Net Interest Margin 4.31% 4.30% 4.11%* 3.96% 3.48% ■ Efficiency Ratio 40.80% 39.63% 40.54% 40.22% 64.03% ■ NPAs + 90 Days Past Due/Total Assets 0.42% 0.39% 0.41% 0.30% 0.64% ■ Allowance Loan Losses/Gross Loans 1.06% 1.05% 1.04% 1.04% 1.00% ■ Reserve/NPLs (Coverage Ratio) 249.03% 264.44% 255.29% 330.49% 210.57% ■ Net Charge-Offs to Average Loans (Annualized) 0.09% 0.15% 0.14% (0.01%) 0.12% ■ Tangible Common Equity/Tangible Assets (2) 10.86% 10.88% 10.64% 10.84% N/A ■ Tier 1 Leverage Ratio 11.01% 11.24% 11.12% 10.72% 9.83% ■ Return on Average Assets 1.54% 1.57% 1.50% 1.46% 1.00% ■ Return on Average Common Equity 12.39% 12.40% 12.04% 12.26% 6.24% ■ Earnings Per Share (Diluted) $0.68 $0.71 $0.72 $0.75 N/A EGBN
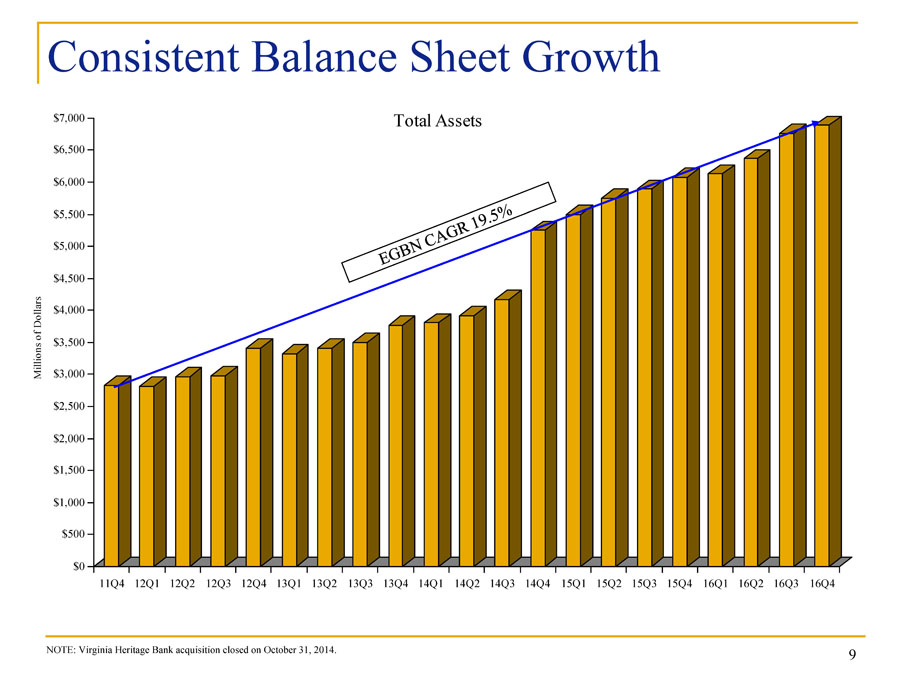
$0 $500 $1,000 $1,500 $2,000 $2,500 $3,000 $3,500 $4,000 $4,500 $5,000 $5,500 $6,000 $6,500 $7,000 Millions of Dollars 11Q4 12Q1 12Q2 12Q3 12Q4 13Q1 13Q2 13Q3 13Q4 14Q1 14Q2 14Q3 14Q4 15Q1 15Q2 15Q3 15Q4 16Q1 16Q2 16Q3 16Q4 Total Assets Consistent Balance Sheet Growth NOTE: Virginia Heritage Bank acquisition closed on October 31, 2014. 9
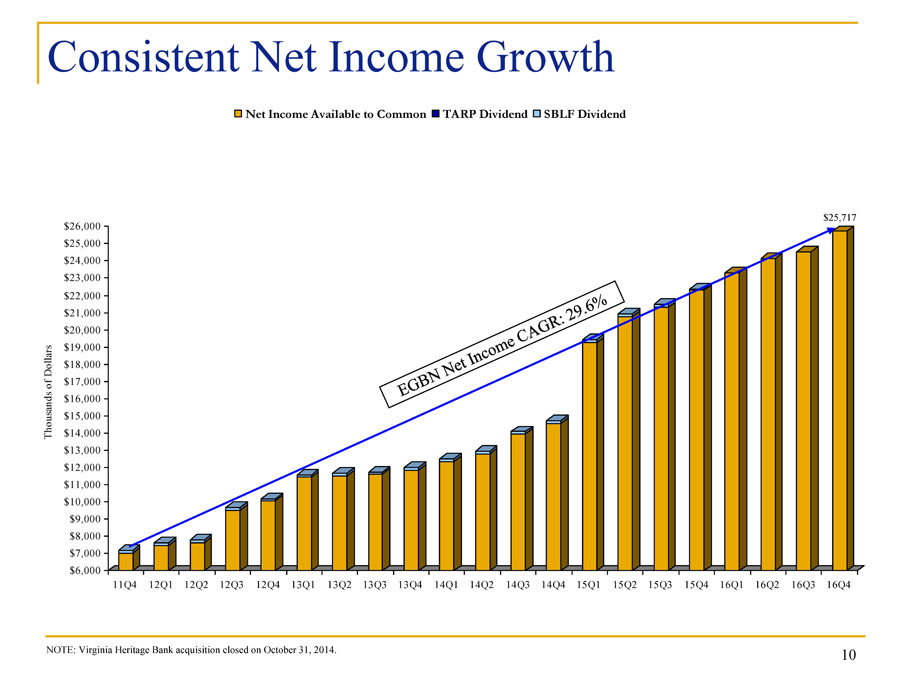
$6,000 $7,000 $8,000 $9,000 $10,000 $11,000 $12,000 $13,000 $14,000 $15,000 $16,000 $17,000 $18,000 $19,000 $20,000 $21,000 $22,000 $23,000 $24,000 $25,000 $26,000 Thousands of Dollars 11Q4 12Q1 12Q2 12Q3 12Q4 13Q1 13Q2 13Q3 13Q4 14Q1 14Q2 14Q3 14Q4 15Q1 15Q2 15Q3 15Q4 16Q1 16Q2 16Q3 16Q4 Net Income Available to Common TARP Dividend SBLF Dividend Consistent Net Income Growth $25,717 10 NOTE: Virginia Heritage Bank acquisition closed on October 31, 2014.

4.32% 4.30% 4.44% 4.33% 4.31% 4.30% 4.11% 3.96% 3.59% 3.56% 3.58% 3.49% 3.48% 3.49% 3.48% 3.48% 2.00% 2.50% 3.00% 3.50% 4.00% 4.50% 5.00% 2012Y 2013Y 2014Y 2015Y 2016Q1 2016Q2 2016Q3 2016Q4 EGBN Peer Group Net Interest Margin NOTE: Bank Holding Company Performance Report Peer Group represents companies with consolidated assets between $3 billion and $10 billion . Virginia Heritage Bank acquisition closed on October 31, 2014 . * Impact of July 2016 Sub - Debt raise in Q3 2016 was (0.15%), Q4 2016 was (0.18%). 11 * *

0.49% 0.37% 0.33% 0.36% 0.36% 0.40% 0.49% 0.51% 0.68% 0.52% 0.45% 0.42% 0.44% 0.45% 0.44% 0.44% 0.00% 0.25% 0.50% 0.75% 2012Y 2013Y 2014Y 2015Y 2016Q1 2016Q2 2016Q3 2016Q4 Cost of Funds EGBN Peer Group 4.81% 4.67% 4.77% 4.69% 4.67% 4.70% 4.60% 4.47% 4.35% 4.13% 4.06% 3.93% 3.93% 3.94% 3.92% 3.93% 2.00% 2.50% 3.00% 3.50% 4.00% 4.50% 5.00% 2012Y 2013Y 2014Y 2015Y 2016Q1 2016Q2 2016Q3 2016Q4 Yield on Average Earning Assets EGBN Peer Group Yields and Cost of Funds NOTE: Bank Holding Company Performance Report Peer Group represents companies with consolidated assets between $3 billion and $10 billion. Virginia Heritage Bank acquisition closed on October 31, 2014 . * Impact of July 2016 Sub - Debt Raise in Q3 2016 was (0.6bps), Q4 2016 was (0.8bps) to Yield on Average Earnings Assets. The Sub - Debt raise impact on Cost of Funds in Q3 2016 was 0.9bps, Q4 2016 was 0.10bps. 12 * * 5.68% 5.51% 5.37% 5.24% 5.13% 5.10% 5.08% 5.11% 5.32% 4.96% 4.72% 4.48% 4.44% 4.43% 4.41% 4.41% 1.00% 2.00% 3.00% 4.00% 5.00% 6.00% 7.00% 2012Y 2013Y 2014Y 2015Y 2016Q1 2016Q2 2016Q3 2016Q4 Yield on Loans EGBN Peer Group * *

$1.95 $0.00 $0.50 $1.00 $1.50 $2.00 $2.50 $3.00 $3.50 2011Y 2012Y 2013Y 2014Y 2015Y 2016Y EPS (Reported) EPS (Operating) Earnings per Share $2.50 13 $2.08 $1.76 $1.46 $1.04 NOTE: There was a 10% stock dividend paid on the common stock on June 14, 2013. Virginia Heritage Bank acquisition closed on October 31, 2014. EPS (Operating) for 2014 is net of merger related expenses; Please refer to the Non - GAAP reconciliation and footnotes in the appendices on pages 32 - 34. $2.86

$9.38 $11.47 $12.89 $14.56 $18.83 $21.61 $0.00 $5.00 $10.00 $15.00 $20.00 $25.00 2011Y 2012Y 2013Y 2014Y 2015Y 2016Y Tangible Book Value per Share NOTE: Please refer to the Non - GAAP reconciliation and footnotes in the appendices on pages 32 - 34. Virginia Heritage Bank acquisition closed on October 31, 2014 . 14
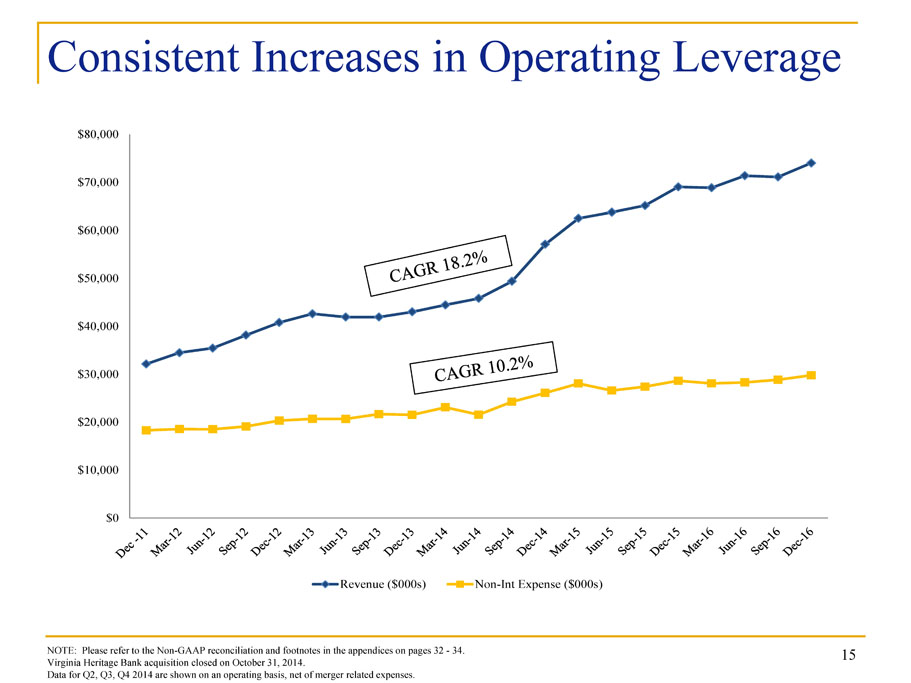
$0 $10,000 $20,000 $30,000 $40,000 $50,000 $60,000 $70,000 $80,000 Revenue ($000s) Non-Int Expense ($000s) Consistent Increases in Operating Leverage NOTE: P lease refer to the Non - GAAP reconciliation and footnotes in the appendices on pages 32 - 34. Virginia Heritage Bank acquisition closed on October 31, 2014 . Data for Q2, Q3, Q4 2014 are shown on an operating basis, net of merger related expenses. 15
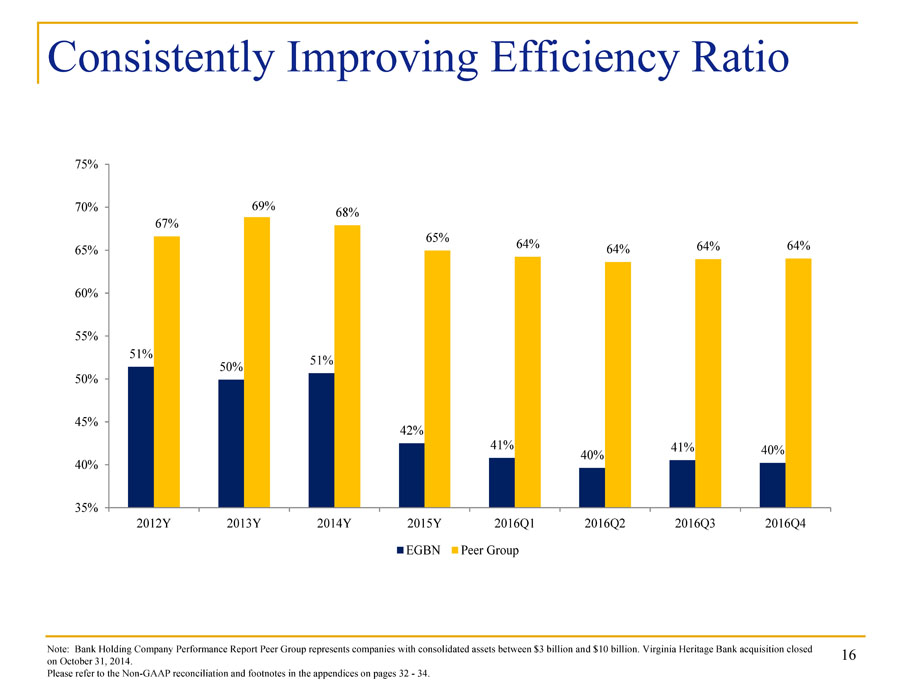
Consistently Improving Efficiency Ratio Note: Bank Holding Company Performance Report Peer Group represents companies with consolidated assets between $3 billion an d $ 10 billion. Virginia Heritage Bank acquisition closed on October 31, 2014 . P lease refer to the Non - GAAP reconciliation and footnotes in the appendices on pages 32 - 34. 16 51% 50% 51% 42% 41% 40% 41% 40% 67% 69% 68% 65% 64% 64% 64% 64% 35% 40% 45% 50% 55% 60% 65% 70% 75% 2012Y 2013Y 2014Y 2015Y 2016Q1 2016Q2 2016Q3 2016Q4 EGBN Peer Group

17 Moderate Interest Rate Risk Position Source: FTN Quarterly IRR Report. Virginia Heritage Bank acquisition closed on October 31, 2014 . ▪ Both assets and liabilities remain short with repricing durations at 23 months on loans and 27 months on deposits ▪ A 100 bps shock increase would increase Net Interest Income by about $ 6 .1 million or 2.2% on a static balance sheet over a 12 month period (Dollar value in thousands) Interest Rate Indicators and Trends 2012Y 2013Y 2014Y 2015Y 2016Q1 2016Q2 2016Q3 2016Q4 Repricing Duration of Assets and Liabilities (months) Investments 45 50 49 47 42 41 41 43 Loans 25 26 27 25 25 24 23 23 Deposits 38 32 34 32 30 30 28 27 Borrowings 17 16 30 40 41 27 57 64 Economic Value of Assets and Liabilities Book Value of Portfolio Loans 2,493,095$ 2,945,158$ 4,312,399$ 4,998,368$ 5,155,871$ 5,403,429$ 5,481,975$ 5,618,820$ Economic Value of Portfolio Loans 2,515,409$ 2,979,180$ 4,314,618$ 5,000,717$ 5,170,212$ 5,415,639$ 5,492,339$ 5,624,085$ Premium (Discount) in Loans 0.9% 1.2% 0.1% 0.0% 0.3% 0.2% 0.2% 0.1% Book Value of Deposits 2,897,222$ 3,225,413$ 4,310,768$ 5,158,445$ 5,189,646$ 5,335,989$ 5,558,149$ 5,717,837$ Economic Value of Deposits 2,706,461$ 3,148,113$ 4,197,226$ 5,002,426$ 5,097,095$ 5,266,214$ 5,479,137$ 5,548,300$ Premium (Discount) in Deposits -6.6% -2.4% -2.6% -3.0% -1.8% -1.3% -1.4% -3.0% Book Value of Equity 349,976$ 393,864$ 620,761$ 738,602$ 762,496$ 788,629$ 815,639$ 842,799$ Economic Value of Equity 445,637$ 504,253$ 734,935$ 896,974$ 869,387$ 870,611$ 908,407$ 1,030,450$ Equity Premium Percentage 27% 28% 18% 21% 14% 10% 11% 22% Interest Rate Shock Analysis SHORT TERM EFFECTS (dollars in thousands) Net Interest Income - Flat balance Sheet 131,479$ 146,422$ 202,091$ 250,826$ 252,009$ 260,993$ 258,087$ 270,909$ Net Interest Income - + 100 basis point shock 131,164$ 143,418$ 197,675$ 250,113$ 253,070$ 263,303$ 262,392$ 276,988$ Percentage Change -0.2% -2.1% -2.2% -0.3% 0.4% 0.9% 1.7% 2.2% Net Interest Income - + 200 basis point shock 134,029$ 144,773$ 199,613$ 257,705$ 262,497$ 274,552$ 275,438$ 289,966$ Percentage Change 1.9% -1.1% -1.2% 2.7% 4.2% 5.2% 6.7% 7.0% Net Interest Income - + 300 basis point shock 139,317$ 148,470$ 203,701$ 266,070$ 272,878$ 286,674$ 289,197$ 303,319$ Percentage Change 6.0% 1.4% 0.8% 6.1% 8.3% 9.8% 12.1% 12.0% Net Interest Income - + 400 basis point shock 144,830$ 152,069$ 207,441$ 274,468$ 283,169$ 298,763$ 303,009$ 316,719$ Percentage Change 10.2% 3.9% 2.6% 9.4% 12.4% 14.5% 17.4% 16.9% Net Interest Income - - 100 basis point shock 130,826$ 141,639$ 200,680$ 244,895$ 246,881$ 255,898$ 251,606$ 264,079$ Percentage Change -0.5% -3.3% -0.7% -2.4% -2.0% -2.0% -2.5% -2.5% Net Interest Income - - 200 basis point shock 129,851$ 137,192$ 196,217$ 241,220$ 243,844$ 254,531$ 249,584$ 256,318$ Percentage Change -1.2% -6.3% -2.9% -3.8% -3.2% -2.5% -3.3% -5.4%

(1) Core deposits include CDAR’s and ICS reciprocal deposits. Commercial focus drives growth of Noninterest Bearing Demand accounts Wholesale Deposits used to enhance favorable cost of funds, not a strategy to replace growth in core deposits Deposit Composition and Growth 18 (Dollar Values in Thousands) Annual Growth Rate Deposit Type % of % of % of Balance Total Balance Total Balance Total % Noninterest Bearing 1,405,067$ 27.2% 1,668,271$ 30.0% 1,775,684$ 31.1% 26.4% Interest Bearing Transaction 178,797 3.5% 297,973 5.4% 289,122 5.1% 61.7% Core Savings & Money Market (1) 2,515,224 48.8% 2,390,367 43.0% 2,484,622 43.4% (1.2%) Core CD's (1) 507,503 9.8% 516,946 9.3% 537,703 9.4% 6.0% Wholesale Money Market 320,101 6.2% 412,151 7.4% 417,938 7.3% 30.6% Wholesale CD's 231,752 4.5% 272,441 4.9% 211,046 3.7% (8.9%) Total Deposits 5,158,444$ 100% 5,558,149$ 100% 5,716,115$ 100% 10.8% As of September 30, 2016 As of December 31, 2016As of December 31, 2015

Balanced Loan and Deposit Growth 19 NOTE: Virginia Heritage Bank acquisition closed on October 31, 2014. $0.0 $1.0 $2.0 $3.0 $4.0 $5.0 $6.0 $ in Billions Total Loans Total Deposits

Detail of Loan Portfolio NOTE: Data as of December 31, 2016 Concentration in quality markets: Washington, DC, Montgomery County, Fairfax County Held for Sale residential mortgages not included 20 (Dollar Value in Thousands) County C&I Owner Occupied CRE Owner Occupied Const. Income Producing CRE Construction Land Residential Mortgage Home Equity Other Consumer TOTAL % of Total Maryland Montgomery 320,202$ 95,975$ 56,467$ 315,542$ 130,597$ 9,862$ 39,359$ 52,619$ 8,292$ 1,028,915$ 18.1% Prince George's 88,142 67,122 31,630 140,884 36,230 8,578 633 1,605 128 374,952 6.6% Baltimore 19,242 13,739 11,597 154,971 16,974 - - 451 112 217,086 3.8% Anne Arundel 10,231 16,162 - 87,988 3,235 5,349 5,074 1,358 59 129,456 2.3% Frederick 27,173 576 2,201 42,385 609 10,750 3,895 2,252 81 89,922 1.6% Howard 6,026 2,986 - 71,979 1,012 3,769 211 450 1 86,434 1.5% Eastern Shore 5,778 6,009 - 65,411 - - 2,787 382 53 80,420 1.4% Charles 311 21,191 - 1,536 210 5,173 469 - - 28,890 0.5% Other MD 6,378 3,859 - 23,298 7,175 4,614 1,063 568 33 46,988 0.8% Washington DC 318,882 177,251 12,631 899,500 399,640 3,179 53,719 17,337 276 1,882,415 33.1% Virginia Fairfax 166,798 80,036 9,323 299,729 101,933 10,337 15,748 14,040 627 698,571 12.3% Alexandria 30,258 12,880 - 67,841 42,252 - 1,485 3,144 113 157,973 2.8% Loudoun 37,981 47,973 - 25,993 51,943 864 1,909 4,032 170 170,865 3.0% Arlington 49,187 968 - 74,888 21,701 2,940 1,222 1,882 25 152,813 2.7% Prince William 6,484 37,155 2,189 66,646 12,808 1,294 676 1,704 160 129,116 2.3% Fauquier - 3,852 - 10,036 99 - - 315 9 14,311 0.3% Other VA 21,770 34,967 - 91,944 26,604 3,098 1,109 732 81 180,305 3.2% Other USA 85,885 18,169 - 68,947 317 9,385 23,389 2,224 145 208,461 3.7% Total $1,200,728 $640,870 $126,038 $2,509,518 $853,339 $79,192 $152,748 $105,095 $10,365 $5,677,893 100.0% % of Total 21.1% 11.3% 2.2% 44.2% 15.0% 1.4% 2.7% 1.9% 0.2% 100.0%

Credit Quality Trends 21 NOTE: Virginia Heritage Bank acquisition closed on October 31, 2014. (Dollar Values in Thousands) 2012Y 2013Y 2014Y 2015Y 2016Q1 2016Q2 2016Q3 2016Q4 Nonperforming Assets: Accruing Loans 90 or More Days Past Due -$ -$ -$ -$ -$ -$ -$ -$ Nonaccrual 30,684 24,702 22,443 13,239 21,928 21,380 22,274 17,875 Total Nonperforming Loans (NPLs) 30,684$ 24,702$ 22,443$ 13,239$ 21,928$ 21,380$ 22,274$ 17,875$ Other Real Estate Owned (OREO) 5,299 9,225 13,224 5,852 3,846 3,152 5,194 2,694 Total Nonperforming Assets 35,983$ 33,927$ 35,667$ 19,091$ 25,774$ 24,532$ 27,468$ 20,569$ Performing Restructured Loans (TDRs) 15,313 7,944 13,502 11,836 6,769 7,329 7,338 7,924 NPAs/Assets 1.06% 0.90% 0.68% 0.31% 0.42% 0.39% 0.41% 0.30% NPAs+TDRs/Assets 1.50% 1.11% 0.94% 0.51% 0.53% 0.50% 0.51% 0.41% Reserves 37,492$ 40,921$ 46,075$ 52,687$ 54,608$ 56,536$ 56,864$ 59,073$ Reserves/Loans 1.50% 1.39% 1.07% 1.05% 1.06% 1.05% 1.04% 1.04% Charge-Offs NCOs/Average Loans 0.37% 0.23% 0.17% 0.17% 0.09% 0.15% 0.14% (0.01%)

Consistent Asset Quality Total Loans ($mms) 22 Note: Virginia Heritage Bank acquisition closed on October 31, 2014. 0.0% 2.0% 4.0% 6.0% 8.0% 10.0% 12.0% 14.0% 16.0% 18.0% 20.0% $0 $1,000 $2,000 $3,000 $4,000 $5,000 $6,000 Dec- 12 Mar- 13 Jun- 13 Sep- 13 Dec- 13 Mar- 14 Jun- 14 Sep- 14 Dec- 14 Mar- 15 Jun- 15 Sep- 15 Dec- 15 Mar- 16 Jun- 16 Sep- 16 Dec- 16 Total Loans ($) NPAs (%) Charge Offs (%) (Dollar Values in Thousands) Loan NPAs/ Average Year Growth Assets Charge-Offs 2011 $380,756 1.27% 0.32% 2012 $436,839 1.06% 0.37% 2013 $452,063 0.90% 0.23% 2014 $1,367,241 0.68% 0.17% 2015 $685,969 0.31% 0.17% 2016 $679,525 0.30% 0.09% Net Charge-Off History for the periods ended December 31, 2016 EGBN EGBN Loan Type 2 Year Avg. 3 Year Avg. Income Producing CRE 0.04% 0.03% Owner Occupied CRE 0.00% 0.07% Construction and Land 0.09% 0.18% Commercial & Industrial 0.38% 0.34%

CRE Risk Management Executive & Board Level Oversight of Approval Process Disciplined Underwriting Proactive Portfolio Management Quarterly Stress Testing of CRE Portfolio Quarterly Independent Credit Review Dedicated Special Assets Team 23
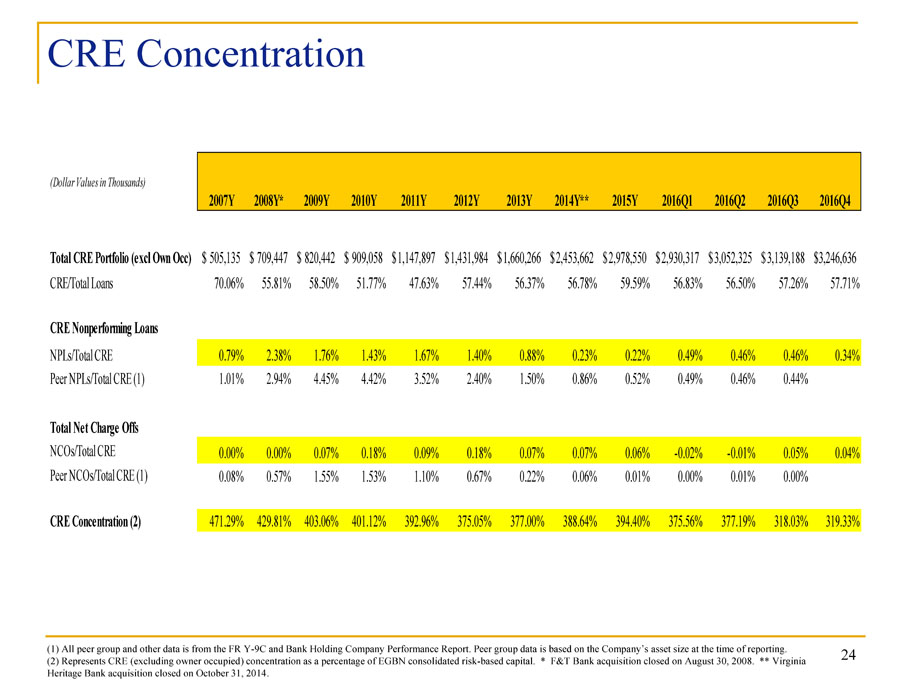
CRE Concentration 24 (1) All peer group and other data is from the FR Y - 9C and Bank Holding Company Performance Report. Peer group data is based on the Compa ny’s asset size at the time of reporting. (2) Represents CRE (excluding owner occupied) concentration as a percentage of EGBN consolidated risk - based capital. * F&T Ban k acquisition closed on August 30, 2008. ** Virginia Heritage Bank acquisition closed on October 31, 2014 . (Dollar Values in Thousands) 2007Y 2008Y* 2009Y 2010Y 2011Y 2012Y 2013Y 2014Y** 2015Y 2016Q1 2016Q2 2016Q3 2016Q4 Total CRE Portfolio (excl Own Occ) 505,135$ 709,447$ 820,442$ 909,058$ 1,147,897$ 1,431,984$ 1,660,266$ 2,453,662$ 2,978,550$ 2,930,317$ 3,052,325$ 3,139,188$ 3,246,636$ CRE/Total Loans 70.06% 55.81% 58.50% 51.77% 47.63% 57.44% 56.37% 56.78% 59.59% 56.83% 56.50% 57.26% 57.71% CRE Nonperforming Loans NPLs/Total CRE 0.79% 2.38% 1.76% 1.43% 1.67% 1.40% 0.88% 0.23% 0.22% 0.49% 0.46% 0.46% 0.34% Peer NPLs/Total CRE (1) 1.01% 2.94% 4.45% 4.42% 3.52% 2.40% 1.50% 0.86% 0.52% 0.49% 0.46% 0.44% Total Net Charge Offs NCOs/Total CRE 0.00% 0.00% 0.07% 0.18% 0.09% 0.18% 0.07% 0.07% 0.06% -0.02% -0.01% 0.05% 0.04% Peer NCOs/Total CRE (1) 0.08% 0.57% 1.55% 1.53% 1.10% 0.67% 0.22% 0.06% 0.01% 0.00% 0.01% 0.00% CRE Concentration (2) 471.29% 429.81% 403.06% 401.12% 392.96% 375.05% 377.00% 388.64% 394.40% 375.56% 377.19% 318.03% 319.33%

ADC Concentration 25 (1) All peer group and other data is from the FR Y - 9C and Bank Holding Company Performance Report. Peer group data is based on t he Company’s asset size at the time of reporting . (2) Represents ADC concentration as a percentage of EGBN consolidated risk - based capital. * F&T Bank acquisition closed on Aug ust 30, 2008. ** Virginia Heritage Bank acquisition closed on October 31, 2014 . (Dollar Values in Thousands) 2007Y 2008Y* 2009Y 2010Y 2011Y 2012Y 2013Y 2014Y** 2015Y 2016Q1 2016Q2 2016Q3 2016Q4 Total ADC Portfolio 101,752$ 283,041$ 252,494$ 327,718$ 448,470$ 539,069$ 628,880$ 798,241$ 909,654$ 897,927$ 857,558$ 914,121$ 976,599$ ADC/Total Loans 14.11% 22.27% 18.00% 18.66% 18.61% 21.62% 21.35% 18.47% 18.20% 17.42% 15.87% 16.68% 17.36% ADC Nonperforming Loans NPLs/Total ADC 3.96% 6.28% 6.30% 4.50% 3.89% 3.45% 1.33% 0.51% 0.08% 0.63% 0.65% 0.56% 0.13% Peer NPLs/Total ADC (1) 1.50% 5.60% 10.75% 11.24% 8.85% 6.51% 2.91% 1.28% 0.63% 0.57% 0.45% 0.40% Total Net Charge Offs NCOs/Total ADC 0.00% 0.16% 0.07% 0.52% 0.28% 0.44% 0.21% 0.26% -0.02% -0.09% -0.05% 0.22% 0.16% Peer NCOs/Total ADC (1) 0.08% 1.30% 3.88% 4.30% 3.09% 2.37% 0.46% -0.11% -0.04% -0.05% -0.05% -0.06% ADC Concentration (2) 114.82% 171.48% 124.04% 144.60% 153.52% 141.19% 142.80% 126.44% 120.45% 115.08% 105.97% 92.61% 96.05%
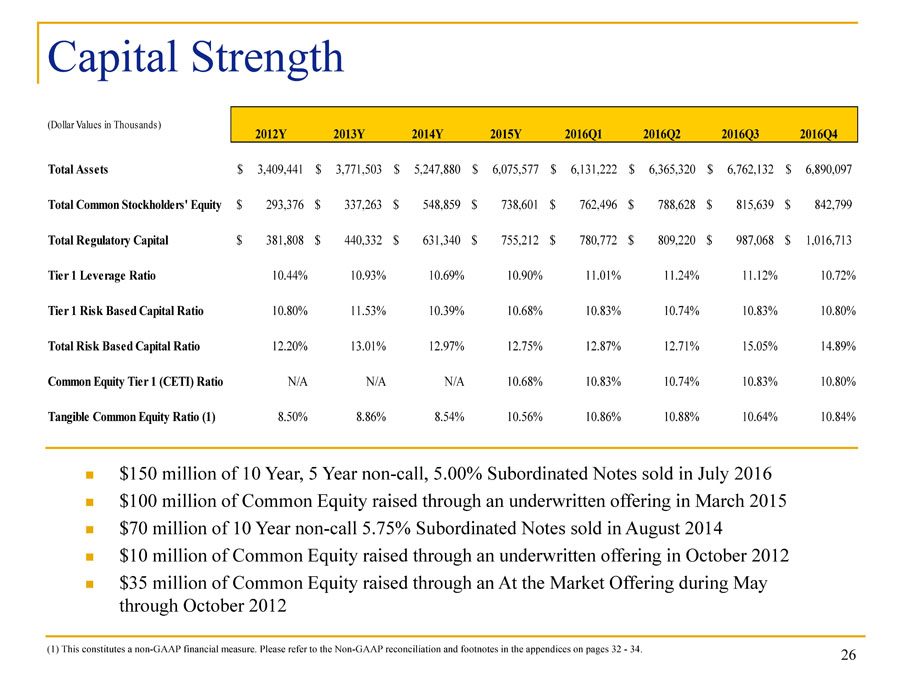
Capital Strength $150 million of 10 Year, 5 Year non - call, 5.00% Subordinated Notes sold in July 2016 $100 million of Common Equity raised through an underwritten offering in March 2015 $70 million of 10 Year non - call 5.75% Subordinated Notes sold in August 2014 $10 million of Common Equity raised through an underwritten offering in October 2012 $35 million of Common Equity raised through an At the Market Offering during May through October 2012 (1) This constitutes a non - GAAP financial measure. P lease refer to the Non - GAAP reconciliation and footnotes in the appendices on pages 32 - 34. 26 (Dollar Values in Thousands) 2012Y 2013Y 2014Y 2015Y 2016Q1 2016Q2 2016Q3 2016Q4 Total Assets 3,409,441$ 3,771,503$ 5,247,880$ 6,075,577$ 6,131,222$ 6,365,320$ 6,762,132$ 6,890,097$ Total Common Stockholders' Equity 293,376$ 337,263$ 548,859$ 738,601$ 762,496$ 788,628$ 815,639$ 842,799$ Total Regulatory Capital 381,808$ 440,332$ 631,340$ 755,212$ 780,772$ 809,220$ 987,068$ 1,016,713$ Tier 1 Leverage Ratio 10.44% 10.93% 10.69% 10.90% 11.01% 11.24% 11.12% 10.72% Tier 1 Risk Based Capital Ratio 10.80% 11.53% 10.39% 10.68% 10.83% 10.74% 10.83% 10.80% Total Risk Based Capital Ratio 12.20% 13.01% 12.97% 12.75% 12.87% 12.71% 15.05% 14.89% Common Equity Tier 1 (CETI) Ratio N/A N/A N/A 10.68% 10.83% 10.74% 10.83% 10.80% Tangible Common Equity Ratio (1) 8.50% 8.86% 8.54% 10.56% 10.86% 10.88% 10.64% 10.84%

Key Success Factors Building and maintaining core relationships o Cross sales o Focus on key customers Maintenance of strong credit culture o Conservative underwriting criteria and loan policies o Disciplined committee approval and review process o Periodic loan and portfolio stress testing o Proactive identification and resolution of problem c redits Built and preserved a strong capital position and balance sheet o Nine capital raising events since August 2008 o 32 consecutive quarters of increasing profitability (since January 1, 2009) have consistently bolstered the capital position 27

Key Success Factors (continued) Disciplined ALCO process Maintained focus on areas of strength o Concentration on core geographic markets and products Built the proper infrastructure to support the increased volume of business and regulation Comprehensive Management and Board level reporting Human Resources o Recruiting of strong, seasoned bankers with local market knowledge and experience o Well designed, incentive based compensation plans o Stability of staff, low turnover rate 28

EagleBank Growth Strategy Profitability • Pricing discipline to sustain Net Interest Margin • Diligent expense control to maintain Efficiency Ratio Maintain Credit Quality • Enhanced monitoring of portfolio • Expanded stress testing Emphasis on Organic Growth • Only 2.90% deposit market share in DC Metro Area • Significant opportunities to expand relationships, particularly in Northern Virginia • Attract new relationships and develop cross sell opportunities Improve Growth of Noninterest Income Components of Revenue • SBA guaranteed loans, residential mortgage origination , FHA commercial mortgage origination, treasury management services, insurance 29

Stock Price Performance 1 Year 3 Year 5 Year EGBN 35.8% 81.7% 325.3% NASDAQ Bank Stock Index 55.0% 50.6% 121.9% NASDAQ Stock Market Index 27.8% 35.2% 95.0% S & P 500 Index 22.3% 27.1% 72.3% EGBN Stock Price Performance SOURCE : SNL Financial, Chart and calculations as of close of trading on February 28, 2017 30

Appendices 31
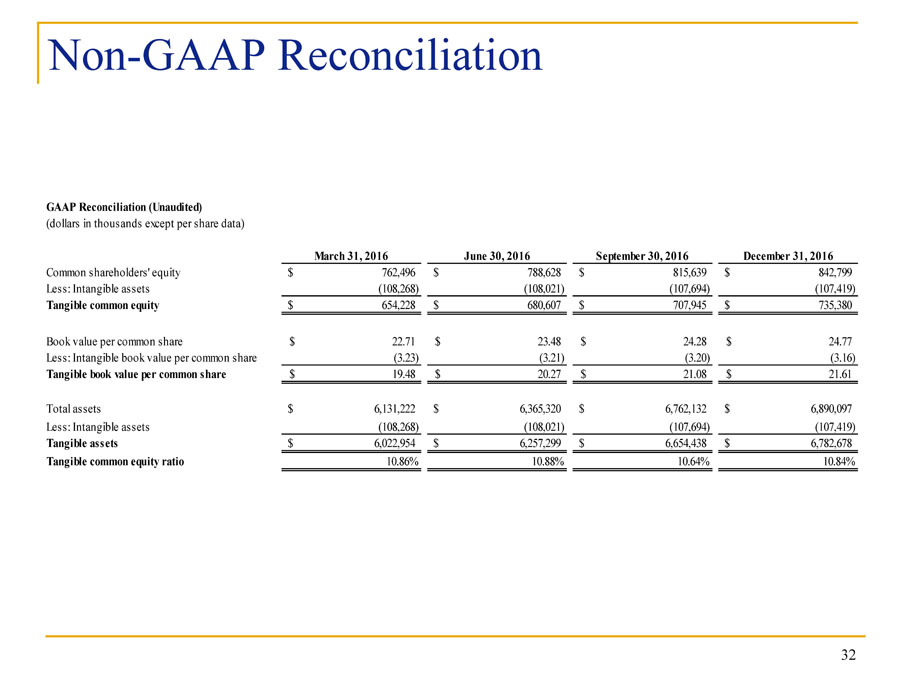
Non - GAAP Reconciliation 32 GAAP Reconciliation (Unaudited) (dollars in thousands except per share data) March 31, 2016 June 30, 2016 September 30, 2016 December 31, 2016 Common shareholders' equity 762,496$ 788,628$ 815,639$ 842,799$ Less: Intangible assets (108,268) (108,021) (107,694) (107,419) Tangible common equity 654,228$ 680,607$ 707,945$ 735,380$ Book value per common share 22.71$ 23.48$ 24.28$ 24.77$ Less: Intangible book value per common share (3.23) (3.21) (3.20) (3.16) Tangible book value per common share 19.48$ 20.27$ 21.08$ 21.61$ Total assets 6,131,222$ 6,365,320$ 6,762,132$ 6,890,097$ Less: Intangible assets (108,268) (108,021) (107,694) (107,419) Tangible assets 6,022,954$ 6,257,299$ 6,654,438$ 6,782,678$ Tangible common equity ratio 10.86% 10.88% 10.64% 10.84%

Non - GAAP Reconciliation 33 GAAP Reconciliation (Unaudited) (dollars in thousands except per share data) December 31, 2012 December 31, 2013 December 31, 2014 December 31, 2015 December 31, 2016 Common shareholders' equity 293,376$ 337,263$ 548,859$ 738,601$ 842,799$ Less: Intangible assets (3,785) (3,510) (109,908) (108,542) (107,419) Tangible common equity 289,591$ 333,753$ 438,951$ 630,059$ 735,380$ Book value per common share 11.62$ 13.03$ 18.21$ 22.07$ 24.77$ Less: Intangible book value per common share (0.15) (0.14) (3.65) (3.24) (3.16) Tangible book value per common share 11.47$ 12.89$ 14.56$ 18.83$ 21.61$ Total assets 3,409,441$ 3,771,503$ 5,247,880$ 6,076,649$ 6,890,097$ Less: Intangible assets (3,785) (3,510) (109,908) (108,542) (107,419) Tangible assets 3,405,656$ 3,767,993$ 5,137,972$ 5,968,107$ 6,782,678$ Tangible common equity ratio 8.50% 8.86% 8.54% 10.56% 10.84%

Non - GAAP Reconciliation Footnotes 34 (1) Tangible common equity to tangible assets (the "tangible common equity ratio") and tangible book value per common share are non -GAAP financial measures derived from GAAP -based amounts. The Company calculates the tangible common equity ratio by excluding the balance of intangible assets from common shareholders' equity and dividing by tangible assets. The Company calculates tangible book value per common share by dividing tangible common equity by common shares outstanding, as compared to book va lue per common share, which the Company calculates by dividing common shareholders' equity by common shares outstanding. The Company considers this information important to shareholders' as tangible equity is a measure that is consistent with the calculati on of capital for bank regulatory purposes, which excludes intangible assets from the c alculation of risk based ratios and as such is useful for investors, regulators, management and others to evaluate capital adequacy and to compare against other financial institutions.

35 Market Information – Washington, DC MSA Population 6.2 Million □ 5th largest market in the U.S. Employment 3.3 Million □ 67,000 new jobs created in 2016 □ Employment growth driven by private sector, over 320,000 net new private sector jobs created over last five years □ Unemployment rate of 3.4% vs. US average of 4.8% (December 2016) Gross Regional Product (GRP) $491 Billion □ 5th largest regional economy in the U.S. □ 25.0% growth in GRP over the last 10 years □ Federal Government Spending is 30.0% of GRP □ Highest median household income of any major U.S. market SOURCE: Greater Washington Board of Trade Regional Report, Bureau of Labor Statistics, Center for Regional Analysis, George Mason University

36 Other 8.9% Non-Local Business 10.6% Associations 2.2% Hospitality 3.6% International 4.9% Other Federal 13.7% Federal Procurement 16.3% Local Business 39.9% Greater Washington Economy NOTE: Other includes Health Care/Education and Media SOURCE: The Wall Street Journal, George Mason University - Center for Regional Analysis, Bureau of Economic Analysis Total Federal Spending = 30% of GRP GRP Contribution by Sub - market Gross Regional Product $491 Billion Suburban Maryland 28.0% District of Columbia 24.0% Northern Virginia 48.0%
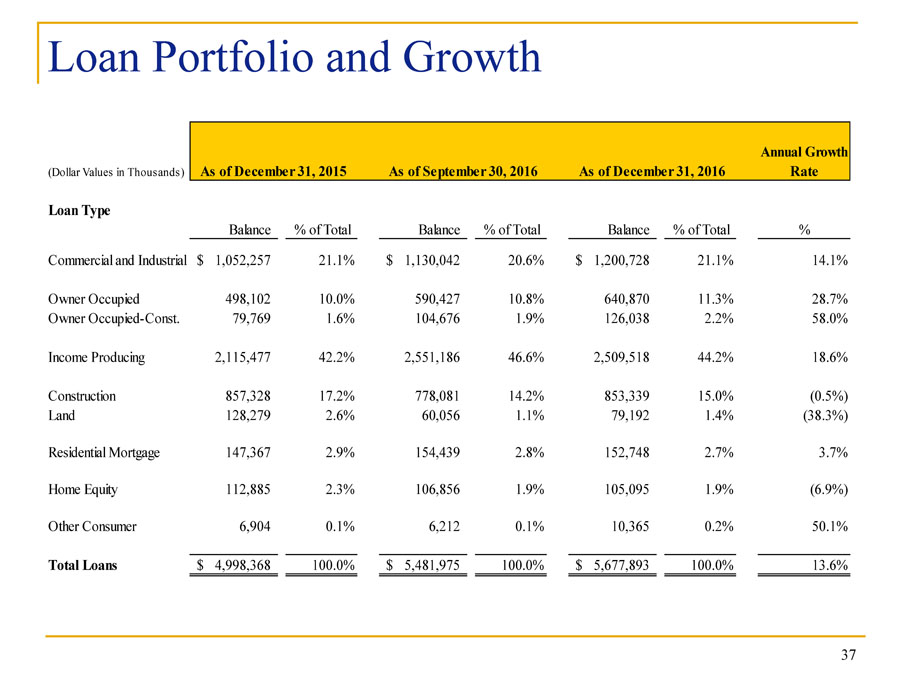
Loan Portfolio and Growth 37 (Dollar Values in Thousands) Annual Growth Rate Loan Type Balance % of Total Balance % of Total Balance % of Total % Commercial and Industrial 1,052,257$ 21.1% 1,130,042$ 20.6% 1,200,728$ 21.1% 14.1% Owner Occupied 498,102 10.0% 590,427 10.8% 640,870 11.3% 28.7% Owner Occupied-Const. 79,769 1.6% 104,676 1.9% 126,038 2.2% 58.0% Income Producing 2,115,477 42.2% 2,551,186 46.6% 2,509,518 44.2% 18.6% Construction 857,328 17.2% 778,081 14.2% 853,339 15.0% (0.5%) Land 128,279 2.6% 60,056 1.1% 79,192 1.4% (38.3%) Residential Mortgage 147,367 2.9% 154,439 2.8% 152,748 2.7% 3.7% Home Equity 112,885 2.3% 106,856 1.9% 105,095 1.9% (6.9%) Other Consumer 6,904 0.1% 6,212 0.1% 10,365 0.2% 50.1% Total Loans 4,998,368$ 100.0% 5,481,975$ 100.0% 5,677,893$ 100.0% 13.6% As of December 31, 2015 As of September 30, 2016 As of December 31, 2016

Geographic Detail - Income Producing CRE NOTE: Data as of December 31, 2016 Focus in core sub - markets: Washington, DC, Montgomery County, Fairfax County 38 (Dollar Value in Thousands) Single Office/ Redevel./ Multi- Mixed & 1-4 County Condo Retail Hotel Family Use Single & 1-4 Family Industrial Other TOTAL % of Total Maryland Montgomery 74,574$ 42,104$ 14,105$ 47,687$ 59,112$ 35,767$ 8,119$ 34,074$ 315,542$ 12.6% Prince George's 24,769 47,885 20,018 9,686 6,672 2,925 11,269 17,660 140,884 5.6% Baltimore 4,590 75,390 20,395 5,717 27,559 5,538 15,629 153 154,971 6.2% Anne Arundel 3,158 24,720 9,614 42,009 - 362 4,310 3,815 87,988 3.5% Frederick 12,299 42,185 - - 2,779 5,263 2,437 7,016 71,979 2.9% Howard 4,465 1,767 - - 2,519 9,664 10,771 13,199 42,385 1.7% Eastern Shore 2,038 - 61,935 - - 1,438 - - 65,411 2.6% Charles - - - - - 261 - 1,275 1,536 0.1% Other MD 5,463 1,595 - 167 2,724 203 12,660 486 23,298 0.9% Washington DC 107,949 83,206 190,108 166,928 54,771 89,120 172 207,246 899,500 35.8% Virginia Fairfax 94,647 47,241 - 977 10,048 20,621 681 125,514 299,729 11.9% Alexandria 1,525 12,326 - - - 3,182 2,225 6,735 25,993 1.0% Loudoun 27,066 5,039 - - 1,775 3,442 4,569 25,950 67,841 2.7% Arlington 25,619 - - 272 32,712 6,241 - 10,044 74,888 3.0% Prince William 13,947 28,995 - - - 757 3,825 19,122 66,646 2.7% Fauquier 2,430 2,067 - 500 - 5,039 10,036 0.4% Other VA 17,493 16,497 - 1,240 111 1,654 46,857 8,092 91,944 3.7% Other USA 20,869 7,966 2,526 5,082 756 7,965 2,218 21,565 68,947 2.7% Total $442,901 $438,983 $318,701 $279,765 $201,538 $194,903 $125,742 $506,985 $2,509,518 100.0% % of Total 17.6% 17.5% 12.7% 11.1% 8.0% 7.8% 5.0% 20.3% 100.0%

Geographic Detail – Construction NOTE: Data as of December 31, 2016 Focus in core sub - markets: Washington, DC, Montgomery County, Fairfax County Recognized expertise in Single Family and Condo construction lending Portfolio is diversified among collateral types 39 (Dollar Value in Thousands) Single & 1-4 Multi- Residential Mixed County Single & 1-4 Family Office Family Condo Use Hotel Retail Other TOTAL % of Total Maryland Montgomery 53,552$ 33,039$ 17,793$ 6,692$ 9,450$ -$ -$ 10,071$ 130,597$ 15.3% Prince George's 7,435 - 1,033 - 11,758 - - 16,004 36,230 4.2% Baltimore 491 - 4,396 - - 4,301 1,535 6,251 16,974 2.0% Anne Arundel 1,407 - - - - - 1,828 - 3,235 0.4% Howard 609 - - - - - - - 609 0.1% Frederick 1,012 - - - - - - - 1,012 0.1% Charles 210 - - - - - - - 210 0.0% Other MD 1,128 - 5,042 - 1,005 - - - 7,175 0.8% Washington DC 75,959 46,566 115,517 80,546 24,279 47,181 905 8,687 399,640 47.0% Virginia Fairfax 42,631 43,055 738 - 11,413 - 2,044 2,052 101,933 11.9% Alexandria 4,725 1,453 - - 22,334 - 13,740 - 42,252 5.0% Loudoun 827 13,546 - 5,444 800 - - 31,326 51,943 6.1% Arlington 20,298 - - 1,403 - - - - 21,701 2.5% Prince William 2,577 - - - 2,929 - - 7,302 12,808 1.5% Fauquier - - 99 - - - 99 0.0% Other VA - 25,069 752 705 - - - 78 26,604 3.1% Other USA 317 - - - - - - - 317 0.0% Total $213,178 $162,728 $145,370 $94,790 $83,968 $51,482 $20,052 $81,771 $853,339 100.0% % of Total 25.1% 19.1% 17.0% 11.1% 9.8% 6.0% 2.3% 9.6% 100.0% Renovation 74,705$ 153,848$ 97,426$ 17,364$ 45,056$ 6,969$ 16,473$ 15,596$ 427,437$ 50.1% Ground-Up 138,473$ 8,880$ 47,944$ 77,426$ 38,912$ 44,513$ 3,579$ 66,175$ 425,902$ 49.9%

Portfolio has $3.3 million of net unrealized losses at December 31, 2016 No holdings of GSE equities or bank Trust Preferred or bank Trust Preferred CDOs Average life of portfolio is 3.8 years Excludes Federal Reserve and Federal Home Loan Bank stock Conservative Securities Portfolio 40 (Dollar Values in Thousands) December 31, 2016 Gross Gross Estimated Amrt. Cost Amortized Unrealized Unrealized Fair % of Total Security Type Cost Gain Losses Value Securities US Government Agency Securities $107,425 $519 $1,802 $106,142 19.8% Mortgage Backed Securites - GSEs 329,606 324 3,691 326,239 60.9% Municipal Bonds 94,607 1,723 400 95,930 17.5% Corporate Bonds 9,508 82 11 9,579 1.8% Other Equity Investments 218 - - 218 0.0% Total Securities $541,364 $2,648 $5,904 $538,108 100.0% September 30, 2016 Gross Gross Estimated Amrt. Cost Amortized Unrealized Unrealized Fair % of Total Security Type Cost Gain Losses Value Securities US Government Agency Securities $55,862 $638 $136 $56,364 13.2% Mortgage Backed Securites - GSEs 264,101 2,284 350 266,035 62.4% Municipal Bonds 94,923 4,954 - 99,877 22.4% Corporate Bonds 8,009 68 23 8,054 1.9% Other Equity Investments 310 28 - 338 0.1% Total Securities 423,205$ 7,972$ 509$ 430,668$ 100.0% December 31, 2015 Gross Gross Estimated Amrt. Cost Amortized Unrealized Unrealized Fair % of Total Security Type Cost Gain Losses Value Securities US Government Agency Securities $56,775 $477 $277 $56,975 11.7% Mortgage Backed Securites - GSEs 299,709 692 3,160 297,241 61.6% Municipal Bonds 114,253 4,131 3 118,381 23.5% Corporate Bonds 15,090 - 152 14,938 3.1% Other Equity Investments 307 27 - 334 0.1% Total Securities $486,134 $5,327 $3,592 $487,869 100.0%

▪ Designated as a “Challenger” Bank 2015 ▪ Honor Roll of Community Banks 2010 - 2015 Nationally Recognized Financial Performance ▪ Community Bankers Cup Award 2012 - 2014 ▪ Ronald D. Paul named East Coast Region Community Banker of the Year 2014 Independent Community Bankers of America 41 ▪ “Top Investment Idea” Recommendation 2012 ▪ “Sm - All Stars” Designation 2011, 2013, 2014, 2015 & 2016

Highly Regarded by Bank Rating Firms FIRM BANK RATING 300/300 Green - *** B AUER F INANCIAL , I NC A - 42
Experienced Management Team 43 R onald D. Paul, Chairman, President and CEO Mr. Paul, a founder of EagleBank, has served as Chairman since May 2008, and prior to that time was Vice Chairman and Chief E xec utive Officer since the organization of the Company. Since June 2006, he has served as Chief Executive Officer of the Bank. Mr. Pau l is also President of Ronald D. Paul Companies and RDP Management, which are engaged in the business of real estate investment and man age ment for office and multi - family properties. Mr. Paul was a director of Allegiance Bank and of Allegiance Banc Corporation from 1990 until its acquisition by F&M, including serving as Vice Chairman of the Board of Directors from 1995. Mr. Paul is also active in various charitable organizations, including serving as Vice Chairman of the Board of Directors of the National Kidney Foundation from 1996 to 19 97, and Chairman from 2002 to 2003. Mr. Paul is a Trustee of the University of Maryland College Park Foundation. He sits on the Board of the Washington Hospital Center and the Metropolitan Washington Board of Trade. Mr. Paul has been named “Washingtonian of the Year ” b y Washingtonian magazine and in 2009 was named the “Greater Washington Entrepreneur of the Year” by Ernst & Young. In 2012 he was elected to the Washington Business Hall of Fame and was named “Community Banker of the Year” by the American Banker magazine. In 2014 Mr. Paul was named Community Banker of the Year for the Eastern Region by the Independent Community Bankers of America. Susan G. Riel, Senior EVP, Chief Operating Officer of EagleBank & EVP, Eagle Bancorp, Inc. Ms. Riel, Senior Executive Vice President - Chief Operating Officer of the Bank, and formerly Chief Administrative Officer. Ms . Riel has been with the bank for 16 years. She previously served as Executive Vice President - Chief Operating Officer of Columbia First Bank, FSB from 1989 until that institution’s acquisition by First Union Bancorp in 1995. She is one of the founding officers of EagleBank. Ms. Riel has over 35 years of experience in the commercial banking industry. James H. Langmead, EVP, Chief Financial Officer, Eagle Bancorp, Inc. and EagleBank Mr. Langmead, Executive Vice President and Chief Financial Officer of the Company since January 2007, and Executive Vice Pres ide nt and Chief Financial Officer of the Bank since January 2005, previously served as Chief Financial Officer of Sandy Spring Bank and Sa ndy Spring Bancorp. Mr. Langmead, a CPA, served in various financial and senior management roles with Sandy Spring Bank from 1992 throug h 2 004. Prior to that time, Mr. Langmead managed the finance group at the Bank of Baltimore .
Experienced Management Team 44 Janice L. Williams, EVP, Chief Credit Officer Ms. Williams, Executive Vice President and Chief Credit Officer of the Bank, has served the Bank as Credit Officer, Senior Cr edi t Officer and Chief Credit Officer for the past 11 years. Prior to employment with the Bank, Ms. Williams was with Capital Bank, Sequoia Bank , and American Security Bank. Additionally, Ms. Williams, a graduate of Georgetown University Law Center and a Member of the Maryland Bar, was previously employed in the private practice of law in Maryland. Laurence E. Bensignor, EVP & General Counsel, Eagle Bancorp, Inc. and EagleBank Mr. Bensignor joined the bank after 29 years in the legal and real estate industries in the Washington, DC area. For ten year s, Mr. Bensignor served as Trustee of the Van Metre Family Trusts, the controlling owner of a private, multifaceted real estate organization. Pre viously, he was a partner and chaired the real estate practice group in the Washington, DC office of the national law firm of Arter & Hadden an d f ormerly was a partner in the Washington, DC law firm of Melrod, Redman & Gartlan. Mr. Bensignor is a Fellow of the American College of Real Es tate Lawyers. Antonio F. Marquez, EVP, Chief Commercial Real Estate Lending Officer Mr. Marquez, Executive Vice President, recently joined EagleBank as the Chief Real Estate Lender. Prior to joining EagleBank, Mr . Marquez established the real estate lending franchise for HSBC for the Washington, DC market Earlier he was the head of Commercial Re al Estate lending at Chevy Chase Bank from 1999 to 2005 and prior to that held various lending positions at Chase Manhattan Bank in New Yo rk and The Riggs National Bank in Washington, D.C. Mr. Marquez has over 30 years of experience in the banking industry in the Washin gto n, DC metropolitan area. Lindsey S. Rheaume, EVP, Chief C&I Lending Officer Mr. Rheaume joined EagleBank as Chief C&I Lending Officer in December 2014 and has over 25 years of commercial lending, credi t r isk and managerial experience in the financial industry. Most recently, he served as relationship executive for JP Morgan Chase, res pon sible for business development in the DC, suburban Maryland and Northern Virginia market with clients ranging in revenue from $20MM to $50 0MM. Previously, he served as executive vice president and commercial lending manager at Virginia Commerce Bank — which was acquired by United Bank in 2014 — where he managed the bank’s entire commercial and industrial lending activities. Earlier in his career, he held senior commercial lending and credit positions with SunTrust Bank, GE Capital and Bank of America .

45 Historical Balance Sheet (Dollar Values in Thousands) 2012Y 2013Y 2014Y 2015Y 2016Y 5 Year Compound Growth Rate Assets Cash and Equivalents $339,334 $306,960 $256,025 $298,363 $368,163 9.6% Securities Available for Sale 310,514 389,405 404,903 504,772 559,708 11.5% Total Cash and Securities 649,848 696,365 660,928 803,135 927,871 10.8% Gross Loans HFI 2,493,095 2,945,158 4,312,399 4,998,368 5,677,893 22.5% Loan Loss Reserves 37,492 40,921 46,075 52,687 59,073 14.8% Loans Held for Sale 226,923 42,030 44,317 47,492 51,629 (21.8%) Total Net Loans 2,682,526 2,946,267 4,310,641 4,993,173 5,670,449 20.8% Real Estate Owned 5,299 9,225 13,224 5,852 2,694 (3.5%) Total Intangibles 3,642 3,276 109,626 108,155 106,947 93.3% Total Servicing Rights 143 234 282 387 472 21.4% Other Assets 67,983 116,136 153,179 164,875 181,664 23.2% Total Assets $3,409,441 $3,771,503 $5,247,880 $6,075,577 $6,890,097 19.5% Liabilities Deposits $2,897,222 $3,225,414 $4,310,768 $5,158,444 $5,716,115 19.0% FHLB Borrowings 30,000 30,000 140,000 0 0 (100.0%) Repurchase Agreements 101,338 80,471 61,120 72,356 68,876 (7.8%) Subordinated Debt 9,300 9,300 79,300 68,928 216,514 87.7% Other Liabilities 21,605 32,455 35,933 37,248 45,793 18.3% Total Liabilities 3,059,465 3,377,640 4,627,121 5,336,976 6,047,298 18.7% Equity Preferred Equity 56,600 56,600 71,900 0 0 (100.0%) Common Equity 287,911 340,582 546,212 738,410 845,180 32.7% Net Unrealized Gain (Loss) 5,465 (3,319) 2,647 191 (2,381) (186.6%) Total Stockholders Equity 349,976 393,863 620,759 738,601 842,799 25.9% Total Liabilities and Equity $3,409,441 $3,771,503 $5,247,880 $6,075,577 $6,890,097 19.5% Balance Sheet Analysis (%) Total Gross Loans/ Total Assets 73.12 78.09 82.17 82.27 82.41 Loans/ Deposits 86.05 91.31 100.04 96.90 99.33 Reserves/ Loans 1.50 1.39 1.07 1.05 1.04 Annualized Growth Rates (%) Asset Growth Rate 20.42 10.62 39.15 15.77 13.41 Gross Loans HFI 21.24 18.13 46.42 15.91 13.59 Deposit Growth Rate 21.12 11.33 33.65 19.66 10.81
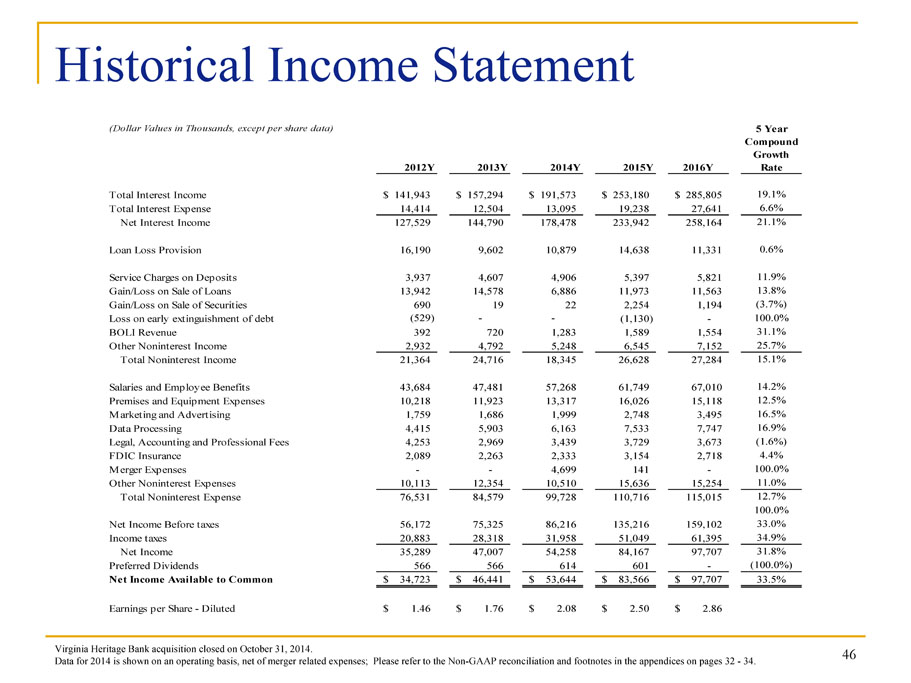
46 Historical Income Statement Virginia Heritage Bank acquisition closed on October 31, 2014. Data for 2014 is shown on an operating basis, net of merger related expenses; P lease refer to the Non - GAAP reconciliation and footnotes in the appendices on pages 32 - 34. (Dollar Values in Thousands, except per share data) 2012Y 2013Y 2014Y 2015Y 2016Y 5 Year Compound Growth Rate Total Interest Income 141,943$ 157,294$ 191,573$ 253,180$ 285,805$ 19.1% Total Interest Expense 14,414 12,504 13,095 19,238 27,641 6.6% Net Interest Income 127,529 144,790 178,478 233,942 258,164 21.1% Loan Loss Provision 16,190 9,602 10,879 14,638 11,331 0.6% Service Charges on Deposits 3,937 4,607 4,906 5,397 5,821 11.9% Gain/Loss on Sale of Loans 13,942 14,578 6,886 11,973 11,563 13.8% Gain/Loss on Sale of Securities 690 19 22 2,254 1,194 (3.7%) Loss on early extinguishment of debt (529) - - (1,130) - 100.0% BOLI Revenue 392 720 1,283 1,589 1,554 31.1% Other Noninterest Income 2,932 4,792 5,248 6,545 7,152 25.7% Total Noninterest Income 21,364 24,716 18,345 26,628 27,284 15.1% Salaries and Employee Benefits 43,684 47,481 57,268 61,749 67,010 14.2% Premises and Equipment Expenses 10,218 11,923 13,317 16,026 15,118 12.5% Marketing and Advertising 1,759 1,686 1,999 2,748 3,495 16.5% Data Processing 4,415 5,903 6,163 7,533 7,747 16.9% Legal, Accounting and Professional Fees 4,253 2,969 3,439 3,729 3,673 (1.6%) FDIC Insurance 2,089 2,263 2,333 3,154 2,718 4.4% Merger Expenses - - 4,699 141 - 100.0% Other Noninterest Expenses 10,113 12,354 10,510 15,636 15,254 11.0% Total Noninterest Expense 76,531 84,579 99,728 110,716 115,015 12.7% 100.0% Net Income Before taxes 56,172 75,325 86,216 135,216 159,102 33.0% Income taxes 20,883 28,318 31,958 51,049 61,395 34.9% Net Income 35,289 47,007 54,258 84,167 97,707 31.8% Preferred Dividends 566 566 614 601 - (100.0%) Net Income Available to Common 34,723$ 46,441$ 53,644$ 83,566$ 97,707$ 33.5% Earnings per Share - Diluted 1.46$ 1.76$ 2.08$ 2.50$ 2.86$