Attached files
| file | filename |
|---|---|
| EX-32.2 - EX-32.2 - OneSpan Inc. | d363884dex322.htm |
| EX-32.1 - EX-32.1 - OneSpan Inc. | d363884dex321.htm |
| EX-31.2 - EX-31.2 - OneSpan Inc. | d363884dex312.htm |
| EX-31.1 - EX-31.1 - OneSpan Inc. | d363884dex311.htm |
| EX-23 - EX-23 - OneSpan Inc. | d363884dex23.htm |
| EX-21 - EX-21 - OneSpan Inc. | d363884dex21.htm |
| EX-4.22 - EX-4.22 - OneSpan Inc. | d363884dex422.htm |
| EX-4.21 - EX-4.21 - OneSpan Inc. | d363884dex421.htm |
| EX-4.20 - EX-4.20 - OneSpan Inc. | d363884dex420.htm |
Table of Contents
UNITED STATES
SECURITIES AND EXCHANGE COMMISSION
Washington, D.C. 20549
FORM 10-K
FOR ANNUAL AND TRANSITION REPORTS PURSUANT TO
SECTIONS 13 OR 15(d) OF THE SECURITIES EXCHANGE ACT OF 1934
(Mark One)
| [x] | ANNUAL REPORT PURSUANT TO SECTION 13 OR 15(D) OF THE SECURITIES EXCHANGE ACT OF 1934 |
| FOR THE FISCAL YEAR ENDED DECEMBER 31, 2016 |
or
| [ ] | TRANSITION REPORT PURSUANT TO SECTION 13 OR 15(d) OF THE SECURITIES EXCHANGE ACT OF 1934 |
| FOR THE TRANSITION PERIOD FROM TO |
Commission file number 000-24389
VASCO Data Security International, Inc.
(Exact Name of Registrant as Specified in Its Charter)
| DELAWARE | 36-4169320 | |
| (State or Other Jurisdiction of Incorporation or Organization) |
(IRS Employer Identification No.) |
1901 South Meyers Road, Suite 210
Oakbrook Terrace, Illinois 60181
(Address of Principal Executive Offices)(Zip Code)
Registrant’s telephone number, including area code:
(630) 932-8844
Securities registered pursuant to Section 12(b) of the Act:
| Title of each class |
Name of exchange on which registered | |
| Common Stock, par value $.001 per share | NASDAQ Capital Market |
Securities registered pursuant to Section 12(g) of the Act:
None
Indicate by check mark if the registrant is a well-known seasoned issuer, as defined by Rule 405 of the Securities Act. Yes No X
Indicate by check mark if the registrant is not required to file reports pursuant to Section 13 or 15(d) of the act. Yes No X
Indicate by check mark whether the registrant: (1) has filed all reports required to be filed by Section 13 or 15(d) of the Securities Exchange Act of 1934 during the preceding 12 months (or for such shorter period that the registrant was required to file such reports), and (2) has been subject to such filing requirements for the past 90 days. Yes X No
Indicate by check mark whether the registrant has submitted electronically and posted on its corporate Web site, if any, every Interactive Data File required to be submitted and posted pursuant to Rule 405 of Regulation S-T (§232.405 of this chapter) during the preceding 12 months (or for such shorter period that the registrant was required to submit and post such files). Yes X No
Indicate by check mark if disclosure of delinquent filers pursuant to Item 405 of Regulation S-K is not contained herein, and will not be contained, to the best of registrant’s knowledge, in definitive proxy or information statements incorporated by reference in Part III of this Form 10-K or any amendment to this Form 10-K. [ ]
Indicate by check mark whether the registrant is a large accelerated filer, an accelerated filer, a non-accelerated filer or a smaller reporting company. See definition of “large accelerated filer,” “accelerated filer” and “smaller reporting company” in Rule 12b-2 of the Exchange Act.
Large accelerated filer Accelerated filer X Non-accelerated filer Smaller reporting company
(do not check if smaller reporting company)
Indicate by check mark whether the registrant is a shell company (as defined in Rule 12b-2 of the Exchange Act). Yes No X
As of June 30, 2016, the aggregate market value of voting and non-voting common equity (based upon the last sale price of the common stock as reported on the NASDAQ Capital Market on June 30, 2016) held by non-affiliates of the registrant was $496,189,352 at $16.39 per share.
As of February 10, 2017, there were 40,208,435 shares of common stock outstanding.
DOCUMENTS INCORPORATED BY REFERENCE
Certain sections of the registrant’s Notice of Annual Meeting of Stockholders and Proxy Statement for its 2017 Annual Meeting of Stockholders are incorporated by reference into Part III of this report.
Table of Contents
This report contains trademarks of VASCO Data Security International, Inc. and its subsidiaries, which include VASCO, the VASCO “V” design, Digipass as a Service, MYDIGIPASS.COM, DIGIPASS, VACMAN, aXsGUARD, IDENTIKEY, Cronto, and eSignLive.
Table of Contents
Cautionary Statement for Purposes of the Safe Harbor Provisions of the Private Securities Litigation Reform Act of 1995
This Annual Report on Form 10-K, including Management’s Discussion and Analysis of Financial Condition and Results of Operations and Quantitative and Qualitative Disclosures About Market Risk contains forward-looking statements within the meaning of Section 21E of the Securities Exchange Act of 1934, as amended and Section 27A of the Securities Act of 1933, as amended concerning, among other things, our expectations regarding the prospects of, and developments and business strategies for, VASCO and our operations, including the development and marketing of certain new products and services and the anticipated future growth in certain markets in which we currently market and sell our products and services or anticipate selling and marketing our products or services in the future. These forward-looking statements (1) are identified by use of terms and phrases such as “expect”, “believe”, “will”, “anticipate”, “emerging”, “intend”, “plan”, “could”, “may”, “estimate”, “should”, “objective”, “goal”, “possible”, “potential”, “projected”, and similar words and expressions, but such words and phrases are not the exclusive means of identifying them, and (2) are subject to risks and uncertainties and represent our present expectations or beliefs concerning future events. VASCO cautions that the forward-looking statements are qualified by important factors that could cause actual results to differ materially from those in the forward-looking statements. These additional risks, uncertainties and other factors have been described in greater detail in this Annual Report on Form 10-K and include, but are not limited to, (a) risks of general market conditions, including currency fluctuations and the uncertainties resulting from turmoil in world economic and financial markets, (b) risks inherent to the computer and network security industry, including rapidly changing technology, evolving industry standards, increasingly sophisticated hacking attempts, increasing numbers of patent infringement claims, changes in customer requirements, price competitive bidding, and changing government regulations, and (c) risks specific to VASCO, including demand for our products and services, competition from more established firms and others, pressures on price levels and our historical dependence on relatively few products, certain suppliers and certain key customers. These risks, uncertainties and other factors include VASCO’s ability to integrate eSignLive into the global business of VASCO successfully and the amount of time and expense spent and incurred in connection with the integration; the risk that the revenue synergies, cost savings and other economic benefits that VASCO anticipates as a result of this acquisition are not fully realized or take longer to realize than expected. Thus, the results that we actually achieve may differ materially from any anticipated results included in, or implied by these statements. Except for our ongoing obligations to disclose material information as required by the U.S. federal securities laws, we do not have any obligations or intention to release publicly any revisions to any forward-looking statements to reflect events or circumstances in the future or to reflect the occurrence of unanticipated events.
1
Table of Contents
VASCO Data Security International, Inc. was incorporated in the State of Delaware in 1997 and is the successor to VASCO Corp., a Delaware corporation. Our principal executive offices are located at 1901 South Meyers Road, Suite 210, Oakbrook Terrace, Illinois 60181; the telephone number at that address is 630 932 8844. Our international headquarters in Europe is located at World-Wide Business Center, Balz-Zimmermannstrasse 7, CH-8152, Glattbrugg, Switzerland; the phone number at this location is +41 43 555 3500. Our principal operations offices in Europe are located at Koningin Astridlaan 164, B-1780 Wemmel, Belgium and the telephone number at that address is +32 2 609 9700. Unless otherwise noted, references in this Annual Report on Form 10-K to “VASCO”, “company”, “we”, “our”, and “us” refer to VASCO Data Security International, Inc. and its subsidiaries.
Additional information on the company, our products and services and our results, including the company’s annual report on Form 10-K, quarterly reports on Form 10-Q, current reports on Form 8-K, and amendments to those reports filed with the Securities and Exchange Commission (the “SEC”) are available, free of charge, on our website at https://www.vasco.com. You may also read and copy any materials we file with the SEC at the SEC’s Public Reference Room at 100 F Street, NE, Washington, DC 20549. You may obtain information on the operation of the Public Reference Room by calling the SEC at 1-800-SEC-0330. Our reports are filed electronically with the SEC and are also available on the SEC’s website (http://www.sec.gov).
General
VASCO designs, develops and markets digital solutions for identity, security and business productivity that protect and facilitate transactions online, via mobile devices, and in-person. VASCO is a global leader in providing anti-fraud and digital transaction management solutions to financial institutions and other businesses. VASCO solutions secure access to data, assets, and applications for global enterprises; provide tools for application developers to easily integrate security functions into their web-based and mobile applications; and facilitate digital transactions involving the signing, sending, and managing of documents. Our core technologies, multi-factor authentication (also known as MFA) and transaction signing, strengthen the process of preventing hacking attacks against online and mobile transactions to allow companies to transact business safely with remote customers. Multi-factor authentication is the process of using multiple user attributes to confirm that the user is who they claim to be. This can include the user’s knowledge, such as a user name or password, what the user possesses, such as a hardware or software token, and who the user is, such is a fingerprint or facial attributes.
VASCO’s solutions include both open standards-based and proprietary solutions, some of which are patented products and services used for authentication, e-signing transactions and documents, and identity management in Business-to-Business (“B2B”), Business-to-Employee (“B2E”) and Business-to-Consumer (“B2C”) environments.
Historically, we have focused on two target market segments, the banking and/or financial services market (which we refer to as the “Banking Market” or “Banking”) and the enterprise and application security market (which we have referred to as the “Enterprise and Application Security Market” or “Enterprise and Application Security”). Our target markets include, but are not limited to, applications where individuals access assets and information, and complete transactions that have significant value.
In this increasingly connected world, online and mobile application owners and users benefit from our expertise in multi-factor authentication, transaction signing, and application security. Our convenient and proven security solutions enable frictionless and trusted interactions between businesses, employees, and consumers across a variety of online and mobile platforms.
2
Table of Contents
In order to succeed in this rapidly evolving market, VASCO has developed a growth strategy. Our strategy includes the following:
Bringing the next generation of online and mobile security solutions and electronic signature technologies to our customers to coincide with their business needs and refresh cycles;
Driving increased demand for our products in new applications, new markets, and new territories;
Benefitting from the shift to cloud-based and mobile device technologies;
Pursuing opportunities to grow our client base in vertical market segments beyond our core business; and
Acquiring technology companies that expand our technology portfolio or our customer base, and allow us to achieve our business objectives.
Our newest product offerings enhance our library of mobile application security solutions, expand our risk-based anti-fraud capabilities, and deliver broad-based signature capabilities that enable secure and simple digitized business transactions.
The number of people using the internet via computers, tablets, and smartphones continues to grow at a rapid pace. Consumers are embracing online and mobile transactions and banking in increasing numbers. Organizations of all types have an increasing number of employees and business partners accessing protected resources from remote locations. New business paradigms such as these introduce new security risks for all participants, especially banks, merchants, and all types of online and mobile service providers. Large and powerful criminal hacking organizations are launching more sophisticated hacking attacks with greater frequency. The criminal activities of private and state-sponsored hacking organizations have driven an increased need for security solutions and the expansion of regulations requiring organizations to improve their security measures to protect against hacking attacks and breaches. Several governments worldwide have recognized the risk associated with using the outdated user name and password access scheme for internet applications and mobile applications and have issued specific recommendations advocating multi-factor authentication for enhanced online and mobile banking security. We anticipate that this trend may continue and that governments in additional countries could prepare similar guidance or rules in order to protect their citizens’ online assets.
Our Background
Our predecessor company, VASCO Corp., entered the data security business in 1991 through the acquisition of a controlling interest in ThumbScan, Inc., which we renamed as VASCO Data Security, Inc.
In 1996, we expanded our computer security business by acquiring Lintel Security NV/SA, a Belgian corporation, which included assets associated with the development of security tokens and security technologies for personal computers and computer networks. Also in 1996, we acquired Digipass NV/SA, a Belgian corporation, which was also a developer of security tokens and security technologies and whose name we changed to VASCO Data Security NV/SA in 1997.
In 1997, VASCO Data Security International, Inc. was incorporated and in 1998, we completed a registered exchange offer with the holders of the outstanding securities of VASCO Corp.
In 2006, we opened our international headquarters in Zurich, Switzerland. In 2007, we established wholly owned sales subsidiaries in Brazil and Japan.
In 2008 and 2009, we established wholly-owned sales subsidiaries in Mumbai, India and Bahrain, respectively.
3
Table of Contents
In 2011, we completed the establishment of our wholly-owned sales subsidiary in China and received our trade license for a new subsidiary in Dubai, United Arab Emirates.
In 2013, we acquired Cronto Limited (“CRONTO”), a provider of secure visual transaction authentication solutions for online banking. CRONTO’s patented solution offers a robust, yet simple way to assure that a financial transaction has not been compromised, or hacked. The CRONTO solution has been integrated into VACMAN Controller and IDENTIKEY Server, VASCO’s security platforms that support VASCO’s entire family of strong authentication and e-signature products.
In 2014, we acquired Risk IDS, a provider of risk analysis solutions to the banking community. The platform is designed to evaluate the profile and activities of the user requesting a transaction to determine the risk profile associated with the transaction. It features a real-time analysis engine that uses rules and statistical techniques to improve real-time fraud detection. The technology is incorporated into our IDENTIKEY Risk Manager solution and is also being utilized in our DIGIPASS for Apps solutions.
In November 2015, we acquired Silanis Technology Inc., a leading provider of Electronic Signature (e-signature) and digital transaction solutions used to sign, send and manage documents. eSignLive™ is trusted by many of the largest banks, insurers and government agencies.
Including our predecessor company, VASCO Corp., we have engaged in fifteen acquisitions and one disposition.
Our Approach
VASCO is a global leader in delivering trust and business productivity solutions to the digital market. VASCO develops next generation technologies that enable more than 10,000 customers in 100 countries in financial, enterprise, government, healthcare, and other segments to support their transition to digital business processes, deliver an enhanced customer experience, and meet regulatory requirements. We believe that solutions for authentication, electronic signature, and identity management that protect access to financial accounts and internal and cloud applications, as well as the integrity of transactions, must be broad in scope and address all of the critical aspects of stopping fraud and enhancing user convenience. The market requirements for security and business enablement continue to evolve and we are responding by expanding our solutions beyond traditional online anti-fraud solutions to include more channels such as mobile and ATM security. We believe that effective security and productivity solutions must address and assimilate issues relating to the following:
| • | Providing protection against the newest and most sophisticated hacking attacks |
| • | Speed and ease of implementation, use, and administration; |
| • | Reliability and scalability; |
| • | Interoperability within diverse applications in the mobile ecosystem; |
| • | Convenient and frictionless end user experience; and |
| • | Overall cost of ownership. |
Accordingly, we have adopted the following approach to designing our products:
| • | Where appropriate, we incorporate industry-accepted, open and non-proprietary protocols. This permits interoperability between our products and multiple platforms, products, and applications widely in use. We minimize the effort required for implementation and integration with existing legacy applications and infrastructure. |
| • | We try to offer a more attractive total cost of ownership than competing products and services. |
| • | We support a wide variety of devices used to gain access to applications through the internet including personal computers, smart phones, tablets, and other personal devices. |
4
Table of Contents
| • | We develop products that are designed to provide both ease of use and the strength needed to protect transactions. Some of our client products use our CRONTO visual authentication solution that allows a user to minimize key strokes by optically scanning an encrypted color bar code that may be encrypted, thus increasing the strength of the security being used. |
| • | We provide multiple choices to our customers for hardware products and software solutions, both on-premises and in the cloud. |
Our Products and Services
Our product offerings, which include authentication, anti-fraud, and electronic signature solutions, provide a flexible and affordable means of establishing trust in users, their devices, and the transactions that they are conducting. Many of our authentication products calculate dynamic passwords, also known as one-time passwords (“OTP”) that authenticate users logging into applications and onto corporate networks. In addition, our anti-fraud products can be used to enable electronic signatures to protect electronic transactions and the integrity of the contents of such transactions.
Using our solutions to access protected applications, electronically sign a transaction, or enter a remote system, the user needs the following:
| • | Knowledge of either a username or a PIN code; and |
| • | An authenticator, either a DIGIPASS hardware authenticator or a DIGIPASS software authenticator downloaded onto a compatible device owned by the user. |
Both factors help ensure that the correct person is being granted access to an application, protected data, or signing a transaction, instead of a hacker. This helps reduce fraud and protect valuable assets.
VASCO’s primary product and service lines can be used by customers in several ways and consists of four categories:
| • | On-premises Solutions, which are typically a component of an organization’s IT infrastructure; |
| • | Client-based anti-fraud solutions, which are most often used by end users for authentication; |
| • | Cloud solutions which provide our solutions and are managed by VASCO; and |
| • | Developer Tools, which are used by application developers to increase the security of their mobile applications. |
On-premises Solutions
| • | VACMAN Controller: Core host system software authentication platform, combining multiple technologies on one unique platform. |
| • | IDENTIKEY Authentication Server and Appliances: Software that adds full server functionality to the VACMAN core authentication platform. |
| • | eSignLive electronic signature and document management solution that is hosted by VASCO’s customers on-premises. |
| • | IDENTIKEY Risk Manager (IRM) risk analysis solution that enables a proactive, real-time approach to fraud prevention. |
Client-based Anti-fraud Solutions
| • | DIGIPASS Hardware Authenticators: A broad family of multi-application hardware authenticators in a variety of form factors and feature sets to meet the diverse security needs of clients across multiple vertical markets. The hardware form factors include one-button, transaction signature, card reader, PKI, and Bluetooth enabled devices. |
5
Table of Contents
| • | DIGIPASS Software-based Solutions: These are authenticators that run on existing non-VASCO devices, such as PCs, mobile phones, tablets, etc. Built around our cornerstone DIGIPASS API, software authenticators include DIGIPASS for Apps (a library of security APIs for mobile applications), and DIGIPASS for Mobile (a stand-alone mobile security application for mobile devices). |
Cloud Solutions
| • | eSignLive electronic signature and document management solution provided on a SaaS basis and also available as a FedRAMP-certified service. |
| • | MYDIGIPASS cloud-based identity solution for e-government and eID services. |
Developer Tools
| • | In addition to enabling user authentication and fraud detection when integrated into a mobile application, DIGIPASS for Apps also provides software developers the ability to protect their mobile application from reverse engineering and application cloning. |
Detailed Product Descriptions
VACMAN Controller
The VACMAN product line incorporates a range of strong authentication utilities and solutions designed to allow organizations to add DIGIPASS strong authentication into their existing networks and applications.
In order to provide the greatest flexibility, without compromising functionality or security, VACMAN solutions are designed to integrate with most popular hardware and software. Once integrated, the VACMAN components become largely transparent to the users, minimizing rollout and support issues.
VACMAN encompasses multiple authentication technologies (passwords, dynamic password technologies, certificates, and biometrics) and allows our customers to use any combination of those technologies simultaneously.
Designed by specialists in system access security, VACMAN makes it easy to administer a high level of access control and allows our customers to match the level of authentication security used with the risk for each user of their application. Our customer simply adds a field to his or her existing user database, describing the authentication technology used and, if applicable, the unique DIGIPASS assigned to the end user of their application. VACMAN is a library requiring only a few days to implement in most systems and supports all DIGIPASS functionality. Once linked to an application, VACMAN automatically handles login requests from any user authorized to have a DIGIPASS.
IDENTIKEY Authentication Server
IDENTIKEY Authentication Server is a centralized authentication server that supports the deployment, use, and administration of DIGIPASS strong user authentication. IDENTIKEY is based on VASCO’s core VACMAN technology.
IDENTIKEY Authentication Server is available in a Banking Edition and three versions for the Enterprise and Application Security market that can be easily upgraded.
6
Table of Contents
The Banking Edition provides robust protection against man-in-the-middle (MITM) attacks, the highest security, and verified fit into existing PCI-DSS environments without reducing compliance.
IDENTIKEY Appliance and IDENTIKEY Virtual Appliance
IDENTIKEY Appliance is a standalone authentication solution that offers strong two-factor authentication for remote access to a corporate network or to web-based in-house business applications. It comes in a 19 inch rack mount design. The appliance verifies DIGIPASS/IDENTIKEY authentication requests from RADIUS clients and web filters and can easily be integrated with any infrastructure. It features a web-based administration interface as well as an auditing and reporting console.
IDENTIKEY Virtual Appliance is a virtualized authentication appliance that secures remote access to corporate networks and web-based applications.
IDENTIKEY Federation Server
IDENTIKEY Federation Server is a server appliance that provides an identity and access management platform. It is used to validate user credentials across multiple applications and disparate networks. The solution validates users and creates an identity ticket enabling web single sign-on for different applications across organizational boundaries. IDENTIKEY Federation Server works as an Identity Provider within the local organization, but can also delegate authentication requests (for unknown users) to other Identity Providers. In a Federated Model, IDENTIKEY Federation Server not only delegates but also receives authentication requests from other Identity Providers, when local users want to access applications from other organizations within the same federated infrastructure.
IDENTIKEY Risk Manager:
IDENTIKEY Risk Manager (IRM) is a comprehensive anti-fraud solution designed to help banks and other users improve the manner and speed of detecting fraud across multiple channels. It enables banks and financial institutions to take a proactive approach to fraud prevention, while at the same time making the experience frictionless for their end users. IRM uses analytic techniques such as Neural Network implementations to score real-time transaction activity. Cross-channel prebuilt rules complement this score and allow fraud experts to make decisions on alerts or link to automated business processes such as Step-Up Authentication. This solution may be implemented in combination with our DIGIPASS for Apps to provide integrated trust with minimal impact on the end user experience. These products are targeted at banks, transaction processors, and ATM operations.
DIGIPASS Hardware Authenticators
We offer a wide variety of DIGIPASS authenticators, each of which has its own distinct characteristics to meet the needs of our customers. All models of the DIGIPASS family are designed to work together so that our customers can switch their users’ devices without requiring any changes to their existing infrastructure. Our hardware DIGIPASS models range from simple one-button devices to devices that include more secure technologies, such as PKI.
With the acquisition of CRONTO in May 2013, VASCO has also added visual cryptography to its product portfolio. Sensitive transaction data are captured in a cryptogram that consists of a matrix of colored dots. By scanning the image with a hardware or software authenticator, the data contained in the cryptogram is decrypted and the transaction details are presented to the user for verification providing a highly secure method of visual transaction signing with maximum user convenience.
Many DIGIPASS hardware authenticators also combine the benefits of traditional password authenticators (authentication and digital signatures) with smart card readers. Together, they bring portability to smart cards and allow the use of secure time-based algorithms.
7
Table of Contents
DIGIPASS hardware technology is designed to support authentication and digital signatures for applications running on desktop PCs, laptops, tablets, and smart phones.
DIGIPASS Software Authenticators
Our DIGIPASS Software authenticators, DIGIPASS for Apps and DIGIPASS for Mobile are designed to provide our customers with increased security for access to their mobile applications and networks without having to carry a standalone hardware device. DIGIPASS software authenticators balance the need for stronger mobile application security with the demands for user convenience by delivering comprehensive, built-in security for mobile applications, combined with a frictionless, “hands-free” authentication and e-signing experience for mobile users.
DIGIPASS for Apps is a comprehensive software development kit (SDK) that allows application developers to natively integrate security features including geolocation, device identification, jailbreak and root detection, fingerprint and face recognition, one-time password delivery via PUSH notification, and electronic signing, among others. Through a comprehensive library of APIs, application developers can extend and strengthen application security, deliver enhanced convenience to their application users, and streamline application deployment and lifecycle management processes.
DIGIPASS for Mobile is a user-friendly and secure mobile authenticator that operates as a discrete mobile application. It includes many of the features of DIGIPASS for Apps and can easily be tailored to meet the needs of any authentication process. It can be customized and deployed rapidly without extensive technical support ensuring strong security with compelling value.
Developer Tools
VASCO’s Runtime Application Self-Protection (RASP), proactively addresses the threat of sophisticated malware, by effectively detecting and preventing fraudulent app activities before they interfere with or corrupt the normal operation of a mobile application. RASP also provides code obfuscation to deter debugging and reverse engineering of applications by hackers and reduces the risk of rogue apps.
eSignLive e-signature:
eSignLive supports a broad range of e-signature requirements from the simple to the complex, and from the occasional electronic contract to processing tens of thousands of transactions. eSignLive provides multiple deployment options including public cloud, private cloud, or on-premises, without compromising on security or functionality. eSignLive is also available in a FedRAMP SaaS-level compliant cloud. U.S. government agencies can now implement e-signatures in the cloud and meet GSA security requirements. Customers can fully configure the e-signature end-user experience to reinforce their brand for a seamless signing experience.
eSignLive is a well-established solution with an optimal e-signing experience across multiple devices, including laptop, mobile phone, or tablet, contributing to high levels of user adoption and satisfaction. Each step of the e-signature workflow may be customized, from authentication to e-document distribution, to ensure a high level of signer satisfaction across multiple channels.
eSignLive provides the most comprehensive and secure electronic evidence for the strongest legal protection by capturing both document and process-level evidence. This reduces the time and cost of gathering evidence and demonstrating legal and regulatory compliance. eSignLive electronic signature capabilities can be a critical component of the customer onboarding process for mobile applications providing a secure, user friendly and legal manner for financial institutions and others to capture customer’s signature and instantly add new customers.
8
Table of Contents
MYDIGIPASS Cloud Services
MYDIGIPASS (“MDP”) is our cloud-based service offering with a focus on the needs of B2B and B2C. MDP facilitates password management while adding an additional level of security to the login procedure. By using our MDP platform, consumers using B2C applications have convenient access to these applications with increased security. The MDP platform may also provide benefits for eGovernment and eID applications by providing authentication for citizens that are accessing government applications online.
We launched MYDIGIPASS (“MDP”) in April 2012. MDP is directed at the e-government and B2B market. This solution enables users to securely access multiple applications with only one DIGIPASS. We believe that with this approach, we can bring the security of multifactor authentication to a large number of online applications.
The combination of our core business line and service offering brings a large number of online applications within VASCO’s reach. MDP may have the potential for future growth as it has the capability of facilitating identity proofing and making authentication more affordable and readily available to users.
Intellectual Property and Proprietary Rights and Licenses
We rely on a combination of patent, copyright, trademark, design and trade secret laws, as well as employee and third-party non-disclosure agreements to protect our proprietary rights. In particular, we hold several patents in the U.S. and in other countries, which cover multiple aspects of our technology. These patents expire between 2021 and 2034. In addition to the issued patents, we also have several patent applications pending in the U.S., Europe and other countries. The majority of our issued and pending patents cover our DIGIPASS family and other authentication related technology. We believe these patents to be valuable property rights and we rely on the strength of our patents and on trade secret law to protect our proprietary technology. We furthermore have registrations for most of our trademarks in most of the markets where we sell the corresponding products and services and registrations of the designs of many of our hardware products primarily in the EU and China. To the extent that we believe our intellectual property rights are being infringed upon, we intend to assert vigorously our intellectual property rights, including but not limited to, pursuing all available legal remedies.
Research and Development
Our research and development efforts historically have been, and will continue to be, concentrated on product enhancement, new technology development, and related new product introductions. We employ a team of full-time engineers and, from time to time, also engage independent engineering firms to conduct non-strategic product development efforts on our behalf. For fiscal years ended December 31, 2016, 2015, and 2014, we incurred expenses of $23.2 million, $17.5 million, and $18.5 million, respectively, for research and development.
Production
Our security hardware DIGIPASS products are manufactured by third party manufacturers pursuant to purchase orders that we issue. Our hardware DIGIPASS products are made primarily from commercially available electronic components purchased globally. Our software products, are produced in-house.
Hardware DIGIPASS products utilize commercially available programmable microprocessors purchased from several suppliers. The microprocessors are the most important components of our security authenticators that are not commodity items readily available on the open market. Some microprocessors are single sourced. Orders of microprocessors generally require a lead-time of 12-16 weeks. We attempt to maintain a sufficient inventory of all parts to handle short-term increases in orders.
9
Table of Contents
Large orders that would significantly deplete our inventory are typically required to be placed with more than twelve weeks of lead-time, allowing us to make appropriate arrangements with our suppliers. We purchase microprocessors and arrange for shipment to third parties for assembly and testing in accordance with our design specifications. The majority of our DIGIPASS products are manufactured by four independent vendors domiciled in Hong Kong and Macau with production facilities in mainland China. Purchases from these companies are made on a volume purchase order basis. Equipment designed to test product at the point of assembly is supplied by VASCO. We maintain a local team in China who conduct quality control and quality assurance procedures. Periodic visits are conducted by VASCO personnel for purposes of quality management, assembly process review, and supplier relations.
Competition
The market for computer and network security solutions is very competitive and, like most technology-driven markets, is subject to rapid change and constantly evolving products and services. Our anti-fraud products are designed to allow authorized users access to a computing environment or application, in some cases using patented technology, as a replacement for or supplement to a static password. Although certain of our security technologies are patented, there are other organizations that offer anti-fraud solutions that compete with us for market share. Our main competitors in our anti-fraud markets are Gemalto and RSA Security, a subsidiary of EMC Corporation, which was acquired by Dell Technologies in 2016. There are many other companies, such as Kobil Systems, SafeNet (acquired by Gemalto in 2014), Symantec, and Early Warning that offer competing authentication hardware, software and services that range from simple locking mechanisms to sophisticated encryption technologies. In addition to these companies, we face competition from many small authentication solution providers many of whom offer new technologies and niche solutions such as biometric or behavioral analysis. We believe that competition in this market is likely to intensify as a result of increasing demand for security products. Our primary competitors for electronic signature solutions include DocuSign and Adobe Systems. Both companies are significantly larger then VASCO and outspend VASCO in marketing by a significant amount. In addition to these companies, there are dozens of smaller and regional providers of electronic signing solutions. Visibility of global competitors and their planned actions has diminished over the last several years as some of our competitors have been acquired by larger corporations (e.g., EMC’s acquisition of RSA) or private equity firms.
We believe that the principal competitive factors affecting the market for computer and network security products as well as electronic signatures include the strength and effectiveness of the solution, technical features, ease of use, quality/reliability, customer service and support, brand recognition, customer base, distribution channels, and the total cost of ownership of the solution. Although we believe that our products currently compete favorably with respect to such factors, other than name recognition in certain markets, there can be no assurance that we can maintain our competitive position against current and potential competitors, especially those with significantly greater financial, marketing, service, support, technical, and other competitive resources.
Some of our present and potential competitors have significantly greater financial, technical, marketing, purchasing, and other resources than we do, and as a result, may be able to respond more quickly to new or emerging technologies and changes in customer requirements, or to devote greater resources to the development, promotion and sale of products, or to deliver competitive products at a lower end-user price. Current and potential competitors have established or may establish cooperative relationships among themselves or with third parties to increase the ability of their products to address the needs of our prospective customers. It is possible that new competitors or alliances may emerge and rapidly acquire significant market share. Accordingly, we have forged, and will continue to forge, our own partnerships to offer a broader range of products and capabilities to the market.
10
Table of Contents
Sales and Marketing
Our security solutions are sold worldwide through our direct sales force, as well as through distributors, resellers and systems integrators. Our traditional security solutions are sold through our direct sales force, as well as through approximately 52 distributors, their reseller networks and systems integrators. Our sales staff coordinates sales activity through both our sales channels and those of our strategic partners making direct sales calls either alone or with the sales personnel of our partners. Our sales staff also provides product education seminars to sales and technical personnel of vendors and distributors with whom we have working relationships and to potential end-users of our products.
VASCO secures and trains its channel. Approximately 1,200 staff members of our channel partners have become VASCO certified.
Our sales force is able to offer each customer a choice of an on-site implementation using our traditional on-premises model or a cloud implementation for some solutions using our services platform.
Part of our expanded selling effort includes approaching our existing strategic partners to find additional applications for our security products. In addition, our marketing plan calls for the identification of new business opportunities that may require enhanced security or areas where we do not currently market our products. Our efforts also include various activities to increase market awareness of solutions as well as preparation and dissemination of white papers explaining how our security products can add value or otherwise be beneficial.
Customers and Markets
Customers for our products include some of the world’s most recognized names: HSBC, Rabobank, Deutsche Bank, Sumitomo Mitsui Banking Corporation, BNP-Paribas Fortis, The Bank of Tokyo-Mitsubishi, Banco Santander, Citibank, and U.S. government agencies including the Postal Service, USDA and GSA.
Our top 10 customers contributed 36%, 50%, and 46%, in 2016, 2015, and 2014, respectively, of total worldwide revenue. In 2015 and 2014, Rabobank contributed 30% and 12% of our worldwide revenue, respectively. In addition, in 2014, HSBC contributed approximately 11%, of our worldwide revenue.
A significant portion of our sales is denominated in foreign currencies and changes in exchange rates impact results of operations. To mitigate exposure to risks associated with fluctuations in currency exchange rates, we attempt to denominate an amount of billings in a currency such that it would provide a hedge against operating expenses being incurred in that currency. For additional information regarding how currency fluctuations can affect our business, please refer to “Management’s Discussion and Analysis of Financial Condition and Results of Operations” and “Quantitative and Qualitative Disclosures about Market Risk.”
We experience seasonality in our business. Historically, these seasonal trends are most notable in the summer months, particularly in Europe, when many businesses defer purchase decisions; however, the timing of any one or more large orders may temper or offset this seasonality.
We generally focus sales and marketing efforts in two primary areas:
| • | Banking, which includes Financial Institutions: Traditionally our largest market where we believe that there are substantial opportunities for future growth. |
| • | Other verticals, which are a significant market for us and includes: |
| - | Businesses seeking secure internal and remote network access: We sell to this market primarily through distributors and resellers. Our strategy is to leverage products developed for the Banking market by selling them to businesses. |
11
Table of Contents
| - | E-commerce: Both business-to-business and business-to-consumer e-commerce are becoming ever more important for us. |
| - | E-government: Our customer base includes a significant number of government organizations and we continue to experience positive growth in this market. This is primarily driven by our e-signature solution, eSignLive. |
Our channel partners are critical to our success. We serve multiple markets via our two-tier indirect sales channel. We invest in and support our channel with training, marketing and sales support resources. Distributors and resellers get the tools they need to be successful, such as campaigns, case studies, marketing funds and more. We train employees of our resellers and distributors on-site and in our offices.
Backlog
Our backlog at December 31, 2016 was approximately $50 million compared to $51 million at December 31, 2015 and $113 million at December 31, 2014. We do not believe that the specific amount of backlog at any point in time is indicative of the trends in our markets or the expected results of our business. Given the large size of orders, the backlog number can change significantly with the receipt of a new order or modification of an existing order.
Financial Information Relating to Foreign and Domestic Operations
For financial information regarding VASCO, see our Consolidated Financial Statements and the related Notes, which are included in this Annual Report on Form 10-K. We have a single operating segment for all our products and operations. See Note 12 in the Notes to Consolidated Financial Statements for a breakdown of revenue and long-lived assets between U.S. and foreign operations.
Employees
As of December 31, 2016, we had 613 total employees, which included 589 full-time employees. Of the total employees, 358 are located in EMEA (Europe, the Middle East and Africa), 154 in Canada, 66 in the U.S., 31 in Asia Pacific and 4 in Latin America. Of the total employees, 299 were involved in sales, marketing, operations and customer support, 229 in research and development and 85 in general and administration.
RISK FACTORS
You should carefully consider the following risk factors, which we consider the most significant, as well as other information contained in this Annual Report on Form 10-K. In addition, there are a number of less significant and other general risk factors that could affect our future results. If any of the events described in the risk factors were to occur, our business, financial condition or operating results could be materially and adversely affected. We have grouped our Risk Factors under captions that we believe describe various categories of potential risk. For the reader’s convenience, we have not duplicated risk factors that could be considered to be included in more than one category.
12
Table of Contents
Risks Related to Our Business
A significant portion of our sales are to a limited number of customers. The loss of substantial sales to any one of them could have an adverse effect on revenues and profits.
We derive a substantial portion of our revenue from a limited number of customers, many of which are financial institutions. The loss of substantial sales to any one of them could adversely affect our operations and results. In fiscal 2016, 2015, and 2014, our top 10 largest customers contributed 36%, 50%, and 46%, respectively, of total worldwide revenue. In 2015 and 2014, Rabobank contributed 30% and 12%, respectively, of total revenue principally due to an order for card readers incorporating our CrontoSign technology.
In fiscal 2014, HSBC contributed approximately 11% of total worldwide revenue. HSBC has no long term contractual commitment to purchase products or services from us. HSBC and its affiliates only make purchase commitments pursuant to individual purchase orders placed with us from time to time, which are subject to our acceptance. The general commercial framework that applies to such purchases by HSBC may be terminated by HSBC at any time, without cause, on 90 days’ notice to us without payment of any termination charge by HSBC.
The return of a worldwide recession and/or an increase in the concern over the European sovereign debt crisis may further impact our business.
Our business is subject to economic conditions that may fluctuate in the major markets in which we operate. Factors that could cause economic conditions to fluctuate include, without limitation, recession, inflation, deflation, interest rates, unemployment, consumer debt levels, general retail or commercial markets and consumer or business purchasing power or preferences.
While it appears that circumstances that led to the sovereign debt crisis have abated, many significant economic issues have not been addressed fully. As a result, we expect that Europe will continue to face difficult economic conditions in 2017. If global economic and financial market conditions remain uncertain and/or weak for an extended period of time, any of the following factors, among others, could have a material adverse effect on our financial condition and results of operations:
| • | slower consumer or business spending may result in reduced demand for our products, reduced orders from customers for our products, order cancellations, lower revenues, increased inventories, and lower gross margins; |
| • | continued volatility in the global markets and fluctuations in exchange rates for foreign currencies and contracts or purchase orders in foreign currencies could negatively impact our reported financial results and condition; |
| • | continued volatility in the prices for commodities and raw materials we use in our products could have a material adverse effect on our costs, gross margins, and ultimately our profitability; |
| • | restructurings, reorganizations, consolidations and other corporate events could affect our customers’ budgets and buying cycles, particularly in the banking industry; |
| • | if our customers experience declining revenues, or experience difficulty obtaining financing in the capital and credit markets to purchase our products, this could result in reduced orders for our products, order cancellations, inability of customers to timely meet their payment obligations to us, extended payment terms, higher accounts receivable, reduced cash flows, greater expense associated with collection efforts and increased bad debt expense; |
| • | in the event of a contraction of our sales, dated inventory may result in a need for increased obsolescence reserves; |
| • | a severe financial difficulty experienced by our customers may cause them to become insolvent or cease business operations, which could reduce the availability of our products to consumers; and |
13
Table of Contents
| • | any difficulty or inability on the part of manufacturers of our products or other participants in our supply chain in obtaining sufficient financing to purchase raw materials or to finance general working capital needs may result in delays or non-delivery of shipments of our products. |
While we believe that many of the effects of the recession and credit crisis have abated, we are unable to predict potential future economic conditions, disruptions in the sovereign debt markets or other financial markets, the Euro Monetary Union or the European Union, or the effect of any such disruption or disruptions on our business and results of operations, but the consequences may be materially adverse. We believe that our business in the Banking market in Europe would be impacted most directly by any such disruption and that the consequences may be materially adverse, as approximately 52% of our consolidated revenues originated in the EMEA region in 2016.
Disruptions in markets or the European Union may affect our liquidity and capital resources.
We believe our financial resources and current borrowing arrangements are adequate to meet our operating needs. However, disruptions in the sovereign debt markets or other financial markets, the Euro Monetary Union or the European Union, could materially adversely affect our liquidity and capital resources and expose us to additional currency fluctuation risk. Sufficiently adverse effects could cause us to modify our business plans.
Furthermore, in an adverse economic environment there is a risk that customers may delay their orders until the economic conditions improve further. If a significant number of orders are delayed for an indefinite period of time, our revenue and cash receipts may not be sufficient to meet the operating needs of the business. If this is the case, we may need to significantly reduce our workforce, sell certain of our assets, enter into strategic relationships or business combinations, discontinue some or all of our operations, or take other similar restructuring actions. While we expect that these actions would result in a reduction of recurring costs, they also may result in a reduction of recurring revenue and cash receipts. It is also likely that we would incur substantial non-recurring costs to implement one or more of these restructuring actions.
We have had a material weakness in our internal controls over financial reporting in the past and we cannot assure you that additional material weaknesses will not occur in the future, despite our efforts to remediate the identified weakness. If we fail to maintain an effective system of internal control over financial reporting, we may not be able to comply with our periodic reporting obligations, or accurately report the Company’s financial condition, results of operations or cash flows, which may adversely affect investor confidence in the Company and, as a result, the value of the Company’s common stock.
Management determined that the Company’s internal control and procedures over financial reporting as of December 31, 2016 were not effective. The determination was the result of a material weakness in such internal controls at that time related to deficiencies associated with our acquisition of Silanis Technology Inc. in November 2015 and its subsequent operation. This weakness was discovered prior to finalizing our financial statements for the fourth quarter and full year 2016 and did not require us to restate any financial information in this 10K or any prior period reports. Our independent registered public accounting firm, KPMG LLP, has issued an adverse report on the effectiveness of our internal control over financial reporting as of December 31, 2016. See Part II, Item 9A of this Form 10-K for further information.
We cannot assure you that an additional material weakness, or significant deficiencies, in our internal controls will not be identified in the future. Any failure to maintain effective controls, or implement new or improved controls, or any difficulties we encounter in their maintenance or implementation, could result in additional significant deficiencies or material weaknesses, cause us to fail to meet our periodic reporting obligations or result in material misstatements in our financial statements. Any such failure could also adversely affect the results of periodic management evaluations and annual auditor attestation reports regarding the effectiveness of our internal controls, and it could cause errors in our financial statements that could in turn lead
14
Table of Contents
to a restatement of those financial statements. In that event, our investors and customers could lose confidence in the accuracy and completeness of our financial reports, the Company’s financial results could be adversely affected, the market price of the Company’s common stock could decline, and the Company could be subject to sanctions or investigations by NASDAQ, the Securities and Exchange Commission or other regulatory authorities. Failure to remedy any material weakness in the Company’s internal control over financial reporting, or to implement or maintain other effective control systems required of public companies, could also restrict the Company’s future access to the capital markets.
We have a long operating history, but only modest accumulated profit.
Although we have reported net income of $10.5 million, $42.1 million, and $33.5 million for the years ended December 31, 2016, 2015, and 2014, respectively, our retained earnings were only $179 million at December 31, 2016. Over our 25 year operating history, we have operated at a loss for many of those years. In the current uncertain economic environment, it may be difficult for us to sustain our recent levels of profitability. We may also choose to invest for long term value which could decrease or eliminate short term profit.
We derive revenue from a limited number of products and do not have a broadly-diversified product base.
A majority of our revenue is derived from the sale of authentication products. We also anticipate that a substantial portion of our future revenue, if any, will also be derived from these products and related services. If the sale of these products and services is impeded for any reason and we have not diversified our product offerings, our business and results of operations would be negatively impacted. This includes a diversification from hardware products to software solutions and related services; which transformation, if not successfully executed, could lead to reduced revenue.
The sales cycle for our products and technology is long, and we may incur substantial expenses for sales that do not occur when anticipated.
The sales cycle for our products, which is the period of time between the identification of a potential customer and completion of the sale, is typically lengthy and subject to a number of significant risks over which we have little control. If revenue falls significantly below anticipated levels, our business would be seriously harmed.
A typical sales cycle in the Banking market is often six months or more. Larger Banking transactions may take up to 18 months or more. Purchasing decisions for our products and systems may be subject to delays due to many factors that are not within our control, such as:
| • | The time required for a prospective customer to recognize the need for our products; |
| • | The significant expense of many data security products and network systems; |
| • | Customers’ internal budgeting processes; and |
| • | Internal procedures customers may require for the approval of large purchases. |
As our operating expenses are based on anticipated revenue levels, a small fluctuation in the timing of sales can cause our operating results to vary significantly between periods.
We have a great dependence on a limited number of suppliers and the loss of their manufacturing capability could materially impact our operations.
In the event that the supply of components or finished products is interrupted or relations with any of our principal vendors is terminated, there could be increased costs and considerable delay in finding suitable
15
Table of Contents
replacement sources to manufacture our products. The majority of our products are manufactured by four independent vendors domiciled in Hong Kong and Macau. Our hardware DIGIPASSES are assembled at facilities in mainland China. The importation of these products from China exposes us to the possibility of product supply disruption and increased costs in the event of changes in the policies of the Chinese government, political unrest or unstable economic conditions in China or developments in the United States or European Union that are adverse to trade, including enactment of protectionist legislation.
We order processors well in advance of expected use and produce finished goods prior to the receipt of customer orders. If orders are not received, we could suffer losses related to the write down or write off of inventory that cannot be sold at full value.
In an attempt to minimize the risk of not having an adequate supply of component parts to meet demand, especially in situations where we have been notified that key processors will no longer be manufactured, we sometimes purchase multiple years’ supply of processors based on internal forecasts of demand. In addition, to meet customers’ demands for accelerated delivery of product, we sometimes produce finished product for existing customers before we receive the executed order from the customer. Should our forecasts of future demand be inaccurate or if we produce product that is never ordered, we could incur substantial losses related to the write down or write off of our inventory.
Our success depends on establishing and maintaining strategic relationships with other companies to develop, market, and distribute our technology and products and, in some cases, to incorporate our technology into their products.
Part of our business strategy is to enter into strategic alliances and other cooperative arrangements with other companies in our industry. We currently are involved in cooperative efforts with respect to the incorporation of our products into products of others, research and development efforts, marketing efforts and reseller arrangements. None of these relationships are exclusive, and some of our strategic partners also have cooperative relationships with certain of our competitors. If we are unable to enter cooperative arrangements in the future or if we lose any of our current strategic or cooperative relationships, our business could be harmed. We do not control the time and resources devoted to such activities by parties with whom we have relationships. In addition, we may not have the resources available to satisfy our commitments, which may adversely affect these relationships. These relationships may not continue, may not be commercially successful, or may require our expenditure of significant financial, personnel and administrative resources from time to time. Further, certain of our products and services compete with the products and services of our strategic partners.
We may not be able to maintain effective product distribution channels, which could result in decreased revenue.
We rely on both our direct sales force and an indirect channel distribution strategy for the sale and marketing of our products. We may be unable to attract distributors, resellers and integrators, as planned, that can market our products effectively and provide timely and cost-effective customer support and service. There is also a risk that some or all of our distributors, resellers or integrators may be acquired, may change their business models or may go out of business, any of which could have an adverse effect on our business. Further, our distributors, integrators and resellers may carry competing lines of products. The loss of important sales personnel, distributors, integrators or resellers could adversely affect us.
We depend on our key personnel for the success of our business and the loss of one or more of our key personnel could have an adverse effect on our ability to manage our business or could be negatively perceived in the capital markets.
Our success and our ability to manage our business depend, in large part, upon the efforts and continued service of our senior management team. The loss of one or more of our key personnel could have a
16
Table of Contents
material adverse effect on our business and operations. It could be difficult for us to find replacements for our key personnel, as competition for such personnel is often intense. Further, such a loss could be negatively perceived in the capital markets, which could reduce the market value of our securities.
If we fail to continue to attract and retain qualified personnel, our business may be harmed.
Our future success depends upon our ability to continue to attract and retain highly qualified technical, sales and managerial personnel. Competition for such personnel is often intense and there can be no assurance that we can attract other highly qualified personnel in the future. If we cannot retain or are unable to hire such key personnel, our business, financial condition and results of operations could be significantly adversely affected.
Changes in our effective tax rate may have an adverse effect on our results of operations.
Our future effective tax rates may be adversely affected by a number of factors including the distribution of income among the various countries in which we operate, changes in the valuation of our deferred tax assets, increases in expenses not deductible for tax purposes, including the impairment of goodwill in connection with acquisitions, changes in share-based compensation expense, and changes in tax laws or the interpretation of such tax laws and changes in generally accepted accounting principles. Any significant increase in our future effective tax rates could adversely impact net income for future periods; and a reduction in our U.S. tax rate could negatively impact our deferred tax assets which could also adversely impact our net income.
Our worldwide income tax provisions and other tax accruals may be insufficient if any taxing authorities assume taxing positions that are contrary to our positions.
Significant judgment is required in determining our provision for income taxes and other taxes such as sales and VAT taxes. There are many transactions for which the ultimate tax outcome is uncertain. Some of these uncertainties arise as a consequence of intercompany agreements to purchase intellectual properties, allocate revenue and costs, and other factors, each of which could ultimately result in changes once the arrangements are reviewed by taxing authorities. Although we believe that our approach to determining the amount of such arrangements is reasonable, we cannot be certain that the final tax authority review of these matters will not differ materially from what is reflected in our historical income tax provisions and other tax accruals. Such differences could have a material effect on our income tax provisions or benefits, or other tax accruals, in the period in which such determination is made, and consequently, on our results of operations for such period.
Changes in global tax laws or in their interpretation or enforcement, could have a material adverse effect on our effective tax rate, results of operations, cash flows and financial condition.
We are subject to taxes in numerous jurisdictions. We calculate and provide for taxes in each tax jurisdiction in which we operate. Tax accounting often involves complex matters and requires our judgment to determine our worldwide provision for income taxes and other tax liabilities. We may be subject to ongoing audits, investigations and tax proceedings in various jurisdictions. Tax authorities may disagree with our judgments, or may take increasingly aggressive positions opposing the judgments we make, including with respect to our intercompany transactions. We regularly assess our judgments to determine the appropriateness of our tax liabilities. However, our judgments might not be sustained as a result of audits, investigations and tax proceedings, and the amounts ultimately paid could be materially different from the amounts previously recorded. In addition, our effective tax rate in the future could be adversely affected by the expiration of current tax benefits, changes in the mix of earnings in countries with differing statutory tax rates, challenges to our intercompany transactions, changes in the valuation of deferred tax assets and liabilities and changes in tax laws or in their interpretation or enforcement. Tax rates in the jurisdictions in which we operate may change as a result of macroeconomic or other factors outside of our control. In addition, changes in tax laws, treaties or regulations, or their interpretation or enforcement, have become more unpredictable and may become more stringent, which could materially adversely affect our tax position.
17
Table of Contents
We have operations and sales in a number of European countries, with our international headquarters and legal entity located in Switzerland. The overall tax environment has made it increasingly challenging for multinational corporations like us to operate with certainty about taxation in many jurisdictions. For example, the European Commission has been conducting investigations, focusing on whether local country tax rulings or tax legislation provide preferential tax treatment that violates European Union state aid rules. In addition, the Organization for Economic Cooperation and Development, 13 Table of Contents which represents a coalition of member countries, is supporting changes to numerous long-standing tax principles through its base erosion and profit shifting project, which is focused on a number of issues, including the shifting of profits among affiliated entities located in different tax jurisdictions. Furthermore, a number of countries where we do business, including the United States and many countries in the European Union, are considering changes in relevant tax, accounting and other laws, regulations and interpretations, including changes to tax laws applicable to multinational corporations. The increasingly complex global tax environment could have a material adverse effect on our effective tax rate, results of operations, cash flows and financial condition. Although we expect to be able to rely on tax treaties between and among the United States, Switzerland and other countries where we operate, legislative or diplomatic action could be taken, or the treaties may be amended in such a way, that would prevent us from being able to rely on such treaties. Our inability to rely on the treaties would subject us to increased taxation or significant additional expense. In addition, congressional proposals could change the definition of a U.S. person for U.S. federal income tax purposes, which could also subject us to increased taxation. In addition, we could be materially adversely affected by future changes in tax law or policy (or in their interpretation or enforcement) in Switzerland or other jurisdictions where we operate. These changes could be exacerbated by economic, budget or other challenges facing the United States, Switzerland or these other jurisdictions.
Any acquisitions we make could disrupt our business and harm our financial condition or results.
We may make investments in complementary companies, products or technologies. Should we do so, our failure to successfully structure or manage the acquisitions could seriously harm our financial condition or operating results. The expected benefits of any acquisition may not be realized. In connection with our acquisition of eSignLive and any future purchases, we will face additional financial and operational risks, including:
| • | Difficulty in assimilating the operations, technology and personnel of acquired companies; |
| • | Disruption in our business because of the allocation of resources to consummate these transactions and the diversion of management’s attention from our existing business; |
| • | Difficulty in retaining key technical and managerial personnel from acquired companies; |
| • | Dilution of our stockholders, if we issue equity to fund these transactions; |
| • | Reduced liquidity, increased debt and higher amortization expenses; |
| • | Assumption of operating losses, increased expenses and liabilities; |
| • | Our relationships with existing employees, customers and business partners may be weakened or terminated as a result of these transactions; |
| • | Discovery of unanticipated issues and liabilities; |
| • | Failure to meet expected returns; and |
| • | Difficulty in maintaining financial reporting and internal control processes needed to be compliant with requirements applicable to companies subject to SEC reporting. |
Reported revenue may fluctuate widely due to the interpretation or application of accounting rules.
Our sales arrangements often include multiple elements, including hardware, services, software, maintenance and support. In addition, we have sold software related arrangements in multiple forms, including perpetual licenses, term based licenses and software-as-a-service, each of which may be treated differently under accounting rules. The accounting rules for such arrangements are complex and subject to change from time to time. Small changes in circumstances could cause wide deviations in the timing of reported revenue.
18
Table of Contents
Provisions in various agreements potentially expose us to substantial liability for intellectual property infringement and other losses.
Our agreements with customers, solution partners and channel partners generally include provisions under which we agree to indemnify them for losses suffered or incurred as a result of claims of intellectual property infringement and, in some cases, for damages caused by us to property or persons or for other damages. In addition, we make certain representations and warranties and incur obligations under our contracts in the ordinary course of business, including for items related to data security and potential data breaches. Large indemnity payments or damages resulting from our contractual obligations could harm our business, operating results and financial condition.
The evolution of our business requires more complex development, management and go-to-market strategies, which involve significant risk.
Our increasing focus on developing and marketing a platform of solutions for identity management, authentication, risk analysis, digital processes and related areas requires different and more complex development, management and go-to-market strategies than our historic hardware authentication business alone. We are developing, buying and licensing technology weighted toward software solutions requiring additional skills and investment in research, development, product management and senior management. This transformation strategy is currently in progress and brings with it significant risks related to our choice of solutions to pursue and our ability to execute the strategy successfully. This strategy requires a greater focus on marketing and selling product suites and software solutions rather than selling hardware products for authentication and transaction signing. Consequently, we are developing, and must continue to develop, new strategies for marketing and selling our offerings. In addition, marketing and selling new technologies to enterprises requires significant investment of time and resources in order to train our employees and educate our customers on the benefits of our new product offerings. These investments can be costly and the additional effort required to educate both customers and our own sales force can distract from their efforts to sell existing products and services.
Risks Related to the Market
We face significant competition and if we lose or fail to gain market share our financial results will suffer.
The market for data security products and services is highly competitive. Our competitors include organizations that provide data security products based upon approaches similar to and different from those that we employ. Many of our competitors have significantly greater financial, marketing, technical and other competitive resources than we do. As a result, our competitors may be able to adapt more quickly to new or emerging technologies and changes in customer requirements, or to devote greater resources to the promotion and sale of their products.
A decrease of average selling prices for our products and services could adversely affect our business.
The average selling prices for our solution offerings may decline as a result of competitive pricing pressures or a change in our mix of products, software and services. In addition, competition continues to increase in the market segments in which we participate and we expect competition to further increase in the future, thereby leading to increased pricing pressures. Furthermore, we anticipate that the average selling prices and gross profits for our products will decrease over product life cycles. To maintain or realize our revenue and gross margins, we must continue to develop, or purchase and introduce new products and services that incorporate new technologies or increased functionality. If we experience such pricing pressures or fail to deliver new products and services relevant to our markets, then our revenue and gross margins could decline, which could harm our business, financial condition and results of operations.
19
Table of Contents
We may need additional capital in the future and our failure to obtain capital would interfere with our growth strategy.
Our ability to obtain financing will depend on a number of factors, including market conditions, our operating performance and investor or creditor interest. These factors may make the timing, amount, terms and conditions of any financing unattractive. They may also result in our incurring additional indebtedness or accepting stockholder dilution. If adequate funds are not available or are not available on acceptable terms, we may have to forego strategic acquisitions or investments, defer our product development activities, or delay the introduction of new products.
We experience variations in quarterly operating results and sales are subject to seasonality, both of which may result in a volatile stock price.
In the future, as in the past, our quarterly operating results may vary significantly, resulting in a volatile stock price. Factors affecting our operating results include:
| • | The level of competition; |
| • | The size, timing, cancellation or rescheduling of significant orders; |
| • | New product announcements or introductions by competitors; |
| • | Technological changes in the market for data security products including the adoption of new technologies and standards; |
| • | Changes in pricing by competitors; |
| • | Our ability to develop, introduce and market new products and product enhancements on a timely basis, if at all; |
| • | Component costs and availability; |
| • | Achievement of significant market share in particular markets followed by declines as buying cycles tend to be multiple years apart; |
| • | The variability of revenue realized from individual customers as their buying patterns often vary significantly from period to period; |
| • | Our success in expanding our sales and marketing programs; |
| • | Market acceptance of new products and product enhancements; |
| • | Changes in foreign currency exchange rates; and |
| • | General economic conditions in the countries in which we operate. |
We also experience seasonality in all markets. These seasonal trends are most notable in the summer months, particularly in Europe, when many businesses defer purchase decisions.
Our stock price may be volatile for reasons other than variations in our quarterly operating results.
The market price of our common stock may fluctuate significantly in response to factors, some of which are beyond our control, including the following:
| • | Actual or anticipated fluctuations in our quarterly or annual operating results; |
| • | Differences between actual operating results and results estimated by analysts that follow our stock and provide estimates of our results to the market; |
| • | Differences between guidance relative to financial results, if given, and actual results; |
| • | Changes in market valuations of other technology companies; |
20
Table of Contents
| • | Announcements by us or our competitors of significant technical innovations, contracts, acquisitions, strategic partnerships, joint ventures or capital commitments; |
| • | Additions or departures of key personnel; |
| • | Future sales of common stock; |
| • | Trading volume fluctuations; and |
| • | Reactions by investors to uncertainties in the world economy and financial markets. |
A small group of persons control a substantial amount of our common stock and could delay or prevent a change of control.
Our Board of Directors, our officers and their immediate families and related entities beneficially own approximately 24%, with Mr. T. Kendall Hunt beneficially owning approximately 23%, of the outstanding shares of our common stock. As the Chairman of the Board of Directors, Chief Executive Officer and our largest stockholder, Mr. Hunt may exercise substantial control over our future direction and operations and such concentration of control may have the effect of discouraging, delaying or preventing a change in control and may also have an adverse effect on the market price of our common stock.
Certain provisions of our charter and of Delaware law make a takeover of our company more difficult.
Our corporate charter and Delaware law contain provisions, such as a class of authorized but unissued preferred stock which may be issued by our board without stockholder approval that might enable our management to resist a takeover of our company. Delaware law also limits business combinations with interested stockholders. These provisions might discourage, delay or prevent a change in control or a change in our management. These provisions could also discourage proxy contests, and make it more difficult for stockholders to elect directors and take other corporate actions. The existence of these provisions could limit the price that investors might be willing to pay in the future for shares of our common stock.
Future issuances of blank check preferred stock may reduce voting power of common stock and may have anti-takeover effects that could prevent a change in control.
Our corporate charter authorizes the issuance of up to 500,000 shares of preferred stock with such designations, rights, powers and preferences as may be determined from time to time by our Board of Directors, including such dividend, liquidation, conversion, voting or other rights, powers and preferences as may be determined from time to time by the Board of Directors without further stockholder approval. The issuance of preferred stock could adversely affect the voting power or other rights of the holders of common stock. In addition, the authorized shares of preferred stock and common stock could be utilized, under certain circumstances, as a method of discouraging, delaying or preventing a change in control.
Risks Related to Technology and Intellectual Property
Technological changes occur rapidly in our industry and our development of new products is critical to maintain our revenue.
The introduction by our competitors of products embodying new technologies and the emergence of new industry standards could render our existing products obsolete and unmarketable. Our future revenue growth and operating profit will depend in part upon our ability to enhance our current products and develop innovative products to distinguish ourselves from the competition and to meet customers’ changing needs in the data security industry. This also includes our ability to manage our mix of hardware and software based products, as well as develop and maintain a platform of solutions relevant to our markets. Security-related product developments and technology innovations by others may adversely affect our competitive position and we may not successfully anticipate or adapt to changing technology, industry standards or customer requirements on a timely basis.
21
Table of Contents
Our business could be negatively impacted by cyber security incidents and other disruptions.
Our use of technology is increasing and is critical in three primary areas of our business:
| 1. | Software and information systems that we use to help us run our business more efficiently and cost effectively; |
| 2. | The products we have traditionally sold and continue to sell to our customers for integration into their software applications contain technology that incorporates the use of secret numbers and encryption technology; and |
| 3. | Solutions delivered on a software-as-a-service basis, from both public and private cloud models, which may process and store confidential, personal, health and financial information of our employees and customers. |
A cyber incident in any of these areas of our business could disrupt our ability to take orders or deliver products or services to our customers, cause us to suffer significant monetary and other losses and significant reputational harm, or substantially impair our ability to grow the business. We expect that there are likely to be hacking attempts intended to impede the performance of our products, disrupt our services and harm our reputation as a company, as the processes used by computer hackers to access or sabotage technology products, services and networks are rapidly evolving in sophistication.
In July 2011, we experienced a cyber incident related to DigiNotar B.V. See Part I. Item 3 – Legal Proceedings, Part II. Item 7 – Management’s Discussion and Analysis of Financial Condition and Results of Operations for a description of the hacking incident at DigiNotar B.V., the termination of DigiNotar B.V’s registration as a certification service provider and DigiNotar B.V.’s bankruptcy. See Part I. Item 3 – Legal Proceedings for a description of legal proceedings related to the cyber security incident at DigiNotar B.V. We may incur additional losses from discontinued operations resulting from these events as a result of unanticipated costs associated with DigiNotar B.V.’s bankruptcy and potential claims that may arise in connection with the hacking incidents.
Our products contain third-party, open-source software and failure to comply with the terms of the underlying open-source software licenses could restrict our ability to sell our products or otherwise result in claims of infringement.
Our products are distributed with software programs licensed to us by third-party authors under “open-source” licenses, which may include the GNU General Public License, the GNU Lesser Public License, the BSD License and the Apache License. These open-source software programs include, without limitation, Linux, Apache, Openssl, IPTables, Tcpdump, Postfix, Cyrus, Perl, Squid ,Snort, Ruby, Rails, PostgreSQL, MongoDB and Puppet. These third-party, open-source programs are typically licensed to us for no fee and the underlying license agreements generally require us to make available to users the source code for such programs, as well as the source code for any modifications or derivative works we create based on these third-party, open-source software programs.
We do not believe that we have created any modifications or derivative works to, an extended version of, or works based on, any open-source software programs referenced above. We include instructions to users on how to obtain copies of the relevant open-source code and licenses.
We do not provide end users a copy of the source code to our proprietary software because we believe that the manner in which our proprietary software is aligned or communicates with the relevant open-source programs does not create a modification, derivative work or extended version of, or a work based on, that open-source program requiring the distribution of our proprietary source code.
22
Table of Contents
Our ability to commercialize our products by incorporating third-party, open-source software may be restricted because, among other reasons:
| • | the terms of open-source license agreements are unclear and subject to varying interpretations, which could result in unforeseen obligations regarding our proprietary products or claims of infringement; |
| • | it may be difficult to determine the developers of open-source software and whether such licensed software infringes another party’s intellectual property rights; |
| • | competitors will have greater access to information by obtaining these open source products, which may help them develop competitive products; and |
| • | open-source software potentially increases customer support costs because licensees can modify the software and potentially introduce errors. |
We must continue to attract and retain highly skilled technical personnel for our research and development efforts.
The market for highly skilled technicians is highly competitive. If we fail to attract, train, assimilate and retain qualified technical personnel for our research and development and product management efforts, we will experience delays or failures in introductions of new or modified products, and services, failures in adequate analysis of technology or acquisitions in the market, loss of clients and market share and a reduction in revenue.
We cannot be certain that our research and development activities will be successful.
While management is committed to enhancing our current product offerings and introducing new products, we cannot be certain that our research and development activities will be successful. Furthermore, we may not have sufficient financial resources to identify and develop new technologies and bring new products to market in a timely and cost effective manner, and we cannot ensure that any such products will be commercially successful if and when they are introduced.
Failure to effectively manage our product and service lifecycles could harm our business.
As part of the natural lifecycle of our products and services, we periodically inform customers that products or services will be reaching their end of life or end of availability and will no longer be supported or receive updates and security patches. Failure to effectively manage our product and service lifecycles could lead to customer dissatisfaction and contractual liabilities, which could adversely affect our business and operating results.
SaaS offerings, which involve various risks, constitute an important part of our business.
As we continue to acquire, develop and offer SaaS versions of products, we will need to continue to evolve our processes to meet a number of regulatory, intellectual property, contractual and service compliance challenges. These challenges include compliance with licenses for open source and third party software embedded in our SaaS offerings, maintaining compliance compliance with export control and privacy regulations, including HIPAA, protecting our services from external threats, maintaining the continuous service levels and data security expected by our customers, preventing the inappropriate use of our services and adapting our go-to-market efforts. In addition to using our internal resources, we also utilize third party resources to deliver SaaS offerings, such as third party data hosting vendors. The failure of a third party provider to prevent service disruptions, data losses or security breaches may require us to issue credits or refunds or indemnify or otherwise be liable to customers or third parties for damages that may occur. Additionally, if these third-party providers fail to deliver on their obligations, our reputation could be damaged, our customers could lose confidence in us and our ability to maintain and expand our SaaS offerings. Finally, our SaaS offerings need to
23
Table of Contents
designed to operate at significant transaction volumes. When combined with third party software and hosting infrastructure, our SaaS offerings may not perform as designed which could lead to service disruptions and associated damages.
We depend significantly upon our proprietary technology and intellectual property and the loss of or the successful challenge to our proprietary rights could require us to divert management attention and could reduce revenue and increase our operating costs.
From time to time, we receive claims that we have infringed the intellectual property rights of others, including claims regarding patents, copyrights, and trademarks. Because of constant technological change in the segments in which we compete, the extensive patent coverage of existing technologies, and the rapid rate of issuance of new patents, it is possible that the number of these claims may grow. In addition, former employers of our former, current, or future employees may assert claims that such employees have improperly disclosed to us the confidential or proprietary information of these former employers. Any such claim, with or without merit, could result in costly litigation and distract management from day-to-day operations. If we are not successful in defending such claims, we could be required to stop selling, delay shipments of, or redesign our products, pay monetary amounts as damages, enter into royalty or licensing arrangements, or satisfy indemnification obligations that we have with our customers. We cannot assure you that any royalty or licensing arrangements that we may seek in such circumstances will be available to us on commercially reasonable terms or at all. We have made and expect to continue making significant expenditures to establish our intellectual property rights and to investigate, defend and settle claims related to the use of technology and intellectual property rights as part of our strategy to manage this risk. In addition, we license and use software from third parties in our business. These third party software licenses may not continue to be available to us on acceptable terms or at all, and may expose us to additional liability. This liability, or our inability to use any of this third party software, could result in shipment delays or other disruptions in our business that could materially and adversely affect our operating results.
We rely principally on trade secrets to protect much of our intellectual property in cases where we do not believe that patent protection is appropriate or obtainable. However, trade secrets are difficult to protect. Although our employees are subject to confidentiality obligations, this protection may be inadequate to deter or prevent misappropriation of our confidential information. We may be unable to detect unauthorized use of our intellectual property or otherwise take appropriate steps to enforce our rights. Failure to obtain or maintain trade secret protection could adversely affect our competitive business position. If we are unable to prevent third parties from infringing or misappropriating our copyrights, trademarks or other proprietary information, our competitive position could be adversely affected. In the course of conducting our business, we may inadvertently infringe the intellectual property rights of others, resulting in claims against us or our customers. Our contracts generally indemnify our customers for third-party claims for intellectual property infringement by the services and products we provide. The expense of defending these claims may adversely affect our financial results.
Our patents may not provide us with competitive advantages.
We hold several patents in the United States and in other countries, which cover multiple aspects of our technology. The majority of our patents cover the DIGIPASS product line. These patents expire between 2021 and 2035. We do not believe patents expiring in 2017 will affect revenues, profitability, or increase competition. In addition to the issued patents, we also have several patents pending in the United States, Europe and other countries. There can be no assurance that we will continue to develop proprietary products or technologies that are patentable, that any issued patent will provide us with any competitive advantages or will not be challenged by third parties, or that patents of others will not hinder our competitive advantage. For example, our CRONTO patent in Europe was successfully challenged by third parties. This decision has been appealed and the patent remains currently in force, for several more years we believe. However, we may lose our appeals, which could have a significant negative effect on the amount of revenue that we derive related to our CRONTO technology. Although certain of our security token technologies are patented, there are other organizations that offer token-type password generators incorporating challenge-response or response-only approaches that employ different technological solutions and compete with us for market share.
24
Table of Contents
We are subject to warranty and product liability risks.
A malfunction of or design defect in our products which results in a breach of a customer’s data security or physical harm or damage from our hardware products could result in tort or warranty claims against us. We seek to reduce the risk of these losses by attempting to negotiate warranty disclaimers and liability limitation clauses in our sales agreements. However, these measures may ultimately prove ineffective in limiting our liability for damages.
In addition to any monetary liability for the failure of our products, an actual or perceived breach of network or data security at one of our customers could adversely affect the market’s perception of us and our products, and could have an adverse effect on our reputation and the demand for our products. Similarly, an actual or perceived breach of network or data security within our own systems could damage our reputation and have an adverse effect on the demand for our products.
There is significant government regulation of technology exports and to the extent we cannot meet the requirements of the regulations we may be prohibited from exporting some of our products, which could negatively impact our revenue.
Our international sales and operations are subject to risks such as the imposition of government controls, new or changed export license requirements, restrictions on the export of critical technology, trade restrictions and changes in tariffs. If we become unable to obtain foreign regulatory approvals on a timely basis our business in those countries would no longer exist and our revenue would decrease dramatically. Certain of our products are subject to export controls under U.S. law. The list of products and countries for which export approval is required, and the regulatory policies with respect thereto, may be revised from time to time and our inability to obtain required approvals under these regulations could materially and adversely affect our ability to make international sales. Violations of export control and international trade laws could result in penalties, fines, adverse reputational consequences, and other materially adverse consequences. Reference is made to Part 1, Item 3, Legal Proceedings of this Form 10-K with respect to the internal investigation regarding sales of VASCO products by a VASCO European subsidiary to a third party distributor which distributor may have resold such products to Iranian entities.
We employ cryptographic technology in our authentication products that uses complex mathematical formulations to establish network security systems.
Many of our products are based on cryptographic technology. With cryptographic technology, a user is given a key that is required to encrypt and decode messages. The security afforded by this technology depends on the integrity of a user’s key and in part on the application of algorithms, which are advanced mathematical factoring equations. These codes may eventually be broken or become subject to government regulation regarding their use, which would render our technology and products less effective. The occurrence of any one of the following could result in a decline in demand for our technology and products:
| • | Any significant advance in techniques for attacking cryptographic systems, including the development of an easy factoring method or faster, more powerful computers; |
| • | Publicity of the successful decoding of cryptographic messages or the misappropriation of keys; and |
| • | Increased government regulation limiting the use, scope or strength of cryptography. |
25
Table of Contents
Risks Related to International Operations
We face a number of risks associated with our international operations, any or all of which could result in a disruption in our business and a decrease in our revenue.
In 2016, approximately 88% of our revenue and approximately 73% of our operating expenses were generated/incurred outside of the U.S. In 2015, approximately 95% of our revenue and approximately 65% of our operating expenses were generated/incurred outside of the U.S. A severe economic decline in any of our major foreign markets could adversely affect our results of operations and financial condition.
In addition to exposures to changes in the economic conditions of our major foreign markets, we are subject to a number of risks any or all of which could result in a disruption in our business and a decrease in our revenue. These include:
| • | Inconsistent regulations and unexpected changes in regulatory requirements; |
| • | Export controls relating to our technology; |
| • | Difficulties and costs of staffing and managing international operations, including maintaining internal controls; |
| • | Potentially adverse tax consequences; |
| • | Wage and price controls or protection; |
| • | Uncertain protection for intellectual property rights, contractual rights and collecting accounts receivable; |
| • | Imposition of trade barriers; |
| • | Differing technology standards; |
| • | Uncertain demand for electronic commerce; |
| • | Linguistic and cultural differences; |
| • | A widely distributed workforce; |
| • | Difficulty in providing support and training to customers in certain international locations; |
| • | Political instability; and |
| • | Social unrest. |
We are subject to foreign exchange fluctuations and risks, and improper management of that risk could result in large cash losses.
Because a significant number of our principal customers are located outside the United States, we expect that international sales will continue to generate a significant portion of our total revenue. We are subject to foreign exchange fluctuations and risks because the majority of our product costs are denominated in U.S. Dollars, whereas a significant portion of the sales and expenses of our foreign operating subsidiaries are denominated in various foreign currencies. A decrease in the value of any of these foreign currencies relative to the U.S. Dollar could adversely affect our revenue and profitability in U.S. Dollars of our products sold in these markets. We do not currently hold forward exchange contracts to exchange foreign currencies for U.S. Dollars to offset currency rate fluctuations.
We must comply with governmental regulations setting environmental standards.
Governmental regulations setting environmental standards influence the design, components or operation of our products. New regulations and changes to current regulations are always possible and, in some
26
Table of Contents
jurisdictions, regulations may be introduced with little or no time to bring related products into compliance with these regulations. Our failure to comply with these regulations may prevent us from selling our products in a certain country. In addition, these regulations may increase our cost of supplying the products by forcing us to redesign existing products or to use more expensive designs or components. In these cases, we may experience unexpected disruptions in our ability to supply customers with products, or we may incur unexpected costs or operational complexities to bring products into compliance. This could have an adverse effect on our revenues, gross profit margins and results of operations and increase the volatility of our financial results.
We are subject to the Restriction on the Use of Hazardous Substances Directive 2002/95/EC (also known as the “RoHS Directive”) and the Waste Electrical and Electronic Equipment Directive (also known as the “WEEE Directive”). These directives restrict the distribution of products containing certain substances, including lead, within applicable geographies and require a manufacturer or importer to recycle products containing those substances.
These directives affect the worldwide electronics and electronics components industries as a whole. If we or our customers fail to comply with such laws and regulations, we could incur liabilities and fines and our operations could be suspended.
The “Brexit” vote in the United Kingdom may affect our European operations.
The “Brexit” vote in June 2016, and the perceptions related thereto, regarding the withdrawal of the United Kingdom from the European Union may adversely affect business activity, political stability, and economic conditions in the United Kingdom, the European Union, and elsewhere. Negotiations on withdrawal and post-exit arrangements likely will be complex and protracted, and there can be no assurance regarding the terms, timing, or consummation of any such arrangements. The proposed withdrawal could adversely affect the tax, currency, operational, legal, and regulatory regimes to which our businesses in the region are subject. Although we do not have a substantial portion of our operations in, nor derive a substantial portion of our revenue from, the United Kingdom, we do have substantial operations and revenue in the European Union. The United Kingdom withdrawal could disrupt the free movement of goods, services, and people between the United Kingdom and the European Union and significantly disrupt trade between the United Kingdom and the European Union and other parties. There can be no assurance that any or all of these events will not have a material adverse effect on our business, financial condition, and operating results.
We or our suppliers may be impacted by new regulations related to climate change.
In addition to the European environmental regulations noted above, we or our suppliers may become subject to new laws enacted with regards to climate change. In the event that new laws are enacted or current laws are modified in countries in which we or our suppliers operate, our flow of product may be impacted and/or the costs of handling the potential waste associated with our products may increase dramatically, either of which could result in a significant negative impact on our ability to operate or operate profitably.
The effects of regulations relating to conflict minerals may adversely affect our business.
The Dodd-Frank Wall Street Reform and Consumer Protection Act contains provisions to improve transparency and accountability concerning the supply of certain minerals and derivatives ( collectively “Conflict Minerals”) which may originate from the conflict zones of the Democratic Republic of Congo (DRC) and adjoining countries (collectively, “Covered Countries”). As a result, in August 2012 the SEC established annual disclosure and reporting requirements for companies using Conflict Minerals in their products, including products manufactured by third parties. Like many electronic devices, our hardware products contain Conflict Minerals and are subject to the disclosure and reporting requirements. Compliance with these rules also requires due diligence including country of origin inquiries to determine the sources of Conflict Minerals used in our products.
27
Table of Contents
As required, we filed our annual reports related to products manufactured in calendar 2015, 2014 and 2013. We reported that we determined we had no reason to believe Conflict Minerals used in our products may have originated in Covered Countries.
We may incur costs associated with complying with these disclosure requirements. These requirements may affect pricing, sourcing and availability of Conflict Minerals used to produce our devices. We may be unable to verify the origin of all Conflict Minerals in our products. We may encounter challenges with customers and stakeholders if we are unable to certify that our products are conflict free.
U.S. investors may have difficulties in making claims for any breach of their rights as holders of shares because some of our assets and executives are not located in the United States.
Several of our executives and key employees are full-time or part-time residents of foreign countries, and a substantial portion of our assets and those of some of our executives and key employees are located in foreign countries. As a result, it may not be possible for investors to effect service of process on those persons located in foreign countries, or to enforce judgments against some of our executives and key employees based upon the securities or other laws of jurisdictions in those foreign countries.
Our business in countries with a history of corruption and transactions with foreign governments increase the risks associated with our international activities.
We are subject to the U.S. Foreign Corrupt Practices Act (FCPA), and other laws that prohibit improper payments or offers of payments to foreign governments and their officials and political parties by U.S. and other business entities for the purpose of obtaining or retaining business. We have operations, deal with and make sales to governmental or quasi-governmental customers in countries known to experience corruption, particularly certain countries in the Middle East, Africa, East Asia and South America, and further expansion of our international selling efforts may involve additional regions. Our activities in these countries create the risk of unauthorized payments or offers of payments by one of our employees, consultants, sales agents or channel partners that could be in violation of various laws, including the FCPA and the U.K. Bribery Act, even though these parties are not always subject to our control. Violations of the FCPA may result in severe criminal or civil sanctions, including suspension or debarment from U.S. government contracting, and we may be subject to other liabilities, which could negatively affect our business, operating results and financial condition. Violations of the U.K. Bribery Act may result in severe criminal or civil sanctions and we may be subject to other liabilities which could negatively affect our business operating results and financial condition.
Item 1B - Unresolved Staff Comments
None.
Our corporate headquarters is located in Oakbrook Terrace, Illinois. Our international headquarters is in Zurich, Switzerland. Our European operational headquarters is located near Brussels, Belgium. We conduct sales and marketing, research and development and customer support activities from our operational headquarters. Our logistics facility and an additional operations facility are also located in Belgium. In the Netherlands, we have two research and development facilities, one of which also houses a sales office. Additionally, we have research and development facilities in Cambridge, United Kingdom, Bordeaux, France and Vienna, Austria.
We have sales personnel in our offices near Boston, Massachusetts, Sydney, Australia, Singapore, Beijing, China, Tokyo, Japan, Mumbai, India, Sao Paulo, Brazil, Dubai, Zurich, Switzerland, Oakbrook Terrace, Illinois, and London, United Kingdom, and conduct sales activities through liaison offices and agents in other locations.
28
Table of Contents
During 2015, we acquired Silanis Technology, Inc. with offices in Montreal, Canada.
All of our properties are leased. We believe these facilities are adequate for our present growth plans.
In addition to the legal matters described below, we are, from time to time, involved in routine legal matters incidental to the conduct of our business, including legal matters such as to protect our intellectual property rights and resolve employment claims. We believe that the ultimate resolution of any such current routine matter will not have a material adverse effect on our continued financial position, results of operations or cash flows.
On January 10, 2011, we purchased our wholly-owned subsidiary, DigiNotar B.V., a private company organized and existing in The Netherlands from the shareholders (“Sellers”). On September 19, 2011, DigiNotar B.V. filed a bankruptcy petition under Article 4 of the Dutch Bankruptcy Act in the Haarlem District Court, The Netherlands. On September 20, 2011, the court declared DigiNotar B.V. bankrupt and appointed a bankruptcy trustee and a bankruptcy judge to manage all affairs of DigiNotar B.V. through the bankruptcy process. The trustee took over management of DigiNotar B.V.’s business activities and is responsible for the administration and liquidation of DigiNotar B.V. In connection with the bankruptcy of DigiNotar B.V., subsequent to September 20, 2011, a number of claims and counter-claims were filed with the courts in The Netherlands (collectively, the “Court”) related to discontinued assets and discontinued liabilities and other available remedies.
On July 30, 2014, the Court issued a judgment in favor of VASCO for €4,108 ($5,176 at an exchange rate of 1.26 U.S. Dollars per Euro, all amounts in thousands) plus interest related to the Sellers’ failure to achieve earn-out targets established in the purchase agreement, breach of certain representations and warranties under the share purchase agreement and reimbursement of certain costs incurred by VASCO as a result of such breach. The judgment was subject to additional legal proceedings.
In November 2014, all matters with the Sellers related to the sale of DigiNotar B.V. were settled for €2,263 ($2,854 at an exchange rate of 1.26 U.S. Dollars per Euro, all amounts in thousands). The funds were applied first in full satisfaction of the previously recorded contingent consideration due from escrow included in assets of discontinued operations and the remainder of $1,088 recorded as income from discontinued operations net of tax of $108.
In January 2015, we received a notice of potential claim by the trustee against all of the individuals who served as Directors of DigiNotar, both before and after our acquisition of DigiNotar. T. Kendall Hunt, Jan Valcke, and Clifford K. Bown were the Directors of DigiNotar following its purchase by VASCO. The basis for the potential claim from the trustee appears to be based primarily on the same arguments that VASCO presented in its case against the sellers, which were adjudicated in VASCO’s favor. While we believe that we have strong defenses against the threatened claim, we have also notified our provider of director and officer insurance should a claim be filed and we do not expect the resolution of the potential claim to have a material adverse effect on our business, financial condition or results of operations. VASCO is indemnifying Messrs. Hunt, Valcke, and Bown for this matter.
On July 28, 2015 a putative class action complaint was filed in the United States District Court for the Northern District of Illinois, captioned Linda J. Rossbach v. Vasco Data Security International, Inc., et al., case number 1:15-cv-06605, naming VASCO and certain of its current and former executive officers as defendants and alleging violations under the Securities Exchange Act of 1934, as amended. The suit was purportedly filed on behalf of a putative class of investors who purchased VASCO securities between April 28, 2015 and July 28, 2015, and seeks to recover damages allegedly caused by the defendants’ alleged violations of the federal securities laws and to pursue remedies under Sections 10(b) and 20(a) of the Securities Exchange Act of 1934 and Rule 10b-5 promulgated thereunder. The complaint seeks certification as a class action and unspecified compensatory damages plus interest and attorneys’ fees. Pursuant to a September 1, 2015 scheduling order
29
Table of Contents
entered by the court, the lead plaintiff, once appointed, will have sixty days to file an amended complaint or notify the defendants that the lead plaintiff intends to rely on the current complaint. On January 30, 2017, the appointed lead plaintiff filed an amended complaint in which the allegations regarding OFAC related matters were dropped and replaced with allegations regarding public disclosures made by the defendants in April 2015 as compared to public statements made in July 2015, generally regarding the strength of the Company’s business and its future prospects. The defendants have until March 31, 2017 to answer or otherwise respond to the operative complaint. Although the ultimate outcome of litigation cannot be predicted with certainty, the Company believes that this lawsuit is without merit and intends to defend against the action vigorously.
On October 9, 2015, a derivative complaint was filed in the United States District Court for the Northern District of Illinois, captioned Elizabeth Herrera v. Hunt, et al., case number 1:15-cv-08937, naming VASCO’s Board of Directors and certain of its current and former executive officers as individual defendants and the Company as a nominal defendant. Two additional complaints, captioned Beth Seltzer v. Hunt, et al., case number 2015-ch-15541, and William Hooper v. Hunt, et al., case number 2016-ch-04054, were filed on October 22, 2015 and March 22, 2016, respectively, in the Circuit Court of Cook County, Illinois naming the same defendants.
The complaints assert, among other things, that the individual defendants breached their fiduciary duties by making material misstatements in, and omitting material information from, the Company’s public disclosures and by failing to maintain adequate internal controls and properly manage the Company. Among other things, the complaints seek unspecified compensatory damages and injunctive relief. On February 23, 2016, the court in Herrera granted a stay of the action pending the resolution of a certain motion to dismiss that the parties anticipate to be filed in Rossbach. On October 29, 2015, a defendant removed the Seltzer action to the United States District Court for the Northern District of Illinois. Thereafter, the plaintiff led a motion to remand the action back to the Circuit Court of Cook County, Illinois, which was denied on February 3, 2016. On February 9, 2016, the court granted an agreed motion for voluntary dismissal of the Seltzer action, which dismissed the action with prejudice as to the named plaintiff’s individual claims. As for the Hooper action, the court granted a stay on June 8, 2016 on the same terms governing the stay in the Herrera action.
During the second quarter of 2015, our management became aware that certain of our products which were sold by our European subsidiary to a third-party distributor may have been resold by the distributor to parties in Iran, potentially including parties whose property and interests in property may be blocked pursuant to Executive Order 13224, Executive Order 13382 or that may be identified under Section 560.304 of 31 C.F.R. Part 560 as the “Government of Iran”.
We ceased shipping to such distributor. In addition, the Audit Committee of the Company’s Board of Directors initiated an internal review of this matter with the assistance of outside counsel. As a precautionary matter, concurrent initial notices of voluntary disclosure were submitted on June 25, 2015 to each of the U.S. Department of the Treasury, Office of Foreign Assets Control (“OFAC”), and the U.S. Department of Commerce, Bureau of Industry and Security (“BIS”).
The Audit Committee with the assistance of outside counsel has completed their review. On December 15, 2015, we filed a letter with BIS (Office of Export Enforcement) with the conclusion that the products supplied to the distributor were not subject to United States Export Control jurisdiction. The Office of Export Enforcement issued a “no action” letter, concluding the voluntary self-disclosure process under the Export Administration Regulations.
In addition, on January 13, 2016, we filed a letter with OFAC, with the conclusions that VASCO and its subsidiaries made no direct sales to Iran or any party listed by OFAC as a Specially Designated National over the five-year period under review (i.e., June 1, 2010 to June 30, 2015). The letter further noted that the investigation did not identify any involvement on the part of senior management officials of VASCO, and to the contrary, noted that VASCO executive management officials had sought to implement procedures and provided notices to VASCO’s sales personnel to prevent the diversion of VASCO products to unauthorized destinations and end users.
30
Table of Contents
We have not received any response to the letter to OFAC and we cannot predict when OFAC will conclude their review of our voluntary self-disclosures. Based upon the OFAC guidelines for monetary penalties, in the fourth quarter of 2015, we accrued $900 for potential penalties if they are assessed by OFAC. Ultimately no penalty may be assessed or the penalty may be less or greater than the accrual, but in any event we do not believe that the final settlement will have a material adverse impact on our business.
In February 2017, we learned that one of our integrated reseller customers, and certain of its end customers, were named as defendants in a patent infringement lawsuit in Japan related to our CRONTO technology. We have indemnification obligations in favor of our customer and are working with them to defend such suit. We believe we have strong grounds to counterclaim that the plaintiff’s patent is invalid and will defend our technology vigorously. However, the outcome of this suit is uncertain. If the plaintiff were able to succeed in this case and impede our ability to sell, and our customers’ ability to use, products utilizing our CRONTO technology, then such result could have a material adverse impact on our business and results of operations.
Item 4 - Mine Safety Disclosures
Not applicable.
31
Table of Contents
Item 5 - Market for Registrant’s Common Equity, Related Stockholder Matters and Issuer Purchases of Equity Securities
Our common stock, par value $0.001 per share, trades on the NASDAQ Capital Market under the symbol VDSI.
The following table sets forth the range of high and low daily closing prices of our common stock on the NASDAQ Capital Market for the past two years.
| 2016 |
High | Low | ||||||
| Fourth quarter |
$ | 18.44 | $ | 13.50 | ||||
| Third quarter |
19.02 | 15.31 | ||||||
| Second quarter |
18.40 | 15.39 | ||||||
| First quarter |
16.64 | 13.39 | ||||||
| 2015 |
High | Low | ||||||
| Fourth quarter |
$ | 20.82 | $ | 16.64 | ||||
| Third quarter |
29.90 | 15.28 | ||||||
| Second quarter |
34.63 | 21.45 | ||||||
| First quarter |
27.97 | 20.87 | ||||||
On February 17, 2017, there were 68 registered holders and approximately 17,800 street name holders of the company’s common stock.
We have not paid any dividends on our common stock since incorporation. The declaration and payment of dividends will be at the sole discretion of the Board of Directors and subject to certain limitations under the General Corporation Law of the State of Delaware. The timing, amount and form of dividends, if any, will depend, among other things, on the company’s results of operations, financial condition, cash requirements, plans for expansion and other factors deemed relevant by the Board of Directors. The company intends to retain any future earnings for use in its business and therefore does not anticipate paying any cash dividends in the foreseeable future.
Recent Sales of Unregistered Securities
None
Issuer Purchases of Equity Securities
The following table provides information about purchases by the Company of its shares of common stock during the three month period ended December 31, 2016:
| Period |
Total Number of Shares Purchased (1) |
Average Price Paid per Share |
Total Number of Shares Purchased as Part of Publicly Announced Plans or Programs (2) |
Maximum Number of Shares that May Yet Be Purchased Under the Plans or Programs (2) |
||||||||||||
| October 1, 2016 through October 31, 2016 |
1,623 | $ | 17.50 | 0 | 0 | |||||||||||
| November 1, 2016 through November 30, 2016 |
0 | 0 | 0 | 0 | ||||||||||||
| December 1, 2016 through December 31, 2016 |
1,609 | $ | 14.00 | 0 | 0 | |||||||||||
| (1.) | All transactions represent surrender of vested shares in satisfaction of mandatory minimum tax withholdings by grantees under the 2009 Equity Incentive Plan. |
| (2.) | The Company has no publically announced plans or programs to repurchase its shares. |
32
Table of Contents
Stock Performance Graph
The Stock Performance Graph below compares the cumulative total return through December 31, 2016, assuming reinvestment of dividends, by an investor who invested $100.00 on December 31, 2011, in each of (i) our common stock, (ii) the Russell 2000 index, (iii) the Standard Industrial Code Index 3577 – Computer Peripheral Equipment, NEC and (iv) a comparable industry (the peer group) index selected by the company. The peer group for this purpose consists of: American Software Inc., Aspen Technology, Inc., Bottomline Technologies (de), Inc., Broadsoft, Inc., Callidus Software, Inc., Ebix Inc., Ellie Mae, Inc., Fortinet, Inc., Guidance Software, Inc., Imperva, Inc., Interactive Intelligence Group, Inc., Monotype Imaging Holdings, Inc., Progress Software Corp., PROS Holdings, Inc., QAD Inc., Radware Ltd., Rapid7, Inc., Seachange International, Inc., and Telenav, Inc. The stock price performance shown on the graph below is not necessarily indicative of future price performance.
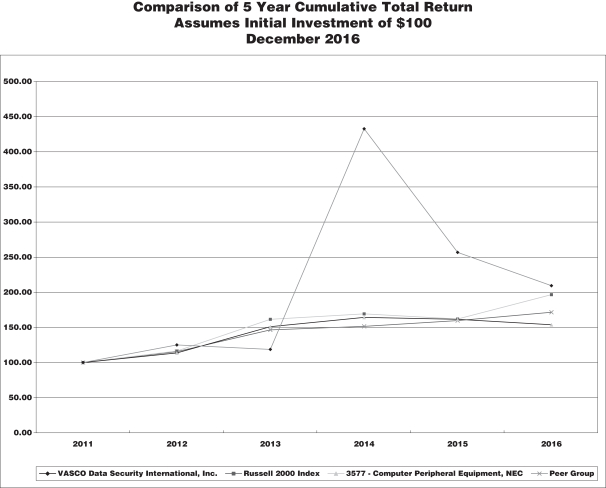
| 2011 | 2012 | 2013 | 2014 | 2015 | 2016 | |||||||||||||||||||
| VASCO Data Security International, Inc. |
100.00 | 125.15 | 118.56 | 432.67 | 256.60 | 209.36 | ||||||||||||||||||
| Russell 2000 Index |
100.00 | 116.35 | 161.52 | 169.42 | 161.95 | 196.45 | ||||||||||||||||||
| 3577 - Computer Peripheral Equipment, NEC |
100.00 | 113.54 | 150.86 | 164.09 | 161.69 | 153.89 | ||||||||||||||||||
| Peer group |
100.00 | 115.40 | 146.22 | 151.24 | 159.82 | 171.43 | ||||||||||||||||||
33
Table of Contents
Item 6 - Selected Financial Data (in thousands, except per share data)
| Year ended December 31, | ||||||||||||||||||||
| 2016 | 2015 | 2014 | 2013 | 2012 | ||||||||||||||||
| Statements of Operations Data: |
||||||||||||||||||||
| Revenue |
$ | 192,304 | $ | 241,443 | $ | 201,537 | $ | 155,047 | $ | 154,029 | ||||||||||
| Operating income from continuing operations |
9,599 | 50,453 | 38,088 | 13,712 | 21,027 | |||||||||||||||
| Net income from continuing operations |
10,561 | 42,194 | 32,611 | 10,967 | 16,229 | |||||||||||||||
| Net income (loss) from discontinued operations |
(47 | ) | (43 | ) | 873 | 180 | (630 | ) | ||||||||||||
| Net income available to common stockholders |
10,514 | 42,151 | 33,484 | 11,147 | 15,599 | |||||||||||||||
| Diluted income from continuing operations per common share |
0.27 | 1.06 | 0.83 | 0.28 | 0.42 | |||||||||||||||
| Diluted income (loss) from discontinued operations per common share |
0.00 | 0.00 | 0.02 | 0.00 | (0.02 | ) | ||||||||||||||
| Diluted net income per common share |
0.27 | 1.06 | 0.85 | 0.28 | 0.40 | |||||||||||||||
| Balance Sheet Data: |
||||||||||||||||||||
| Cash and equivalents |
$ | 49,345 | $ | 78,522 | $ | 137,381 | $ | 98,607 | $ | 106,469 | ||||||||||
| Working capital |
139,199 | 127,675 | 161,029 | 124,538 | 129,487 | |||||||||||||||
| Total assets |
327,270 | 311,822 | 251,338 | 211,877 | 186,506 | |||||||||||||||
| Long term obligations |
2,731 | 8,084 | 268 | 493 | 238 | |||||||||||||||
| Total stockholders equity |
254,579 | 248,048 | 205,873 | 174,278 | 156,320 | |||||||||||||||
| Cash dividends declared per common share |
0 | 0 | 0 | 0 | 0 | |||||||||||||||
34
Table of Contents
Item 7 - Management’s Discussion and Analysis of Financial Condition and Results of Operations
(in thousands, except head count, ratios, time periods and percents)
Unless otherwise noted, references in this Annual Report on Form 10-K to “VASCO”, “company”, “we”, “our”, and “us” refer to VASCO Data Security International, Inc. and its subsidiaries.
Cautionary Note Regarding Forward-Looking Statements
This Annual Report on Form 10-K, including Management’s Discussion and Analysis of Financial Condition and Results of Operations and Quantitative and Qualitative Disclosures About Market Risk contains forward-looking statements within the meaning of Section 21E of the Securities Exchange Act of 1934, as amended and Section 27A of the Securities Act of 1933, as amended concerning, among other things, our expectations regarding the prospects of, and developments and business strategies for, VASCO and our operations, including the development and marketing of certain new products and services and the anticipated future growth in certain markets in which we currently market and sell our products and services or anticipate selling and marketing our products or services in the future. These forward-looking statements (1) are identified by use of terms and phrases such as “expect”, “believe”, “will”, “anticipate”, “emerging”, “intend”, “plan”, “could”, “may”, “estimate”, “should”, “objective”, “goal”, “possible”, “potential”, “projected” and similar words and expressions, but such words and phrases are not the exclusive means of identifying them, and (2) are subject to risks and uncertainties and represent our present expectations or beliefs concerning future events. VASCO cautions that the forward-looking statements are qualified by important factors that could cause actual results to differ materially from those in the forward-looking statements. These additional risks, uncertainties and other factors have been described in greater detail in this Annual Report on Form 10-K and include, but are not limited to, (a) risks of general market conditions, including currency fluctuations and the uncertainties resulting from turmoil in world economic and financial markets, (b) risks inherent to the computer and network security industry, including rapidly changing technology, evolving industry standards, increasingly sophisticated hacking attempts, increasing numbers of patent infringement claims, changes in customer requirements, price competitive bidding, and changing government regulations, and (c) risks specific to VASCO, including demand for our products and services, competition from more established firms and others, pressures on price levels and our historical dependence on relatively few products, certain suppliers and certain key customers. These risks, uncertainties and other factors include VASCO’s ability to integrate eSignLive into the global business of VASCO successfully and the amount of time and expense spent and incurred in connection with the integration; the risk that the revenue synergies, cost savings and other economic benefits that VASCO anticipates as a result of this acquisition are not fully realized or take longer to realize than expected. Thus, the results that we actually achieve may differ materially from any anticipated results included in, or implied by these statements. Except for our ongoing obligations to disclose material information as required by the U.S. federal securities laws, we do not have any obligations or intention to release publicly any revisions to any forward-looking statements to reflect events or circumstances in the future or to reflect the occurrence of unanticipated events.
General
The following discussion is based upon our consolidated results of operations for the years ended December 31, 2016, 2015, and 2014 (percentages in the discussion, except for returns on average net cash balances, are rounded to the closest full percentage point) and should be read in conjunction with our consolidated financial statements included elsewhere in this Annual Report on Form 10-K.
We design, develop, market and support both propriety and open standards-based hardware and software solutions that manage and secure access to information assets and that enable secure and convenient online and mobile transactions. Our products and services are used for a broad array of purposes including e-banking and e-commerce. Our multi-factor user authentication is delivered via our hardware and software DIGIPASS security products (collectively “DIGIPASSES”), many of which incorporate an electronic and digital signature capability, which further protects the integrity of electronic transactions and data transmissions. Many
35
Table of Contents
of our software DIGIPASSES are designed as mobile applications that are downloaded directly to mobile devices, (DIGIPASS for Mobile), while others are integrated directly into mobile applications (DIGIPASS for Apps) that are downloaded onto mobile devices. As evidenced by our current customer base, most of our products are purchased by businesses and, depending on the business application, are distributed to either their employees or their customers. Those customers may be other businesses or, as is the case with online and mobile banking, our customer banks’ corporate and retail customers. Our target market is any business process that uses some form of electronic interface, particularly the Internet, where the owner of that process is at risk if unauthorized users can gain access to its process and either obtain proprietary information or execute transactions that are not authorized. Our products can not only increase the security associated with accessing the business process, thereby reducing the losses from unauthorized access, but also, in many cases, can reduce the cost of the process itself by automating activities that were previously performed manually such as an electronic signature.
We offer our products either through: (a) a product sales and licensing model or (b) through our services platform, which includes our cloud-based service offering.
In May 2013, we acquired Cronto Limited, a provider of secure visual transaction authentication solutions for online banking. Using the patented CRONTO technology, VASCO customers can establish a secure communication channel with their clients and display the details of a transaction in an encrypted graphical cryptogram consisting of a matrix of colored dots, which are displayed on the end user’s screen. For banks, account holders can simply “scan” the CRONTO image with a VASCO hardware device or a camera-equipped mobile phone with CRONTO software embedded to verify the transaction details and respond with an electronic signature.
In May 2014, we acquired Risk IDS, a provider of risk-based authentication solutions to the banking community. Risk-based authentication provides a more flexible process of authentication to ensure higher risk profiles result in stronger challenges. It allows the application to request higher levels of assurance or authentication when the risk level is determined to be higher. Contextual information that may be used in risk-based authentication includes user location, device characteristics, transaction amount, and many other factors. This method is designed to provide variable levels of security depending on the identified risks for a particular transaction or user.
In November 2015, we acquired Silanis Technology Inc. (“eSignLive”), a leading provider of electronic signature (e-signature) and digital transaction solutions used to sign, send and manage documents. We offer multiple deployment options including public cloud, private cloud, or on-premises. eSignLive has been identified as a top 3 provider of e-signature solutions by Forrester Research.
Industry Growth: We expect that the market for IT security solutions will continue to grow at a positive rate as the use of online and mobile transactions and commerce increases and the awareness of cyber security risks also increases. We expect our future growth will be driven by new government regulations, increases in the frequency and sophistication of hacking attacks, and the growth in online and mobile transactions. The issues driving the growth are global issues and the rate of adoption in each country is a function of that country’s culture, the competitive position of businesses operating in that country, the country’s overall economic conditions and the degree to which businesses and consumers within the country use technology.
Economic Conditions: Our revenue may vary significantly with changes in the economic conditions in the countries in which we sell products. With our current concentration of revenue in Europe and specifically in the banking/finance vertical market, significant changes in the economic outlook for the European Banking market may have a significant effect on our revenue.
There continues to be significant global economic uncertainty, including Europe, our most important market. While the European Union and European Central Bank continue to implement new programs to adapt to
36
Table of Contents
changing economic conditions in the region, parts of Europe continue to struggle with sovereign debt issues and weakening currencies. As a result, we expect that Europe will continue to face difficult economic conditions in 2017. Should the sovereign debt issue escalate, economic difficulties may negatively impact the global economy and our business.
During June 2016, voters in the United Kingdom passed a referendum providing for withdrawal from the European Union. While customer revenues from the United Kingdom and transactions denominated in British pounds are not significant, uncertainty surrounding withdrawal of the United Kingdom from the European Union may be a negative influence on normal ordering patterns within the European Banking market.
The European Banking market has been challenged by weak economic conditions and increased regulatory and risk mandates. Strategic priorities of many banks include improving efficiencies, and addressing regulatory and risk issues. To improve efficiencies, many banks have significantly reduced headcount while pursuing enhanced online and mobile customer services. Bank regulation periodically addresses enhanced cyber and data security. We believe our products are well positioned for online and mobile offerings and provide enhanced security, however, economic conditions, reduced headcount, and the transitioning of priorities may cause disruption in normal ordering patterns.
Cybersecurity: Our use of technology is increasing and is critical in three primary areas of our business:
| 1. | Software and information systems that we use to help us run our business more efficiently and cost effectively; |
| 2. | The products we have traditionally sold and continue to sell to our customers for integration into their software applications contain technology that incorporates the use of secret numbers and encryption technology; and |
| 3. | New products and services that we introduced to the market are focused on processing information through our servers or in the cloud. |
We believe that the risks and consequences of potential incidents in each of the above areas are different.
In the case of the information systems we use to help us run our business, we believe that an incident could disrupt our ability to take orders or deliver product to our customers, but such a delay in these activities would not have a material impact on our overall results. To minimize this risk, we actively use various forms of security and monitor the use of our systems regularly to detect potential incidents as soon as possible.
In the case of products that we have traditionally sold, we believe that the risk of a potential cyber incident is minimal. We offer our customers the ability to either create the secret numbers themselves or have us create the numbers on their behalf. When asked to create the numbers, we do so in a secure environment with limited physical access and store the numbers on a system that is not connected to any other network, including other VASCO networks, and similarly, is not connected to the internet.
In the case of our new products and services, which involve the active daily processing of the secret numbers on our servers or servers managed by others in a hosted environment, we believe a cyber incident could have a material impact on our future business. We also believe that these products may be more susceptible to cyber attacks than our traditional products since it involves the active processing of transactions using the secret numbers. While we do not have a significant amount of revenue from these products today, we believe that these products have the potential to provide substantial future growth. A cyber incident involving these products in the future could substantially impair our ability to grow the business and we could suffer significant monetary and other losses and significant reputational harm.
37
Table of Contents
To minimize the risk, we review our security procedures on a regular basis. Our reviews include the processes and software programs we are currently using as well as new forms of cyber incidents and new or updated software programs that may be available in the market that would help mitigate the risk of incidents. Certain insurance coverages may apply to certain cyber incidents. Overall, we expect the cost of securing our networks will increase in future periods, whether through increased staff, systems or insurance coverage.
While we did not experience any cyber incident in 2016, 2015, or 2014 that had a significant impact on our business, it is possible that we could experience an incident in 2017 or future years, which could result in unanticipated costs.
See Part I, Item 3 – Legal Proceedings for a description of legal proceedings related to the cyber security incident in 2011.
Income Taxes: Our effective tax rate reflects our global structure related to the ownership of our intellectual property (“IP”). All our IP in our traditional authentication business is owned by two subsidiaries, one in the U.S. and one in Switzerland. These two subsidiaries have entered into agreements with most of the other VASCO entities under which those other entities provide services to our U.S. and Swiss subsidiaries on either a percentage of revenue or on a cost plus basis or both. Under this structure, the earnings of our service provider subsidiaries are relatively constant. These service provider companies tend to be in jurisdictions with higher effective tax rates. Fluctuations in earnings tend to flow to the U.S. company and Swiss company. Earnings flowing to the U.S. company are expected to be taxed at a rate of 35% to 40%, while earnings flowing to the Swiss company are expected to be taxed at a rate ranging from 10% to 12%.
With the majority of our revenues being generated outside of the U.S., our consolidated effective tax rate is strongly influenced by the effective tax rate of our foreign operations. Changes in the effective rate related to foreign operations reflect changes in the geographic mix of where the earnings are realized and the tax rates in each of the countries in which it is earned. The statutory tax rate for the primary foreign tax jurisdictions ranges from 8% to 35%.
The geographic mix of earnings of our foreign subsidiaries will primarily depend on the level of our service provider subsidiaries’ pretax income, which is recorded as an expense by the U.S. and Swiss subsidiaries and the benefit that is realized in Switzerland through the sales of product. The level of pretax income in our service provider subsidiaries is expected to vary based on:
| 1. | the staff, programs and services offered on a yearly basis by the various subsidiaries as determined by management, or |
| 2. | the changes in exchange rates related to the currencies in the service provider subsidiaries, or |
| 3. | the amount of revenues that the service provider subsidiaries generate. |
For items 1 and 2 above, there is a direct impact in the opposite direction on earnings of the U.S. and Swiss entities. Any change from item 3 is generally expected to result in a larger change in income in the U.S. and Swiss entities in the direction of the change (increased revenues expected to result in increased margins/pretax profits and conversely decreased revenues expected to result in decreased margins/pretax profits).
In addition to the provision of services, the intercompany agreements transfer the majority of the business risk to our U.S. and Swiss subsidiaries. As a result, the contracting subsidiaries’ pretax income is reasonably assured while the pretax income of the U.S. and Swiss subsidiaries varies directly with our overall success in the market.
In November 2015, we acquired eSignLive, a foreign company with substantial IP and net operating loss and other tax carryforwards. The tax benefit of the carryforwards has been fully reserved as realization has not been deemed more likely than not. We are currently evaluating the operations of eSignLive. In the event eSignLive continues to generate losses, the impact will be to increase our effective tax rate.
38
Table of Contents
Currency Fluctuations: In 2016, approximately 88% of our revenue and approximately 73% of our operating expenses were generated/incurred outside of the U.S. In 2015, approximately 95% of our revenue and approximately 65% of our operating expenses were generated/incurred outside of the U.S. While the majority of our revenue is generated outside of the U.S., the majority of our revenue is billed in U.S. Dollars. In 2016, approximately 69% of our revenue was denominated in U.S. Dollars, 26% was denominated in Euros and 5% was denominated in other currencies. In 2015, approximately 78% of our revenue was denominated in U.S. Dollars, 18% was denominated in Euros and 4% was denominated in other currencies.
Since a significant portion of our revenues and operating expenses are outside the U.S. and denominated in currencies other than the U.S. Dollar, changes in currency exchange rates, especially the Euro to U.S. Dollar, can have a significant impact on revenue and expenses. To minimize the net impact of currency on operating earnings, we attempt to denominate an amount of billings in a currency such that it would provide a hedge against the operating expenses incurred in that currency. For the full-year 2016, we estimate that our revenue denominated in Euros of $50,648 compared to operating expenses denominated in Euros of $47,119. For the full-year 2015, we estimate that our revenue denominated in Euros of $43,000 compared to operating expenses denominated in Euros of $41,100. In 2016 compared to 2015, the U.S. Dollar, on average, strengthened approximately 1% against the Euro. We estimate that the net impact of the change in currency rates in 2016 compared to 2015 resulted in a decrease in revenue of approximately $327 and a decrease in operating expenses of $527.
The financial position and the results of operations of our foreign subsidiaries, with the exception of our subsidiaries in Switzerland, Singapore and Canada, are measured using the local currency as the functional currency. Accordingly, assets and liabilities are translated into U.S. Dollars using current exchange rates as of the balance sheet date. Revenues and expenses are translated at average exchange rates prevailing during the year. Translation adjustments arising from differences in exchange rates generated a comprehensive loss of $2,488, $3,292, and $4,468 in 2016, 2015, and 2014, respectively. These amounts are included as a separate component of stockholders’ equity. The functional currency of our subsidiaries in Switzerland, Canada, and Singapore is the U.S. Dollar.
Gains and losses resulting from foreign currency transactions are included in the consolidated statements of operations as other non-operating income/expense. In 2016, foreign exchange transaction gains were $111. In 2015, and 2014, we reported foreign exchange transaction losses of $1,247, and $1,382, respectively.
Revenue
Revenue by Geographic Regions: We classify our sales by customers’ location in four geographic regions: 1) EMEA, which includes Europe, the Middle East and Africa; 2) the United States, which for our purposes includes sales in Canada; 3) Asia Pacific Rim; and 4) Other Countries, including Australia, Latin America and India. The breakdown of revenue in each of our major geographic areas was as follows:
| EMEA | United States |
Asia Pacific | Other Countries |
Total | ||||||||||||||||
| Total Revenue: |
||||||||||||||||||||
| 2016 |
$ | 100,827 | $ | 23,632 | $ | 52,873 | $ | 14,972 | $ | 192,304 | ||||||||||
| 2015 |
$ | 164,180 | $ | 11,723 | $ | 47,156 | $ | 18,384 | $ | 241,443 | ||||||||||
| 2014 |
$ | 129,385 | $ | 12,098 | $ | 42,365 | $ | 17,689 | $ | 201,537 | ||||||||||
| Percent of Total: |
||||||||||||||||||||
| 2016 |
52 | % | 12 | % | 27 | % | 8 | % | 100 | % | ||||||||||
| 2015 |
68 | % | 5 | % | 19 | % | 8 | % | 100 | % | ||||||||||
| 2014 |
64 | % | 6 | % | 21 | % | 9 | % | 100 | % | ||||||||||
39
Table of Contents
2016 Compared to 2015
Total revenue in 2016 decreased $49,140, or 20%, from 2015. The decrease in total revenue was primarily attributable to the decrease in sales to Rabobank. After excluding revenues from Rabobank and e-SignLive, total revenue in 2016 increased 0.4% to $169,820. See the discussion below under “Revenue by Target Market” for additional information.
Revenue generated in EMEA for the full-year 2016 was $100,827, or 39%, lower in 2016 than in 2015. The change reflected a decrease of approximately 44% from the Banking market, and a decrease of approximately 3% from the Enterprise and Application Security market. The decrease in the Banking market was driven by a decline in hardware products, primarily products sold to Rabobank.
Revenue generated in Asia Pacific for the full-year 2016 was $52,873, or 12%, higher in 2016 than in 2015. Revenue was approximately 7% higher in the Banking market and 7% lower in the Enterprise and Application Security market compared to the revenue for full-year 2015. Revenues from both hardware and non-hardware products increased.
Revenue generated in other countries for the full-year 2016 was $14,972, or 19%, lower in 2016 than in 2015. Revenue in other countries was approximately 29% lower in the Banking market, mostly in the Latin American market, and 150% higher in the Enterprise and Application Security market compared to revenue for full-year 2015.
Revenue generated in the United States for the full-year 2016 was $23,632, or 102%, higher in 2016 than in 2015. Revenue was approximately 15% lower in the Banking market and 605% higher in the Enterprise and Application Security market primarily due to the acquisition of eSignLive.
2015 Compared to 2014
Total revenue in 2015 increased $39,906, or 20%, from 2014. The increase in total revenue was primarily attributable to an increase in hardware product sold to the Banking market. See the discussion below under “Revenue by Target Market” for additional information.
Revenue generated in EMEA for the full-year 2015 was $34,795, or 27%, higher in 2015 than in 2014. The increase reflected an increase of approximately 33% in revenue from the Banking market and a decrease of approximately 1% in revenue from the Enterprise and Application Security market. The increase in revenue in the Banking market was driven by an increase in hardware products, in large part from card readers that either include our CRONTO technology or provide a high level of functionality. Revenue from the Enterprise and Application Security market decline in hardware products was offset by non-hardware products, primarily maintenance.
Revenue generated in Asia Pacific for the full-year 2015 was $4,791, or 11%, higher in 2015 than in 2014. Revenue was approximately 13% higher in the Banking market and 15% lower in the Enterprise and Application Security market when compared to the revenue for full-year 2014. In the Banking market revenues from both hardware and non-hardware products increased.
Revenue generated in other countries for the full-year 2015 was $695, or 4%, higher in 2015 than in 2014. Revenue in other countries was approximately 6% higher in the Banking market, mostly in the Latin American market, and 22% lower in the Enterprise and Application Security market when compared to the revenue for full-year 2014.
Revenue generated in the United States for the full-year 2015 was $375, or 3%, lower in 2015 than in 2014. Revenue was approximately 7% lower in the Banking market and 1% higher in the Enterprise and Application Security market.
40
Table of Contents
Revenue by Target Market: Revenue is generated currently from two primary markets, (1) Banking and (2) Enterprise and Application Security, through the use of both direct and indirect sales channels. The Enterprise and Application Security market includes products used by employees of corporations to secure their internal networks (the Enterprise Security market) and business-to-business, business-to-consumer, e-commerce, e-government, e-gaming and other vertical applications (the Application Security market) that are not related to banking or finance. In addition, maintenance and support services associated with all markets are included in the Enterprise and Application Security market results. Management currently views the Enterprise and Application Security market as one market because the same products are sold using the same methods to both groups (i.e., a direct touch model and channel distribution model). Sales to the Enterprise and Application Security market are generally for smaller quantities and higher prices than sales made to the Banking market. The breakdown of revenue between the two primary markets is as follows:
| Banking | Enterprise
& Application Security |
Total | ||||||||||
| Total Revenue: |
||||||||||||
| 2016 |
$ | 143,423 | $ | 48,881 | $ | 192,304 | ||||||
| 2015 |
$ | 208,992 | $ | 32,451 | $ | 241,443 | ||||||
| 2014 |
$ | 168,073 | $ | 33,464 | $ | 201,537 | ||||||
| Percent of Total: |
||||||||||||
| 2016 |
75 | % | 25 | % | 100 | % | ||||||
| 2015 |
87 | % | 13 | % | 100 | % | ||||||
| 2014 |
83 | % | 17 | % | 100 | % | ||||||
2016 Compared to 2015
Revenue for the full year 2016 from the Banking market decreased $65,569, or 31% from 2015, and revenue from the Enterprise and Application Security market increased $16,430 or 51% in the same period.
The decrease in revenues from the Banking market was primarily driven by hardware sales to Rabobank. In the fourth quarter of 2014 and full year 2015, Rabobank deployed cardreaders to bank customers. Full year 2016 revenue from sales of card readers to Rabobank decreased approximately $62,938, over 2015. While we expect Rabobank may continue to place additional orders, we do not expect these orders to be of the same magnitude as those received in the initial rollout period.
The increase in revenue from the Enterprise and Application Security market reflects an increase in both hardware and non-hardware revenue.
The changes in revenue in both markets reflects the transactional nature of our business where the absolute amount of revenue reported in any given period is a reflection of transactions closed in that period. Also, given the sustainable, repeatable nature of our revenue model, we believe that the growth over a longer period of time reflects the growth in our customer base, which we expect will lead to continued increases in revenues in future years, albeit with uneven growth reported annually. We expect that customers that have purchased our products in prior years will replace those products in future years for several reasons, including but not limited to;
| • | upgrading to products that are more convenient for their customers to use and/or provide a higher level of security (e.g., our products with electronic or digital signing capability) to counteract the increasing sophistication of parties attempting to steal their customers’ identities or conduct man-in-the-middle attacks; |
| • | establishing a competitive advantage in their market place by providing technology that differs from their competitors; |
41
Table of Contents
| • | expanding the use of our products to provide security over new applications that may be offered by our customers to their application users; and |
| • | replacing existing products that may have been lost or are reaching the end of their useful lives. |
2015 Compared to 2014
Revenue for the full year 2015 from the Banking market increased $40,919, or 24%, from 2014 and revenue from the Enterprise and Application Security market decreased $1,013 or 3% in the same period.
The increase in revenues from the Banking market was primarily driven by hardware sales of card readers to Rabobank. In the fourth quarter of 2014 and full year 2015, Rabobank deployed cardreaders to bank customers. Full year 2015 revenue from sales of card readers to Rabobank increased $53,677, over 2014. While we expect Rabobank may continue to place additional orders, we do not expect these orders to be at the same magnitude as those received in the initial rollout period.
The decrease in revenue from the Enterprise and Application Security market reflects a decrease in both hardware and non-hardware revenue, offset by an increase in maintenance and support revenue, which we include with non-hardware revenues.
Gross Profit and Operating Expenses
The following table sets forth, for the periods indicated, certain consolidated financial data as a percentage of revenue from continuing operations for the years ended December 31, 2016, 2015, and 2014.
| Percentage of Revenue Year Ended December 31, |
||||||||||||
| 2016 | 2015 | 2014 | ||||||||||
| Revenue |
100.0 | % | 100.0 | % | 100.0 | % | ||||||
| Cost of goods sold |
32.1 | 40.5 | 37.7 | |||||||||
|
|
|
|
|
|
|
|||||||
| Gross profit |
67.9 | 59.5 | 62.3 | |||||||||
| Operating costs |
||||||||||||
| Sales and marketing |
29.8 | 15.8 | 20.9 | |||||||||
| Research and development |
12.1 | 7.2 | 9.2 | |||||||||
| General and administrative |
16.5 | 13.5 | 11.1 | |||||||||
| Amortization of purchased intangible assets |
4.6 | 2.0 | 2.2 | |||||||||
|
|
|
|
|
|
|
|||||||
| Total operating costs |
63.0 | 38.6 | 43.4 | |||||||||
|
|
|
|
|
|
|
|||||||
| Operating income |
5.0 | 20.9 | 18.9 | |||||||||
| Interest income, net |
0.4 | 0.2 | 0.1 | |||||||||
| Other income (expense), net |
0.5 | 0.0 | (0.1 | ) | ||||||||
|
|
|
|
|
|
|
|||||||
| Income before income taxes |
5.9 | 21.1 | 18.8 | |||||||||
| Provision for income taxes |
0.4 | 3.6 | 2.6 | |||||||||
|
|
|
|
|
|
|
|||||||
| Net income |
5.5 | 17.5 | 16.2 | |||||||||
|
|
|
|
|
|
|
|||||||
As further described in Note 1 to the consolidated financial statements, beginning in 2016, revenue is presented in two categories, Product and License revenue and Service and Other Revenue. Product and License Revenue includes hardware products and software licenses. Service and Other Revenue includes software as a service (“SaaS”) solutions, maintenance and support, and professional services. Additional adjustments were made to present cost of goods sold consistent with these two categories. Prior periods have been adjusted to reflect the current presentation.
In addition, we have revised amounts reported in previously issued financial statements for periods presented in the Annual Report on Form 10-K related to costs of services erroneously recorded as operating
42
Table of Contents
expenses. We determined the errors were not material to the previously issued financial statements and disclosures included in our Annual Report on Form 10-K for the year ended December 31, 2015 or for any quarterly periods included therein or through our most recent Quarterly Report on Form 10-Q.
Gross Profit
2016 Compared to 2015
Consolidated gross profit for 2016 was $130,657, a decrease of $12,883, or 9%, from the $143,540 reported for 2015. Gross profit as a percentage of revenue (“gross profit margin”) was 68% in 2016 compared to 60% in 2015. The increase in the gross profit margin was primarily attributable to the following factors:
| • | an increase in Enterprise and Application Security market revenues |
| • | an increase in the gross margins from hardware products sold in the Banking market |
| • | an increase of our non-hardware revenue as a percentage of total revenue to 39% in 2016 from 22% in 2015: and |
Gross margin on product sold reflects the specific mix of product and quantities sold in each period. For 2016, gross margins from product sold in the Banking market was approximately nine percentage points higher than in 2015. Gross margins from product sold in the Enterprise and Application Security market, excluding e-SignLive, were approximately six percentage points higher in 2016 compared to 2015.
Revenue from the Enterprise and Application Security market, which generally has gross profit margins that are 20 to 30 percentage points higher than the Banking market, was 25% of our total revenue for the full-year 2016 compared to 13% of our total revenue for the full-year 2015.
The increase in gross margin from product sold in the Banking market is primarily attributable to the decrease in card readers sold as a percentage of revenue. Card readers, which generally have gross profit margins that are 15 to 25 percentage points lower than other hardware-related margins due to competitive pricing pressures, were 12% of our total revenue for the full-year 2016 compared to 36% of our revenue for the full-year 2015.
2015 Compared to 2014
Consolidated gross profit for 2015 was $143,540, an increase of $17,898, or 14%, from the $125,642 reported for 2014. Gross profit as a percentage of revenue (“gross profit margin”) was 60% in 2015 compared to 62% in 2014. The decrease in the gross profit margin was primarily attributable to the following factors:
| • | an unfavorable mix of products sold, with revenues from card reader market increasing from 25% to 36% of our total revenue, and other hardware decreasing from 48% to 42% of our total revenue; |
| • | a decline in the gross margins from hardware products sold in the Banking market; |
| • | a decline in non-hardware revenue as a percentage of total revenue to 22% in 2015 from 27% in 2014; and |
| • | the strengthening of the US Dollar, which reduced revenue without the offsetting impact on costs of goods sold. |
Gross margin on product sold reflects the specific mix of product and quantities sold in each period. As the size of deals increase, the gross margin generally declines. For 2015, gross margins from product sold in the Banking market was approximately 4 percentage points lower than in 2014. Gross margins from product sold in the Enterprise and Application Security market was approximately 1 percentage point higher in 2015 compared to 2014.
Revenue from the Enterprise and Application Security market, which generally has gross profit margins that are 20 to 30 percentage points higher than the Banking market, was 13% of our total revenue for the full-year 2015 compared to 17% of our total revenue for the full-year 2014.
43
Table of Contents
The decline in gross margin from product sold in the Banking market is primarily attributable to the increase in card readers sold as a percentage of revenue. Card readers, which generally have gross profit margins that are 15 to 25 percentage points lower than other hardware-related margins due to competitive pricing pressures, were 36% of our total revenue for the full-year 2015 compared to 25% of our revenue for the full-year 2014. In 2015, we experienced increased demand for our card readers that include our CRONTO technology.
Operating Expenses
Our operating expenses are generally based on anticipated revenue levels and the majority of such expenses are fixed over short periods of time. As a result, small variations in the amount of revenue recognized in any given period could cause significant variations in the period-to-period comparisons of either the absolute amounts of operating income or operating income as a percentage of revenue. The three primary factors impacting our operating expenses are headcount, stock-based incentive plan compensation expenses and the acquisition of eSignLive. Overall, our operating expenses increased $27,971 or 30%, from $93,087 in 2015 to $121,058 in 2016.
Generally, the most significant factor driving our operating expenses is headcount. Direct compensation and benefit plan expenses historically represented between 55% and 65% of our operating expenses. We attempt to manage our headcount within the context of the economic environments in which we operate and the investments we believe we need to help ensure our infrastructure is able to support future growth and ensure our products are competitive. Average headcount for the full-year 2016, 2015, and 2014 was 595, 412, and 380, respectively.
In November 2015, with the acquisition of eSignLive, our headcount increased by 156.
For full-year 2016, 2015, and 2014, operating expenses included $4,871, $5,650, and $3,250, respectively, related to long-term incentive plans. Generally, awards granted at the beginning of 2016 were not earned. Long-term incentive awards granted at the beginning of 2015 and 2014 were earned. Long-term incentive plan compensation expense includes both cash and stock-based incentives.
Sales and Marketing Expenses
2016 Compared to 2015
Consolidated sales and marketing expenses for the year ended December 31, 2016 were $57,347, an increase of $19,148, or 50%, from $38,199 reported for 2015. The increase in sales and marketing expenses primarily relates to:
| • | increased compensation expenses of approximately $17,704 resulting from higher average full-year headcount in 2016 than in 2015. |
| • | increased marketing initiatives including trade shows and other marketing efforts; |
Our average full-year headcount increased 35% in 2016 compared to 2015. The average full-time sales, marketing and operations employee headcount was 288 in 2016 compared to 199 in 2015.
2015 Compared to 2014
Consolidated sales and marketing expenses for the year ended December 31, 2015 were $38,199, a decrease of $3,990, or 9%, from $42,189 reported for 2014. This decrease in sales and marketing expenses primarily relates to:
| • | stronger US Dollar generating a $4,700 decrease in sales and marketing expenses compared to 2014; |
| • | increased marketing initiatives including trade shows and other marketing efforts; |
44
Table of Contents
partially offset by
| • | lower total compensation expenses related primarily to commissions and bonuses. |
Our average full-year headcount increased 7% in 2015 compared to 2014. The average full-time sales, marketing and operations employee headcount was 199 in 2015 compared to 186 in 2014.
Research and Development Expenses
2016 Compared to 2015
Consolidated research and development costs for the year ended December 31, 2016 were $ 23,214, an increase of $5,757, or 33%, from $ 17,457 for 2015. The increase in research and development was primarily attributable to:
| • | increased compensation expenses of approximately $4,070 resulting from higher average full-year headcount in 2016 than in 2015 from eSignLive acquisition. |
The average research and development headcount increased approximately 49% to 225 in 2016 from 151 in 2015.
2015 Compared to 2014
Consolidated research and development costs for the year ended December 31, 2015 were $17,457, a decrease of $1,089, or 6%, from $18,546 for 2014. The decrease in research and development was primarily attributable to:
| • | stronger US Dollar generating a $3,100 decrease in research and development expenses compared to 2014; |
partially offset by,
| • | increased compensation expenses of approximately $1,700 resulting from higher average full-year headcount in 2015 than in 2014, including the impact of the eSignLive acquisition. |
The average research and development headcount increased approximately 10% to 151 in 2015 from 137 in 2014. At year-end 2015, 2014 and 2013, we employed 209, 136 and 143 research and development employees, respectively. The increase in headcount primarily reflects the additional headcount related to the eSignLive acquisition.
General and Administrative Expenses
2016 Compared to 2015
Consolidated general and administrative expenses for the year ended December 31, 2016 were $31,648 a decrease of $841 or 3%, from $32,489 reported for 2015.
The decrease in general and administrative expenses is primarily attributable to:
| • | decreased professional fees and other expenses of $1,651, and $2,127, respectively; |
partially offset by:
| • | increased general and administrative expenses of approximately $2,908 from eSignLive; |
The average full-time general and administrative employee headcount increased approximately 32% to 82 persons in 2016 from 62 persons in 2015. At year-end 2016, 2015 and 2014, we employed 85, 77 and 56 general and administrative employees, respectively.
45
Table of Contents
2015 Compared to 2014
Consolidated general and administrative expenses for the year ended December 31, 2015 were $32,489, an increase of $10,202 or 46%, from $22,287 reported for 2014.
The increase in general and administrative expenses is primarily attributable to:
| • | increased compensation expenses of $3,332, resulting from increased long-term incentive and non-cash compensation and an increase in our average full-year headcount in 2015 from 2014; |
| • | professional fees increased approximately $5,389 compared to 2014. The increase primarily reflected an increase in legal expenses related to our internal investigation of the possible sale of our products by a distributor into Iran and the acquisition of eSignLive; |
| • | accrued penalty of $900 related to the internal investigation related to the possible sale of our products by a distributor into Iran; |
partially offset by:
| • | stronger US Dollar generating a $1,100 decrease in general and administrative expenses compared to 2014. |
The average full-time general and administrative employee headcount increased approximately 7% to 62 persons in 2015 from 58 persons in 2014. At year-end 2015, 2014 and 2013, we employed 77 (including 15 from the eSignLive acquisition), 56 and 60 general and administrative employees, respectively.
Amortization Expense
2016 Compared to 2015
Amortization expense for 2016 was $8,849, an increase of $3,907, or 79%, from $4,942 reported for 2015. The increase was primarily related to the amortization of intangible assets associated with our acquisition of eSignLive in November 2015.
2015 Compared to 2014
Amortization expense for 2015 was $4,942, an increase of $410, or 9%, from $4,532 reported for 2014. The increase was primarily related to the amortization of intangible assets associated with our acquisition of eSignLive in November 2015.
Interest Income, Net
2016 Compared to 2015
Consolidated net interest income was $785 in 2016 compared to $364 in 2015. The increase in net interest income reflected an increase in the average return on invested balances partially offset by a decrease in the average net cash balance. Our return on average net cash balances was 0.6% in 2016 compared to 0.2% in 2015. Average net cash and short term investment balances were $134,483 in 2016, a decrease of $21,814 or 14% from $156,297 in 2015.
2015 Compared to 2014
Consolidated net interest income was $364 in 2015 compared to $118 in 2014. The increase in net interest income reflected an increase in the average return on invested balances and an increase in the average net cash balance. Our return on average net cash balances was 0.2% in 2015 compared to 0.1% in 2014. Average net cash and short term investment balances were $156,297 in 2015, an increase of $38,582 or 33% from $117,715 in 2014.
46
Table of Contents
Other Income (Expense), net
2016 Compared to 2015
Other income (expense), net primarily includes exchange gains (losses) on transactions denominated in currencies other than a subsidiary’s functional currency and subsidies received from foreign governments related to research and development. Other income of $1,040 in 2016 compared to other income of $81 in 2015. Exchange gains were $111 in 2016 and losses of $1,247 in 2015.
2015 Compared to 2014
Other income (expense), net in 2015 primarily included exchange gains (losses) on transactions that are denominated in currencies other than a subsidiary’s functional currency and subsidies received from foreign governments related to increasing trade in other countries or increasing spending on research and development. Other income of $81 in 2015 compared to other expense of $286 in 2014. The fluctuation primarily reflects higher government subsidies. Exchange losses were $1,247 and $1,382 in 2015 and 2014, respectively.
Income Taxes
2016 Compared to 2015
Income tax expense for 2016 was $863, compared to $8,704 in 2015. The effective tax rate in 2016 was 9%, a decrease of 8 percentage points from 17% in 2015. The decrease in the rate is primarily due to increase in losses in higher tax jurisdictions partially offset by the increase in the Swiss tax rate as applicable to VASCO.
2015 Compared to 2014
Income tax expense for 2015 was $8,704, compared to $5,309 in 2014. The effective tax rate in 2015 was 17%, an increase of 3 percentage points from 14% in 2014. The increase in the rate in 2015 is primarily due to incremental U.S. tax provided on an intercompany dividend from our Swiss subsidiary.
Foreign Tax Credit and Loss Carryforwards Available
At December 31, 2016, we had U.S. foreign tax credit carryforwards of $7,027, expiring in 2023 through 2025. We have not provided a valuation reserve for the U.S. foreign tax credits because we believe that it is more likely than not that they will be realized.
At December 31, 2016, we have deferred tax assets of $16,655 resulting from foreign and state NOL carryforwards of $58,110 and other foreign deductible carryforwards of $16,817. At December 31, 2016, we have a valuation allowance of $6,192 against deferred tax assets related to certain carryforwards. See Note 7 to the consolidated financial statements for more information regarding carryforwards and valuation allowances.
Loss from Discontinued Operations
We had losses from discontinued operations of $47 in 2016 compared to $43 for 2015.
Note 3 of the consolidated financial statements contains additional information about the discontinued operations. See Part 1, Item 1A – Risk Factors and Part 1, Item 3 – Legal Proceedings for additional information related to DigiNotar B.V.
Liquidity and Capital Resources
At December 31, 2016, we had net cash balances (total cash, cash equivalents and restricted cash less bank borrowings) of $49,345 and short term investments of $94,856. We had no outstanding debt or restricted cash at December 31, 2016.
47
Table of Contents
Short term investments at December 31, 2016, consisting of high quality commercial paper with maturities of less than six months, were held by our U.S. and Swiss entities and issued by domestic and foreign corporations.
Earnings of certain subsidiaries are deemed available for distribution. At December 31, 2016 and 2015, unremitted foreign earnings available for distribution are $14,299, and $22,672, respectively. The deferred tax liability for the incremental U.S. tax to be paid upon remittance as dividends at December 31, 2016 and 2015 was $409 and $137, respectively.
The earnings of certain designated subsidiaries remain permanently invested. At December 31, 2016 and 2015, total unremitted foreign earnings considered permanently invested are $154,316 and $131,327, respectively. It is not practicable to estimate the incremental U.S. tax liability which would be incurred if these earnings were repatriated.
At December 31, 2016, we held $21,733 of cash in banks in the United States and $27,612 of cash in banks outside of the United States. Of the cash in banks outside of the United States, $27,332 is not subject to significant repatriation restrictions, but may be subject to tax upon repatriation. Cash in banks outside of the United States includes $17,151 held in tax jurisdictions where we consider retained earnings to be available for distribution and $10,461 held in jurisdictions where we consider retained earnings to be permanently invested.
Cash provided by operating activities was $28,453 during the year ended December 31, 2016. During 2016, we used $56,496, for investing activities, including net short term investments of $49,915. Financing activities used $1,051 for tax payments for restricted stock issuances.
Cash provided by operating activities was $68,950 during the year ended December 31, 2015. During 2015, we used $55,956, for investing activities, including $74,486 for the purchase of eSignLive and $1,362 for additions to property and equipment. Financing activities used $6,444, primarily to repay eSignLive debt.
The net effect of 2016 activity resulted in a decrease in net cash of $29,177 and a net cash balance of $49,345 at December 31, 2016, compared to $78,522 at the end of 2015. Our working capital at December 31, 2016 was $139,199, an increase of $11,524 or 9%, from $127,675 at December 31, 2015. The change is primarily attributable to the generation of positive cash flow from operations in 2016. Our current ratio was 3.5 to 1.0 at December 31, 2016.
The net effect of 2015 activity resulted in an increase in net cash of $6,081 and a net cash balance of $78,522 at December 31, 2015, compared to $72,441 at the end of 2014. Our working capital at December 31, 2015 was $127,675 a decrease of $33,354 or 21%, from $161,029 at December 31, 2014. The change is primarily attributable to the purchase of eSignLive in 2015. Our current ratio was 3.3 to 1.0 at December 31, 2015.
We believe that our financial resources are adequate to meet our operating needs over the next twelve months.
Off-Balance Sheet Arrangements
The company has no off-balance sheet arrangements.
48
Table of Contents
Contractual Obligations
The company has the following contractual obligations at December 31, 2016:
| Payments due by period | ||||||||||||||||||||
| Total | 1 year | 2-3 years |
4-5 years |
More than 5 years |
||||||||||||||||
| Operating lease obligations |
$ | 7,217 | $ | 3,204 | $ | 3,144 | $ | 869 | $ | 0 | ||||||||||
| Purchase obligations |
19,134 | 19,134 | 0 | 0 | 0 | |||||||||||||||
| Warranty reserve |
153 | 153 | 0 | 0 | 0 | |||||||||||||||
|
|
|
|
|
|
|
|
|
|
|
|||||||||||
| $ | 26,504 | $ | 22,491 | $ | 3,144 | $ | 869 | $ | 0 | |||||||||||
|
|
|
|
|
|
|
|
|
|
|
|||||||||||
Purchase obligations are primarily for inventory. As further described in our Critical Accounting Policies, we regularly monitor inventories to ensure they are realizable at stated values.
The company had $662 and $560 of unrecognized tax benefits as of both December 31, 2016 and 2015, which have been set aside in a reserve in accordance with Financial Accounting Standards Board (“FASB”) Accounting Standards Codification (“ASC”) 740 Income Taxes. These amounts are not included in the above table as the timing of payment of such obligations, if any, is not determinable.
Critical Accounting Policies and Estimates
Management’s Discussion and Analysis of Financial Condition and Results of Operations discusses our consolidated financial statements, which have been prepared in accordance with accounting principles generally accepted in the U.S. The preparation of these financial statements requires management to make estimates and assumptions that affect the reported amounts of assets and liabilities and the disclosure of contingent assets and liabilities at the date of the consolidated financial statements and the reported amounts of revenue and expenses during the reporting period.
On an on-going basis, management evaluates its estimates and judgments, including those related to bad debts, net realizable value of inventory and intangible assets. Management bases its estimates and judgments on historical experience and on various other factors that are believed to be reasonable under the circumstances, the results of which form the basis for making judgments about the carrying values of assets and liabilities that are not readily apparent from other sources. Actual results may differ from these estimates under different assumptions or conditions. Management believes the following critical accounting policies affect significant judgments and estimates used in the preparation of its consolidated financial statements.
Revenue Recognition
We recognize revenue in accordance with ASC 985-605, Software – Revenue Recognition, ASC 985-605-25, Revenue Recognition – Multiple Element Arrangements and Staff Accounting Bulletin 104.
Product and License Revenue includes hardware products and software licenses. Services and Other includes software as a service (“SaaS”), maintenance and support, and professional services.
Revenue is recognized when there is persuasive evidence that an arrangement exists, delivery has occurred, the fee is fixed or determinable and collection of the revenue is probable.
In multiple-element arrangements, some of our products are accounted for under the software provisions of ASC 985-605 and others under the provisions that relate to the sale of non-software products.
In our typical multiple-element arrangement, the primary deliverables include:
| 1. | a client component (i.e., an item that is used by the person being authenticated in the form of either a new standalone hardware device or software that is downloaded onto a device the customer already owns); |
49
Table of Contents
| 2. | host system software that is installed on the customer’s systems (i.e., software on the host system that verifies the identity of the person being authenticated) or licenses for additional users on the host system software if the host system software had been installed previously; and |
| 3. | post contract support (PCS) in the form of maintenance on the host system software or support. |
Our multiple-element arrangements may also include other items that are usually delivered prior to the recognition of any revenue are incidental to the overall transaction such as initialization of the hardware device, customization of the hardware device itself or the packaging in which it is delivered, deployment services where we deliver the device to our customer’s end-use customer or employee and, in some limited cases, professional services to assist with the initial implementation of a new customer.
In multiple-element arrangements that include a hardware client device, we allocate the selling price among all elements, delivered and undelivered, based on our internal price lists and the percentage of the selling price of that element, per the price list, to the total of the estimated selling price of all of the elements per the price list. Our internal price lists for both delivered and undelivered elements were determined to be reasonable estimates of the selling price of each element based on a comparison of actual sales made to the price list.
In multiple-element arrangements that include a software client device, we continue to account for each element under the current standards of ASC 985-605 related to software. When software client device and host software are delivered elements, we use the Residual Method for determining the amount of revenue to recognize for token and software licenses if we have vendor-specific objective evidence (“VSOE”) for all of the undelivered elements. Any discount provided to the customer is applied fully to the delivered elements in such an arrangement. VSOE for undelivered elements is established using the “bell curve method.” Under this method, we conclude VSOE exists when a substantial majority of PCS renewals are within a narrow range of pricing. The estimated selling price of PCS items is based on an established percentage of the user license fee attributable to the specific software. In sales arrangements where VSOE of fair value has not been established, revenue for all elements is deferred and amortized over the life of the arrangement.
For transactions other than multiple-element arrangements, we recognize revenue as follows:
| 1. | Product and License Revenue: Revenue from the sale of computer security hardware or the license of software is recorded upon shipment or, if an acceptance period is allowed, at the latter of shipment or customer acceptance. No significant obligations or contingencies exist with regard to delivery, customer acceptance or rights of return at the time revenue is recognized. |
| 2. | SaaS: We generate SaaS revenues from our cloud services offerings. SaaS revenues include fees from customers for access to the eSignLive suite of solutions. Our standard customer arrangements generally do not provide the customer with the right to take possession of the software supporting the cloud-based application service at any time. As such, these arrangements are considered service contracts and revenue is recognized ratably over the service period of the contract. |
| 3. | Maintenance and Support Agreements: Maintenance and support agreements generally call for us to provide software updates and technical support, respectively, to customers. Revenue on maintenance and technical support is deferred and recognized ratably over the term of the applicable maintenance and support agreement. |
| 4. | Professional Services: We provide professional services to our customers. Revenue from such services is recognized during the period in which the services are performed. |
We generate subscription services revenues primarily from our cloud services offerings. Subscription services revenues include subscription fees from customers for access to the eSignLive suite of solutions. Our standard customer arrangements generally do not provide the customer with the right to take possession of the software supporting the cloud-based application service at any time. As such, these arrangements are considered service contracts and revenue is recognized ratably over the service period of the contract.
50
Table of Contents
We recognize revenue from sales to distributors and resellers on the same basis as sales made directly to customers. We recognize revenue when there is persuasive evidence that an arrangement exists, delivery has occurred, the fee is fixed or determinable and collection of the revenue is probable.
For large-volume transactions, we may negotiate a specific price that is based on the number of users of the software license or quantities of hardware supplied. The per unit prices for large-volume transactions are generally lower than transactions for smaller quantities and the price differences are commonly referred to as volume-purchase discounts.
All revenue is reported on a net basis, excluding any sales taxes or value added taxes.
Allowance for Doubtful Accounts
We maintain allowances for doubtful accounts for estimated losses resulting from the inability of our customers to make payments for goods and services. We analyze accounts receivable, customer creditworthiness, current economic trends and changes in our customer payment terms when evaluating the adequacy of the allowance for doubtful accounts. The allowance is based on a specific review of all significant past-due accounts. If the financial condition of our customers deteriorates, resulting in an impairment of their ability to make payments, additional allowances may be required.
Net Realizable Value of Inventory
We write down inventory where it appears that the carrying cost of the inventory may not be recovered through subsequent sale of the inventory. We analyze the quantity of inventory on hand, the quantity sold in the past year, the anticipated sales volume in the form of sales to new customers as well as sales to previous customers, the expected sales price and the cost of making the sale when evaluating the valuation of our inventory. If the sales volume or sales price of a specific model declines significantly, additional write-downs may be required.
Impairment of Long-Lived and Intangible Assets:
Definite-lived intangible assets include proprietary technology, customer relationships, and other intangible assets. Intangible assets other than patents with definite lives are amortized over the useful life, generally three to seven years for proprietary technology and five to twelve years for customer relationships. Patents are amortized over the life of the patent, generally 20 years in the U.S.
Long-lived assets, including property, plant and equipment, definite-lived intangible assets being amortized and capitalized software costs, are reviewed for impairment in accordance with ASC 360-10, Property, Plant and Equipment, whenever events or changes in circumstances indicate that the carrying amount of the long-lived asset group may not be recoverable. An impairment loss shall be recognized if the carrying amount of a long-lived asset group exceeds the sum of the undiscounted cash flows expected to result from the use and eventual disposition of the asset. If it is determined that an impairment loss has occurred, the loss is measured as the amount by which the carrying amount of the long-lived asset group exceeds its fair value. Long-lived assets held for sale are reported at the lower of carrying value or fair value less cost to sell.
Goodwill and Other Intangible Assets:
Intangible assets arising from business combinations, such as acquired technology, customer relationships, and other intangible assets, are originally recorded at fair value. Intangible assets other than patents with definite lives are amortized over the useful life, generally three to seven years for proprietary technology and five to twelve years for customer relationships. Patents are amortized over the life of the patent, generally 20 years in the U.S.
51
Table of Contents
Goodwill represents the excess of purchase price over the fair value of net identifiable assets acquired in a business combination. We assess the impairment of goodwill each November or whenever events or changes in circumstances indicate that the carrying value may not be recoverable. The Company’s impairment assessment begins with a qualitative assessment to determine whether it is more likely than not that the fair value of a reporting unit is less than its carrying value. The qualitative assessment includes comparing the overall financial performance of the reporting units against the planned results used in the last quantitative goodwill impairment test. Additionally, each reporting unit’s fair value is assessed in light of certain events and circumstances, including macroeconomic conditions, industry and market considerations, cost factors, and other relevant entity- and reporting unit specific events. The selection and assessment of qualitative factors used to determine whether it is more likely than not that the fair value of a reporting unit exceeds the carrying value involves significant judgments and estimates. If it is determined under the qualitative assessment that it is more likely than not that the fair value of a reporting unit is less than its carrying value, then a two-step quantitative impairment test is performed. Under the first step, the estimated fair value of the reporting unit is compared with its carrying value (including goodwill). If the fair value of the reporting unit exceeds its carrying value, step two does not need to be performed. If the estimated fair value of the reporting unit is less than its carrying value, an indication of goodwill impairment exists for the reporting unit and the enterprise must perform step two of the impairment test (measurement). Under step two, an impairment loss is recognized for any excess of the carrying amount of the reporting unit’s goodwill over the implied fair value of that goodwill. The implied fair value of goodwill is determined by allocating the fair value of the reporting unit in a manner similar to a purchase price allocation in acquisition accounting. The residual amount after this allocation is the implied fair value of the reporting unit goodwill. Fair value of the reporting unit under the two-step assessment is determined using a combination of both income and market-based variation approaches. The inputs and assumptions to valuation methods used to estimate the fair value of reporting units involves significant judgments.
We have not recognized any impairment for the years ended December 31, 2016, 2015 or 2014.
Income Taxes:
We account for income taxes under the asset and liability method. Deferred tax assets and liabilities are recognized for the future tax consequences attributable to differences between the financial statement carrying amounts of existing assets and liabilities and their respective tax bases and operating loss and tax credit carryforwards. We measure deferred tax assets and liabilities using enacted tax rates expected to apply to taxable income in the years in which those temporary differences are expected to be recovered or settled. We recognize the effect of a change in tax rates on deferred tax assets and liabilities and in income in the period that includes the enactment date.
We recognize tax benefits for tax positions that are more likely than not to be sustained upon examination by tax authorities. The amount recognized is measured as the largest amount of benefit that is greater than 50 percent likely to be realized upon ultimate settlement. Unrecognized tax benefits are tax benefits claimed in our income tax returns that do not meet these recognition and measurement standards. Assumptions, judgments, and the use of estimates are required in determining whether the “more likely than not” standard has been meet when developing the provision for income taxes.
Recently Issued Accounting Pronouncements
In November 2015, the FASB issued Accounting Standards Update No. 2015-17, Balance Sheet Classification of Deferred Taxes, (ASU 2015-17), requiring deferred tax liabilities and assets be classified as non-current in a classified statement of financial position. The ASU is effective for annual periods beginning after December 15, 2015 and interim periods within such annual periods. We have adopted ASU 2015-17 prospectively in our consolidated financial statements as of January 1, 2016. Prior periods were not retrospectively adjusted.
52
Table of Contents
In September 2015, the FASB issued Accounting Standards Update No. 2015-16, Simplifying the Accounting for Measurement-Period Adjustments, (ASU 2015-16), which eliminates the requirement for an acquirer to retrospectively adjust the financial statements for measurement-period adjustments that occur in periods after a business combination is consummated. The ASU is effective for annual periods beginning after December 15, 2015 and interim periods within such annual periods and applies prospectively to adjustments to provisional amounts that occur after the effective date. We have adopted ASU 2015-16 in our consolidated financial statements as of January 1, 2016. Measurement period adjustments identified subsequent to December 31, 2015 for the eSignLive Acquisition, further described in Note 4 to the Consolidated Financial Statements, are recorded and disclosed in accordance with ASU 2015-16.
In May 2014, the FASB issued Accounting Standards Update No. 2014-09, Revenue from Contracts with Customers (ASU 2014-09), which supersedes nearly all existing revenue recognition guidance under U.S. GAAP. The core principle of ASU 2014-09 is to recognize revenues when promised goods or services are transferred to customers in an amount that reflects the consideration to which an entity expects to be entitled for those goods or services. The standard creates a five-step model to achieve its core principle: (i) identify the contract(s) with a customer; (ii) identify the performance obligations in the contract; (iii) determine the transaction price; (iv) allocate the transaction price to the separate performance obligations in the contract; and (v) recognize revenue when (or as) the entity satisfies a performance obligation. In addition, entities must disclose sufficient information to enable users of financial statements to understand the nature, amount, timing, and uncertainty of revenue and cash flows arising from contracts with customers. Qualitative and quantitative disclosures are required about: (i) the entity’s contracts with customers; (ii) the significant judgments, and changes in judgments, made in applying the guidance to those contracts; and (iii) any assets recognized from the costs to obtain or fulfill a contract with a customer.
ASU 2014-09 is effective for annual periods beginning after December 15, 2016, and interim periods within such annual periods, using either of the following transition methods: (i) a full retrospective approach reflecting the application of the standard in each prior reporting period with the option to elect certain practical expedients, or (ii) a retrospective approach with the cumulative effect of initially adopting ASU 2014-09 recognized at the date of adoption. We will adopt this guidance at the beginning of the first quarter of 2018. We expect to determine the transition method in the second quarter of 2017.
We are currently evaluating the impact of our pending adoption of the new revenue recognition guidance on revenue transactions, including any impacts on associated processes, systems, and internal controls. Our evaluation has included determining whether the unit of account (i.e., performance obligations) will change as compared to current GAAP, as well as determining the standalone selling price of each performance obligation. Standalone selling prices under the new guidance may not be substantially different from our current methodologies of establishing fair value on multiple element arrangements. Based on initial assessments, we have identified certain arrangements where revenue may be recognized earlier compared to current GAAP. We expect to recognize license revenue from term licenses upon delivery of the software, rather than over the term of the arrangement. We expect to begin capitalizing certain sales commissions upon adoption of the new standard and are currently in the process of evaluating the period over which to amortize these capitalized costs. We continue to evaluate the impact of this guidance and subsequent amendments on our consolidated financial position, results of operations, and cash flows, and any preliminary assessments are subject to change.
In February 2016, The FASB issued Accounting Standards Update No. 2016-02, Leases, which among other things, requires lessees to recognize most leases on the balance sheet. ASU 2016-02 is effective for annual and interim periods in fiscal years beginning after December 15, 2018 and mandates a modified retrospective transition method. We are currently evaluating the impact of ASU 2016-02 on our consolidated financial statements.
On March 30, 2016, the FASB issued ASU 2016-09, Improvements to Employee Share-Based Payment Accounting, to improve accounting for share-based payment transactions as part of the FASB’s simplification
53
Table of Contents
initiative. The ASU changes certain aspects of accounting for share-based payment award transactions, including: (1) recognition of excess tax benefits and tax deficiencies as income tax expense or benefit instead of additional paid-in capital; (2) classification of excess tax benefits on the statement of cash flows, and (3) accounting for forfeitures. The other provisions of ASU 2016-09 are immaterial to the Company. ASU 2016-09 is effective for fiscal years beginning after December 15, 2016. Early adoption is permitted. We have early adopted ASU 2016-09 in our consolidated financial statements as of January 1, 2016 and applicable aspects described were adopted prospectively. Prior periods were not retrospectively adjusted.
The adoption of ASU 2016-09 resulted in an increase to the tax provision of $169 that would have otherwise been charged to additional paid in capital for the year ended December 31, 2016. Similarly, for the year ended December 31, 2016, as a result of the adoption of ASU 2016-09, cashflows from operating activities decreased $169 and cash flows from financing activities increased by the same amount. We also elected to begin accounting for forfeitures as they occur. The impact of this policy change was immaterial to our consolidated financial statements. The impact of this ASU on future periods is dependent on our stock price at the time restricted stock awards vest.
In October 2016, the FASB issued ASU 2016-16, “Accounting for Income Taxes: Intra-Entity Transfers of Assets Other Than Inventory.” The standard requires that the income tax impact of intra-entity sales and transfers of property, except for inventory, be recognized when the transfer occurs. The standard will become effective for us beginning January 1, 2018 and will require any deferred taxes not yet recognized on intra-entity transfers to be recorded to retained earnings under a modified retrospective approach. Early adoption is permitted. We are currently evaluating the standard, but expect that it will not have a material impact on our consolidated financial statements.
From time to time, new accounting pronouncements are issued by the FASB or other standard setting bodies that are adopted by us as of the specified effective date. Unless otherwise discussed, our management believes that the impact of recently issued standards that are not yet effective will not have a material impact on our consolidated financial statements upon adoption.
Item 7A - Quantitative and Qualitative Disclosures about Market Risk (In thousands)
Foreign Currency Exchange Risk – In 2016, approximately 88% of our business was conducted outside the United States, primarily in Europe, Latin America and Asia/Pacific. A significant portion of our business operations is transacted in foreign currencies. As a result, we have exposure to foreign exchange fluctuations. We are affected by both foreign currency translation and transaction adjustments. Translation adjustments result from the conversion of the foreign subsidiaries’ balance sheets and income statements to U.S. Dollars at year-end exchange rates and weighted average exchange rates, respectively. Translation adjustments resulting from this process are recorded directly into stockholders’ equity. Transaction adjustments result from currency exchange movements when one of our companies transacts business in a currency that differs from its local currency. These adjustments are recorded as gains or losses in our statements of operations. Our business transactions are spread across numerous countries and currencies. This geographic diversity reduces the risk to our operating results. As noted in Management’s Discussion and Analysis above, we attempt to minimize the net impact of currency on operating earnings by denominating an amount of billings in a currency such that it would provide a hedge against the operating expenses being incurred in that currency.
Interest Rate Risk – We have minimal interest rate risk. We had no debt outstanding at December 31, 2016. Our cash, cash equivalents, and short term investments are invested in short-term instruments at current market rates. If rates were to increase or decrease by one percentage point, the company’s interest income would increase or decrease approximately $1,442 annually.
Impairment Risk – At December 31, 2016, we had goodwill of $54,409 and other intangible assets of $46,549, primarily from acquisitions including eSignLive in 2015, Risk IDS in 2014, Cronto in 2013, and other prior acquisitions. We assess the net realizable value of goodwill at least annually, and the net realizable value of
54
Table of Contents
other intangible assets whenever events or circumstances change indicating the carrying value may not be recoverable. For the twelve months ended December 31, 2016, 2015, and 2014, we did not incur any impairments however, we may incur impairment charges in future periods.
Item 8 - Financial Statements and Supplementary Data
The information in response to this item is included in our consolidated financial statements, together with the report thereon of KPMG LLP, appearing on pages F-1 through F-29 of this Form 10-K, and in Item 7 under the heading Management’s Discussion and Analysis of Financial Condition and Results of Operations.
Item 9 - Changes in and Disagreements with Accountants on Accounting and Financial Disclosure
None.
Item 9A - Controls and Procedures
(a) Disclosure Controls and Procedures
Our management, with the participation of our Chief Executive Officer and Chief Financial Officer, who, respectively, are our principal executive officer and principal financial officer, conducted an evaluation of the effectiveness of the design and operation of our disclosure controls and procedures (as defined in Rule 13a-15 under the Securities Exchange Act of 1934, as amended (the “Exchange Act”) as of December 31, 2016. Disclosure controls and procedures include, without limitation, controls and procedure designed to ensure (i) information required to be disclosed by us in our reports that we file or submit under the Exchange Act is recorded, processed, summarized and reported within the time periods specified in the Securities and Exchange Commission’s rules and forms, and (ii) information required to be disclosed by us in our reports that we file or submit under the Exchange Act is accumulated and communicated to our management, including our principal executive and principal financial officers, or persons performing similar functions, as appropriate to allow timely decisions regarding required disclosure.
Based on this evaluation, our Chief Executive Officer and Chief Financial Officer concluded that due to the material weakness in our internal control over financial reporting described below in the Management’s Report on Internal Control Over Financial Reporting, our disclosure controls and procedures were not effective as of December 31, 2016.
(b) Management’s Annual Report on Internal Control over Financial Reporting
The management of VASCO Data Security International, Inc. is responsible for establishing and maintaining adequate internal control over financial reporting. Internal control over financial reporting is defined in Rule 13a-15(f) or 15d-15(f) promulgated under the Exchange Act as a process designed by, or under the supervision of, the company’s principal executive and principal financial officers and effected by the company’s board of directors, management and other personnel, to provide reasonable assurance regarding the reliability of financial reporting and the preparation of financial statements for external purposes in accordance with generally accepted accounting principles and includes those policies and procedures that:
| • | Pertain to the maintenance of records that in reasonable detail accurately and fairly reflect the transactions and dispositions of the assets of the company; |
| • | Provide reasonable assurance that transactions are recorded as necessary to permit preparation of financial statements in accordance with generally accepted accounting principles, and that receipts and expenditures of the company are being made only in accordance with authorizations of management and directors of the company; and |
| • | Provide reasonable assurance regarding prevention or timely detection of unauthorized acquisition, use or disposition of the company’s assets that could have a material effect on the financial statements. |
55
Table of Contents
A material weakness is a deficiency, or a combination of deficiencies, in internal control over financial reporting, such that there is a reasonable possibility that a material misstatement of the company’s annual or interim consolidated financial statements will not be prevented or detected on a timely basis. A deficiency exists when the design or operation of a control does not allow management or employees, in the normal course of performing their assigned functions, to prevent or detect misstatements on a timely basis.
Our management, led by our Chief Executive Officer and Chief Financial Officer, assessed the effectiveness of internal control over financial reporting as of December 31, 2016 using the criteria set forth in Internal Control-Integrated Framework (2013) issued by the Committee of Sponsoring Organizations of the Treadway Commission (COSO 2013 Framework). Management’s evaluation of our internal control over financial reporting determined that the company’s internal control over financial reporting was not effective based on those criteria as of December 31, 2016 due to the material weakness described below.
Management has identified the following control deficiencies that constituted a material weakness in our internal control over financial reporting as of December 31, 2016:
| • | We did not maintain sufficiently trained resources with knowledge of accounting for complex multiple element software revenue arrangements at Silanis Technology, Inc. and as a result did not conduct an effective risk assessment process to design and implement effective process level control activities to account for revenue from such customer arrangements under ASC 985-605 and ASC 605-25. |
| • | We did not maintain sufficiently trained resources with knowledge of internal control over financial reporting as it relates to accounting for business combinations and as a result did not design and implement effective process level control activities over the review of significant inputs and assumptions used to value acquired assets and assumed liabilities in the acquisition of Silanis Technology, Inc. |
| • | We did not design and implement effective monitoring controls related to the integration of Silanis Technology, Inc. subsequent to its acquisition. |
The deficiencies led to a material misstatement in product revenue which was corrected prior to the issuance of the financial statements. The deficiencies also led to immaterial misstatements in product and service revenue, deferred revenue, cost of sales and operating expenses, as well as goodwill, intangible assets and other working capital assets and liabilities acquired in the Silanis Technology, Inc. acquisition. These deficiencies represented a material weakness in our internal control over financial reporting as of December 31, 2016 because there is a reasonable possibility that material misstatements to our consolidated financial statements will not be prevented or detected on a timely basis.
Our independent registered public accounting firm, KPMG LLP, has issued an adverse report on the effectiveness of our internal control over financial reporting. This report is included within Item 9A of this Form 10-K.
(c) Changes in Internal Controls over Financial Reporting
Management has evaluated, with the participation of our Chief Executive Officer and Chief Financial Officer, whether any changes in our internal control over financial reporting that occurred during our last fiscal quarter have materially affected, or are reasonably likely to materially affect, our internal control over financial reporting. Other than the material weakness, identified currently and described above, there have been no changes in internal control over financial reporting during the period covered by this Report that have materially affected, or are reasonably likely to materially affect, our internal control over financial reporting.
56
Table of Contents
(d) Management’s Remediation Plan
To remediate the material weakness described above, we have initiated implementation of compensating controls in the near term. In addition we will:
| • | Design and implement effective process level control activities to account for complex multiple element software revenue arrangements under ASC 985-605 and ASC 605-25 at Silanis Technology, Inc.; |
| • | Design and implement effective process level control activities over the review of significant inputs and assumptions used to value acquired assets and assumed liabilities; and |
| • | Design and implement effective monitoring controls over the integration of future acquisitions. |
We expect to procure resources, possibly including outside third parties, and educate new and existing resources in order to execute the remediation plan and maintain an effective internal control environment on an ongoing basis.
The material weakness will be considered remediated when management concludes that, through testing, the applicable remedial controls are designed and implemented effectively. We expect remediation of this material weakness will be completed in fiscal year 2017.
57
Table of Contents
Report of Independent Registered Public Accounting Firm
The Board of Directors and Stockholders
VASCO Data Security International, Inc.:
We have audited VASCO Data Security International, Inc.’s (“the Company’s”) internal control over financial reporting as of December 31, 2016, based on criteria established in Internal Control—Integrated Framework (2013) issued by the Committee of Sponsoring Organizations of the Treadway Commission (COSO). The Company’s management is responsible for maintaining effective internal control over financial reporting and for its assessment of the effectiveness of internal control over financial reporting, included in the accompanying Management’s Annual Report on Internal Control over Financial Reporting. Our responsibility is to express an opinion on the Company’s internal control over financial reporting based on our audit.
We conducted our audit in accordance with the standards of the Public Company Accounting Oversight Board (United States). Those standards require that we plan and perform the audit to obtain reasonable assurance about whether effective internal control over financial reporting was maintained in all material respects. Our audit included obtaining an understanding of internal control over financial reporting, assessing the risk that a material weakness exists, and testing and evaluating the design and operating effectiveness of internal control based on the assessed risk. Our audit also included performing such other procedures as we considered necessary in the circumstances. We believe that our audit provides a reasonable basis for our opinion.
A company’s internal control over financial reporting is a process designed to provide reasonable assurance regarding the reliability of financial reporting and the preparation of financial statements for external purposes in accordance with generally accepted accounting principles. A company’s internal control over financial reporting includes those policies and procedures that (1) pertain to the maintenance of records that, in reasonable detail, accurately and fairly reflect the transactions and dispositions of the assets of the company; (2) provide reasonable assurance that transactions are recorded as necessary to permit preparation of financial statements in accordance with generally accepted accounting principles, and that receipts and expenditures of the company are being made only in accordance with authorizations of management and directors of the company; and (3) provide reasonable assurance regarding prevention or timely detection of unauthorized acquisition, use, or disposition of the company’s assets that could have a material effect on the financial statements.
Because of its inherent limitations, internal control over financial reporting may not prevent or detect misstatements. Also, projections of any evaluation of effectiveness to future periods are subject to the risk that controls may become inadequate because of changes in conditions, or that the degree of compliance with the policies or procedures may deteriorate.
A material weakness is a deficiency, or a combination of deficiencies, in internal control over financial reporting, such that there is a reasonable possibility that a material misstatement of the company’s annual or interim financial statements will not be prevented or detected on a timely basis. A material weakness related to ineffective design and implementation of process level control activities to account for complex multiple element software revenue arrangements at Silanis Technology, Inc., and the review of significant inputs and assumptions used to value acquired assets and assumed liabilities in the acquisition of Silanis Technology, Inc., and ineffective design and implementation of monitoring controls related to the integration of Silanis Technology, Inc. subsequent to its acquisition has been identified and included in management’s assessment. We also have audited, in accordance with the standards of the Public Company Accounting Oversight Board (United States), the consolidated balance sheets of VASCO Data Security International, Inc. and subsidiaries as of December 31, 2016 and 2015, and the related consolidated statements of operations, comprehensive income, stockholders’ equity, and cash flows for each of the years in the three-year period ended December 31, 2016. This material weakness was considered in determining the nature, timing, and extent of audit tests applied in our audit of the 2016 consolidated financial statements, and this report does not affect our report dated March 10, 2017, which expressed an unqualified opinion on those consolidated financial statements.
58
Table of Contents
In our opinion, because of the effect of the aforementioned material weakness on the achievement of the objectives of the control criteria, VASCO Data Security International, Inc. has not maintained effective internal control over financial reporting as of December 31, 2016, based on criteria established in Internal Control - Integrated Framework (2013) issued by the Committee of Sponsoring Organizations of the Treadway Commission (COSO).
We do not express an opinion or any other form of assurance on management’s statements referring to corrective actions taken after December 31, 2016, relative to the aforementioned material weakness in internal control over financial reporting.
/s/ KPMG LLP
Chicago, Illinois
March 10, 2017
59
Table of Contents
Item 10 - Directors, Executive Officers and Corporate Governance
All information in response to this Item is incorporated by reference to the “Directors and Executive Officers” and “Section 16(a) Beneficial Ownership Compliance” sections of VASCO’s Proxy Statement for the 2017 Annual Meeting of Stockholders.
Item 11 - Executive Compensation
The information in response to this Item is incorporated by reference to the “Executive Compensation” section of VASCO’s Proxy Statement for the 2017 Annual Meeting of Stockholders.
Item 12 - Security Ownership of Certain Beneficial Owners and Management and Related Stockholder Matters
The information in response to this Item is incorporated by reference to the “Security Ownership of Certain Beneficial Owners, Directors and Management” section of VASCO’s Proxy Statement for the 2017 Annual Meeting of Stockholders.
Item 13 - Certain Relationships and Related Transactions, and Director Independence
The information in response to this Item is incorporated by reference to the “Directors and Executive Officers” and “Transactions with Related Persons” sections of VASCO’s Proxy Statement for the 2017 Annual Meeting of Stockholders.
Item 14 - Principal Accounting Fees and Services
The information in response to this Item is incorporated by reference to the “Report of the Audit Committee” section of VASCO’s Proxy Statement for the 2017 Annual Meeting of Stockholders.
60
Table of Contents
Item 15 - Exhibits and Financial Statement Schedules
(a) The following documents are filed as part of this Form 10-K.
(1) The following consolidated financial statements and notes thereto, and the related independent auditors’ report, are included on pages F-1 through F-29 of this Form 10-K:
Report of Independent Registered Public Accounting Firm
Consolidated Balance Sheets as of December 31, 2016 and 2015
Consolidated Statements of Operations for the Years Ended December 31, 2016, 2015 and 2014
Consolidated Statements of Comprehensive Income for the Years Ended December 31, 2016, 2015 and 2014
Consolidated Statements of Stockholders’ Equity for the Years Ended December 31, 2016, 2015 and 2014
Consolidated Statements of Cash Flows for the Years Ended December 31, 2016, 2015 and 2014
Notes to Consolidated Financial Statements
(2) The following consolidated financial statement schedule of the company is included on page F-30 of this Form 10-K:
Schedule II – Valuation and Qualifying Accounts
All other financial statement schedules are omitted because such schedules are not required or the information required has been presented in the aforementioned consolidated financial statements.
(3) The following exhibits are filed with this Form 10-K or incorporated by reference as set forth at the end of the list of exhibits:
| Exhibit |
Description | |
| 2.1 |
IP Purchase Agreement between VASCO Data Security International GmbH and DigiNotar Technologie B.V., DigiNotar Notariaat B.V., DigiNotar B.V., and DigiNotar Holding B.V. dated January 10, 2011. (Incorporated by reference—Form 8K filed January 14, 2011.) | |
| 2.2 |
Share Sale and Purchase Agreement between VASCO Data Security International GmbH and DigiNotar Holding B.V., DigiNotar B.V., and DigiNotar Notariaat B.V. dated January 10, 2011. (Incorporated by reference—Form 8K filed January 14, 2011.) | |
| 2.3 |
Agreement between VASCO Data Security International GmbH and D.B.A. ten Burg Holding B.V. and Bosco Holding B.V. dated January 10, 2011. (Incorporated by reference—Form 8K filed January 14, 2011.) | |
| 2.4 |
Agreement for the Sale and Purchase of the Entire Issued Capital of Cronto Limited dated May 20, 2013. (Incorporated by reference—Form 8K filed May 23, 2013.) | |
| 2.5 |
Arrangement Agreement, dated October 6, 2015, among VASCO Data Security International, Inc., 685102 N.B. Inc., Silanis Technology Inc., Silanis International Limited, Silanis Canada Inc., and Silanis Agent Inc. (incorporated by reference—Form 8-K filed October 13, 2015.) | |
| 3.1 |
Certificate of Incorporation of Registrant, as amended. (Incorporated by reference to the Registrant’s Registration Statement on Form S-4, as amended (Registration No. 333-35563), originally filed on September 12, 1997.) | |
61
Table of Contents
| Exhibit |
Description | |
| 3.2 |
Bylaws of Registrant, as amended and restated December 12, 2007. (Incorporated by reference—Form 8-K filed on December 18, 2007.) | |
| 4.1 |
Specimen of Registrant’s Common Stock Certificate. (Incorporated by reference to the Registrant’s Registration Statement on Form S-4, as amended (Registration No. 333-35563), originally filed on September 12, 1997.) | |
| 4.2* |
Form of Award Agreement for Stock Option Grant under the VASCO Data Security International, Inc. 1997 Stock Compensation Plan, as Amended and Restated. (Incorporated by reference—Form 10-K filed March 14, 2008.) | |
| 4.3* |
Form of Award Agreement for Restricted Shares under the VASCO Data Security International, Inc. 1997 Stock Compensation Plan, as Amended and Restated (time-based vesting) with respect to awards granted on January 9, 2008. (Incorporated by reference—Form 8-K/A filed January 16, 2008.) | |
| 4.4* |
Form of Award Agreement for Restricted Shares under the VASCO Data Security International, Inc. 1997 Stock Compensation Plan as Amended and Restated (performance-based vesting) with respect to awards granted on January 9, 2008. (Incorporated by reference—Form 8-K/A filed January 16, 2008.) | |
| 4.5* |
Form of Award Agreement for Deferred Stock under the VASCO Data Security International, Inc. 1997 Stock Compensation Plan, as Amended and Restated (performance-based vesting). (Incorporated by reference—Form 10-K filed March 14, 2008.) | |
| 4.6* |
Form of Award Agreement for Restricted Shares under the VASCO Data Security International, Inc. 1997 Stock Compensation Plan, as Amended and Restated (time-based vesting) with respect to awards granted on or after January 8, 2009. (Incorporated by reference—Form 8K filed January 14, 2009.) | |
| 4.7* |
Form of Award Agreement for Restricted Shares under the VASCO Data Security International, Inc. 1997 Stock Compensation Plan as Amended and Restated (performance-based vesting) with respect to awards granted on or after January 8, 2009. (Incorporated by reference—Form 8-K filed January 14, 2009.) | |
| 4.8* |
Form of Option Agreement under the VASCO Data Security International, Inc. 1997 Stock Compensation Plan as Amended and Restated with respect to awards granted prior to January 9, 2008. (Incorporated by reference to the Registrant’s Registration Statement on Form S-4, as amended (Registration No. 333-35563), originally filed with the Securities and Exchange Commission on September 12, 1997.) | |
| 4.9* |
Form of Award Agreement for Deferred Stock under the VASCO Data Security International, Inc. 2009 Equity Incentive Plan. (Incorporated by reference—Form 10-K filed March 16, 2010.) | |
| 4.10* |
Form of Award Agreement for Restricted Shares under the VASCO Data Security International, Inc. 2009 Equity Incentive Plan. (Incorporated by reference—Form 10-K filed March 16, 2010.) | |
| 4.11* |
Form of Award Agreement for Performance Shares under the VASCO Data Security International, Inc. 2009 Equity Incentive Plan with respect to awards granted in 2010. (Incorporated by reference—Form 10-K filed March 16, 2010.) | |
| 4.12* |
Form of Award Agreement for Performance Shares under the VASCO Data Security International, Inc. 2009 Equity Incentive Plan with respect to awards granted in 2011. (Incorporated by reference—Form 10-K filed March 11, 2011.) | |
| 4.13* |
Form of Award Agreement for Performance Shares under VASCO Data Security International, Inc. 2009 Equity Incentive Plan with respect to awards granted in 2012. (Incorporated by reference—Form 10-K filed March 9, 2012.) | |
62
Table of Contents
| Exhibit |
Description | |
| 4.14* |
Form of Award Agreement for Performance Shares under VASCO Data Security International, Inc. 2009 Equity Incentive Plan with respect to awards granted in 2013. (Incorporated by reference—Form 10-K filed March 8, 2013.) | |
| 4.15* |
Form of Award Agreement for Performance Shares under VASCO Data Security International, Inc. 2009 Equity Incentive Plan with respect to awards granted in 2014. (Incorporated by reference—Form 10-K filed March 12, 2014.) | |
| 4.16* |
Form of Award Agreement for Performance Shares under VASCO Data Security International, Inc. 2009 Equity Incentive Plan with respect to awards granted in 2015. (Incorporated by reference—Form 10-K filed March 13, 2015.) | |
| 4.17* |
Award Agreement for Restricted Shares under VASCO Data Security International, Inc. 2009 Equity Incentive Plan made as of October 5, 2015 between VASCO Data Security International, Inc. and Mark Stephen Hoyt. (Incorporated by reference—Form 8-K filed October 5, 2015.) | |
| 4.18* |
Form of Award Agreement for Performance Shares under VASCO Data Security International, Inc. 2009 Equity Incentive Plan with respect to awards granted in 2016. (Incorporated by reference—Form 10-K filed February 29, 2016.) | |
| 4.19* |
Fiscal Year 2016 Form of Award Agreement for Deferred Stock under the VASCO Data Security International, Inc. 2009 Equity Incentive Plan. (Incorporated by reference—Form 10-K filed February 29, 2016.) | |
| 4.20* |
Form of Award Agreement for Restricted Shares under the VASCO Data Security International, Inc. 2009 Equity Incentive Plan with respect to awards granted January 5, 2017. | |
| 4.21* |
Form of Award Agreement for Performance Shares under VASCO Data Security International, Inc. 2009 Equity Incentive Plan with respect to awards granted January 5, 2017. | |
| 4.22* |
Fiscal Year 2017 Form of Award Agreement for Deferred Stock under the VASCO Data Security International, Inc. 2009 Equity Incentive Plan. | |
| 10.1* |
1997 VASCO Data Security International, Inc. Stock Compensation Plan, as Amended and Restated. (Incorporated by reference to the Registrant’s Definitive Proxy Statement pursuant to Schedule 14A, filed with the SEC on April 30, 1999.) | |
| 10.3* |
Employment agreement with Clifford Bown. (Incorporated by reference to the Registrant’s Annual Report on Form 10-K, originally filed with the Securities and Exchange Commission on March 31, 2003.) | |
| 10.4 |
Share Sale and Purchase Agreement by and among VASCO Data Security International, Inc., A.O.S. Holding B.V., Filipan Beheer B.V., Mr. Mladen Filipan and Pijnenburg Beheer N.V., dated February 4, 2005 (Incorporated by reference—Form 8-K filed February 8, 2005.) | |
| 10.5* |
Employment Agreement by and between VASCO Data Security International, Inc. and Jan Valcke effective as of January 1, 2005. (Incorporated by reference—Form 8-K filed July 1, 2005.) | |
| 10.6* |
Letter agreement dated February 26, 2007, supplementing the Employment Agreement dated January 1, 2003, between the company and Clifford K. Bown. (Incorporated by reference—Form 8K filed March 2, 2007.) | |
| 10.7* |
Letter agreement dated January 8, 2009, supplementing the Employment Agreement dated January 1, 2003, between the company and Clifford K. Bown. (Incorporated by reference—Form 8K filed January 14, 2009.) | |
| 10.9* |
Employment Agreement Amendment, dated December 31, 2008 by and between VASCO Data Security International, Inc. and Clifford K. Bown (Incorporated by reference—Form 8-K filed January 14, 2009.) | |
63
Table of Contents
| Exhibit |
Description | |
| 10.10* |
Amendment to the VASCO Data Security International, Inc. 1997 Stock Compensation Plan, dated December 19, 2008. (Incorporated by reference—Form 8-K filed January 14, 2009.) | |
| 10.11* |
VASCO Data Security International, Inc. 2009 Equity Incentive Plan, effective December 19, 2008. (Incorporated by reference to the Registrant’s Definitive Proxy Statement pursuant to Schedule 14A, filed with the SEC on April 30, 2009.) | |
| 10.12* |
VASCO Data Security International, Inc. Executive Incentive Compensation Plan, effective December 19, 2008. (Incorporated by reference to the Registrant’s Definitive Proxy Statement pursuant to Schedule 14A, filed with the SEC on April 30, 2009.) | |
| 10.13* |
Amended and Restated Employment Agreement effective as of January 1, 2011 between VASCO Data Security International, Inc. and T. Kendall Hunt. (Incorporated by reference—Form 8-K filed December 21, 2010.) | |
| 10.14* |
Letter Agreement dated February 15, 2011, by and between VASCO Data Security International, Inc. and T. Kendall Hunt. (Incorporated by reference—Form 8-K filed February 22, 2011.) | |
| 10.15* |
First Amendment dated April 23, 2014, to Amended and Restated Employment Agreement effective January 1, 2011 between VASCO Data Security International, Inc. and T. Kendall Hunt. (Incorporated by reference—Form 8-K filed April 28, 2014.) | |
| 10.16* |
Second Amendment dated November 24, 2014, to Amended and Restated Employment Agreement effective January 1, 2011 between VASCO Data Security International, Inc. and T. Kendall Hunt. (Incorporated by reference—Form 8-K filed November 25, 2014.) | |
| 10.17* |
Retention Agreement dated March 16, 2015 between VASCO Data Security International, Inc. and Clifford K. Bown. (Incorporated by reference—Form 8-K filed March 16, 2015.) | |
| 10.18* |
Employment Agreement, effective October 5, 2015, by and between VASCO Data Security International, Inc. and Mark Stephen Hoyt. (Incorporated by reference—Form 8-K filed October 5, 2015) | |
| 10.19* |
Third Amendment dated November 20, 2015, to Amended and Restated Employment Agreement effective January 1, 2011 between VASCO Data Security International, Inc. and T. Kendall Hunt. (Incorporated by reference—Form 8-K filed November 20, 2015.) | |
| 10.20* |
Fourth Amendment dated August 2, 2016, to Amended and Restated Employment Agreement effective January 1, 2011 between VASCO Data Security International, Inc. and T. Kendall Hunt. (Incorporated by reference—Form 10-Q filed August 4, 2016.) | |
| 10.21* |
Employment Agreement, dated August 2, 2016, by and between VASCO Data Security International GmbH and T. Kendall Hunt. (Incorporated by reference—Form 10-Q filed August 4, 2016) | |
| 10.22* |
Employment Agreement, dated December 1, 2015, by and between VASCO Data Security International, Inc. and Scott Clements, and Amendment No. 1 to Employment Agreement effective as of November 15, 2015. (Incorporated by reference—Form 8-K filed November 15, 2016) | |
| 14.1 |
VASCO Data Security International, Inc. and Subsidiaries Code of Conduct and Ethics. (Incorporated by reference—Form 8-K filed March 12, 2008.) | |
| 14.2 |
Amended VASCO Data Security International, Inc. and Subsidiaries Code of Conduct and Ethics. (Incorporated by reference—Form 8-K filed April 27, 2010.) | |
| 14.3 |
Amended Corporate Governance Guidelines of the Board of Directors of VASCO Data Security International, Inc. and Subsidiaries. (Incorporated by reference—Form 8-K filed June 21, 2013 and Form 8-K/A filed July 30, 2013.) | |
| 21 |
Subsidiaries of Registrant. | |
| 23 |
Consent of KPMG LLP. | |
64
Table of Contents
| Exhibit |
Description | |
| 31.1 |
Rule 13a-14(a)/15d-14(a) Certification of Principal Executive Officer pursuant to Section 302 of the Sarbanes-Oxley Act of 2002, dated March 10, 2017. | |
| 31.2 |
Rule 13a-14(a)/15d-14(a) Certification of Principal Financial Officer pursuant to Section 302 of the Sarbanes-Oxley Act of 2002, dated March 10, 2017. | |
| 32.1 |
Section 1350 Certification of Principal Executive Officer pursuant to Section 906 of the Sarbanes-Oxley Act of 2002, dated March 10, 2017. | |
| 32.2 |
Section 1350 Certification of Principal Financial Officer pursuant to Section 906 of the Sarbanes-Oxley Act of 2002, dated March 10, 2017. | |
| 101.INS |
XBRL Instance Document | |
| 101.SCH |
XBRL Taxonomy Extension Schema Document | |
| 101.CAL |
XBRL Taxonomy Extension Calculation Linkbase Document | |
| 101.LAB |
XBRL Taxonomy Extension Label Linkbase Document | |
| 101.PRE |
XBRL Taxonomy Extension Presentation Linkbase Document | |
| 101.DEF |
XBRL Taxonomy Extension Definition Linkbase Document | |
| * | Management contract or compensatory plan or arrangement required to be filed as an exhibit to this Annual Report on Form 10-K. |
VASCO Data Security International, Inc. will furnish any of the above exhibits to stockholders upon written request addressed to the Secretary at the address given on the cover page of this Form 10-K. The charge for furnishing copies of the exhibits is $0.25 per page, plus postage.
65
Table of Contents
VASCO Data Security International, Inc.
INDEX TO FINANCIAL STATEMENTS AND SCHEDULE
| Financial Statements |
||||
| F-2 | ||||
| Consolidated Balance Sheets as of December 31, 2016 and 2015 |
F-3 | |||
| Consolidated Statements of Operations for the Years Ended December 31, 2016, 2015 and 2014 |
F-4 | |||
| Consolidated Statements of Comprehensive Income for the Years Ended December 31, 2016, 2015 and 2014 |
F-5 | |||
| Consolidated Statements of Stockholders’ Equity for the Years Ended December 31, 2016, 2015 and 2014 |
F-6 | |||
| Consolidated Statements of Cash Flows for the Years Ended December 31, 2016, 2015 and 2014 |
F-7 | |||
| F-8 | ||||
| Financial Statement Schedule |
||||
| The following consolidated financial statement schedule is included herein: |
||||
| F-34 | ||||
All other financial statement schedules are omitted because they are not applicable or the required information is shown in the consolidated financial statements or notes thereto.
F-1
Table of Contents
Report of Independent Registered Public Accounting Firm
The Board of Directors and Stockholders
VASCO Data Security International, Inc.:
We have audited the accompanying consolidated balance sheets of VASCO Data Security International, Inc. and subsidiaries (the Company) as of December 31, 2016 and 2015, and the related consolidated statements of operations, comprehensive income, stockholders’ equity, and cash flows for each of the years in the three-year period ended December 31, 2016. In connection with our audits of the consolidated financial statements, we also have audited the accompanying consolidated financial statement Schedule II – Valuation and Qualifying Accounts. These consolidated financial statements and the consolidated financial statement schedule are the responsibility of the Company’s management. Our responsibility is to express an opinion on these consolidated financial statements and the consolidated financial statement schedule based on our audits.
We conducted our audits in accordance with the standards of the Public Company Accounting Oversight Board (United States). Those standards require that we plan and perform the audit to obtain reasonable assurance about whether the financial statements are free of material misstatement. An audit includes examining, on a test basis, evidence supporting the amounts and disclosures in the financial statements. An audit also includes assessing the accounting principles used and significant estimates made by management, as well as evaluating the overall financial statement presentation. We believe that our audits provide a reasonable basis for our opinion.
In our opinion, the consolidated financial statements referred to above present fairly, in all material respects, the financial position of the Company as of December 31, 2016 and 2015, and the results of their operations and their cash flows for each of the years in the three-year period ended December 31, 2016, in conformity with U.S. generally accepted accounting principles. Also in our opinion, the related consolidated financial statement schedule, when considered in relation to the basic consolidated financial statements taken as a whole, presents fairly, in all material respects, the information set forth herein.
We also have audited, in accordance with the standards of the Public Company Accounting Oversight Board (United States), the Company’s internal control over financial reporting as of December 31, 2016, based on criteria established in Internal Control—Integrated Framework (2013) issued by the Committee of Sponsoring Organizations of the Treadway Commission (COSO), and our report dated March 10, 2017 expressed an adverse opinion on the effectiveness of the Company’s internal control over financial reporting.
/s/ KPMG LLP
Chicago, Illinois
March 10, 2017
F-2
Table of Contents
VASCO Data Security International, Inc.
(in thousands, except per share data)
| December 31, | ||||||||
| 2016 | 2015 | |||||||
| ASSETS |
||||||||
| Current assets |
||||||||
| Cash and equivalents |
$ | 49,345 | $ | 78,522 | ||||
| Short term investments |
94,856 | 44,961 | ||||||
| Accounts receivable, net of allowance for doubtful accounts of $535 in 2016 and $621 in 2015 |
36,693 | 29,426 | ||||||
| Inventories, net |
17,420 | 20,618 | ||||||
| Prepaid expenses |
3,249 | 3,051 | ||||||
| Foreign sales tax receivable |
186 | 510 | ||||||
| Deferred income taxes |
0 | 1,495 | ||||||
| Other current assets |
5,404 | 4,778 | ||||||
| Assets of discontinued operations |
6 | 4 | ||||||
|
|
|
|
|
|||||
| Total current assets |
207,159 | 183,365 | ||||||
| Property and equipment: |
||||||||
| Furniture and fixtures |
5,547 | 5,354 | ||||||
| Office equipment |
13,028 | 11,512 | ||||||
|
|
|
|
|
|||||
| 18,575 | 16,866 | |||||||
| Accumulated depreciation |
(15,294 | ) | (13,767 | ) | ||||
|
|
|
|
|
|||||
| Property and equipment, net |
3,281 | 3,099 | ||||||
| Goodwill, net of accumulated amortization |
54,409 | 80,853 | ||||||
| Intangible assets, net of accumulated amortization |
46,549 | 37,970 | ||||||
| Other assets |
15,872 | 6,535 | ||||||
|
|
|
|
|
|||||
| Total assets |
$ | 327,270 | $ | 311,822 | ||||
|
|
|
|
|
|||||
| LIABILITIES AND STOCKHOLDERS’ EQUITY |
||||||||
| Current liabilities |
||||||||
| Accounts payable |
$ | 8,915 | $ | 8,803 | ||||
| Deferred revenue |
36,364 | 22,450 | ||||||
| Accrued wages and payroll taxes |
10,894 | 10,291 | ||||||
| Income taxes payable |
4,594 | 4,823 | ||||||
| Other accrued expenses |
5,454 | 7,820 | ||||||
| Deferred compensation |
1,729 | 1,503 | ||||||
| Liabilities of discontinued operations |
10 | 0 | ||||||
|
|
|
|
|
|||||
| Total current liabilities |
67,960 | 55,690 | ||||||
| Other long-term liabilities |
1,878 | 76 | ||||||
| Deferred income taxes |
853 | 8,008 | ||||||
|
|
|
|
|
|||||
| Total liabilities |
70,691 | 63,774 | ||||||
|
|
|
|
|
|||||
| Stockholders’ equity |
||||||||
| Preferred stock: 500 shares authorized, none issued and outstanding at December 31, 2016 or 2015 |
0 | 0 | ||||||
| Common stock: $.001 par value per share, 75,000 shares authorized; 40,097 and 40,108 shares issued and outstanding at December 31, 2016 and 2015, respectively |
40 | 40 | ||||||
| Additional paid-in capital |
87,481 | 85,766 | ||||||
| Accumulated income |
178,551 | 168,036 | ||||||
| Accumulated other comprehensive income (loss) |
(9,493 | ) | (5,794 | ) | ||||
|
|
|
|
|
|||||
| Total stockholders’ equity |
256,579 | 248,048 | ||||||
|
|
|
|
|
|||||
| Total liabilities and stockholders’ equity |
$ | 327,270 | $ | 311,822 | ||||
|
|
|
|
|
|||||
See accompanying notes to consolidated financial statements.
F-3
Table of Contents
VASCO Data Security International, Inc.
CONSOLIDATED STATEMENTS OF OPERATIONS
(in thousands, except per share data)
| For the years ended December 31, | ||||||||||||
| 2016 | 2015 | 2014 | ||||||||||
| Revenue |
||||||||||||
| Product and license |
$ | 156,057 | $ | 218,908 | $ | 182,556 | ||||||
| Services and other |
36,247 | 22,535 | 18,981 | |||||||||
|
|
|
|
|
|
|
|||||||
| Total revenue |
192,304 | 241,443 | 201,537 | |||||||||
| Cost of goods sold |
||||||||||||
| Products |
53,191 | 95,028 | 72,802 | |||||||||
| Services and other |
8,456 | 2,875 | 3,093 | |||||||||
|
|
|
|
|
|
|
|||||||
| Total cost of goods sold |
61,647 | 97,903 | 75,895 | |||||||||
| Gross profit |
130,657 | 143,540 | 125,642 | |||||||||
|
|
|
|
|
|
|
|||||||
| Operating costs: |
||||||||||||
| Sales and marketing |
57,347 | 38,199 | 42,189 | |||||||||
| Research and development |
23,214 | 17,457 | 18,546 | |||||||||
| General and administrative |
31,648 | 32,489 | 22,287 | |||||||||
| Amortization of purchased intangible assets |
8,849 | 4,942 | 4,532 | |||||||||
|
|
|
|
|
|
|
|||||||
| Total operating costs |
121,058 | 93,087 | 87,554 | |||||||||
|
|
|
|
|
|
|
|||||||
| Operating income |
9,599 | 50,453 | 38,088 | |||||||||
| Interest income, net |
785 | 364 | 118 | |||||||||
| Other income, net |
1,040 | 81 | (286 | ) | ||||||||
|
|
|
|
|
|
|
|||||||
| Income from continuing operations before income taxes |
11,424 | 50,898 | 37,920 | |||||||||
| Provision for income taxes |
863 | 8,704 | 5,309 | |||||||||
|
|
|
|
|
|
|
|||||||
| Net income-continuing operations |
10,561 | 42,194 | 32,611 | |||||||||
| Net income (loss) from discontinued operations |
(47 | ) | (43 | ) | 873 | |||||||
|
|
|
|
|
|
|
|||||||
| Net income |
$ | 10,514 | $ | 42,151 | $ | 33,484 | ||||||
|
|
|
|
|
|
|
|||||||
| Basic income (loss) per share: |
||||||||||||
| Continuing operations |
$ | 0.27 | $ | 1.07 | $ | 0.83 | ||||||
| Discontinued operations |
(0.00 | ) | (0.00 | ) | 0.02 | |||||||
|
|
|
|
|
|
|
|||||||
| Total net income per share |
$ | 0.27 | $ | 1.07 | $ | 0.85 | ||||||
|
|
|
|
|
|
|
|||||||
| Diluted income (loss) per share: |
||||||||||||
| Continuing operations |
$ | 0.27 | $ | 1.06 | $ | 0.83 | ||||||
| Discontinued operations |
(0.00 | ) | (0.00 | ) | 0.02 | |||||||
|
|
|
|
|
|
|
|||||||
| Total net income per share |
$ | 0.27 | $ | 1.06 | $ | 0.85 | ||||||
|
|
|
|
|
|
|
|||||||
| Weighted average common shares outstanding: |
||||||||||||
| Basic |
39,719 | 39,568 | 39,337 | |||||||||
|
|
|
|
|
|
|
|||||||
| Diluted |
39,782 | 39,736 | 39,499 | |||||||||
|
|
|
|
|
|
|
|||||||
See accompanying notes to consolidated financial statements.
F-4
Table of Contents
VASCO Data Security International, Inc.
CONSOLIDATED STATEMENTS OF COMPREHENSIVE INCOME
(in thousands)
| For the years ended December 31, | ||||||||||||
| 2016 | 2015 | 2014 | ||||||||||
| Net income |
$ | 10,514 | $ | 42,151 | $ | 33,484 | ||||||
| Other comprehensive income (loss):- |
||||||||||||
| Currency translation adjustment |
(2,488 | ) | (3,292 | ) | (4,468 | ) | ||||||
| Pension adjustment, Net of tax of $624 |
(1,211 | ) | - | - | ||||||||
|
|
|
|
|
|
|
|||||||
| Comprehensive income |
$ | 6,815 | $ | 38,859 | $ | 29,016 | ||||||
|
|
|
|
|
|
|
|||||||
See accompanying notes to consolidated financial statements.
F-5
Table of Contents
VASCO Data Security International, Inc.
CONSOLIDATED STATEMENTS OF STOCKHOLDERS’ EQUITY
(in thousands)
| Additional Paid-In Capital |
Accumulated Income |
Accumulated Other Comprehensive Income (Loss) |
Total Stockholders’ Equity |
|||||||||||||||||||||
| Common Stock | ||||||||||||||||||||||||
| Description |
Shares | Amount | ||||||||||||||||||||||
| Balance at January 1, 2014 |
39,619 | $ | 40 | $ | 79,871 | $ | 92,401 | $ | 1,966 | $ | 174,278 | |||||||||||||
| Net income |
0 | 0 | 0 | 33,484 | 0 | 33,484 | ||||||||||||||||||
| Foreign currency translation adjustment |
0 | 0 | 0 | 0 | (4,468 | ) | (4,468 | ) | ||||||||||||||||
| Exercise of stock options |
20 | 0 | 51 | 0 | 0 | 51 | ||||||||||||||||||
| Restricted stock awards |
21 | 0 | 2,399 | 0 | 0 | 2,399 | ||||||||||||||||||
| Tax payments for stock issuances |
0 | 0 | (123 | ) | 0 | 0 | (123 | ) | ||||||||||||||||
| Tax benefits of stock based compensation |
0 | 0 | 253 | 0 | 0 | 253 | ||||||||||||||||||
|
|
|
|
|
|
|
|
|
|
|
|
|
|||||||||||||
| Balance at December 31, 2014 |
39,660 | 40 | 82,450 | 125,885 | (2,502 | ) | 205,873 | |||||||||||||||||
| Net income |
0 | 0 | 0 | 42,151 | 0 | 42,151 | ||||||||||||||||||
| Foreign currency translation adjustment |
0 | 0 | 0 | 0 | (3,292 | ) | (3,292 | ) | ||||||||||||||||
| Restricted stock awards |
448 | 0 | 3,835 | 0 | 0 | 3,835 | ||||||||||||||||||
| Tax payments for stock issuances |
0 | 0 | (837 | ) | 0 | 0 | (837 | ) | ||||||||||||||||
| Tax benefits of stock based compensation |
0 | 0 | 318 | 0 | 0 | 318 | ||||||||||||||||||
|
|
|
|
|
|
|
|
|
|
|
|
|
|||||||||||||
| Balance at December 31, 2015 |
40,108 | 40 | 85,766 | 168,036 | (5,794 | ) | 248,048 | |||||||||||||||||
| Net income |
0 | 0 | 0 | 10,514 | 0 | 10,514 | ||||||||||||||||||
| Foreign currency translation adjustment |
0 | 0 | 0 | 0 | (2,488 | ) | (2,488 | ) | ||||||||||||||||
| Restricted stock awards |
(11 | ) | 0 | 2,766 | 0 | 0 | 2,766 | |||||||||||||||||
| Tax payments for stock issuances |
0 | 0 | (1,051 | ) | 0 | 0 | (1,051 | ) | ||||||||||||||||
| Pension adjustment, net of tax of $624 |
0 | 0 | 0 | 0 | (1,211 | ) | |
(1,211 |
) | |||||||||||||||
|
|
|
|
|
|
|
|
|
|
|
|
|
|||||||||||||
| Balance at December 31, 2016 |
40,097 | $ | 40 | $ | 87,481 | $ | 178,550 | ($ | 9,493 | ) | $ | 256,578 | ||||||||||||
|
|
|
|
|
|
|
|
|
|
|
|
|
|||||||||||||
See accompanying notes to consolidated financial statements.
F-6
Table of Contents
VASCO Data Security International, Inc.
CONSOLIDATED STATEMENTS OF CASH FLOWS
(in thousands)
| For the years ended December 31, | ||||||||||||
| 2016 | 2015 | 2014 | ||||||||||
| Cash flows from operating activities: |
||||||||||||
| Net income from continuing operations |
$ | 10,561 | $ | 42,194 | $ | 32,611 | ||||||
| Adjustments to reconcile net income from continuing operations to net cash provided by continuing operations: |
||||||||||||
| Depreciation and amortization |
10,777 | 6,302 | 6,156 | |||||||||
| Loss on disposal of assets |
14 | 0 | 0 | |||||||||
| Deferred tax expense (benefit) |
(4,936 | ) | (691 | ) | 492 | |||||||
| Stock-based compensation |
2,766 | 3,835 | 2,399 | |||||||||
| Changes in assets and liabilities, net of effect of acquisitions: |
||||||||||||
| Accounts receivable, net |
(8,106 | ) | 2,860 | (4,660 | ) | |||||||
| Inventories |
3,198 | 13,257 | (8,222 | ) | ||||||||
| Foreign sales tax receivable |
336 | 49 | (112 | ) | ||||||||
| Other current assets |
(419 | ) | (243 | ) | 1,150 | |||||||
| Accounts payable |
163 | (6,645 | ) | 4,531 | ||||||||
| Income taxes payable |
(582 | ) | 2,946 | (2,063 | ) | |||||||
| Accrued expenses |
4 | 1,351 | 3,344 | |||||||||
| Current deferred compensation |
226 | 697 | 691 | |||||||||
| Deferred revenue |
14,396 | 2,996 | 2,437 | |||||||||
| Other long-term liabilities |
55 | 42 | 0 | |||||||||
|
|
|
|
|
|
|
|||||||
| Net cash provided by operating activities of continuing operations |
28,453 | 68,950 | 38,754 | |||||||||
|
|
|
|
|
|
|
|||||||
| Cash flows from investing activities of continuing operations: |
||||||||||||
| Purchase of short term investments |
(184,690 | ) | (109,747 | ) | (94,856 | ) | ||||||
| Maturities of short term investments |
134,775 | 129,725 | 29,916 | |||||||||
| Purchase of Silanis, net of cash acquired |
0 | (74,486 | ) | 0 | ||||||||
| Additions to property and equipment |
(2,043 | ) | (1,362 | ) | (1,453 | ) | ||||||
| Additions to intangible assets |
(144 | ) | (89 | ) | (112 | ) | ||||||
| Other assets |
(4,394 | ) | 3 | (1,295 | ) | |||||||
|
|
|
|
|
|
|
|||||||
| Net cash used in investing activities of continuing operations |
(56,496 | ) | (55,956 | ) | (67,800 | ) | ||||||
|
|
|
|
|
|
|
|||||||
| Cash flows from financing activities of continuing operations: |
||||||||||||
| Repayment of debt |
0 | (5,925 | ) | 0 | ||||||||
| Proceeds from exercise of stock options, net |
0 | 0 | 51 | |||||||||
| Tax payments for restricted stock issuances |
(1,051 | ) | (837 | ) | (123 | ) | ||||||
| Tax benefit of stock-based compensation |
0 | 318 | 253 | |||||||||
|
|
|
|
|
|
|
|||||||
| Net cash provided by (used in) financing activities of continuing operations |
(1,051 | ) | (6,444 | ) | 181 | |||||||
|
|
|
|
|
|
|
|||||||
| Cash flows from discontinued operations: |
||||||||||||
| Net cash provided by (used in) operating activities of discontinued operations |
(38 | ) | (158 | ) | 2,864 | |||||||
|
|
|
|
|
|
|
|||||||
| Net cash provided by (used in) discontinued operations |
(38 | ) | (158 | ) | 2,864 | |||||||
|
|
|
|
|
|
|
|||||||
| Effect of exchange rate changes on cash |
(45 | ) | (311 | ) | (165 | ) | ||||||
|
|
|
|
|
|
|
|||||||
| Net increase (decrease) in cash |
(29,177 | ) | 6,081 | (26,166 | ) | |||||||
| Cash and equivalents, beginning of year |
78,522 | 72,441 | 98,607 | |||||||||
|
|
|
|
|
|
|
|||||||
| Cash and equivalents, end of year |
$ | 49,345 | $ | 78,522 | $ | 72,441 | ||||||
|
|
|
|
|
|
|
|||||||
| Supplemental cash flow disclosures: |
||||||||||||
| Cash paid for income taxes |
$ | 5,982 | $ | 6,781 | $ | 6,109 | ||||||
| Cash paid for interest |
$ | 0 | $ | 0 | $ | 0 | ||||||
See accompanying notes to consolidated financial statements.
F-7
Table of Contents
VASCO DATA SECURITY INTERNATIONAL, INC.
NOTES TO CONSOLIDATED FINANCIAL STATEMENTS
(amounts in thousands, except per share data)
Unless otherwise noted, references in this Annual Report on Form 10-K to “VASCO”, “company”, “we”, “our” and “us” refer to VASCO Data Security International, Inc. and its subsidiaries.
Note 1 – Summary of Significant Accounting Policies
Nature of Operations
VASCO Data Security International, Inc. and its wholly owned subsidiaries design, develop, market and support hardware and software security systems that manage and secure access to information assets. VASCO has operations in Austria, Australia, Belgium, Brazil, Canada, China, France, India, Japan, The Netherlands, Singapore, Switzerland, the United Arab Emirates, the United Kingdom (U.K)., and the United States (U.S.).
In accordance with ASC 280, Segment Reporting, our operations are reported as a single operating segment.
Revision of Previously Issued Financial Statements
We have revised amounts reported in previously issued financial statements for periods presented in the Annual Report on Form 10-K related to costs of services erroneously recorded as operating expenses. We evaluated the aggregate effects of the errors to our previously issued financial statements in accordance with SEC Staff Accounting Bulletins No. 99 and No. 108 and, based upon quantitative and qualitative factors, determined that the errors were not material to the previously issued financial statements and disclosures included in our Annual Report on Form 10-K for the year ended December 31, 2015 or for any quarterly periods included therein or through our most recent Quarterly Report on Form 10-Q. As part of this evaluation, we considered a number of qualitative factors, including, among others, that the errors did not change total revenue, did not change operating income, and did not mask a change in earnings or other trends when considering the overall competitive and economic environment within the industry during the periods.
In addition, in accordance with SEC requirements, beginning in 2016, revenue is presented in two categories, Product and License Revenue and Service and Other Revenue. Product and License Revenue includes hardware products and software licenses. Service and Other Revenue includes software as a service (“SaaS”) solutions, maintenance and support, and professional services. Additional adjustments were made to present cost of goods sold consistent with these two categories. Prior periods have been adjusted to reflect the current presentation.
F-8
Table of Contents
VASCO DATA SECURITY INTERNATIONAL, INC.
NOTES TO CONSOLIDATED FINANCIAL STATEMENTS - (Continued)
(amounts in thousands, except per share data)
The following table presents the effect of the aforementioned revisions on our consolidated statement of operations
| For the year ended December 31, 2015 | ||||||||||||
| As previously Reported |
Adjustment | Corrected | ||||||||||
| Revenue |
||||||||||||
| Product and License |
$ | $ | 218,908 | $ | 218,908 | |||||||
| Service and Other |
22,535 | 22,535 | ||||||||||
|
|
|
|
|
|
|
|||||||
| Total Revenue |
241,443 | 241,443 | ||||||||||
| Cost of Goods Sold |
||||||||||||
| Product and License |
95,028 | 95,028 | ||||||||||
| Service and Other |
2,875 | 2,875 | ||||||||||
|
|
|
|
|
|
|
|||||||
| Total Cost of Goods Sold |
95,351 | 2,552 | 97,903 | |||||||||
|
|
|
|
|
|
|
|||||||
| Gross Profit |
146,092 | (2,552 | ) | 143,540 | ||||||||
|
|
|
|
|
|
|
|||||||
| Operating costs |
||||||||||||
| Sales and marketing |
39,670 | (1,471 | ) | 38,199 | ||||||||
| Research and development |
18,538 | (1,081 | ) | 17,457 | ||||||||
| General and administrative |
32,489 | 0 | 32,489 | |||||||||
| Amortization of purchased intangibles |
4,942 | 0 | 4,942 | |||||||||
|
|
|
|
|
|
|
|||||||
| Total operating costs |
95,639 | (2,552 | ) | 93,088 | ||||||||
|
|
|
|
|
|
|
|||||||
| Operating income |
$ | 50,453 | $ | 0 | $ | 50,453 | ||||||
|
|
|
|
|
|
|
|||||||
| For the year ended December 31, 2014 | ||||||||||||
| As previously Reported |
Adjustment | Corrected | ||||||||||
| Revenue |
||||||||||||
| Product and License |
$ | $ | 182,556 | $ | 182,556 | |||||||
| Service and Other |
18,981 | 18,981 | ||||||||||
|
|
|
|
|
|
|
|||||||
| Total Revenue |
201,537 | 201,537 | ||||||||||
| Cost of Goods Sold |
||||||||||||
| Product and License |
72,802 | 72,802 | ||||||||||
| Service and Other |
3,093 | 3,093 | ||||||||||
|
|
|
|
|
|
|
|||||||
| Total Cost of Goods Sold |
73,771 | 2,124 | 75,895 | |||||||||
|
|
|
|
|
|
|
|||||||
| Gross Profit |
127,766 | (2,124 | ) | 125,642 | ||||||||
|
|
|
|
|
|
|
|||||||
| Operating costs |
||||||||||||
| Sales and marketing |
43,362 | (1,173 | ) | 42,189 | ||||||||
| Research and development |
19,497 | (951 | ) | 18,546 | ||||||||
| General and administrative |
22,287 | - | 22,287 | |||||||||
| Amortization of purchased intangibles |
4,532 | - | 4,532 | |||||||||
|
|
|
|
|
|
|
|||||||
| Total operating costs |
89,678 | (2,124 | ) | 87,554 | ||||||||
|
|
|
|
|
|
|
|||||||
| Operating income |
$ | 38,088 | $ | - | $ | 38,088 | ||||||
|
|
|
|
|
|
|
|||||||
F-9
Table of Contents
VASCO DATA SECURITY INTERNATIONAL, INC.
NOTES TO CONSOLIDATED FINANCIAL STATEMENTS - (Continued)
(amounts in thousands, except per share data)
Financial information presented in the accompanying notes to these consolidated financial statements reflect the correction of these errors. Periods not presented herein will be revised, as applicable, as included in future filings.
Principles of Consolidation
The consolidated financial statements include the accounts of VASCO Data Security International, Inc. and its wholly owned subsidiaries. Intercompany accounts and transactions have been eliminated in consolidation.
As further described in Note 3, during January 2011 we acquired 100% of the stock of DigiNotar B.V. Effective September 20, 2011, DigiNotar B.V. was declared bankrupt in The Netherlands, transferring effective control over DigiNotar B.V. to the bankruptcy trustee. Accordingly, assets, liabilities and operating activities related to DigiNotar B.V. are reflected as discontinued operations.
Estimates and Assumptions
The preparation of financial statements in conformity with accounting principles generally accepted in the U.S. requires management to make estimates and assumptions that affect the reported amounts of assets and liabilities and disclosure of contingent assets and liabilities at the date of the financial statements and the reported amounts of revenue and expenses during the reporting period. Actual results could differ from those estimates.
Foreign Currency Translation and Transactions
The financial position and results of the operations of the majority of the company’s foreign subsidiaries are measured using the local currency as the functional currency. Accordingly, assets and liabilities are translated into U.S. Dollars using current exchange rates as of the balance sheet date. Revenues and expenses are translated at average exchange rates prevailing during the year. Translation adjustments arising from differences in exchange rates are charged or credited to other comprehensive income. Gains or (losses) resulting from foreign currency transactions were $111, ($1,247), and ($1,382) in 2016, 2015, and 2014, respectively, and are included in other income, net in the consolidated statements of operations.
The financial position and results of our operations in Canada, Singapore, and Switzerland are measured in U.S. Dollars. For these subsidiaries, gains and losses that result from foreign currency transactions are included in the consolidated statements of operations in other income, net.
Revenue Recognition
We recognize revenue in accordance with Financial Accounting Standards Board (FASB) Accounting Standards Codification (ASC) 985-605, Software – Revenue Recognition, ASC 605-25, Revenue Recognition – Multiple Element Arrangements and Staff Accounting Bulletin 104.
Product and License Revenue includes hardware products and software licenses. Services and Other Revenue includes software as a service (“SaaS”), maintenance and support, and professional services.
Revenue is recognized when there is persuasive evidence that an arrangement exists, delivery has occurred, the fee is fixed or determinable and collection of the revenue is probable.
In multiple-element arrangements, some of our products are accounted for under the software provisions of ASC 985-605 and others under the provisions that relate to the sale of non-software products.
F-10
Table of Contents
VASCO DATA SECURITY INTERNATIONAL, INC.
NOTES TO CONSOLIDATED FINANCIAL STATEMENTS - (Continued)
(amounts in thousands, except per share data)
In our typical multiple-element arrangement, the primary deliverables include:
| 1. | a client component (i.e., an item that is used by the person being authenticated in the form of either a new standalone hardware device or software that is downloaded onto a device the customer already owns), |
| 2. | host system software that is installed on the customer’s systems (i.e., software on the host system that verifies the identity of the person being authenticated) or licenses for additional users on the host system software if the host system software had been installed previously, and |
| 3. | post contract support (“PCS”) in the form of maintenance on the host system software or support. |
Our multiple-element arrangements may also include other items that are usually delivered prior to the recognition of any revenue and incidental to the overall transaction such as initialization of the hardware device, customization of the hardware device itself or the packaging in which it is delivered, deployment services where we deliver the device to our customer’s end-use customer or employee and, in some cases, professional services to assist with the initial implementation of a new customer.
In multiple-element arrangements that include a hardware client device, we allocate the selling price among all elements, delivered and undelivered, based on our internal price lists and the percentage of the selling price of that element, per the price list, to the total of the estimated selling price of all of the elements per the price list. Our internal price lists for both delivered and undelivered elements were determined to be reasonable estimates of the selling price of each element based on a comparison of actual sales made to the price list.
In multiple-element arrangements that include a software client device, we account for each element under the standards of ASC 985-605 related to software. When software client devices and host software are delivered elements, we use the Residual Method for determining the amount of revenue to recognize for token and software licenses if we have vendor-specific objective evidence (VSOE) for all of the undelivered elements. Any discount provided to the customer is applied fully to the delivered elements in such an arrangement. VSOE for undelivered elements is established using the “bell curve method.” Under this method, we conclude VSOE exists when a substantial majority of PCS renewals are within a narrow range of pricing. The estimated selling price of PCS items is based on an established percentage of the user license fee attributable to the specific software. In sales arrangements where VSOE of fair value has not been established, revenue for all elements is deferred and amortized over the life of the arrangement.
For transactions other than multiple-element arrangements, we recognize revenue as follows:
| 1. | Product and License Revenue: Revenue from the sale of computer security hardware or the license of software is recorded upon shipment or, if an acceptance period is allowed, at the latter of shipment or customer acceptance. No significant obligations or contingencies exist with regard to delivery, customer acceptance or rights of return at the time revenue is recognized. |
| 2. | SaaS: We generate SaaS revenues from our cloud services offerings. SaaS revenues include fees from customers for access to the eSignLive suite of solutions. Our standard customer arrangements generally do not provide the customer with the right to take possession of the software supporting the cloud-based application service at any time. As such, these arrangements are considered service contracts and revenue is recognized ratably over the service period of the contract. |
| 3. | Maintenance and Support Agreements: Maintenance and support agreements generally call for us to provide software updates and technical support, respectively, to customers. Revenue on maintenance and technical support is deferred and recognized ratably over the term of the maintenance and support agreement. |
F-11
Table of Contents
VASCO DATA SECURITY INTERNATIONAL, INC.
NOTES TO CONSOLIDATED FINANCIAL STATEMENTS - (Continued)
(amounts in thousands, except per share data)
| 4. | Professional Services: We provide professional services to our customers. Revenue from such services is recognized during the period in which the services are performed. |
We recognize revenue from sales to distributors and resellers on the same basis as sales made directly to customers. We recognize revenue when there is persuasive evidence that an arrangement exists, delivery has occurred, the fee is fixed or determinable and collection of the revenue is probable.
For large-volume transactions, we may negotiate a specific price based on the number of users of the software license or quantities of hardware supplied. The per unit prices for large-volume transactions are generally lower than transactions for smaller quantities and the price differences are commonly referred to as volume-purchase discounts.
All revenue is reported on a net basis, excluding any sales or value added taxes.
Cash and Cash Equivalents
Cash and cash equivalents are stated at cost plus accrued interest, which approximates fair value. Cash equivalents are high-quality short term money market instruments and commercial paper with maturities at acquisition of three months or less. Cash and cash equivalents are held by a number of U.S. and non-U.S. commercial banks and money market investment funds.
Short Term Investments
Short term investments are stated at cost plus accrued interest, which approximates fair value. Short term investments are high-quality commercial paper and bank certificates of deposit with maturities at acquisition of more than three months and less than twelve months.
Accounts Receivable and Allowance for Doubtful Accounts
The credit worthiness of customers is reviewed prior to shipment. A reasonable assurance of collection is a requirement for revenue recognition. Verification of credit and/or the establishment of credit limits are part of the customer contract administration process. Credit limit adjustments for existing customers may result from the periodic review of outstanding accounts receivable. The company records trade accounts receivable at invoice values, which are generally equal to fair value.
We maintain allowances for doubtful accounts for estimated losses resulting from the inability of our customers to make payments for goods and services. We analyze accounts receivable balances, customer credit-worthiness, current economic trends and changes in our customer payment timing when evaluating the adequacy of the allowance for doubtful accounts. The allowance is based on a specific review of all significant past-due accounts. If the financial condition of our customers deteriorates, resulting in an impairment of their ability to make payments, additional allowances may be required. Generally, accounts are charged off when decision is taken to no longer pursue collection.
Inventories
Inventories, consisting principally of hardware and component parts, are stated at the lower of cost or market. Cost is determined using the first-in-first-out (FIFO) method. We write down inventory where it appears that the carrying cost of the inventory may not be recovered through subsequent sale of the inventory. We
F-12
Table of Contents
VASCO DATA SECURITY INTERNATIONAL, INC.
NOTES TO CONSOLIDATED FINANCIAL STATEMENTS - (Continued)
(amounts in thousands, except per share data)
analyze the quantity of inventory on hand, the quantity sold in the past year, the anticipated sales volume in the form of sales to new customers as well as sales to previous customers, the expected sales price and the cost of making the sale when evaluating the valuation of our inventory. If the sales volume or sales price of a specific model declines significantly, additional write downs may be required.
Property and Equipment
Property and equipment are stated at cost. Depreciation is computed using the straight-line method over the estimated useful lives of the related assets ranging from three to seven years. Additions and improvements are capitalized, while expenditures for maintenance and repairs are charged to operations as incurred. Gains or losses resulting from sales or retirements are recorded as incurred, at which time related costs and accumulated depreciation are removed from the accounts. Depreciation expense for the years ended December 31, 2016, 2015, and 2014 of $1,928, $1,345, and $1,928, respectively, is included in operating expenses
Long Term Investments
Included in Other Assets are minority equity investments in companies we believe may be beneficial in executing our strategy. At December 31, 2016, investments were $4,073. There were no investments in 2015. In accordance with ASC 325, the investments are recorded at cost and evaluated for impairment annually or whenever events or changes in circumstances indicate that the carrying value may not be recoverable.
Cost of Goods Sold
Included in product cost of goods sold are direct product costs. Cost of goods sold related to service revenues are primarily costs related to SaaS solutions, including personnel and equipment costs, and personnel costs of employees providing professional services and maintenance and support.
Research and Development Costs
Costs for research and development, principally the design and development of hardware, and the design and development of software prior to the determination of technological feasibility, are expensed as incurred on a project-by-project basis.
Software Development Costs
We capitalize software development costs in accordance with ASC 985-20, Costs of Software to be Sold, Leased, or Marketed. Research costs and software development costs, prior to the establishment of technological feasibility, determined based upon the creation of a working model, are expensed as incurred. Our software capitalization policy currently defines technological feasibility as a functioning beta test prototype with confirmed manufacturability (a working model), within a reasonably predictable range of costs. Additional criteria include receptive customers, or potential customers, as evidenced by interest expressed in a beta test prototype, at some suggested selling price. Our policy is to amortize capitalized costs by the greater of (a) the ratio that current gross revenue for a product bear to the total of current and anticipated future gross revenue for that product or (b) the straight-line method over the remaining estimated economic life of the product, generally two to five years, including the period being reported on. No software development costs were capitalized in any of the years ended December 31, 2016, 2015, or 2014.
F-13
Table of Contents
VASCO DATA SECURITY INTERNATIONAL, INC.
NOTES TO CONSOLIDATED FINANCIAL STATEMENTS - (Continued)
(amounts in thousands, except per share data)
Income Taxes
We account for income taxes under the asset and liability method. Deferred tax assets and liabilities are recognized for the future tax consequences attributable to differences between the financial statement carrying amounts of existing assets and liabilities and their respective tax bases and operating loss and tax credit carryforwards. We measure deferred tax assets and liabilities using enacted tax rates expected to apply to taxable income in the years in which those temporary differences are expected to be recovered or settled. We recognize the effect of a change in tax rates on deferred tax assets and liabilities and in income in the period that includes the enactment date.
We monitor our potential income tax exposures as required by ASC 740, Income Taxes.
We have significant net operating loss and other deductible carryforwards in certain jurisdictions available to reduce the liability on future taxable income. A valuation allowance has been provided to offset some of these future benefits because we have not determined that their realization is more likely than not.
Fair Value of Financial Instruments
At December 31, 2016, and 2015, our financial instruments were cash equivalents, short term investments, accounts receivable, accounts payable and accrued liabilities. The estimated fair value of our financial instruments has been determined by using available market information and appropriate valuation methodologies, as defined in ASC 820, Fair Value Measurements. The fair values of the financial instruments were not materially different from their carrying amounts at December 31, 2016 and 2015.
Accounting for Leases
All of our leases are operating leases. Rent expense on facility leases is charged evenly over the life of the lease, regardless of the timing of actual payments.
Goodwill and Other Intangibles
Intangible assets arising from business combinations, such as acquired technology, customer relationships, and other intangible assets, are originally recorded at fair value. Intangible assets other than patents with definite lives are amortized over the useful life, generally three to seven years for proprietary technology and five to twelve years for customer relationships. Patents are amortized over the life of the patent, generally 20 years in the U.S.
Goodwill represents the excess of purchase price over the fair value of net identifiable assets acquired in a business combination. We assess the impairment of goodwill each November or whenever events or changes in circumstances indicate that the carrying value may not be recoverable. The Company’s impairment assessment begins with a qualitative assessment to determine whether it is more likely than not that the fair value of a reporting unit is less than its carrying value. The qualitative assessment includes comparing the overall financial performance of the reporting units against the planned results used in the last quantitative goodwill impairment test. Additionally, each reporting unit’s fair value is assessed in light of certain events and circumstances, including macroeconomic conditions, industry and market considerations, cost factors, and other relevant entity-and reporting unit specific events. The selection and assessment of qualitative factors used to determine whether it is more likely than not that the fair value of a reporting unit exceeds the carrying value involves significant judgments and estimates. If it is determined under the qualitative assessment that it is more likely than not that the fair value of a reporting unit is less than its carrying value, then a two-step quantitative impairment test is
F-14
Table of Contents
VASCO DATA SECURITY INTERNATIONAL, INC.
NOTES TO CONSOLIDATED FINANCIAL STATEMENTS - (Continued)
(amounts in thousands, except per share data)
performed. Under the first step, the estimated fair value of the reporting unit is compared with its carrying value (including goodwill). If the fair value of the reporting unit exceeds its carrying value, step two does not need to be performed. If the estimated fair value of the reporting unit is less than its carrying value, an indication of goodwill impairment exists for the reporting unit and the enterprise must perform step two of the impairment test (measurement). Under step two, an impairment loss is recognized for any excess of the carrying amount of the reporting unit’s goodwill over the implied fair value of that goodwill. The implied fair value of goodwill is determined by allocating the fair value of the reporting unit in a manner similar to a purchase price allocation in acquisition accounting. The residual amount after this allocation is the implied fair value of the reporting unit goodwill. Fair value of the reporting unit under the two-step assessment is determined using a combination of both income and market-based variation approaches. The inputs and assumptions to valuation methods used to estimate the fair value of reporting units involves significant judgments. In accordance with ASC 350, we consider the company to be two reporting units, the operations of eSignLive and the remainder of our operations. Our qualitative assessment of each reporting unit did not indicate an impairment. Accordingly, we did not recognize any impairment for the year ended December 31, 2016.
Stock-Based Compensation
We have stock-based employee compensation plans, which are described more fully in Note 9. ASC 718, Compensation-Stock Compensation requires us to estimate the fair value of restricted stock granted to employees, directors and others and to record compensation expense equal to the estimated fair value. Compensation expense is recorded on a straight-line basis over the vesting period. Forfeitures are recorded as incurred.
Retirement Benefits
We record annual expenses relating to our pension benefit plans based on calculations which include various actuarial assumptions, including discount rates, assumed asset rates of return, compensation increases, and turnover rates. We review our actuarial assumptions on an annual basis and make modifications to the assumptions based on current rates and trends. The effects of gains, losses, and prior service costs and credits are amortized over the average service life. The funded status, or projected benefit obligation less plan assets, for each plan, is reflected in our consolidated balance sheets using a December 31 measurement date.
Warranty
Warranties are provided on the sale of certain of our products and an accrual for estimated future claims is recorded at the time revenue is recognized. We estimate the cost based on past claims experience, sales history and other considerations. We regularly assess the adequacy of our estimates and adjust the amounts as necessary. Our standard practice is to provide a warranty on our hardware products for either a one or two year period after the date of purchase. Customers may purchase extended warranties covering periods from one to four years after the standard warranty period. We defer the revenue associated with the extended warranty and recognize it into income on a straight-line basis over the extended warranty period. We have historically experienced minimal actual claims over the warranty period.
Recently Issued Accounting Pronouncements
In November 2015, the FASB issued Accounting Standards Update No. 2015-17, Balance Sheet Classification of Deferred Taxes, (ASU 2015-17), requiring deferred tax liabilities and assets be classified as non-current in a classified statement of financial position. The ASU is effective for annual periods beginning
F-15
Table of Contents
VASCO DATA SECURITY INTERNATIONAL, INC.
NOTES TO CONSOLIDATED FINANCIAL STATEMENTS - (Continued)
(amounts in thousands, except per share data)
after December 15, 2015 and interim periods within such annual periods. We have adopted ASU 2015-17 prospectively in our consolidated financial statements as of January 1, 2016. Prior periods were not retrospectively adjusted.
In September 2015, the FASB issued Accounting Standards Update No. 2015-16, Simplifying the Accounting for Measurement-Period Adjustments, (ASU 2015-16), which eliminates the requirement for an acquirer to retrospectively adjust the financial statements for measurement-period adjustments that occur in periods after a business combination is consummated. The ASU is effective for annual periods beginning after December 15, 2015 and interim periods within such annual periods and applies prospectively to adjustments to provisional amounts that occur after the effective date. We have adopted ASU 2015-16 in our consolidated financial statements as of January 1, 2016. Measurement period adjustments identified subsequent to December 31, 2015 for the eSignLive Acquisition, further described in Note 4 to the Consolidated Financial Statements, were recorded and disclosed in accordance with ASU 2015-16.
In May 2014, the FASB issued Accounting Standards Update No. 2014-09, Revenue from Contracts with Customers (ASU 2014-09), which supersedes nearly all existing revenue recognition guidance under U.S. GAAP. The core principle of ASU 2014-09 is to recognize revenues when promised goods or services are transferred to customers in an amount that reflects the consideration to which an entity expects to be entitled for those goods or services. The standard creates a five-step model to achieve its core principle: (i) identify the contract(s) with a customer; (ii) identify the performance obligations in the contract; (iii) determine the transaction price; (iv) allocate the transaction price to the separate performance obligations in the contract; and (v) recognize revenue when (or as) the entity satisfies a performance obligation. In addition, entities must disclose sufficient information to enable users of financial statements to understand the nature, amount, timing, and uncertainty of revenue and cash flows arising from contracts with customers. Qualitative and quantitative disclosures are required about: (i) the entity’s contracts with customers; (ii) the significant judgments, and changes in judgments, made in applying the guidance to those contracts; and (iii) any assets recognized from the costs to obtain or fulfill a contract with a customer.
ASU 2014-9 is effective for annual periods beginning after December 15, 2016, and interim periods within such annual periods, using either of the following transition methods: (i) a full retrospective approach reflecting the application of the standard in each prior reporting period with the option to elect certain practical expedients, or (ii) a retrospective approach with the cumulative effect of initially adopting ASU 2014-09 recognized at the date of adoption. We will adopt this guidance at the beginning of the first quarter of 2018. We expect to determine the transition method in the second quarter of 2017.
We are currently evaluating the impact of our pending adoption of the new revenue recognition guidance on revenue transactions, including any impacts on associated processes, systems, and internal controls. Our evaluation has included determining whether the unit of account (i.e., performance obligations) will change as compared to current GAAP, as well as determining the standalone selling price of each performance obligation. Standalone selling prices under the new guidance may not be substantially different from our current methodologies of establishing fair value on multiple element arrangements. Based on initial assessments, we have identified certain arrangements where revenue may be recognized earlier compared to current GAAP. We expect to recognize license revenue from term licenses upon delivery of the software, rather than over the term of the arrangement. We expect to begin capitalizing certain sales commissions upon adoption of the new standard and are currently in the process of evaluating the period over which to amortize these capitalized costs. We continue to evaluate the impact of this guidance and subsequent amendments on our consolidated financial position, results of operations, and cash flows, and any preliminary assessments are subject to change.
F-16
Table of Contents
VASCO DATA SECURITY INTERNATIONAL, INC.
NOTES TO CONSOLIDATED FINANCIAL STATEMENTS - (Continued)
(amounts in thousands, except per share data)
In February 2016, The FASB issued Accounting Standards Update No. 2016-02, Leases, which among other things, requires lessees to recognize most leases on the balance sheet. ASU 2016-02 is effective for annual and interim periods in fiscal years beginning after December 15, 2018 and mandates a modified retrospective transition method. We are currently evaluating the impact of ASU 2016-02 on our consolidated financial statements.
On March 30, 2016, the FASB issued ASU 2016-09, Improvements to Employee Share-Based Payment Accounting, to improve accounting for share-based payment transactions as part of the FASB’s simplification initiative. The ASU changes certain aspects of accounting for share-based payment award transactions, including: (1) recognition of excess tax benefits and tax deficiencies as income tax expense or benefit instead of additional paid-in capital; (2) classification of excess tax benefits on the statement of cash flows, and (3) accounting for forfeitures. The other provisions of ASU 2016-09 are immaterial to the Company. ASU 2016-09 is effective for fiscal years beginning after December 15, 2016. Early adoption is permitted. We have early adopted ASU 2016-09 in our consolidated financial statements as of January 1, 2016 and applicable aspects described were adopted prospectively. Prior periods were not retrospectively adjusted.
The adoption of ASU 2016-09 resulted in an increase to the tax provision of $169 that would have otherwise been debited to additional paid in capital. Similarly, as a result of the adoption of ASU 2016-09, cashflows from operating activities decreased $169 and cash flows from financing activities decreased by the same amount. We also elected to begin accounting for forfeitures when they occur. The impact of this policy change was immaterial to our consolidated financial statements. The impact of this ASU on future periods is dependent on our stock price at the time restricted stock awards vest.
Note 2 – Inventories
Inventories, consisting principally of hardware and component parts, are stated at the lower of cost or market.
Inventory is comprised of the following:
| December 31, | ||||||||
| 2016 | 2015 | |||||||
| Component parts |
$ | 8,360 | $ | 9,351 | ||||
| Work-in-process and finished goods |
9,060 | 11,267 | ||||||
|
|
|
|
|
|||||
| Total |
$ | 17,420 | $ | 20,618 | ||||
|
|
|
|
|
|||||
F-17
Table of Contents
VASCO DATA SECURITY INTERNATIONAL, INC.
NOTES TO CONSOLIDATED FINANCIAL STATEMENTS - (Continued)
(amounts in thousands, except per share data)
Note 3 – Discontinued Operations
During 2011, our wholly-owned Dutch subsidiary, DigiNotar B.V., was declared bankrupt. The court-appointed trustee is responsible for the business activities, administration and liquidation of DigiNotar B.V. Accordingly, related assets, liabilities and activities are reflected in discontinued operations.
Income (loss) from discontinued operations, net of tax, for the twelve months ended December 31, 2016, 2015, and 2014 was as follows:
| Years ended December 31, | ||||||||||||
| 2016 | 2015 | 2014 | ||||||||||
| Gain (Loss) from operations |
$ | (47 | ) | $ | 0 | $ | 0 | |||||
| Gain (Loss) on disposal |
0 | (43 | ) | 873 | ||||||||
|
|
|
|
|
|
|
|||||||
| Gain (Loss) from discontinued operations |
$ | (47 | ) | $ | (43 | ) | $ | 873 | ||||
|
|
|
|
|
|
|
|||||||
At December 31, 2016 and 2015, remaining assets and liabilities related to DigiNotar have been classified as assets of discontinued operations and liabilities of discontinued operations, respectively, in the consolidated balance sheets and consist of the following:
| As of December 31, | ||||||||
| 2016 | 2015 | |||||||
| Income taxes receivable |
$ | 6 | $ | 4 | ||||
|
|
|
|
|
|||||
| Assets of discontinued operations |
$ | 6 | $ | 4 | ||||
|
|
|
|
|
|||||
| Accrued professional fees |
$ | 10 | $ | 0 | ||||
|
|
|
|
|
|||||
| Liabilities of discontinued operations |
$ | 10 | $ | 0 | ||||
|
|
|
|
|
|||||
Assets of discontinued operations and certain portions of liabilities of discontinued operations are denominated in local currencies and are subject to currency fluctuation.
Note 4 – Acquisition of eSignLive
On November 25, 2015, the Company completed its acquisition of Silanis Technology, Inc. (“eSignLive”), a privately-held provider of electronic signature and digital transaction solutions used to sign, send, and manage documents. Pursuant to the arrangement agreement, we acquired all of the issued and outstanding shares of eSignLive for an aggregate purchase price of $75,000 subject to further adjustment as provided in the arrangement agreement.
Upon acquisition, eSignLive became our wholly-owned subsidiary. The acquisition is accounted for as a business combination using the acquisition method accounting in accordance with FASB ASC Topic No. 805, Business Combinations, whereby the net assets acquired are recognized based on their estimated fair values on the acquisition date.
The results of operations of eSignLive subsequent to the November 25, 2015 acquisition date have been included in the Consolidated Statements of Operations. eSignLive revenue and net income (loss) included in the results of operations for the year ended December 31, 2015 were $541 and $(2,168), respectively.
Acquisition-related expense recognized during 2015 of approximately $2,374 is recorded in general and administrative expenses in the Consolidated Statements of Operations.
F-18
Table of Contents
VASCO DATA SECURITY INTERNATIONAL, INC.
NOTES TO CONSOLIDATED FINANCIAL STATEMENTS - (Continued)
(amounts in thousands, except per share data)
Aggregate Purchase Price Allocation
Purchase consideration has been allocated to assets and liabilities based on estimated acquisition-date fair values and are summarized in the following table:
| as initially reported on December 31, 2015 |
Measurement Period Adjustments |
as adjusted | ||||||||||
| Tangible assets and liabilities |
||||||||||||
| Cash |
$ | 514 | $ | 96 | $ | 610 | ||||||
| Accounts receivable, net |
4,471 | (615 | ) | 3,856 | ||||||||
| Other current assets |
4,234 | (19 | ) | 4,215 | ||||||||
| Property and equipment |
416 | 24 | 440 | |||||||||
| Current liabilities |
(16,896 | ) | 1,576 | (15,320 | ) | |||||||
| Other non-current liabilities |
(8,070 | ) | 5,731 | (2,339 | ) | |||||||
| Intangible assets |
30,000 | 17,400 | 47,400 | |||||||||
| Goodwill |
60,331 | (24,419 | ) | 35,912 | ||||||||
|
|
|
|
|
|
|
|||||||
| Net assets acquired |
$ | 75,000 | $ | (226 | ) | $ | 74,774 | |||||
|
|
|
|
|
|
|
|||||||
The excess of purchase consideration over net assets assumed was recorded as goodwill, which represents the strategic value assigned to eSignLive, including expected benefits from synergies resulting from the acquisition, as well as the knowledge and experience of the workforce in place. In accordance with applicable accounting standards, goodwill is not amortized and will be tested for impairment at least annually, or more frequently, if certain indicators are present. Goodwill and intangible assets related to this acquisition are not deductible for tax purposes.
The effect of the measurement period adjustments recorded in the current period have been determined as if such adjustments had been accounted for at the acquisition date. Excluding prior measurement period adjustments reducing liabilities and goodwill each by $9,146, all measurement period adjustments were recorded in the fourth quarter of 2016 and resulted in a credit to the tax provision of $2,344.
The following table summarizes acquired intangible assets, as well as the respective amortization periods:
| Estimated Fair Value |
Amortization Period (Years) |
|||||||
| (000s) | ||||||||
| Identifiable Intangible Assets |
||||||||
| Tradenames |
$ | 2,400 | 10 | |||||
| Technology |
10,000 | 5 | ||||||
| Non-compete agreements |
8,000 | 5 | ||||||
| Customer Relationships |
27,000 | 12 | ||||||
|
|
|
|||||||
| $ | 47,400 | |||||||
|
|
|
|||||||
Unaudited Pro Forma Financial Information
The following unaudited pro forma financial information presents the results of operations as if the acquisition had taken place on January 1, 2014. These amounts were prepared in accordance with the acquisition
F-19
Table of Contents
VASCO DATA SECURITY INTERNATIONAL, INC.
NOTES TO CONSOLIDATED FINANCIAL STATEMENTS - (Continued)
(amounts in thousands, except per share data)
method of accounting under existing standards and are not necessarily indicative of the results of operations that would have occurred if the acquisition had been completed on the first day of 2014, nor are they indicative of our future operating results.
Income tax impacts resulting from pro forma adjustments were calculated utilizing the statutory income tax rate of 35% for the years ended December 31, 2015 and 2014.
These unaudited pro forma amounts include the following adjustments to historical results shown net of tax;
| • | To reflect estimated amortization of acquired identifiable intangible assets of $6,060 and $6,060 for the year ended December 31, 2015 and 2014, respectively. |
| • | To reflect estimated amortization of fair value adjustment of acquired deferred revenue of $(4,000) and $0 for the year ended December 31, 2015 and 2014, respectively. |
| • | To reclassify non-recurring transaction expenses of $5,812 from 2015 to 2014. |
| • | To reverse benefit of certain refundable tax credits of $1,021 and $1,588 for the year ended December 31, 2015 and 2014, respectively. |
| Year Ended December 31, | ||||||||
| 2015 | 2014 | |||||||
| Revenue |
$ | 256,416 | $ | 212,595 | ||||
| Net income |
$ | 28,059 | $ | 14,729 | ||||
Note 5 – Goodwill
Goodwill activity for the two years ended December 31, 2016 consisted of the following:
| Net balance at December 31, 2014 |
$ | 22,208 | ||
| Additions - eSignLive |
60,331 | |||
| Net foreign currency translation |
(1,686 | ) | ||
|
|
|
|||
| Net balance at December 31, 2015 |
$ | 80,853 | ||
| Adjustment to provisional estimate of acquisition date fair values |
(24,419 | ) | ||
| Net foreign currency translation |
(2,025 | ) | ||
|
|
|
|||
| Net balance at December 31, 2016 |
$ | 54,409 | ||
|
|
|
|||
| December 31, 2016 balance at cost |
$ | 55,209 | ||
| Accumulated amortization |
(800 | ) | ||
|
|
|
|||
| Net balance at December 31, 2016 |
$ | 54,409 | ||
|
|
|
There were no impairment losses in 2016, 2015, or 2014.
Certain portions of goodwill are denominated in local currencies and are subject to currency fluctuations.
F-20
Table of Contents
VASCO DATA SECURITY INTERNATIONAL, INC.
NOTES TO CONSOLIDATED FINANCIAL STATEMENTS - (Continued)
(amounts in thousands, except per share data)
Note 6 – Intangible Assets
Intangible asset activity for the two years ended December 31, 2016 is detailed in the following table;
| Capitalized Technology |
Customer Relationships |
Other | Total Intangible Assets |
|||||||||||||
| Net balance at December 31, 2014 |
$ | 10,216 | $ | 644 | $ | 1,959 | $ | 12,819 | ||||||||
| Additions-eSignLive |
29,000 | 400 | 600 | 30,000 | ||||||||||||
| Additions-Other |
0 | 0 | 131 | 131 | ||||||||||||
| Net foreign currency translation |
(15 | ) | (23 | ) | 0 | (38 | ) | |||||||||
| Amortization expense |
(4,569 | ) | (193 | ) | (180 | ) | (4,942 | ) | ||||||||
|
|
|
|
|
|
|
|
|
|||||||||
| Net balance at December 31, 2015 |
34,632 | 828 | 2,510 | 37,970 | ||||||||||||
| Measurement Period Adjustments - eSignLive |
(19,000 | ) | 26,600 | 9,800 | 17,400 | |||||||||||
| Additions-Other |
0 | 0 | 143 | 143 | ||||||||||||
| Net foreign currency translation |
(58 | ) | (57 | ) | - | (115 | ) | |||||||||
| Amortization expense |
(4,182 | ) | (2,597 | ) | (2,070 | ) | (8,849 | ) | ||||||||
|
|
|
|
|
|
|
|
|
|||||||||
| Net balance at December 31, 2016 |
$ | 11,392 | $ | 24,774 | $ | 10,383 | $ | 46,549 | ||||||||
|
|
|
|
|
|
|
|
|
|||||||||
| December 31, 2016 balance at cost |
$ | 37,745 | $ | 27,757 | $ | 13,244 | $ | 78,746 | ||||||||
| Accumulated amortization |
(26,353 | ) | (2,983 | ) | (2,861 | ) | (32,197 | ) | ||||||||
|
|
|
|
|
|
|
|
|
|||||||||
| Net balance at December 31, 2016 |
$ | 11,392 | $ | 24,774 | $ | 10,383 | $ | 46,549 | ||||||||
|
|
|
|
|
|
|
|
|
|||||||||
Additions - eSignLive refers to intangible assets acquired in the acquisition of eSignLive described in Note 4 including capitalized technology, trademarks, customer relationships and non-compete agreements. Certain intangible assets are denominated in local currencies and are subject to currency fluctuations. Expected amortization of the intangible assets for the years ended:
| December 31, 2017 |
$ | 8,782 | ||
| December 31, 2018 |
7,306 | |||
| December 31, 2019 |
6,207 | |||
| December 31, 2020 |
5,875 | |||
| December 31, 2021 |
2,575 | |||
| Thereafter |
14,734 | |||
|
|
|
|||
| Subject to amortization |
45,479 | |||
| Trademarks |
1,070 | |||
|
|
|
|||
| Total intangible assets |
$ | 46,549 | ||
|
|
|
Note 7 – Income Taxes
Income from continuing operations before income taxes was generated in the following jurisdictions. For the year ended December 31, 2016, 2015, and 2014, domestic income excludes taxable intercompany dividend income of $8,825, $10,000, and $30,650, respectively.
| For the year ended December 31, | ||||||||||||
| 2016 | 2015 | 2014 | ||||||||||
| Domestic |
$ | (11,170 | ) | $ | (5,007 | ) | $ | (3,294 | ) | |||
| Foreign |
22,595 | 55,905 | 41,214 | |||||||||
|
|
|
|
|
|
|
|||||||
| Total |
$ | 11,425 | $ | 50,898 | $ | 37,920 | ||||||
|
|
|
|
|
|
|
|||||||
F-21
Table of Contents
VASCO DATA SECURITY INTERNATIONAL, INC.
NOTES TO CONSOLIDATED FINANCIAL STATEMENTS - (Continued)
(amounts in thousands, except per share data)
The provision for income taxes consists of the following:
| For the year ended December 31, | ||||||||||||
| 2016 | 2015 | 2014 | ||||||||||
| Current: |
||||||||||||
| Federal |
$ | (90 | ) | $ | - | $ | - | |||||
| State |
5 | 1 | 42 | |||||||||
| Foreign |
5,915 | 9,140 | 4,688 | |||||||||
|
|
|
|
|
|
|
|||||||
| Total current |
5,830 | 9,141 | 4,730 | |||||||||
|
|
|
|
|
|
|
|||||||
| Deferred: |
||||||||||||
| Federal |
(2,985 | ) | 338 | (497 | ) | |||||||
| State |
115 | (135 | ) | 361 | ||||||||
| Foreign |
(2,097 | ) | (640 | ) | 715 | |||||||
|
|
|
|
|
|
|
|||||||
| Total deferred |
(4,967 | ) | (437 | ) | 579 | |||||||
|
|
|
|
|
|
|
|||||||
| Total |
$ | 863 | $ | 8,704 | $ | 5,309 | ||||||
|
|
|
|
|
|
|
|||||||
The U.S. federal corporate tax rate varies with taxable income. Our U.S. statutory rate for 2016 and 2015 was 34%. For 2014, our U.S. statutory rate was 35%. The differences between the income tax provisions computed using the statutory federal income tax rate and the provisions for income taxes reported in the consolidated statements of operations are as follows:
| For the years ended December 31, | ||||||||||||
| 2016 | 2015 | 2014 | ||||||||||
| Expected tax at statutory rate |
$ | 3,884 | $ | 17,305 | $ | 13,272 | ||||||
| Foreign taxes at other rates |
(7,512 | ) | (12,487 | ) | (9,107 | ) | ||||||
| US tax on foreign earnings, net of foreign tax credits |
(405 | ) | 1,968 | (9 | ) | |||||||
| Valuation reserves on NOL carryforwards |
3,816 | 469 | 2 | |||||||||
| State income taxes, net of federal benefit |
83 | 26 | 140 | |||||||||
| Disallowed expenses and other |
997 | 1,423 | 1,011 | |||||||||
|
|
|
|
|
|
|
|||||||
| Total |
$ | 863 | $ | 8,704 | $ | 5,309 | ||||||
|
|
|
|
|
|
|
|||||||
F-22
Table of Contents
VASCO DATA SECURITY INTERNATIONAL, INC.
NOTES TO CONSOLIDATED FINANCIAL STATEMENTS - (Continued)
(amounts in thousands, except per share data)
Current deferred tax assets and long-term deferred tax liabilities are presented as separate line items in the balance sheet. Long-term deferred tax assets of $11,116 and $6,216 as of December 31, 2016 and 2015, respectively, are included in other assets. Deferred income tax balances are comprised of the following:
| As of December 31, | ||||||||
| 2016 | 2015 | |||||||
| Deferred tax assets: |
||||||||
| U.S. foreign tax credit |
$ | 7,027 | $ | 3,309 | ||||
| Stock and long-term compensation plans |
2,304 | 2,817 | ||||||
| Foreign NOL & other carryforwards |
16,340 | 13,771 | ||||||
| US state NOL carryforwards |
803 | 248 | ||||||
| US alternative minimum tax |
357 | 395 | ||||||
| Deferred revenue |
358 | 672 | ||||||
| Pension liability, net |
624 | 0 | ||||||
| Reserve for uncertain tax issues |
(445 | ) | (560 | ) | ||||
| Amortization and depreciation |
708 | 627 | ||||||
| Accrued expenses and other |
523 | 288 | ||||||
|
|
|
|
|
|||||
| Total gross deferred tax assets |
28,599 | 21,567 | ||||||
| Less: Valuation allowance |
(6,274 | ) | (13,719 | ) | ||||
|
|
|
|
|
|||||
| Net deferred income tax assets |
$ | 22,325 | $ | 7,848 | ||||
|
|
|
|
|
|||||
| Deferred tax liabilities: |
||||||||
| Swiss tax allowances |
$ | 691 | $ | 851 | ||||
| US tax on unremitted foreign earnings |
424 | 137 | ||||||
| Deferred revenue |
- | 901 | ||||||
| Intangible assets |
10,947 | 8,008 | ||||||
|
|
|
|
|
|||||
| Deferred tax liabilities |
$ | 12,062 | $ | 9,897 | ||||
|
|
|
|
|
|||||
| Net deferred tax assets (liabilities) |
$ | 10,263 | $ | (2,049 | ) | |||
|
|
|
|
|
|||||
Long-term deferred tax assets and liabilities are netted by tax jurisdiction.
Earnings of certain subsidiaries are deemed available for distribution. At December 31, 2016 and 2015, unremitted foreign earnings available for distribution are $14,299 and $22,672, respectively. The deferred tax liability for the incremental U.S. tax to be paid upon remittance as dividends at December 31, 2016 and 2015 was $409 and $137, respectively.
The earnings of certain designated subsidiaries remain permanently invested. At December 31, 2016 and 2015, total unremitted foreign earnings considered permanently invested are $154,581 and $131,327, respectively. It is not practicable to estimate the incremental U.S. tax liability which would be incurred if these earnings were repatriated.
At December 31, 2016, we held $21,733 of cash in banks in the United States and $27,612 of cash in banks outside of the United States. Of the cash in banks outside of the United States, $27,332 is not subject to significant repatriation restrictions, but may be subject to tax upon repatriation. Cash in banks outside of the United States includes $17,151 held in tax jurisdictions where we consider retained earnings to be available for distribution and $10,461 held in jurisdictions where we consider retained earnings to be permanently invested.
F-23
Table of Contents
VASCO DATA SECURITY INTERNATIONAL, INC.
NOTES TO CONSOLIDATED FINANCIAL STATEMENTS - (Continued)
(amounts in thousands, except per share data)
A portion of tax benefits related to certain restricted stock and stock options were credited to additional paid-in capital. For the years ended December 31, 2015 and 2014, credits to additional paid-in capital were $318 and $253, respectively. With the adoption of ASU 2016-09, the tax impact for 2016 of $169 was recorded as an increase to the tax provision.
U.S. foreign tax credit carryforwards expiring in 2023 and 2026 were $2,940 and $4,087, respectively, at December 31, 2016. We have not provided a valuation reserve for the foreign tax credits as we believe it is more likely than not they will be realized due to our tax strategy to distribute foreign earnings to utilize foreign tax credits prior to expiration.
At December 31, 2016, we had foreign and state net operating loss (NOL) carryforwards and other foreign deductible carryforwards as shown in the following table;
| Carryforward | Expiration | |||||||
| NOL Carryforward |
||||||||
| Canada |
$ | 39,375 | 2024-2036 | |||||
| Other foreign |
3,101 | None | ||||||
| U.S. states |
15,634 | 2017-2036 | ||||||
|
|
|
|||||||
| 58,110 | ||||||||
|
|
|
|||||||
| Other Carryforwards |
||||||||
| Canada |
14,883 | None | ||||||
| Other foreign |
1,934 | 2017-2018 | ||||||
|
|
|
|||||||
| 16,817 | ||||||||
|
|
|
|||||||
| $ | 74,927 | |||||||
|
|
|
|||||||
The net change in the valuation allowance for the years ended December 31, 2016 was a decrease of $7,445 and for the years ended December 31, 2015 and 2014, were increases of $11,219 and $101, respectively. This valuation allowance is reviewed on a regular basis and adjustments made as appropriate. The increase in the valuation allowance in 2015 reflects NOL and other carryforwards related to the eSignLive acquisition further described in Note 4. The decrease in the valuation allowance in 2016 reflects measurement period adjustments recorded for the eSignLive acquisition. The change in the valuation allowance also reflects other factors including, but not limited to, changes in our assessment of our ability to use existing NOLs and other deduction carryforwards, changes in currency rates, and adjustments to reflect differences between the actual returns filed and the estimates we made at financial reporting dates. The company expects to generate adequate taxable income to realize deferred tax assets in foreign jurisdictions where no valuation allowance exists.
We had accrued interest or penalties for income tax liabilities of $51 at December 31, 2016. There was none at December 31, 2015. Our policy is to record interest expense and penalties on income taxes as income tax expense.
F-24
Table of Contents
VASCO DATA SECURITY INTERNATIONAL, INC.
NOTES TO CONSOLIDATED FINANCIAL STATEMENTS - (Continued)
(amounts in thousands, except per share data)
ASC 740, Income Taxes sets a “more likely than not” criterion for recognizing the tax benefit of uncertain tax positions. As of December 31, 2016, 2015, and 2014, we had a reserve of $662, $560 and $560, respectively, of which $662, $560, and $560, respectively, would impact the effective tax rate, if recognized. As of December 31, 2016, $445 of the reserve is an offset to our deferred tax assets and $217 is included in income tax payable. As of December 31, 2015 and 2014, the reserve is an offset to our deferred tax assets.
| As of December 31, | ||||||||||||
| 2016 | 2015 | 2014 | ||||||||||
| Reserve at beginning of year |
$ | 560 | $ | 560 | $ | 560 | ||||||
| Increases related to prior year tax positions |
217 | - | - | |||||||||
| Lapse of statute of limitations |
(115 | ) | - | - | ||||||||
|
|
|
|
|
|
|
|||||||
| Total |
$ | 662 | $ | 560 | $ | 560 | ||||||
|
|
|
|
|
|
|
|||||||
Based on the possible expiration of the statute of limitations, it is reasonably possible that the liability for uncertain tax positions will change within the next twelve months. The associated tax impact on the effective tax rate is estimated to be a tax benefit of $445, with minimal cash payments.
Our primary tax jurisdictions and the earliest tax year subject to audit are presented in the following table.
| Australia |
2008 | |||
| Austria |
2010 | |||
| Belgium |
2014 | |||
| Canada |
2012 | |||
| Netherlands |
2011 | |||
| Singapore |
2011 | |||
| Switzerland |
2015 | |||
| United States |
2007 |
Note 8 – Deferred Warranty Revenue and Warranty Reserve
Our standard practice is to provide a warranty on our DIGIPASS hardware for one to two years after the date of purchase. Customers may purchase extended warranties covering periods from one to four years after the standard warranty period. We defer the revenue associated with the extended warranty and recognize it into income on a straight-line basis over the extended warranty period. The estimated cost of providing warranty services during the extended warranty period is less than the revenue related to such warranty service.
Deferred warranty revenue at December 31, 2016 will be recognized as revenue as follows:
| Year | Amount | |||
| 2017 |
$ | 22 | ||
| 2018 |
12 | |||
| 2019 |
3 | |||
|
|
|
|||
| Total | $ | 37 | ||
|
|
|
|||
F-25
Table of Contents
VASCO DATA SECURITY INTERNATIONAL, INC.
NOTES TO CONSOLIDATED FINANCIAL STATEMENTS - (Continued)
(amounts in thousands, except per share data)
We maintain a reserve for the potential cost of future warranty claims related to products sold and recognized in revenue. The reserve is included in accrued expenses. Activity in the warranty reserve account during the three years ended December 31, 2016 was as follows:
| For the years ended December 31, | ||||||||||||
| 2016 | 2015 | 2014 | ||||||||||
| Balance, beginning of period |
$ | 43 | $ | 85 | $ | 116 | ||||||
| Provision for warranty claims |
165 | 165 | 173 | |||||||||
| Product or cash issued to settle claims |
(55 | ) | (207 | ) | (204 | ) | ||||||
|
|
|
|
|
|
|
|||||||
| Balance, end of period |
$ | 153 | $ | 43 | $ | 85 | ||||||
|
|
|
|
|
|
|
|||||||
Note 9 – Stock Compensation Plans
In June 2009, our stockholders approved and in June 2014 our stockholders reapproved the VASCO Data Security International, Inc. 2009 Equity Incentive Plan (the “2009 Equity Plan”). The 2009 Equity Plan permits the issuance of awards in a variety of forms, including (1) shares of our common stock, (2) nonqualified and incentive stock options for the purchase of our common stock, (3) stock appreciation rights, (4) deferred stock, (5) other stock-based awards (including restricted shares, performance shares, performance units and other stock unit awards), and (6) cash incentive awards.
Upon approval of the 2009 Equity Plan, our 1997 Stock Compensation Plan, as amended and restated (the “1997 Compensation Plan”) was suspended. No additional awards will be issued under the 1997 Compensation Plan, however, all outstanding awards under the 1997 Compensation Plan were unaffected by the approval of the 2009 Equity Plan. The 1997 Compensation Plan permitted the award of stock compensation in various forms.
The 2009 Equity Plan and the 1997 Compensation Plan were designed and intended to provide performance incentives to employees and non-employee directors, consultants and other key persons of the company. Both plans are administered by the Compensation Committee as appointed by the Board of Directors and are intended to be non-qualified plans.
As of December 31, 2016, the number of shares allowed to be issued under the 2009 Equity Plan was 6,161 shares of the company’s common stock, representing 15.4% of the issued and outstanding shares of the company as of such date.
The following table summarizes compensation expense recorded under the two plans.
| 2016 | 2015 | 2014 | ||||||||||
| Restricted stock |
$ | 2,766 | $ | 3,835 | $ | 2,399 | ||||||
| Long-term compensation plan |
2,105 | 1,815 | 851 | |||||||||
|
|
|
|
|
|
|
|||||||
| Total expense |
$ | 4,871 | $ | 5,650 | $ | 3,250 | ||||||
|
|
|
|
|
|
|
|||||||
F-26
Table of Contents
VASCO DATA SECURITY INTERNATIONAL, INC.
NOTES TO CONSOLIDATED FINANCIAL STATEMENTS - (Continued)
(amounts in thousands, except per share data)
Time-Based Restricted Stock
Time-based restricted stock awards granted to non-employee directors vest on the first anniversary date of the grant. Awards granted to an executive officer in 2016 vest in equal semi-annual installments over four years. Shares are subject to forfeiture if the service period requirement is not met. Compensation expense equal to the market value of the stock on the grant date is recorded on a straight-line basis over the vesting period as required by ASC 718 Compensation-Stock Compensation. Compensation expense was $2,177, $1,356, and $1,316 for 2016, 2015, and 2014, respectively. The following table summarizes the time-based restricted stock activity for the year ended December 31, 2016:
| Shares | Weighted average remaining term (years) |
Aggregate intrinsic value |
||||||||||
| Outstanding at January 1, 2016 |
414 | 2.56 | $ | 6,926 | ||||||||
| Shares vested |
(121 | ) | 1,902 | |||||||||
| Shares awarded |
30 | 505 | ||||||||||
| Shares forfeited |
(47 | ) | 800 | |||||||||
|
|
|
|||||||||||
| Outstanding at December 31, 2016 |
276 | 1.97 | 3,767 | |||||||||
|
|
|
|||||||||||
The unamortized future compensation expense for time-based restricted stock awards was $3,454 at December 31, 2016.
Performance-Based Restricted Stock
Performance-based restricted stock awards granted to executive officers in 2016 were subject to achievement of one-year and three year performance targets established by the Board of Directors. Earned shares related to one-year performance targets vest annually over four years. Earned shares related to three-year targets vest upon completion of the three-year period. Shares are subject to forfeiture if the service period requirement is not met.
There were no shares to be earned from awards granted in 2016. The number of shares earned in 2015 and 2014 was 110 and 152, respectively. Compensation expense, equal to the market value of the stock on the grant date, is recorded on a straight-line basis over the vesting period at the performance level deemed probable, as required by ASC 718. Compensation expense in 2016, 2015, and 2014 was $589, $2,479, and $1,083. Unamortized future compensation expense for performance-based restricted stock was $1,581 at December 31, 2016.
The following table summarizes activity related to unvested performance restricted stock shares during 2016:
| Total Unvested Shares |
Weighted average remaining term (years) |
Aggregate intrinsic value |
||||||||||
| Outstanding at January 1, 2016 |
366 | 1.64 | $ | 6,123 | ||||||||
| Shares vested |
(128 | ) | 1,978 | |||||||||
| Shares awarded |
85 | 1,423 | ||||||||||
| Shares forfeited |
(153 | ) | 2,184 | |||||||||
|
|
|
|||||||||||
| Outstanding at December 31, 2016 |
170 | 1.71 | 2,321 | |||||||||
|
|
|
|||||||||||
F-27
Table of Contents
VASCO DATA SECURITY INTERNATIONAL, INC.
NOTES TO CONSOLIDATED FINANCIAL STATEMENTS - (Continued)
(amounts in thousands, except per share data)
At December 31, 2016, total unvested shares consists of 58 earned shares and 112 unearned shares.
Note 10 – Earnings per Common Share
Basic earnings per share is based on the weighted average number of shares outstanding and excludes the dilutive effect of unexercised common stock equivalents. Diluted earnings per share is based on the weighted average number of shares outstanding and includes the dilutive effect of unexercised common stock equivalents to the extent they are not anti-dilutive. A reconciliation of the shares included in the basic and fully diluted earnings per share calculations is as follows:
| For the years ended December 31, | ||||||||||||
| 2016 | 2015 | 2014 | ||||||||||
| Net income-continuing operations |
$ | 10,561 | $ | 42,194 | $ | 32,611 | ||||||
| Net income (loss) from discontinued operations |
(47 | ) | (43 | ) | 873 | |||||||
|
|
|
|
|
|
|
|||||||
| Net income |
$ | 10,514 | $ | 42,151 | $ | 33,484 | ||||||
|
|
|
|
|
|
|
|||||||
| Weighted average common shares outstanding: |
||||||||||||
| Basic |
39,719 | 39,568 | 39,337 | |||||||||
| Incremental shares with dilutive effect: |
||||||||||||
| Restricted stock awards |
63 | 168 | 162 | |||||||||
|
|
|
|
|
|
|
|||||||
| Diluted |
39,782 | 39,736 | 39,499 | |||||||||
|
|
|
|
|
|
|
|||||||
| Basic income (loss) per share: |
||||||||||||
| Continuing operations |
$ | 0.27 | $ | 1.07 | $ | 0.83 | ||||||
| Discontinued operations |
(0.00 | ) | (0.00 | ) | 0.02 | |||||||
|
|
|
|
|
|
|
|||||||
| Total net income per share |
$ | 0.27 | $ | 1.07 | $ | 0.85 | ||||||
|
|
|
|
|
|
|
|||||||
| Diluted income (loss) per share: |
||||||||||||
| Continuing operations |
$ | 0.27 | $ | 1.06 | $ | 0.83 | ||||||
| Discontinued operations |
(0.00 | ) | (0.00 | ) | 0.02 | |||||||
|
|
|
|
|
|
|
|||||||
| Total net income per share |
$ | 0.27 | $ | 1.06 | $ | 0.85 | ||||||
|
|
|
|
|
|
|
|||||||
Note 11 – Employee Benefit Plan
We maintain a defined contribution pension plan for our U.S. employees established pursuant to the provisions of Section 401(k) of the Internal Revenue Code, which provides benefits for eligible employees of the company and allows us to match employee contributions. For the years ended December 31, 2016, 2015, and 2014, we contributed $167, $110, and $119 respectively, to this plan as matching contributions.
We also maintain a pension plan for our Belgian employees, in compliance with Belgian law. Contributions to Belgium plans are paid by the employees and the employer. Certain features of the plans require them to be categorized as defined benefit plans under ASC 715 due to Belgian social legislation, which prescribed a minimum annual return of 3.25% on employer contributions and 3.75% for employee contributions through December 31, 2015. In prior periods, the net period pension cost, unfunded net pension obligation and related disclosures were determined to be immaterial.
Effective January 1, 2016, Belgian law decreased the minimum required return for both employer and employee prospective contributions to 1.75%. While this change in law reduced the pension benefit obligation as
F-28
Table of Contents
VASCO DATA SECURITY INTERNATIONAL, INC.
NOTES TO CONSOLIDATED FINANCIAL STATEMENTS - (Continued)
(amounts in thousands, except per share data)
of December 31, 2016, the discount rate assumption used to value the projected benefit obligation decreased from 3.2% as of December 31, 2015, to 1.6% as of December 31, 2016, due to a reduction in Euro AA bond rates, and resulting yield curve, during 2016. These factors contributed to an overall increase to the projected benefit obligation of $1,835, recorded as an actuarial loss in accumulated other comprehensive income, net of tax, of $624. The net periodic pension cost for the year ended December 31, 2016, was immaterial.
The net unfunded status of these pension plans as of December 31, 2016, is as follows:
| Fair value of plan assets |
$ | 5,668 | ||
| Projected benefit obligation |
(7,503 | ) | ||
|
|
|
|||
| Net unfunded benefit obligation |
$ | (1,835 | ) | |
|
|
|
The net unfunded benefit obligation is recorded within other long-term liabilities in our consolidated balance sheet as of December 31, 2016
Actuarial Assumptions
Certain actuarial assumptions such as the discount rate and the long-term rate of return on plan assets have a significant effect on the amounts reported for net periodic cost and the benefit obligation. The assumed discount rates reflect the prevailing market rates of a universe of high-quality, non-callable, corporate bonds currently available that, if the obligation were settled at the measurement date, would provide the necessary future cash flows to pay the benefit obligation when due. In determining the long-term return on plan assets, the Company considers long-term rates of return of comparable low risk investments, such as Euro AA bonds.
| Annual weighted average assumptions at December 31, 2016 | ||||
| Discount rate |
1.6 | % | ||
| Inflation |
1.8 | % | ||
| Expected return on plan assets |
2.0 | % | ||
| Rate of salary increases |
2.8 | % | ||
For the year ended December 31, 2016, all plan assets are invested in guaranteed investment contracts.
The Company’s investment policy is designed to meet the responsibility under Belgium social legislation and align our investments to our liabilities, while reducing risk in our plans.
The fair value of plan assets is the guaranteed investment contract surrender value. The fair value of the plans assets were determined using Level 3 inputs as defined by ASC 820, Fair Value Measurements.
For the years ended December 31, 2016, 2015, and 2014, the company contributed $647, $572 and $697 respectively, to the plans.
| Projected future pension benefit payments | ||||
| 2017 |
$ | 141 | ||
| 2018 |
233 | |||
| 2019 |
159 | |||
| 2020 |
162 | |||
| 2021 |
336 | |||
| Beyond |
2,232 | |||
F-29
Table of Contents
VASCO DATA SECURITY INTERNATIONAL, INC.
NOTES TO CONSOLIDATED FINANCIAL STATEMENTS - (Continued)
(amounts in thousands, except per share data)
Note 12 – Geographic, Customer and Supplier Information
We classify our sales by our customers’ locations in four geographic regions: 1) EMEA, which includes Europe, the Middle East and Africa; 2) the United States, which for our purposes includes sales in Canada; 3) Asia Pacific Rim; and 4) Other Countries, including Australia, Latin America and India. Information regarding geographic areas for the years ended December 31, 2016, 2015, and 2014 is as follows:
| Europe, Middle East, Africa (EMEA) |
United States | Asia Pacific | Other Countries |
Total | ||||||||||||||||
| 2016 |
||||||||||||||||||||
| Revenue |
$ | 100,858 | $ | 23,603 | $ | 52,871 | $ | 14,972 | $ | 192,304 | ||||||||||
| Gross profit |
65,025 | 20,555 | 34,202 | 10,874 | 130,657 | |||||||||||||||
| Long-lived assets |
7,005 | 632 | 26 | 58 | 7,721 | |||||||||||||||
| 2015 |
||||||||||||||||||||
| Revenue |
$ | 164,180 | $ | 11,723 | $ | 47,156 | $ | 18,384 | $ | 241,443 | ||||||||||
| Gross profit |
92,721 | 9,766 | 28,508 | 12,545 | 143,540 | |||||||||||||||
| Long-lived assets |
2,771 | 620 | 19 | 51 | 3,461 | |||||||||||||||
| 2014 |
||||||||||||||||||||
| Revenue |
$ | 129,385 | $ | 12,098 | $ | 42,365 | $ | 17,689 | $ | 201,537 | ||||||||||
| Gross profit |
78,933 | 10,143 | 23,996 | 13,360 | 125,642 | |||||||||||||||
| Long-lived assets |
2,815 | 275 | 31 | 73 | 3,194 | |||||||||||||||
Previously reported gross profit for 2015 and 2014 revised in accordance with footnote 1.
For the years 2016, 2015, and 2014, our top 10 customers contributed 36%, 50% and 46%, respectively, of total worldwide revenue. In 2015 and 2014, one customer accounted for approximately 30%, and 12%, respectively, of total revenue. In 2014, another customer accounted for approximately 11% of total revenue.
The majority of our products are manufactured by four independent vendors, headquartered in Hong Kong and Macau. Our hardware DIGIPASSES are assembled at facilities in mainland China.
Note 13 – Commitments and Contingencies
The company leases office space and automobiles under operating lease agreements expiring at various times through 2021. Future minimum rental payments required under non-cancelable leases are as follows:
| Year |
Amount | |||
| 2017 |
$ | 3,204 | ||
| 2018 |
1,948 | |||
| 2019 |
1,196 | |||
| 2020 |
650 | |||
| 2021 |
219 | |||
| Thereafter |
0 | |||
|
|
|
|||
| Total |
$ | 7,217 | ||
|
|
|
|||
Rent expense under operating leases aggregated $3,384, $2,998 and $3,061 for the years ended December 31, 2016, 2015, and 2014, respectively. Rent expense is recorded on a straight-line basis over the life of the lease agreement.
F-30
Table of Contents
VASCO DATA SECURITY INTERNATIONAL, INC.
NOTES TO CONSOLIDATED FINANCIAL STATEMENTS - (Continued)
(amounts in thousands, except per share data)
At December 31, 2016, we have inventory purchase obligations of $19,134. We expect all purchase obligations will be consummated within twelve months.
We include various types of indemnification clauses in our agreements. These indemnifications may include, but are not limited to, infringement claims related to our intellectual property, direct damages and consequential damages. The type and amount of such indemnifications vary substantially based on our assessment of risk and reward associated with each agreement. We believe the estimated fair value of these indemnification clauses is minimal, and we cannot determine the maximum amount of potential future payments, if any, related to such indemnification provisions. We have no liabilities recorded for these clauses as of December 31, 2016.
During the second quarter of 2015, our management became aware that certain of our products which were sold by our European subsidiary to a third-party distributor may have been resold by the distributor to parties in Iran, potentially including parties whose property and interests in property may be blocked pursuant to Executive Order 13224, Executive Order 13382 or that may be identified under Section 560.304 of 31 C.F.R. Part 560 as the “Government of Iran”.
We ceased shipping to such distributor. In addition, the Audit Committee of the Company’s Board of Directors initiated an internal review of this matter with the assistance of outside counsel. As a precautionary matter, concurrent initial notices of voluntary disclosure were submitted on June 25, 2015 to each of the U.S. Department of the Treasury, Office of Foreign Assets Control (“OFAC”), and the U.S. Department of Commerce, Bureau of Industry and Security (“BIS”).
The Audit Committee with the assistance of outside counsel has completed their review. On December 15, 2015, we filed a letter with BIS (Office of Export Enforcement) with the conclusion that the products supplied to the distributor were not subject to United States Export Control jurisdiction. The Office of Export Enforcement issued a “no action” letter, concluding the voluntary self-disclosure process under the Export Administration Regulations.
In addition, on January 13, 2016, we filed a letter with OFAC, with the conclusions that VASCO and its subsidiaries made no direct sales to Iran or any party listed by OFAC as a Specially Designated National over the five-year period under review (i.e., June 1, 2010 to June 30, 2015). The letter further noted that the investigation did not identify any involvement on the part of senior management officials of VASCO, and to the contrary, noted that VASCO executive management officials had sought to implement procedures and provided notices to VASCO’s sales personnel to prevent the diversion of VASCO products to unauthorized destinations and end users.
We have not received any response to the letter to OFAC and we cannot predict when OFAC will conclude their review of our voluntary self-disclosures. Based upon the OFAC guidelines for monetary penalties, in the fourth quarter of 2015, we accrued $900 for potential penalties if they are assessed by OFAC. Ultimately no penalty may be assessed or the penalty may be less or greater than the accrual, but in any event we do not believe that the final settlement will have a material adverse impact on our business.
On July 28, 2015 a putative class action complaint was filed in the United States District Court for the Northern District of Illinois, captioned Linda J. Rossbach v. Vasco Data Security International, Inc., et al., case number 1:15-cv-06605, naming VASCO and certain of its current and former executive officers as defendants and alleging violations under the Securities Exchange Act of 1934, as amended. The suit was purportedly filed on behalf of a putative class of investors who purchased VASCO securities between April 28, 2015 and July 28,
F-31
Table of Contents
VASCO DATA SECURITY INTERNATIONAL, INC.
NOTES TO CONSOLIDATED FINANCIAL STATEMENTS - (Continued)
(amounts in thousands, except per share data)
2015, and seeks to recover damages allegedly caused by the defendants’ alleged violations of the federal securities laws and to pursue remedies under Sections 10(b) and 20(a) of the Securities Exchange Act of 1934 and Rule 10b-5 promulgated thereunder. The complaint seeks certification as a class action and unspecified compensatory damages plus interest and attorneys’ fees. Pursuant to a September 1, 2015 scheduling order entered by the court, the lead plaintiff, once appointed, will have sixty days to file an amended complaint or notify the defendants that the lead plaintiff intends to rely on the current complaint. On January 30, 2017, the appointed lead plaintiff filed an amended complaint in which the allegations regarding OFAC related matters were dropped and replaced with allegations regarding public disclosures made by the defendants in April 2015 as compared to public statements made in July 2015, generally regarding the strength of the Company’s business and its future prospects. The defendants have until March 31, 2017 to answer or otherwise respond to the operative complaint. Although the ultimate outcome of litigation cannot be predicted with certainty, the Company believes that this lawsuit is without merit and intends to defend against the action vigorously.
On October 9, 2015, a derivative complaint was filed in the United States District Court for the Northern District of Illinois, captioned Elizabeth Herrera v. Hunt, et al., case number 1:15-cv-08937, naming VASCO’s Board of Directors and certain of its current and former executive officers as individual defendants and the Company as a nominal defendant. Two additional complaints, captioned Beth Seltzer v. Hunt, et al., case number 2015-ch-15541, and William Hooper v. Hunt, et al., case number 2016-ch-04054, were filed on October 22, 2015 and March 22, 2016, respectively, in the Circuit Court of Cook County, Illinois naming the same defendants.
The complaints assert, among other things, that the individual defendants breached their fiduciary duties by making material misstatements in, and omitting material information from, the Company’s public disclosures and by failing to maintain adequate internal controls and properly manage the Company. Among other things, the complaints seek unspecified compensatory damages and injunctive relief. On February 23, 2016, the court in Herrera granted a stay of the action pending the resolution of a certain motion to dismiss that the parties anticipate to be filed in Rossbach. On October 29, 2015, a defendant removed the Seltzer action to the United States District Court for the Northern District of Illinois. Thereafter, the plaintiff led a motion to remand the action back to the Circuit Court of Cook County, Illinois, which was denied on February 3, 2016. On February 9, 2016, the court granted an agreed motion for voluntary dismissal of the Seltzer action, which dismissed the action with prejudice as to the named plaintiff’s individual claims. As for the Hooper action, the court granted a stay on June 8, 2016 on the same terms governing the stay in the Herrera action.
From time to time, we have been involved in litigation incidental to the conduct of our business. Excluding matters disclosed above, we are not a party to any lawsuit or proceeding that, in management’s opinion, is likely to have a material adverse effect on its business, financial condition or results of operations.
F-32
Table of Contents
VASCO DATA SECURITY INTERNATIONAL, INC.
NOTES TO CONSOLIDATED FINANCIAL STATEMENTS - (Continued)
(amounts in thousands, except per share data)
Note 14 – Quarterly Results of Operations (unaudited)
The quarterly results of operations are as follows:
| First Quarter |
Second Quarter |
Third Quarter |
Fourth Quarter |
|||||||||||||
| 2016 | ||||||||||||||||
| Net sales |
$ | 46,767 | $ | 54,293 | $ | 43,648 | $ | 47,597 | ||||||||
| Gross profit |
32,104 | 36,551 | 30,050 | 31,954 | ||||||||||||
| Operating expenses |
28,990 | 33,165 | 29,138 | 29,765 | ||||||||||||
| Operating income |
3,115 | 3,386 | 912 | 2,186 | ||||||||||||
| Income from Continuing Operations |
2,199 | 2,826 | 494 | 5,042 | ||||||||||||
| Income (loss) from Discontinued Operations |
0 | (1 | ) | (16 | ) | (30 | ) | |||||||||
| Net income |
2,199 | 2,825 | 478 | 5,012 | ||||||||||||
| Basic income/(loss) per share: |
||||||||||||||||
| Continuing Operations |
$ | 0.06 | $ | 0.07 | $ | 0.01 | $ | 0.13 | ||||||||
| Discontinued Operations |
0.00 | 0.00 | 0.00 | 0.00 | ||||||||||||
|
|
|
|
|
|
|
|
|
|||||||||
| Total Net income per share |
$ | 0.06 | $ | 0.07 | $ | 0.01 | $ | 0.13 | ||||||||
|
|
|
|
|
|
|
|
|
|||||||||
| Diluted income/(loss) per share: |
||||||||||||||||
| Continuing Operations |
$ | 0.06 | $ | 0.07 | $ | 0.01 | $ | 0.13 | ||||||||
| Discontinued Operations |
0.00 | 0.00 | 0.00 | 0.00 | ||||||||||||
|
|
|
|
|
|
|
|
|
|||||||||
| Total Net income per share |
$ | 0.06 | $ | 0.07 | $ | 0.01 | $ | 0.13 | ||||||||
|
|
|
|
|
|
|
|
|
|||||||||
| 2015 | ||||||||||||||||
| Net sales |
$ | 65,135 | $ | 65,393 | $ | 60,027 | $ | 50,889 | ||||||||
| Gross profit |
37,106 | 37,739 | 35,695 | 33,000 | ||||||||||||
| Operating expenses |
21,030 | 21,986 | 22,240 | 27,832 | ||||||||||||
| Operating income |
16,077 | 15,753 | 13,455 | 5,168 | ||||||||||||
| Income from Continuing Operations |
13,657 | 13,866 | 11,186 | 3,485 | ||||||||||||
| Income (loss) from Discontinued Operations |
(23 | ) | (14 | ) | (4 | ) | (1 | ) | ||||||||
| Net income |
13,634 | 13,852 | 11,182 | 3,484 | ||||||||||||
| Basic income/(loss) per share: |
||||||||||||||||
| Continuing Operations |
$ | 0.34 | $ | 0.35 | $ | 0.28 | $ | 0.09 | ||||||||
| Discontinued Operations |
0.00 | 0.00 | 0.00 | 0.00 | ||||||||||||
|
|
|
|
|
|
|
|
|
|||||||||
| Total Net income per share |
$ | 0.34 | $ | 0.35 | $ | 0.28 | $ | 0.09 | ||||||||
|
|
|
|
|
|
|
|
|
|||||||||
| Diluted income/(loss) per share: |
||||||||||||||||
| Continuing Operations |
$ | 0.34 | $ | 0.35 | $ | 0.28 | $ | 0.09 | ||||||||
| Discontinued Operations |
0.00 | 0.00 | 0.00 | 0.00 | ||||||||||||
|
|
|
|
|
|
|
|
|
|||||||||
| Total Net income per share |
$ | 0.34 | $ | 0.35 | $ | 0.28 | $ | 0.09 | ||||||||
|
|
|
|
|
|
|
|
|
|||||||||
The gross profit and operating expenses reflected in the quarterly results of operations tables above have been revised from amounts previously reported to correct immaterial errors as discussed in Note 1 “Revision of Previously Issued Financial Statements”. Specifically, the gross profit decreased and the operating expenses increased from the respective amounts previously reported by the company by $1,824, $1,974, $2,051, $568, $759, $571, and $648 in the first quarter of 2016, the second quarter of 2016, the third quarter of 2016, the first quarter of 2015, the second quarter of 2015, the third quarter of 2015 and the fourth quarter of 2015, respectively.
F-33
Table of Contents
VASCO DATA SECURITY INTERNATIONAL, INC.
VALUATION AND QUALIFYING ACCOUNTS
Allowance for doubtful accounts for trade receivables
| For the year ended December 31, |
Beginning Balance |
Provision for Bad Debts |
Chargeoffs | Foreign Currency Translation |
Ending Balance |
|||||||||||||||
| 2016 |
$ | 621 | (85 | ) | 0 | (1 | ) | $ | 535 | |||||||||||
| 2015 |
$ | 223 | 686 | (293 | ) | 5 | $ | 621 | ||||||||||||
| 2014 |
$ | 650 | 24 | (429 | ) | (22 | ) | $ | 223 | |||||||||||
See accompanying independent auditors’ report.
F-34
Table of Contents
SIGNATURES
Pursuant to the requirements of Section 13 or 15(d) of the Securities Exchange Act of 1934, the Registrant has duly caused this Report to be signed on its behalf by the undersigned, thereunto duly authorized, on March 10, 2017.
| VASCO Data Security International, Inc. |
| /s/ T. Kendall Hunt |
| T. Kendall Hunt |
| Chief Executive Officer |
Pursuant to the requirements of the Securities Exchange Act of 1934, this Report has been signed by the following persons on behalf of the Registrant in the capacities indicated on March 10, 2017.
POWER OF ATTORNEY
Each of the undersigned, in his capacity as an officer or director, or both, as the case may be, of VASCO Data Security International, Inc. does hereby appoint T. Kendall Hunt, and each of them severally, his true and lawful attorneys or attorney to execute in his name, place and stead, in his capacity as director or officer, or both, as the case may be, this Annual Report on Form 10-K for the fiscal year ended December 31, 2016 and any and all amendments thereto and to file the same with all exhibits thereto and other documents in connection therewith with the Securities and Exchange Commission. Each of said attorneys shall have power to act hereunder with or without the other attorney and shall have full power and authority to do and perform in the name and on behalf of each of said directors or officers, or both, as the case may be, every act whatsoever requisite or necessary to be done in the premises, as fully and to all intents and purposes as to which each of said officers or directors, or both, as the case may be, might or could do in person, hereby ratifying and confirming all that said attorneys or attorney may lawfully do or cause to be done by virtue hereof.
| SIGNATURE |
TITLE | |||
| /s/ T. Kendall Hunt T. Kendall Hunt |
Chief Executive Officer and Chairman (Principal Executive Officer) | |||
| /s/ Scott Clements Scott Clements |
President and Chief Operating Officer (Principal Operating Officer) | |||
| /s/ Mark S. Hoyt Mark S. Hoyt |
Chief Financial Officer and Secretary (Principal Financial Officer and Principal Accounting Officer) | |||
| /s/ Michael P. Cullinane Michael P. Cullinane |
Director | |||
| /s/ Jean K. Holley Jean K. Holley |
Director | |||
| /s/ John N. Fox, Jr. John N. Fox, Jr. |
Director | |||
| /s/ Matthew Moog Matthew Moog |
Director | |||