Attached files
| file | filename |
|---|---|
| EX-99.1 - EXHIBIT 99.1 - Internap Corp | t1700156_ex99-1.htm |
| 8-K - FORM 8-K - Internap Corp | t1700156_8k.htm |
Exhibit 99.2

l Internap Corporation Presentation 4 th Quarter 2016 Earnings Results Peter D. Aquino Chief Executive Officer Robert M. Dennerlein Chief Financial Officer March 9, 2017

This presentation contains forward - looking statements. These forward - looking statements include statements related to our cost reductions, improved profitability, our ability to refinance our indebtedness; our strategy to align into pure - play businesses and our expectations for full - year 2017 revenue, Adjusted EBITDA and capital expenditures. Our ability to achieve these forward - looking statements is based on certain assumptions, including our ability to execute on our business strategy, leveraging of multiple routes to market, expanded brand awareness for high - performance Internet infrastructure services and customer churn levels. These assumptions may prove inaccurate in the future. Because such forward - looking statements are not guarantees of future performance and involve risks and uncertainties, there are important factors that could cause Internap’s actual results to differ materially from those in the forward - looking statements. These factors include our ability to execute on our business strategy and drive growth; our ability to maintain current customers and obtain new ones, whether in a cost - effective manner or at all; the robustness of the IT infrastructure services market; our ability to achieve or sustain profitability; our ability to expand margins and drive higher returns on investment; our abilit y to sell into new and existing data center space; the actual performance of our IT infrastructure services; our ability to correctly forecast capital needs, demand planning and space utilization; our ability to respond successfully to technological change and the resulting competition; the availability of services from Internet network service providers or network service providers providing network access loops and local loops on favorable terms, or at all; failure of third party suppliers to deliver their products and services on favorable terms, or at all; failures in our network operations centers, data centers, network access points or computer systems; our ability to provide or improve Internet infrastructure services to our customers; and our ability to protect our intellectual property; market conditions and the terms of any issuance of equity or debt securities or the refinancing or amendment of our indebtedness; risks related to our indebtedness, including our substantial amount of debt, our ability to incur debt and increases in interest rates or in our borrowing margins; our ability to meet the financial and other covenants contained in our credit agreement; as well as other factors discussed in our filings with the Securities and Exchange Commission. Given these risks and uncertainties, investors should not place undue reliance on forward - looking statements as a prediction of actual results. We undertake no obligation to update, amend or clarify any forward - looking statement for any reason. 2 Forward - looking Statements

In addition to results presented in accordance with GAAP, this presentation includes non - GAAP financial measures. The Company believes these non - GAAP financial measures provide additional information that is useful to investors in helping to understand our underlying performance and trends. Non - GAAP financial measures have inherent limitations, which are not required to be uniformly applied. Readers should be aware of these limitations and should be cautious with respect to the use of such measures. To compensate for these limitations, we use non - GAAP financial measures as comparative tools, together with GAAP financial measures, to assist in the evaluation of our operating performance or financial condition. Our method of calculating these non - GAAP financial measures may differ from methods used by other companies. These non - GAAP financial measures should not be considered in isolation or as a substitute for those financial measures prepared in accordance with GAAP. As required by SEC rules, we have provided in this presentation reconciliations of the non - GAAP financial measures included in this presentation to the most directly comparable GAAP financial measures. Reconciliations of non - GAAP financial measures are also available in the attachment to our fourth quarter 2016 earnings press release available on our website at www.ir.Internap.com . 3 Non - GAAP Financial Measures

Positioning 2017 as a New Baseline 4 INAP’s New Leadership in Execute Mode x The new INAP SoTPs = Colo + Cloud Business Units x Identified Key Areas for Operational Improvements: • Hired new senior management team / ReOrg • Re - established 2016 / 2017 Financial Targets • Initiated Cost Reductions – Phase I of III complete • Rebuilding Sales & Marketing for Profitable Growth x Locked in Amended Credit Agreement with $43M of equity from current investors …on to Refinancing

**Reconciliation to GAAP on pages 11 - 15 * Operating Expenses and reported GAAP Net Loss for 4Q ‘16 included a non - cash goodwill impairment of $1.9 million. 5 Consolidated Earnings Summary (million, except %) 4Q ‘16 3Q ‘16 4Q ‘15 Total Revenue $74.1 $73.9 $78.8 Operating Expenses* $79.1 $157.3 $85.5 GAAP Net Loss* $(13.1) $(91.3) $(11.3) Minus goodwill impairment and other items* $7.6 $83.6 $3.9 Normalized net loss (non - GAAP)** $(5.5) $(7.7) $(7.4) Adjusted EBITDA (non - GAAP)** $21.6 $19.8 $22.8 Adjusted EBITDA Margin (non - GAAP)** 29.1% 26.8% 29.0% Capital Expenditures ( CapEx ) $6.3 $12.8 $14.7 Adjusted EBITDA less CapEx ** $15.3 $7.0 $8.1

*Reconciliation to GAAP on page 11 - 15 Approximately 25% of the Y/Y revenue decline is associated with a customer being acquired by a large social media company, with the remainder attributable to IP pricing declines. 6 Data Center / Network Services Revenue & Segment Profit (non - GAAP)* and Margin (non - GAAP)* • 4Q ‘16 DCNS Y/Y revenue decrease primarily due to continued decline in IP connectivity pricing and churn impact from one large Colo customer • 4Q ‘16 IP Y/Y revenue decline reflects the continued decline in IP connectivity pricing • 4Q ‘16 Colo Y/Y revenue decline reflects the churn of one large customer partially offset by Company Controlled Colo growth • 4Q ‘16 DCNS Y/Y segment profit decrease driven by lower revenue; Q/Q segment profit increase due to favorable power cost seasonality

*Reconciliation to GAAP on pages 11 - 15 7 Cloud/Managed Services Revenue & Segment Profit (non - GAAP)* and Margin (non - GAAP)* • 4Q ‘16 Cloud/Hosting Y/Y revenue decline reflects continued negative impact of churn due to customer acquisition by large social media company • 4Q ‘16 Agile Y/Y revenue decrease due to customer acquisition churn partially offset by revenue growth; Q/Q revenue increase reflects favorable revenue growth • 4Q ‘16 Iweb Y/Y revenue declined due to lower BNOC • 4Q ‘16 MH Y/Y revenue declined due to lower BNOC • 4Q ‘16 Cloud/Hosting segment Y/Y segment profit decreased due to lower revenue; Q/Q segment profit reflects favorable power cost seasonality and cost reductions Strengthening sequential performance in revenue generation and profitability.

*Reconciliation to GAAP on pages 11 - 15 Transforming Balance Sheet 8 Cash Flow and Balance Sheet Summary ($millions) 4Q'16 3Q'16 4Q'15 FY' 16 Net cash flows provided by operating activities (GAAP) 10.2$ 11.5$ 17.8$ 46.4$ Capital expenditures: Maintenance capital (1.8)$ (1.9)$ (3.5)$ (7.4)$ Growth capital (4.5)$ (10.9)$ (11.2)$ (38.8)$ Free cash flow (non-GAAP)* 4.0$ (1.4)$ 3.1$ 0.3$ Cash Interest 7.6$ 7.6$ 6.7$ 27.6$ Unlevered free cash flow (non-GAAP)* 11.6$ 6.2$ 9.8$ 27.9$ Balance Sheet Total Debt 373.6$ 375.1$ 374.6$ 373.6$ Cash & cash equivalents 10.4$ 9.6$ 17.8$ 10.4$

*Reconciliation to GAAP on pages 11 - 15 9 Financial Outlook Expected Range ($ millions) 2016 Range and Actual 2017 Range Revenue $275 to $285 Adjusted EBITDA (non - GAAP)* $84 to $87 Capital expenditures ~$42 2016 Guidance Achieved; Reaffirming 2017 Outlook $297 $300 $298 $81 $83 $82 $47 $50 $46

Transforming INAP to Earn Peer - Group Multiples 10 Next Steps for the New INAP x Continue to Rebuild Sales & Marketing Capabilities x Reorient customers to INAPs growth products, and premier Tier 3 - type data centers in 9 major markets. x Launch Phase II and III of cost reductions: • Network optimization effort • Partner facilities evaluation x Refinance Senior Debt in 2017 x Be Opportunistic in deal - making

11 Reconciliation of Non - GAAP Financial Measures Appendix

12 Reconciliation of Non - GAAP Financial Measures Normalized net loss is a non - GAAP measure. Normalized net loss is net loss plus exit activities, restructuring and impairments, stock - based compensation, strategic alternatives and related costs and organizational realignment costs. (in thousands) December 31, 2016 September 30, 2016 December 31, 2015 Net loss (GAAP) (13,110)$ (91,297)$ (11,269)$ Exit activities, restructuring and impairments, including goodwill impairment 7,149 79,839 1,033 Stock-based compensation 280 1,253 2,582 Strategic alternatives and related costs (136) 1,121 245 Organizational realignment costs 320 1,403 - Normalized net loss (non-GAAP) (5,497)$ (7,681)$ (7,409)$ Three Months Ended

13 Reconciliation of Non - GAAP Financial Measures Segment profit and segment margin are non - GAAP measures . Segment profit is segment revenues less direct costs of sales and services, exclusive of depreciation and amortization. Segment profit does not include direct costs of customer support or depreciation or amortization associated with direct costs. Segment margin is segment profit as a percentage of segment revenu es. (dollars in thousands) December 30, 2016 September 30, 2016 December 31, 2015 Revenues: Data center and network services: Company-controlled 22,561$ 22,710$ 23,310$ Partner 9,751 9,837 9,955 IP connectivity 17,249 17,220 19,745 Total data center and network services 49,561 49,767 53,010 Cloud and hosting services 24,556 24,173 25,746 Total 74,117 73,940 78,756 Direct cost of sales and services, exclusive of depreciation and amortization: Data center and network services: Company-controlled 10,072 10,266 9,728 Partner 7,060 7,517 7,280 IP connectivity 7,154 7,259 7,760 Total data center and network services 24,286 25,042 24,768 Cloud and hosting services 5,960 6,520 6,666 Total 30,246 31,562 31,434 Segment Profit: Data center and network services Company-controlled 12,489 12,444 13,582 Partner 2,691 2,320 2,675 IP connectivity 10,095 9,961 11,985 Total data center and network services 25,275 24,725 28,242 Cloud and hosting services 18,596 17,653 19,080 Total 43,871$ 42,378$ 47,322$ Segment Margin: Data center and network services Company-controlled 55.4% 54.8% 58.3% Partner 27.6% 23.6% 26.9% IP connectivity 58.5% 57.8% 60.7% Total data center and network services 51.0% 49.7% 53.3% Cloud and hosting services 75.7% 73.0% 74.1% Total 59.2% 57.3% 60.1% Three Months Ended
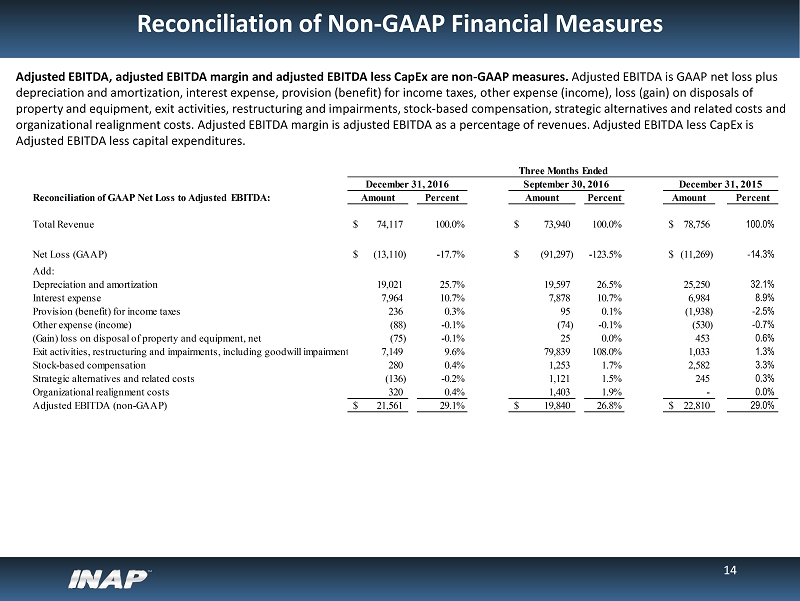
14 Reconciliation of Non - GAAP Financial Measures Adjusted EBITDA, adjusted EBITDA margin and adjusted EBITDA less CapEx are non - GAAP measures. Adjusted EBITDA is GAAP net loss plus depreciation and amortization, interest expense, provision (benefit) for income taxes, other expense (income), loss (gain) on di sposals of property and equipment, exit activities, restructuring and impairments, stock - based compensation, strategic alternatives and rel ated costs and organizational realignment costs. Adjusted EBITDA margin is adjusted EBITDA as a percentage of revenues . Adjusted EBITDA less CapEx is Adjusted EBITDA less capital expenditures. Reconciliation of GAAP Net Loss to Adjusted EBITDA: Amount Percent Amount Percent Amount Percent Total Revenue 74,117$ 100.0% 73,940$ 100.0% 78,756$ 100.0% Net Loss (GAAP) (13,110)$ -17.7% (91,297)$ -123.5% (11,269)$ -14.3% Add: Depreciation and amortization 19,021 25.7% 19,597 26.5% 25,250 32.1% Interest expense 7,964 10.7% 7,878 10.7% 6,984 8.9% Provision (benefit) for income taxes 236 0.3% 95 0.1% (1,938) -2.5% Other expense (income) (88) -0.1% (74) -0.1% (530) -0.7% (Gain) loss on disposal of property and equipment, net (75) -0.1% 25 0.0% 453 0.6% Exit activities, restructuring and impairments, including goodwill impairment 7,149 9.6% 79,839 108.0% 1,033 1.3% Stock-based compensation 280 0.4% 1,253 1.7% 2,582 3.3% Strategic alternatives and related costs (136) -0.2% 1,121 1.5% 245 0.3% Organizational realignment costs 320 0.4% 1,403 1.9% - 0.0% Adjusted EBITDA (non-GAAP) 21,561$ 29.1% 19,840$ 26.8% 22,810$ 29.0% December 31, 2016 September 30, 2016 December 31, 2015 Three Months Ended

15 Reconciliation of Non - GAAP Financial Measures Adjusted EBITDA less CapEx is a non - GAAP measure. Adjusted EBITDA less CapEx is adjusted EBITDA less capital expenditures with Adjusted EBITDA for this non - GAAP measure defined as net cash flow provided by operating activities plus cash paid for interest, cash paid for taxes, cash paid for exit activities and restructuring, cash paid for strategic alternatives and related costs, cash paid for organizational realignment costs, payment of debt lender fees and other working capital changes less capital expenditures. Year Ended Reconciliation of GAAP Net Cash Flows Provided by Operating Activities to Adjusted EBITDA less CapEx: December 31, 2016 September 30, 2016 December 31, 2015 December 31, 2016 Net Cash Flows provided by operating activites: 10,185$ 11,464$ 17,815$ 46,449$ Add : Cash paid for interest 7,604 7,601 6,715 29,561 Cash paid for income taxes 22 11 21 165 Cash paid for exit activities and restructuring 1,229 776 859 3,584 Cash paid for strategic alternatives and related costs 512 187 - 3,876 Cash paid for organizational realignment costs 1,664 913 - 1,716 Payment of debt lender fees - - - 1,716 Other working capital changes 345 (1,112) (2,600) (5,106) Adjusted EBITDA (non-GAAP) 21,561$ 19,840$ 22,810$ 81,961$ Less: Capital Expenditures (CapEx) 6,250$ 12,860$ 14,738 46,192 Adjusted EBITDA less CapEx (non-GAAP) 15,311$ 6,980$ 8,072$ 35,769$ Three Months Ended

16 Reconciliation of Non - GAAP Financial Measures Free cash flow and unlevered free cash flow are non - GAAP financial measures. Free cash flow and unlevered free cash flow are non - GAAP measures. Free cash flow is net cash flows provided by operating activities minus capital expenditures. Unlevered free cash f low is free cash flow plus cash interest expense. (in thousands) Adjusted EBITDA and forward looking projected adjusted EBITDA are non - GAAP measures. Adjusted EBITDA is GAAP net loss plus depreciation and amortization, interest expense, provision (benefit) for income taxes, other expense ( income), loss (gain) on disposals of property and equipment, exit activities, restructuring and impairments, stock - based compensation, strategic alternatives and related costs an d organizational realignment costs. The table below sets forth adjusted EBITDA for the full year 2016 and a forward looking projected adjusted EB ITDA range for full - year 2017. Amount Percent Amount Percent Amount Percent Total Revenue 298$ 100.0% 275$ 100.0% 285$ 100.0% Net Loss (GAAP) (125)$ -41.9% (6)$ -2.2% (4)$ -1.4% Add: Depreciation and amortization 77 25.8% 71 25.8% 71 24.9% Interest expense 31 10.4% 0.0% 0.0% Provision for income taxes 1 0.2% 0.0% 0.0% Other expense (income) 0 0.1% 0.0% 0.0% (Gain) loss on disposal of property and equipment, net (0) 0.0% 0.0% 0.0% Exit activities, restructuring and impairments, including goodwill impairment 87 29.3% 7 2.5% 6 2.1% Stock-based compensation 5 1.7% 8 2.9% 10 3.5% Strategic alternatives and related costs 1 0.5% 2 0.7% 2 0.7% Organizational realignment costs 4 1.5% 2 0.7% 2 0.7% Adjusted EBITDA (non-GAAP) 82$ 27.5% 84$ 30.5% 87$ 30.5% Capital Expenditures (CapEx) 46.2 15.5% Adjusted EBITDA less CapEx 35.8 12.0% Year Ended December 31, 2016 Low High 2017 Full-Year Guidance December 31, 2016 September 30, 2016 December 31, 2015 FY'16 Net cash flows provided by operating activities 10,184$ 11,464$ 17,815$ 46,449$ Capital expenditures: Maintenance capital (1,717) (1,935) (3,472) (7,270) Growth capital (4,533) (10,925) (11,266) (38,922) Free cash flow (non-GAAP) 3,934 (1,396) 3,077 257 Cash Interest Expense 7,604 7,601 6,715 27,575 Unlevered free cash flow (non-GAAP) 11,538$ 6,205$ 9,792$ 27,832$ Three Months Ended