Attached files
| file | filename |
|---|---|
| EX-32.2 - EX-32.2 - Bojangles', Inc. | d310576dex322.htm |
| EX-32.1 - EX-32.1 - Bojangles', Inc. | d310576dex321.htm |
| EX-31.2 - EX-31.2 - Bojangles', Inc. | d310576dex312.htm |
| EX-31.1 - EX-31.1 - Bojangles', Inc. | d310576dex311.htm |
| EX-23.1 - EX-23.1 - Bojangles', Inc. | d310576dex231.htm |
| EX-21 - EX-21 - Bojangles', Inc. | d310576dex21.htm |
Table of Contents
Index to Financial Statements
UNITED STATES
SECURITIES AND EXCHANGE COMMISSION
Washington, D.C. 20549
FORM 10-K
(Mark One)
| ☒ | ANNUAL REPORT PURSUANT TO SECTION 13 OR 15(d) OF THE SECURITIES EXCHANGE ACT OF 1934 |
For the fiscal year ended December 25, 2016
OR
| ☐ | TRANSITION REPORT PURSUANT TO SECTION 13 OR 15(d) OF THE SECURITIES EXCHANGE ACT OF 1934 |
For the transition period from to
Commission File Number 001-37374
Bojangles’, Inc.
(Exact name of registrant as specified in its charter)
| Delaware | 45-2988924 | |
| (State or other jurisdiction of incorporation or organization) |
(I.R.S. Employer Identification No.) | |
| 9432 Southern Pine Boulevard Charlotte, North Carolina |
28273 | |
| (Address of principal executive offices) | (Zip Code) | |
(704) 527-2675
(Registrant’s telephone number, including area code)
Securities registered pursuant to Section 12(b) of the Act:
| Title of each class |
Name of exchange on which registered | |
| Common Stock, par value $0.01 per share | NASDAQ Global Select Market |
Securities registered pursuant to Section 12(g) of the Act: None
Indicate by check mark if the registrant is a well-known seasoned issuer, as defined in Rule 405 of the Securities Act. Yes ☐ No ☒
Indicate by check mark if the registrant is not required to file reports pursuant to Section 13 or Section 15(d) of the Exchange Act. Yes ☐ No ☒
Indicate by check mark whether the registrant (1) has filed all reports required to be filed by Section 13 or 15(d) of the Securities Exchange Act of 1934 during the preceding 12 months (or for such shorter period that the registrant was required to file such reports), and (2) has been subject to such filing requirements for the past 90 days. Yes ☒ No ☐
Indicate by check mark whether the registrant has submitted electronically and posted on its corporate Web site, if any, every Interactive Data File required to be submitted and posted pursuant to Rule 405 of Regulation S-T (§232.405 of this chapter) during the preceding 12 months (or for such shorter period that the registrant was required to submit and post such files). Yes ☒ No ☐
Indicate by check mark if disclosure of delinquent filers pursuant to Item 405 of Regulation S-K (§229.405 of this chapter) is not contained herein, and will not be contained, to the best of Registrant’s knowledge, in definitive proxy or information statements incorporated by reference in Part III of this Form 10-K or any amendment to this Form 10-K. ☒
Indicate by check mark whether the registrant is a large accelerated filer, an accelerated filer, a non-accelerated filer, or a smaller reporting company. See the definitions of “large accelerated filer,” “accelerated filer” and “smaller reporting company” in Rule 12b-2 of the Exchange Act.
| Large accelerated filer | ☐ | Accelerated filer | ☒ | |||
| Non-accelerated filer | ☐ (Do not check if a smaller reporting company) | Smaller reporting company | ☐ | |||
Indicate by check mark whether the registrant is a shell company (as defined in Rule 12b-2 of the Exchange Act). Yes ☐ No ☒
As of June 24, 2016 (the last business day of the registrant’s second quarter for fiscal 2016), the aggregate market value of the registrant’s voting common stock held by non-affiliates of the registrant, based on the closing sale price as reported on the NASDAQ Global Select Market System, was approximately $170.6 million. For purposes of the foregoing calculation only, executive officers and directors of the registrant have been deemed to be affiliates.
As of March 1, 2017, there were 36,562,709 shares of the registrant’s common stock, par value $0.01 per share outstanding.
DOCUMENTS INCORPORATED BY REFERENCE
The information required by Part III of this Form 10-K, to the extent not set forth herein, is incorporated herein by reference from the Bojangles’, Inc. definitive proxy statement to be filed with the Securities and Exchange Commission pursuant to Regulation 14A not later than 120 days after December 25, 2016.
Table of Contents
Index to Financial Statements
BOJANGLES’, INC. AND SUBSIDIARIES
FORM 10-K
i
Table of Contents
Index to Financial Statements
MARKET AND INDUSTRY DATA AND FORECASTS
Certain market and industry data included in this Annual Report on Form 10-K is derived from information provided by third-party market research firms, including Technomic, Inc. (“Technomic”) and The NPD Group (“NPD”), or third-party financial or analytics firms, including The Buxton Company (“Buxton”) that we believe to be reliable. Market estimates are calculated by using independent industry publications, government publications and third-party forecasts in conjunction with our assumptions about our markets. We have not independently verified such third-party information. While we are not aware of any misstatements regarding any market, industry or similar data presented herein, such data involves risks and uncertainties and are subject to change based on various factors, including those discussed under the headings “Cautionary Note Regarding Forward-Looking Statements” and “Risk Factors” in this Annual Report on Form 10-K.
Certain data are also based on our good faith estimates, which are derived from our knowledge of the industry and independent sources. Industry publications, surveys and forecasts generally state that the information contained therein has been obtained from sources believed to be reliable, but there can be no assurance as to the accuracy or completeness of included information. We have not independently verified any of the data from third-party sources nor have we ascertained the underlying economic assumptions relied upon therein. Statements as to our market position are based on market data currently available to us. While we are not aware of any misstatements regarding the industry data presented herein, our estimates involve risks and uncertainties and are subject to change based on various factors, including those discussed under the heading “Risk Factors” in this Annual Report on Form 10-K. Similarly, we believe our internal research is reliable, even though such research has not been verified by any independent sources.
BASIS OF PRESENTATION
In this Annual Report on Form 10-K, unless the context otherwise requires:
| • | “we,” “us,” “our,” the “company” or “Bojangles’,” refers collectively to Bojangles’, Inc., a Delaware corporation, incorporated in 2011 and its subsidiaries; |
| • | “our restaurant system” or “our system” refers to both company-operated and franchised restaurants, and the number of restaurants presented in our restaurant system, unless otherwise indicated, is as of December 25, 2016; |
| • | “our restaurants,” or results or statistics attributable to one or more restaurants without expressly identifying them as company-operated, franchised or both, refers to our company-operated restaurants only; |
| • | when referring to “system-wide” financial metrics, we are referring to such financial metrics at the restaurant-level for company-operated restaurants plus those reported to us by our franchisees; |
| • | “average check” refers to company restaurant revenues from company-operated restaurants divided by company-operated restaurant transactions; |
| • | “dayparts” refers to five dayparts consisting of breakfast as open to 11:00 a.m., lunch as 11:00 a.m. to 2:00 p.m., snack as 2:00 p.m. to 5:00 p.m., dinner as 5:00 p.m. to 8:00 p.m., and after dinner as 8:00 p.m. to close. |
On May 13, 2015, we completed our initial public offering (“IPO”) of 8,912,500 shares of common stock at a price to the public of $19.00 per share, including 1,162,500 shares sold to the underwriters pursuant to their option to purchase additional shares. All of the shares of our common stock offered as part of the IPO were sold by selling stockholders. Accordingly, we did not receive any proceeds from the sale of the shares. Prior to the consummation of the IPO (i) a 359.03843-for-1 stock split of our common stock was effected (subject to rounding to eliminate any fractional shares), (ii) the conversion ratio of our Series A Preferred Stock was
ii
Table of Contents
Index to Financial Statements
automatically adjusted as a result of the stock split in accordance with certain anti-dilution provisions in our certificate of incorporation and (iii) each share of our Series A Preferred Stock converted into 359.03843 shares of our common stock (subject to rounding to eliminate any fractional shares). All share and per-share data herein have been adjusted to reflect the stock split as though it had occurred prior to the earliest data presented.
We use a 52- or 53-week fiscal year ending on the last Sunday of each calendar year. Fiscal 2012, fiscal 2013, fiscal 2014, fiscal 2015 and fiscal 2016 ended on December 30, 2012, December 29, 2013, December 28, 2014, December 27, 2015 and December 25, 2016, respectively.
In a 52-week fiscal year, each quarter includes 13 weeks of operations; in a 53-week fiscal year, the first, second and third quarters each include 13 weeks of operations and the fourth quarter includes 14 weeks of operations. Approximately every five or six years, a 53-week fiscal year occurs. Fiscal 2012 was a 53-week fiscal year. Fiscal 2013, fiscal 2014, fiscal 2015 and fiscal 2016 were 52-week fiscal years.
Our point-of-sale system is used to collect detailed transaction data from company-operated restaurants, which generates information about product mix, daypart sales and other metrics that we actively analyze. During fiscal 2015, we completed the migration of our company-operated restaurants to a new point-of-sale system. Prior to the completion of the implementation of our new point-of-sale system, certain metrics were computed using data from company-operated restaurants operating on our previous point-of-sale system allocated across all company-operated restaurants. During the third fiscal quarter of 2015, certain metrics were computed using data from company-operated restaurants on our new point-of-sale system allocated across all company-operated restaurants. Beginning in the fourth fiscal quarter of 2015, certain metrics were computed using detailed transaction data from all company-operated restaurants. In order to calculate certain key performance indicators, franchised restaurant sales are estimated based on data reported by our franchisees.
Comparable restaurant sales growth reflects the change in year-over-year sales for the comparable restaurant base (as applicable, system-wide, franchised or company-operated restaurants). A restaurant enters our comparable restaurant base on the first full day of the month after being open for 15 months using a mid-month convention. If a company-operated restaurant is temporarily closed for a full calendar week due to items such as a remodel, scrape and rebuild, casualty event, severe weather conditions or any other short-term closure, it is removed from the comparable restaurant sales calculations for such period it is temporarily closed.
System-wide comparable restaurant sales include restaurant sales at all comparable company-operated restaurants and at all comparable franchised restaurants, as reported by franchisees. If a franchised restaurant is temporarily closed for a full calendar week due to items such as a remodel, scrape and rebuild, casualty event, severe weather conditions or any other short-term closure, it is removed from the comparable restaurant sales calculations for the entire month(s) impacted by the temporary closure. While we do not record franchised restaurant sales as revenues, our royalty revenues are calculated based on a percentage of franchised restaurant sales.
We measure system-wide, franchised and company-operated average unit volume (“AUV”) on a fiscal year basis and on a trailing twelve-months (“TTM”) basis for non-fiscal year-end periods. Annual AUVs are calculated using the following methodology: first, we determine the domestic free-standing restaurants with both a drive-thru and interior seating that have been open for a full twelve-month period (excluding express units); and second, we calculate the revenues for these restaurants and divide by the number of restaurants in that base to arrive at our AUV calculation. This methodology is similar for each TTM period in addition to the fiscal year end.
Restaurant contribution is defined as company restaurant revenues less company food and supplies costs, restaurant labor costs and operating costs. Restaurant contribution margin is defined as restaurant contribution as a percentage of company restaurant revenues.
iii
Table of Contents
Index to Financial Statements
We calculate restaurant-level cash flow as restaurant contribution (excluding preopening expense) less equipment capital lease payments. Our equipment capital leases typically have terms of 60 months.
We calculate cash-on-cash return by dividing year one restaurant-level cash flow by upfront cash investment costs (which include upfront cash equipment investments and exclude preopening costs).
Certain monetary amounts, percentages and other figures included in this Annual Report on Form 10-K have been subject to rounding adjustments. Percentage amounts included in this Annual Report on Form 10-K have not in all cases been calculated on the basis of such rounded figures, but on the basis of such amounts prior to rounding. For this reason, percentage amounts in this Annual Report on Form 10-K may vary from those obtained by performing the same calculations using the figures in our Consolidated Financial Statements. Certain other amounts that appear in this Annual Report on Form 10-K may not sum due to rounding.
Unless otherwise indicated, all references to “dollars” and “$” in this Annual Report on Form 10-K are to, and amounts are presented in, U.S. dollars.
TRADEMARKS AND COPYRIGHTS
Bojangles’®,” “Bojangles’ Express®,” “It’s Bo Time®,” “Bo-Smart®,” “Big Bo Box®,” “Chicken Supremes™,” “Bojangles’ Cajun Pintos®,” “Bojangles’ Dirty Rice®,” “Legendary Iced Tea®,” “Tailgate Everything®,” “Cajun Filet Biscuit®,” “Bo-Tato Rounds®,” “Bo-Berry Biscuits®,” “Bo’Town Roasters™,” “Bojangles’ Seasoned Fries™,” “Roasted Chicken Bites™” and other trademarks or service marks of Bojangles’ appearing in this Annual Report on Form 10-K are the property of Bojangles’ or its subsidiaries. Solely for convenience, some of the copyrights, trade names and trademarks referred to in this Annual Report on Form 10-K are listed without their ©, ®, sm and ™ symbols, but we will assert, to the fullest extent under applicable law, our rights to our copyrights, trade names, trademarks and service marks. This Annual Report on Form 10-K contains additional trade names, trademarks, and service marks of other companies. We do not intend our use or display of other companies’ trade names, trademarks or service marks to imply a relationship with, or endorsement or sponsorship of us by, these other companies.
CAUTIONARY NOTE REGARDING FORWARD-LOOKING STATEMENTS
Statements made in this Annual Report that are not statements of historical or current facts, such as those under the heading “Management’s Discussion and Analysis of Financial Condition and Results of Operations,” are “forward-looking statements” within the meaning of the Private Securities Litigation Reform Act of 1995. Forward-looking statements discuss our current expectations and projections relating to our financial condition, results of operations, plans, objectives, future performance and business. These statements may be preceded by, followed by or include the words “aim,” “anticipate,” “believe,” “estimate,” “expect,” “forecast,” “intend,” “outlook,” “plan,” “potential,” “project,” “projection,” “seek,” “may,” “could,” “would,” “will,” “should,” “can,” “can have,” “likely,” the negatives thereof and other words and terms of similar meaning.
Forward-looking statements are inherently subject to risks, uncertainties and assumptions; they are not guarantees of performance. You should not place undue reliance on these statements. We have based these forward-looking statements on our current expectations and projections about future events. Although we believe that our assumptions made in connection with the forward-looking statements are reasonable, we cannot assure you that the assumptions and expectations will prove to be correct.
iv
Table of Contents
Index to Financial Statements
You should understand that the following important factors could affect our future results and could cause those results or other outcomes to differ materially from those expressed or implied in our forward-looking statements:
| • | our vulnerability to changes in consumer preferences and economic conditions; |
| • | our ability to open restaurants in new and existing markets and expand our franchise system; |
| • | our ability to generate comparable restaurant sales growth; |
| • | our restaurants and our franchisees’ restaurants may close due to financial or other difficulties; |
| • | new menu items, advertising campaigns, changes in discounting strategy, technology initiatives and restaurant designs and remodels may not generate increased sales or profits; |
| • | anticipated future restaurant openings may be delayed or cancelled; |
| • | increases in the cost of chicken, pork, dairy, wheat, corn and other products; |
| • | our ability to compete successfully with other quick-service and fast-casual restaurants, including new entrants to the breakfast market and those newly expanding their breakfast menus for all day availability; |
| • | our reliance on our franchisees, who may be adversely impacted by economic conditions and who may incur financial hardships, be unable to obtain credit, need to close their restaurants or declare bankruptcy; |
| • | our ability to support our franchise system; |
| • | our limited degree of control over the actions of our franchisees; |
| • | our potential responsibility for certain acts of our franchisees; |
| • | our vulnerability to conditions in the Southeastern United States; |
| • | negative publicity, whether or not valid; |
| • | concerns about food safety and quality and about food-borne illnesses, including adverse public perception due to the occurrence of avian flu, swine flu or other food-borne illnesses, such as salmonella, E. coli, or others; |
| • | our dependence upon frequent and timely deliveries of restaurant food and other supplies; |
| • | our reliance upon a limited number of suppliers for substantially all of our restaurant food and other supplies; |
| • | our reliance upon just one third-party distributor for substantially all of our restaurant food and other supplies; |
| • | the adverse impact of economic conditions on our operating results and financial condition, on our ability to comply with the terms and covenants of our debt agreements and on our ability to pay or to refinance our existing debt or to obtain additional financing; |
| • | our ability to protect our name and logo and other intellectual property; |
| • | loss of the abilities, experience and knowledge of our existing directors and officers; |
| • | matters relating to employment and labor laws; |
| • | labor shortages or increases in labor costs; |
| • | the impact of litigation, including wage and hour class action lawsuits; |
| • | our ability and the ability of our franchisees to renew leases at the end of their terms; |
| • | the impact of federal, state or local government regulations relating to the preparation and sale of food, zoning and building codes, employee wages and benefits, and environmental and other matters; |
| • | the fact that we are considered a “controlled company” and exempt from certain corporate governance rules primarily relating to board independence, and we may use some or all of these exemptions; |
| • | the fact that we are a holding company with no operations and will rely on our operating subsidiaries to provide us with funds; |
v
Table of Contents
Index to Financial Statements
| • | our expectations regarding the time during which we will be an emerging growth company under the JOBS Act; and |
| • | changes in accounting standards. |
More information on potential factors that could affect our financial results is included from time to time in the “Cautionary Note Regarding Forward-Looking Statements,” “Risk Factors” and “Management’s Discussion and Analysis of Financial Condition and Results of Operations” or similarly captioned sections of this Annual Report and our other periodic and current filings we make from time to time with the United States Securities and Exchange Commission (the “SEC”), and which are available on our website at http://www.bojangles.com. You should not place undue reliance on any of our forward-looking statements which speak only as of the date they are made. We undertake no obligation to publicly update or revise any forward-looking statements, whether as a result of new information, future events or otherwise. Furthermore, we cannot guarantee future results, events, levels of activity, performance or achievements.
vi
Table of Contents
Index to Financial Statements
PART I
Company Overview
It’s Bo Time!
Bojangles’ is a highly differentiated and growing restaurant operator and franchisor dedicated to serving customers high-quality, craveable food made from our Southern recipes. Since 1977, we believe Bojangles’ has become an iconic brand with a cult-like following due to our famous, made-from-scratch biscuits baked every 20 minutes, our fresh, never-frozen bone-in fried chicken, our unique fixin’s and our Legendary Iced Tea. We believe we offer fast-casual quality food combined with quick-service speed, convenience and value. While we serve our full menu of craveable food across all dayparts, we are especially known by customers for our breakfast offerings and generated, on average, approximately $650,000 in fiscal 2016 per company-operated restaurant before 11:00 a.m. In fiscal 2016, our 309 company-operated and 407 franchised restaurants, primarily located in the Southeastern United States, generated over $1.2 billion in system-wide sales, representing $504.7 million in company restaurant revenues and $727.2 million in franchise sales which contributed $27.2 million in franchise royalty and other franchise revenues. Over this same period, our restaurants generated a system-wide AUV of over $1.8 million, which we believe is among the highest in the quick-service restaurant (“QSR”) and fast-casual segments. Our mission is to win the hearts of our customers by delivering quality and service all day, every day, and we believe our passionate team members and culture are fundamental to our success. The excitement for our brand and enthusiasm of our customers can be best summarized by our famous tagline…“It’s Bo Time!”
Since our founding in Charlotte, North Carolina in 1977, our core menu centered on “chicken ’n biscuits” has remained largely unchanged. We believe our variety of fresh, flavorful and Southern-inspired items appeals to a broad customer demographic across our five dayparts: breakfast, lunch, snack, dinner and after dinner. Bojangles’ is known for its breakfast menu, which is served all day, every day, and includes our top selling Cajun Filet Biscuit. We also offer hand-breaded, bone-in chicken marinated for at least 12 hours, Chicken Supremes, Homestyle Chicken Tenders and sandwiches, as well as unique fixin’s including our Seasoned Fries, Bo-Tato Rounds, Cajun Pintos and Dirty Rice. Our Bo-Smart menu features items such as salads, grilled chicken sandwiches, roasted chicken bites and fat-free green beans. In addition to our individual menu items, we offer combos and family meals that appeal to large parties, as well as our Big Bo Box, which is perfect for tailgating events. Our food is complemented by our Legendary Iced Tea that is steeped the old-fashioned way, providing a rich flavor that our customers crave. Our high-quality, handcrafted food also represents a great value with an average check of only $7.08 for company-operated restaurants in fiscal 2016. We believe our distinct menu with fresh, made-from-scratch offerings combined with a compelling average check creates an attractive value proposition for our customers.
Our Industry
The U.S. restaurant industry is divided into two segments: full service and limited service. Full service is comprised of the casual dining, mid-scale and fine dining sub-segments. We operate within the limited service segment (“LSR”), which is comprised of the QSR and fast-casual sub-segments. QSRs are defined by Technomic as traditional “fast-food” restaurants with average check sizes of $3.00-$8.00. Fast-casual is defined by Technomic as a limited or self-service format with average check sizes of $8.00-$12.00 that offers food prepared to order within a generally more upscale and developed establishment. Our restaurants combine elements of both QSRs and fast-casual restaurants. Our restaurants’ convenient locations and format, drive-thru service and average check are attributes that we share with QSRs (rather than with the fast-casual segment generally), while the quality of our food, the freshness of our ingredients and our traditional cooking methods (as opposed to utilizing microwaves) are attributes that we generally share with fast-casual restaurants.
According to Technomic, 2015 sales for the total LSR category increased 5.2% from 2014 to $255 billion. We offer fast-casual quality food combined with quick-service speed, convenience and value across multiple
1
Table of Contents
Index to Financial Statements
dayparts. According to Technomic, sales for the total QSR segment grew 4.1% from 2014 to $212 billion in 2015, and are projected to grow to $254 billion by 2019, representing a compounded annual growth rate (“CAGR”) of 4.6%. Total sales in the fast-casual segment grew 11.3% from 2014 to $43 billion in 2015, and are projected to grow to $64 billion by 2019, representing a CAGR of 10.2%. We believe our differentiated, high-quality menu, including our extensive breakfast offerings that deliver great value all day, every day, positions us to compete successfully against both QSR and fast-casual concepts, providing us with a large addressable market.
We believe that we are well-positioned to benefit from a number of culinary and demographic trends in the United States:
Growing Breakfast Daypart: According to NPD CREST®, total morning meal dollars grew from $57 billion for the year ended September 2010 to $75 billion for the year ended September 2016, representing a CAGR of 4.6%. In addition, sales for the QSR morning meal daypart grew from $39 billion for the year ended September 2010 to $56 billion for the year ended September 2016, representing a CAGR of 6.1%. Several factors are driving growth in the breakfast daypart, including more extensive menu offerings and consumers’ desire for value, portability and convenience. Consumers’ breakfast eating habits tend to be more habitual than other meals because breakfast is part of many consumers’ morning routines.
Increasing Chicken Category: In 2015, the chicken menu category for LSRs grew 8.2% from 2014, outpacing the broader LSR category, according to Technomic.
Population Growth in Our Markets: Since 2000, population growth in our key markets has exceeded the U.S. national average. According to the U.S. Census Bureau, growth in the Georgia, North Carolina, South Carolina, Virginia and Tennessee populations from 2000 to 2016 was on average 22.1%, as compared to 14.5% population growth in the U.S. over that same period.
The “Bo Difference”
We believe the following strengths differentiate us and serve as the foundation for our continued growth:
Iconic Brand with Loyal, Cult-Like Following. Since opening our first restaurant in North Carolina in 1977, we believe we have become an iconic brand with a cult-like following by consistently delivering differentiated, craveable food. We believe our “Bo Fanatics,” which is our term for our most loyal customers, visit us multiple times per week and promote our brand through word of mouth and engagement on social media. We support our brand through high profile sponsorships of sporting events and venues, such as the Bojangles’ Southern 500, as well as endorsements from celebrities who are fans of Bojangles’. We believe our iconic brand and cult-like following have driven our 27 consecutive quarters of system-wide comparable restaurant sales growth and support our ability to grow our restaurant base in existing and new markets.
High-Quality, Craveable Food. We are committed to maintaining the integrity of our traditional, Southern food. We believe our customers crave the unique flavor of our food and the variety of our menu, which includes our signature breakfast biscuits, bone-in fried chicken, Chicken Supremes, Homestyle Chicken Tenders, sandwiches, unique fixin’s, and our Bo-Smart menu. We use high-quality ingredients prepared the old-fashioned way and do not have microwaves in our restaurants. As an example of our commitment to quality, all of our specially trained biscuit makers follow 48 steps in preparing our made-from-scratch, buttermilk biscuits, which are baked fresh every 20 minutes. We prepare eggs, sausage and cured country ham on the griddle for our breakfast menu served all day. For our unique fixin’s, we prepare our famous Dirty Rice and Cajun Pintos on the stove-top, and our Seasoned Fries are made with our special blend of seasonings. Finally, we steep our Legendary Iced Tea to ensure a rich brewed flavor that our customers crave. This commitment to offering high-quality food with unique flavor that we believe customers cannot find at other restaurants has earned us deep customer loyalty and a high frequency of visits.
2
Table of Contents
Index to Financial Statements
Diversified Daypart Mix. We have a diversified daypart mix that supports AUVs that are among the highest in the QSR and fast-casual segments:
Our Famous Breakfast: While many of our competitors do not offer breakfast, in fiscal 2016, we generated 37% of our company restaurant revenues before 11:00 a.m., or an average of approximately $650,000 annually per company-operated restaurant. Our strong breakfast results make us a leader in an attractive daypart in the industry. Furthermore, we believe breakfast has broad customer appeal and is the most habitual daypart, which drives repeat business and customer loyalty.
Our Craveable Menu for Lunch, Snack, Dinner and After Dinner: In fiscal 2016, we generated 63% of our company restaurant revenues from 11:00 a.m. to closing, which is typically 10:00 p.m. We believe Bojangles’ menu, focused on high-quality, craveable items, is distinct in the LSR industry and provides an attractive value proposition for lunch, snack, dinner and after dinner. Our Big Bo Box, family and tailgate meals cater to group occasions and drive sales during these dayparts. Additionally, our customers can order our famous breakfast items all day, which we believe differentiates us from our peers and delivers great value at all hours.
Unique Value Proposition: Fast-Casual Quality Food with QSR Speed, Convenience and Value. Everything we do is driven by our intense focus on delivering a compelling value proposition to our customers. We believe that our concept combines elements of both fast-casual restaurants (quality and food preparation) and QSR (speed, convenience and value). Our value proposition is a key element of our long track record of delivering strong comparable restaurant sales and successful market expansion:
High-Quality Ingredients: We cook our food using high-quality ingredients. For example, our menu features our famous biscuits, which are made from fresh buttermilk, and our bone-in fried chicken, which is fresh and never-frozen. Our menu also includes items such as our Country Ham Biscuit made from traditionally dry-cured country ham and our Sausage Biscuit made from high-quality sausage with a blend of seasonings prepared especially for Bojangles’. Our Legendary Iced Tea is steeped the old-fashioned way and is never made from concentrates or poured from bottles or cans.
Traditional Food Preparation: We prepare our food the old-fashioned way, and never in a microwave. Our restaurant kitchens are specifically designed for our employees to prepare our food in a traditional manner; for example, our bone-in chicken is hand-breaded and is marinated for at least 12 hours. Many of our menu items are made-from-scratch and are cooked in the oven, on the griddle or on the stove-top.
Compelling Speed and Convenience: We locate our restaurants in places that are easily accessible and convenient to customers’ homes, places of work and daily commutes. We also strive to deliver our food quickly to our customers, whether in our restaurants or through our drive-thru. We believe our customers appreciate our speed and convenience, as evidenced by approximately 80% of our company restaurant revenues in fiscal 2016 generated via drive-thru and carry-out.
Attractive Price Point: Our average check was $7.08 for company-operated restaurants in fiscal 2016. We believe this average check is lower than any fast-casual and most QSR restaurant concepts.
Compelling Hybrid System that Provides Capital Efficient Growth. Our hybrid system captures the earnings power of a company-operated model with strong economics and the capital efficiency of a franchised model. As of December 25, 2016, 43% of our restaurant base was company-operated and 57% was franchised.
Company-Operated: As of December 25, 2016 we had 309 company-operated restaurants, which has grown from 196 as of the end of fiscal 2011, representing a CAGR of 9.5%. In fiscal 2016, our company-operated restaurants generated $504.7 million in revenues, which increased from $281.9 million in fiscal 2011. This sales growth contributed to our restaurant contribution increase from $44.3 million in fiscal 2011 to $94.9 million in fiscal 2016, representing a CAGR of 16.4%. With approximately 43% of the restaurant base operated by the company, we are aligned with our
3
Table of Contents
Index to Financial Statements
franchisees and take a leadership role in executing brand and operational initiatives. Our company-operated restaurants have achieved strong performance, thereby illustrating to franchisees the potential of our brand and generating significant credibility within our franchise base.
Franchised: As of December 25, 2016, our franchisees operated 407 restaurants, which has grown from 312 as of fiscal 2011, representing a CAGR of 5.5%. Royalties and franchise fees totaled $27.2 million in fiscal 2016, which increased from $18.0 million in fiscal 2011. We believe royalties and fees generated from our franchise base provide us with significant, predictable cash flow to invest in executing our strategies. Our approximately 90 franchise entities are important partners in our system-wide growth as they allow us to expand the Bojangles’ brand in new and existing markets in a capital efficient manner.
Highly Productive Restaurant Base with Strong Unit Economics. We believe our differentiated customer value proposition generates strong restaurant-level financials and attractive returns on investment. For fiscal 2016, our system-wide AUV was over $1.8 million, which we believe is among the highest in the QSR and fast-casual segments. Our new company-operated restaurant model targets strong cash flows and compelling cash-on-cash returns. Unlike some other restaurant concepts, we primarily utilize build-to-suit developments and equipment financing leases for our new company-operated restaurants, which requires minimal upfront investment for construction and equipment costs. Our new company-operated restaurant model is based on a year one target AUV of $1.5 million, as well as restaurant-level cash flow of approximately $110,000 and average upfront cash equipment investment of approximately $85,000 for locations under build-to-suit and equipment financing leases. Given our build-to-suit and equipment financing lease strategy that minimizes our upfront cash investment, our new company-operated restaurant model delivers, on average, a less than one-year payback on cash investment for these locations, which we are able to assess once the restaurant has been open for a full twelve months. On average, we have exceeded this one-year payback on cash investment target for our new company-operated restaurants utilizing a build-to-suit and equipment financing lease strategy that were opened during fiscal years 2011-2015. We believe that our strong productivity, attractive restaurant-level financials and low cash investment provide a platform for continued profitable company growth and compelling returns on our new restaurants. See “—Construction” for more information.
Strong Management Team Driving Culture Based on People. We have a highly experienced management team with approximately 381 years of cumulative experience in the restaurant industry, as of the date hereof. Our leadership team is committed to instilling our strong culture, which is based on trust, servant leadership and total commitment in all that we do. Our values of hard work, teamwork, harmony, listening and respect underlie everything that we do, both in our interactions with each other and with customers. We view our restaurant-level employees as the true heroes of our business, working daily to deliver our high-quality food with a strong sense of pride in our brand. We believe our strong management team and commitment to a culture based on people and integrity are key drivers of our success as a differentiated restaurant concept and position us well for long-term growth.
Spreading the “Bo-Buzz”
We plan to pursue the following strategies to continue to grow our revenues and profits:
Continue to Open New Company-Operated and Franchised Restaurants. We believe we are in the early stages of our growth story. We have expanded our system-wide restaurant count from 508 restaurants as of the end of fiscal 2011 to 716 restaurants as of the end of fiscal 2016, representing a CAGR of 7.1%. In fiscal 2016, we opened 29 company-operated restaurants and 29 franchised restaurants, contributing to annual system-wide unit growth of 8.2%. Over the long term, we plan to continue growing the number of Bojangles’ system-wide restaurants by approximately 7% to 8% annually, while maintaining a similar proportion of company-operated and franchised units. Given the strength of our brand, existing restaurant base and new unit economics, we believe we can continue opening restaurants in our core North Carolina and South Carolina markets. Additionally, given the performance of our approximately 275 company-
4
Table of Contents
Index to Financial Statements
operated and franchised restaurants in adjacent markets as of December 25, 2016, we believe there is a significant opportunity to continue to grow in our existing footprint. Based on our experience and research conducted for us by Buxton, we believe the total restaurant potential in our current footprint of eleven states is more than 1,400 locations, and across the United States we believe the total restaurant potential is more than 3,500 locations.
Drive Comparable Restaurant Sales. We have generated 27 consecutive quarters of system-wide comparable restaurant sales growth through the fourth fiscal quarter ended December 25, 2016. We plan to continue delivering comparable restaurant sales growth through the following strategies:
Attract New Customers Through Expanded Brand Awareness: We expect to attract new customers as Bojangles’ becomes more widely known due to new restaurant openings and marketing efforts focused on broadening the reach and appeal of our brand. We expect consumers will become more familiar with Bojangles’ as we continue to penetrate our markets, which we believe will benefit our existing restaurant base. Our marketing strategy centers on our “It’s Bo Time” campaign, which highlights the craveability and made-from-scratch quality of our food. We also utilize social media community engagement and public relations to increase the reach of our brand. Additionally, our system will benefit from increased contributions to our marketing and various co-op advertising funds as we continue to grow our restaurant base.
Increase Existing Customer Frequency: We are striving to increase customer frequency by providing “Bo-Size Service,” a service experience and environment that “compliments” the quality of our food and models our culture. We expect to accomplish this by enhancing customer engagement, while also improving throughput, order execution and quality. Additionally, in early fiscal 2014 we began implementing a customer experience measurement system, which provides us with real-time feedback and customers’ insights to enhance our service experience. Recently, we also announced that we will be strategically adding labor initiatives, such as table service and more full-time versus part-time team members, where we believe it will significantly enhance the customer service experience over time. We believe that always striving for excellent customer service will create an experience and environment that will support increased existing customer visits.
Continue to Grow Dayparts: We believe we have an opportunity to complement our strong breakfast daypart with our lunch, snack, dinner and after dinner dayparts. We expect to drive growth across these dayparts through optimized labor and management allocation, enhanced menu offerings, innovative merchandising and marketing campaigns, such as our Big Bo Box packaging and Tailgate Everything campaign, which have successfully driven growth in our post-breakfast dayparts over time. We plan to continue introducing and marketing limited time offers to increase occasions across our dayparts as well as to educate customers on our lunch and dinner offerings.
Leverage Technology. We are investing in new technology, such as our new point-of-sale system, XPIENT, which will allow us to enhance efficiency and throughput in our restaurants. Currently, XPIENT has been installed in all of our company-operated restaurants. Additionally, we are working on several other key initiatives, including mobile payment, online ordering and a customer loyalty program, which we believe will improve our customer experience, capture large group ordering and increase transactions.
Continue to Enhance Profitability. We focus on expanding our profitability over the long term while also investing in personnel, technology and infrastructure to support our future growth. We will seek to further enhance our long-term margins by maintaining fiscal discipline and leveraging fixed costs. We constantly focus on restaurant-level operations, including cost controls, while ensuring that we do not sacrifice the quality and service for which we are known. Additionally, as our restaurant base grows, we believe we will be able to leverage support costs over the long term as general and administrative expenses grow at a slower rate than our revenues.
5
Table of Contents
Index to Financial Statements
Our Food
Our Menu
Our core menu is centered on “chicken ’n biscuits” and has remained largely unchanged since 1977. We believe we offer craveable, Southern-inspired food with unique flavor that customers cannot find at other restaurants. We prepare our food using high-quality ingredients with many of our items made-from-scratch, and we do not permit microwave ovens in any of our restaurants, ever. Our menu includes our famous, made-from-scratch, buttermilk biscuits baked fresh every 20 minutes; our fresh, never-frozen bone-in fried chicken; our unique fixin’s; our Bo-Smart menu featuring items such as salads, grilled chicken sandwiches, roasted chicken bites and fat-free green beans; our freshly baked and delicious sweets menu; and our Legendary Iced Tea. Our goal is that every menu item at Bojangles’ has a unique or special flavor that differentiates our restaurants and our brand.
Our food is offered a la carte and in combos which may be favorably priced compared to individual orders. A Bojangles’ customer may order a single piece of chicken or one of our chicken dinners with a choice of our unique fixin’s, and always accompanied by a made-from-scratch, fresh buttermilk biscuit. Our chicken, fixin’s, biscuits and Legendary Iced Tea may also be ordered in boxes or family meals, and larger combinations may be offered as tailgate specials or may be packaged in our iconic Big Bo Box. The addition of boxes, family meals and tailgate specials to our menu has helped increase our dinner and carry-out business, resulting in a higher average check and comparable restaurant sales growth.
Breakfast
We are especially known for our breakfast offering, which is served all day, every day. Each morning, our specially trained and certified biscuit makers begin preparing our made-from-scratch biscuits, which are made using fresh buttermilk and flour. Biscuit sandwiches are typically made-to-order with combinations of chicken, ham, sausage, cheese, eggs, gravy and other fillings. Our Cajun Filet Biscuit is our most popular biscuit sandwich, featuring our marinated chicken filet with special Cajun-inspired seasonings. For our ham biscuits, we use dry-cured country ham that is rubbed with salt, sugar and other ingredients and then cured for 90 days and our steak biscuits are made with breaded chopped steak. We also offer limited-time-only biscuit sandwiches utilizing the same made-from-scratch biscuit platform, including our grilled pork chop biscuit. To complement our biscuits, many customers choose our Bo-Tato Rounds, which are mini seasoned hash browns fried to a golden brown, and our Bo’Town Roasters coffee.
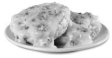
Below are just a few of our breakfast biscuits served all day, every day:
| Cajun Filet | Country Ham | Sausage | Steak | Gravy | ||||
|
|
|

|
| ||||
Lunch, Snack, Dinner and After Dinner
Our menu centers on our fresh, never-frozen, bone-in chicken and a variety of unique fixin’s. Our bone-in chicken is marinated for at least 12 hours, and then hand-dipped and breaded before cooking. In addition to our bone-in chicken, we offer our Chicken Supremes and our Homestyle Chicken Tenders, which have a milder flavor profile, both of which are made with boneless whole breast chicken select tenderloin.
6
Table of Contents
Index to Financial Statements
To accompany our chicken, we offer our famous fixin’s including our Dirty Rice and Cajun Pintos which are cooked on the stove-top. For our Dirty Rice, we use sausage made to our specification using our exclusive blend of seasonings, and our Cajun Pintos are prepared using our exclusive ranchero style seasonings. Our Seasoned Fries are skin-on, entrée fries which are sprinkled with our special seasoning blend. In addition, we offer Southern style mac ‘n cheese made from two cheeses; fat-free green beans; cole slaw; and mashed potatoes with gravy.
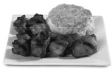
| 2-Piece Dinner | Fixin’s | Chicken Supremes | 20-Piece Tailgate | |||

|

|

|

| |||
Our menu also features salads, sandwiches and our whole meat Roasted Chicken Bites. For our sandwiches, our customers can order grilled chicken or a Cajun Filet on a toasted bun. Our sandwiches are served with crisp lettuce and fresh tomato, with the option of adding hickory smoked bacon and sharp American cheese. We offer three salads, made fresh daily and featuring a mix of crisp romaine and iceberg lettuce, red cabbage, grated carrots, sliced cucumber, grape tomatoes and Monterey jack and cheddar cheese. Our customers can also add our seasoned, grilled chicken breast filet and boneless whole breast tenderloin filets to our salads for a delicious and satisfying meal.
| Grilled Chicken Sandwich |
Chicken Supremes Salad |
Grilled Chicken Salad |
Roasted Chicken Bites | |||

|

|

|
| |||
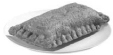
In addition, we serve a selection of sweets including our customers’ favorite Bo-Berry Biscuit, which is a made-from-scratch sweet biscuit, freshly baked and topped with delicious icing. We also offer our cinnamon biscuit and our signature sweet potato pie.
| Bo-Berry Biscuit | Cinnamon Biscuit | Sweet Potato Pie | ||

|

|
| ||
Overall, we believe our differentiated menu of high-quality, hand-crafted food represents a great value with an average check of only $7.08 for company-operated restaurants in fiscal 2016.
Restaurant Design
Our typical full-size restaurant is a modern, free-standing building which is approximately 3,900 square feet in size and can seat approximately 70 customers. Our restaurant locations are typically free-standing urban or suburban locations, and are located on approximately one acre of land and include a drive-thru window and approximately 45 parking spaces. Our restaurants are characterized by a unique exterior and interior design, color schemes, and layout, including specially designed decor and furnishings. The exterior of our current restaurant design is characterized by orange mansard roofs, tall brick towers and stucco arches. Restaurant interiors incorporate modern designs and rich colors in an effort to provide a clean and inviting environment and fun, family-friendly atmosphere.
7
Table of Contents
Index to Financial Statements
Recently, we unveiled our new restaurant design, which we believe will enhance our brand and unit growth opportunity. We opened our first “Bojangles’ of the Future” location in Greenville, South Carolina during the first fiscal quarter of 2017. Also during the first fiscal quarter of 2017, we began construction on our second “Bojangles’ of the Future” location, which will be in Charlotte, North Carolina. In addition, we have approved other locations on which we expect to utilize our “Bojangles’ of the Future” design during fiscal 2017. During fiscal 2016, we completed the initial phase of our “Bojangles’ of the Future” project, which included a complete review of the interior and exterior design of our restaurants, as well as what elements could potentially be incorporated into future restaurant remodels. Our new restaurant design features a distinctive, contemporary exterior that combines sophisticated materials like brick and tile, as well as steel canopies. Soft lighting and landscaped planters alongside the building and in the drive-thru lane are designed to provide the restaurant with a warm, welcoming feel. The new restaurant interior will center on the star of the Bojangles’ menu—our made-from-scratch biscuits. Upon entering the restaurant and proceeding to the counter, guests will be able to view our new “Biscuit Theater” where they can watch biscuits being made fresh every 20 minutes by a Bojangles’ Master Biscuit Maker. The dining room will also get a refresh with wireless internet, multi-device electrical charging stations, unique high-top community tables and a variety of seating options to accommodate different sized groups. Although we have not yet determined if the “Bojangles’ of the Future” will become our system-wide new unit standard, certain of these design features are being incorporated into current construction projects. We believe our “Kitchen of the Future” redesign, which is now a new unit standard for our company-operated full-size restaurants, will support greater efficiency, better throughput and increased transactions.
In addition to the new construction “Bojangles’ of the Future” restaurants, we have also selected three company-operated restaurants in Charlotte, North Carolina to be remodeled with many of the design elements in the “Bojangles’ of the Future” prototype.
In addition to our standard restaurants, we have 38 Bojangles’ Express locations as of December 25, 2016, which are restaurants located in or attached to another business or other structures such as shopping malls, food courts, travel plazas, grocery stores, college campuses, airports, military bases or convention centers or sports arenas, that may be as small as 800 square feet and as large as 3,800 square feet. Bojangles’ Express locations may be part of a larger structure or complex, and also includes “drive-thru only” restaurants.
Site Selection and Expansion
New Restaurant Development
We believe our restaurant model is designed to generate compelling cash flow, restaurant-level financial results and returns on invested capital, which we believe provide us with an attractive foundation for expansion. In fiscal 2013, we opened 18 company-operated and 28 franchised restaurants, in fiscal 2014, we opened 24 company-operated and 28 franchised restaurants, in fiscal 2015, we opened 29 company-operated and 34 franchised restaurants and in fiscal 2016, we opened 29 company-operated and 29 franchised restaurants, contributing to annual system-wide unit growth of 7.8% in fiscal 2014, 6.4% in fiscal 2015 and 8.2% in fiscal 2016. Over the long term, we plan to grow the number of Bojangles’ system-wide restaurants by approximately 7% to 8% annually.
Strategic Growth Plan
Our strategic plan targets opening both company-operated and franchised restaurant units, increasing comparable restaurant sales and growing AUVs. This integrated strategy seeks to expand our market share by further penetrating existing markets and growing into primarily contiguous new markets, leveraging our brand awareness. Our expansion into new markets typically follows a pattern over the long term of increasing AUVs as more consumers “discover” Bojangles’ and become loyal to our brand and food. Increasing restaurant penetration and leveraging our broader marketing programs drive the “conversion” of customers in new markets. As we penetrate existing markets and enhance our market share, more marketing dollars are available and we are able to
8
Table of Contents
Index to Financial Statements
increase our marketing spending through the use of various media types, benefiting both new and existing restaurants. When a marketing region reaches a specified level of penetration, the region is elevated to a new marketing threshold which allows for higher impact advertising and drives traffic across the region. We experience significantly higher AUVs in Designated Market Areas (“DMAs”) where our restaurant density is high enough to support elevated marketing spending. Our growth strategy is to continue opening restaurants in DMAs where we have higher unit penetration. In addition, we plan to open restaurants in DMAs where we have lower unit penetration so that we can achieve the unit density required to benefit from pooled marketing dollars and increased customer awareness.
Site Selection Process
We consider the location of a restaurant to be a critical variable in its long-term success and as such, we devote significant effort to the investigation and evaluation of potential restaurant locations. Our in-house development team has significant real estate experience in the restaurant industry. We adhere to a disciplined restaurant site selection plan, which contains criteria based on a variety of factors, including population, demographics, access to “breakfast traffic,” and unit visibility. This detailed site selection plan allows us to target new restaurant locations primarily on the “going-to-work” side of the street to support breakfast sales, and near traffic light intersections on streets travelled by approximately 20,000 cars or more per day. In addition, we use a third-party data analytics tool to assist in the site selection, and acquire information from data services to support our analysis. New company-operated and franchised restaurants are reviewed and approved by our real estate committee, which includes our senior leadership team.
Construction
On average, it takes approximately one year from identification of a specific site to the opening of a new restaurant, which includes approximately five to six months of due diligence review of the site and three to four months of construction time. Our new restaurants are typically ground-up prototypes but may include conversions. We estimate the land, building and equipment of a new company-operated restaurant requires an average investment of approximately $2.4 million, including approximately $0.7 million for land, approximately $1.4 million for the building construction, which includes the building and site and soft costs, and approximately $0.3 million for equipment. We primarily utilize build-to-suit developments and equipment financing leases for our new company-operated restaurants, requiring minimal upfront cash investment. Each new restaurant under a build-to-suit development and equipment financing lease typically requires an upfront cash equipment investment of approximately $85,000, and we target a year one cash-on-cash return of approximately 129% for our new restaurants utilizing build-to-suit development and an equipment financing lease. While we primarily utilize a build-to-suit development strategy, our new restaurant strategy may change over time. We expect our average investment for new company-operated restaurants to increase related to our “Bojangles’ of the Future” project. In addition, if our “Bojangles’ of the Future” project is successful, we may undertake more remodels than in previous years, which we expect will increase our total and average investment for remodels as we incorporate the new design elements.
Restaurant Management and Operations
Service Philosophy
We are extremely focused on customer service. In fiscal 2014, we introduced Bo-Size Service, which aims to deliver a Star Service experience and environment that “compliments” the quality of our food and models our culture. Our Star Service culture includes key points of difference—“speak to me,” “act like you care,” “hurry,” “get it right” and “bring me back”—which are defined as the simple, but specific, opportunities for us to elevate the level of our service and customer satisfaction. We believe the key points of difference provide us a competitive advantage and a unique opportunity to exceed our customers’ expectations. Understanding these points of difference, developing a culture of genuine customer-service values, and implementing them properly is an essential element of new team member training.
9
Table of Contents
Index to Financial Statements
We utilize tools such as our Bo-Sat Monitor guest survey program, which is powered by the Service Management Group, to capture and measure customer feedback. During fiscal 2016, we completed the rollout of our Bo-Sat Monitor program to our franchise community, which allowed the entire Bojangles’ system to operate under the same program. We believe this industry standard yields valuable data that is informing decisions across the organization, and transforming the way some things are done. As a result of knowledge gained with this effort, we believe we can now dig much deeper into customer service opportunities and potentially elevate the Bojangles’ experience even higher for all our customers.
Recently, we also announced that we will be strategically adding labor initiatives, such as table service and more full-time versus part-time team members, where we believe it will significantly enhance the customer service experience over time.
Quality, Food Safety and Handling Procedures
We and our franchisees are focused on maintaining high food quality and food safety in each restaurant through the careful training and supervision of personnel and by following rigorous quality and cleanliness standards that have been established. Standards for food preparation and cleaning procedures are defined, monitored and maintained by our Operations and Training Departments. In company-operated restaurants, we utilize third-party inspectors to regularly monitor restaurant performance through food safety audits. In addition, we expect to expand this program to our franchised restaurants beginning in fiscal 2017. As part of our food quality assurance program, we have processes in place to monitor, as well as inspect and evaluate production runs of our products to ensure they meet specifications mutually agreed upon with our suppliers.
Managers and Team Members
Each restaurant operates with five distinct dayparts (breakfast, lunch, snack, dinner and after dinner) and a staff of approximately 30 to 35 team members led by the unit director, assistant unit directors, and shift managers. Quality is constantly monitored by area directors at company-operated restaurants and by franchise business consultants (“FBCs”) at franchised restaurants.
Before, during and after our restaurants are serving customers, our team members focus intensely on daily operational execution. Our hard working and dedicated team members typically begin food preparation an hour before the restaurant opens and continue through closing. Bojangles’ has a strict pre-closing policy that keeps each member of the team focused on customer service. Each team member has responsibility for cleaning throughout the day and the entire unit is thoroughly cleaned each night. The restaurant level management team utilizes proven operational systems such as The Manager’s Walk to effectively manage each shift.
We are diligent in our team member selection processes, only hiring approximately 10% of those who began the application process in fiscal 2016. We aim to staff our restaurants with team members that are friendly, customer-focused, driven to provide high-quality food, and who are also a good fit for our culture. As of December 25, 2016, our team member base was comprised of approximately 9,850 restaurant employees and approximately 250 support center personnel.
The heart of our business is our people and we encourage them to possess a strong sense of pride in their jobs and to excel by participating in competitions that test and reward high performing restaurants and team members. Our ShowBo competition focuses on rewarding and recognizing the best team and involves unannounced visits to evaluate each restaurant on service, quality and cleanliness.
Our Master Biscuit Makers
Our reputation is built on our signature “chicken ’n biscuits.” Our biscuit makers are at the heart of our business, baking made-from-scratch biscuits all day, every day in our restaurants system-wide. Our biscuit makers strictly
10
Table of Contents
Index to Financial Statements
follow our 48-step biscuit recipe, which includes using fresh buttermilk, hand rolling and cutting the dough and baking biscuits fresh in the oven every 20 minutes to ensure a consistent offering for every customer. We maintain high standards for our biscuit makers and require them to be re-certified every year to make sure we are providing the best possible biscuits for our customers.
To highlight our strong sense of pride in our biscuit makers and how vital they are to our business, we encourage them to excel in annual competitions that test and reward high performers. Our annual “Master Biscuit Maker Challenge” brings together team members from across our entire system of restaurants to compete for the honor of being named one of our Champion Master Biscuit Makers. Each participant is judged on their ability to adhere to our 48-step biscuit recipe, taking into account the size, shape and color of the biscuits and time it takes to complete the process without sacrificing quality. The finalists for the competition have earned the highest scores out of hundreds of biscuit makers at the individual restaurant, area and regional levels and are invited to the final round at our headquarters in Charlotte, North Carolina. The competition serves as a reminder to all team members who the real heroes of our company are and illustrates the pride our team members have in delivering our “biscuit magic.”
Training
We ensure that new unit directors in company-operated restaurants possess the experience and passion necessary to deliver strong performance, and we support them with five to seven weeks of training in the Bojangles’ training program, including one week at our training center located in Charlotte, North Carolina and known as Bojangles’ University. Many of our new restaurants draw experienced team members from nearby locations, in addition to utilizing an “all-star” team provided by the company to support the workforce from the opening day through the early weeks of operation. Leveraging our base of existing team members ensures that new restaurants operate seamlessly from day one and cultivates Bojangles’ workplace culture, key drivers of our continued success and that of our franchisees’.
We allow our and our franchisees’ principal operating officer or partner, managers and other restaurant team members to attend optional training programs and seminars that we offer from time to time. We currently provide training in our certified company-operated restaurants and Bojangles’ University. The initial training program is approximately five to seven weeks in duration consisting of classroom instruction and on-the-job training, and is conducted approximately 10 times per year. We bear the cost of maintaining Bojangles’ University, including the overhead costs of training, staff salaries, materials and training tools. We require each trainee to complete the training program to our satisfaction in order to be certified as a Bojangles’ company-operated restaurant manager.
Franchise Program
Overview
We use a franchising strategy to increase new restaurant growth, leveraging the ownership of entrepreneurs with specific local market expertise and requiring a relatively minimal capital commitment by us. As of December 25, 2016, we had approximately 90 franchise entities that operated 407 restaurants. Our franchisees range in size from single-restaurant operators to the largest franchisee, which operated 64 restaurants as of December 25, 2016. Our existing franchise base consists of many successful, longstanding restaurant operators, 52 of which operate multiple restaurants. As of December 25, 2016, our franchisees operated restaurants in 36 DMAs. Of our franchised restaurants, 371 were owned and operated by franchisees that have been with us for more than five years, some of which have developed franchised restaurants as part of multi-unit, multi-year development agreements. In addition, many of our existing franchisees continue to develop restaurants without development agreements. We also support our growth by attracting highly qualified and experienced new franchisees. We will continue to recruit new franchisees who we believe are capable of successful multi-unit development. We believe the revenues generated from our franchise base, including royalty revenues, have historically served as an important source of stable and recurring cash flows to us and, as such, we plan to expand our base of franchised restaurants.
11
Table of Contents
Index to Financial Statements
Description of Franchise and Development Agreements
Our typical agreements for a full-size traditional unit grant a franchisee the right to operate for an initial term of 20 years with additional renewal terms that total 20 years subject to various conditions that include upgrades to the restaurant facility and brand image. Our typical express franchise agreements grant the right to operate for a period of 10 years without renewal so that we can assess at the time of expiration if the market is better served by a full-size replacement. All franchise agreements grant licenses to use the Bojangles’ trademarks, trade secrets and proprietary methods, recipes and procedures. Our obligations under the franchise agreement include an initial training program, ongoing advice and consultation in connection with operations and management of the restaurants, the development of advertising materials, as well as advice and assistance in local marketing and inspections of a franchisee’s restaurants.
The initial franchise fee for each full-size traditional unit is $25,000, and $15,000 for each express unit. Franchisees are required to pay as royalties 4% of franchise unit sales, except for certain grandfathered units that may pay a lesser percentage and international locations that pay 5%. Franchisees, except for certain grandfathered units that may pay a lesser amount and international locations that are not required to contribute, are also required to pay 1% of franchise unit sales to the Bojangles’ marketing development fund, to which we also contribute, which creates a pooled fund for the creation of marketing and advertising materials, marketing and media research, marketing promotions and a portion of our marketing employees’ salaries and expenses. Franchisees are required to sign an advertising co-operative agreement, or the co-op agreement, in connection with their franchise agreements that provides for pooled advertising funds when franchisees share a market with other franchisees or us. Typically, the co-op agreement requires that when an advertising co-operative is activated, franchisees and the company units within the co-operative market must contribute up to 2% of unit sales to the co-operative. Finally, the franchise agreements require that franchisees spend from one to three percent of franchise unit sales on local marketing, depending upon whether an advertising co-operative has been activated in a franchisee’s market.
We often enter into development agreements with new and existing franchisees that provide for planned assigned areas of unit development on a multi-unit, multi-year basis by a franchisee. A development agreement typically provides for the opening of one restaurant per year over a five-year term, but we may grant rights to develop larger numbers of units more quickly, or may shorten the time allowed for development. Moreover, many franchisees develop on a case-by-case submittal basis rather than by formal development agreements. The development fee paid by a franchisee under a development agreement is $5,000 per each assigned unit, and this unit fee is deductible against the franchise fee for each unit developed under the terms of the development agreement. Typically, more than one franchisee and, at times, we may develop in a market to increase the rate of penetration in that market in order to increase consumer awareness and, as a result, the availability of pooled advertising funds in that market.
Franchise Owner Support
We value our franchisee relationships and provide strong support for their operations and growth initiatives to produce sustainable, long-term success. Our restaurant development team provides consultation regarding site selection and approval processes and our franchise operating team provides consultation in all aspects of operations and preopening preparation. We also have all-star teams to provide assistance for the first two units a franchisee opens. Additionally, we conduct a mandatory management training program, requiring that for at least the first restaurant, a minimum of five of each franchisee’s operating managers successfully complete a five to seven-week training program prior to opening. The program consists of hands-on training in the operation and management of the restaurant and is conducted by a training manager who has been certified by us. Instructional materials for the initial training include our operations manual, wall charts, job aids, product build charts, ServSafe (food safety) book, videos and other materials we may create from time to time. For the second and subsequent restaurants, franchisees have the option of training their own managers or using our training program without payment of additional fees.
12
Table of Contents
Index to Financial Statements
We also offer support well beyond restaurant opening. We provide ongoing leadership and assistance to the franchisee network through our FBCs who maintain an open dialogue with franchisees on brand initiatives through webinars and quarterly market meetings, and help franchisees to evaluate sales growth and cost initiatives. By continuing to support our franchise network and monitoring local performance, our FBCs help protect our brand. Additionally, we communicate with franchisees on at least a monthly basis, and senior company representatives meet quarterly with our franchise advisory council to discuss system-wide initiatives, share ideas and resolve issues. In addition, we provide local marketing consultation and support, and prepare marketing materials for use by all franchisees in various media including television and radio through the Bojangles’ marketing development fund.
Marketing and Advertising
We use multiple marketing channels, including television, radio, print advertising, billboard advertising, internet and social media and loyalty programs to broadly drive brand awareness and traffic to our restaurants. We advertise on local network and cable television in our primary markets, and utilize heavier cable schedules for some of our less developed markets. During fiscal 2016, we and our franchisees were active in television advertising, including cable placement, in approximately 26 DMAs of the 36 DMAs in which our system has restaurants, and we expect to add television advertising in additional DMAs in the future. During fiscal 2016, we and our franchisees utilized radio advertising in approximately 20 radio metro areas. We also sponsor arenas, race tracks, broadcast and sporting events including the Bojangles’ Coliseum in Charlotte, North Carolina, the Carolina Panthers National Football League team, the Charlotte Hornets National Basketball Association team, the Fox Sports South-Atlanta Braves Television Network, the Atlantic Coast Conference basketball and football and other events and venues. In addition, we are active in various charity and goodwill events and activities, including in-restaurant fundraising, auctions and events for the Muscular Dystrophy Association, Toys for Tots and St. Jude’s Children’s Hospital. We engage in one on one conversations with our consumers using social media platforms such as Facebook, YouTube, Instagram and Twitter. We also use social media as a research and customer service tool, and apply insight we gain to future marketing efforts.
We promote our restaurants and food through our “It’s Bo Time” advertising campaign, which has become synonymous with our brand. The campaign aims to deliver our message that our products are craveable and that Bojangles’ is a warm and friendly place to be. All domestic franchisees and the company contribute to the marketing development fund for the development of marketing materials for use in various media, including radio and television commercials, promotions and sponsorships, marketing research as well as the cost of administration of the marketing development fund. The company administers and may require franchisees’ participation in advertising co-operatives with other franchisees and the company to increase advertising levels based in pooled media advertising.
Purchasing and Distribution
Maintaining a high degree of quality in our restaurants depends in part on our ability to acquire fresh ingredients and other necessary supplies that meet our specifications from reliable suppliers. We regularly inspect vendors to ensure that products purchased conform to our standards and that prices offered are competitive. Our Quality Assurance Department works with our suppliers to obtain third-party audits. We negotiate terms, conditions and pricing directly with all suppliers of food and packaging. We contract with our foodservice distributor for the distribution of all of our food and most of our supplies delivered to our restaurants, excluding bone-in chicken for some of our restaurants as of the end of fiscal 2016.
In September 2015, we entered into a Master Distribution Agreement with McLane Foodservice, Inc. (“McLane”), pursuant to which McLane was appointed as an approved distributor for substantially all of the items used in our stores. We transitioned to McLane from our prior approved distributor during the first fiscal quarter of 2016. Our agreement with McLane extends through March 31, 2023 and generally restricts us from using alternative distributors for most products. McLane delivers frozen, refrigerated and dry products, as well as
13
Table of Contents
Index to Financial Statements
most of our restaurant supplies, to most of our restaurants at least two times per week. We contract with four primary suppliers for our bone-in chicken which is supplied to us by various distributors, including McLane. Our agreement with McLane allows for us to transition the bone-in chicken distribution through McLane. A portion of our restaurants completed the transition to bone-in chicken distribution through McLane during fiscal 2016, with the remaining company-operated restaurants expected to transition during fiscal 2017. These bone-in chicken distributors typically deliver to most of our company-operated restaurants at least two times per week. Our franchisees are required to use an approved distributor and approved manufacturers for the purchase of their food and supplies. Franchisees can elect to transition to bone-in chicken distribution through McLane or, if quality standards can be met, continue to receive deliveries from other approved chicken distributors.
In our normal course of business, we evaluate bids from multiple suppliers for various products. Poultry and other proteins are our largest product cost items and represented approximately 45% of company-operated food and supplies costs in fiscal 2016. Fluctuations in supply and prices can significantly impact our restaurant service and profit performance. We actively manage cost volatility for poultry by negotiating directly with multiple suppliers, purchasing from suppliers with what we believe are the most favorable terms given existing market conditions.
Intellectual Property
We have registered Bojangles® and certain other names used by our restaurants as trademarks or service marks with the United States Patent and Trademark Office. The Bojangles® trademark is also registered in some form in approximately 25 foreign countries. Our current brand campaign tag line, It’s Bo Time®, has also been registered with the United States Patent and Trademark Office. We also have registered the configuration of our Big Bo Box as a trademark, and we continue to expand the family of Bojangles’ related trademarks. In addition, the Bojangles’ logo, website name and address and Facebook and Twitter accounts are our intellectual property. Our policy is to pursue and maintain registration of service marks and trademarks in those countries where permitted and where business strategy requires us to do so and to oppose vigorously any infringement or dilution of the service marks or trademarks. We or our suppliers maintain the seasonings and additives for our chicken and biscuits, and our other products, as well as certain standards, specifications and operating procedures, as trade secrets or confidential information.
Competition
We operate in the limited service restaurant industry, which is highly competitive and fragmented. The number, size and strength of competitors vary by region. Our competition includes a variety of locally owned restaurants and national and regional chains that offer dine-in, carry-out and delivery services. Our competition in the broadest perspective includes restaurants, convenience food stores, delicatessens, supermarkets and club stores. However, more specifically, we compete with fast-casual restaurants, such as Chipotle and Panera Bread Company, quick-service restaurants who serve breakfast, such as McDonald’s and Hardee’s, and chicken-specialty and Cajun quick-service restaurants, such as Chick-fil-A, Popeyes Louisiana Kitchen and Zaxby’s.
We believe competition within the fast-casual restaurant segment is based primarily on fresh ingredients and preparation of food, quality, taste, service and ambience. We also believe that QSR competition is based primarily on value, speed of service, convenience of drive-thru service, brand recognition and restaurant location. In addition, we compete with franchisors of other restaurant concepts for prospective franchisees.
Environmental Matters
We are subject to federal, state and local laws and regulations relating to environmental protection, including regulation of discharges into the air and water, storage and disposal of waste and clean-up of contaminated soil and groundwater. Under various federal, state and local laws, an owner or operator of real estate may be liable for the costs of removal or remediation of hazardous or toxic substances on, in or emanating from such property.
14
Table of Contents
Index to Financial Statements
Such liability may be imposed without regard to whether the owner or operator knew of, or was responsible for, the presence of such hazardous or toxic substances, and in some cases we may have obligations imposed by indemnity provisions in our leases.
We have not conducted a comprehensive environmental review of all of our properties, although for new company development, a Phase I environmental review is typically completed, and when advisable, a Phase II review, prior to our undertaking a long-term lease. No assurance can be given that we have identified all of the potential environmental liabilities at our properties or that such liabilities will not have a material adverse effect on our financial condition.
Regulation and Compliance
We are subject to extensive federal, state and local government regulation, including those relating to, among others, public health and safety, zoning and fire codes, and franchising. Failure to obtain or retain food or other licenses and registrations or exemptions would adversely affect the operations of restaurants, or the ability to franchise. Although we have not experienced and do not anticipate any significant problems in obtaining required licenses, permits or approvals, any difficulties, delays or failures in obtaining such licenses, permits, registrations, exemptions, or approvals could delay or prevent the opening of, or adversely impact the viability of, a restaurant in a particular area.
The development and construction of additional restaurants will be subject to compliance with applicable regulations, including those relating to zoning, land use, water quality and retention, and environment.
We believe federal and state environmental regulations have not had a material effect on operations, but more stringent and varied requirements of local government bodies with respect to zoning, land use and environmental factors, among others, could delay construction and increase development costs for new restaurants.
We are also subject to the Fair Labor Standards Act, the Immigration Reform and Control Act of 1986 and various federal and state laws governing such matters as minimum wages, exempt versus non-exempt, overtime, unemployment tax rates, workers’ compensation rates, citizenship requirements and other working conditions. A significant portion of the hourly staff is paid at rates consistent with the applicable federal or state minimum wage and, accordingly, increases in the minimum wage and/or changes in exempt versus non-exempt status will increase labor costs. In addition, the Patient Protection and Affordable Care Act of 2010 (“PPACA”) increased medical costs beginning in fiscal 2015 and we expect further increases in subsequent years. We are also subject to the Americans with Disabilities Act, which prohibits discrimination on the basis of disability in public accommodations and employment, which may require us to design or modify our restaurants to make reasonable accommodations for disabled persons.
For a discussion of the various risks we face from regulation and compliance matters, see “Risk Factors.”
Management Information Systems
All of our company-operated restaurants use computerized point-of-sale and back office systems, which we believe are scalable to support our long-term growth plans. The point-of-sale system provides a touch screen interface and integrated, high speed credit card and gift card processing. The point-of-sale system is used to collect daily transaction data from company-operated restaurants, which generates information about product mix and daily sales that we actively analyze. During fiscal 2015, we completed migrating our company-operated restaurants to a new point-of-sale system and during the post-transition there may be a period of time during which the transactional data for the restaurants that migrated to the new point-of-sale system is in a format that is not easily usable for analytical purposes.
Our in-restaurant back office computer system is designed to assist in the management of our restaurants and provide labor and food cost management tools. The system also provides our support center and restaurant
15
Table of Contents
Index to Financial Statements
operations management quick access to detailed business data and reduces the time our restaurant managers spend on administrative needs. The system also provides sales, bank deposit and variance data to our finance department on a daily basis. For company-operated restaurants, we use this data to generate daily, weekly and/or period reports regarding sales and other key measures. The XPIENT point-of-sale and back office systems are available for use in franchised restaurants, but there are other systems currently in use and otherwise available that may be used by franchisees.
Additionally, we are working on several other key initiatives, including mobile payment, online ordering and a customer loyalty program, which we believe will improve our customer experience, capture large group ordering and increase transactions.
Geographic Footprint
As of December 25, 2016, we had 309 domestic company-operated restaurants and 404 domestic franchised restaurants located in eleven states, including North Carolina, South Carolina, Georgia, Virginia, Tennessee, Alabama, Maryland, Florida, Kentucky, West Virginia and Pennsylvania, and the District of Columbia. In addition, we currently have three international franchised restaurants in Roatan Island, Honduras. International stores represented less than 1% of our revenues in each of fiscal 2016, fiscal 2015 and fiscal 2014.
Employees
As of December 25, 2016, we had approximately 10,100 employees, of whom approximately 9,850 were restaurant employees and approximately 250 were support center personnel. None of our employees are part of a collective bargaining agreement, and we believe our relationships with our employees are satisfactory.
Seasonality
Seasonal factors cause our revenues to fluctuate from fiscal quarter to fiscal quarter. Our revenues per restaurant are typically lower in the first fiscal quarter. As a result, our quarterly and annual operating results and key performance indicators may fluctuate significantly.
You should consider carefully the following risks and uncertainties when reading this Annual Report. If any of the following risks actually occurs, our business, financial condition and results of operations could be materially and adversely affected. In that event, the trading price of our common stock could decline. Although we believe that we have identified and discussed below the key risk factors affecting our business, there may be additional risks and uncertainties that are not presently known or that are not currently believed to be significant that may adversely affect our performance or financial condition.
Risks Related to Our Business and Industry
We are vulnerable to changes in consumer preferences and economic conditions that could harm our business, financial condition, results of operations and cash flow.
Food service businesses depend on consumer discretionary spending and are often affected by changes in consumer tastes, national, regional and local economic conditions and demographic trends. Factors such as traffic patterns, weather, fuel prices, local demographics and the type, number and locations of competing restaurants may adversely affect the performances of individual locations. In addition, economic downturns, inflation or increased food or energy costs could harm the restaurant industry in general and our locations in particular. Adverse changes in any of these factors could reduce consumer traffic or impose practical limits on pricing that could harm our business, financial condition, results of operations and cash flow. There can be no assurance that
16
Table of Contents
Index to Financial Statements
consumers will continue to regard Southern-inspired, chicken-based or fried food favorably or that we will be able to develop new menu items that appeal to consumer preferences. Also, changes in consumer shopping habits, such as increased utilization of online retailers, could reduce traffic and transactions in our restaurants and negatively impact our business. Our business, financial condition and results of operations depend in part on our ability to anticipate, identify and respond to changing consumer preferences and economic conditions. In addition, the restaurant industry is currently under heightened legal and legislative scrutiny related to menu labeling and resulting from the perception that the practices of restaurant companies have contributed to nutritional, caloric intake, obesity or other health concerns of their guests. If we are unable to adapt to changes in consumer preferences and trends, we may lose customers and our revenues may decline.
Our growth strategy depends in part on opening new restaurants in existing and new markets and expanding our franchise system. We may be unsuccessful in opening new company-operated or franchised restaurants or establishing new markets, which could adversely affect our growth.
One of the key means to achieving our growth strategy will be through opening restaurants and operating those restaurants on a profitable basis. We opened 24 company-operated restaurants in fiscal 2014, opened 29 company-operated restaurants in fiscal 2015 and opened 29 company-operated restaurants in fiscal 2016. Our franchisees opened 28 franchise operated restaurants in fiscal 2014, opened 34 franchise operated restaurants in fiscal 2015 and opened 29 franchise operated restaurants in fiscal 2016. Our ability to open new restaurants is dependent upon a number of factors, many of which are beyond our control, including our and our franchisees’ ability to:
| • | identify available and suitable restaurant sites; |
| • | compete for restaurant sites; |
| • | reach acceptable agreements regarding the lease or purchase of locations; |
| • | obtain or have available the financing required to acquire and operate a restaurant, including construction and opening costs, which includes access to build-to-suit leases and equipment financing leases at favorable interest and capitalization rates; |
| • | respond to unforeseen engineering or environmental problems with leased premises; |
| • | avoid the impact of inclement weather, natural disasters and other calamities; |
| • | hire, train and retain the skilled management and other employees necessary to meet staffing needs; |
| • | obtain, in a timely manner and for an acceptable cost, required licenses, permits and regulatory approvals and respond effectively to any changes in local, state or federal law and regulations that adversely affect our and our franchisees’ costs or ability to open new restaurants; and |
| • | control construction and equipment cost increases for new restaurants. |
There is no guarantee that a sufficient number of suitable restaurant sites will be available in desirable areas or on terms that are acceptable to us in order to achieve our growth plan. If we are unable to open new restaurants or sign new franchisees, or if existing franchisees do not open new restaurants, or if restaurant openings are significantly delayed, our revenues or earnings growth could be adversely affected and our business negatively affected.
As part of our longer term growth strategy, we may enter into geographic markets in which we have little or no prior operating or franchising experience through company-operated restaurant growth and through franchise development agreements. The challenges of entering new markets include: difficulties in hiring experienced personnel; unfamiliarity with local real estate markets and demographics; consumer unfamiliarity with our brand; and different competitive and economic conditions, consumer tastes and discretionary spending patterns that are more difficult to predict or satisfy than in our existing markets. Consumer recognition of our brand has been
17
Table of Contents
Index to Financial Statements
important in the success of company-operated and franchised restaurants in our existing markets. Restaurants we open in new markets may take longer to reach expected sales and profit levels on a consistent basis and may have higher construction, occupancy and operating costs than existing restaurants, thereby affecting our overall profitability. In addition, consumer tastes and breakfast preferences may vary geographically for Southern-inspired items, which could affect our overall sales and profitability. Any failure on our part to recognize or respond to these challenges may adversely affect the success of any new restaurants. Expanding our franchise system could require the implementation, expense and successful management of enhanced business support systems, management information systems and financial controls as well as additional staffing, franchise support and capital expenditures and working capital.
Due to brand recognition and logistical synergies, as part of our growth strategy, we also intend to open new restaurants in areas where we have existing restaurants. The operating results and comparable restaurant sales for our restaurants could be adversely affected due to close proximity with our other restaurants and market saturation.
New restaurants, once opened, may not be profitable or may close, and historical average restaurant revenues and comparable restaurant sales may not be indicative of future results.
Some of our restaurants open with an initial start-up period of higher than normal sales volumes, which subsequently decrease to stabilized levels. In new markets, the length of time before average sales for new restaurants stabilize is less predictable and can be longer as a result of our limited knowledge of these markets and consumers’ limited awareness of our brand. In addition, our average restaurant revenues and comparable restaurant sales may not increase at historical rates. We may also not be successful in our new restaurant design for new restaurants and remodels of our existing restaurants in connection with our “Bojangles’ of the Future” project. Our ability to operate new restaurants profitably and increase average restaurant revenues and comparable restaurant sales will depend on many factors, some of which are beyond our control, including:
| • | consumer awareness and understanding of our brand; |
| • | general economic conditions, which can affect restaurant traffic, local labor costs and prices we pay for the food products and other supplies we use; |
| • | consumption patterns and food preferences that may differ from region to region; |
| • | changes in consumer preferences and discretionary spending; |
| • | difficulties obtaining or maintaining adequate relationships with distributors or suppliers in new markets; |
| • | increases in prices for commodities, including chicken and other proteins; |
| • | inefficiency in our labor costs as the staff gains experience; |
| • | competition, either from our competitors in the restaurant industry or our own restaurants; |
| • | temporary and permanent site characteristics of new restaurants; |
| • | changes in government regulation; |
| • | increased remodeling projects and associated costs, construction costs, cash capital expenditures, operating costs, depreciation and amortization expenses, and general and administrative expenses associated with our “Bojangles’ of the Future” and technology projects; and |
| • | other unanticipated increases in costs, any of which could give rise to delays or cost overruns. |
If our new restaurants do not perform as planned or close, our business and future prospects could be harmed. In addition, an inability to achieve our expected average restaurant revenues could have a material adverse effect on our business, financial condition and results of operations.
18
Table of Contents
Index to Financial Statements
Opening new restaurants in existing markets may negatively impact sales at our and our franchisees’ existing restaurants.
The consumer target area of our and our franchisees’ restaurants varies by location, depending on a number of factors, including population density, other local retail and business attractions, area demographics and geography. As a result, the opening of a new restaurant in or near markets in which we or our franchisees already have restaurants could adversely impact sales at these existing restaurants. Existing restaurants could also make it more difficult to build our and our franchisees’ consumer base for a new restaurant in the same market. Our core business strategy does not entail opening new restaurants that we believe will materially affect sales at our or our franchisees’ existing restaurants. However, we cannot guarantee there will not be significant impact in some cases and we may selectively open new restaurants in and around areas of existing restaurants that are operating at or near capacity to effectively serve our customers. Sales cannibalization between our restaurants may become significant in the future as we continue to expand our operations and could affect our sales growth, which could, in turn, materially and adversely affect our business, financial condition and results of operations.
Our sales growth and ability to achieve profitability could be adversely affected if comparable restaurant sales are less than we expect.
The level of comparable restaurant sales, which reflect the change in year-over-year sales for restaurants in the fiscal month following 15 months of operation using a mid-month convention, will affect our sales growth and will continue to be a critical factor affecting our ability to generate profits because the profit margin on comparable restaurant sales is generally higher than the profit margin on new restaurant sales. Our ability to increase comparable restaurant sales depends in part on our ability to successfully implement our initiatives to build sales. It is possible such initiatives will not be successful, that we will not achieve our target comparable restaurant sales growth or that the change in comparable restaurant sales could be negative, which may cause a decrease in sales growth and ability to achieve profitability that would have a material adverse effect on our business, financial condition and results of operations.
Our marketing programs may not be successful, and our new menu items, advertising campaigns, technology initiatives and restaurant designs and remodels may not generate increased sales or profits.
We incur costs and expend other resources in our marketing efforts on new menu items, advertising campaigns and restaurant designs and remodels to raise brand awareness and attract and retain customers. We are also working on several other key technology initiatives, including mobile payment, online ordering and a customer loyalty program, which we believe will improve our customer experience, capture large group ordering and increase transactions. These initiatives may not be successful, resulting in expenses incurred without the benefit of higher revenues. In addition, if we choose higher price points for promotional items, do less targeted discounting or increase our prices too much, our sales could be negatively impacted, which could have a material adverse effect on our results of operations and financial condition.
Further, if we are successful with the implementation of our technology initiatives related to mobile payment, online ordering and customer loyalty program, we may be required to introduce new in-store procedures and tools in order to execute operationally, which could include adding new roles and resources. Any changes to our restaurant operations associated with our technology initiatives could result in additional restaurant operating expenses and could negatively impact our results of operations.
Additionally, some of our competitors have greater financial resources, which enable them to spend significantly more on marketing and advertising and other initiatives than we are able to. Should our competitors increase spending on marketing and advertising and other initiatives such as additional discounting or our marketing funds decrease for any reason, or should our advertising, promotions, new menu items, technology initiatives and restaurant designs and remodels be less effective than our competitors, there could be a material adverse effect on our results of operations and financial condition.
19
Table of Contents
Index to Financial Statements
Changes in food and supplies costs, especially for chicken, could adversely affect our business, financial condition and results of operations.
Our profitability depends in part on our ability to anticipate and react to changes in food and supplies costs. We are susceptible to increases in food costs as a result of factors beyond our control, such as general economic conditions, seasonal economic fluctuations, weather conditions, global demand, food safety concerns, infectious diseases, fluctuations in the U.S. dollar, product recalls and government regulations. Although our overall food and supplies costs as a percentage of company restaurant revenues decreased during fiscal 2016, the costs of many basic foods for humans and animals, including wheat and cooking oil, have increased markedly in recent years, resulting in upward pricing pressures on almost all of our raw ingredients, including chicken (especially limited service restaurant-sized chickens) and pork. Food prices for a number of our key ingredients escalated markedly at various points in fiscal 2014, fiscal 2015 and fiscal 2016. As a result of such pricing pressures, we have experienced, and expect to continue to experience, significant increases in the costs of certain ingredients for items on our menu. In addition, due to the avian flu the cost of our eggs and seasoned fried turkeys were significantly higher in recent years. Weather related issues, such as freezes or drought, may also lead to temporary spikes in the prices of some ingredients such as produce or meats. Any increase in the prices of the ingredients most critical to our menu, such as chicken, pork, dairy and wheat, would adversely affect our operating results. Alternatively, in the event of cost increases with respect to one or more of our raw ingredients, we may choose to temporarily suspend serving menu items rather than paying the increased cost for the ingredients. Any such changes to our available menu may negatively impact our restaurant traffic, business and comparable restaurant sales during the shortage and thereafter. We have implemented menu price increases in the past to significantly offset the higher prices of food and supplies costs. We may not be able to offset all or any portion of increased food and supplies costs through higher menu prices in the future. If we or our franchisees implement further menu price increases in the future to protect our margins, restaurant traffic could be materially adversely affected, at both company-operated and franchised restaurants.
Our principal food product is chicken. In fiscal 2014, fiscal 2015 and fiscal 2016, the cost of chicken and other proteins included in our product cost was approximately 44%, 46% and 45%, respectively, of our food and supplies costs from company-operated restaurants. Material increases in the cost of chicken and other proteins could materially adversely affect our business, operating results and financial condition. Changes in the cost and availability of chicken can result from a number of factors, including seasonality, increases in the cost of grain, disease and other factors that affect availability, greater international demand for domestic chicken products, decreased numbers of size and choice chickens, especially limited service restaurant-sized chickens, increased costs for larger-sized chickens, which must be purchased if we are unable to purchase sufficient quantities of limited service restaurant-sized chickens, and increased transportation costs.
A major driver of the price of corn, which is the primary feed source for chicken, has been the increasing demand for corn by the ethanol industry as an alternative fuel source, as most ethanol plants in the United States use corn as the primary source of grain to make ethanol. This increased demand on the nation’s corn crop has had and may continue to have an adverse impact on chicken prices. While we have some supply agreements that allow us to lock in prices of certain raw ingredients for certain periods of time, we currently do not make extensive use of futures contracts or other financial risk management strategies with respect to potential price fluctuations in the cost of chicken, pork or other raw ingredients, food and supplies.
Wheat is an ingredient in some of our principal food products. Changes in the cost and availability of wheat may be affected by a number of factors, including economic and industry conditions, crop disease, weed control, water availability, various planting/growing/harvesting problems, and severe weather conditions such as drought, floods or frost that are difficult to anticipate and which cannot be controlled. Demand for food products made from wheat flour is affected by changes in consumer tastes, demographic trends and national, regional and local economic conditions.
Another of our principal food products is pork. Material increases in the cost of pork could materially adversely affect our business, operating results and financial condition. Changes in the cost of pork can result from a
20
Table of Contents
Index to Financial Statements
number of factors, including seasonality, increases in the cost of grain, disease and viruses and other factors that affect availability and greater international demand for domestic pork products.
We may not be able to compete successfully with other quick-service and fast-casual restaurants. Intense competition in the restaurant industry could make it more difficult to expand our business and could also have a negative impact on our operating results if customers favor our competitors or we are forced to change our pricing and other marketing strategies.
The food service industry, and particularly its quick-service and fast-casual segments, is intensely competitive. In addition, the Southeastern United States, the primary market in which we compete, consists of what we believe to be the most competitive Southern-inspired quick-service and fast-casual market in the United States. We expect competition in this market and each of our other markets to continue to be intense because consumer trends are favoring limited service restaurants that offer healthier menu items made with better quality products, and many limited service restaurants are responding to these trends. Competition in our industry is primarily based on price, convenience, quality of service, brand recognition, restaurant location and type and quality of food. If our company-operated and franchised restaurants cannot compete successfully with other quick-service and fast-casual restaurants in new and existing markets, we could lose customers and our revenues could decline. Our company-operated and franchised restaurants compete with national and regional quick-service and fast-casual restaurant chains for customers, restaurant locations and qualified management and other staff. Compared with us, some of our competitors have substantially greater financial and other resources, have been in business longer, have greater brand recognition or are better established in the markets where our restaurants are located or are planned to be located. In addition, competition has increased in the breakfast market as more competitors have entered the breakfast market or expanded their breakfast menu to be served all day, which may negatively impact our sales. Also, certain of our competitors have increased discounting and others have expanded their online ordering and delivery options, both of which may negatively impact our sales. Any of these competitive factors may materially adversely affect our business, financial condition or results of operations.
The financial performance of our franchisees can negatively impact our business.
As 57% of our restaurants are franchised as of December 25, 2016, our financial results are dependent in part upon the operational and financial success of our franchisees. We receive royalties, franchise fees, contributions to our marketing development fund and co-op advertising funds, and other fees from our franchisees. We have established operational standards and guidelines for our franchisees; however, we have limited control over how our franchisees’ businesses are run. While we are responsible for ensuring the success of our entire system of restaurants and for taking a longer term view with respect to system improvements, our franchisees have individual business strategies and objectives, which might conflict with our interests. Our franchisees may not be able to secure adequate financing to open or continue operating their Bojangles’ restaurants. If they incur too much debt or if economic or sales trends deteriorate such that they are unable to repay existing debt, our franchisees could experience financial distress or even bankruptcy. We also anticipate that we and our franchisees have been and will be financially impacted by the implementation of, and any potential changes to, the health care reform legislation and labor regulations. If a significant number of franchisees become financially distressed, it could harm our operating results through reduced royalty revenues and the impact on our profitability could be greater than the percentage decrease in the royalty revenues. Closure of franchised restaurants would reduce our royalty revenues and could negatively impact margins, since we may not be able to reduce fixed costs which we continue to incur.
We have limited control with respect to the operations of our franchisees, which could have a negative impact on our business.
Franchisees are independent business operators and are not our employees, and we do not exercise control over the day-to-day operations of their restaurants. We provide training and support to franchisees, and set and monitor operational standards, but the quality of franchised restaurants may be diminished by any number of
21
Table of Contents
Index to Financial Statements
factors beyond our control. Consequently, franchisees may not successfully operate restaurants in a manner consistent with our standards and requirements, or may not hire and train qualified managers and other restaurant personnel. If franchisees do not operate to our expectations, our image and reputation, and the image and reputation of other franchisees, may suffer materially and system-wide sales could decline significantly, which would reduce our royalty revenues, and the impact on profitability could be greater than the percentage decrease in royalties and fees.
The challenging economic environment may affect our franchisees, with adverse consequences to us.
We rely in part on our franchisees and the manner in which they operate their locations to develop and promote our business. As of December 25, 2016, our top three franchisees operated 156 of our franchised restaurants and accounted for approximately 44% of our royalty revenues in both fiscal 2016 and fiscal 2015. Due to the continuing challenging economic environment, it is possible that some franchisees could file for bankruptcy or become delinquent in their payments to us, which could have a significant adverse impact on our business due to loss or delay in payments of royalties, contributions to our marketing development fund and co-op advertising funds and other fees. Bankruptcies by our franchisees could prevent us from terminating their franchise agreements so that we can offer their territories to other franchisees, negatively impact our market share and operating results as we may have fewer well-performing restaurants, and adversely impact our ability to attract new franchisees.
Although we have developed criteria to evaluate and screen prospective developers and franchisees, we cannot be certain that the developers and franchisees we select will have the business acumen or financial resources necessary to open and operate successful franchises in their franchise areas, and state franchise laws may limit our ability to terminate or modify these franchise arrangements. Moreover, franchisees may not successfully operate restaurants in a manner consistent with our standards and requirements, or may not hire and train qualified managers and other restaurant personnel. The failure of developers and franchisees to open and operate franchises successfully could have a material adverse effect on us, our reputation, our brand and our ability to attract prospective franchisees and could materially adversely affect our business, financial condition, results of operations and cash flows.
Franchisees may not have access to the financial or management resources that they need to open the restaurants contemplated by their agreements with us, or be able to find suitable sites on which to develop them. Franchisees may not be able to negotiate acceptable lease or purchase terms for restaurant sites, obtain the necessary permits and government approvals or meet construction schedules. Any of these problems could slow our growth and reduce our franchise revenues. Additionally, our franchisees typically depend on financing from banks and other financial institutions, which may not always be available to them, in order to construct and open new restaurants. For these reasons, franchisees operating under development agreements may not be able to meet the new restaurant opening dates required under those agreements. Also, as of December 25, 2016, we sublease certain restaurants and equipment to six franchisees which comprise ten restaurants and lease land, building and equipment we own to one of our franchisees. If any such franchisees cannot meet their financial obligations under their subleases, or otherwise fail to honor or default under the terms of their subleases, we would be financially obligated under a master lease and could be adversely affected.
Our system-wide restaurant base is geographically concentrated in the Southeastern United States, and we could be negatively affected by conditions specific to that region.
Our company-operated and franchised restaurants in the Southeastern United States represent approximately 99% of our system-wide restaurants as of December 25, 2016. Our company-operated and franchised restaurants in North Carolina and South Carolina represent approximately 61% of our system-wide restaurants as of December 25, 2016. Approximately 70% of our company-operated restaurants are located in North Carolina and South Carolina as of December 25, 2016. Adverse changes in demographic, unemployment, economic, regulatory or weather conditions in the Southeastern United States have had, and may continue to have, material
22
Table of Contents
Index to Financial Statements
adverse effects on our business. As a result of our concentration in this market, we have been, and in the future may be, disproportionately affected by these adverse conditions compared to other chain restaurants with a national footprint.
In addition, our competitors could open additional restaurants in North Carolina and South Carolina, where we have significant concentration with over 435 of our system restaurants, which could result in reduced market share for us and may adversely impact our profitability.
Negative publicity could reduce sales at some or all of our restaurants.
We may, from time to time, be faced with negative publicity relating to food quality, the safety, sanitation and welfare of our restaurant facilities, customer complaints or litigation alleging illness or injury, health inspection scores, integrity of our or our suppliers’ food processing and other policies, practices and procedures, employee relationships and welfare or other matters at one or more of our restaurants. Negative publicity may adversely affect us, regardless of whether the allegations are valid or whether we are held to be responsible. In addition, the negative impact of adverse publicity relating to one restaurant may extend far beyond the restaurant involved, especially due to the high geographic concentration of many of our restaurants, to affect some or all of our other restaurants, including our franchised restaurants. The risk of negative publicity is particularly great with respect to our franchised restaurants because we are limited in the manner in which we can regulate them, especially on a real-time basis and negative publicity from our franchised restaurants may also significantly impact company-operated restaurants. A similar risk exists with respect to food service businesses unrelated to us, if customers mistakenly associate such unrelated businesses with our operations. Employee claims against us based on, among other things, wage and hour violations, discrimination, harassment or wrongful termination may also create not only legal and financial liability but negative publicity that could adversely affect us and divert our financial and management resources that would otherwise be used to benefit the future performance of our operations. These types of employee claims could also be asserted against us, on a co-employer theory, by employees of our franchisees. A significant increase in the number of these claims or an increase in the number of successful claims could materially adversely affect our business, financial condition, results of operations and cash flows.
Food safety and quality concerns may negatively impact our business and profitability, our internal operational controls and standards may not always be met and our employees may not always act professionally, responsibly and in our and our customers’ best interests. Any possible instances of food-borne illness could reduce our restaurant sales.
Incidents or reports of food-borne or water-borne illness or other food safety issues, food contamination or tampering, employee hygiene and cleanliness failures or improper employee conduct at our restaurants could lead to product liability or other claims. Such incidents or reports could negatively affect our brand and reputation as well as our business, revenues and profits. Similar incidents or reports occurring at limited service restaurants unrelated to us could likewise create negative publicity, which could negatively impact consumer behavior towards us.
We cannot guarantee to consumers that our internal controls and training will be fully effective in preventing all food-borne illnesses. Furthermore, our reliance on third-party food processors makes it difficult to monitor food safety compliance and may increase the risk that food-borne illness would affect multiple locations rather than single restaurants. Some food-borne illness incidents could be caused by third-party food suppliers and transporters outside of our control. New illnesses resistant to our current precautions may develop in the future, or diseases with long incubation periods could arise, that could give rise to claims or allegations on a retroactive basis. One or more instances of food-borne illness in one of our company-operated or franchised restaurants could negatively affect sales at all of our restaurants if highly publicized, especially due to the high geographic concentration of many of our restaurants. This risk exists even if it were later determined that the illness was wrongly attributed to one of our restaurants. A number of other restaurant chains have experienced incidents related to food-borne illnesses that have had material adverse impacts on their operations, and we cannot assure
23
Table of Contents
Index to Financial Statements
you that we could avoid a similar impact upon the occurrence of a similar incident at one of our restaurants. Additionally, even if food-borne illnesses were not identified at our restaurants, our restaurant sales could be adversely affected if instances of food-borne illnesses at other restaurant chains were highly publicized. In addition, our restaurant sales could be adversely affected by publicity regarding other high-profile illnesses such as avian flu or swine flu that customers may associate with our food products.
Except for a portion of our fresh chicken, we rely on one company to distribute substantially all of our food and supplies to company-operated and franchised restaurants. We also rely on a limited number of companies, and, in some cases, a sole company, to supply certain products, supplies and ingredients to our distributor. Failure to receive timely deliveries of food or other supplies could result in a loss of revenues and materially and adversely impact our operations.
Our and our franchisees’ ability to maintain consistent quality menu items and prices significantly depends upon our ability to acquire quality food products, including chicken and related items, from reliable sources in accordance with our specifications on a timely basis. Shortages or interruptions in the supply of food products caused by unanticipated demand, problems in production or distribution, contamination of food products, an outbreak of poultry or pork diseases, inclement weather or other conditions could materially adversely affect the availability, quality and cost of ingredients, which would adversely affect our business, financial condition, results of operations and cash flows. We have contracts with a limited number of suppliers, and, in some cases, a sole supplier, for certain products, supplies and ingredients. Certain menu items and ingredients are provided to us and our franchisees by single suppliers for various proteins and a single supplier for spices. We have limited rights to access the exclusive formulas used for us by one of the single-source suppliers. In September 2015, we entered into a Master Distribution Agreement with McLane, pursuant to which McLane was appointed as an approved distributor for substantially all of the food and supplies used in our company-operated and franchised stores, including buttermilk. We transitioned to McLane from our prior approved distributor during the first fiscal quarter of 2016. Our agreement with McLane also allows for us to transition the bone-in chicken distribution through McLane. A portion of our restaurants completed the transition to bone-in chicken distribution through McLane during fiscal 2016, with the remaining company-operated restaurants expected to transition during fiscal 2017. If McLane or our fresh chicken suppliers fail to perform as anticipated or seek to terminate agreements with us or our franchisees, or if there is any disruption in any of our supply or distribution relationships for any other reason, we or our franchisees could be forced to temporarily close a restaurant or remove popular items from a restaurant’s menu due to a supply shortage. In such event, that restaurant may experience a significant reduction in revenues during the time affected by the shortage and thereafter if our customers change their dining habits as a result, any of which could have a material adverse effect on our business, financial condition, results of operations and cash flows.
Our level of indebtedness could materially and adversely affect our business, financial condition and results of operations.
The total debt outstanding under our credit facility and capital lease obligations at December 25, 2016 was $187.3 million and we had no borrowings outstanding under our revolving credit facility. Our indebtedness could have significant effects on our business, such as:
| • | limiting our ability to borrow additional amounts to fund working capital, capital expenditures, acquisitions, debt service requirements, execution of our growth strategy and other purposes; |
| • | requiring us to dedicate a substantial portion of our cash flow from operations to pay principal and interest on our debt, which would reduce availability of our cash flow to fund working capital, capital expenditures, acquisitions, execution of our growth strategy and other general corporate purposes; |
| • | making us more vulnerable to adverse changes in general economic, industry and competitive conditions, in government regulation and in our business by limiting our ability to plan for and react to changing conditions; |
24
Table of Contents
Index to Financial Statements
| • | placing us at a competitive disadvantage compared with our competitors that have less debt; and |
| • | exposing us to risks inherent in interest rate fluctuations because our borrowings are at variable rates of interest, which could result in higher interest expense in the event of increases in interest rates. |
In addition, we may not be able to generate sufficient cash flow from our operations to repay our indebtedness when it becomes due and to meet our other cash needs. If we are not able to pay our debts as they become due, we will be required to pursue one or more alternative strategies, such as selling assets, refinancing or restructuring our indebtedness or selling additional debt or equity securities. We may not be able to refinance our debt or sell additional debt or equity securities or our assets on favorable terms, if at all, and if we must sell our assets, it may negatively affect our ability to generate revenues.
Our agreements relating to our term loan and revolving credit facility contain a number of covenants that, among other things, restrict, subject to certain exceptions, our ability to (i) incur additional indebtedness, (ii) issue preferred stock, (iii) create liens on assets, (iv) engage in mergers or consolidations, (v) sell assets, (vi) make investments, loans, or advances, (vii) make certain acquisitions, (viii) engage in certain transactions with affiliates, (ix) authorize or pay dividends, (x) change our lines of business or fiscal year and (xi) not exceed pre-determined maximum cash capital expenditures. In addition, our term loan and revolving credit facility requires us to maintain, on a consolidated basis, a minimum fixed charge coverage ratio, not to exceed a maximum total lease adjusted leverage ratio and not to exceed a maximum cash capital expenditure limit. Our ability to borrow under our revolving credit facility depends on our compliance with these tests. Events beyond our control, including changes in general economic and business conditions, may affect our ability to meet these tests. We cannot assure you that we will meet these tests in the future, or that our lenders will waive any failure to meet these tests.
The failure to comply with our debt covenants or the volatile credit and capital markets could have a material adverse effect on our financial condition.
Our ability to manage our debt is dependent on our level of positive cash flow from company-operated and franchised restaurants, net of costs. An economic downturn may negatively impact our cash flows. Credit and capital markets can be volatile, which could make it more difficult for us to refinance our existing debt or to obtain additional debt or equity financings in the future. Such constraints could increase our costs of borrowing and could restrict our access to other potential sources of future liquidity. Our failure to comply with the debt covenants in our term loan and revolving credit facility or to have sufficient liquidity to make interest and other payments required by our debt could result in a default of such debt and acceleration of our borrowings, which would have a material adverse effect on our business and financial condition. The lack of availability or access to build-to-suit leases and equipment financing leases could result in a decreased number of new restaurants and have a negative impact on our growth.
If the interest rate swaps entered into in connection with our credit facility prove ineffective, it could result in volatility in our operating results, including potential losses, which could have a material adverse effect on our results of operations and cash flows.
As of December 25, 2016, we have three interest rate swap contracts with one of our lenders under our current credit agreement to exchange our variable interest rate payment commitments for fixed interest rate payments on our term loans. On May 17, 2013, we entered into an interest rate swap contract with a notional amount of $50.0 million, an effective date of November 30, 2015 and a termination date of September 29, 2017, under which we pay a fixed interest rate of 1.3325% and receive the one-month LIBOR rate. Also on May 17, 2013, we entered into a second interest rate swap contract with a notional amount of $25.0 million, an effective date of May 31, 2013 and a termination date of May 31, 2017, under which we pay a fixed interest rate of 0.70125% and receive the one-month LIBOR rate. On October 26, 2015, we entered into a third interest rate swap contract with a notional amount of $50.0 million, an effective date of October 30, 2015 and a termination date of October 31,
25
Table of Contents
Index to Financial Statements
2019, under which we pay a fixed interest rate of 1.115% and receive the one-month LIBOR rate. Early termination of these interest rate swap contracts may result in payments by us and expiration of these swaps without replacement may result in increased interest payments by us, which could have a material adverse effect on our results of operations and cash flow.
We record the swaps at fair value, and are currently designated as an effective cash flow hedge under ASC 815, Derivatives and Hedging (“ASC 815”). Each fiscal quarter, we assess whether each derivative that qualifies for hedge accounting continues to be highly effective in offsetting changes in the cash flows of the hedged item and record in earnings any gains or losses resulting from hedge ineffectiveness. The hedge provided by our swaps could prove to be ineffective for a number of reasons, including early retirement of our term loan, as is allowed under the credit facility, or in the event the counterparty to the interest rate swaps are determined in the future to not be creditworthy. Any determination that the hedge created by the swaps is ineffective could have a material adverse effect on our results of operations and cash flows and result in volatility in our operating results. In addition, any changes in relevant accounting standards relating to the swaps, especially ASC 815, could materially increase earnings volatility.
A prolonged economic downturn could materially affect us in the future.
The restaurant industry is dependent upon consumer discretionary spending. The recession from late 2007 to mid-2009 reduced consumer confidence to historic lows, impacting the public’s ability and desire to spend discretionary dollars as a result of job losses, home foreclosures, significantly reduced home values, investment losses, bankruptcies and reduced access to credit, resulting in lower levels of customer traffic and lower average check sizes in our restaurants. If the economy experiences another significant decline, our business, results of operations and ability to comply with the terms of our term loan and revolving credit facility could be materially adversely affected and may result in a deceleration of the number and timing of new restaurant openings by us and our franchisees. Deterioration in customer traffic or a reduction in average check size would negatively impact our revenues and profitability and could result in reductions in staff levels, additional impairment charges and potential restaurant closures.
The interests of our franchisees may conflict with ours or yours in the future and we could face liability from our franchisees or related to our relationship with our franchisees.
Franchisees, as independent business operators, may from time to time disagree with us and our strategies regarding the business or our interpretation of our respective rights and obligations under the franchise agreement and the terms and conditions of the franchisee/franchisor relationship. This may lead to disputes with our franchisees and we expect such disputes to occur from time to time in the future as we continue to offer franchises. Such disputes may result in legal action against us. To the extent we have such disputes, the attention, time and financial resources of our management and our franchisees will be diverted from our restaurants, which could have a material adverse effect on our business, financial condition, results of operations and cash flows even if we have a successful outcome in the dispute.
In addition, various state and federal laws govern our relationship with our franchisees and our potential sale of a franchise. A franchisee and/or a government agency may bring legal action against us based on the franchisee/franchisor relationships that could result in the award of damages to franchisees and/or the imposition of fines or other penalties against us.
Information technology system failures or breaches of our network security could interrupt our operations and adversely affect our business.
We and our franchisees rely on our computer systems and network infrastructure across our operations, including point-of-sale processing at our restaurants. Our and our franchisees’ operations depend upon our and our franchisees’ ability to protect our computer equipment and systems against damage from physical theft, fire,
26
Table of Contents
Index to Financial Statements
power loss, telecommunications failure or other catastrophic events, as well as from internal and external security breaches, viruses and other disruptive problems. Any damage or failure of our computer systems or network infrastructure that causes an interruption in our operations could have a material adverse effect on our business and subject us or our franchisees to litigation or to actions by regulatory authorities.
We are continuing to expand, upgrade and develop our information technology capabilities, including the recent implementation of a new point-of-sale system for company-operated restaurants. If we are unable to successfully upgrade or expand our technological capabilities, we may not be able to take advantage of market opportunities, manage our costs and transactional data effectively, satisfy customer requirements, execute our business plan or respond to competitive pressures. Additionally, unforeseen problems with our new point-of-sale system may affect our operational abilities and internal controls and we may incur additional costs in connection with such upgrades and expansion.
If we or our franchisees are unable to protect our customers’ credit and debit card data, we could be exposed to data loss, litigation, liability and reputational damage.
In connection with credit and debit card sales, we and our franchisees transmit confidential credit and debit card information by way of secure private retail networks. Although we and our franchisees use private networks, third parties may have the technology or know-how to breach the security of the customer information transmitted in connection with credit and debit card sales, and our and our franchisees’ security measures and those of our and our franchisees’ technology vendors may not effectively prohibit others from obtaining improper access to this information. If a person were able to circumvent these security measures, he or she could destroy or steal valuable information or disrupt our and our franchisees’ operations. Any security breach could expose us and our franchisees to risks of data loss, litigation and liability and could seriously disrupt our and our franchisees’ operations and any resulting negative publicity could significantly harm our reputation.
The failure to enforce and maintain our trademarks and protect our other intellectual property could materially adversely affect our business, including our ability to establish and maintain brand awareness.
We have registered Bojangles’® and certain other names used by our restaurants as trademarks or service marks with the United States Patent and Trademark Office. The Bojangles’® trademark is also registered in some form in approximately 25 foreign countries. Our current brand campaign, “It’s Bo Time” has also been approved for registration with the United States Patent and Trademark Office. In addition, the Bojangles’ logo, website name and address and Facebook and Twitter accounts are our intellectual property. The success of our business strategy depends on our continued ability to use our existing trademarks and service marks in order to increase brand awareness and develop our branded products. If our efforts to protect our intellectual property are not adequate, or if any third-party misappropriates or infringes on our intellectual property, whether in print, on the Internet or through other media, the value of our brands may be harmed, which could have a material adverse effect on our business, including the failure of our brands and branded products to achieve and maintain market acceptance. There can be no assurance that all of the steps we have taken to protect our intellectual property in the United States and in foreign countries will be adequate. In addition, the laws of some foreign countries do not protect intellectual property rights to the same extent as do the laws of the United States.
We or our suppliers maintain the seasonings and additives for our chicken, biscuits and other offerings, as well as certain standards, specifications and operating procedures, as trade secrets or confidential information. We may not be able to prevent the unauthorized disclosure or use of our trade secrets or information, despite the existence of confidentiality agreements and other measures. While we try to ensure that the quality of our brand and branded products is maintained by all of our franchisees, we cannot be certain that these franchisees will not take actions that adversely affect the value of our intellectual property or reputation. If any of our trade secrets or information were to be disclosed to or independently developed by a competitor, our business, financial condition and results of operations could be materially adversely affected.
27
Table of Contents
Index to Financial Statements
Third-party claims with respect to intellectual property assets, if decided against us, may result in competing uses or require adoption of new, non-infringing intellectual property, which may in turn adversely affect sales and revenues.
There can be no assurance that third parties will not assert infringement or misappropriation claims against us, or assert claims that our rights in our trademarks, service marks, trade dress and other intellectual property assets are invalid or unenforceable. Any such claims could have a material adverse effect on us or our franchisees if such claims were to be decided against us. If our rights in any intellectual property were invalidated or deemed unenforceable, it could permit competing uses of intellectual property which, in turn, could lead to a decline in restaurant revenues. If the intellectual property became subject to third-party infringement, misappropriation or other claims, and such claims were decided against us, we may be forced to pay damages, be required to develop or adopt non-infringing intellectual property or be obligated to acquire a license to the intellectual property that is the subject of the asserted claim. There could be significant expenses associated with the defense of any infringement, misappropriation, or other third-party claims.
We depend on our executive officers, the loss of whom could materially harm our business.
We rely upon the accumulated knowledge, skills and experience of our executive officers. Our executive officers have cumulative experience of more than 27 years with us and over 88 years in the food service industry. If they were to leave us or become incapacitated, we might suffer in our planning and execution of business strategy and operations, impacting our brand and financial results. We also do not maintain any key man life insurance policies for any of our employees.
Matters relating to employment and labor law may adversely affect our business.
Various federal and state labor laws govern our relationships with our employees and affect operating costs. These laws include employee classifications as exempt or non-exempt, minimum wage requirements, unemployment tax rates, workers’ compensation rates, citizenship requirements and other wage and benefit requirements for employees classified as non-exempt. Significant additional government regulations and new laws, including mandating increases in minimum wages, changes in exempt and non-exempt status, or mandated benefits such as health insurance could materially affect our business, financial condition, operating results or cash flow. Since we self-insure our medical plan, increased medical claims could negatively impact our margins, as will the PPACA. Furthermore, if our or our franchisees’ employees unionize, it could materially affect our business, financial condition, operating results or cash flow.
We are also subject in the ordinary course of business to employee claims against us based, among other things, on discrimination, harassment, wrongful termination, or violation of wage and labor laws, including a current lawsuit seeking class action status against us regarding overtime and exempt versus non-exempt status. Such claims could also be asserted against us by employees of our franchisees. Moreover, claims asserted against franchisees may at times be made against us as a franchisor. These claims may divert our financial and management resources that would otherwise be used to benefit our operations. The ongoing expense of any resulting lawsuits, and any substantial settlement payment or damage award against us, could adversely affect our business, brand image, employee recruitment, financial condition, operating results or cash flows.
Restaurant companies have been the target of class action lawsuits and other proceedings alleging, among other things, violations of federal and state workplace and employment laws. Proceedings of this nature are costly, divert management attention and, if successful, could result in our payment of substantial damages or settlement costs.
Our business is subject to the risk of litigation by employees, consumers, suppliers, franchisees, stockholders or others through private actions, class actions, administrative proceedings, regulatory actions or other litigation. The outcome of litigation, particularly class action and regulatory actions, is difficult to assess or quantify. In
28
Table of Contents
Index to Financial Statements
recent years, restaurant companies, including us, have been subject to lawsuits, including class action lawsuits, alleging violations of federal and state laws regarding workplace and employment conditions, discrimination and similar matters. A number of these lawsuits have resulted in the payment of substantial damages by the defendants. Similar lawsuits have been instituted from time to time alleging violations of various federal and state wage and hour laws regarding, among other things, employee meal deductions, overtime eligibility of managers and failure to pay for all hours worked. Though we do not believe any lawsuits in which we are currently involved will have a material adverse effect on our financial position, results of operations, liquidity or capital resources, we may in the future be subject to lawsuits that could have such an effect.
Occasionally, our customers file complaints or lawsuits against us alleging that we are responsible for some illness or injury they suffered at or after a visit to one of our restaurants, including actions seeking damages resulting from food-borne illness or accidents in our restaurants. We are also subject to a variety of other claims from third parties arising in the ordinary course of our business, including contract claims. The restaurant industry has also been subject to a growing number of claims that the menus and actions of restaurant chains have led to the obesity of certain of their customers. We may also be subject to lawsuits from our employees, the U.S. Equal Employment Opportunity Commission or others alleging violations of federal and state laws regarding workplace and employment conditions, discrimination and similar matters.
Regardless of whether any claims against us are valid or whether we are liable, claims may be expensive to defend and may divert time and money away from our operations and result in increases in our insurance premiums. In addition, they may generate negative publicity, which could reduce customer traffic and sales. Although we maintain what we believe to be adequate levels of insurance, insurance may not be available at all or in sufficient amounts to cover any liabilities with respect to these or other matters. A judgment or other liability in excess of our insurance coverage for any claims or any adverse publicity resulting from claims could adversely affect our business and results of operations.
If we or our franchisees face labor shortages or increased labor costs, our results of operations and our growth could be adversely affected.
Labor is a primary component in the cost of operating our company-operated and franchised restaurants. If we or our franchisees face labor shortages or increased labor costs because of increased competition for employees, higher employee turnover rates, unionization of restaurant workers, or increases in the federally-mandated or state-mandated minimum wage, change in exempt and non-exempt status, or other employee benefits costs (including costs associated with health insurance coverage or workers’ compensation insurance), our and our franchisees’ operating expenses could increase and our growth could be adversely affected.
We have a substantial number of hourly employees who are paid wage rates at or based on the applicable federal or state minimum wage and increases in the minimum wage will increase our labor costs and the labor costs of our franchisees. The federal minimum wage has been $7.25 per hour since July 24, 2009. Federally-mandated, state-mandated or locally-mandated minimum wages may be raised in the future. As of the date hereof, 29 states and the District of Columbia have set a minimum wage level higher than the federal minimum wage. We may be unable to increase our menu prices in order to pass future increased labor costs on to our customers, in which case our margins would be negatively affected. Also, reduced margins of franchisees could make it more difficult to sell franchises. If menu prices are increased by us and our franchisees to cover increased labor costs, the higher prices could adversely affect transactions which could lower sales and thereby reduce our margins and the royalties that we receive from franchisees.
In addition, our success depends in part upon our and our franchisees’ ability to attract, motivate and retain a sufficient number of well-qualified restaurant operators, management personnel and other employees. Qualified individuals needed to fill these positions can be in short supply in some geographic areas, and in fiscal 2016 some of our stores experienced increased competition for qualified employees and were required to pay higher wages to hire employees. In addition, limited service restaurants have traditionally experienced relatively high
29
Table of Contents
Index to Financial Statements
employee turnover rates. Our turnover increased in both fiscal 2015 and fiscal 2016 at company-operated restaurants. Our and our franchisees’ ability to recruit and retain employees may delay the planned openings of new restaurants or result in higher employee turnover in existing restaurants, which could increase our and our franchisees’ labor costs and have a material adverse effect on our business, financial condition, results of operations or cash flows. If we or our franchisees are unable to recruit and retain sufficiently qualified individuals, our business and our growth could be adversely affected. Competition for these employees could require us or our franchisees to pay higher wages, which could also result in higher labor costs.
During fiscal 2016, the Department of Labor (“DOL”) enacted regulations related to overtime and exempt versus non-exempt classification that were scheduled to become effective December 1, 2016. Although the December 1, 2016 effective date was delayed, we increased the salaries of certain of our team members, and if the regulations are ultimately implemented, we expect the overtime rules and/or changes in exempt versus non-exempt status will result in additional increases in labor costs for us and/or our franchisees.
Finally, labor initiatives we or our franchisees implement across company-operated and franchised restaurants influence our labor costs. Certain initiatives, such as the expansion of our table service at company-operated restaurants, will increase our labor costs and overall operating expenses, which could adversely affect our growth. Changing the mix of full-time and part-time team members is another labor initiative that will influence our labor costs. Increasing our full-time team members at company-operated restaurants and/or franchised restaurants relative to part-time team members will result in higher labor costs for us and/or our franchisees, which could adversely affect our growth.
We are locked into long-term and non-cancelable leases and may be unable to renew leases at the end of their terms.
Many of our restaurant leases are non-cancelable and typically have initial terms up to between 15 and 20 years and three renewal terms of five years each that we may exercise at our option. Even if we close a restaurant, we are required to perform our obligations under the applicable lease, which could include, among other things, a provision for a closed restaurant reserve when the restaurant is closed, which would impact our profitability, and payment of the base rent, property taxes, insurance and maintenance for the balance of the lease term. In addition, in connection with leases for restaurants that we will continue to operate, we may, at the end of the lease term and any renewal period for a restaurant, be unable to renew the lease without substantial additional cost, if at all. As a result, we may close or relocate the restaurant, which could subject us to construction and other costs and risks. Additionally, the revenues and profit, if any, generated at a relocated restaurant may not equal the revenues and profit generated at the existing restaurant.
We and our franchisees are subject to extensive government regulations that could result in claims leading to increased costs and restrict our ability to operate or sell franchises.
We and our franchisees are subject to extensive government regulation at the federal, state and local government levels. These include, but are not limited to, regulations relating to the preparation and sale of food, zoning and building codes, franchising, land use and employee, health, sanitation and safety matters. We and our franchisees are required to obtain and maintain a wide variety of governmental licenses, permits and approvals. Difficulty or failure in obtaining them in the future could result in delaying or canceling the opening of new restaurants. Local authorities may suspend or deny renewal of our governmental licenses if they determine that our operations do not meet the standards for initial grant or renewal. This risk would be even higher if there were a major change in the licensing requirements affecting our types of restaurants.
The PPACA requires employers such as us to provide adequate and affordable health insurance for all qualifying employees or pay a monthly per-employee fee or penalty for non-compliance beginning in fiscal 2015. The PPACA increased our costs in providing health insurance for our employees beginning in fiscal 2015, and we expect additional increases in future years. We expect that increases in the penalty for non-compliance with the
30
Table of Contents
Index to Financial Statements
individual mandate will result in more employees enrolling in the health insurance offered by us and our costs in providing health insurance will increase.
We are also subject to regulation by the Federal Trade Commission and subject to state laws that govern the offer, sale, renewal and termination of franchises and our relationship with our franchisees. The failure to comply with these laws and regulations in any jurisdiction or to obtain required approvals could result in a ban or temporary suspension on franchise sales, fines or the requirement that we make a rescission offer to franchisees, any of which could affect our ability to open new restaurants in the future and thus could materially adversely affect our business and operating results. Any such failure could also subject us to liability to our franchisees.
Compliance with environmental laws may negatively affect our business.
We are subject to federal, state and local laws and regulations, including those concerning waste disposal, pollution, protection of the environment, and the presence, discharge, storage, handling, release and disposal of, and exposure to, hazardous or toxic substances. These environmental laws provide for significant fines and penalties for non-compliance and liabilities for remediation, sometimes without regard to whether the owner or operator of the property knew of, or was responsible for, the release or presence of hazardous toxic substances. Third parties may also make claims against owners or operators of properties for personal injuries and property damage associated with releases of, or actual or alleged exposure to, such hazardous or toxic substances at, on or from our restaurants. Environmental conditions relating to the presence of hazardous substances at prior, existing or future restaurant sites could materially adversely affect our business, financial condition and results of operations. Further, environmental laws and regulations, and the administration, interpretation and enforcement thereof, are subject to change and may become more stringent in the future, each of which could materially adversely affect our business, financial condition and results of operations.
Legislation and regulations requiring the display and provision of nutritional information for our menu offerings, and new information or attitudes regarding diet and health or adverse opinions about the health effects of consuming our menu offerings, could affect consumer preferences and negatively impact our results of operations.
Government regulation and consumer eating habits may impact our business as a result of changes in attitudes regarding diet and health or new information regarding the health effects of consuming our menu offerings, including our buttermilk biscuits, legendary sweet tea and bone-in fried chicken. These changes have resulted in, and may continue to result in, the enactment of laws and regulations that impact the ingredients and nutritional content of our menu offerings, or laws and regulations requiring us to disclose the nutritional content of our food offerings.
The PPACA establishes a uniform, federal requirement for certain restaurants to post certain nutritional information on their menus. Specifically, the PPACA amended the Federal Food, Drug and Cosmetic Act to, as of May 5, 2017, require chain restaurants with 20 or more locations operating under the same name and offering substantially the same menus to publish the total number of calories of standard menu items on menus and menu boards, along with a statement that puts this calorie information in the context of a total daily calorie intake. The PPACA also requires covered restaurants to, as of May 5, 2017, provide to consumers, upon request, a written summary of detailed nutritional information for each standard menu item, and to provide a statement on menus and menu boards about the availability of this information. The PPACA further permits the United States Food and Drug Administration to require covered restaurants to make additional nutrient disclosures, such as disclosure of trans-fat content. An unfavorable report on, or reaction to, our menu ingredients, the size of our portions or the nutritional content of our menu items could negatively influence the demand for our offerings.
Furthermore, a number of states, counties and cities have enacted menu labeling laws requiring multi-unit restaurant operators to disclose certain nutritional information to customers, or have enacted legislation restricting the use of certain types of ingredients in restaurants.
31
Table of Contents
Index to Financial Statements
Compliance with current and future laws and regulations regarding the ingredients and nutritional content of our menu items may be costly and time-consuming. Additionally, if consumer health regulations or consumer eating habits change significantly, we may be required to modify or discontinue certain menu items, and we may experience higher costs associated with the implementation of those changes. Additionally, some government authorities are increasing regulations regarding trans-fats and sodium, which may require us to limit or eliminate trans-fats and sodium in our menu offerings or switch to higher cost ingredients or may hinder our ability to operate in certain markets. Some jurisdictions have banned certain cooking ingredients, such as trans-fats, which a limited number of our menu products contain in small, but measurable amounts, or have discussed banning certain products, such as large sodas. Removal of these products and ingredients from our menus could affect product tastes, customer satisfaction levels, and sales volumes, whereas if we fail to comply with these laws or regulations, our business could experience a material adverse effect.
We cannot make any assurances regarding our ability to effectively respond to changes in consumer health perceptions or our ability to successfully implement the nutrient content disclosure requirements and to adapt our menu offerings to trends in eating habits. The imposition of additional menu-labeling laws could have an adverse effect on our results of operations and financial position, as well as on the restaurant industry in general.
We may become subject to liabilities arising from environmental laws that could likely increase our operating expenses and materially and adversely affect our business and results of operations.
We are subject to federal, state and local laws, regulations and ordinances that:
| • | govern activities or operations that may have adverse environmental effects, such as discharges to air and water, as well as waste handling and disposal practices for solid and hazardous wastes; and |
| • | impose liability for the costs of cleaning up, and damage resulting from, sites of past spills, disposals or other releases of hazardous materials. |
In particular, under applicable environmental laws, we may be responsible for remediation of environmental conditions and may be subject to associated liabilities, including liabilities for clean-up costs and personal injury or property damage, relating to our restaurants and the land on which our restaurants are located, regardless of whether we lease or own the restaurants or land in question and regardless of whether such environmental conditions were created by us or by a prior owner or tenant. If we are found liable for the costs of remediating contamination at any of our properties, our operating expenses would likely increase and our results of operations would be materially adversely affected. See “Business—Environmental Matters.” Some of our leases provide for indemnification of our landlords for environmental contamination, clean-up or owner liability.
We are exposed to the risk of natural disasters, unusual weather conditions, pandemic outbreaks, political events, war and terrorism that could disrupt business and result in lower sales, increased operating costs and capital expenditures.
Our headquarters, company-operated and franchised restaurant locations, third-party sole distributor and its facilities, as well as certain of our vendors and customers, are located in areas which have been and could be subject to natural disasters such as floods, hurricanes, tornadoes, fires or earthquakes. Adverse weather conditions or other extreme changes in the weather, including resulting electrical and technological failures, especially such events which occur in North Carolina or South Carolina, as a result of the concentration of our restaurants, may disrupt our and our franchisees’ business and may adversely affect our and our franchisees’ ability to obtain food and supplies and sell menu items. Our business may be harmed if our or our franchisees’ ability to obtain food and supplies and sell menu items is impacted by any such events, any of which could influence customer trends and purchases and may negatively impact our and our franchisees’ revenues, properties or operations. Such events could result in physical damage to one or more of our or our franchisees’ properties, the temporary closure of some or all of our company-operated restaurants, franchised restaurants and third-party sole distributor, the temporary lack of an adequate work force in a market, temporary or long-term
32
Table of Contents
Index to Financial Statements
disruption in the transport of goods, delay in the delivery of goods and supplies to our company-operated and franchised restaurants and third-party sole distributor, disruption of our technology support or information systems, or fuel shortages or dramatic increases in fuel prices, all of which would increase the cost of doing business. These events also could have indirect consequences such as increases in the costs of insurance if they result in significant loss of property or other insurable damage. Any of these factors, or any combination thereof, could adversely affect our operations.
Because of our international franchised restaurants, we could be adversely affected by violations of the U.S. Foreign Corrupt Practices Act and similar worldwide anti-bribery and anti-kickback laws.
We currently have three franchised locations located outside the United States. The U.S. Foreign Corrupt Practices Act, and other similar anti-bribery and anti-kickback laws and regulations, generally prohibit companies and their intermediaries from making improper payments to non-U.S. officials for the purpose of obtaining or retaining business. We cannot assure you that we will be successful in preventing our franchisees or other agents from taking actions in violation of these laws or regulations. Such violations, or allegations of such violations, could disrupt our business and result in a material adverse effect on our financial condition, results of operations and cash flows.
Risks Related to Ownership of Our Common Stock
If the ownership of our common stock continues to be highly concentrated, it may prevent minority stockholders from influencing significant corporate decisions and may result in conflicts of interest.
Advent International Corporation (“Advent”) indirectly beneficially owns approximately 52% of our outstanding common stock outstanding as of December 25, 2016. As a result, Advent indirectly beneficially owns shares sufficient for majority votes over all matters requiring stockholder votes, including: the election of directors; mergers, consolidations and acquisitions; the sale of all or substantially all of our assets and other decisions affecting our capital structure; amendments to our certificate of incorporation or our bylaws; and our winding up and dissolution.
This concentration of ownership may delay, deter or prevent acts that would be favored by our other stockholders. The interests of Advent may not always coincide with our interests or the interests of our other stockholders. This concentration of ownership may also have the effect of delaying, preventing or deterring a change in control of us. Also, Advent may seek to cause us to take courses of action that, in its judgment, could enhance its investment in us, but which might involve risks to our other stockholders or adversely affect us or our other stockholders. As a result, the market price of our common stock could decline or stockholders might not receive a premium over the then-current market price of our common stock upon a change in control. In addition, this concentration of share ownership may adversely affect the trading price of our common stock because investors may perceive disadvantages in owning shares in a company with significant stockholders.
The interests of Advent may conflict with ours or those of our other stockholders in the future.
Advent engages in a range of investing activities, including investments in restaurants and other consumer-related companies in particular. In the ordinary course of its business activities, Advent may engage in activities where its interests conflict with our interests or those of our other stockholders. Our amended and restated certificate of incorporation contains provisions renouncing any interest or expectancy held by our directors affiliated with Advent in certain corporate opportunities. Accordingly, the interests of Advent may supersede ours, causing them or their affiliates to compete against us or to pursue opportunities instead of us, for which we have no recourse. Such actions on the part of Advent and inaction on our part could have a material adverse effect on our business, financial condition and results of operations. In addition, Advent may have an interest in pursuing acquisitions, divestitures and other transactions that, in its judgment, could enhance its investment in us, even though such transactions might involve risks to our stockholders, such as debt financed acquisitions.
33
Table of Contents
Index to Financial Statements
As a controlled company, we are not subject to all of the corporate governance rules of NASDAQ.
We are considered a “controlled company” under the rules of NASDAQ. Controlled companies are exempt from NASDAQ corporate governance rules requiring that listed companies have (i) a majority of the board of directors consist of “independent” directors under the listing standards of NASDAQ, (ii) a nominating/corporate governance committee composed entirely of independent directors and a written nominating/corporate governance committee charter meeting NASDAQ requirements and (iii) a compensation committee composed entirely of independent directors and a written compensation committee charter meeting the requirements of NASDAQ. As a result of relying on certain of these exceptions, our nominating and corporate governance committee does not consist entirely of independent directors. While we have chosen not to rely on certain of the exceptions, we may in the future choose to rely on such exceptions as long as we continue to be a controlled company. Accordingly, our stockholders may not have the same protections afforded to stockholders of companies that are subject to all of the corporate governance requirements of NASDAQ.
Bojangles’, Inc. is a holding company with no operations and relies on its operating subsidiaries to provide it with funds necessary to meet its financial obligations and to pay dividends.
Bojangles’, Inc. is a holding company with no material direct operations. Bojangles’, Inc.’s principal assets are the equity interests it directly or indirectly holds in its operating subsidiaries which own our operating assets. As a result, Bojangles’, Inc. is dependent on loans, dividends and other payments from its operating subsidiaries to generate the funds necessary to meet its financial obligations and to pay dividends on its common stock. Its subsidiaries are legally distinct from Bojangles’, Inc. and may be prohibited or restricted from paying dividends, including the restrictions contained in our term loan and revolving credit facility described below, or otherwise making funds available to us under certain conditions. Although Bojangles’, Inc. does not expect to pay dividends on its common stock for the foreseeable future, if it is unable to obtain funds from its subsidiaries, it may be unable to, or its board may exercise its discretion not to, pay dividends.
We do not anticipate paying any dividends on our common stock in the foreseeable future.
We do not expect to declare or pay any cash or other dividends in the foreseeable future on our common stock because we intend to use cash flow generated by operations to grow our business. Our term loan and revolving credit facility restrict our ability to pay cash dividends on our common stock. We may also enter into other credit agreements or other borrowing arrangements in the future that restrict or limit our ability to pay cash dividends on our common stock. As a result, our stockholders may not receive any return on an investment in our common stock unless they sell our common stock for a price greater than that which they paid for it.
If we are unable to regain and maintain compliance with the requirements for continued listing on the NASDAQ Global Select Market, our common stock may be delisted and the price of our common stock could be negatively impacted.
Our common stock is currently listed for trading on the NASDAQ Global Select Market. We must satisfy NASDAQ’s continued listing requirements or risk delisting, which would have a material adverse effect on our business. On November 23, 2016, we were notified that Robert Alderson, a member of our board of directors, had passed away. Mr. Alderson was also a member of the audit committee of our board of directors and, as a result of his passing, we are not in compliance with Rule 5605(c)(2)(A) of the NASDAQ, which requires that we maintain an audit committee composed of at least three independent directors. Our board of directors is actively seeking to recruit a director to fill the vacancies on the board of directors and the audit committee resulting from Mr. Alderson’s passing and expects to regain compliance with Rule 5605(c)(2)(A) before the end of the cure period for such non-compliance as provided for by the listing rules of NASDAQ. However, there can be no assurance that we will be able to regain compliance with NASDAQ’s listing requirements. A delisting of our common stock from the NASDAQ Global Select Market could materially reduce the liquidity of our common stock, resulting in a corresponding material reduction in the price of our common stock, and may result in the potential loss of confidence by investors, suppliers, customers and employees and fewer business development opportunities.
34
Table of Contents
Index to Financial Statements
As a public company, we incur significant costs to comply with the laws and regulations affecting public companies which could harm our business and results of operations.
As a public company, we are subject to the reporting requirements of the Securities Exchange Act of 1934, as amended (the “Exchange Act”), and the Sarbanes-Oxley Act of 2002, as amended (the “Sarbanes-Oxley Act”), and the listing requirements of NASDAQ, and other applicable securities rules and regulations. These rules and regulations have increased and will continue to increase our legal, accounting and financial compliance costs and have made and will continue to make some activities more time consuming and costly, particularly after we cease to be an “emerging growth company” as defined in the JOBS Act. For example, these rules and regulations could make it more difficult and more costly for us to obtain director and officer liability insurance, and we may be required to accept reduced policy limits and coverage or to incur substantial costs to maintain the same or similar coverage. These rules and regulations could also make it more difficult for us to attract and retain qualified persons to serve on our board of directors or our board committees or as executive officers. Our management and other personnel devote a substantial amount of time to these compliance initiatives. As a result, management’s attention may be diverted from other business concerns, which could harm our business and operating results. In fiscal 2015, we hired additional employees to comply with these requirements. Despite the increase in headcount, we will need to hire more employees in the future, which will further increase our costs and expenses.
Our management team and other personnel devote a substantial amount of time to new compliance initiatives and we may not successfully or efficiently manage our ongoing transition to a public company. To comply with the requirements of being a public company, including the Sarbanes-Oxley Act, we have undertaken and will continue to undertake various actions, such as implementing new internal controls and procedures and hiring accounting or internal audit staff, which will require us to incur additional expenses and harm our results of operations.
Our management has limited experience managing a public company and our current resources may not be sufficient to fulfill our public company obligations.
As a public company, we are subject to various regulatory requirements, including those of the SEC and NASDAQ. These requirements include record keeping, financial reporting and corporate governance rules and regulations. Our management team has limited experience in managing a public company and, historically, has not had the resources typically found in a public company. Our internal infrastructure may not be adequate to support our increased reporting obligations and we may be unable to hire, train or retain necessary staff and may be reliant on engaging outside consultants or professionals to overcome our lack of experience or employees. Our business could be adversely affected if our internal infrastructure is inadequate, we are unable to engage outside consultants or are otherwise unable to fulfill our public company obligations.
If securities or industry analysts do not publish research, do not continue to publish research or publish inaccurate or unfavorable research about our business, our stock price and trading volume could decline.
The trading market for our common stock is influenced by the research and reports that industry or securities analysts publish about us or our business. If one or more of these analysts ceases coverage of our company or fails to publish reports on us regularly, we could lose visibility in the financial markets, which in turn could cause our stock price or trading volume to decline. Moreover, if our operating results do not meet the expectations of the investor community, or one or more of the analysts who cover our company downgrade our stock, our stock price could decline.
For as long as we are an emerging growth company, we will not be required to comply with certain reporting requirements, including those relating to accounting standards and disclosure about our executive compensation, that apply to other public companies.
We are an “emerging growth company,” as defined in Section 2(a) of the Securities Act, as modified by the JOBS Act. As such, we are eligible to take advantage of certain exemptions from various reporting requirements
35
Table of Contents
Index to Financial Statements
that are applicable to other public companies that are not “emerging growth companies,” including, but not limited to, not being required to comply with the auditor attestation requirements of Section 404(b) of the Sarbanes-Oxley Act, reduced disclosure obligations regarding executive compensation in our periodic reports and proxy statements, and exemptions from the requirements of holding a non-binding advisory vote on executive compensation and of stockholder approval of any golden parachute payments not previously approved. We take advantage of some of these exceptions, and we do not know if some investors find our common stock less attractive as a result. The result may be a less-active trading market for our common stock and our stock price may be more volatile.
In addition, Section 107 of the JOBS Act provides that an “emerging growth company” can take advantage of the extended transition period provided in Section 7(a)(2)(B) of the Securities Act for complying with new or revised accounting standards. In other words, an “emerging growth company” can delay the adoption of certain accounting standards until those standards would otherwise apply to private companies. We have irrevocably elected not to avail ourselves of this exemption and, therefore, we will be subject to the same new or revised accounting standards as other public companies that are not emerging growth companies.
We could remain an “emerging growth company” until December 27, 2020 or until the earliest of (a) the last day of the first fiscal year in which our annual gross revenues exceed $1 billion, (b) the date that we become a “large accelerated filer” as defined in Rule 12b-2 under the Exchange Act, which would occur if the market value of our common stock that is held by non-affiliates exceeds $700 million as of the last business day of our most recently completed second fiscal quarter, or (c) the date on which we have issued more than $1 billion in non-convertible debt securities in the preceding three-year period.
If we fail to establish and maintain an effective system of integrated internal controls, we may not be able to report our financial results accurately, which could have a material adverse effect on our business, financial condition and results of operations.
Ensuring that we have adequate internal financial and accounting controls and procedures in place so that we can produce accurate financial statements on a timely basis is a costly and time-consuming effort that will need to be evaluated frequently. Section 404 of the Sarbanes-Oxley Act requires public companies to conduct an annual review and evaluation of their internal controls and attestations by independent auditors regarding the effectiveness of internal controls. We currently qualify as an emerging growth company, and thus, we are exempt from the auditors’ attestation requirement until such time as we no longer qualify as an emerging growth company. Regardless of whether we qualify as an emerging growth company, we still need to implement substantial control systems and procedures in order to satisfy the reporting requirements under the Exchange Act and applicable NASDAQ requirements, among other items. Establishing these internal controls have been and will continue to be costly and may divert management’s attention.
Evaluation by us of our internal controls over financial reporting may identify material weaknesses that may cause us to be unable to report our financial information on a timely basis and thereby subject us to adverse regulatory consequences, including sanctions by the SEC or violations of NASDAQ listing rules. There also could be a negative reaction in the financial markets due to a loss of investor confidence in us and the reliability of our financial statements. Confidence in the reliability of our financial statements also could suffer if we or our independent registered public accounting firm were to report a material weakness in our internal controls over financial reporting. This could materially adversely affect our business, financial condition, results of operations and stock price.
The market price and trading volume of our common stock has been and may be volatile, which could result in rapid and substantial losses for our stockholders, and you may lose all or part of your investment.
Prior to our IPO, there had been no public market for our common stock. Shares of our common stock were sold in our IPO in May 2015 at a price of $19.00 per share. During fiscal year 2015, our common stock traded as high
36
Table of Contents
Index to Financial Statements
as $28.45 and as low as $14.70. During fiscal year 2016, our common stock traded as high as $20.15 and as low as $13.39. An active, liquid and orderly market for our common stock may not be sustained, which could depress the trading price of our common stock or cause it to be highly volatile or subject to wide fluctuations. The market price of our common stock has and may continue to fluctuate or may decline significantly in the future. Some of the factors that could negatively affect our share price or result in fluctuations in the price or trading volume of our common stock include:
| • | variations in our quarterly or annual operating results; |
| • | changes in our earnings estimates (if provided) or differences between our actual financial and operating results and those expected by investors and analysts; |
| • | the contents of published research reports about us or our industry or the failure of securities analysts to cover our common stock; |
| • | additions or departures of key management personnel; |
| • | any increased indebtedness we may incur in the future; |
| • | announcements by us or others and developments affecting us; |
| • | actions by institutional stockholders; |
| • | litigation and governmental investigations; |
| • | legislative or regulatory changes; |
| • | judicial pronouncements interpreting laws and regulations; |
| • | changes in government programs; |
| • | changes in market valuations of similar companies; |
| • | speculation or reports by the press or investment community with respect to us or our industry in general; |
| • | announcements by us or our competitors of significant contracts, acquisitions, dispositions, strategic relationships, joint ventures or capital commitments; and |
| • | general market, political and economic conditions, including local conditions in the markets in which we operate. |
These broad market and industry factors may decrease the market price of our common stock, regardless of our actual operating performance. The stock market in general has from time to time experienced extreme price and volume fluctuations, including recently. In addition, in the past, following periods of volatility in the overall market and decreases in the market price of a company’s securities, securities class action litigation has often been instituted against these companies. This litigation, if instituted against us, could result in substantial costs and a diversion of our management’s attention and resources.
Future offerings of debt or equity securities by us may adversely affect the market price of our common stock.
In the future, we may attempt to obtain financing or to further increase our capital resources by issuing additional shares of our common stock or by offering debt or other equity securities, including senior or subordinated notes, debt securities convertible into equity or shares of preferred stock. Opening new company-operated restaurants in existing and new markets could require substantial additional capital in excess of cash from operations. We would expect to finance the capital required for new company-operated restaurants through a combination of additional issuances of equity, corporate indebtedness, leases and cash from operations.
Issuing additional shares of our common stock or other equity securities or securities convertible into equity may dilute the economic and voting rights of our existing stockholders or reduce the market price of our common
37
Table of Contents
Index to Financial Statements
stock or both. Upon liquidation, holders of such debt securities and preferred shares, if issued, and lenders with respect to other borrowings would receive a distribution of our available assets prior to the holders of our common stock. Debt securities convertible into equity could be subject to adjustments in the conversion ratio pursuant to which certain events may increase the number of equity securities issuable upon conversion. Preferred shares, if issued, could have a preference with respect to liquidating distributions or a preference with respect to dividend payments that could limit our ability to pay dividends to the holders of our common stock. Our decision to issue securities in any future offering will depend on market conditions and other factors beyond our control, which may adversely affect the amount, timing, or nature of our future offerings. Thus, holders of our common stock bear the risk that our future offerings may reduce the market price of our common stock and dilute their stockholdings in us.
The market price of our common stock could be negatively affected by sales of substantial amounts of our common stock in the public markets.
As of December 25, 2016, we had 36,547,434 shares of common stock outstanding. Of our issued and outstanding shares, all common stock is freely transferable, except for any shares held by our “affiliates,” as that term is defined in Rule 144 under the Securities Act. Approximately 52% of our outstanding common stock as of December 25, 2016 is beneficially owned by Advent, and can be resold into the public markets in the future in accordance with the requirements of Rule 144.
Sales or distributions of substantial amounts of our common stock, or the perception that such sales or distributions could occur, may cause the market price of our common stock to decline. A decline in the price of our common stock might impede our ability to raise capital through the issuance of additional common stock or other equity securities.
Pursuant to our stockholders’ agreement, certain of our stockholders may require us to file registration statements under the Securities Act at our expense, covering resales of our common stock held by them or piggyback on a registration statement in certain circumstances. Any such sales, or the prospect of any such sales, could materially impact the market price of our common stock.
The future issuance of additional common stock in connection with the Amended and Restated 2011 Equity Incentive Plan, acquisitions or otherwise will dilute all other stockholdings.
As of December 25, 2016, we had an aggregate of 105,596,164 shares of common stock authorized but unissued and not reserved for issuance under the Amended and Restated 2011 Equity Incentive Plan (the “Amended 2011 Plan”). We may issue all of these shares of common stock without any action or approval by our stockholders, subject to certain exceptions. Any common stock issued in connection with the Amended 2011 Plan, the exercise of outstanding stock options, or otherwise, would dilute the percentage ownership held investors.
Delaware law and our organizational documents, as well as our existing and future debt agreements, may impede or discourage a takeover, which could deprive our investors of the opportunity to receive a premium for their shares.
We are a Delaware corporation, and the anti-takeover provisions of Delaware law impose various impediments to the ability of a third-party to acquire control of us, even if a change of control would be beneficial to our existing stockholders. In addition, provisions of our amended and restated certificate of incorporation and bylaws may make it more difficult for, or prevent a third-party from, acquiring control of us without the approval of our board of directors. Among other things, these provisions:
| • | provide for a classified board of directors with staggered three-year terms; |
| • | do not permit cumulative voting in the election of directors, which would otherwise allow less than a majority of stockholders to elect director candidates; |
38
Table of Contents
Index to Financial Statements
| • | delegate the sole power of a majority of the board of directors to fix the number of directors; |
| • | provide the power of our board of directors to fill any vacancy on our board of directors, whether such vacancy occurs as a result of an increase in the number of directors or otherwise; |
| • | authorize the issuance of “blank check” preferred stock without any need for action by stockholders; |
| • | eliminate the ability of stockholders to call special meetings of stockholders; |
| • | establish advance notice requirements for nominations for election to our board of directors or for proposing matters that can be acted on by stockholders at stockholder meetings; and |
| • | provide that a 66 2⁄3% supermajority vote will be required to amend or repeal provisions relating to, among other things, the classification of the board of directors, the filling of vacancies on the board of directors and the advance notice requirements for stockholder proposals and director nominations. |
In addition, our term loan and revolving credit facility imposes, and we anticipate that documents governing our future indebtedness may impose, limitations on our ability to enter into change of control transactions. Thereunder, the occurrence of a change of control transaction could constitute an event of default permitting acceleration of the indebtedness, thereby impeding our ability to enter into certain transactions.
The foregoing factors, as well as the significant common stock ownership by Advent could impede a merger, takeover, or other business combination, or discourage a potential investor from making a tender offer for our common stock, which, under certain circumstances, could reduce the market value of our common stock.
Our amended and restated bylaws designate the Court of Chancery of the State of Delaware as the sole and exclusive forum for certain types of actions and proceedings that may be initiated by our stockholders, which could limit our stockholders’ ability to obtain a favorable judicial forum for disputes with us or our directors, officers, or other employees.
Our amended and restated bylaws provide that, subject to certain exceptions, unless we consent in writing to the selection of an alternative forum, the Court of Chancery of the State of Delaware shall be the sole and exclusive forum for (A) any derivative action or proceeding brought on our behalf, (B) any action asserting a claim of breach of a fiduciary duty owed by any of our directors, officers or other employees to us or our stockholders, (C) any action asserting a claim arising pursuant to any provision of the Delaware General Corporation Law, or DGCL, our certificate of incorporation or our bylaws, or (D) any action asserting a claim against us governed by the internal affairs doctrine. This choice of forum provision may limit a stockholder’s ability to bring a claim in a judicial forum that it finds favorable for disputes with us or our directors, officers, or other employees, which may discourage such lawsuits against us and our directors, officers, and other employees. Alternatively, if a court were to find this provision of our amended and restated bylaws inapplicable to, or unenforceable in respect of, one or more of the specified types of actions or proceedings, we may incur additional costs associated with resolving such matters in other jurisdictions, which could adversely affect our business, financial condition or results of operations.
Item 1B. Unresolved Staff Comments
None.
39
Table of Contents
Index to Financial Statements
As of December 25, 2016, we had 309 domestic company-operated restaurants and 404 domestic franchised restaurants located in eleven states, including North Carolina, South Carolina, Georgia, Tennessee, Virginia, Alabama, Kentucky, Maryland, Florida, West Virginia and Pennsylvania, and the District of Columbia. In addition, we currently have three international franchised restaurants in Roatan Island, Honduras.
Our Footprint As of December 25, 2016
As of December 25, 2016, company-operated, franchised and total restaurants by jurisdiction are:
| State |
Company- Operated |
Franchised | Total | |||||||||
| North Carolina |
150 | 153 | 303 | |||||||||
| South Carolina |
67 | 68 | 135 | |||||||||
| Georgia |
29 | 62 | 91 | |||||||||
| Tennessee |
37 | 30 | 67 | |||||||||
| Virginia |
— | 61 | 61 | |||||||||
| Alabama |
17 | 16 | 33 | |||||||||
| Kentucky |
4 | 4 | 8 | |||||||||
| Maryland |
5 | — | 5 | |||||||||
| Florida |
— | 4 | 4 | |||||||||
| West Virginia |
— | 4 | 4 | |||||||||
| Pennsylvania |
— | 1 | 1 | |||||||||
| Washington DC |
— | 1 | 1 | |||||||||
|
|
|
|
|
|
|
|||||||
| Domestic Total: |
309 | 404 | 713 | |||||||||
|
|
|
|
|
|
|
|||||||
| Honduras |
— | 3 | 3 | |||||||||
|
|
|
|
|
|
|
|||||||
| International Total: |
— | 3 | 3 | |||||||||
|
|
|
|
|
|
|
|||||||
| Total: |
309 | 407 | 716 | |||||||||
|
|
|
|
|
|
|
|||||||
For a majority of our company-operated restaurants, we lease both the building and the land on which the restaurant is built. For certain company-operated restaurants we lease only the land on which the restaurant is built. In addition, for two of our company-operated restaurants, we own both the building and the land on which the restaurant is built.
Our leases typically have terms of 15 years, with three renewal terms of five years each. Restaurant leases provide for a specified annual rent, and some leases call for additional or contingent rent based on revenues above specified levels. Our leases are “triple net leases” that require us to pay real estate taxes, insurance and maintenance costs. In addition, we lease our executive offices, consisting of approximately 45,000 square feet in Charlotte, North Carolina, for a term expiring in 2022. We believe our executive offices are suitable for near-term expansion plans and we have added, and will continue to add, additional square footage on an as-needed basis.
We are involved in various other claims and legal actions that arise in the ordinary course of business. We do not believe that the ultimate resolution of these actions will have a material adverse effect on our financial position, results of operations, liquidity or capital resources. A significant increase in the number of claims or an increase in amounts owing under successful claims could materially adversely affect our business, financial condition, results of operations and cash flows.
Item 4. Mine Safety Disclosures
Not applicable.
40
Table of Contents
Index to Financial Statements
PART II
Item 5. Market for Registrant’s Common Equity, Related Stockholder Matters and Issuer Purchases of Equity Securities
Market Information
Our common stock has been publicly traded on the NASDAQ Global Select Market under the ticker symbol “BOJA” since May 8, 2015. We did not have any shares of common stock outstanding prior to our IPO. The following table sets forth, for the periods indicated, the intraday high and low prices of our common stock on the NASDAQ Global Select Market:
| High | Low | |||||||
| Fourth Fiscal Quarter (September 26, 2015 – December 25, 2016) |
$ | 20.15 | $ | 14.55 | ||||
| Third Fiscal Quarter (June 27, 2015 – September 25, 2016) |
$ | 18.50 | $ | 15.29 | ||||
| Second Fiscal Quarter (March 28, 2016 – June 26, 2016) |
$ | 19.00 | $ | 16.08 | ||||
| First Fiscal Quarter (December 28, 2015 – March 27, 2016) |
$ | 18.90 | $ | 13.39 | ||||
| High | Low | |||||||
| Fourth Fiscal Quarter (September 28, 2015 – December 27, 2015) |
$ | 19.75 | $ | 14.70 | ||||
| Third Fiscal Quarter (June 29, 2015 – September 27, 2015) |
$ | 25.55 | $ | 17.41 | ||||
| Second Fiscal Quarter (May 8, 2015 – June 28, 2015) |
$ | 28.45 | $ | 22.41 | ||||
Holders
As of March 1, 2017, there were approximately 15 holders of record of our common stock. The number of holders of record is based upon the actual number of holders registered at such date and does not include holders of shares in “street name” or persons, partnerships, associates, corporations or other entities in security position listings maintained by depositories.
Dividends
We have not declared, and currently do not plan to declare in the foreseeable future, dividends on our common stock. Instead, we anticipate that all of our earnings in the foreseeable future, if any, will be used for the operation and growth of our business. Any future determination to pay dividends on our common stock will be at the discretion of our board of directors and will depend upon many factors, including our financial position, our results of operations, our liquidity, legal requirements, restrictions that may be imposed by the terms of current and future financing instruments and other factors deemed relevant by our board of directors. Our credit facility also restricts our ability to pay cash dividends on our common stock.
41
Table of Contents
Index to Financial Statements
Stock Performance Graph
The following graph compares the cumulative total shareholder return on our common stock from May 8, 2015 (using the price of which our shares of common stock were initially sold to the public) to December 25, 2016 to that of the total return of the NASDAQ Composite and the S&P Composite 1500 Restaurants Index. The comparison assumes $100 was invested in our common stock on May 8, 2015 and in each of the forgoing indices on May 8, 2015 and assumes the reinvestment of dividends. The stock price performance included in this graph is not necessarily indicative of future stock price performance.
The information contained in the performance graph below shall not be deemed “soliciting material” or to be “filed” with the SEC nor shall such information be deemed incorporated by reference into any future filing under the Securities Act or the Exchange Act except to the extent we specifically incorporate it by reference into such filing.
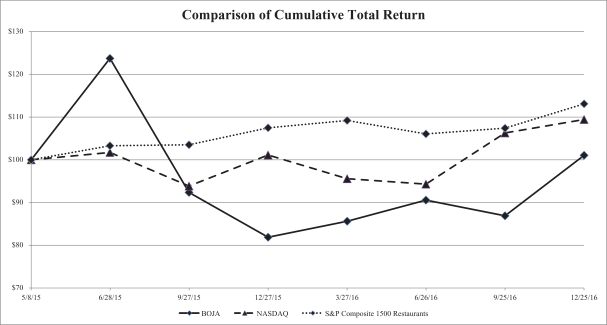
| 5/8/2015 | 6/28/2015 | 9/27/2015 | 12/27/2015 | 3/27/2016 | 6/26/2016 | 9/25/2016 | 12/25/2016 | |||||||||||||||||||||||||
| Bojangles’, Inc. |
$ | 100.00 | $ | 123.74 | $ | 92.37 | $ | 81.89 | $ | 85.63 | $ | 90.63 | $ | 86.95 | $ | 101.05 | ||||||||||||||||
| NASDAQ Composite |
$ | 100.00 | $ | 101.78 | $ | 93.89 | $ | 101.14 | $ | 95.63 | $ | 94.32 | $ | 106.29 | $ | 109.44 | ||||||||||||||||
| S&P Composite 1500 Restaurants |
$ | 100.00 | $ | 103.33 | $ | 103.56 | $ | 107.53 | $ | 109.24 | $ | 106.08 | $ | 107.42 | $ | 113.16 | ||||||||||||||||
42
Table of Contents
Index to Financial Statements
Item 6. Selected Financial Data
The following tables contain selected historical consolidated financial data as of and for the fiscal years ended December 25, 2016, December 27, 2015 and December 28, 2014, derived from our audited consolidated financial statements included elsewhere in this Annual Report. The selected historical financial data for the fiscal years ended December 29, 2013 and December 30, 2012 are derived from audited consolidated financial statements not included in this Annual Report. These tables should be read in conjunction with Item 7, “Management’s Discussion and Analysis of Financial Condition and Results of Operations,” and our audited consolidated financial statements and the notes thereto.
| Fiscal Year Ended(1) | ||||||||||||||||||||
| 2016 | 2015 | 2014 | 2013 | 2012 | ||||||||||||||||
| (in thousands, except per share amounts) | ||||||||||||||||||||
| Consolidated Statement of Operations Data: |
||||||||||||||||||||
| Revenues: |
||||||||||||||||||||
| Company restaurant revenues |
$ | 504,664 | $ | 462,138 | $ | 406,788 | $ | 353,592 | $ | 328,370 | ||||||||||
| Franchise royalty revenues |
26,364 | 25,104 | 22,746 | 20,572 | 19,539 | |||||||||||||||
| Other franchise revenues |
853 | 960 | 938 | 998 | 860 | |||||||||||||||
|
|
|
|
|
|
|
|
|
|
|
|||||||||||
| Total revenues |
531,881 | 488,202 | 430,472 | 375,162 | 348,769 | |||||||||||||||
|
|
|
|
|
|
|
|
|
|
|
|||||||||||
| Company restaurant operating expenses: |
||||||||||||||||||||
| Food and supplies costs |
158,644 | 150,563 | 133,191 | 118,563 | 108,972 | |||||||||||||||
| Restaurant labor costs |
138,839 | 126,380 | 112,506 | 99,378 | 95,732 | |||||||||||||||
| Operating costs |
112,256 | 100,916 | 88,476 | 75,160 | 68,499 | |||||||||||||||
| Depreciation and amortization |
12,709 | 11,456 | 9,713 | 9,011 | 8,361 | |||||||||||||||
|
|
|
|
|
|
|
|
|
|
|
|||||||||||
| Total company restaurant operating expenses |
422,448 | 389,315 | 343,886 | 302,112 | 281,564 | |||||||||||||||
|
|
|
|
|
|
|
|
|
|
|
|||||||||||
| Operating income before other operating expenses |
109,433 | 98,887 | 86,586 | 73,050 | 67,205 | |||||||||||||||
|
|
|
|
|
|
|
|
|
|
|
|||||||||||
| Other operating expenses: |
||||||||||||||||||||
| General and administrative |
39,041 | 42,844 | 32,107 | 27,478 | 25,480 | |||||||||||||||
| Depreciation and amortization |
2,917 | 2,809 | 2,372 | 2,177 | 2,154 | |||||||||||||||
| Impairment |
1,927 | 1,210 | 484 | 653 | 321 | |||||||||||||||
| Loss (gain) on disposal of property and equipment |
47 | 336 | 60 | (579 | ) | 161 | ||||||||||||||
|
|
|
|
|
|
|
|
|
|
|
|||||||||||
| Total other operating expenses |
43,932 | 47,199 | 35,023 | 29,729 | 28,116 | |||||||||||||||
|
|
|
|
|
|
|
|
|
|
|
|||||||||||
| Operating income |
65,501 | 51,688 | 51,563 | 43,321 | 39,089 | |||||||||||||||
| Loss on debt extinguishment |
— | — | — | — | (10,838 | ) | ||||||||||||||
| Amortization of deferred debt issuance costs |
(763 | ) | (821 | ) | (733 | ) | (681 | ) | (1,509 | ) | ||||||||||
| Interest income |
4 | 7 | 2 | 3 | 4 | |||||||||||||||
| Interest expense |
(7,489 | ) | (8,314 | ) | (9,123 | ) | (8,401 | ) | (15,157 | ) | ||||||||||
|
|
|
|
|
|
|
|
|
|
|
|||||||||||
| Income before income taxes |
57,253 | 42,560 | 41,709 | 34,242 | 11,589 | |||||||||||||||
| Income taxes |
19,537 | 16,034 | 15,589 | 9,915 | 3,931 | |||||||||||||||
|
|
|
|
|
|
|
|
|
|
|
|||||||||||
| Net income |
$ | 37,716 | $ | 26,526 | $ | 26,120 | $ | 24,327 | $ | 7,658 | ||||||||||
|
|
|
|
|
|
|
|
|
|
|
|||||||||||
| Net income per share(2): |
||||||||||||||||||||
| Basic |
$ | 1.04 | $ | 1.15 | $ | — | $ | — | $ | — | ||||||||||
| Diluted |
1.00 | 0.71 | 0.70 | 0.66 | 0.21 | |||||||||||||||
| Weighted average shares used in computing net income per share(2): |
||||||||||||||||||||
| Basic |
36,258 | 23,118 | — | — | — | |||||||||||||||
| Diluted |
37,684 | 37,464 | 37,429 | 36,949 | 36,596 | |||||||||||||||
| Consolidated Statement of Cash Flows Data: |
||||||||||||||||||||
| Net cash provided by operating activities |
$ | 54,300 | $ | 45,526 | $ | 41,643 | $ | 37,930 | $ | 32,934 | ||||||||||
| Net cash used in investing activities |
(9,744 | ) | (12,186 | ) | (10,669 | ) | (8,619 | ) | (7,823 | ) | ||||||||||
| Net cash used in financing activities |
(44,921 | ) | (32,278 | ) | (26,229 | ) | (29,461 | ) | (21,511 | ) | ||||||||||
43
Table of Contents
Index to Financial Statements
| Fiscal Year Ended(1) | ||||||||||||||||||||
| 2016 | 2015 | 2014 | 2013 | 2012 | ||||||||||||||||
| (Dollar amounts in thousands, except per share amounts) | ||||||||||||||||||||
| Consolidated Balance Sheet Data: |
||||||||||||||||||||
| Cash and cash equivalents |
$ | 13,898 | $ | 14,263 | $ | 13,201 | $ | 8,456 | $ | 8,606 | ||||||||||
| Property and equipment, net |
52,275 | 48,137 | 42,478 | 42,022 | 35,411 | |||||||||||||||
| Total assets |
559,772 | 558,306 | 552,643 | 541,336 | 535,121 | |||||||||||||||
| Total debt(3) |
187,281 | 227,645 | 252,758 | 221,840 | 195,460 | |||||||||||||||
| Total stockholders’ equity |
210,790 | 167,124 | 137,752 | 160,603 | 184,932 | |||||||||||||||
| Other Supplemental Metrics: |
||||||||||||||||||||
| Number of restaurants: |
||||||||||||||||||||
| Company-operated |
309 | 281 | 254 | 225 | 211 | |||||||||||||||
| Franchised |
407 | 381 | 368 | 352 | 327 | |||||||||||||||
| System-wide |
716 | 662 | 622 | 577 | 538 | |||||||||||||||
| Comparable restaurant sales growth(4): |
||||||||||||||||||||
| Company-operated |
1.1 | % | 3.6 | % | 4.0 | % | 4.5 | % | 8.4 | % | ||||||||||
| Franchised |
1.5 | % | 4.4 | % | 5.0 | % | 1.4 | % | 6.2 | % | ||||||||||
| System-wide |
1.3 | % | 4.1 | % | 4.6 | % | 2.5 | % | 7.0 | % | ||||||||||
| System-wide sales |
$ | 1,231,898 | $ | 1,153,003 | $ | 1,035,380 | $ | 925,228 | $ | 866,534 | ||||||||||
| System-wide average unit volumes |
$ | 1,818 | $ | 1,839 | $ | 1,774 | $ | 1,728 | $ | 1,716 | ||||||||||
| Restaurant contribution(5) |
$ | 94,925 | $ | 84,279 | $ | 72,615 | $ | 60,491 | $ | 55,167 | ||||||||||
| as a percentage of company restaurant revenues(5) |
18.8 | % | 18.2 | % | 17.9 | % | 17.1 | % | 16.8 | % | ||||||||||
| EBITDA(6) |
$ | 81,127 | $ | 65,953 | $ | 63,648 | $ | 54,509 | $ | 38,766 | ||||||||||
| Adjusted EBITDA(6) |
$ | 88,889 | $ | 79,265 | $ | 68,885 | $ | 60,458 | $ | 54,630 | ||||||||||
| Cash capital expenditures(7) |
$ | 9,695 | $ | 12,047 | $ | 7,495 | $ | 9,431 | $ | 7,213 | ||||||||||
| (1) | Fiscal 2016, fiscal 2015, fiscal 2014 and fiscal 2013 were 52-week fiscal years. Fiscal 2012 was a 53-week fiscal year. |
| (2) | On May 13, 2015, we completed an initial public offering of 8,912,500 shares of common stock (the “IPO”), including 1,162,500 shares sold to the underwriters pursuant to their option to purchase additional shares. We have not presented basic net income per share for the fiscal years ended December 28, 2014, December 29, 2013 and December 30, 2012 because our historical capital structure makes the presentation of net income per share not meaningful as we did not have any shares of common stock outstanding prior to our IPO. |
| (3) | Total debt consists of borrowings under our credit facility and capital lease obligations. See the consolidated financial statements included in Part II, Item 8 for more information about all liabilities. |
| (4) | Comparable restaurant sales growth reflects the change in year-over-year sales for the comparable restaurant base. A restaurant enters our comparable restaurant base the first full day of the month after being open for 15 months using a mid-month convention. If a restaurant is temporarily closed for a full calendar week due to items such as a remodel, scrape and rebuild, casualty event, severe weather conditions or any other short-term closure, it is removed from the comparable restaurant sales calculations for such period. System-wide comparable restaurant sales include restaurant sales at all comparable company-operated restaurants and at all comparable franchised restaurants, as reported by franchisees. While we do not record franchised restaurant sales as revenues, our royalty revenues are calculated based on a percentage of franchised restaurant sales. |
| (5) | See Restaurant Contribution and Restaurant Contribution Margin (Non-GAAP Financial Measures) in Item 7 for additional information and a reconciliation to the most directly comparable GAAP financial measure. |
| (6) | See EBITDA and Adjusted EBITDA (Non-GAAP Financial Measures) in Item 7 for additional information and a reconciliation to the most directly comparable GAAP financial measure. |
| (7) | Cash capital expenditures represents cash for purchases of property and equipment. |
44
Table of Contents
Index to Financial Statements
Item 7. Management’s Discussion and Analysis of Financial Condition and Results of Operations
The following discussion and analysis of the consolidated financial condition and results of operations for Bojangles’, Inc. (“Bojangles’” or the “Company”) should be read in conjunction with the financial statements of the Company and notes thereto included elsewhere in this annual report. In this annual report, unless the context otherwise requires, references to “we,” “us,” and “our” mean the Company, together with its subsidiaries, on a consolidated basis.
Operating results for any one fiscal year are not necessarily indicative of results to be expected for any other fiscal year and our key performance indicators, as discussed below, may decrease for any future period. Unless otherwise stated, comparable restaurant sales and average unit volumes are presented on a system-wide basis, which means they include sales at both company-operated restaurants and franchised restaurants. Franchise sales represent sales at all franchised restaurants and are revenues to our franchisees. We do not record franchise sales as revenues; however, our franchise royalty revenues include royalties based on a percentage of franchise sales.
Overview
Bojangles’ is a highly differentiated and growing restaurant operator and franchisor dedicated to serving customers high-quality, craveable food made from our Southern recipes. We opened our first store in Charlotte, North Carolina in 1977 and, as of December 25, 2016, have expanded our system-wide restaurants to 716 across eleven states, the District of Columbia and Roatan Island, Honduras. Our system of restaurants, which includes both company-operated and franchised restaurants, generated over $1.2 billion of system-wide sales during fiscal year 2016. We offer fast-casual quality food and preparation combined with quick-service speed, convenience and value.
Key Performance Indicators
To evaluate the performance of our business, we utilize a variety of financial and performance measures. These key measures include company restaurant revenues, franchise royalty and other franchise revenues, system-wide AUVs, comparable restaurant sales, restaurant openings and net income. In addition, we also evaluate Adjusted Net Income and Adjusted Diluted Net Income per Share, EBITDA and Adjusted EBITDA, and restaurant contribution and restaurant contribution margin which are considered to be non-GAAP financial measures.
Company Restaurant Revenues
Company restaurant revenues consist of sales of food and beverages in company-operated restaurants. Company restaurant revenues in a period are influenced by several factors, including the number of operating weeks in such period, the number of open restaurants and comparable restaurant sales growth.
Seasonal factors cause our revenues to fluctuate from fiscal quarter to fiscal quarter. Our revenues per restaurant are typically lower in the first fiscal quarter. As a result, our quarterly and annual operating results and key performance indicators may fluctuate significantly.
Franchise Royalty and Other Franchise Revenues
Franchise royalty and other franchise revenues represents royalty income, and initial and renewal franchise fees. While we expect the majority of our total revenue growth will be driven by company-operated restaurants, our franchised restaurants and growth in franchise royalty and other franchise revenues remain an important part of our financial success.
45
Table of Contents
Index to Financial Statements
System-wide Average Unit Volumes
We measure system-wide AUVs on a fiscal year basis and on a trailing twelve-month basis for each non-fiscal year-end period for system-wide restaurants. Annual AUVs are calculated using the following methodology: first, we determine the domestic free-standing restaurants with both a drive-thru and interior seating that have been open for a full twelve-month period (excluding express units); and second, we calculate the revenues for these restaurants and divide by the number of restaurants in that base to arrive at our AUV calculation. This methodology is similar for each trailing twelve-month period outside the fiscal year end.
| Fiscal Year Ended | ||||||||||||
| December 25, 2016 |
December 27, 2015 |
December 28, 2014 |
||||||||||
| (Dollar amounts in thousands) |
||||||||||||
| Average Unit Volumes |
||||||||||||
| Total system-wide |
$ | 1,818 | $ | 1,839 | $ | 1,774 | ||||||
Comparable Restaurant Sales
Comparable restaurant sales reflects the change in year-over-year sales for the comparable restaurant base. A restaurant enters our comparable restaurant base the first full day of the month after being open for 15 months using a mid-month convention. If a restaurant is temporarily closed for a full calendar week due to items such as a remodel, scrape and rebuild, casualty event, severe weather conditions or any other short-term closure, it is removed from the comparable restaurant sales calculations for such period. While we do not record franchised sales as revenues, our royalty revenues are calculated based on a percentage of franchised restaurant sales.
| Fiscal Year Ended | ||||||||||||
| December 25, 2016 |
December 27, 2015 |
December 28, 2014 |
||||||||||
| Comparable Restaurant Sales: |
||||||||||||
| Company-operated |
1.1 | % | 3.6 | % | 4.0 | % | ||||||
| Franchised |
1.5 | % | 4.4 | % | 5.0 | % | ||||||
| Total system-wide |
1.3 | % | 4.1 | % | 4.6 | % | ||||||
Restaurant Openings
The number of restaurant openings reflects the number of restaurants opened during a particular reporting period. Before we open company-operated restaurants, we incur preopening costs. System-wide, some of our restaurants open with an initial start-up period of higher than normal sales volume, which subsequently decreases to stabilized levels. Newly opened restaurants typically have lower annual sales volumes than our established company-operated restaurants. Newly opened company-operated restaurants typically experience normal inefficiencies such as higher food and supplies, labor and other direct operating costs and, as a result, restaurant contribution margins are typically lower during the start-up period of operations. In addition, newly opened restaurants typically have high occupancy costs compared to existing restaurants and may cannibalize sales of existing restaurants. When entering new markets, we may be exposed to longer start-up times and lower contribution margins than reflected in our average historical experience.
46
Table of Contents
Index to Financial Statements
The following is the number of Bojangles’ company-operated, franchised and system-wide restaurants at the beginning and end of fiscal 2014, 2015 and 2016:
| Fiscal Year Ended | ||||||||||||
| December 25, 2016 |
December 27, 2015 |
December 28, 2014 |
||||||||||
| Company-operated restaurant activity: |
||||||||||||
| Restaurants at the beginning of the fiscal year |
281 | 254 | 225 | |||||||||
| Opened during the fiscal year |
29 | 29 | 24 | |||||||||
| Closed during the fiscal year |
(2 | ) | (3 | ) | (3 | ) | ||||||
| Refranchised during the fiscal year |
1 | 1 | 8 | |||||||||
|
|
|
|
|
|
|
|||||||
| Restaurants at the end of the fiscal year |
309 | 281 | 254 | |||||||||
|
|
|
|
|
|
|
|||||||
| Franchised restaurant activity: |
||||||||||||
| Restaurants at the beginning of the fiscal year |
381 | 368 | 352 | |||||||||
| Opened during the fiscal year |
29 | 34 | 28 | |||||||||
| Closed during the fiscal year |
(2 | ) | (20 | ) | (4 | ) | ||||||
| Refranchised during the fiscal year |
(1 | ) | (1 | ) | (8 | ) | ||||||
|
|
|
|
|
|
|
|||||||
| Restaurants at the end of the fiscal year |
407 | 381 | 368 | |||||||||
|
|
|
|
|
|
|
|||||||
| Total system-wide restaurant activity: |
||||||||||||
| Restaurants at the beginning of the fiscal year |
662 | 622 | 577 | |||||||||
| Opened during the fiscal year |
58 | 63 | 52 | |||||||||
| Closed during the fiscal year |
(4 | ) | (23 | ) | (7 | ) | ||||||
|
|
|
|
|
|
|
|||||||
| Restaurants at the end of the fiscal year |
716 | 662 | 622 | |||||||||
|
|
|
|
|
|
|
|||||||
Restaurant closures reflect permanent closures and exclude any temporary closures for items such as remodels, scrape and rebuilds, casualty events, severe weather conditions or any other short-term closure. A relocation results in a closure and an opening. During the fiscal years ended December 25, 2016, December 27, 2015 and December 28, 2014, our franchisees closed 2, 20 and 4 restaurants, respectively, of which 1, 7 and 1, respectively, were relocations. During the fiscal years ended December 25, 2016, December 27, 2015 and December 28, 2014, we closed 2, 3 and 3 Company-operated restaurants, respectively, of which 2, 3 and 2, respectively were relocations.
Net Income, Adjusted Net Income, Adjusted Diluted Net Income per Share, EBITDA and Adjusted EBITDA
We consider net income to be a key performance indicator that shows the overall health of our entire business. We typically utilize net income in conjunction with the non-GAAP financial measures Adjusted Net Income, Adjusted Diluted Net Income per Share, EBITDA and Adjusted EBITDA when assessing the operational strength and the performance of our business.
Adjusted Net Income represents company net income before items that we do not consider representative of our ongoing operating performance, as well as an estimate of recurring incremental legal, accounting, insurance and other operating and compliance costs we expect to incur as a public company for those periods where they had not yet been incurred, both as identified in the reconciliation table below. Adjusted Diluted Net Income per Share represents company diluted net income per share before items that we do not consider representative of our ongoing operating performance, as well as an estimate of recurring incremental legal, accounting, insurance and other operating and compliance costs we expect to incur as a public company for those periods where they had not yet been incurred, both as identified in the reconciliation table below.
EBITDA represents company net income before interest expense (net of interest income), provision for income taxes and depreciation and amortization. Adjusted EBITDA represents company net income before interest
47
Table of Contents
Index to Financial Statements
expense (net of interest income), provision for income taxes, depreciation and amortization, items that we do not consider representative of our ongoing operating performance and certain non-cash items, as identified in the reconciliation table below.
Adjusted Net Income, Adjusted Diluted Net Income per Share, EBITDA and Adjusted EBITDA as presented in this Form 10-K are supplemental measures of our performance that are neither required by, nor presented in accordance with, GAAP. Adjusted Net Income, Adjusted Diluted Net Income per Share, EBITDA and Adjusted EBITDA are not measurements of our financial performance under GAAP and should not be considered as alternatives to net income, operating income or any other performance measures derived in accordance with GAAP or as alternatives to cash flow from operating activities as a measure of our liquidity. In addition, in evaluating Adjusted Net Income, Adjusted Diluted Net Income per Share, EBITDA and Adjusted EBITDA, you should be aware that in the future we will incur expenses or charges such as those added back to calculate Adjusted Net Income, Adjusted Diluted Net Income per Share, EBITDA and Adjusted EBITDA. Our presentation of Adjusted Net Income, Adjusted Diluted Net Income per Share, EBITDA and Adjusted EBITDA should not be construed as an inference that our future results will be unaffected by unusual or non-recurring items.
Adjusted Net Income, Adjusted Diluted Net Income per share, EBITDA and Adjusted EBITDA have limitations as analytical tools, and you should not consider them in isolation, or as substitutes for analysis of our results as reported under GAAP. Some of these limitations are (i) they do not reflect our cash expenditures, or future requirements for capital expenditures or contractual commitments, (ii) they do not reflect changes in, or cash requirements for, our working capital needs, (iii) EBITDA and Adjusted EBITDA do not reflect the significant interest expense, or the cash requirements necessary to service interest or principal payments, on our debt, (iv) although depreciation and amortization are non-cash charges, the assets being depreciated and amortized will often have to be replaced in the future, and Adjusted Net Income, Adjusted Diluted Net Income per Share, EBITDA and Adjusted EBITDA do not reflect any cash requirements for such replacements, (v) they do not adjust for all non-cash income or expense items that are reflected in our statements of cash flows, (vi) they do not reflect the impact of earnings or charges resulting from matters we consider not to be indicative of our ongoing operations, and (vii) other companies in our industry may calculate these measures differently than we do, limiting their usefulness as comparative measures.
We compensate for these limitations by providing specific information regarding the GAAP amounts excluded from such non-GAAP financial measures. We further compensate for the limitations in our use of non-GAAP financial measures by presenting comparable GAAP measures more prominently.
We believe Adjusted Net Income, Adjusted Diluted Net Income per Share, EBITDA and Adjusted EBITDA facilitate operating performance comparisons from period to period by isolating the effects of some items that vary from period to period without any correlation to core operating performance or that vary widely among similar companies. These potential differences may be caused by variations in capital structures (affecting interest expense), tax positions (such as the impact on periods or companies of changes in effective tax rates or net operating losses) and the age and book depreciation of facilities and equipment (affecting relative depreciation expense). We also present EBITDA and Adjusted EBITDA because (i) we believe these measures are frequently used by securities analysts, investors and other interested parties to evaluate companies in our industry, (ii) we believe investors will find these measures useful in assessing our ability to service or incur indebtedness, and (iii) we use EBITDA and Adjusted EBITDA internally as benchmarks to evaluate our operating performance or compare our performance to that of our competitors.
48
Table of Contents
Index to Financial Statements
The following tables set forth reconciliations of net income to Adjusted Net Income and diluted net income per share to Adjusted Diluted Net Income per Share:
| Fiscal Year Ended | ||||||||||||
| (Dollar amounts in thousands) |
December 25, 2016 |
December 27, 2015 |
December 28, 2014 |
|||||||||
| Net income |
$ | 37,716 | $ | 26,526 | $ | 26,120 | ||||||
|
|
|
|
|
|
|
|||||||
| Certain professional and transaction costs(a) |
464 | 5,254 | 453 | |||||||||
| Incremental public company costs(b) |
— | (940 | ) | (2,400 | ) | |||||||
| Vesting of performance-based stock options(c) |
495 | 708 | — | |||||||||
| Payroll taxes associated with stock option exercises(d) |
124 | 28 | — | |||||||||
| Executive separation expenses(e) |
278 | 533 | — | |||||||||
| Distributor transition costs(f) |
81 | 594 | — | |||||||||
| Gain from termination of vendor contract(g) |
— | — | (1,475 | ) | ||||||||
| State income tax rate change(h) |
(908 | ) | (903 | ) | — | |||||||
| Tax impact of adjustments(i) |
(392 | ) | (673 | ) | 1,329 | |||||||
|
|
|
|
|
|
|
|||||||
| Total adjustments |
142 | 4,601 | (2,093 | ) | ||||||||
|
|
|
|
|
|
|
|||||||
| Adjusted Net Income |
$ | 37,858 | $ | 31,127 | $ | 24,027 | ||||||
|
|
|
|
|
|
|
|||||||
| Fiscal Year Ended | ||||||||||||
| December 25, 2016 |
December 27, 2015 |
December 28, 2014 |
||||||||||
| Diluted net income per share |
$ | 1.00 | $ | 0.71 | $ | 0.70 | ||||||
|
|
|
|
|
|
|
|||||||
| Certain professional and transaction costs(a) |
0.01 | 0.14 | 0.01 | |||||||||
| Incremental public company costs(b) |
— | (0.03 | ) | (0.07 | ) | |||||||
| Vesting of performance-based stock options(c) |
0.01 | 0.02 | — | |||||||||
| Payroll taxes associated with stock option exercises(d) |
— | — | — | |||||||||
| Executive separation expenses(e) |
0.01 | 0.01 | — | |||||||||
| Distributor transition costs(f) |
— | 0.02 | — | |||||||||
| Gain from termination of vendor contract(g) |
— | — | (0.04 | ) | ||||||||
| State income tax rate change(h) |
(0.02 | ) | (0.02 | ) | — | |||||||
| Tax impact of adjustments(i) |
(0.01 | ) | (0.02 | ) | 0.04 | |||||||
|
|
|
|
|
|
|
|||||||
| Total adjustments |
0.00 | 0.12 | (0.06 | ) | ||||||||
|
|
|
|
|
|
|
|||||||
| Adjusted Diluted Net Income per Share |
$ | 1.00 | $ | 0.83 | $ | 0.64 | ||||||
|
|
|
|
|
|
|
|||||||
| (a) | Includes costs associated with third-party consultants for one-time projects, public offering expenses and certain professional fees and transaction costs related to financing transactions. We could incur similar expenses in future periods if we commence additional public offerings, financing transactions or other one-time projects. |
| (b) | Reflects an estimate of recurring incremental legal, accounting, insurance and other operating and compliance costs we expect to incur as a public company in addition to actual amounts incurred. By its nature, this adjustment involves risks and uncertainties, and the actual costs incurred could be different than this adjustment. No adjustments will be made beyond the second fiscal quarter 2016 since the one-year anniversary of our IPO occurred during the thirteen weeks ended June 26, 2016. |
| (c) | Includes non-cash, stock-based compensation related to the vesting of certain performance-based stock option awards. We could incur similar expenses in future periods upon the achievement of the performance metrics indicated in the stock option grants. |
| (d) | Represents payroll taxes associated with stock option exercises related to stock options that were outstanding prior to our IPO. We expect to incur similar expenses in future periods when our directors or employees exercise stock options that were outstanding prior to our IPO. |
49
Table of Contents
Index to Financial Statements
| (e) | Represents severance and legal fees associated with a former executive’s departure from the Company. |
| (f) | Includes expenses incurred in connection with the transition to our new distributor. |
| (g) | Represents the elimination of a gain from the termination of a contract with a beverage vendor. |
| (h) | As a result of enacted reductions to the North Carolina corporate income tax rate, we adjusted our deferred income taxes during the fiscal years ended December 25, 2016 and December 27, 2015 by applying the lower rate, which resulted in a corresponding decrease to income tax expense. |
| (i) | Represents the income tax (expense) benefit associated with the adjustments in (a) through (h) that are deductible for income tax purposes. |
The following table sets forth reconciliations of net income to EBITDA and Adjusted EBITDA:
| Fiscal Year Ended | ||||||||||||
| (Dollar amounts in thousands) |
December 25, 2016 |
December 27, 2015 |
December 28, 2014 |
|||||||||
| Net income |
$ | 37,716 | $ | 26,526 | $ | 26,120 | ||||||
| Income taxes |
19,537 | 16,034 | 15,589 | |||||||||
| Interest expense, net |
7,485 | 8,307 | 9,121 | |||||||||
| Depreciation and amortization(a) |
16,389 | 15,086 | 12,818 | |||||||||
|
|
|
|
|
|
|
|||||||
| EBITDA |
81,127 | 65,953 | 63,648 | |||||||||
| Non-cash rent(b) |
1,556 | 1,642 | 1,513 | |||||||||
| Stock-based compensation(c) |
1,827 | 1,963 | 1,420 | |||||||||
| Payroll taxes associated with stock option exercises(d) |
124 | 28 | — | |||||||||
| Preopening expenses(e) |
1,407 | 1,540 | 1,358 | |||||||||
| Sponsor and board member fees and expenses(f) |
— | 166 | 1,059 | |||||||||
| Certain professional, transaction and other costs(g) |
464 | 5,254 | 805 | |||||||||
| Executive separation expenses(h) |
278 | 533 | — | |||||||||
| Distributor transition costs(i) |
81 | 594 | — | |||||||||
| Impairment and dispositions(j) |
2,025 | 1,592 | 557 | |||||||||
| Gain from termination of a vendor contract(k) |
— | — | (1,475 | ) | ||||||||
|
|
|
|
|
|
|
|||||||
| Adjusted EBITDA |
$ | 88,889 | $ | 79,265 | $ | 68,885 | ||||||
|
|
|
|
|
|
|
|||||||
| (a) | Includes amortization of deferred debt issuance costs. |
| (b) | Includes deferred rent, which represents the extent to which our rent expense has been above or below our cash rent payments, amortization of favorable (unfavorable) leases and closed store reserves for rent net of cash payments. We expect to continue to incur similar expenses in future periods as we record rent expense in accordance with GAAP, as well as continue to amortize favorable (unfavorable) leases and record closed store reserves. |
| (c) | Represents non-cash, stock-based compensation. We expect to incur similar expenses in future periods as we record stock-based compensation related to existing grants (and any potential future grants) in accordance with GAAP. |
| (d) | Represents payroll taxes associated with stock option exercises related to stock options that were outstanding prior to our IPO. We expect to incur similar expenses in future periods when our directors or employees exercise stock options that were outstanding prior to our IPO. |
| (e) | Includes expenses directly associated with the opening of company-operated restaurants and incurred prior to the opening of a company-operated restaurant. We expect to continue to incur similar expenses as we open company-operated restaurants. |
| (f) | Includes reimbursement of expenses to our sponsor prior to our IPO and compensation and expense reimbursement to members of our board prior to our IPO. |
| (g) | Includes costs associated with third-party consultants for one-time projects, public offering expenses and certain professional fees and transaction costs related to financing transactions. We could incur similar expenses in future periods if we commence additional public offerings, financing transactions or other one-time projects. |
50
Table of Contents
Index to Financial Statements
| (h) | Represents severance and legal fees associated with a former executive’s departure from the Company. |
| (i) | Includes expenses incurred in connection with the transition to our new distributor. |
| (j) | Includes loss (gain) on disposal of property and equipment, impairment and cash proceeds on disposals from disposition of property and equipment. We could continue to record impairment expense in future periods if performance of company-operated restaurants is not sufficient to recover the carrying amount of the related long-lived assets. We may incur future losses (gains) and receive cash proceeds on disposal of property and equipment associated with retirement, replacement or write-off of fixed assets. |
| (k) | Represents the elimination of a gain from the termination of a contract with a beverage vendor. |
Restaurant Contribution and Restaurant Contribution Margin
Restaurant contribution and restaurant contribution margin are neither required by, nor presented in accordance with, GAAP. Restaurant contribution is defined as company restaurant revenues less food and supplies costs, restaurant labor costs, and operating costs. Restaurant contribution margin is defined as restaurant contribution as a percentage of company restaurant revenues. Fluctuations in restaurant contribution and restaurant contribution margin can be attributed to company comparable restaurant sales growth, sales volumes of newly opened company restaurants, and changes in company food and supplies costs, restaurant labor costs and operating costs.
Restaurant contribution and restaurant contribution margin are supplemental measures of operating performance of our restaurants and our calculations thereof may not be comparable to those reported by other companies. Restaurant contribution and restaurant contribution margin have limitations as analytical tools, and should not be considered in isolation or as substitutes for analysis of our results as reported under GAAP. We believe that restaurant contribution and restaurant contribution margin are important tools for investors as they are widely-used metrics within the restaurant industry to evaluate restaurant-level productivity, efficiency and performance. We use restaurant contribution and restaurant contribution margin as key metrics to evaluate profitability and performance of our restaurants across periods and to evaluate our restaurant financial performance compared to our competitors.
The following table reconciles our restaurant contribution to the line item on the consolidated statements of operations and comprehensive income entitled “Company restaurant revenues,” which we believe is the most directly comparable GAAP measure on our consolidated statements of operations and comprehensive income.
| Fiscal Year Ended | ||||||||||||
| (Dollar amounts in thousands) |
December 25, 2016 |
December 27, 2015 |
December 28, 2014 |
|||||||||
| Company restaurant revenues |
$ | 504,664 | $ | 462,138 | $ | 406,788 | ||||||
| Food and supplies costs(1) |
(158,644 | ) | (150,563 | ) | (133,191 | ) | ||||||
| Restaurant labor costs |
(138,839 | ) | (126,380 | ) | (112,506 | ) | ||||||
| Operating costs |
(112,256 | ) | (100,916 | ) | (88,476 | ) | ||||||
|
|
|
|
|
|
|
|||||||
| Restaurant contribution(1) |
$ | 94,925 | $ | 84,279 | $ | 72,615 | ||||||
|
|
|
|
|
|
|
|||||||
| Restaurant contribution margin(1) |
18.8 | % | 18.2 | % | 17.9 | % | ||||||
| (1) | Fiscal 2014 includes a one-time reduction in food and supplies cost of approximately $1.5 million resulting from the termination of a vendor contract. |
Key Financial Definitions
Total Revenues
Our revenues are derived from two primary sources: company restaurant revenues and franchise revenues. Franchise revenues are comprised of franchise royalty revenues and, to a lesser extent, other franchise revenues which include initial and renewal franchisee fees.
51
Table of Contents
Index to Financial Statements
Food and Supplies Costs
Food and supplies costs include the direct costs associated with food, beverage and packaging of our menu items at company-operated restaurants. The components of food and supplies are variable in nature, change with sales volume, are affected by menu mix and are subject to fluctuations in commodity costs.
Restaurant Labor Costs
Restaurant labor costs, including preopening labor, consist of company-operated restaurant-level management and hourly labor costs, including salaries, wages, payroll taxes, workers’ compensation expense, benefits and bonuses paid to our company-operated restaurant-level team members. Like other cost items, we expect restaurant labor costs at our company-operated restaurants to grow due to inflation and as our company restaurant revenues grows. Factors that influence labor costs include minimum wage and employer payroll tax legislation, exempt versus non-exempt classification, a tightening labor market, employee turnover levels, health care costs and the performance of our restaurants. In addition, the PPACA has increased health care costs for our restaurants, and we expect the PPACA will continue to result in increased health care costs for our restaurants in the future.
Although the DOL regulations related to overtime and exempt versus non-exempt classification that were scheduled to become effective December 1, 2016 were enjoined, we increased the salaries of certain of our team members. Increasing the salary of these employees, along with various labor initiatives we intend to implement, including table service and employing more full-time versus part-time team members, and higher health care costs will increase our restaurant labor costs. Our restaurant labor costs could increase further if the DOL regulations related to overtime and exempt versus non-exempt classification that were scheduled to become effective December 1, 2016 ultimately go in to effect.
Operating Costs
Restaurant operating costs include all other company-operated restaurant-level operating expenses, such as repairs and maintenance, utilities, credit and debit card processing, occupancy expenses and other restaurant operating costs. In addition, our advertising costs are included in operating costs and are comprised of our company-operated restaurants’ portion of spending on all advertising which includes, but is not limited to, television, radio, social media, billboards, point-of-sale materials, sponsorships, and creation of media, such as commercials and marketing campaigns.
Company Restaurant Depreciation and Amortization
Company restaurant depreciation and amortization primarily consists of the depreciation of property and equipment and amortization of intangible assets at the restaurant level. We expect that growth in company-operated restaurant count, as well as restaurant remodels, investments in technology and other initiatives, will increase company restaurant depreciation and amortization.
General and Administrative Expenses
General and administrative expenses include expenses associated with corporate and administrative functions that support our operations, including compensation and benefits, travel expense, stock-based compensation expense, legal and professional fees, training, and other corporate costs. We expect we will incur incremental increases in general and administrative expenses as a result of being a public company.
Other Depreciation and Amortization
Other depreciation and amortization primarily consists of the depreciation of property and equipment and amortization of intangible assets not directly located at company-operated restaurants. We expect that growth in system-wide restaurant count, as well as investments in technology and other initiatives, will increase other depreciation and amortization.
52
Table of Contents
Index to Financial Statements
Impairment
Long-lived assets such as property, equipment and intangible assets are reviewed on a unit-by-unit basis for impairment. When circumstances indicate a carrying value of the assets may not be recoverable, an appropriate impairment is recorded. Impairments could increase if performance of company-operated restaurants is not sufficient to recover the carrying amount of the related long-lived assets.
Loss on Disposal of Property and Equipment
Loss on disposal of property and equipment includes the net loss on disposal of assets related to retirements and replacements or write-off of leasehold improvements, equipment and other fixed assets. These losses are related to normal disposals in the ordinary course of business and gains from insurance proceeds, if any.
Amortization of Deferred Debt Issuance Costs
Deferred debt issuance costs are amortized over the term of the related debt on the effective interest method.
Interest Expense
Interest expense primarily consists of interest on our debt outstanding under our credit facility and capital lease obligations.
Income Taxes
Income taxes represent federal, state, and local current and deferred income tax expense.
53
Table of Contents
Index to Financial Statements
Results of Operations
Fiscal Year 2016 Compared to Fiscal Year 2015
Our operating results for the fiscal years ended December 25, 2016 and December 27, 2015 are compared below:
| Fiscal Year Ended | ||||||||||||||||
| December 25, 2016 |
December 27, 2015 |
Increase/ (Decrease) |
Percentage Change |
|||||||||||||
| (Dollar amounts in thousands) | ||||||||||||||||
| Statement of Operations Data: |
||||||||||||||||
| Revenues: |
||||||||||||||||
| Company restaurant revenues |
$ | 504,664 | $ | 462,138 | $ | 42,526 | 9.2 | % | ||||||||
| Franchise royalty revenues |
26,364 | 25,104 | 1,260 | 5.0 | % | |||||||||||
| Other franchise revenues |
853 | 960 | (107 | ) | (11.1 | )% | ||||||||||
|
|
|
|
|
|
|
|||||||||||
| Total revenues |
531,881 | 488,202 | 43,679 | 8.9 | % | |||||||||||
|
|
|
|
|
|
|
|||||||||||
| Company restaurant operating expenses: |
||||||||||||||||
| Food and supplies costs |
158,644 | 150,563 | 8,081 | 5.4 | % | |||||||||||
| Restaurant labor costs |
138,839 | 126,380 | 12,459 | 9.9 | % | |||||||||||
| Operating costs |
112,256 | 100,916 | 11,340 | 11.2 | % | |||||||||||
| Depreciation and amortization |
12,709 | 11,456 | 1,253 | 10.9 | % | |||||||||||
|
|
|
|
|
|
|
|||||||||||
| Total company restaurant operating expenses |
422,448 | 389,315 | 33,133 | 8.5 | % | |||||||||||
|
|
|
|
|
|
|
|||||||||||
| Operating income before other operating expenses |
109,433 | 98,887 | 10,546 | 10.7 | % | |||||||||||
|
|
|
|
|
|
|
|||||||||||
| Other operating expenses: |
||||||||||||||||
| General and administrative |
39,041 | 42,844 | (3,803 | ) | (8.9 | )% | ||||||||||
| Depreciation and amortization |
2,917 | 2,809 | 108 | 3.8 | % | |||||||||||
| Impairment |
1,927 | 1,210 | 717 | 59.3 | % | |||||||||||
| Loss on disposal of property and equipment |
47 | 336 | (289 | ) | (86.0 | )% | ||||||||||
|
|
|
|
|
|
|
|||||||||||
| Total other operating expenses |
43,932 | 47,199 | (3,267 | ) | (6.9 | )% | ||||||||||
|
|
|
|
|
|
|
|||||||||||
| Operating income |
65,501 | 51,688 | 13,813 | 26.7 | % | |||||||||||
| Amortization of deferred debt issuance costs |
(763 | ) | (821 | ) | 58 | (7.1 | )% | |||||||||
| Interest income |
4 | 7 | (3 | ) | n/m | |||||||||||
| Interest expense |
(7,489 | ) | (8,314 | ) | 825 | (9.9 | )% | |||||||||
|
|
|
|
|
|
|
|||||||||||
| Income before income taxes |
57,253 | 42,560 | 14,693 | 34.5 | % | |||||||||||
| Income taxes |
19,537 | 16,034 | 3,503 | 21.8 | % | |||||||||||
|
|
|
|
|
|
|
|||||||||||
| Net income |
$ | 37,716 | $ | 26,526 | $ | 11,190 | 42.2 | % | ||||||||
|
|
|
|
|
|
|
|||||||||||
n/m = not meaningful
Company Restaurant Revenues
Company restaurant revenues increased $42.5 million, or 9.2%, during fiscal 2016 compared to fiscal 2015. The growth in company restaurant revenues was primarily due to an increase in the non-comparable restaurant base (net additions of 28 company-operated restaurants as of December 25, 2016 compared to December 27, 2015) accounting for $37.8 million and an increase in comparable company restaurant sales of $4.7 million, or 1.1%, composed of increases in price, offset by decreases in transactions and mix at our comparable company restaurants.
54
Table of Contents
Index to Financial Statements
Franchise Royalty Revenues
Franchise royalty revenues increased $1.3 million during fiscal 2016 compared to fiscal 2015. The increase was primarily due to an additional net 26 franchised restaurants at December 25, 2016 compared to December 27, 2015 and franchised comparable restaurant sales growth of 1.5%.
Other Franchise Revenues
Other franchise revenues decreased $0.1 million during fiscal 2016 compared to fiscal 2015. The decrease was primarily due to fewer openings of franchised restaurants during fiscal 2016 compared to fiscal 2015.
Food and Supplies Costs
Food and supplies costs increased $8.1 million during fiscal 2016 compared to fiscal 2015. This increase was primarily driven by an increase in company restaurant revenues. Food and supplies costs as a percentage of company restaurant revenues during fiscal 2016 was 31.4% versus 32.6% during fiscal 2015. This percentage decrease was primarily due to our menu price increases and lower commodity costs.
Restaurant Labor Costs
Company-operated restaurant labor increased $12.5 million during fiscal 2016 compared to fiscal 2015, primarily due to higher company restaurant revenues as a result of an increase in the number of company-operated restaurants. As a percentage of company restaurant revenues, restaurant labor costs increased to 27.5% in fiscal 2016 from 27.3% in fiscal 2015. This increase was primarily driven by an increase in direct labor, partially offset by lower medical claims and incentive compensation. Although medical claims during fiscal 2016 were below historical levels, we expect overall health care costs, which includes medical claims, will increase in future fiscal years.
We expect our restaurant labor costs will continue to increase due to the tightening labor market, as well as certain labor initiatives across company-operated restaurants, including the expansion of our table service and increasing the number of full-time versus part-time team members. In addition, we expect that our restaurant labor costs will increase as a result of increasing the salaries of certain of our team members due to the DOL regulations that were scheduled to go in to effect December 1, 2016. Our restaurant labor costs could increase further if the DOL regulations related to overtime and exempt versus non-exempt classification that were scheduled to become effective December 1, 2016 ultimately go in to effect.
Operating Costs
Operating costs increased $11.3 million during fiscal 2016 compared to fiscal 2015, primarily due to higher company restaurant revenues. As a percentage of company restaurant revenues, operating costs increased to 22.2% for fiscal 2016 from 21.8% in fiscal 2015. Operating costs as a percentage of company restaurant revenues increased primarily due to higher occupancy costs, partially offset by lower marketing costs.
Restaurant Depreciation and Amortization
Restaurant depreciation and amortization increased $1.3 million during fiscal 2016 compared to fiscal 2015, due primarily to the increased number of company-operated restaurants and the completion of the implementation of our new point-of-sale system during fiscal 2015. As a percentage of company restaurant revenues, depreciation and amortization was 2.5% during both fiscal 2016 and fiscal 2015.
General and Administrative Expenses
General and administrative expenses decreased $3.8 million during fiscal 2016 compared to fiscal 2015. The decrease was primarily due to $4.6 million in legal, accounting and other expenses directly related to public
55
Table of Contents
Index to Financial Statements
offerings incurred during fiscal 2015, $0.5 million of lower legal and other expenses incurred in connection with the transition to a new distributor, $0.5 million of lower meetings and convention expenses primarily due to our bi-annual franchise convention and unit director leadership conference occurring during fiscal 2015, $1.0 million of lower incentive compensation and $0.3 million of lower executive separation expenses, partially offset by additional positions added to support an increased number of restaurants in our system, additional costs as a result of operating as a public company and $0.4 million in legal, accounting and other expenses directly related to public offerings incurred during fiscal 2016. As a percentage of total revenues, general and administrative expenses were 7.3% and 8.8% during fiscal 2016 and fiscal 2015, respectively.
We expect our recurring general and administrative expenses will continue to increase as we grow our business and incur additional expenses related to being a newer public company.
Interest Expense
Interest expense decreased $0.8 million during fiscal 2016 compared to fiscal 2015. The decrease was due primarily to principal payments of $42.7 million on our long-term debt and a reduction in our applicable rate, partially offset by an increase in the LIBOR rate and interest expense associated with interest rate swaps.
Income Taxes
Income taxes increased $3.5 million during fiscal 2016 compared to fiscal 2015. Our effective income tax rates were 34.1% and 37.7% during fiscal 2016 and fiscal 2015, respectively. The effective income tax rate for both fiscal 2016 and fiscal 2015 was impacted by a deferred income tax benefit due to a reduction in the North Carolina corporate income tax rate and the recognition of certain tax credits. The effective income tax rate for both fiscal 2016 and fiscal 2015 was also impacted by public offering expenses that were not deductible for income tax purposes.
56
Table of Contents
Index to Financial Statements
Fiscal Year 2015 Compared to Fiscal Year 2014
Our operating results for the fiscal years ended December 27, 2015 and December 28, 2014 are compared below:
| Fiscal Year Ended | ||||||||||||||||
| December 27, 2015 |
December 28, 2014 |
Increase/ (Decrease) |
Percentage Change |
|||||||||||||
| (Dollar amounts in thousands) | ||||||||||||||||
| Statement of Operations Data: |
||||||||||||||||
| Revenues: |
||||||||||||||||
| Company restaurant revenues |
$ | 462,138 | $ | 406,788 | $ | 55,350 | 13.6 | % | ||||||||
| Franchise royalty revenues |
25,104 | 22,746 | 2,358 | 10.4 | % | |||||||||||
| Other franchise revenues |
960 | 938 | 22 | 2.3 | % | |||||||||||
|
|
|
|
|
|
|
|||||||||||
| Total revenues |
488,202 | 430,472 | 57,730 | 13.4 | % | |||||||||||
|
|
|
|
|
|
|
|||||||||||
| Company restaurant operating expenses: |
||||||||||||||||
| Food and supplies costs |
150,563 | 133,191 | 17,372 | 13.0 | % | |||||||||||
| Restaurant labor costs |
126,380 | 112,506 | 13,874 | 12.3 | % | |||||||||||
| Operating costs |
100,916 | 88,476 | 12,440 | 14.1 | % | |||||||||||
| Depreciation and amortization |
11,456 | 9,713 | 1,743 | 17.9 | % | |||||||||||
|
|
|
|
|
|
|
|||||||||||
| Total company restaurant operating expenses |
389,315 | 343,886 | 45,429 | 13.2 | % | |||||||||||
|
|
|
|
|
|
|
|||||||||||
| Operating income before other operating expenses |
98,887 | 86,586 | 12,301 | 14.2 | % | |||||||||||
|
|
|
|
|
|
|
|||||||||||
| Other operating expenses: |
||||||||||||||||
| General and administrative |
42,844 | 32,107 | 10,737 | 33.4 | % | |||||||||||
| Depreciation and amortization |
2,809 | 2,372 | 437 | 18.4 | % | |||||||||||
| Impairment |
1,210 | 484 | 726 | 150.0 | % | |||||||||||
| Loss on disposal of property and equipment |
336 | 60 | 276 | 460.0 | % | |||||||||||
|
|
|
|
|
|
|
|||||||||||
| Total other operating expenses |
47,199 | 35,023 | 12,176 | 34.8 | % | |||||||||||
|
|
|
|
|
|
|
|||||||||||
| Operating income |
51,688 | 51,563 | 125 | 0.2 | % | |||||||||||
| Amortization of deferred debt issuance costs |
(821 | ) | (733 | ) | (88 | ) | 12.0 | % | ||||||||
| Interest income |
7 | 2 | 5 | n/m | ||||||||||||
| Interest expense |
(8,314 | ) | (9,123 | ) | 809 | (8.9 | )% | |||||||||
|
|
|
|
|
|
|
|||||||||||
| Income before income taxes |
42,560 | 41,709 | 851 | 2.0 | % | |||||||||||
| Income taxes |
16,034 | 15,589 | 445 | 2.9 | % | |||||||||||
|
|
|
|
|
|
|
|||||||||||
| Net income |
$ | 26,526 | $ | 26,120 | $ | 406 | 1.6 | % | ||||||||
|
|
|
|
|
|
|
|||||||||||
n/m = not meaningful
Company Restaurant Revenues
Company restaurant revenues increased $55.4 million, or 13.6%, during fiscal 2015 compared to fiscal 2014. The growth in company restaurant revenues was primarily due to an increase in comparable company restaurant sales of $14.1 million, or 3.6%, composed of increases in price and mix at our comparable company restaurants, and an increase in the non-comparable restaurant base (net additions of 27 company-operated restaurants as of December 27, 2015 compared to December 28, 2014) accounting for $41.3 million.
Franchise Royalty Revenues
Franchise royalty revenues increased $2.4 million during fiscal 2015 compared to fiscal 2014. The increase was primarily due to an additional net 13 franchised restaurants at December 27, 2015 compared to December 28, 2014 and franchised comparable restaurant sales growth of 4.4%.
57
Table of Contents
Index to Financial Statements
Food and Supplies Costs
Food and supplies costs increased $17.4 million during fiscal 2015 compared to fiscal 2014. This increase was primarily driven by an increase in company restaurant revenues and a $1.5 million gain associated with the termination of a beverage vendor contract during fiscal 2014, which was recorded as a reduction to food and supplies costs. Excluding the impact of the $1.5 million gain associated with the termination of a beverage vendor contract, food and supplies costs as a percentage of company restaurant revenues during fiscal 2014 was 33.1% versus 32.6% during fiscal 2015. This percentage decrease was primarily due to our menu price increases, partially offset by commodity price increases.
Restaurant Labor Costs
Company-operated restaurant labor increased $13.9 million during fiscal 2015 compared to fiscal 2014, primarily due to higher company restaurant revenues and increased health care costs. As a percentage of company restaurant revenues, restaurant labor costs decreased to 27.3% in fiscal 2015 from 27.7% in fiscal 2014. This decrease was primarily driven by an increase in comparable company restaurant sales which resulted in leveraging certain fixed labor expenses and a reduction in payroll taxes, partially offset by an increase in health care costs related to enrollment from the PPACA and higher medical claims.
Operating Costs
Operating costs increased $12.4 million during fiscal 2015 compared to fiscal 2014, primarily due to higher company restaurant revenues. As a percentage of company restaurant revenues, operating costs increased to 21.8% for fiscal 2015 from 21.7% in fiscal 2014. This increase was primarily attributable to an increase in marketing and occupancy costs, partially offset by leveraging comparable restaurant sales growth.
Restaurant Depreciation and Amortization
Restaurant depreciation and amortization increased $1.7 million during fiscal 2015 compared to fiscal 2014, due primarily to the increased number of company-operated restaurants and our new point-of–sale system. As a percentage of company restaurant revenues, depreciation and amortization was 2.5% and 2.4% during fiscal 2015 and fiscal 2014, respectively.
General and Administrative Expenses
General and administrative expenses increased $10.7 million during fiscal 2015 compared to fiscal 2014. The increase is due primarily to $4.6 million in legal, accounting and other expenses directly related to public offerings, $0.7 million of stock-based compensation expense as a result of the vesting of certain performance awards, $0.6 million of legal and other expenses incurred in connection with the transition to a new distributor, a $0.5 million accrual pursuant to an employment agreement, additional positions added to support an increased number of restaurants in our system, and additional costs as a result of operating as a public company. As a percentage of total revenues, general and administrative expenses were 8.8% and 7.5% during fiscal 2015 and fiscal 2014, respectively.
We expect our recurring general and administrative expenses will continue to increase as we grow our business and incur additional expenses related to being a newer public company.
Interest Expense
Interest expense decreased $0.8 million during fiscal 2015 compared to fiscal 2014. The decrease was due primarily to principal payments of $28.1 million on our long-term debt and a reduction in our applicable rate, partially offset by an increase in capital lease obligations during fiscal 2015.
58
Table of Contents
Index to Financial Statements
Income Taxes
Income taxes increased $0.4 million during fiscal 2015 compared to fiscal 2014. Our effective income tax rates were 37.7% and 37.4% during fiscal 2015 and fiscal 2014, respectively. The increase was primarily due to expenses incurred related to the IPO for which we will not receive a tax deduction, which was partially offset by the recognition of certain tax credits and a reduction in the North Carolina corporate income tax rate.
Liquidity and Capital Resources
Our primary requirements for liquidity and capital are new company-operated restaurants, existing restaurant capital investments (remodels and maintenance), information technology investments, principal and interest payments on our term debt and capital lease obligations, operating lease obligations and working capital and general corporate needs. Our customers pay primarily for their purchases in cash or by payment card (credit or debit) at the time of sale. Therefore, we are able to sell many of our inventory items before we have to pay our suppliers for such items. Our restaurants do not require significant inventories or receivables. We do have accounts receivable from our franchisees primarily related to royalty revenues, as well as from certain vendors.
Our growth plan is dependent upon many factors, including economic conditions, real estate markets, restaurant locations and the nature of our lease agreements. Our capital expenditure outlays are also dependent on costs for maintenance in our existing restaurants as well as information technology and other general corporate expenditures. We primarily utilize build-to-suit developments and equipment financing leases for our new company-operated restaurants, requiring minimal upfront cash investment. While we currently utilize a build-to-suit development strategy, our new restaurant strategy may change over time.
We currently expect our cash capital expenditures for fiscal 2017 will range between $17.5 million and $18.0 million excluding approximately $1.6 million to $1.7 million of restaurant preopening costs for restaurants that are not capitalized. These capital estimates are based on restaurant capital expenditures for the opening of 27 to 28 company-operated restaurants as well as investments to remodel and improve our existing restaurants, investments in technology and for general corporate purposes.
We believe that cash and cash equivalents and expected cash flow from operations are adequate to fund debt service requirements, capital lease obligations, operating lease obligations, capital expenditures and working capital needs for at least the next 12 months. However, our ability to continue to meet these requirements and obligations will depend on, among other things, our ability to achieve anticipated levels of revenues and cash flow from operations, our ability to manage costs and working capital successfully and the continued availability of build-to-suit and equipment financing leases for our new company-operated restaurants. We have used excess cash flows to make payments on our outstanding long-term debt in advance of the required due date, and we may continue to do so in future periods.
The following table presents summary cash flow information for the periods indicated (in thousands):
| Fiscal Year Ended | ||||||||||||
| December 25, 2016 |
December 27, 2015 |
December 28, 2014 |
||||||||||
| Net cash provided by (used in): |
||||||||||||
| Operating activities |
$ | 54,300 | $ | 45,526 | $ | 41,643 | ||||||
| Investing activities |
(9,744 | ) | (12,186 | ) | (10,669 | ) | ||||||
| Financing activities |
(44,921 | ) | (32,278 | ) | (26,229 | ) | ||||||
|
|
|
|
|
|
|
|||||||
| Net (decrease) increase in cash |
$ | (365 | ) | $ | 1,062 | $ | 4,745 | |||||
|
|
|
|
|
|
|
|||||||
Operating Activities
Net cash provided by operating activities increased from $45.5 million during the fiscal year ended December 27, 2015 to $54.3 million during the fiscal year ended December 25, 2016. The increase was primarily attributable to
59
Table of Contents
Index to Financial Statements
an increase in cash generated from our operations due to the net increase in company-operated restaurants, an increase in franchise royalty revenues and an increase in comparable restaurant sales, as well as the costs associated with our IPO incurred during fiscal 2015.
Net cash provided by operating activities increased from $41.6 million during the fiscal year ended December 28, 2014 to $45.5 million during the fiscal year ended December 27, 2015. The increase was primarily attributable to an increase in cash generated from our operations due to the net increase in company-operated restaurants, franchise royalty revenues and an increase in comparable restaurant sales, partially offset by the costs associated with our IPO.
Investing Activities
Net cash used in investing activities decreased from $12.2 million during the fiscal year ended December 27, 2015 to $9.7 million during the fiscal year ended December 25, 2016. The decrease was primarily attributable to a reduction in purchases of property and equipment.
Net cash used in investing activities increased from $10.7 million during the fiscal year ended December 28, 2014 to $12.2 million during the fiscal year ended December 27, 2015. The increase was primarily attributable to an increase in purchases of property and equipment of $4.6 million, partially offset by a $3.0 million decrease in the purchase of a franchisee’s assets.
Financing Activities
Net cash used in financing activities increased from $32.3 million during the fiscal year ended December 27, 2015 to $44.9 million during the fiscal year ended December 25, 2016. This increase was primarily due to $14.7 million and $1.4 million of higher principal payments on long-term debt and capital lease obligations, respectively, partially offset by a $0.9 million increase in proceeds received from the exercises of stock options and a $2.0 million increase in the associated excess tax benefit, as well as $0.6 million of debt issuance costs incurred during fiscal 2015.
Net cash used in financing activities increased from $26.2 million during the fiscal year ended December 28, 2014 to $32.3 million during the fiscal year ended December 27, 2015. This increase was primarily due to a $6.7 million increase in principal payments on long-term debt and a $0.7 million increase in principal payments on capital lease obligations, partially offset by a $0.6 million increase in excess tax benefit from stock-based compensation and $0.3 million of proceeds from stock option exercises.
Debt and Other Obligations
Credit Agreement
On October 9, 2012, we entered into a credit agreement (“Credit Agreement”) with several financial institutions. The Credit Agreement is secured by substantially all of our assets and originally provided for borrowings under a term loan of $175.0 million, and a revolving credit facility of $25.0 million, with a maturity date of October 9, 2017. In May 2013, we amended the Credit Agreement to provide for an additional $50.0 million term loan, the proceeds of which were used to fund a distribution to the holders of our Series A preferred stock. In April 2014, we further amended the Credit Agreement to provide for an additional $50.0 million term loan, the proceeds of which were also used to fund a distribution to the holders of our Series A preferred stock, and to extend the maturity date to October 9, 2018. On July 23, 2015, we amended the credit agreement in order to permit the merger of BHI Intermediate Holding Corp., our former wholly owned subsidiary into us. On September 25, 2015, we further amended the credit agreement to, among other things, extend the maturity date on the Credit Agreement to October 9, 2020 and lower the applicable interest rate. On October 19, 2016, we further amended the Credit Agreement to, among other things, increase allowable indebtedness associated with capital lease
60
Table of Contents
Index to Financial Statements
obligations, synthetic lease obligations and purchase money obligations, as well as to increase allowable cash capital expenditures during each fiscal year. We had $157.5 million of outstanding term loans and no outstanding borrowings under our revolving credit facility as of December 25, 2016.
Borrowings under the Credit Agreement are allowed under base rate and Eurodollar rate loans. Base rate loans bear interest at the higher of (1) the Bank of America prime rate, (2) the Federal Funds Rate plus 0.50%, or (3) the LIBOR rate for one-month loans plus 1.00% and an applicable rate. Eurodollar rate loans may be entered or converted into one-, two-, three-, or six-month periods and are charged interest at the LIBOR rate on the effective date for the period selected, plus an applicable rate. As of December 25, 2016, all of our outstanding term loan debt was in one-month Eurodollar loans with an interest rate of approximately 2.61%.
Debt Covenants
Our Credit Agreement contains various covenants that, among other things, do not allow us to exceed a maximum consolidated total lease adjusted leverage ratio, requires us to maintain a minimum consolidated fixed charge coverage ratio, and place certain limitations on cash capital expenditures and our ability to pay dividends. We were in compliance with all of the covenants under our Credit Agreement as of December 25, 2016.
Hedging Arrangements
In connection with our Credit Agreement, we have three variable-to-fixed interest rate swap agreements to manage fluctuations in cash flows resulting from changes in the benchmark interest rate of LIBOR as of December 25, 2016. On May 17, 2013, we entered into an interest rate swap contract with an effective date of November 30, 2015 a termination date of September 29, 2017 and a notional amount of $50.0 million, under which we pay a fixed interest rate of 1.3325% and receive the one-month LIBOR rate. Also on May 17, 2013, we entered into a second interest rate swap contract with an effective date of May 31, 2013, a termination date of May 31, 2017 and a notional amount of $25.0 million, under which we pay interest fixed at 0.70125% and receive the one-month LIBOR rate. On October 26, 2015, we entered into a third interest rate swap contract with an effective date of October 30, 2015, a termination date of October 31, 2019 and a notional amount of $50.0 million, under which we pay interest fixed at 1.115% and receive the one-month LIBOR rate.
Contractual Obligations
The table below summarizes our contractual commitments to make future payments pursuant to our long-term debt and other obligations including operating lease obligations, capital lease obligations, marketing commitments, purchase obligations and financing obligations under build-to-suit leases outstanding as of December 25, 2016, our most recent fiscal year-end for which a balance sheet is presented. The table does not include any new transactions after the fiscal year ended December 25, 2016 including, but not limited to, new operating and capital leases, new marketing commitments and new financing obligations under build-to-suit leases:
| (Amounts in thousands) |
Total | Less than 1 year |
1-3 years | 3-5 years | More than 5 years |
|||||||||||||||
| Long-term debt |
$ | 157,458 | $ | 2,132 | $ | 15,861 | $ | 139,465 | $ | — | ||||||||||
| Interest on long-term debt(1) |
16,505 | 5,198 | 8,140 | 3,167 | — | |||||||||||||||
| Operating leases |
384,377 | 39,611 | 75,856 | 70,685 | 198,225 | |||||||||||||||
| Capital leases |
34,527 | 8,832 | 14,625 | 7,096 | 3,974 | |||||||||||||||
| Marketing commitments(2) |
9,029 | 3,517 | 4,619 | 893 | — | |||||||||||||||
| Purchase obligations(3) |
715 | 217 | 477 | 21 | — | |||||||||||||||
| Financing obligations under build-to-suit leases |
4,114 | 4,114 | — | — | — | |||||||||||||||
|
|
|
|
|
|
|
|
|
|
|
|||||||||||
| Total |
$ | 606,725 | $ | 63,621 | $ | 119,578 | $ | 221,327 | $ | 202,199 | ||||||||||
|
|
|
|
|
|
|
|
|
|
|
|||||||||||
61
Table of Contents
Index to Financial Statements
| (1) | Includes estimated interest payments calculated based on current interest rates as of December 25, 2016. Interest includes interest and fees under our credit facility and our interest rate swaps. |
| (2) | Includes commitments for various marketing sponsorships and expenses. |
| (3) | During fiscal 2016, we entered into an unconditional purchase obligation related to equipment for use in our restaurants. The expected timing of payments of the purchase obligations above is estimated based on current information. |
Off-Balance Sheet Arrangements
We have guaranteed through 2018 debt from a previous credit facility which was assumed by a franchisee. We may be required to perform this guarantee in the event of default or nonperformance of this franchisee. We have determined that default by the franchisee is unlikely due to timely and consistent payments, and have therefore not recorded a liability for the debt assumed by this franchisee on our consolidated balance sheets. The carrying value of debt covered by this additional guarantee by us was approximately $0.1 million at both December 25, 2016 and December 27, 2015, respectively.
Emerging Growth Company
We are an “emerging growth company,” as defined in Section 2(a) of the Securities Act, as modified by the Jumpstart our Business Startups Act of 2012, or the JOBS Act (the “JOBS Act”). As such, we are eligible to take advantage of certain exemptions from various reporting requirements that are applicable to other public companies that are not “emerging growth companies,” including, but not limited to, not being required to comply with the auditor attestation requirements of Section 404(b) of the Sarbanes-Oxley Act, reduced disclosure obligations regarding executive compensation in our periodic reports and proxy statements, and exemptions from the requirements of holding a non-binding advisory vote on executive compensation and of stockholder approval of any golden parachute payments not previously approved.
In addition, Section 107 of the JOBS Act provides that an “emerging growth company” can take advantage of the extended transition period provided in Section 7(a)(2)(B) of the Securities Act for complying with new or revised accounting standards. In other words, an “emerging growth company” can delay the adoption of certain accounting standards until those standards would otherwise apply to private companies. We have irrevocably elected not to avail ourselves of this exemption and, therefore, we will be subject to the same new or revised accounting standards as other public companies that are not emerging growth companies.
We could remain an “emerging growth company” until December 27, 2020 or until the earliest of (a) the last day of the first fiscal year in which our annual gross revenues exceed $1 billion, (b) the date that we become a “large accelerated filer” as defined in Rule 12b-2 under the Exchange Act, which would occur if the market value of our common stock that is held by non-affiliates exceeds $700 million as of the last business day of our most recently completed second fiscal quarter, or (c) the date on which we have issued more than $1 billion in non-convertible debt securities in the preceding three-year period.
New Accounting Standards
In May 2014, the FASB issued ASU No. 2014-09, Revenue from Contracts with Customers (“ASU 2014-09”). This update was issued to replace the current revenue recognition guidance, creating a more comprehensive revenue model. This update was originally to be effective in fiscal periods beginning after December 15, 2016 and early application was not permitted. In July 2015, the FASB affirmed its proposal to defer the effective date by one year to annual reporting periods beginning after December 15, 2017. The FASB also affirmed its proposal to permit early adoption of the standard, but not before the original effective date of December 15, 2016. We will not early adopt ASU 2014-09. ASU 2014-09 permits two transition approaches: retrospective or modified retrospective. We are still evaluating our transition approach and expect to reach a decision in the first half of fiscal 2017. We have completed a preliminary review of ASU 2014-09 and do not expect the adoption of ASU
62
Table of Contents
Index to Financial Statements
2014-09 to have a material impact on our company restaurant revenues or franchise royalty revenues. We expect the adoption of ASU 2014-09 will require us to recognize initial and renewal franchisee fees on a straight-line basis over the life of the franchise agreement, which will impact our other franchise revenues. In addition, we anticipate funds contributed by franchisees to the advertising funds we manage, as well as the associated advertising fund expenditures, will be reported on a gross basis, and the advertising fund revenues and expenses may be reported in different periods.
In July 2015, the FASB issued ASU 2015-11, Inventory (Topic 330) (“ASU 2015-11”). The pronouncement was issued to simplify the measurement of inventory and changes the measurement from lower of cost or market to lower of cost and net realizable value. This pronouncement is effective for reporting periods beginning after December 15, 2016. The adoption of ASU 2015-11 is not expected to have a significant impact on our consolidated financial statements.
In February 2016, the FASB issued ASU 2016-02, Leases (Topic 842) (“ASU 2016-02”), which requires lessees to recognize leases on-balance sheet and disclose key information about leasing arrangements. ASU 2016-02 establishes a right-of-use model (“ROU”) that requires a lessee to recognize a ROU asset and corresponding lease liability on the balance sheet for all leases with a term longer than twelve months. Leases will be classified as finance or operating, with classification affecting the pattern and classification of expense recognition in the statement of operations. ASU 2016-02 is effective for annual periods beginning after December 15, 2018, including interim periods within those fiscal years, with early adoption permitted. We expect to adopt ASU 2016-02 on December 31, 2018, which is the first day of our fiscal 2019. A modified retrospective transition is required for leases existing at, or entered into after, the beginning of the earliest comparative period presented in the financial statements, with certain practical expedients available. We expect that ASU 2016-02 will have a material effect on our financial statements. While we are continuing to assess the impact of adoption, we currently believe the most significant changes relate to (1) the recognition of new ROU assets and lease liabilities on our balance sheet for real estate and equipment operating leases and (2) the derecognition of existing assets and liabilities for certain assets under construction in build-to-suit lease arrangements that we will lease when construction is complete.
In March 2016, the FASB issued ASU 2016-09, Improvements to Employee Share-Based Payment Accounting (“ASU 2016-09”), which simplifies several aspects of the accounting for employee share-based payment transactions. ASU 2016-09 addresses several aspects of the accounting for share-based payment award transactions, including: (a) income tax consequences; (b) classification of awards as either equity or liabilities; and (c) classification on the statement of cash flows. ASU 2016-09 is effective for fiscal years beginning after December 15, 2016, including interim periods within those fiscal years. Early adoption is permitted. We will adopt ASU 2016-09 prospectively during the first fiscal quarter of 2017. We believe the adoption of ASU 2016-09 will cause volatility in our effective tax rates and diluted net income per share due to the tax effects related to share-based payments being recorded to the consolidated statement of operations and comprehensive income. The volatility in future periods will depend on our stock price on the date awards are exercised or vest and the number of awards that are exercised or vest in each period. In addition, we believe the adoption of ASU 2016-09 will result in an increase in the weighted average number of common shares outstanding used for computing diluted net income per share as tax effects related to share-based payments will no longer be considered assumed proceeds when calculating dilutive potential common shares using the treasury-stock method.
The FASB has recently issued or discussed a number of proposed standards on such topics as consolidation, financial statement presentation, financial instruments and hedging. Some of the proposed changes are significant and could have a material impact on our reporting. We have not yet fully evaluated the potential impact of all these proposals, but will make such an evaluation as the standards are finalized.
63
Table of Contents
Index to Financial Statements
Critical Accounting Policies and Use of Estimates
Our discussion and analysis of operating results and financial condition are based upon our financial statements. The preparation of our financial statements in accordance with GAAP requires us to make estimates and assumptions that affect the reported amounts of assets, liabilities, revenues, expenses and related disclosures of contingent assets and liabilities. We base our estimates on past experience and other assumptions that we believe are reasonable under the circumstances, and we evaluate these estimates on an ongoing basis.
Accounting policies are an integral part of our financial statements. A thorough understanding of these accounting policies is essential when reviewing our reported results of operations and our financial position. Management believes that the critical accounting policies and estimates discussed below involve the most difficult management judgments due to the sensitivity of the methods and assumptions used. See Note 1 to the consolidated financial statements included in Part II, Item 8 for more information about our significant accounting policies.
Franchise Fee and Royalty Accounting
We grant franchises to individual restaurant operators in exchange for initial franchise license fees and continuing royalty payments. We account for initial franchisee fees in accordance with FASB ASC 952, Franchisors. Franchise license fees are deferred when received and recognized as revenues when substantial performance of all franchisor obligations have been achieved or the franchise development agreement is terminated. The commencement of operations by the franchisee indicates substantial performance has occurred. If substantial performance of our obligations has not been completed, revenues are not recognized and the amount received is deferred until all material services or conditions have been satisfied by us or the franchise development agreement is terminated. Continuing franchise royalty revenues are recognized on the accrual basis and are based on a percentage of monthly sales, generally ranging from 3% to 4% for franchisees operating within the United States of America, and 5% for franchisees with operations in other countries.
Allowance for Doubtful Accounts
We maintain allowances, which management believes are adequate to absorb estimated losses to be incurred in realizing the recorded amounts of its accounts receivable. These allowances are determined by management based primarily on an analysis of collectability of individual accounts and historical trends.
Goodwill and Intangible Assets Not Subject to Amortization
The excess of the purchase price over the estimated fair value of the net assets acquired, including identified intangibles in a business combination is recorded as goodwill. In addition to goodwill, our indefinite-lived intangible asset consists of the Bojangles’ brand. We do not amortize our goodwill and brand. We perform an impairment test for goodwill and our brand annually as of December 1 and when a triggering event occurs or change in circumstances indicates that impairment might exist. Such events or circumstances may be a significant change in business climate, economic and industry trends, legal factors, negative operating performance indicators, significant competition, changes in strategy or disposition.
Our impairment review for goodwill consists of a qualitative assessment of whether it is more-likely-than-not that the fair value is less than its carrying amount, and if required, followed by a two-step process of determining the fair value and comparing it to the carrying value of the net assets. If the qualitative assessment demonstrates that it is more-likely-than-not that the estimated fair value exceeds its carrying value, it is not necessary to perform the two-step goodwill impairment test. We may elect to bypass the qualitative assessment and proceed directly to the two-step process in any period. We can resume the qualitative assessment in any subsequent period. When performing the two-step process, if the fair value exceeds its carrying value, no further analysis or write-down of goodwill is required. If the fair value is less than the carrying value of its net assets, the estimated
64
Table of Contents
Index to Financial Statements
fair value is allocated to all its underlying assets and liabilities, including both recognized and unrecognized tangible and intangible assets, based on their fair value. If necessary, goodwill is then written down to its implied fair value. Our impairment review for our brand consists of a qualitative assessment similar to goodwill and, if necessary, a comparison of the fair value of our brand with its carrying amount. If the carrying amount exceeds its fair value, an impairment loss is recognized in an amount equal to that excess. If the fair value exceeds its carrying amount, our brand is not considered impaired.
The estimated fair value is the amount for which the business could be sold in market. We estimate the fair value using a combination of market earnings multiples and discounted cash flow methodologies. This requires significant judgments including estimation of future cash flows, which is dependent on internal forecasts, estimation of the long-term rate of growth of our business, the useful life over which cash flows will occur and determination of our weighted average cost of capital. Changes in these estimates and assumptions could materially affect the determination of fair value and/or goodwill impairment.
We determined the fair value of our goodwill and the fair value of our brand and both were substantially in excess of their respective carrying values when we performed our annual goodwill and brand impairment tests as of December 1, 2016. As such, we have determined that no impairment to our goodwill or our brand occurred during the fiscal years ended December 25, 2016, December 27, 2015 and December 28, 2014.
Long-Lived Assets
We state the value of our long-lived assets at cost, minus accumulated depreciation and amortization. We calculate depreciation using the straight-line method over the estimated useful lives of the related assets. We amortize our leasehold improvements using the straight-line method over the shorter of the lease term (including reasonably assured renewal periods) or the estimated useful lives of the related assets. We expense repairs and maintenance as incurred, but capitalize major improvements and betterments.
Long-lived assets, such as property and equipment, and purchased intangible assets subject to amortization, are reviewed for impairment whenever events or changes in circumstances indicate that the carrying amount of an asset may not be recoverable. If circumstances require a long-lived asset or asset group to be tested for possible impairment, we first compare undiscounted cash flows expected to be generated by that asset or asset group to its carrying value. If the carrying value of a long-lived asset or asset group is not recoverable on an undiscounted cash flow basis, an impairment loss is recognized to the extent that the carrying value exceeds its fair value. Fair value is determined through various valuation techniques including discounted cash flow models, quoted market values and third-party independent appraisals, as considered necessary.
Some of the events or changes in circumstances that would trigger an impairment test include, but are not limited to:
| • | bankruptcy proceedings or other significant financial distress; |
| • | significant negative industry or economic trends; |
| • | knowledge of transactions involving the sale of similar property at amounts below our carrying value; or |
| • | our expectation to dispose of long-lived assets before the end of their estimated useful lives, even though the assets do not meet the criteria to be classified as “held for sale.” |
We recorded impairment charges of $1.9 million, $1.2 million and $0.5 million due to underperforming restaurants during the fiscal years ended December 25, 2016, December 27, 2015 and December 28, 2014, respectively. The impaired assets had no value at December 25, 2016.
65
Table of Contents
Index to Financial Statements
Leases
We lease restaurant land and buildings, certain restaurant, office and computer equipment, office space and vehicles under operating and capital leases. Accounting for leased properties requires compliance with technical accounting rules and significant judgment by management. Application of these accounting rules and assumptions made by management will determine whether we are considered the owner for accounting purposes or whether the lease is accounted for as an operating lease or as a capital lease.
The lease term for all types of leases begins on the date we become legally obligated for the rent payments or we take possession of the building or land, whichever is earlier.
Additionally, we review leases for which we are involved in construction to determine whether build-to-suit and sale-leaseback criteria are met. For those leases that trigger specific build-to-suit accounting, we are considered the accounting owner of the construction project and in such cases, developer’s construction costs are capitalized, including the value of costs incurred up to the date we execute our lease and costs incurred during the remainder of the construction period, as such costs are incurred. During the construction period an offsetting liability is recognized as a financing lease obligation for the construction costs incurred by the developer. The construction period begins when we execute our lease agreement with the property owner and continues until the space is substantially complete and ready for its intended use.
Once construction is complete, we are required to perform a sale-leaseback analysis to determine if we can remove the developer’s assets and associated financing obligations from the balance sheet. If, in such cases, we maintain any form of “continuing involvement” in the property, it would preclude us from derecognizing the asset and associated financing obligations following the completion of construction. In those cases, we will continue to account for the asset as if we are the legal owner, and the financing obligation similar to other debt, until the lease expires or is modified to remove the continuing involvement that prohibits derecognition. If there is no “continuing involvement” and derecognition is permitted, we would be required to account for the lease as either operating or capital.
Rent expense for operating leases that contain scheduled rent increases is recognized on a straight line basis over the term of the respective lease. Favorable and unfavorable operating leases are recorded in connection with the acquisition method of accounting. We amortize favorable and unfavorable leases on a straight line basis over the remaining term of the leases. Upon early termination of a lease, the write-off of the favorable or unfavorable lease carrying value associated with the lease is recognized as a loss or gain in the consolidated statements of operations and comprehensive income.
Certain leases contain rent escalation clauses based on escalation terms. The excess of cumulative rent expense over cumulative rent payments made on leases with fixed escalation terms is recognized as deferred rents within other noncurrent liabilities in the accompanying balance sheets. Contingent rentals are generally based on sales levels in excess of stipulated amounts, and thus are not considered minimum lease payments at lease inception. We recognize contingent rent expense when it is deemed probable.
If the lease is classified as a capital lease, we record the present value of the minimum lease payments and a related capital lease obligation on our consolidated balance sheet. The asset is then amortized over the lesser of the economic life of the asset or the lease term. Rent payments for these properties are not recorded as rent expense, but rather are recognized as a reduction of the capital lease obligation and as interest expense.
Stock-Based Compensation
We record the stock-based awards on the fair value of the shares at the date of grant, net of estimated forfeitures. In order to calculate our stock options’ fair values and the associated compensation costs for share-based awards, we utilize the Black- Scholes-Merton option pricing model, and we have developed estimates of various inputs
66
Table of Contents
Index to Financial Statements
including expected term, expected volatility and risk-free interest rate. These assumptions generally require significant judgment. The forfeiture rate is based on historical rates and reduces the compensation expense recognized. The expected term for options granted is derived using the “simplified” method, in accordance with SEC guidance. Expected volatility is estimated using publicly-traded peer companies in our market category. Volatility is calculated with reference to the historical daily closing equity prices of our peer companies, prior to the grant date, over a period equal to the expected term. We calculate the risk-free interest rate using the implied yield for a U.S. Treasury security with constant maturity and a remaining term equal to the expected term of our employee stock options. We do not anticipate paying any cash dividends for the foreseeable future and therefore use an expected dividend yield of zero for option valuation purposes.
There were no stock options granted during the fiscal year ended December 27, 2015. The assumptions used for grants made during the fiscal years ended December 25, 2016 and December 28, 2014 are provided in the following table:
| Fiscal Year Ended | ||||||||
| December 25, 2016 |
December 28, 2014 |
|||||||
| Valuation assumptions: |
||||||||
| Expected dividend yield |
0% | 0% | ||||||
| Expected volatility |
27.73% | 32.00% to 34.90% | ||||||
| Expected term |
6.25 years | 5.75 to 6.49 years | ||||||
| Risk-free interest rate |
1.41% | 1.72% to 1.98% | ||||||
If in the future we determine that another method is more reasonable, or if another method for calculating these input assumptions is prescribed by authoritative guidance, and, therefore, should be used to estimate volatility or expected life, the fair value calculated for our stock options could change significantly. Higher volatility and longer expected lives result in an increase in stock-based compensation expense determined at the date of grant. Stock-based compensation expense affects our general and administrative expenses.
Prior to our IPO, it was necessary to estimate the fair value of the common stock underlying our equity awards when computing fair value calculations under the Black-Scholes-Merton option pricing model. The fair value of our common stock was assessed on each grant date by our board of directors. Given the absence of an active market for our common stock, our board of directors estimated our common stock’s fair value based on an analysis of a number of objective and subjective factors that they believed that market participants would consider in valuing it, including the following:
| • | financial metrics, including, but not limited to, our results of operations; |
| • | the valuation of our common stock by an unrelated third-party valuation firm for all stock options awarded in fiscal 2014; |
| • | the hiring of key personnel; |
| • | the fact that the option grants involved illiquid securities in a private company; |
| • | the risks inherent in the development and expansion of our food and services; and |
| • | the likelihood of achieving a liquidity event, such as an initial public offering or sale of our company, given prevailing market conditions. |
Before our IPO, we historically granted stock options with exercise prices not less than the fair value of our common stock underlying such stock options, as determined on the date of grant by our board of directors, with input from our management and from an independent third-party valuation expert for stock options awarded in fiscal 2014 only.
67
Table of Contents
Index to Financial Statements
We granted 151,000, 0 and 1,155,022 stock options to employees, officers and board members during the fiscal years ended December 25, 2016, December 27, 2015 and December 28, 2014, respectively. Stock option holders forfeited 200,709, 6,732 and 408,047 stock options during the fiscal years ended December 25, 2016, December 27, 2015 and December 28, 2014, respectively. Stock-based compensation expense of approximately $1.8 million, $2.0 million and $1.4 million for the fiscal years ended December 25, 2016, December 27, 2015 and December 28, 2014, respectively, is included in general and administrative expenses in the consolidated statements of operations and comprehensive income.
Fair Value Measurements
Fair value is the price the company would receive to sell an asset or pay to transfer a liability (exit price) in an orderly transaction between market participants. For those assets and liabilities recorded or disclosed at fair value, we determine fair value based upon the quoted market price, if available. If a quoted market price is not available for identical assets or liabilities, we determine fair value based upon the quoted market price of similar assets or liabilities or the present value of expected future cash flows considering the risks involved, including counterparty performance risk, if appropriate, and using discount rates appropriate for the duration. The fair values are assigned a level within the fair value hierarchy depending on the source of the inputs into the calculation.
Level 1 - Inputs based upon quoted prices in active markets for identical assets or liabilities.
Level 2 - Inputs other than quoted prices included within Level 1 that are observable for the asset or liability, either directly or indirectly.
Level 3 - Inputs that are unobservable for the asset or liability.
Derivative Instruments and Hedging Activities
We use interest-rate-related derivative instruments to manage our exposure related to changes in interest rates on our variable-rate debt instruments. We do not enter into derivative instruments for any purpose other than cash flow hedging. For all hedging relationships, we formally document the hedging relationship and risk-management objective and strategy for undertaking the hedge, the hedging instrument, the hedged transaction, the nature of the risk being hedged, how the hedging instrument’s effectiveness in offsetting the hedged risk will be assessed prospectively and retrospectively, and a description of the method used to measure ineffectiveness. We also formally assess, both at the inception of the hedging relationship and on an ongoing basis, whether the derivatives that are used in hedging relationships are highly effective in offsetting changes in cash flows of the hedged transactions.
We recognize all derivative instruments as either assets or liabilities in the consolidated balance sheets at their fair values. The fair value of interest rate swaps is determined using an income approach using the following significant inputs: the term of the swaps, the notional amount of the swaps, and the rate on the fixed leg of the swaps.
For derivative instruments designated in a cash flow hedging relationship, the effective portion of the gain or loss on the derivative is reported as a component of other comprehensive income (loss) and reclassified into earnings in the same period or periods during which the hedged transaction affects earnings. Gains and losses on the derivative representing either hedge ineffectiveness or hedge components excluded from the assessment of effectiveness are recognized in current earnings.
We discontinue hedge accounting prospectively when we determine that the derivative is no longer effective in offsetting cash flows attributable to the hedged risk, the derivative expires or is sold, terminated, or exercised, the cash flow hedge is de-designated because a forecasted transaction is not probable of occurring, or management determines to remove the designation of the cash flow hedge.
68
Table of Contents
Index to Financial Statements
In all situations in which hedge accounting is discontinued and the derivative remains outstanding, we continue to carry the derivative at fair value on the consolidated balance sheets and recognize any subsequent changes in its fair value in earnings.
Item 7A. Quantitative and Qualitative Disclosures About Market Risk
Inflation Risk
The primary inflationary factors affecting our operations are food and supplies, labor costs, energy costs and materials used in the construction of new company-operated restaurants. Increases in the minimum wage directly affect our labor costs and the PPACA has increased our health insurance costs beginning in fiscal 2015. Our leases require us to pay taxes, maintenance, repairs, insurance and utilities, all of which are generally subject to inflationary increases. Finally, the cost of constructing our restaurants is subject to inflationary increase in the costs of labor and material which results in higher rent expense on new restaurants.
Interest Rate Risk
Interest rate risk is the exposure to loss resulting from changes in the level of interest rates and the spread between different interest rates. We are exposed to market risk from changes in interest rates on our debt, which bears interest at variable rates. As of December 25, 2016, we had outstanding borrowings of $157.5 million under our credit facility. As of December 25, 2016, $125.0 million of our outstanding borrowings under the credit facility was covered by interest rate swaps that effectively fix the LIBOR component of the interest rate on those borrowings for certain periods of time. A 1.00% increase in the effective interest rate applied to our borrowings currently subject to variable interest rates would result in a pre-tax interest expense increase of $0.3 million on an annualized basis.
Interest rate risk is highly sensitive due to many factors, including U.S. monetary and tax policies, U.S. and international economic factors and other factors beyond our control. Our credit facility debt has floating interest rates. We are exposed to changes in the level of interest rates and to changes in the relationship or spread between interest rates for our floating rate debt. Our floating rate debt requires payments based on a variable interest rate index such as LIBOR. Therefore, increases in interest rates may reduce our net income by increasing the cost of our debt. However, we seek to mitigate our floating interest rate risk on our credit facility long-term debt by entering into fixed pay interest rate derivatives on a portion of the credit facility long-term debt, as discussed above under “Debt and Other Obligations – Hedging Arrangements”.
Commodity Market Risk
We purchase certain products that are affected by commodity prices and are, therefore, subject to price volatility caused by weather, market conditions and other factors which are not considered predictable or within our control. Although these products are subject to changes in commodity prices, certain purchasing contracts or pricing arrangements contain risk management techniques designed to minimize price volatility. The purchasing contracts and pricing arrangements we use may result in unconditional purchase obligations, which are not reflected in our consolidated balance sheets. Typically, we use these types of purchasing techniques to control costs as an alternative to directly managing financial instruments to hedge commodity prices. In many cases, we believe we will be able to address material commodity cost increases by adjusting our menu pricing, promotional mix, or changing our product delivery strategy. However, increases in commodity prices, without adjustments to our menu prices, could increase food and supplies costs as a percentage of company restaurant revenues and customers may react negatively to increases in our menu prices which could adversely impact customer traffic and revenues.
Credit Risk
Credit risk relates to the risk of loss resulting from non-performance or non-payment by counterparties pursuant to the terms of their contractual obligations. Risks surrounding counterparty performance and credit could ultimately impact the amount and timing of expected cash flows.
69
Table of Contents
Index to Financial Statements
Certain financial instruments potentially subject us to a concentration of credit risk. These financial instruments consist primarily of cash and cash equivalents and accounts and vendor receivables. We place our cash and cash equivalents with high-credit, quality financial institutions. The balances in these accounts exceed the amounts insured by the Federal Deposit Insurance Corporation.
Concentration of credit risk with respect to receivables is primarily limited to franchisees, which are primarily located in the Southeastern United States, and vendors. Royalty revenues from three franchisees, one of which is a related party franchisee, accounted for approximately 44%, 44% and 45% of our total franchise royalty revenues for the fiscal years ended December 25, 2016, December 27, 2015 and December 28, 2014, respectively. Royalty and franchise fee accounts receivable from three franchisees, one of which is a related party franchisee, accounted for approximately 40% and 44% of our gross royalty and franchise fee accounts receivable as of December 25, 2016 and December 27, 2015, respectively. We continually evaluate and monitor the credit history of our franchisees and believe we have an adequate allowance for bad debts.
Item 8. Financial Statements and Supplementary Data
See Consolidated Financial Statements and Notes thereto commencing on Page F-1. Quarterly information (unaudited) is presented in a Note to the consolidated financial statements.
Item 9. Changes In and Disagreements with Accountants on Accounting and Financial Disclosure
None.
Item 9A. Controls and Procedures
Evaluation of Disclosure Controls and Procedures
We maintain disclosure controls and procedures (as defined in Rule 13a-15(e) of the Exchange Act) that are designed to ensure that information required to be disclosed in our reports under the Exchange Act is recorded, processed, summarized and reported within the time periods specified in the SEC’s rules and forms, and that such information is accumulated and communicated to our management, including our chief executive officer and chief financial officer, as appropriate, to allow timely decisions regarding required disclosures. Any controls and procedures, no matter how well designed and operated, can provide only reasonable assurance of achieving the desired control objectives.
As of the end of the period covered by this Annual Report, we carried out an evaluation under the supervision and with the participation of our management, including our chief executive officer and chief financial officer, of the effectiveness of our disclosure controls and procedures. Based upon our evaluation, our chief executive officer and chief financial officer have concluded that our disclosure controls and procedures were effective as of December 25, 2016 at the reasonable assurance level.
Management’s Report on Internal Control Over Financial Reporting
Management is responsible for establishing and maintaining adequate internal control over financial reporting, as such term is defined in Exchange Act Rules 13a-15(f). Internal control over financial reporting is a process designed to provide reasonable assurance regarding the reliability of financial reporting and the preparation of the financial statements for external purposes in accordance with generally accepted accounting principles in the United States of America. Because of its inherent limitations, internal control over financial reporting may not prevent or detect misstatements. Also, projections of any evaluation of effectiveness to future periods are subject to the risk that controls may become inadequate because of changes in conditions, or that the degree of compliance with the policies or procedures may deteriorate.
70
Table of Contents
Index to Financial Statements
Under the supervision and with the participation of our management, including our chief executive officer and chief financial officer, we conducted an evaluation of the effectiveness of our internal control over financial reporting based on the framework in Internal Control – Integrated Framework (2013) issued by the Committee of Sponsoring Organizations of the Treadway Commission. Based on our evaluation under the framework in Internal Control – Integrated Framework (2013), our management concluded that our internal control over financial reporting was effective as of December 25, 2016 at the reasonable assurance level.
KPMG LLP, our independent registered public accounting firm, has audited the Consolidated Financial Statements as of December 25, 2016, as stated in their report herein. As we are an “emerging growth company” under the JOBS Act, KPMG LLP is not required to attest to the effectiveness of our internal control over financial reporting for so long as we are an emerging growth company.
Changes in Internal Control Over Financial Reporting
There were no changes in our internal controls over financial reporting that occurred during the thirteen weeks ended December 25, 2016 that have materially affected, or are reasonably likely to materially affect, our internal control over financial reporting.
None.
71
Table of Contents
Index to Financial Statements
PART III
We expect to file a definitive proxy statement relating to our 2017 Annual Meeting of Stockholders with the SEC pursuant to Regulation 14A, not later than 120 days after the end of our most recent fiscal year. Accordingly, certain information required by Part III of this Annual Report has been omitted under General Instruction G(3) to Form 10-K. Only the information from the definitive proxy statement that specifically addresses disclosure requirements of Items 10-14 below is incorporated by reference.
Item 10. Directors, Officers and Corporate Governance
We will provide information that is responsive to this Item 10 in our definitive proxy statement for our 2017 Annual Meeting of Stockholders or in an amendment to this Annual Report not later than 120 days after the end of the fiscal year covered by this Annual Report, in either case under the captions “Proposal No. 1—Election of Directors,” “Corporate Governance and Board Structure” and “Section 16(a) Beneficial Ownership Reporting Compliance,” and possibly elsewhere therein. That information is incorporated in this Item 10 by reference.
Item 11. Executive Compensation
We will provide information that is responsive to this Item 11 in our definitive proxy statement for our 2017 Annual Meeting of Stockholders or in an amendment to this Annual Report not later than 120 days after the end of the fiscal year covered by this Annual Report, in either case under the captions “Executive and Director Compensation,” and “Corporate Governance and Board Structure,” and possibly elsewhere therein. That information is incorporated in this Item 11 by reference.
Item 12. Security Ownership of Certain Beneficial Owners and Management and Related Stockholder Matters
We will provide information that is responsive to this Item 12 in our definitive proxy statement for our 2017 Annual Meeting of Stockholders or in an amendment to this Annual Report not later than 120 days after the end of the fiscal year covered by this Annual Report, in either case under the captions “Security Ownership of Certain Beneficial Owners and Management,” and “Equity Compensation Plan Information,” and possibly elsewhere therein. That information is incorporated in this Item 12 by reference.
Item 13. Certain Relationships and Related Transactions, and Director Independence
We will provide information that is responsive to this Item 13 in our definitive proxy statement for our 2017 Annual Meeting of Stockholders or in an amendment to this Annual Report not later than 120 days after the end of the fiscal year covered by this Annual Report, in either case under the captions “Related Person Transactions,” and “Corporate Governance and Board Structure,” and possibly elsewhere therein. That information is incorporated in this Item 13 by reference.
Item 14. Principal Accountant Fees and Services
We will provide information that is responsive to this Item 14 in our definitive proxy statement for our 2017 Annual Meeting of Stockholders or in an amendment to this Annual Report not later than 120 days after the end of the fiscal year covered by this Annual Report, in either case under the caption “Proposal No. 2—Ratification of Appointment of Independent Registered Public Accounting Firm,” and possibly elsewhere therein. That information is incorporated in this Item 14 by reference.
72
Table of Contents
Index to Financial Statements
PART IV
Item 15. Exhibits and Financial Statement Schedules
The following financial statements are filed as a part of this Annual Report on Form 10-K:
(a)(2) We have omitted all other schedules because the conditions requiring their filing do not exist or because the required information appears in our Consolidated Financial Statements, including the notes to those statements.
(a)(3) See Exhibits below.
(b) Exhibits
| Exhibit |
Description | |
| 3.1 | Second Certificate of Amendment to the Second Amended and Restated Certificate of Incorporation, effective May 12, 2015 (incorporated by reference to Exhibit 3.1 to the Company’s report on Form 8-K filed May 13, 2015—Commission File No. 001-37374). | |
| 3.2 | Amended and Restated Certificate of Incorporation of Bojangles’, Inc., effective May 13, 2015 (incorporated by reference to Exhibit 3.2 to the Company’s report on Form 8-K filed May 13, 2015—Commission File No. 001-37374). | |
| 3.3 | Amended and Restated Bylaws of Bojangles’, Inc. (incorporated by reference to Exhibit 3.4 to Amendment No. 1 to the Company’s Registration Statement on Form S-1 filed April 27, 2015—Commission File No. 333-203268). | |
| 4.1 | Specimen of Common Stock Certificate of Bojangles’, Inc. (incorporated by reference to Exhibit 4.1 to Amendment No. 1 to the Company’s Registration Statement on Form S-1 filed April 27, 2015—Commission File No. 333-203268). | |
| 10.1 | Credit Agreement, dated October 9, 2012, by and among Bojangles’ Restaurants, Inc., BHI Intermediate Holding Corp., Bank of America N.A., as a lender and administrative agent for all lenders, and the other lenders party thereto (incorporated by reference to Exhibit 10.1 to the Company’s Registration Statement on Form S-1 filed April 6, 2015—Commission File No. 333-203268). | |
| 10.2 | First Amendment to the Credit Agreement, dated May 15, 2013, by and among Bojangles’ Restaurants, Inc., BHI Intermediate Holding Corp., Bank of America N.A., as a lender and administrative agent for all lenders, and the other lenders party thereto (incorporated by reference to Exhibit 10.2 to the Company’s Registration Statement on Form S-1 filed April 6, 2015—Commission File No. 333-203268). | |
73
Table of Contents
Index to Financial Statements
| Exhibit |
Description | |
| 10.3 | Second Amendment to the Credit Agreement, dated April 11, 2014, by and among Bojangles’ Restaurants, Inc., BHI Intermediate Holding Corp., Bank of America N.A., as a lender and administrative agent for all lenders, and the other lenders party thereto (incorporated by reference to Exhibit 10.3 to the Company’s Registration Statement on Form S-1 filed April 6, 2015—Commission File No. 333-203268). | |
| 10.4 | Amendment No. 3 dated as of July 23, 2015 between Bojangles’ Restaurants, Inc., BHI Intermediate Holding Corp., Bojangles’ International, LLC, BJ Georgia, LLC, BJ Restaurant Development, LLC, the lender parties thereto and Bank of America, N.A., as administrative agent (incorporated by reference to Exhibit 10.1 to the Company’s report on Form 8-K filed July 24, 2015—Commission File No. 001-37374). | |
| 10.5 | Amendment No. 4 dated as of September 25, 2015 between Bojangles’, Inc., Bojangles’ Restaurants, Inc., Bojangles’ International, LLC, BJ Georgia, LLC, BJ Restaurant Development, LLC, the lender parties thereto and Bank of America, N.A., as administrative agent (incorporated by reference to Exhibit 10.1 to the Company’s report on Form 8-K/A filed September 28, 2015—Commission File No. 001-37374). | |
| 10.6 | Amendment No. 5 dated as of October 19, 2016 between Bojangles’, Inc., Bojangles’ Restaurants, Inc., Bojangles’ International, LLC, BJ Georgia, LLC, BJ Restaurant Development, LLC, the lender parties thereto and Bank of America, N.A., as administrative agent (incorporated by reference to Exhibit 10.2 to the Company’s report on Form 10-Q filed November 4, 2016—Commission File No. 001-37374). | |
| 10.7 † | Master Distribution Agreement between McLane Foodservice, Inc. and Bojangles’ Restaurants, Inc. dated as of September 9, 2015 (incorporated by reference to Exhibit 10.1 to the Company’s report on Form 8-K filed September 9, 2015—Commission File No. 001-37374). | |
| 10.8 † | Amendment to Master Distribution Agreement between McLane Foodservice, Inc. and Bojangles’ Restaurants, Inc. dated as of October 20, 2015 (incorporated by reference to Exhibit 10.3 to the Company’s report on Form 10-Q filed November 4, 2015—Commission File No. 001-37374). | |
| 10.9 † | Second Amendment to Master Distribution Agreement between McLane Foodservice, Inc. and Bojangles’ Restaurants, Inc. dated as of September 7, 2016 (incorporated by reference to Exhibit 10.1 to the Company’s report on Form 10-Q filed November 4, 2016—Commission File No. 001-37374). | |
| 10.10 # | Amended and Restated Employment Agreement, dated December 18, 2014, by and between Bojangles, Inc. and Clifton W. Rutledge (incorporated by reference to Exhibit 10.8 to the Company’s Registration Statement on Form S-1 filed April 6, 2015—Commission File No. 333-203268). | |
| 10.11 # | Amendment #1 to Amended and Restated Employment Agreement by and between Bojangles’ Inc. and Clifton W. Rutledge, dated November 1, 2016 (incorporated by reference to Exhibit 10.3 to the Company’s report on Form 10-Q filed November 4, 2016—Commission File No. 001-37374). | |
| 10.12 # | Amended and Restated Employment Agreement, dated August 18, 2012, by and between Bojangles’ Restaurants, Inc., Bojangles’ International, LLC, and BHI Exchange, Inc. and Eric M. Newman (incorporated by reference to Exhibit 10.9 to the Company’s Registration Statement on Form S-1 filed April 6, 2015—Commission File No. 333-203268). | |
| 10.13 # | Separation Agreement, dated October 19, 2016, between Eric M. Newman and Bojangles’, Inc. (incorporated by reference to Exhibit 10.1 to the Company’s report on Form 8-K filed October 25, 2016—Commission File No. 001-37374). | |
74
Table of Contents
Index to Financial Statements
| Exhibit |
Description | |
| 10.14 # | Amended and Restated Employment Agreement, dated April 27, 2011, by and between Bojangles’ Restaurants, Inc., BHI Exchange, Inc. and Michael J. Jordan (incorporated by reference to Exhibit 10.10 to the Company’s Registration Statement on Form S-1 filed April 6, 2015—Commission File No. 333-203268). | |
| 10.15 # | Amended and Restated Severance Agreement, dated April 27, 2011, by and between Bojangles’ Restaurants, Inc., BHI Exchange, Inc. and Kenneth E. Avery (incorporated by reference to Exhibit 10.11 to the Company’s Registration Statement on Form S-1 filed April 6, 2015—Commission File No. 333-203268). | |
| 10.16 # | Severance Letter Agreement, dated December 17, 2013, by and between Kenneth E. Avery and Bojangles’ Restaurants, Inc. (incorporated by reference to Exhibit 10.12 to the Company’s Registration Statement on Form S-1 filed April 6, 2015—Commission File No. 333-203268). | |
| 10.17 # | Employment Agreement, dated December 30, 2013, by and between BHI Holding Corp. and James R. Kibler (incorporated by reference to Exhibit 10.13 to the Company’s Registration Statement on Form S-1 filed April 6, 2015—Commission File No. 333-203268). | |
| 10.18 # | 2007 Nonqualified Deferred Compensation Plan (incorporated by reference to Exhibit 10.14 to the Company’s Registration Statement on Form S-1 filed April 6, 2015—Commission File No. 333-203268). | |
| 10.19 # | Bojangles’, Inc. Amended and Restated 2011 Equity Incentive Plan (incorporated by reference to Exhibit 10.15 to Amendment No. 1 to the Company’s Registration Statement on Form S-1 filed April 27, 2015—Commission File No. 333-203268). | |
| 10.20 # | Non-Qualified Stock Option Award Agreement for Clifton Rutledge pursuant to 2011 Equity Incentive Plan (incorporated by reference to Exhibit 10.16 to the Company’s Registration Statement on Form S-1 filed April 6, 2015—Commission File No. 333-203268). | |
| 10.21 # | Form of Non-Qualified Stock Option Award Agreement for James R. Kibler, M. John Jordan, and Eric M. Newman pursuant to 2011 Equity Incentive Plan (incorporated by reference to Exhibit 10.17 to the Company’s Registration Statement on Form S-1 filed April 6, 2015—Commission File No. 333-203268). | |
| 10.22 # | Non-Qualified Stock Option Award Agreements for Kenneth E. Avery pursuant to 2011 Equity Incentive Plan (incorporated by reference to Exhibit 10.18 to the Company’s Registration Statement on Form S-1 filed April 6, 2015—Commission File No. 333-203268). | |
| 10.23 # | Form of Restricted Stock Unit Award Agreement under the Bojangles’, Inc. Amended and Restated 2011 Equity Incentive Plan (Non-Employee Directors) (incorporated by reference to Exhibit 10.1 to the Company’s report on Form 10-Q filed June 11, 2015—Commission File No. 001-37374). | |
| 10.24 # | Form of Incentive Stock Option Agreement under the Bojangles’, Inc. Amended and Restated 2011 Equity Incentive Plan (incorporated by reference to Exhibit 10.2 to the Company’s report on Form 10-Q filed June 11, 2015—Commission File No. 001-37374). | |
| 10.25 # | Form of Non-Qualified Stock Option Agreement under the Bojangles’, Inc. Amended and Restated 2011 Equity Incentive Plan (incorporated by reference to Exhibit 10.3 to the Company’s report on Form 10-Q filed June 11, 2015—Commission File No. 001-37374). | |
| 10.26 # | Form of Restricted Stock Award Agreement under the Bojangles’, Inc. Amended and Restated 2011 Equity Incentive Plan (incorporated by reference to Exhibit 10.20 to Amendment No. 1 to the Company’s Registration Statement on Form S-1 filed April 27, 2015—Commission File No. 333-203268). | |
75
Table of Contents
Index to Financial Statements
| Exhibit |
Description | |
| 10.27 # | Bojangles’, Inc. Performance Bonus Plan (incorporated by reference to Exhibit 10.19 to Amendment No. 1 to the Company’s Registration Statement on Form S-1 filed April 27, 2015—Commission File No. 333-203268). | |
| 10.28 # | Bojangles’, Inc. Compensation Policy For Non-Employee Directors (Amended and Restated Effective June 8, 2016) (incorporated by reference to Exhibit 10.1 to the Company’s report on Form 10-Q filed August 8, 2016—Commission File No. 001-37374). | |
| 21 | List of Subsidiaries of the Company.* | |
| 23.1 | Consent of KPMG LLP, an independent registered public accounting firm.* | |
| 31.1 | Certification as adopted pursuant to Section 302 of the Sarbanes-Oxley Act of 2002.* | |
| 31.2 | Certification as adopted pursuant to Section 302 of the Sarbanes-Oxley Act of 2002.* | |
| 32.1 | Certification required by 18 United States Code Section 1350, as adopted pursuant to Section 906 of the Sarbanes-Oxley Act of 2002.‡ | |
| 32.2 | Certification required by 18 United States Code Section 1350, as adopted pursuant to Section 906 of the Sarbanes-Oxley Act of 2002.‡ | |
| 101 | Sections of the Bojangles’, Inc. Annual Report on Form 10-K for the fiscal year ended December 25, 2016, formatted in XBRL (eXtensible Business Reporting Language), submitted in the following files: | |
| 101.INS | XBRL Instance Document. | |
| 101.SCH | XBRL Taxonomy Extension Schema Document. | |
| 101.CAL | XBRL Taxonomy Extension Calculation Linkbase Document. | |
| 101.DEF | XBRL Taxonomy Extension Definition Linkbase Document. | |
| 101.LAB | XBRL Taxonomy Extension Label Linkbase Document. | |
| 101.PRE | XBRL Taxonomy Extension Presentation Linkbase Document. | |
| * | Filed herewith |
| # | Indicates a management contract or compensatory plan or arrangement. |
| † | Indicates confidential treatment as to certain portions of this exhibit have been requested or granted. Omitted portions have been filed separately with the SEC. |
| ‡ | Furnished herewith |
The Company has elected not to include any summary information.
76
Table of Contents
Index to Financial Statements
SIGNATURES
Pursuant to the requirements of the Securities Exchange Act of 1934, the registrant has duly caused this report to be signed on its behalf by the undersigned thereunto duly authorized, on the 7th day of March 2017.
| BOJANGLES’, INC. | ||
| By: | /s/ Clifton Rutledge | |
| Clifton Rutledge | ||
| Director, President and Chief Executive Officer | ||
Pursuant to the requirements of the Securities and Exchange Act of 1934, this report has been signed below by the following persons on behalf of the registrant and in the capacities and on the 7th day of March 2017.
| Name |
Title | |
| /s/ Clifton Rutledge Clifton Rutledge |
Director, President and Chief Executive Officer (principal executive officer) | |
| /s/ M. John Jordan M. John Jordan |
Senior Vice President of Finance, Chief Financial Officer and Treasurer (principal financial and accounting officer) | |
| /s/ William A. Kussell William A. Kussell |
Non-Executive Chairman and Director | |
| /s/ Steven J. Collins Steven J. Collins |
Director | |
| /s/ Tommy L. Haddock Tommy L. Haddock |
Director | |
| /s/ Starlette B. Johnson Starlette B. Johnson |
Director | |
| /s/ James R. Kibler James R. Kibler |
Director | |
| /s/ Steven M. Tadler Steven M. Tadler |
Director | |
| /s/ Christopher J. Doubrava Christopher J. Doubrava |
Director | |
| /s/ John E. Currie John E. Currie |
Director | |
77
Table of Contents
Index to Financial Statements
Report of Independent Registered Public Accounting Firm
The Board of Directors and Stockholders
Bojangles’, Inc. and subsidiaries:
We have audited the accompanying consolidated balance sheets of Bojangles’, Inc. and subsidiaries as of December 25, 2016 and December 27, 2015, and the related consolidated statements of operations and comprehensive income, stockholders’ equity, and cash flows for each of the years in the three-year period ended December 25, 2016. These consolidated financial statements are the responsibility of the Company’s management. Our responsibility is to express an opinion on these consolidated financial statements based on our audits.
We conducted our audits in accordance with the standards of the Public Company Accounting Oversight Board (United States). Those standards require that we plan and perform the audit to obtain reasonable assurance about whether the financial statements are free of material misstatement. An audit includes examining, on a test basis, evidence supporting the amounts and disclosures in the financial statements. An audit also includes assessing the accounting principles used and significant estimates made by management, as well as evaluating the overall financial statement presentation. We believe that our audits provide a reasonable basis for our opinion.
In our opinion, the consolidated financial statements referred to above present fairly, in all material respects, the financial position of Bojangles’, Inc. and subsidiaries as of December 25, 2016 and December 27, 2015, and the results of their operations and their cash flows for each of the years in the three-year period ended December 25, 2016, in conformity with U.S. generally accepted accounting principles.
/s/ KPMG LLP
Charlotte, North Carolina
March 7, 2017
F-1
Table of Contents
Index to Financial Statements
Item 1. Financial Statements
BOJANGLES’, INC. AND SUBSIDIARIES
Consolidated Balance Sheets
(in thousands, except per share amounts)
| December 25, 2016 |
December 27, 2015 |
|||||||
| Assets | ||||||||
| Current assets: |
||||||||
| Cash and cash equivalents |
$ | 13,898 | 14,263 | |||||
| Accounts and vendor receivables, net |
5,421 | 4,736 | ||||||
| Accounts receivable, related parties, net |
386 | 403 | ||||||
| Inventories, net |
3,326 | 3,080 | ||||||
| Other current assets |
3,033 | 5,639 | ||||||
|
|
|
|
|
|||||
| Total current assets |
26,064 | 28,121 | ||||||
| Property and equipment, net |
52,275 | 48,137 | ||||||
| Goodwill |
161,140 | 161,140 | ||||||
| Brand |
290,500 | 290,500 | ||||||
| Franchise rights, net |
24,243 | 25,341 | ||||||
| Favorable leases, net |
981 | 1,394 | ||||||
| Other noncurrent assets |
4,569 | 3,673 | ||||||
|
|
|
|
|
|||||
| Total assets |
$ | 559,772 | 558,306 | |||||
|
|
|
|
|
|||||
| Liabilities and Stockholders’ Equity | ||||||||
| Current liabilities: |
||||||||
| Accounts payable |
$ | 16,818 | 17,893 | |||||
| Accrued expenses |
17,940 | 19,086 | ||||||
| Current maturities of long-term debt |
2,132 | — | ||||||
| Current maturities of capital lease obligations |
7,299 | 5,968 | ||||||
| Other current liabilities |
4,390 | 2,155 | ||||||
|
|
|
|
|
|||||
| Total current liabilities |
48,579 | 45,102 | ||||||
| Long-term debt, less current maturities and deferred debt issuance costs, net |
153,630 | 197,735 | ||||||
| Deferred income taxes |
111,312 | 115,028 | ||||||
| Capital lease obligations, less current maturities |
22,524 | 21,483 | ||||||
| Other noncurrent liabilities |
12,937 | 11,834 | ||||||
|
|
|
|
|
|||||
| Total liabilities |
348,982 | 391,182 | ||||||
|
|
|
|
|
|||||
| Commitments and contingencies (notes 2, 3 and 17) |
— | — | ||||||
| Stockholders’ equity: |
||||||||
| Preferred stock, $0.01 par value; 25,000 shares authorized and no shares issued and outstanding as of both December 25, 2016 and December 27, 2015 |
— | — | ||||||
| Common stock, $0.01 par value; 150,000 shares authorized and 36,547 and 36,009 shares issued and outstanding as of December 25, 2016 and December 27, 2015, respectively |
365 | 360 | ||||||
| Additional paid-in capital |
124,802 | 119,084 | ||||||
| Retained earnings |
85,377 | 47,661 | ||||||
| Accumulated other comprehensive income |
246 | 19 | ||||||
|
|
|
|
|
|||||
| Total stockholders’ equity |
210,790 | 167,124 | ||||||
|
|
|
|
|
|||||
| Total liabilities and stockholders’ equity |
$ | 559,772 | 558,306 | |||||
|
|
|
|
|
|||||
See accompanying notes to consolidated financial statements.
F-2
Table of Contents
Index to Financial Statements
BOJANGLES’, INC. AND SUBSIDIARIES
Consolidated Statements of Operations and Comprehensive Income
(in thousands, except per share amounts)
| Fiscal Year Ended | ||||||||||||
| December 25, 2016 |
December 27, 2015 |
December 28, 2014 |
||||||||||
| Revenues: |
||||||||||||
| Company restaurant revenues |
$ | 504,664 | 462,138 | 406,788 | ||||||||
| Franchise royalty revenues |
26,364 | 25,104 | 22,746 | |||||||||
| Other franchise revenues |
853 | 960 | 938 | |||||||||
|
|
|
|
|
|
|
|||||||
| Total revenues |
531,881 | 488,202 | 430,472 | |||||||||
|
|
|
|
|
|
|
|||||||
| Company restaurant operating expenses: |
||||||||||||
| Food and supplies costs |
158,644 | 150,563 | 133,191 | |||||||||
| Restaurant labor costs |
138,839 | 126,380 | 112,506 | |||||||||
| Operating costs |
112,256 | 100,916 | 88,476 | |||||||||
| Depreciation and amortization |
12,709 | 11,456 | 9,713 | |||||||||
|
|
|
|
|
|
|
|||||||
| Total Company restaurant operating expenses |
422,448 | 389,315 | 343,886 | |||||||||
|
|
|
|
|
|
|
|||||||
| Operating income before other operating expenses |
109,433 | 98,887 | 86,586 | |||||||||
|
|
|
|
|
|
|
|||||||
| Other operating expenses: |
||||||||||||
| General and administrative |
39,041 | 42,844 | 32,107 | |||||||||
| Depreciation and amortization |
2,917 | 2,809 | 2,372 | |||||||||
| Impairment |
1,927 | 1,210 | 484 | |||||||||
| Loss on disposal of property and equipment |
47 | 336 | 60 | |||||||||
|
|
|
|
|
|
|
|||||||
| Total other operating expenses |
43,932 | 47,199 | 35,023 | |||||||||
|
|
|
|
|
|
|
|||||||
| Operating income |
65,501 | 51,688 | 51,563 | |||||||||
| Amortization of deferred debt issuance costs |
(763 | ) | (821 | ) | (733 | ) | ||||||
| Interest income |
4 | 7 | 2 | |||||||||
| Interest expense |
(7,489 | ) | (8,314 | ) | (9,123 | ) | ||||||
|
|
|
|
|
|
|
|||||||
| Income before income taxes |
57,253 | 42,560 | 41,709 | |||||||||
| Income taxes |
19,537 | 16,034 | 15,589 | |||||||||
|
|
|
|
|
|
|
|||||||
| Net income |
37,716 | 26,526 | 26,120 | |||||||||
|
|
|
|
|
|
|
|||||||
| Other comprehensive income, net of tax |
||||||||||||
| Change in fair value on interest rate swaps, net of income tax (expense) benefit of ($137), $79, and $176 |
227 | (127 | ) | (268 | ) | |||||||
|
|
|
|
|
|
|
|||||||
| Comprehensive income |
$ | 37,943 | 26,399 | 25,852 | ||||||||
|
|
|
|
|
|
|
|||||||
| Net income per share: |
||||||||||||
| Basic |
$ | 1.04 | 1.15 | — | ||||||||
|
|
|
|
|
|
|
|||||||
| Diluted |
$ | 1.00 | 0.71 | 0.70 | ||||||||
|
|
|
|
|
|
|
|||||||
See accompanying notes to consolidated financial statements.
F-3
Table of Contents
Index to Financial Statements
BOJANGLES’, INC. AND SUBSIDIARIES
Consolidated Statement of Stockholders’ Equity
(in thousands, except per share amounts)
| Preferred stock |
Common stock |
Additional paid-in capital |
Retained earnings |
Accumulated other comprehensive income |
Total stockholders’ equity |
|||||||||||||||||||||||
| Shares | Amount | |||||||||||||||||||||||||||
| Balance as of December 29, 2013 |
$ | 172,691 | — | $ | — | (30,535 | ) | 18,033 | 414 | 160,603 | ||||||||||||||||||
| Net income |
— | — | — | — | 26,120 | — | 26,120 | |||||||||||||||||||||
| Change in fair value on interest rate swaps, net of income tax benefit of $176 |
— | — | — | — | — | (268 | ) | (268 | ) | |||||||||||||||||||
| Stock option settlement |
— | — | — | (172 | ) | — | — | (172 | ) | |||||||||||||||||||
| Stockholder distribution ($500 per share) |
— | — | — | (26,982 | ) | (23,018 | ) | — | (50,000 | ) | ||||||||||||||||||
| Excess tax benefits from stock-based payment arrangements |
— | — | — | 49 | — | — | 49 | |||||||||||||||||||||
| Stock-based compensation |
— | — | — | 1,420 | — | — | 1,420 | |||||||||||||||||||||
|
|
|
|
|
|
|
|
|
|
|
|
|
|
|
|||||||||||||||
| Balance as of December 28, 2014 |
172,691 | — | — | (56,220 | ) | 21,135 | 146 | 137,752 | ||||||||||||||||||||
| Net income |
— | — | — | — | 26,526 | — | 26,526 | |||||||||||||||||||||
| Change in fair value on interest rate swaps, net of income tax benefit of $79 |
— | — | — | — | — | (127 | ) | (127 | ) | |||||||||||||||||||
| Stock option exercise |
— | 106 | 1 | 329 | — | — | 330 | |||||||||||||||||||||
| Excess tax benefits from stock-based payment arrangements |
— | — | — | 680 | — | — | 680 | |||||||||||||||||||||
| Conversion of preferred stock to common stock |
(172,691 | ) | 35,903 | 359 | 172,332 | — | — | — | ||||||||||||||||||||
| Stock-based compensation |
— | — | — | 1,963 | — | — | 1,963 | |||||||||||||||||||||
|
|
|
|
|
|
|
|
|
|
|
|
|
|
|
|||||||||||||||
| Balance as of December 27, 2015 |
— | 36,009 | 360 | 119,084 | 47,661 | 19 | 167,124 | |||||||||||||||||||||
| Net income |
— | — | — | — | 37,716 | — | 37,716 | |||||||||||||||||||||
| Change in fair value on interest rate swaps, net of income tax expense of $137 |
— | — | — | — | — | 227 | 227 | |||||||||||||||||||||
| Stock option exercise |
— | 530 | 5 | 1,205 | — | — | 1,210 | |||||||||||||||||||||
| Vesting of restricted stock units |
— | 8 | — | — | — | — | — | |||||||||||||||||||||
| Excess tax benefits from stock-based payment arrangements |
— | — | — | 2,686 | — | — | 2,686 | |||||||||||||||||||||
| Stock-based compensation |
— | — | — | 1,827 | — | — | 1,827 | |||||||||||||||||||||
|
|
|
|
|
|
|
|
|
|
|
|
|
|
|
|||||||||||||||
| Balance as of December 25, 2016 |
$ | — | 36,547 | $ | 365 | 124,802 | 85,377 | 246 | 210,790 | |||||||||||||||||||
|
|
|
|
|
|
|
|
|
|
|
|
|
|
|
|||||||||||||||
See accompanying notes to consolidated financial statements.
F-4
Table of Contents
Index to Financial Statements
BOJANGLES’, INC. AND SUBSIDIARIES
Consolidated Statements of Cash Flows
(in thousands)
| Fiscal Year Ended | ||||||||||||
| December 25, 2016 |
December 27, 2015 |
December 28, 2014 |
||||||||||
| Cash flows from operating activities: |
||||||||||||
| Net income |
$ | 37,716 | 26,526 | 26,120 | ||||||||
| Adjustments to reconcile net income to net cash provided by operating activities: |
||||||||||||
| Deferred income tax benefit |
(2,177 | ) | (1,992 | ) | (980 | ) | ||||||
| Depreciation and amortization |
15,626 | 14,265 | 12,085 | |||||||||
| Amortization of deferred debt issuance costs |
763 | 821 | 733 | |||||||||
| Impairment |
1,927 | 1,210 | 484 | |||||||||
| Loss on disposal of property and equipment |
47 | 336 | 60 | |||||||||
| (Benefit) provision for doubtful accounts |
(72 | ) | 239 | 78 | ||||||||
| Provision for inventory spoilage |
20 | 23 | 9 | |||||||||
| (Benefit) provision for closed stores |
(51 | ) | 36 | 102 | ||||||||
| Stock-based compensation |
1,827 | 1,963 | 1,420 | |||||||||
| Excess tax benefit from stock-based compensation |
(2,686 | ) | (680 | ) | (49 | ) | ||||||
| Changes in operating assets and liabilities: |
||||||||||||
| Accounts and vendor receivables |
(595 | ) | (357 | ) | (2,264 | ) | ||||||
| Inventories |
(267 | ) | (360 | ) | (421 | ) | ||||||
| Other assets |
(354 | ) | 662 | (698 | ) | |||||||
| Income taxes |
4,069 | (1,352 | ) | (939 | ) | |||||||
| Investments for nonqualified deferred compensation plan |
(484 | ) | (425 | ) | (371 | ) | ||||||
| Accounts payable and accrued expenses |
(2,497 | ) | 2,860 | 6,624 | ||||||||
| Closed store obligation and deferred rents |
1,426 | 1,499 | 1,295 | |||||||||
| Vendor advance |
— | — | (1,678 | ) | ||||||||
| Deferred revenue |
(152 | ) | 120 | (47 | ) | |||||||
| Deferred compensation |
484 | 425 | 371 | |||||||||
| Other noncurrent liabilities |
(270 | ) | (293 | ) | (291 | ) | ||||||
|
|
|
|
|
|
|
|||||||
| Net cash provided by operating activities |
54,300 | 45,526 | 41,643 | |||||||||
|
|
|
|
|
|
|
|||||||
| Cash flows from investing activities: |
||||||||||||
| Purchases of franchisee’s assets |
(100 | ) | (186 | ) | (3,187 | ) | ||||||
| Purchases of property and equipment |
(9,695 | ) | (12,047 | ) | (7,495 | ) | ||||||
| Proceeds from disposition of property and equipment |
51 | 47 | 13 | |||||||||
|
|
|
|
|
|
|
|||||||
| Net cash used in investing activities |
(9,744 | ) | (12,186 | ) | (10,669 | ) | ||||||
|
|
|
|
|
|
|
|||||||
| Cash flows from financing activities: |
||||||||||||
| Proceeds from borrowings on long-term debt |
— | — | 50,000 | |||||||||
| Principal payments on long-term debt |
(42,736 | ) | (28,055 | ) | (21,376 | ) | ||||||
| Debt issuance costs |
— | (554 | ) | (720 | ) | |||||||
| Distribution to stockholders |
— | — | (50,000 | ) | ||||||||
| Stock option settlement |
— | — | (172 | ) | ||||||||
| Stock option exercise |
1,210 | 330 | — | |||||||||
| Excess tax benefit from stock-based compensation |
2,686 | 680 | 49 | |||||||||
| Principal payments on capital lease obligations |
(6,081 | ) | (4,679 | ) | (4,010 | ) | ||||||
|
|
|
|
|
|
|
|||||||
| Net cash used in financing activities |
(44,921 | ) | (32,278 | ) | (26,229 | ) | ||||||
|
|
|
|
|
|
|
|||||||
| Net (decrease) increase in cash and cash equivalents |
(365 | ) | 1,062 | 4,745 | ||||||||
| Cash and cash equivalents balance, beginning of fiscal year |
14,263 | 13,201 | 8,456 | |||||||||
|
|
|
|
|
|
|
|||||||
| Cash and cash equivalents balance, end of fiscal year |
$ | 13,898 | 14,263 | 13,201 | ||||||||
|
|
|
|
|
|
|
|||||||
| Supplemental cash flow disclosures: |
||||||||||||
| Non-cash conversion of preferred stock into common stock |
$ | — | 172,691 | — | ||||||||
| Cash paid for interest |
7,589 | 8,395 | 8,972 | |||||||||
| Cash paid for income taxes |
17,645 | 19,378 | 17,508 | |||||||||
| Assets acquired under capital leases |
8,977 | 7,815 | 6,452 | |||||||||
| Net change in assets under financing obligations |
2,520 | 657 | (1,990 | ) | ||||||||
| Reduction of capital lease obligations upon return of assets |
206 | 148 | 120 | |||||||||
| Reduction of capital lease obligations upon early termination of lease |
288 | — | — | |||||||||
See accompanying notes to consolidated financial statements.
F-5
Table of Contents
Index to Financial Statements
BOJANGLES’, INC. AND SUBSIDIARIES
Notes to Consolidated Financial Statements
Fiscal Years Ended December 25, 2016, December 27, 2015 and December 28, 2014
| (1) | Description of Business and Organization and Summary of Significant Accounting Policies |
| (a) | Description of Business and Organization |
Bojangles’, Inc. (formerly known as BHI Holding Corp.) (together with its subsidiaries, “Bojangles’”, the “Company”, “we” or “our”) was formed on June 28, 2011 as a Delaware corporation. The Company’s principal business is the operations and development and franchising, as franchisor, of limited service restaurants. As of December 25, 2016, there were 309 Company-operated restaurants, 61 related party franchised restaurants, and 346 independent franchised restaurants operating under the Bojangles’® name. The restaurants are located principally in the Southeastern United States. The Company’s franchising activity is regulated by the laws of the various states in which it is registered to sell franchises, as well as rules promulgated by the Federal Trade Commission. The legislation and rules, among other things, establish minimum disclosure requirements to a prospective franchisee and require periodic registration by the Company with state administrative agencies.
On July 24, 2015, the Company completed a merger of BHI Intermediate Holding Corp. (“BHIH”), a Delaware corporation and a wholly-owned subsidiary of the Company, with and into the Company (the “Merger”).
The following is the number of Bojangles’ franchised, Company-operated and system-wide restaurants at the beginning and end of the fiscal years ended December 25, 2016 and December 27, 2015:
| Fiscal Year Ended | ||||||||||||||||||||||||
| December 25, 2016 | December 27, 2015 | |||||||||||||||||||||||
| Franchised | Company- Operated |
System- Wide |
Franchised | Company- Operated |
System- Wide |
|||||||||||||||||||
| Restaurants at the beginning of the fiscal year |
381 | 281 | 662 | 368 | 254 | 622 | ||||||||||||||||||
| Opened during the fiscal year |
29 | 29 | 58 | 34 | 29 | 63 | ||||||||||||||||||
| Closed during the fiscal year |
(2 | ) | (2 | ) | (4 | ) | (20 | ) | (3 | ) | (23 | ) | ||||||||||||
| Refranchised during the fiscal year |
(1 | ) | 1 | — | (1 | ) | 1 | — | ||||||||||||||||
|
|
|
|
|
|
|
|
|
|
|
|
|
|||||||||||||
| Restaurants at the end of the fiscal year |
407 | 309 | 716 | 381 | 281 | 662 | ||||||||||||||||||
|
|
|
|
|
|
|
|
|
|
|
|
|
|||||||||||||
| Restaurant closures reflect permanent closures and exclude any temporary closures for items such as remodels, scrape and rebuilds, casualty events, severe weather conditions or any other short-term closure. A relocation results in a closure and an opening. During the fiscal years ended December 25, 2016 and December 27, 2015, our franchisees closed 2 and 20 restaurants, respectively, of which 1 and 7, respectively, were relocations. During the fiscal years ended December 25, 2016 and December 27, 2015, we closed 2 and 3 Company-operated restaurants, respectively, of which 2 and 3, respectively, were relocations. |
| |||||||||||||||||||||||
| (b) | Basis of Presentation and Consolidation |
The consolidated financial statements of the Company have been prepared in accordance with generally accepted accounting principles and practices of the United States of America (“GAAP”) and include our accounts and the accounts of our wholly-owned subsidiaries. The Company consolidates entities in which we have a controlling financial interest, the usual condition of which is ownership of a majority voting interest. All significant intercompany accounts and transactions are eliminated in consolidation. Certain prior period balances have been reclassified to conform to current period presentation, including the reclassification of the December 27, 2015 balance of $2.5 million of debt issuance costs from Deferred debt issuance costs, net to Long-term debt, less current maturities and deferred debt issuance costs, net on the consolidated balance sheets.
F-6
Table of Contents
Index to Financial Statements
| (c) | Fiscal Year |
The Company operates on a 52- or 53-week fiscal year ending on the last Sunday of December. Each of the fiscal years ended December 25, 2016, December 27, 2015 and December 28, 2014 consisted of 52 weeks.
| (d) | Use of Accounting Estimates |
The preparation of consolidated financial statements in conformity with GAAP requires management to make estimates and assumptions that affect the reported amounts of certain assets and liabilities and disclosures of contingent assets and liabilities as of the date of the financial statements and the reported amounts of revenue and expenses during the reporting period. Accordingly, the actual amounts could differ from those estimates. Any adjustments applied to estimated amounts are recognized in the fiscal year in which such adjustments are determined.
| (e) | Segment Information |
We have determined that we have one operating segment, therefore, one reportable segment. Our chief operating decision maker (“CODM”) is our Chief Executive Officer; our CODM reviews financial performance and allocates resources at a consolidated level on a recurring basis. All of our assets are located in the United States of America.
| (f) | Business Combinations |
We account for business combinations using the acquisition method. As of the acquisition date, the acquirer recognizes, separately from goodwill, the identifiable assets acquired, the liabilities assumed, and any non-controlling interest in the acquiree. Goodwill is initially measured at cost, being the excess of the cost of acquisition over the fair value of the net identifiable assets acquired and liabilities assumed. The cost of an acquisition is measured as the aggregate of the consideration transferred, measured at acquisition date fair value and the amount of any non-controlling interest in the acquiree. If the cost of acquisition is lower than the fair value of the net identifiable assets, the difference is recognized in profit or loss. Acquisition costs are expensed as incurred.
| (g) | Fair Value Measurements |
The Company utilizes valuation techniques that maximize the use of observable inputs and minimize the use of unobservable inputs to the extent possible. The Company determines fair value based on assumptions that market participants would use in pricing an asset or liability in the principal or most advantageous market. When considering market participant assumptions in fair value measurements, the following fair value hierarchy distinguishes between observable and unobservable inputs, which are categorized in one of the following levels:
| • | Level 1 Inputs: Unadjusted quoted prices in active markets for identical assets or liabilities accessible to the reporting entity at the measurement date. |
| • | Level 2 Inputs: Other than quoted prices included in Level 1 inputs that are observable for the asset or liability, either directly or indirectly, for substantially the full term of the asset or liability. |
| • | Level 3 Inputs: Unobservable inputs for the asset or liability used to measure fair value to the extent that observable inputs are not available, thereby allowing for situations in which there is little, if any, market activity for the asset or liability at the measurement date. |
In instances whereby inputs used to measure fair value fall into different levels in the above fair value hierarchy, fair value measurements in their entirety are categorized based on the lowest level input that
F-7
Table of Contents
Index to Financial Statements
is significant to the valuation. The Company’s assessment of the significance of particular inputs to these fair value measurements requires judgment and considers factors specific to each asset or liability.
| (h) | Cash and Cash Equivalents |
The Company considers all highly liquid investments purchased with an original maturity of three months or less and credit card receivables to be cash and cash equivalents.
| (i) | Accounts and Vendor Receivables and Allowance for Doubtful Accounts |
Accounts receivables consist of franchisee receivables from external and related parties, which are recorded at invoiced amounts, and other receivables. Royalty receivables are recorded at amounts earned based upon rates set forth in the related franchise agreements.
Vendor receivables consist of amounts due from certain beverage vendors related to long-term beverage supply agreements. Pursuant to the terms of these arrangements, marketing rebates are provided to the Company from the beverage vendors based upon the volume of purchases for Company-operated restaurants. For Company-operated restaurants, these incentives are recognized as earned throughout the year and are classified as a reduction of food and supplies costs in the consolidated statements of operations and comprehensive income.
The Company maintains allowances, which management believes are adequate to absorb estimated losses to be incurred in realizing the recorded amounts of its accounts and vendor receivables. These allowances are determined by management based primarily on an analysis of collectability of individual accounts, historical trends and current economic conditions. On a continuing basis, management analyzes delinquent receivables, and once these receivables are determined to be uncollectible, they are written off either against an existing allowance account or as a direct charge to the consolidated statement of operations.
| (j) | Inventories, Net |
Inventories, net consist of food and paper products and are stated at lower of cost or market. The cost of inventories is determined on a first-in, first-out basis. The Company maintains a provision for inventory spoilage. Marketing and maintenance supplies are expensed as purchased.
| (k) | Derivative Instruments and Hedging Activities |
The Company recognizes all derivative instruments as either assets or liabilities in the consolidated balance sheets at their respective fair values. For derivatives designated in hedging relationships, changes in the fair value are either offset through earnings against the change in fair value of the hedged item attributable to the risk being hedged or recognized in accumulated other comprehensive income (loss), to the extent the derivative is effective at offsetting the changes in cash flows being hedged until the hedged item affects earnings.
The Company only enters into derivative contracts that it intends to designate as a hedge of a forecasted transaction or the variability of cash flows to be received or paid related to a recognized asset or liability (cash flow hedge). For all hedging relationships, the Company formally documents the hedging relationship and its risk-management objective and strategy for undertaking the hedge, the hedging instrument, the hedged transaction, the nature of the risk being hedged, how the hedging instrument’s effectiveness in offsetting the hedged risk will be assessed prospectively and retrospectively, and a description of the method used to measure ineffectiveness. The Company also formally assesses, both at the inception of the hedging relationship and on an ongoing basis, whether
F-8
Table of Contents
Index to Financial Statements
the derivatives that are used in hedging relationships are highly effective in offsetting changes in cash flows of hedged transactions. For derivative instruments that are designated and qualify as part of a cash flow hedging relationship, the effective portion of the gain or loss on the derivative is reported as a component of other comprehensive income (loss) and reclassified into earnings in the same period or periods during which the hedged transaction affects earnings. Gains and losses on the derivative representing either hedge ineffectiveness or hedge components excluded from the assessment of effectiveness are recognized in current earnings.
The Company discontinues hedge accounting prospectively when it determines that the derivative is no longer effective in offsetting cash flows attributable to the hedged risk, the derivative expires or is sold, terminated, or exercised, the cash flow hedge is dedesignated because a forecasted transaction is not probable of occurring, or management determines to remove the designation of the cash flow hedge.
In all situations in which hedge accounting is discontinued and the derivative remains outstanding, the Company continues to carry the derivative at its fair value on the consolidated balance sheets and recognizes any subsequent changes in its fair value in earnings. When it is probable that a forecasted transaction will not occur, the Company discontinues hedge accounting and recognizes immediately in earnings gains and losses that were accumulated in other comprehensive income (loss) related to the hedging relationship.
| (l) | Impairment of Long-Lived Assets |
Long-lived assets, such as property and equipment, and purchased intangible assets subject to depreciation and amortization, are reviewed for impairment whenever events or changes in circumstances indicate that the carrying amount of an asset may not be recoverable.
If circumstances require a long-lived asset or asset group be tested for possible impairment, the Company first compares undiscounted cash flows expected to be generated by that asset or asset group to its carrying value. If the carrying value of the long-lived asset or asset group is not recoverable on an undiscounted cash flow basis, an impairment is recognized to the extent that the carrying value exceeds its fair value. Fair value is determined through various valuation techniques, including discounted cash flow models, quoted market values and third-party independent appraisals, as considered necessary.
| (m) | Property and Equipment |
Property and equipment are recorded at cost. Depreciation is computed using the straight-line method over the estimated useful lives of the assets. Capital leases are recorded at the lesser of the estimated fair value or the present value of amounts due under the lease. Buildings, equipment and vehicles under capital leases are amortized over the shorter of the estimated useful life of the asset or the lease term. Maintenance and repairs that do not improve or extend the useful lives of the assets are not considered assets and are charged to expense when incurred.
Provisions for depreciation are made using the straight-line method over an asset’s estimated useful life: up to 40 years for buildings; up to 5 years for furniture, fixtures and equipment; up to 5 years for computer hardware and software; and in the case of leasehold improvements and capital lease assets, the lesser of the economic life of the asset or the lease term.
| (n) | Leases |
The Company leases restaurant land and buildings, certain restaurant, office and computer equipment, office space and vehicles. We define a lease term as the initial term of the lease, plus any renewals covered by bargain renewal options or that are reasonably assured of exercise because non-renewal would create an economic penalty. Additionally, we review leases for which we are involved in construction to determine whether build-to-suit and sale-leaseback criteria are met. For those leases
F-9
Table of Contents
Index to Financial Statements
that trigger specific build-to-suit accounting, developer assets are recorded during the construction period with an offsetting liability as financing lease obligations.
Assets we acquire as lessee under capital leases are stated at the lower of the present value of future minimum lease payments or fair market value at the date of inception of the lease. Capital lease assets are amortized using the straight-line method over the shorter of the useful life of the asset or the underlying lease term.
We record rent expense and income from operating leases that contain rent holidays or scheduled rent increases on a straight-line basis over the lease term. Contingent rentals are generally based on sales levels in excess of stipulated amounts, and thus are not considered minimum lease payments at lease inception.
Favorable and unfavorable operating leases are recorded in connection with the acquisition method of accounting. Favorable leases represents the asset in excess of the approximate fair market value of the leases as of the date assumed. Unfavorable leases represents the liability in excess of the approximate fair market value of the leases as of the date assumed. We amortize favorable and unfavorable leases on a straight-line basis over the remaining term of the leases, as determined at the acquisition date. Upon early termination of a lease, the write-off of the favorable or unfavorable lease carrying value associated with the lease is recognized as a loss or gain within other operating expenses in the consolidated statements of operations. Amortization of favorable and unfavorable leases on Company restaurants is included in operating costs within company restaurant operating expenses in the consolidated statements of operations.
| (o) | Goodwill and Indefinite-Lived Intangible Assets |
Goodwill and indefinite-lived intangible assets are not amortized, but are tested for impairment on an annual basis or more frequently when circumstances arise indicating that a particular asset may be impaired. Goodwill represents the excess of the cost of the business acquired over the fair value of its net assets at the date of acquisition. The Company accounts for goodwill under ASC 350, Intangibles—Goodwill and Other, which requires that goodwill and indefinite-lived intangible assets, primarily the Bojangles’ brand (“Brand”), are not amortized but tested for impairment at least annually or more frequently if events or changes in circumstances indicate that the asset might be impaired.
The Company performs its annual impairment review of goodwill and Brand at December 1 and when a triggering event occurs between annual impairment tests and records any resulting impairment. An impairment occurs if the carrying amount of goodwill or Brand exceeds the estimated fair value.
The impairment evaluation for goodwill includes a comparison of the fair value of the Company’s reporting unit with the carrying value. The Company’s reporting unit is deemed to be Bojangles’, Inc. as the Company is operating under one segment. The Company estimates the fair value of its reporting unit using a discounted cash flow model. The operating assumptions used in the discounted cash flow model are generally consistent with the reporting unit’s past performance and with the projections and assumptions that are used in the Company’s current operating plans. Such assumptions are subject to change as a result of changing economic and competitive conditions. If the reporting unit’s carrying value exceeds its fair value, goodwill is written down to its implied fair value.
The Company has determined that no impairment of goodwill and indefinite-lived intangible assets occurred during the fiscal years ended December 25, 2016, December 27, 2015 and December 28, 2014.
| (p) | Other Intangibles, Net—definite-lived |
Definite-lived intangible assets primarily consist of deferred debt issuance costs, franchise rights, and favorable and unfavorable leases and are amortized over the term of the related debt, franchise contracts, or leases.
F-10
Table of Contents
Index to Financial Statements
The Company’s definite-lived intangible assets (primarily franchise rights) are amortized on a straight-line basis up to 38 years based on the remaining life of the original franchise agreement or lease agreement.
| (q) | Income Taxes |
Amounts in the financial statements related to income taxes are calculated using the principles of ASC Topic 740, Income Taxes. Deferred tax assets and liabilities are recognized for the future tax consequences attributable to differences between the financial statements carrying amounts of existing assets and liabilities and their respective tax bases and operating loss and tax credit carry forwards. Deferred tax assets and liabilities are measured using enacted tax rates expected to apply to taxable income in the years in which those temporary differences are expected to be recovered or settled. The effect on deferred tax assets and liabilities of a change in tax rates is recognized in income in the period that includes the enactment date.
We recognize positions taken or expected to be taken in a tax return, in the financial statements when it is more likely than not (i.e., a likelihood of more than fifty percent) that the position would be sustained upon examination by tax authorities. A recognized tax position is then measured at the largest amount of benefit with greater than fifty percent likelihood of being realized upon ultimate settlement. Changes in recognition or measurement are reflected in the period in which the change in judgment occurs. The Company records interest related to uncertain tax positions in interest expense and penalties in general and administrative expenses. The Company’s uncertain tax positions are not significant.
In November 2015, the Financial Standards Accounting Board (“FASB”) issued Accounting Standards Update (“ASU”) No. 2015-17, Income Taxes (Topic 740): Balance Sheet Classification of Deferred Taxes (“ASU 2015-17”). ASU 2015-17 requires that deferred tax liabilities and assets be classified as noncurrent in a classified statement of financial position. The Company adopted ASU 2015-17 during the first fiscal quarter of 2016 on a prospective basis, and accordingly, has classified its deferred tax liabilities and assets as of December 25, 2016 as noncurrent.
| (r) | Closed Store Obligation |
The Company records obligations for closed stores that are under long-term lease agreements in accordance with ASC 420-10, Exit or Disposal Cost Obligations. The obligation represents an estimate of the fair value of the remaining obligation, which is determined by calculating the present value of the remaining non-cancelable lease payments after the anticipated closing date, net of estimated subtenant income (if applicable). In addition, estimates of future property tax and maintenance expenditures for vacant stores through their remaining lease terms are included in the obligation for closed stores. The closed store obligations are paid over the lease terms associated with the closed stores, unless settled earlier. Bojangles’ management estimates the subtenant income and future cash flows based on its historical experience and knowledge of (i) the market in which the store is located, (ii) the results of its previous efforts to dispose of similar assets, and (iii) the current economic conditions. Adjustments to closed store obligations primarily relate to changes in subtenants and actual costs differing from original estimates. Adjustments are made for changes in estimates in the period in which the change becomes known. Any excess store closing obligation remaining upon settlement of the obligation is reversed to income in the period that such settlement is determined.
| (s) | Comprehensive Income (Loss) |
Comprehensive income (loss) is net income plus the change in fair value of the Company’s cash flow hedges, net of income taxes, discussed in Note 2. Amounts included in accumulated other comprehensive income (loss) for the Company’s derivative instruments are recorded net of the related income tax effects.
F-11
Table of Contents
Index to Financial Statements
As of December 25, 2016, December 27, 2015 and December 28, 2014, accumulated other comprehensive income consisted of net unrealized gains on interest rate swap agreements. See Note 2 for further discussion of the Company’s interest rate swap agreements.
| (t) | Revenue Recognition |
The Company generates revenues from two sources: (i) retail sales at company-operated restaurants; and (ii) franchise revenues, consisting of royalties based on a percentage of sales reported by franchise restaurants and franchise fees paid by franchisees.
Revenue of Company-operated restaurants is primarily recognized as customers pay for products at the point of sale. The Company reports revenue net of sales and use taxes collected from customers and remitted to governmental taxing authorities.
The Company accounts for initial franchisee fees in accordance with ASC 952, Franchisors. The Company grants individual restaurant franchises to operators in exchange for initial franchise license fees and continuing royalty payments. Franchise license fees are deferred when received and recognized as revenue when the related restaurant begins operations. Continuing franchise royalty revenues are recognized on the accrual basis and are based on a percentage of monthly sales, generally ranging from 3% to 4% for franchisees operating within the United States of America, and 5% for franchisees with operations in other countries.
| (u) | Store Opening Costs |
All costs, both direct and indirect, incurred to open Company-operated stores, such as new employee training, initial print materials, marketing, payroll expenses and rent incurred in connection with new restaurant openings are expensed in the period incurred.
| (v) | Rent Expense |
Rent expense for operating leases that contain rent holidays or scheduled rent increases is recognized on a straight-line basis over the term of the respective lease. Contingent rentals are generally based on sales levels in excess of stipulated amounts, and thus are not considered minimum lease payments at lease inception. The Company amortizes favorable and unfavorable leases on a straight-line basis over the remaining term of the leases. Upon early termination of a lease, the write-off of the favorable or unfavorable lease carrying value associated with the lease is recognized as a loss or gain in the consolidated statements of operations and comprehensive income.
| (w) | Advertising Costs |
Company restaurants and franchise restaurants contribute to various advertising funds that we manage. The franchise portion of contributions to the marketing development fund and various co-operative advertising funds the Company manages has no impact on our statement of operations and comprehensive income. All domestic franchise restaurants contribute to the marketing development fund managed by the Company. Franchisees contributed $4.8 million, $4.5 million and $4.1 million to the marketing development fund for the fiscal years ended December 25, 2016, December 27, 2015 and December 28, 2014, respectively. The marketing development fund had $0.1 million, $0 and $0.4 million in unspent funds from both franchise and Company contributions included in the consolidated balance sheets as of December 25, 2016, December 27, 2015 and December 28, 2014, respectively. Various franchise restaurants contribute to various co-operative advertising funds managed by the Company. Franchisees contributed $6.0 million, $5.3 million and $4.5 million to various co-operative advertising funds managed by the Company for the fiscal years ended December 25, 2016, December 27, 2015 and December 28, 2014, respectively, and $0.1 million,
F-12
Table of Contents
Index to Financial Statements
$0.1 million and $17 thousand of unspent funds were included in the consolidated balance sheets as of December 25, 2016, December 27, 2015 and December 28, 2014, respectively. Advertising and promotional costs incurred by the Company are expensed in the period incurred.
| (x) | Employee Benefit Plans |
The Company adopted a defined contribution plan, the “401(k) Plan.” Under the provisions of the plan, the Company currently matches 50% of the first 5% of the employee contributions to the 401(k) Plan. Participants are 100% vested in their own contributions.
The Company’s rabbi trust plan is a non-qualified deferred compensation plan which allows certain eligible employees to defer a portion of their base salary and variable compensation each plan year. To offset its obligation, the Company has established fully funded participant directed investment accounts.
| (y) | Stock-Based Compensation |
Under the provisions of ASC 718, Compensation—Stock Compensation, compensation is recorded for awards of stock based on the fair value of the shares at the date of grant, net of estimated forfeitures, less the amount that the employee is required to pay.
The fair value of each option award is estimated using a Black-Scholes-Merton option-pricing model. The fair value of stock-based compensation is amortized either on the graded vesting attribution method or on the cliff vesting attribution method depending on the specific award.
In the fiscal years ended December 25, 2016, December 27, 2015 and December 28, 2014, the stock-based compensation expense of $1.8 million, $2.0 million and $1.4 million, respectively is included in general and administrative expenses in the consolidated statements of operations and comprehensive income.
| (z) | Computation of Net Income per Share |
Basic net income per share is computed by dividing net income by the weighted daily average number of shares of common stock outstanding during the period. In periods when the Company generates net income from continued operations, diluted net income per share is based upon the weighted daily average number of shares of common stock outstanding for the period plus dilutive potential common shares including stock options, restricted stock units, and warrants to purchase common stock, using the treasury-stock method and from convertible stock using the “if converted” method.
| (aa) | New Accounting Pronouncements |
In May 2014, the FASB issued ASU No. 2014-09, Revenue from Contracts with Customers (“ASU 2014-09”). This update was issued to replace the current revenue recognition guidance, creating a more comprehensive revenue model. This update was originally to be effective in fiscal periods beginning after December 15, 2016 and early application was not permitted. In July 2015, the FASB affirmed its proposal to defer the effective date by one year to annual reporting periods beginning after December 15, 2017. The FASB also affirmed its proposal to permit early adoption of the standard, but not before the original effective date of December 15, 2016. The Company will not early adopt ASU 2014-09. ASU 2014-09 permits two transition approaches: retrospective or modified retrospective. The Company is still evaluating its transition approach and expects to reach a decision in the first half of fiscal 2017. The Company has completed a preliminary review of ASU 2014-09 and does not expect the adoption of ASU 2014-09 to have a material impact on its company restaurant revenues or franchise royalty revenues. The Company expects the adoption of ASU 2014-09 will require the
F-13
Table of Contents
Index to Financial Statements
Company to recognize initial and renewal franchisee fees on a straight-line basis over the life of the franchise agreement, which will impact its other franchise revenues. In addition, the Company anticipates funds contributed by franchisees to the advertising funds managed by the Company, as well as the associated advertising fund expenditures, will be reported on a gross basis, and the advertising fund revenues and expenses may be reported in different periods.
In July 2015, the FASB issued ASU 2015-11, Inventory (Topic 330) (“ASU 2015-11”). The pronouncement was issued to simplify the measurement of inventory and changes the measurement from lower of cost or market to lower of cost and net realizable value. This pronouncement is effective for reporting periods beginning after December 15, 2016. The adoption of ASU 2015-11 is not expected to have a significant impact on the Company’s consolidated financial statements.
In February 2016, the FASB issued ASU 2016-02, Leases (Topic 842) (“ASU 2016-02”), which requires lessees to recognize leases on-balance sheet and disclose key information about leasing arrangements. ASU 2016-02 establishes a right-of-use model (“ROU”) that requires a lessee to recognize a ROU asset and corresponding lease liability on the balance sheet for all leases with a term longer than twelve months. Leases will be classified as finance or operating, with classification affecting the pattern and classification of expense recognition in the statement of operations. ASU 2016-02 is effective for annual periods beginning after December 15, 2018, including interim periods within those fiscal years, with early adoption permitted. The Company expects to adopt ASU 2016-02 on December 31, 2018, which is the first day of its fiscal 2019. A modified retrospective transition is required for leases existing at, or entered into after, the beginning of the earliest comparative period presented in the financial statements, with certain practical expedients available. The Company expects that ASU 2016-02 will have a material effect on its financial statements. While the Company is continuing to assess the impact of adoption, it currently believes the most significant changes relate to (1) the recognition of new ROU assets and lease liabilities on the Company’s balance sheet for real estate and equipment operating leases and (2) the derecognition of existing assets and liabilities for certain assets under construction in build-to-suit lease arrangements that the Company will lease when construction is complete.
In March 2016, the FASB issued ASU 2016-09, Improvements to Employee Share-Based Payment Accounting (“ASU 2016-09”), which simplifies several aspects of the accounting for employee share-based payment transactions. ASU 2016-09 addresses several aspects of the accounting for share-based payment award transactions, including: (a) income tax consequences; (b) classification of awards as either equity or liabilities; and (c) classification on the statement of cash flows. ASU 2016-09 is effective for fiscal years beginning after December 15, 2016, including interim periods within those fiscal years. Early adoption is permitted. The Company will adopt ASU 2016-09 prospectively during the first fiscal quarter of 2017. The Company believes the adoption of ASU 2016-09 will cause volatility in its effective tax rates and diluted net income per share due to the tax effects related to share-based payments being recorded to the consolidated statement of operations and comprehensive income. The volatility in future periods will depend on the Company’s stock price on the date awards are exercised or vest and the number of awards that are exercised or vest in each period. In addition, the Company believes the adoption of ASU 2016-09 will result in an increase in the weighted average number of common shares outstanding used for computing diluted net income per share as tax effects related to share-based payments will no longer be considered assumed proceeds when calculating dilutive potential common shares using the treasury-stock method.
The FASB has recently issued or discussed a number of proposed standards on such topics as consolidation, financial statement presentation, financial instruments and hedging. Some of the proposed changes are significant and could have a material impact on our reporting. The Company has not yet fully evaluated the potential impact of all these proposals, but will make such an evaluation as the standards are finalized.
F-14
Table of Contents
Index to Financial Statements
| (2) | Long-Term Debt |
Long-term debt consist of the following (in thousands):
| December 25, 2016 |
December 27, 2015 |
|||||||
| Term Loan |
$ | 157,458 | 200,194 | |||||
| Revolving line of credit |
— | — | ||||||
|
|
|
|
|
|||||
| Total long-term debt |
157,458 | 200,194 | ||||||
| Less: Current maturities of long term debt |
(2,132 | ) | — | |||||
| Less: Deferred debt issuance costs, net |
(1,696 | ) | (2,459 | ) | ||||
|
|
|
|
|
|||||
| Long-term debt, less current maturities and deferred debt issuance costs, net |
$ | 153,630 | 197,735 | |||||
|
|
|
|
|
|||||
| December 25, 2016 |
December 27, 2015 |
|||||||
| Deferred debt issuance costs |
$ | 4,809 | 4,809 | |||||
| Less: Accumulated amortization |
(3,113 | ) | (2,350 | ) | ||||
|
|
|
|
|
|||||
| Deferred debt issuance costs, net |
$ | 1,696 | 2,459 | |||||
|
|
|
|
|
|||||
Estimated future amortization expense of deferred debt issuance costs is as follows (in thousands):
| For the fiscal year ended: |
||||
| 2017 |
$ | 467 | ||
| 2018 |
455 | |||
| 2019 |
441 | |||
| 2020 |
333 | |||
| 2021 |
— | |||
| Thereafter |
— | |||
|
|
|
|||
| Total |
$ | 1,696 | ||
|
|
|
| (a) | Term Loan and Revolving Line of Credit |
On October 9, 2012, the Company entered into a credit agreement (“Credit Agreement”) with several financial institutions, collateralized by all of the assets of the Company. The Credit Agreement, provided for borrowings under a term loan of $175.0 million and a revolving line of credit up to $25.0 million with a maturity date of October 9, 2017. On May 15, 2013, the Credit Agreement was amended for an additional term loan to allow the Company to borrow an additional $50.0 million, the proceeds of which were used to fund a distribution to the Series A Preferred Stock stockholders of the Company. On April 11, 2014, the Credit Agreement was amended for an additional term loan to allow the Company to borrow an additional $50.0 million with a maturity date on the term loan and revolver extended to October 9, 2018, the proceeds of which were used to fund a distribution to the Series A Preferred Stock stockholders of the Company.
On July 23, 2015, in order to permit the Merger, the Company entered into Amendment No. 3 to the Credit Agreement (“Amendment No. 3”). Amendment No. 3, among other things, deemed the Company (as successor-in-interest to BHIH), as of the Merger effective date, to be a party to the Credit Agreement as a “Guarantor” and “Loan Party” thereunder.
The Credit Agreement was further amended on September 25, 2015 (“Amendment No. 4”), to, among other things, extend the maturity date on the Credit Agreement for two additional years to October 9, 2020 and lower the Applicable Rate (as defined in Amendment No. 4).
F-15
Table of Contents
Index to Financial Statements
The Credit Agreement was further amended on October 19, 2016 (“Amendment No. 5”) to, among other things, increase allowable indebtedness associated with capital lease obligations, synthetic lease obligations and purchase money obligations, as well as to increase allowable cash capital expenditures during each fiscal year.
During the term of the Credit Agreement, the Company is allowed to borrow amounts under base rate or Eurodollar rate loans. Base rate loans are charged interest at the higher of the Bank of America’s prime rate, the Federal Funds Rate plus 0.50%, or the LIBOR rate for one month loans plus 1.00% and an applicable rate. The applicable rate for base rate loans was 1.00% and 1.25% as of December 25, 2016 and December 27, 2015, respectively. As of December 25, 2016 and December 27, 2015, Bank of America’s prime rate was the highest of the three rates at 3.75% as of December 25, 2016 and 3.50% as of December 27, 2015 that resulted in a total interest rate of 4.75% as of both December 25, 2016 and December 27, 2015. Interest on base rate loans is due on each calendar quarter end, with the same principal maturity date as the Credit Agreement. Base rate loans may be repaid or converted to a Eurodollar rate loan at any time during the term of the Credit Agreement without penalty.
Eurodollar rate loans may be entered or converted into one, two, three, or six month periods. The Eurodollar rate loans are charged interest at the LIBOR rate on the effective date for the period selected, plus an applicable rate. The applicable rate for Eurodollar rate loans was 2.00% and 2.25% as of December 25, 2016 and December 27, 2015, respectively. As of December 25, 2016, the one, two, three, and six month LIBOR rates were 0.76%, 0.81%, 1.00%, and 1.32%, respectively. As of December 27, 2015, the one, two, three, and six month LIBOR rates were 0.42%, 0.51%, 0.60%, and 0.83%, respectively. As the Eurodollar rate loans mature, they may be converted into new Eurodollar rate loans, converted into base rate loans or repaid.
As of December 25, 2016, there were outstanding balances under the term loan in one-month Eurodollar loans of $157.5 million, all of which were accruing interest at a rate of approximately 2.61%. As of December 27, 2015, there were outstanding balances under the term loan in one-month Eurodollar loans of $200.2 million, all of which were accruing interest at a rate of approximately 2.48%.
As of December 25, 2016 and December 27, 2015, there were no outstanding balances under the revolving line of credit.
| (b) | Debt Covenants |
Pursuant to the Credit Agreement, certain covenants restrict the Company from exceeding a maximum consolidated total lease adjusted leverage ratio, require the Company to maintain a minimum consolidated fixed charge coverage ratio, and place certain limitations on cash capital expenditures. The Company was not in violation of any covenants under the Credit Agreement as of December 25, 2016.
| (c) | Contractual Principal Payments |
Contractual aggregate required principal payments on the term loans payable at December 25, 2016 are as follows (in thousands):
| For the fiscal year ended: |
||||
| 2017 |
$ | 2,132 | ||
| 2018 |
6,396 | |||
| 2019 |
9,465 | |||
| 2020 |
139,465 | |||
| 2021 |
— | |||
| Thereafter |
— | |||
|
|
|
|||
| Total |
$ | 157,458 | ||
|
|
|
F-16
Table of Contents
Index to Financial Statements
| (d) | Interest Rate Swap Agreements |
In order to minimize the effect of changes in LIBOR under the Credit Agreement, the Company has entered into three variable-to-fixed interest rate swap agreements. On May 17, 2013, the Company entered into an interest rate swap contract with an effective date of November 30, 2015, a termination date of September 29, 2017 and a notional amount of $50.0 million, under which the Company pays a fixed interest rate of 1.3325% and receives the one-month LIBOR rate. Also on May 17, 2013, the Company entered into a second interest rate swap contract with an effective date of May 31, 2013, a termination date of May 31, 2017 and a notional amount of $25.0 million, under which the Company pays interest fixed at 0.70125% and receives the one-month LIBOR rate. On October 26, 2015, the Company entered into a third interest rate swap contract with an effective date of October 30, 2015, a termination date of October 31, 2019 and a notional amount of $50.0 million, under which the Company pays interest fixed at 1.115% and receives the one-month LIBOR rate.
The activity in accumulated other comprehensive income is as follows (in thousands):
| Fiscal Year Ended | ||||||||
| December 25, 2016 |
December 27, 2015 |
|||||||
| Opening balance, accumulated other comprehensive income |
$ | 19 | 146 | |||||
| Unrealized gain (loss) from effective interest rate swaps, net of tax |
227 | (127 | ) | |||||
|
|
|
|
|
|||||
| Ending balance, accumulated other comprehensive income |
$ | 246 | 19 | |||||
|
|
|
|
|
|||||
| (3) | Leases |
The Company’s agreement with a financial institution providing up to $3.5 million for leasing of equipment that was originally scheduled to expire on March 1, 2016 was initially extended to September 30, 2016. As the Company had utilized all capacity under this agreement, on June 27, 2016, the financial institution increased the capacity under this agreement by an additional $8.1 million and further extended the expiration of the agreement to June 1, 2017. Under this leasing arrangement, each of the scheduled leases has a 60-month term, a fixed interest rate equal to the interest rate swap for a 2.61 year weighted average life as published by the Bloomberg Swap report on the lease commencement date for the specific equipment project plus 300 basis points, and a bargain purchase option at the end of the lease of $1. As a result of the bargain purchase option, the Company has classified the leases under this leasing arrangement as capital leases.
The Company’s agreement with another financial institution providing up to $1.4 million for leasing of equipment expired on April 30, 2016. Under this leasing arrangement, each of the scheduled leases had a 60-month term, a fixed interest rate equal to the 32-month interpolated interest rate swap on the lease commencement date for the specific equipment project plus 391 basis points, and a bargain purchase option at the end of the lease of $1. On April 22, 2016, the Company entered into a new agreement with the financial institution providing up to $2.0 million for leasing of equipment, which is scheduled to expire on April 30, 2017. Under this leasing arrangement, each of the scheduled leases has a 60-month term, a fixed interest rate equal to the 3-year interest rate swap on the lease commencement date for the specific equipment project plus 290 basis points, and a bargain purchase option at the end of the lease of $1. On October 11, 2016, the Company entered into a new agreement with the financial institution providing up to $2.1 million for leasing of equipment, which is scheduled to expire on September 30, 2017. Under this leasing arrangement, each of the scheduled leases has a 60-month term, a fixed interest rate equal to the 3-year interest rate swap on the lease commencement date for the specific equipment project plus 290 basis points, and a bargain purchase option at the end of the lease of $1. As a result of the bargain purchase option, the Company has classified the leases under these leasing arrangements as capital leases.
On August 15, 2016, the Company entered into an agreement with a third financial institution providing up to $3.0 million for leasing of equipment, which is scheduled to expire on June 30, 2017. Under this leasing
F-17
Table of Contents
Index to Financial Statements
arrangement, each of the scheduled leases has a 60-month term, a fixed interest rate equal to the average of two- and three-year interest rate swap rates as published by the Bloomberg Swap report on the lease commencement date for the specific equipment project plus 300 basis points, and a bargain purchase option at the end of the lease of $1. As a result of the bargain purchase option, the Company has classified the leases under this leasing arrangement as capital leases.
Various lease agreements provide for contingent rent based on the excess of a percentage of annual sales over minimum annual rent. Annual rents on other restaurants are based on a percentage of restaurant revenue with no stated minimum.
Total rent expense, which is included in operating costs in the consolidated statements of operations and comprehensive income, was as follows (in thousands):
| Fiscal Year Ended | ||||||||||||
| December 25, 2016 |
December 27, 2015 |
December 28, 2014 |
||||||||||
| Minimum land, building, equipment, and auto rental expense |
$ | 39,177 | 34,781 | 30,763 | ||||||||
| Contingent and percentage rental expense |
978 | 1,017 | 943 | |||||||||
|
|
|
|
|
|
|
|||||||
| Subtotal |
40,155 | 35,798 | 31,706 | |||||||||
| Less subleases |
(1,436 | ) | (1,570 | ) | (1,867 | ) | ||||||
|
|
|
|
|
|
|
|||||||
| Total rent expense |
$ | 38,719 | 34,228 | 29,839 | ||||||||
|
|
|
|
|
|
|
|||||||
The following is a schedule by years of future minimum rental payments required under operating leases that have initial or remaining non-cancelable lease terms in excess of one year, and the future minimum lease payments under capital leases together with the present value of the net minimum capital lease payments (in thousands):
| Capital Leases |
Operating Leases |
Total | ||||||||||
| For the fiscal year ending: |
||||||||||||
| 2017 |
$ | 8,832 | 39,611 | 48,443 | ||||||||
| 2018 |
7,986 | 38,340 | 46,326 | |||||||||
| 2019 |
6,639 | 37,516 | 44,155 | |||||||||
| 2020 |
4,627 | 36,405 | 41,032 | |||||||||
| 2021 |
2,469 | 34,280 | 36,749 | |||||||||
| Thereafter |
3,974 | 198,225 | 202,199 | |||||||||
|
|
|
|
|
|
|
|||||||
| Future minimum lease payments |
34,527 | $ | 384,377 | 418,904 | ||||||||
|
|
|
|
|
|||||||||
| Less amounts representing interest |
(4,704 | ) | ||||||||||
|
|
|
|||||||||||
| Present value of net minimum capital lease payments |
29,823 | |||||||||||
| Less current portion |
(7,299 | ) | ||||||||||
|
|
|
|||||||||||
| Noncurrent portion |
$ | 22,524 | ||||||||||
|
|
|
|||||||||||
The total future minimum lease payments include guaranteed residual values of $0.8 million related to various leased vehicles. The total future minimum lease payments have not been reduced by the future minimum sublease rentals due from lessees.
F-18
Table of Contents
Index to Financial Statements
The following are the future minimum sublease rentals due from lessees (in thousands):
| For the fiscal year ended: |
||||
| 2017 |
$ | 1,142 | ||
| 2018 |
872 | |||
| 2019 |
728 | |||
| 2020 |
593 | |||
| 2021 |
375 | |||
| Thereafter |
681 | |||
|
|
|
|||
| Total |
$ | 4,391 | ||
|
|
|
Favorable leases, net of accumulated amortization totaled $1.0 million and $1.4 million as of December 25, 2016 and December 27, 2015, respectively. Unfavorable leases, net of accumulated amortization totaled $1.5 million and $1.8 million as of December 25, 2016 and December 27, 2015, respectively. Amortization of favorable and unfavorable leases on Company restaurants was $0.1 million, $0.1 million and $0.2 million for the fiscal years ended December 25, 2016, December 27, 2015 and December 28, 2014, respectively. The Company also recognized a loss for the termination of favorable leases of $24 thousand, $0.1 million and $0 in the consolidated statements of operations and comprehensive income for the fiscal years ended December 25, 2016, December 27, 2015 and December 28, 2014, respectively.
Estimated future amortization expense (benefit) of favorable and unfavorable leases is as follows (in thousands):
| For the fiscal year ended: |
||||
| 2017 |
$ | 25 | ||
| 2018 |
9 | |||
| 2019 |
(45 | ) | ||
| 2020 |
(142 | ) | ||
| 2021 |
(127 | ) | ||
| Thereafter |
(266 | ) | ||
|
|
|
|||
| Total |
$ | (546 | ) | |
|
|
|
| (4) | Stockholders’ Equity |
As of December 25, 2016, the Company is authorized to issue 150.0 million shares of $0.01 par value common stock and 25.0 million shares of $0.01 par value preferred stock. As of December 25, 2016, there were 36.5 million shares of the Company’s common stock outstanding. As of December 25, 2016, there were no shares of the Company’s preferred stock outstanding.
On May 13, 2015, the Company completed its initial public offering of approximately 8.9 million shares of common stock at a price to the public of $19.00 per share (the “IPO”), including approximately 1.2 million shares sold to the underwriters pursuant to their option to purchase additional shares. All of the shares of the Company’s common stock offered as part of the IPO were sold by selling stockholders. Accordingly, the Company did not receive any proceeds from the sale of the shares. Prior to the consummation of the IPO (i) a 359.03843-for-1 stock split of the Company’s common stock was effected (subject to rounding to eliminate any fractional shares), (ii) the conversion ratio of the Company’s Series A Preferred Stock was automatically adjusted as a result of the stock split in accordance with certain anti-dilution provisions in the Company’s certificate of incorporation and (iii) each share of the Company’s Series A Preferred Stock converted into 359.03843 shares of the Company’s common stock (subject to rounding to eliminate any fractional shares). All share and per-share data herein have been adjusted to reflect the stock split as though it had occurred prior to the earliest data presented.
Holders of the Company’s common stock are entitled to (i) one vote for each share held of record on all matters submitted to a vote of stockholders, (ii) receive ratably any dividends, when and if declared by the
F-19
Table of Contents
Index to Financial Statements
board of directors out of funds legally available therefore and (iii) receive ratably, based on the number of shares of common stock held, the remaining assets available for distribution, after payment in full of all amounts required to be paid to creditors and to the holders of preferred stock having liquidation preferences, if any.
| (5) | Fair Value Measurements |
The following methods and assumptions were used to estimate the fair value of each class of financial instruments:
| • | Cash and cash equivalents, trade accounts and vendor receivables, other assets (nonderivatives), notes payable to financial institutions, trade accounts payable, and accrued expenses (nonderivatives): The carrying amounts, at face value or cost plus accrued interest, approximate fair value because of the short maturity of these instruments. |
| • | Interest rate swaps: The fair value of interest rate swaps is determined using an income approach using the following significant inputs: the term of the swaps, the notional amount of the swaps, the rate on the fixed leg of the swaps and counterparty credit worthiness. There were three interest rate swaps outstanding as of December 25, 2016. |
The following table presents financial assets and liabilities measured at fair value on a recurring basis, which include derivatives designated as cash flow hedging instruments, and other investments, which consists of money market accounts and mutual funds held in a rabbi trust established by the Company to fund a portion of the Company’s current and future obligations under its deferred compensation plan (in thousands):
| Carrying value |
Quoted Prices in active markets for identical instruments (Level 1) |
Significant other observable inputs (Level 2) |
Significant unobservable inputs (Level 3) |
|||||||||||||
| Fair value measurement as of December 25, 2016: |
||||||||||||||||
| Investments for nonqualified deferred compensation plan (included with other noncurrent assets on the consolidated balance sheets) |
$ | 3,112 | 3,112 | — | — | |||||||||||
| Interest rate swap (included with other current assets and other noncurrent assets on the consolidated balance sheets) |
561 | — | 561 | — | ||||||||||||
| Interest rate swap (included with other current liabilities on the consolidated balance sheets) |
(166 | ) | — | (166 | ) | — | ||||||||||
| Fair value measurement as of December 27, 2015: |
||||||||||||||||
| Investments for nonqualified deferred compensation plan (included with other noncurrent assets on the consolidated balance sheets) |
$ | 2,628 | 2,628 | — | — | |||||||||||
| Interest rate swap (included with other noncurrent assets on the consolidated balance sheets) |
437 | — | 437 | — | ||||||||||||
| Interest rate swap (included with other noncurrent liabilities on the consolidated balance sheets) |
(405 | ) | — | (405 | ) | — | ||||||||||
There were no transfers into or out of Level 1 and Level 2 fair value measurements during the fiscal years ended December 25, 2016 and December 27, 2015.
The Company’s investments for the nonqualified deferred compensation plan are comprised of investments held in a rabbi trust. These investments consist of money market funds and mutual funds and the fair value measurements are derived using quoted prices in active markets for the specific funds which are based on Level 1 inputs of the fair value hierarchy.
F-20
Table of Contents
Index to Financial Statements
The Company’s interest rate swaps are valued using a discounted cash flow analysis that incorporates observable market parameters, such as interest rate yield curves and currency rates, classified as Level 2 within the valuation hierarchy. Derivative valuations incorporate credit risk adjustments that are necessary to reflect the probability of default by us or the counterparty.
| (6) | Accounts and Vendor Receivables, Net |
Accounts and vendor receivables consist of the following (in thousands):
| December 25, 2016 |
December 27, 2015 |
|||||||
| Accounts receivable |
$ | 3,269 | 3,097 | |||||
| Vendor receivables |
2,287 | 1,968 | ||||||
| Allowance for doubtful accounts |
(135 | ) | (329 | ) | ||||
|
|
|
|
|
|||||
| Accounts and vendor receivables, net |
$ | 5,421 | 4,736 | |||||
|
|
|
|
|
|||||
| Accounts receivable, related parties |
$ | 408 | 425 | |||||
| Allowance for doubtful accounts |
(22 | ) | (22 | ) | ||||
|
|
|
|
|
|||||
| Accounts receivable, related parties, net |
$ | 386 | 403 | |||||
|
|
|
|
|
|||||
| The change in allowances for doubtful accounts is as follows: |
||||||||
| Beginning balance |
$ | 351 | 205 | |||||
| Bad debt (benefit) expense, net |
(72 | ) | 239 | |||||
| Write-offs and other |
(122 | ) | (93 | ) | ||||
|
|
|
|
|
|||||
| Ending balance |
$ | 157 | 351 | |||||
|
|
|
|
|
|||||
| (7) | Inventories, Net |
Inventories, net consist of the following (in thousands):
| December 25, 2016 |
December 27, 2015 |
|||||||
| Food, net |
$ | 2,612 | 2,421 | |||||
| Paper, net |
714 | 659 | ||||||
|
|
|
|
|
|||||
| Inventories, net |
$ | 3,326 | 3,080 | |||||
|
|
|
|
|
|||||
| (8) | Other Current Assets |
Other current assets consist of the following (in thousands):
| December 25, 2016 |
December 27, 2015 |
|||||||
| Income taxes refundable |
$ | 1,505 | 2,887 | |||||
| Prepaid expenses |
1,517 | 1,076 | ||||||
| Interest rate swap asset |
11 | — | ||||||
| Deferred income taxes |
— | 1,676 | ||||||
|
|
|
|
|
|||||
| Other current assets |
$ | 3,033 | 5,639 | |||||
|
|
|
|
|
|||||
F-21
Table of Contents
Index to Financial Statements
| (9) | Property and Equipment, Net |
Property and equipment, net consist of the following (in thousands):
| Useful lives | December 25, 2016 |
December 27, 2015 |
||||||||||
| Land |
— | $ | 1,509 | 1,509 | ||||||||
| Buildings |
Up to 40 years | 1,330 | 1,330 | |||||||||
| Furniture, fixtures and equipment |
Up to 5 years | 18,342 | 16,798 | |||||||||
| Computer hardware and software |
Up to 5 years | 9,673 | 8,780 | |||||||||
| Leasehold improvements |
Up to 20 years | 25,171 | 22,987 | |||||||||
| Capital leases, buildings |
Lesser of lease term or 40 years | 8,286 | 8,553 | |||||||||
| Capital leases, equipment |
Lesser of lease term or 5 years | 28,707 | 22,956 | |||||||||
| Capital leases, automobiles |
Lesser of lease term or 5 years | 3,478 | 3,297 | |||||||||
|
Construction-in-progress |
— | 8,086 | 3,408 | |||||||||
|
|
|
|
|
|||||||||
| Total |
104,582 | 89,618 | ||||||||||
| Less: |
||||||||||||
| Accumulated depreciation |
(33,462 | ) | (26,830 | ) | ||||||||
| Accumulated amortization |
(18,845 | ) | (14,651 | ) | ||||||||
|
|
|
|
|
|||||||||
| Property and equipment, net |
$ | 52,275 | 48,137 | |||||||||
|
|
|
|
|
|||||||||
Depreciation and amortization expense related to property and equipment was $14.5 million, $13.2 million and $11.0 million for the fiscal years ended December 25, 2016, December 27, 2015 and December 28, 2014, respectively.
| (10) | Franchise Rights, Net |
Franchise rights are intangible assets recorded at the time of an acquisition. The franchise rights represent the value of existing franchise agreements, and are amortized over the remaining life of the agreements. Franchise rights, net are as follows (in thousands):
| December 25, 2016 |
December 27, 2015 |
|||||||
| Franchise rights, including reacquired franchise rights |
$ | 29,623 | 29,623 | |||||
| Less accumulated amortization |
(5,380 | ) | (4,282 | ) | ||||
|
|
|
|
|
|||||
| Franchise rights, net |
$ | 24,243 | 25,341 | |||||
|
|
|
|
|
|||||
Amortization expense related to franchise rights was $1.1 million, $1.1 million and $1.0 million during the fiscal years ended December 25, 2016, December 27, 2015 and December 28, 2014, respectively, and is included in depreciation and amortization expense in the consolidated statements of operations and comprehensive income.
Estimated future amortization expense is as follows (in thousands):
| For the fiscal year ended: |
||||
| 2017 |
$ | 1,097 | ||
| 2018 |
1,097 | |||
| 2019 |
1,097 | |||
| 2020 |
1,081 | |||
| 2021 |
1,025 | |||
| Thereafter |
18,846 | |||
|
|
|
|||
| Total |
$ | 24,243 | ||
|
|
|
F-22
Table of Contents
Index to Financial Statements
| (11) | Other Noncurrent Assets |
Other noncurrent assets consist of the following (in thousands):
| December 25, 2016 |
December 27, 2015 |
|||||||
| Investments for nonqualified deferred compensation plan |
$ | 3,112 | 2,628 | |||||
| Interest rate swap asset |
550 | 437 | ||||||
| Other noncurrent assets |
907 | 608 | ||||||
|
|
|
|
|
|||||
| Other noncurrent assets |
$ | 4,569 | 3,673 | |||||
|
|
|
|
|
|||||
| (12) | Accrued Expenses |
Accrued expenses consist of the following (in thousands):
| December 25, 2016 |
December 27, 2015 |
|||||||
| Payroll & related |
$ | 9,791 | 12,316 | |||||
| Sales and property taxes |
2,620 | 2,472 | ||||||
| Gift cards |
1,135 | 974 | ||||||
| Utilities |
1,232 | 1,092 | ||||||
| Occupancy |
445 | 481 | ||||||
| Interest |
616 | 715 | ||||||
| Bank fees |
711 | 638 | ||||||
| Other |
1,390 | 398 | ||||||
|
|
|
|
|
|||||
| Accrued expenses |
$ | 17,940 | 19,086 | |||||
|
|
|
|
|
|||||
| (13) | Other Current Liabilities |
Other current liabilities consist of the following (in thousands):
| December 25, 2016 |
December 27, 2015 |
|||||||
| Financing obligations under build-to-suit transactions |
$ | 4,114 | 1,594 | |||||
| Closed store obligation |
110 | 184 | ||||||
| Other |
166 | 377 | ||||||
|
|
|
|
|
|||||
| Other current liabilities |
$ | 4,390 | 2,155 | |||||
|
|
|
|
|
|||||
| (14) | Other Noncurrent Liabilities |
Other noncurrent liabilities consist of the following (in thousands):
| December 25, 2016 |
December 27, 2015 |
|||||||
| Deferred rents |
$ | 7,434 | 5,875 | |||||
| Unfavorable lease liability, net |
1,527 | 1,817 | ||||||
| Deferred compensation |
3,112 | 2,628 | ||||||
| Deferred revenue |
565 | 717 | ||||||
| Closed store obligation |
246 | 356 | ||||||
| Interest rate swap liability |
— | 405 | ||||||
| Other noncurrent liabilities |
53 | 36 | ||||||
|
|
|
|
|
|||||
| Other noncurrent liabilities |
$ | 12,937 | 11,834 | |||||
|
|
|
|
|
|||||
F-23
Table of Contents
Index to Financial Statements
Deferred revenue includes initial franchise license fees that have been received, but for which the Company has not completed its obligations under these franchise agreements; therefore, revenue has not been recognized.
| (15) | Closed Store Obligation |
As of December 25, 2016 and December 27, 2015, the Company had several stores that were either closed and vacant or closed and subleased. The closed store obligation consists of the present value of remaining future minimum lease payments under non-cancelable lease agreements for those stores that were either closed and vacant or closed and subleased less the present value of remaining future minimum lease payments under non-cancelable subleases on those stores. In addition, estimates of future property tax and maintenance expenditures for vacant stores through their remaining lease terms are included in the obligation for closed stores. Any resulting expense or income is included as a component of general and administrative expenses in the accompanying consolidated statements of operations and comprehensive income as the stores are closed. Cash payments are scheduled to continue through 2026.
The change in the closed store obligation is as follows (in thousands):
| December 25, 2016 |
December 27, 2015 |
|||||||
| Closed store obligation, beginning of fiscal year |
$ | 540 | 609 | |||||
| Cash payments for lease obligations, net of cash received on subleases and the change in present value of future lease obligations |
(133 | ) | (105 | ) | ||||
| (Benefit) provision for closed stores |
(51 | ) | 36 | |||||
|
|
|
|
|
|||||
| Closed store obligation, end of fiscal year |
356 | 540 | ||||||
| Less current portion |
(110 | ) | (184 | ) | ||||
|
|
|
|
|
|||||
| Noncurrent closed store obligation |
$ | 246 | 356 | |||||
|
|
|
|
|
|||||
| (16) | Income Taxes |
Income tax expense consist of the following (in thousands):
| Fiscal Year Ended | ||||||||||||
| December 25, 2016 |
December 27, 2015 |
December 28, 2014 |
||||||||||
| Current: |
||||||||||||
| U.S. federal |
$ | 19,344 | 16,021 | 14,387 | ||||||||
| State and local |
2,370 | 2,005 | 2,182 | |||||||||
|
|
|
|
|
|
|
|||||||
| Total current |
21,714 | 18,026 | 16,569 | |||||||||
|
|
|
|
|
|
|
|||||||
| Deferred: |
||||||||||||
| U.S. federal |
$ | (699 | ) | (566 | ) | (987 | ) | |||||
| State and local |
(1,478 | ) | (1,426 | ) | 7 | |||||||
|
|
|
|
|
|
|
|||||||
| Total deferred |
(2,177 | ) | (1,992 | ) | (980 | ) | ||||||
|
|
|
|
|
|
|
|||||||
| Income tax expense |
$ | 19,537 | 16,034 | 15,589 | ||||||||
|
|
|
|
|
|
|
|||||||
F-24
Table of Contents
Index to Financial Statements
Income tax expense for the fiscal years ended December 25, 2016, December 27, 2015 and December 28, 2014 differed from the amounts computed by applying the U.S. federal income tax rate of 35% to pretax income as a result of the following (in thousands):
| Fiscal Year Ended | ||||||||||||||||||||||||
| December 25, | December 27, | December 28, | ||||||||||||||||||||||
| 2016 | 2015 | 2014 | ||||||||||||||||||||||
| Computed “expected” tax expense |
$ | 20,038 | 35.0 | % | $ | 14,896 | 35.0 | % | $ | 14,598 | 35.0 | % | ||||||||||||
| Increase (reduction) in income taxes resulting from: |
||||||||||||||||||||||||
| Work Opportunity and Welfare to Work tax credits, net of federal income tax expense |
(1,355 | ) | (2.4 | %) | (795 | ) | (1.9 | %) | (460 | ) | (1.1 | %) | ||||||||||||
| State and local income taxes, net of federal income tax expense/benefit |
580 | 1.0 | % | 376 | 0.9 | % | 1,423 | 3.4 | % | |||||||||||||||
| Expenses related to public offerings not deductible for income tax purposes |
145 | 0.2 | % | 1,548 | 3.6 | % | — | 0.0 | % | |||||||||||||||
| Meals and entertainment |
32 | 0.1 | % | 27 | 0.1 | % | 20 | 0.1 | % | |||||||||||||||
| Other, net |
97 | 0.2 | % | (18 | ) | 0.0 | % | 8 | 0.0 | % | ||||||||||||||
|
|
|
|
|
|
|
|
|
|
|
|
|
|||||||||||||
| Total |
$ | 19,537 | 34.1 | % | $ | 16,034 | 37.7 | % | $ | 15,589 | 37.4 | % | ||||||||||||
|
|
|
|
|
|
|
|
|
|
|
|
|
|||||||||||||
The tax effects of temporary differences that give rise to significant portions of the deferred tax assets and deferred tax liabilities at December 25, 2016 and December 27, 2015 are presented below (in thousands):
| December 25, 2016 |
December 27, 2015 |
|||||||
| Current deferred tax assets (liabilities): |
||||||||
| Capital lease assets and obligations and property and equipment |
$ | — | 718 | |||||
| Reserves, accruals, and other assets |
— | 1,274 | ||||||
| Discount on early repayment of debt |
— | (592 | ) | |||||
| Accrued vacation |
— | 276 | ||||||
|
|
|
|
|
|||||
| Current deferred tax assets, net |
$ | — | 1,676 | |||||
|
|
|
|
|
|||||
| Noncurrent deferred tax assets (liabilities): |
||||||||
| Brand |
$ | (101,116 | ) | (101,988 | ) | |||
| Franchise rights and other intangible assets |
(15,562 | ) | (15,970 | ) | ||||
| Discount on early repayment of debt |
(1,185 | ) | (1,185 | ) | ||||
| Capital lease assets and obligations and property and equipment |
(1,160 | ) | (1,647 | ) | ||||
| Deferred compensation |
1,177 | 1,000 | ||||||
| Stock-based compensation |
2,354 | 2,099 | ||||||
| Deferred rent |
2,805 | 2,235 | ||||||
| Reserves, accruals, and other assets |
1,375 | 428 | ||||||
|
|
|
|
|
|||||
| Noncurrent deferred tax liabilities, net |
$ | (111,312 | ) | (115,028 | ) | |||
|
|
|
|
|
|||||
There was no valuation allowance for deferred tax assets as of December 25, 2016 and December 27, 2015. In assessing the realizability of deferred tax assets, management considers whether it is more likely than not that some portion or all of the deferred tax assets will not be realized. The ultimate realization of deferred tax assets is dependent upon the generation of future taxable income during the periods in which those temporary differences become deductible. Management considers the scheduled reversal of deferred tax liabilities and projected future taxable income in making this assessment. Based upon the level of historical taxable income and projections of future taxable income over the periods in which the deferred tax assets are deductible, management believes it is more likely than not that the Company will realize the benefits of these deductible differences.
F-25
Table of Contents
Index to Financial Statements
The Company recognizes interest and penalties related to uncertain tax positions in interest expense and general and administrative expenses, respectively. Uncertain tax positions and related interest and penalties on uncertain tax positions for the fiscal years ended December 25, 2016, December 27, 2015 and December 28, 2014 were not significant.
The Company is subject to U.S. federal income tax, as well as income tax of multiple state jurisdictions. The U.S. federal and material state and local tax statutes of limitations remain open for the fiscal years 2013 and forward.
| (17) | Commitments and Contingencies |
| (a) | Litigation |
The Company is subject to various claims and litigation that arise in the normal course of business. Management is of the opinion that, although the outcome of the litigation cannot be predicted with any certainty, the ultimate liability, if any, will not have a material adverse effect on the Company’s financial position, results of operations or cash flows.
| (b) | Concentration of Interest Rate Risk |
Interest rate risk is the exposure to loss resulting from changes in the level of interest rates and the spread between different interest rates. Interest rate risk is highly sensitive due to many factors, including U.S. monetary and tax policies, U.S. and international economic factors and other factors beyond our control. The Company’s credit facility has floating interest rates. The Company is exposed to changes in the level of interest rates and to changes in the relationship or spread between interest rates for our floating rate debt. The Company’s floating rate debt will require payments based on a variable interest rate index such as LIBOR. Therefore, increases in interest rates may reduce the Company’s net income by increasing the cost of the Company’s debt. However, the Company seeks to mitigate some of its floating interest rate risk on long-term debt by entering into fixed pay interest rate derivatives on a portion of our outstanding long-term debt (see Note 2).
| (c) | Concentration of Credit Risk |
Certain financial instruments potentially subject the Company to a concentration of credit risk. These financial instruments consist primarily of cash and cash equivalents and accounts and vendor receivables. The Company places its cash and cash equivalents with high-credit, quality financial institutions. At times, the balances in the accounts exceed the amounts insured by the Federal Deposit Insurance Corporation.
Concentration of credit risk with respect to receivables is primarily limited to franchisees, which are primarily located in the southeastern United States and certain vendors. Royalty revenues from three franchisees, one of which is a related party franchisee, accounted for approximately 44%, 44% and 45% of the Company’s total franchise royalty revenues for the fiscal years ended December 25, 2016, December 27, 2015 and December 28, 2014, respectively. Royalty and franchise fee accounts receivable from three franchisees, one of which is a related party franchisee, accounted for approximately 40% and 44% of the Company’s gross royalty and franchise fee accounts receivable as of December 25, 2016 and December 27, 2015, respectively. The Company continually evaluates and monitors the credit history of its franchisees and believes it has an adequate allowance for bad debts.
| (d) | Concentration of Commodity Price Risk |
The Company purchases certain products that are affected by commodity prices and are, therefore, subject to price volatility caused by weather, market conditions and other factors which are not considered
F-26
Table of Contents
Index to Financial Statements
predictable or within our control. Although these products are subject to changes in commodity prices, certain purchasing contracts or pricing arrangements contain risk management techniques designed to minimize price volatility. The purchasing contracts and pricing arrangements we use may result in unconditional purchase obligations, which are not reflected in our consolidated balance sheets. Typically, the Company uses these types of purchasing techniques to control costs as an alternative to directly managing financial instruments to hedge commodity prices. In many cases, the Company believes it will be able to address material commodity cost increases by adjusting our menu pricing, promotional mix, or changing our product delivery strategy. However, increases in commodity prices, without adjustments to our menu prices, could increase food and supplies costs as a percentage of company restaurant revenues and customers may react negatively to increases in our menu prices which could adversely impact customer traffic and revenues.
| (e) | Debt Guarantees |
Prior to July 25, 2011, a franchisee of the Company assumed a portion of the Company’s then outstanding term debt, which the Company guarantees through 2018. The Company may be required to perform under this guarantee in the event of default or nonperformance by this franchisee. The Company has determined default by the franchisee is unlikely due to their timely and consistent payments; therefore, the Company has not recorded a liability for this note on its consolidated balance sheets. The carrying value of debt covered by this additional guarantee of the Company was $0.1 million as of both December 25, 2016 and December 27, 2015.
| (f) | Sponsorships |
The Company has entered into various sponsorship agreements with original terms of up to ten years to receive certain advertising rights, the use of certain advertising territories, and vendor products as defined in the agreements. These amounts are reflected as operating costs within Company restaurant operating expenses in the consolidated statements of operations and comprehensive income, generally in the year in which the amounts are incurred.
The minimum future payments required under existing sponsorship agreements are as follows (in thousands):
| For the fiscal year ended: |
||||
| 2017 |
$ | 3,517 | ||
| 2018 |
2,721 | |||
| 2019 |
1,898 | |||
| 2020 |
893 | |||
| 2021 |
— | |||
| Thereafter |
— | |||
|
|
|
|||
| Total |
$ | 9,029 | ||
|
|
|
| (18) | Employee Benefit Plans |
| (a) | 401(k) Plan |
The Company sponsors a 401(k) tax deferred savings plan covering employees meeting certain age and service requirements as defined in the plan. Participants can make pretax contributions with the Company matching certain percentages of employee contributions. The total employer matching expense related to the plan was $0.7 million, $0.7 million and $0.6 million for the fiscal years ended December 25, 2016, December 27, 2015 and December 28, 2014, respectively.
F-27
Table of Contents
Index to Financial Statements
| (b) | Deferred Compensation Plan |
The Company has a rabbi trust to invest compensation deferred under our nonqualified deferred compensation plan and fund future deferred compensation obligations. The rabbi trust is subject to creditor claims in the event of insolvency, but the assets held in the rabbi trust are not available for general corporate purposes. This plan allows eligible participants to defer compensation. Deferred compensation, net of accumulated earnings and/or losses on the participant-directed investment options, is distributable in cash at employee specified dates or upon retirement, death, disability or termination from the plan. Realized and unrealized gains and losses on these securities are recorded in the consolidated statements of operations and comprehensive income and offset changes in deferred compensation liabilities to participants. The assets of the plan were $3.1 million and $2.6 million as of December 25, 2016 and December 27, 2015, respectively, and are subject to the Company’s creditors and are included in the accompanying consolidated balance sheets.
| (19) | Net Income per Share |
Basic net income per share is calculated using the weighted-average number of shares of common stock outstanding during the fiscal years ended December 25, 2016 and December 27, 2015. The Company has not presented basic net income per share for the fiscal year ended December 28, 2014 because its historical capital structure makes the presentation of net income per share not meaningful as the Company did not have any shares of common stock outstanding prior to its IPO.
The computation of diluted net income per share assumes the conversion of the outstanding preferred stock into common stock. Diluted net income per share is calculated using the weighted-average number of shares of common stock outstanding and potentially dilutive during the period, using the treasury stock method.
The computation of basic and diluted net income per share for the fiscal years ended December 25, 2016, December 27, 2015 and December 28, 2014 are as follows (in thousands, except per share amounts):
| Fiscal Year Ended | ||||||||||||
| December 25, 2016 |
December 27, 2015 |
December 28, 2014 |
||||||||||
| Net income |
$ | 37,716 | 26,526 | 26,120 | ||||||||
|
|
|
|
|
|
|
|||||||
| Weighted average number of common shares outstanding-basic |
36,258 | 23,118 | — | |||||||||
|
|
|
|
|
|
|
|||||||
| Weighted average number of common shares assumed from the conversion of Series A Preferred Stock |
— | 12,822 | 35,904 | |||||||||
| Weighted average dilutive effect of stock-based compensation |
1,426 | 1,524 | 1,525 | |||||||||
|
|
|
|
|
|
|
|||||||
| Weighted average number of common shares outstanding-diluted |
37,684 | 37,464 | 37,429 | |||||||||
|
|
|
|
|
|
|
|||||||
| Net income per share-basic |
$ | 1.04 | 1.15 | — | ||||||||
|
|
|
|
|
|
|
|||||||
| Net income per share-diluted |
$ | 1.00 | 0.71 | 0.70 | ||||||||
|
|
|
|
|
|
|
|||||||
| (20) | Stock Compensation Plan |
Effective immediately prior to the IPO, the Company’s board of directors and stockholders approved the amendment and restatement of the 2011 Equity Incentive Plan. Under the Amended and Restated 2011 Equity Incentive Plan (the “Amended 2011 Plan”), the Company’s board of directors may grant stock options, restricted stock units and performance awards to officers, directors, employees, and consultants of the Company and its subsidiaries. There are up to 8.5 million shares available for issuance under the Amended 2011 Plan of authorized but unissued common stock. At December 25, 2016, there were 4.0 million additional shares available for grant under the Amended 2011 Plan.
F-28
Table of Contents
Index to Financial Statements
Stock Options
Stock options are granted at a price determined by the board of directors or committee designated by the board at not less than the fair market value of a share on the date of grant. The term of each option shall be determined by the board of directors or committee designated by the board at the time of grant and shall be no greater than ten years.
The fair value of each option award is estimated on the date of grant using the Black-Scholes-Merton option-pricing model. No dividends are expected to be paid over the contractual term of the stock options granted, resulting in the use of a zero expected dividend rate. Volatility was estimated based on the average historical volatility of similar entities with publicly traded shares. The expected term for options granted is derived using the “simplified” method, in accordance with SEC guidance. The risk-free rate for the expected term of the option is based on the U.S. Treasury yield curve at the date of grant. There were no stock options granted during the fiscal year ended December 27, 2015. The assumptions used for grants made during the fiscal years ended December 25, 2016 and December 28, 2014 are provided in the following table:
| December 25, 2016 |
December 28, 2014 |
|||||||
| Valuation assumptions: |
||||||||
| Expected dividend yield |
0% | 0% | ||||||
| Expected volatility |
27.73% | 32.00% to 34.90% | ||||||
| Expected term |
6.25 years | 5.75 to 6.49 years | ||||||
| Risk-free interest rate |
1.41% | 1.72% to 1.98% | ||||||
Stock option activity during the period indicated is as follows:
| Number of shares |
Weighted average exercise price |
Weighted average remaining contractual term |
Aggregate intrinsic value (in thousands) |
|||||||||||||
| Balance as of December 27, 2015 |
4,347,024 | $ | 3.78 | 6.8 | $ | 51,198 | ||||||||||
| Granted |
151,000 | 18.05 | ||||||||||||||
| Exercised |
(530,042 | ) | 2.28 | 8,021 | ||||||||||||
| Repurchased |
— | — | ||||||||||||||
| Forfeited |
(200,709 | ) | 3.23 | |||||||||||||
| Expired |
— | — | ||||||||||||||
|
|
|
|||||||||||||||
| Balance as of December 25, 2016 |
3,767,273 | $ | 4.59 | 6.0 | $ | 55,023 | ||||||||||
|
|
|
|
|
|
|
|
|
|||||||||
| Exercisable as of December 25, 2016 |
2,348,583 | $ | 4.12 | 5.9 | $ | 35,407 | ||||||||||
|
|
|
|
|
|
|
|
|
|||||||||
As of December 25, 2016, there was $2.0 million of total unrecognized compensation cost related to time based stock options, which is expected to be recognized over a weighted average period of approximately 2.3 years. As of December 25, 2016, there was approximately $2.5 million of total unrecognized compensation cost related to 0.9 million outstanding performance based stock options. These performance based stock options will vest and become exercisable upon the achievement of certain performance metrics indicated in the stock option grant.
F-29
Table of Contents
Index to Financial Statements
Restricted Stock Units
Restricted stock unit activity during the period indicated is as follows:
| Number of shares |
Weighted average fair value at grant date |
|||||||
| Nonvested as of December 27, 2015 |
7,893 | $ | 19.00 | |||||
| Granted |
92,120 | 18.05 | ||||||
| Forfeited |
(10,270 | ) | 18.05 | |||||
| Vested |
(7,893 | ) | 19.00 | |||||
|
|
|
|||||||
| Nonvested as of December 25, 2016 |
81,850 | $ | 18.05 | |||||
|
|
|
|
|
|||||
On June 8, 2016, the Company granted a total of 75,500 restricted stock units to certain employees of the Company. The restricted stock units will vest in equal annual installments over four years, subject to continued service to the Company. Vested shares will be delivered within ten days of the vesting date of such restricted stock unit. On June 8, 2016, the Company granted 2,770 restricted stock units to each of its six non-employee directors who are not affiliated with Advent International Corporation (“Advent”). The restricted stock units will vest on the date of the Company’s next annual meeting, subject to continued service to the Company. Vested shares will be delivered within ten days of the vesting date of such restricted stock unit.
On May 13, 2015, the Company granted 2,631 restricted stock units to each of its then three non-employee directors who were not affiliated with Advent. All of these restricted stock units vested on June 8, 2016.
As of December 25, 2016, there was $1.2 million of total unrecognized compensation cost related to restricted stock units, which is expected to be recognized ratably over a period of approximately 3.2 years.
| (21) | Related Party Transactions |
Advent is related to the Company through members of the board of directors and ownership of the Company. The Company reimburses Advent for certain expenses. There were no amounts included in accounts payable due to Advent as of both December 25, 2016 and December 27, 2015.
Panthers Football, LLC (“The Panthers”) is owned by family members of certain indirect stockholders of the Company. The Company has a marketing and sponsorship agreement with The Panthers.
Cajun Jack’s, LLC (“Cajun”) is owned by family members of certain indirect stockholders and a member of the board of directors of the Company. Cajun is a franchisee of the Company. Cajun remits payments to the Company for royalties, marketing, and franchise license fees.
New Generation Foods, LLC (“New Generation”) is owned by family members of certain indirect stockholders and a member of the board of directors of the Company. New Generation is a franchisee of the Company. New Generation remits payments to the Company for royalties, marketing, and franchise license fees. From January 29, 2014 through July 31, 2015, the Company matched New Generation’s advertising expenditures in an amount up to 1% of New Generation’s sales.
Tri-Arc Food Systems, Inc. (“Tri-Arc”) owns an interest in the Company. In addition, an owner of Tri-Arc is a member of the board of directors of the Company. Tri-Arc is a franchisee of the Company. Tri-Arc remits payments to the Company for royalties, marketing, and franchise license fees. In addition, the Company reimburses Tri-Arc for shared marketing costs.
JZF Properties, LLC (“JZF”) is owned by family members of certain indirect stockholders and a member of the board of directors of the Company. JZF leases a building and land to the Company for use as a restaurant operated by the Company.
MAR Real Estate, LLC (“MRE”) is owned by a certain indirect stockholder of the Company. MRE leases land and buildings to the Company for use as restaurants operated by the Company.
F-30
Table of Contents
Index to Financial Statements
Palmetto Lowcountry Properties, LLC (“PLP”) is owned by a certain indirect stockholder of the Company. PLP leases land and buildings to the Company for use as restaurants operated by the Company.
Catco Bo Memorial, LLC (“CBM”) is owned by a certain indirect stockholder of the Company. CBM leases land, equipment and a building to the Company for use as a restaurant operated by the Company.
MRMJ Holdings, LLC (“MRMJ”) is owned by a certain indirect stockholder of the Company. MRMJ leases land and a building to the Company for use as a restaurant operated by the Company.
The following table presents expenses incurred and payments made in transactions with the Company’s related parties (in thousands):
| Fiscal Year Ended | ||||||||||||||
| Related Party |
Description | December 25, 2016 |
December 27, 2015 |
December 28, 2014 |
||||||||||
| Advent |
Out-of-pocket expense reimbursement |
$ | 11 | 38 | 73 | |||||||||
| The Panthers |
Marketing/sponsorship expense |
737 | 700 | 684 | ||||||||||
| New Generation |
Advertising expense | — | 74 | 117 | ||||||||||
| Tri-Arc |
Marketing expense | 72 | 72 | 72 | ||||||||||
| JZF |
Rent payments | 217 | 196 | 201 | ||||||||||
| MRE |
Rent payments | 152 | 197 | 141 | ||||||||||
| PLP |
Rent payments | 57 | 140 | — | ||||||||||
| CBM |
Rent payments | 100 | 23 | — | ||||||||||
| MRMJ |
Rent payments | 37 | — | — | ||||||||||
The following tables present franchise royalty revenues and other franchise revenues from transactions with the Company’s related parties (in thousands):
| Franchise Royalty Revenues | ||||||||||||
| Fiscal Year Ended | ||||||||||||
| Related Party |
December 25, 2016 |
December 27, 2015 |
December 28, 2014 |
|||||||||
| Cajun |
$ | 99 | 97 | 95 | ||||||||
| New Generation |
568 | 521 | 466 | |||||||||
| Tri-Arc |
5,107 | 4,928 | 4,611 | |||||||||
| Other Franchise Revenues | ||||||||||||
| Fiscal Year Ended | ||||||||||||
| Related Party |
December 25, 2016 |
December 27, 2016 |
December 28, 2015 |
|||||||||
| Cajun |
$ | — | — | — | ||||||||
| New Generation |
— | 60 | — | |||||||||
| Tri-Arc |
25 | 38 | 75 | |||||||||
The following table presents accounts receivable from transactions with the Company’s related parties (in thousands):
| Gross Accounts Receivable | ||||||||
| Related Party |
December 25, 2016 |
December 27, 2015 |
||||||
| Cajun |
$ | 8 | 9 | |||||
| New Generation |
51 | 52 | ||||||
| Tri-Arc |
382 | 387 | ||||||
F-31
Table of Contents
Index to Financial Statements
| (22) | Selected Quarterly Financial Data (Unaudited) |
The following table sets forth certain unaudited financial and operating information for each quarter of fiscal 2016 and fiscal 2015. The unaudited quarterly information includes all adjustments (consisting of normal recurring adjustments) that, in the opinion of management, are necessary for the fair presentation of the information presented. Operating results for interim periods are not necessarily indicative of the results that may be expected for a full fiscal year.
| Fiscal Year 2016 | ||||||||||||||||
| First Quarter |
Second Quarter |
Third Quarter |
Fourth Quarter |
|||||||||||||
| (in thousands, except per share amounts) | ||||||||||||||||
| Revenues: |
||||||||||||||||
| Company restaurant revenues |
$ | 121,413 | 124,674 | 126,358 | 132,219 | |||||||||||
| Franchise royalty revenues |
6,172 | 6,621 | 6,739 | 6,832 | ||||||||||||
| Other franchise revenues |
70 | 300 | 100 | 383 | ||||||||||||
|
|
|
|
|
|
|
|
|
|||||||||
| Total revenues |
127,655 | 131,595 | 133,197 | 139,434 | ||||||||||||
| Operating income |
14,072 | 18,004 | 16,150 | 17,275 | ||||||||||||
| Net income |
7,844 | 10,031 | 10,019 | 9,822 | ||||||||||||
| Net income per share: |
||||||||||||||||
| Basic |
0.22 | 0.28 | 0.28 | 0.27 | ||||||||||||
| Diluted |
0.21 | 0.27 | 0.27 | 0.26 | ||||||||||||
| Fiscal Year 2015 | ||||||||||||||||
| First Quarter |
Second Quarter |
Third Quarter |
Fourth Quarter |
|||||||||||||
| (in thousands, except per share amounts) | ||||||||||||||||
| Revenues: |
||||||||||||||||
| Company restaurant revenues |
$ | 108,336 | 114,043 | 117,536 | 122,223 | |||||||||||
| Franchise royalty revenues |
5,936 | 6,368 | 6,436 | 6,364 | ||||||||||||
| Other franchise revenues |
375 | 105 | 287 | 193 | ||||||||||||
|
|
|
|
|
|
|
|
|
|||||||||
| Total revenues |
114,647 | 120,516 | 124,259 | 128,780 | ||||||||||||
| Operating income(1) |
9,488 | 13,166 | 14,479 | 14,555 | ||||||||||||
| Net income |
3,438 | 6,334 | 8,910 | 7,844 | ||||||||||||
| Net income per share: |
||||||||||||||||
| Basic |
— | 0.31 | 0.25 | 0.22 | ||||||||||||
| Diluted |
0.09 | 0.17 | 0.24 | 0.21 | ||||||||||||
| (1) | The first and second quarter of fiscal year 2015 include expenses related to the Company’s IPO of $2.7 million and $1.8 million, respectively. |
F-32
Table of Contents
Index to Financial Statements
EXHIBIT INDEX
| Exhibit |
Description | |
| 21 | List of Subsidiaries of the Company. | |
| 23.1 | Consent of KPMG LLP, an independent registered public accounting firm. | |
| 31.1 | Certification as adopted pursuant to Section 302 of the Sarbanes-Oxley Act of 2002. | |
| 31.2 | Certification as adopted pursuant to Section 302 of the Sarbanes-Oxley Act of 2002. | |
| 32.1 | Certification required by 18 United States Code Section 1350, as adopted pursuant to Section 906 of the Sarbanes-Oxley Act of 2002. | |
| 32.2 | Certification required by 18 United States Code Section 1350, as adopted pursuant to Section 906 of the Sarbanes-Oxley Act of 2002. | |
| 101 | Sections of the Bojangles’, Inc. Annual Report on Form 10-K for the fiscal year ended December 25, 2016, formatted in XBRL (eXtensible Business Reporting Language), submitted in the following files: | |
| 101.INS | XBRL Instance Document. | |
| 101.SCH | XBRL Taxonomy Extension Schema Document. | |
| 101.CAL | XBRL Taxonomy Extension Calculation Linkbase Document. | |
| 101.DEF | XBRL Taxonomy Extension Definition Linkbase Document. | |
| 101.LAB | XBRL Taxonomy Extension Label Linkbase Document. | |
| 101.PRE | XBRL Taxonomy Extension Presentation Linkbase Document. | |