Attached files
| file | filename |
|---|---|
| EX-99.5 - EX-99.5 - Primo Water Corp /CN/ | d352088dex995.htm |
| EX-99.3 - EX-99.3 - Primo Water Corp /CN/ | d352088dex993.htm |
| EX-99.2 - EX-99.2 - Primo Water Corp /CN/ | d352088dex992.htm |
| EX-99.1 - EX-99.1 - Primo Water Corp /CN/ | d352088dex991.htm |
| 8-K - 8-K - Primo Water Corp /CN/ | d352088d8k.htm |
Exhibit 99.4
As used in this Exhibit 99.4, unless the context otherwise requires or as is otherwise indicated, the words “we,” “us,” “our,” “Cott,” “Company” and words of similar import refer to Cott Corporation and its subsidiaries on a consolidated basis.
On January 4, 2016, we acquired Aquaterra Corporation (“Aquaterra”) pursuant to a Share Purchase Agreement dated December 7, 2015 (the “Aquaterra Acquisition”). On August 2, 2016, we completed the acquisition of Eden Holdings, the indirect parent company of Eden Springs Europe B.V. (“Eden”), a leading provider of water and coffee solutions in Europe (the “Eden Acquisition”). On August 11, 2016, we completed the acquisition of S. & D. Coffee, Inc. (“S&D”), a premium coffee roaster and provider of customized coffee, tea, and extract solutions to the foodservice, convenience, gas, hospitality and office segments in the United States (the “S&D Acquisition” and, collectively with the Aquaterra Acquisition and the Eden Acquisition, the “2016 Acquisitions”).
Water & Coffee Solutions
On a pro forma basis for 2016, net revenue for our Water & Coffee Solutions business was $2,014.4 million, which represented 53.0% of our total pro forma net revenue.
Traditional Business
On a pro forma basis for 2016, net revenue for our Traditional Business was $1,783.6 million, which represented 47.0% of our total pro forma net revenue.
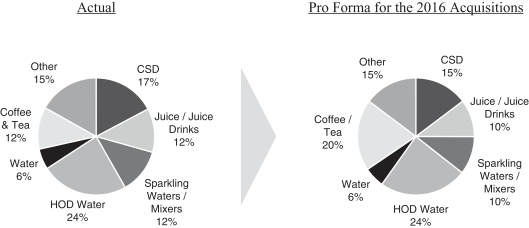
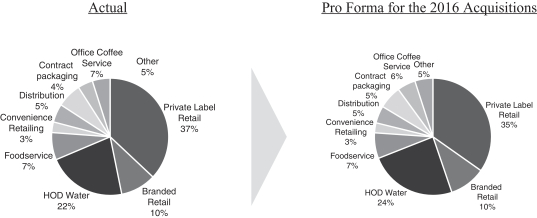
Product Categories and Channels
We have a diversified product portfolio across major beverage categories with an expanding presence in beverages that are on-trend with consumer demand. Since 2009, we have invested in developing new products and completed a number of acquisitions to enhance the breadth of our product focus and to continue to diversify our revenues and channel mix.
The following chart sets forth Cott’s net revenues for the year ended December 31, 2016 by product category and channel mix on an actual and on a pro forma basis, assuming the 2016 Acquisitions had occurred on January 3, 2016:
Revenues by Product for the year ended December 31, 2016
1
Revenues by Channel for the year ended December 31, 2016
2
Summary Pro Forma Financial Information
The following tables set forth our summary pro forma financial information for the period presented. You should read the following summary data in conjunction with the section entitled “Selected Financial Data” and “Management’s Discussion and Analysis of Financial Condition and Results of Operations” contained in our Form 10-K, our audited consolidated financial statements and related notes in our Form 10-K and the section entitled “Unaudited Pro Forma Condensed Combined Financial Information,” filed as Exhibit 99.3 to this Current Report on Form 8-K.
The unaudited pro forma condensed combined financial information for the year ended December 31, 2016 gives effect to the Eden Acquisition and the S&D Acquisition as if each had been consummated on January 3, 2016. The unaudited pro forma condensed combined financial information is for illustrative and informational purposes only and does not purport to represent or be indicative of what our financial condition or results of operations would have been had the Eden Acquisition and the S&D Acquisition each been consummated on such date. The unaudited pro forma financial information should not be considered representative of our future financial condition or results of operations. For additional information, see the section entitled “Unaudited Pro Forma Condensed Combined Financial Information” filed as Exhibit 99.3 to this Current Report on Form 8-K.
| Pro Forma As Adjusted(1) |
||||
| Dec. 31, 2016 | ||||
| (millions of U.S. dollars) | ||||
| Other Financial Data (unaudited): |
||||
| EBITDA(2) |
$ | 379.3 | ||
| Adjusted EBITDA(3) |
432.1 | |||
| Adjusted EBITDA margin (in %)(4) |
11.4 | % | ||
| Capital expenditures(5) |
165.3 | |||
| Depreciation and amortization |
281.8 | |||
| Pro Forma Acquisition Adjusted EBITDA(3) |
455.4 | |||
| Pro Forma Acquisition Adjusted EBITDA margin(6) |
12.0 | % | ||
| Ratio of as adjusted total funded secured indebtedness to Pro Forma |
1.2x | |||
| Ratio of as adjusted net funded secured indebtedness to Pro Forma |
1.0x | |||
| Ratio of as adjusted total indebtedness to Pro Forma |
4.9x | |||
| Ratio of as adjusted net indebtedness to Pro Forma |
4.6x | |||
| (1) | Adjusted for the offering of the Notes and the application of the net proceeds therefrom for the repurchase or redemption of all of the outstanding Cott Beverages Inc.’s 6.75% Senior Notes due 2020 (the “2020 Notes”), excluding accrued and unpaid interest on the 2020 Notes. |
| (2) | EBITDA means earnings before interest expense, income taxes, depreciation, amortization and net income attributable to non-controlling interests, accumulated dividends on preferred shares and foreign exchange impact on redemption of preferred shares. Other companies may define EBITDA differently and, as a result, our measure of EBITDA may not be directly comparable to EBITDA of other companies. Other disclosures related to the use of EBITDA, as well as a reconciliation of net (loss) income attributed to Cott Corporation to EBITDA, are included in footnote (3) below. |
| (3) | Adjusted EBITDA means EBITDA adjusted for items which are not considered by management to be indicative of the underlying results. Pro Forma Acquisition Adjusted EBITDA represents pro forma Adjusted EBITDA plus $23.3 million of estimated cost synergies (expected to be achieved by the end of 2020) to be derived from cost savings in the areas of procurement and administration related to the acquisitions of Eden and S&D. The $11.2 million of Eden related cost synergies expected to be achieved by the end of 2020 are comprised of approximately $7.5 million of procurement/fleet cost savings and approximately $3.7 million of administrative and other |
3
| costs savings. The $12.1 million of S&D related cost synergies expected to be achieved by the end of 2020 are comprised of approximately $7.1 million of procurement and vertical integration cost savings, approximately $2.6 million of facilities and refurbishment cost savings and approximately $2.4 million of administrative cost savings. The expected synergies are inherently uncertain, and are subject to significant business, economic and competitive uncertainties and contingencies, many of which are difficult to predict and are beyond our control. Pro Forma Acquisition Adjusted EBITDA does not take into account merger and integration costs that may be incurred in order to achieve the expected synergies. We cannot assure you that we will be able to achieve these synergies as planned or at all. See “Risks Related to Our Business—We may not realize the expected revenue and cost synergies related to our recent acquisitions,” included in our Form 10-K. |
We believe that the inclusion of supplementary adjustments to EBITDA applied in presenting Adjusted EBITDA and Pro Forma Acquisition Adjusted EBITDA are appropriate to provide additional information to investors about our financial performance. However, we have incurred the charges and expenses that constitute these adjustments in prior periods and expect to incur them in future periods. These expectations are forward-looking statements within the meaning of the securities laws and actual results may vary due to various risks, including those identified under “Risk Factors,” included in our Form 10-K. Because we use these adjusted financial results in the management of our business and to understand underlying business performance, we believe this supplemental information is useful to investors for their independent evaluation and understanding of our business performance and the performance of our management. The non-GAAP financial measures described above are in addition to, and not meant to be considered superior to, or a substitute for, our financial statements prepared in accordance with GAAP. In addition, the non- GAAP financial measures included in this offering memorandum reflect our judgment of particular items, and may be different from, and therefore may not be comparable to, similarly titled measures reported by other companies. The following table provides a reconciliation of EBITDA, Adjusted EBITDA and Pro Forma Acquisition Adjusted EBITDA to net income (loss) with respect to Cott Corporation:
| Pro Forma | ||||
| Dec. 31, 2016 | ||||
| (millions of U.S. dollars) | ||||
| Reconciliation: |
||||
| Net income (loss) attributed to Cott Corporation |
$ | (78.2 | ) | |
| Interest expense, net |
142.6 | |||
| Income tax expense (benefit) |
26.8 | |||
| Depreciation and amortization |
281.8 | |||
| Net income attributable to non-controlling interests(a) |
6.3 | |||
| Accumulated dividends on preferred shares(b) |
— | |||
| Foreign exchange impact on redemption of preferred shares(c) |
— | |||
|
|
|
|||
| EBITDA |
379.3 | |||
| Acquisition and integration costs(d) |
19.6 | |||
| Purchase accounting adjustments, net(e) |
6.2 | |||
| Unrealized commodity hedging loss (gain), net(f) |
9.9 | |||
| Foreign exchange and other gains, net |
7.3 | |||
| Loss on disposal of property, plant & equipment(g) |
5.6 | |||
| Other adjustments(h) |
4.2 | |||
|
|
|
|||
| Adjusted EBITDA |
$ | 432.1 | ||
|
|
|
|||
| Estimated cost synergies(i) |
23.3 | |||
| Pro Forma Acquisition Adjusted EBITDA |
$ | 455.4 | ||
|
|
|
|||
| (a) | The portion of net income attributable to third-party ownership interests in our business. |
| (b) | Dividends attributable to convertible and non-convertible preferred shares issued during the DSS Acquisition. The Company redeemed the outstanding convertible and non-convertible preferred shares in 2015. |
| (c) | Non-recurring foreign exchange impact related to the difference in U.S. dollar to Canadian dollar conversion rates from date of issuance to date of redemption of convertible and non-convertible preferred shares in 2015. |
4
| (d) | Non-recurring costs related to third-party advisory and professional fees, administrative costs, and other costs associated with our acquisition and integration activities. |
| (e) | Non-cash accounting adjustments recorded in accordance with GAAP. |
| (f) | Non-cash adjustment related to changes in the fair value of our commodity derivative instruments. |
| (g) | Non-cash adjustment recorded upon the disposal of property, plant & equipment. |
| (h) | Non-recurring costs related to Company investing and financing activities, legal settlements, legal entity reorganization and other non-recurring expenses. |
| (i) | The $11.2 million of Eden related cost synergies expected to be achieved by the end of 2020 are comprised of approximately $7.5 million of procurement/fleet cost savings and approximately $3.7 million of administrative and other costs savings. The $12.1 million of S&D related cost synergies expected to be achieved by the end of 2020 are comprised of approximately $7.1 million of procurement and vertical integration cost savings, approximately $2.6 million of facilities and refurbishment cost savings and approximately $2.4 million of administrative cost savings. |
| (4) | We define Adjusted EBITDA margin as Adjusted EBITDA divided by total net revenue. |
| (5) | Includes information technology expenditures. |
| (6) | We define Pro Forma Acquisition Adjusted EBITDA margin as Pro Forma Acquisition Adjusted EBITDA divided by pro forma total net revenue. |
| (7) | As adjusted total funded secured indebtedness, as adjusted net funded secured indebtedness, as adjusted total indebtedness and as adjusted net indebtedness, as applicable, do not include unamortized debt issuance costs and premiums on debt. |
| (8) | As adjusted net secured indebtedness and as adjusted net indebtedness are net of as adjusted cash and cash equivalents of $110.7 million. |
5