Attached files
| file | filename |
|---|---|
| EX-32.2 - EX-32.2 - Primo Water Corp /CN/ | d483557dex322.htm |
| EX-32.1 - EX-32.1 - Primo Water Corp /CN/ | d483557dex321.htm |
| EX-31.2 - EX-31.2 - Primo Water Corp /CN/ | d483557dex312.htm |
| EX-31.1 - EX-31.1 - Primo Water Corp /CN/ | d483557dex311.htm |
| EX-23.1 - EX-23.1 - Primo Water Corp /CN/ | d483557dex231.htm |
| EX-21.1 - EX-21.1 - Primo Water Corp /CN/ | d483557dex211.htm |
| EX-10.11 - EX-10.11 - Primo Water Corp /CN/ | d483557dex1011.htm |
Table of Contents
United States
Securities and Exchange Commission
Washington, D.C. 20549
Form 10-K
| ☒ | Annual Report Pursuant to Section 13 or 15(d) of the Securities Exchange Act of 1934 |
For the fiscal year ended December 30, 2017
| ☐ | Transition Report Pursuant to Section 13 or 15(d) of the Securities Exchange Act of 1934 |
For the transition period from to
Commission file number 001-31410
COTT CORPORATION
(Exact name of registrant as specified in its charter)
| CANADA | 98-0154711 | |
| (State or Other Jurisdiction of Incorporation or Organization) |
(IRS Employer Identification No.) | |
| 1200 BRITANNIA ROAD EAST MISSISSAUGA, ONTARIO, CANADA |
L4W 4T5 | |
| 4221 WEST BOY SCOUT BOULEVARD SUITE 400 TAMPA, FLORIDA, UNITED STATES |
33607 | |
| (Address of principal executive offices) | (Zip Code) | |
Registrant’s telephone number, including area code: (905) 795-6500 and (813) 313-1800
Securities registered pursuant to Section 12(b) of the Act:
| Title of each class |
Name of each exchange on which registered | |
| COMMON SHARES WITHOUT NOMINAL OR
PAR VALUE |
NEW YORK STOCK EXCHANGE
TORONTO STOCK EXCHANGE |
Securities registered pursuant to Section 12(g) of the Act: NONE
Indicate by check mark if the registrant is a well-known seasoned issuer, as defined in Rule 405 of the Securities Act. Yes ☒ No ☐
Indicate by check mark if the registrant is not required to file reports pursuant to Section 13 or Section 15(d) of the Act. Yes ☐ No ☒
Indicate by check mark whether the registrant: (1) has filed all reports required to be filed by Section 13 or 15(d) of the Securities Exchange Act of 1934 during the preceding 12 months (or for such shorter period that the registrant was required to file such reports), and (2) has been subject to such filing requirements for the past 90 days. Yes ☒ No ☐
Indicate by check mark whether the registrant has submitted electronically and posted on its corporate Web site, if any, every Interactive Data File required to be submitted and posted pursuant to Rule 405 of Regulation S-T (§ 232.405 of this chapter) during the preceding 12 months (or for such shorter period that the registrant was required to submit and post such files). Yes ☒ No ☐
Indicate by check mark if disclosure of delinquent filers pursuant to Item 405 of Regulation S-K (§229.405) is not contained herein, and will not be contained, to the best of the registrant’s knowledge, in definitive proxy or information statements incorporated by reference in Part III of this Form 10-K or any amendment to this Form 10-K. ☐
Indicate by check mark whether the registrant is a large accelerated filer, an accelerated filer, a non-accelerated filer, a smaller reporting company, or an emerging growth company. See the definitions of “large accelerated filer,” “accelerated filer,” “smaller reporting company” and “emerging growth company” in Rule 12b-2 of the Exchange Act. (Check one):
| Large accelerated filer | ☒ | Accelerated filer | ☐ | |||
| Non-accelerated filer | ☐ (Do not check if a smaller reporting company) | Smaller reporting company | ☐ | |||
| Emerging growth company | ☐ | |||||
If an emerging growth company, indicate by check mark if the registrant has elected not to use the extended transition period for complying with any new or revised financial accounting standards provided pursuant to Section 13(a) of the Exchange Act. ☐
Indicate by check mark whether the registrant is a shell company (as defined in Rule 12-12 of the Act). Yes ☐ No ☒
The aggregate market value of the common equity held by non-affiliates of the registrant as of July 1, 2017 (based on the closing sale price of $14.44 for the registrant’s common shares as reported on the New York Stock Exchange on June 30, 2017) was $1,974.8 million.
(Reference is made to Part II, Item 5 for a statement of assumptions upon which the calculation is made).
The number of the registrant’s outstanding common shares as of February 21, 2018 was 140,081,348.
Documents incorporated by reference
Portions of our definitive proxy circular for the 2018 Annual and Special Meeting of Shareowners, to be filed within 120 days of December 30, 2017, are incorporated by reference in Part III. Such proxy circular, except for the parts therein which have been specifically incorporated by reference, shall not be deemed “filed” for the purposes of this Annual Report on Form 10-K.
Table of Contents
Table of Contents
Our consolidated financial statements are prepared in accordance with United States generally accepted accounting principles (“GAAP”) in U.S. dollars. Unless otherwise indicated, all amounts in this Annual Report on Form 10-K are in U.S. dollars and U.S. GAAP.
Any reference to 2017, 2016 and 2015 corresponds to our fiscal years ended December 30, 2017, December 31, 2016, and January 2, 2016, respectively.
Forward-looking statements
In addition to historical information, this Annual Report on Form 10-K, and the reports and documents incorporated by reference in this Annual Report on Form 10-K, may contain statements relating to future events and future results. These statements are “forward-looking” within the meaning of the Private Securities Litigation Reform Act of 1995 and applicable Canadian securities legislation and involve known and unknown risks, uncertainties, future expectations and other factors that may cause actual results, performance or achievements of Cott Corporation to be materially different from any future results, performance or achievements expressed or implied by such forward-looking statements. Such statements include, but are not limited to, statements that relate to projections of sales, earnings, earnings per share, cash flows, capital expenditures or other financial items, statements regarding our intentions to pay regular quarterly dividends on our common shares, and discussions of estimated future revenue enhancements and cost savings. These statements also relate to our business strategy, goals and expectations concerning our market position, future operations, margins, profitability, liquidity and capital resources. Generally, words such as “anticipate,” “believe,” “continue,” “could,” “endeavor,” “estimate,” “expect,” “intend,” “may,” “will,” “plan,” “predict,” “project,” “should” and similar terms and phrases are used to identify forward-looking statements in this Annual Report on Form 10-K and in the documents incorporated in this Annual Report on Form 10-K by reference. These forward-looking statements reflect current expectations regarding future events and operating performance and are made only as of the date of this Annual Report on Form 10-K.
The forward-looking statements are not guarantees of future performance or events and, by their nature, are based on certain estimates and assumptions regarding interest and foreign exchange rates, expected growth, results of operations, performance, business prospects and opportunities and effective income tax rates, which are subject to inherent risks and uncertainties. Material factors or assumptions that were applied in drawing a conclusion or making an estimate set out in forward-looking statements may include, but are not limited to, assumptions regarding management’s current plans and estimates. Although we believe the assumptions underlying these forward-looking statements are reasonable, any of these assumptions could prove to be inaccurate and, as a result, the forward-looking statements based on those assumptions could prove to be incorrect. Our operations involve risks and uncertainties, many of which are outside of our control, and any one or any combination of these risks and uncertainties could also affect whether the forward-looking statements ultimately prove to be correct. These risks and uncertainties include, but are not limited to, those described in Part I, Item 1A. “Risk Factors” and elsewhere in this Annual Report on Form 10-K and those described from time to time in our future reports filed with the Securities and Exchange Commission and Canadian securities regulatory authorities.
We undertake no obligation to update any information contained in this Annual Report on Form 10-K or to publicly release the results of any revisions to forward-looking statements to reflect events or circumstances of which we may become aware of after the date of this Annual Report on Form 10-K. Undue reliance should not be placed on forward-looking statements.
All future written and oral forward-looking statements attributable to us or persons acting on our behalf are expressly qualified in their entirety by the foregoing.
Table of Contents
PART I
| ITEM 1. | BUSINESS |
Our Company
When used in this report, the terms “Cott,” “the Company,” “our Company,” “Cott Corporation,” “we,” “us,” or “our” mean Cott Corporation and its consolidated subsidiaries, collectively.
We incorporated in 1955 and are governed by the Canada Business Corporations Act. Our registered Canadian office is located at 1100 boulevard Rene-Levesque Ouest, 25e etage, Montreal, Quebec, Canada H3B 5C9 and our principal executive offices are located at 4221 W. Boy Scout Boulevard Suite 400, Tampa, Florida, United States 33607 and 1200 Britannia Road East, Mississauga, Ontario, Canada L4W 4T5.
Cott is a route based service company with a leading volume-based national presence in the North America and European home and office delivery (“HOD”) industry for bottled water and a leader in custom coffee roasting, blending of iced tea and extract solutions for the U.S. foodservice industry. Our platform reaches over 2.4 million customers or delivery points across North America and Europe supported by strategically located sales and distribution facilities and fleets, as well as wholesalers and distributors. This enables us to efficiently service residences, businesses, restaurant chains, hotels and motels, small and large retailers, and healthcare facilities.
On January 30, 2018, we sold our carbonated soft drinks (“CSDs”) and juice businesses via the sale of our North America, United Kingdom (“U.K.”) and Mexico business units (including the Canadian business) and our Royal Crown International (“RCI”) finished goods export business (collectively, the “Traditional Business”) to Refresco Group N.V., a Dutch public company (“Refresco”), pursuant to a Share Purchase Agreement (the “Purchase Agreement”) dated as of July 24, 2017 (the “Transaction”). The Transaction was structured as a sale of the assets of our Canadian business and a sale of the stock of the operating subsidiaries engaged in the Traditional Business in the other jurisdictions. The aggregate deal consideration was $1.25 billion in cash, paid at closing, subject to adjustment for indebtedness, working capital, and other customary post-closing adjustments. Accordingly, as a result of the sale of the Traditional Business representing a strategic shift in our operations, those businesses are presented herein as discontinued operations. See Note 2 to the Consolidated Financial Statements for additional information on discontinued operations. The Transaction did not include our Route Based Services and Coffee, Tea and Extract Solutions reporting segments, our RCI concentrate business, our Columbus, Georgia manufacturing facility or our Aimia Foods Limited (“Aimia”) and Decantae Mineral Water Ltd. (“Decantae”) businesses.
The cash proceeds from the Transaction were used to (i) retire $525.0 million aggregate principal amount of 5.375% senior notes due 2022 (the “2022 Notes”), (ii) retire the remaining $250.0 million aggregate principal amount of 10.000% senior secured notes due 2021 (the “DSS Notes”), (iii) repay $262.5 million outstanding balance on our asset-based lending facility (the “ABL facility”), and (iv) repay $1.9 million in aggregate principal outstanding on our capital lease finance arrangement with General Electric Capital Corporation (the “GE Term Loan”). Additionally, in connection with the closing of the Transaction on January 30, 2018, we entered into a second amendment and restatement agreement making effective an amended and restated senior secured asset-based lending credit facility (the “ABL facility”). The ABL facility, as amended and restated, under which Cott and its subsidiaries, Cott Holdings Inc., DS Services of America, Inc., S. & D. Coffee, Inc., Aimia Foods Limited and Aquaterra Corporation, are borrowers, is a revolving facility of up to $250.0 million, which may be increased up to an additional $100.0 million at our option if lenders agree to increase their commitments, with a maturity date of August 3, 2021.
Our Operations
At the beginning of 2017, our business operated through four reporting segments: Water and Coffee Solutions (which included our DS Services of America, Inc. (“DSS”), Aquaterra Corporation (“Aquaterra”), Eden Springs B.V. (“Eden”) and S. & D. Coffee, Inc. (“S&D”) businesses), Cott North America, Cott United Kingdom (“Cott U.K.”) and All Other (which included our Mexico and RCI operating segments).
During the third quarter of 2017, we reviewed our reporting segments as a result of the Transaction. Following such review, we reorganized our reporting segments into three reporting segments: Route Based Services (which includes our DSS, Aquaterra and Eden businesses), Coffee, Tea and Extract Solutions (which includes our S&D business) and All Other (which includes our Aimia and Decantae businesses, the RCI concentrate business, our Columbus, Georgia manufacturing facility and other miscellaneous expenses). Segment reporting results have been recast to reflect these changes for all periods presented. Our corporate oversight function is not treated as a segment; it includes certain general and administrative costs that are not allocated to any of the reporting segments.
5
Table of Contents
Route Based Services
Our Route Based Services reporting segment provides bottled water, coffee and water filtration services to customers in North America, Europe, and Israel. Route Based Services products include bottled water, coffee, brewed tea, water dispensers, coffee and tea brewers and filtration equipment. Route Based Services’ net revenue was $1,501.7 million, $1,224.3 million and $1,021.2 million, and represented 66.2%, 75.5% and 86.0% of our total net revenue for 2017, 2016 and 2015, respectively.
Coffee, Tea and Extract Solutions
Our Coffee, Tea and Extract Solutions reporting segment provides premium coffee roasting and customized coffee, tea and extract solutions to customers in the United States. Coffee, Tea and Extract Solutions products include fresh brewed coffee or tea, speciality coffee, liquid coffee or tea concentrate, single cup coffee, cold brewed coffee, iced blend coffee or tea beverages, tea, blended teas, hot tea, sparkling tea, and coffee or tea extract solutions. Coffee, Tea and Extract Solutions net revenue was $602.2 million and $228.0 million, and represented 26.5% and 14.0% of our total net revenue for 2017 and 2016, respectively.
All Other
Our All Other segment consists of our Aimia, Decantae and the RCI concentrate businesses, our Columbus, Georgia manufacturing facility and other miscellaneous expenses. All Other products include hot chocolate, coffee, tea, soups, malt drinks, creamers/whiteners, cereals, beverage concentrates and mineral water. All Other net revenue was $165.8 million, $170.9 million and $166.1 million, and represented 7.3%, 10.5% and 14.0% of our total revenue for 2017, 2016 and 2015, respectively.
Competitive Strengths
The combination of our scale and density of our routes in key markets, our industry-leading infrastructure, and our emphasis on superior customer service is intended to create significant competitive strengths. With respect to our Route Based Services and Coffee, Tea and Extract Solutions reporting segments, we continually invest in our delivery infrastructure, call centers and service capabilities, as well as coffee roasting and extract capacity, to maintain our established position as a leader in these segments. We believe these investments have positioned us to capitalize on a number of positive industry dynamics and new growth opportunities. First, we intend to capture new customers as we capitalize on favorable consumer trends across our addressable markets, including increased focus on health and wellness, concerns about deteriorating municipal water quality and the shift to premium coffee systems and “on the go” coffee and tea purchases. Second, we believe our ability to cross-sell complementary water and coffee products and services represents a significant untapped opportunity. Third, the highly fragmented market in which we operate affords us ample opportunity to make the most of our scale, systems and customer density to execute synergistic tuck-in acquisitions across all of our service areas. We believe these strengths, along with the strengths outlined below, will allow us to capitalize on growth opportunities to drive sustainable and profitable growth.
Leading Position in Multiple Service Platforms
We have a leading volume-based national presence in the North America and European HOD industry for bottled water. In bottled water, we offer a portfolio of well-known brands with longstanding heritages, such as Sparkletts, Hinckley Springs, Kentwood Springs, Canadian Springs, Labrador and Eden Springs, which have contributed to our leadership position in the HOD industry. In office coffee services (“OCS”), we offer a complete range of products under leading brands including Keurig®, Mars Alterra®, Starbucks® Coffee, Caribou Coffee®, Peet’s Coffee & Tea®, Javarama® and Lavazza®.
In coffee roasting, tea blending, and extract production, we are a leading custom coffee, tea and extract solutions provider, offering a portfolio of service offerings to our customers. Our superior scale, product development and expertise, as well as our focus on customer service, differentiates us from our competition as we are able to partner with our customers on logistics, supply chain and ongoing strategy development.
6
Table of Contents
We are one of the only direct-to-customer providers that can offer comprehensive services to residential customers and small and medium-sized businesses, as well as large regional and national corporations and retailers, universities and government agencies. Our broad direct-to-consumer network creates an advantage in marketing and customer reach, while our extensive range of products and capabilities allows us to offer customers a convenient, single solution for coffee, tea and high quality drinking water. We believe our position will be further strengthened through our ongoing efforts to enhance and promote our full-service beverage offering to new and existing customers.
We also believe that opportunities exist to increase sales of our products in our core markets by optimizing existing customer relationships, capitalizing on cross-selling and up-selling opportunities, obtaining new customers, exploring new channels of distribution and introducing new products through our broad reaching distribution network.
Scale International HOD and OCS Platforms
We believe that having one of the leading North American and European HOD production and distribution networks in the industry gives us the ability to reduce our purchasing, manufacturing and delivery costs relative to our competitors as well as drive customer density within the markets we serve. We have an extensive HOD and OCS distribution network with a unique ability to service customers. We believe few companies have a comparable footprint or infrastructure to support local, regional and national accounts directly, which differentiates us in the industry. Our scaled network has allowed us to secure strategic relationships, which have been successful in attracting new customers and leveraging our production and delivery infrastructure. We are able to provide multiple products to our HOD and OCS customers at minimal additional cost and generate additional profits on those incremental sales.
The acquisition of Eden in 2016 further expanded our European capabilities. We believe that our large distribution footprint in the water-and-coffee solutions space in Europe differentiates us from our competitors, providing us with region wide coverage for our most significant businesses and allowing us to meet the water and coffee needs of our diversified customer base, including both small and medium sized businesses and larger European customer accounts.
High Levels of Customer Service and Strong Customer Integration
Customer service and customer retention are key indicators of success within our Route Based Services reporting segment. Route Sales Representatives or “RSRs”, who comprise the consumer-facing part of the business, are an important part of the customer relationship and not only drive customer service, but also generate new organic customer growth. Our Route Based Services reporting segment provides reliable deliveries and closely tracks call center and customer service metrics to continually improve customer satisfaction.
Customer service is a key driver in the success and growth of our Coffee, Tea and Extract Solutions reporting segment. Customers have access to a vast array of services, including our commodity sourcing, product development, delivery systems and sustainability programs, as well as a number of other services. Our ability to customize these services and respond quickly to our customers’ needs are hallmarks for our high level of customer service.
Strategic Importance to Our Coffee, Tea and Extract Solutions Customers
The acquisition of S&D in 2016 (and creation of our Coffee, Tea and Extract Solutions reporting segment in 2017) made us a leader in custom coffee roasting and blending of foodservice iced teas in the United States. We believe the combination of S&D’s premium quality products and solutions, sourcing and distribution reach, and human capital assets create unmatched custom coffee, tea and extract production capabilities.
Our Coffee, Tea and Extract Solutions reporting segment has a proven track record of working alongside our customers to create menu ideation and develop products to take to market. Our product development team develops differentiated and profitable menu items which span the culinary arts and food science, backed by our innovative coffee and liquid extract labs. In addition, we offer a sourcing capability staffed with a team of industry veterans. Coffee and tea markets are unpredictable, but with our industry expertise, we are able to guide our customers through the process utilizing our size, strength and relationships.
Business Strategy
Our vision is to be the preeminent international route based direct to consumer and service provider across water, coffee, tea, filtration and extract solutions with dedicated focus on shareowner returns through continuous growth, expanding margins, and growing free cash flow. Our business services profile offers recurring and repeatable revenue streams and scalable platforms which uniquely position us to allow for operational leverage with growth and to capture synergies through tuck-in acquisition opportunities. We intend to drive value creation through growth from our “Better-for-You” product
7
Table of Contents
offerings (positioned in growing categories of water, coffee, tea, filtration and extract solutions), focused innovation with product development, route logistics and technology creating further growth, as well as cross selling and customer service opportunities, margin expansion driven by scaled platforms with increased customer and route density, highly synergistic customer list or tuck-in acquisition opportunities, and strong free cash flow generation.
Focus on Water, Coffee, Tea, Filtration and Extract Services Growth
Our goal is to grow profitably as consumers move to healthier beverage options, and increase free cash flow by expanding our customer density and consumption, focusing on customer service and reducing costs to serve, as well as price improvement.
We will remain focused on expanding our small and medium-sized business customer base, a market segment that we believe remains underpenetrated, by continuing to capitalize on our strong direct-to-consumer distribution network, international sales and marketing efforts as well as our strategic partnerships.
We believe our ability to cross-sell complementary water, coffee, tea and filtration products and services represents a significant untapped opportunity as nearly all of our existing and target customers consume multiple products. We believe we are well-positioned to capitalize on this opportunity utilizing our strong relationships and frequent face-to-face interactions with our large installed customer base. RSRs are trained to sell across our product set and are highly incentivized through our commission structure to promote new products to existing customers, which increases sales and average revenue per customer.
We intend to proactively pursue accretive acquisitions to complement our organic growth. The highly fragmented market in which we operate affords us ample opportunities to execute synergistic HOD water, OCS and filtration tuck-in acquisitions. Our acquisition strategy is consistent with our objective to continually build customer density and reduce the overall cost of servicing our existing customer base. We have a proven track record of achieving significant synergies and integrating companies onto our platform and we believe that our acquisition strategy will continue to improve our profitability and margins.
We have managed to pursue this acquisition strategy while reducing leverage levels from the time of the acquisition of DSS by employing a combination of disciplined purchase pricing, successful integration and synergy realization, and divestiture of assets that are no longer instrumental to our mission and strategy.
Evaluate Acquisition Opportunities
We will continue to evaluate additional mid-to-larger scale opportunities (like the acquisitions of S&D and Eden) to expand our positions in the HOD water, coffee, tea, filtration and extract solution service categories, as well as other higher margin or growth-oriented categories where we believe our platform, operating strength and synergies can be leveraged.
Financial Information about Segments
For financial information about reporting segments and geographic areas, see Note 9 to the Consolidated Financial Statements contained in this Annual Report on Form 10-K.
Ingredient and Packaging Supplies
In addition to water, the principal raw materials required to produce our products are green coffee, tea, polyethylene terephthalate (“PET”) resin, high-density polyethylene (“HDPE”) and polycarbonate bottles, caps and preforms, labels and cartons and trays. The cost of these raw materials can fluctuate substantially over time. We have implemented a number of risk mitigation programs including our futures contracts and hedging programs with our customers in order to reduce the risk of commodity fluctuations in key areas such as coffee procurement and energy surcharges tied to certain energy indexes within North America. We also have implemented a number of sustainability programs throughout our network to assist our suppliers in operating under changing environments. Our core product of HOD bottled water utilizes a reusable bottle that allows for the overall cost to service to be spread out over a number of recurring trips to our customer base. Where we have not established a risk mitigation program, it is often necessary to recover the increased cost of materials through price increases which we have historically had success in utilizing in order to reduce our overall exposure to rising ingredient and packaging costs.
Under many of our supply arrangements for these raw materials, the price we pay fluctuates along with certain changes in underlying commodity costs, such as green coffee, tea, resin in the case of PET, and HDPE. We believe that we will be able to either renegotiate contracts with these suppliers when they expire or find alternative sources for supply. We also believe there is adequate supply of the ingredient and packaging materials used to produce and package our products.
8
Table of Contents
Generally, we bear the risk of increases in the costs of the ingredient and packaging materials used to produce our products, including the underlying costs of the commodities used to manufacture them and, to some extent, the costs of converting those commodities into the materials we purchase.
Green coffee, tea, resin for PET, HDPE and fuel are examples of underlying commodities for which we bear the risk of increases in costs. In addition, the contracts for certain of our ingredient and packaging materials permit our suppliers to increase the costs they charge us based on increases in their cost of converting the underlying commodities into the materials we purchase. In certain cases those increases are subject to negotiated limits. Changes in the prices we pay for ingredient and packaging materials occur at times that vary by product and supplier, and take place on a monthly, quarterly or annual basis.
A portion of our revenues is derived from coffee product distribution. The supply and price of coffee beans may be affected by weather, international conditions, consumer demand, and access to transportation. An increase in the price of coffee beans could reduce our coffee sales and coffee product margins, which could adversely affect our business, financial condition and results of operations.
Trade Secrets, Copyrights, Trademarks and Licenses
We sell a majority of our HOD three gallon (“3G”) and five gallon (“5G”) bottled water under our own brands while our OCS business sells both our branded products as well as products under which we have a distribution license. We sell a majority of our manufactured coffee and tea products under retailer or foodservice brands to customers who own the trademarks associated with those products. We own registrations, or applications to register, various trademarks that are important to our worldwide business, including Alhambra®, Belmont Springs®, Deep Rock®, Hinckley Springs®, Crystal Springs®, Kentwood Springs®, Mount Olympus®, Standard Coffee®, Javarama®, Athena®, Nursery®, Relyant®, Sierra Springs®, Sparkletts®, Constant Coffee®, Premium Gold®, S&D® and S&D Coffee & Tea® in the United States, Canadian Springs® and Labrador® in Canada, Eden®, Eden Springs®, Chateaud’eau®, Edelvia®, Mey Eden®, Edenissimo®, Kafevend®, Pauza®, and Garraways® in Europe and Israel, and RC® mark in various formats in more than 120 countries and territories outside of North America. The licenses to which we are a party are of varying terms, including some that are perpetual. Trademark ownership is generally of indefinite duration when marks are properly maintained in commercial use.
Our success depends in part on our intellectual property, which includes trade secrets in the form of concentrate formulas for our beverages and trademarks for the names of the beverages we sell. To protect this intellectual property, we rely principally on registration of trademarks, contractual responsibilities and restrictions in agreements (such as indemnification, nondisclosure and confidentiality agreements) with employees, consultants and customers, and on the common law and/or statutory protections afforded to trademarks, copyrights, trade secrets and proprietary “know-how.” We also closely monitor the use of our trademarks and when necessary vigorously pursue any party that infringes on our trademarks, using all available legal remedies.
Customers
Our Traditional Business experienced some customer concentration. Following the closing of the Transaction on January 30, 2018, we have limited customer concentration, of which no customer accounts for more than 10% of our net revenues.
Competition
Our principal competitor in the 3G and 5G HOD bottled water business in the United States is Nestlé, which competes with us directly in many of our markets. Within Canada and Europe, our principal competitors are local or regional HOD bottled water businesses. We face competition in our HOD business as distribution methods for residential and commercial bottled water products continue to change and evolve, including the increasing availability of 3G and 5G water bottles in retail stores. This could affect our business as some customers may choose to purchase water in returnable bottles through retailers rather than through our sales and distribution network. We have a strategic alliance with Primo Water Corporation (“Primo”) to bottle and distribute Primo’s 3G and 5G water bottles through retail stores, however, customers could choose to purchase Primo’s competitors’ retail products. Our HOD business also faces increased competition from filtration units in the residential and commercial market. Because homes and offices with installed filtration systems participate at a lower rate in the bottled water market, the installation of these systems poses a competitive threat to our business and reduces the number of potential customers for our bottled water products. In addition, consumers may choose to drink from municipal water sources instead of purchasing bottled water or using a filtration unit.
9
Table of Contents
The coffee industry is highly competitive, including with respect to price, product quality, service, convenience and innovation, and competition could become increasingly more intense due to the relatively low barriers to entry. We face competition from many sources, including the institutional foodservice divisions of multi-national manufacturers of retail products many of which have greater financial and other resources than we do, wholesale foodservice distributors, regional institutional coffee roasters, and specialty coffee suppliers. If we do not succeed in differentiating ourselves through, among other things, our product and service offerings, then our competitive position may be weakened and our sales and profitability may be materially adversely affected. If, due to competitive pressures or contractual restrictions, we are required to reduce prices to attract market share or we are unable to increase prices in response to commodity and other cost increases and we are not able to increase sales volumes to offset the margin declines, then our results of operations could be adversely affected.
We seek to differentiate ourselves from our competitors by offering our customers high-quality products, category management strategies, packaging and marketing strategies, efficient distribution methods, and superior service.
Government Regulation and Environmental Matters
The production, distribution and sale in the United States of many of our products are subject to the Federal Food, Drug, and Cosmetic Act, the Federal Trade Commission Act, the Lanham Act, state consumer protection laws, federal, state and local workplace health and safety laws, various federal, state and local environmental protection laws and various other federal, state and local statutes and regulations applicable to the production, transportation, sale, safety, advertising, labeling and ingredients of such products. Outside the United States, the production, distribution and sale of our many products and related operations are also subject to numerous similar and other statutes and regulations.
A number of states have passed laws setting forth warning or labeling requirements relating to products made for human consumption. For example, the California law known as “Proposition 65” requires that a specific warning appear on any product sold in California containing a substance listed by that state as having been found to cause cancer or reproductive toxicity. This law, and others like it, exposes all food and beverage producers to the possibility of having to provide warnings on their products. The detection of even a trace amount of a listed substance can subject an affected product to the requirement of a warning label, although products containing listed substances that occur naturally or that are contributed to such products solely by a municipal water supply are generally exempt from the warning requirement. From time to time over the past several years, certain of our customers have received notices alleging that the labeling requirements of the relevant state regulation would apply to products manufactured by us and sold by them. There can be no assurance that we will not be adversely affected by actions against our customers or us relating to Proposition 65 or similar “failure to warn” laws.
We currently offer and use non-refillable recyclable containers in the United States and other countries around the world. We also offer and use refillable containers, which are also recyclable. Legal requirements apply in various jurisdictions in the United States and other countries requiring that deposits or certain taxes or fees be charged for the sale, marketing and use of certain non-refillable beverage containers. The precise requirements imposed by these measures vary. Other types of beverage container-related deposit, recycling, tax and/or product stewardship statutes and regulations also apply in various jurisdictions. We anticipate that additional, similar legal requirements may be proposed or enacted in the future at local, state and federal levels, both in the United States and elsewhere.
We are a member of the International Bottled Water Association (“IBWA”) and the Water Quality Association. These associations often set higher water quality standards than those set by governmental agencies. Members must comply with these standards, which are enforced by the members themselves. The IBWA requires submission to annual plant inspections administered by an independent third-party inspection agency, such as the National Sanitation Foundation. These inspections audit quality and testing records, review all areas of plant operations and the bottling process, and check compliance with relevant national standards, good manufacturing practices, and any other regulations set by the IBWA. If we fail to meet the standards set by the IBWA and Water Quality Association, there could be an adverse impact on our reputation, which could have a material adverse effect on our business and results of operations.
All of our production facilities and other operations are subject to various environmental protection statutes and regulations, including those of the U.S. Environmental Protection Agency (“EPA”), which pertain to the use of water resources and the discharge of waste water. Failure to comply with these regulations can have serious consequences, including civil and administrative penalties. Compliance with these provisions has not had, and we do not expect such compliance to have, any material adverse effect on our capital expenditures, net income or competitive position.
10
Table of Contents
Subject to the terms and conditions of the applicable policies, we have coverage for product recalls and product liability claims that could result from the injury, illness or death of consumers using our products, contamination of our products, or damage to or mislabeling of our products.
Employees
As of December 30, 2017, we had over 10,400 employees, of whom approximately 8,600 were in the Route Based Services reporting segment, 1,200 were in the Coffee, Tea and Extract Solutions reporting segment, and 500 in All Other. We have entered into collective bargaining agreements covering approximately 770 of employees in the Route Based Services reporting segment that contain terms that we believe are typical in our industry. As these agreements expire, we believe that they can be renegotiated on terms satisfactory to us. We consider our relations with employees to be generally good.
Availability of Information and Other Matters
We are required to file annual, quarterly and current reports, proxy statements and other information with the U.S. Securities and Exchange Commission (the “SEC”) and Canadian securities regulatory authorities. The public may read and copy any materials that we file with the SEC at the SEC’s Public Reference Room at 100 F Street, NE, Washington, D.C. 20549. Information in the Public Reference Room may be obtained by calling the SEC at 1-202-551-8090. In addition, the SEC maintains an Internet site that contains reports, proxy and information statements, and other information regarding issuers that file with the SEC at www.sec.gov. Information filed with the Canadian securities regulatory authorities is available at www.sedar.com.
Our Annual Report on Form 10-K, quarterly reports on Form 10-Q, current reports on Form 8-K and amendments to reports filed or furnished pursuant to Sections 13(a) and 15(d) of the Securities Exchange Act of 1934, as amended, are also available free of charge on our website at www.cott.com, as soon as reasonably practicable after such material is electronically filed with, or furnished to, the SEC. The information found on our website is not part of this or any other report that we file with, or furnish to, the SEC or to Canadian securities regulatory authorities.
We are responsible for establishing and maintaining adequate internal control over financial reporting as required by the SEC. See “Management’s Report on Internal Control over Financial Reporting” in Item 9A.
| ITEM 1A. | RISK FACTORS |
In addition to the other information set forth in this Annual Report on Form 10-K, you should carefully consider the following factors, which could materially affect our business, financial condition or results of operations. The risks described below are not the only risks that we face. Additional risks and uncertainties not currently known to us or that we currently deem to be immaterial also may negatively affect our business, financial condition or results of operations.
We may be unable to compete successfully in the markets in which we operate.
We face competition in our HOD business as distribution methods for residential and commercial bottled water products continue to change and evolve. The increasing availability of 3G and 5G water bottles in retail stores could affect our business as some customers may choose to purchase water in returnable bottles through retailers rather than through our sales and distribution network. We have a strategic alliance with Primo to bottle and distribute Primo’s 3G and 5G water bottles through retail stores, however, customers could choose to purchase Primo’s competitors’ retail products. Our HOD business also faces increased competition from filtration units in the residential and commercial market. Because homes and offices with installed filtration systems participate at a lower rate in the bottled water market, the installation of these systems poses a competitive threat to our business and reduces the number of potential customers for our bottled water products. In addition, consumers may choose to drink from municipal water sources instead of purchasing bottled water or using a filtration unit. Our OCS business is also subject to intense competition. Our coffee business consists of both large brewers and single-serve brewers, where increased competition has developed from food, beverage and office products distributors. Additionally, retail and internet availability of these products could negatively affect demand for the direct distribution sources we offer.
The coffee industry is highly competitive, including with respect to price, product quality, service, convenience and innovation, and competition could become increasingly more intense due to the relatively low barriers to entry. We face competition from many sources, including the institutional foodservice divisions of multi-national manufacturers of retail products many of which have greater financial and other resources than we do, wholesale foodservice distributors, regional institutional coffee roasters, and specialty coffee suppliers. If we do not succeed in differentiating ourselves through, among
11
Table of Contents
other things, our product and service offerings, then our competitive position may be weakened and our sales and profitability may be materially adversely affected. If, due to competitive pressures or contractual restrictions, we are required to reduce prices to attract market share or we are unable to increase prices in response to commodity and other cost increases and we are not able to increase sales volumes to offset the margin declines, then our results of operations could be adversely affected.
Our ingredients, packaging supplies and other costs are subject to price increases, and we may be unable to effectively pass rising costs on to our customers, or effectively hedge against such rising costs.
We typically bear the risk of changes in prices on the ingredient and packaging materials in our products. The majority of our ingredient and packaging supply contracts allow our suppliers to alter the prices they charge us based on changes in the costs of the underlying commodities that are used to produce them and, in some cases, changes in production costs. Resin for PET, HDPE and polycarbonate bottles and green coffee are examples of these underlying commodities. These changes in the prices we pay for ingredient and packaging materials occur at times that vary by product and supplier, and take place, on a monthly, quarterly or annual basis.
Accordingly, we bear the risk of fluctuations in the costs of these ingredient and packaging materials, including the underlying costs of the commodities used to manufacture them and, to some extent, the costs of converting those commodities into the materials we purchase. If the cost of these ingredients or packaging materials increases, we may be unable to pass these costs along to our customers through adjustments to the prices we charge, which could have a negative effect on our results of operations. If we are able to pass these costs on to our customers through price increases, the impact those increased prices could have on our volumes is uncertain.
Our production facilities use a significant amount of electricity, natural gas and other energy sources to operate. Fluctuations in the price of fuel and other energy sources for which we have not locked in long-term pricing commitments or arrangements would affect our operating costs, which could negatively affect our results of operations.
We have entered into futures contracts designed to mitigate the price risk associated with forecasted purchases of green coffee used in our manufacturing process. Price increases could exert pressure on our costs and we may not be able to effectively hedge any such increases. Furthermore, price decreases in commodities that we have effectively hedged could also increase our cost of goods sold for mark-to-market changes in the derivative instruments. In addition to risk mitigation programs around futures contracts and hedging programs with our customers in order to reduce the risk of commodity fluctuations in key areas such as coffee procurement, we also have implemented energy surcharges in our Route Based Services reporting segment in North America tied to certain energy indexes within North America. We also have implemented a number of sustainability programs throughout our network to assist our suppliers in operating under changing environments. Our core product of HOD bottled water utilizes a reusable bottle that allows for the overall cost to service to be spread out over a number of recurring trips to our customer base.
If we fail to manage our operations successfully, our business and results of operations may be negatively affected.
In recent years, we have grown our business and beverage offerings primarily through the acquisition of other companies, development of new product lines and growth with key customers. We believe that opportunities exist to grow our business by leveraging existing customer relationships, obtaining new customers, exploring new channels of distribution, introducing new products or identifying appropriate acquisition or strategic alliance candidates. The success of this strategy with respect to acquisitions depends on our ability to manage and integrate acquisitions and alliances into our existing business. Furthermore, the businesses or product lines that we acquire or align with may not be integrated successfully into our business or prove profitable. In addition to the foregoing factors, our ability to expand our business in foreign countries is also dependent on, and may be limited by, our ability to comply with the laws of the various jurisdictions in which we may operate, as well as changes in local government regulations and policies in such jurisdictions. If we fail to successfully manage our operations, our business and results of operation could be adversely affected.
We may devote a significant amount of our management’s attention and resources to our ongoing review of strategic opportunities, and we may not be able to fully realize the potential benefit of any such alternatives that we pursue.
As part of our overall strategic planning process, from time to time we evaluate whether there are alternatives available to complement our strategy of organic growth and growth through diversification. Accordingly, we may from time to time be engaged in evaluating potential transactions and other strategic alternatives, and we may engage in discussions that may result in one or more transactions. Although there would be uncertainty that any of these discussions would result in definitive agreements or the completion of any transaction, we may devote a significant amount of our management’s attention and resources to evaluating and pursuing a transaction or opportunity, which could negatively affect our operations.
12
Table of Contents
In addition, we may incur significant costs in connection with evaluating and pursuing other strategic opportunities, regardless of whether any transaction is completed. We may not fully realize the potential benefits of any strategic alternatives or transactions that we pursue.
We have completed the divestiture of our Traditional Business, and have ongoing obligations and potential liabilities associated with the Transaction.
On January 30, 2018, we completed the divestiture of our Traditional Business in the Transaction. Under the Purchase Agreement, we remain liable for certain pre-closing liabilities associated with the divested business, such as taxes and certain litigation, and we remain liable for a period of time for breaches of representations, warranties and covenants made to the purchaser. We have also indemnified the purchaser in the event of such breaches and for other specific risks. Even though the Purchase Agreement contains what we believe to be customary liability caps, and we have established reserves for any expected ongoing liability associated with the divested business, unexpected liabilities may arise for which we could be responsible. If that occurs, or if established reserves are not sufficient, it could negatively affect our financial condition and future results of operations.
We may not realize the expected revenue and cost synergies related to our recent acquisitions.
The success of our recent acquisitions will depend, in part, on our ability to realize all or some of the anticipated benefits from integrating with our existing businesses. The integration process may be complex, costly, time-consuming and subject to significant business, economic and competitive uncertainties and contingencies, many of which are difficult to predict and are beyond our control. The difficulties of integrating the operations and realizing revenue and cost synergies include, among others:
| • | failure to implement our business plan for the combined business; |
| • | unanticipated issues in integrating manufacturing, logistics, information, communications and other systems; |
| • | possible inconsistencies in standards, controls, procedures and policies, and compensation structures between acquired structures and our structure; |
| • | failure to retain key customers and suppliers; |
| • | unanticipated changes in applicable laws and regulations; |
| • | failure to retain key employees; |
| • | additional exposure to risks of new markets and geographies; |
| • | inherent operating risks; and |
| • | other unanticipated issues, expenses and liabilities. |
We may not be able to maintain the levels of revenue, earnings or operating efficiency that each of Cott, on the one hand, and DSS, Eden and S&D, on the other hand, had achieved or might achieve separately. Even if we realize the expected benefits, this may not be achieved within the anticipated time frame. Furthermore, the synergies from recent acquisitions may be offset by costs incurred in consummating such acquisitions or in integrating the acquired businesses, increases in other expenses, operating losses or unrelated adverse results in the business. As a result, there can be no assurance that such synergies will be achieved.
In addition, actual results may differ from pro forma financial information of the combined companies due to changes in the fair value of assets acquired and liabilities assumed, changes in assumptions used to form estimates, difference in accounting policies between the companies, and completion of purchase accounting.
Our indemnification rights under the acquisition agreements are limited.
In connection with each of the acquisitions of DSS, Eden and S&D, we are generally subject to all of the liabilities of the acquired business that were not satisfied on or prior to the closing date of such transaction. There may be liabilities that we underestimated or did not discover in the course of performing our due diligence investigation. Under each of the respective purchase agreements, we have been provided with a limited set of warranties and indemnities in relation to
13
Table of Contents
identified risks. Our sole remedy from the sellers for any breach of those warranties is an action for indemnification, which is subject to certain negotiated limitations and thresholds, or an action for damages. Our rights to indemnification in most cases must be asserted within a negotiated time period after closing, which means if we fail to identify a breach promptly after closing, we may not be able to recover amounts to which we otherwise would have been entitled. We have secured insurance to cover losses arising in respect of the breach by the seller of those warranties and funds have been placed into escrow, but such funds may prove insufficient to cover damages that may occur. Damages resulting from a breach of warranty could have a material and adverse effect on our financial condition and results of operations.
Changes in future business conditions could cause business investments and/or recorded goodwill, indefinite life intangible assets or other intangible assets to become impaired, resulting in substantial losses and write-downs that would negatively affect our results of operations.
As part of our overall strategy, we will, from time to time, make investments in other businesses. These investments are made upon target analysis and due diligence procedures designed to achieve a desired return or strategic objective. These procedures often involve certain assumptions and judgment in determining investment amount or acquisition price. After consummation of an acquisition or investment, unforeseen issues could arise that adversely affect anticipated returns or that are otherwise not recoverable as an adjustment to the purchase price. Even after careful integration efforts, actual operating results may vary significantly from initial estimates. Goodwill accounted for approximately $1,104.7 million of our recorded total assets of continuing operations as of December 30, 2017. We evaluate the recoverability of recorded goodwill amounts annually, or when evidence of potential impairment exists. The annual impairment test is based on several factors requiring judgment and certain underlying assumptions. Our other intangible assets with indefinite lives relate to the 2001 acquisition of intellectual property from Royal Crown Company, Inc., including the right to manufacture our concentrates, with all related inventions, processes, technologies, technical and manufacturing information, know-how and the use of the Royal Crown brand outside of North America and Mexico (the “Rights”), and trademarks acquired in the acquisitions of DSS, Aquaterra and Eden. These assets have an aggregate net book value of $288.6 million, and are more fully described in Note 1 to the Consolidated Financial Statements.
As of December 30, 2017, our intangible assets subject to amortization, net of accumulated amortization for continuing operations were $462.5 million, which consisted principally of $428.7 million of customer relationships that arose from acquisitions, $15.8 million of software, and $14.2 million of patents. Customer relationships are typically amortized on an accelerated basis for the period over which we expect to receive the economic benefits. The customer relationships acquired in connection with the acquisitions of S&D, Eden, Aquaterra, and DSS are amortized over the expected remaining useful life of those relationships on a basis that reflects the pattern of realization of the estimated undiscounted after-tax cash flows. We review the estimated useful life of these intangible assets annually, taking into consideration the specific net cash flows related to the intangible asset, unless a review is required more frequently due to a triggering event such as the loss of a significant customer. The permanent loss of, or significant decline in sales to customers included in the intangible asset would result in either an impairment in the value of the intangible asset or an accelerated amortization of any remaining value and could lead to an impairment of the fixed assets that were used to service that customer. Principally, a decrease in expected reporting segment cash flows, changes in market conditions, loss of key customers and a change in our imputed cost of capital may indicate potential impairment of recorded goodwill, the Rights, trademarks or tradenames. For additional information on accounting policies we have in place for goodwill impairment, see our discussion under “Critical Accounting Policies and Estimates” in “Item 7. Management’s Discussion and Analysis of Financial Condition and Results of Operations” of this Annual Report on Form 10-K and Note 1 to the Consolidated Financial Statements.
Our geographic diversity subjects us to the risk of currency fluctuations.
Although our sales predominately come from the United States, we conduct operations in many areas of the world, involving transactions denominated in a variety of currencies. We are subject to currency exchange rate risk to the extent that our costs are denominated in currencies other than those in which we earn revenues. In addition, because our financial statements are denominated in U.S. dollars, changes in currency exchange rates between the U.S. dollar and other currencies have had, and will continue to have, an impact on our results of operations. While we may enter into financial transactions to address these risks, there can be no assurance that currency exchange rate fluctuations will not negatively affect our financial condition, results of operations and cash flows. In addition, while the use of currency hedging instruments may provide us with protection from adverse fluctuations in currency exchange rates, by utilizing these instruments we potentially forego the benefits that might result from favorable fluctuations in currency exchange rates.
14
Table of Contents
If we are unable to maintain relationships with our raw material suppliers, we may incur higher supply costs or be unable to deliver products to our customers.
In addition to water, the principal raw materials required to produce our products are green coffee, tea, PET resin, HDPE and polycarbonate bottles, caps and preforms, labels and cartons and trays. We rely upon our ongoing relationships with our key suppliers to support our operations.
We typically enter into annual or multi-year supply arrangements with our key suppliers, meaning that our suppliers are obligated to continue to supply us with materials for one-year or multi-year periods, at the end of which we must either renegotiate the contracts with those suppliers or find alternative sources for supply. There can be no assurance that we will be able to either renegotiate contracts (with similar or more favorable terms) with these suppliers when they expire or, alternatively, if we are unable to renegotiate contracts with our key suppliers, there can be no assurance that we could replace them. We could also incur higher ingredient and packaging supply costs in renegotiating contracts with existing suppliers or replacing those suppliers, or we could experience temporary disruptions in our ability to deliver products to our customers, either of which could negatively affect our results of operations.
With respect to some of our key ingredients, such as green coffee, we have entered into long-term supply agreements, the remaining terms of which range up to 12 months, and therefore we expect to have a supply of those key ingredients during such terms. In addition, the supply of specific ingredient and packaging materials could be adversely affected by many factors, including industry consolidation, energy shortages, governmental controls, labor disputes, natural disasters, transportation interruption, political instability, acts of war or terrorism and other factors.
Some of the Arabica coffee beans we purchase do not trade directly on the commodity markets. Rather, we purchase these coffee beans on a negotiated basis from coffee brokers, exporters and growers. If any of these supply relationships deteriorate, we may be unable to procure a sufficient quantity of high-quality coffee beans at prices acceptable to us or at all. Further, non-performance by suppliers could expose us to credit and supply risk under coffee purchase commitments for delivery in the future. In addition, the political situation in many of the Arabica coffee growing regions, including Africa, Indonesia, and Central and South America, can be unstable, and such instability could affect our ability to purchase coffee from those regions. If green coffee beans from a region become unavailable or prohibitively expensive, we could be forced to use alternative coffee beans or discontinue certain blends, which could adversely impact our sales. A raw material shortage could result in a decrease in revenues or a deterioration of our relationship with our customers in our OCS business, or could impair our ability to expand our OCS business.
We have a significant amount of outstanding indebtedness, which could adversely affect our financial health, and future cash flows may not be sufficient to meet our obligations.
As of December 30, 2017, our total indebtedness for continuing operations was $2,287.0 million, of which $1,011.2 million was retired or repaid upon closing of the Transaction. Our present indebtedness and any future borrowings could have important adverse consequences to us and our investors, including:
| • | requiring a substantial portion of our cash flow from operations to make interest payments on this indebtedness; |
| • | making it more difficult to satisfy debt service and other obligations; |
| • | increasing the risk of a future credit ratings downgrade of our indebtedness, which would increase future debt costs; |
| • | increasing our vulnerability to general adverse economic and industry conditions; |
| • | reducing the cash flow available or limiting our ability to borrow additional funds for share repurchases, to pay dividends, to fund capital expenditures and other corporate purposes and to grow our business; |
| • | limiting our flexibility in planning for, or reacting to, changes in our business and the industry; and |
| • | placing us at a competitive disadvantage to our competitors that may not be as highly leveraged as we are. |
To the extent we become more leveraged, we face an increased likelihood that one or more of the risks described above would materialize. In addition, our actual cash requirements in the future may be greater than expected. We cannot assure you that our business will generate sufficient cash flow from operations, or that future borrowings will be available to us in amounts sufficient to enable us to pay our indebtedness or to fund our other liquidity needs.
15
Table of Contents
If we fail to generate sufficient cash flow from future operations to meet our debt service obligations, we may need to refinance all or a portion of our indebtedness on or before maturity. We cannot assure you that we will be able to refinance any of our indebtedness on attractive terms, commercially reasonable terms or at all. If we cannot service or refinance our indebtedness, we may have to take actions such as selling assets, seeking additional equity or reducing or delaying capital expenditures, strategic acquisitions, investments and alliances, any of which could impede the implementation of our business strategy, prevent us from entering into transactions that would otherwise benefit our business and/or have a material adverse effect on our financial condition and results of operations. Our future operating performance and our ability to service or refinance our indebtedness will be subject to future economic conditions and to financial, business and other factors, many of which are beyond our control.
Our ABL facility and the indenture governing our outstanding notes each contain various covenants limiting the discretion of our management in operating our business, which could prevent us from capitalizing on business opportunities and taking some corporate actions.
Our ABL facility and the indenture governing our outstanding notes each impose significant operating and financial restrictions on us. These restrictions will limit or restrict, among other things, our ability and the ability of our restricted subsidiaries to:
| • | incur additional indebtedness; |
| • | make restricted payments (including paying dividends on, redeeming, repurchasing or retiring our capital stock); |
| • | make investments; |
| • | create liens; |
| • | sell assets; |
| • | enter into agreements restricting our subsidiaries’ ability to pay dividends, make loans or transfer assets to us; |
| • | engage in transactions with affiliates; and |
| • | consolidate, merge or sell all or substantially all of our assets. |
These covenants are subject to important exceptions and qualifications. In addition, our ABL facility also requires us, under certain circumstances, to maintain compliance with certain financial covenants as described in the “Covenant Compliance” section in Item 7. Our ability to comply with these covenants may be affected by events beyond our control, including those described in this “Risk Factors” section. A breach of any of the covenants contained in our ABL facility, or the indentures governing our outstanding notes could result in an event of default under one or more of the documents governing such obligations, which would allow the lenders under our ABL facility to declare all borrowings outstanding, or in the case of the noteholders of our outstanding notes, all principal amounts outstanding on such notes, to be due and payable. Any such acceleration would trigger cross-default provisions under the ABL facility, and the indentures governing our outstanding notes and, potentially, our other indebtedness. In the event of an acceleration of payment obligations, we would likely be unable to pay our outstanding indebtedness with our cash and cash equivalents then on hand. We would, therefore, be required to seek alternative sources of funding, which may not be available on commercially reasonable terms, terms as favorable as our current agreements or at all. If we are unable to refinance our indebtedness or find alternative means of financing our operations, we may be required to curtail our operations, face bankruptcy, or take other actions that are inconsistent with our current business practices or strategy. For additional information about our ABL facility, see our discussion under “Liquidity and Capital Resources” in “Item 7. Management’s Discussion and Analysis of Financial Condition and Results of Operations” of this Annual Report on Form 10-K and Note 15 to the Consolidated Financial Statements.
A portion of our debt may be variable rate debt, and changes in interest rates could adversely affect us by causing us to incur higher interest costs with respect to such variable rate debt.
Our ABL facility subjects us to interest rate risk. The rate at which we pay interest on amounts borrowed under such facility fluctuates with changes in interest rates and our debt leverage. Accordingly, with respect to any amounts from time to time outstanding under our ABL facility, we are and will be exposed to changes in interest rates. If we are unable to adequately manage our debt structure in response to changes in the market, our interest expense could increase, which would negatively affect our financial condition and results of operations. The outstanding borrowings under the ABL facility as of December 30, 2017 were $220.3 million.
16
Table of Contents
We incurred substantial indebtedness in order to finance acquisitions, which could adversely affect our business and limit our ability to plan for or respond to changes in our business.
Our strategy of growth by acquisitions has been financed by the incurrence of substantial indebtedness. There can be no assurance that we will be successful in obtaining any future debt financing on favorable terms or at all.
Our ability to make payments on our debt obligations and to fund planned capital expenditures depends on our ability to generate cash from our future operations. This, to a certain extent, is subject to financial, competitive, legislative, regulatory and other factors that are beyond our control. In addition, if we cannot service our indebtedness, we may have to take actions such as selling assets, seeking additional equity or reducing or delaying capital expenditures, strategic acquisitions, investments and alliances, any of which could impede the implementation of our business strategy, prevent us from entering into transactions that would otherwise benefit our business and/or negatively affect our financial condition and results of operations. We may not be able to refinance our indebtedness or take such other actions, if necessary, on commercially reasonable terms, or at all.
Our results of operations may be negatively affected by global financial events.
In recent years, global financial events have resulted in the consolidation, failure or near failure of a number of institutions in the banking, insurance and investment banking industries and have substantially reduced the ability of companies to obtain financing. These events also adversely affected the financial markets. These events could continue to have a number of different effects on our business, including:
| • | a reduction in consumer spending, which could result in a reduction in our sales volume; |
| • | a negative impact on the ability of our customers to timely pay their obligations to us or our vendors to timely supply materials, thus reducing our cash flow; |
| • | an increase in counterparty risk; |
| • | an increased likelihood that one or more members of our banking syndicate may be unable to honor its commitments under our ABL facility; and |
| • | restricted access to capital markets that may limit our ability to take advantage of business opportunities. |
Other events or conditions may arise or persist directly or indirectly from the global financial events that could negatively affect our business.
We may not fully realize the expected cost savings and/or operating efficiencies from our restructuring activities.
We have in the past implemented, and may in the future implement, restructuring activities to support the implementation of key strategic initiatives designed to achieve long-term sustainable growth. These activities are intended to maximize our operating effectiveness and efficiency and to reduce our costs. We cannot be assured that we will achieve or sustain the targeted benefits under these programs or that the benefits, even if achieved, will be adequate to meet our long-term growth expectations. In addition, the implementation of key elements of these activities may have an adverse impact on our business, particularly in the near-term.
Substantial disruption to production at our production facilities could occur.
A disruption in production at our production facilities or those of our suppliers, bottlers, distribution channels or service networks could have a material adverse effect on our business. The disruption could occur for many reasons, including fire, natural disasters, weather, manufacturing problems, diseases, strikes, transportation interruption, government regulation or terrorism. Alternative facilities with sufficient capacity or capabilities may not be available, may cost substantially more or may take a significant time to start production, each of which could negatively impact our business and results of operations.
17
Table of Contents
Our business is dependent on our ability to maintain access to our water sources; water scarcity and poor quality could negatively affect our long-term financial performance.
A disruption in the water flow at any one of our water sources, a dispute over water rights, increased legal restrictions on water use or access at our water sources or the failure to maintain access to our water sources could cause an increase in the cost of our products or shortages that would likely not allow us to meet market demand. The potential delivery and price disruptions due to the loss of any one water source or a decline in the volume of water available could significantly disrupt our business, result in the loss of customer confidence and have an adverse effect on our business, financial condition and results of operations. Further, if any of our municipal water sources were curtailed or eliminated as a result of, for example, a natural disaster, work stoppage or other significant event that disrupted water flow from such municipal source, we may have to purchase water from other sources, which could increase water and transportation costs and could result in supply shortages and price increases. Any one of these events could have a negative impact on our business, financial condition, reputation and results of operations.
Water is a limited resource facing significant challenges from population growth, environmental contamination and poor management. As demand for water continues to increase and if water becomes more scarce and the quality of water available deteriorates, our business may incur increasing costs or face capacity constraints, which could adversely affect our profitability or net sales in the long run.
Our success depends, in part, on our intellectual property, which we may be unable to protect.
While we own certain of the trademarks used to identify our beverages, other trademarks are used through licenses from third-parties or by permission from our customers. Our success depends, in part, on our ability to protect our intellectual property.
To protect this intellectual property, we rely principally on registration of trademarks, contractual responsibilities and restrictions in agreements (such as indemnification, nondisclosure and confidentiality agreements) with employees, consultants and customers, and on common law and statutory protections afforded to trademarks, trade secrets and proprietary “know-how.” In addition, we vigorously protect our intellectual property against infringements using any and all legal remedies available. Notwithstanding our efforts, we may not be successful in protecting our intellectual property for a number of reasons, including:
| • | our competitors may independently develop intellectual property that is similar to or better than ours; |
| • | employees, consultants or customers may not abide by their contractual agreements and the cost of enforcing those agreements may be prohibitive, or those agreements may prove to be unenforceable or more limited than anticipated; |
| • | foreign intellectual property laws may not adequately protect our intellectual property rights; and |
| • | our intellectual property rights may be successfully challenged, invalidated or circumvented. |
If we are unable to protect our intellectual property, our competitive position would weaken and we could face significant expense to protect or enforce our intellectual property rights. At December 30, 2017, we had $24.5 million of Rights and $264.1 million of trademarks recorded as intangible assets not subject to amortization (see Note 13 to the Consolidated Financial Statements).
Occasionally, third parties may assert that we are, or may be, infringing on or misappropriating their intellectual property rights. In these cases, we intend to defend against claims or negotiate licenses when we consider these actions appropriate. Intellectual property cases are uncertain and involve complex legal and factual questions. If we become involved in this type of litigation, it could consume significant resources and divert our attention from business operations.
If we are found to infringe on the intellectual property rights of others, we could incur significant damages, be enjoined from continuing to manufacture, market or use the affected product, or be required to obtain a license to continue manufacturing or using the affected product. A license could be very expensive to obtain or may not be available at all. Similarly, changing products or processes to avoid infringing the rights of others may be costly or impracticable.
Our products may not meet health and safety standards or could become contaminated and we could be liable for injury, illness or death caused by consumption of our products.
We have adopted various quality, environmental, health and safety standards. However, our products may still not meet these standards or could otherwise become contaminated. A failure to meet these standards or contamination could occur in our operations or those of our bottlers, distributors or suppliers. This could result in expensive production interruptions, recalls and liability claims. We may be liable to our customers if the consumption of any of our products causes injury, illness or death. Moreover, negative publicity could be generated from false, unfounded or nominal liability claims or limited recalls. Any of these failures or occurrences could negatively affect our business, results of operations or cash flows.
18
Table of Contents
Litigation or legal proceedings could expose us to significant liabilities and damage our reputation.
We are party to various litigation claims and legal proceedings. We evaluate these claims and proceedings to assess the likelihood of unfavorable outcomes, and, if possible, estimate the amount of potential losses. If our products are not safely and/or properly manufactured or designed, personal injuries or property damage could result, which could subject us to claims for damages. The costs associated with defending product liability and other claims, and the payment of damages, could be substantial. Our reputation could also be adversely affected by such claims, whether or not successful.
We may establish a reserve as appropriate based upon assessments and estimates in accordance with our accounting policies and we have also asserted insurance claims where appropriate. We base our assessments, estimates and disclosures on the information available to us at the time and rely on legal and management judgment. Actual outcomes or losses or any recoveries we may receive from insurance may differ materially from assessments and estimates. Actual settlements, judgments or resolutions of these claims or proceedings may negatively affect our business and financial performance. A successful claim against us that is not covered by insurance or is in excess of our available insurance limits could require us to make significant payments of damages and could negatively affect our business, financial condition and results of operations. For more information, see “Item 3. Legal Proceedings.”
Changes in the legal and regulatory environment in the jurisdictions in which we operate could negatively affect our results of operations, adversely affect demand for our products and services or result in litigation.
As a producer and distributor of beverages, we must comply with various federal, state, provincial, local and foreign laws relating to production, packaging, quality, labeling and distribution, including, in the United States, those of the federal Food, Drug and Cosmetic Act, the Fair Packaging and Labeling Act, the Federal Trade Commission Act, the Nutrition Labeling and Education Act and California Proposition 65. We are also subject to various federal, state, provincial, local and foreign environmental laws and workplace regulations. These laws and regulations include, in the United States, the Occupational Safety and Health Act, the Unfair Labor Standards Act, the Clean Air Act, the Clean Water Act, the Safe Drinking Water Act, the Comprehensive Environmental Response, Compensation, and Liability Act, the Resource Conservation and Recovery Act, the Federal Motor Carrier Safety Act, laws governing equal employment opportunity, customs and foreign trade laws and regulations, laws relating to the maintenance of fuel storage tanks, laws relating to mineral and chemical concentration and water quality, consumption and treatment, and various other federal statutes and regulations. The Food and Drug Administration (“FDA”) regulates bottled water as a food. Our bottled water must meet FDA requirements of safety for human consumption, labeling, processing and distribution under sanitary conditions and production in accordance with FDA “good manufacturing practices.” Outside the United States, the production and distribution of our products are also subject to various laws and regulations. These laws and regulations may change as a result of political, economic, or social events. Such regulatory changes may include changes in food and drug laws, laws related to advertising, accounting standards, taxation requirements, competition laws and environmental laws, including laws relating to the regulation of water rights and treatment. Changes in laws, regulations or government policy and related interpretations may alter the environment in which we do business, which may negatively affect our results of operations or increase our costs or liabilities.
Food/Beverage Production
A number of states have passed laws setting forth warning or labeling requirements relating to products made for human consumption. For example, the California law known as Proposition 65 requires that a specific warning appear on any product sold in California containing a substance listed by that state as having been found to cause cancer or reproductive toxicity. This law, and others like it, exposes all food and beverage producers to the possibility of having to provide warnings on their products. The detection of even a trace amount of a listed substance can subject an affected product to the requirement of a warning label, although products containing listed substances that occur naturally or that are contributed to such products solely by a municipal water supply are generally exempt from the warning requirement. From time to time over the past several years, certain of our customers have received notices alleging that the labeling requirements of the relevant state regulation would apply to products manufactured by us and sold by them. There can be no assurance that we will not be adversely affected by actions against our customers or us relating to Proposition 65 or similar “failure to warn” laws. Were any such claim to be pursued or succeed, we might in some cases be required to indemnify our customers for damages and provide warnings on our products in order for them to be sold in certain states. Any negative media attention, adverse publicity or action arising from allegations of violations could adversely affect consumer perceptions of our products and harm our business.
19
Table of Contents
Energy/Conservation Initiatives
The EPA has oversight over the voluntary Energy Star certification program for appliances, including bottled water dispensers. Since February 1, 2014, the EPA has required appliances in the program to adhere to a lower energy consumption standard of 0.87 kilowatt hours per day. While we are working closely with our water cooler manufacturers to ensure we have continued access to Energy Star certified bottled water dispensers, there can be no assurances that we will continue to have such access. Our inability to utilize compliant dispensers could negatively affect our business, financial condition, reputation and results of operations.
Recent initiatives have taken place in several markets in which we operate regarding bottled water. Regulations have been proposed in some jurisdictions that would ban the use of public funds to purchase bottled water, enact local taxes on bottled water and water extraction and restrict the withdrawal of water from public and private sources. We believe that the adverse publicity associated with these initiatives is generally aimed at the retail, small bottle segment of the industry that is a minimal part of our business, and that our customers can readily distinguish our products from the retail bottles that are currently the basis for concern in some areas. Our customers typically buy their water in reusable 3G and 5G water bottles that are placed on coolers and reused many times. While we believe that to date we have not directly experienced any adverse effects from these concerns, and that our products are sufficiently different from those under scrutiny, there is no assurance that adverse publicity about any element of the bottled water industry will not affect consumer behavior by discouraging buyers from buying bottled water products generally. In that case, our sales and other financial results could be adversely affected.
The increasing concern over climate change also may result in more regional, federal and/or global legal and regulatory requirements to reduce or mitigate the effects of greenhouse gases. In the event that such regulation is more aggressive than the sustainability measures that we are currently undertaking to monitor our emissions and improve our energy efficiency, we may experience significant increases in our costs of operation and delivery. In particular, increasing regulation of fuel emissions could substantially increase the cost of energy, including fuel, required to operate our facilities or transport and distribute our products, particularly in our DSS business, thereby substantially increasing the distribution and supply chain costs associated with our products. As a result, climate change could negatively affect our business and results of operations.
Packaging Ingredients
The manufacture, sale and use of resins and Bisphenol A (“BPA”) used to make our 3G and 5G water bottles are subject to regulation by the Food and Drug Administration (“FDA”). These regulations relate to substances used in food packaging materials, not with specific finished food packaging products. BPA is contained in substantially all of our three- and five-gallon returnable polycarbonate plastic bottles. Negative media attention regarding BPA has generated concern in the bottled water market, although a January 2010 report by the FDA notes studies that suggest the low levels of BPA used in polycarbonate bottles are safe for human exposure and the FDA sustained this opinion in its March 2013 BPA consumer update. The FDA indicated that it will continue to evaluate these studies before issuing a final assessment on the safety of BPA and the FDA’s current public health recommendations include taking reasonable steps to reduce exposure of infants and young children to BPA. The FDA and certain states, however, may in the future decide to regulate more aggressively the potential harmful effects of BPA. Although the FDA rejected a 2012 citizen petition from the Natural Resources Defense Council seeking the ban of BPA from all food and drink packaging, including plastic bottles and canned foods, our customers and potential new customers may share the concerns raised by the citizens petition and may reduce their exposure to BPA as a result. The FDA has also asserted the need for additional studies on the safety of BPA in food packaging materials and acknowledged recent studies regarding potential developmental and behavioral effects of BPA exposure on infants and young children. The EPA and certain states also may in the future study or regulate BPA. Additionally, a number of states have passed legislation banning the use of BPA in packaging intended for children three years of age and younger, such as in baby bottles and sippy cups. Extensive negative public perception regarding food packaging that uses BPA could cause consumers to stop purchasing our products manufactured in polycarbonate bottles. Further, the emergence of new scientific evidence or reports that suggests our polycarbonate water bottles are unsafe, or interpretations of existing evidence by regulatory agencies that lead to prohibitions on the use of polycarbonate plastic as packaging for food contact materials, could cause a serious disruption in our ability to package our bottled water products. If polycarbonate plastic becomes a banned substance, we may not be able to adopt alternative packaging, and conduct extensive and costly safety testing, in time to prevent adverse effects to our business, financial condition and results of operations. Further, if our competitors successfully integrate BPA-free packaging into their business and BPA is subsequently deemed undesirable or unsafe, our competitors may have a significant competitive advantage over us.
20
Table of Contents
Hazardous Materials
We engage in or have in the past engaged in the handling, storage or use of hazardous substances, including for the maintenance and fueling of our vehicle fleet for our DSS business. We are also required to obtain environmental permits from governmental authorities for certain operations. We cannot assure you that we have been or will be at all times in complete compliance with such laws, regulations and permits. If we violate or fail to comply with these laws, regulations or permits, we could be fined or otherwise sanctioned by regulators. We could also be held liable for any consequences arising out of human exposure to hazardous substances or other environmental damage.
Certain environmental laws impose liability on current or previous owners or operators of real property for the cost of removal or remediation of hazardous substances. These laws often impose liability even if the owner or operator did not know of, or was not responsible for, the release of such hazardous substances and also impose liability on persons who arrange for hazardous substances to be sent to disposal or treatment facilities. In addition to actions brought by governmental agencies, private plaintiffs may also bring personal injury claims arising from the presence of hazardous substances on a property. Certain environmental contamination has been identified at or in the vicinity of some of our DSS properties. From time to time, we have also been named a potentially responsible party at third-party waste disposal sites. There can be no assurances that we will not be required to make material expenditures in the future for these or other contamination-related concerns or that other responsible parties will conduct any required cleanup. Environmental laws and regulations are complex, change frequently and tend to become more stringent over time. We cannot assure you that our costs of complying with current and future environmental laws and regulations and our liabilities arising from past or future releases of, or exposure to, hazardous substances will not negatively affect our business, financial condition or results of operations.
Our business is seasonal and adverse weather conditions could negatively affect our business, financial condition and results of operations.
The sales of our products are influenced to some extent by weather conditions in the markets in which we operate. Unusually cold or rainy weather during the summer months may reduce the demand for our bottled water and other products and contribute to lower revenues, which could negatively affect our profitability. Warmer winter weather could decrease sales of our coffee and hot chocolate products and negatively affect our business, financial condition and results of operations.
Global or regional catastrophic events could affect our operations and results of operations.
Our business can be affected by large-scale terrorist acts, especially those directed against the United States or other major industrialized countries in which we do business, major natural disasters, or widespread outbreaks of infectious diseases. Such events could impair our ability to manage our business, could disrupt our supply of raw materials, and could affect production, transportation and delivery of products. In addition, such events could cause disruption of regional or global economic activity, which can affect consumers’ purchasing power in the affected areas and, therefore, reduce demand for our products.
Our success depends in part upon our ability to recruit, retain and prepare succession plans for our CEO, CFO, senior management and key employees.
The performance of our Chief Executive Officer (“CEO”), Chief Financial Officer (“CFO”), senior management and other key employees is critical to our success. We plan to continue to invest time and resources in developing our senior management and key employee teams. Our long-term success will depend on our ability to recruit and retain capable senior management and other key employees, and any failure to do so could have a material adverse effect on our future operating results and financial condition. Further, if we fail to adequately plan for the succession of our CEO, CFO, senior management and other key employees, our results of operations could be negatively affected.
We may not be able to renew collective bargaining agreements on satisfactory terms, or we could experience strikes.
Some of our employees are covered by collective bargaining agreements expiring on various dates. We may not be able to renew our collective bargaining agreements on satisfactory terms or at all. This could result in strikes or work stoppages, which could impair our ability to manufacture and distribute our products and result in a substantial loss of sales. The terms of existing or renewed agreements could also significantly increase our costs or negatively affect our ability to increase operational efficiency.
21
Table of Contents
We depend on key information systems and third-party service providers.
We depend on key information systems to accurately and efficiently transact our business, provide information to management and prepare financial reports. We rely on third-party providers for various networking, application hosting and related business process services which support our key information systems. Issues with performance by these third-parties may disrupt our operations and as a result, our operating expenses could increase, which could negatively affect our results of operations.
In addition, these systems and services are vulnerable to interruptions or other failures resulting from, among other things, natural disasters, terrorist attacks, software, equipment or telecommunications failures, processing errors, computer viruses, hackers, other security issues or supplier defaults. Security, backup and disaster recovery measures may not be adequate or implemented properly to avoid such disruptions or failures. Any disruption or failure of these systems or services could cause substantial errors, processing inefficiencies, security breaches, inability to use the systems or process transactions, loss of customers or other business disruptions, all of which could negatively affect our business and results of operations.
If we are unable to securely maintain our customers’ confidential or credit card information, or other private data relating to our employees or our Company, we could be subject to negative publicity, costly government enforcement actions or private litigation, which could damage our business reputation and negatively affect our results of operations.
The protection of our customer, employee and Company data is critical to us. We have procedures and technology in place to safeguard our customers’ debit card, credit card and other personal information, our employees’ private data and Company records and intellectual property. However, if we experience a data security breach of any kind, we could be exposed to negative publicity, government enforcement actions, private litigation or costly response measures. In addition, our reputation within the business community and with our customers may be affected, which could result in our customers discontinuing their purchases of our products and services or their use of the debit or credit card payment option. Any loss of our ability to securely offer our customers a credit card payment option would make our products less attractive to many small organizations by negatively affecting our customer experience and significantly increasing our administrative costs related to customer payment processing. This could cause us to lose market share to our competitors and could have a negative effect on our results of operations.
In addition, the regulatory environment surrounding information security and privacy is increasingly demanding, with frequent imposition of new and changing requirements. For example, the European Union’s General Data Protection Regulation, which will become effective in May 2018, imposes significant new requirements on how we collect, process and transfer personal data, as well as significant fines for non-compliance. Compliance with changes in privacy and information security laws and standards may result in significant expense due to increased investment in technology and the development of new operational processes.
We may not continue our quarterly dividend and shareowners may never obtain a return on their investment.
We have paid quarterly cash dividends since 2012. Most recently, the board of directors declared a dividend of $0.06 per common share to be paid in cash on March 28, 2018 to shareowners of record at the close of business on March 13, 2018. However, there can be no assurance that we will continue to declare quarterly dividends in the future. The declaration and payment of future dividends on our common shares is subject to, among other things, the best interests of our shareowners, our results of operations, cash balances and future cash requirements, financial condition, statutory regulations and covenants and other restrictions on payment set forth in the instruments governing our indebtedness and preferred shares in effect from time to time. Accordingly, shareowners must rely on sales of their common shares after price appreciation, which may never occur, as the only way to realize any return on their investment.
We are subject to risks associated with our international operations, including compliance with applicable U.S. and foreign anti-corruption laws and regulations, such as the U.S. Foreign Corrupt Practices Act, the U.K. Bribery Act of 2010 and other applicable anti-corruption laws, which may increase the cost of doing business in international jurisdictions.
We currently operate internationally and we intend to continue expansion of our international operations. We now operate in 17 European countries and Israel. As a result, our business is exposed to risks inherent in foreign operations. If we fail to adequately address the challenges and risks associated with our international operations and acquisition strategy, we may encounter difficulties in our international operations and implementing our strategy, which could impede our growth or
22
Table of Contents
harm our operating results. These risks, which can vary substantially by jurisdiction, include the difficulties associated with managing an organization with operations in multiple countries, compliance with differing laws and regulations (including the U.S. Foreign Corrupt Practices Act, the U.K. Bribery Act of 2010 and local laws prohibiting payments to government officials and other corrupt practices, tax laws, regulations and rates), enforcing agreements and collecting receivables through foreign legal systems. Although we have implemented policies and procedures designed to ensure compliance with these laws, there can be no assurance that our employees, contractors and agents will not take actions in violation of our policies, particularly as we expand our operations through organic growth and acquisitions. Any such violations could subject us to civil or criminal penalties, including material fines or prohibitions on our ability to offer our products in one or more countries, and could also materially damage our reputation, brand, international expansion efforts, business and operating results. Additional risks include the potential for restrictive actions by foreign governments, changes in economic conditions in each market, foreign customers who may have longer payment cycles than customers in the United States, the impact of economic, political and social instability of those countries in which we operate and acts of nature, such as typhoons, tsunamis, or earthquakes. The overall volatility of the economic environment has increased the risk of disruption and losses resulting from hyper–inflation, currency devaluation and tax or regulatory changes in certain countries in which we have operations.
We are subject to the risk of increased taxes.
We base our tax positions upon our understanding of the tax laws of the various countries in which we have assets or conduct business activities. However, our tax positions are subject to review and possible challenge by taxing authorities. This includes adverse changes to the manner in which Canada and other countries tax multinational companies and interpret or change their tax laws. We cannot determine in advance the extent to which some jurisdictions may assess additional tax or interest and penalties on such taxes. In addition, our effective tax rate may be increased by changes in the valuation of deferred tax assets and liabilities, changes in our cash management strategies, changes in local tax rates or countries adopting more aggressive interpretations of tax laws.
Our income tax expense includes tax benefits resulting from several reorganizations of our legal entity structure and refinancing of intercompany debt during the last three years. However, since the calculation of our tax liabilities involves dealing with uncertainties in the application of complex tax laws and regulations in a multitude of jurisdictions across our global operations, our effective tax rate may ultimately be different than the amount we are currently reporting. In addition, several jurisdictions in which we operate have tax laws with detailed transfer pricing rules which require that all transactions with nonresident related parties be priced using arm’s length pricing principles, and that contemporaneous documentation must exist to support such pricing. There is a risk that the taxing authorities may not deem our transfer pricing documentation acceptable. The Organization for Economic Cooperation and Development (“OECD”) released guidance related to Base Erosion and Profit Shifting (“BEPS”) which may also result in legislative changes that could impact our effective tax rate.
The interpretation and application of the 2017 Tax Cuts and Jobs Act could materially affect our tax obligations and effective tax rate.
The 2017 Tax Cuts and Jobs Act (the “Tax Act”) was enacted on December 22, 2017, and significantly affected U.S. tax law. The U.S. rule-making bodies have the authority to issue regulations and interpretative guidance that may significantly impact how we apply the law and impact our results of operations in the period issued. The application of accounting guidance for such items is currently uncertain as the rules are broad and complex and require information not previously relevant or regularly produced. As a result, we have provided a provisional estimate on the effect of the Tax Act in our Consolidated Financial Statements. As we complete our analysis of the Tax Act, collect and prepare necessary data, and interpret any additional guidance, we may make adjustments to provisional amounts that we have recorded that could materially impact our provision for income taxes in the period in which the adjustments are made.
We also face other risks that could adversely affect our business, results of operations or financial condition, which include:
| • | any requirement to restate financial results in the event of inappropriate application of accounting principles or otherwise; |
| • | any event that could damage our reputation; |
| • | failure to properly manage credit risk from customers; |
| • | failure of our processes to prevent and detect unethical conduct of employees; |
23
Table of Contents
| • | any significant failure of internal controls over financial reporting; |
| • | failure of our prevention and control systems related to employee compliance with internal policies and regulatory requirements; |
| • | failure of corporate governance policies and procedures; and |
| • | credit ratings changes. |
| ITEM 1B. | UNRESOLVED STAFF COMMENTS |
None.
| ITEM 2. | PROPERTIES |
Our business is supported by our extensive manufacturing and distribution network. Immediately following the sale of our Traditional Business, our manufacturing footprint encompasses 54 strategically located beverage manufacturing and production facilities, including: 46 facilities in our Route Based Services reporting segment, which includes 30 facilities in the United States, nine facilities in Europe, and seven facilities in Canada; four facilities in our Coffee, Tea and Extract Solutions reporting segment, all in the United States; and four facilities representing our All Other reporting segment, which includes three facilities in the United Kingdom and one concentrate manufacturing facility based in the United States. We also have 376 branch distribution and warehouse facilities across all of our reporting segments, which include 250 facilities in the United States, 110 facilities in Europe and 16 facilities in Canada, and one customer service call center for the DSS business in the United States.
The total square footage of our beverage manufacturing and production facilities is approximately 2.5 million square feet in the United States; 0.3 million square feet in Canada; and 0.7 million square feet in Europe, inclusive of 0.2 million square feet in the United Kingdom. The total square footage of our branch distribution and warehouse facilities is approximately 2.7 million square feet in the United States; 0.2 million square feet in Canada; and 0.9 million square feet in Europe. This square footage does not include 29 leased office spaces and one owned office space that together comprise 0.4 million square feet. Lease terms for non-owned beverage production facilities and offices expire between 2018 and 2046.
The beverage production facilities and square footage amounts noted above do not include vacant or underutilized properties.
| ITEM 3. | LEGAL PROCEEDINGS |
We are subject to various claims and legal proceedings with respect to matters such as governmental regulations, income taxes, and other actions arising out of the normal course of business. Management believes that the resolution of these matters will not have a material adverse effect on our financial position or results of operations.
| ITEM 4. | MINE SAFETY DISCLOSURES |
Not applicable.
24
Table of Contents
SUPPLEMENTAL ITEM PART I. EXECUTIVE OFFICERS OF THE REGISTRANT
The following is a list of names, ages, offices and backgrounds of all of our executive officers as of February 28, 2018. Our officers do not serve for a set term.
| Office |
Age | |||
| Jerry Fowden | Chief Executive Officer | 61 | ||
| Jay Wells |
Chief Financial Officer | 55 | ||
| Thomas Harrington |
President Services/Chief Executive Officer - DSS Business Unit |
60 | ||
| Ron Hinson |
Chief Executive Officer - S&D Business Unit |
62 | ||
| Marni Morgan Poe |
Vice President, General Counsel and Secretary |
48 | ||
| Jason Ausher |
Chief Accounting Officer |
44 | ||
| Steve Erdman |
Senior Vice President Global Human Resources | 55 |
| • | Jerry Fowden was appointed Chief Executive Officer in 2009. Prior to this appointment, he served as President of our international operating segment, Interim President North America and Interim President of our UK and European business from 2007 to 2009. Prior to joining Cott, Mr. Fowden served as Chief Executive Officer of Trader Media Group and was a member of the Guardian Media Group Plc’s board of directors from 2005 to 2007. Prior to this time, Mr. Fowden served in a variety of roles at multiple companies, including global Chief Operating Officer of AB InBev S.A. Belgium, an alcoholic beverage company, Chief Executive Officer of Bass Brewers Ltd., a subsidiary of AB InBev S.A. Belgium, Managing Director of the Rank Group plc’s Hospitality and Holiday Division and member of the Rank Group plc’s board of directors, Chief Executive Officer of Hero AG’s European beverage operations and various roles within PepsiCo Inc.’s beverage operations and Mars, Incorporated’s pet food operations. Mr. Fowden currently serves on the board of directors of Constellation Brands Inc., a premium alcoholic beverage company and on the board of directors of the American Beverage Association. Mr. Fowden has previously served on the board of directors of Chesapeake Corporation, a global packaging company, and as a member of the advisory board of Tchibo Coffee International Ltd, a premium coffee company. |
| • | Jay Wells was appointed Chief Financial Officer in 2012. Prior to joining Cott, Mr. Wells held various senior finance positions with Molson Coors from 2005 to 2012, including Chief Financial Officer of Molson Coors Canada, a subsidiary of Molson Coors Brewing Company, and Global Vice President, Treasury, Tax, and Strategic Finance of Molson Coors Brewing Company. From 1990 to 2005, Mr. Wells held several positions within Deloitte and Touche LLP, including partner. |
| • | Thomas J. Harrington was appointed Chief Executive Officer of our DS Services business unit upon our acquisition of DS Services in December 2014 and was appointed President Services in July 2016. Prior to the acquisition, Mr. Harrington served in various roles with DS Services from 2004 to 2014, including Chief Executive Officer, President, Chief Operating Officer, West Division President, and Senior Vice President, Central Division. Prior to joining DS Services, Mr. Harrington served in various roles with Coca-Cola Enterprises, Inc. including Vice President and General Manager of Coca-Cola Enterprises New York and Chicago divisions. He also served in various sales and marketing roles with Pepperidge Farm from 1979 to 1985. Mr. Harrington currently serves on the board of directors of the National Automatic Merchandising Association, the International Bottled Water Association and the Water Quality Association. |
| • | Ron Hinson has been Chief Executive Officer of S&D Coffee and Tea since 2000, and he continued in that role after the closing of the S&D Acquisition. Prior to the acquisition, Mr. Hinson served in various roles with S&D over a 39 year period, beginning his career in the sales organization and working his way up to Chief Executive Officer in 2000 and Chairman of the Board of Directors of S&D in 2010. Mr. Hinson currently serves on the board of directors of the National Coffee Association and the Tea Association. |
| • | Marni Morgan Poe was appointed Vice President, General Counsel and Secretary in 2010. Prior to her appointment, Ms. Poe served as Corporate Counsel of the Company from 2008 to 2010. Prior to joining the Company, Ms. Poe was a partner at the law firm of Holland & Knight LLP from 2000 to 2006 and an associate of the law firm from 1995 to 2000. |
| • | Jason Ausher was appointed Chief Accounting Officer in May 2015. Prior to this appointment, from 2011 to 2015, Mr. Ausher served as the Company’s VP Treasurer, Corporate Development. From 2010 to 2011, Mr. Ausher served as the Company’s Corporate Controller and from 2008 to 2010 he held the position of Controller |
25
Table of Contents
| for the Company’s U.S. Business Unit. From 2003 to 2008, Mr. Ausher held numerous positions with Walter Industries, Inc. and Mueller Water Products Inc. (a water infrastructure business and spin-off of Walter Industries, Inc.), including the position of Vice President of Finance. Prior to this, from 1996 to 2002, Mr. Ausher was with PriceWaterhouseCoopers LLP. |
| • | Steve Erdman was appointed Senior Vice President Global Human Resources in June 2017. From 2004 to 2017, Mr. Erdman served in various roles with DS Services, including Director of Human Resources, Vice President – Human Resources, Vice President and Chief People Officer, and Senior Vice President and Chief People Officer. Prior to joining DS Services, Mr. Erdman was the Group Director – Human Resources with Coca-Cola Enterprises, Inc. |
26
Table of Contents
| ITEM 5. | MARKET FOR THE REGISTRANT’S COMMON EQUITY, RELATED SHAREOWNER MATTERS AND ISSUER PURCHASES OF EQUITY SECURITIES |
Our common shares are listed on the TSX under the ticker symbol “BCB,” and on the NYSE under the ticker symbol “COT.”
The tables below show the high and low reported per share sales prices of our common shares on the TSX (in Canadian dollars) and the NYSE (in U.S. dollars) for the indicated periods for 2017 and 2016.
Toronto Stock Exchange (C$)
| TSX | ||||||||||||||||
| 2017 | 2016 | |||||||||||||||
| High | Low | High | Low | |||||||||||||
| First Quarter |
$ | 16.75 | $ | 13.52 | $ | 18.56 | $ | 12.65 | ||||||||
| Second Quarter |
$ | 19.84 | $ | 16.01 | $ | 21.16 | $ | 16.30 | ||||||||
| Third Quarter |
$ | 20.21 | $ | 17.67 | $ | 22.66 | $ | 17.80 | ||||||||
| Fourth Quarter |
$ | 22.75 | $ | 18.17 | $ | 19.18 | $ | 13.42 | ||||||||
New York Stock Exchange (U.S.$)
| NYSE | ||||||||||||||||
| 2017 | 2016 | |||||||||||||||
| High | Low | High | Low | |||||||||||||
| First Quarter |
$ | 12.60 | $ | 10.34 | $ | 14.26 | $ | 9.07 | ||||||||
| Second Quarter |
$ | 14.77 | $ | 11.94 | $ | 16.70 | $ | 12.87 | ||||||||
| Third Quarter |
$ | 16.18 | $ | 13.69 | $ | 17.38 | $ | 13.94 | ||||||||
| Fourth Quarter |
$ | 17.77 | $ | 14.25 | $ | 14.37 | $ | 10.10 | ||||||||
As of February 21, 2018, we had 926 shareowners of record. This number was determined from records maintained by our transfer agent and does not include beneficial owners of securities whose securities are held in the names of various dealers or clearing agencies. The closing sale price of our common shares on February 21, 2018 was C$18.99 on the TSX and $14.98 on the NYSE.
Our board of directors has declared a quarterly cash dividend of $0.06 per common share in each quarter during 2016 and 2017 for an aggregate yearly dividend payment of approximately $31.7 million and $33.7 million, respectively. We intend to pay a regular quarterly dividend on our common shares subject to, among other things, the best interests of our shareowners, our results of operations, cash balances and future cash requirements, financial condition, statutory regulations and covenants set forth in the ABL facility and indentures governing our outstanding notes as well as other factors that our board of directors may deem relevant from time to time.
Dividends to shareowners who are non-residents of Canada will generally be subject to Canadian withholding tax. Under current Canadian tax law, dividends paid by a Canadian corporation to a non-resident shareowner are generally subject to Canadian withholding tax at a 25% rate. Under the current tax treaty between Canada and the United States, U.S. residents who are entitled to treaty benefits are generally eligible for a reduction in this withholding tax rate to 15% (and to 5% for a shareowner that is a corporation and is the beneficial owner of at least 10% of our voting stock). Accordingly, under current tax law, our U.S. resident shareowners who are entitled to treaty benefits will generally be subject to a Canadian withholding tax at a 15% rate on dividends paid by us, provided that they have complied with applicable procedural requirements to claim the benefit of the reduced rate under the tax treaty. The fifth protocol to the tax treaty between Canada and the United States places additional restrictions on the ability of U.S. residents to claim these reduced rate benefits. U.S. residents generally will be entitled on their U.S. federal income tax returns to claim a foreign tax credit, or a deduction, for Canadian withholding tax that applies to them, subject to certain applicable limitations. U.S. investors should consult their tax advisors with respect to the tax consequences and requirements applicable to them, based on their individual circumstances.
27
Table of Contents
There are certain restrictions on the payment of dividends under our ABL facility and the indentures governing our outstanding notes. The ABL facility and the indentures governing our outstanding notes are discussed in “Item 7. Management’s Discussion and Analysis of Financial Condition and Results of Operations” in this Annual Report on Form 10-K.
For information on securities authorized for issuance under our equity compensation plans, see “Item 12. Security Ownership of Certain Beneficial Owners and Management and Related Shareowner Matters” in this Annual Report on Form 10-K.
Calculation of aggregate market value of non-affiliate shares
For purposes of calculating the aggregate market value of common shares held by non-affiliates as shown on the cover page of this Annual Report on Form 10-K, it was assumed that all of the outstanding shares were held by non-affiliates except for outstanding shares held or controlled by our directors and executive officers. For further information concerning shareholdings of officers, directors and principal shareowners, see “Item 12. Security Ownership of Certain Beneficial Owners and Management and Related Shareowner Matters” in this Annual Report on Form 10-K.
Shareowner return performance graph
The following graph shows changes over our past five fiscal years in the value of C$100, assuming reinvestment of dividends, invested in: (i) our common shares; (ii) the Toronto Stock Exchange’s S&P/TSX Composite Index; and (iii) a peer group of publicly-traded companies in the bottling and route-based service industries comprised of Coca-Cola Enterprises Inc., Coca-Cola Bottling Co. Consolidated, Coca Cola FEMSA, S.A.B de C.V., Coca Cola Amatil Ltd., National Beverage Corp., A.G. Barr plc, Britvic plc, G&K Services, Inc., UniFirst Corp., ABM Industries Inc., Chemed Corp., ServiceMaster Global Holdings, Inc., Cintas Corp., and Aramark. The closing price of Cott’s common shares as of December 29, 2017, the last trading day of 2017, was C$20.98 on the TSX and $16.66 on the NYSE. The following table is in Canadian dollars.
COMPARISON OF CUMULATIVE TOTAL RETURN
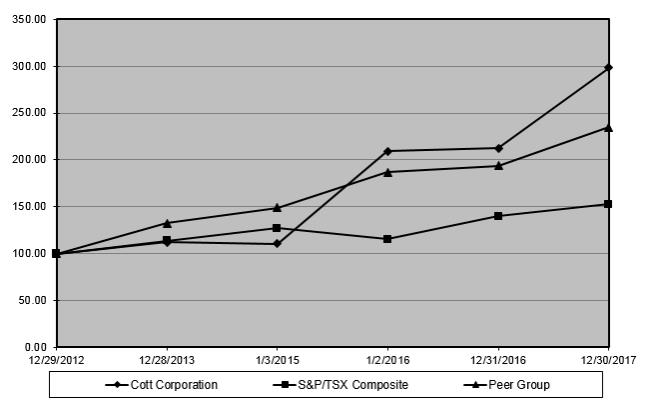
28
Table of Contents
ASSUMES $100 (CANADIAN) INVESTED ON DECEMBER 29, 2012
ASSUMES DIVIDENDS REINVESTED
FISCAL YEAR ENDING DECEMBER 30, 2017
| Company / Market / Peer Group |
12/29/2012 | 12/28/2013 | 1/3/2015 | 1/2/2016 | 12/31/2016 | 12/30/2017 | ||||||||||||||||||
| Cott Corporation |
$ | 100.00 | $ | 112.45 | $ | 110.38 | $ | 209.58 | $ | 212.73 | $ | 298.60 | ||||||||||||
| S&P / TSX Composite |
$ | 100.00 | $ | 113.78 | $ | 127.25 | $ | 115.59 | $ | 139.96 | $ | 152.67 | ||||||||||||
| Peer Group |
$ | 100.00 | $ | 132.36 | $ | 149.18 | $ | 186.70 | $ | 193.94 | $ | 235.03 | ||||||||||||
Issuer Purchases of Equity Securities
During the fourth quarter of 2017, we did not repurchase any of our common shares.
Tax Withholdings
The following table contains information about shares that we withheld from delivering to employees during 2017 to satisfy their tax obligations related to share-based awards.
| Total Number of Common Shares Purchased |
Average Price Paid per Common Shares |
Total Number of Common Shares Purchased as Part of Publicly Announced Plans or Programs |
Maximum Approximate Dollar Value of Common Shares that May Yet Be Purchased Under the Plans or Programs |
|||||||||||||
| February 2017 |
150,206 | $ | 11.32 | N/A | N/A | |||||||||||
| May 2017 |
156 | $ | 12.74 | N/A | N/A | |||||||||||
| June 2017 |
609 | $ | 13.19 | N/A | N/A | |||||||||||
| August 2017 |
13,770 | $ | 15.33 | N/A | N/A | |||||||||||
| October 2017 |
506 | $ | 15.01 | N/A | N/A | |||||||||||
| December 2017 |
112,091 | $ | 16.86 | N/A | N/A | |||||||||||
|
|
|
|||||||||||||||
| Total |
277,338 | |||||||||||||||
|
|
|
|||||||||||||||
29
Table of Contents
| ITEM 6. | SELECTED FINANCIAL DATA |
The following selected financial data reflects our results of operations. This information should be read in conjunction with, and is qualified by reference to “Item 7. Management’s Discussion and Analysis of Financial Condition and Results of Operations” and the Consolidated Financial Statements and Notes thereto included elsewhere in this Annual Report on Form 10-K. The financial information presented may not be indicative of future performance.
The Company has accounted for the disposition of our Traditional Business as discontinued operations beginning in 2017. All data for prior periods have been recast.
| December 30, 2017 |
December 31, 20161 |
January 2, 2016 |
January 3, 20152 |
December 28, 2013 |
||||||||||||||||
| (in millions of U.S. dollars, except per share amounts) |
(52 weeks) | (52 weeks) | (52 weeks) | (53 weeks) | (52 weeks) | |||||||||||||||
| Revenue, net |
$ | 2,269.7 | $ | 1,623.2 | $ | 1,187.3 | $ | 160.8 | $ | 68.0 | ||||||||||
| Net (loss) income from continuing operations |
(3.6 | ) | (60.3 | ) | 15.7 | 7.1 | (5.6 | ) | ||||||||||||
| Net income (loss) from discontinued operations, net of income taxes |
10.7 | (11.2 | ) | 4.9 | 9.3 | 27.6 | ||||||||||||||
| Net income (loss) |
7.1 | (71.5 | ) | 20.6 | 16.4 | 22.0 | ||||||||||||||
| Net (loss) income attributable to Cott Corporation |
(1.4 | ) | (77.8 | ) | (3.4 | ) | 10.0 | 17.0 | ||||||||||||
| Net (loss) income per common share attributable to Cott Corporation |
||||||||||||||||||||
| Basic: |
||||||||||||||||||||
| Continuing operations |
$ | (0.03 | ) | $ | (0.47 | ) | $ | (0.02 | ) | $ | 0.07 | $ | (0.06 | ) | ||||||
| Discontinued operations |
0.02 | (0.14 | ) | (0.01 | ) | 0.04 | 0.24 | |||||||||||||
| Net income (loss) |
(0.01 | ) | (0.61 | ) | (0.03 | ) | 0.11 | 0.18 | ||||||||||||
| Diluted: |
||||||||||||||||||||
| Continuing operations |
$ | (0.03 | ) | $ | (0.47 | ) | $ | (0.02 | ) | $ | 0.07 | $ | (0.06 | ) | ||||||
| Discontinued operations |
0.02 | (0.14 | ) | (0.01 | ) | 0.03 | 0.24 | |||||||||||||
| Net income (loss) |
(0.01 | ) | (0.61 | ) | (0.03 | ) | 0.10 | 0.18 | ||||||||||||
| Financial Condition |
||||||||||||||||||||
| Total assets |
$ | 4,093.1 | $ | 3,939.7 | $ | 2,887.3 | $ | 3,073.2 | $ | 1,410.7 | ||||||||||
| Short-term borrowings required to be repaid or extinguished from divestiture 3 |
220.3 | 207.0 | 122.0 | 229.0 | 50.8 | |||||||||||||||
| Debt required to be repaid or extinguished from divestiture 4 |
519.0 | 1,135.4 | 1,133.6 | 1,132.5 | 392.7 | |||||||||||||||
| Long-term debt, net of current maturities |
1,542.6 | 851.4 | 390.1 | 405.6 | — | |||||||||||||||
| Convertible preferred shares |
— | — | — | 116.1 | — | |||||||||||||||
| Non-convertible preferred shares |
— | — | — | 32.7 | — | |||||||||||||||
| Dividends declared per common share |
0.24 | 0.24 | 0.24 | 0.24 | 0.24 | |||||||||||||||
| 1. | In 2016, we completed the acquisitions of S&D, Eden, and Aquaterra for a combined $973.9 million, financed by a combination of cash on hand, incremental borrowings under our ABL facility of $270.0 million, proceeds from the issuance of €450.0 million (U.S. $539.1 million at the exchange rate in effect on December 30, 2017) of our 2024 Notes, and net proceeds from the issuance of common shares in June 2016 having an aggregate value of $219.8 million. |
| 2. | In 2014, we completed the acquisition of DSS for approximately $1.246 billion, financed by a combination of incremental borrowings under our ABL facility of $180.0 million, proceeds from the issuance of $625.0 million of 6.75% senior notes due 2020 (the “2020 Notes”), the assumption of DSS’s $350.0 million DSS Notes, and the issuance to the owners of DSS of Preferred Shares having an aggregate value of approximately $148.8 million. |
30
Table of Contents
| 3. | The obligations under the ABL facility were required to be repaid in full at the closing of the sale of the Traditional Business. Accordingly, the ABL facility is presented as “Short-term borrowings required to be repaid or extinguished as part of divestiture.” |
| 4. | All senior notes issued by our wholly-owned subsidiary Cott Beverages Inc. were classified as “Debt required to be repaid or extinguished as part of divestiture” in prior periods. |
31
Table of Contents
| ITEM 7. | MANAGEMENT’S DISCUSSION AND ANALYSIS OF FINANCIAL CONDITION AND RESULTS OF OPERATIONS |
Overview
Cott is a route based service company with a leading volume-based national presence in the North America and European home and office delivery (“HOD”) industry for bottled water and a leader in custom coffee roasting, blending of iced tea and extract solutions for the U.S. foodservice industry. Our platform reaches over 2.4 million customers or delivery points across North America and Europe supported by strategically located sales and distribution facilities and fleets, as well as wholesalers and distributors. This enables us to efficiently service residences, businesses, restaurant chains, hotels and motels, small and large retailers, and healthcare facilities.
The beverage market is subject to some seasonal variations. Our water delivery and beverage sales are generally higher during the warmer months, while sales of our coffee products are generally higher during cooler months, and may also be influenced by the timing of holidays and weather fluctuations. Our purchases of raw materials and related accounts payable fluctuate based upon the demand for our products. The seasonality of our sales volume causes our working capital needs to fluctuate throughout the year.
Ingredient and packaging costs represent a significant portion of our cost of sales. These costs are subject to global and regional commodity price trends. Our most significant commodities are green coffee, tea, polyethylene terephthalate (“PET”) resin, high-density polyethylene (“HDPE”) and polycarbonate bottles, caps and preforms, labels and cartons and trays. We attempt to manage our exposure to fluctuations in ingredient and packaging costs by entering into fixed price commitments for a portion of our ingredient and packaging requirements and implementing price increases as needed.
We conduct operations in countries involving transactions denominated in a variety of currencies. We are subject to currency exchange risks to the extent that our costs are denominated in currencies other than those in which we earn revenues. As our financial statements are denominated in U.S. dollars, fluctuations in currency exchange rates between the U.S. dollar and other currencies have had, and will continue to have an impact on our results of operations.
In 2017, our capital expenditures were devoted primarily to supporting growth in our business, maintaining existing facilities and making equipment upgrades.
At the beginning of 2017, our business operated through four reporting segments; Water and Coffee Solutions (which included our DS Services of America, Inc. (“DSS”), Aquaterra Corporation (“Aquaterra”), Eden Springs Europe B.V. (“Eden”) and S. & D. Coffee, Inc. (“S&D”) businesses), Cott North America, Cott United Kingdom (“Cott U.K.”) and All Other (which included our Mexico and Royal Crown International (“RCI”) operating segments).
During the third quarter of 2017, we reviewed our reporting segments as a result of the Transaction (as defined below). Following such review, we reorganized our reporting segments into three reporting segments; Route Based Services (which includes our DSS, Aquaterra and Eden businesses), Coffee, Tea and Extract Solutions (which includes our S&D business) and All Other (which includes our Aimia Foods (“Aimia”), Decantae Mineral Water Ltd. (“Decantae”), and our RCI concentrate businesses, our Columbus, Georgia manufacturing facility and other miscellaneous expenses). Segment reporting results have been recast to reflect these changes for all periods presented. Our corporate oversight function is not treated as a segment; it includes certain general and administrative costs that are not allocated to any of the reporting segments.
For the years ended December 30, 2017, December 31, 2016 and January 2, 2016, we had 52 weeks of activity. For the year ended January 2, 2016, we had four additional shipping days in our DSS business, which we estimate contributed $12.5 million of additional revenue and $0.1 million of additional operating income for the year ended January 2, 2016.
Divestiture, Acquisition and Financing Transactions
Divestiture of Traditional Business
On January 30, 2018, we sold our carbonated soft drinks (“CSDs”) and juice businesses via the sale of our North America, United Kingdom (“U.K.”) and Mexico business units (including the Canadian business) and our Royal Crown International (“RCI”) finished goods export business (collectively, “Traditional Business”) to Refresco Group N.V., a Dutch public company (“Refresco”), pursuant to a Share Purchase Agreement (the “Purchase Agreement”) dated as of July 24, 2017 (the “Transaction”). The Transaction was structured as a sale of the assets of our Canadian business and a sale of the stock of the operating subsidiaries engaged in the Traditional Business in the other jurisdictions. The aggregate deal consideration was $1.25 billion, paid in cash at closing, subject to adjustment for indebtedness, working capital, and other customary post-closing adjustments. Accordingly, as a result of the sale of the Traditional Business representing a strategic shift in our operations, those businesses are presented herein as discontinued operations. See Note 2 to the Consolidated Financial Statements for additional information regarding discontinued operations. The Transaction did not include our Route Based Services and Coffee, Tea and Extract Solutions reporting segments, our RCI concentrate business, our Columbus, Georgia manufacturing facility or our Aimia and Decantae businesses.
32
Table of Contents
For all periods presented, the operating results associated with the Traditional Business have been reclassified into net income (loss) from discontinued operations, net of income taxes in the Consolidated Statements of Operations, and the assets and liabilities associated with this business have been reflected as assets and liabilities of discontinued operations in the Consolidated Balance Sheets. Cash flows from the Company’s discontinued operations are presented in the Consolidated Statements of Cash Flows for all periods presented.
Acquisitions
In August 2016, we acquired S&D, a premium coffee roaster and provider of customized coffee, tea, and extract solutions to the foodservice, convenience, gas, hospitality and office segments in the United States (the “S&D Acquisition”). The aggregate purchase price was $353.6 million. The S&D Acquisition was funded through a combination of incremental borrowings under our asset-based lending facility (the “ABL facility”) and proceeds from our June 2016 Offering (as defined below).
In August 2016, we acquired Eden, a leading provider of water and coffee solutions in Europe (the “Eden Acquisition”). The aggregate purchase price was €515.9 million (U.S. $576.3 million at the then-current exchange rate). The Eden Acquisition was funded through a combination of proceeds from the 2024 Notes (as defined below) and cash on hand.
In January 2016, we acquired Aquaterra, a Canadian direct-to-consumer HOD bottled water and office coffee services (“OCS”) business (the “Aquaterra Acquisition”). The aggregate purchase price was C$61.2 million (U.S. $44.0 million at the then-current exchange rate). The purchase price was paid at closing using cash on hand.
Financing Activity
On January 30, 2018, in connection with the closing of the Transaction, we used a portion of the proceeds from the Transaction to retire $525.0 million aggregate principal amount of 5.375% senior notes due 2022 (the “2022 Notes”) and retire the remaining $250.0 million aggregate principal amount of 10.000% senior secured notes due 2021 (the “DSS Notes”). The redemption of our 2022 Notes included $21.2 million in premium payments and accrued interest of $2.2 million. The redemption of our DSS Notes included $12.5 million in premium payments and accrued interest of $10.3 million.
We also used a portion of the proceeds from the Transaction to repay in full our $262.5 million outstanding balance on our ABL facility. Additionally, we amended and restated our ABL facility in connection with the closing of the Transaction, as further discussed below.
On May 5, 2017, we used a portion of the proceeds from the issuance of the 2025 Notes (as defined below) to redeem $100.0 million in aggregate principal amount of the DSS Notes. The partial redemption of the DSS Notes included $7.7 million in premium payments, accrued interest of $1.8 million and the write-off of $9.2 million of unamortized premium.
On April 5, 2017 and March 22, 2017, we used a portion of the proceeds from the issuance of the 2025 Notes (as defined below) to purchase $422.7 million and $202.3 million in aggregate principal amount of our $625.0 million of 6.75% senior notes due January 1, 2020 (the “2020 Notes”). The redemption of our 2020 Notes included $14.3 million and $7.1 million in premium payments, accrued interest of $7.4 million and $3.1 million, the write-off of $5.8 million and $2.9 million in deferred financing fees, and other costs of $0.1 million.
On March 22, 2017, we issued $750.0 million of 5.500% senior notes due April 1, 2025 (the “2025 Notes”) to qualified purchasers in a private placement offering under Rule 144A under the Securities Act of 1933, as amended (the “Securities Act”), and outside the United States to non-U.S. purchasers pursuant to Regulation S under the Securities Act and other applicable laws. The 2025 Notes were issued by our wholly-owned subsidiary Cott Holdings Inc., and most of our U.S., Canadian, U.K., Luxembourg and Dutch subsidiaries guarantee the 2025 Notes. The 2025 Notes will mature on April 1, 2025 and interest is payable semi-annually on April 1st and October 1st of each year commencing on October 1, 2017. We incurred $11.7 million of financing fees in connection with the issuance of the 2025 Notes.
In June 2016, we issued €450.0 million (U.S. $539.1 million at the exchange rate in effect on December 30, 2017) of 5.500% senior notes due July 1, 2024 (the “2024 Notes”) to qualified purchasers in a private placement offering under the Securities Act, and outside the United States to non-U.S. purchasers pursuant to Regulation S under the Securities Act and other applicable laws. We incurred $11.3 million of financing fees in connection with the issuance of the 2024 Notes. The proceeds of the 2024 Notes were used to fund a portion of the purchase price of the Eden Acquisition and to pay related fees and expenses.
In June 2016, we completed a public offering, on a bought deal basis, of 15,088,000 common shares at a price of $15.25 per share for total gross proceeds to us of $230.1 million (the “June 2016 Offering”). We incurred $9.2 million of underwriter commissions and $1.1 million in professional fees in connection with the June 2016 Offering. The net proceeds of the June 2016 Offering were used to repay borrowings under our ABL facility, to finance the S&D Acquisition and for general corporate purposes.
33
Table of Contents
In March 2016, we completed a public offering, on a bought deal basis, of 12,765,000 common shares at a price of $11.80 per share for total gross proceeds to us of $150.6 million (the “March 2016 Offering”). We incurred $6.0 million of underwriter commissions and $0.8 million in professional fees in connection with the March 2016 Offering. The net proceeds of the March 2016 Offering were used to repay borrowings under our ABL facility and for general corporate purposes.
In June 2015, we entered into a sale-leaseback transaction (the “Sale-Leaseback Transaction”) involving three of our continuing operations and two of our discontinued operations manufacturing, production and distribution facilities, all located in North America, pursuant to which we received cash proceeds on the continuing operations facilities of $25.3 million, after related transaction expenses, and recorded a gain of $18.1 million. The continuing operations facilities are being leased from the buyer-lessor over an initial lease term of 20 years and the lease is classified as an operating lease. We determined we have retained the lease rights to the facilities but not the benefits and risks incident to ownership; thus $17.1 million of the $18.1 million gain was deferred, with the remaining $1.0 million recognized as a gain on sale in loss on disposal of property, plant & equipment, net in our Consolidated Statement of Operations for the year ended January 2, 2016. This deferred gain is being amortized as a reduction to rent expense over the 20-year initial lease term.
In May 2015, we completed a public offering, on a bought deal basis, of 16,215,000 common shares at a price of $9.25 per share for total gross proceeds to us of $150.0 million (the “2015 Offering”). We incurred $6.0 million of underwriter commissions and $1.5 million in professional fees in connection with the 2015 Offering. The net proceeds of the 2015 Offering were used to redeem all of our Series A Convertible First Preferred Shares (the “Convertible Preferred Shares”) and Series B Non-Convertible First Preferred Shares (the “Non-Convertible Preferred Shares,” and together with the Convertible Preferred Shares, the “Preferred Shares”).
Summary Financial Results
Net loss from continuing operations in 2017 was $3.6 million or $0.03 per diluted common share, compared with net loss from continuing operations of $60.3 million or $0.47 per diluted common share in 2016.
The following items of significance affected our 2017 financial results:
| • | Net revenue increased $646.5 million, or 39.8%, in 2017 compared to the prior year due primarily to the additions of our S&D and Eden businesses, growth in volume and consumption, as well as increased pricing in our Route Based Services reporting segment, strong coffee volume growth in our Coffee, Tea and Extract Solutions reporting segment, and the impact of favorable foreign exchange rates. Excluding the impact of foreign exchange, revenue increased $633.8 million, or 39.0%, from the prior year; |
| • | Gross profit increased to $1,127.7 million from $850.1 million in the prior year due primarily to the additions of our S&D and Eden businesses and growth in our DSS business. Gross profit as a percentage of revenue decreased to 49.7% in 2017 compared to 52.4% in the prior year. The decrease in gross profit as a percentage of net revenue is due to our S&D business, which is a lower gross profit business; |
| • | Selling, general and administrative (“SG&A”) expenses increased to $1,042.7 million in 2017 compared to $806.2 million in the prior year due primarily to the additions of our S&D and Eden businesses. As a percentage of revenue, SG&A expenses decreased to 45.9% from 49.7% in the prior year; |
| • | Loss on disposal of property, plant and equipment, net was primarily related to the disposal of $10.2 million of equipment that was either replaced or no longer being used in our reporting segments; |
| • | Acquisition and integration expenses decreased to $25.9 million in 2017 compared to $27.8 million in the prior year due primarily to the reduction in costs with the integration of our S&D and Eden businesses; |
| • | Other income, net was $3.0 million in 2017 compared to other expense, net of $5.6 million in the prior year due primarily to the increase of net gains on foreign currency transactions and the gain recognized upon the partial redemption of our DSS Notes in 2017 and unrealized losses on our commodity hedges in the prior year; |
| • | Interest expense, net increased to $85.5 million in 2017 compared to $43.0 million in the prior year due primarily to the issuance of our 2025 Notes in the first quarter of 2017 and having a full year of interest expense in 2017 associated with our 2024 Notes; |
| • | Income tax benefit was $30.0 million in 2017 compared to income tax expense of $21.2 million in the prior year due primarily to the change in the U.S. federal enacted tax rate in 2017 and the Canadian valuation allowance recorded in the third quarter of 2016 and the U.S. federal valuation allowance recorded in the fourth quarter of 2016; and |
34
Table of Contents
| • | Adjusted EBITDA increased to $295.6 million in 2017 compared to $211.6 million in the prior year due to the items listed above. |
The following items of significance affected our 2016 financial results:
| • | Net revenue increased $435.9 million, or 36.7%, in 2016 compared to the prior year due primarily to the additions of our S&D, Eden, and Aquaterra businesses, partially offset by the impact of unfavorable foreign exchange rates, and four less shipping days compared to the prior year in our DSS business. Excluding the impact of foreign exchange and four additional shipping days in 2015, revenue increased $462.0 million, or 39.3%, from the prior year; |
| • | Gross profit increased to $850.1 million from $650.5 million in the prior year due primarily to the additions of our S&D, Eden and Aquaterra businesses, partially offset by the impact of unfavorable foreign exchange rates and increased operational costs at our DSS business. Gross profit as a percentage of revenue decreased to 52.4% in 2016 compared to 54.8% in the prior year. The decrease in gross profit as a percentage of net revenue is due to our S&D business, which is a lower gross profit business; |
| • | SG&A expenses increased to $806.2 million in 2016 compared to $608.4 million in the prior year due primarily to the additions of our S&D, Eden and Aquaterra businesses. As a percentage of revenue, SG&A expenses decreased to 49.7% from 51.2% in the prior year; |
| • | Loss on disposal of property, plant and equipment, net was primarily related to the disposal of $6.6 million of equipment that was either replaced or no longer being used in our reporting segments; |
| • | Acquisition and integration expenses increased to $27.8 million in 2016 compared to $20.0 million in the prior year due primarily to the transaction costs in connection with the acquisitions of our S&D, Eden and Aquaterra businesses; |
| • | Other expense, net was $5.6 million in 2016 compared to other income, net of $12.8 million in the prior year due primarily to the reduction of net gains on foreign currency transactions and unrealized losses on our commodity hedges, partially offset by realized gains on our commodity hedges; |
| • | Interest expense, net was $43.0 million in 2016 compared to $30.1 million in the prior year due primarily to interest on our 2024 Notes issued in the second quarter of 2016; |
| • | Income tax expense was $21.2 million in 2016 compared to income tax benefit of $15.1 million in the prior year due primarily to the Canadian valuation allowance recorded in the third quarter of 2016 and the U.S. federal valuation allowance recorded in the fourth quarter of 2016; and |
| • | Adjusted EBITDA increased to $211.6 million in 2016 compared to $183.0 million in the prior year due to the items listed above. |
Critical Accounting Policies
Our significant accounting policies and recently issued accounting pronouncements are described in Note 1 to the Consolidated Financial Statements included in this Annual Report on Form 10-K. We believe the following represent our critical accounting policies:
Estimates
The preparation of the Consolidated Financial Statements in conformity with GAAP requires management to make estimates and assumptions that affect the amounts of assets and liabilities and disclosure of contingent assets and liabilities at the date of the financial statements and the amount of revenue and expenses during the reporting period. Actual results could differ from those estimates. The Consolidated Financial Statements include estimates and assumptions that, in the opinion of management, were significant to the underlying amounts representing the future valuation of intangible assets, long-lived assets and goodwill, realization of deferred income tax assets, the resolution of tax contingencies, and projected benefit plan obligations.
35
Table of Contents
Impairment testing of goodwill
Cott operates through five operating segments: Route Based Services, Coffee, Tea and Extract Solutions, Aimia, RCI and Decantae. Route Based Services, Coffee, Tea and Extract Solutions are also reportable segments and Aimia, RCI and Decantae are combined and disclosed in the All Other category. We test goodwill for impairment at least annually on the first day of the fourth quarter, based on our reporting unit carrying values, calculated as total assets less interest-bearing liabilities, as of the end of the third quarter, or more frequently if we determine a triggering event has occurred during the year. Any impairment loss is recognized in our results of operations. We evaluate goodwill for impairment on a reporting unit basis, which is an operating segment or a level below an operating segment, referred to as a component. A component of an operating segment is a reporting unit if the component constitutes a business for which discrete financial information is available and management regularly reviews the operating results of that component. However, two or more components of an operating segment are aggregated and deemed a single reporting unit if the components have similar economic characteristics. Our Route Based Services operating segment was determined to have three components: DSS, Aquaterra and Eden. We have determined that DSS and Aquaterra have similar economic characteristics and have aggregated them as a single reporting unit for the purpose of testing goodwill for impairment (“DSSAqua”). For the purpose of testing goodwill for impairment in 2017, we have determined our reporting units are DSSAqua, Eden, S&D, Aimia, RCI and Decantae. DSSAqua and Eden are components of the Route Based Services operating segment. S&D is a component of the Coffee, Tea and Extract Solutions operating segment.
We had goodwill of $1,104.7 million on the Consolidated Balance Sheet at December 30, 2017, which represents amounts for the DSSAqua, Eden, S&D, Aimia, RCI and Decantae reporting units.
In the fourth quarter of 2017, the Company early adopted Accounting Standard Update (“ASU”) 2017-04, “Intangibles—Goodwill and Other (Topic 350): Simplifying the Test for Goodwill Impairment,” as part of the annual goodwill impairment testing. We have the option of performing a qualitative assessment to determine whether any further quantitative testing for a potential impairment is necessary. Our qualitative assessment will use judgments including, but not limited to, changes in the general economic environment, industry considerations, current economic performance compared to historical economic performance, entity-specific events and events affecting our reporting units, where applicable. If we elect to bypass the qualitative assessment or if we determine, based upon our assessment of those qualitative factors that it is more likely than not that the fair value of the reporting unit is less than its net carrying value, a quantitative assessment is required. Quantitative testing requires the fair value of the reporting unit to be compared with its carrying value. If the reporting unit’s carrying value exceeds its fair value, an impairment charge is recognized for the difference.
For purposes of the 2017 annual test, we elected to perform a qualitative assessment for our RCI and Decantae reporting units to assess whether it was more likely than not the fair value of these reporting units exceeded their respective carrying values. In performing these assessments, management relied on a number of factors including, but not limited to, macroeconomic conditions, industry and market considerations, cost factors that would have a negative effect on earnings and cash flows, overall financial performance compared with forecasted projections in prior periods, and other relevant reporting unit events, the impact of which are all significant judgments and estimates. Based on these factors, management concluded that it was more likely than not that the fair values of the RCI and Decantae reporting units were greater than their respective carrying amount, including goodwill, indicating no impairment. Goodwill allocated to the RCI and Decantae reporting units as of December 30, 2017 is $4.5 million and $1.7 million, respectively.
For the DSSAqua, Eden, S&D and Aimia reporting units, we elected to bypass the qualitative assessment and performed a quantitative analysis due to a decline in 2017 actual versus projected operating results for DSSAqua and Aimia, and to establish a baseline reference for Eden and S&D as 2017 was the first full year of operations for these businesses. We determined the fair value of each reporting unit being evaluated using a mix of the income approach (which is based on the discounted cash flows of the reporting unit) and the guideline public company approach. We weighted the income approach and the guideline public company approach at 50% each to determine the fair value of each reporting unit. We believe using a combination of these approaches provides a more accurate valuation because it incorporates the expected cash generation of the Company in addition to how a third-party market participant would value the reporting unit. As the business is assumed to continue in perpetuity, the discounted future cash flows includes a terminal value. Critical assumptions used in our 2017 valuation of the reporting units include the weighted-average terminal growth rates of 2.5%, 1.5%, 2.5% and 2.0% and discount rates of 8.0%, 9.0%, 8.5% and 11.0% for our DSSAqua, Eden, S&D and Aimia reporting units, respectively. The terminal growth rate assumption incorporated into the discounted cash flow calculation reflects our long-term view of the market and industry, projected changes in the sale of our products, pricing of such products and operating profit margins. The discount rate was determined using various factors and sensitive assumptions, including bond yields, size premiums and tax rates. This rate was based on the weighted average cost of capital a market participant would use if evaluating the reporting unit as an investment. These assumptions are considered significant unobservable inputs and represent our best estimate of assumptions that market participants would use to determine the fair value of the respective reporting units. The key inputs into the discounted cash flow analysis were consistent with market data, where available, indicating that the assumptions used were in a reasonable range of observable market data.
36
Table of Contents
Based on the quantitative assessment including consideration of the sensitivity of the assumptions made and methods used to determine fair value, industry trends and other relevant factors, we noted that the estimated fair values of DSSAqua, Eden, S&D and Aimia reporting units exceeded their carrying values by approximately 42.5%, 17.4%, 25.9% and 19.2%, respectively. Therefore no goodwill impairment charges were recorded in the fourth quarter ended December 30, 2017. Goodwill allocated to the DSSAqua, Eden, S&D and Aimia reporting units as of December 30, 2017 are $612.0 million, $324.7 million, $117.8 million and $44.0 million, respectively.
In addition, we note that goodwill held by reporting units in our Traditional Business totaled $136.8 million at December 30, 2017 and is included in long-term assets of discontinued operations on the Consolidated Balance Sheet. We elected to perform a qualitative assessment for our Traditional Business reporting units to assess whether it was more likely than not that the fair value of these reporting units exceeded their respective carrying values. In performing these assessments, management relied on a number of factors including, but not limited to, macroeconomic conditions, industry and market considerations, cost factors that would have a negative effect on earnings and cash flows, overall financial performance compared with forecasted projections in prior periods, the aggregate deal consideration of $1.25 billion for the sale of the Traditional Business and other relevant reporting unit events, all of which require the use of significant judgments and estimates. Based on these factors, management concluded that it was more likely than not that the fair values of the Traditional Business reporting units were greater than their respective carrying amounts, including goodwill, indicating no impairment.
Each year during the fourth quarter, we re-evaluate the assumptions used in our assessments, such as revenue growth rates, operating profit margins and discount rates, to reflect any significant changes in the business environment that could materially affect the fair value of our reporting units. Based on the evaluations performed in 2017, we determined that the fair value of each of our reporting units exceeded their carrying amounts.
Impairment testing of intangible assets with an indefinite life
Our intangible assets with indefinite lives relate to the 2001 acquisition of intellectual property from Royal Crown Company, Inc., and include the right to manufacture our concentrates, with all related inventions, processes, technologies, technical and manufacturing information, know-how and the use of the Royal Crown brand outside of North America and Mexico (the “Rights”); trademarks acquired in the acquisition of DSS (the “DSS Trademarks”); trademarks acquired in the acquisition of Eden (the “Eden Trademarks”), and trademarks acquired in the acquisition of Aquaterra (the “Aquaterra Trademarks”). These assets have an aggregate net book value of $288.6 million as of December 30, 2017. There are no legal, regulatory, contractual, competitive, economic, or other factors that limit the useful life of these intangible assets.
The life of the Rights, DSS Trademarks, Eden Trademarks, and Aquaterra Trademarks are considered to be indefinite and therefore these intangible assets are not amortized. Rather, they are tested for impairment at least annually or more frequently if we determine a triggering event has occurred during the year. We compare the carrying amount of the intangible asset to its fair value and when the carrying amount is greater than the fair value, we recognize in income an impairment loss. During the fourth quarter of 2017, management concluded that it was more likely than not that the fair value of the Rights, DSS Trademarks, Eden Trademarks, and Aquaterra Trademarks were greater than their respective carrying value, indicating no impairment.
We assessed qualitative factors to determine whether the existence of events or circumstances indicated that it was more likely than not that the fair value of the Rights and the Aquaterra Trademarks were less than their respective carrying value. The qualitative factors we assessed included macroeconomic conditions, industry and market considerations, cost factors that would have a negative effect on earnings and cash flows, overall financial performance compared with forecasted projections in prior periods, and other relevant events, the impact of which are all significant judgements and estimates. We concluded that it was more likely than not that the fair value of the Rights and the Aquaterra Trademarks were more than its carrying value and therefore we were not required to perform any additional testing.
To determine the fair value of the DSS Trademarks and the Eden Trademarks, we use a relief from royalty method of the income approach, which calculates a fair value royalty rate that is applied to revenue forecasts associated with those trademarks. The resulting cash flows are discounted using a rate to reflect the risk of achieving the projected royalty savings attributable to the trademarks. The assumptions used to estimate the fair value of these trademarks are subjective and require significant management judgment, including estimated future revenues, the fair value royalty rate (which is estimated to be a reasonable market royalty charge that would be charged by a licensor of the trademarks) and the risk adjusted discount rate. Based on our impairment test, the estimated fair value of the DSS Trademarks and the Eden Trademarks exceeded the carrying value by approximately 18.0% and 28.0%, respectively. If actual revenues in future periods, are less than currently projected for the DSS Trademarks and Eden Trademarks, these trademarks could be impaired.
37
Table of Contents
Other intangible assets
As of December 30, 2017, our intangible assets subject to amortization, net of accumulated amortization for continuing operations were $462.5 million, which consisted principally of $428.7 million of customer relationships that arose from acquisitions, $15.8 million of software, and $14.2 million of patents. Customer relationships are typically amortized on an accelerated basis for the period over which we expect to receive the economic benefits. The customer relationships acquired in connection with the acquisitions of S&D, Eden, Aquaterra and DSS are amortized over the expected remaining useful life of those relationships on a basis that reflects the pattern of realization of the estimated undiscounted after-tax cash flows. We review the estimated useful life of these intangible assets annually, taking into consideration the specific net cash flows related to the intangible asset, unless a review is required more frequently due to a triggering event such as the loss of a significant customer. The permanent loss of, or significant decline in sales to customers included in the intangible asset would result in either an impairment in the value of the intangible asset or an accelerated amortization of any remaining value and could lead to an impairment of the fixed assets that were used to service that customer. We did not record impairment charges for intangible assets in 2017, 2016 or 2015.
Impairment of long-lived assets
When adverse events occur, we compare the carrying amount of long-lived assets to the estimated undiscounted future cash flows at the lowest level of independent cash flows for the group of long-lived assets and recognize any impairment loss based on discounted cash flows in the Consolidated Statements of Operations, taking into consideration the timing of testing and the asset’s remaining useful life. The expected life and value of these long-lived assets is based on an evaluation of the competitive environment, history and future prospects as appropriate.
Income taxes
We are subject to income taxes in Canada as well as in numerous foreign jurisdictions. Significant judgments and estimates are required in determining the income tax expense in these jurisdictions. Our income tax expense, deferred tax assets and liabilities and reserves for unrecognized tax benefits reflect management’s best assessment of estimated future taxes to be paid in the jurisdictions in which we operate.
Deferred income taxes arise from temporary differences between the tax and financial statement recognition of revenue and expense. In evaluating our ability to recover our deferred tax assets within the jurisdiction from which they arise we consider all available positive and negative evidence, including scheduled reversals of deferred tax liabilities, projected future taxable income, tax planning strategies and recent financial operations. In projecting future taxable income, we begin with historical results adjusted for the results of discontinued operations and changes in accounting policies and incorporate assumptions including the amount of future Canadian and foreign pre-tax operating income, the reversal of temporary differences, and the implementation of feasible and prudent tax planning strategies. These assumptions require significant judgment about the forecasts of future taxable income and are consistent with the plans and estimates we are using to manage the underlying businesses. Changes in tax laws and rates could also affect recorded deferred tax assets and liabilities in the future.
The calculation of our tax liabilities involves dealing with uncertainties in the application of complex tax laws and regulations in a multitude of jurisdictions across our global operations. On December 22, 2017, the U.S. government enacted comprehensive tax legislation commonly referred to as the Tax Cuts and Jobs Act (the “Tax Act”). The Tax Act significantly revised the U.S. corporate income tax regime by, among other things, lowering the U.S. corporate tax rate from 35% to 21%, limiting various business deductions and repealing the corporate alternative minimum tax. Many provisions in the Tax Act are generally effective in tax years beginning after December 31, 2017. U.S. GAAP requires the impact of tax legislation to be recognized in the period in which the law was enacted. As a result of the Tax Act, we recorded tax benefits in the fourth quarter of 2017 of $32.2 million due to a re-measurement of the U.S deferred tax assets and liabilities and $1.3 million due to the repeal of the corporate alternative minimum tax. The tax benefits represent provisional amounts and our current best estimates. The provisional amounts incorporate assumptions made based upon our current interpretation of the Tax Act and may be refined through the fourth quarter of 2018 as we receive additional clarification and implementation guidance.
Financial Accounting Standards Board (“FASB”) Accounting Standards Codification (“ASC”) Topic 740, “Income Taxes” (“ASC 740”) provides that a tax benefit from an uncertain tax position may be recognized when it is more likely than not that the position will be sustained upon examination, including resolutions of any related appeals or litigation processes, based on the technical merits. ASC 740 also provides guidance on measurement, derecognition, classification, interest and penalties, accounting in interim periods, disclosure and transition.
38
Table of Contents
We recognize tax liabilities in accordance with ASC 740 and we adjust these liabilities when our judgment changes as a result of the evaluation of new information not previously available. Due to the complexity of some of these uncertainties, the ultimate resolution may result in a payment that is materially different from our current estimate of the tax liabilities. These differences will be reflected as increases or decreases to income tax expense in the period in which they are determined.
Pension costs
We account for our defined benefit pension plans in accordance with ASC No. 715-20, “Compensation—Defined Benefit Plans—General” (“ASC 715-20”). The funded status is the difference between the fair value of plan assets and the benefit obligation. The adjustment to accumulated other comprehensive income represents the net unrecognized actuarial gains or losses and unrecognized prior service costs. Future actuarial gains or losses that are not recognized as net periodic benefits cost in the same periods will be recognized as a component of other comprehensive income.
We maintain several defined-benefit plans that cover certain employees in the United States, Switzerland and Israel. We record the expenses associated with these plans based on calculations which include various actuarial assumptions such as discount rates and expected long-term rates of return on plan assets. Material changes in pension costs may occur in the future due to changes in these assumptions. Future annual amounts could be impacted by changes in the discount rate, changes in the expected long-term rate of return, changes in the level of contributions to the plans and other factors.
We utilize a yield curve analysis to determine the discount rates for our defined benefit plans’ obligations. The yield curve considers pricing and yield information for high quality corporate bonds with maturities matched to estimated payouts of future pension benefits. The expected return on plan assets is based on our expectation of the long-term rates of return on each asset class based on the current asset mix of the funds, considering the historical returns earned on the type of assets in the funds. We review our actuarial assumptions on an annual basis and make modifications to the assumptions based on current rates and trends when appropriate. The effects of the modifications to the actuarial assumptions which impact the projected benefit obligation are amortized over future periods.
In connection with certain other collective bargaining agreements to which we are a party, we are required to make contributions on behalf of certain union employees to multiemployer pension plans. The ongoing contributions and liabilities associated with these plans are not material.
Non-GAAP Measures
In this Annual Report on Form 10-K, we supplement our reporting of financial measures determined in accordance with GAAP by utilizing certain non-GAAP financial measures that exclude certain items to make period-over-period comparisons for our underlying operations before material charges. We exclude these items to better understand trends in the business. We exclude the impact of foreign exchange to separate the impact of currency exchange rate changes from our results of operations.
We also utilize (loss) earnings before interest expense, taxes, depreciation and amortization (“EBITDA”), which is GAAP net (loss) income from continuing operations before interest expense, net, (benefit) expense for income taxes and depreciation and amortization. We consider EBITDA to be an indicator of operating performance. We also use EBITDA, as do analysts, lenders, investors and others, because it excludes certain items that can vary widely across different industries or among companies within the same industry. These differences can result in considerable variability in the relative costs of productive assets and the depreciation and amortization expense among companies. We also utilize adjusted EBITDA, which is EBITDA excluding acquisition and integration costs, inventory step up and other purchase accounting adjustments, (gain) loss on commodity hedging instruments, net, foreign exchange and other (gains) losses, net, loss on disposal of property, plant & equipment, net, gain on extinguishment of long-term debt, share-based compensation costs, and other adjustments, as the case may be (“Adjusted EBITDA”). We consider Adjusted EBITDA to be an indicator of our operating performance. Adjusted EBITDA excludes certain items to make more meaningful period-over-period comparisons of our underlying operations before material changes. Effective January 1, 2017, share-based compensation expense as a part of annual compensation packages is included as an adjustment to EBITDA, and prior periods presented have been updated to incorporate the change. This determination is based upon review of peer companies and business practices among entities undergoing transformation within their operations.
Additionally, we supplement our reporting of net cash provided by operating activities from continuing operations determined in accordance with GAAP by excluding additions to property, plant & equipment to present free cash flow and adjusted free cash flow (which is free cash flow excluding DSS integration capital expenditures, acquisition and integration cash costs, cash collateral costs and other adjustments), which management believes provides useful information to investors about the amount of cash generated by the business that can be used for strategic opportunities, including investing in our business, making strategic acquisitions, paying dividends, and strengthening the balance sheet.
39
Table of Contents
Because we use these adjusted financial results in the management of our business and to understand underlying business performance, we believe this supplemental information is useful to investors for their independent evaluation and understanding of our business performance and the performance of our management. The non-GAAP financial measures described above are in addition to, and not meant to be considered superior to, or a substitute for, our financial statements prepared in accordance with GAAP. In addition, the non-GAAP financial measures included in this Annual Report on Form 10-K reflect our judgment of particular items, and may be different from, and therefore may not be comparable to, similarly titled measures reported by other companies.
40
Table of Contents
The following table summarizes our Consolidated Statements of Operations as a percentage of net revenue for 2017, 2016 and 2015:
| 2017 | 2016 | 2015 | ||||||||||||||||||||||
| Percentage | Percentage | Percentage | ||||||||||||||||||||||
| of | of | of | ||||||||||||||||||||||
| (in millions of U.S. dollars, except percentage amounts) |
Revenue | Revenue | Revenue | |||||||||||||||||||||
| Revenue, net |
$ | 2,269.7 | 100.0 | % | $ | 1,623.2 | 100.0 | % | $ | 1,187.3 | 100.0 | % | ||||||||||||
| Cost of sales |
1,142.0 | 50.3 | % | 773.1 | 47.6 | % | 536.8 | 45.2 | % | |||||||||||||||
|
|
|
|
|
|
|
|
|
|
|
|
|
|||||||||||||
| Gross profit |
1,127.7 | 49.7 | % | 850.1 | 52.4 | % | 650.5 | 54.8 | % | |||||||||||||||
| SG&A expenses |
1,042.7 | 45.9 | % | 806.2 | 49.7 | % | 608.4 | 51.2 | % | |||||||||||||||
| Loss on disposal of property, plant & equipment, net |
10.2 | 0.4 | % | 6.6 | 0.4 | % | 4.2 | 0.4 | % | |||||||||||||||
| Acquisition and integration expenses |
25.9 | 1.1 | % | 27.8 | 1.7 | % | 20.0 | 1.7 | % | |||||||||||||||
|
|
|
|
|
|
|
|
|
|
|
|
|
|||||||||||||
| Operating income |
48.9 | 2.2 | % | 9.5 | 0.6 | % | 17.9 | 1.5 | % | |||||||||||||||
| Other (income) expense, net |
(3.0 | ) | (0.1 | )% | 5.6 | 0.3 | % | (12.8 | ) | (1.1 | )% | |||||||||||||
| Interest expense, net |
85.5 | 3.8 | % | 43.0 | 2.6 | % | 30.1 | 2.5 | % | |||||||||||||||
|
|
|
|
|
|
|
|
|
|
|
|
|
|||||||||||||
| (Loss) income from continuing operations before income taxes |
(33.6 | ) | (1.5 | )% | (39.1 | ) | (2.4 | )% | 0.6 | 0.1 | % | |||||||||||||
| Income tax (benefit) expense |
(30.0 | ) | (1.3 | )% | 21.2 | 1.3 | % | (15.1 | ) | (1.3 | )% | |||||||||||||
|
|
|
|
|
|
|
|
|
|
|
|
|
|||||||||||||
| Net (loss) income from continuing operations |
(3.6 | ) | (0.2 | )% | (60.3 | ) | (3.7 | )% | 15.7 | 1.3 | % | |||||||||||||
| Net income (loss) from discontinued operations, net of income taxes |
10.7 | 0.5 | % | (11.2 | ) | (0.7 | )% | 4.9 | 0.4 | % | ||||||||||||||
|
|
|
|
|
|
|
|
|
|
|
|
|
|||||||||||||
| Net income (loss) |
7.1 | 0.3 | % | (71.5 | ) | (4.4 | )% | 20.6 | 1.7 | % | ||||||||||||||
| Less: Net income attributable to non-controlling interests - discontinued operations |
8.5 | 0.4 | % | 6.3 | 0.4 | % | 6.1 | 0.5 | % | |||||||||||||||
| Less: Accumulated dividends on preferred shares - continuing operations |
— | — | % | — | — | % | 5.9 | 0.5 | % | |||||||||||||||
| Less: Foreign exchange impact on redemption of preferred shares -continued operations |
— | — | % | — | — | % | 12.0 | 1.0 | % | |||||||||||||||
|
|
|
|
|
|
|
|
|
|
|
|
|
|||||||||||||
| Net loss attributable to Cott Corporation |
$ | (1.4 | ) | (0.1 | )% | $ | (77.8 | ) | (4.8 | )% | $ | (3.4 | ) | (0.3 | )% | |||||||||
|
|
|
|
|
|
|
|
|
|
|
|
|
|||||||||||||
| Depreciation & amortization |
$ | 188.6 | 8.3 | % | $ | 151.1 | 9.3 | % | $ | 128.3 | 10.8 | % | ||||||||||||
|
|
|
|
|
|
|
|
|
|
|
|
|
|||||||||||||
41
Table of Contents
The following table summarizes our net revenue, gross profit and operating income (loss) by reporting segment for 2017, 2016 and 2015 (for purposes of the table below, our corporate oversight function (“Corporate”) is not treated as a segment; it includes certain general and administrative costs that are not allocated to any of the reporting segments):
| (in millions of U.S. dollars) |
2017 | 2016 | 2015 | |||||||||
| Revenue, net |
||||||||||||
| Route Based Services |
$ | 1,501.7 | $ | 1,224.3 | $ | 1,021.2 | ||||||
| Coffee, Tea and Extract Solutions |
602.2 | 228.0 | — | |||||||||
| All Other |
165.8 | 170.9 | 166.1 | |||||||||
|
|
|
|
|
|
|
|||||||
| Total |
$ | 2,269.7 | $ | 1,623.2 | $ | 1,187.3 | ||||||
|
|
|
|
|
|
|
|||||||
| Gross profit |
||||||||||||
| Route Based Services |
$ | 939.9 | $ | 752.4 | $ | 618.4 | ||||||
| Coffee, Tea and Extract Solutions |
161.4 | 65.5 | — | |||||||||
| All Other |
26.4 | 32.2 | 32.1 | |||||||||
|
|
|
|
|
|
|
|||||||
| Total |
$ | 1,127.7 | $ | 850.1 | $ | 650.5 | ||||||
|
|
|
|
|
|
|
|||||||
| Operating income (loss) |
||||||||||||
| Route Based Services |
$ | 77.0 | $ | 41.2 | $ | 39.0 | ||||||
| Coffee, Tea and Extract Solutions |
15.7 | 5.3 | — | |||||||||
| All Other |
1.2 | 8.0 | 8.8 | |||||||||
| Corporate |
(45.0 | ) | (45.0 | ) | (29.9 | ) | ||||||
|
|
|
|
|
|
|
|||||||
| Total |
$ | 48.9 | $ | 9.5 | $ | 17.9 | ||||||
|
|
|
|
|
|
|
|||||||
The following tables summarize revenue by channel for 2017, 2016 and 2015:
| For the Year Ended December 30, 2017 | ||||||||||||||||
| (in millions of U.S. dollars) |
Route Based Services |
Coffee, Tea and Extract Solutions |
All Other |
Total | ||||||||||||
| Revenue, net |
||||||||||||||||
| Home and office bottled water delivery |
$ | 990.6 | $ | — | $ | — | $ | 990.6 | ||||||||
| Coffee and tea services |
184.2 | 501.7 | 2.6 | 688.5 | ||||||||||||
| Retail |
166.7 | — | 65.3 | 232.0 | ||||||||||||
| Other |
160.2 | 100.5 | 97.9 | 358.6 | ||||||||||||
|
|
|
|
|
|
|
|
|
|||||||||
| Total |
$ | 1,501.7 | $ | 602.2 | $ | 165.8 | $ | 2,269.7 | ||||||||
|
|
|
|
|
|
|
|
|
|||||||||
| For the Year Ended December 31, 2016 | ||||||||||||||||
| (in millions of U.S. dollars) |
Route Based Services |
Coffee, Tea and Extract Solutions |
All Other |
Total | ||||||||||||
| Revenue, net |
||||||||||||||||
| Home and office bottled water delivery |
$ | 799.4 | $ | — | $ | — | $ | 799.4 | ||||||||
| Coffee and tea services |
146.8 | 187.8 | 2.6 | 337.2 | ||||||||||||
| Retail |
164.6 | — | 51.7 | 216.3 | ||||||||||||
| Other |
113.5 | 40.2 | 116.6 | 270.3 | ||||||||||||
|
|
|
|
|
|
|
|
|
|||||||||
| Total |
$ | 1,224.3 | $ | 228.0 | $ | 170.9 | $ | 1,623.2 | ||||||||
|
|
|
|
|
|
|
|
|
|||||||||
42
Table of Contents
| For the Year Ended January 2, 2016 | ||||||||||||||||
| (in millions of U.S. dollars) |
Route Based Services |
Coffee, Tea and Extract Solutions |
All Other |
Total | ||||||||||||
| Revenue, net |
||||||||||||||||
| Home and office bottled water delivery |
$ | 651.3 | $ | — | $ | — | $ | 651.3 | ||||||||
| Coffee and tea services |
121.3 | — | — | 121.3 | ||||||||||||
| Retail |
149.4 | — | 61.8 | 211.2 | ||||||||||||
| Other |
99.2 | — | 104.3 | 203.5 | ||||||||||||
|
|
|
|
|
|
|
|
|
|||||||||
| Total |
$ | 1,021.2 | $ | — | $ | 166.1 | $ | 1,187.3 | ||||||||
|
|
|
|
|
|
|
|
|
|||||||||
Results of Operations
The following table summarizes the change in revenue by reporting segment for 2017:
| For the Year Ended December 30, 2017 | ||||||||||||||||
| (in millions of U.S. dollars, except percentage amounts) |
Route Based Services |
Coffee, Tea and Extract Solutions |
All Other |
Total | ||||||||||||
| Change in revenue |
$ | 277.4 | $ | 374.2 | $ | (5.1 | ) | $ | 646.5 | |||||||
| Impact of foreign exchange 1 |
(16.9 | ) | — | 4.2 | (12.7 | ) | ||||||||||
|
|
|
|
|
|
|
|
|
|||||||||
| Change excluding foreign exchange |
$ | 260.5 | $ | 374.2 | $ | (0.9 | ) | $ | 633.8 | |||||||
|
|
|
|
|
|
|
|
|
|||||||||
| Percentage change in revenue |
22.7 | % | 164.1 | % | (3.0 | )% | 39.8 | % | ||||||||
|
|
|
|
|
|
|
|
|
|||||||||
| Percentage change in revenue excluding foreign exchange |
21.3 | % | 164.1 | % | (0.5 | )% | 39.0 | % | ||||||||
|
|
|
|
|
|
|
|
|
|||||||||
| 1. | Impact of foreign exchange is the difference between the current year’s revenue translated utilizing the current year’s average foreign exchange rates less the current year’s revenue translated utilizing the prior year’s average foreign exchange rates. |
The following table summarizes the change in revenue by reporting segment for 2016:
| For the Year Ended December 31, 2016 | ||||||||||||||||
| (in millions of U.S. dollars, except percentage amounts) |
Route Based Services |
Coffee, Tea and Extract Solutions |
All Other |
Total | ||||||||||||
| Change in revenue |
$ | 203.1 | $ | 228.0 | $ | 4.8 | $ | 435.9 | ||||||||
| Impact of foreign exchange 1 |
— | — | 13.6 | 13.6 | ||||||||||||
|
|
|
|
|
|
|
|
|
|||||||||
| Change excluding foreign exchange |
$ | 203.1 | $ | 228.0 | $ | 18.4 | $ | 449.5 | ||||||||
|
|
|
|
|
|
|
|
|
|||||||||
| Percentage change in revenue |
19.9 | % | — | % | 2.9 | % | 36.7 | % | ||||||||
|
|
|
|
|
|
|
|
|
|||||||||
| Percentage change in revenue excluding foreign exchange |
19.9 | % | — | % | 11.1 | % | 37.9 | % | ||||||||
|
|
|
|
|
|
|
|
|
|||||||||
| Impact of four additional shipping days in 2015 |
$ | 12.5 | $ | — | $ | — | $ | 12.5 | ||||||||
|
|
|
|
|
|
|
|
|
|||||||||
| Change excluding foreign exchange and impact of four additional shipping days in 2015 |
$ | 215.6 | $ | 228.0 | $ | 18.4 | $ | 462.0 | ||||||||
|
|
|
|
|
|
|
|
|
|||||||||
| Percentage change in revenue excluding foreign exchange and four additional shipping days in 2015 |
21.4 | % | — | % | 11.1 | % | 39.3 | % | ||||||||
|
|
|
|
|
|
|
|
|
|||||||||
| 1. | Impact of foreign exchange is the difference between the current year’s revenue translated utilizing the current year’s average foreign exchange rates less the current year’s revenue translated utilizing the prior year’s average foreign exchange rates. |
43
Table of Contents
The following table summarizes our EBITDA and Adjusted EBITDA for the fiscal years ended December 30, 2017, December 31, 2016 and January 2, 2016, respectively.
| For the Year Ended | ||||||||||||
| December 30, 2017 |
December 31 2016 |
January 2, 2016 |
||||||||||
| (in millions of U.S. dollars) |
||||||||||||
| Net (loss) income from continuing operations |
$ | (3.6 | ) | $ | (60.3 | ) | $ | 15.7 | ||||
| Interest expense, net |
85.5 | 43.0 | 30.1 | |||||||||
| Income tax (benefit) expense |
(30.0 | ) | 21.2 | (15.1 | ) | |||||||
| Depreciation & amortization |
188.6 | 151.1 | 128.3 | |||||||||
|
|
|
|
|
|
|
|||||||
| EBITDA |
$ | 240.5 | $ | 155.0 | $ | 159.0 | ||||||
| Acquisition and integration costs 1 |
25.9 | 27.8 | 20.0 | |||||||||
| Inventory step up and other purchase accounting adjustments |
— | 6.2 | 4.2 | |||||||||
| Commodity hedging (gain) loss, net 2 |
(0.3 | ) | 4.1 | — | ||||||||
| Foreign exchange and other (gains) losses, net |
(2.0 | ) | 0.2 | (13.4 | ) | |||||||
| Loss on disposal of property, plant & equipment, net |
11.1 | 6.6 | 4.3 | |||||||||
| Gain on extinguishment of long-term debt |
(1.5 | ) | — | — | ||||||||
| Share-based compensation costs |
14.0 | 6.6 | 6.4 | |||||||||
| Other adjustments |
7.9 | 5.1 | 2.5 | |||||||||
|
|
|
|
|
|
|
|||||||
| Adjusted EBITDA |
$ | 295.6 | $ | 211.6 | $ | 183.0 | ||||||
|
|
|
|
|
|
|
|||||||
| 1. | Includes $3.5 million, $0.4 million and $1.2 million of share-based compensation costs for the years ended December 30, 2017, December 31, 2016 and January 2, 2016, respectively, related to awards granted in connection with the acquisitions of our S&D, Eden and DSS businesses. |
| 2. | In the fourth quarter of 2016, unrealized gains and losses associated with coffee hedges were included as adjustments to EBITDA, while certain realized gains and losses were not included as adjustments. In 2017, with the adoption of Accounting Standards Update (“ASU”) 2017-12, “Derivatives and Hedging (Topic 815): Targeted Improvements to Accounting for Hedging Activities,” management determined it was appropriate to include these realized and unrealized gains and losses as adjustments to EBITDA for the year ended December 31, 2016. |
The following table summarizes our free cash flow and adjusted free cash flow for the fiscal years ended December 30, 2017, December 31, 2016 and January 2, 2016, respectively:
| For the Year Ended | ||||||||||||
| (in millions of U.S. dollars) |
December 30, 2017 |
December 31 2016 |
January 2, 2016 |
|||||||||
| Net cash provided by operating activities from continuing operations |
$ | 176.0 | $ | 145.5 | $ | 131.1 | ||||||
| Less: Additions to property, plant & equipment |
(121.3 | ) | (95.1 | ) | (69.6 | ) | ||||||
|
|
|
|
|
|
|
|||||||
| Free Cash Flow |
$ | 54.7 | $ | 50.4 | $ | 61.5 | ||||||
|
|
|
|
|
|
|
|||||||
| Plus: |
||||||||||||
| DSS integration capital expenditures |
— | — | 5.3 | |||||||||
| Acquisition and integration cash costs |
23.6 | 18.6 | 13.9 | |||||||||
| Cash collateral 1 |
— | — | (29.4 | ) | ||||||||
| Other adjustments |
— | 1.2 | — | |||||||||
|
|
|
|
|
|
|
|||||||
| Adjusted Free Cash Flow |
$ | 78.3 | $ | 70.2 | $ | 51.3 | ||||||
|
|
|
|
|
|
|
|||||||
| 1. | In connection with the acquisition of DSS, $29.4 million of cash was required to collateralize certain DSS self-insurance programs. The $29.4 million was funded with borrowings under our ABL facility, and the cash collateral was included within prepaid and other current assets on our Consolidated Balance Sheet at January 3, 2015. After January 3, 2015, additional letters of credit were issued from our available ABL facility capacity, and the cash collateral was returned to the Company and used to repay a portion of our outstanding ABL facility. |
44
Table of Contents
2017 versus 2016
Net revenue increased $646.5 million, or 39.8%, in 2017 from 2016. Excluding the impact of foreign exchange, net revenue increased $633.8 million, or 39.0%, due primarily to the additions of our S&D and Eden businesses, growth in volume and consumption, as well as increased pricing in our Route Based Services reporting segment, and strong coffee volume growth in our Coffee, Tea and Extract Solutions reporting segment.
2016 versus 2015
Net revenue increased $435.9 million, or 36.7%, in 2016 from 2015. Excluding the impact of foreign exchange and four additional shipping days in 2015 for DSS, net revenue increased $462.0 million, or 39.3%, due primarily to the additions of our S&D, Eden, and Aquaterra businesses.
Revenue, Net Results for Reporting Segments
2017 versus 2016
Route Based Services net revenue increased $277.4 million, or 22.7%, in 2017 from 2016, due primarily to the addition of our Eden business, growth in volume and consumption, increased pricing, and the impact of favorable foreign exchange rates. Excluding the impact of foreign exchange, net revenue increased $260.5 million, or 21.3%, from the prior year.
Coffee, Tea and Extract Solutions net revenue increased $374.2 million, or 164.1%, in 2017 from 2016, due primarily to having a full year of results for S&D in 2017 as compared to five months in the prior year, as well as strong coffee volume growth in 2017.
All Other net revenue decreased $5.1 million, or 3.0%, in 2017 from 2016. Excluding the impact of foreign exchange, net revenue decreased $0.9 million, or 0.5%, from the prior year.
2016 versus 2015
Route Based Services net revenue increased $203.1 million, or 19.9%, in 2016 from 2015. Excluding the impact of four additional shipping days in 2015 in our DSS business, net revenue increased $215.6 million, or 21.4%, due primarily to the incremental revenues from the additions of our Eden and Aquaterra businesses.
Coffee, Tea and Extract Solutions net revenue increased $228.0 million in 2016 from 2015, due primarily to the addition of our S&D business in the third quarter of the prior year.
All Other net revenue increased $4.8 million, or 2.9%, in 2016 from 2015. Excluding the impact of foreign exchange, net revenue increased $18.4 million, or 11.1%.
45
Table of Contents
Cost of Sales
2017 versus 2016
Cost of sales increased to $1,142.0 million in 2017 compared to $773.1 million in 2016 due primarily to the additions of our S&D and Eden businesses and higher production costs in our DSS business. As a percentage of net revenue, cost of sales was 50.3% in 2017 compared to 47.6% in 2016.
2016 versus 2015
Cost of sales increased to $773.1 million in 2016 compared to $536.8 million in 2015 due primarily to the additions of our S&D, Eden and Aquaterra businesses. As a percentage of net revenue, cost of sales was 47.6% in 2016 compared to 45.2% in 2015.
Gross Profit
2017 versus 2016
Gross profit increased to $1,127.7 million in 2017 compared to $850.1 million in 2016 due primarily to the additions of our S&D and Eden businesses and growth in our DSS business. As a percentage of net revenue, gross profit was 49.7% in 2017 compared to 52.4% in 2016. The decrease in gross profit as a percentage of net revenue is due to our S&D business, which is a lower gross profit business.
2016 versus 2015
Gross profit increased to $850.1 million in 2016 compared to $650.5 million in 2015 due primarily to the additions of our S&D, Eden and Aquaterra businesses, partially offset by the impact of unfavorable foreign exchange rates and increased operational costs at our DSS business. As a percentage of net revenue, gross profit was 52.4% in 2016 compared to 54.8% in 2015. The decrease in gross profit as a percentage of net revenue is due to our S&D business, which is a lower gross profit business.
Selling, General and Administrative Expenses
2017 versus 2016
SG&A expenses increased to $1,042.7 million in 2017 compared to $806.2 million in 2016 due primarily to the additions of our S&D and Eden businesses. As a percentage of net revenue, SG&A expenses were 45.9% in 2017 compared to 49.7% in 2016.
2016 versus 2015
SG&A expenses increased to $806.2 million in 2016 compared to $608.4 million in 2015 due primarily to the additions of our S&D, Eden and Aquaterra businesses. As a percentage of net revenue, SG&A expenses were 49.7% in 2016 compared to 51.2% in 2015.
Acquisition and Integration Expenses
2017 versus 2016
Acquisition and integration expenses include costs directly related to integrating and reorganizing acquired businesses. Acquisition and integration expenses decreased to $25.9 million in 2017 compared to $27.8 million in 2016 due primarily to the reduction in costs with the integration of our S&D and Eden businesses. As a percentage of net revenue, acquisition and integration expenses were 1.1% in 2017 compared to 1.7% in 2016.
2016 versus 2015
Acquisition and integration expenses increased to $27.8 million in 2016 compared to $20.0 million in 2015 due primarily to the transaction costs in connection with the additions of our S&D, Eden and Aquaterra businesses. As a percentage of net revenue, acquisition and integration expenses were 1.7% in 2016 compared to 1.7% in 2015.
46
Table of Contents
Operating Income
2017 versus 2016
Operating income was $48.9 million in 2017 compared to $9.5 million in 2016. Overall, operating income increased by $39.4 million, or 414.7% due primarily to the addition of the higher gross profit business of Eden, partially offset by increased SG&A expenses.
2016 versus 2015
Operating income was $9.5 million in 2016 compared to $17.9 million in 2015. Overall, operating income decreased by $8.4 million, or 46.9%, due primarily to increased SG&A expenses and increased acquisition and integration expenses, partially offset by the additions of the higher gross profit businesses of Eden and Aquaterra.
Other (Income) Expense, Net
2017 versus 2016
Other income, net was $3.0 million in 2017 compared to other expense, net of $5.6 million in 2016. The difference was due primarily to the increase of net gains on foreign currency transactions and the gain recognized upon the partial redemption of our DSS Notes in 2017 and unrealized losses on our commodity hedges in 2016.
2016 versus 2015
Other expense, net was $5.6 million in 2016 compared to other income, net of $12.8 million in 2015. The difference was due primarily to the reduction of net gains on foreign currency transactions and unrealized losses on our commodity hedges, partially offset by realized gains on our commodity hedges.
Interest Expense, Net
2017 versus 2016
Interest expense, net was $85.5 million in 2017 compared to $43.0 million in 2016. The increase was due primarily to the issuance of our 2025 Notes in the first quarter of 2017 and having a full year of interest expense in 2017 associated with our 2024 Notes.
2016 versus 2015
Interest expense, net was $43.0 million in 2016 compared to $30.1 million in 2015. The increase was due primarily to interest on our 2024 Notes issued in the second quarter of 2016.
Income Taxes
2017 versus 2016
Income tax benefit was $30.0 million in 2017 compared to income tax expense of $21.2 million in 2016. The effective income tax rate was 89.3% in 2017 compared to (54.2%) in 2016. The income tax benefit in 2017 was due primarily to the change in the U.S. federal enacted tax rate in 2017. The income tax expense in 2016 was due primarily to the Canadian valuation allowance recorded in the third quarter of 2016 and the U.S. federal valuation allowance recorded in the fourth quarter of 2016. The effective tax rate differs from the Canadian statutory rate primarily due to: (a) the change in the U.S. federal enacted tax rate in 2017; (b) significant permanent differences for which we have recognized a tax benefit; (c) income in tax jurisdictions with lower statutory tax rates than Canada; and (d) losses in tax jurisdictions with existing valuation allowances.
2016 versus 2015
Income tax expense was $21.2 million in 2016 compared to income tax benefit of $15.1 million in 2015. The effective income tax rate was (54.2%) in 2016 compared to (2,516.7%) in 2015. The effective rate increase in 2016 was due primarily to the Canadian valuation allowance recorded in the third quarter of 2016 and the U.S. federal valuation allowance recorded in the fourth quarter of 2016. The effective tax rate differs from the Canadian statutory rate primarily due to: (a) the Canadian valuation allowance recorded in the third quarter of 2016 and the U.S. federal valuation allowance recorded in the fourth quarter of 2016; (b) significant permanent differences for which we have recognized a tax benefit; (c) income in tax jurisdictions with lower statutory tax rates than Canada; and (d) losses in tax jurisdictions with existing valuation allowances.
47
Table of Contents
Liquidity and Capital Resources
The following table summarizes our cash flows for 2017, 2016 and 2015 as reported in our Consolidated Statements of Cash Flows in the accompanying Consolidated Financial Statements:
| For the Year Ended | ||||||||||||
| December 30, 2017 |
December 31, 2016 |
January 2, 2016 |
||||||||||
| (in millions of U.S. dollars) |
||||||||||||
| Net cash provided by operating activities from continuing operations |
$ | 176.0 | $ | 145.5 | $ | 131.1 | ||||||
| Net cash used in investing activities from continuing operations |
(153.6 | ) | (1,052.6 | ) | (66.6 | ) | ||||||
| Net cash provided by (used in) financing activities from continuing operations |
596.5 | 807.1 | (37.5 | ) | ||||||||
| Cash flows from discontinued operations: |
||||||||||||
| Net cash provided by operating activities from discontinued operations |
102.7 | 124.3 | 123.5 | |||||||||
| Net cash used in investing activities from discontinued operations |
(44.7 | ) | (44.0 | ) | (33.1 | ) | ||||||
| Net cash (used in) provided by financing activities from discontinued operations |
(643.4 | ) | 68.6 | (122.6 | ) | |||||||
| Effect of exchange rate changes on cash |
6.3 | (7.9 | ) | (3.9 | ) | |||||||
|
|
|
|
|
|
|
|||||||
| Net increase (decrease) in cash, cash equivalents and restricted cash |
39.8 | 41.0 | (9.1 | ) | ||||||||
| Cash, cash equivalents and restricted cash, beginning of period |
118.1 | 77.1 | 86.2 | |||||||||
|
|
|
|
|
|
|
|||||||
| Cash & cash equivalents, end of period |
157.9 | 118.1 | 77.1 | |||||||||
| Cash & cash equivalents from discontinued operations, end of period |
66.0 | 40.0 | 55.3 | |||||||||
|
|
|
|
|
|
|
|||||||
| Cash & cash equivalents from continued operations, end of period |
$ | 91.9 | $ | 78.1 | $ | 21.8 | ||||||
|
|
|
|
|
|
|
|||||||
Operating Activities
Cash provided by operating activities from continuing operations was $176.0 million in 2017 compared to $145.5 million in 2016 and $131.1 million in 2015. The $30.5 million increase in 2017 compared to 2016 was due primarily to the decrease in net loss from continuing operations, partially offset by the change in working capital account balances relative to the prior year resulting from timing of inventory purchases and payments of interest on our 2024 Notes.
The $14.4 million increase in 2016 compared to 2015 was due primarily to the timing of accounts receivable receipts and accounts payable payments relative to the prior year, partially offset by the release of cash collateral held by third parties in the prior year.
Investing Activities
Cash used in investing activities from continuing operations was $153.6 million in 2017 compared to $1,052.6 million in 2016 and $66.6 million in 2015. The $899.0 million decrease in 2017 compared to 2016 was due primarily to the cash used in the acquisitions of our S&D, Eden and Aquaterra businesses in the prior year, partially offset by an increase in additions to property, plant and equipment relative to the prior year.
48
Table of Contents
The $986.0 million increase in 2016 compared to 2015 was due primarily to the cash used to acquire the S&D, Eden and Aquaterra businesses and an increase in purchases of property, plant and equipment, partially offset by cash provided by the receipt of proceeds from the Sale-Leaseback Transaction in the comparable prior year.
Financing Activities
Cash provided by financing activities from continuing operations was $596.5 million in 2017 compared to $807.1 million in 2016 and cash used in financing activities from continuing operations of $37.5 million in 2015. The $210.6 million decrease in 2017 compared to 2016 was due primarily to the receipt of net proceeds from the issuance of common shares and the 2024 Notes in the prior year, partially offset by the issuance of the 2025 Notes and the partial redemption of the DSS Notes.
The $844.6 million increase in cash provided by financing activities from continuing operations in 2016 compared to 2015 was due primarily to the receipt of the net proceeds from the March 2016 Offering and the June 2016 Offering, proceeds received from the issuance of the 2024 Notes, and an increase in borrowings under our ABL facility, net of payments.
Financial Liquidity
As of December 30, 2017, we had $2,287.0 million of debt and $91.9 million of cash and cash equivalents compared to $2,199.0 million of debt and $78.1 million of cash and cash equivalents as of December 31, 2016. On January 30, 2018, in connection with the closing of the Transaction, we used a portion of the proceeds to (i) retire $525.0 million aggregate principal amount of our 2022 Notes, (ii) retire the remaining $250.0 million aggregate principal amount of our DSS Notes, (iii) repay the $262.5 million outstanding balance on our ABL facility, and (iv) repay $1.9 million in aggregate principal outstanding on our GE Term Loan.
We believe that our level of resources, which includes cash on hand, available borrowings under our ABL facility and funds provided by operations, will be adequate to meet our expenses, capital expenditures, and debt service obligations for the next twelve months. Our ability to generate cash to meet our current expenses and debt service obligations will depend on our future performance. If we do not have enough cash to pay our debt service obligations, or if the ABL facility or our outstanding notes were to become currently due, either at maturity or as a result of a breach, we may be required to take actions such as amending our ABL facility or the indentures governing our outstanding notes, refinancing all or part of our existing debt, selling assets, incurring additional indebtedness or raising equity. The ABL facility is secured by substantially all of our assets and those of the respective guarantor subsidiaries. If the ABL facility were to become currently due, the lenders may have the right to foreclose on such assets. If we need to seek additional financing, there is no assurance that this additional financing will be available on favorable terms or at all.
Our ABL facility and debt capital markets transactions are described under “Debt” below.
In June 2016, we completed the June 2016 Offering for gross proceeds to us of approximately $230.1 million. We incurred $9.2 million of underwriter commissions and $1.1 million in professional fees in connection with the June 2016 Offering. The net proceeds of the June 2016 Offering were used to repay borrowings under our ABL facility, to finance the S&D Acquisition and for general corporate purposes.
In March 2016, we completed the March 2016 Offering for gross proceeds to us of approximately $150.6 million. We incurred $6.0 million of underwriter commissions and $0.8 million in professional fees the March 2016 Offering. The net proceeds of the March 2016 Offering were used to repay borrowings under our ABL facility and for general corporate purposes.
In 2017, we declared a dividend of $0.06 per common share each quarter for an aggregate dividend payment of approximately $33.7 million.
We may, from time to time, depending on market conditions, including without limitation whether our outstanding notes are then trading at a discount to their face amount, repurchase our outstanding notes for cash and/or in exchange for shares of our common shares, warrants, preferred shares, debt or other consideration, in each case in open market purchases and/or privately negotiated transactions. The amounts involved in any such transactions, individually or in aggregate, may be material. However, the covenants in our ABL facility subject such purchases to certain limitations and conditions.
49
Table of Contents
Off-Balance Sheet Arrangements
We have no off-balance sheet arrangements as defined under Item 303(a)(4) of Regulation S-K as of December 30, 2017.
Contractual Obligations
The following table shows the schedule of future payments under certain contracts, including debt agreements and guarantees, as of December 30, 2017:
| Payments due by period | ||||||||||||||||||||||||||||
| (in millions of U.S. dollars) |
Total | 2018 | 2019 | 2020 | 2021 | 2022 | Thereafter | |||||||||||||||||||||
| 10.000% senior notes due in 2021 1 |
250.0 | — | — | — | 250.0 | — | — | |||||||||||||||||||||
| 5.375% senior notes due in 2022 1 |
525.0 | — | — | — | — | 525.0 | — | |||||||||||||||||||||
| 5.500% senior notes due in 2024 |
539.1 | — | — | — | — | — | 539.1 | |||||||||||||||||||||
| 5.500% senior notes due in 2025 |
750.0 | — | — | — | — | — | 750.0 | |||||||||||||||||||||
| ABL facility 2 |
220.3 | 220.3 | — | — | — | — | — | |||||||||||||||||||||
| GE Term Loan 3 |
2.0 | 2.0 | — | — | — | — | — | |||||||||||||||||||||
| Capital leases and other long-term debt |
7.2 | 3.1 | 1.8 | 1.0 | 0.6 | 0.4 | 0.3 | |||||||||||||||||||||
| Interest expense 4 |
536.5 | 75.2 | 70.8 | 75.1 | 74.9 | 70.7 | 169.8 | |||||||||||||||||||||
| Operating leases |
266.7 | 45.9 | 39.6 | 32.7 | 26.9 | 22.7 | 98.9 | |||||||||||||||||||||
| Pension obligations |
10.0 | 0.8 | 0.8 | 0.8 | 0.7 | 0.7 | 6.2 | |||||||||||||||||||||
| Purchase obligations 5 |
135.5 | 130.2 | 2.7 | 1.7 | 0.9 | — | — | |||||||||||||||||||||
|
|
|
|
|
|
|
|
|
|
|
|
|
|
|
|||||||||||||||
| Total 6 |
$ | 3,242.3 | $ | 477.5 | $ | 115.7 | $ | 111.3 | $ | 354.0 | $ | 619.5 | $ | 1,564.3 | ||||||||||||||
|
|
|
|
|
|
|
|
|
|
|
|
|
|
|
|||||||||||||||
| 1. | On January 30, 2018, in connection with the closing of the Transaction, we used a portion of the proceeds from the Transaction to redeem the remaining aggregate principal amount of the DSS Notes and the 2022 Notes. |
| 2. | The ABL facility is considered a current liability. As of December 30, 2017, we had $220.3 million of outstanding borrowings under the ABL facility. These borrowings were repaid on January 30, 2018 with proceeds from the Transaction. |
| 3. | In January 2008, we entered into a capital lease finance arrangement with General Electric Capital Corporation (“GE Capital”) for the lease of equipment. In September 2013, we purchased the equipment subject to the lease for an aggregate purchase price of $10.7 million, with the financing for such purchase provided by GE Capital at a 5.23% interest rate. On January 30, 2018, in connection with the closing of the Transaction, we used a portion of the proceeds from the Transaction to repay the outstanding balance of the GE Term Loan. |
| 4. | Interest expense includes fixed interest for one month on the DSS Notes, the 2022 Notes, the GE Term Loan and the ABL facility, and a full year of fixed interest on the 2024 Notes, the 2025 Notes, capital leases and other long-term liabilities. Actual amounts will differ from estimates provided. |
| 5. | Purchase obligations consist of commitments for the purchase of inventory, energy transactions, and payments related to professional fees and technology outsourcing agreements. These obligations represent the minimum contractual obligations expected under the normal course of business. |
| 6. | The contractual obligations table excludes the Company’s ASC 740 uncertain tax positions of $16.2 million because the Company cannot make a reliable estimate as to when such amounts will be settled. |
50
Table of Contents
Debt
Our total debt as of December 30, 2017 and December 31, 2016 was as follows:
| December 30, 2017 | December 31, 2016 | |||||||||||||||||||||||
| (in millions of U.S. dollars) |
Principal | Unamortized Debt Costs |
Net | Principal | Unamortized Debt Costs |
Net | ||||||||||||||||||
| 6.750% senior notes due in 2020 |
$ | — | — | $ | — | $ | 625.0 | $ | 9.3 | $ | 615.7 | |||||||||||||
| 10.000% senior notes due in 2021 1 |
269.9 | — | 269.9 | 384.2 | — | 384.2 | ||||||||||||||||||
| 5.375% senior notes due in 2022 |
525.0 | 6.0 | 519.0 | 525.0 | 7.1 | 517.9 | ||||||||||||||||||
| 5.500% senior notes due in 2024 |
539.1 | 9.5 | 529.6 | 474.1 | 9.8 | 464.3 | ||||||||||||||||||
| 5.500% senior notes due in 2025 |
750.0 | 11.0 | 739.0 | — | — | — | ||||||||||||||||||
| ABL facility |
220.3 | — | 220.3 | 207.0 | — | 207.0 | ||||||||||||||||||
| GE Term Loan |
2.0 | — | 2.0 | 4.3 | 0.2 | 4.1 | ||||||||||||||||||
| Other debt financing |
0.8 | — | 0.8 | — | — | — | ||||||||||||||||||
| Capital leases |
6.4 | — | 6.4 | 5.8 | — | 5.8 | ||||||||||||||||||
|
|
|
|
|
|
|
|
|
|
|
|
|
|||||||||||||
| Total debt |
2,313.5 | 26.5 | 2,287.0 | 2,225.4 | 26.4 | 2,199.0 | ||||||||||||||||||
| Less: Short-term borrowings and current debt: |
||||||||||||||||||||||||
| ABL facility |
220.3 | — | 220.3 | 207.0 | — | 207.0 | ||||||||||||||||||
|
|
|
|
|
|
|
|
|
|
|
|
|
|||||||||||||
| Total short-term borrowings required to be repaid or extinguished as part of divestiture |
220.3 | — | 220.3 | 207.0 | — | 207.0 | ||||||||||||||||||
| GE Term Loan - current maturities |
2.0 | — | 2.0 | 2.3 | — | 2.3 | ||||||||||||||||||
| Other debt financing |
0.8 | — | 0.8 | — | — | — | ||||||||||||||||||
| Capital leases - current maturities |
2.3 | — | 2.3 | 2.9 | — | 2.9 | ||||||||||||||||||
|
|
|
|
|
|
|
|
|
|
|
|
|
|||||||||||||
| Total current debt |
225.4 | — | 225.4 | 212.2 | — | 212.2 | ||||||||||||||||||
| Less: Debt required to be repaid or extinguished as part of divestiture |
||||||||||||||||||||||||
| 6.750% senior notes due in 2020 |
— | — | — | 625.0 | 9.3 | 615.7 | ||||||||||||||||||
| 5.375% senior notes due in 2022 |
525.0 | 6.0 | 519.0 | 525.0 | 7.1 | 517.9 | ||||||||||||||||||
| GE Term Loan |
— | — | — | 2.0 | 0.2 | 1.8 | ||||||||||||||||||
|
|
|
|
|
|
|
|
|
|
|
|
|
|||||||||||||
| Total debt to be required to be repaid or extinguished as part of divestiture |
525.0 | 6.0 | 519.0 | 1,152.0 | 16.6 | 1,135.4 | ||||||||||||||||||
|
|
|
|
|
|
|
|
|
|
|
|
|
|||||||||||||
| Total long-term debt |
$ | 1,563.1 | $ | 20.5 | $ | 1,542.6 | $ | 861.2 | $ | 9.8 | $ | 851.4 | ||||||||||||
|
|
|
|
|
|
|
|
|
|
|
|
|
|||||||||||||
| 1. | The outstanding aggregate principal amount and unamortized premium of our DSS Notes was $250.0 million and $19.9 million at December 30, 2017, and $350.0 million and $34.2 million at December 31, 2016, respectively. |
Asset-Based Lending Facility
We had an ABL facility with JPMorgan Chase Bank N.A. as Agent since 2008 to provide financing for our operations. We have amended and refinanced the ABL facility from time to time and incurred related financing fees, $12.4 million of which have been capitalized and deferred and are being amortized using the straight-line method over the duration of the amended ABL facility.
51
Table of Contents
As of December 30, 2017, we had $220.3 million of outstanding borrowings under the ABL facility. The commitment fee was 0.375% per annum of the unused commitment, which, taking into account $46.0 million of letters of credit, was $233.7 million as of December 30, 2017. The weighted average effective interest rate at December 30, 2017 on our outstanding LIBOR loans was 3.1%. The effective interest rates are based on our aggregate availability.
On January 30, 2018, in connection with the closing of the Transaction, we used a portion of the proceeds from the Transaction to repay in full our $262.5 million outstanding balance on the ABL facility. Additionally, we amended and restated the Amended and Restated Credit Agreement. The ABL facility, as amended and restated, provides us with financing in the United States, Canada, the United Kingdom, Luxembourg and the Netherlands. Cott and its subsidiaries, Cott Holdings Inc., DSS, S&D, Aimia and Aquaterra, are borrowers under the ABL facility. The ABL facility is a revolving facility of up to $250.0 million with a maturity date of August 3, 2021. JPMorgan Chase Bank, N.A. serves as administrative agent and administrative collateral agent and JPMorgan Chase Bank, N.A., London Branch serves as U.K. security trustee. Availability under the ABL facility is dependent on a borrowing base calculated as a percentage of the value of eligible inventory, accounts receivable and property, plant and equipment in the manner set forth in the credit agreement. Subject to certain conditions, the ABL facility may be increased up to an additional $100.0 million at our option if lenders agree to increase their commitments. The debt under the ABL facility is guaranteed by most of our U.S., Canadian, U.K. and Luxembourg subsidiaries and certain of our Dutch subsidiaries.
5.500% Senior Notes due in 2025
On March 22, 2017, we issued $750.0 million of our 2025 Notes to qualified purchasers in a private placement offering under Rule 144A under the Securities Act, and outside the United States to non-U.S. purchasers pursuant to Regulation S under the Securities Act and other applicable laws. The 2025 Notes were issued by our wholly-owned subsidiary Cott Holdings Inc., and most of our U.S., Canadian, U.K., Luxembourg and Dutch subsidiaries guarantee the 2025 Notes. The 2025 Notes will mature on April 1, 2025 and interest is payable semi-annually on April 1st and October 1st of each year commencing on October 1, 2017. The proceeds of the 2025 Notes were used to redeem in full the 2020 Notes, redeem $100.0 million aggregate principal amount of our DSS Notes and to pay related fees and expenses.
We incurred $11.7 million of financing fees in connection with the issuance of the 2025 Notes. The financing fees are being amortized using the effective interest method over an eight-year period, which represents the term to maturity of the 2025 Notes.
5.500% Senior Notes due in 2024
In June 2016, we issued €450.0 million (U.S. $539.1 million at the exchange rate in effect on December 30, 2017) of our 2024 Notes to qualified purchasers in a private placement offering under Rule 144A and Regulation S under the Securities Act and other applicable laws. The 2024 Notes were initially issued by our wholly-owned subsidiary Cott Finance Corporation. In connection with the closing of the Eden Acquisition, we assumed all of the obligations of Cott Finance Corporation under the 2024 Notes, and most of our U.S., Canadian, U.K. Luxembourg and Dutch subsidiaries that are currently obligors under the 2022 Notes and the 2020 Notes entered into a supplemental indenture to guarantee the 2024 Notes. The 2024 Notes will mature on July 1, 2024 and interest is payable semi-annually on January 1st and July 1st of each year commencing on January 1, 2017. The proceeds of the 2024 Notes were used to fund a portion of the purchase price of the Eden Acquisition and to pay related fees and expenses.
We incurred approximately $11.3 million of financing fees for the issuance of the 2024 Notes and $11.0 million of bridge financing commitment fees and professional fees in connection with the Eden Acquisition. The financing fees are being amortized using the effective interest method over an eight-year period, which represents the term to maturity of the 2024 Notes. The bridge financing commitment fees and professional fees were recorded in SG&A expenses for the year ended December 31, 2016 in our Consolidated Statement of Operations.
5.375% Senior Notes due in 2022
In June 2014, we issued $525.0 million of 5.375% senior notes due 2022. The issuer of the notes was our wholly-owned U.S. subsidiary Cott Beverages Inc. (“CBI”), and we and most of our U.S., Canadian and U.K. subsidiaries guaranteed the obligations.
We incurred $9.6 million of financing fees in connection with the issuance of the 2022 Notes. The financing fees were being amortized using the effective interest method over an eight-year period, which represented the term to maturity of the 2022 Notes.
52
Table of Contents
On January 30, 2018, in connection with the closing of the Transaction, we used a portion of the proceeds from the Transaction to redeem in full the 2022 Notes. The redemption of the 2022 Notes included $21.2 million in premium payments and $2.2 million in accrued interest.
10.00% Senior Notes due in 2021
In August 2013, DSS (formerly DS Waters of America, Inc.) issued $350.0 million of 10.00% senior secured notes. In connection with the acquisition of DSS, our wholly-owned U.S. subsidiary CBI, and we and most of our U.S., Canadian and U.K. subsidiaries became guarantors of the obligations.
The DSS Notes were recorded at their fair value of $406.0 million as part of the acquisition of DSS. The difference between the fair value and the principal amount of $350.0 million was being amortized as a component of interest expense over the remaining contractual term of the DSS Notes. We incurred approximately $26.5 million of consent solicitation fees and bridge financing commitment fees.
On May 5, 2017, we used a portion of the proceeds from the issuance of the 2025 Notes to redeem $100.0 million in aggregate principal amount of the DSS Notes. The partial redemption of the DSS Notes included $7.7 million in premium payments, accrued interest of $1.8 million and the write-off of $9.2 million of unamortized premium.
On January 30, 2018, in connection with the closing of the Transaction, we used a portion of the proceeds from the Transaction to redeem all of the remaining $250.0 million aggregate principal amount of the DSS Notes. The redemption of the 2022 Notes included $12.5 million in premium payments, and $10.3 million in accrued interest.
6.75% Senior Notes due in 2020
In December 2014, we issued $625.0 million of 6.75% senior notes due 2020. The issuer of the notes was our wholly-owned U.S. subsidiary CBI, and we and most of our U.S., Canadian and U.K. subsidiaries guaranteed the obligations.
We incurred $14.4 million of financing fees in connection with the issuance of the 2020 Notes. The financing fees were being amortized using the effective interest method over a five-year period, which represented the term to maturity of the 2020 Notes.
On April 5, 2017 and March 22, 2017, we used a portion of the proceeds from the issuance of the 2025 Notes to purchase $422.7 million and $202.3 million in aggregate principal amount of the 2020 Notes. The redemption of the 2020 Notes included $14.3 million and $7.1 million in premium payments, accrued interest of $7.4 million and $3.1 million, the write-off of $5.8 million and $2.9 million in deferred financing fees, and other costs of $0.1 million.
GE Term Loan
In 2008, we entered into a capital lease finance arrangement with GE Capital for the lease of equipment. In 2013, we purchased the equipment subject to the lease for an aggregate purchase price of $10.7 million, with the financing for such purchase provided by GE Capital at 5.23% interest.
On January 30, 2018, in connection with the closing of the Transaction, we used a portion of the proceeds from the Transaction to pay the remaining $1.9 million outstanding balance of the GE Term Loan.
Credit Ratings and Covenant Compliance
Credit Ratings
Our objective is to maintain credit ratings that provide us with ready access to global capital and credit markets at favorable interest rates.
53
Table of Contents
As of December 30, 2017, the Company’s credit ratings were as follows:
| Credit Ratings | ||||
| Moody’s Rating | Standard and Poor’s | |||
| Corporate credit rating |
B1 | B | ||
| 2024 Notes |
B2 | B | ||
| 2025 Notes |
B2 | B | ||
| Outlook |
Stable | Positive | ||
On January 30, 2018, in connection with the closing of the Transaction, Moody’s upgraded its rating on our senior unsecured notes to ‘B1’ from ‘B2’.
Any downgrade of our credit ratings by either Moody’s or S&P could increase our future borrowing costs or impair our ability to access capital markets on terms commercially acceptable to us or at all.
Covenant Compliance
Indentures governing our outstanding notes
Under the indentures governing our outstanding notes, we are subject to a number of covenants, including covenants that limit our and certain of our subsidiaries’ ability, subject to certain exceptions and qualifications, to (i) pay dividends or make distributions, repurchase equity securities, prepay subordinated debt or make certain investments, (ii) incur additional debt or issue certain disqualified stock or preferred stock, (iii) create or incur liens on assets securing indebtedness, (iv) merge or consolidate with another company or sell all or substantially all of our assets taken as a whole, (v) enter into transactions with affiliates and (vi) sell assets. The covenants are substantially similar across the series of notes. As of December 30, 2017, we were in compliance with all of the covenants under each series of notes. There have been no amendments to any such covenants of our outstanding notes since the date of their issuance or assumption, as applicable.
ABL Facility
Under the credit agreement governing the ABL facility, Cott and its restricted subsidiaries are subject to a number of business and financial covenants, including a minimum fixed charge coverage ratio, which measures our ability to cover financing expenses. As of December 30, 2017, the minimum fixed charge coverage ratio of 1.0 to 1.0 was effective if and when aggregate availability was less than the greater of 10% of the lenders’ commitments under the ABL facility or $37.5 million. If excess availability was less than the greater of 10% of the aggregate availability under the ABL facility or $37.5 million, the lenders would take dominion over the cash and would apply excess cash to reduce amounts owing under the facility. We were in compliance with all of the applicable covenants under the ABL facility as of December 30, 2017.
On January 30, 2018, in connection with the closing of the Transaction, we amended and restated the Amended and Restated Credit Agreement, dated as of August 3, 2016, as amended, that governed our prior ABL facility. Under the credit agreement governing the ABL facility, as amended and restated, Cott and its restricted subsidiaries are subject to a number of business and financial covenants, including a minimum fixed charge coverage ratio, which measures our ability to cover financing expenses. The minimum fixed charge coverage ratio of 1.0 to 1.0 is effective if and when there exists an event of default or aggregate availability is less than the greater of 10% of the Line Cap under the ABL facility or $22.5 million. Line Cap is defined as an amount equal to the lesser of the lenders’ commitments or the borrowing base at such time. If an event of default exists or the excess availability is less than the greater of 10% of the aggregate availability under the ABL facility or $22.5 million, the lenders will take dominion over the cash and will apply excess cash to reduce amounts owing under the facility.
Issuer Purchases of Equity Securities
During the fourth quarter of 2017, we did not repurchase any of our common shares.
Tax Withholding
During 2017, 277,338 shares (2016—408,744; 2015—91,934) of our previously-issued common shares were withheld from delivery to our employees to satisfy their tax obligations related to share-based awards.
54
Table of Contents
Capital structure
Since December 31, 2016, equity has increased by $11.9 million. The increase was due primarily to share-based compensation costs of $22.9 million and currency translation adjustments of $27.2 million, partially offset by common share dividend payments of $33.7 million and distributions to non-controlling interests of $7.7 million.
Dividend payments
Common Share Dividend
The board of directors declared a quarterly dividend of $0.06 per common share in each quarter during 2017 and 2016 for an aggregate dividend payment of approximately $33.7 million and $31.7 million, respectively. Cott intends to pay a regular quarterly dividend on its common shares subject to, among other things, the best interests of its shareowners, Cott’s results of operations, cash balances and future cash requirements, financial condition, statutory regulations and covenants set forth in the ABL facility and indentures governing our outstanding notes as well as other factors that the board of directors may deem relevant from time to time.
Preferred Share Dividend
The terms of the Preferred Shares required us to pay a quarterly dividend to the holders of the Preferred Shares. Prior to their redemption in June 2015, we paid approximately $5.9 million in dividends to the holders of record of the Preferred Shares.
Equity-Based Plans
In 2015, with the approval of our shareowners, we (i) amended the Amended and Restated Cott Corporation Equity Incentive Plan (the “Equity Incentive Plan”) to, among other things, increase the number of shares that may be issued under the Equity Incentive Plan, and (ii) adopted the Cott Corporation Employee Share Purchase Plan (the “ESPP”) to provide eligible employees of the Company and its designated subsidiaries with an opportunity to acquire an ownership interest in the Company through the purchase of Company common shares via payroll deductions.
We also adopted the Cott Corporation Dividend Reinvestment Plan in 2015, which allows eligible shareowners to acquire additional common shares via reinvestment of cash dividends paid by us.
Recent Accounting Pronouncements
Refer to Note 1 in the Consolidated Financial Statements for a summary of recently adopted and recently issued accounting standards and their related effects or anticipated effects on our consolidated results of operations and financial condition.
| ITEM 7A. | QUANTITATIVE AND QUALITATIVE DISCLOSURES ABOUT MARKET RISK |
We do not trade market risk sensitive instruments.
Currency Exchange Rate Risk
We are exposed to changes in foreign currency exchange rates. Operations outside of the United States accounted for 24.7% of 2017 revenue and 20.0% of 2016 revenue, and are concentrated principally in the United Kingdom, Canada, and Europe. We translate the revenues and expenses of our foreign operations using average exchange rates prevailing during the period. The effect of a 10% change in the average foreign currency exchange rates among the U.S. dollar versus the Canadian dollar, pound sterling and Euro for the year ended December 30, 2017, would result in our revenues in 2017 changing by $56.1 million and our gross profit in 2017 changing by $32.3 million. This change would be material to our cash flows and our results of operations.
Debt Obligations and Interest Rates
We have exposure to interest rate risk from the outstanding principal amounts of our short-term borrowings on our ABL facility. Interest rates on our long-term debt are fixed and not subject to interest rate volatility. Our ABL facility is vulnerable to fluctuations in the U.S. short-term base rate and the LIBOR rate. Because we had $220.3 million of ABL borrowings outstanding as of December 30, 2017, a 100 basis point increase in the current per annum interest rate for our ABL facility (excluding the $46.0 million of outstanding letters of credit) would result in additional interest expense of approximately $2.2 million. The weighted average interest rate of our outstanding ABL facility at December 30, 2017 was 3.1%.
55
Table of Contents
We regularly review the structure of our indebtedness and consider changes to the proportion of variable versus fixed rate debt through refinancing, interest rate swaps or other measures in response to the changing economic environment. Historically, we have not used derivative instruments to manage interest rate risk. If we use and fail to manage these derivative instruments successfully, or if we are unable to refinance our indebtedness or otherwise increase our debt capacity in response to changes in the marketplace, the expense associated with debt service could increase. This would negatively affect our financial condition and profitability.
The information below summarizes our market risks associated with long-term debt obligations as of December 30, 2017. The table presents principal cash flows and related interest rates by year. Interest rates disclosed represent the actual weighted average rates as of December 30, 2017.
| Debt Obligations | ||||||||
| (in millions of U.S. dollars, except percentage amounts) |
Outstanding debt balance |
Weighted average interest rate |
||||||
| Debt maturing in: |
||||||||
| 2018 |
$ | 225.4 | 3.1 | % | ||||
| 2019 |
1.8 | 7.0 | % | |||||
| 2020 |
1.0 | 7.3 | % | |||||
| 2021 1 |
250.6 | 10.0 | % | |||||
| 2022 1 |
525.4 | 5.4 | % | |||||
| Thereafter |
1,289.4 | 5.6 | % | |||||
|
|
|
|||||||
| Total |
$ | 2,293.6 | ||||||
|
|
|
|||||||
| 1. | Includes $525.0 million and $250.0 million aggregate principal amount of our 2022 Notes and DSS Notes. On January 30, 2018, in connection with the closing of the Transaction, we used a portion of the proceeds to redeem or repay these amounts. |
Commodity Price Risk
The competitive marketplace in which we operate may limit our ability to recover increased costs through higher prices. As a result, we are subject to market risk with respect to commodity price fluctuations principally related to our purchases of resin for PET, HDPE and polycarbonate bottles, tea, and green coffee. We manage some of our exposure to this risk through the use of supplier pricing agreements, which enable us to fix the purchase prices for certain commodities, as well as derivative financial instruments. We estimate that a 10% increase in the market prices of these commodities over the current market prices would cumulatively increase our cost of sales during the next 12 months by approximately $36.5 million. This change would be material to our cash flows and our results of operations.
| ITEM 8. | FINANCIAL STATEMENTS AND SUPPLEMENTARY DATA |
See “Index to Consolidated Financial Statements.”
| ITEM 9. | CHANGES IN AND DISAGREEMENTS WITH ACCOUNTANTS ON ACCOUNTING AND FINANCIAL DISCLOSURE |
None.
| ITEM 9A. | CONTROLS AND PROCEDURES |
Disclosure Controls and Procedures
Our management, under the supervision and with the participation of our Chief Executive Officer and Chief Financial Officer, carried out an evaluation of the effectiveness of the design and operation of our disclosure controls and procedures as of December 30, 2017 (the “Evaluation”). Based upon the Evaluation, our Chief Executive Officer and Chief Financial Officer concluded that our disclosure controls and procedures (as defined in Rule 13a-15(e) of the Securities Exchange Act of 1934 (the “Exchange Act”)) are effective.
56
Table of Contents
Management’s Report on Internal Control Over Financial Reporting
Our management is responsible for establishing and maintaining adequate internal control over financial reporting as defined in Exchange Act Rules 13a-15(f) and 15d-15(f). Management evaluates the effectiveness of our internal control over financial reporting using the criteria set forth by the Committee of Sponsoring Organizations of the Treadway Commission in Internal Control—Integrated Framework (2013). Management, under the supervision and with the participation of our Chief Executive Officer and Chief Financial Officer, assessed the effectiveness of our internal control over financial reporting as of December 30, 2017, and concluded that it was effective as of December 30, 2017.
The effectiveness of our internal control over financial reporting as of December 30, 2017 has been audited by PricewaterhouseCoopers LLP, our independent registered certified public accounting firm, who also audited our Consolidated Financial Statements included in this Annual Report on Form 10-K, as stated in their report which appears herein.
Changes in Internal Control Over Financial Reporting
There was no change in our internal control over financial reporting during the quarter ended December 30, 2017 that has materially affected, or is reasonably likely to materially affect, our internal control over financial reporting.
| ITEM 9B. | OTHER INFORMATION |
None.
57
Table of Contents
| ITEM 10. | DIRECTORS, EXECUTIVE OFFICERS AND CORPORATE GOVERNANCE |
The information required by this item regarding directors is incorporated by reference to, and will be contained in, the “Election of Directors” section of our definitive proxy circular for the 2018 Annual and Special Meeting of Shareowners, which is expected to be filed within 120 days after December 30, 2017 (the “2018 Proxy Circular”). The information required by this item regarding audit committee financial expert disclosure is incorporated by reference to, and will be contained in, the “Corporate Governance” section of our 2018 Proxy Circular. The information required by this item regarding executive officers appears as the Supplemental Item in Part I. There have been no material changes to the procedures by which shareholders may recommend nominees to our board of directors.
The Audit Committee of our board of directors is an “audit committee” for the purposes of Section 3(a)(58)(A) of the Securities Exchange Act of 1934, as amended. The Audit Committee charter is posted on our website at www.cott.com. The members of the Audit Committee are Graham Savage (Chairman), Gregory Monahan and Kenneth C. Keller Jr. As required by the NYSE rules, the board has determined that each member of the Audit Committee is independent, financially literate and that Mr. Savage qualifies as an “audit committee financial expert” within the meaning of the rules of the U.S. Securities and Exchange Commission.
All of our directors, officers and employees must comply with our Code of Business Conduct and Ethics. In addition, our Chief Executive Officer, Chief Financial Officer and principal accounting officer and certain other employees have a further obligation to comply with our Code of Ethics for Senior Officers. Our Code of Business Conduct and Ethics and our Code of Ethics for Senior Officers are posted on our website, www.cott.com, and we intend to comply with obligations to disclose any amendment to, or waiver of, provisions of these codes by posting such information on our website.
Section 16(a) Beneficial ownership reporting compliance
The information required by this item is incorporated by reference to, and will be contained in, the “Section 16(a) Beneficial Ownership Reporting Compliance” section of our 2018 Proxy Circular.
| ITEM 11. | EXECUTIVE COMPENSATION |
The information required by this item is incorporated by reference to, and will be contained in, the “Compensation of Executive Officers” section of our 2018 Proxy Circular.
| ITEM 12. | SECURITY OWNERSHIP OF CERTAIN BENEFICIAL OWNERS AND MANAGEMENT AND RELATED SHAREOWNER MATTERS |
The information required by this item is incorporated by reference to, and will be contained in, the “Principal Shareowners,” “Security Ownership of Directors and Management” and “Equity Compensation Plan Information” sections of our 2018 Proxy Circular.
| ITEM 13. | CERTAIN RELATIONSHIPS AND RELATED TRANSACTIONS, AND DIRECTOR INDEPENDENCE |
The information required by this item is incorporated by reference to, and will be contained in, the “Certain Relationships and Related Transactions” section of our 2018 Proxy Circular.
| ITEM 14. | PRINCIPAL ACCOUNTANT FEES AND SERVICES |
The information required by this item is incorporated by reference to, and will be contained in, the “Independent Registered Public Accounting Firm” section of our 2018 Proxy Circular.
58
Table of Contents
| ITEM 15. | EXHIBITS AND FINANCIAL STATEMENT SCHEDULES |
| (a) | The documents filed as part of this report are as follows: |
1. Financial Statements
The consolidated financial statements and accompanying report of a registered independent public accounting firm are listed in the “Index to Consolidated Financial Statements” and are filed as part of this report.
2. Financial Statement Schedule
3. Exhibits
59
Table of Contents
60
Table of Contents
61
Table of Contents
62
Table of Contents
| 1. | Confidential treatment has been granted for portions of this exhibit. |
| 2. | Indicates a management contract or compensatory plan. |
| 3. | Furnished herewith. |
All other schedules called for by the applicable SEC accounting regulations are not required under the related instructions or are inapplicable and, therefore, have been omitted.
| ITEM 16. | FORM 10-K SUMMARY |
Not applicable.
63
Table of Contents
Signatures
Pursuant to the requirements of Section 13 or 15(d) of the Securities Exchange Act of 1934, the Registrant has duly caused this report to be signed on its behalf by the undersigned, thereunto duly authorized.
Cott Corporation
| /s/ JERRY FOWDEN |
| Jerry Fowden |
| Chief Executive Officer |
| Date: February 28, 2018 |
Pursuant to the requirements of the Securities Exchange Act of 1934, this report has been signed below by the following persons on behalf of the registrant and in the capacities and on the dates indicated:
| /S/ JERRY FOWDEN Jerry Fowden Chief Executive Officer, Director (Principal Executive Officer) Date: February 28, 2018 |
/S/ BETTY JANE HESS Betty Jane Hess Director Date: February 28, 2018 | |||
| /S/ JAY WELLS Jay Wells Chief Financial Officer (Principal Financial Officer) Date: February 28, 2018 |
/S/GREGORY MONAHAN Gregory Monahan Director Date: February 28, 2018 | |||
| /S/ JASON AUSHER Jason Ausher Chief Accounting Officer (Principal Accounting Officer) Date: February 28, 2018 |
/S/ MARIO PILOZZI Mario Pilozzi Director Date: February 28, 2018 | |||
| /S/ DAVID T. GIBBONS David T. Gibbons Chairman, Director Date: February 28, 2018 |
/S/ ANDREW PROZES Andrew Prozes Director Date: February 28, 2018 | |||
| /S/ KENNETH C. KELLER JR Kenneth C. Keller Jr Director Date: February 28, 2018 |
/S/ GRAHAM SAVAGE Graham Savage Director Date: February 28, 2018 | |||
| /S/ STEPHEN H. HALPERIN Stephen H. Halperin Director Date: February 28, 2018 |
/S/ ERIC ROSENFELD Eric Rosenfeld Director Date: February 28, 2018 | |||
64
Table of Contents
COTT CORPORATION
INDEX TO CONSOLIDATED FINANCIAL STATEMENTS
F-1
Table of Contents
Report of Independent Registered Public Accounting Firm
To the Board of Directors and Shareholders of Cott Corporation
Opinions on the Financial Statements and Internal Control over Financial Reporting
We have audited the accompanying consolidated balance sheets of Cott Corporation and its subsidiaries as of December 30, 2017 and December 31, 2016, and the related consolidated statements of operations, comprehensive income (loss), equity and cash flows for each of the three years in the period ended December 30, 2017, including the related notes and financial statement schedule listed in the index appearing under Item 15(a)(2) (collectively referred to as the “consolidated financial statements”). We also have audited the Company’s internal control over financial reporting as of December 30, 2017, based on criteria established in Internal Control—Integrated Framework (2013) issued by the Committee of Sponsoring Organizations of the Treadway Commission (COSO).
In our opinion, the consolidated financial statements referred to above present fairly, in all material respects, the financial position of the Company as of December 30, 2017 and December 31, 2016, and the results of its operations and its cash flows for each of the three years in the period ended December 30, 2017 in conformity with accounting principles generally accepted in the United States of America. Also in our opinion, the Company maintained, in all material respects, effective internal control over financial reporting as of December 30, 2017, based on criteria established in Internal Control—Integrated Framework (2013) issued by the COSO.
Basis for Opinions
The Company’s management is responsible for these consolidated financial statements, for maintaining effective internal control over financial reporting, and for its assessment of the effectiveness of internal control over financial reporting, included in Management’s Report on Internal Control Over Financial Reporting appearing under Item 9A. Our responsibility is to express opinions on the Company’s consolidated financial statements and on the Company’s internal control over financial reporting based on our audits. We are a public accounting firm registered with the Public Company Accounting Oversight Board (United States) (“PCAOB”) and are required to be independent with respect to the Company in accordance with the U.S. federal securities laws and the applicable rules and regulations of the Securities and Exchange Commission and the PCAOB.
We conducted our audits in accordance with the standards of the PCAOB. Those standards require that we plan and perform the audits to obtain reasonable assurance about whether the consolidated financial statements are free of material misstatement, whether due to error or fraud, and whether effective internal control over financial reporting was maintained in all material respects.
Our audits of the consolidated financial statements included performing procedures to assess the risks of material misstatement of the consolidated financial statements, whether due to error or fraud, and performing procedures that respond to those risks. Such procedures included examining, on a test basis, evidence regarding the amounts and disclosures in the consolidated financial statements. Our audits also included evaluating the accounting principles used and significant estimates made by management, as well as evaluating the overall presentation of the consolidated financial statements. Our audit of internal control over financial reporting included obtaining an understanding of internal control over financial reporting, assessing the risk that a material weakness exists, and testing and evaluating the design and operating effectiveness of internal control based on the assessed risk. Our audits also included performing such other procedures as we considered necessary in the circumstances. We believe that our audits provide a reasonable basis for our opinions.
Definition and Limitations of Internal Control over Financial Reporting
A company’s internal control over financial reporting is a process designed to provide reasonable assurance regarding the reliability of financial reporting and the preparation of financial statements for external purposes in accordance with generally accepted accounting principles. A company’s internal control over financial reporting includes those policies and procedures that (i) pertain to the maintenance of records that, in reasonable detail, accurately and fairly reflect the transactions and dispositions of the assets of the company; (ii) provide reasonable assurance that transactions are recorded as necessary to permit preparation of financial statements in accordance with generally accepted accounting principles, and that receipts and expenditures of the company are being made only in accordance with authorizations of management and directors of the company; and (iii) provide reasonable assurance regarding prevention or timely detection of unauthorized acquisition, use, or disposition of the company’s assets that could have a material effect on the financial statements.
Because of its inherent limitations, internal control over financial reporting may not prevent or detect misstatements. Also, projections of any evaluation of effectiveness to future periods are subject to the risk that controls may become inadequate because of changes in conditions, or that the degree of compliance with the policies or procedures may deteriorate.
/s/PricewaterhouseCoopers LLP
Certified Public Accountants
Tampa, Florida
February 28, 2018
We have served as the Company’s auditor since 2007.
F-2
Table of Contents
COTT CORPORATION
CONSOLIDATED STATEMENTS OF OPERATIONS
(in millions of U.S. dollars, except share and per share amounts)
| For the Year Ended | ||||||||||||
| December 30, | December 31, | January 2, | ||||||||||
| 2017 | 2016 | 2016 | ||||||||||
| Revenue, net |
$ | 2,269.7 | $ | 1,623.2 | $ | 1,187.3 | ||||||
| Cost of sales |
1,142.0 | 773.1 | 536.8 | |||||||||
|
|
|
|
|
|
|
|||||||
| Gross profit |
1,127.7 | 850.1 | 650.5 | |||||||||
| Selling, general and administrative expenses |
1,042.7 | 806.2 | 608.4 | |||||||||
| Loss on disposal of property, plant & equipment, net |
10.2 | 6.6 | 4.2 | |||||||||
| Acquisition and integration expenses |
25.9 | 27.8 | 20.0 | |||||||||
|
|
|
|
|
|
|
|||||||
| Operating income |
48.9 | 9.5 | 17.9 | |||||||||
| Other (income) expense, net |
(3.0 | ) | 5.6 | (12.8 | ) | |||||||
| Interest expense, net |
85.5 | 43.0 | 30.1 | |||||||||
|
|
|
|
|
|
|
|||||||
| (Loss) income from continuing operations before income taxes |
(33.6 | ) | (39.1 | ) | 0.6 | |||||||
| Income tax (benefit) expense |
(30.0 | ) | 21.2 | (15.1 | ) | |||||||
|
|
|
|
|
|
|
|||||||
| Net (loss) income from continuing operations |
$ | (3.6 | ) | $ | (60.3 | ) | $ | 15.7 | ||||
| Net income (loss) from discontinued operations, net of income taxes (Note 2) |
10.7 | (11.2 | ) | 4.9 | ||||||||
|
|
|
|
|
|
|
|||||||
| Net income (loss) |
$ | 7.1 | $ | (71.5 | ) | $ | 20.6 | |||||
| Less: Net income attributable to non-controlling interests - discontinued operations |
8.5 | 6.3 | 6.1 | |||||||||
| Less: Accumulated dividends on convertible preferred shares - continued operations |
— | — | 4.5 | |||||||||
| Less: Accumulated dividends on non-convertible preferred shares - continued operations |
— | — | 1.4 | |||||||||
| Less: Foreign exchange impact on redemption of preferred shares - continued operations |
— | — | 12.0 | |||||||||
|
|
|
|
|
|
|
|||||||
| Net loss attributable to Cott Corporation |
$ | (1.4 | ) | $ | (77.8 | ) | $ | (3.4 | ) | |||
|
|
|
|
|
|
|
|||||||
| Net (loss) income per common share attributable to |
||||||||||||
| Cott Corporation |
||||||||||||
| Basic: |
||||||||||||
| Continuing operations |
$ | (0.03 | ) | $ | (0.47 | ) | $ | (0.02 | ) | |||
| Discontinued operations |
$ | 0.02 | $ | (0.14 | ) | $ | (0.01 | ) | ||||
| Net income (loss) |
$ | (0.01 | ) | $ | (0.61 | ) | $ | (0.03 | ) | |||
| Diluted: |
||||||||||||
| Continuing operations |
$ | (0.03 | ) | $ | (0.47 | ) | $ | (0.02 | ) | |||
| Discontinued operations |
$ | 0.02 | $ | (0.14 | ) | $ | (0.01 | ) | ||||
| Net income (loss) |
$ | (0.01 | ) | $ | (0.61 | ) | $ | (0.03 | ) | |||
| Weighted average common shares outstanding (in thousands) |
||||||||||||
| Basic |
139,078 | 128,290 | 103,037 | |||||||||
| Diluted |
139,078 | 128,290 | 103,037 | |||||||||
| Dividends declared per common share |
$ | 0.24 | $ | 0.24 | $ | 0.24 | ||||||
The accompanying notes are an integral part of these consolidated financial statements.
F-3
Table of Contents
COTT CORPORATION
CONSOLIDATED STATEMENTS OF COMPREHENSIVE INCOME (LOSS)
(in millions of U.S. dollars)
| For the Year Ended | ||||||||||||
| December 30, | December 31, | January 2, | ||||||||||
| 2017 | 2016 | 2016 | ||||||||||
| Net income (loss) |
$ | 7.1 | $ | (71.5 | ) | $ | 20.6 | |||||
| Other comprehensive income (loss): |
||||||||||||
| Currency translation adjustment |
27.2 | (42.0 | ) | (23.0 | ) | |||||||
| Pension benefit plan, net of tax 1 |
(2.4 | ) | (4.3 | ) | 2.3 | |||||||
| Unrealized (loss) gain on derivative instruments, net of tax 2 |
(1.3 | ) | 4.6 | (4.9 | ) | |||||||
|
|
|
|
|
|
|
|||||||
| Total other comprehensive income (loss) |
23.5 | (41.7 | ) | (25.6 | ) | |||||||
|
|
|
|
|
|
|
|||||||
| Comprehensive income (loss) |
$ | 30.6 | $ | (113.2 | ) | $ | (5.0 | ) | ||||
| Less: Comprehensive income attributable to non-controlling interests |
8.5 | 6.3 | 6.4 | |||||||||
| Less: Accumulated dividends on convertible preferred shares |
— | — | 4.5 | |||||||||
| Less: Accumulated dividends on non-convertible preferred shares |
— | — | 1.4 | |||||||||
| Less: Foreign exchange impact on redemption of preferred shares |
— | — | 12.0 | |||||||||
|
|
|
|
|
|
|
|||||||
| Comprehensive income (loss) attributed to Cott Corporation |
$ | 22.1 | $ | (119.5 | ) | $ | (29.3 | ) | ||||
|
|
|
|
|
|
|
|||||||
| 1. | Net of the effect of a $0.6 million tax benefit, $0.3 million tax benefit and $1.0 million tax expense for the years ended December 30, 2017, December 31, 2016 and January 2, 2016, respectively. |
| 2. | Net of the effect of a $2.5 million tax benefit for the year ended January 2, 2016. |
The accompanying notes are an integral part of these consolidated financial statements.
F-4
Table of Contents
COTT CORPORATION
(in millions of U.S. dollars, except share amounts)
| December 30, | December 31, | |||||||
| 2017 | 2016 | |||||||
| ASSETS |
||||||||
| Current assets |
||||||||
| Cash & cash equivalents |
$ | 91.9 | $ | 78.1 | ||||
| Accounts receivable, net of allowance of $7.8 ($6.3 as of December 31, 2016) |
285.0 | 276.7 | ||||||
| Inventories |
127.6 | 124.6 | ||||||
| Prepaid expenses and other current assets |
20.7 | 22.1 | ||||||
| Current assets of discontinued operations |
408.7 | 351.7 | ||||||
|
|
|
|
|
|||||
| Total current assets |
933.9 | 853.2 | ||||||
| Property, plant & equipment, net |
584.2 | 581.8 | ||||||
| Goodwill |
1,104.7 | 1,048.3 | ||||||
| Intangible assets, net |
751.1 | 759.0 | ||||||
| Deferred tax assets |
2.3 | — | ||||||
| Other long-term assets, net |
39.4 | 30.5 | ||||||
| Long-term assets of discontinued operations |
677.5 | 666.9 | ||||||
|
|
|
|
|
|||||
| Total assets |
$ | 4,093.1 | $ | 3,939.7 | ||||
|
|
|
|
|
|||||
| LIABILITIES AND EQUITY |
||||||||
| Current liabilities |
||||||||
| Short-term borrowings required to be repaid or extinguished as part of divestiture |
$ | 220.3 | $ | 207.0 | ||||
| Current maturities of long-term debt |
5.1 | 5.2 | ||||||
| Accounts payable and accrued liabilities |
412.9 | 368.0 | ||||||
| Current liabilities of discontinued operations |
295.1 | 229.9 | ||||||
|
|
|
|
|
|||||
| Total current liabilities |
933.4 | 810.1 | ||||||
| Long-term debt |
1,542.6 | 851.4 | ||||||
| Debt required to be repaid or extinguished as part of divestiture |
519.0 | 1,135.4 | ||||||
| Deferred tax liabilities |
98.4 | 155.0 | ||||||
| Other long-term liabilities |
68.2 | 75.4 | ||||||
| Long-term liabilities of discontinued operations |
45.8 | 38.6 | ||||||
|
|
|
|
|
|||||
| Total liabilities |
3,207.4 | 3,065.9 | ||||||
| Commitments and contingencies - Note 18 |
||||||||
| Equity |
||||||||
| Common shares, no par - 139,488,805 shares issued (December 31, 2016 - 138,591,100 shares issued) |
917.1 | 909.3 | ||||||
| Additional paid-in-capital |
69.1 | 54.2 | ||||||
| (Accumulated deficit) retained earnings |
(12.2 | ) | 22.9 | |||||
| Accumulated other comprehensive loss |
(94.4 | ) | (117.9 | ) | ||||
|
|
|
|
|
|||||
| Total Cott Corporation equity |
879.6 | 868.5 | ||||||
| Non-controlling interests |
6.1 | 5.3 | ||||||
|
|
|
|
|
|||||
| Total equity |
885.7 | 873.8 | ||||||
|
|
|
|
|
|||||
| Total liabilities and equity |
$ | 4,093.1 | $ | 3,939.7 | ||||
|
|
|
|
|
|||||
Approved by the Board of Directors:
/s/ Graham Savage
Director
The accompanying notes are an integral part of these consolidated financial statements.
F-5
Table of Contents
COTT CORPORATION
CONSOLIDATED STATEMENTS OF CASH FLOWS
(in millions of U.S. dollars)
| For the Year Ended | ||||||||||||
| December 30, | December 31, | January 2, | ||||||||||
| 2017 | 2016 | 2016 | ||||||||||
| Cash flows from operating activities of continuing operations: |
||||||||||||
| Net income (loss) |
$ | 7.1 | $ | (71.5 | ) | $ | 20.6 | |||||
| Net income (loss) from discontinued operations, net of income taxes |
10.7 | (11.2 | ) | 4.9 | ||||||||
|
|
|
|
|
|
|
|||||||
| Net (loss) income from continuing operations |
(3.6 | ) | (60.3 | ) | 15.7 | |||||||
| Adjustments to reconcile net (loss) income from continuing operations to cash flows provided by operating activities: |
||||||||||||
| Depreciation & amortization |
188.6 | 151.1 | 128.3 | |||||||||
| Amortization of financing fees |
1.9 | 0.5 | — | |||||||||
| Amortization of senior notes premium |
(5.1 | ) | (5.9 | ) | (5.6 | ) | ||||||
| Share-based compensation expense |
17.5 | 7.0 | 7.6 | |||||||||
| (Benefit) provision for deferred income taxes |
(33.9 | ) | 19.9 | (22.0 | ) | |||||||
| Unrealized commodity hedging (gain) loss, net |
(0.3 | ) | 9.7 | — | ||||||||
| Gain on extinguishment of debt, net |
(1.5 | ) | — | — | ||||||||
| Loss on disposal of property, plant & equipment, net |
10.2 | 6.6 | 4.2 | |||||||||
| Other non-cash items |
1.9 | 9.7 | (9.1 | ) | ||||||||
| Change in operating assets and liabilities, net of acquisitions: |
||||||||||||
| Accounts receivable |
(8.0 | ) | (3.1 | ) | (3.8 | ) | ||||||
| Inventories |
(2.0 | ) | 12.9 | 1.0 | ||||||||
| Prepaid expenses and other current assets |
0.9 | (4.6 | ) | 1.7 | ||||||||
| Other assets |
2.1 | (1.3 | ) | (3.3 | ) | |||||||
| Accounts payable and accrued liabilities and other liabilities |
7.3 | 3.3 | 16.4 | |||||||||
|
|
|
|
|
|
|
|||||||
| Net cash provided by operating activities from continuing operations |
176.0 | 145.5 | 131.1 | |||||||||
|
|
|
|
|
|
|
|||||||
| Cash flows from investing activities of continuing operations: |
||||||||||||
| Acquisitions, net of cash received |
(35.5 | ) | (959.4 | ) | (24.0 | ) | ||||||
| Additions to property, plant & equipment |
(121.3 | ) | (95.1 | ) | (69.6 | ) | ||||||
| Additions to intangible assets |
(5.6 | ) | (4.2 | ) | (3.0 | ) | ||||||
| Proceeds from sale of property, plant & equipment and sale-leaseback |
7.8 | 5.7 | 30.0 | |||||||||
| Other investing activities |
1.0 | 0.4 | — | |||||||||
|
|
|
|
|
|
|
|||||||
| Net cash used in investing activities from continuing operations |
(153.6 | ) | (1,052.6 | ) | (66.6 | ) | ||||||
|
|
|
|
|
|
|
|||||||
| Cash flows from financing activities of continuing operations: |
||||||||||||
| Payments of long-term debt |
(101.5 | ) | (0.5 | ) | — | |||||||
| Issuance of long-term debt |
750.0 | 498.7 | — | |||||||||
| Premiums and costs paid upon extinguishment of long-term debt |
(7.7 | ) | — | — | ||||||||
| Issuance of common shares |
3.5 | 366.8 | 143.1 | |||||||||
| Financing fees |
(11.1 | ) | (10.1 | ) | — | |||||||
| Preferred shares repurchased and cancelled |
— | — | (148.8 | ) | ||||||||
| Common shares repurchased and cancelled |
(3.8 | ) | (5.7 | ) | (0.8 | ) | ||||||
| Dividends paid to common and preferred shareholders |
(33.4 | ) | (31.4 | ) | (31.0 | ) | ||||||
| Payment of contingent consideration for acquisitions |
— | (10.8 | ) | — | ||||||||
| Other financing activities |
0.5 | 0.1 | — | |||||||||
|
|
|
|
|
|
|
|||||||
| Net cash provided by (used in) financing activities from continuing operations |
596.5 | 807.1 | (37.5 | ) | ||||||||
|
|
|
|
|
|
|
|||||||
| Cash flows from discontinued operations: |
||||||||||||
| Operating activities of discontinued operations |
102.7 | 124.3 | 123.5 | |||||||||
| Investing activities of discontinued operations |
(44.7 | ) | (44.0 | ) | (33.1 | ) | ||||||
| Financing activities of discontinued operations |
(643.4 | ) | 68.6 | (122.6 | ) | |||||||
|
|
|
|
|
|
|
|||||||
| Net cash (used in) provided by discontinued operations |
(585.4 | ) | 148.9 | (32.2 | ) | |||||||
|
|
|
|
|
|
|
|||||||
| Effect of exchange rate changes on cash |
6.3 | (7.9 | ) | (3.9 | ) | |||||||
|
|
|
|
|
|
|
|||||||
| Net increase (decrease) in cash & cash equivalents and restricted cash |
39.8 | 41.0 | (9.1 | ) | ||||||||
| Cash & cash equivalents and restricted cash, beginning of period |
118.1 | 77.1 | 86.2 | |||||||||
|
|
|
|
|
|
|
|||||||
| Cash & cash equivalents, end of period |
157.9 | 118.1 | 77.1 | |||||||||
| Cash & cash equivalents of discontinued operations, end of period |
66.0 | 40.0 | 55.3 | |||||||||
|
|
|
|
|
|
|
|||||||
| Cash & cash equivalents from continuing operations, end of period |
$ | 91.9 | $ | 78.1 | $ | 21.8 | ||||||
|
|
|
|
|
|
|
|||||||
| Supplemental Non-cash Investing and Financing Activities: |
||||||||||||
| Additions to property, plant & equipment through accounts payable and accrued liabilities and other liabilities |
$ | 10.9 | $ | 3.1 | $ | 0.7 | ||||||
| Accrued deferred financing fees |
0.6 | 0.5 | — | |||||||||
| Dividends payable issued through accounts payable and other accrued liabilities |
0.3 | 0.3 | — | |||||||||
| Supplemental Disclosures of Cash Flow Information: |
||||||||||||
| Cash paid for interest |
$ | 81.6 | $ | 48.5 | $ | 34.9 | ||||||
| Cash paid for income taxes, net |
1.9 | 3.3 | 2.5 | |||||||||
The accompanying notes are an integral part of these consolidated financial statements.
F-6
Table of Contents
COTT CORPORATION
CONSOLIDATED STATEMENTS OF EQUITY
(in millions of U.S. dollars, except share amounts)
| Cott Corporation Equity | ||||||||||||||||||||||||||||
| Number of | Retained | Accumulated | ||||||||||||||||||||||||||
| Common | Additional | Earnings | Other | Non- | ||||||||||||||||||||||||
| Shares | Common | Paid-in- | (Accumulated | Comprehensive | Controlling | Total | ||||||||||||||||||||||
| (In thousands) | Shares | Capital | deficit) | Loss | Interests | Equity | ||||||||||||||||||||||
| Balance at January 3, 2015 |
93,073 | $ | 388.3 | $ | 46.6 | $ | 158.1 | $ | (51.0 | ) | $ | 6.9 | $ | 548.9 | ||||||||||||||
| Common shares repurchased and cancelled |
(92 | ) | (0.8 | ) | — | — | — | — | (0.8 | ) | ||||||||||||||||||
| Common shares issued - Equity Incentive Plan |
488 | 2.5 | (2.0 | ) | — | — | — | 0.5 | ||||||||||||||||||||
| Common shares issued - Equity issuance |
16,215 | 144.6 | — | — | — | — | 144.6 | |||||||||||||||||||||
| Common shares issued - Dividend reinvestment plan |
11 | 0.1 | — | — | — | — | 0.1 | |||||||||||||||||||||
| Share-based compensation |
— | — | 10.3 | — | — | — | 10.3 | |||||||||||||||||||||
| Common shares dividend |
— | — | — | (25.1 | ) | — | — | (25.1 | ) | |||||||||||||||||||
| Redemption of preferred shares |
— | — | — | (12.0 | ) | — | — | (12.0 | ) | |||||||||||||||||||
| Distributions to non-controlling interests |
— | — | — | — | — | (8.5 | ) | (8.5 | ) | |||||||||||||||||||
| Purchase of subsidiary shares from non-controlling interest |
— | — | (3.7 | ) | — | 0.7 | 1.8 | (1.2 | ) | |||||||||||||||||||
| Comprehensive (loss) income |
||||||||||||||||||||||||||||
| Currency translation adjustment |
— | — | — | — | (23.3 | ) | 0.3 | (23.0 | ) | |||||||||||||||||||
| Pension benefit plan, net of tax |
— | — | — | — | 2.3 | — | 2.3 | |||||||||||||||||||||
| Unrealized loss on derivative instruments, net of tax |
— | — | — | — | (4.9 | ) | — | (4.9 | ) | |||||||||||||||||||
| Preferred shares dividend |
— | — | — | (5.9 | ) | — | — | (5.9 | ) | |||||||||||||||||||
| Net income |
— | — | — | 14.5 | — | 6.1 | 20.6 | |||||||||||||||||||||
|
|
|
|
|
|
|
|
|
|
|
|
|
|
|
|||||||||||||||
| Balance at January 2, 2016 |
109,695 | $ | 534.7 | $ | 51.2 | $ | 129.6 | $ | (76.2 | ) | $ | 6.6 | $ | 645.9 | ||||||||||||||
|
|
|
|
|
|
|
|
|
|
|
|
|
|
|
|||||||||||||||
| Cumulative effect adjustment |
— | — | — | 2.8 | — | — | 2.8 | |||||||||||||||||||||
| Common shares repurchased and cancelled |
(409 | ) | (5.7 | ) | — | — | — | — | (5.7 | ) | ||||||||||||||||||
| Common shares issued - Equity Incentive Plan |
1,327 | 15.1 | (6.2 | ) | — | — | — | 8.9 | ||||||||||||||||||||
| Common shares issued - Equity issuance |
27,853 | 363.6 | — | — | — | — | 363.6 | |||||||||||||||||||||
|
Common shares issued - Dividend Reinvestment Plan |
23 | 0.3 | — | — | — | — | 0.3 | |||||||||||||||||||||
|
Common shares issued - Employee Stock Purchase Plan |
102 | 1.3 | (0.2 | ) | — | — | — | 1.1 | ||||||||||||||||||||
| Share-based compensation |
— | — | 9.4 | — | — | — | 9.4 | |||||||||||||||||||||
| Common shares dividend |
— | — | — | (31.7 | ) | — | — | (31.7 | ) | |||||||||||||||||||
| Distributions to non-controlling interests |
— | — | — | — | — | (7.6 | ) | (7.6 | ) | |||||||||||||||||||
| Comprehensive (loss) income |
||||||||||||||||||||||||||||
| Currency translation adjustment |
— | — | — | — | (42.0 | ) | — | (42.0 | ) | |||||||||||||||||||
| Pension benefit plan, net of tax |
— | — | — | — | (4.3 | ) | — | (4.3 | ) | |||||||||||||||||||
| Unrealized gain on derivative instruments, net of tax |
— | — | — | — | 4.6 | — | 4.6 | |||||||||||||||||||||
| Net (loss) income |
— | — | — | (77.8 | ) | — | 6.3 | (71.5 | ) | |||||||||||||||||||
|
|
|
|
|
|
|
|
|
|
|
|
|
|
|
|||||||||||||||
| Balance at December 31, 2016 |
138,591 | $ | 909.3 | $ | 54.2 | $ | 22.9 | $ | (117.9 | ) | $ | 5.3 | $ | 873.8 | ||||||||||||||
|
|
|
|
|
|
|
|
|
|
|
|
|
|
|
|||||||||||||||
| Common shares repurchased and cancelled |
(277 | ) | (3.8 | ) | — | — | — | — | (3.8 | ) | ||||||||||||||||||
| Common shares issued - Equity Incentive Plan |
1,004 | 9.4 | (7.7 | ) | — | — | — | 1.7 | ||||||||||||||||||||
| Common shares issued - Dividend Reinvestment Plan |
34 | 0.5 | — | — | — | — | 0.5 | |||||||||||||||||||||
| Common shares issued - Employee Stock Purchase Plan |
137 | 1.7 | (0.3 | ) | — | — | — | 1.4 | ||||||||||||||||||||
| Share-based compensation |
— | — | 22.9 | — | — | — | 22.9 | |||||||||||||||||||||
| Common shares dividends |
— | — | — | (33.7 | ) | — | — | (33.7 | ) | |||||||||||||||||||
| Distributions to non-controlling interests |
— | — | — | — | — | (7.7 | ) | (7.7 | ) | |||||||||||||||||||
| Comprehensive income (loss) |
||||||||||||||||||||||||||||
| Currency translation adjustment |
— | — | — | — | 27.2 | — | 27.2 | |||||||||||||||||||||
| Pension benefit plan, net of tax |
— | — | — | — | (2.4 | ) | — | (2.4 | ) | |||||||||||||||||||
| Unrealized loss on derivative instruments, net of tax |
— | — | — | — | (1.3 | ) | — | (1.3 | ) | |||||||||||||||||||
| Net income |
— | — | — | (1.4 | ) | — | 8.5 | 7.1 | ||||||||||||||||||||
|
|
|
|
|
|
|
|
|
|
|
|
|
|
|
|||||||||||||||
| Balance at December 30, 2017 |
139,489 | $ | 917.1 | $ | 69.1 | $ | (12.2 | ) | $ | (94.4 | ) | $ | 6.1 | $ | 885.7 | |||||||||||||
|
|
|
|
|
|
|
|
|
|
|
|
|
|
|
|||||||||||||||
The accompanying notes are an integral part of these consolidated financial statements.
F-7
Table of Contents
Notes to Consolidated Financial Statements
Description of Business
As used herein, “Cott,” “the Company,” “our Company,” “Cott Corporation,” “we,” “us,” or “our” refers to Cott Corporation, together with its consolidated subsidiaries. Cott is a route based service company with a leading volume-based national presence in the North America and European home and office delivery (“HOD”) industry for bottled water and a leader in custom coffee roasting, blending of iced tea and extract solutions for the U.S. foodservice industry. Our platform reaches over 2.4 million customers or delivery points across North America and Europe supported by strategically located sales and distribution facilities and fleets, as well as wholesalers and distributors. This enables us to efficiently service residences, businesses, restaurant chains, hotels and motels, small and large retailers, and healthcare facilities.
Note 1—Summary of Significant Accounting Policies
Basis of presentation
These Consolidated Financial Statements have been prepared in accordance with U.S. generally accepted accounting principles (“GAAP”) using the U.S. dollar as the reporting currency, as the majority of our business and the majority of our shareowners are in the United States.
At the beginning of 2017, our business operated through four reporting segments, Water and Coffee Solutions (which included our DS Services of America, Inc. (“DSS”), Aquaterra Corporation (“Aquaterra”), Eden Springs Europe B.V. (“Eden”) and S. & D. Coffee, Inc. (“S&D”) businesses), Cott North America, Cott United Kingdom (“Cott U.K.”) and All Other (which included our Mexico and Royal Crown International (“RCI”) operating segments).
During the third quarter of 2017, we reviewed our reporting segments as a result of the Transaction (as defined below). Following such review, we reorganized our reporting segments into three reporting segments: Route Based Services (which includes our DSS, Aquaterra and Eden businesses), Coffee, Tea and Extract Solutions (which includes our S&D business) and All Other (which includes our Aimia Foods (“Aimia”) and Decantae Mineral Water Ltd. (“Decantae”) business, our RCI concentrate business, our Columbus, Georgia manufacturing facility and other miscellaneous expenses). Segment reporting results have been recast to reflect these changes for all periods presented. Our corporate oversight function is not treated as a segment; it includes certain general and administrative costs that are not allocated to any of the reporting segments.
For the years ended December 30, 2017, December 31, 2016 and January 2, 2016, we had 52 weeks of activity. For the year ended January 2, 2016, we had four additional shipping days in our Route Based Services reporting segment, which we estimate contributed $12.5 million of additional revenue and $0.1 million of additional operating income for the year ended January 2, 2016.
Basis of consolidation
The Consolidated Financial Statements include our accounts, our wholly-owned and majority-owned subsidiaries and joint ventures that we control. All intercompany transactions and accounts have been eliminated in consolidation.
Discontinued Operations
On July 24, 2017, we entered into a Share Purchase Agreement with Refresco Group N.V., a Dutch public company (“Refresco”), pursuant to which we sold to Refresco, on January 30, 2018, our carbonated soft drinks (“CSDs”) and juice businesses via the sale of our North America, United Kingdom (“U.K.”) and Mexico business units (including the Canadian business) and our RCI finished goods export business (collectively, “Traditional Business” and such transaction, the “Transaction”). The Transaction was structured as a sale of the assets of our Canadian business and a sale of the stock of the operating subsidiaries engaged in the Traditional Business in the other jurisdictions after we completed an internal reorganization. The aggregate deal consideration was $1.25 billion, paid at closing in cash, subject to adjustment for indebtedness, working capital, and other customary post-closing adjustments. Accordingly, as a result of the sale of the Traditional Business representing a strategic shift and having a major effect on our operations, the Traditional Business is presented herein as discontinued operations. The Traditional Business excludes our Route Based Services and Coffee, Tea and Extract Solutions reporting segments, our Aimia, Decantae and RCI concentrate businesses and our Columbus, Georgia manufacturing facility.
For all periods presented, the operating results associated with the Traditional Business have been reclassified into net income (loss) from discontinued operations, net of income taxes in the Consolidated Statements of Operations and the assets and liabilities associated with this business have been reflected as current and long-term assets and liabilities of discontinued operations in the Consolidated Balance Sheets. Cash flows from the Company’s discontinued operations are presented in the Consolidated Statements of Cash Flows for all periods presented. The Notes to Consolidated Financial Statements are presented on a continuing operations basis unless otherwise noted.
F-8
Table of Contents
In the Form 10-Q for the three and nine months ended September 30, 2017, the Company originally reported the $525.0 million of 5.375% senior notes due 2022 (the “2022 Notes”), the $625.0 million of 6.75% senior notes due 2020 (the “2020 Notes”), the asset-based lending facility (the “ABL facility”) and certain other debt as liabilities of discontinued operations. However, since Refresco did not assume the debt upon closing of the sale of the Traditional Business, these items should not have been classified as discontinued operations. Management has evaluated this misclassification and determined the amounts are not material to the previously issued financial statements. The 2022 Notes, the 2020 Notes, and certain other debt are presented as “Debt required to be repaid or extinguished as part of divestiture” and the ABL facility is presented as “Short-term borrowings required to be repaid or extinguished as part of divestiture” on the accompanying Consolidated Balance Sheets.
Estimates
The preparation of these Consolidated Financial Statements in conformity with GAAP requires management to make estimates and assumptions that affect the amounts of assets and liabilities and disclosure of contingent assets and liabilities at the date of the financial statements and the amount of revenue and expenses during the reporting period. Actual results could differ from those estimates. The Consolidated Financial Statements include estimates and assumptions that, in the opinion of management, were significant to the underlying amounts representing the future valuation of intangible assets, long-lived assets and goodwill, realization of deferred income tax assets, the resolution of tax contingencies and projected benefit plan obligations.
Revenue recognition
We recognize revenue, net of sales returns, when ownership passes to customers for products manufactured in our own plants and/or by third-parties on our behalf, and when prices to our customers are fixed or determinable and collection is reasonably assured. This may be upon shipment of goods or upon delivery to the customer, depending on contractual terms. Shipping and handling costs paid by the customer to us are included in revenue. Although we occasionally accept returns of products from our customers, historically returns have not been material.
We also recognize rental income on filtration, brewers and dispensing equipment at customer locations based on the terms of the related rental agreements, which are generally measured based on 28-day periods. Amounts billed to customers for rental in future periods are deferred and included in accounts payable and accrued liabilities on the Consolidated Balance Sheets.
Sales incentives
We participate in various incentive programs with our customers, including volume-based incentives, contractual rebates and promotional allowances. Volume incentives are based on our customers achieving volume targets for a period of time. Volume incentives and contractual rebates are deducted from revenue and accrued as the incentives are earned and are based on management’s estimate of the total the customer is expected to earn and claim. Promotional allowances are accrued at the time of revenue recognition and are deducted from revenue based on either the volume shipped or the volume sold at the retailer location, depending on the terms of the allowance. We regularly review customer sales forecasts to ensure volume targets will be met and adjust incentive accruals and revenues accordingly.
Cost of sales
We record costs associated with the manufacturing of our products in cost of sales. Shipping and handling costs incurred to store, prepare and move products between production facilities or from production facilities to branch locations or storage facilities are recorded in cost of sales. Shipping and handling costs incurred to deliver products from our Route Based Services and Coffee, Tea and Extract Solutions reporting segment branch locations to the end-user consumer of those products are recorded in selling, general and administrative (“SG&A”) expenses. All other costs incurred in shipment of products from our production facilities to customer locations are reflected in cost of sales. Shipping and handling costs included in SG&A were $440.8 million, $360.4 million, and $281.9 million for the years ended December 30, 2017, December 31, 2016, and January 2, 2016, respectively. Finished goods inventory costs include the cost of direct labor and materials and the applicable share of overhead expense chargeable to production.
Selling, general and administrative expenses
We record all other expenses not charged to production as SG&A expenses. Advertising costs are expensed at the commencement of an advertising campaign and are recognized as a component of SG&A expenses. Advertising costs are not significant to any reporting segment other than Route Based Services. Advertising costs expensed were approximately $21.6 million, $20.8 million, and $18.0 million for the years ended December 30, 2017, December 31, 2016, and January 2, 2016, respectively.
F-9
Table of Contents
Share-based compensation
We have in effect equity incentive plans under which Time-based RSUs, Performance-based RSUs, non-qualified stock options and director share awards have been granted (as such terms are defined in Note 7 of the Consolidated Financial Statements). Share-based compensation expense for all share-based compensation awards is based on the grant-date fair value. We recognized these compensation costs on a straight-line basis over the requisite service period of the award, which is generally the vesting term of three years, and account for forfeitures when they occur. The fair value of the Company’s Time-based RSUs, Performance-based RSUs and director share awards are based on the closing market price of its common shares on the date of grant as stated on the NYSE. We estimate the fair value of non-qualified options as of the date of grant using the Black-Scholes option pricing model. This model considers, among other factors, the expected life of the award, the expected volatility of the Company’s share price, and expected dividends. The Company records share-based compensation expense in SG&A expenses.
All excess tax benefits and tax deficiencies related to share-based compensation are recognized in results of operations at settlement or expiration of the award. The excess tax benefit or deficiency is calculated as the difference between the grant date price and the price of our common shares on the vesting or exercise date.
Cash and cash equivalents
Cash and cash equivalents include all highly liquid investments with original maturities not exceeding three months at the time of purchase. The fair values of our cash and cash equivalents approximate the amounts shown on our Consolidated Balance Sheets due to their short-term nature.
Allowance for doubtful accounts
A portion of our accounts receivable is not expected to be collected due to non-payment, bankruptcies and deductions. Our accounting policy for the allowance for doubtful accounts requires us to reserve an amount based on the evaluation of the aging of accounts receivable, detailed analysis of high-risk customers’ accounts, and the overall market and economic conditions of our customers. This evaluation considers the customer demographic, such as large retailers as compared to small businesses or individual customers. We consider our accounts receivable delinquent or past due based on payment terms established with each customer. Accounts receivable are written off when the account is determined to be uncollectible.
Inventories
Inventories are stated at the lower of cost, determined on the first-in, first-out method, or net realizable value. Returnable bottles are valued at the lower of cost, deposit value or net realizable value. Finished goods and work-in-process include the inventory costs of raw materials, direct labor and manufacturing overhead costs. As a result, we use an inventory reserve to adjust our inventory costs down to a net realizable value and to reserve for estimated obsolescence of both raw materials and finished goods.
Customer deposits
The Company generally collects deposits on three- and five-gallon bottles used by its HOD customers. Such deposits are refunded only after customers return such bottles in satisfactory condition. The associated bottle deposit liability is estimated based on the number of water customers, average consumption and return rates and bottle deposit market rates. The Company analyzes these assumptions quarterly and adjusts the bottle deposit liability as necessary.
Property, plant and equipment
Property, plant and equipment are stated at cost less accumulated depreciation. Depreciation is allocated between cost of sales and SG&A expenses and is determined using the straight-line method over the estimated useful lives of the assets.
Leasehold improvements are amortized using the straight-line method over the remaining life of the lease or useful life of the asset, whichever is shorter. Maintenance and repairs are charged to operating expense when incurred.
Goodwill
Goodwill represents the excess purchase price of acquired businesses over the fair value of the net assets acquired. Goodwill is not amortized, but instead is tested for impairment at least annually.
F-10
Table of Contents
The following table summarizes our goodwill on a reporting segment basis as of December 30, 2017 and December 31, 2016:
| Reporting Segment | ||||||||||||||||||||
| Route | Coffee, Tea | |||||||||||||||||||
| Based | and Extract | |||||||||||||||||||
| (in millions of U.S. dollars) |
Services | Solutions | All Other | Total | ||||||||||||||||
| Balance January 2, 2016 |
$ | 579.1 | $ | — | $ | 52.6 | $ | 631.7 | ||||||||||||
| Goodwill acquired during the year |
322.0 | 117.1 | — | 439.1 | ||||||||||||||||
| Foreign exchange |
(14.6 | ) | — | (7.9 | ) | (22.5 | ) | |||||||||||||
|
|
|
|
|
|
|
|
|
|||||||||||||
| Balance December 31, 2016 |
$ | 886.5 | $ | 117.1 | $ | 44.7 | $ | 1,048.3 | ||||||||||||
| Goodwill acquired during the year |
8.5 | 1.3 | 9.8 | |||||||||||||||||
| Adjustments 1 |
0.1 | 0.7 | — | 0.8 | ||||||||||||||||
| Foreign exchange |
41.6 | — | 4.2 | 45.8 | ||||||||||||||||
|
|
|
|
|
|
|
|
|
|||||||||||||
| Balance December 30, 2017 |
$ | 936.7 | $ | 117.8 | $ | 50.2 | $ | 1,104.7 | ||||||||||||
|
|
|
|
|
|
|
|
|
|||||||||||||
| 1. | For the year ended December 30, 2017, we recorded adjustments to goodwill allocated to the Route Based Services and the Coffee, Tea and Extract Solutions segments in connection with the acquisitions of Eden and S&D (see Note 3 to the Consolidated Financial Statements). |
Cott operates through five operating segments: Route Based Services, Coffee, Tea and Extract Solutions, Aimia, RCI and Decantae. Route Based Services, Coffee, Tea and Extract Solutions are also reportable segments and Aimia, RCI and Decantae are combined and disclosed in the All Other category. We test goodwill for impairment at least annually on the first day of the fourth quarter, based on our reporting unit carrying values, calculated as total assets less non-interest bearing liabilities, as of the end of the third quarter, or more frequently if we determine a triggering event has occurred during the year. Any impairment loss is recognized in our results of operations. We evaluate goodwill for impairment on a reporting unit basis, which is an operating segment or a level below an operating segment, referred to as a component. A component of an operating segment is a reporting unit if the component constitutes a business for which discrete financial information is available and management regularly reviews the operating results of that component. However, two or more components of an operating segment are aggregated and deemed a single reporting unit if the components have similar economic characteristics. Our Route Based Services operating segment was determined to have three components, DSS, Aquaterra and Eden. We have determined that DSS and Aquaterra have similar economic characteristics and have aggregated them as a single reporting unit for the purpose of testing goodwill for impairment (“DSSAqua”). For the purpose of testing goodwill for impairment in 2017, we have determined our reporting units are DSSAqua, Eden, S&D, Aimia, RCI and Decantae. DSSAqua and Eden are components of the Route Based Services operating segment. S&D is a component of the Coffee, Tea and Extract Solutions operating segment.
We had goodwill of $1,104.7 million on our Consolidated Balance Sheet at December 30, 2017, which represents amounts for the DSSAqua, Eden, S&D, Aimia, RCI and Decantae reporting units.
In the fourth quarter of 2017, the Company early adopted Accounting Standard Update (“ASU”) 2017-04, “Intangibles – Goodwill and Other (Topic 350): Simplifying the Test for Goodwill Impairment,” as part of the annual goodwill impairment testing. We have the option of performing a qualitative assessment to determine whether any further quantitative testing for a potential impairment is necessary. Our qualitative assessment will use judgments including, but not limited to, changes in the general economic environment, industry considerations, current economic performance compared to historical economic performance, entity-specific events and events affecting our reporting units, where applicable. If we elect to bypass the qualitative assessment or if we determine, based upon our assessment of those qualitative factors that it is more likely than not that the fair value of the reporting unit is less than its net carrying value, a quantitative assessment is required. Quantitative testing requires the fair value of the reporting unit to be compared with its carrying value. If the reporting unit’s carrying value exceeds its fair value, an impairment charge is recognized for the difference.
For purposes of the 2017 annual test, we elected to perform a qualitative assessment for our RCI and Decantae reporting units to assess whether it was more likely than not that the fair value of these reporting units exceeded their respective carrying values. In performing these assessments, management relied on a number of factors including, but not limited to, macroeconomic conditions, industry and market considerations, cost factors that would have a negative effect on earnings and cash flows, overall financial performance compared with forecasted projections in prior periods, and other relevant reporting unit events, the impact of which are all significant judgments and estimates. Based on these factors, management concluded that it was more likely than not that the fair values of the RCI and Decantae reporting units were greater than their respective carrying amount, including goodwill, indicating no impairment. Goodwill allocated to the RCI and Decantae reporting units as of December 30, 2017 is $4.5 million and $1.7 million, respectively.
F-11
Table of Contents
For the DSSAqua, Eden, S&D and Aimia reporting units, we elected to bypass the qualitative assessment and performed a quantitative analysis due to a decline in 2017 actual versus projected operating results for DSSAqua and Aimia, and to establish a baseline reference for Eden and S&D as 2017 was the first full year of operations for these businesses. We determined the fair value of each reporting unit being evaluated using a mix of the income approach (which is based on the discounted cash flows of the reporting unit) and the guideline public company approach. We weighted the income approach and the guideline public company approach at 50% each to determine the fair value of each reporting unit. We believe using a combination of these approaches provides a more accurate valuation because it incorporates the expected cash generation of the Company in addition to how a third-party market participant would value the reporting unit. As the business is assumed to continue in perpetuity, the discounted future cash flows includes a terminal value. Critical assumptions used in our 2017 valuation of the reporting units include the weighted-average terminal growth rates of 2.5%, 1.5%, 2.5% and 2.0% and discount rates of 8.0%, 9.0%, 8.5% and 11.0% for our DSSAqua, Eden, S&D and Aimia reporting units, respectively. The terminal growth rate assumption incorporated into the discounted cash flow calculation reflects our long-term view of the market and industry, projected changes in the sale of our products, pricing of such products and operating profit margins. The discount rate was determined using various factors and sensitive assumptions, including bond yields, size premiums and tax rates. This rate was based on the weighted average cost of capital a market participant would use if evaluating the reporting unit as an investment. These assumptions are considered significant unobservable inputs and represent our best estimate of assumptions that market participants would use to determine the fair value of the respective reporting units. The key inputs into the discounted cash flow analysis were consistent with market data, where available, indicating that the assumptions used were in a reasonable range of observable market data.
Based on the quantitative assessment including consideration of the sensitivity of the assumptions made and methods used to determine fair value, industry trends and other relevant factors, we noted that the estimated fair values of DSSAqua, Eden, S&D and Aimia reporting units exceeded their carrying values by approximately 42.5%, 17.4%, 25.9% and 19.2%, respectively. Therefore no goodwill impairment charges were recorded in the fourth quarter ended December 30, 2017. Goodwill allocated to the DSSAqua, Eden, S&D and Aimia reporting units as of December 30, 2017 are $612.0 million, $324.7 million, $117.8 million and $44.0 million, respectively.
In addition, we note that goodwill held by reporting units in our Traditional Business totaled $136.8 million at December 30, 2017 and is included in long-term assets of discontinued operations on the Consolidated Balance Sheet. We elected to perform a qualitative assessment for our Traditional Business reporting units to assess whether it was more likely than not that the fair value of these reporting units exceeded their respective carrying values. In performing these assessments, management relied on a number of factors including, but not limited to, macroeconomic conditions, industry and market considerations, cost factors that would have a negative effect on earnings and cash flows, overall financial performance compared with forecasted projections in prior periods, the aggregate deal consideration of $1.25 billion for the sale of the Traditional Business and other relevant reporting unit events, all of which require the use of significant judgments and estimates. Based on these factors, management concluded that it was more likely than not that the fair values of the Traditional Business reporting units were greater than their respective carrying amounts, including goodwill, indicating no impairment.
Each year during the fourth quarter, we re-evaluate the assumptions used in our assessments, such as revenue growth rates, operating profit margins and discount rates, to reflect any significant changes in the business environment that could materially affect the fair value of our reporting units. Based on the evaluations performed in 2017, we determined that the fair value of each of our reporting units exceeded their carrying amounts.
Intangible assets
As of December 30, 2017, our intangible assets subject to amortization, net of accumulated amortization were $462.5 million, consisting principally of $428.7 million of customer relationships that arose from acquisitions, $15.8 million of software, and $14.2 million of patents. Customer relationships are typically amortized on an accelerated basis for the period over which we expect to receive the economic benefits. With the S&D Acquisition, Eden Acquisition, and Aquaterra Acquisition, the acquired customer relationships are amortized over the expected remaining useful life of those relationships on a basis that reflects the pattern of realization of the estimated undiscounted after-tax cash flows. We review the estimated useful life of these intangible assets annually, unless a review is required more frequently due a triggering event, such as a loss of a significant customer. Our review of the estimated useful life takes into consideration the specific net cash flows related to the intangible asset. The permanent loss of, or significant decline in sales to customers included in the intangible asset would result in either an impairment in the value of the intangible asset or an accelerated amortization of any remaining value and could lead to an impairment of the fixed assets that were used to service that customer. In 2016, we recorded $11.4 million in customer relationships acquired with the Aquaterra Acquisition, $134.1 million in customer relationships acquired with the Eden Acquisition, and $113.7 million in customer relationships acquired with the S&D Acquisition. We did not record impairment charges for other intangible assets in 2017, 2016 or 2015.
F-12
Table of Contents
Our intangible assets with indefinite lives relate to the 2001 acquisition of intellectual property from Royal Crown Company, Inc., and include the right to manufacture our concentrates, with all related inventions, processes, technologies, technical and manufacturing information, know-how and the use of the Royal Crown brand outside of North America and Mexico (the “Rights”); trademarks acquired in the acquisition of DSS (the “DSS Trademarks”); trademarks acquired in the acquisition of Eden (the “Eden Trademarks”), and trademarks acquired in the acquisition of Aquaterra (the “Aquaterra Trademarks”). These assets have an aggregate net book value of $288.6 million as of December 30, 2017. There are no legal, regulatory, contractual, competitive, economic, or other factors that limit the useful life of these intangible assets.
The life of the Rights, DSS Trademarks, Eden Trademarks, and Aquaterra Trademarks are considered to be indefinite and therefore these intangible assets are not amortized. Rather, they are tested for impairment at least annually or more frequently if we determine a triggering event has occurred during the year. We compare the carrying amount of the intangible asset to its fair value and when the carrying amount is greater than the fair value, we recognize in income an impairment loss. During the fourth quarter of 2017, management concluded that it was more likely than not that the fair value of the Rights, DSS Trademarks, Eden Trademarks, and Aquaterra Trademarks were greater than their respective carrying value, indicating no impairment.
We assessed qualitative factors to determine whether the existence of events or circumstances indicated that it was more likely than not that the fair value of the Rights and the Aquaterra Trademarks were less than their respective carrying value. The qualitative factors we assessed included macroeconomic conditions, industry and market considerations, cost factors that would have a negative effect on earnings and cash flows, overall financial performance compared with forecasted projections in prior periods, and other relevant events, the impact of which are all significant judgements and estimates. We concluded that it was more likely than not that the fair value of the Rights and the Aquaterra Trademarks were more than its carrying value and therefore we were not required to perform any additional testing.
To determine the fair value of the DSS Trademarks and the Eden Trademarks, we use a relief from royalty method of the income approach, which calculates a fair value royalty rate that is applied to revenue forecasts associated with those trademarks. The resulting cash flows are discounted using a rate to reflect the risk of achieving the projected royalty savings attributable to the trademarks. The assumptions used to estimate the fair value of these trademarks are subjective and require significant management judgment, including estimated future revenues, the fair value royalty rate (which is estimated to be a reasonable market royalty charge that would be charged by a licensor of the trademarks) and the risk adjusted discount rate. Based on our impairment test, the estimated fair value of the DSS Trademarks and the Eden Trademarks exceeded the carrying value by approximately 18.0% and 28.0%, respectively. If actual revenues in future periods, are less than currently projected for the DSS Trademarks and Eden Trademarks, these trademarks could be impaired.
Impairment and disposal of long-lived assets
When adverse events occur, we compare the carrying amount of long-lived assets to the estimated undiscounted future cash flows at the lowest level of independent cash flows for the group of long-lived assets and recognize any impairment loss based on discounted cash flows in the Consolidated Statements of Operations, taking into consideration the timing of testing and the asset’s remaining useful life. The expected life and value of these long-lived assets is based on an evaluation of the competitive environment, history and future prospects as appropriate. We did not record impairments of long-lived assets in 2017 or 2016. As part of normal business operations, we identify long-lived assets that are no longer productive and are disposed. Losses on disposals of assets are presented separately in our Consolidated Statements of Operations as part of operating income. We recognized losses on disposal of property, plant & equipment, net of $10.2 million for the year ended December 30, 2017 ($6.6 million—December 31, 2016; $4.2 million—January 2, 2016).
Derivative financial instruments
We use derivative financial instruments to manage our exposure to movements in foreign currencies and certain commodity prices. All derivative instruments are recorded at fair value in the Consolidated Balance Sheets. We do not use derivative financial instruments for trading or speculative purposes. We manage credit risk related to the derivative financial instruments by requiring high credit standards for our counterparties and periodic settlements. Refer to Note 19 to the Consolidated Financial Statements for further information on our derivative financial instruments.
Foreign currency translation
The assets and liabilities of non-U.S. active operations, all of which are self-sustaining, are translated to U.S. dollars at the exchange rates in effect at the balance sheet dates. Revenues and expenses are translated using average monthly exchange rates prevailing during the period. The resulting gains or losses are recorded in accumulated other comprehensive loss.
F-13
Table of Contents
Income taxes
We account for income taxes under the asset and liability method. Deferred tax assets and liabilities are recognized based on the differences between the financial statement carrying amount of assets and liabilities and their respective tax bases, using currently enacted income tax rates. A valuation allowance is established to reduce deferred income tax assets if, on the basis of available evidence, it is not more likely than not that all or a portion of any deferred tax assets will be realized. The consideration of available evidence requires significant management judgment including an assessment of the future periods in which the deferred tax assets and liabilities are expected to be realized and projections of future taxable income.
The ultimate realization of the deferred tax assets, related to net operating losses, is dependent upon the generation of future taxable income during the periods prior to their expiration. If our estimates and assumptions about future taxable income are not appropriate, the value of our deferred tax assets may not be recoverable, which may result in an increase to our valuation allowance that will impact current earnings.
We account for uncertain tax positions using a two-step process. The first step is to evaluate the tax position for recognition by determining if the weight of available evidence indicates that it is more likely than not that the position will be sustained on audit, including resolution of related appeals or litigation processes, based on the technical merits. The second step requires management to estimate and measure the tax benefit as the largest amount that is more than 50% likely to be realized upon ultimate settlement. It is inherently difficult and subjective to estimate such amounts, as we have to determine the probability of various possible outcomes. We re-evaluate these uncertain tax positions on a quarterly basis. This evaluation is based on factors including, but not limited to, changes in facts or circumstances, changes in tax law, effectively settled issues under audit, and new audit activity. Such a change in recognition or measurement would result in the recognition of a tax benefit or an additional charge to the tax provision.
We recognize interest and penalties related to unrecognized tax benefits within the income tax (benefit) expense line in the accompanying Consolidated Statements of Operations, and we include accrued interest and penalties within the accounts payable and accrued liabilities or the prepaid expenses and other current assets line in the accompanying Consolidated Balance Sheets.
Pension costs
We record annual amounts relating to defined benefit pension plans based on calculations, which include various actuarial assumptions such as discount rates and assumed rates of return on plan assets depending on the pension plan. Material changes in pension costs may occur in the future due to changes in these assumptions. Future annual amounts could be impacted by changes in the discount rate, changes in the expected long-term rate of return on plan assets, changes in the level of contributions to the plans and other factors. The funded status is the difference between the fair value of plan assets and the benefit obligation. Future actuarial gains or losses that are not recognized as net periodic benefits cost in the same periods will be recognized as a component of other comprehensive income.
Recently adopted accounting pronouncements
Update ASU 2015-11 – Inventory (Topic 330)
In July 2015, the FASB issued ASU 2015-11 – Inventory (Topic 330) to simplify the accounting for inventory. The guidance requires entities to measure most inventory at the lower of cost or net realizable value. Net realizable value is the estimated selling price in the ordinary course of business, less reasonably predictable costs of completion, disposal and transportation. The Company adopted the provisions of this guidance effective January 1, 2017, and applied it prospectively to all periods presented. The adoption of this standard did not have a material impact on our Consolidated Financial Statements.
Update ASU 2017-04 – Intangibles—Goodwill and Other (Topic 350)
In January 2017, the FASB amended its guidance regarding goodwill impairment. The amendments remove certain conditions of the goodwill impairment test and simplify the computation of impairment. The amendments in this update are effective for fiscal years beginning after December 15, 2019, including interim periods within those fiscal years, with early adoption permitted for any tests performed after January 1, 2017. The amendments in this update should be applied prospectively, with disclosure required as to the nature of and reason for the change in accounting principle upon transition. In the fourth quarter of 2017, the Company early adopted ASU 2017-04 as part of the annual goodwill impairment testing.
F-14
Table of Contents
Update ASU 2017-12 – Derivatives and Hedging (Topic 815): Targeted Improvements to Accounting for Hedging Activities
In August 2017, the FASB amended its guidance regarding the improvement of accounting for hedging transactions. This new standard simplifies and expands the eligible hedging strategies for financial and non-financial risks. It also enhances the transparency of how hedging results are presented and disclosed. Further, the new standard provides partial relief on the timing of certain aspects of hedge documentation and eliminates the requirement to recognize hedge ineffectiveness separately in earnings. The guidance is designed to align hedge accounting with a company’s risk management activities and simplifies its application through targeted improvements by expanding the list of items eligible to be hedged and amending the methods used to measure the effectiveness of hedging relationships. Additionally it prescribes how hedging results should be presented and requires incremental disclosures. The amendments in this update are effective for fiscal years beginning after December 15, 2018, and interim periods within those fiscal years. The Company has early adopted, in an interim period, the targeted improvements to accounting for hedging activities. The transition date is October 1, 2017 (”Adoption Date”). The impacts to the Company at the Adoption Date are limited to S&D’s outstanding coffee futures contracts. Adoption of ASU 2017-12 did not result in a cumulative adjustment to the opening balance of retained earnings and did not have any other material effect on the results of operations, financial position or cash flows of the Company.
Update ASU 2017-13 – Revenue Recognition (Topic 605), Revenue from Contracts with Customers (Topic 606), Leases (Topic 840), and Leases (Topic 842) – Amendments to SEC Paragraphs Pursuant to the Staff Announcement at the July 20, 2017 EITF Meeting and Rescission of Prior SEC Staff Announcements and Observer Comments
In August 2017, the FASB issued an update to its guidance that delays the mandatory adoption of Topic 606 and Topic 842 for certain entities, revises the guidance related to performance-based incentive fees in Topic 605 and revises the guidance related to leases in Topic 840 and Topic 842. The revisions to the lease guidance eliminate language specific to certain sale-leaseback arrangements, guarantees of lease residual assets and loans made by lessees to owner-lessors. Also included is an amendment to Topic 842 to retain the guidance in Topic 840 covering the impact of changes in tax rates on investments in leveraged leases. This standard, which is effective immediately, generally relates to the adoption of Topic 606 and Topic 842 and did not have a material impact on our Consolidated Financial Statements.
Recently issued accounting pronouncements
Update ASU 2014-09 – Revenue from Contracts with Customers (Topic 606)
In May 2014, the FASB amended its guidance regarding revenue recognition and created a new Topic 606, Revenue from Contracts with Customers. The objectives for creating Topic 606 were to remove inconsistencies and weaknesses in revenue recognition, provide a more robust framework for addressing revenue issues, provide more useful information to users of the financial statements through improved disclosure requirements, simplify the preparation of financial statements by reducing the number of requirements to which an entity must refer, and improve comparability of revenue recognition practices across entities, industries, jurisdictions and capital markets. The core principle of the guidance is that an entity should recognize revenue to depict the transfer of promised goods or services to customers in an amount that reflects the consideration to which the entity expects to be entitled in exchange for those goods or services. To achieve the core principle, an entity should apply the following steps: 1) identify the contract(s) with a customer; 2) identify the performance obligations in the contract; 3) determine the transaction price; 4) allocate the transaction price to the performance obligations in the contract; and 5) recognize revenue when (or as) the entity satisfies a performance obligation. For public entities, the amendments are effective for annual reporting periods beginning after December 15, 2017, including interim periods within that reporting period. The amendments may be applied retrospectively to each prior reporting period presented or retrospectively with the cumulative effect of initially applying the amendment recognized at the date of initial application.
We will adopt this guidance and related amendments as of December 31, 2017. The standard permits the use of either the retrospective or cumulative effect transition method. The Company has elected the cumulative effect method. We will be required to comply with expanded disclosure requirements, including the disaggregation of revenues to depict the nature and uncertainty of types of revenues, contract assets and liabilities, current period revenues previously recorded as a liability, performance obligations, significant judgments and estimates affecting the amount and timing of revenue recognition, determination of transaction prices, and allocation of transaction prices to performance obligations.
During 2017, the Company completed its analysis of the impact of the standard on its contract types, and concluded the adoption of this standard will not have a material impact on our Consolidated Financial Statements. We have also modified current processes and controls to apply the requirements of the new standard. We do not believe such modifications are material to our internal controls over financial reporting.
Update ASU 2016-02 – Leases (Topic 842)
In February 2016, the FASB issued an update to its guidance on lease accounting for lessees and lessors. This update revises accounting for operating leases by a lessee, among other changes, and requires a lessee to recognize a liability to make lease payments and an asset representing its right to use the underlying asset for the lease term in the balance sheet. The
F-15
Table of Contents
distinction between finance and operating leases has not changed and the update does not significantly change the effect of finance and operating leases on the Consolidated Statements of Operations and the Consolidated Statements of Cash Flows. Additionally, this update requires both qualitative and specific quantitative disclosures. For public entities, the amendments in this update are effective for fiscal years beginning after December 15, 2018, including interim periods within those fiscal years, with early adoption permitted. A modified retrospective transition approach is required for leases existing at, or entered into after, the beginning of the earliest comparative period presented in the financial statements, with certain practical expedients available.
We are currently assessing the impact of adoption of this standard on our Consolidated Financial Statements. The Company is evaluating the standard’s applicability to our various contractual arrangements. We currently believe that the most significant changes relate to the recognition of new right of use assets and lease liabilities for real estate and equipment leases, which will result in increases to our assets and liabilities on our Consolidated Balance Sheets. We believe that substantially all of our lessee lease arrangements will continue to be classified as operating leases under the new standard. Additionally, we had $19.9 million of deferred gains at December 31, 2016 associated with sale-leaseback transactions which are currently being amortized over the leaseback term. Upon adoption of this standard, we will be required to recognize the unamortized deferred gain at January 1, 2017 as a cumulative effect adjustment to equity. In addition, upon adoption of this standard, deferred gains related to the sale-leaseback transactions completed in 2017 of $7.9 million at December 30, 2017 will be recognized in net income (loss) from discontinued operations, net of income taxes in the Consolidated Statement of Operations for the year ended December 30, 2017.
The standard also requires lessors to classify leases as sales-type, direct financing or operating leases, similar to existing guidance. We believe that substantially all of our lessor lease arrangements will continue to be classified as operating leases under the new standard.
Update ASU 2016-13 – Financial Instruments – Credit Losses (Topic 326)
In June 2016, the FASB amended its guidance to measure all expected credit losses for financial assets held at the reporting date based on historical experience, current conditions, and reasonable and supportable forecasts. Entities will now use forward-looking information to better form their credit loss estimates. The amended guidance also requires enhanced disclosures to help financial statement users better understand significant estimates and judgments used in estimating credit losses, as well as the credit quality and underwriting standards of an entity’s portfolio. The amendments in this update are effective for fiscal years beginning after December 15, 2019, including interim periods within those fiscal years. Early adoption will be permitted for fiscal years beginning after December 15, 2018, including interim periods within those fiscal years. This guidance will be applied using a prospective or modified retrospective transition method, depending on the area covered in this update. We are currently assessing the impact of adoption of this standard on our Consolidated Financial Statements.
Update ASU 2017-01 – Business Combination (Topic 805)
In January 2017, the FASB amended its guidance regarding business combinations. The amendment clarified the definition of a business with the objective of adding guidance to assist entities with evaluating whether transactions should be accounted for as acquisitions (or disposals) of assets or businesses. The amendments provide an analysis of fair value of assets acquired to determine when a set of assets is not a business, and uses more stringent criteria related to inputs, substantive process, and outputs to determine if a business exists. The amendments in this update are effective for fiscal years beginning after December 15, 2017, including interim periods within those fiscal years, with early adoption permitted. The amendments in this update should be applied prospectively on or after the effective date with no requirement for disclosures at transition. We are currently assessing the impact of adoption of this standard on our Consolidated Financial Statements.
Update ASU 2017-07 – Compensation—Retirement Benefits (Topic 715)
In March 2017, the FASB issued an update to its guidance on presentation of net periodic pension cost and net periodic post-retirement pension cost, and requires the service cost component to be presented in the same line item or items as other compensation costs arising from services rendered by the pertinent employees during the period. The other components of net benefit cost are required to be presented in the income statement separately from the service cost component and outside a subtotal of income from operations. The amendments in this update also allow only the service cost component to be eligible for capitalization when applicable. For public entities, the amendments in this update are effective for fiscal years beginning after December 15, 2017, including interim periods within those fiscal years, with early adoption permitted. At adoption, this update will be applied retrospectively for the presentation of the service cost component and other components of net periodic pension cost and net periodic post-retirement benefit cost in the income statement and prospectively, on or after the effective date, for the capitalization of the service cost component of net periodic pension cost and net periodic post-retirement benefit in assets. Additionally, in the period of adoption, an entity should provide disclosures about a change in accounting principle. We are currently assessing the impact of adoption of this standard on our Consolidated Financial Statements.
F-16
Table of Contents
Update ASU 2017-08 – Receivables—Nonrefundable Fees and Other Costs (Subtopic 310-20)
In March 2017, the FASB amended its guidance on accounting for debt securities. The amendments shorten the amortization period for certain callable debt securities held at a premium. Specifically, the amendments require the premium to be amortized to the earliest call date. The amendments do not require an accounting change for securities held at a discount; the discount continues to be amortized to maturity. For public entities, the amendments in this update are effective for fiscal years beginning after December 15, 2018, including interim periods within those fiscal years, with early adoption permitted. If an entity early adopts the amendments in an interim period, any adjustments should be reflected as of the beginning of the fiscal year that includes that interim period. At adoption, this update will be applied using a modified retrospective basis through a cumulative-effect adjustment directly to retained earnings as of the beginning of the period of adoption. Additionally, in the period of adoption, an entity should provide disclosures about a change in accounting principle. We are currently assessing the impact of adoption of this standard on our Consolidated Financial Statements.
Update ASU 2017-09 – Stock Compensation – Scope of Modification Accounting (Topic 718)
In May 2017, the FASB amended its guidance regarding the scope of modification accounting for share-based compensation arrangements. The amendments provide guidance about which changes to the terms or conditions of a share-based payment award require an entity to apply modification accounting in Topic 718. For public entities, the amendments in this update are effective for fiscal years beginning after December 15, 2017. Early adoption is permitted, including adoption in any interim period, for public entities for reporting periods for which financial statements have not yet been issued. The amendments in this update should be applied prospectively to an award modified on or after the adoption date. We do not expect adoption of this standard to have a significant impact on our Consolidated Financial Statements.
Update ASU 2018-02 – Income Statement—Reporting Comprehensive Income (Topic 220)
In February 2018, the FASB amended its guidance which allows a reclassification from accumulated other comprehensive income to retained earnings for stranded tax effects resulting from the comprehensive tax legislation enacted by the U.S. government on December 22, 2017 commonly referred to as the Tax Cuts and Jobs Act (the “Tax Act”) and requires certain disclosures about stranded tax effects. For public entities, the amendments in this update are effective for fiscal years beginning after December 15, 2018, including interim periods within those fiscal years, with early adoption permitted, and may be applied in the period of adoption or retrospectively to each period in which the effect of the change in the U.S. federal corporate tax rate in the Tax Act is recognized. We are currently assessing the impact of adoption of this standard on our Consolidated Financial Statements.
Note 2—Discontinued Operations
On January 30, 2018, the Company completed the sale of the Traditional Business to Refresco. The Transaction was structured as a sale of the assets of the Canadian business and a sale of the stock of the operating subsidiaries engaged in the Traditional Business in the other jurisdictions after the Company completed an internal reorganization. The aggregate deal consideration was $1.25 billion, paid at closing in cash, subject to adjustment for indebtedness, working capital, and other customary post-closing adjustments. The Traditional Business excludes our Company’s Route Based Services and Coffee, Tea and Extract Solutions reporting segments, our Aimia, Decantae and RCI concentrate businesses, and our Columbus, Georgia manufacturing facility.
In connection with the closing of the Transaction, the Company used a portion of the proceeds to redeem $525.0 million aggregate principal amount of the 2022 Notes, $250.0 million aggregate principal amount of the 10.000% senior secured notes due 2021 (the “DSS Notes”), and $262.5 million outstanding balance on the ABL facility.
The Company and Refresco have entered into a Transition Services Agreement pursuant to which the Company and Refresco will provide certain services to each other for various service periods, with the longest service period being 18 months, including tax and accounting services, certain human resources services, communications systems and support, and insurance/risk management. Each party will be compensated for services rendered as set forth in the Transition Services Agreement. Each service period may be extended as set forth in the Transition Services Agreement, up to a maximum extension of 180 days.
In addition, the Company and Refresco have entered into certain Co-pack Manufacturing Agreements pursuant to which the Company and Refresco will manufacture and supply certain beverage products for each other and a Concentrate Supply Agreement pursuant to which the Company will supply concentrates to Refresco. Each party will be compensated for the products they supply as set forth in the applicable agreements. The Co-pack Manufacturing Agreements provide for a term of 36 months and the Concentrate Supply Agreement provides for a term that is coterminous with the term of the Transition Services Agreement.
F-17
Table of Contents
The major components of net income (loss) from discontinued operations, net of income taxes in the accompanying Consolidated Statements of Operations include the following:
| For the Year Ended | ||||||||||||
| December 30, 2017 |
December 31, 2016 |
January 2, 2016 |
||||||||||
| (in millions of U.S. dollars) |
||||||||||||
| Revenue, net |
$ | 1,637.1 | $ | 1,658.6 | $ | 1,799.6 | ||||||
| Cost of sales |
1,428.4 | 1,434.5 | 1,554.6 | |||||||||
| Operating income from discontinued operations |
49.9 | 72.7 | 81.5 | |||||||||
| Loss from discontinued operations, before income taxes |
(20.5 | ) | (6.8 | ) | (2.7 | ) | ||||||
| Income tax (benefit) expense 1 |
(31.2 | ) | 4.4 | (7.6 | ) | |||||||
| Net income (loss) from discontinued operations, net of income taxes |
10.7 | (11.2 | ) | 4.9 | ||||||||
| Less: Net income attributable to non-controlling interests |
8.5 | 6.3 | 6.1 | |||||||||
| Net income (loss) attributable to Cott Corporation – discontinued operations 2 |
$ | 2.2 | $ | (17.5 | ) | $ | (1.2 | ) | ||||
| 1. | The Transaction is anticipated to result in a gain on sale which led to certain U.S. deferred tax liabilities being considered as a source of future taxable income. As a result, we recognized a tax benefit of approximately $26.9 million related to a corresponding U.S. valuation allowance release. |
| 2. | Net income (loss) attributable to Cott Corporation - discontinued operations is inclusive of interest expense on short-term borrowings and debt required to be repaid or extinguished as part of divestiture of $49.5 million for the year ended December 30, 2017 (December 31, 2016 - $81.2 million; January 2, 2016 - $80.9 million). |
Assets and liabilities of discontinued operations presented in the accompanying Consolidated Balance Sheets as of December 30, 2017 and December 31, 2016 include the following:
| (in millions of U.S. dollars) |
December 30, 2017 |
December 31, 2016 |
||||||
| ASSETS |
||||||||
| Cash & cash equivalents |
$ | 66.0 | $ | 40.0 | ||||
| Accounts receivable, net |
143.2 | 127.2 | ||||||
| Inventories |
191.2 | 176.8 | ||||||
| Prepaid expenses and other current assets |
8.3 | 7.7 | ||||||
|
|
|
|
|
|||||
| Current assets of discontinued operations |
408.7 | 351.7 | ||||||
| Property, plant & equipment, net |
350.7 | 348.1 | ||||||
| Goodwill |
136.8 | 127.1 | ||||||
| Intangible assets, net |
176.2 | 180.7 | ||||||
| Other long-term assets, net |
13.8 | 11.0 | ||||||
|
|
|
|
|
|||||
| Long-term assets of discontinued operations |
$ | 677.5 | $ | 666.9 | ||||
|
|
|
|
|
|||||
| LIABILITIES |
||||||||
| Current maturities of long-term debt |
0.5 | 0.5 | ||||||
| Accounts payable and accrued liabilities |
294.6 | 229.4 | ||||||
|
|
|
|
|
|||||
| Current liabilities of discontinued operations |
295.1 | 229.9 | ||||||
| Long-term debt |
0.9 | 1.2 | ||||||
| Deferred tax liabilities |
1.0 | 2.8 | ||||||
| Other long-term liabilities |
43.9 | 34.6 | ||||||
|
|
|
|
|
|||||
| Long-term liabilities of discontinued operations |
$ | 45.8 | $ | 38.6 | ||||
|
|
|
|
|
|||||
Cash flows from discontinued operations included borrowings and payments under the ABL facility of $3,004.1 million and $2,990.7 million, respectively, for the year ended December 30, 2017, $2,401.7 million and $2,318.9 million, respectively, for the year ended December 31, 2016, and $994.5 million and $1,101.8 million, respectively, for the year ended January 2, 2016.
F-18
Table of Contents
Note 3—Acquisitions
S&D Acquisition
On August 11, 2016, the Company acquired S&D, a premium coffee roaster and provider of customized coffee, tea and extract solutions (the “S&D Acquisition”). The initial purchase price paid by the Company in the S&D Acquisition was $354.1 million on a debt- and cash-free basis. Customary post-closing working capital adjustments were resolved in January 2017 by the payment of $0.5 million from the former owners of S&D to the Company. The S&D Acquisition was funded through a combination of incremental borrowings under the Company’s ABL facility and proceeds from our June 2016 Offering (as defined below).
The total consideration paid by Cott in the S&D Acquisition is summarized below:
| (in millions of U.S. dollars) |
||||
| Cash paid to sellers |
$ | 232.1 | ||
| Cash paid on behalf of sellers for sellers’ transaction expenses |
84.2 | |||
| Cash paid to retire outstanding debt on behalf of sellers |
37.8 | |||
| Working capital settlement |
(0.5 | ) | ||
|
|
|
|||
| Total consideration |
$ | 353.6 | ||
|
|
|
|||
The S&D Acquisition supported the Company’s strategy to become a more diversified beverage provider across multiple channels and geographies, as well as expanding the Company’s existing coffee and tea categories. The Company has accounted for this transaction as a business combination which requires that assets acquired and liabilities assumed be measured at their acquisition date fair values.
The adjusted purchase price of $353.6 million was allocated to the assets acquired and liabilities assumed based on management’s estimates of their fair values as of the acquisition date. The excess of the adjusted purchase price over the aggregate fair values was recorded as goodwill. Measurement period adjustments recorded during the year ended December 30, 2017 included adjustments to property, plant and equipment and a related adjustment to deferred taxes based on the results of the validation procedures performed, as well as an adjustment to income taxes payable existing at the acquisition date. These measurement period adjustments did not have a material effect on our results of operations in prior periods.
The table below summarizes the originally reported estimated acquisition date fair values, measurement period adjustments recorded and the final purchase price allocation of the assets acquired and liabilities assumed:
| (in millions of U.S. dollars) |
Originally Reported |
Measurement Period Adjustments |
Acquired Value |
|||||||||
| Cash |
$ | 1.7 | $ | — | $ | 1.7 | ||||||
| Accounts receivable |
51.4 | — | 51.4 | |||||||||
| Inventory |
62.5 | — | 62.5 | |||||||||
| Prepaid expenses and other assets |
2.3 | — | 2.3 | |||||||||
| Property, plant & equipment |
92.9 | (0.7 | ) | 92.2 | ||||||||
| Goodwill |
117.1 | 0.7 | 117.8 | |||||||||
| Intangible assets |
119.0 | — | 119.0 | |||||||||
| Other assets |
2.2 | — | 2.2 | |||||||||
| Accounts payable and accrued liabilities |
(46.7 | ) | (0.2 | ) | (46.9 | ) | ||||||
| Deferred tax liabilities |
(43.3 | ) | 0.2 | (43.1 | ) | |||||||
| Other long-term liabilities |
(5.5 | ) | — | (5.5 | ) | |||||||
|
|
|
|
|
|
|
|||||||
| Total |
$ | 353.6 | $ | — | $ | 353.6 | ||||||
|
|
|
|
|
|
|
|||||||
The amount of revenues and net loss related to the S&D Acquisition included in the Company’s Consolidated Statement of Operations for the year ended December 31, 2016 for the period from the acquisition date through December 31, 2016 were $228.0 million and $2.8 million, respectively. During the year ended December 31, 2016, the Company incurred $3.5 million of acquisition-related costs associated with the S&D Acquisition, which are included in acquisition and integration expenses in the Consolidated Statement of Operations for the year ended December 31, 2016. In connection with the S&D Acquisition, the Company granted 416,951 common shares to certain S&D employees which were fully vested upon issuance and had an aggregate grant date fair value of approximately $7.1 million.
F-19
Table of Contents
Eden Acquisition
On August 2, 2016, the Company acquired Eden, a leading provider of water and coffee solutions in Europe (the “Eden Acquisition”). The initial purchase price paid by the Company was €517.9 million (U.S. $578.5 million at the exchange rate in effect on the acquisition date), which represented the €470.0 million stated purchase price, €17.5 million of cash on hand, estimated working capital of €15.4 million, and other items of €15.0 million, paid at closing in cash. The initial purchase price was subject to adjustments upon the determination of actual working capital, net indebtedness and certain transaction related expenses, and these adjustment were resolved in January 2017 by the payment of €2.0 million (U.S. $2.2 million at the exchange rate in effect on the date of payment) made by the former owners of Eden to the Company. The Eden Acquisition was ultimately funded through a combination of proceeds from the issuance of €450 million (U.S. $539.1 million at the exchange rate in effect on December 30, 2017) of 5.500% senior notes due July 1, 2024 (the “2024 Notes”) and cash on hand.
The total consideration paid by Cott in the Eden Acquisition is summarized below:
| (in millions of U.S. dollars) |
||||
| Cash paid to sellers |
$ | 86.5 | ||
| Cash paid on behalf of sellers to retire outstanding indebtedness |
420.2 | |||
| Cash paid to retire sellers financing payables, net |
71.8 | |||
| Working capital settlement |
(2.2 | ) | ||
|
|
|
|||
| Total consideration |
$ | 576.3 | ||
|
|
|
|||
The Eden Acquisition supported the Company’s strategy to become a more diversified beverage provider across multiple channels and geographies, as well as the Company’s continuing strategy to acquire higher margin HOD bottled water and coffee and tea categories. The Company has accounted for this transaction as a business combination in accordance with authoritative accounting guidance.
The adjusted purchase price of $576.3 million was allocated to the assets acquired and liabilities assumed based on management’s estimates of their fair values as of the acquisition date. The excess of the adjusted purchase price over the aggregate fair values was recorded as goodwill. Measurement period adjustments recorded during the year ended December 30, 2017 included adjustments to property, plant and equipment and a related adjustment to deferred taxes based on the results of the validation procedures performed, adjustments to accounts receivable, intangible assets and accrued liabilities based on a final review of fair values, and an adjustment to other long-term liabilities based on a final analysis of certain tax positions. These measurement period adjustments did not have a material effect on our results of operations in prior periods.
The table below summarizes the originally reported estimated acquisition date fair values, measurement period adjustments recorded and the final purchase price allocation of the assets acquired and liabilities assumed:
| (in millions of U.S. dollars) |
Originally Reported |
Measurement Period Adjustments |
Acquired Value | |||||||||
| Cash & cash equivalents |
$ | 19.6 | $ | — | $ | 19.6 | ||||||
| Accounts receivable |
95.4 | (1.0 | ) | 94.4 | ||||||||
| Inventories |
17.7 | — | 17.7 | |||||||||
| Prepaid expenses and other current assets |
6.2 | — | 6.2 | |||||||||
| Property, plant & equipment |
107.1 | (8.2 | ) | 98.9 | ||||||||
| Goodwill |
299.7 | 0.1 | 299.8 | |||||||||
| Intangible assets |
213.2 | (0.7 | ) | 212.5 | ||||||||
| Other assets |
2.8 | — | 2.8 | |||||||||
| Deferred tax assets |
19.5 | — | 19.5 | |||||||||
| Current maturities of long-term debt |
(2.7 | ) | — | (2.7 | ) | |||||||
| Accounts payable and accrued liabilities |
(128.3 | ) | (0.5 | ) | (128.8 | ) | ||||||
| Long-term debt |
(3.1 | ) | — | (3.1 | ) | |||||||
| Deferred tax liabilities |
(49.5 | ) | 3.5 | (46.0 | ) | |||||||
| Other long-term liabilities |
(21.3 | ) | 6.8 | (14.5 | ) | |||||||
|
|
|
|
|
|
|
|||||||
| Total |
$ | 576.3 | $ | — | $ | 576.3 | ||||||
|
|
|
|
|
|
|
|||||||
The amount of revenues and net loss related to the Eden Acquisition included in the Company’s Consolidated Statement of Operations for the year ended December 31, 2016 for the period from the acquisition date through December 31, 2016 were $156.9 million and $14.4 million, respectively. During the year ended December 31, 2016, the Company incurred $13.5 million of acquisition-related costs associated with the Eden Acquisition, which are included in acquisition and integration expenses in the Consolidated Statement of Operations for the year ended December 31, 2016.
F-20
Table of Contents
Aquaterra Acquisition
On January 4, 2016, the Company acquired Aquaterra (the “Aquaterra Acquisition”). Aquaterra operates a Canadian direct-to-consumer HOD bottled water and office coffee services business. The aggregate purchase price paid by the Company in the Aquaterra Acquisition was C$61.2 million (U.S. $44.0 million at the exchange rate in effect on the acquisition date). The purchase price was paid at closing in cash and was subject to a customary post-closing working capital adjustment. The post-closing adjustment was completed in May 2016 and resulted in the payment of $0.5 million by the former owners of Aquaterra to the Company.
This acquisition supported the Company’s strategy to become a more diversified beverage provider across multiple channels and geographies, as well as the Company’s strategy to acquire higher margin HOD bottled water and coffee and tea services categories. The Company has accounted for this transaction as a business combination in accordance with authoritative accounting guidance.
The adjusted purchase consideration of $44.0 million was allocated to the assets acquired and liabilities assumed based on their fair values as of the acquisition date. An allocation of the purchase price has been made to major categories of assets and liabilities based on management’s estimates of their fair values as of the acquisition date.
The table below summarizes the allocation of the purchase price to the fair value of the assets acquired and liabilities assumed:
| (in millions of U.S. dollars) |
Acquired Value | |||
| Cash |
$ | 1.3 | ||
| Accounts receivable |
7.1 | |||
| Inventories |
2.1 | |||
| Prepaid expenses and other current assets |
0.4 | |||
| Property, plant & equipment |
12.3 | |||
| Goodwill |
21.2 | |||
| Intangible assets |
15.8 | |||
| Other assets |
0.8 | |||
| Accounts payable and accrued liabilities |
(16.3 | ) | ||
| Long-term debt |
(0.4 | ) | ||
| Other long-term liabilities |
(0.3 | ) | ||
|
|
|
|||
| Total |
$ | 44.0 | ||
|
|
|
|||
The amount of revenues and net income related to the Aquaterra Acquisition included in the Company’s Consolidated Statement of Operations for the year ended December 31, 2016 for the period from the acquisition date through December 31, 2016 were $61.2 million and $1.1 million, respectively. During the year ended December 31, 2016, the Company incurred $1.3 million of acquisition-related costs associated with the Aquaterra Acquisition, which are included in acquisition and integration expenses in the Consolidated Statement of Operations for the year ended December 31, 2016.
Intangible Assets
In our determination of the estimated fair value of intangible assets, we consider, among other factors, the best use of acquired assets, analysis of historical financial performance and estimates of future performance of the acquired business’ products. The estimated fair values of identified intangible assets are calculated considering both market participant assumptions, using an income approach as well as estimates and assumptions provided by Cott management and management of the acquired business.
The estimated fair value of customer relationships represent future after-tax discounted cash flows that will be derived from sales to existing customers of the acquired business as of the date of acquisition.
F-21
Table of Contents
The estimated fair value of trademarks and trade names represent the future projected cost savings associated with the premium and brand image obtained as a result of owning the trademark or trade name as opposed to obtaining the benefit of the trademark or trade name through a royalty or rental fee.
The estimated fair value of non-competition agreements represent the future after-tax discounted cash flows that are expected to be retained by the acquired business as a result of preventing certain employees or prior owners from competing with us in the specified restricted territories for a period of time subsequent to the date of acquisition or the date of termination of their employment with Cott, as the case may be.
S&D Acquisition
The following table sets forth the components of identified intangible assets associated with the S&D Acquisition and their estimated weighted average useful lives:
| (in millions of U.S. dollars) |
Estimated Fair Market Value |
Weighted Average Estimated Useful Life | ||||
| Customer relationships |
$ | 113.7 | 17 years | |||
| Non-competition agreements |
3.0 | 3 years | ||||
| Software |
2.3 | 2 years | ||||
|
|
|
|||||
| Total |
$ | 119.0 | ||||
|
|
|
|||||
Eden Acquisition
The following table sets forth the components of identified intangible assets associated with the Eden Acquisition and their estimated weighted average useful lives:
| (in millions of U.S. dollars) |
Estimated Fair Market Value |
Estimated Useful Life | ||||
| Customer relationships |
$ | 134.1 | 15 years | |||
| Trademarks and trade names |
72.7 | Indefinite | ||||
| Software |
5.7 | 3-5 years | ||||
|
|
|
|||||
| Total |
$ | 212.5 | ||||
|
|
|
|||||
Aquaterra Acquisition
The following table sets forth the components of identified intangible assets associated with the Aquaterra Acquisition and their estimated weighted average useful lives:
| (in millions of U.S. dollars) |
Estimated Fair Market Value |
Estimated Useful Life | ||||
| Customer relationships |
$ | 11.4 | 12 years | |||
| Trademarks and trade names |
4.4 | Indefinite | ||||
|
|
|
|||||
| Total |
$ | 15.8 | ||||
|
|
|
|||||
Goodwill
S&D Acquisition
The principal factor that resulted in recognition of goodwill in the S&D Acquisition was that the purchase price was based in part on cash flow projections assuming the reduction of administration costs and the integration of acquired customers and products into our operations, which is of greater value than on a standalone basis. The goodwill recognized as part of the S&D Acquisition was allocated to the Coffee, Tea and Extract Solutions reporting segment, none of which is expected to be tax deductible.
F-22
Table of Contents
Eden Acquisition
The principal factor that resulted in recognition of goodwill in the Eden Acquisition was that the purchase price was based in part on cash flow projections assuming the reduction of administration costs and the integration of acquired customers and products into our operations, which is of greater value than on a standalone basis. The goodwill recognized as part of the Eden Acquisition was allocated to the Route Based Services reporting segment, a portion of which is expected to be tax deductible.
Aquaterra Acquisition
The principal factor that resulted in recognition of goodwill in the Aquaterra Acquisition was that the purchase price was based in part on cash flow projections assuming the reduction of administration costs and the integration of acquired customers and products into our operations, which is of greater value than on a standalone basis. The goodwill recognized as part of the Aquaterra Acquisition was allocated to the Route Based Services reporting segment, none of which is expected to be tax deductible.
Supplemental Pro Forma Data (unaudited)
The following unaudited pro forma financial information for the years ended December 31, 2016 and January 2, 2016, represent the combined results of operations as if the S&D Acquisition and Eden Acquisition had occurred on January 4, 2015. Unaudited pro forma consolidated results of operations for the Aquaterra Acquisition were not included in the combined results of our operations for the years ended December 31, 2016 and January 2, 2016 as the Company determined they were immaterial. The unaudited pro forma financial information results reflect certain adjustments related to these acquisitions such as increased amortization expense on acquired intangible assets resulting from the preliminary fair valuation of assets acquired. The unaudited pro forma financial information does not necessarily reflect the results of operations that would have occurred had we operated as a single entity during such periods.
| For the Year Ended | ||||||||
| (in millions of U.S. dollars, except per share amounts) |
December 31, 2016 |
January 2, 2016 |
||||||
| Revenue |
$ | 2,185.5 | $ | 2,157.4 | ||||
| Net loss from continuing operations |
$ | (38.6 | ) | $ | (28.6 | ) | ||
| Net loss attributed to Cott Corporation |
$ | (58.2 | ) | $ | (47.8 | ) | ||
| Net loss per common share from continuing operations |
$ | (0.28 | ) | $ | (0.25 | ) | ||
| Net loss per common share attributed to Cott Corporation, diluted |
$ | (0.42 | ) | $ | (0.41 | ) | ||
Note 4—Other (Income) Expense, Net
The following table summarizes other (income) expense, net for the years ended December 30, 2017, December 31, 2016 and January 2, 2016:
| For the Year Ended | ||||||||||||
| (in millions of U.S. dollars) |
December 30, 2017 |
December 31, 2016 |
January 2, 2016 |
|||||||||
| Foreign exchange (gains) losses |
$ | (1.7 | ) | $ | 1.9 | $ | (12.3 | ) | ||||
| Realized commodity hedging gains |
— | (5.8 | ) | — | ||||||||
| Unrealized commodity hedging loss (gain), net |
— | 9.7 | — | |||||||||
| Gain on extinguishment of long-term debt |
(1.5 | ) | — | — | ||||||||
| Other losses (gains), net |
0.2 | (0.2 | ) | (0.5 | ) | |||||||
|
|
|
|
|
|
|
|||||||
| Total |
$ | (3.0 | ) | $ | 5.6 | $ | (12.8 | ) | ||||
|
|
|
|
|
|
|
|||||||
F-23
Table of Contents
Note 5—Interest Expense
The following table summarizes interest expense, net for the years ended December 30, 2017, December 31, 2016 and January 2, 2016:
| For the Year Ended | ||||||||||||
| (in millions of U.S. dollars) |
December 30, 2017 |
December 31, 2016 |
January 2, 2016 |
|||||||||
| Interest on long-term debt |
$ | 83.1 | $ | 42.9 | $ | 30.1 | ||||||
| Other interest expense, net |
2.4 | 0.1 | — | |||||||||
|
|
|
|
|
|
|
|||||||
| Total |
$ | 85.5 | $ | 43.0 | $ | 30.1 | ||||||
|
|
|
|
|
|
|
|||||||
Note 6—Income Taxes
(Benefit) Provision for Income Taxes
(Loss) income from continuing operations, before income taxes consisted of the following:
| For the Year Ended | ||||||||||||
| (in millions of U.S. dollars) |
December 30, 2017 |
December 31, 2016 |
January 2, 2016 |
|||||||||
| Canada |
$ | (29.1 | ) | $ | (25.4 | ) | $ | 17.3 | ||||
| Outside Canada |
(4.5 | ) | (13.7 | ) | (16.7 | ) | ||||||
|
|
|
|
|
|
|
|||||||
| (Loss) income from continuing operations, before income taxes |
$ | (33.6 | ) | $ | (39.1 | ) | $ | 0.6 | ||||
|
|
|
|
|
|
|
|||||||
Income tax (benefit) expense consisted of the following:
| For the Year Ended | ||||||||||||||||
| (in millions of U.S. dollars) |
December 30, 2017 |
December 31, 2016 |
January 2, 2016 |
|||||||||||||
| Current |
||||||||||||||||
| Canada |
$ | — | $ | — | $ | 4.0 | ||||||||||
| Outside Canada |
3.9 | 1.3 | 2.9 | |||||||||||||
|
|
|
|
|
|
|
|||||||||||
| $ | 3.9 | $ | 1.3 | $ | 6.9 | |||||||||||
|
|
|
|
|
|
|
|||||||||||
| Deferred |
||||||||||||||||
| Canada |
$ | — | $ | 8.7 | $ | (1.2 | ) | |||||||||
| Outside Canada |
(33.9 | ) | 11.2 | (20.8 | ) | |||||||||||
|
|
|
|
|
|
|
|||||||||||
| $ | (33.9 | ) | $ | 19.9 | $ | (22.0 | ) | |||||||||
|
|
|
|
|
|
|
|||||||||||
| Income tax (benefit) expense |
$ | (30.0 | ) | $ | 21.2 | $ | (15.1 | ) | ||||||||
|
|
|
|
|
|
|
|||||||||||
F-24
Table of Contents
The following table reconciles income taxes calculated at the basic Canadian corporate rates with the income tax provision:
| For the Year Ended | ||||||||||||
| (in millions of U.S. dollars) |
December 30, 2017 |
December 31, 2016 |
January 2, 2016 |
|||||||||
| Income tax (benefit) expense based on Canadian statutory rates |
$ | (8.7 | ) | $ | (10.1 | ) | $ | 0.1 | ||||
| Foreign tax rate differential |
(1.3 | ) | (1.3 | ) | (0.5 | ) | ||||||
| Local taxes |
(0.2 | ) | (1.1 | ) | (1.5 | ) | ||||||
| Nontaxable interest income |
(11.3 | ) | (7.9 | ) | (5.5 | ) | ||||||
| Impact of intercompany transactions and dividends |
(9.2 | ) | (10.6 | ) | (13.8 | ) | ||||||
| Nontaxable capital gains |
(3.7 | ) | — | (1.4 | ) | |||||||
| Dividend income |
— | 1.1 | 0.9 | |||||||||
| Change in enacted tax rates |
(32.7 | ) | (0.6 | ) | 1.3 | |||||||
| Change in valuation allowance |
45.8 | 48.6 | (0.8 | ) | ||||||||
| Change in uncertain tax positions |
(2.4 | ) | (0.2 | ) | (0.7 | ) | ||||||
| Equity compensation |
1.1 | 0.6 | 0.9 | |||||||||
| Permanent differences |
(0.6 | ) | 1.8 | 0.7 | ||||||||
| Outside basis differences on discontinued operations |
(3.8 | ) | — | — | ||||||||
| Adjustments to deferred taxes |
(3.4 | ) | — | 5.5 | ||||||||
| Other items |
0.4 | 0.9 | (0.3 | ) | ||||||||
|
|
|
|
|
|
|
|||||||
| Income tax (benefit) expense |
$ | (30.0 | ) | $ | 21.2 | $ | (15.1 | ) | ||||
|
|
|
|
|
|
|
|||||||
Deferred Tax Assets and Liabilities
Deferred income tax assets and liabilities were recognized on temporary differences between the financial and tax bases of existing assets and liabilities as follows:
| (in millions of U.S. dollars) |
December 30, 2017 |
December 31, 2016 |
||||||
| Deferred tax assets |
||||||||
| Net operating loss carryforwards |
$ | 181.6 | $ | 204.1 | ||||
| Capital loss carryforwards |
4.5 | 1.1 | ||||||
| Liabilities and reserves |
35.7 | 42.5 | ||||||
| Stock options |
7.0 | 5.5 | ||||||
| Inventories |
4.5 | 5.2 | ||||||
| Interest expense |
25.4 | 31.1 | ||||||
| Outside basis differences on discontinued operations |
3.8 | — | ||||||
| Other |
4.9 | 9.4 | ||||||
|
|
|
|
|
|||||
| 267.4 | 298.9 | |||||||
|
|
|
|
|
|||||
| Deferred tax liabilities |
||||||||
| Property, plant & equipment |
(69.2 | ) | (104.5 | ) | ||||
| Intangible assets |
(165.2 | ) | (231.7 | ) | ||||
|
|
|
|
|
|||||
| (234.4 | ) | (336.2 | ) | |||||
|
|
|
|
|
|||||
| Valuation allowance |
(129.1 | ) | (117.7 | ) | ||||
|
|
|
|
|
|||||
| Net deferred tax liability |
$ | (96.1 | ) | $ | (155.0 | ) | ||
|
|
|
|
|
|||||
The following changes were made to the December 31, 2016 presentation of the temporary differences to conform with the current period presentation: Deferred tax assets associated with disallowed interest deductions were reclassed from net operating loss carryforwards to interest expense and the deferred tax asset associated with the unamortized premium on the DSS Notes was reclassed from intangible assets to interest expense.
F-25
Table of Contents
On December 22, 2017, the U.S. government enacted the Tax Act, which significantly revised the U.S. corporate income tax regime by, among other things, lowering the U.S. corporate tax rate from 35% to 21%, limiting various business deductions and repealing the corporate alternative minimum tax. Many provisions in the Tax Act are generally effective in tax years beginning after December 31, 2017. U.S. GAAP requires the impact of tax legislation to be recognized in the period in which the law was enacted. As a result of the Tax Act, we recorded tax benefits in the fourth quarter of 2017 of $32.2 million due to a re-measurement of the U.S deferred tax assets and liabilities and $1.3 million due to the repeal of the corporate alternative minimum tax. The tax benefits represent provisional amounts and our current best estimates. The provisional amounts incorporate assumptions made based upon our current interpretation of the Tax Act and may be refined through the fourth quarter of 2018 as we receive additional clarification and implementation guidance.
As a result of adopting ASU 2016-09 in 2016 on a modified retrospective basis, with a cumulative effect adjustment to opening retained earnings, the table of deferred tax assets and liabilities shown above includes deferred tax assets at December 31, 2016 that arose directly from tax deductions related to equity compensation in excess of compensation recognized for financial reporting.
As of December 30, 2017, we have outside tax basis differences, including undistributed earnings, in our foreign subsidiaries. For 2017, we recorded a deferred tax asset of $3.8 million with a corresponding valuation allowance for the reversal of certain outside basis differences related to the divestiture of the Traditional Business. Deferred taxes have not been recorded on the remaining undistributed earnings because the foreign subsidiary has the ability to repatriate funds to its parent company tax-efficiently or the undistributed earnings are indefinitely reinvested under the accounting guidance. In order to arrive at this conclusion, we considered factors including, but not limited to, past experience, domestic cash requirements, cash requirements to satisfy the ongoing operations, capital expenditures and other financial obligations of our subsidiaries. It is not practicable to determine the excess book basis over outside tax basis in the shares or the amount of incremental taxes that might arise if these earnings were to be remitted. The amount of tax payable could be significantly impacted by the jurisdiction in which a distribution was made, the amount of the distribution, foreign withholding taxes under applicable tax laws when distributed, relevant tax treaties and foreign tax credits. We repatriated earnings of $27.5 million, nil, and $17.3 million, to Canada in 2017, 2016 and 2015, respectively, incurring no tax expense.
As of December 30, 2017, we have operating loss carryforwards totaling $785.0 million, capital loss carryforwards totaling $17.8 million, and credit carryforwards totaling $4.1 million. The operating loss carryforward amount was attributable to Canadian operating loss carryforwards of $129.6 million that will expire from 2027 to 2038; U.S. federal and state operating loss carryforwards of $459.2 million and $19.6 million, respectively, that will expire from 2018 to 2038; Dutch operating loss carryfowards of $102.1 million that will expire from 2018 to 2024; and various other operating loss carryforwards of $74.5 million that will expire from 2018 to 2038.
The capital loss carryforward is attributable to Canadian capital losses of $12.9 million and Israeli capital losses of $4.9 million, all with indefinite lives. The credit carryforward is attributable to a refundable U.S. federal alternative minimum tax credit carryforward of $1.3 million, other U.S. federal credit carryforwards with a limited carryforward life of $0.9 million, and U.S. state credit carryforwards of $1.9 million that will expire from 2018 to 2022.
In general, under Section 382 and 383 of the U.S. Internal Revenue Code of 1986, as amended (the “Code”), a U.S. corporation that undergoes an “ownership change” is subject to limitations on its ability to utilize its pre-change net operating losses (“NOLs”) or tax credits to offset future taxable income. Therefore, current or future changes in our Canadian stock ownership, many of which are outside of our control, could result in a U.S. ownership change under Section 382 and 383 of the Code. If we undergo a U.S. ownership change, our ability to utilize U.S. federal or state NOLs or tax credits could be limited. We monitor changes in our ownership on an ongoing basis and do not believe we had a change of control limitation as of December 30, 2017.
We establish a valuation allowance to reduce deferred tax assets if, based on the weight of the available evidence, both positive and negative, for each respective tax jurisdiction, it is more likely than not that some portion or all of the deferred tax assets will not be realized. Due to recent cumulative losses, it was determined in 2016 that it is more likely than not we will not realize the benefit of net operating loss carryforwards and other net deferred assets in the U.S., Canada, and certain jurisdictions within the Eden business. The balance of the valuation allowance was $129.1 million and $117.7 million for the years ended December 30, 2017 and December 31, 2016, respectively. The valuation allowance increase in 2017 was primarily related to losses in tax jurisdictions with existing valuation allowances, but this increase was largely offset with valuation allowance reductions related to U.S. tax reform and recent acquisitions.
Additionally, we have determined that it is more likely than not that the benefit from our capital losses in Canada and Israel will not be realized in the future due to the uncertainty regarding potential future capital gains in the jurisdiction. In recognition of this risk, we have provided a valuation allowance of $4.5 million on our capital losses.
F-26
Table of Contents
The Transaction is anticipated to generate a taxable gain on sale in the U.S. which could result in a U.S. valuation allowance release and recognition of a material income tax benefit within the next twelve months.
Unrecognized Tax Benefits
A reconciliation of the beginning and ending amount of our unrecognized tax benefits is as follows:
| For the Year Ended | ||||||||||||
| (in millions of U.S. dollars) |
December 30, 2017 |
December 31, 2016 |
January 2, 2016 |
|||||||||
| Unrecognized tax benefits at beginning of year |
$ | 28.6 | $ | 9.9 | $ | 12.3 | ||||||
| Additions based on tax positions taken during a prior period |
0.2 | 0.2 | 0.2 | |||||||||
| Reductions based on tax positions taken during a prior period |
(6.3 | ) | — | (1.6 | ) | |||||||
| Settlement on tax positions taken during a prior period |
(1.0 | ) | (4.5 | ) | (0.6 | ) | ||||||
| Tax rate change |
(4.5 | ) | — | — | ||||||||
| Lapse in statute of limitations |
(3.2 | ) | (0.1 | ) | (1.8 | ) | ||||||
| Additions based on tax positions taken during the current period |
1.7 | 24.0 | 1.9 | |||||||||
| Foreign exchange |
0.7 | (0.9 | ) | (0.5 | ) | |||||||
|
|
|
|
|
|
|
|||||||
| Unrecognized tax benefits at end of year |
$ | 16.2 | $ | 28.6 | $ | 9.9 | ||||||
|
|
|
|
|
|
|
|||||||
As of December 30, 2017, we had $16.2 million of unrecognized tax benefits, a net decrease of $12.4 million from $28.6 million as of December 31, 2016. If we recognized our tax positions, approximately $6.2 million would favorably impact the effective tax rate. We believe it is reasonably possible that our unrecognized tax benefits will decrease or be recognized in the next twelve months by up to $3.6 million due to the settlement of certain tax positions and lapses in statutes of limitation in various tax jurisdictions.
We recognize interest and penalties related to unrecognized tax benefits in the provision for income taxes. We recovered nil of interest and penalties during the years ended December 30, 2017, December 31, 2016 and January 2, 2016. The amount of interest and penalties recognized in the Consolidated Balance Sheets for 2017 and 2016 were a liability of $0.7 million and $1.8 million, respectively.
Years through 2009 have been audited by the U.S. Internal Revenue Service, though the statutes are still open back to 2008 due to certain net operating loss carryforwards. Years prior to 2012 are closed to audit by U.S. state jurisdictions. We are currently under audit in Canada by the Canada Revenue Agency (“CRA”) for tax years 2013 to 2015. Years prior to 2012 are closed to audit by the CRA. We are currently under audit in Israel for the 2013 to 2015 tax years and in Poland for the 2014 and 2016 tax years.
Note 7—Share-based Compensation
Our shareowners approved our Amended and Restated Cott Corporation Equity Incentive Plan (the “Amended and Restated Equity Plan”) in its current form in May 2015. Awards under the Amended and Restated Equity Plan may be in the form of incentive stock options, non-qualified stock options, restricted shares, restricted share units, performance shares, performance units, stock appreciation rights, and stock payments to employees, directors and outside consultants. The Amended and Restated Equity Plan is administered by the Human Resources and Compensation Committee (“HRCC”) or any other board committee as may be designated by the board from time to time. Under the Amended and Restated Equity Plan, 20,000,000 shares are reserved for future issuance subject to adjustment upon a share split, share dividend, recapitalization, and other similar transactions and events. Shares that are issued under the Amended and Restated Equity Plan are applied to reduce the maximum number of shares remaining available for issuance under the Amended and Restated Equity Plan; provided that the total number of shares available for issuance under the Amended and Restated Plan is reduced two shares for each share issued pursuant to a “full-value” award (i.e., an award other than an option or stock appreciation right).
Shares to be issued pursuant to Time-based RSUs, Performance-based RSUs, or stock options that are forfeited, expired, or are cancelled or settled without the issuance of shares return to the pool of shares available for issuance under the Amended and Restated Equity Plan. As of December 30, 2017, there were 2,432,533 shares available for future issuance under the Amended and Restated Equity Plan.
F-27
Table of Contents
The table below summarizes the share-based compensation expense for the years ended December 30, 2017, December 31, 2016, and January 2, 2016. Share-based compensation expense is recorded in SG&A expenses in the Consolidated Statements of Operations. As referenced below: (i) “Performance-based RSUs” represent restricted share units with performance-based vesting, (ii) “Time-based RSUs” represent restricted share units with time-based vesting, (iii) “Stock options” represent non-qualified stock options, (iv) “Director share awards” represent common shares issued in consideration of the annual board retainer fee to non-management members of our board of directors, and (v) the “ESPP” represents the Cott Corporation Employee Share Purchase Plan, under which common shares are issued to eligible employees at a discount through payroll deductions.
| For the Year Ended | ||||||||||||
| (in millions of U.S. dollars) |
December 30, 2017 |
December 31, 2016 |
January 2, 2016 |
|||||||||
| Stock options |
$ | 5.5 | $ | 3.7 | $ | 1.9 | ||||||
| Performance-based RSUs |
12.0 | 1.3 | 4.9 | |||||||||
| Time-based RSUs |
4.2 | 3.3 | 2.4 | |||||||||
| Director share awards |
1.1 | 0.9 | 1.0 | |||||||||
| Employee Share Purchase Plan |
0.1 | 0.2 | 0.1 | |||||||||
|
|
|
|
|
|
|
|||||||
| Total 1 |
$ | 22.9 | $ | 9.4 | $ | 10.3 | ||||||
|
|
|
|
|
|
|
|||||||
| 1. | Includes $5.4 million, $2.4 million and $2.7 million of share-based compensation expense from our discontinued operations, which were included in net income (loss) from discontinued operations, net of income taxes on the Consolidated Statements of Operations for the years ended December 30, 2017, December 31, 2016 and January 2, 2016, respectively. |
During the third quarter of 2017, in connection with the sale of the Traditional Business and upon a determination by the HRCC, outstanding awards granted to Traditional Business employees vested as follows: outstanding time-based RSUs vested in full, outstanding unvested stock options vested in full (and remain exercisable for three years from the date of closing of the Transaction), and outstanding performance-based RSUs vested in full, assuming achievement of the applicable pre-tax income level at the “target” level. As a result, an additional $1.2 million of expense was recorded for the year ended December 30, 2017 and included in net income (loss) from discontinued operations, net of income taxes on the Consolidated Statement of Operations.
The tax benefit recognized related to share-based compensation expense for the fiscal year ended December 30, 2017 was $0.5 million (December 31, 2016 - $2.8 million; January 2, 2016 - $2.7 million).
As of December 30, 2017, the unrecognized share-based compensation expense and weighted average years over which we expect to recognize it as compensation expense were as follows:
| (in millions of U.S. dollars, except years) |
Unrecognized share-based compensation expense as of December 30, 2017 |
Weighted average years expected to recognize compensation |
||||||
| Stock options |
$ | 5.3 | 1.6 | |||||
| Performance-based RSUs |
12.8 | 2.0 | ||||||
| Time-based RSUs |
3.7 | 1.6 | ||||||
|
|
|
|||||||
| Total |
$ | 21.8 | ||||||
|
|
|
|||||||
Stock Options
During 2017, 2016 and 2015 approximately 734,500, 2,975,500, and 684,000 options were granted to certain employees under the Amended and Restated Equity Plan at a weighted-average exercise price of $17.50, $11.15, and $9.22 per share, respectively. The weighted-average grant date fair value of the options was estimated to be $4.82, $2.84, and $4.31 per share in 2017, 2016 and 2015, respectively, using the Black-Scholes option pricing model. The contractual term of an option granted is fixed by the Amended and Restated Equity plan and cannot exceed ten years from the grant date.
The grant date fair value of each option granted during 2017, 2016 and 2015 was estimated on the date of grant using the Black-Scholes option pricing model with the following weighted-average assumptions:
| For the Year Ended | ||||||||||||
| December 30, 2017 |
December 31, 2016 |
January 2, 2016 |
||||||||||
| Risk-free interest rate |
2.3 | % | 1.9 | % | 2.0 | % | ||||||
| Average expected life (years) |
6.0 | 6.2 | 10.0 | |||||||||
| Expected volatility |
29.2 | % | 30.7 | % | 58.7 | % | ||||||
| Expected dividend yield |
1.4 | % | 2.2 | % | 3.0 | % | ||||||
F-28
Table of Contents
The following table summarizes the activity for Company stock options:
| Stock Options (in thousands) |
Weighted average exercise price |
Weighted average contractual term (years) |
Aggregate intrinsic value (in thousands) |
|||||||||||||
| Outstanding at January 3, 2015 |
1,221 | $ | 7.77 | 7.6 | $ | 400.7 | ||||||||||
|
|
|
|
|
|
|
|
|
|||||||||
| Granted |
684 | 9.22 | ||||||||||||||
| Exercised |
(113 | ) | 4.94 | 637.4 | ||||||||||||
| Forfeited or expired |
(35 | ) | 8.56 | |||||||||||||
|
|
|
|
|
|
|
|
|
|||||||||
| Outstanding at January 2, 2016 |
1,757 | $ | 8.50 | 8.0 | $ | 4,373.8 | ||||||||||
|
|
|
|
|
|
|
|
|
|||||||||
| Granted |
2,976 | 11.15 | ||||||||||||||
| Exercised |
(238 | ) | 7.29 | 2,304.7 | ||||||||||||
| Forfeited or expired |
(21 | ) | 9.99 | |||||||||||||
|
|
|
|
|
|
|
|
|
|||||||||
| Outstanding at December 31, 2016 |
4,474 | $ | 10.32 | 8.8 | $ | 5,623.3 | ||||||||||
|
|
|
|
|
|
|
|
|
|||||||||
| Granted |
734 | 17.50 | ||||||||||||||
| Exercised |
(169 | ) | 9.21 | 1,092.9 | ||||||||||||
| Forfeited or expired |
(33 | ) | 10.28 | |||||||||||||
|
|
|
|
|
|
|
|
|
|||||||||
| Outstanding at December 30, 2017 |
5,006 | $ | 11.41 | 8.1 | $ | 26,952.3 | ||||||||||
|
|
|
|
|
|
|
|
|
|||||||||
| Exercisable at December 30, 2017 |
2,402 | $ | 9.74 | 6.1 | $ | 16,647.8 | ||||||||||
|
|
|
|
|
|
|
|
|
|||||||||
| Vested or expected to vest at December 30, 2017 |
5,006 | $ | 11.41 | 7.8 | $ | 26,952.3 | ||||||||||
|
|
|
|
|
|
|
|
|
|||||||||
The aggregate intrinsic value amounts in the table above represent the difference between the closing price of our common shares on the New York Stock Exchange on December 29, 2017, which was $16.66 (December 30, 2016—$11.33; December 31, 2015—$10.99), and the exercise price, multiplied by the number of in-the-money stock options as of the same date.
Stock options granted during the year ended December 30, 2017 vest in three equal annual installments on the first, second and third anniversaries of the date of grant.
The total amount of cash received from the exercise of stock options was $1.6 million during the fiscal year ended December 30, 2017 with no associated tax benefit realized. The total amount of cash received from the exercise of stock options was $1.7 million during the fiscal year ended December 31, 2016 with an associated tax benefit of $1.3 million. The total amount of cash received from the exercise of stock options was $0.5 million during the fiscal year ended January 2, 2016 with no associated tax benefit realized. The total fair value of options that vested during the year ended December 30, 2017 was $16.4 million (December 31, 2016 — $1.6 million; January 2, 2016 — $1.5 million).
Other Awards
In 2017, we granted 84,060 common shares to the non-management members of our board of directors under the Amended and Restated Equity Plan with a grant date fair value of approximately $1.1 million. The common shares were issued in consideration of the directors’ annual board retainer fee and were vested upon issuance.
Additionally, in 2017, we granted 33,030 Performance-based RSUs, which vest on the last day of our 2019 fiscal year, and 202,269 Performance-based RSUs, which vest on the last day of our 2020 fiscal year. The number of shares ultimately awarded will be based upon the performance percentage, which can range from 0% to 200% of the awards granted. The Performance-based RSUs vest primarily on the Company’s achievement of a specified level of cumulative pre-tax income for the applicable performance period. The number of Performance-based RSUs that may vest and the related unrecognized compensation cost is subject to change based on the level of targeted pre-tax income that is achieved during the vesting period. The Company also granted 134,840 Time-based RSUs, which vest in three equal annual installments on the first, second and third anniversaries of the date of grant and are based upon a service condition.
F-29
Table of Contents
| Number of Performance- based RSUs (in thousands) |
Weighted Average Grant-Date Fair Value |
Number of Time-based RSUs (in thousands) |
Weighted Average Grant-Date Fair Value |
|||||||||||||||||
| Balance at January 3, 2015 |
1,782 | 7.01 | 664 | 8.63 | ||||||||||||||||
|
|
|
|
|
|
|
|
|
|||||||||||||
| Awarded |
320 | 9.22 | 213 | 9.22 | ||||||||||||||||
| Awarded in connection with modification |
55 | 7.90 | — | — | ||||||||||||||||
| Issued |
(255 | ) | 6.87 | (10 | ) | 8.60 | ||||||||||||||
| Forfeited |
(24 | ) | 8.61 | (40 | ) | 8.67 | ||||||||||||||
|
|
|
|
|
|
|
|
|
|||||||||||||
| Balance at January 2, 2016 |
1,878 | 7.41 | 827 | 8.78 | ||||||||||||||||
|
|
|
|
|
|
|
|
|
|||||||||||||
| Awarded |
835 | 11.18 | 503 | 11.18 | ||||||||||||||||
| Awarded in connection with acquisitions 1 |
584 | 15.81 | 514 | 16.52 | ||||||||||||||||
| Issued 2 |
— | — | (1,027 | ) | 12.01 | |||||||||||||||
| Cancelled |
(224 | ) | 9.29 | — | — | |||||||||||||||
| Forfeited |
(10 | ) | 9.24 | (17 | ) | 8.50 | ||||||||||||||
|
|
|
|
|
|
|
|
|
|||||||||||||
| Outstanding at December 31, 2016 |
3,063 | $ | 9.89 | 800 | $ | 11.10 | ||||||||||||||
|
|
|
|
|
|
|
|
|
|||||||||||||
| Awarded |
235 | 17.06 | 135 | 17.50 | ||||||||||||||||
| Awarded in connection with modification |
64 | 11.32 | — | — | ||||||||||||||||
| Issued |
(320 | ) | 8.00 | (409 | ) | 10.55 | ||||||||||||||
| Forfeited |
(143 | ) | 15.18 | (24 | ) | 12.28 | ||||||||||||||
|
|
|
|
|
|
|
|
|
|||||||||||||
| Outstanding at December 30, 2017 |
2,899 | 9.15 | 502 | 13.14 | ||||||||||||||||
|
|
|
|
|
|
|
|
|
|||||||||||||
| Vested or expected to vest at December 30, 2017 |
2,235 | $ | 12.21 | 493 | $ | 13.13 | ||||||||||||||
|
|
|
|
|
|
|
|
|
|||||||||||||
| 1. | Represents shares that were awarded to Eden and S&D employees in connection with the Eden Acquisition and S&D Acquisition. |
| 2. | Includes 416,951 common shares granted to certain S&D employees in connection with the S&D Acquisition; the common shares were fully vested upon issuance. |
The total fair value of Performance-based RSUs vested and issued during the years ended December 30, 2017 January 2, 2016 were $2.6 million and $1.8 million. There were no Performance-based RSUs vested and issued during the year ended December 31, 2016. The total fair value of Time-based RSUs vested and issued during the years ended December 30, 2017, December 31, 2016, and January 2, 2016 were $4.3 million, $12.3 million, and $0.1 million.
Employee Share Purchase Plan
The Company has maintained the Cott Corporation Employee Share Purchase Plan (the “ESPP”) since 2015. The ESPP qualifies as an “employee share purchase plan” under Section 423 of the Internal Revenue Code of 1986 (“IRC”), as amended. Substantially all employees are eligible to participate in the ESPP and may elect to participate at the beginning of any quarterly offering period. The ESPP authorizes the issuance, and the purchase by eligible employees, of up to 3,000,000 shares of Cott common shares through payroll deductions. Eligible employees who choose to participate may purchase Cott common shares at 90% of market value on the first or last day of the quarterly offering period, whichever is lower. The minimum contribution which an eligible employee may make under the ESPP is 1% of the employee’s eligible compensation, with the maximum contribution limited to 15% of the employee’s eligible compensation. At the end of each quarterly offering period for which the employee participates, the total amount of each employee’s payroll deduction for that offering period will be used to purchase Cott common shares. The Company recognized $0.1 million, $0.2 million and $0.1 million of share-based compensation expense in SG&A expenses in the Consolidated Statement of Operations for 2017, 2016 and 2015, respectively. At December 30, 2017, 2,735,506 shares remained available for issuance under the ESPP.
F-30
Table of Contents
Note 8—Common Shares and Net (Loss) Income per Common Share
Common Shares
On June 29, 2016, we completed a public offering, on a bought deal basis, of 15,088,000 common shares at a price of $15.25 per share for total gross proceeds to us of $230.1 million (the “June 2016 Offering”). We incurred and recorded $9.2 million of underwriter commissions and $1.1 million in professional fees in connection with the June 2016 Offering. The net proceeds of the June 2016 Offering were used to repay borrowings under our ABL facility, to finance the S&D Acquisition and for general corporate purposes.
On March 9, 2016, we completed a public offering, on a bought deal basis, of 12,765,000 common shares at a price of $11.80 per share for total gross proceeds to us of $150.6 million (the “March 2016 Offering”). We incurred and recorded $6.0 million of underwriter commissions and $0.8 million in professional fees in connection with the March 2016 Offering. The net proceeds of the March 2016 Offering were used to repay borrowings under our ABL facility and for general corporate purposes.
Net (Loss) Income Per Common Share
Basic net (loss) income per common share is calculated by dividing net (loss) income attributable to Cott Corporation by the weighted average number of common shares outstanding during the periods presented. Diluted net (loss) income per common share is calculated by dividing diluted net (loss) income attributable to Cott Corporation by the weighted average number of common shares outstanding adjusted to include the effect, if dilutive, of the exercise of in-the-money stock options, Performance-based RSUs, and Time-based RSUs during the periods presented.
Set forth below is a reconciliation of the numerator and denominator for the diluted net (loss) income per common share computations for the periods indicated:
| For the Year Ended | ||||||||||||
| December 30, 2017 |
December 31, 2016 |
January 2, 2016 |
||||||||||
| Numerator (in millions): |
||||||||||||
| Net (loss) income attributable to Cott Corporation |
||||||||||||
| Continuing operations |
$ | (3.6 | ) | $ | (60.3 | ) | $ | (2.2 | ) | |||
| Discontinued operations |
2.2 | (17.5 | ) | (1.2 | ) | |||||||
|
|
|
|
|
|
|
|||||||
| Net losses |
(1.4 | ) | (77.8 | ) | (3.4 | ) | ||||||
|
|
|
|
|
|
|
|||||||
| Basic Earnings Per Share |
||||||||||||
| Denominator (in thousands): |
||||||||||||
| Weighted average common shares outstanding - basic |
139,078 | 128,290 | 103,037 | |||||||||
| Basic Earnings Per Share: |
||||||||||||
| Continuing operations |
(0.03 | ) | (0.47 | ) | (0.02 | ) | ||||||
| Discontinued operations |
0.02 | (0.14 | ) | (0.01 | ) | |||||||
|
|
|
|
|
|
|
|||||||
| Net losses |
(0.01 | ) | (0.61 | ) | (0.03 | ) | ||||||
|
|
|
|
|
|
|
|||||||
| Diluted Earnings Per Share |
||||||||||||
| Denominator (in thousands): |
||||||||||||
| Weighted average common shares outstanding - basic |
139,078 | 128,290 | 103,037 | |||||||||
| Dilutive effect of Stock Options |
— | — | — | |||||||||
| Dilutive effect of Performance based RSUs |
— | — | — | |||||||||
| Dilutive effect of Time-based RSUs |
— | — | — | |||||||||
|
|
|
|
|
|
|
|||||||
| Weighted average common shares outstanding - diluted |
139,078 | 128,290 | 103,037 | |||||||||
| Diluted Earnings Per Share: |
||||||||||||
| Continued operations |
(0.03 | ) | (0.47 | ) | (0.02 | ) | ||||||
| Discontinued operations |
0.02 | (0.14 | ) | (0.01 | ) | |||||||
|
|
|
|
|
|
|
|||||||
| Net losses |
(0.01 | ) | (0.61 | ) | (0.03 | ) | ||||||
|
|
|
|
|
|
|
|||||||
F-31
Table of Contents
The following table summarizes anti-dilutive securities excluded from the computation of diluted net (loss) income per common share for the periods indicated:
| For the Year Ended | ||||||||||||
| (in thousands) |
December 30, 2017 |
December 31, 2016 |
January 2, 2016 |
|||||||||
| Stock options |
5,006 | 4,474 | 1,757 | |||||||||
| Performance-based RSUs 1 |
2,235 | 2,070 | 1,631 | |||||||||
| Time-based RSUs 2 |
493 | 800 | 827 | |||||||||
| 1. | Performance-based RSUs represent the number of shares expected to be issued based on the estimated achievement of pre-tax income for these awards. |
| 2. | Time-based RSUs represent the number of shares expected to be issued based on known employee retention information. |
Note 9—Segment Reporting
Our broad portfolio of products include bottled water, coffee, brewed tea, water dispensers, coffee and tea brewers, speciality coffee, liquid coffee or tea concentrate, single cup coffee, cold brewed coffee, iced blend coffee or tea beverages, blended teas, hot tea, sparkling tea, coffee or tea extract solutions, filtration equipment, hot chocolate, soups, malt drinks, creamers/whiteners, cereals, beverage concentrates and mineral water.
At the beginning of 2017, our business operated through four reporting segments: Water and Coffee Solutions (which included our DSS, Aquaterra, Eden and S&D businesses), Cott North America, Cott U.K. and All Other (which included our Mexico and RCI operating segments).
During the third quarter of 2017, we reviewed our reporting segments as a result of the Transaction. Following such review, we reorganized our reporting segments into three reporting segments: Route Based Services (which includes our DSS, Aquaterra and Eden businesses), Coffee, Tea and Extract Solutions (which includes our S&D business) and All Other (which includes our Aimia, Decantae, and RCI concentrate businesses, our Columbus, Georgia manufacturing facility and other miscellaneous expenses). Our corporate oversight function is not treated as a segment. This function includes certain general and administrative costs that are not allocated to any of the reporting segments. Our segment reporting results have been recast to reflect these changes for all periods presented.
| December 30, 2017 | ||||||||||||||||||||
| (in millions of U.S. dollars) |
Route Based Services |
Coffee, Tea and Extract Solutions |
All Other |
Corporate | Total | |||||||||||||||
| Revenue, net 1 |
$ | 1,501.7 | $ | 602.2 | $ | 165.8 | $ | — | $ | 2,269.7 | ||||||||||
| Depreciation and amortization |
158.3 | 22.7 | 7.6 | — | 188.6 | |||||||||||||||
| Operating income (loss) |
77.0 | 15.7 | 1.2 | (45.0 | ) | 48.9 | ||||||||||||||
| Property, plant & equipment, net |
482.2 | 89.1 | 12.9 | — | 584.2 | |||||||||||||||
| Goodwill |
936.7 | 117.8 | 50.2 | — | 1,104.7 | |||||||||||||||
| Intangible assets, net |
564.5 | 110.8 | 75.8 | — | 751.1 | |||||||||||||||
| Total segment assets 2 |
2,343.4 | 455.7 | 207.8 | — | 3,006.9 | |||||||||||||||
| Additions to property, plant & equipment |
99.1 | 19.0 | 3.2 | — | 121.3 | |||||||||||||||
| 1. | All Other includes $41.1 million of related party concentrate sales to discontinued operations for the year ended December 30, 2017. |
| 2. | Excludes intersegment receivables, investments and notes receivable. |
F-32
Table of Contents
| December 31, 2016 | ||||||||||||||||||||
|
(in millions of U.S. dollars) |
Route Based Services |
Coffee, Tea and Extract Solutions |
All Other |
Corporate | Total | |||||||||||||||
| Revenue, net 1 |
$ | 1,224.3 | $ | 228.0 | $ | 170.9 | $ | — | $ | 1,623.2 | ||||||||||
| Depreciation and amortization |
136.0 | 8.0 | 7.1 | — | 151.1 | |||||||||||||||
| Operating income (loss) |
41.2 | 5.3 | 8.0 | (45.0 | ) | 9.5 | ||||||||||||||
| Property, plant & equipment, net |
480.2 | 91.0 | 10.6 | — | 581.8 | |||||||||||||||
| Goodwill |
886.5 | 117.1 | 44.7 | — | 1,048.3 | |||||||||||||||
| Intangible assets, net |
569.6 | 116.6 | 72.8 | — | 759.0 | |||||||||||||||
| Total segment assets 2 |
2,287.1 | 463.2 | 170.8 | — | 2,921.1 | |||||||||||||||
| Additions to property, plant & equipment |
87.7 | 6.0 | 1.4 | — | 95.1 | |||||||||||||||
| 1. | All Other includes $37.4 million of related party concentrate sales to discontinued operations for the year ended December 31, 2016. |
| 2. | Excludes intersegment receivables, investments and notes receivable. |
| January 2, 2016 | ||||||||||||||||||||
| (in millions of U.S. dollars) |
Route Based Services |
Coffee, Tea and Extract Solutions |
All Other |
Corporate | Total | |||||||||||||||
| Revenue, net 1 |
$ | 1,021.2 | $ | — | $ | 166.1 | $ | — | 1,187.3 | |||||||||||
| Depreciation and amortization |
119.9 | — | 8.4 | — | 128.3 | |||||||||||||||
| Operating (loss) income |
39.0 | — | 8.8 | (29.9 | ) | 17.9 | ||||||||||||||
| Additions to property, plant & equipment |
66.9 | — | 2.7 | — | 69.6 | |||||||||||||||
| 1. | All Other includes $36.8 million of related party concentrate sales to discontinued operations for the year ended January 2, 2016. |
| Reconciliation of Segment Assets to Total Assets (in millions of U.S. dollars) |
December 30, 2017 | December 31, 2016 | ||||||
| Segment assets 1 |
$ | 3,006.9 | $ | 2,921.1 | ||||
| Assets of discontinued operations 1 |
1,086.2 | 1,018.6 | ||||||
|
|
|
|
|
|||||
| Total assets |
$ | 4,093.1 | $ | 3,939.7 | ||||
|
|
|
|
|
|||||
Credit risk arises from the potential default of a customer in meeting its financial obligations to us. Concentrations of credit exposure may arise with a group of customers that have similar economic characteristics or that are located in the same geographic region. The ability of such customers to meet obligations would be similarly affected by changing economic, political or other conditions. We are not currently aware of any facts that would create a material credit risk.
Our Traditional Business experienced some customer concentration. Following the closing of the Transaction on January 30, 2018, we have limited customer concentration, of which no customer accounts for more than 10% of our net revenues.
F-33
Table of Contents
Revenues are attributed to countries based on location of customer. Revenues generated from sales to external customers by geographic area were as follows:
| For the Year Ended | ||||||||||||
| (in millions of U.S. dollars) |
December 30, 2017 |
December 31, 2016 |
January 2, 2016 |
|||||||||
| United States |
$ | 1,709.0 | $ | 1,299.0 | $ | 1,085.6 | ||||||
| United Kingdom |
160.0 | 130.3 | 101.7 | |||||||||
| Canada |
61.8 | 61.2 | — | |||||||||
| All other countries |
338.9 | 132.7 | — | |||||||||
|
|
|
|
|
|
|
|||||||
| Total |
$ | 2,269.7 | $ | 1,623.2 | $ | 1,187.3 | ||||||
|
|
|
|
|
|
|
|||||||
Revenues by channel by reporting segment were as follows:
| For the Year Ended December 30, 2017 | ||||||||||||||||
| (in millions of U.S. dollars) |
Route Based Services |
Coffee, Tea and Extract Solutions |
All Other |
Total | ||||||||||||
| Revenue, net |
||||||||||||||||
| Home and office bottled water delivery |
$ | 990.6 | $ | — | $ | — | $ | 990.6 | ||||||||
| Coffee and tea services |
184.2 | 501.7 | 2.6 | 688.5 | ||||||||||||
| Retail |
166.7 | — | 65.3 | 232.0 | ||||||||||||
| Other |
160.2 | 100.5 | 97.9 | 358.6 | ||||||||||||
|
|
|
|
|
|
|
|
|
|||||||||
| Total |
$ | 1,501.7 | $ | 602.2 | $ | 165.8 | $ | 2,269.7 | ||||||||
|
|
|
|
|
|
|
|
|
|||||||||
| For the Year Ended December 31, 2016 | ||||||||||||||||
| (in millions of U.S. dollars) |
Route Based Services |
Coffee, Tea and Extract Solutions |
All Other |
Total | ||||||||||||
| Revenue, net |
||||||||||||||||
| Home and office bottled water delivery |
$ | 799.4 | $ | — | $ | — | $ | 799.4 | ||||||||
| Coffee and tea services |
146.8 | 187.8 | 2.6 | 337.2 | ||||||||||||
| Retail |
164.6 | — | 51.7 | 216.3 | ||||||||||||
| Other |
113.5 | 40.2 | 116.6 | 270.3 | ||||||||||||
|
|
|
|
|
|
|
|
|
|||||||||
| Total |
$ | 1,224.3 | $ | 228.0 | $ | 170.9 | $ | 1,623.2 | ||||||||
|
|
|
|
|
|
|
|
|
|||||||||
| For the Year Ended January 2, 2016 | ||||||||||||||||
| (in millions of U.S. dollars) |
Route Based Services |
Coffee, Tea and Extract Solutions |
All Other |
Total | ||||||||||||
| Revenue, net |
||||||||||||||||
| Home and office bottled water delivery |
$ | 651.3 | $ | — | $ | — | $ | 651.3 | ||||||||
| Coffee and tea services |
121.3 | — | — | 121.3 | ||||||||||||
| Retail |
149.4 | — | 61.8 | 211.2 | ||||||||||||
| Other |
99.2 | — | 104.3 | 203.5 | ||||||||||||
|
|
|
|
|
|
|
|
|
|||||||||
| Total |
$ | 1,021.2 | $ | — | $ | 166.1 | $ | 1,187.3 | ||||||||
|
|
|
|
|
|
|
|
|
|||||||||
Property, plant & equipment, net by geographic area as of December 30, 2017 and December 31, 2016 were as follows:
| (in millions of U.S. dollars) |
December 30, 2017 |
December 31 2016 |
||||||
| United States |
$ | 452.3 | $ | 459.4 | ||||
| Canada |
14.2 | 14.2 | ||||||
| All other countries 1 |
117.7 | 108.2 | ||||||
|
|
|
|
|
|||||
| Total |
$ | 584.2 | $ | 581.8 | ||||
|
|
|
|
|
|||||
| 1. | No individual country is greater than 10% of total property, plant and equipment as of December 30, 2017 and December 31, 2016. |
F-34
Table of Contents
Note 10—Accounts Receivable, Net
The following table summarizes accounts receivable, net as of December 30, 2017 and December 31, 2016:
| (in millions of U.S. dollars) |
December 30, 2017 | December 31, 2016 | ||||||
| Trade receivables |
$ | 275.5 | $ | 255.2 | ||||
| Allowance for doubtful accounts |
(7.8 | ) | (6.3 | ) | ||||
| Other |
17.3 | 27.8 | ||||||
|
|
|
|
|
|||||
| Total |
$ | 285.0 | $ | 276.7 | ||||
|
|
|
|
|
|||||
Note 11—Inventories
The following table summarizes inventories as of December 30, 2017 and December 31, 2016:
| (in millions of U.S. dollars) |
December 30, 2017 | December 31, 2016 | ||||||
| Raw materials |
$ | 68.1 | $ | 56.5 | ||||
| Finished goods |
34.3 | 42.7 | ||||||
| Resale items |
21.8 | 22.0 | ||||||
| Other |
3.4 | 3.4 | ||||||
|
|
|
|
|
|||||
| Total |
$ | 127.6 | $ | 124.6 | ||||
|
|
|
|
|
|||||
Note 12—Property, Plant & Equipment, Net
The following table summarizes property, plant and equipment, net as of December 30, 2017 and December 31, 2016:
| December 30, 2017 | December 31, 2016 | |||||||||||||||||||||||||||
| (in millions of U.S. dollars) |
Estimated Useful Life in Years |
Cost | Accumulated Depreciation |
Net | Cost | Accumulated Depreciation |
Net | |||||||||||||||||||||
| Land |
n/a | $ | 82.9 | $ | — | $ | 82.9 | $ | 82.0 | $ | — | $ | 82.0 | |||||||||||||||
| Buildings |
10-40 | 88.9 | 14.8 | 74.1 | 102.7 | 10.2 | 92.5 | |||||||||||||||||||||
| Machinery and equipment |
5-15 | 142.3 | 53.5 | 88.8 | 120.8 | 31.6 | 89.2 | |||||||||||||||||||||
| Plates, films and molds |
1-10 | 0.4 | 0.3 | 0.1 | 0.3 | 0.2 | 0.1 | |||||||||||||||||||||
| Vehicles and transportation equipment |
3-15 | 87.3 | 41.3 | 46.0 | 85.3 | 28.9 | 56.4 | |||||||||||||||||||||
| Leasehold improvements 1 |
34.1 | 8.5 | 25.6 | 18.4 | 4.8 | 13.6 | ||||||||||||||||||||||
| IT Systems |
3-7 | 12.4 | 6.4 | 6.0 | 10.6 | 3.9 | 6.7 | |||||||||||||||||||||
| Furniture and fixtures |
3-10 | 11.3 | 4.1 | 7.2 | 7.2 | 2.4 | 4.8 | |||||||||||||||||||||
| Customer equipment 2 |
3-7 | 303.1 | 90.9 | 212.2 | 255.4 | 61.5 | 193.9 | |||||||||||||||||||||
| Returnable bottles 3 |
3-5 | 51.8 | 16.4 | 35.4 | 54.4 | 16.6 | 37.8 | |||||||||||||||||||||
| Capital leases 4 |
6.6 | 0.7 | 5.9 | 5.1 | 0.3 | 4.8 | ||||||||||||||||||||||
|
|
|
|
|
|
|
|
|
|
|
|
|
|||||||||||||||||
| Total |
$ | 821.1 | $ | 236.9 | $ | 584.2 | $ | 742.2 | $ | 160.4 | $ | 581.8 | ||||||||||||||||
|
|
|
|
|
|
|
|
|
|
|
|
|
|||||||||||||||||
| 1. | Leasehold improvements are amortized over the shorter of their estimated useful lives or the related lease life. |
| 2. | Customer equipment for the Route Based Services reporting segment consists of coolers, brewers, refrigerators, water purification devices and storage racks held on site at customer locations. |
| 3. | Returnable bottles are those bottles on site at Route Based Services customer locations. |
| 4. | Our recorded assets under capital leases relate to machinery and equipment, IT systems, customer equipment and vehicles and transportation equipment. |
F-35
Table of Contents
The amounts above include construction in progress of $11.3 million and $3.0 million for 2017 and 2016, respectively.
Depreciation expense, which includes depreciation recorded for assets under capital leases, for the year ended December 30, 2017 was $120.0 million (2016 - $97.8 million; 2015 - $81.6 million).
Note 13—Intangible assets
The following table summarizes intangible assets as of December 30, 2017 and December 31, 2016:
| December 30, 2017 | December 31, 2016 | |||||||||||||||||||||||
| (in millions of U.S. dollars) |
Cost | Accumulated Amortization |
Net | Cost | Accumulated Amortization |
Net | ||||||||||||||||||
| Intangibles |
||||||||||||||||||||||||
| Not subject to amortization |
||||||||||||||||||||||||
| Rights 1 |
$ | 24.5 | — | $ | 24.5 | $ | 24.5 | — | $ | 24.5 | ||||||||||||||
| Trademarks |
264.1 | — | 264.1 | 257.1 | — | 257.1 | ||||||||||||||||||
|
|
|
|
|
|
|
|
|
|
|
|
|
|||||||||||||
| Total intangibles not subject to amortization |
$ | 288.6 | — | $ | 288.6 | $ | 281.6 | — | $ | 281.6 | ||||||||||||||
|
|
|
|
|
|
|
|
|
|
|
|
|
|||||||||||||
| Subject to amortization |
||||||||||||||||||||||||
| Customer relationships |
583.4 | 154.7 | 428.7 | 552.3 | 94.3 | 458.0 | ||||||||||||||||||
| Patents |
15.2 | 1.0 | 14.2 | — | — | — | ||||||||||||||||||
| Software |
28.8 | 13.0 | 15.8 | 20.5 | 6.3 | 14.2 | ||||||||||||||||||
| Other |
8.0 | 4.2 | 3.8 | 7.3 | 2.1 | 5.2 | ||||||||||||||||||
|
|
|
|
|
|
|
|
|
|
|
|
|
|||||||||||||
| Total intangibles subject to amortization |
$ | 635.4 | $ | 172.9 | $ | 462.5 | $ | 580.1 | $ | 102.7 | $ | 477.4 | ||||||||||||
|
|
|
|
|
|
|
|
|
|
|
|
|
|||||||||||||
| Total intangible assets |
$ | 924.0 | $ | 172.9 | $ | 751.1 | $ | 861.7 | $ | 102.7 | $ | 759.0 | ||||||||||||
|
|
|
|
|
|
|
|
|
|
|
|
|
|||||||||||||
| 1. | Relates to the 2001 acquisition of the Rights. |
Amortization expense of intangible assets was $68.6 million during 2017 (2016 - $53.3 million; 2015 - $46.7 million).
The estimated amortization expense for intangible assets subject to amortization over the next five years is:
| (in millions of U.S. dollars) |
||||
| 2018 |
$ | 67.8 | ||
| 2019 |
60.3 | |||
| 2020 |
51.3 | |||
| 2021 |
44.4 | |||
| 2022 |
38.7 | |||
| Thereafter |
200.0 | |||
|
|
|
|||
| Total |
$ | 462.5 | ||
|
|
|
|||
F-36
Table of Contents
Note 14—Accounts Payable and Accrued Liabilities
The following table summarizes accounts payable and accrued liabilities as of December 30, 2017 and December 31, 2016:
| (in millions of U.S. dollars) |
December 30, 2017 | December 31, 2016 | ||||||
| Trade payables |
$ | 197.2 | $ | 185.9 | ||||
| Accrued compensation |
47.6 | 38.4 | ||||||
| Accrued sales incentives |
6.9 | 1.0 | ||||||
| Accrued interest |
18.7 | 11.6 | ||||||
| Payroll, sales and other taxes |
12.9 | 9.0 | ||||||
| Accrued deposits |
66.9 | 51.9 | ||||||
| Other accrued liabilities |
62.7 | 70.2 | ||||||
|
|
|
|
|
|||||
| Total |
$ | 412.9 | $ | 368.0 | ||||
|
|
|
|
|
|||||
Note 15—Debt
Our total debt as of December 30, 2017 and December 31, 2016 was as follows:
| December 30, 2017 | December 31, 2016 | |||||||||||||||||||||||
| (in millions of U.S. dollars) |
Principal | Unamortized Debt Costs |
Net | Principal | Unamortized Debt Costs |
Net | ||||||||||||||||||
| 6.750% senior notes due in 2020 |
$ | — | — | $ | — | $ | 625.0 | $ | 9.3 | $ | 615.7 | |||||||||||||
| 10.000% senior notes due in 2021 1 |
269.9 | — | 269.9 | 384.2 | — | 384.2 | ||||||||||||||||||
| 5.375% senior notes due in 2022 |
525.0 | 6.0 | 519.0 | 525.0 | 7.1 | 517.9 | ||||||||||||||||||
| 5.500% senior notes due in 2024 |
539.1 | 9.5 | 529.6 | 474.1 | 9.8 | 464.3 | ||||||||||||||||||
| 5.500% senior notes due in 2025 |
750.0 | 11.0 | 739.0 | — | — | — | ||||||||||||||||||
| ABL facility |
220.3 | — | 220.3 | 207.0 | — | 207.0 | ||||||||||||||||||
| GE Term Loan |
2.0 | — | 2.0 | 4.3 | 0.2 | 4.1 | ||||||||||||||||||
| Other debt financing |
0.8 | — | 0.8 | — | — | — | ||||||||||||||||||
| Capital leases |
6.4 | — | 6.4 | 5.8 | — | 5.8 | ||||||||||||||||||
|
|
|
|
|
|
|
|
|
|
|
|
|
|||||||||||||
| Total debt |
2,313.5 | 26.5 | 2,287.0 | 2,225.4 | 26.4 | 2,199.0 | ||||||||||||||||||
| Less: Short-term borrowings and current debt: |
||||||||||||||||||||||||
| ABL facility |
220.3 | — | 220.3 | 207.0 | — | 207.0 | ||||||||||||||||||
|
|
|
|
|
|
|
|
|
|
|
|
|
|||||||||||||
| Total short-term borrowings required to be repaid or extinguished as part of divestiture |
220.3 | — | 220.3 | 207.0 | — | 207.0 | ||||||||||||||||||
| GE Term Loan - current maturities |
2.0 | — | 2.0 | 2.3 | — | 2.3 | ||||||||||||||||||
| Other debt financing |
0.8 | — | 0.8 | — | — | — | ||||||||||||||||||
| Capital leases -current maturities |
2.3 | — | 2.3 | 2.9 | — | 2.9 | ||||||||||||||||||
|
|
|
|
|
|
|
|
|
|
|
|
|
|||||||||||||
| Total current debt |
225.4 | — | 225.4 | 212.2 | — | 212.2 | ||||||||||||||||||
| Less: Debt required to be repaid or extinguished as part of divestiture |
||||||||||||||||||||||||
| 6.750% senior notes due in 2020 |
— | — | — | 625.0 | 9.3 | 615.7 | ||||||||||||||||||
| 5.375% senior notes due in 2022 |
525.0 | 6.0 | 519.0 | 525.0 | 7.1 | 517.9 | ||||||||||||||||||
| GE Term Loan |
— | — | — | 2.0 | 0.2 | 1.8 | ||||||||||||||||||
|
|
|
|
|
|
|
|
|
|
|
|
|
|||||||||||||
| Total debt to be required to be repaid or extinguished as part of divestiture |
525.0 | 6.0 | 519.0 | 1,152.0 | 16.6 | 1,135.4 | ||||||||||||||||||
|
|
|
|
|
|
|
|
|
|
|
|
|
|||||||||||||
| Total long-term debt |
$ | 1,563.1 | $ | 20.5 | $ | 1,542.6 | $ | 861.2 | $ | 9.8 | $ | 851.4 | ||||||||||||
|
|
|
|
|
|
|
|
|
|
|
|
|
|||||||||||||
| 1. | The outstanding aggregate principal amount and unamortized premium of our DSS Notes was $250.0 million and $19.9 million at December 30, 2017, and $350.0 million and $34.2 million at December 31, 2016, respectively. |
F-37
Table of Contents
The long-term debt payments (which include current maturities of long-term debt) required in each of the next five years and thereafter are as follows:
| (in millions of U.S. dollars) |
Long Term Debt (incl. current) |
|||
| 2018 |
$ | 225.4 | ||
| 2019 |
1.8 | |||
| 2020 |
1.0 | |||
| 2021 |
250.6 | |||
| 2022 |
525.4 | |||
| Thereafter |
1,289.4 | |||
|
|
|
|||
| $ | 2,293.6 | |||
|
|
|
|||
Asset-Based Lending Facility
In March 2008, we entered into a credit agreement with JPMorgan Chase Bank N.A. as Agent that created an ABL facility to provide financing for our operations. We have amended and refinanced the ABL facility from time to time and incurred related financing fees, $12.4 million of which have been capitalized and deferred and are being amortized using the straight-line method over the duration of the amended ABL facility.
As of December 30, 2017, we had $220.3 million of outstanding borrowings under the ABL facility. The commitment fee was 0.375% per annum of the unused commitment, which, taking into account $46.0 million of letters of credit, was $233.7 million as of December 30, 2017. The weighted average effective interest rate at December 30, 2017 on our outstanding LIBOR loans was 3.1%. The effective interest rates are based on our aggregate availability.
On January 30, 2018, in connection with the closing of the Transaction, we used a portion of the proceeds from the Transaction to repay $262.5 million of our outstanding balance on the ABL facility. Additionally, we amended and restated the Amended and Restated Credit Agreement. The ABL facility, as amended and restated, provides us with financing in the United States, Canada, the United Kingdom, Luxembourg and the Netherlands. Cott and its subsidiaries, Cott Holdings Inc., DSS, S&D, Aimia and Aquaterra, are borrowers under the ABL facility. The ABL facility is a revolving facility of up to $250.0 million with a maturity date of August 3, 2021. JPMorgan Chase Bank, N.A. serves as administrative agent and administrative collateral agent and JPMorgan Chase Bank, N.A., London Branch serves as U.K. security trustee. Availability under the ABL facility is dependent on a borrowing base calculated as a percentage of the value of eligible inventory, accounts receivable and property, plant and equipment in the manner set forth in the credit agreement. Subject to certain conditions, the ABL facility may be increased up to an additional $100.0 million at our option if lenders agree to increase their commitments. The debt under the ABL facility is guaranteed by most of our U.S., Canadian, U.K. and Luxembourg subsidiaries and certain of our Dutch subsidiaries.
5.500% Senior Notes due in 2025
On March 22, 2017, we issued $750.0 million of our 2025 Notes to qualified purchasers in a private placement offering under Rule 144A under the Securities Act, and outside the United States to non-U.S. purchasers pursuant to Regulation S under the Securities Act and other applicable laws. The 2025 Notes were issued by our wholly-owned subsidiary Cott Holdings Inc., and most of our U.S., Canadian, U.K., Luxembourg and Dutch subsidiaries guarantee the 2025 Notes. The 2025 Notes will mature on April 1, 2025 and interest is payable semi-annually on April 1st and October 1st of each year commencing on October 1, 2017. The proceeds of the 2025 Notes were used to redeem in full the 2020 Notes, redeem $100.0 million aggregate principal amount of our DSS Notes and to pay related fees and expenses.
F-38
Table of Contents
We incurred $11.7 million of financing fees in connection with the issuance of the 2025 Notes. The financing fees are being amortized using the effective interest method over an eight-year period, which represents the term to maturity of the 2025 Notes.
5.500% Senior Notes due in 2024
In June 2016, we issued €450.0 million (U.S. $539.1 million at the exchange rate in effect on December 30, 2017) of our 2024 Notes to qualified purchasers in a private placement offering under Rule 144A and Regulation S under the Securities Act and other applicable laws. The 2024 Notes were initially issued by our wholly-owned subsidiary Cott Finance Corporation. In connection with the closing of the Eden Acquisition, we assumed all of the obligations of Cott Finance Corporation under the 2024 Notes, and most of our U.S., Canadian, U.K. Luxembourg and Dutch subsidiaries that are currently obligors under the 2022 Notes and the 2020 Notes entered into a supplemental indenture to guarantee the 2024 Notes. The 2024 Notes will mature on July 1, 2024 and interest is payable semi-annually on January 1st and July 1st of each year commencing on January 1, 2017. The proceeds of the 2024 Notes were used to fund a portion of the purchase price of the Eden Acquisition and to pay related fees and expenses.
We incurred approximately $11.3 million of financing fees for the issuance of the 2024 Notes and $11.0 million of bridge financing commitment fees and professional fees in connection with the Eden Acquisition. The financing fees are being amortized using the effective interest method over an eight-year period, which represents the term to maturity of the 2024 Notes. The bridge financing commitment fees and professional fees were recorded in SG&A expenses for the year ended December 31, 2016 in our Consolidated Statement of Operations.
5.375% Senior Notes due in 2022
In June 2014, we issued $525.0 million of 5.375% senior notes due 2022. The issuer of the notes was our wholly-owned U.S. subsidiary Cott Beverages Inc. (“CBI”), and we and most of our U.S., Canadian and U.K. subsidiaries guaranteed the obligations.
We incurred $9.6 million of financing fees in connection with the issuance of the 2022 Notes. The financing fees were being amortized using the effective interest method over an eight-year period, which represented the term to maturity of the 2022 Notes.
On January 30, 2018, in connection with the closing of the Transaction, we used a portion of the proceeds from the Transaction to redeem the 2022 Notes. The redemption of the 2022 Notes included $21.2 million in premium payments and $2.2 million in accrued interest.
10.00% Senior Notes due in 2021
In August 2013, DSS (formerly DS Waters of America, Inc.) issued $350.0 million of 10.00% senior secured notes. In connection with the acquisition of DSS, our wholly-owned U.S. subsidiary CBI, and we and most of our U.S., Canadian and U.K. subsidiaries became guarantors of the obligations.
The DSS Notes were recorded at their fair value of $406.0 million as part of the acquisition of DSS. The difference between the fair value and the principal amount of $350.0 million was being amortized as a component of interest expense over the remaining contractual term of the DSS Notes. We incurred approximately $26.5 million of consent solicitation fees and bridge financing commitment fees.
On May 5, 2017, we used a portion of the proceeds from the issuance of the 2025 Notes to redeem $100.0 million in aggregate principal amount of the DSS Notes. The partial redemption of the DSS Notes included $7.7 million in premium payments, accrued interest of $1.8 million and the write-off of $9.2 million of unamortized premium.
On January 30, 2018, in connection with the closing of the Transaction, we used a portion of the proceeds from the Transaction to redeem the remaining $250.0 million aggregate principal amount of the DSS Notes. The redemption of the 2022 Notes included $12.5 million in premium payments and $10.3 million in accrued interest.
6.75% Senior Notes due in 2020
In December 2014, we issued $625.0 million of 6.75% senior notes due January 1, 2020. The issuer of the notes was our wholly-owned U.S. subsidiary CBI, and we and most of our U.S., Canadian and U.K. subsidiaries guaranteed the obligations.
F-39
Table of Contents
We incurred $14.4 million of financing fees in connection with the issuance of the 2020 Notes. The financing fees were being amortized using the effective interest method over a five-year period, which represented the term to maturity of the 2020 Notes.
On April 5, 2017 and March 22, 2017, we used a portion of the proceeds from the issuance of the 2025 Notes to purchase $422.7 million and $202.3 million in aggregate principal amount of the 2020 Notes. The redemption of the 2020 Notes included $14.3 million and $7.1 million in premium payments, accrued interest of $7.4 million and $3.1 million, the write-off of $5.8 million and $2.9 million in deferred financing fees, and other costs of $0.1 million.
GE Term Loan
In January 2008, we entered into a capital lease finance arrangement with GE Capital for the lease of equipment. In September 2013, we purchased the equipment subject to the lease for an aggregate purchase price of $10.7 million, with the financing for such purchase provided by GE Capital at 5.23% interest.
On January 30, 2018, in connection with the closing of the Transaction, we used a portion of the proceeds from the Transaction to pay the remaining $1.9 million outstanding balance of the GE Term Loan.
Covenant Compliance
Indentures governing our outstanding notes
Under the indentures governing our outstanding notes, we are subject to a number of covenants, including covenants that limit our and certain of our subsidiaries’ ability, subject to certain exceptions and qualifications, to (i) pay dividends or make distributions, repurchase equity securities, prepay subordinated debt or make certain investments, (ii) incur additional debt or issue certain disqualified stock or preferred stock, (iii) create or incur liens on assets securing indebtedness, (iv) merge or consolidate with another company or sell all or substantially all of our assets taken as a whole, (v) enter into transactions with affiliates and (vi) sell assets. The covenants are substantially similar across the series of notes. As of December 30, 2017, we were in compliance with all of the covenants under each series of notes. There have been no amendments to any covenants of our outstanding notes since the date of their issuance or assumption, as applicable.
ABL Facility
Under the credit agreement governing the ABL facility, Cott and its restricted subsidiaries are subject to a number of business and financial covenants, including a minimum fixed charge coverage ratio, which measures our ability to cover financing expenses. As of December 30, 2017, the minimum fixed charge coverage ratio of 1.0 to 1.0 was effective if and when aggregate availability was less than the greater of 10% of the lenders’ commitments under the ABL facility or $37.5 million. If excess availability was less than the greater of 10% of the aggregate availability under the ABL facility or $37.5 million, the lenders would take dominion over the cash and would apply excess cash to reduce amounts owing under the facility. We were in compliance with all of the applicable covenants under the ABL facility as of December 30, 2017.
On January 30, 2018, in connection with the closing of the Transaction, we amended and restated the Amended and Restated Credit Agreement, dated as of August 3, 2016, as amended, which governed our prior ABL facility. Under the credit agreement governing the ABL facility, as amended and restated, Cott and its restricted subsidiaries are subject to a number of business and financial covenants, including a minimum fixed charge coverage ratio, which measures our ability to cover financing expenses. The minimum fixed charge coverage ratio of 1.0 to 1.0 is effective if and when there exists an event of default or aggregate availability is less than the greater of 10% of the Line Cap under the ABL facility or $22.5 million. Line Cap is defined as an amount equal to the lesser of the lenders’ commitments or the borrowing base at such time. If an event of default exists or the excess availability is less than the greater of 10% of the aggregate availability under the ABL facility or $22.5 million, the lenders will take dominion over the cash and will apply excess cash to reduce amounts owing under the facility.
Note 16—Retirement Plans
The Company maintains certain defined contribution (“DC”) retirement plans covering qualifying employees. The total expense with respect to these DC plans was $2.0 million for the year ended December 30, 2017 (2016—$4.7 million; 2015—$4.5 million).
F-40
Table of Contents
The Company also maintains several defined benefit (“DB”) plans acquired as a part of acquisitions covering certain U.S. and non-U.S. employees, referred to as the U.S. and International Plans, respectively. Retirement benefits are based on years of service multiplied by a monthly benefit factor. Pension costs are funded in accordance with the provisions of the applicable law. Our U.S. Plan is closed to new participants and frozen. The Company uses a December 30, 2017 measurement date for all DB plans. Any variation differences based on one day of trading are deemed immaterial.
In the third quarter of 2017, our Eden business relocated its corporate headquarters from Switzerland to Spain, which resulted in the dismissal or relocation of certain non-U.S. employees of the International Plans. As a result of the dismissal or relocation of the certain non-U.S. employees, we recorded a gain on pension curtailment of approximately $4.5 million to SG&A expenses, in the Consolidated Statement of Operations for the year ended December 30, 2017.
Obligations and Funded Status
The following table summarizes the change in the projected benefit obligation, change in plan assets and unfunded status of the DB plans as of December 30, 2017 and December 31, 2016:
| December 30, 2017 | ||||||||||||
| (in millions of U.S. dollars) |
U.S. | International | Total | |||||||||
| Change in Projected Benefit Obligation |
||||||||||||
| Projected benefit obligation at beginning of year |
$ | 8.3 | $ | 30.5 | $ | 38.8 | ||||||
| Business combinations |
— | — | — | |||||||||
| Service cost |
— | 1.9 | 1.9 | |||||||||
| Interest cost |
0.3 | 0.3 | 0.6 | |||||||||
| Benefit payments |
(0.4 | ) | (3.0 | ) | (3.4 | ) | ||||||
| Actuarial losses |
0.2 | (0.1 | ) | 0.1 | ||||||||
| Settlement gains |
— | — | — | |||||||||
| Curtailment gains |
— | (18.2 | ) | (18.2 | ) | |||||||
| Translation gains |
— | 1.4 | 1.4 | |||||||||
|
|
|
|
|
|
|
|||||||
| Projected benefit obligation at end of year |
$ | 8.4 | $ | 12.8 | $ | 21.2 | ||||||
|
|
|
|
|
|
|
|||||||
| Change in Plan Assets |
||||||||||||
| Plan assets beginning of year |
$ | 6.3 | $ | 20.4 | $ | 26.7 | ||||||
| Business combinations |
— | — | — | |||||||||
| Employer contributions |
0.3 | 0.9 | 1.2 | |||||||||
| Plan participant contributions |
— | 0.4 | 0.4 | |||||||||
| Benefit payments |
(0.4 | ) | (2.5 | ) | (2.9 | ) | ||||||
| Curtailment losses |
— | (14.2 | ) | (14.2 | ) | |||||||
| Actual return on plan assets |
0.9 | 0.6 | 1.5 | |||||||||
| Translation losses |
— | 1.0 | 1.0 | |||||||||
|
|
|
|
|
|
|
|||||||
| Fair value at end of year |
$ | 7.1 | $ | 6.6 | $ | 13.7 | ||||||
|
|
|
|
|
|
|
|||||||
| Funded Status of Plan |
||||||||||||
| Projected benefit obligation |
$ | (8.4 | ) | $ | (12.8 | ) | $ | (21.2 | ) | |||
| Fair value of plan assets |
7.1 | 6.6 | 13.7 | |||||||||
|
|
|
|
|
|
|
|||||||
| Unfunded status |
$ | (1.3 | ) | $ | (6.2 | ) | $ | (7.5 | ) | |||
|
|
|
|
|
|
|
|||||||
F-41
Table of Contents
| December 31, 2016 | ||||||||||||
| (in millions of U.S. dollars) |
U.S. | International | Total | |||||||||
| Change in Projected Benefit Obligation |
||||||||||||
| Projected benefit obligation at beginning of year |
$ | 10.3 | $ | — | $ | 10.3 | ||||||
| Business combinations |
— | 29.3 | 29.3 | |||||||||
| Service cost |
— | 2.1 | 2.1 | |||||||||
| Interest cost |
0.4 | 0.3 | 0.7 | |||||||||
| Benefit payments |
(2.3 | ) | (0.5 | ) | (2.8 | ) | ||||||
| Actuarial losses |
— | 0.4 | 0.4 | |||||||||
| Settlement gains |
(0.1 | ) | — | (0.1 | ) | |||||||
| Translation gains |
— | (1.1 | ) | (1.1 | ) | |||||||
|
|
|
|
|
|
|
|||||||
| Projected benefit obligation at end of year |
$ | 8.3 | $ | 30.5 | $ | 38.8 | ||||||
|
|
|
|
|
|
|
|||||||
| Change in Plan Assets |
||||||||||||
| Plan assets beginning of year |
$ | 7.7 | $ | — | $ | 7.7 | ||||||
| Business combinations |
— | 19.5 | 19.5 | |||||||||
| Employer contributions |
0.4 | 0.6 | 1.0 | |||||||||
| Plan participant contributions |
— | 0.2 | 0.2 | |||||||||
| Benefit payments |
(2.3 | ) | (0.2 | ) | (2.5 | ) | ||||||
| Actual return on plan assets |
0.4 | 0.9 | 1.3 | |||||||||
| Translation losses |
— | (0.6 | ) | (0.6 | ) | |||||||
|
|
|
|
|
|
|
|||||||
| Fair value at end of year |
$ | 6.2 | $ | 20.4 | $ | 26.6 | ||||||
|
|
|
|
|
|
|
|||||||
| Funded Status of Plan |
||||||||||||
| Projected benefit obligation |
$ | (8.3 | ) | $ | (30.5 | ) | $ | (38.8 | ) | |||
| Fair value of plan assets |
6.2 | 20.4 | 26.6 | |||||||||
|
|
|
|
|
|
|
|||||||
| Unfunded status |
$ | (2.1 | ) | $ | (10.1 | ) | $ | (12.2 | ) | |||
|
|
|
|
|
|
|
|||||||
The accumulated benefit obligation for the U.S. Plans equaled $8.4 million and $8.3 million at the end of 2017 and 2016, respectively. The accumulated benefit obligation for the International Plans equaled $12.8 million and $30.5 million at the end of 2017 and 2016, respectively.
Periodic Pension Costs
The components of net periodic pension cost were as follows:
| December 30, 2017 | ||||||||||||
| (in millions of U.S. dollars) |
U.S. | International | Total | |||||||||
| Service cost |
$ | — | $ | 1.9 | $ | 1.9 | ||||||
| Interest cost |
(0.3 | ) | 0.3 | — | ||||||||
| Expected return on plan assets |
0.4 | (0.3 | ) | 0.1 | ||||||||
| Amortization of prior service costs |
— | — | — | |||||||||
| Recognized net loss due to settlement |
— | — | — | |||||||||
| Amortization of net actuarial loss |
— | — | — | |||||||||
| Curtailment gain |
— | (4.5 | ) | (4.5 | ) | |||||||
| Employees contribution |
— | (0.4 | ) | (0.4 | ) | |||||||
|
|
|
|
|
|
|
|||||||
| Net periodic pension cost |
$ | 0.1 | $ | (3.0 | ) | $ | (2.9 | ) | ||||
|
|
|
|
|
|
|
|||||||
F-42
Table of Contents
| December 31, 2016 | ||||||||||||
| (in millions of U.S. dollars) |
U.S. | International | Total | |||||||||
| Service cost |
$ | — | $ | 2.1 | $ | 2.1 | ||||||
| Interest cost |
(0.4 | ) | 0.2 | (0.2 | ) | |||||||
| Expected return on plan assets |
0.6 | (0.2 | ) | 0.4 | ||||||||
| Amortization of prior service costs |
— | — | — | |||||||||
| Recognized net loss due to settlement |
(0.1 | ) | — | (0.1 | ) | |||||||
| Amortization of net actuarial loss |
— | — | — | |||||||||
| Employees contribution |
— | (0.2 | ) | (0.2 | ) | |||||||
|
|
|
|
|
|
|
|||||||
| Net periodic pension cost |
$ | 0.1 | $ | 1.9 | $ | 2.0 | ||||||
|
|
|
|
|
|
|
|||||||
| January 2, 2016 | ||||||||||||
| (in millions of U.S. dollars) |
U.S. | International | Total | |||||||||
| Interest cost |
0.4 | — | 0.4 | |||||||||
| Expected return on plan assets |
(0.5 | ) | — | (0.5 | ) | |||||||
|
|
|
|
|
|
|
|||||||
| Net periodic pension cost |
$ | (0.1 | ) | $ | — | $ | (0.1 | ) | ||||
|
|
|
|
|
|
|
|||||||
Accumulated Other Comprehensive Loss
Amounts included in accumulated other comprehensive loss, net of tax, at year-end which have not yet been recognized in net periodic benefit cost were as follows:
| December 30, 2017 | ||||||||||||
| (in millions of U.S. dollars) |
U.S. | International | Total | |||||||||
| Unrecognized net actuarial loss |
(0.6 | ) | (16.2 | ) | (16.8 | ) | ||||||
|
|
|
|
|
|
|
|||||||
| Total accumulated other comprehensive loss |
$ | (0.6 | ) | $ | (16.2 | ) | $ | (16.8 | ) | |||
|
|
|
|
|
|
|
|||||||
| December 31, 2016 | ||||||||||||
| (in millions of U.S. dollars) |
U.S. | International | Total | |||||||||
| Unrecognized net actuarial loss |
(1.2 | ) | (13.2 | ) | (14.4 | ) | ||||||
|
|
|
|
|
|
|
|||||||
| Total accumulated other comprehensive loss |
$ | (1.2 | ) | $ | (13.2 | ) | $ | (14.4 | ) | |||
|
|
|
|
|
|
|
|||||||
| January 2, 2016 | ||||||||||||
| (in millions of U.S. dollars) |
U.S. | International | Total | |||||||||
| Unamortized prior service cost |
$ | (0.1 | ) | $ | — | $ | (0.1 | ) | ||||
| Unrecognized net actuarial loss |
(1.4 | ) | (8.6 | ) | (10.0 | ) | ||||||
|
|
|
|
|
|
|
|||||||
| Total accumulated other comprehensive loss |
$ | (1.5 | ) | $ | (8.6 | ) | $ | (10.1 | ) | |||
|
|
|
|
|
|
|
|||||||
F-43
Table of Contents
Actuarial Assumptions
The following table summarizes the weighted average actuarial assumptions used to determine the projected benefit obligation:
| For the Year Ended | ||||||||||||
| December 30, 2017 |
December 31, 2016 |
January 2, 2016 |
||||||||||
| U.S. Plans |
||||||||||||
| Discount rate |
3.5 | % | 3.8 | % | 4.0 | % | ||||||
| Expected long-term rate of return on plan assets |
7.0 | % | 7.0 | % | 7.3 | % | ||||||
| International Plans |
||||||||||||
| Discount rate |
2.0 | % | 1.7 | % | — | % | ||||||
| Expected long-term rate of return on plan assets |
3.1 | % | 2.6 | % | — | % | ||||||
| Rate of compensation increase |
1.4 | % | 1.0 | % | — | % | ||||||
| CPI Inflation factor |
0.3 | % | 0.3 | % | — | % | ||||||
The following table summarizes the weighted average actuarial assumptions used to determine net periodic benefit cost:
| For the Year Ended | ||||||||||||
| December 30, 2017 | December 31, 2016 | January 2, 2016 | ||||||||||
| U.S. Plans |
||||||||||||
| Discount rate |
3.8 | % | 4.0 | % | 4.1 | % | ||||||
| Expected long-term rate of return on plan assets |
7.0 | % | 7.0 | % | 7.3 | % | ||||||
| International Plans |
||||||||||||
| Discount rate |
2.0 | % | 1.7 | % | — | % | ||||||
| Expected long-term rate of return on plan assets |
3.1 | % | 1.0 | % | — | % | ||||||
| Inflation factor |
0.3 | % | 0.3 | % | — | % | ||||||
The Company utilizes a yield curve analysis to determine the discount rates for its DB plan obligations. The yield curve considers pricing and yield information for high quality corporate bonds with maturities matched to estimated payouts of future pension benefits. The Company evaluates its assumption regarding the estimated long-term rate of return on plan assets based on historical experience, future expectations of investment returns, asset allocations, and its investment strategy. The Company’s long-term rate of return on plan assets reflect expectations of projected weighted average market returns of plan assets. Changes in expected returns on plan assets also reflect any adjustments to the Company’s targeted asset allocation.
F-44
Table of Contents
Asset Mix
Our DB plans weighted-average asset allocations by asset category were as follows:
| December 30, 2017 |
December 31, 2016 |
|||||||
| U.S. Plans |
||||||||
| Equity securities |
61.4 | % | 60.7 | % | ||||
| Fixed income investments |
38.6 | % | 39.3 | % | ||||
| International Plans |
||||||||
| Cash and cash equivalents |
0.3 | % | 2.4 | % | ||||
| Equity securities |
64.2 | % | 76.1 | % | ||||
| Fixed income investments |
29.2 | % | 8.8 | % | ||||
| Real estate |
6.3 | % | 12.7 | % | ||||
Plan Assets
Our investment policy is that plan assets will be managed utilizing an investment philosophy and approach characterized by all of the following, listed in priority order: (1) emphasis on total return, (2) emphasis on high-quality securities, (3) sufficient income and stability of income, (4) safety of principal with limited volatility of capital through proper diversification and (5) sufficient liquidity. The target allocation percentages for the U.S. Plans’ assets range between 55% to 65% in equity securities and 35% to 45% in fixed income investments. The target allocation percentages for the International Plans’ assets range between 50% to 80% in equity securities, 20% to 50% in fixed income investments, 0% to 30% in real estate and 0% to 15% in alternative investments. None of our equity or debt securities are included in plan assets.
Cash Flows
We expect to contribute $0.8 million to the DB plans during the 2018 fiscal year.
The following benefit payments are expected to be paid in the periods indicated below:
| (in millions of U.S. dollars) |
U.S. | International | Total | |||||||||
| Expected benefit payments |
||||||||||||
| FY 2018 |
$ | 0.4 | $ | 1.1 | $ | 1.5 | ||||||
| FY 2019 |
0.4 | 0.7 | 1.1 | |||||||||
| FY 2020 |
0.4 | 0.6 | 1.0 | |||||||||
| FY 2021 |
0.5 | 0.5 | 1.0 | |||||||||
| FY 2022 |
0.5 | 0.4 | 0.9 | |||||||||
| FY 2023 through FY 2027 |
2.5 | 1.8 | 4.3 | |||||||||
The fair values of the Company’s U.S. plan assets are measured daily at their net asset value and valued at $7.1 million and $6.2 million at December 30, 2017 and December 31, 2016, respectively.
F-45
Table of Contents
The fair values of the Company’s International plan assets at December 30, 2017 and December 31, 2016 were as follows:
| December 30, 2017 | ||||||||||||
| (in millions of U.S. dollars) |
Level 1 | Level 2 | Level 3 | |||||||||
| Mutual funds: |
||||||||||||
| Non-U.S. equity securities |
1.6 | — | — | |||||||||
| Other |
— | 0.4 | — | |||||||||
| Fixed income: |
||||||||||||
| Non-U.S. bonds |
2.3 | — | — | |||||||||
| Insurance contract |
— | 1.9 | — | |||||||||
| Real estate: |
||||||||||||
| Real estate |
— | 0.4 | — | |||||||||
|
|
|
|
|
|
|
|||||||
| Total |
$ | 3.9 | $ | 2.7 | $ | — | ||||||
|
|
|
|
|
|
|
|||||||
| December 31, 2016 | ||||||||||||
| (in millions of U.S. dollars) |
Level 1 | Level 2 | Level 3 | |||||||||
| Cash and cash equivalents: |
||||||||||||
| Cash and cash equivalents |
$ | 0.5 | $ | — | $ | — | ||||||
| Mutual funds: |
||||||||||||
| Non-U.S. equity securities |
2.5 | — | — | |||||||||
| Other |
— | 1.3 | — | |||||||||
| Fixed income: |
||||||||||||
| Non-U.S. bonds |
11.7 | — | ||||||||||
| Insurance contract |
— | 1.8 | — | |||||||||
| Real estate: |
||||||||||||
| Real estate |
— | 2.6 | ||||||||||
|
|
|
|
|
|
|
|||||||
| Total |
$ | 14.7 | $ | 5.7 | $ | — | ||||||
|
|
|
|
|
|
|
|||||||
F-46
Table of Contents
Note 17—Consolidated Accumulated Other Comprehensive (Loss) Income
Changes in consolidated accumulated other comprehensive (loss) income (“AOCI”) by component for the years ended December 30, 2017, December 31, 2016 and January 2, 2016 were as follows:
| (in millions of U.S. dollars)1 |
Gains and Losses on Derivative Instruments |
Pension Benefit Plan Items |
Currency Translation Adjustment Items |
Total | ||||||||||||
| Balance at January 3, 2015 |
$ | 0.2 | $ | (12.4 | ) | $ | (38.8 | ) | $ | (51.0 | ) | |||||
|
|
|
|
|
|
|
|
|
|||||||||
| OCI before reclassifications |
(5.6 | ) | 1.9 | (23.3 | ) | (27.0 | ) | |||||||||
| Amounts reclassified from AOCI |
0.7 | 0.4 | — | 1.1 | ||||||||||||
|
|
|
|
|
|
|
|
|
|||||||||
| Net current-period OCI |
(4.9 | ) | 2.3 | (23.3 | ) | (25.9 | ) | |||||||||
| Purchase of subsidiary shares from non-controlling interest |
— | — | 0.7 | 0.7 | ||||||||||||
|
|
|
|
|
|
|
|
|
|||||||||
| Balance January 2, 2016 |
$ | (4.7 | ) | $ | (10.1 | ) | $ | (61.4 | ) | $ | (76.2 | ) | ||||
|
|
|
|
|
|
|
|
|
|||||||||
| OCI before reclassifications |
10.9 | (4.8 | ) | (42.0 | ) | (35.9 | ) | |||||||||
| Amounts reclassified from AOCI |
(6.3 | ) | 0.5 | — | (5.8 | ) | ||||||||||
|
|
|
|
|
|
|
|
|
|||||||||
| Net current-period OCI |
4.6 | (4.3 | ) | (42.0 | ) | (41.7 | ) | |||||||||
|
|
|
|
|
|
|
|
|
|||||||||
| Balance December 31, 2016 |
$ | (0.1 | ) | $ | (14.4 | ) | $ | (103.4 | ) | $ | (117.9 | ) | ||||
|
|
|
|
|
|
|
|
|
|||||||||
| OCI before reclassifications |
— | (2.7 | ) | 27.2 | 24.5 | |||||||||||
| Amounts reclassified from AOCI |
(1.3 | ) | 0.3 | — | (1.0 | ) | ||||||||||
|
|
|
|
|
|
|
|
|
|||||||||
| Net current-period OCI |
(1.3 | ) | (2.4 | ) | 27.2 | 23.5 | ||||||||||
|
|
|
|
|
|
|
|
|
|||||||||
| Balance December 30, 2017 |
$ | (1.4 | ) | $ | (16.8 | ) | $ | (76.2 | ) | $ | (94.4 | ) | ||||
|
|
|
|
|
|
|
|
|
|||||||||
| 1. | All amounts are net of tax. |
The following table summarizes the amounts reclassified from AOCI to total net income (loss) for the years ended December 30, 2017, December 31, 2016 and January 2, 2016:
| (in millions of U.S. dollars) |
For the Year Ended | Affected Line Item in the Statement Where Net Income Is Presented | ||||||||||||
| Details About AOCI Components1 |
December 30, 2017 |
December 31, 2016 |
January 2, 2016 |
|||||||||||
| Gains and losses on derivative instruments |
||||||||||||||
| Foreign currency and commodity hedges |
$ | 1.3 | $ | 6.4 | $ | (1.5 | ) | Cost of sales | ||||||
|
|
|
|
|
|
|
|||||||||
| $ | 1.3 | $ | 6.4 | $ | (1.5 | ) | Total before taxes | |||||||
| — | (0.1 | ) | 0.8 | Tax (expense) or benefit | ||||||||||
|
|
|
|
|
|
|
|||||||||
| $ | 1.3 | $ | 6.3 | $ | (0.7 | ) | Net of tax | |||||||
|
|
|
|
|
|
|
|||||||||
| Amortization of pension benefit plan items |
||||||||||||||
| Prior service costs 2 |
$ | — | $ | (0.1 | ) | $ | (0.1 | ) | ||||||
| Actuarial (losses)/gains 2 |
(0.3 | ) | (0.4 | ) | (0.4 | ) | ||||||||
|
|
|
|
|
|
|
|||||||||
| (0.3 | ) | (0.5 | ) | (0.5 | ) | Total before taxes | ||||||||
| — | — | 0.1 | Tax (expense) or benefit | |||||||||||
|
|
|
|
|
|
|
|||||||||
| $ | (0.3 | ) | $ | (0.5 | ) | $ | (0.4 | ) | Net of tax | |||||
|
|
|
|
|
|
|
|||||||||
| Total reclassifications for the period |
$ | 1.0 | $ | 5.8 | $ | (1.1 | ) | Net of tax | ||||||
|
|
|
|
|
|
|
|||||||||
| 1. | Amounts in parenthesis indicate debits. |
| 2. | These AOCI components are included in the computation of net periodic pension cost. |
F-47
Table of Contents
Note 18—Commitments and Contingencies
We lease buildings, machinery and equipment, computer hardware and furniture and fixtures. All contractual increases and rent free periods included in the lease contract are taken into account when calculating the minimum lease payment and are recognized on a straight-line basis over the lease term. Certain leases have renewal periods and contingent rentals, which are not included in the table below. The minimum annual payments under operating leases are as follows:
| (in millions of U.S. dollars) |
||||
| 2018 |
$ | 45.9 | ||
| 2019 |
39.6 | |||
| 2020 |
32.7 | |||
| 2021 |
26.9 | |||
| 2022 |
22.7 | |||
| Thereafter |
98.9 | |||
Operating lease expenses were:
| (in millions of U.S. dollars) |
||||
| Year ended December 30, 2017 |
$ | 54.3 | ||
| Year ended December 31, 2016 |
$ | 32.3 | ||
| Year ended January 2, 2016 |
$ | 20.5 | ||
|
|
|
|||
| $ | 107.1 | |||
|
|
|
|||
Operating lease expenses are shown net of sublease income of $0.7 million for 2017. As of December 30, 2017, we had commitments for capital expenditures of approximately $0.1 million.
We are subject to various claims and legal proceedings with respect to matters such as governmental regulations, and other actions arising out of the normal course of business. Management believes that the resolution of these matters will not have a material adverse effect on our financial position, results of operations, or cash flow.
In May 2014, we completed the Aimia Acquisition, which included deferred consideration of £19.9 million (U.S. $33.5 million), which was paid by us on September 15, 2014 and aggregate contingent consideration of up to £16.0 million which was payable upon the achievement of certain measures related to Aimia’s performance during the twelve months ending July 1, 2016. The aggregate contingent consideration was £12.0 million, offset by an existing receivable of £3.9 million due to the Company from the former owners of Aimia, for a final total cash payment of £8.1 million (U.S. $10.8 million at the exchange rate in effect on the date of payment) that was paid during the third quarter of 2016.
We had $46.0 million in standby letters of credit outstanding as of December 30, 2017 ($42.4 million—December 31, 2016; $45.6 million—January 2, 2016).
We have future purchase obligations of $135.5 million that consist of commitments for the purchase of inventory, energy transactions, and payments related to professional fees and information technology outsourcing agreements. These obligations represent the minimum contractual obligations expected under the normal course of business.
Guarantees
After completion of the Transaction, the Company continues to provide contractual payment guarantees to three third-party lessors of certain real property used in the Traditional Business. The leases were conveyed to Refresco as part of the Transaction, but the Company’s guarantee was not released by the landlord. The three lease agreements mature in 2027, 2028 and 2029. The maximum potential amount of undiscounted future payments under the guarantee of approximately $42.0 million as of December 30, 2017 was calculated based on the minimum lease payments of the leases over the remaining term of the agreements. The Transaction documents require Refresco to pay all post-closing obligations under these conveyed leases, and to reimburse the Company if the landlord calls on a guarantee. Refresco has also agreed to a covenant to negotiate with the landlords for a release of the Company’s guarantees; discussions are ongoing.
Note 19—Hedging Transactions and Derivative Financial Instruments
We are directly and indirectly affected by changes in foreign currency market conditions. These changes in market conditions may adversely impact our financial performance and are referred to as market risks. When deemed appropriate by management, we use derivatives as a risk management tool to mitigate the potential impact of foreign currency market risks.
We use various types of derivative instruments including, but not limited to, forward contracts and swap agreements for certain commodities. Forward contracts are agreements to buy or sell a quantity of a currency at a predetermined future date, and at a predetermined rate or price. A swap agreement is a contract between two parties to exchange cash flows based on specified underlying notional amounts, assets and/or indices.
F-48
Table of Contents
All derivatives are carried at fair value in the Consolidated Balance Sheets in the line item accounts receivable, net or accounts payable and accrued liabilities. The carrying values of the derivatives reflect the impact of legally enforceable agreements with the same counterparties. These allow us to net settle positive and negative positions (assets and liabilities) arising from different transactions with the same counterparty.
The accounting for gains and losses that result from changes in the fair values of derivative instruments depends on whether the derivatives have been designated and qualify as hedging instruments and the types of hedging relationships. Derivatives can be designated as fair value hedges, cash flow hedges or hedges of net investments in foreign operations. The changes in the fair values of derivatives that have been designated and qualify for fair value hedge accounting are recorded in the same line item in our Consolidated Statements of Operations as the changes in the fair value of the hedged items attributable to the risk being hedged. The changes in fair values of derivatives that have been designated and qualify as cash flow hedges are recorded in AOCI and are reclassified into the line item in the Consolidated Statements of Operations in which the hedged items are recorded in the same period the hedged items affect earnings. Due to the high degree of effectiveness between the hedging instruments and the underlying exposures being hedged, fluctuations in the value of the derivative instruments are generally offset by changes in the fair values or cash flows of the underlying exposures being hedged. The changes in fair values of derivatives that were not designated and/or did not qualify as hedging instruments are immediately recognized into earnings. We classify cash inflows and outflows related to derivative and hedging instruments with the appropriate cash flows section associated with the item being hedged.
For derivatives that will be accounted for as hedging instruments, we formally designate and document, at inception, the financial instrument as a hedge of a specific underlying exposure, the risk management objective and the strategy for undertaking the hedge transaction. In addition, we formally assess both at the inception and at least quarterly thereafter, whether the financial instruments used in hedging transactions are highly effective at offsetting changes in either the fair values or cash flows of the related underlying exposures.
We estimate the fair values of our derivatives based on quoted market prices or pricing models using current market rates (see Note 20 to the Consolidated Financial Statements). The notional amounts of the derivative financial instruments do not necessarily represent amounts exchanged by the parties and, therefore, are not a direct measure of our exposure to the financial risks described above. The amounts exchanged are calculated by reference to the notional amounts and by other terms of the derivatives, such as interest rates, foreign currency exchange rates or other financial indices. We do not view the fair values of our derivatives in isolation, but rather in relation to the fair values or cash flows of the underlying hedged transactions. All of our derivatives are over-the-counter instruments with liquid markets.
Credit Risk Associated with Derivatives
We have established strict counterparty credit guidelines and enter into transactions only with financial institutions of investment grade or better. We monitor counterparty exposures regularly and review promptly any downgrade in counterparty credit rating. We mitigate pre-settlement risk by being permitted to net settle for transactions with the same counterparty. To minimize the concentration of credit risk, we enter into derivative transactions with a portfolio of financial institutions. Based on these factors, we consider the risk of counterparty default to be minimal.
Cash Flow Hedging Strategy
We use cash flow hedges to minimize the variability in cash flows of assets or liabilities or forecasted transactions caused by fluctuations in commodity prices. The changes in fair values of hedges that are determined to be ineffective are immediately reclassified from AOCI into earnings. We did not discontinue any cash flow hedging relationships during the years ended December 30, 2017 or December 31, 2016, respectively. Substantially all outstanding hedges as of December 30, 2017 are expected to settle in the next twelve months.
We have entered into coffee futures contracts to hedge exposure to price fluctuations on green coffee associated with fixed-price sales contracts with customers, which generally range from three to twelve months in length. These derivative instruments have been designated and qualified as a part of our commodity cash flow hedging program effective January 1, 2017. The objective of this hedging program is to reduce the variability of cash flows associated with future purchases of green coffee.
The notional amount for the coffee futures contracts that were designated and qualified for our commodity cash flow hedging program was 48.1 million pounds as of December 30, 2017. We did not elect hedge accounting for our coffee futures contracts in 2016. The notional amounts for the coffee futures contracts not designated or qualifying as hedging instruments was 44.9 million pounds as of December 31, 2016. Approximately $1.3 million of realized gains, representing the effective portion of the cash-flow hedge, were subsequently reclassified from AOCI to earnings and recognized in cost of sales in the Consolidated Statement of Operations for the year ended December 30, 2017.
F-49
Table of Contents
The fair value of the Company’s derivative liabilities included in accounts payable and accrued liabilities was $1.2 million and $6.1 million as of December 30, 2017 and December 31, 2016, respectively. We had no derivative assets as of December 30, 2017 and December 31, 2016. Set forth below is a reconciliation of the Company’s derivatives by contract type for the period indicated:
| (in millions of U.S. dollars) |
December 30, 2017 | December 31, 2016 | ||||||||||||||
| Derivative Contract |
Assets | Liabilities | Assets | Liabilities | ||||||||||||
| Coffee futures 1 |
$ | — | $ | 1.2 | $ | — | $ | 6.1 | ||||||||
|
|
|
|
|
|
|
|
|
|||||||||
| $ | — | $ | 1.2 | $ | — | $ | 6.1 | |||||||||
|
|
|
|
|
|
|
|
|
|||||||||
| 1. | The fair value of the coffee futures excludes amounts in the related margin accounts. As of December 30, 2017 and December 31, 2016, the aggregate margin account balances were $5.3 million and $9.2 million, respectively and are included in cash & cash equivalents on the Consolidated Balance Sheet. |
Coffee futures are subject to enforceable master netting arrangements and are presented net in the reconciliation above. The fair value of the coffee futures assets and liabilities which are shown on a net basis are reconciled in the table below:
| (in millions of U.S. dollars) |
December 30, 2017 | December 31, 2016 | ||||||
| Coffee futures assets |
$ | 0.6 | $ | 1.4 | ||||
| Coffee futures liabilities |
(1.8 | ) | (7.5 | ) | ||||
|
|
|
|
|
|||||
| Net liability |
$ | (1.2 | ) | $ | (6.1 | ) | ||
|
|
|
|
|
|||||
The location and amount of gains or losses recognized in the Consolidated Statements of Operations for cash flow hedging relationships relationship, presented on a pre-tax basis, for the year ended December 30, 2017, is shown in the table below:
| For the year ended December 30, 2017 |
||||
| (in millions of U.S. dollars) |
Cost of sales | |||
| Total amounts of income and expense line items presented in the Consolidated Statements of Operations in which the effects of cash flow hedges are recorded |
$ | 1,142.0 | ||
| Gain on cash flow hedging relationship |
||||
| Coffee futures: |
||||
| Gain reclassfied from AOCI into income |
$ | 1.3 | ||
The settlement of our derivative instruments resulted in a credit to cost of sales of $1.3 million for the year ended December 30, 2017.
Note 20—Fair Value Measurements
ASC No. 820 defines fair value as the exchange price that would be received for an asset or paid to transfer a liability (an exit price) in the principal or most advantageous market for the asset or liability in an orderly transaction between market participants at the measurement date. Additionally, the inputs used to measure fair value are prioritized based on a three-level hierarchy. This hierarchy requires entities to maximize the use of observable inputs and minimize the use of unobservable inputs.
The three levels of inputs used to measure fair value are as follows:
| • | Level 1—Quoted prices in active markets for identical assets or liabilities. |
| • | Level 2—Observable inputs other than quoted prices included in Level 1, such as quoted prices for similar assets and liabilities in active markets; quoted prices for identical or similar assets and liabilities in markets that are not active; or other inputs that are observable or can be corroborated by observable market data. |
| • | Level 3—Unobservable inputs that are supported by little or no market activity and that are significant to the fair value of the assets or liabilities. This includes certain pricing models, discounted cash flow methodologies and similar techniques that use significant unobservable inputs. |
F-50
Table of Contents
We have certain assets and liabilities such as our derivative instruments that are required to be recorded at fair value on a recurring basis in accordance with U.S. GAAP.
Our derivative assets and liabilities represent Level 2 instruments. Level 2 instruments are valued based on observable inputs for quoted prices for similar assets and liabilities in active markets. The fair value of the derivative liabilities as of December 30, 2017 and December 31, 2016 was $1.2 million and $6.1 million, respectively. We had no derivative assets as of December 30, 2017 and December 31, 2016.
Fair value of financial instruments
The carrying amounts reflected in the Consolidated Balance Sheets for cash and cash equivalents, receivables, payables, short-term borrowings and long-term debt approximate their respective fair values, except as otherwise indicated. The carrying values and estimated fair values of our significant outstanding debt as of December 30, 2017 and December 31, 2016 were as follows:
| December 30, 2017 | December 31, 2016 | |||||||||||||||
| (in millions of U.S. dollars) |
Carrying Value |
Fair Value |
Carrying Value |
Fair Value |
||||||||||||
| 6.750% senior notes due in 2020 1, 3 |
$ | — | $ | — | $ | 615.7 | $ | 647.7 | ||||||||
| 10.000% senior notes due in 2021 1, 2 |
269.9 | 283.4 | 384.2 | 383.7 | ||||||||||||
| 5.375% senior notes due in 2022 1, 3 |
519.0 | 539.9 | 517.9 | 534.2 | ||||||||||||
| 5.500% senior notes due in 2024 1, 3 |
529.6 | 574.0 | 464.3 | 505.5 | ||||||||||||
| 5.500% senior notes due in 2025 1, 3 |
739.0 | 759.3 | — | — | ||||||||||||
|
|
|
|
|
|
|
|
|
|||||||||
| Total |
$ | 2,057.5 | $ | 2,156.6 | $ | 1,982.1 | $ | 2,071.1 | ||||||||
|
|
|
|
|
|
|
|
|
|||||||||
| 1. | The fair values were based on the trading levels and bid/offer prices observed by a market participant and are considered Level 2 financial instruments. |
| 2. | Includes unamortized premium of $19.9 million and $34.2 million at December 30, 2017 and December 31, 2016, respectively. |
| 3. | Carrying value of our significant outstanding debt is net of unamortized debt issuance costs as of December 30, 2017 and December 31, 2016 (see Note 15 to the Consolidated Financial Statements). |
Note 21—Quarterly Financial Information (unaudited)
| Year Ended December 30, 2017 | ||||||||||||||||||||
| (in millions of U.S. dollars, except per share amounts) |
First Quarter |
Second Quarter |
Third Quarter |
Fourth Quarter |
Total | |||||||||||||||
| Revenue, net |
$ | 536.9 | $ | 580.6 | $ | 580.9 | $ | 571.3 | $ | 2,269.7 | ||||||||||
| Cost of sales |
268.1 | 293.5 | 288.1 | 292.3 | 1,142.0 | |||||||||||||||
|
|
|
|
|
|
|
|
|
|
|
|||||||||||
| Gross profit |
268.8 | 287.1 | 292.8 | 279.0 | 1,127.7 | |||||||||||||||
| SG&A expenses |
255.0 | 260.0 | 262.8 | 264.9 | 1,042.7 | |||||||||||||||
| Loss (gain) on disposal of property plant and equipment, net |
1.3 | 3.9 | (0.4 | ) | 5.4 | 10.2 | ||||||||||||||
| Acquisition and integration expenses |
7.3 | 6.7 | 3.2 | 8.7 | 25.9 | |||||||||||||||
|
|
|
|
|
|
|
|
|
|
|
|||||||||||
| Operating income |
5.2 | 16.5 | 27.2 | — | 48.9 | |||||||||||||||
|
|
|
|
|
|
|
|
|
|
|
|||||||||||
| Net (loss) income from continuing operations |
(10.2 | ) | (4.5 | ) | 1.6 | 9.5 | (3.6 | ) | ||||||||||||
|
|
|
|
|
|
|
|
|
|
|
|||||||||||
| Net (loss) income from discontinued operations, |
||||||||||||||||||||
| net of income taxes |
(24.2 | ) | (17.8 | ) | 43.0 | 9.7 | 10.7 | |||||||||||||
|
|
|
|
|
|
|
|
|
|
|
|||||||||||
| Less: Net income attributable to non-controlling interests - discontinued operations |
2.0 | 2.3 | 2.1 | 2.1 | 8.5 | |||||||||||||||
|
|
|
|
|
|
|
|
|
|
|
|||||||||||
| Net (loss) income attributable to Cott Corporation |
$ | (36.4 | ) | $ | (24.6 | ) | $ | 42.5 | $ | 17.1 | $ | (1.4 | ) | |||||||
|
|
|
|
|
|
|
|
|
|
|
|||||||||||
| Per share data: |
||||||||||||||||||||
| Net (loss) income per common share attributable to Cott Corporation |
||||||||||||||||||||
| Basic: |
||||||||||||||||||||
| Continuing operations |
$ | (0.07 | ) | $ | (0.03 | ) | $ | 0.01 | $ | 0.07 | $ | (0.03 | ) | |||||||
|
|
|
|
|
|
|
|
|
|
|
|||||||||||
| Discontinued operations |
$ | (0.19 | ) | $ | (0.15 | ) | $ | 0.29 | $ | 0.05 | $ | 0.02 | ||||||||
|
|
|
|
|
|
|
|
|
|
|
|||||||||||
| Net (loss) income |
$ | (0.26 | ) | $ | (0.18 | ) | $ | 0.30 | $ | 0.12 | $ | (0.01 | ) | |||||||
|
|
|
|
|
|
|
|
|
|
|
|||||||||||
| Diluted: |
||||||||||||||||||||
| Continuing operations |
$ | (0.07 | ) | $ | (0.03 | ) | $ | 0.01 | $ | 0.07 | $ | (0.03 | ) | |||||||
|
|
|
|
|
|
|
|
|
|
|
|||||||||||
| Discontinued operations |
$ | (0.19 | ) | $ | (0.15 | ) | $ | 0.29 | $ | 0.05 | $ | 0.02 | ||||||||
|
|
|
|
|
|
|
|
|
|
|
|||||||||||
| Net (loss) income |
$ | (0.26 | ) | $ | (0.18 | ) | $ | 0.30 | $ | 0.12 | $ | (0.01 | ) | |||||||
|
|
|
|
|
|
|
|
|
|
|
|||||||||||
F-51
Table of Contents
| Year Ended December 31, 2016 | ||||||||||||||||||||
| (in millions of U.S. dollars, except per share amounts) |
First Quarter |
Second Quarter |
Third Quarter |
Fourth Quarter |
Total | |||||||||||||||
| Revenue, net |
$ | 305.1 | $ | 320.2 | $ | 476.7 | $ | 521.2 | $ | 1,623.2 | ||||||||||
| Cost of sales |
140.3 | 141.1 | 229.0 | 262.7 | 773.1 | |||||||||||||||
|
|
|
|
|
|
|
|
|
|
|
|||||||||||
| Gross profit |
164.8 | 179.1 | 247.7 | 258.5 | 850.1 | |||||||||||||||
| SG&A expenses |
159.4 | 163.0 | 225.3 | 258.5 | 806.2 | |||||||||||||||
| Loss on disposal of property, plant and equipment, net |
1.8 | 1.4 | 1.4 | 2.0 | 6.6 | |||||||||||||||
| Acquisition and integration expenses |
1.4 | 11.7 | 7.4 | 7.3 | 27.8 | |||||||||||||||
|
|
|
|
|
|
|
|
|
|
|
|||||||||||
| Operating income (loss) |
2.2 | 3.0 | 13.6 | (9.3 | ) | 9.5 | ||||||||||||||
|
|
|
|
|
|
|
|
|
|
|
|||||||||||
| Net income (loss) from continuing operations |
1.4 | (3.0 | ) | (4.0 | ) | (54.7 | ) | (60.3 | ) | |||||||||||
|
|
|
|
|
|
|
|
|
|
|
|||||||||||
| Net (loss) income from discontinued operations, net of income taxes |
(2.8 | ) | 11.9 | 2.9 | (23.2 | ) | (11.2 | ) | ||||||||||||
|
|
|
|
|
|
|
|
|
|
|
|||||||||||
| Less: Net income attributable to non-controlling interests - discontinued operations |
1.4 | 1.5 | 1.5 | 1.9 | 6.3 | |||||||||||||||
|
|
|
|
|
|
|
|
|
|
|
|||||||||||
| Net (loss) income attributable to Cott Corporation |
$ | (2.8 | ) | $ | 7.4 | $ | (2.6 | ) | $ | (79.8 | ) | $ | (77.8 | ) | ||||||
|
|
|
|
|
|
|
|
|
|
|
|||||||||||
| Per share data: |
||||||||||||||||||||
| Net (loss) income per common share attributable to |
||||||||||||||||||||
| Cott Corporation |
||||||||||||||||||||
| Basic: |
||||||||||||||||||||
| Continuing operations |
$ | 0.01 | $ | (0.02 | ) | $ | (0.03 | ) | $ | (0.40 | ) | $ | (0.47 | ) | ||||||
|
|
|
|
|
|
|
|
|
|
|
|||||||||||
| Discontinued operations |
$ | (0.03 | ) | $ | 0.08 | $ | 0.01 | $ | (0.18 | ) | $ | (0.14 | ) | |||||||
|
|
|
|
|
|
|
|
|
|
|
|||||||||||
| Net (loss) income |
$ | (0.02 | ) | $ | 0.06 | $ | (0.02 | ) | $ | (0.58 | ) | $ | (0.61 | ) | ||||||
|
|
|
|
|
|
|
|
|
|
|
|||||||||||
| Diluted: |
||||||||||||||||||||
| Continuing operations |
$ | 0.01 | $ | (0.02 | ) | $ | (0.03 | ) | $ | (0.40 | ) | $ | (0.47 | ) | ||||||
|
|
|
|
|
|
|
|
|
|
|
|||||||||||
| Discontinued operations |
$ | (0.03 | ) | $ | 0.08 | $ | 0.01 | $ | (0.18 | ) | $ | (0.14 | ) | |||||||
|
|
|
|
|
|
|
|
|
|
|
|||||||||||
| Net (loss) income |
$ | (0.02 | ) | $ | 0.06 | $ | (0.02 | ) | $ | (0.58 | ) | $ | (0.61 | ) | ||||||
|
|
|
|
|
|
|
|
|
|
|
|||||||||||
Note 22—Subsequent Events
On January 30, 2018, the Company completed the Transaction. The Transaction was structured as a sale of the assets of our Canadian business and a sale of the stock of the operating subsidiaries engaged in the Traditional Business in the other jurisdictions after we completed an internal reorganization. The aggregate consideration was approximately $1.25 billion,
F-52
Table of Contents
paid at closing in cash, subject to adjustment for indebtedness, working capital, and other customary post-closing adjustments. We used the cash proceeds from the Transaction to retire $525.0 million aggregate principal amount of the 2022 Notes, retire the remaining $250.0 million aggregate principal amount of the DSS Notes, repay $262.5 million of the outstanding balance on our ABL facility, and repay $1.9 million in aggregate principal outstanding on our GE Term Loan. Additionally, in connection with the closing of the Transaction on January 30, 2018, we further amended and restated the Amended and Restated Credit Agreement, dated as of August 3, 2016, as amended, which governed our prior ABL facility. The ABL facility, as amended and restated, is a revolving facility of up to $250.0 million, which may be increased up to an additional $100.0 million at our option if lenders agree to increase their commitments, with a maturity date of August 3, 2021.
On February 12, 2018, the Company entered into a definitive agreement to acquire Crystal Rock Holdings, Inc. (“Crystal Rock”), a direct-to-consumer home and office water, coffee, filtration and office supply service business serving customers throughout New York and New England, for approximately $35 million.
Under the terms of the merger agreement, a wholly-owned subsidiary of Cott commenced a tender offer on February 20, 2018 to acquire all of the outstanding shares of Crystal Rock’s common stock at a price of $0.97 per share in cash. The consummation of the tender offer is subject to several conditions, including a minimum tender of a majority of outstanding shares of Crystal Rock common stock on a fully diluted basis, and other customary conditions. Following consummation of the tender offer, such subsidiary will merge with and into Crystal Rock, such that, following the merger, Crystal Rock will become a wholly-owned subsidiary of Cott.
The acquisition of Crystal Rock is expected to close in March 2018, subject to the conditions to the tender offer and other customary closing conditions.
On February 28, 2018, the Board of Directors declared a dividend of $0.06 per common share, payable in cash on March 28, 2018 to shareowners of record at the close of business on March 13, 2018.
F-53
Table of Contents
SCHEDULE II—VALUATION AND QUALIFYING ACCOUNTS
| (in millions of U.S. dollars) |
Year Ended December 30, 2017 | |||||||||||||||||||||||
| Description |
Balance at Beginning of Year |
Reduction in Sales |
Charged to Costs and Expenses |
Charged to Other Accounts |
Deductions1 | Balance at End of Year |
||||||||||||||||||
| Reserves deducted in the balance sheet from the asset to which they apply |
||||||||||||||||||||||||
| Allowances for losses on: |
||||||||||||||||||||||||
| Accounts receivables |
$ | (6.3 | ) | $ | 0.1 | $ | (16.2 | ) | $ | 10.8 | $ | 3.8 | $ | (7.8 | ) | |||||||||
| Inventories |
(1.3 | ) | — | (0.4 | ) | — | 0.2 | (1.5 | ) | |||||||||||||||
| Deferred tax assets |
(117.7 | ) | — | (17.6 | ) | 6.2 | — | (129.1 | ) | |||||||||||||||
|
|
|
|
|
|
|
|
|
|
|
|
|
|||||||||||||
| $ | (125.3 | ) | $ | 0.1 | $ | (34.2 | ) | $ | 17.0 | $ | 4.0 | $ | (138.4 | ) | ||||||||||
|
|
|
|
|
|
|
|
|
|
|
|
|
|||||||||||||
| (in millions of U.S. dollars) |
Year Ended December 31, 2016 | |||||||||||||||||||||||
| Description |
Balance at Beginning of Year |
Reduction in Sales |
Charged to Costs and Expenses |
Charged to Other Accounts |
Deductions1 | Balance at End of Year |
||||||||||||||||||
| Reserves deducted in the balance sheet from the asset to which they apply |
||||||||||||||||||||||||
| Allowances for losses on: |
||||||||||||||||||||||||
| Accounts receivables |
$ | (5.6 | ) | $ | — | $ | (12.1 | ) | $ | 12.0 | $ | (0.6 | ) | $ | (6.3 | ) | ||||||||
| Inventories |
(0.1 | ) | — | (0.1 | ) | (1.2 | ) | 0.1 | (1.3 | ) | ||||||||||||||
| Deferred tax assets2 |
(1.2 | ) | — | (61.3 | ) | (55.2 | ) | — | (117.7 | ) | ||||||||||||||
|
|
|
|
|
|
|
|
|
|
|
|
|
|||||||||||||
| $ | (6.9 | ) | $ | — | $ | (73.5 | ) | $ | (44.4 | ) | $ | (0.5 | ) | $ | (125.3 | ) | ||||||||
|
|
|
|
|
|
|
|
|
|
|
|
|
|||||||||||||
| (in millions of U.S. dollars) |
Year Ended January 2, 2016 | |||||||||||||||||||||||
| Description |
Balance at Beginning of Year |
Reduction in Sales |
Charged to Costs and Expenses |
Charged to Other Accounts |
Deductions1 | Balance at End of Year |
||||||||||||||||||
| Reserves deducted in the balance sheet from the asset to which they apply |
||||||||||||||||||||||||
| Allowances for losses on: |
||||||||||||||||||||||||
| Accounts receivables |
$ | (1.6 | ) | $ | — | $ | (14.8 | ) | $ | 12.2 | $ | (1.4 | ) | $ | (5.6 | ) | ||||||||
| Inventories |
(0.1 | ) | — | (0.1 | ) | — | 0.1 | (0.1 | ) | |||||||||||||||
| Deferred tax assets |
(0.9 | ) | — | (0.3 | ) | — | — | (1.2 | ) | |||||||||||||||
|
|
|
|
|
|
|
|
|
|
|
|
|
|||||||||||||
| $ | (2.6 | ) | $ | — | $ | (15.2 | ) | $ | 12.2 | $ | (1.3 | ) | $ | (6.9 | ) | |||||||||
|
|
|
|
|
|
|
|
|
|
|
|
|
|||||||||||||
| 1. | Deductions primarily represent uncollectible accounts written off. |
| 2. | Amounts charged to other accounts include $27.3 million and $23.8 million of valuation allowances recorded through purchase accounting during 2016 related to the Aquaterra Acquisition and Eden Acquisition, respectively. |
F-54