Attached files
| file | filename |
|---|---|
| EX-99.1 - EXHIBIT 99.1 - R1 RCM INC. | a4q16earningprfinal120pm.htm |
| 8-K - 8-K - R1 RCM INC. | a3-1x178xk.htm |

Q4 and Full Year 2016 Results Conference Call
March 1, 2017
Exhibit 99.2

2
Safe Harbor Statement and Non-GAAP Financial Measures
This presentation contains forward-looking statements, including statements regarding future growth, plans and performance. All forward-
looking statements contained in this presentation involve risks and uncertainties. The Company’s actual results and outcomes could differ
materially from those anticipated in these forward-looking statements as a result of various factors, including the factors set forth under the
heading “Risk Factors” in its Annual Report on Form 10-K for the year ended December 31, 2016, filed with the SEC on March 1, 2017. The
words “strive,” “objective,” “anticipates,” “believes,” “estimates,” “expects,” “intends,” “may,” “plans,” “projects,” “vision,” “would,” and
similar expressions are intended to identify forward-looking statements, although not all forward-looking statements contain these identifying
words. The Company has based these forward-looking statements on its current expectations and projections about future events. Although
the Company believes that the expectations underlying any of its forward-looking statements are reasonable, these expectations may prove to
be incorrect and all of these statements are subject to risks and uncertainties. Should one or more of these risks and uncertainties materialize,
or should underlying assumptions, projections, or expectations prove incorrect, actual results, performance, financial condition, or events may
vary materially and adversely from those anticipated, estimated, or expected.
All forward-looking statements included in this presentation are expressly qualified in their entirety by these cautionary statements. The
Company cautions readers not to place undue reliance on any forward-looking statement that speaks only as of the date made and to
recognize that forward-looking statements are predictions of future results, which may not occur as anticipated. Actual results could differ
materially from those anticipated in the forward-looking statements and from historical results, due to the uncertainties and factors described
above, as well as others that the Company may consider immaterial or does not anticipate at this time. Although the Company believes that
the expectations reflected in its forward-looking statements are reasonable, the Company does not know whether its expectations may prove
correct. The Company’s expectations reflected in its forward-looking statements can be affected by inaccurate assumptions it might make or
by known or unknown uncertainties and factors, including those described above. The risks and uncertainties described above are not
exclusive, and further information concerning the Company and its business, including factors that potentially could materially affect its
financial results or condition or relationships with customers and potential customers, may emerge from time to time. The Company assumes
no, and it specifically disclaims any, obligation to update, amend, or clarify forward-looking statements to reflect actual results or changes in
factors or assumptions affecting such forward-looking statements. The Company advises investors, however, to consult any further disclosures
it makes on related subjects in our periodic reports that it files with or furnishes to the SEC.
This presentation includes the following non-GAAP financial measures : Gross Cash Generated and Net Cash Generated from Customer
Contracting Activities (on a historical basis), and Adjusted EBITDA (on a projected basis). Please refer to the Appendix located at the end of this
presentation for a reconciliation of the non-GAAP financial measures to the most directly comparable GAAP financial measure.

3
2016 Highlights
Financial Results
Significant bottom-line improvement in 2H’16 versus 1H’16
Company re-launch
Rebranded company in January 2017
On track for relisting in 1H’17
Renewal and expansion of Ascension agreement
Started onboarding first tranche in mid-2016
Deployment office set up as a strategic capability
Intermountain Healthcare renewal
Second-largest R1 customer – improved visibility to forecast
PAS Improvement
Gained market share in addition to organic growth
Cost structure alignment
Annualized cost savings of approximately $16 million

4
2017 Goals
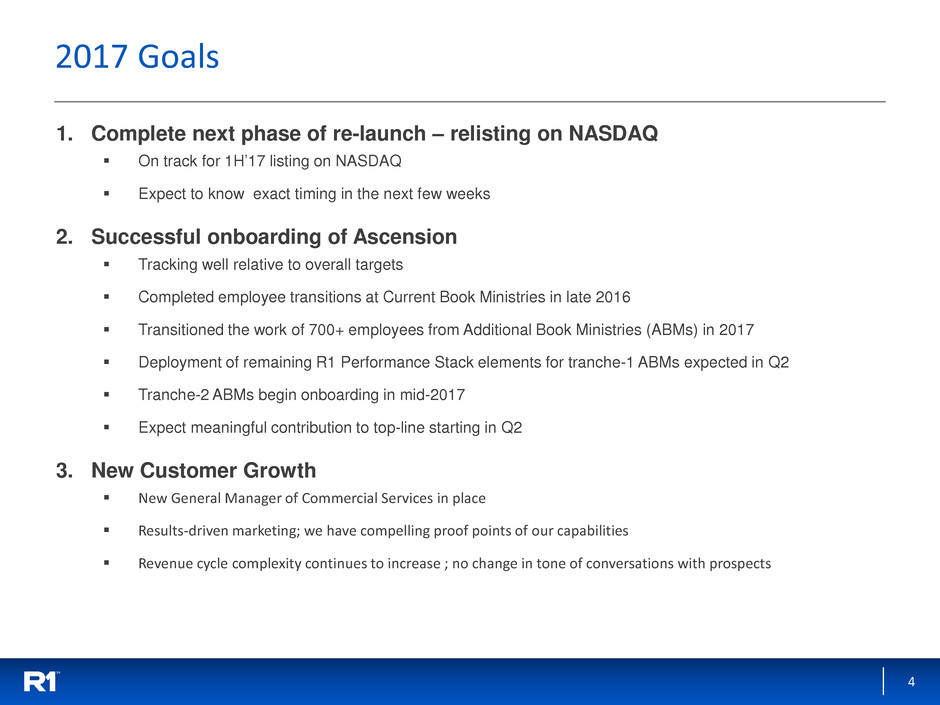
1. Complete next phase of re-launch – relisting on NASDAQ
On track for 1H’17 listing on NASDAQ
Expect to know exact timing in the next few weeks
2. Successful onboarding of Ascension
Tracking well relative to overall targets
Completed employee transitions at Current Book Ministries in late 2016
Transitioned the work of 700+ employees from Additional Book Ministries (ABMs) in 2017
Deployment of remaining R1 Performance Stack elements for tranche-1 ABMs expected in Q2
Tranche-2 ABMs begin onboarding in mid-2017
Expect meaningful contribution to top-line starting in Q2
3. New Customer Growth
New General Manager of Commercial Services in place
Results-driven marketing; we have compelling proof points of our capabilities
Revenue cycle complexity continues to increase ; no change in tone of conversations with prospects

5
Overview of Non-GAAP Measures*
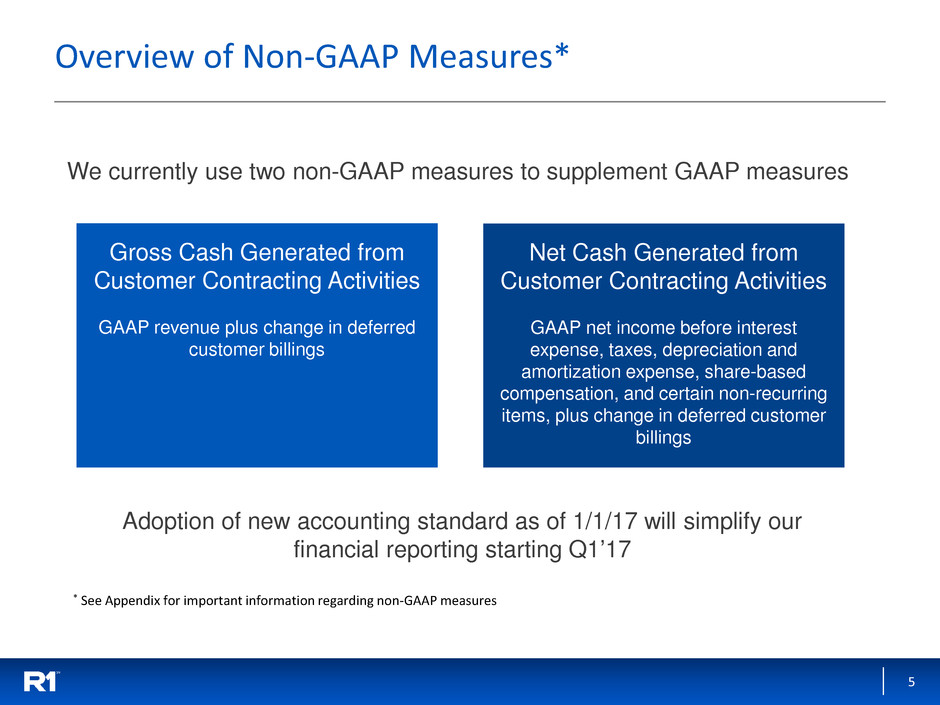
We currently use two non-GAAP measures to supplement GAAP measures
Gross Cash Generated from
Customer Contracting Activities
GAAP revenue plus change in deferred
customer billings
Net Cash Generated from
Customer Contracting Activities
GAAP net income before interest
expense, taxes, depreciation and
amortization expense, share-based
compensation, and certain non-recurring
items, plus change in deferred customer
billings
* See Appendix for important information regarding non-GAAP measures
Adoption of new accounting standard as of 1/1/17 will simplify our
financial reporting starting Q1’17

6
Q4’16 non-GAAP Results – Q/Q and Y/Y Comparison
($ in millions) 4Q’16 3Q’16 4Q’15 Key change driver(s)
Gross Cash
Generated
$69.8 $59.7 $72.7
• Ascension CBM employees
onboarded in Q4
• Customer attrition y/y
• PAS growth q/q and y/y
Cost of Services $58.1 $43.6 $35.5
• Onboarding of Ascension CBM
employees to R1
SG&A $12.1 $12.6 $10.2
• June 2016 restructuring, offset in
part by re-launch expenses
• Lower incentive compensation in
4Q’15
Net Cash Generated ($0.4) $3.6 $27.0 • Combination of above reasons

7
2016 vs. 2015 Results (non-GAAP)
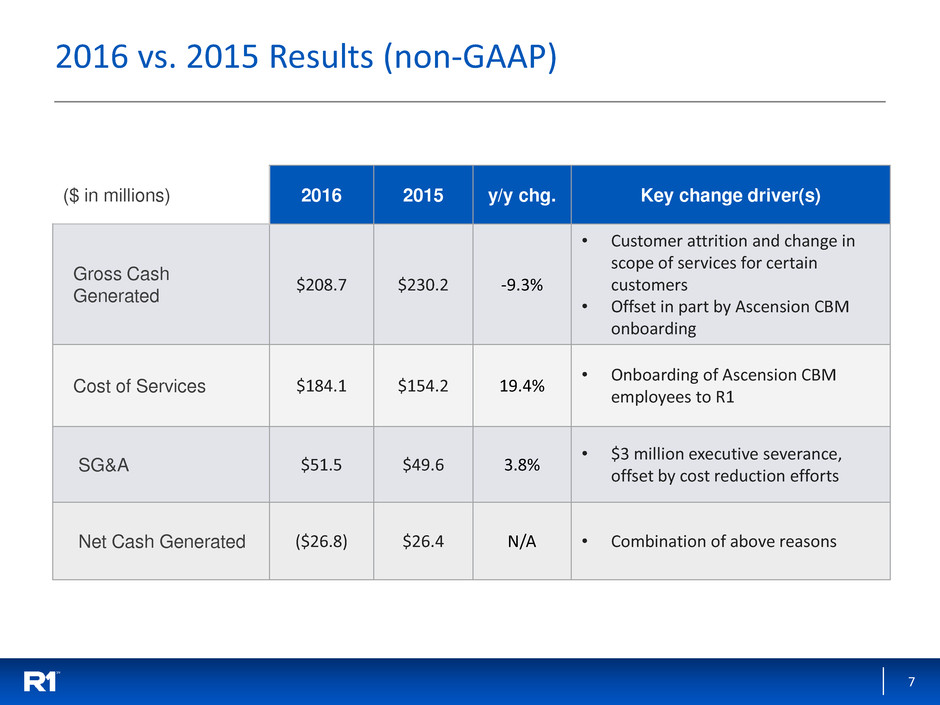
($ in millions) 2016 2015 y/y chg. Key change driver(s)
Gross Cash
Generated
$208.7 $230.2 -9.3%
• Customer attrition and change in
scope of services for certain
customers
• Offset in part by Ascension CBM
onboarding
Cost of Services $184.1 $154.2 19.4%
• Onboarding of Ascension CBM
employees to R1
SG&A $51.5 $49.6 3.8%
• $3 million executive severance,
offset by cost reduction efforts
Net Cash Generated ($26.8) $26.4 N/A • Combination of above reasons

8
Additional Commentary
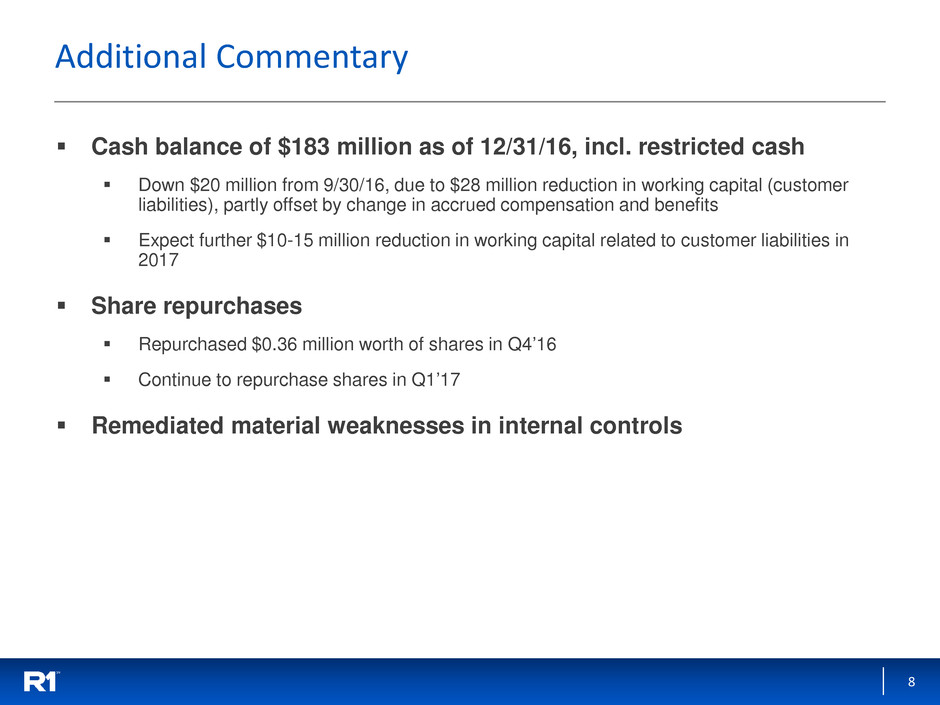
Cash balance of $183 million as of 12/31/16, incl. restricted cash
Down $20 million from 9/30/16, due to $28 million reduction in working capital (customer
liabilities), partly offset by change in accrued compensation and benefits
Expect further $10-15 million reduction in working capital related to customer liabilities in
2017
Share repurchases
Repurchased $0.36 million worth of shares in Q4’16
Continue to repurchase shares in Q1’17
Remediated material weaknesses in internal controls

9
2017 Guidance
($ in millions) 2017
Revenue $400 - $425
GAAP Operating Income ($25) – ($30)
Adjusted EBITDA* $0 - $5
* Adjusted EBITDA is calculated as GAAP operating income plus depreciation and
amortization expense, share-based compensation expense, and severance and other costs.

10
2020 Outlook
($ in millions) 2020
Revenue $700 - $900
GAAP Operating Income $75 - $105
Adjusted EBITDA* $105 - $135
* Adjusted EBITDA is calculated as GAAP operating income plus depreciation and
amortization expense, share-based compensation expense, and severance and other costs.

11
Appendix

12
Use of Non-GAAP Financial Measures
In order to provide a more comprehensive understanding of the information used by R1’s management team in financial and operational
decision making, the Company supplements its GAAP consolidated financial statements with certain non-GAAP financial measures, which
are included in this presentation on a projected basis. These include Gross Cash Generated from Customer Contracting Activities, Net Cash
Generated from Customer Contracting Activities, and adjusted EBITDA. Our Board and management team use these non-GAAP measures as
(i) one of the primary methods for planning and forecasting overall expectations and for evaluating actual results against such expectations;
and (ii) a performance evaluation metric in determining achievement of certain executive incentive compensation programs, as well as for
incentive compensation plans for employees.
Gross Cash Generated from Customer Contracting Activities is defined as GAAP net services revenue, plus the change in deferred customer
billings. Accordingly, Gross Cash Generated from Customer Contracting Activities is the sum of (i) invoiced or accrued net operating fees, (ii)
cash collections on incentive fees and (iii) other services fees. Net Cash Generated from Customer Contracting Activities reflects non-GAAP
adjusted EBITDA and the change in deferred customer billings. The Company anticipates that it will no longer report Gross Cash Generated
from Customer Contracting Activities and Net Cash Generated from Customer Contracting Activities once it adopts the new revenue
recognition accounting standard in 2017.
Adjusted EBITDA is defined as net income before net interest income (expense), income tax provision, depreciation and amortization
expense, share-based compensation, transaction-related expenses, reorganization-related expenses and certain other items. The use of
adjusted EBITDA to measure operating and financial performance is limited by our revenue recognition criteria, pursuant to which GAAP
net services revenue is recognized at the end of a contract or other contractual agreement event. Adjusted EBITDA does not adequately
match corresponding cash flows from customer contracting activities. As a result, the Company uses Gross and Net Cash Generated from
Customer Contracting Activities to better compare cash flows to operating performance.
Deferred customer billings include the portion of both (i) invoiced or accrued net operating fees and (ii) cash collections of incentive fees, in
each case, that have not met our revenue recognition criteria. Deferred customer billings are included in the detail of our customer
liabilities balance in the consolidated balance sheet available in the Company’s Annual Report on Form 10-K for the year ended December
31, 2016.
These adjusted measures are non-GAAP and should be considered in addition to, but not as a substitute for, the information prepared in
accordance with GAAP.

13
Reconciliation of GAAP net services revenue to non-GAAP Gross Cash
Generated from Customer Contracting Activities
* fav. - Favorable
unfav. – Unfavorable
$ in thousands
Three Months Ended
December 31,
2016 vs. 2015 Change
Year Ended
December 31,
2016 vs. 2015 Change
2016
2015
Amount %
2016
2015
Amount %
Consolidated Statement of Operations Data:
RCM services: net operating fees $68,589
$46,832
$21,757 46.5%
$368,848
$66,234
$302,614 456.9%
RCM services: incentive fees 24,780
11,289
13,491 119.5%
191,317
20,311
171,006 841.9%
RCM services: other 8,030
6,790
1,240 18.3%
16,322
16,381
(59) -0.4%
Other services fees 4,758
3,430
1,328 38.7%
16,070
14,313
1,757 12.3%
Total net services revenue 106,157
68,341
37,816 55.3%
592,557
117,239
475,318 405.4%
Change in deferred customer billings (318,059)
4,337
(322,396) unfav.
(383,864)
112,938
(496,802) unfav.
Gross cash generated from customer
contracting activities
$69,835
$72,678
($284,580) -391.6%
$208,693
$230,177
($21,484) -9.3%
Components of Gross Cash Generated from Customer Contracting Activities:
RCM services: net operating fee $55,713
$34,424
$21,289 61.8%
$150,527
$123,185
$27,342 22.2%
RCM services: incentive fee 5,309
20,155
(14,846) -73.7%
29,112
67,656
(38,544) -57.0%
RCM services: other 4,056
14,669
(10,613) -72.3%
12,985
25,023
(12,038) -48.1%
Total RCM services fees 65,078
69,248
(4,170) -6.0%
192,624
215,864
(23,240) -10.8%
Other services fees 4,757
3,430
1,327 38.7%
16,069
14,313
1,756 12.3%
Gross cash generated from customer
contracting activities
$69,835
$72,678
($2,843) -3.9%
$208,693
$230,177
($21,484) -9.3%

14
Reconciliation of GAAP net income (loss) to non-GAAP Net Cash Generated
from Customer Contracting Activities
* fav. - Favorable
unfav. – Unfavorable
$ in thousands
Three Months Ended
December 31,
2016 vs. 2015 Change
Year Ended
December 31,
2016 vs. 2015 Change
2016
2015
Amount %
2016
2015
Amount %
Net income (loss) $13,126
$5,447
$7,679 141.0%
$177,071
($84,256)
$261,327 -310.2%
Net interest income (110)
(84)
(26) 31.0%
(297)
(231)
(66) 28.6%
Income tax provision (benefit) 14,493
5,555
8,938 160.9%
121,127
(51,557)
172,684 -334.9%
Depreciation and amortization expense 2,893
1,906
987 51.8%
10,198
8,462
1,736 20.5%
Share-based compensation expense 4,659
6,353
(1,694) -26.7%
28,102
31,671
(3,569) -11.3%
Other 829
3,493
(2,664) -76.3%
20,822
9,343
11,479 122.9%
Adjusted EBITDA 35,890
22,670
13,220 58.3%
357,023
(86,568)
443,591 -512.4%
Change in deferred customer billings (36,322)
4,337
(40,659) unfav.
(383,864)
112,938
(496,802) unfav.
Net cash generated from customer contracting
activities
($432)
$27,007
($27,439) unfav.
($26,841) $26,370
($53,211) unfav.

15
Share-Based Compensation and D&A Expense included within Operating Expenses
Three Months Ended
December 31,
Year Ended
December 31,
2016
2015
2016
2015
Cost of services $1,333
$1,452
$6,137
$7,208
Selling, general and administrative $3,326
4,901
21,965
24,463
Other $0
—
1,828
—
Total share-based compensation expense $4,659
$6,353
$29,930
$31,671
Three Months Ended
December 31,
Year Ended
December 31,
2016
2015
2016
2015
Cost of services $2,620
$1,737
$9,492
$7,536
Selling, general and administrative $273
169
706
926
Total depreciation and amortization $2,893
$1,906
$10,198
$8,462
Share-Based Compensation Expense Allocation Details
Depreciation and Amortization Expense Allocation Details
$ in thousands
$ in thousands

16
Condensed Consolidated non-GAAP Financial Information
Three Months Ended December 31,
Year Ended December 31,
2016
2015
2016
2015
GAAP net services revenue $106,157
$68,341
$592,557
$117,239
Increase/(decrease) in deferred customer billings (36,322)
4,337
(383,864)
112,938
Gross cash generated from customer contracting activities 69,835
72,678
208,693
230,177
Operating Expenses1:
Cost of services 58,126
35,504
184,068
154,233
Selling, general and administrative 12,141
10,167
51,466
49,574
Sub-total 70,267
45,671
235,534
203,807
Net cash generated from customer contracting activities ($432)
$27,007
($26,841)
$26,370
Net cash generated margin -0.6%
37.2%
-12.9%
11.5%
$ in thousands
1Excludes share-based compensation, depreciation and amortization, and other costs

17
Reconciliation GAAP Operating Income Guidance to non-GAAP Adjusted EBITDA Guidance
$ in millions
2017 2020
GAAP Operating Income Guidance ($25) - ($30) $75 - $105
Plus:
Depreciation and amortization expense ~$13 $10- $15
Share-based compensation expense ~$13 $10- $15
Severance and other costs ~$5 ~$5
Adjusted EBITDA guidance $0 - $5 $105 - $135
