Attached files
UNITED STATES
SECURITIES AND EXCHANGE COMMISSION
Washington, D.C. 20549
FORM 10-K
x | Annual Report Pursuant to Section 13 or 15(d) of the Securities Exchange Act of 1934 |
For the fiscal year ended December 31, 2016
or
¨ | Transition Report Pursuant to Section 13 or 15(d) of the Securities Exchange Act of 1934 |
For the transition period from to
Commission File Number 1-12815
CHICAGO BRIDGE & IRON COMPANY N.V.
The Netherlands | Prinses Beatrixlaan 35 | 98-0420223 | ||
(State or other jurisdiction of | 2595 AK The Hague | (I.R.S. Employer Identification No.) | ||
incorporation or organization) | The Netherlands | |||
31 70 373 2010 | ||||
(Address and telephone number of principal executive offices) | ||||
Securities registered pursuant to Section 12(b) of the Act:
Title of each class: | Name of each exchange on which registered: | |
Common Stock; Euro .01 par value | New York Stock Exchange | |
Securities registered pursuant to Section 12(g) of the Act: none
Indicate by check mark if the registrant is a well-known seasoned issuer, as defined in Rule 405 of the Securities Act. YES x NO ¨
Indicate by check mark if the registrant is not required to file reports pursuant to Section 13 or Section 15(d) of the Act. YES ¨ NO x
Indicate by check mark whether the registrant (1) has filed all reports required to be filed by Section 13 or 15(d) of the Securities Exchange Act of 1934 during the preceding 12 months (or for such shorter period that the registrant was required to file such reports), and (2) has been subject to such filing requirements for the past 90 days. YES x NO ¨
Indicate by check mark whether the registrant has submitted electronically and posted on its corporate Website, if any, every Interactive Data File required to be submitted and posted pursuant to Rule 405 of Regulation S-T (§232.405 of this chapter) during the preceding 12 months (or for such shorter period that the registrant was required to submit and post such files). YES x NO ¨
Indicate by check mark if disclosure of delinquent filers pursuant to Item 405 of Regulation S-K (§229.405 of this chapter) is not contained herein, and will not be contained, to the best of registrant’s knowledge, in definitive proxy or information statements incorporated by reference in Part III of this Form 10-K or any amendment to this Form 10-K. ¨
Indicate by check mark whether the registrant is a large accelerated filer, an accelerated filer, a non-accelerated filer, or a smaller reporting company. See the definitions of “large accelerated filer,” “accelerated filer” and “smaller reporting company” in Rule 12b-2 of the Exchange Act.
Large accelerated filer | x | Accelerated filer | o |
Non-accelerated filer | o (Do not check if a smaller reporting company) | Smaller reporting company | o |
Indicate by check mark whether the registrant is a shell company (as defined in Rule 12b-2 of the Act). YES ¨ NO x
Aggregate market value of common stock held by non-affiliates, based on a New York Stock Exchange closing price of $34.63 as of June 30, 2016 was approximately $3.6 billion.
The number of shares outstanding of the registrant’s common stock as of February 16, 2017 was 100,307,516.
DOCUMENTS INCORPORATED BY REFERENCE
Portions of the 2017 Proxy Statement for the annual general meeting of shareholders to be held May 3, 2017 Part III
CHICAGO BRIDGE & IRON COMPANY N.V.
Table of Contents
Page | ||
Item 1. | ||
Item 1A. | ||
Item 1B. | ||
Item 2. | ||
Item 3. | ||
Item 4. | ||
Item 5. | ||
Item 6. | ||
Item 7. | ||
Item 7A. | ||
Item 8. | ||
Item 9. | ||
Item 9A. | ||
Item 9B. | ||
Item 10. | ||
Item 11. | ||
Item 12. | ||
Item 13. | ||
Item 14. | ||
Item 15. | ||
2
PART I
FORWARD-LOOKING STATEMENTS
This Annual Report on Form 10-K, including all documents incorporated by reference, contains forward-looking statements regarding Chicago Bridge & Iron Company N.V. (“CB&I” or “the Company”) and represents our expectations and beliefs concerning future events. These forward-looking statements are intended to be covered by the safe harbor for forward-looking statements provided by the Private Securities Litigation Reform Act of 1995. Forward-looking statements involve known and unknown risks and uncertainties. The forward-looking statements included herein or incorporated herein by reference include or may include, but are not limited to, (and you should read carefully) statements that are predictive in nature, depend upon or refer to future events or conditions, or use or contain words, terms, phrases, or expressions such as “achieve,” “forecast,” “plan,” “propose,” “strategy,” “envision,” “hope,” “will,” “continue,” “potential,” “expect,” “believe,” “anticipate,” “project,” “estimate,” “predict,” “intend,” “should,” “could,” “may,” “might,” or similar words, terms, phrases, or expressions or the negative of any of these terms. Any statements in this Form 10-K that are not based upon historical fact are forward-looking statements and represent our best judgment as to what may occur in the future.
In addition to the material risks listed under Item 1A “Risk Factors” that may cause business conditions or our actual results, performance or achievements to be materially different from those expressed or implied by any forward-looking statements, the following are some, but not all, of the factors that might cause business conditions or our actual results, performance or achievements to be materially different from those expressed or implied by any forward-looking statements, or contribute to such differences: our ability to realize cost savings from our expected performance of contracts, whether as a result of improper estimates, performance, or otherwise; uncertain timing and funding of new contract awards, as well as project cancellations; cost overruns on fixed-price or similar contracts or failure to receive timely or proper payments on cost-reimbursable contracts, whether as a result of improper estimates, performance, disputes, or otherwise; risks associated with labor productivity; risks associated with percentage of completion accounting; our ability to settle or negotiate unapproved change orders and claims; changes in the costs or availability of, or delivery schedule for, equipment, components, materials, labor or subcontractors; adverse impacts from weather affecting our performance and timeliness of completion, which could lead to increased costs and affect the quality, costs or availability of, or delivery schedule for, equipment, components, materials, labor or subcontractors; operating risks, which could lead to increased costs and affect the quality, costs or availability of, or delivery schedule for, equipment, components, materials, labor or subcontractors; increased competition; fluctuating revenue resulting from a number of factors, including a decline in energy prices and the cyclical nature of the individual markets in which our customers operate; delayed or lower than expected activity in the energy and natural resource industries, demand from which is the largest component of our revenue; lower than expected growth in our primary end markets, including but not limited to Liquefied Natural Gas (“LNG”) and energy processes; risks inherent in acquisitions and our ability to complete or obtain financing for acquisitions; our ability to integrate and successfully operate and manage acquired businesses and the risks associated with those businesses; the non-competitiveness or unavailability of, or lack of demand or loss of legal protection for, our intellectual property assets or rights; failure to keep pace with technological changes or innovation; failure of our patents or licensed technologies to perform as expected or to remain competitive, current, in demand, profitable or enforceable; adverse outcomes of pending claims or litigation or the possibility of new claims or litigation, and the potential effect of such claims or litigation on our business, financial position, results of operations and cash flow; lack of necessary liquidity to provide bid, performance, advance payment and retention bonds, guarantees, or letters of credit securing our obligations under our bids and contracts or to finance expenditures prior to the receipt of payment for the performance of contracts; proposed and actual revisions to United States (“U.S.”) and non-U.S. tax laws, and interpretation of said laws, Dutch tax treaties with foreign countries and U.S. tax treaties with non-U.S. countries (including, but not limited to The Netherlands), which would seek to increase income taxes payable; political and economic conditions including, but not limited to, war, conflict or civil or economic unrest in countries in which we operate; compliance with applicable laws and regulations in any one or more of the countries in which we operate including, but not limited to, the U.S. Foreign Corrupt Practices Act (“FCPA”) and those concerning the environment, export controls and trade sanction programs; our inability to properly manage or hedge currency or similar risks; and a downturn, disruption, or stagnation in the economy in general.
Although we believe the expectations reflected in our forward-looking statements are reasonable, we cannot guarantee future performance or results. You should not unduly rely on any forward-looking statements. Each forward-looking statement is made and applies only as of the date of the particular statement, and we are not obligated to update, withdraw, or revise any forward-looking statements, whether as a result of new information, future events or otherwise. You should consider these risks when reading any forward-looking statements. All forward-looking statements attributed or attributable to us or to persons acting on our behalf are expressly qualified in their entirety by this section entitled “Forward-Looking Statements”.
3
Item 1. Business
Founded in 1889, CB&I, a Netherlands company, provides a wide range of services, including conceptual design, technology, engineering, procurement, fabrication, modularization, construction, commissioning, maintenance, program management and environmental services to customers in the energy infrastructure market throughout the world, and is a provider of diversified government services. Our stock trades on the New York Stock Exchange (“NYSE”) under the ticker symbol “CBI.” With more than a century of experience and approximately 42,100 employees worldwide, we capitalize on our global expertise and local knowledge to safely and reliably deliver projects virtually anywhere. At a given point in time, we have active projects in process in more than 70 countries.
Dispositions
On December 31, 2015 we completed the sale of our nuclear power construction business (the “Nuclear Operations”), previously included within our Engineering & Construction operating group, to Westinghouse Electric Company LLC (“WEC”) for transaction consideration of approximately $161.0 million, which is due upon WEC’s substantial completion of the acquired VC Summer and Vogtle nuclear projects. At December 31, 2015, we recorded the present value of the transaction consideration (the “Transaction Receivable”); however, during the fourth quarter 2016 we determined that recovery was no longer probable and recorded a non-cash pre-tax charge of approximately $148.1 million (approximately $96.3 million after-tax) to reserve the Transaction Receivable. During 2015, we recorded a non-cash pre-tax charge of approximately $1.5 billion (approximately $1.1 billion after-tax) related to the impairment of goodwill (approximately $453.1 million) and intangible assets (approximately $79.1 million) and a loss on the net assets sold (approximately $973.7 million) as a result of the sale.
See Note 4 and Note 12 within Item 8 for additional discussion regarding the sale of our Nuclear Operations and related dispute with WEC, respectively.
Segment Financial Information
Our management structure and internal and public segment reporting are aligned based upon the services offered by our four operating groups, which represent our reportable segments.
Engineering & Construction. Engineering & Construction provides engineering, procurement and construction (“EPC”) services for major energy infrastructure facilities. Projects for this operating group include upstream and downstream process facilities for the oil and gas industry, such as refinery process units and petrochemical facilities, as well as LNG liquefaction and regasification terminals, and fossil electric generating plants for the power generation industry. Customers include international energy companies such as AES, Chevron, ExxonMobil, Duke Energy, Westlake Chemical Corporation, Lotte Chemical Corporation and Sempra Energy; national energy companies such as Orpic (Oman) and KNPC (Kuwait); and regional energy companies in the U.S. such as Entergy and Freeport LNG.
Fabrication Services. Fabrication Services provides fabrication and erection of steel plate structures; fabrication of piping systems and process modules; manufacturing and distribution of pipe and fittings; and engineered products for the oil and gas, petrochemical, power generation, water and wastewater, mining and mineral processing industries. Projects for this operating group include above ground storage tanks, LNG and low temperature tanks, field erected pressure vessels and spheres, elevated water storage tanks and other specialty structures, process modules, fabrication of piping and structural steel, induction bending and module prefabrication and assembly. Customers include international energy companies such as Chevron, ChevronPhillips, ConocoPhillips, Dow, ExxonMobil and Shell; international mining and mineral processing companies such as Alcoa and BHP; national energy companies such as ADNOC (United Arab Emirates (“UAE”)), KNPC (Kuwait) and Saudi Aramco (Saudi Arabia); regional refining, chemical, and gas processing companies such as Flint Hills Resources (U.S.), Suncor (U.S. and Canada) and Sunoco (U.S.); and regional terminal operators such as Enterprise (U.S.) and Kinder Morgan (U.S. and Canada).
Technology. Technology provides proprietary process technology licenses and associated engineering services and catalysts, primarily for the petrochemical and refining industries, and offers process planning and project development services and a comprehensive program of aftermarket support. Technology has a 50% owned unconsolidated joint venture with Chevron (“Chevron-Lummus Global” or “CLG”) that provides proprietary process technology licenses and associated engineering services and catalyst, primarily for the refining industry. Technology also has a 33.3% owned unconsolidated joint venture (“NET Power”) with Exelon Generation Company, LLC and 8 Rivers Capital, LLC, for the purpose of commercializing a new natural gas power generation system that recovers the carbon dioxide produced during combustion. The joint venture is currently building a demonstration unit in Texas. Technology customers include international energy companies such as Chevron, Phillips 66, Reliance, Shell, TOTAL, and Valero; national energy companies such as Indian Oil (India), Pemex (Mexico), Saudi Aramco (Saudi Arabia), PetroChina (China) and Takreer (UAE); and regional energy companies such as Irving Oil (Canada) and Thai Oil (Thailand).
Capital Services. Capital Services provides comprehensive and integrated maintenance services, environmental engineering and remediation, construction services, program management, and disaster response and recovery for private-sector customers and governments. Private-sector customers include international chemical manufacturing companies such as
4
Occidental Chemical; regional energy providers in the U.S. such as Entergy and Exelon; and regional refining, chemical, and gas processing companies in the U.S. such as Flint Hills Resources. Government customers include U.S. Federal departments and agencies such as the U.S. Department of Defense (“DOD”), U.S. Department of Energy (“DOE”), U.S. Environmental Protection Agency (“EPA”) and the U.S. Federal Emergency Management Agency (“FEMA”), as well as U.S. state and local governments.
Segment financial information by operating group can be found under “Results of Operations” within Item 7 “Management’s Discussion and Analysis of Financial Condition and Results of Operations” and in Note 17 within Item 8.
Competitive Strengths
Our core competencies, which we believe are significant competitive strengths, include:
Strong Health, Safety and Environmental (“HSE”) Performance. Because of our long and outstanding safety record, we are sometimes invited to bid on projects for which other competitors do not qualify. Our HSE performance also translates directly to lower costs and reduced risk to our employees, subcontractors and customers. According to the U.S. Bureau of Labor Statistics, the national Lost Workday Case Incidence Rate for construction companies similar to CB&I was 1.0 per 100 full-time employees for 2015 (the latest reported year), while our rates for 2015 and 2016 were only 0.01 per 100 employees and 0.02 per 100 employees, respectively. CB&I was awarded the 2015 Green Cross for Safety medal by the National Safety Council for our outstanding achievement in workplace safety. CB&I was the first company in our industry to earn this honor, which is one of the most prestigious safety awards a company can receive.
Licensed Technologies. We hold approximately 3,500 patents and offer a broad, state-of-the-art portfolio of over 90 hydrocarbon refining, petrochemical and gas processing technologies. Our ability to provide licensed technologies sets us apart from our competitors and presents opportunities for increased profitability. Combining technology with EPC capabilities strengthens our presence throughout the project life cycle, allowing us to capture additional market share in higher margin growth markets.
Worldwide Record of Excellence. We have an established record as a leader in the international engineering and construction industry by providing consistently superior project performance for more than a century. The extensive roster of successful projects that we have executed around the world serves as a reference list for prospective clients, many of whom view such reference projects as a critically important element in selecting a contractor.
Global Execution Capabilities. With a network of approximately 200 sales and operations offices around the world, established supplier relationships and available workforces, we have the ability to rapidly mobilize personnel, materials and equipment to execute projects in locations ranging from highly industrialized countries to some of the world’s most remote regions. Additionally, due primarily to our long-standing presence in numerous markets around the world, we have a prominent position as a local direct hire contractor in global energy and industrial markets.
Integrated Execution Model. We are one of the few EPC contractors that has self perform construction capability in the U.S. and worldwide. In addition, we believe our world class piping fabrication facilities around the world are unique in the EPC contractor industry. These are key elements of our integrated project delivery model that provides our customers lower costs and schedule assurance due to our ability to directly perform and control the critical path activities of most projects. This provides us with a competitive advantage over other EPC contractors that operate in our space.
Modular Fabrication. We are one of the few EPC contractors and process technology providers with fabrication facilities, which allows us to offer customers the option of modular construction, when feasible. In contrast to traditional on-site “stick built” construction, modular construction enables modules to be built within a tightly monitored shop environment which allows us to, among other things, better control quality, minimize weather delays and expedite schedules. Once completed, the modules are shipped to, and assembled at, the project site.
Recognized Expertise. Our in-house engineering team includes internationally-recognized experts in a broad range of energy infrastructure fields, including processes and facilities related to oil and gas production, LNG, refining, petrochemicals, gas processing, power generation, modular design and fabrication, cryogenic storage and processing, and bulk liquid storage and systems. Several of our senior engineers are long-standing members of committees that have helped develop worldwide standards for storage structures and process vessels for the oil and gas industry, including the American Petroleum Institute and the American Society of Mechanical Engineers. In addition, and due in part to our integrated execution model, our engineers work closely with project managers to ensure that our design proposals place a premium on practical construction considerations.
Diversified Offering of Products and Services. We are well-diversified in our offerings and in the geographies we serve within the energy infrastructure market. Our diversity ranges from downstream activities such as gas processing, LNG, refining, and petrochemicals, to fossil based power plants and upstream activities such as offshore oil and gas and onshore oil sands projects. Our products and services for these end markets include feasibility studies and consulting, technology licensing,
5
front end engineering design, EPC, piping and modular fabrication, storage solutions, engineered products, specialized equipment, and operations, maintenance and environmental services. The diversity of our offerings improves our competitive positioning by allowing us to provide our customers with a fully-integrated platform for turnkey delivery, while retaining the flexibility to provide stand-alone offerings. In addition to serving the energy infrastructure market, we provide diversified government services.
Strong Focus on Project Risk Management. We are experienced in managing the risks associated with identifying, screening, bidding and executing complex projects. Our position as an integrated EPC service provider allows us to execute global projects on a competitively bid and negotiated basis. We offer our customers a range of contracting options, including cost-reimbursable, fixed-price and hybrid, which has both cost-reimbursable and fixed-price characteristics.
Management Team with Extensive Engineering and Construction Industry Experience. Members of our senior management team have an average of over 30 years of experience in the energy infrastructure industry.
Growth Strategy
Although our near-term prospects may be moderated by the overall level of capital investment in energy infrastructure, we anticipate that our intermediate-term growth will primarily be derived organically from our competitive positioning in existing end markets. Through our fully integrated offerings, we have the ability to provide technology, engineering, procurement, fabrication, construction, maintenance, and associated services. Our ability to grow is underpinned by our capacity to compete for, and execute, the largest energy infrastructure projects globally while maintaining the agility to pursue stand-alone opportunities that generate a strong base of work. Our competitive positioning is further supported by our superior record of project execution coupled with selectivity in the developments we pursue and our partnering arrangements. On an opportunistic and strategic basis, we may pursue further growth through selective acquisitions of additional businesses, technologies, or assets that expand or complement our strategic alliances or current portfolio of services and meet our stringent acquisition criteria.
Competition
We operate in a competitive environment. Technology performance, price, timeliness of completion, quality, safety record, track record and reputation are principal competitive factors within our industry. There are numerous regional, national and global competitors that offer similar services to those offered by each of our operating groups.
Marketing and Customers
We contract directly with hundreds of customers in the energy, petrochemical, natural resource, power and government services industries. We rely primarily on direct contact between our technically qualified sales and engineering staff and our customers’ engineering and contracting departments. Dedicated sales employees are located in offices throughout the world.
Our significant customers are primarily in the hydrocarbon and power generation industries and include major petroleum and petrochemical companies (see the “Segment Financial Information” section above for a representative listing of our customers by operating group). We have longstanding relationships with many of our significant customers; however, we are not dependent upon any single customer on an ongoing basis and do not believe the loss of any single customer would have a material adverse effect on our business. For 2016, 2015, and 2014 revenue from our LNG mechanical erection and tank projects in the Asia Pacific region for Gorgon LNG was approximately $1.1 billion (approximately 11% of our consolidated 2016 revenue), approximately $1.6 billion (approximately 13% of our consolidated 2015 revenue), and approximately $2.0 billion (approximately 15% of our consolidated 2014 revenue), respectively. For 2016, revenue from our LNG export facility projects in the U.S. for Sempra Energy and Freeport LNG were approximately $1.6 billion (approximately 15% of our consolidated 2016 revenue) and approximately $1.1 billion (approximately 10% of our consolidated 2016 revenue), respectively.
Backlog
New awards represent the expected revenue value of new contract commitments received during a given period, as well as scope growth on existing commitments. Backlog represents the unearned value of our new awards. New awards and backlog include the entire award values for joint ventures we consolidate and our proportionate share of award values for joint ventures we proportionately consolidate. New awards and backlog also include our pro-rata share of the award values for unconsolidated joint ventures we account for under the equity method. As the net results for our equity method joint ventures are recognized as equity earnings, their revenue is not presented in our Consolidated Statement of Operations. Backlog may fluctuate with currency movements.
At December 31, 2016, we had backlog of approximately $18.5 billion (including approximately $1.7 billion related to our equity method joint ventures), compared with $22.6 billion at December 31, 2015 (including approximately $1.8 billion related to our equity method joint ventures). The decrease in backlog from 2015 is primarily due to the impact of revenue exceeding new awards by $3.8 billion (including approximately $187.4 million of revenue related to our equity method joint
6
ventures) and other adjustments, primarily related to reductions in maintenance backlog for our Capital Services operating group. The geographic mix of our backlog and revenue is primarily dependent upon global energy demand and at December 31, 2016, approximately 20% of our backlog was derived from projects outside the U.S., and for 2016 approximately 30% of our revenue was derived from projects outside the U.S. In addition, as certain contracts within our Capital Services and Engineering & Construction operating groups are dependent upon funding from the U.S. government, where funds are appropriated on a year-by-year basis, while contract performance may take more than one year, approximately $1.0 billion of our backlog at December 31, 2016 was for contractual commitments that are subject to future funding decisions. Due to the timing of awards and the long-term nature of some of our projects, approximately 50% to 55% of our December 31, 2016 backlog (including backlog associated with our equity method joint ventures) is anticipated to be recognized beyond 2017. For further discussion of our backlog, see the applicable risk factor in Item 1A “Risk Factors” and the “Overview” section of Item 7.
Types of Contracts
Our contracts are awarded on a competitively bid and negotiated basis using a range of contracting options, including cost-reimbursable, fixed-price and hybrid, which has both cost-reimbursable and fixed-price characteristics. Each contract is designed to optimize the balance between risk and reward.
Raw Materials and Suppliers
The principal raw materials we use are metal plate, structural steel, pipe, fittings, catalysts, proprietary equipment and selected engineered equipment such as pressure vessels, exchangers, pumps, valves, compressors, motors and electrical and instrumentation components. Most of these materials are available from numerous suppliers worldwide, with some furnished under negotiated supply agreements. We anticipate being able to obtain these materials for the foreseeable future; however, the price, availability and schedule validities offered by our suppliers may vary significantly from year to year due to various factors, including supplier consolidations, supplier raw material shortages, costs, and surcharges, supplier capacity, customer demand, market conditions, and any duties and tariffs imposed on the materials.
We use subcontractors where it assists us in meeting customer requirements with regard to resources, schedule, cost or technical expertise. These subcontractors may range from small local entities to companies with global capabilities, some of which may be utilized on a repetitive or preferred basis. To the extent necessary, we anticipate being able to locate and contract with qualified subcontractors in all global areas where we do business.
Environmental Matters
Our operations are subject to extensive and changing U.S. federal, state and local laws and regulations, as well as the laws of other countries, that establish health and environmental quality standards. These standards, among others, relate to air and water pollutants and the management and disposal of hazardous substances and wastes. We are exposed to potential liability for personal injury or property damage caused by any release, spill, exposure or other accident involving such pollutants, substances or wastes.
In connection with the historical operation of our facilities, including those associated with acquired operations, substances which currently are or might be considered hazardous were used or disposed of at some sites that will or may require us to make expenditures for remediation. In addition, we have agreed to indemnify parties from whom we have purchased or to whom we have sold facilities for certain environmental liabilities arising from acts occurring before the dates those facilities were transferred.
We believe we are in compliance, in all material respects, with environmental laws and regulations and maintain insurance coverage to mitigate our exposure to environmental liabilities. We do not believe any environmental matters will have a material adverse effect on our future results of operations, financial position or cash flow. We do not anticipate we will incur material capital expenditures for environmental controls or for the investigation or remediation of environmental conditions during 2017 or 2018.
Patents
We have numerous active patents and patent applications throughout the world, the majority of which are associated with technologies licensed by our Technology operating group. However, no individual patent is so essential that its loss would materially affect our business.
Employees
At December 31, 2016, we employed approximately 42,100 persons worldwide, comprised of approximately 16,100 salaried employees and approximately 26,000 hourly and craft employees. Our number of employees, particularly hourly and craft, varies in relation to the location, number and size of projects we have in process at any given time. To preserve our
7
project management and technological expertise as core competencies, we continuously recruit and develop qualified personnel, and maintain ongoing training programs for all our key personnel.
The percentage of our employees represented by unions at December 31, 2016 was approximately 15% to 20%. We have agreements, which generally extend up to 6 years, with various unions representing groups of employees at project sites and fabrication facilities in the U.S., Canada, Australia and various other countries. We enjoy good relations with our unions and have not experienced a significant work stoppage in any of our facilities in more than ten years.
Available Information
We make available our Annual Reports on Form 10-K, Quarterly Reports on Form 10-Q, Current Reports on Form 8-K, and amendments to those reports, filed or furnished pursuant to Section 13(a) or 15(d) of the Securities Exchange Act of 1934 (the “Exchange Act”), free of charge through our Internet website at www.cbi.com as soon as reasonably practicable after we electronically file such material with, or furnish it to, the U.S. Securities and Exchange Commission (the “SEC”).
The public may read and copy any materials we file with or furnish to the SEC at the SEC’s Public Reference Room at 100 F Street N.E., Washington, D.C. 20549. The public may obtain information on the operation of the Public Reference Room by calling the SEC at 1-800-SEC-0330. The SEC also maintains a website that contains our electronic filings at www.sec.gov.
Item 1A. Risk Factors
Any of the following risks (which are not the only risks we face) could have material adverse effects on our results of operations, financial position and cash flow:
Our Business is Dependent upon Major Construction and Service Contracts, the Unpredictable Timing of Which May Result in Significant Fluctuations in Our Cash Flow due to the Timing of Receipt of Payment Under the Contracts.
Our cash flow is dependent upon obtaining major construction and service contracts primarily for work in the energy, petrochemical, natural resource and government services markets throughout the world, especially in cyclical industries such as refining, natural gas and petrochemical. The timing of or failure to obtain contracts, delays in awards of contracts, cancellations of contracts, delays in completion of contracts, or failure to obtain timely payment from our customers, could result in significant periodic fluctuations in our cash flow. In addition, many of our contracts require us to satisfy specific progress or performance milestones in order to receive payment from the customer. As a result, we may incur significant costs for engineering, materials, components, equipment, labor or subcontractors prior to receipt of payment from a customer. Such expenditures could reduce our cash flow and necessitate borrowings under our credit facilities.
The Nature of Our Primary Contracting Terms for Our Contracts, Including Cost-Reimbursable and Fixed-Price or a Combination Thereof, Could Adversely Affect Our Operating Results.
We offer our customers a range of contracting options for our contracts, including cost-reimbursable, fixed-price and hybrid, which has both cost-reimbursable and fixed-price characteristics. Under cost-reimbursable contracts, we generally perform our services in exchange for a price that consists of reimbursement of all customer-approved costs and a profit component, which is typically a fixed rate per hour, an overall fixed fee, or a percentage of total reimbursable costs. If we are unable to obtain proper reimbursement for all costs incurred due to improper estimates, performance issues, customer disputes, or any of the additional factors noted below for fixed-price contracts, the project may be less profitable than we expect. Under fixed-price contracts, we perform our services and execute our projects at an established price and, as a result, benefit from cost savings, but may be unable to recover any cost overruns. If we do not execute a contract within our cost estimates, we may incur losses or the project may be less profitable than we expected. The revenue, cost and profit realized on such contracts can vary, sometimes substantially, from the original projections due to a variety of factors, including, but not limited to:
• | costs incurred in connection with modifications to a contract that may be unapproved by the customer as to scope, schedule, and/or price (“unapproved change orders”); |
• | unanticipated costs or claims, including costs for project modifications, delays, errors or changes in specifications or designs, regulatory changes or contract termination; |
• | unanticipated technical problems with the structures, equipment or systems we supply; |
• | failure to properly estimate costs of engineering, materials, components, equipment, labor or subcontractors; |
• | changes in the costs of engineering, materials, components, equipment, labor or subcontractors; |
• | changes in labor conditions, including the availability, wage and productivity of labor; |
• | productivity and other delays caused by weather conditions; |
• | failure of our suppliers or subcontractors to perform; |
8
• | difficulties in obtaining required governmental permits or approvals; |
• | changes in laws and regulations; and |
• | changes in general economic conditions. |
Our hybrid contracts can have a combination of the risk factors described above for our fixed-price and cost-reimbursable contracts.
These risks are exacerbated for projects with long durations because there is an increased risk that the circumstances upon which we based our original estimates will change in a manner that increases costs. In addition, we sometimes bear the risk of delays caused by unexpected conditions or events. To the extent there are future cost increases that we cannot recover from our customers, joint venture partners, suppliers or subcontractors, the outcome could have an adverse effect on our results of operations, financial position and cash flow.
Furthermore, revenue and profit from our contracts can be affected by contract incentives or penalties that may not be known or finalized until the later stages of the contract term. Some of these contracts provide for the customer’s review of our accounting and cost control systems to verify the completeness and accuracy of the reimbursable costs invoiced. These reviews could result in reductions in reimbursable costs previously billed to the customer.
The cumulative impact of revisions in total cost estimates during the progress of work is reflected in the period in which these changes become known, including to the extent required, the reversal of profit recognized in prior periods and the recognition of losses expected to be incurred on contracts in progress. Due to the various estimates inherent in our contract accounting, actual results could differ from those estimates.
Our Billed and Unbilled Revenue May Be Exposed to Potential Risk if a Project is Terminated or Canceled, if Our Customers Encounter Financial Difficulties, or if We Encounter Disputes with Our Customers.
Our contracts often require us to satisfy or achieve certain milestones in order to receive payment for the work performed, or in the case of cost-reimbursable contracts, provide support for billings in advance of receiving payment. As a result, we may incur significant costs or perform significant amounts of work prior to receipt of payment. If our customer does not proceed with the completion of the project or defaults on its payment obligations, or if we encounter disputes with our customers with respect to the adequacy of billing support, we may face difficulties in collecting payment of amounts due to us for the costs previously incurred. In addition, many of our customers for large EPC projects are project-specific entities that do not have significant assets other than their interests in the EPC project. It may be difficult to collect amounts owed to us by these customers. If we are unable to collect amounts owed to us, this could have an adverse effect on our results of operations, financial position and cash flow.
We May Not Be Able to Fully Realize the Revenue Value Reported in Our Backlog.
New awards represent the expected revenue value of new contract commitments received during a given period, as well as scope growth on existing commitments. Commitments may be in the form of written contracts, purchase orders or indications of the amounts of time and materials we need to make available for customers’ anticipated projects. New awards may also include estimated amounts of work to be performed based on customer communication and historic experience and knowledge of our customers’ intentions. Backlog represents the unearned value of our new awards. New awards and backlog include the entire award values for joint ventures we consolidate and our proportionate share of award values for joint ventures we proportionately consolidate. New awards and backlog also include our pro-rata share of the award values for unconsolidated joint ventures we account for under the equity method. As the net results for our equity method joint ventures are recognized as equity earnings, their revenue is not presented in our Consolidated Statement of Operations. At December 31, 2016, we had backlog of approximately $18.5 billion (including approximately $1.7 billion related to our equity method joint ventures). Because the revenue value reported in backlog (including our equity method joint ventures) is the remaining value associated with work that has not yet been completed, the projected value may not be realized or, if realized, may not be profitable as a result of poor contract performance.
Due to project terminations, suspensions or changes in project scope and schedule, we cannot predict with certainty when or if our backlog will be performed. From time to time, projects are canceled that appeared to have a high certainty of going forward at the time they were recorded as new awards. In the event of a project cancellation, we typically have no contractual right to the total revenue reflected in our backlog. Some of the contracts in our backlog provide for cancellation fees or certain reimbursements in the event customers cancel projects. These cancellation fees usually provide for reimbursement of our out-of-pocket costs, costs associated with work performed prior to cancellation, and to varying degrees, a percentage of the profit we would have realized had the contract been completed. Although we may be reimbursed for certain costs, we may be unable to recover all direct costs incurred and may incur additional unrecoverable costs due to the resulting under-utilization of our assets.
9
Our Failure to Meet Contractual Schedule or Performance Requirements Could Adversely Affect Our Revenue and Profitability.
In certain circumstances, we guarantee project completion by a scheduled date or certain performance levels. Failure to meet these schedule or performance requirements could result in a reduction of revenue and additional costs, and these adjustments could exceed projected profit. Project revenue or profit could also be reduced by liquidated damages withheld by customers under contractual penalty provisions, which can be substantial and can accrue on a daily basis. Schedule delays can result in costs exceeding our projections for a particular project. Performance problems for existing and future contracts could cause actual results of operations to differ materially from those previously anticipated and could cause us to suffer damage to our reputation within our industry and our customer base.
Our Government Contracts May Be Subject to Modification or Termination, Which Could Adversely Affect Our Revenue and Profitability.
We are a provider of services to U.S. government agencies and are therefore exposed to risks associated with government contracting. Government agencies typically can terminate or modify contracts at their convenience due to budget constraints or various other reasons. As a result, our backlog may be reduced or we may incur a loss if a government agency terminates or modifies a contract with us. We are also subject to audits, including audits of our internal control systems, cost reviews and investigations by government contracting oversight agencies. As a result of an audit, the oversight agency may disallow certain costs or withhold a percentage of interim payments. Cost disallowances may result in adjustments to previously reported revenue and may require us to refund a portion of previously collected amounts. In addition, failure to comply with the terms of one or more of our government contracts or government regulations and statutes could result in us being suspended or debarred from future government projects for a significant period of time, possible civil or criminal fines and penalties, the risk of public scrutiny of our performance, and potential harm to our reputation, each of which could have an adverse effect on our business. Other remedies that government agencies may seek for improper activities or performance issues include sanctions such as forfeiture of profit and suspension of payments.
In addition to the risks noted above, legislatures typically appropriate funds on a year-by-year basis, while contract performance may take more than one year. As a result, contracts with government agencies may be only partially funded or may be terminated, and we may not realize all of the potential revenue and profit from those contracts. Appropriations and the timing of payment may be influenced by, among other things, the state of the economy, competing political priorities, curtailments in the use of government contracting firms, budget constraints, the timing and amount of tax receipts and the overall level of government expenditures.
We Are Exposed to Potential Risks and Uncertainties Associated With Our Use of Partnering Arrangements and Our Subcontracting and Vendor Partner Arrangements to Execute Certain Projects.
In the ordinary course of business, we execute specific projects and conduct certain operations through joint venture, consortium and other collaborative arrangements (collectively referred to as “venture(s)”). We have various ownership interests in these ventures, with such ownership typically proportionate to our decision making and distribution rights. The ventures generally contract directly with the third party customer; however, services may be performed directly by the ventures, or may be performed by us, our partners, or a combination thereof.
The use of these ventures exposes us to a number of risks, including the risk that our partners may be unable or unwilling to provide their share of capital investment to fund the operations of the venture or complete their obligations to us, the venture, or ultimately, our customer. Differences in opinions or views among venture partners could also result in delayed decision-making or failure to agree on material issues, which could adversely affect the business and operations of the venture. In addition, agreement terms may subject us to joint and several liability for our venture partners, and the failure of our venture partners to perform their obligations could impose additional performance and financial obligations on us. The aforementioned factors could result in unanticipated costs to complete the projects, liquidated damages or contract disputes, including claims against our partners, any of which could have an adverse effect on our results of operations, financial position and cash flow.
Additionally, we rely on third party partners, equipment manufacturers and subcontractors to assist in the completion of our projects. To the extent these parties cannot execute their portion of the work and are unable to deliver their services, equipment or materials according to the contractual terms, or to the extent we cannot engage subcontractors or acquire equipment or materials, our ability to complete a project in a timely manner may be impacted. If the amount we are required to pay for these goods and services exceeds the amount we have included in the estimates for our work, we could experience project losses or a reduction in estimated profit.
In both the private and public sectors, either acting as a prime contractor, a subcontractor or as a member of a venture, we may join with other firms to form a team to compete for a single contract. Because a team can often offer stronger combined qualifications than any stand-alone company, these teaming arrangements can be very important to the success of a particular contract bid process or proposal. This can be particularly true for larger projects and in geographies in which bidding success
10
can be substantially impacted by the presence and quality of a local partner. The failure to maintain such relationships in both foreign and domestic markets may impact our ability to win additional work.
Intense Competition in the Markets We Serve Could Reduce Our Market Share and Earnings.
The energy, petrochemical, natural resource, power and government services markets we serve are highly competitive markets in which a large number of regional, national and multinational companies (including, in some cases, certain of our customers) compete, and these markets require substantial resources and capital investment in equipment, technology and skilled personnel. Competition also places downward pressure on our contract prices and margins. Intense competition is expected to continue in these markets, presenting us with significant challenges in our ability to maintain strong growth rates and acceptable margins. If we are unable to meet these competitive challenges, we could lose market share to our competitors and experience an overall reduction in our results of operations, financial position and cash flow.
Our Revenue and Profitability May Be Adversely Affected by a Reduced Level of Activity in the Hydrocarbon Industry.
In recent years, demand from the worldwide hydrocarbon industry has been the largest generator of our revenue. Numerous factors influence capital expenditure decisions in the hydrocarbon industry, including, but not limited to, the following:
• | current and projected oil and gas prices; |
• | exploration, extraction, production and transportation costs; |
• | the discovery rate, size and location of new oil and gas reserves; |
• | the sale and expiration dates of leases and concessions; |
• | local and international political and economic conditions, including sanctions, war or conflict; |
• | technological challenges and advances; |
• | the ability of oil and gas companies to generate capital; |
• | demand for hydrocarbon production; and |
• | changing taxes, price controls, and laws and regulations. |
The aforementioned factors are beyond our control and could have an adverse effect on our results of operations, financial position and cash flow.
If the U.S. Were to Revoke or Limit the DOE’s Loan Guarantee Program (“LGP”), it Could Have a Material Adverse Effect on Our Results of Operations, Financial Position and Cash Flow.
Some of our customers may rely on the DOE’s LGP, under which the DOE issues loan guarantees to eligible projects that “avoid, reduce, or sequester air pollutants or anthropogenic emissions of greenhouse gases” and “employ new or significantly improved technologies as compared to technologies in service in the U.S. at the time the guarantee is issued.” If the U.S. government were to revoke or limit the DOE’s LGP, it could make obtaining funding more difficult for many of our customers, which could inhibit their ability to take on new projects and have an adverse effect our results of operations, financial position and cash flow.
We May be Exposed to Additional Risks as We Obtain New Significant Awards and Execute Our Backlog, Including Greater Backlog Concentration in Fewer Projects, Potential Cost Overruns and Increasing Requirements for Letters of Credit, Each of Which Could Have a Material Adverse Effect on Our Future Results of Operations, Financial Position and Cash Flow.
As we obtain new significant project awards and convert the backlog into revenue, these projects may use larger sums of working capital than other projects and will be concentrated among a smaller number of customers. If any significant projects currently included in our backlog or awarded in the future were to have material cost overruns, or are significantly delayed, modified or canceled, and we are unable to replace the projects in backlog, our results of operations, financial position and cash flow could be adversely impacted.
Additionally, as we convert our significant projects from backlog into active construction, we may face significantly greater requirements for the provision of letters of credit or other forms of credit enhancements. We can provide no assurance that we will be able to access such capital and credit as needed or that we would be able to do so on economically attractive terms.
11
Our Customers’ and Our Partners’ Ability to Receive the Applicable Regulatory and Environmental Approvals for Our Power Projects and the Timeliness of Those Approvals Could Adversely Affect Us.
The regulatory permitting process for our power projects requires significant investments of time and money by our customers and sometimes by us and our partners. There are no assurances that we or our customers will obtain the necessary permits for these projects. Applications for permits to operate these power projects, including air emissions permits, may be opposed by government entities, individuals or environmental groups, resulting in delays and possible non-issuance of the permits.
Volatility in the Equity and Credit Markets Could Adversely Impact Us Due to Factors Affecting the Availability of Funding for Our Customers, Availability of Our Lending Facilities and Non-Compliance with Our Financial and Restrictive Lending Covenants.
Some of our customers, suppliers and subcontractors have traditionally accessed commercial financing and capital markets, as well as government backed export credit agency support to fund their operations or projects, and the availability of funding from those sources could be adversely impacted by a volatile equity or credit markets. The availability of lending facilities and our ability to remain in compliance with our financial and restrictive lending covenants could also be impacted by circumstances or conditions beyond our control, including but not limited to, the delay or cancellation of projects, decreased profitability on our projects, changes in currency exchange or interest rates, performance of pension plan assets, or changes in actuarial assumptions. Further, we could be impacted if our customers experience a material change in their ability to pay us, or if the banks associated with our lending facilities were to cease or reduce operations, or if there is a full or partial break-up of the European Union (the “EU”) or its currency, the Euro.
Demand for Our Products and Services is Cyclical and Vulnerable to Economic Downturns and Reductions in Private Industry and Government Spending.
The hydrocarbon refining, petrochemical, and natural gas industries we serve historically have been, and will likely continue to be, cyclical in nature and vulnerable to general downturns in the domestic and international economies. Many of our customers may face budget shortfalls or may delay capital spending resulting in a decrease in the overall demand for our services. A decrease in federal, state and local tax revenue as well as other economic declines may result in lower government spending. Further, our customers may demand better pricing terms and their ability to pay timely may be affected by an ongoing weak economy. Portions of our business traditionally lag recovery in the economy; therefore, our business may not recover immediately upon any economic improvement. The aforementioned could have an adverse effect on our results of operations, financial position and cash flow.
Our New Awards and Liquidity May Be Adversely Affected by Bonding and Letter of Credit Capacity.
A portion of our new awards requires the support of bid and performance surety bonds or letters of credit, as well as advance payment and retention bonds. Our primary use of surety bonds is to support water and wastewater treatment and standard tank projects in the U.S., while letters of credit are generally used to support other projects. A restriction, reduction, or termination of our surety bond agreements could limit our ability to bid on new project opportunities, thereby limiting our new awards, or increasing our letter of credit utilization in lieu of bonds, thereby reducing availability under our credit facilities. A restriction, reduction or termination of our letter of credit facilities could also limit our ability to bid on new project opportunities or could significantly change the timing of project cash flow, resulting in increased borrowing needs.
We are Vulnerable to Significant Fluctuations in Our Liquidity That May Vary Substantially Over Time.
Our operations could require us to utilize large sums of working capital, sometimes on short notice and sometimes without assurance of recovery of the expenditures. Circumstances or events that could create large cash outflows include increased costs or losses resulting from fixed-price or hybrid contracts, inability to achieve contractual billing or payment milestones, inability to recover unapproved change orders or claims, environmental liabilities, litigation risks, unexpected costs or losses resulting from previous acquisitions, contract initiation or completion delays, political conditions, customer payment problems, foreign exchange risks and professional and product liability claims.
Non-Compliance With Covenants in Our Financing Arrangements, Without Waiver or Amendment From the Lenders or Note Holders, Could Require Cash Collateral For Outstanding Letters of Credit, Could Adversely Affect Our Ability to Borrow Funds and Could Ultimately Require Us to Repay the Debt Earlier Than Expected.
At December 31, 2016, we had total debt of $2.2 billion, including $800.0 million of term loan borrowings, $1.0 billion in senior notes, and $407.5 million of revolving facility borrowings. Our financing arrangements contain certain financial covenants, including a maximum leverage ratio, a minimum fixed charge coverage ratio and a minimum net worth level, and other covenants with which we must comply. We may not be able to satisfy these ratios or comply with the other covenants if our results of operations, financial position and cash flow deteriorate as a result of, but not limited to, an adverse impact from
12
our other risk factors. These covenants may restrict our ability to obtain additional financing without incurring substantial financing costs, or at all.
We May be Required to Contribute Cash to Meet Our Underfunded Pension Obligations in Certain Multi-Employer Pension Plans.
We participate in various multi-employer pension plans in the U.S. and Canada under union and industry agreements that generally provide defined benefits to employees covered by collective bargaining agreements. Absent an applicable exemption, a contributor to a multi-employer plan is liable, upon termination or withdrawal from a plan, for its proportionate share of the plan’s underfunded vested liability. Funding requirements for benefit obligations of our pension plans are subject to certain regulatory requirements and we may be required to make cash contributions which may be material to one or more of these plans to satisfy certain underfunded benefit obligations.
Our Projects Expose Us to Potential Professional Liability, Product Liability, Warranty or Other Claims.
We engineer, procure, construct and provide services (including pipe, steel, and large structures fabrication) for large industrial facilities in which system failure can be disastrous. We may also be subject to claims resulting from the subsequent operations of facilities we have installed. Under some of our contracts, we must use customer-specified metals or processes for producing or fabricating pipe for our customers. The failure of any of these metals or processes could result in warranty claims against us for significant replacement or rework costs, which could have an adverse effect on our results of operations, financial position and cash flow.
In addition, our operations are subject to the usual hazards inherent in providing engineering and construction services, such as the risk of accidents, fires and explosions. These hazards can cause personal injury and loss of life, business interruptions, property damage, and pollution and environmental damage. We may be subject to claims as a result of these hazards.
Although we generally do not accept liability for consequential damages in our contracts, should we be determined liable, we may not be covered by insurance or, if covered, the dollar amount of these liabilities may exceed our policy limits. Any catastrophic occurrence in excess of insurance limits at project sites where our structures are installed or on projects for which services are performed could result in significant professional liability, product liability, warranty or other claims against us. Any damages not covered by our insurance, in excess of our insurance limits or, if covered by insurance subject to a high deductible, could result in a significant loss for us, which may reduce our profits and cash available for operations. These claims could also make it difficult for us to obtain adequate insurance coverage in the future at a reasonable cost.
Additionally, customers or subcontractors that have agreed to indemnify us against such losses may refuse or be unable to pay us. A partially or completely uninsured claim, if successful and of significant magnitude, could result in an adverse effect on our results of operations, financial position and cash flow.
We Could Be Adversely Affected by Violations of the FCPA, Similar Worldwide Anti-Bribery Laws, and Various International Trade and Export Laws.
The international nature of our business creates various domestic and local regulatory challenges. The FCPA and similar anti-bribery laws in other jurisdictions generally prohibit companies and their intermediaries from offering anything of value to government officials for the purpose of obtaining or retaining business, directing business to a particular person or legal entity or obtaining an unfair advantage. Our policies mandate compliance with these anti-bribery laws. We operate in many parts of the world that have experienced governmental corruption to some degree and, in certain circumstances, strict compliance with anti-bribery laws may conflict with local customs and practices. We train our employees concerning anti-bribery laws and issues, and we also inform our partners, subcontractors, and third parties who work for us or on our behalf that they must comply with anti-bribery law requirements. We also have procedures and controls in place to monitor internal and external compliance. Allegations of violations of anti-bribery laws, including the FCPA, may also result in internal, independent or governmental investigations. Additionally, our global operations include the import and export of goods and technologies across international borders, which requires a robust compliance program. We cannot assure that our internal controls and procedures will always protect us from the reckless or criminal acts committed by our employees, partners or third parties working for us or on our behalf. If we are found to be liable for anti-bribery law violations or other regulatory violations (either due to our own acts or our inadvertence, or due to the acts or inadvertence of others), we could suffer from criminal or civil penalties or other sanctions, which could have an adverse effect on our results of operations, financial position and cash flow.
We May Experience Increased Costs and Decreased Cash Flow Due to Compliance with Environmental Laws and Regulations, Liability for Contamination of the Environment or Related Personal Injuries.
General—We are subject to environmental laws and regulations, including those concerning emissions into the air; nuclear material; discharge into waterways; generation, storage, handling, treatment and disposal of waste materials; and health and safety.
13
Our business often involves working around and with volatile, toxic and hazardous substances and other highly-regulated pollutants, substances or wastes, for which the improper characterization, handling or disposal could constitute violations of U.S. federal, state or local laws and regulations and laws of other countries, and result in criminal and civil liabilities. Environmental laws and regulations generally impose limitations and standards for certain pollutants or waste materials and require us to obtain permits and comply with various other requirements. Governmental authorities may seek to impose fines and penalties on us, or revoke or deny issuance or renewal of operating permits for failure to comply with applicable laws and regulations. We are also exposed to potential liability for personal injury or property damage caused by any release, spill, exposure or other accident involving such pollutants, substances or wastes. Furthermore, we provide certain environmental remediation services.
We may incur liabilities that may not be covered by insurance policies, or, if covered, the financial amount of such liabilities may exceed our policy limits or fall within applicable deductible or retention limits. A partially or completely uninsured claim, if successful and of significant magnitude, could cause us to suffer a significant loss and reduce cash available for our operations.
The environmental, health and safety laws and regulations to which we are subject are constantly changing, and it is impossible to predict the impact of such laws and regulations on us in the future. We cannot ensure that our operations will continue to comply with future laws and regulations or that these laws and regulations will not cause us to incur significant costs or adopt more costly methods of operation. Additionally, the adoption and implementation of any new regulations imposing reporting obligations on, or limiting emissions of greenhouse gases from, our customers’ equipment and operations could significantly impact demand for our services, particularly among our customers for coal and gas-fired generation facilities as well as our customers in the petrochemicals business. Any significant reduction in demand for our services as a result of the adoption of these or similar proposals could have an adverse effect on our results of operations, financial position and cash flow.
In connection with the historical operation of our facilities, including those associated with acquired operations, substances which currently are or might be considered hazardous were used or disposed of at some sites that will or may require us to make expenditures for remediation. In addition, we have agreed to indemnify parties from whom we have purchased or to whom we have sold facilities for certain environmental liabilities arising from acts occurring before the dates those facilities were transferred.
Nuclear Maintenance—We are subject to regulations from a number of entities, including the applicable U.S. regulatory bodies, such as the U.S. Nuclear Regulatory Commission, and non-U.S. regulatory bodies, such as the International Atomic Energy Agency (the “IAEA”) and the EU. Regulations include, among other things: systems for nuclear material safeguards implemented by the IAEA and the EU; global-scale agreements on nuclear safety such as the Convention on Nuclear Safety and the Joint Convention on the Safety of Spent Fuel Management and on the Safety of Radioactive Waste Management; the Euratom Treaty, which has created uniform safety standards aimed at protecting the public and workers and passed rules governing the transportation of radioactive waste; and additional general regulations for licensed nuclear facilities, including strict inspection procedures and regulations governing the maintenance, shutdown and dismantling of nuclear facilities and the disposal of nuclear wastes. Failure to maintain sufficient compliance programs for these regulations, or other problems encountered during maintenance work, could significantly increase our costs and have an adverse effect on our results of operations, financial position and cash flow.
We Are and Will Continue to Be Involved in Litigation Including Litigation Related to Hazardous Substances that Could Negatively Impact Our Earnings and Liquidity.
We have been and may from time to time be named as a defendant in legal actions claiming damages in connection with engineering and construction projects, technology licenses, other services we provide, and other matters. These are typically claims that arise in the normal course of business, including employment-related claims and contractual disputes or claims for personal injury or property damage which occur in connection with services performed relating to project or construction sites. Contractual disputes normally involve claims relating to the timely completion of projects, performance of equipment or technologies, design or other engineering services or project construction services provided by us. While we do not believe that any of our pending contractual, employment-related, personal injury or property damage claims and disputes could have an adverse effect on our results of operations, financial position and cash flow, there can be no assurance that this will be the case.
In addition, we are from time to time involved in various litigation and other matters related to hazardous substances encountered in our business. In particular, the numerous operating hazards inherent in our business increase the risk of toxic tort litigation relating to any and all consequences arising out of human exposure to hazardous substances, including without limitation, current or past claims involving asbestos-related materials, formaldehyde, Cesium 137 (radiation), mercury and other hazardous substances, or related environmental damage. As a result, we are subject to potentially material liabilities related to personal injuries or property damages that may be caused by hazardous substance releases and exposures. The outcome of such litigation is inherently uncertain and adverse developments or outcomes can result in significant monetary
14
damages, penalties, other sanctions or injunctive relief against us, limitations on our property rights, or regulatory interpretations that increase our operating costs. If any of these disputes result in a substantial monetary judgment against us or an adverse legal interpretation is settled on unfavorable terms, or otherwise affects our operations, it could have an adverse effect on our results of operations, financial position and cash flow.
Uncertainty in Enforcing U.S. Judgments Against Netherlands Corporations, Directors and Others Could Create Difficulties for Our Shareholders in Enforcing Any Judgments Obtained Against Us.
We are a Netherlands company and a significant portion of our assets are located outside of the U.S. In addition, certain members of our management and supervisory boards may be residents of countries other than the U.S. As a result, effecting service of process on such persons may be difficult, and judgments of U.S. courts, including judgments against us or members of our management or supervisory boards predicated on the civil liability provisions of the federal or state securities laws of the U.S., may be difficult to enforce.
Certain Provisions of Our Articles of Association and Netherlands Law May Have Possible Anti-Takeover Effects.
Our Articles of Association and the applicable law of The Netherlands contain provisions that may be deemed to have anti-takeover effects. Among other things, these provisions provide for a staggered board of Supervisory Directors, a binding nomination process and supermajority shareholder voting requirements for certain significant transactions. Such provisions may delay, defer or prevent takeover attempts that shareholders might consider in their best interests. In addition, certain U.S. tax laws, including those relating to possible classification as a “controlled foreign corporation” (described below), may discourage third parties from accumulating significant blocks of our common shares.
We Have a Risk of Being Classified as a Controlled Foreign Corporation and Certain Shareholders Who Do Not Beneficially Own Shares May Lose the Benefit of Withholding Tax Reduction or Exemption Under Dutch Legislation.
As a company incorporated in The Netherlands, we would be classified as a controlled foreign corporation for U.S. federal income tax purposes if any U.S. person acquires 10% or more of our common shares (including ownership through the attribution rules of Section 958 of the Internal Revenue Code of 1986, as amended (the “Code”), each such person, a “U.S. 10% Shareholder”) and the sum of the percentage ownership by all U.S. 10% Shareholders exceeds 50% (by voting power or value) of our common shares. We do not believe we are currently a controlled foreign corporation; however, we may be determined to be a controlled foreign corporation in the future. In the event that such a determination is made, all U.S. 10% Shareholders would be subject to taxation under Subpart F of the Code. The ultimate consequences of this determination are fact-specific to each U.S. 10% Shareholder, but could include possible taxation of such U.S. 10% Shareholder on a pro-rata portion of our income, even in the absence of any distribution of such income.
Under the double taxation convention in effect between The Netherlands and the U.S. (the “Treaty”), dividends we pay to certain U.S. corporate shareholders owning at least 10% of our voting power are generally eligible for a reduction of the 15% Netherlands withholding tax to 5%, unless the common shares held by such residents are attributable to a business or part of a business that is, in whole or in part, carried on through a permanent establishment or a permanent representative in The Netherlands. Dividends received by exempt pension organizations and exempt organizations, as defined in the Treaty, are completely exempt from the withholding tax. A holder of common shares other than an individual will not be eligible for the benefits of the Treaty if such holder of common shares does not satisfy one or more of the tests set forth in the limitation on benefits provisions of Article 26 of the Treaty. According to an anti-dividend stripping provision, no exemption from, reduction of, or refund of, Netherlands withholding tax will be granted if the ultimate recipient of a dividend paid by us is not considered to be the beneficial owner of such dividend. The ability of a holder of common shares to take a credit against its U.S. taxable income for Netherlands withholding tax may be limited.
Political and Economic Conditions, Including War, Conflict or Economic Turmoil in Non-U.S. Countries in Which We or Our Customers Operate, Could Adversely Affect Us.
A significant number of our projects are performed or located outside the U.S., including projects in developing countries with economic conditions and political and legal systems, and associated instability risks, that are significantly different from those found in the U.S. We expect non-U.S. sales and operations to continue to contribute materially to our earnings for the foreseeable future. Non-U.S. contracts and operations expose us to risks inherent in doing business outside the U.S., including but not limited to the following:
• | unstable economic conditions in some countries in which we make capital investments, operate or provide services, including Europe, which has experienced recent economic turmoil; |
• | increased costs, lower revenue and backlog and decreased liquidity resulting from a full or partial break-up of the EU or its currency, the Euro; |
• | the lack of well-developed legal systems in some countries in which we make capital investments, operate, or provide services, which could make it difficult for us to enforce our rights; |
15
• | expropriation of property; |
• | restrictions on the right to receive dividends from our ventures, convert currency or repatriate funds; and |
• | political upheaval and international hostilities, including risks of loss due to civil strife, acts of war, guerrilla activities, insurrections and acts of terrorism. |
We Are Exposed to Possible Losses from Foreign Currency Exchange Rates.
We are exposed to market risk associated with changes in foreign currency exchange rates. Our exposure to changes in foreign currency exchange rates arises primarily from receivables, payables, and firm and forecasted commitments associated with foreign transactions. We may incur losses from foreign currency exchange rate fluctuations if we are unable to convert foreign currency in a timely fashion. We seek to minimize the risks from these foreign currency exchange rate fluctuations primarily through a combination of contracting methodology (including escalation provisions for projects in inflationary economies) and, when deemed appropriate, the use of foreign currency exchange rate derivatives. In circumstances where we utilize derivatives, our results of operations might be negatively impacted if the underlying transactions occur at different times, or in different amounts, than originally anticipated, or if the counterparties to our contracts fail to perform. In addition, our entities with functional currencies other than our reporting currency of the U.S. Dollar are translated to the U.S. Dollar for reporting purposes. As a result, foreign currency exchange rate fluctuations could have a significant impact on our revenue and earnings. We do not hold, issue, or use financial instruments for trading or speculative purposes.
If We Are Unable to Attract, Retain and Motivate Key Personnel, Our Business Could Be Adversely Affected.
Our future success depends upon our ability to attract, retain and motivate highly-skilled personnel in various areas, including engineering, skilled laborers and craftsmen, project management, procurement, project controls, finance and senior management. If we do not succeed in retaining our current employees and attracting new high quality employees, our business could be adversely affected.
Work Stoppages, Union Negotiations and Other Labor Problems Could Adversely Affect Us.
A portion of our employees are represented by labor unions. A lengthy strike or other work stoppage at any of our facilities could have an adverse effect on us. There is inherent risk that on-going or future negotiations relating to collective bargaining agreements or union representation may not be favorable to us. From time to time, we also have experienced attempts to unionize our non-union shops. Such efforts can often disrupt or delay work and present risk of labor unrest.
Our Employees Work on Projects That are Inherently Dangerous and a Failure to Maintain a Safe Work Site Could Result in Significant Losses.
Safety is a primary focus of our business and is critical to all of our stakeholders, including our employees, customers and shareholders, and our reputation; however, we often work on large-scale and complex projects, frequently in geographically remote locations. Our project sites can place our employees and others near large equipment, dangerous processes or highly-regulated materials, and in challenging environments. If we fail to implement appropriate safety procedures or if our procedures fail, our employees or others may suffer injuries. Often, we are responsible for safety on the project sites where we work. Many of our customers require that we meet certain safety criteria to be eligible to bid on contracts, and some of our contract fees or profits are subject to satisfying safety criteria. Unsafe work conditions also have the potential of increasing employee turnover, increasing project costs and raising our operating costs. Although we maintain functional groups whose primary purpose is to implement effective health, safety and environmental procedures throughout our company, the failure to comply with such procedures, customer contracts or applicable regulations could subject us to losses and liability.
Any Previous or Prospective Acquisitions Could Be Difficult to Integrate, Disrupt Our Business, Dilute Shareholder Value and Harm Our Operating Results.
We have made acquisitions and may continue to pursue additional growth through the opportunistic and strategic acquisition of companies, assets or technologies that will enable us to broaden the types of services and technologies we provide and to expand into new markets. Our opportunity to grow through prospective acquisitions may be limited if we cannot identify suitable companies or assets or reach agreement on potential acquisitions on acceptable terms or for other reasons. Our previous or prospective acquisitions may be subject to a variety of risks, including, but not limited to, the following:
• | difficulties in the integration of operations and systems; |
• | the key personnel and customers of the acquired company may terminate their relationships with the acquired company; |
• | additional financial and accounting challenges and complexities in areas such as tax planning, treasury management, financial reporting and internal controls; |
16
• | assumption of risks and liabilities (including, for example, environmental-related costs), some of which we may not discover during our due diligence; |
• | disruption of or insufficient management attention to our ongoing business; |
• | inability to realize the cost savings or other financial or operational benefits we anticipated; and |
• | potential requirement for additional equity or debt financing, which may not be available, or if available, may not have favorable terms. |
Realization of one or more of these risks could have an adverse effect on our results of operations, financial position and cash flow. Moreover, to the extent an acquisition financed by non-equity consideration results in additional goodwill, it will reduce our tangible net worth, which might have an adverse effect on our credit and bonding capacity.
If We Fail to Meet Expectations of Securities Analysts or Investors due to Fluctuations in Our Revenue, Operating Results or Cash Flows, Our Stock Price Could Decline Significantly.
Our revenue, operating results and cash flows may fluctuate from quarter to quarter due to a number of factors, including the timing of or failure to obtain projects, delays in awards of projects, cancellations of projects, delays in the completion of projects, changes in estimated costs to complete projects, performance of significant amounts of work prior to receipt of payment, or the timing of approvals of change orders with, or recoveries of claims against, our customers. It is likely that in some future quarters our operating results or cash flows may fall below the expectations of securities analysts or investors. In this event, the trading price of our common stock could decline significantly.
Our Sale or Issuance of Additional Common Shares Could Dilute Each Shareholder’s Share Ownership.
Part of our business strategy is to expand into new markets and enhance our position in existing markets throughout the world through the strategic and opportunistic acquisition of complementary businesses. In order to successfully complete future acquisitions or fund our other activities, we may issue equity securities that could dilute our earnings per share and each shareholder’s share ownership.
We Cannot Provide Assurance That We Will Be Able to Continue Paying Dividends at the Current Rate.
We have declared and paid quarterly cash dividends on our common stock; however, there can be no assurance that future dividends or distributions will be declared or paid. The payment of dividends or distributions in the future will be subject to the discretion of our shareholders (in the case of annual dividends), our Management Board and our Supervisory Board. Our Management Board and Supervisory Board will periodically evaluate our ability to pay dividends in the future based upon relevant factors, which include:
• | potential lack of available cash to pay dividends due to general business and economic conditions, net results of acquisitions, changes in our cash requirements, capital spending plans, financing agreements, availability of surplus cash flow or financial position; |
• | legal and contractual restrictions on the amount of dividends that we may distribute to our shareholders, including but not limited to restrictions under the Dutch Civil Code; and |
• | potential inability to receive dividend payments from our subsidiaries at the same level that we have historically. The ability of our subsidiaries to make dividend payments to us is subject to factors similar to those listed above. |
Our Goodwill and Other Finite-Lived Intangible Assets Could Become Impaired and Result in Future Charges to Earnings.
Goodwill—Our goodwill balance represents the excess of the purchase price over the fair value of net assets acquired as part of previous acquisitions. Net assets acquired include identifiable finite-lived intangible assets that were recorded at fair value based upon expected future recovery of the underlying assets.
At December 31, 2016, our goodwill balance was $3.0 billion and was distributed among our four operating groups as follows: Engineering & Construction - $1.9 billion, Fabrication Services - $665.7 million, Technology - $297.9 million and Capital Services - $229.6 million. Goodwill is not amortized to earnings, but instead is reviewed for impairment at least annually at a reporting unit level, absent any indicators of impairment or when other actions require an impairment assessment (such as a change in reporting units). We perform our annual impairment assessment during the fourth quarter of each year based upon balances as of October 1. We identify a potential impairment by comparing the fair value of the applicable reporting unit to its net book value, including goodwill. If the net book value exceeds the fair value of the reporting unit, an indication of potential impairment exists, and we measure the impairment by comparing the carrying value of the reporting unit’s goodwill to its implied fair value. To determine the fair value of our reporting units and test for impairment, we utilize an income approach (discounted cash flow method) as we believe this is the most direct approach to incorporate the specific economic attributes and risk profiles of our reporting units into our valuation model. This is consistent with the methodology used to determine the fair value of our reporting units in previous years. We generally do not utilize a market approach given the lack of relevant
17
information generated by market transactions involving comparable businesses. However, to the extent market indicators of fair value become available, we consider such market indicators in our discounted cash flow analysis and determination of fair value. The discounted cash flow methodology is based, to a large extent, on assumptions about future events, which may or may not occur as anticipated, and such deviations could have a significant impact on the calculated estimated fair values of our reporting units. These assumptions include, but are not limited to, estimates of discount rates, future growth rates, and terminal values for each reporting unit.
During 2016 we performed various quantitative assessments of goodwill in connection with the third quarter integration and operational combination of the reporting units within our Fabrication Services operating group and in connection with our annual fourth quarter impairment assessment. As a result of our fourth quarter annual impairment assessment, we recorded a non-cash pre-tax charge of approximately $655.0 million related to the partial impairment of goodwill for our Capital Services operating group. No other impairment charges were necessary as a result of the changes in our reporting units or our annual assessment. If we were to experience a significant and prolonged deterioration of our market capitalization, it may indicate a decline in the fair value of our reporting units and result in the need to perform an interim quantitative impairment assessment. If, based on future assessments our goodwill is deemed to be impaired, the impairment would result in a charge to earnings in the period of impairment with a resulting decrease in our net worth.
See “Critical Accounting Estimates” section of Item 7 for discussion regarding the amount by which the estimated fair values of each of our reporting units exceeded their respective net book values, and additional discussion regarding the determination of the estimated fair values for certain reporting units.
Other Intangible Assets—At December 31, 2016, our finite-lived intangible assets were $367.8 million. We amortize our finite-lived intangible assets on a straight-line basis with lives ranging from 4 to 20 years, absent any indicators of impairment. We review finite-lived intangible assets for impairment when events or changes in circumstances indicate that the carrying amount may not be recoverable. If a recoverability assessment is required, the estimated future cash flow associated with the asset or asset group will be compared to the asset’s carrying amount to determine if an impairment exists. We noted no impairment during 2016; however, if our other intangible assets are determined to be impaired in the future, the impairment would result in a charge to earnings in the year of the impairment with a resulting decrease in our net worth.
We Rely on Our Information Systems to Conduct Our Business, and Failure to Protect These Systems Against Security Breaches Could Adversely Affect Our Business and Results of Operations. Additionally, if These Systems Fail or Become Unavailable for Any Significant Period of Time, Our Business Could be Harmed.
The efficient operation of our business is dependent on computer hardware and software systems. Information systems are vulnerable to security breaches, and we rely on industry-accepted security measures and technology to securely maintain confidential and proprietary information maintained on our information systems. However, these measures and technology may not adequately prevent security breaches. In addition, the unavailability of the information systems or the failure of these systems to perform as anticipated for any reason could disrupt our business and could result in decreased performance and increased costs, causing our business and results of operations to suffer. Any significant interruption or failure of our information systems or any significant breach of security could adversely affect our business and results of operations.
If We are Unable to Enforce Our Intellectual Property Rights or if Our Technology Becomes Obsolete, Our Competitive Position Could be Adversely Impacted.
We believe that we are an industry leader by owning or having access to our technologies. We protect our technology positions through patent registrations, license restrictions and a research and development program. We may not be able to successfully preserve our intellectual property rights in the future, as these rights could be invalidated, circumvented or challenged. In addition, the laws of some foreign countries in which our services may be sold do not protect intellectual property rights to the same extent as U.S. law. Because we license technologies from third parties, there is a risk that our relationships with licensors may terminate or expire or may be interrupted or harmed. If we are unable to protect and maintain our intellectual property rights, or if there are any successful intellectual property challenges or infringement proceedings against us, our ability to differentiate our service offerings could be reduced. Finally, there is nothing to prevent our competitors from independently attempting to develop or obtain access to technologies that are similar or superior to our technologies.
Item 1B. Unresolved Staff Comments
None.
18
Item 2. Properties
We own or lease properties in locations throughout the world to conduct our business. We believe these facilities are adequate to meet our current and near-term requirements. The following list summarizes our principal properties by the operating group for which they are primarily utilized: Engineering & Construction (“EC”), Fabrication Services (“FS”), Technology (“Tech”), Capital Services (“CS”), and Corporate (“Corp”):
Location | Type of Facility | Interest | Operating Group | |||
Brno, Czech Republic | Engineering office | Leased | EC | |||
Canton, Massachusetts | Operations office | Leased | EC, CS, Tech | |||
Charlotte, North Carolina | Operations and sales office | Leased | EC | |||
Gurgaon, India | Engineering and operations office | Leased | EC, FS, Tech | |||
Houston, Texas | Engineering and operations office | Leased | EC, Tech | |||
London, England | Engineering and sales office | Leased | EC | |||
Moscow, Russia | Administrative, operations and sales office | Leased | EC, Tech | |||
Perth, Australia | Administrative, engineering, operations and sales office | Leased | EC, FS | |||
The Hague, The Netherlands (1) | Administrative, engineering, operations and sales office | Leased | EC, FS, Tech, Corp | |||
Abu Dhabi, UAE | Operations office and fabrication facility | Owned/Leased | FS | |||
Al Aujam, Saudi Arabia | Fabrication facility and warehouse | Owned | FS | |||
Al-Khobar, Saudi Arabia | Administrative and engineering office | Leased | FS, EC | |||
Askar, Bahrain | Operations office and fabrication facility | Owned/Leased | FS | |||
Beaumont, Texas | Fabrication facility | Owned | FS | |||
Clearfield, Utah | Fabrication facility | Leased | FS | |||
Clive, Iowa | Fabrication facility | Owned | FS | |||
Dubai, UAE | Administrative, engineering and operations office and warehouse | Leased | FS, Tech | |||
El Dorado, Arkansas | Fabrication facility | Owned | FS | |||
Fort Saskatchewan, Canada | Operations office, fabrication facility and warehouse | Owned | FS | |||
Houston, Texas | Operations office, fabrication facility, warehouse and distribution facility | Owned/Leased | FS | |||
Lake Charles, Louisiana | Fabrication facility | Owned/Leased | FS | |||
Laurens, South Carolina | Fabrication facility | Owned | FS | |||
New Brunswick, New Jersey | Fabrication and distribution facility | Leased | FS | |||
Niagara-on-the-Lake, Canada | Engineering office | Leased | FS | |||
Plainfield, Illinois | Engineering and operations office | Leased | FS | |||
Sattahip, Thailand | Operations office and fabrication facility | Leased | FS | |||
Sherwood Park, Canada | Administrative and operations office | Leased | FS | |||
Shreveport, Louisiana | Fabrication and distribution facilities | Owned | FS | |||
Tyler, Texas | Engineering office | Owned | FS | |||
The Woodlands, Texas (1) | Administrative, operations and sales office | Owned | FS, EC, Tech, CS, Corp | |||
Walker, Louisiana | Operations office, fabrication facility and warehouse | Owned | FS | |||
Beijing, China | Sales and operations office | Leased | Tech | |||
Bloomfield, New Jersey | Administrative, engineering and operations office | Leased | Tech, FS | |||
Ludwigshafen, Germany | Research and development office | Leased | Tech | |||
Mannheim, Germany | Engineering and operations office | Leased | Tech | |||
Pasadena, Texas | Research and development office and manufacturing facility | Owned | Tech | |||
Alexandria, Virginia | Operations office | Leased | CS | |||
Baton Rouge, Louisiana | Administrative, engineering and operations offices | Leased | CS, EC, FS | |||
Findlay, Ohio | Operations office and warehouse | Leased | CS | |||
Greenwood Village, Colorado | Operations office | Leased | CS, Tech | |||
Knoxville, Tennessee | Operations office | Leased | CS | |||
Monroeville, Pennsylvania | Operations office | Leased | CS | |||
Trenton, New Jersey | Operations office | Leased | CS | |||
(1) | In addition to being utilized by the operating groups referenced above, our office in The Hague, The Netherlands serves as our corporate headquarters and our office in The Woodlands, Texas serves as our administrative headquarters. |
We also own or lease a number of smaller administrative and field construction offices, warehouses and equipment maintenance centers strategically located throughout the world.
19
Item 3. Legal Proceedings
General—We have been and may from time to time be named as a defendant in legal actions claiming damages in connection with engineering and construction projects, technology licenses, other services we provide, and other matters. These are typically claims that arise in the normal course of business, including employment-related claims and contractual disputes or claims for personal injury or property damage which occur in connection with services performed relating to project or construction sites. Contractual disputes normally involve claims relating to the timely completion of projects, performance of equipment or technologies, design or other engineering services or project construction services provided by us. We do not believe that any of our pending contractual, employment-related personal injury or property damage claims and disputes will have a material adverse effect on our results of operations, financial position or cash flow.
Project Arbitration Matter—The customer for one of our large cost-reimbursable projects has filed a request for arbitration with the International Chamber of Commerce, alleging cost overruns on the project. The customer has not provided evidence to substantiate its allegations and we believe all amounts incurred and billed on the project, including outstanding receivables of approximately $231.0 million as of December 31, 2016, are contractually due under the provisions of our contract and are recoverable. We do not believe a risk of material loss is probable related to this matter, and accordingly, no amounts have been accrued. While it is possible that a loss may be incurred, we are unable to estimate the range of potential loss, if any. Further, we have asserted counterclaims for our outstanding receivables.
Dispute Related to Sale of Nuclear Operations—As discussed further in Note 4 within Item 8, on December 31, 2015, we sold our Nuclear Operations to WEC. In connection with the transaction, a customary post-closing purchase price adjustment mechanism was negotiated between CB&I and WEC (the “Parties”) to account for any difference between target working capital and actual working capital as finally determined. On April 28, 2016, WEC delivered to us a purported closing statement estimating closing working capital to be negative $976.5 million, which was $2.2 billion less than target working capital. In contrast, we calculated closing working capital to be $1.6 billion, which is $427.8 million greater than target working capital. On July 21, 2016, we filed a complaint against WEC in the Court of Chancery in the State of Delaware (the “Court”) seeking a declaration that WEC has no remedy for the vast majority of its claims and requesting an injunction barring WEC from bringing such claims. On December 2, 2016, the Court granted WEC’s motion for judgment on the pleadings and dismissed our complaint, stating that the dispute should follow the dispute resolution process as set forth in the sales agreement. We have filed an appeal of the Court’s ruling to the Delaware Supreme Court which is now in the briefing stages. The Parties have selected an independent auditor for the dispute resolution process and we must simultaneously move forward with this process while the appeal is pursued. We do not believe a risk of material loss is probable related to this matter, and accordingly, no amounts have been accrued. While it is possible that a loss may be incurred, we are unable to estimate the range of potential loss, if any. We intend to vigorously pursue this litigation and our rights under the purchase agreement.
Asbestos Litigation—We are a defendant in lawsuits wherein plaintiffs allege exposure to asbestos due to work we may have performed at various locations. We have never been a manufacturer, distributor or supplier of asbestos products. Over the past several decades and through December 31, 2016, we have been named a defendant in lawsuits alleging exposure to asbestos involving approximately 6,000 plaintiffs and, of those claims, approximately 1,200 claims were pending and 4,800 have been closed through dismissals or settlements. Over the past several decades and through December 31, 2016, the claims alleging exposure to asbestos that have been resolved have been dismissed or settled for an average settlement amount of approximately two thousand dollars per claim. We review each case on its own merits and make accruals based upon the probability of loss and our estimates of the amount of liability and related expenses, if any. While we have seen an increase in the number of recent filings, especially in one specific venue, we do not believe the increase or any unresolved asserted claims will have a material adverse effect on our future results of operations, financial position or cash flow, and at December 31, 2016, we had approximately $9.2 million accrued for liability and related expenses. With respect to unasserted asbestos claims, we cannot identify a population of potential claimants with sufficient certainty to determine the probability of a loss and to make a reasonable estimate of liability, if any. While we continue to pursue recovery for recognized and unrecognized contingent losses through insurance, indemnification arrangements or other sources, we are unable to quantify the amount, if any, that we may expect to recover because of the variability in coverage amounts, limitations and deductibles, or the viability of carriers, with respect to our insurance policies for the years in question.
Environmental Matters—Our operations are subject to extensive and changing U.S. federal, state and local laws and regulations, as well as the laws of other countries, that establish health and environmental quality standards. These standards, among others, relate to air and water pollutants and the management and disposal of hazardous substances and wastes. We are exposed to potential liability for personal injury or property damage caused by any release, spill, exposure or other accident involving such pollutants, substances or wastes.
In connection with the historical operation of our facilities, including those associated with acquired operations, substances which currently are or might be considered hazardous were used or disposed of at some sites that will or may require us to make expenditures for remediation. In addition, we have agreed to indemnify parties from whom we have
20
purchased or to whom we have sold facilities for certain environmental liabilities arising from acts occurring before the dates those facilities were transferred.
We believe we are in compliance, in all material respects, with environmental laws and regulations and maintain insurance coverage to mitigate our exposure to environmental liabilities. We do not believe any environmental matters will have a material adverse effect on our future results of operations, financial position or cash flow. We do not anticipate we will incur material capital expenditures for environmental controls or for the investigation or remediation of environmental conditions during 2017 or 2018.
Item 4. Mine Safety Disclosures
None.
PART II
Item 5. Market for Registrant’s Common Equity, Related Stockholder Matters and Issuer Purchases of Equity Securities
Stock and Dividend Information—Our common stock is traded on the NYSE. At February 16, 2017, we had approximately 123 thousand shareholders, based upon individual participants in security position listings at that date. The following table presents our range of common stock prices on the NYSE and the cash dividends paid per share of common stock by quarter for 2016 and 2015:
Range of Common Stock Prices | Dividends | |||||||||||||||
High | Low | Close | Per Share | |||||||||||||
Year Ended December 31, 2016 | ||||||||||||||||
Fourth Quarter | $ | 36.56 | $ | 26.55 | $ | 31.75 | $ | 0.07 | ||||||||
Third Quarter | $ | 39.71 | $ | 26.12 | $ | 28.03 | $ | 0.07 | ||||||||
Second Quarter | $ | 41.33 | $ | 32.16 | $ | 34.63 | $ | 0.07 | ||||||||
First Quarter | $ | 39.82 | $ | 31.30 | $ | 36.59 | $ | 0.07 | ||||||||
Year Ended December 31, 2015 | ||||||||||||||||
Fourth Quarter | $ | 46.39 | $ | 36.75 | $ | 38.99 | $ | 0.07 | ||||||||
Third Quarter | $ | 53.73 | $ | 36.23 | $ | 39.66 | $ | 0.07 | ||||||||
Second Quarter | $ | 59.45 | $ | 44.00 | $ | 50.04 | $ | 0.07 | ||||||||
First Quarter | $ | 50.12 | $ | 32.16 | $ | 49.26 | $ | 0.07 | ||||||||
Cash dividends are dependent upon our results of operations, financial condition, cash requirements, availability of surplus and such other factors as our Supervisory Board may deem relevant. See Item 1A for risk factors associated with our cash dividends.
21
Stock Performance Graph—The following chart compares the cumulative total shareholder return on shares of our common stock for the five-year period ended December 31, 2016, with the cumulative total shareholder return of the S&P 500 Index and Dow Jones (“DJ”) U.S. Heavy Construction Index for the same period. The comparison assumes one hundred dollars invested on December 31, 2011 and the reinvestment of all dividends. The calculated shareholder return for our common stock is not indicative of future performance.
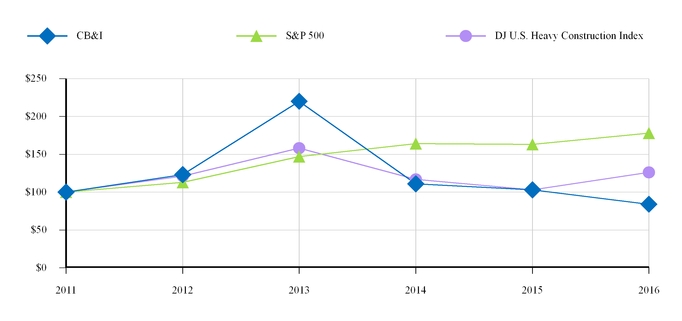
2011 | 2012 | 2013 | 2014 | 2015 | 2016 | |||||||||||||||||||
CB&I | $ | 100 | $ | 123 | $ | 220 | $ | 111 | $ | 103 | $ | 84 | ||||||||||||
S&P 500 | $ | 100 | $ | 113 | $ | 147 | $ | 164 | $ | 163 | $ | 178 | ||||||||||||
DJ U.S. Heavy Construction Index | $ | 100 | $ | 121 | $ | 158 | $ | 117 | $ | 103 | $ | 126 | ||||||||||||
Equity Compensation Plan Information—The following table summarizes information, at December 31, 2016, relating to our equity compensation plans pursuant to which options or other rights to acquire our common shares may be granted from time to time:
Plan Category | Number of Securities to be Issued Upon Exercise of Outstanding Options, Warrants and Rights | Weighted-Average Exercise Price of Outstanding Options, Warrants and Rights | Number of Securities Remaining Available for Future Issuance Under Equity Compensation Plans (excluding securities reflected in column (a)) | |||||||
(a) | (b) | (c) | ||||||||
Equity compensation plans approved by security holders | 662 | $ | 19.03 | 8,421 | ||||||
Equity compensation plans not approved by security holders (1) | 46 | $ | 45.13 | 315 | ||||||
Total | 708 | $ | 20.73 | 8,736 | ||||||
(1) | Associated with The Shaw 2008 Omnibus Incentive Plan that was approved by The Shaw Group Inc. (“Shaw”) shareholders and subsequently acquired as part of our acquisition of Shaw (the “Shaw Acquisition”), on February 13, 2013 (the “Acquisition Closing Date”). |
Stock Repurchases—None in the fourth quarter of 2016.
22
Item 6. Selected Financial Data
The following table presents selected financial and operating data for the last five years. This information should be read in conjunction with “Item 7. Management’s Discussion and Analysis of Financial Condition and Results of Operations” and “Item 8. Financial Statements and Supplementary Data.”
Years Ended December 31, | ||||||||||||||||||||
2016 (1) | 2015 (2) | 2014 | 2013 (3) | 2012 | ||||||||||||||||
(In thousands, except per share and employee data) | ||||||||||||||||||||
Statement of Operations Data | ||||||||||||||||||||
Revenue | $ | 10,679,558 | $ | 12,929,504 | $ | 12,974,930 | $ | 11,094,527 | $ | 5,485,206 | ||||||||||
Cost of revenue | 9,653,502 | 11,417,188 | 11,508,521 | 9,895,517 | 4,786,499 | |||||||||||||||
Gross profit | 1,026,056 | 1,512,316 | 1,466,409 | 1,199,010 | 698,707 | |||||||||||||||
Selling and administrative expense | 349,874 | 387,027 | 405,208 | 379,485 | 227,948 | |||||||||||||||
Intangibles amortization | 42,439 | 57,625 | 66,506 | 61,111 | 22,613 | |||||||||||||||
Equity earnings | (26,826 | ) | (15,689 | ) | (25,225 | ) | (23,474 | ) | (17,931 | ) | ||||||||||
Goodwill impairment | 655,000 | 453,100 | — | — | — | |||||||||||||||
Loss on net assets sold and intangible assets impairment | 148,148 | 1,052,751 | — | — | — | |||||||||||||||
Other operating expense (income), net (4) | 2,339 | 2,619 | (2,373 | ) | 1,643 | (566 | ) | |||||||||||||
Acquisition and integration related costs (5) | — | — | 39,685 | 95,737 | 11,000 | |||||||||||||||
(Loss) income from operations | (144,918 | ) | (425,117 | ) | 982,608 | 684,508 | 455,643 | |||||||||||||
Interest expense | (105,349 | ) | (94,360 | ) | (83,590 | ) | (87,578 | ) | (19,606 | ) | ||||||||||
Interest income | 13,004 | 8,285 | 8,524 | 6,930 | 8,029 | |||||||||||||||
(Loss) income before taxes | (237,263 | ) | (511,192 | ) | 907,542 | 603,860 | 444,066 | |||||||||||||
Income tax (expense) benefit (6)(7) | (2,560 | ) | 81,231 | (271,417 | ) | (91,270 | ) | (127,003 | ) | |||||||||||
Net (loss) income | (239,823 | ) | (429,961 | ) | 636,125 | 512,590 | 317,063 | |||||||||||||
Less: Net income attributable to noncontrolling interests | (73,346 | ) | (74,454 | ) | (92,518 | ) | (58,470 | ) | (15,408 | ) | ||||||||||
Net (loss) income attributable to CB&I | $ | (313,169 | ) | $ | (504,415 | ) | $ | 543,607 | $ | 454,120 | $ | 301,655 | ||||||||
Per Share Data | ||||||||||||||||||||
Net (loss) income attributable to CB&I per share — basic | $ | (3.05 | ) | $ | (4.72 | ) | $ | 5.03 | $ | 4.29 | $ | 3.12 | ||||||||
Net (loss) income attributable to CB&I per share — diluted | $ | (3.05 | ) | $ | (4.72 | ) | $ | 4.98 | $ | 4.23 | $ | 3.07 | ||||||||
Cash dividends per share | $ | 0.28 | $ | 0.28 | $ | 0.28 | $ | 0.20 | $ | 0.20 | ||||||||||
Balance Sheet Data | ||||||||||||||||||||
Goodwill | $ | 3,043,410 | $ | 3,711,506 | $ | 4,195,231 | $ | 4,226,468 | $ | 926,711 | ||||||||||
Total assets (8) | $ | 7,839,420 | $ | 9,192,060 | $ | 9,369,830 | $ | 9,374,291 | $ | 4,327,192 | ||||||||||
Long-term debt, net (8) | $ | 1,287,923 | $ | 1,791,832 | $ | 1,553,846 | $ | 1,610,863 | $ | 799,143 | ||||||||||
Total shareholders’ equity | $ | 1,561,337 | $ | 2,163,590 | $ | 2,876,303 | $ | 2,507,438 | $ | 1,396,310 | ||||||||||
Other Financial Data | ||||||||||||||||||||
(Loss) income from operations percentage | (1.4)% | (3.3)% | 7.6% | 6.2% | 8.3% | |||||||||||||||
Depreciation and amortization | $ | 122,522 | $ | 161,135 | $ | 181,398 | $ | 180,026 | $ | 66,421 | ||||||||||
Capital expenditures | $ | 52,462 | $ | 78,852 | $ | 117,624 | $ | 90,492 | $ | 72,279 | ||||||||||
Other Data | ||||||||||||||||||||
New awards (9) | $ | 7,064,157 | $ | 13,138,498 | $ | 16,265,273 | $ | 12,252,970 | $ | 7,305,970 | ||||||||||
Backlog (9) | $ | 18,455,233 | $ | 22,643,939 | $ | 30,363,269 | $ | 27,794,212 | $ | 10,928,818 | ||||||||||
Number of employees: | ||||||||||||||||||||
Salaried | 16,100 | 18,500 | 22,900 | 21,400 | 9,400 | |||||||||||||||
Hourly and craft | 26,000 | 23,500 | 31,500 | 34,500 | 17,400 | |||||||||||||||
23
(1) | Results for 2016 include the impact of a reserve for the Transaction Receivable associated with the 2015 sale of our Nuclear Operations, which resulted in a non-cash pre-tax charge of approximately $148.1 million (approximately $96.3 million after-tax). Results for 2016 also include a non-cash pre-tax charge related to the partial impairment of goodwill (approximately $655.0 million) for our Capital Services operating group resulting from our fourth quarter annual impairment assessment. Our 2016 net income reflects the non-deductibility of the goodwill impairment charge for tax purposes. See “Results of Operations” within Item 7 and Note 6 within Item 8 for additional discussion. |
(2) | Results for 2015 include the impact of the sale of our Nuclear Operations which resulted in a non-cash pre-tax charge of approximately $1.5 billion (approximately $1.1 billion after-tax) related to the impairment of goodwill (approximately $453.1 million) and intangible assets (approximately $79.1 million) and a loss on net assets sold (approximately $973.7 million), as well as a reduction in our backlog (approximately $7.3 billion). See “Results of Operations” within Item 7 and Note 4 within Item 8 for further discussion and quantification of the impact of the sale. |
(3) | Results for 2013 include the impact of the Shaw Acquisition from the Acquisition Closing Date. |
(4) | Other operating expense (income), net, generally represents (gains) losses associated with the sale or disposition of property and equipment. For 2015, other operating expense (income), net, also included a gain of approximately $7.5 million related to the contribution of a technology to one of our unconsolidated joint ventures and a foreign exchange loss of approximately $11.0 million associated with the re-measurement of certain non-U.S. Dollar denominated net assets. |
(5) | For 2014 and 2013, integration related costs primarily related to facility consolidations, including the associated accrued future lease costs for vacated facilities and unutilized capacity, personnel relocation and severance related costs, and systems integration costs. For 2013 and 2012, acquisition related costs primarily related to transaction costs, professional fees, and change-in-control and severance related costs associated with the Shaw Acquisition. |
(6) | Income tax expense for 2013 included a benefit of approximately $62.8 million resulting from the reversal of a valuation allowance associated with our United Kingdom (“U.K.”) net operating loss deferred tax asset. |
(7) | Income tax expense for 2016 included a benefit of approximately $67.0 million resulting from the reversal of a deferred tax liability associated with historical earnings of a non-U.S. subsidiary for which the earnings are no longer anticipated to be subject to tax. |
(8) | Our December 31, 2015, 2014, 2013 and 2012 Balance Sheets reflect the reclassification of deferred debt issuance costs from total assets to current maturities of long-term debt and long-term debt. |
(9) | New awards represent the expected revenue value of new contract commitments received during a given period, as well as scope growth on existing commitments. Backlog represents the unearned value of our new awards. New awards and backlog include the entire award values for joint ventures we consolidate and our proportionate share of award values for joint ventures we proportionately consolidate. New awards and backlog also include our pro-rata share of the award values for unconsolidated joint ventures we account for under the equity method. As the net results for our equity method joint ventures are recognized as equity earnings, their revenue is not presented in our Consolidated Statement of Operations. Backlog may fluctuate with currency movements. |
24
Item 7. Management’s Discussion and Analysis of Financial Condition and Results of Operations
The following “Management’s Discussion and Analysis of Financial Condition and Results of Operations” is provided to assist readers in understanding our financial performance during the periods presented and significant trends that may impact our future performance. This discussion should be read in conjunction with our Financial Statements and the related notes thereto.
OVERVIEW
General—We provide a wide range of services through our four operating groups, including conceptual design, technology, engineering, procurement, fabrication, modularization, construction, commissioning, maintenance, program management and environmental services to customers in the energy infrastructure market throughout the world, and are a provider of diversified government services. Our operating groups, which represent our reportable segments, include: Engineering & Construction; Fabrication Services; Technology; and Capital Services.
We continue to be broadly diversified across the global energy infrastructure market. Our geographic diversity is illustrated by approximately 30% of our 2016 revenue coming from projects outside the U.S. and approximately 20% of our December 31, 2016 backlog of $18.5 billion (including approximately $1.7 billion related to our equity method joint ventures) being comprised of projects outside the U.S. The geographic mix of our revenue will evolve consistent with changes in our backlog mix, as well as shifts in future global energy demand. Our diversity in energy infrastructure end markets ranges from downstream activities such as gas processing, LNG, refining, and petrochemicals, to fossil based power plants and upstream activities such as offshore oil and gas and onshore oil sands projects. Planned investments across the natural gas value chain, including LNG and petrochemicals, remain strong, and we anticipate additional benefits from continued investments in projects based on U.S. shale gas. Global investments in power and petrochemical facilities are expected to continue, as are investments in various types of facilities which require storage structures and pre-fabricated pipe.
Our long-term contracts are awarded on a competitively bid and negotiated basis using a range of contracting options, including cost-reimbursable, fixed-price and hybrid, which has both cost-reimbursable and fixed-price characteristics. Under cost-reimbursable contracts, we generally perform our services in exchange for a price that consists of reimbursement of all customer-approved costs and a profit component, which is typically a fixed rate per hour, an overall fixed fee or a percentage of total reimbursable costs. Under fixed-price contracts, we perform our services and execute our projects at an established price. The timing of our revenue recognition may be impacted by the contracting structure of our contracts. Cost-reimbursable contracts, and hybrid contracts with a more significant cost-reimbursable component, generally provide our customers with greater influence over the timing of when we perform our work, and accordingly, such contracts often result in less predictability with respect to the timing of our revenue. Fixed-price contracts, and hybrid contracts with a more significant fixed-price component, tend to provide us with greater control over project schedule and the timing of when work is performed and costs are incurred, and accordingly, when revenue is recognized. Our shorter-term contracts and services are generally provided on a cost-reimbursable, fixed-price or unit price basis. Our December 31, 2016 backlog distribution by contracting type was approximately 70% fixed-price, hybrid, or unit based and 30% cost-reimbursable and is further described below within our operating group discussion. We anticipate that approximately 45% to 50% of our consolidated backlog (including backlog associated with our equity method joint ventures) will be recognized during 2017.
New awards represent the expected revenue value of new contract commitments received during a given period, as well as scope growth on existing commitments. Backlog represents the unearned value of our new awards. New awards and backlog include the entire award values for joint ventures we consolidate and our proportionate share of award values for joint ventures we proportionately consolidate. New awards and backlog also include our pro-rata share of the award values for unconsolidated joint ventures we account for under the equity method. As the net results for our equity method joint ventures are recognized as equity earnings, their revenue is not presented in our Consolidated Statement of Operations.
Backlog for each of our operating groups generally consists of several hundred contracts, which are being executed globally. These contracts vary in size from less than one hundred thousand dollars in contract value to several billion dollars, with varying durations that can exceed five years. The timing of new awards and differing types, sizes, and durations of our contracts, combined with their geographic diversity and stages of completion, often results in fluctuations in our quarterly operating group results as a percentage of operating group revenue. In addition, the relative contribution of each of our operating groups, and selling and administrative expense fluctuations, will impact our quarterly consolidated results as a percentage of consolidated revenue. Selling and administrative expense fluctuations are impacted by our stock-based compensation costs, which are generally higher in the first quarter of each year due to the timing of stock awards and the accelerated expensing of awards for participants that are eligible to retire. As a result of the aforementioned, quarterly variability in our revenue and operating results is not unusual in our business.
25
Our 2016 revenue reflects the impact of the sale of our Nuclear Operations on December 31, 2015 (see Note 4 within Item 8), which represented approximately $2.1 billion of our 2015 revenue. In addition, our 2016 revenue and operating results have been impacted by delays in the awards of certain large project prospects. Such delays in awards could also impact our near term revenue and operating results; however, we do not currently anticipate a long-term impact to our revenue as a result of the delays in awards. In addition, the anticipated sale of our Capital Services operating group (see Note 18 within Item 8), which represented approximately $2.2 billion of our 2016 revenue, would also impact our future revenue and operating results. Absent the aforementioned, we are currently not aware of any other fundamental change in our backlog or business that would give rise to future long-term operating results that would be significantly different from our recent historical norms. Further, we do not anticipate a material long-term negative impact to our liquidity as a result of the aforementioned and anticipate generating operating cash flows equivalent to our earnings.
Engineering & Construction—Our Engineering & Construction operating group provides EPC services for major energy infrastructure facilities.
Backlog for our Engineering & Construction operating group comprised approximately $9.9 billion (54%) of our consolidated December 31, 2016 backlog (including approximately $1.2 billion related to our equity method joint ventures). The backlog composition by end market was approximately 40% LNG, 30% petrochemical, 25% power, and 5% refining. Our LNG backlog was primarily concentrated in the Asia Pacific and North American regions. We anticipate significant opportunities will be derived from North America and Africa. Our petrochemical backlog was primarily concentrated in the U.S. and the Middle East region and we anticipate significant opportunities will continue to be derived from these regions. Our power backlog was primarily concentrated in the U.S. and we anticipate that our significant future opportunities will be derived from North America. The majority of our refining-related backlog was derived from the Middle East and Russia and we anticipate that our future opportunities will continue to be derived from these regions. Our December 31, 2016 backlog distribution for this operating group by contracting type was approximately 80% fixed-price and hybrid and 20% cost-reimbursable.
Fabrication Services—Our Fabrication Services operating group provides fabrication and erection of steel plate structures; fabrication of piping systems and process modules; manufacturing and distribution of pipe and fittings; and engineered products for the oil and gas, petrochemical, power generation, water and wastewater, mining and mineral processing industries.
Backlog for our Fabrication Services operating group comprised approximately $2.1 billion (11%) of our consolidated December 31, 2016 backlog. The backlog composition by end market was approximately 40% petrochemical, 30% LNG (including low temp and cryogenic), 15% power, 5% refining, 5% gas processing and 5% other end markets. Our December 31, 2016 backlog distribution for this operating group by contracting type was approximately 95% fixed-price, hybrid, or unit based, with the remainder being cost-reimbursable.
Technology—Our Technology operating group provides proprietary process technology licenses and associated engineering services and catalysts, primarily for the petrochemical and refining industries, and offers process planning and project development services and a comprehensive program of aftermarket support. Technology also has a 50% owned unconsolidated joint venture that provides proprietary process technology licenses and associated engineering services and catalyst, primarily for the refining industry, as well as a 33.3% owned unconsolidated joint venture that is commercializing a new natural gas power generation system that recovers the carbon dioxide produced during combustion.
Backlog for our Technology operating group comprised approximately $1.0 billion (6%) of our consolidated December 31, 2016 backlog (including approximately $470.0 million related to our equity method joint ventures) and was primarily comprised of fixed-price contracts.
Capital Services—Our Capital Services operating group provides comprehensive and integrated maintenance services, environmental engineering and remediation, construction services, program management, and disaster response and recovery for private-sector customers and governments.
Backlog for our Capital Services operating group comprised approximately $5.4 billion (29%) of our consolidated December 31, 2016 backlog. The backlog composition by end market was approximately 65% operations and maintenance services, 15% environmental services, 15% construction services and 5% program and project management, and was primarily concentrated in the U.S. Our December 31, 2016 backlog distribution for this operating group by contracting type was approximately 75% cost-reimbursable and 25% fixed-price and unit based.
26
RESULTS OF OPERATIONS
Our backlog, new awards, revenue and income from operations by reportable segment were as follows:
December 31, | ||||||||||||||||||
(In thousands) | ||||||||||||||||||
2016 | % of Total | 2015 | % of Total | 2014 | % of Total | |||||||||||||
Backlog | ||||||||||||||||||
Engineering & Construction | $ | 9,916,948 | 54% | $ | 12,892,804 | 57% | $ | 21,284,090 | 71% | |||||||||
Fabrication Services | 2,114,550 | 11% | 3,107,500 | 14% | 2,828,954 | 9% | ||||||||||||
Technology | 1,025,723 | 6% | 963,058 | 4% | 652,750 | 2% | ||||||||||||
Capital Services | 5,398,012 | 29% | 5,680,577 | 25% | 5,597,475 | 18% | ||||||||||||
Total backlog | $ | 18,455,233 | $ | 22,643,939 | $ | 30,363,269 | ||||||||||||
Years Ended December 31, | ||||||||||||||||||
(In thousands) | ||||||||||||||||||
2016 | % of Total | 2015 | % of Total | 2014 | % of Total | |||||||||||||
New Awards | ||||||||||||||||||
Engineering & Construction | $ | 3,104,874 | 44% | $ | 6,709,864 | 51% | $ | 10,101,263 | 62% | |||||||||
Fabrication Services | 1,273,971 | 18% | 3,106,563 | 24% | 2,422,580 | 15% | ||||||||||||
Technology | 479,409 | 7% | 577,540 | 4% | 387,010 | 2% | ||||||||||||
Capital Services | 2,205,903 | 31% | 2,744,531 | 21% | 3,354,420 | 21% | ||||||||||||
Total new awards | $ | 7,064,157 | $ | 13,138,498 | $ | 16,265,273 | ||||||||||||
2016 | % of Total | 2015 | % of Total | 2014 | % of Total | |||||||||||||
Revenue | ||||||||||||||||||
Engineering & Construction | $ | 6,105,488 | 57% | $ | 7,697,684 | 60% | $ | 7,623,381 | 59% | |||||||||
Fabrication Services | 2,110,310 | 20% | 2,442,690 | 19% | 2,738,981 | 21% | ||||||||||||
Technology | 284,424 | 3% | 399,099 | 3% | 385,126 | 3% | ||||||||||||
Capital Services | 2,179,336 | 20% | 2,390,031 | 18% | 2,227,442 | 17% | ||||||||||||
Total revenue | $ | 10,679,558 | $ | 12,929,504 | $ | 12,974,930 | ||||||||||||
2016 | % of Revenue | 2015 | % of Revenue | 2014 | % of Revenue | |||||||||||||
(Loss) Income From Operations | ||||||||||||||||||
Engineering & Construction | $ | 158,704 | 2.6% | $ | (875,321 | ) | (11.4)% | $ | 518,671 | 6.8% | ||||||||
Fabrication Services | 183,141 | 8.7% | 225,267 | 9.2% | 274,487 | 10.0% | ||||||||||||
Technology | 105,293 | 37.0% | 150,877 | 37.8% | 147,782 | 38.4% | ||||||||||||
Capital Services | (592,056 | ) | (27.2)% | 74,060 | 3.1% | 81,353 | 3.7% | |||||||||||
Total operating groups | (144,918 | ) | (1.4)% | (425,117 | ) | (3.3)% | 1,022,293 | 7.9% | ||||||||||
Integration related costs | — | — | (39,685 | ) | ||||||||||||||
Total (loss) income from operations | $ | (144,918 | ) | (1.4)% | $ | (425,117 | ) | (3.3)% | $ | 982,608 | 7.6% | |||||||
As discussed in Note 6 within Item 8, during 2016 we recorded a non-cash pre-tax charge related to the partial impairment of goodwill for our Capital Services operating group resulting from our fourth quarter annual impairment assessment. As discussed in Note 4 within Item 8, during 2016 we recorded a non-cash pre-tax charge within our Engineering & Construction operating group resulting from a reserve for the transaction consideration (the “Transaction Receivable”) associated with the 2015 sale of our Nuclear Operations. Also discussed in Note 4 within Item 8, on December 31, 2015 we completed the sale of our Nuclear Operations, which was previously included within our Engineering & Construction operating group, and during 2015 we recorded a non-cash pre-tax charge related to the impairments of goodwill and intangible assets and
27
a loss on net assets sold. For comparative purposes only, the results of the disposed Nuclear Operations for 2015, and charges for 2016 and 2015, are presented separately within the discussion and tables below.
2016 Versus 2015
Consolidated Results
New Awards/Backlog—As discussed above, new awards represent the expected revenue value of new contract commitments received during a given period, as well as scope growth on existing commitments. Backlog represents the unearned value of our new awards. New awards and backlog include the entire award values for joint ventures we consolidate and our proportionate share of award values for joint ventures we proportionately consolidate. New awards and backlog also include our pro-rata share of the award values for unconsolidated joint ventures we account for under the equity method. As the net results for our equity method joint ventures are recognized as equity earnings, their revenue is not presented in our Consolidated Statement of Operations. Our new awards may vary significantly each reporting period based on the timing of our major new contract commitments.
New awards were $7.1 billion for 2016 (including approximately $116.0 million related to our equity method joint ventures), compared with $13.1 billion for 2015 (including approximately $1.6 billion related to our equity method joint ventures). Significant new awards for 2016 (within our Engineering & Construction operating group) included:
• | three gas turbine power projects in the U.S. (approximately $1.1 billion combined), |
• | federal funding allocations for our mixed oxide fuel fabrication facility project in the U.S. and scope increases for our LNG mechanical erection project in the Asia Pacific region (approximately $970.0 million combined), and |
• | a refinery project in Russia (approximately $460.0 million). |
Other significant awards for 2016 included refinery maintenance services (approximately $490.0 million combined) and power plant services (approximately $475.0 million combined) in the U.S. and Canada within our Capital Services operating group.
Significant new awards for 2015 (within our Engineering & Construction operating group) included:
• | petrochemical facility projects in the U.S. (approximately $1.8 billion combined), |
• | our pro-rata share of a $2.8 billion liquids ethylene cracker project and associated units in the Middle East (approximately $1.4 billion) that we are executing through an unconsolidated equity method joint venture arrangement, |
• | scope increases for our LNG mechanical erection project in the Asia Pacific region (approximately $720.0 million), |
• | our proportionate share of a $2.0 billion additional LNG train for an LNG export facility in the U.S. (approximately $675.0 million) that we are executing through a proportionately consolidated joint venture arrangement, and |
• | a gas turbine power project in the U.S. (approximately $600.0 million). |
Other significant awards for 2015 included scope increases for our former large nuclear projects in the U.S. (approximately $730.0 million) within our Engineering & Construction and Fabrication Services operating groups; low-temperature tanks in the U.S. (approximately $300.0 million) within our Fabrication Services operating group; and power plant and refinery maintenance services in North America (approximately $910.0 million combined) within our Capital Services operating group. See Operating Group Results below for further discussion.
Backlog at December 31, 2016 was approximately $18.5 billion (including approximately $1.7 billion related to our equity method joint ventures), compared with $22.6 billion at December 31, 2015 (including approximately $1.8 billion related to our equity method joint ventures), with the decrease reflecting the impact of revenue exceeding new awards by approximately $3.8 billion (including $187.4 million of revenue for our unconsolidated equity method ventures) and other adjustments, primarily related to reductions in maintenance backlog for our Capital Services operating group.
Certain contracts within our Capital Services and Engineering & Construction operating groups are dependent upon funding from the U.S. government, where funds are appropriated on a year-by-year basis, while contract performance may take more than one year. Approximately $1.0 billion of our backlog at December 31, 2016 for these operating groups was for contractual commitments that are subject to future funding decisions.
28
Revenue—Revenue was $10.7 billion for 2016, representing a decrease of $2.2 billion (17.4%) compared with 2015. Our 2016 and 2015 revenue exclude approximately $187.4 million and $95.6 million, respectively, of revenue for our unconsolidated equity method ventures. Our 2015 revenue included approximately $2.1 billion of revenue attributable to our former Nuclear Operations. The table below summarizes our 2015 revenue excluding the Nuclear Operations.
Years Ended December 31, | ||||||||||||
2016 | % of Total | 2015 | % of Total | |||||||||
(In thousands) | ||||||||||||
Excluding Nuclear Operations (1) | $ | 10,679,558 | 100% | $ | 10,868,337 | 84% | ||||||
Nuclear Operations (1) | — | —% | 2,061,167 | 16% | ||||||||
Total revenue (1) | $ | 10,679,558 | $ | 12,929,504 | ||||||||
(1) | The break-out of 2015 revenue represents a non-GAAP financial disclosure, which we believe provides better comparability with our 2016 results. |
Excluding the impact of our former Nuclear Operations, revenue for 2016 decreased by $188.8 million (1.7%) compared with 2015. Our 2016 revenue was impacted by the wind down of various tank projects in North America, South America and the Asia Pacific region within our Fabrication Services operating group; a reduction in construction services activity within our Capital Services operating group; and decreased activity on our large cost reimbursable LNG mechanical erection project in the Asia Pacific region and refinery project in Colombia within our Engineering & Construction operating group. These impacts were partly offset by the benefit of increased activity on our LNG export facility projects in the U.S. and various other projects in the U.S. and Asia Pacific region within our Engineering & Construction operating group. See Operating Group Results below for further discussion.
Gross Profit—Gross profit was $1.0 billion (9.6% of revenue) for 2016, compared with $1.5 billion (11.7% of revenue) for 2015. Our 2015 results included approximately $239.1 million of gross profit attributable to our former Nuclear Operations. The table below summarizes our 2015 gross profit excluding the Nuclear Operations.
Years Ended December 31, | ||||||||||||
2016 | % of Revenue | 2015 | % of Revenue | |||||||||
(In thousands) | ||||||||||||
Excluding Nuclear Operations (1) | $ | 1,026,056 | 9.6% | $ | 1,273,266 | 11.7% | ||||||
Nuclear Operations (1) | — | —% | 239,050 | 11.6% | ||||||||
Total gross profit (1) | $ | 1,026,056 | 9.6% | $ | 1,512,316 | 11.7% | ||||||
(1) | The break-out of 2015 gross profit represents a non-GAAP financial disclosure, which we believe provides better comparability with our 2016 results. |
Excluding the impact of our former Nuclear Operations, gross profit was approximately $1.3 billion (11.7% of revenue) for 2015. Our 2016 gross profit percentage decreased compared to the 2015 period due to the net impact of changes in forecast costs and changes in estimated recoveries on certain projects, lower revenue volume for our higher margin Technology operating group, and reduced leverage of our operating costs, partly offset by a higher margin mix. See Operating Group Results below for further discussion.
Selling and Administrative Expense—Selling and administrative expense was $349.9 million (3.3% of revenue) for 2016, compared with $387.0 million (3.0% of revenue) for 2015. The decrease in absolute dollars for 2016 was primarily attributable to lower incentive plan costs (approximately $26.0 million) and lower expense attributable to our former Nuclear Operations, partly offset by inflationary increases.
Intangibles Amortization—Intangibles amortization was $42.4 million for 2016, compared with $57.6 million for 2015. The decrease for 2016 was primarily due to lower intangible balances resulting from the impairment of certain intangible assets in the third quarter 2015 and intangible assets that became fully amortized during the first quarter 2016.
Equity Earnings—Equity earnings were $26.8 million for 2016, compared with $15.7 million for 2015 and were primarily associated with our unconsolidated joint ventures within our Technology and Engineering & Construction operating groups.
29
Loss on Net Assets Sold and Impairment of Intangible Assets and Goodwill—As discussed in Note 6 within Item 8, during 2016 we recorded a non-cash pre-tax charge of approximately $655.0 million related to the partial impairment of goodwill resulting from our fourth quarter annual impairment assessment. In addition, as discussed in Note 4 within Item 8, during 2016 we recorded a non-cash pre-tax charge of approximately $148.1 million resulting from a reserve for the Transaction Receivable associated with the 2015 sale of our Nuclear Operations. As a result of the sale of our Nuclear Operations discussed in Note 4 within Item 8, during 2015 we recorded a non-cash pre-tax charge of approximately $1.5 billion related to the impairment of goodwill ($453.1 million) and intangible assets ($79.1 million) and a loss on net assets sold ($973.7 million).
Other Operating Expense (Income), Net—Other operating expense (income), net, generally represents losses (gains) associated with the sale or disposition of property and equipment. For 2015, other operating expense (income), net, also included a gain of approximately $7.5 million related to the contribution of a technology to one of our unconsolidated joint ventures and a foreign exchange loss of approximately $11.0 million associated with the re-measurement of certain non-U.S. Dollar denominated net assets.
(Loss) Income from Operations—Loss from operations was $(144.9) million (1.4% of revenue) for 2016, compared with a loss from operations of $(425.1) million (3.3% of revenue) for 2015. Our 2016 results included the aforementioned $655.0 million goodwill impairment charge and the impact of the $148.1 million Transaction Receivable reserve. Our 2015 results included approximately $215.2 million of income from operations attributable to our former Nuclear Operations and the aforementioned $1.5 billion charge resulting from the sale of our Nuclear Operations. The table below summarizes our 2016 and 2015 results excluding the Nuclear Operations and charges.
Years Ended December 31, | ||||||||||||
2016 | % of Revenue | 2015 | % of Revenue | |||||||||
(In thousands) | ||||||||||||
Excluding Nuclear Operations, Charges and Impairments (1) | $ | 658,230 | 6.2% | $ | 865,584 | 8.0% | ||||||
Nuclear Operations (1) | — | —% | 215,150 | 10.4% | ||||||||
Charges related to sale of Nuclear Operations and Impairments (1) | (803,148 | ) | —% | (1,505,851 | ) | —% | ||||||
Loss from operations (1) | $ | (144,918 | ) | (1.4)% | $ | (425,117 | ) | (3.3)% | ||||
(1) | The break-out of 2016 and 2015 (loss) income from operations represents a non-GAAP financial disclosure, which we believe provides better comparability between our 2016 and 2015 results. |
Excluding the impact of the goodwill impairment charge and Transaction Receivable reserve, income from operations was approximately $658.2 million (6.2% of revenue) for 2016. Excluding the impact of our former Nuclear Operations and charge, income from operations was approximately $865.6 million (8.0% of revenue) for 2015. The changes in our 2016 income from operations compared to 2015 were due to the reasons noted above. See Operating Group Results below for further discussion.
Interest Expense and Interest Income—Interest expense was $105.3 million for 2016, compared with $94.4 million for 2015. The increase for 2016 was the result of higher revolving credit facility borrowings and the full year impact of long-term borrowings, which occurred in the third quarter 2015. Interest income was $13.0 million for 2016, compared with $8.3 million for 2015.
Income Tax (Expense) Benefit—Income tax expense was $2.6 million ((1.1)% of pre-tax loss) for 2016, compared with an income tax benefit of $81.2 million (15.9% of pre-tax loss) for 2015. For 2016, the aforementioned impact of the $148.1 million Transaction Receivable reserve resulted in a tax benefit of $51.8 million. Our 2016 tax rate also reflects the non-deductibility of the aforementioned $655.0 million goodwill impairment. Excluding these impacts, our 2016 tax rate was 9.6% of pre-tax income and our income tax expense was $54.4 million. For 2015, the aforementioned $1.5 billion charge related to the sale of our Nuclear Operations resulted in a net tax benefit of $370.7 million. The net tax benefit on the charge reflects the non-deductibility of the goodwill impairment and the establishment of U.S. state valuation allowances. Excluding this net benefit, our 2015 tax rate was 29.1% and our income tax expense was $289.5 million.
Our 2016 tax rate benefited from the reversal of a deferred tax liability associated with historical earnings of a non-U.S. subsidiary for which the earnings are no longer anticipated to be subject to tax (approximately 12.0%), earnings represented by noncontrolling interests (approximately 4.0%) and adjustments to non-U.S. valuation allowances (approximately 3.0%). Our 2015 tax rate benefited from earnings represented by noncontrolling interests (approximately 2.0%) and previously unrecognized tax benefits and other adjustments (approximately 3.0%).
30
Our 2016 tax rate decreased relative to the 2015 period, excluding the impacts of the aforementioned items for 2016 and 2015, due to lower pre-tax income in higher tax rate jurisdictions, primarily the U.S. (approximately 5.0%). Our tax rate may continue to experience fluctuations due primarily to changes in the geographic distribution of our pre-tax income.
Net Income Attributable to Noncontrolling Interests—Noncontrolling interests are primarily associated with our consolidated joint venture projects within our Engineering & Construction operating group and certain operations in the U.S. and Middle East within our Capital Services and Fabrication Services operating groups. Net income attributable to noncontrolling interests was $73.3 million for 2016, compared with $74.5 million for 2015, and was commensurate with the level of applicable operating results for the aforementioned projects and operations. See Operating Group Results below for further discussion.
Operating Group Results
Engineering & Construction
New Awards—New awards were $3.1 billion for 2016, compared with $6.7 billion for 2015 (including approximately $1.4 billion related to our equity method joint ventures). Significant new awards for 2016 included:
• | three gas turbine power projects in the U.S. (approximately $1.1 billion combined), |
• | federal funding allocations for our mixed oxide fuel fabrication facility project in the U.S. and scope increases for our LNG mechanical erection project in the Asia Pacific region (approximately $970.0 million combined), and |
• | a refinery project in Russia (approximately $460.0 million). |
Significant new awards for 2015 included:
• | petrochemical facility projects in the U.S. (approximately $1.8 billion combined), |
• | our pro-rata share of a $2.8 billion liquids ethylene cracker project and associated units in the Middle East (approximately $1.4 billion) that we are executing through an unconsolidated equity method joint venture arrangement, |
• | scope increases for our LNG mechanical erection project in the Asia Pacific region (approximately $720.0 million), |
• | our proportionate share of a $2.0 billion additional LNG train for an LNG export facility in the U.S. (approximately $675.0 million) that we are executing through a proportionately consolidated joint venture arrangement, |
• | a gas turbine power project in the U.S. (approximately $600.0 million), |
• | scope increases for our former large nuclear projects in the U.S. (approximately $480.0 million), |
• | an ethylene storage facility in the U.S. (approximately $115.0 million), |
• | a chemicals plant project in the U.S. (approximately $100.0 million), and |
• | engineering and procurement services for a refinery project in Russia. |
Revenue—Revenue was $6.1 billion for 2016, representing a decrease of $1.6 billion (20.7%) compared with 2015. Our 2015 revenue included approximately $2.1 billion of revenue attributable to our former Nuclear Operations. The table below summarizes our 2015 revenue excluding the Nuclear Operations.
Years Ended December 31, | ||||||||||||
2016 | % of Total | 2015 | % of Total | |||||||||
(In thousands) | ||||||||||||
Excluding Nuclear Operations (1) | $ | 6,105,488 | 100% | $ | 5,636,517 | 73% | ||||||
Nuclear Operations (1) | — | —% | 2,061,167 | 27% | ||||||||
Total revenue (1) | $ | 6,105,488 | $ | 7,697,684 | ||||||||
(1) | The break-out of 2015 revenue represents a non-GAAP financial disclosure, which we believe provides better comparability with our 2016 results. |
Excluding the impact of our former Nuclear Operations, revenue for 2016 increased by $469.0 million (8.3%) compared with 2015. Our 2016 revenue benefited from increased activity on our LNG export facility projects in the U.S. (approximately $1.1 billion) and various other projects in the U.S. and Asia Pacific region, partly offset by decreased activity on our large cost
31
reimbursable LNG mechanical erection project in the Asia Pacific region and refinery project in Colombia (approximately $890.0 million combined).
Approximately $2.3 billion of the operating group’s 2016 revenue was attributable to our LNG export facility projects in the U.S., compared with approximately $1.2 billion for 2015. Approximately $1.2 billion of the operating group’s 2016 revenue was attributable to our large cost reimbursable projects, compared with approximately $2.1 billion for 2015.
Income (Loss) from Operations—Income from operations was $158.7 million (2.6% of revenue) for 2016, compared with a loss from operations of $(875.3) million (11.4% of revenue) for 2015. Our 2016 results included the impact of the aforementioned $148.1 million Transaction Receivable reserve. Our 2015 results included approximately $215.2 million of income from operations attributable to our former Nuclear Operations and the aforementioned $1.5 billion charge resulting from the sale of our Nuclear Operations. The 2015 results for our former Nuclear Operations benefited by approximately $28.0 million from the net impact of cost increases and adjustments to project price on our former large U.S. nuclear projects. The table below summarizes our 2016 and 2015 results excluding the Nuclear Operations and charges.
Years Ended December 31, | ||||||||||||
2016 | % of Revenue | 2015 | % of Revenue | |||||||||
(In thousands) | ||||||||||||
Excluding Nuclear Operations, Charges and Impairment (1) | $ | 306,852 | 5.0% | $ | 415,380 | 7.4% | ||||||
Nuclear Operations (1) | — | —% | 215,150 | 10.4% | ||||||||
Charges related to sale of Nuclear Operations and Impairment (1) | (148,148 | ) | —% | (1,505,851 | ) | —% | ||||||
Income (loss) from operations (1) | $ | 158,704 | 2.6% | $ | (875,321 | ) | (11.4)% | |||||
(1) | The break-out of 2016 and 2015 income (loss) from operations represents a non-GAAP financial disclosure, which we believe provides better comparability between our 2016 and 2015 results. |
Excluding the impact of the Transaction Receivable reserve, income from operations was approximately $306.9 million (5.0% of revenue) for 2016. Excluding the impact of our former Nuclear Operations and the charge, income from operations was approximately $415.4 million (7.4% of revenue) for 2015. Our 2016 results were impacted by forecast cost increases on three projects in the U.S. (approximately $283.0 million combined), including approximately $164.0 million for a project in a loss position. Our estimate to complete the project in a loss position was impacted primarily by lower than anticipated labor productivity and extensions of schedule during the second half of 2016. At December 31, 2016, the project was approximately 65% complete and had a reserve for estimated losses of approximately $49.0 million. If future labor productivity differs from our current estimates, our schedule is further extended, or the project incurs schedule liquidated damages due to our inability to reach a favorable commercial resolution on such matters, the project may experience additional forecast cost increases. The aforementioned project charges were partly offset by the benefit of changes in estimated recoveries on a large consolidated joint venture project and increased recoveries and savings on two projects in the U.S. (approximately $124.0 million for the three projects combined). Our 2016 results also benefited from higher revenue volume, leverage of operating costs and a higher margin mix.
Fabrication Services
New Awards—New awards were $1.3 billion for 2016, compared with $3.1 billion for 2015. Significant new awards for 2016 included an LNG storage and fueling terminal in the U.S. (approximately $200.0 million); crude oil storage tanks in Canada (approximately $70.0 million); crude oil storage tanks in the Middle East (approximately $40.0 million); and various storage tank and pipe fabrication awards throughout the world.
Significant new awards for 2015 included low-temperature tanks in the U.S. (approximately $300.0 million); scope increases for our former large nuclear projects in the U.S. (approximately $250.0 million); a hydrotreater project in the U.S. (approximately $95.0 million); engineered products for a refinery in Russia (approximately $93.0 million); storage spheres in the U.S. (approximately $70.0 million); storage tanks for a clean fuels project in the Middle East (approximately $60.0 million); an oil sands project in Canada (approximately $50.0 million); pipe fabrication for a petrochemical project in the U.S. (approximately $40.0 million); work scopes for our U.S. LNG export facility projects that we are executing through our proportionately consolidated joint venture arrangements; and work scopes for our liquids ethylene cracker project in the Middle East that we are executing through an unconsolidated equity method joint venture.
Revenue—Revenue was $2.1 billion for 2016, representing a decrease of $332.4 million (13.6%) compared with 2015. Our 2016 revenue was impacted by the wind down of various storage tank projects in North America, South America and the Asia Pacific region and lower engineered products activity (approximately $435.0 million combined), partly offset by increased fabrication activity.
32
Income from Operations—Income from operations was $183.1 million (8.7% of revenue) for 2016, compared with $225.3 million (9.2% of revenue) for 2015. Our 2016 results were impacted by lower revenue volume, reduced leverage of our operating costs and forecast cost increases on various projects, primarily in North America and the Asia Pacific region (approximately $45.0 million combined), including approximately $25.0 million for a project in a loss position. Our estimate to complete the project in a loss position was impacted primarily by lower than anticipated labor productivity. At December 31, 2016, the project was approximately 75% complete and had a reserve for estimated losses of approximately $5.0 million. If future productivity differs from our current estimates the project may experience additional forecast cost increases. Our 2015 results were impacted by net forecast cost increases on various projects in the U.S. (approximately $30.0 million combined) and a foreign exchange loss (approximately $11.0 million) associated with the re-measurement of certain non-U.S. Dollar denominated net assets.
Technology
New Awards—New awards were $479.4 million for 2016 (including approximately $116.0 million related to our equity method joint ventures), compared with $577.5 million for 2015 (including approximately $226.0 million related to our equity method joint ventures). Significant new awards for 2016 included alkylation licensing in North America and China; hydrocracking licensing in China; petrochemical licensing in Europe and China; proprietary equipment sales in Asia; and catalyst awards throughout the world. Significant new awards for 2015 included refining and petrochemical catalysts in North America and Africa and hydroprocessing licensing in the Asia Pacific region (approximately $100.0 million).
Revenue—Revenue was $284.4 million for 2016, representing a decrease of $114.7 million (28.7%) compared with 2015. Our 2016 revenue was impacted by lower catalyst volume and the timing of new awards.
Income from Operations—Income from operations was $105.3 million (37.0% of revenue) for 2016, compared with $150.9 million (37.8% of revenue) for 2015. Our 2016 results were impacted by lower revenue volume and lower equity earnings (approximately $5.0 million), partly offset by a higher margin mix. Our 2015 results benefited from a gain of approximately $7.5 million associated with the contribution of a technology to one of our unconsolidated joint ventures.
Capital Services
New Awards—New awards were $2.2 billion for 2016, compared with $2.7 billion for 2015. Significant new awards for 2016 included refinery maintenance services (approximately $490.0 million combined); power plant services (approximately $475.0 million combined); industrial maintenance services (approximately $100.0 million); U.S. military base services (approximately $75.0 million); disaster recovery services for FEMA (approximately $70.0 million); and landfill services (approximately $50.0 million), all within North America; and environmental remediation work for the U.S. Navy globally (approximately $70.0 million).
Significant new awards for 2015 included power plant and refinery maintenance services in the U.S. and Canada (approximately $910.0 million combined); power plant maintenance and modification services in the U.S. (approximately $200.0 million); scope increases on a chemical expansion project in the U.S. (approximately $200.0 million); refinery maintenance services in South America (approximately $120.0 million); world-wide military installation fuel services for the U.S. Federal Government (approximately $100.0 million); power plant operations and maintenance services in the U.S. (approximately $100.0 million); long-term specialty chemical maintenance services at multiple facilities in the U.S. (approximately $100.0 million); work for the Rapid Disaster Infrastructure Response Program of the U.S. Army Corps of Engineers (approximately $60.0 million); chemical plant operations and maintenance services in the U.S. (approximately $60.0 million); coking unit services in Canada (approximately $50.0 million); and site construction for a hydrotreater in the U.S. (approximately $45.0 million).
Revenue—Revenue was $2.2 billion for 2016, representing a decrease of $210.7 million (8.8%) compared with 2015. Our 2016 revenue was impacted by lower construction services activity.
(Loss) Income from Operations—Loss from operations was $(592.1) million (27.2% of revenue) for 2016, compared with income from operations of $74.1 million (3.1% of revenue) for 2015. Our 2016 results included the aforementioned $655.0 million goodwill impairment charge. The table below summarizes our 2016 results excluding the charge.
Years Ended December 31, | ||||||||||||
2016 | % of Revenue | 2015 | % of Revenue | |||||||||
(In thousands) | ||||||||||||
Excluding Impairment (1) | $ | 62,944 | 2.9% | $ | 74,060 | 3.1% | ||||||
Charge related to Impairment (1) | (655,000 | ) | —% | — | —% | |||||||
(Loss) income from operations (1) | $ | (592,056 | ) | (27.2)% | $ | 74,060 | 3.1% | |||||
33
(1) | The break-out of 2016 (loss) income from operations represents a non-GAAP financial disclosure, which we believe provides better comparability with our 2015 results. |
Excluding the impact of the goodwill impairment charge, income from operations was approximately $62.9 million (2.9% of revenue) for 2016.
2015 Versus 2014
Consolidated Results
New awards were $13.1 billion for 2015 (including approximately $1.6 billion related to our equity method joint ventures), compared with $16.3 billion for 2014. Significant new awards for 2015 (within our Engineering & Construction operating group) included:
• | petrochemical facility projects in the U.S. (approximately $1.8 billion combined), |
• | our pro-rata share of a $2.8 billion liquids ethylene cracker project and associated units in the Middle East (approximately $1.4 billion) that we are executing through an unconsolidated equity method joint venture arrangement, |
• | scope increases for our LNG mechanical erection project in the Asia Pacific region (approximately $720.0 million), |
• | our proportionate share of a $2.0 billion additional LNG train for an LNG export facility in the U.S. (approximately $675.0 million) that we are executing through a proportionately consolidated joint venture arrangement, and |
• | a gas turbine power project in the U.S. (approximately $600.0 million). |
Other significant awards for 2015 included scope increases for our former large nuclear projects in the U.S. (approximately $730.0 million) within our Engineering & Construction and Fabrication Services operating groups; low-temperature tanks in the U.S. (approximately $300.0 million) within our Fabrication Services operating group; and power plant and refinery maintenance services in North America (approximately $910.0 million combined) within our Capital Services operating group.
Significant awards for 2014 included our proportionate share of a $6.2 billion LNG export facility in the U.S (approximately $3.1 billion) that we are executing through a proportionately consolidated joint venture arrangement; work scopes we will perform for our two U.S. LNG export facility projects (approximately $900.0 million combined) that we are executing through our proportionately consolidated joint venture arrangements; federal funding allocations for our mixed oxide fuel fabrication facility project in the U.S., and scope increases for our former large U.S. nuclear projects and cost-reimbursable refinery project in Colombia and LNG mechanical erection project in the Asia Pacific region (approximately $3.0 billion combined; and two gas turbine power projects in the U.S. (approximately $850.0 million combined), all within our Engineering & Construction operating group; and nuclear power plant services in the U.S. (approximately $800.0 million), within our Capital Services operating group. See Operating Group Results below for further discussion.
Backlog at December 31, 2015 was approximately $22.6 billion (including approximately $1.8 billion related to our equity method joint ventures), compared with $30.4 billion at December 31, 2014, with the decrease reflecting the impact of the sale of our Nuclear Operations (approximately $7.3 billion) and other adjustments, primarily related to foreign currency fluctuations associated with the strengthening of the U.S. Dollar against the Australian Dollar, Euro, Colombian Peso and Canadian Dollar (approximately $400.0 million). As noted in the Revenue and Gross Profit sections below, foreign currency fluctuations also had an unfavorable impact on our operating results for 2015.
Certain contracts within our Capital Services and Engineering & Construction operating groups are dependent upon funding from the U.S. government, where funds are appropriated on a year-by-year basis, while contract performance may take more than one year. Approximately $1.1 billion of our backlog at December 31, 2015 for these operating groups was for contractual commitments that are subject to future funding decisions.
Revenue—Revenue was $12.9 billion for 2015, representing a decrease of $45.4 million (0.4%) compared with 2014. Our 2015 revenue was unfavorably impacted relative to 2014 by approximately $890.0 million due to foreign currency fluctuations associated with the strengthening of the U.S. Dollar against the Australian Dollar, British Pound, Canadian Dollar, Colombian Peso and Euro, primarily within our Engineering & Construction operating group. Inclusive of the aforementioned foreign exchange impacts, our results were impacted by a reduction in revenue on our cost-reimbursable LNG mechanical erection and gas processing projects in the Asia Pacific region and refinery project in Colombia within our Engineering & Construction operating group; and the wind down of various tank projects in the Asia Pacific region within our Fabrication Services operating group; partly offset by increased progress on our former large U.S. nuclear projects and increased LNG revenue in the U.S., all within our Engineering & Construction operating group; and increased plant maintenance and chemical plant services revenue within our Capital Services operating group.
34
For 2015 and 2014, revenue from our aforementioned LNG mechanical erection project in the Asia Pacific region, combined with our LNG tank project for the same customer within our Fabrication Services operating group, totaled $1.6 billion (approximately 13% of our total 2015 revenue) and $2.0 billion (approximately 15% of our total 2014 revenue), respectively. See Operating Group Results below for further discussion.
Gross Profit—Gross profit was $1.5 billion (11.7% of revenue) for 2015, compared with $1.5 billion (11.3% of revenue) for 2014. Our 2015 results were unfavorably impacted relative to 2014 by approximately $73.0 million due to lower revenue volume resulting from foreign currency fluctuations associated with the strengthening of the U.S. Dollar, primarily within our Engineering & Construction operating group, as noted in the Revenue section above. The increase in gross profit percentage was primarily attributable to the impact of leveraging our operating costs during 2015, and 2014 being unfavorably impacted by a temporary underutilization of fabrication capacity within our Fabrication Services operating group.
Selling and Administrative Expense—Selling and administrative expense was $387.0 million (3.0% of revenue) for 2015, compared with $405.2 million (3.1% of revenue) for 2014. The decrease in absolute dollars and as a percentage of revenue for 2015 was primarily attributable to lower incentive plan costs (approximately $12.6 million) and our cost reduction initiatives.
Intangibles Amortization—Intangibles amortization was $57.6 million for 2015, compared with $66.5 million for 2014. The decrease for 2015 was primarily attributable to intangible assets that became fully amortized during the first quarter 2015, the impairment of intangible assets in the third quarter 2015 resulting from the sale of our Nuclear Operations, and the impact of foreign currency translation.
Equity Earnings—Equity earnings were $15.7 million for 2015, compared with $25.2 million for 2014 and were associated with our unconsolidated CLG joint venture and other unconsolidated equity method joint ventures.
Loss on Net Assets Sold and Impairment of Intangible Assets and Goodwill—As a result of the sale of our Nuclear Operations discussed in Note 4 within Item 8, during 2015 we recorded a non-cash pre-tax charge of approximately $1.5 billion related to the impairment of goodwill ($453.1 million) and intangible assets ($79.1 million) and a loss on net assets sold ($973.7 million).
Other Operating Expense (Income), Net—Other operating expense (income), net, generally represents losses (gains) associated with the sale or disposition of property and equipment. For 2015, other operating expense (income), net, also included a gain of approximately $7.5 million related to the contribution of a technology to one of our unconsolidated joint ventures and a foreign exchange loss of approximately $11.0 million associated with the re-measurement of certain non-U.S. Dollar denominated net assets.
Integration Related Costs—Integration related costs were $39.7 million for 2014 and primarily related to facility consolidations, including the associated accrued future lease costs for vacated facilities and unutilized capacity, personnel relocation and severance related costs, and systems integration costs.
(Loss) Income from Operations—Loss from operations was $(425.1) million (3.3% of revenue) for 2015, compared with income from operations of $982.6 million (7.6% of revenue) for 2014. The changes in absolute dollars and as a percentage of revenue were primarily attributable to the reasons noted above. The table below summarizes our results excluding the impact of the charge resulting from the sale of our Nuclear Operations for 2015 and integration related costs for 2014.
Years Ended December 31, | ||||||||||||
2015 | % of Revenue | 2014 | % of Revenue | |||||||||
(In thousands) | ||||||||||||
Excluding Charge and Integration related costs (1) | $ | 1,080,734 | 8.4% | $ | 1,022,293 | 7.9% | ||||||
Charge related to sale of Nuclear Operations and Impairment(1) | (1,505,851 | ) | (11.7)% | — | —% | |||||||
Integration related costs (1) | — | —% | (39,685 | ) | (0.3)% | |||||||
(Loss) income from operations (1) | $ | (425,117 | ) | (3.3)% | $ | 982,608 | 7.6% | |||||
(1) | The break-out of 2015 and 2014 income (loss) from operations represents a non-GAAP financial disclosure, which we believe provides better comparability between our 2015 and 2014 results. |
Excluding the impact of the charge for 2015 and integration related costs for 2014, income from operations was $1.1 billion (8.4% of revenue) for 2015, compared with $1.0 billion (7.9% of revenue) for 2014. See Operating Group Results below for further discussion.
Interest Expense and Interest Income—Interest expense was $94.4 million for 2015, compared with $83.6 million for 2014. The increase was the result of higher average revolving credit facility borrowings and additional long-term borrowings during 2015. Interest income was $8.3 million for 2015, compared with $8.5 million for 2014.
35
Income Tax Benefit (Expense)—Income tax benefit was $81.2 million (15.9% of pre-tax loss) for 2015, compared with income tax expense of $271.4 million (29.9% of pre-tax income) for 2014. The aforementioned $1.5 billion charge resulting from the sale of our Nuclear Operations resulted in a net tax benefit of $370.7 million for 2015. The net tax benefit on the charge reflects the non-deductibility of the goodwill impairment and the establishment of U.S. state valuation allowances. Excluding this net benefit, our income tax expense for 2015 was $289.5 million (29.1% of pre-tax income excluding the charge). Our 2015 tax rate benefited from earnings represented by noncontrolling interests (approximately 2.0%) and previously unrecognized tax benefits and other adjustments (approximately 3.0%). Our 2014 tax rate also benefited from earnings represented by noncontrolling interests (approximately 2.5%). Our 2015 tax rate increased relative to 2014 due to a greater proportion of our pre-tax income being earned in higher tax rate jurisdictions, primarily the U.S. (approximately 2.0%).
Net Income Attributable to Noncontrolling Interests—Noncontrolling interests are primarily associated with our large LNG mechanical erection project in the Asia Pacific region and certain operations in the U.S. and Middle East. Also included in 2014 was our large gas processing project in the Asia Pacific region. Net income attributable to noncontrolling interests was $74.5 million for 2015, compared with $92.5 million for 2014. The change compared to 2014 was commensurate with the level of applicable operating results for the aforementioned projects and operations.
Operating Group Results
Engineering & Construction
New Awards—New awards were $6.7 billion for 2015 (including approximately $1.4 billion related to our equity method joint ventures), compared with $10.1 billion for 2014. Significant new awards for 2015 included:
• | petrochemical facility projects in the U.S. (approximately $1.8 billion combined), |
• | our pro-rata share of a $2.8 billion liquids ethylene cracker project and associated units in the Middle East (approximately $1.4 billion) that we are executing through an unconsolidated equity method joint venture arrangement, |
• | scope increases for our LNG mechanical erection project in the Asia Pacific region (approximately $720.0 million), |
• | our proportionate share of a $2.0 billion additional LNG train for an LNG export facility in the U.S. (approximately $675.0 million) that we are executing through a proportionately consolidated joint venture arrangement, |
• | a gas turbine power project in the U.S. (approximately $600.0 million), |
• | scope increases for our former large nuclear projects in the U.S. (approximately $480.0 million), |
• | an ethylene storage facility in the U.S. (approximately $115.0 million), |
• | a chemicals plant project in the U.S. (approximately $100.0 million), and |
• | engineering and procurement services for a refinery project in Russia. |
Significant awards for 2014 included our proportionate share of a $6.2 billion LNG export facility in the U.S. (approximately $3.1 billion) that we are executing through a proportionately consolidated joint venture arrangement; work scopes for our two U.S. LNG export facility projects (approximately $900.0 million combined) that we are executing through our proportionately consolidated joint venture arrangements; federal funding allocations for our mixed oxide fuel fabrication facility project in the U.S., and scope increases for our former large U.S. nuclear projects and cost-reimbursable refinery project in Colombia and LNG mechanical erection project in the Asia Pacific region (approximately $3.0 billion combined); two gas turbine power projects in the U.S. (approximately $850.0 million combined); structural, mechanical and piping construction work for an LNG project in the Asia Pacific region (approximately $625.0 million); engineering and procurement for a clean fuels project in the Middle East (approximately $370.0 million); and a demonstration plant for our NET Power venture.
Revenue—Revenue was $7.7 billion for 2015, representing an increase of $74.3 million (1.0%) compared with 2014. Our 2015 revenue was unfavorably impacted relative to 2014 by approximately $730.0 million due to foreign currency fluctuations associated with the strengthening of the U.S. Dollar against the Australian Dollar, British Pound, Canadian Dollar, Colombian Peso and Euro. Inclusive of the aforementioned foreign exchange impacts, our 2015 results primarily benefited from increased revenue on our LNG projects in the U.S. (approximately $1.0 billion) and former large U.S. nuclear projects (approximately $250.0 million), partly offset by net decreased revenue on our large cost-reimbursable LNG mechanical erection and gas processing projects in the Asia Pacific region and refinery project in Colombia (approximately $1.0 billion combined) and various other projects in Canada and Europe.
Approximately $2.0 billion of the operating group’s 2015 revenue was attributable to our former large U.S. nuclear projects, compared with approximately $1.7 billion for 2014. Approximately $2.1 billion of the operating group’s 2015 revenue was attributable to our large cost-reimbursable projects, compared with approximately $3.1 billion for 2014. Approximately
36
$1.2 billion of the operating group’s 2015 revenue was attributable to our U.S. LNG export facility projects, compared with approximately $205.0 million for 2014.
(Loss) Income from Operations—Loss from operations was $(875.3) million (11.4% of revenue) for 2015, compared with income from operations of $518.7 million (6.8% of revenue) for 2014. As a result of the sale of our Nuclear Operations discussed in Note 4 within Item 8, our results were impacted by a non-cash charge of approximately $1.5 billion related to the impairment of goodwill ($453.1 million) and intangible assets ($79.1 million) and loss on net assets sold ($973.7 million). The table below summarizes our results excluding the impact of the charge.
Years Ended December 31, | ||||||||||||
2015 | % of Revenue | 2014 | % of Revenue | |||||||||
(In thousands) | ||||||||||||
Excluding Charge (1) | $ | 630,530 | 8.2% | $ | 518,671 | 6.8% | ||||||
Charge related to sale of Nuclear Operations and Impairment (1) | (1,505,851 | ) | (19.6)% | — | —% | |||||||
(Loss) income from operations (1) | $ | (875,321 | ) | (11.4)% | $ | 518,671 | 6.8% | |||||
(1) | The break-out of 2015 income (loss) from operations represents a non-GAAP financial disclosure, which we believe provides better comparability with our 2014 results. |
Excluding the impact of the charge, income from operations was $630.5 million (8.2% of revenue) for 2015. Our 2015 results were unfavorably impacted relative to 2014 by approximately $44.0 million due to lower revenue volume resulting from foreign currency fluctuations associated with the strengthening of the U.S. Dollar, as noted in the Revenue section above. Our 2015 results benefited during 2015 from a higher margin backlog mix and better overhead recoveries, and benefited by approximately $28.0 million from the net impact of cost increases on our two former U.S. nuclear projects and the percent complete benefit of increases in project price on both projects related to contractual entitlements from our customers and consortium partner and an increase in claim recoveries on our South Carolina nuclear project related to the aforementioned and previously forecasted cost increases.
During 2014, we experienced increases in forecast cost on our two former U.S. nuclear projects related primarily to extensions of schedule resulting from regulatory and design changes. Project price for the nuclear projects was increased by a comparable amount based on our contractual entitlements, which provide for our customers and consortium partner to reimburse us for such costs. The aforementioned did not result in a significant net change in estimated margins on the projects; however, the percent complete dilutive effect of the changes was a reduction to our 2014 income from operations of approximately $34.0 million. In addition, during 2014 we experienced increases in forecast cost on our South Carolina nuclear project resulting from regulatory and design changes, and increased project price by approximately $373.0 million for unapproved change orders and claims related to these and previous forecast cost increases. This resulted in a benefit to our 2014 income from operations of approximately $24.0 million. The net impact of the aforementioned changes on the nuclear projects was a reduction to our 2014 income from operations of approximately $10.0 million.
Fabrication Services
New Awards—New awards were $3.1 billion for 2015, compared with $2.4 billion for 2014. Significant new awards for 2015 included engineering and fabrication for low-temperature tanks in the U.S. (approximately $300.0 million); scope increases for our former large nuclear projects in the U.S. (approximately $250.0 million); engineering and fabrication for a hydrotreater in the U.S. (approximately $95.0 million); engineered products for a refinery in Russia (approximately $93.0 million); engineering, procurement, fabrication and erection for storage spheres in the U.S. (approximately $70.0 million); storage tanks for a clean fuels project in the Middle East (approximately $60.0 million); an oil sands project in Canada (approximately $50.0 million); pipe fabrication for a petrochemical project in the U.S. (approximately $40.0 million); work scopes for our U.S. LNG export facility projects that we are executing through our proportionately consolidated joint venture arrangements; and work scopes for our liquids ethylene cracker project that we are executing through our unconsolidated equity method joint venture.
Significant new awards for 2014 included ethylene heaters in Malaysia and Turkmenistan (approximately $270.0 million, combined); work scopes we will perform for one of the aforementioned U.S. LNG export facility projects (approximately $140.0 million) that we are executing through a proportionately consolidated joint venture; pipe fabrication for a propane dehydrogenation unit in the U.S. (approximately $100.0 million); petroleum storage tank projects in the Middle East (approximately $90.0 million) and the U.S. (approximately $49.0 million); storage spheres in the Middle East (approximately $60.0 million); engineered products for a refinery in the Middle East (approximately $50.0 million); an ammonia storage tank project in the U.S. (approximately $40.0 million); and various other storage tank and pipe fabrication awards throughout the world.
37
Revenue—Revenue was $2.4 billion for 2015, representing a decrease of $296.3 million (10.8%) compared with 2014. Our 2015 revenue was unfavorably impacted relative to 2014 by approximately $140.0 million due to foreign currency fluctuations associated with the strengthening of the U.S. Dollar against the Australian Dollar and Canadian Dollar. Inclusive of the aforementioned foreign exchange impacts, our 2015 results were impacted by lower storage tank work in the Asia Pacific region (approximately $440.0 million), partly offset by increased engineered products activity (approximately $200.0 million).
Income from Operations—Income from operations was $225.3 million (9.2% of revenue) for 2015, compared with $274.5 million (10.0% of revenue) for 2014. Our 2015 results were impacted by lower revenue volume, a lower margin mix on our pipe fabrication backlog, net cost increases on various projects in the U.S. (approximately $30.0 million combined), and a foreign exchange loss (approximately $11.0 million) associated with the re-measurement of certain non-U.S. Dollar denominated net assets during 2015. Our 2014 results were impacted by a temporary underutilization of our pipe fabrication capacity due to customer delays (approximately $28.0 million) in the first half of 2014, and cost increases on a pipe fabrication project (approximately $24.0 million) sold in 2010 that was on hold until 2014, offset by savings on a project in the Asia Pacific region and a higher margin mix on the remaining portion of our backlog.
Technology
New Awards—New awards were $577.5 million for 2015 (including $226.0 million related to our equity method joint ventures), compared with $387.0 million for 2014. Significant new awards for 2015 included refining and petrochemical catalysts in North America and Africa and hydroprocessing licensing in the Asia Pacific region (approximately $100.0 million). Significant new awards for 2014 included refining and petrochemical catalysts and petrochemical licensing throughout the world. New awards for 2014 exclude amounts related to our unconsolidated equity method CLG joint venture, which recorded significant new awards during 2014, including hydroprocessing licensing in the Middle East (approximately $100.0 million).
Revenue—Revenue was $399.1 million for 2015, representing an increase of $14.0 million (3.6%) compared with 2014. Our 2015 results benefited from higher catalyst volume.
Income from Operations—Income from operations was $150.9 million (37.8% of revenue) for 2015, compared with $147.8 million (38.4% of revenue) for 2014. The increase in absolute dollars for 2015 was primarily attributable to a gain (approximately $7.5 million) associated with the contribution of a technology to our unconsolidated CLG joint venture during 2015, partly offset by lower equity earnings (approximately $4.0 million).
Capital Services
New Awards—New awards were $2.7 billion for 2015, compared with $3.4 billion for 2014. Significant new awards for 2015 included power plant and refinery maintenance services in the U.S. and Canada (approximately $910.0 million combined); power plant maintenance and modification services in the U.S. (approximately $200.0 million); scope increases on a chemical expansion project in the U.S. (approximately $200.0 million); refinery maintenance services in South America (approximately $120.0 million); world-wide military installation fuel services for the U.S. Federal Government (approximately $100.0 million); power plant operations and maintenance services in the U.S. (approximately $100.0 million); long-term specialty chemical maintenance services at multiple facilities in the U.S. (approximately $100.0 million); work for the Rapid Disaster Infrastructure Response Program of the U.S. Army Corps of Engineers (approximately $60.0 million); chemical plant operations and maintenance work in the U.S. (approximately $60.0 million); coking unit services in Canada (approximately $50.0 million); and site construction for a hydrotreater in the U.S. (approximately $45.0 million).
Significant new awards for 2014 included power plant services in the U.S. (approximately $800.0 million); power and petrochemical facility maintenance work in the U.S. (approximately $210.0 million combined); the extension of an environmental remediation services project in the U.S. (approximately $150.0 million); power facility modification work in the U.S. (approximately $120.0 million); chemical plant services the U.S. (approximately $110.0 million); an earthworks and soil stabilization project in the U.S. (approximately $100.0 million); fossil power facility maintenance and modification work in the U.S. (approximately $100.0 million); hydrocracker services in Europe (approximately $90.0 million); refinery maintenance and industrial services in the U.S. (approximately $65.0 million); environmental monitoring services in the U.S. (approximately $60.0 million); a support services project for the U.S. EPA; oversight of decommissioning and demolition at a DOE facility; scope increases on base operations support contracts; and increased environmental remediation work at DOD facilities.
Revenue—Revenue was $2.4 billion for 2015, representing an increase of $162.6 million (7.3%) compared with 2014. Our 2015 revenue primarily benefited from increased plant maintenance and chemical plant services revenue in the U.S.
Income from Operations—Income from operations was $74.1 million (3.1% of revenue) for 2015, compared with $81.4 million (3.7% of revenue) for 2014. The decreases in absolute dollars and as a percentage of revenue were primarily due to a lower margin mix of work and reserves established during 2015 for two uncollectible receivables (approximately $7.0 million), partly offset by higher revenue volume and continuing benefits from previously implemented cost reduction initiatives.
38
LIQUIDITY AND CAPITAL RESOURCES
General
Cash and Cash Equivalents—At December 31, 2016, our cash and cash equivalents were $505.2 million, and were maintained in local accounts throughout the world, substantially all of which were maintained outside The Netherlands, our country of domicile. With the exception of $334.5 million of cash and cash equivalents within our variable interest entities (“VIEs”) associated with our partnering arrangements, which is generally only available for use in our operating activities when distributed to the partners, we are not aware of any material restrictions on our cash and cash equivalents.
With respect to tax consequences associated with repatriating our foreign earnings, distributions from our EU subsidiaries to their Netherlands parent companies are not subject to taxation. Further, for our non-EU companies and their subsidiaries and our U.S. companies, to the extent taxes apply, the amount of permanently reinvested earnings becomes taxable upon repatriation of assets from the subsidiary or liquidation of the subsidiary. We have accrued taxes on undistributed earnings that we intend to repatriate and we intend to permanently reinvest the remaining undistributed earnings in their respective businesses, and accordingly, have accrued no taxes on such amounts.
Summary of Cash Flow Activity
Operating Activities—During 2016, net cash provided by operating activities was $654.5 million, primarily resulting from cash generated from earnings (excluding the aforementioned $655.0 million non-cash goodwill impairment charge and the non-cash impact of the aforementioned $148.1 million Transaction Receivable reserve), and a net change of $282.1 million in our accounts receivable, inventory, accounts payable and net contracts in progress account balances (collectively “Contract Capital”), partly offset by a net increase of $229.1 million in our other current and non-current assets. The components of our net Contract Capital balances at December 31, 2016 and 2015, and changes during 2016, were as follows:
December 31, | ||||||||||||
2016 | 2015 | Change | ||||||||||
(In thousands) | ||||||||||||
Total billings in excess of costs and estimated earnings (1) | $ | (1,449,335 | ) | $ | (1,934,111 | ) | $ | 484,776 | ||||
Total costs and estimated earnings in excess of billings (1) | 564,024 | 688,314 | (124,290 | ) | ||||||||
Contracts in Progress, net | (885,311 | ) | (1,245,797 | ) | 360,486 | |||||||
Accounts receivable, net | 727,659 | 1,331,217 | (603,558 | ) | ||||||||
Inventory | 194,130 | 289,658 | (95,528 | ) | ||||||||
Accounts payable | (1,105,576 | ) | (1,162,077 | ) | 56,501 | |||||||
Contract Capital, net | $ | (1,069,098 | ) | $ | (786,999 | ) | $ | (282,099 | ) | |||
(1) | Represents our cash position relative to revenue recognized on projects, with (i) billings in excess of costs and estimated earnings representing a liability reflective of future cash expenditures and non-cash earnings, and (ii) costs and estimated earnings in excess of billings representing an asset reflective of future cash receipts. |
Fluctuations in our Contract Capital balance, and its components, are not unusual in our business and are impacted by the size of our projects and changing mix of cost-reimbursable versus fixed-price backlog. Our cost-reimbursable projects tend to have a greater working capital requirement (“costs and estimated earnings in excess of billings”), while our fixed-price projects are generally structured to be cash flow positive (“billings in excess of costs and estimated earnings”). Our Contract Capital is particularly impacted by the timing of new awards and related payments in advance of performing work, and the achievement of billing milestones on backlog as we complete certain phases of work. Contract Capital is also impacted at period-end by the timing of accounts receivable collections and accounts payable payments for our large projects.
The $282.1 million decrease in our Contract Capital was primarily due to a net decrease in contracts in progress and accounts receivable and a decrease in inventory, partly offset by a decrease in accounts payable. The net decrease in contracts in progress and accounts receivable was primarily due to a change in the classification of receivables (approximately $231.0 million at December 31, 2016) from accounts receivable, net, to other non-current assets, for one of our completed large cost reimbursable projects, as we do not anticipate collection within the next year. The accounts receivable balance for the project was approximately $106.0 million at December 31, 2015. The decrease in inventory is related to our fabrication projects and the timing of awards. Our net cash provided by operating activities, combined with payments in advance of performing work for our unconsolidated equity method joint ventures, which are reflected in financing activities because the joint ventures are not consolidated, totaled approximately $801.5 million during 2016.
39
Although we anticipate future quarterly variability in our operating cash flows due to ongoing fluctuations in our Contract Capital balance, we expect cash flows from operating activities to approximate earnings for 2017, and we believe our anticipated future operating cash flows and capacity under our revolving and other credit facilities will be sufficient to finance our capital expenditures, settle our commitments and contingencies and address our working capital needs for the foreseeable future.
Investing Activities—During 2016, net cash used in investing activities was $169.3 million, primarily related to capital expenditures of $52.5 million, net advances of $49.8 million to our venture partners by our proportionately consolidated ventures (see Notes 7 and 8 within Item 8 for further discussion) and other investments of $71.8 million. We will continue to evaluate and selectively pursue other opportunities for additional expansion of our business through the acquisition of complementary businesses and technologies. These acquisitions may involve the use of cash or may require further debt or equity financing.
Financing Activities—During 2016, net cash used in financing activities was $482.2 million, primarily related to net revolving facility and other short-term repayments of $245.5 million, share repurchases totaling $206.6 million (5.8 million shares at an average price of $35.79 per share), including $198.2 million to purchase 5.5 million shares of our outstanding common stock and $8.4 million to repurchase 0.3 million shares associated with stock-based compensation-related withholding taxes on taxable share distributions, repayments on our long-term debt of $150.0 million, distributions to our noncontrolling interest partners of $74.3 million and dividends paid to our shareholders of $28.7 million. These cash outflows were partly offset by net advances from our equity method and proportionately consolidated ventures of $206.6 million (see Notes 7 and 8 within Item 8 for further discussion) and cash proceeds from the issuance of shares associated with our stock plans of $16.3 million.
Effect of Exchange Rate Changes on Cash and Cash Equivalents—During 2016, our cash and cash equivalents balance decreased by $48.1 million due to the impact of changes in functional currency exchange rates against the U.S. Dollar for non-U.S. Dollar cash balances, primarily for net changes in the Australian Dollar, British Pound and Euro exchange rates. The net unrealized loss on our cash and cash equivalents resulting from these exchange rate movements is reflected in the cumulative translation adjustment component of other comprehensive income (loss) (“OCI”). Our cash and cash equivalents held in non-U.S. Dollar currencies are used primarily for project-related and other operating expenditures in those currencies, and therefore, our exposure to realized exchange gains and losses is not anticipated to be material.
Credit Facilities and Debt
General—Our primary internal source of liquidity is cash flow generated from operations. Capacity under our revolving credit and other facilities discussed below is also available, if necessary, to fund operating or investing activities and provide necessary letters of credit. Letters of credit are generally issued to customers in the ordinary course of business to support advance payments and performance guarantees, in lieu of retention on our contracts, or in certain cases, are issued in support of our insurance programs.
Committed Facilities—We have a five-year, $1.35 billion, committed and unsecured revolving facility (the “Revolving Facility”) with Bank of America N.A. (“BofA”), as administrative agent, and BNP Paribas Securities Corp., BBVA Compass, Credit Agricole Corporate and Investment Bank (“Credit Agricole”) and TD Securities, each as syndication agents, which expires in October 2018. The Revolving Facility has a $270.0 million financial letter of credit sublimit and has financial and restrictive covenants described further below. The Revolving Facility also includes customary restrictions regarding subsidiary indebtedness, sales of assets, liens, investments, type of business conducted, and mergers and acquisitions, and includes a limitation for dividend payments and share repurchases, among other restrictions. In addition to interest on debt borrowings, we are assessed quarterly commitment fees on the unutilized portion of the facility as well as letter of credit fees on outstanding instruments. The interest, commitment fee, and letter of credit fee percentages are based upon our quarterly leverage ratio. In the event we borrow funds under the facility, interest is assessed at either prime plus an applicable floating margin (3.75% and 1.00%, respectively at December 31, 2016), or LIBOR plus an applicable floating margin (0.77% and 2.00%, respectively at December 31, 2016). At December 31, 2016, we had $100.0 million of outstanding borrowings under the facility and $78.3 million of outstanding letters of credit under the facility (none of which were financial letters of credit), providing $1.2 billion of available capacity. During 2016, our weighted average interest rate on borrowings under the facility was approximately 2.3%, inclusive of the applicable floating margin.
We have a five-year, $800.0 million, committed and unsecured revolving credit facility (the “Second Revolving Facility”) with BofA, as administrative agent, and BNP Paribas Securities Corp., BBVA Compass, Credit Agricole and Bank of Tokyo Mitsubishi UFJ, each as syndication agents, which expires in July 2020. The Second Revolving Facility supplements our Revolving Facility, has a $50.0 million financial letter of credit sublimit and has financial and restrictive covenants described further below. In addition to interest on debt borrowings, we are assessed quarterly commitment fees on the unutilized portion of the facility as well as letter of credit fees on outstanding instruments. The interest, commitment fee, and letter of credit fee percentages are based upon our quarterly leverage ratio. In the event we borrow funds under the facility, interest is assessed at
40
either prime plus an applicable floating margin (3.75% and 1.00%, respectively at December 31, 2016), or LIBOR plus an applicable floating margin (0.77% and 2.00%, respectively at December 31, 2016). At December 31, 2016, we had $157.5 million of outstanding borrowings and $7.6 million of outstanding letters of credit under the facility (including $2.8 million of financial letters of credit), providing $634.9 million of available capacity. During 2016, our weighted average interest rate on borrowings under the facility was approximately 4.3%, inclusive of the applicable floating margin.
Uncommitted Facilities—We also have various short-term, uncommitted letter of credit and borrowing facilities (the “Uncommitted Facilities”) across several geographic regions of approximately $4.6 billion, of which $563.0 million may be utilized for borrowings. At December 31, 2016, we had $150.0 million of outstanding borrowings and $1.6 billion of outstanding letters of credit under these facilities, providing $2.8 billion of available capacity, of which $413.0 million may be utilized for borrowings. During 2016, our weighted average interest rate on borrowings under the facilities was approximately 1.6%.
Term Loans—At December 31, 2016, we had $300.0 million outstanding on a four-year, $1.0 billion unsecured term loan (the “Term Loan”) with BofA as administrative agent. Interest and principal under the Term Loan is payable quarterly in arrears and bears interest at LIBOR plus an applicable floating margin (0.77% and 2.00%, respectively at December 31, 2016). However, we continue to utilize an interest rate swap to hedge against $290.4 million of the outstanding Term Loan, which resulted in a weighted average interest rate of approximately 2.3% during 2016, inclusive of the applicable floating margin. The balance of the Term Loan was paid February 13, 2017. The Term Loan has financial and restrictive covenants described further below.
At December 31, 2016, we had $500.0 million outstanding on a five-year, $500.0 million unsecured term loan (the “Second Term Loan”) with BofA as administrative agent. Interest and principal under the Second Term Loan is payable quarterly in arrears beginning in June 2017 and bears interest at LIBOR plus an applicable floating margin (rates are equivalent to the Term Loan). During 2016, our weighted average interest rate on the Second Term Loan was approximately 2.3%, inclusive of the applicable floating margin. Future annual maturities for the Second Term Loan are $56.3 million, $75.0 million, $75.0 million and $293.8 million for 2017, 2018, 2019, and 2020, respectively. The Second Term Loan has financial and restrictive covenants described further below.
Senior Notes—We have a series of senior notes totaling $800.0 million in the aggregate (the “Senior Notes”) with Merrill Lynch, Pierce, Fenner & Smith Incorporated, and Credit Agricole, as administrative agents. The Senior Notes have financial and restrictive covenants described further below. The Senior Notes include Series A through D, which contain the following terms:
• | Series A—Interest due semi-annually at a fixed rate of 4.15%, with principal of $150.0 million due in December 2017 |
• | Series B—Interest due semi-annually at a fixed rate of 4.57%, with principal of $225.0 million due in December 2019 |
• | Series C—Interest due semi-annually at a fixed rate of 5.15%, with principal of $275.0 million due in December 2022 |
• | Series D—Interest due semi-annually at a fixed rate of 5.30%, with principal of $150.0 million due in December 2024 |
We have senior notes totaling $200.0 million (the “Second Senior Notes”) with BofA as administrative agent. Interest is due semi-annually at a fixed rate of 4.53%, with principal of $200.0 million due in July 2025. The Second Senior Notes have financial and restrictive covenants described further below.
Compliance and Other—On February 24, 2017, and effective for the period ended December 31, 2016, we amended our Revolving Facility, Second Revolving Facility, Second Term Loan, Senior Notes and Second Senior Notes. The amendments adjusted our maximum leverage ratio from 3.00 to 3.50 and our minimum net worth from $1.7 billion to $1.2 billion. Our maximum leverage ratio will decrease to 3.00 on December 31, 2017, or 45 days subsequent to the closing of the sale of our Capital Services operating group (the “Closing Date”) as described in Note 18 within Item 8, if earlier. Our required fixed charge ratio remained at 1.75. The amendments also reduce our Revolving Facility from $1.4 billion to $1.2 billion at the Closing Date. Our amended restrictive covenants continue to include a twelve-month limitation of $250.0 million for dividend payments and share repurchases if our leverage ratio exceeds 1.50 (unlimited if our leverage ratio is equal to or below 1.50); however, share repurchases and acquisitions are not allowed if our leverage ratio exceeds 3.00. The amendments to our Senior Notes and Second Senior Notes also include other provisions relating to maintaining our leverage ratio and credit profile.
At December 31, 2016, we were in compliance with all our amended financial and restrictive covenants with a leverage ratio of 3.10, a fixed charge coverage ratio of 3.61, and net worth of $1.4 billion. Future compliance with our lending facilities could be impacted by circumstances or conditions beyond our control, including, but not limited to, the delay or cancellation of projects, decreased profitability on our projects, changes in currency exchange or interest rates, performance of pension plan assets, or changes in actuarial assumptions. Further, we could be impacted if our customers experience a material change in their ability to pay us or if the banks associated with our lending facilities were to cease or reduce operations, or if there is a full or partial break-up of the EU or its currency, the Euro.
41
During 2016, maximum outstanding borrowings under our revolving credit and other facilities were approximately $1.4 billion. In addition to providing letters of credit, we also issue surety bonds in the ordinary course of business to support our contract performance. At December 31, 2016, we had $826 million of outstanding surety bonds. Capitalized interest was insignificant for 2016, 2015 and 2014.
Other
Contractual Obligations—At December 31, 2016, our contractual obligations were as follows:
Payments Due by Period | ||||||||||||||||||||
(In thousands) | Total | Less than 1 Year | 1-3 Years | 3-5 Years | After 5 Years | |||||||||||||||
Senior Notes (1) | $ | 984,360 | $ | 188,413 | $ | 289,447 | $ | 44,225 | $ | 462,275 | ||||||||||
Second Senior Notes (2) | 277,765 | 9,060 | 18,120 | 18,120 | 232,465 | |||||||||||||||
Term Loan (3) | 300,941 | 300,941 | — | — | — | |||||||||||||||
Second Term Loan (4) | 538,505 | 69,711 | 170,948 | 297,846 | — | |||||||||||||||
Operating leases (5) | 386,229 | 77,923 | 114,860 | 76,430 | 117,016 | |||||||||||||||
Information technology (“IT”) obligations (6) | 50,170 | 33,309 | 16,861 | — | — | |||||||||||||||
Self-insurance obligations (7) | 16,727 | 16,727 | — | — | — | |||||||||||||||
Pension funding obligations (8) | 17,013 | 17,013 | — | — | — | |||||||||||||||
Postretirement benefit funding obligations (8) | 2,476 | 2,476 | — | — | — | |||||||||||||||
Purchase obligations (9) | — | — | — | — | — | |||||||||||||||
Unrecognized tax benefits (10) | — | — | — | — | — | |||||||||||||||
Total contractual obligations | $ | 2,574,186 | $ | 715,573 | $ | 610,236 | $ | 436,621 | $ | 811,756 | ||||||||||
(1) | Includes interest accruing on our $800.0 million Senior Notes at a weighted average fixed rate of 4.83%. |
(2) | Includes interest accruing on our $200.0 million Second Senior Notes at a fixed rate of 4.53%. |
(3) | Includes interest accruing on the remaining $300.0 million of our $1.0 billion Term Loan at a rate of 2.63%, inclusive of our interest rate swap. |
(4) | Includes interest accruing on our $500.0 million Second Term Loan at a rate of 2.77%. |
(5) | Includes approximately $4.2 million of minimum lease payments that are contractually recoverable through our cost-reimbursable projects. |
(6) | Represents commitments for IT technical support and software maintenance contracts. |
(7) | Represents expected 2017 payments associated with our self-insurance programs. Payments beyond one year have not been included as amounts are not determinable. |
(8) | Represents expected 2017 contributions to fund our defined benefit pension and other postretirement plans. Contributions beyond one year have not been included as amounts are not determinable. |
(9) | In the ordinary course of business, we enter into commitments (which are expected to be recovered from our customers) for the purchase of materials and supplies on our projects. We do not enter into long-term purchase commitments on a speculative basis for fixed or minimum quantities. |
(10) | Payments for income tax reserves of $14.2 million are not included as the timing of specific tax payments is not determinable. |
Other—We believe our cash on hand, cash generated from operations, amounts available under our Revolving Facility and Second Revolving Facility (collectively, “Committed Facilities”) and Uncommitted Facilities, and other external sources of liquidity, such as the issuance of debt and equity instruments, will be sufficient to finance our capital expenditures, settle our commitments and contingencies (as more fully described in Note 12 within Item 8) and address our working capital needs for the foreseeable future. However, there can be no assurance that such funding will continue to be available, as our ability to generate cash flows from operations, our ability to access funding under our Committed Facilities and Uncommitted Facilities at reasonable terms, and our ability to comply with financial and restrictive covenants may be impacted by a variety of business, economic, legislative, financial and other factors, which may be outside of our control.
42
Additionally, while we currently have significant uncommitted bonding facilities, primarily to support various commercial provisions in our contracts, a termination or reduction of these bonding facilities could result in the utilization of letters of credit in lieu of performance bonds, thereby reducing the available capacity under the Committed Facilities. Although we do not anticipate a reduction or termination of the bonding facilities, there can be no assurance that such facilities will continue to be available at reasonable terms to service our ordinary course obligations.
A portion of our pension plans’ assets are invested in EU government securities, which could be impacted by economic turmoil in Europe or a full or partial break-up of the EU or its currency, the Euro. However, given the long-term nature of pension funding requirements, in the event any of our pension plans (including those with investments in EU government securities) become materially underfunded from a decline in value of our plan assets, we believe our cash on hand and amounts available under our existing Committed Facilities and Uncommitted Facilities would be sufficient to fund any increases in future contribution requirements. See Note 11 within Item 8 for further discussion of our pension plan assets.
We are a defendant in a number of lawsuits arising in the normal course of business and we have in place appropriate insurance coverage for the type of work that we perform. As a matter of standard policy, we review our litigation accrual quarterly and as further information is known on pending cases, increases or decreases, as appropriate, may be recorded. See Note 12 within Item 8 for a discussion of pending litigation.
OFF-BALANCE SHEET ARRANGEMENTS
We use operating leases for facilities and equipment when they make economic sense, including sale-leaseback arrangements. Our sale-leaseback arrangements are not material to our Financial Statements, and we have no other significant off-balance sheet arrangements.
NEW ACCOUNTING STANDARDS
See the applicable section of Note 2 within Item 8 for a discussion of new accounting standards.
CRITICAL ACCOUNTING ESTIMATES
The discussion and analysis of our financial condition and results of operations are based upon our Financial Statements, which have been prepared in accordance with accounting principles generally accepted in the United States of America. The preparation of these Financial Statements requires us to make estimates and judgments that affect the reported amounts of assets, liabilities, revenue and expenses and related disclosures of contingent assets and liabilities. We continually evaluate our estimates based upon historical experience and various other assumptions that we believe to be reasonable under the circumstances. Our management has discussed the development and selection of our critical accounting estimates with the Audit Committee of our Supervisory Board. Actual results may differ from these estimates under different assumptions or conditions. We believe the following critical accounting policies affect our more significant judgments and estimates used in the preparation of our Financial Statements.
Revenue Recognition
Our revenue is primarily derived from long-term contracts and is generally recognized using the percentage of completion (“POC”) method, primarily based on the percentage that actual costs-to-date bear to total estimated costs to complete each contract. We follow the guidance of Financial Accounting Standards Board (“FASB”) Accounting Standards Codification (“ASC”) Revenue Recognition Topic 605-35 for accounting policies relating to our use of the POC method, estimating costs, and revenue recognition, including the recognition of incentive fees, unapproved change orders and claims, and combining and segmenting contracts. We primarily utilize the cost-to-cost approach to estimate POC as we believe this method is less subjective than relying on assessments of physical progress. Under the cost-to-cost approach, the use of estimated costs to complete each contract is a significant variable in the process of determining recognized revenue and is a significant factor in the accounting for contracts. Significant estimates that impact the cost to complete each contract are costs of engineering, materials, components, equipment, labor and subcontracts; labor productivity; schedule durations, including subcontractor or supplier progress; liquidated damages; contract disputes, including claims; achievement of contractual performance requirements; and contingency, among others. The cumulative impact of revisions in total cost estimates during the progress of work is reflected in the period in which these changes become known, including, to the extent required, the reversal of profit recognized in prior periods and the recognition of losses expected to be incurred on contracts in progress. Due to the various estimates inherent in our contract accounting, actual results could differ from those estimates. See Note 16 within Item 8 for discussion of projects with significant changes in estimated margins during 2016, 2015 and 2014.
Our long-term contracts are awarded on a competitively bid and negotiated basis and the timing of revenue recognition may be impacted by the terms of such contracts. We use a range of contracting options, including cost-reimbursable, fixed-price and hybrid, which has both cost-reimbursable and fixed-price characteristics. Fixed-price contracts, and hybrid contracts with a more significant fixed-price component, tend to provide us with greater control over project schedule and the timing of when work is performed and costs are incurred, and accordingly, when revenue is recognized. Cost-reimbursable contracts, and
43
hybrid contracts with a more significant cost-reimbursable component, generally provide our customers with greater influence over the timing of when we perform our work, and accordingly, such contracts often result in less predictability with respect to the timing of revenue recognition. Contract revenue for our long-term contracts recognized under the POC method reflects the original contract price adjusted for approved change orders and estimated recoveries for incentive fees, unapproved change orders and claims. We recognize revenue associated with incentive fees when the value can be reliably estimated and recovery is probable. We recognize revenue associated with unapproved change orders and claims to the extent the related costs have been incurred, the value can be reliably estimated and recovery is probable. Our recorded incentive fees, unapproved change orders and claims reflect our best estimate of recovery amounts; however, the ultimate resolution and amounts received could differ from these estimates. See Note 16 within Item 8 for additional discussion of our recorded unapproved change orders, claims and incentives.
With respect to our EPC services, our contracts are not segmented between types of services, such as engineering and construction, if each of the EPC components is negotiated concurrently or if the pricing of any such services is subject to the ultimate negotiation and agreement of the entire EPC contract. However, an EPC contract including technology or fabrication services may be segmented if we satisfy the segmenting criteria in ASC 605-35. Revenue recorded in these situations is based on our prices and terms for similar services to third party customers. Segmenting a contract may result in different interim rates of profitability for each scope of service than if we had recognized revenue without segmenting. In some instances, we may combine contracts that are entered into in multiple phases, but are interdependent and include pricing considerations by us and the customer that are impacted by all phases of the project. Otherwise, if each phase is independent of the other and pricing considerations do not give effect to another phase, the contracts will not be combined.
Cost of revenue for our long-term contracts includes direct contract costs, such as materials and labor, and indirect costs that are attributable to contract activity. The timing of when we bill our customers is generally dependent upon advance billing terms, milestone billings based on the completion of certain phases of the work, or when services are provided. Projects with costs and estimated earnings recognized to date in excess of cumulative billings is reported on the Balance Sheet as costs and estimated earnings in excess of billings. Projects with cumulative billings in excess of costs and estimated earnings recognized to date is reported on the Balance Sheet as billings in excess of costs and estimated earnings. Any uncollected billed amounts, including contract retentions, are reported as accounts receivable.
Revenue for our service contracts that do not satisfy the criteria for revenue recognition under the POC method is recorded at the time services are performed. Revenue associated with incentive fees for these contracts is recognized when earned. Unbilled receivables for our service contracts are recorded within accounts receivable.
Revenue for our pipe and steel fabrication and catalyst manufacturing contracts that are independent of an EPC contract, or for which we satisfy the segmentation criteria discussed above, is recognized upon shipment of the fabricated or manufactured units. During the fabrication or manufacturing process, all related direct and allocable indirect costs are capitalized as work in process inventory and such costs are recorded as cost of revenue at the time of shipment.
Goodwill
Goodwill Summary and Reporting Units—At December 31, 2016, our goodwill balance was $3.0 billion. Goodwill is not amortized to earnings, but instead is reviewed for impairment at least annually at a reporting unit level, absent any indicators of impairment or when other actions require an impairment assessment (such as a change in reporting units). We perform our annual impairment assessment during the fourth quarter of each year based upon balances as of October 1. At October 1, 2016, we had the following five reporting units within our four operating groups:
• | Engineering & Construction—Our Engineering & Construction operating group represents a reporting unit. |
• | Fabrication Services—Our Fabrication Services operating group represents a reporting unit. As of December 31, 2015, Fabrication Services included three reporting units: Steel Plate Structures, Fabrication & Manufacturing, and Engineered Products. However, during the third quarter 2016, our Steel Plate Structures, Fabrication & Manufacturing and Engineered Products operations were integrated and operationally combined. As a result, we reevaluated our reporting units within the Fabrication Services operating group and determined that the Fabrication Services operating group represented a single reporting unit subsequent to the reorganization. In conjunction with the reorganization of our Fabrication Services operating group and change in reporting units, we performed a quantitative assessment of goodwill for each of the reporting units immediately before the change in reporting units, and for the new Fabrication Services reporting unit. Based on these quantitative assessments, the fair value of each of the reporting units exceeded their respective net book values, and accordingly, no impairment charge was necessary as a result of the change in reporting units. |
• | Technology—Our Technology operating group represents a reporting unit. |
• | Capital Services—Our Capital Services operating group includes two reporting units: Facilities & Plant Services and Federal Services. |
44
Annual Impairment Assessment—As part of our annual goodwill impairment assessment during the fourth quarter 2016, we performed a quantitative assessment of goodwill for each of the aforementioned reporting units as of October 1, 2016. Based on these quantitative assessments, the fair value of our Engineering & Construction, Fabrication Services and Technology reporting units each substantially exceeded their respective net book values, and accordingly, no impairment charge was necessary for these reporting units as a result of our annual impairment assessment. However, we determined that the net book value of the Facilities & Plant Services and Federal Services reporting units each exceeded their respective fair values, indicating that the carrying value of their goodwill was impaired. Our fair value determination for the Facilities & Plant Services and Federal Services reporting units gave consideration to a market indicator of fair value for the reporting units as discussed further in Note 18 within Item 8. As a result of the aforementioned, we recorded a goodwill impairment charge of $655.0 million for these reporting units ($581.9 million for Facilities & Plant Services and $73.1 million for Federal Services). Accordingly, at December 31, 2016, the adjusted carrying value of goodwill for the Facilities & Plant Services and Federal Services reporting units was approximately $112.9 million and $116.7 million, respectively. The amount of goodwill impairment charge was determined by comparing the carrying value of each reporting unit’s goodwill to their respective implied fair values. The fair values of the Facilities & Plant Services and Federal Services reporting units approximated their respective net book values subsequent to the goodwill impairments. If, based on future assessments our goodwill is deemed to be impaired, the impairment would result in a charge to earnings in the period of impairment.
Determination of Reporting Unit Fair Values—To determine the fair value of our reporting units and test for impairment, we utilized an income approach (discounted cash flow method) as we believe this is the most direct approach to incorporate the specific economic attributes and risk profiles of our reporting units into our valuation model. This is consistent with the methodology used to determine the fair value of our reporting units in previous years. We generally do not utilize a market approach given the lack of relevant information generated by market transactions involving comparable businesses. However, to the extent market indicators of fair value become available, we consider such market indicators in our discounted cash flow analysis and determination of fair value. The discounted cash flow methodology is based, to a large extent, on assumptions about future events, which may or may not occur as anticipated, and such deviations could have a significant impact on the calculated estimated fair values of our reporting units. These assumptions include, but are not limited to, estimates of discount rates, future growth rates, and terminal values for each reporting unit. The discounted cash flow analysis for our realigned reporting units tested in the third quarter 2016, and all reporting units tested in the fourth quarter 2016, included forecasted cash flows over a seven-year forecast period (2017 through 2023), with our 2017 business plan used as the basis for our 2017 projections. These forecasted cash flows took into consideration historical and recent results, the reporting unit’s backlog and near term prospects, and management’s outlook for the future. A terminal value was also calculated using a terminal value growth assumption to derive the annual cash flows after the discrete forecast period. A reporting unit specific discount rate was applied to the forecasted cash flows and terminal cash flows to determine the discounted future cash flows, or fair value, of each reporting unit. Further, for our Facilities & Plant Services and Federal Services reporting units, our fair value estimates were adjusted to give effect to the aforementioned market indicator of fair value discussed further in Note 18 within Item 8.
See Note 6 within Item 8 for further discussion regarding goodwill.
Other Long-Lived Assets
We amortize our finite-lived intangible assets on a straight-line basis with lives ranging from 4 to 20 years, absent any indicators of impairment. We review tangible assets and finite-lived intangible assets for impairment when events or changes in circumstances indicate that the carrying amount may not be recoverable. If a recoverability assessment is required, the estimated future cash flow associated with the asset or asset group will be compared to the asset’s carrying amount to determine if an impairment exists. As a result of the partial impairment of goodwill for our Capital Services operating group resulting from our fourth quarter annual impairment assessment discussed further in Note 6 within Item 8, we determined that an indicator of impairment existed for the finite-lived intangible assets of our Capital Services operating group, and accordingly, we performed an impairment assessment for these intangible assets during the fourth quarter 2016. Based on our impairment assessment, we concluded that the intangible assets were not impaired. We noted no other indicators of impairment during 2016. See Note 6 within Item 8 for further discussion of our intangible assets.
Income Taxes
Deferred tax assets and liabilities are recognized for the future tax consequences attributable to differences between the financial statement carrying amounts of existing assets and liabilities and their respective tax basis using currently enacted income tax rates for the years in which the differences are expected to reverse. A valuation allowance is provided to offset any net deferred tax assets (“DTA(s)”) if, based upon the available evidence, it is more likely than not that some or all of the DTAs will not be realized. The realization of our net DTAs depends upon our ability to generate sufficient future taxable income of the appropriate character and in the appropriate jurisdictions.
45
On a periodic and ongoing basis we evaluate our DTAs and assess the appropriateness of our valuation allowances (“VA”). In assessing the need for a VA, we consider both positive and negative evidence related to the likelihood of realization of the DTAs. If, based on the weight of available evidence, our assessment indicates that it is more likely than not that a DTA will not be realized, we record a VA. Our assessments include, among other things, the value and quality of our backlog, evaluations of existing and anticipated market conditions, analysis of recent and historical operating results and projections of future results, strategic plans and alternatives for associated operations, as well as asset expiration dates, where applicable. If the factors upon which we based our assessment of realizability of our DTAs differ materially from our expectations, including future operating results being lower than our current estimates, our future assessments could be impacted and result in an increase in VA and increase in tax expense.
At December 31, 2016, our net DTAs associated with Non-U.S. net operating losses (“NOLs”), U.S.-Federal NOLs, U.S.-State NOLs, and foreign tax credits and other tax credits totaled $31.6 million, $548.6 million, $56.2 million, and $57.3 million, respectively. We believe that it is more likely than not that our DTAs will be realized.
Income tax and associated interest and penalty reserves, where applicable, are recorded in those instances where we consider it more likely than not that additional tax will be due in excess of amounts reflected in income tax returns filed worldwide, irrespective of whether or not we have received tax assessments. At December 31, 2016 and 2015, our reserves totaled approximately $14.2 million and $9.1 million, respectively. If these income tax reserves are ultimately unnecessary, approximately $11.0 million and $6.0 million, respectively, would benefit tax expense as we are contractually indemnified for the remaining balances. We continually review our exposure to additional income tax obligations and, as further information is known or events occur, changes in our tax and interest reserves may be recorded within income tax expense and interest expense, respectively.
Insurance
We maintain insurance coverage for various aspects of our business and operations. However, we retain a portion of anticipated losses through the use of deductibles and self-insured retentions for our exposures related to third party liability and workers’ compensation. We regularly review estimates of reported and unreported claims through analysis of historical and projected trends, in conjunction with actuaries and other consultants, and provide for losses through insurance reserves. As claims develop and additional information becomes available, adjustments to loss reserves may be required. If actual results are not consistent with our assumptions, we may be exposed to gains or losses that could be material. A hypothetical ten percent change in our self-insurance reserves at December 31, 2016 would have impacted our pre-tax income by approximately $10.4 million for 2016.
Partnering Arrangements
In the ordinary course of business, we execute specific projects and conduct certain operations through joint venture, consortium and other collaborative arrangements (collectively referred to as “venture(s)”). We have various ownership interests in these ventures, with such ownership typically proportionate to our decision making and distribution rights. The ventures generally contract directly with the third party customer; however, services may be performed directly by the ventures, or may be performed by us, our partners, or a combination thereof.
Venture net assets consist primarily of working capital and property and equipment, and assets may be restricted from being used to fund obligations outside of the venture. These ventures typically have limited third party debt or have debt that is non-recourse in nature; however, they may provide for capital calls to fund operations or require participants in the venture to provide additional financial support, including advance payment or retention letters of credit.
Each venture is assessed at inception and on an ongoing basis as to whether it qualifies as a VIE under the consolidations guidance in ASC 810. A venture generally qualifies as a VIE when it (1) meets the definition of a legal entity, (2) absorbs the operational risk of the projects being executed, creating a variable interest, and (3) lacks sufficient capital investment from the partners, potentially resulting in the venture requiring additional subordinated financial support, if necessary, to finance its future activities.
If at any time a venture qualifies as a VIE, we perform a qualitative assessment to determine whether we are the primary beneficiary of the VIE and, therefore, need to consolidate the VIE. We are the primary beneficiary if we have (1) the power to direct the economically significant activities of the VIE and (2) the right to receive benefits from, and obligation to absorb losses of, the VIE. If the venture is a VIE and we are the primary beneficiary, or we otherwise have the ability to control the venture, we consolidate the venture. If we are not determined to be the primary beneficiary of the VIE, or only have the ability to significantly influence, rather than control the venture, we do not consolidate the venture. We account for unconsolidated ventures using either proportionate consolidation for both the Balance Sheet and Statement of Operations, when we meet the applicable accounting criteria to do so, or the equity method. See Note 7 within Item 8 for additional discussion of our material partnering arrangements.
46
Financial Instruments
We utilize derivative instruments in certain circumstances to mitigate the effects of changes in foreign currency exchange rates and interest rates, as described below:
• | Foreign Currency Exchange Rate Derivatives—We do not engage in currency speculation; however, we utilize foreign currency exchange rate derivatives on an ongoing basis to hedge against certain foreign currency related operating exposures. We generally seek hedge accounting treatment for contracts used to hedge operating exposures and designate them as cash flow hedges. Therefore, gains and losses, exclusive of credit risk and forward points (which represent the time value component of the fair value of our derivative positions), are included in accumulated other comprehensive income (“AOCI”) until the associated underlying operating exposure impacts our earnings. Changes in the fair value of (1) credit risk and forward points, (2) instruments deemed ineffective during the period, and (3) instruments that we do not designate as cash flow hedges are recognized within cost of revenue. |
• | Interest Rate Derivatives—At December 31, 2016, we continued to utilize a swap arrangement to hedge against interest rate variability associated with $290.4 million of our outstanding $300.0 million Term Loan. The swap arrangement has been designated as a cash flow hedge as its critical terms matched those of the Term Loan at inception and through December 31, 2016. Accordingly, changes in the fair value of the swap arrangement are included in AOCI until the associated underlying exposure impacts our earnings. |
See Note 10 within Item 8 for additional discussion of our financial instruments.
Item 7A. Quantitative and Qualitative Disclosures About Market Risk
Foreign Currency Risk—We are exposed to market risk associated with changes in foreign currency exchange rates, which may adversely affect our results of operations, financial condition and cash flows.
One form of exposure to fluctuating exchange rates relates to the effects of translating financial statements of entities with functional currencies other than the U.S. Dollar into our reporting currency. With respect to the translation of our balance sheet, net movements in the Australian Dollar, British Pound, and Euro exchange rates against the U.S. Dollar unfavorably impacted the cumulative translation adjustment component of AOCI by approximately $55.3 million, net of tax, and our cash balance was unfavorably impacted by approximately $48.1 million. We generally do not hedge our exposure to potential foreign currency translation adjustments.
Another form of exposure to fluctuating exchange rates relates to the effects of transacting in currencies other than those of our entity’s functional currencies. We do not engage in currency speculation; however, we utilize foreign currency exchange rate derivatives on an ongoing basis to hedge against certain foreign currency related operating exposures. We generally seek hedge accounting treatment for contracts used to hedge operating exposures and designate them as cash flow hedges. Therefore, gains and losses, exclusive of credit risk and forward points (which represent the time value component of the fair value of our derivative positions), are included in AOCI until the associated underlying operating exposure impacts our earnings. Changes in the fair value of (1) credit risk and forward points, (2) instruments deemed ineffective during the period, and (3) instruments that we do not designate as cash flow hedges are recognized within cost of revenue and were not material during 2016.
At December 31, 2016, the notional value of our outstanding forward contracts to hedge certain foreign currency exchange-related operating exposures was $139.1 million, including net foreign currency exchange rate exposure associated with the purchase of U.S. Dollars ($74.9 million), Thai Baht ($24.0 million), Japanese Yen ($17.6 million), and Kuwaiti Dinars ($3.4 million) and the sale of Euros ($19.2 million). The total fair value of these contracts was a net liability of approximately $3.1 million at December 31, 2016. The potential change in fair value for our outstanding contracts resulting from a hypothetical ten percent change in quoted foreign currency exchange rates would have been approximately $6.3 million and $2.5 million at December 31, 2016 and 2015, respectively. This potential change in fair value of our outstanding contracts would be offset by the change in fair value of the associated underlying operating exposures.
Interest Rate Risk—At December 31, 2016, we continued to utilize an interest rate swap to hedge against interest rate variability associated with $290.4 million of our outstanding $300.0 million Term Loan. The swap arrangement has been designated as a cash flow hedge as its critical terms matched those of the Term Loan at inception and through December 31, 2016. Accordingly, changes in the fair value of the interest rate swap are recognized in AOCI. The total fair value of the contract was a net asset of approximately $0.1 million at December 31, 2016. The potential change in fair value for our interest rate swap resulting from a hypothetical one percent change in the LIBOR rate would have been approximately $0.1 million and $2.8 million at December 31, 2016 and 2015, respectively.
47
Other—The carrying values of our accounts receivable and accounts payable approximate their fair values because of the short-term nature of these instruments. At December 31, 2016, the fair values of our Term Loan and Second Term Loan, based on current market rates for debt with similar credit risk and maturities, approximated their carrying values as interest is based upon LIBOR plus an applicable floating margin. Our Senior Notes and Second Senior Notes are categorized within level 2 of the valuation hierarchy. Our Senior Notes had a total fair value of approximately $785.7 million and $772.6 million at December 31, 2016 and 2015, respectively, based on current market rates for debt with similar credit risk and maturities. Our Second Senior Notes had a total fair value of approximately $206.4 million and $203.5 million at December 31, 2016 and 2015, respectively, based on current market rates for debt with similar credit risk and maturities. See Note 10 within Item 8 for additional discussion of our financial instruments.
48
Item 8. Financial Statements and Supplementary Data
Table of Contents
Page | |
49
MANAGEMENT’S REPORT ON INTERNAL CONTROL OVER FINANCIAL REPORTING
Our management is responsible for establishing and maintaining adequate internal controls over financial reporting, as such term is defined in Exchange Act Rule 13a-15(f). Our internal control over financial reporting is a process designed to provide reasonable assurance regarding the reliability of financial reporting and the preparation of financial statements for external purposes in accordance with accounting principles generally accepted in the United States of America. Included in our system of internal control are written policies, an organizational structure providing division of responsibilities, the selection and training of qualified personnel and a program of financial and operations reviews by our professional staff of corporate auditors.
Our internal control over financial reporting includes those policies and procedures that (i) pertain to the maintenance of records that, in reasonable detail, accurately and fairly reflect the underlying transactions, including the acquisition and disposition of assets; (ii) provide reasonable assurance that our assets are safeguarded and transactions are executed in accordance with management’s and our directors’ authorization and are recorded as necessary to permit preparation of our Financial Statements in accordance with generally accepted accounting principles; and (iii) provide reasonable assurance regarding prevention or timely detection of unauthorized acquisition, use, or disposition of our assets that could have a material effect on our Financial Statements.
Under the supervision and with the participation of our management, including our principal executive officer and principal financial officer, we conducted an evaluation of the effectiveness of our internal control over financial reporting. Our evaluation was based on the framework in Internal Control – Integrated Framework (2013 Framework) issued by the Committee of Sponsoring Organizations of the Treadway Commission (the COSO criteria).
Based on our evaluation utilizing the COSO criteria, our principal executive officer and principal financial officer concluded our internal control over financial reporting was effective as of December 31, 2016. The conclusion of our principal executive officer and principal financial officer is based upon the recognition that there are inherent limitations in all systems of internal control, including the possibility of human error and the circumvention or overriding of controls. Due to its inherent limitations, internal control over financial reporting may not prevent or detect misstatements. Also, projections of any evaluation of effectiveness to future periods are subject to the risk that controls may become inadequate because of changes in conditions, or that the degree of compliance with the policies or procedures may deteriorate.
Our internal control over financial reporting as of December 31, 2016 has been audited by Ernst & Young LLP, an independent registered public accounting firm, as stated in their report which is included herein.
/s/ Philip K. Asherman | /s/ Michael S. Taff | |
Philip K. Asherman | Michael S. Taff | |
President and | Executive Vice President and | |
Chief Executive Officer | Chief Financial Officer | |
February 28, 2017
50
REPORT OF INDEPENDENT REGISTERED PUBLIC ACCOUNTING FIRM
The Supervisory Board and Shareholders of
Chicago Bridge & Iron Company N.V.
We have audited Chicago Bridge & Iron Company N.V.’s internal control over financial reporting as of December 31, 2016, based on criteria established in Internal Control—Integrated Framework issued by the Committee of Sponsoring Organizations of the Treadway Commission (2013 Framework) (the COSO criteria). Chicago Bridge & Iron Company N.V.’s management is responsible for maintaining effective internal control over financial reporting, and for its assessment of the effectiveness of internal control over financial reporting included in the accompanying “Management’s Report on Internal Control Over Financial Reporting.” Our responsibility is to express an opinion on the company’s internal control over financial reporting based on our audit.
We conducted our audit in accordance with the standards of the Public Company Accounting Oversight Board (United States). Those standards require that we plan and perform the audit to obtain reasonable assurance about whether effective internal control over financial reporting was maintained in all material respects. Our audit included obtaining an understanding of internal control over financial reporting, assessing the risk that a material weakness exists, testing and evaluating the design and operating effectiveness of internal control based on the assessed risk, and performing such other procedures as we considered necessary in the circumstances. We believe that our audit provides a reasonable basis for our opinion.
A company’s internal control over financial reporting is a process designed to provide reasonable assurance regarding the reliability of financial reporting and the preparation of financial statements for external purposes in accordance with generally accepted accounting principles. A company’s internal control over financial reporting includes those policies and procedures that (1) pertain to the maintenance of records that, in reasonable detail, accurately and fairly reflect the transactions and dispositions of the assets of the company; (2) provide reasonable assurance that transactions are recorded as necessary to permit preparation of financial statements in accordance with generally accepted accounting principles, and that receipts and expenditures of the company are being made only in accordance with authorizations of management and directors of the company; and (3) provide reasonable assurance regarding prevention or timely detection of unauthorized acquisition, use or disposition of the company’s assets that could have a material effect on the financial statements.
Because of its inherent limitations, internal control over financial reporting may not prevent or detect misstatements. Also, projections of any evaluation of effectiveness to future periods are subject to the risk that controls may become inadequate because of changes in conditions, or that the degree of compliance with the policies or procedures may deteriorate.
In our opinion, Chicago Bridge & Iron Company N.V. maintained, in all material respects, effective internal control over financial reporting as of December 31, 2016, based on the COSO criteria.
We also have audited, in accordance with the standards of the Public Company Accounting Oversight Board (United States), the consolidated balance sheets of Chicago Bridge & Iron Company N.V. as of December 31, 2016 and 2015, and the related consolidated statements of operations, comprehensive income, changes in shareholders’ equity and cash flows for each of the three years in the period ended December 31, 2016 and our report dated February 28, 2017, expressed an unqualified opinion thereon.
/s/ Ernst & Young LLP
Houston, Texas
February 28, 2017
51
REPORT OF INDEPENDENT REGISTERED PUBLIC ACCOUNTING FIRM
The Supervisory Board and Shareholders of
Chicago Bridge & Iron Company N.V.
We have audited the accompanying consolidated balance sheets of Chicago Bridge & Iron Company N.V. as of December 31, 2016 and 2015, and the related consolidated statements of operations, comprehensive income, changes in shareholders’ equity, and cash flows for each of the three years in the period ended December 31, 2016. These financial statements are the responsibility of the Company’s management. Our responsibility is to express an opinion on these financial statements based on our audits.
We conducted our audits in accordance with the standards of the Public Company Accounting Oversight Board (United States). Those standards require that we plan and perform the audit to obtain reasonable assurance about whether the financial statements are free of material misstatement. An audit includes examining, on a test basis, evidence supporting the amounts and disclosures in the financial statements. An audit also includes assessing the accounting principles used and significant estimates made by management, as well as evaluating the overall financial statement presentation. We believe that our audits provide a reasonable basis for our opinion.
In our opinion, the financial statements referred to above present fairly, in all material respects, the consolidated financial position of Chicago Bridge & Iron Company N.V. at December 31, 2016 and 2015, and the consolidated results of its operations and its cash flows for each of the three years in the period ended December 31, 2016, in conformity with U.S. generally accepted accounting principles.
We also have audited, in accordance with the standards of the Public Company Accounting Oversight Board (United States), Chicago Bridge & Iron Company N.V.’s internal control over financial reporting as of December 31, 2016, based on criteria established in Internal Control – Integrated Framework issued by the Committee of Sponsoring Organizations of the Treadway Commission (2013 Framework) and our report dated February 28, 2017, expressed an unqualified opinion thereon.
/s/ Ernst & Young LLP
Houston, Texas
February 28, 2017
52
CHICAGO BRIDGE & IRON COMPANY N.V.
CONSOLIDATED STATEMENTS OF OPERATIONS
Years Ended December 31, | |||||||||||
2016 | 2015 | 2014 | |||||||||
(In thousands, except per share data) | |||||||||||
Revenue | $ | 10,679,558 | $ | 12,929,504 | $ | 12,974,930 | |||||
Cost of revenue | 9,653,502 | 11,417,188 | 11,508,521 | ||||||||
Gross profit | 1,026,056 | 1,512,316 | 1,466,409 | ||||||||
Selling and administrative expense | 349,874 | 387,027 | 405,208 | ||||||||
Intangibles amortization | 42,439 | 57,625 | 66,506 | ||||||||
Equity earnings | (26,826 | ) | (15,689 | ) | (25,225 | ) | |||||
Goodwill impairment (Note 6) | 655,000 | 453,100 | — | ||||||||
Loss on net assets sold and intangible assets impairment (Note 4) | 148,148 | 1,052,751 | — | ||||||||
Other operating expense (income), net | 2,339 | 2,619 | (2,373 | ) | |||||||
Integration related costs | — | — | 39,685 | ||||||||
(Loss) income from operations | (144,918 | ) | (425,117 | ) | 982,608 | ||||||
Interest expense | (105,349 | ) | (94,360 | ) | (83,590 | ) | |||||
Interest income | 13,004 | 8,285 | 8,524 | ||||||||
(Loss) income before taxes | (237,263 | ) | (511,192 | ) | 907,542 | ||||||
Income tax (expense) benefit | (2,560 | ) | 81,231 | (271,417 | ) | ||||||
Net (loss) income | (239,823 | ) | (429,961 | ) | 636,125 | ||||||
Less: Net income attributable to noncontrolling interests | (73,346 | ) | (74,454 | ) | (92,518 | ) | |||||
Net (loss) income attributable to CB&I | $ | (313,169 | ) | $ | (504,415 | ) | $ | 543,607 | |||
Net (loss) income attributable to CB&I per share: | |||||||||||
Basic | $ | (3.05 | ) | $ | (4.72 | ) | $ | 5.03 | |||
Diluted | $ | (3.05 | ) | $ | (4.72 | ) | $ | 4.98 | |||
Cash dividends on shares: | |||||||||||
Amount | $ | 28,733 | $ | 29,847 | $ | 30,246 | |||||
Per share | $ | 0.28 | $ | 0.28 | $ | 0.28 | |||||
The accompanying Notes are an integral part of these Consolidated Financial Statements.
53
CHICAGO BRIDGE & IRON COMPANY N.V.
CONSOLIDATED STATEMENTS OF COMPREHENSIVE INCOME
Years Ended December 31, | |||||||||||
2016 | 2015 | 2014 | |||||||||
(In thousands) | |||||||||||
Net (loss) income | $ | (239,823 | ) | $ | (429,961 | ) | $ | 636,125 | |||
Other comprehensive (loss) income, net of tax: | |||||||||||
Change in cumulative translation adjustment (net of tax of ($3,884), $960 and ($43)) | (56,097 | ) | (78,128 | ) | (99,391 | ) | |||||
Change in unrealized fair value of cash flow hedges (net of tax of ($475), ($678) and $1,171) | 754 | 1,746 | (4,484 | ) | |||||||
Change in unrecognized prior service pension credits/costs (net of tax of $200, $316 and ($730)) | (516 | ) | (819 | ) | 2,354 | ||||||
Change in unrecognized actuarial pension gains/losses (net of tax of $15,184, ($17,445) and $22,793) | (46,533 | ) | 42,924 | (53,127 | ) | ||||||
Comprehensive (loss) income | (342,215 | ) | (464,238 | ) | 481,477 | ||||||
Net income attributable to noncontrolling interests (net of tax of $0, ($124) and ($2,877)) | (73,346 | ) | (74,454 | ) | (92,518 | ) | |||||
Change in cumulative translation adjustment attributable to noncontrolling interests (net of tax of $0, $0 and $0) | 816 | 2,634 | 12,184 | ||||||||
Comprehensive (loss) income attributable to CB&I | $ | (414,745 | ) | $ | (536,058 | ) | $ | 401,143 | |||
The accompanying Notes are an integral part of these Consolidated Financial Statements.
54
CHICAGO BRIDGE & IRON COMPANY N.V.
CONSOLIDATED BALANCE SHEETS
December 31, | |||||||
2016 | 2015 | ||||||
(In thousands) | |||||||
Assets | |||||||
Cash and cash equivalents ($334,539 and $410,989 related to variable interest entities ("VIEs")) | $ | 505,156 | $ | 550,221 | |||
Accounts receivable, net ($59,690 and $334,232 related to VIEs) | 727,659 | 1,331,217 | |||||
Inventory (Note 5) | 194,130 | 289,658 | |||||
Costs and estimated earnings in excess of billings ($46,934 and $28,130 related to VIEs) (Note 2) | 564,024 | 688,314 | |||||
Other current assets ($426,537 and $372,523 related to VIEs) (Note 8) | 550,783 | 507,889 | |||||
Total current assets | 2,541,752 | 3,367,299 | |||||
Equity investments (Note 7) | 175,277 | 136,845 | |||||
Property and equipment, net (Note 8) | 565,690 | 604,043 | |||||
Goodwill (Note 6) | 3,043,410 | 3,711,506 | |||||
Other intangibles, net (Note 6) | 367,849 | 410,949 | |||||
Deferred income taxes (Note 15) | 730,108 | 633,627 | |||||
Other non-current assets | 415,334 | 327,791 | |||||
Total assets | $ | 7,839,420 | $ | 9,192,060 | |||
Liabilities | |||||||
Revolving facility and other short-term borrowings (Note 9) | $ | 407,500 | $ | 653,000 | |||
Current maturities of long-term debt, net (Note 9) | 503,910 | 147,871 | |||||
Accounts payable ($339,573 and $405,853 related to VIEs) | 1,105,576 | 1,162,077 | |||||
Billings in excess of costs and estimated earnings ($415,462 and $846,180 related to VIEs) (Note 2) | 1,449,335 | 1,934,111 | |||||
Other current liabilities (Note 8) | 1,069,928 | 959,889 | |||||
Total current liabilities | 4,536,249 | 4,856,948 | |||||
Long-term debt, net (Note 9) | 1,287,923 | 1,791,832 | |||||
Deferred income taxes (Note 15) | 7,307 | 10,239 | |||||
Other non-current liabilities (Note 8) | 446,604 | 369,451 | |||||
Total liabilities | 6,278,083 | 7,028,470 | |||||
Commitments and contingencies (Note 12) | — | — | |||||
Shareholders’ Equity | |||||||
Common stock, Euro .01 par value; shares authorized: 250,000; shares issued: 108,857 and 108,857; shares outstanding: 100,113 and 104,427 | 1,288 | 1,288 | |||||
Additional paid-in capital | 782,130 | 800,641 | |||||
Retained earnings | 1,370,606 | 1,712,508 | |||||
Treasury stock, at cost: 8,744 and 4,430 shares | (344,870 | ) | (206,407 | ) | |||
Accumulated other comprehensive loss (Note 13) | (395,616 | ) | (294,040 | ) | |||
Total CB&I shareholders’ equity | 1,413,538 | 2,013,990 | |||||
Noncontrolling interests (Note 7) | 147,799 | 149,600 | |||||
Total shareholders’ equity | 1,561,337 | 2,163,590 | |||||
Total liabilities and shareholders’ equity | $ | 7,839,420 | $ | 9,192,060 | |||
The accompanying Notes are an integral part of these Consolidated Financial Statements.
55
CHICAGO BRIDGE & IRON COMPANY N.V.
CONSOLIDATED STATEMENTS OF CASH FLOWS
Years Ended December 31, | |||||||||||
2016 | 2015 | 2014 | |||||||||
(In thousands) | |||||||||||
Cash Flows from Operating Activities | |||||||||||
Net (loss) income | $ | (239,823 | ) | $ | (429,961 | ) | $ | 636,125 | |||
Adjustments to reconcile net (loss) income to net cash provided by (used in) operating activities: | |||||||||||
Depreciation and amortization | 122,522 | 161,135 | 181,398 | ||||||||
Goodwill impairment | 655,000 | 453,100 | — | ||||||||
Loss on net assets sold and intangible assets impairment | 148,148 | 1,040,751 | — | ||||||||
Deferred income taxes | (86,881 | ) | (146,453 | ) | 138,847 | ||||||
Stock-based compensation expense | 39,611 | 57,506 | 65,588 | ||||||||
Other operating expense (income), net | 2,339 | 2,619 | (2,373 | ) | |||||||
Unrealized loss on foreign currency hedges | 2,178 | 2,853 | 8,551 | ||||||||
Excess tax benefits from stock-based compensation | (51 | ) | (287 | ) | (15,282 | ) | |||||
Changes in operating assets and liabilities: | |||||||||||
Decrease (increase) in receivables, net | 603,558 | (213,508 | ) | 78,881 | |||||||
Change in contracts in progress, net | (360,486 | ) | (939,608 | ) | (942,689 | ) | |||||
Decrease (increase) in inventory | 95,528 | (6,091 | ) | 16,832 | |||||||
(Decrease) increase in accounts payable | (56,501 | ) | 105,856 | 99,376 | |||||||
(Increase) decrease in other current and non-current assets | (229,075 | ) | (33,000 | ) | 2,054 | ||||||
Decrease in other current and non-current liabilities | (40,512 | ) | (151,458 | ) | (20,247 | ) | |||||
(Increase) decrease in equity investments | (14,932 | ) | 22,117 | (8,191 | ) | ||||||
Change in other, net | 13,835 | 18,215 | 25,177 | ||||||||
Net cash provided by (used in) operating activities | 654,458 | (56,214 | ) | 264,047 | |||||||
Cash Flows from Investing Activities | |||||||||||
Capital expenditures | (52,462 | ) | (78,852 | ) | (117,624 | ) | |||||
Advances with partners of proportionately consolidated ventures, net | (49,755 | ) | (253,890 | ) | (71,158 | ) | |||||
Proceeds from sale of property and equipment | 4,763 | 9,235 | 14,117 | ||||||||
Other, net | (71,835 | ) | (58,169 | ) | (7,612 | ) | |||||
Net cash used in investing activities | (169,289 | ) | (381,676 | ) | (182,277 | ) | |||||
Cash Flows from Financing Activities | |||||||||||
Revolving facility and other short-term (repayments) borrowings, net | (245,500 | ) | 488,259 | 49,741 | |||||||
Long-term borrowings | — | 700,000 | 48,081 | ||||||||
Advances with equity method and proportionately consolidated ventures, net | 206,583 | 226,191 | 108,658 | ||||||||
Repayments on long-term debt | (150,000 | ) | (420,155 | ) | (102,926 | ) | |||||
Excess tax benefits from stock-based compensation | 51 | 287 | 15,282 | ||||||||
Purchase of treasury stock | (206,569 | ) | (230,814 | ) | (85,903 | ) | |||||
Issuance of stock | 16,329 | 20,164 | 26,772 | ||||||||
Dividends paid | (28,733 | ) | (29,847 | ) | (30,246 | ) | |||||
Distributions to noncontrolling interests | (74,331 | ) | (56,681 | ) | (104,982 | ) | |||||
Net cash (used in) provided by financing activities | (482,170 | ) | 697,404 | (75,523 | ) | ||||||
Effect of exchange rate changes on cash and cash equivalents | (48,064 | ) | (60,616 | ) | (75,426 | ) | |||||
(Decrease) increase in cash and cash equivalents | (45,065 | ) | 198,898 | (69,179 | ) | ||||||
Cash and cash equivalents, beginning of the year | 550,221 | 351,323 | 420,502 | ||||||||
Cash and cash equivalents, end of the year | $ | 505,156 | $ | 550,221 | $ | 351,323 | |||||
Supplemental Cash Flow Disclosures | |||||||||||
Cash paid for interest | $ | 99,333 | $ | 83,147 | $ | 74,267 | |||||
Cash paid for income taxes, net | $ | 46,149 | $ | 135,111 | $ | 167,277 | |||||
The accompanying Notes are an integral part of these Consolidated Financial Statements.
56
CHICAGO BRIDGE & IRON COMPANY N.V.
CONSOLIDATED STATEMENTS OF CHANGES IN SHAREHOLDERS’ EQUITY
Common Stock | Additional Paid-In Capital | Retained Earnings | Treasury Stock | (Note 13) Accumulated Other Comprehensive(Loss) Income | Non - controlling Interests | Total Shareholders’ Equity | |||||||||||||||||||||||||||
Shares | Amount | Shares | Amount | ||||||||||||||||||||||||||||||
(In thousands, except per share data) | |||||||||||||||||||||||||||||||||
Balance at December 31, 2013 | 107,478 | $ | 1,275 | $ | 753,742 | $ | 1,733,409 | 379 | $ | (23,914 | ) | $ | (119,933 | ) | $ | 162,859 | $ | 2,507,438 | |||||||||||||||
Net income | — | — | — | 543,607 | — | — | — | 92,518 | 636,125 | ||||||||||||||||||||||||
Change in cumulative translation adjustment, net | — | — | — | — | — | — | (87,207 | ) | (12,184 | ) | (99,391 | ) | |||||||||||||||||||||
Change in unrealized fair value of cash flow hedges, net | — | — | — | — | — | — | (4,484 | ) | — | (4,484 | ) | ||||||||||||||||||||||
Change in unrecognized prior service pension credits/costs, net | — | — | — | — | — | — | 2,354 | — | 2,354 | ||||||||||||||||||||||||
Change in unrecognized actuarial pension gains/losses, net | — | — | — | — | — | — | (53,127 | ) | — | (53,127 | ) | ||||||||||||||||||||||
Distributions to noncontrolling interests | — | — | — | — | — | — | — | (104,982 | ) | (104,982 | ) | ||||||||||||||||||||||
Dividends paid ($0.28 per share) | — | — | — | (30,246 | ) | — | — | — | — | (30,246 | ) | ||||||||||||||||||||||
Stock-based compensation expense | — | — | 65,588 | — | — | — | — | — | 65,588 | ||||||||||||||||||||||||
Issuance to treasury stock | — | 8 | 40,818 | — | 550 | (40,826 | ) | — | — | — | |||||||||||||||||||||||
Purchase of treasury stock | (1,369 | ) | — | — | — | 1,369 | (85,903 | ) | — | — | (85,903 | ) | |||||||||||||||||||||
Issuance of stock | 1,697 | — | (83,284 | ) | — | (1,697 | ) | 126,215 | — | — | 42,931 | ||||||||||||||||||||||
Balance at December 31, 2014 | 107,806 | 1,283 | 776,864 | 2,246,770 | 601 | (24,428 | ) | (262,397 | ) | 138,211 | 2,876,303 | ||||||||||||||||||||||
Net (loss) income | — | — | — | (504,415 | ) | — | — | — | 74,454 | (429,961 | ) | ||||||||||||||||||||||
Other | — | — | — | — | — | — | — | (3,750 | ) | (3,750 | ) | ||||||||||||||||||||||
Change in cumulative translation adjustment, net | — | — | — | — | — | — | (75,494 | ) | (2,634 | ) | (78,128 | ) | |||||||||||||||||||||
Change in unrealized fair value of cash flow hedges, net | — | — | — | — | — | — | 1,746 | — | 1,746 | ||||||||||||||||||||||||
Change in unrecognized prior service pension credits/costs, net | — | — | — | — | — | — | (819 | ) | — | (819 | ) | ||||||||||||||||||||||
Change in unrecognized actuarial pension gains/losses, net | — | — | — | — | — | — | 42,924 | — | 42,924 | ||||||||||||||||||||||||
Distributions to noncontrolling interests | — | — | — | — | — | — | — | (56,681 | ) | (56,681 | ) | ||||||||||||||||||||||
Dividends paid ($0.28 per share) | — | — | — | (29,847 | ) | — | — | — | — | (29,847 | ) | ||||||||||||||||||||||
Stock-based compensation expense | — | — | 57,506 | — | — | — | — | — | 57,506 | ||||||||||||||||||||||||
Issuance to treasury stock | — | 5 | 19,894 | — | 450 | (19,899 | ) | — | — | — | |||||||||||||||||||||||
Purchase of treasury stock | (5,001 | ) | — | — | — | 5,001 | (230,814 | ) | — | — | (230,814 | ) | |||||||||||||||||||||
Issuance of stock | 1,622 | — | (53,623 | ) | — | (1,622 | ) | 68,734 | — | — | 15,111 | ||||||||||||||||||||||
Balance at December 31, 2015 | 104,427 | 1,288 | 800,641 | 1,712,508 | 4,430 | (206,407 | ) | (294,040 | ) | 149,600 | 2,163,590 | ||||||||||||||||||||||
Net (loss) income | — | — | — | (313,169 | ) | — | — | — | 73,346 | (239,823 | ) | ||||||||||||||||||||||
Change in cumulative translation adjustment, net | — | — | — | — | — | — | (55,281 | ) | (816 | ) | (56,097 | ) | |||||||||||||||||||||
Change in unrealized fair value of cash flow hedges, net | — | — | — | — | — | — | 754 | — | 754 | ||||||||||||||||||||||||
Change in unrecognized prior service pension credits/costs, net | — | — | — | — | — | — | (516 | ) | — | (516 | ) | ||||||||||||||||||||||
Change in unrecognized actuarial pension gains/losses, net | — | — | — | — | — | — | (46,533 | ) | — | (46,533 | ) | ||||||||||||||||||||||
Distributions to noncontrolling interests | — | — | — | — | — | — | — | (74,331 | ) | (74,331 | ) | ||||||||||||||||||||||
Dividends paid ($0.28 per share) | — | — | — | (28,733 | ) | — | — | — | — | (28,733 | ) | ||||||||||||||||||||||
Stock-based compensation expense | — | — | 39,611 | — | — | — | — | — | 39,611 | ||||||||||||||||||||||||
Purchase of treasury stock | (5,772 | ) | — | — | — | 5,772 | (206,569 | ) | — | — | (206,569 | ) | |||||||||||||||||||||
Issuance of stock | 1,458 | — | (58,122 | ) | — | (1,458 | ) | 68,106 | — | — | 9,984 | ||||||||||||||||||||||
Balance at December 31, 2016 | 100,113 | $ | 1,288 | $ | 782,130 | $ | 1,370,606 | 8,744 | $ | (344,870 | ) | $ | (395,616 | ) | $ | 147,799 | $ | 1,561,337 | |||||||||||||||
The accompanying Notes are an integral part of these Consolidated Financial Statements.
57
CHICAGO BRIDGE & IRON COMPANY N.V.
NOTES TO CONSOLIDATED FINANCIAL STATEMENTS
($ and share values in thousands, except per share data)
1. ORGANIZATION AND NATURE OF OPERATIONS
Organization and Nature of Operations—Founded in 1889, Chicago Bridge & Iron Company N.V. (“CB&I” or the “Company”) provides a wide range of services, including conceptual design, technology, engineering, procurement, fabrication, modularization, construction, commissioning, maintenance, program management and environmental services to customers in the energy infrastructure market throughout the world, and is a provider of diversified government services. Our business is aligned into four operating groups, which represent our reportable segments: (1) Engineering & Construction; (2) Fabrication Services; (3) Technology; and (4) Capital Services. Natural gas, petroleum, power and petrochemical projects for the worldwide energy and natural resource industries accounted for a majority of our revenue in 2016, 2015 and 2014. See Note 17 for a discussion of our operating groups and related financial information.
2. SIGNIFICANT ACCOUNTING POLICIES
Basis of Accounting and Consolidation—The accompanying Consolidated Financial Statements (“Financial Statements”) are prepared in accordance with the rules and regulations of the United States (“U.S.”) Securities and Exchange Commission (the “SEC”) and accounting principles generally accepted in the United States of America (“U.S. GAAP”). These Financial Statements include all wholly-owned subsidiaries and those entities which we are required to consolidate. See the “Partnering Arrangements” section of this footnote for further discussion of our consolidation policy for those entities that are not wholly-owned. Intercompany balances and transactions are eliminated in consolidation. Certain balances at December 31, 2015 have been reclassified within our Consolidated Balance Sheet (“Balance Sheet”) to conform to our December 31, 2016 presentation.
Use of Estimates—The preparation of our Financial Statements in conformity with U.S. GAAP requires us to make estimates and judgments that affect the reported amounts of assets, liabilities, revenue and expenses and related disclosures of contingent assets and liabilities. We believe the most significant estimates and judgments are associated with revenue recognition for our contracts, including estimating costs and the recognition of incentive fees and unapproved change orders and claims; fair value and recoverability assessments that must be periodically performed with respect to long-lived tangible assets, goodwill and other intangible assets; valuation of deferred tax assets and financial instruments; the determination of liabilities related to self-insurance programs and income taxes; and consolidation determinations with respect to our partnering arrangements. If the underlying estimates and assumptions upon which our Financial Statements are based change in the future, actual amounts may differ from those included in the accompanying Financial Statements.
Revenue Recognition—Our revenue is primarily derived from long-term contracts and is generally recognized using the percentage of completion (“POC”) method, primarily based on the percentage that actual costs-to-date bear to total estimated costs to complete each contract. We follow the guidance of Financial Accounting Standards Board (“FASB”) Accounting Standards Codification (“ASC”) Revenue Recognition Topic 605-35 for accounting policies relating to our use of the POC method, estimating costs, and revenue recognition, including the recognition of incentive fees, unapproved change orders and claims, and combining and segmenting contracts. We primarily utilize the cost-to-cost approach to estimate POC as we believe this method is less subjective than relying on assessments of physical progress. Under the cost-to-cost approach, the use of estimated costs to complete each contract is a significant variable in the process of determining recognized revenue and is a significant factor in the accounting for contracts. Significant estimates that impact the cost to complete each contract are costs of engineering, materials, components, equipment, labor and subcontracts; labor productivity; schedule durations, including subcontractor or supplier progress; liquidated damages; contract disputes, including claims; achievement of contractual performance requirements; and contingency, among others. The cumulative impact of revisions in total cost estimates during the progress of work is reflected in the period in which these changes become known, including, to the extent required, the reversal of profit recognized in prior periods and the recognition of losses expected to be incurred on contracts in progress. Due to the various estimates inherent in our contract accounting, actual results could differ from those estimates. See Note 16 for discussion of projects with significant changes in estimated margins during 2016, 2015 and 2014.
Our long-term contracts are awarded on a competitively bid and negotiated basis and the timing of revenue recognition may be impacted by the terms of such contracts. We use a range of contracting options, including cost-reimbursable, fixed-price and hybrid, which has both cost-reimbursable and fixed-price characteristics. Fixed-price contracts, and hybrid contracts with a more significant fixed-price component, tend to provide us with greater control over project schedule and the timing of when work is performed and costs are incurred, and accordingly, when revenue is recognized. Cost-reimbursable contracts, and hybrid contracts with a more significant cost-reimbursable component, generally provide our customers with greater influence over the timing of when we perform our work, and accordingly, such contracts often result in less predictability with respect to the timing of revenue recognition. Contract revenue for our long-term contracts recognized under the POC method reflects the original contract price adjusted for approved change orders and estimated recoveries for incentive fees, unapproved change
58
Chicago Bridge & Iron Company N.V.
NOTES TO CONSOLIDATED FINANCIAL STATEMENTS — (Continued)
orders and claims. We recognize revenue associated with incentive fees when the value can be reliably estimated and recovery is probable. We recognize revenue associated with unapproved change orders and claims to the extent the related costs have been incurred, the value can be reliably estimated and recovery is probable. Our recorded incentive fees, unapproved change orders and claims reflect our best estimate of recovery amounts; however, the ultimate resolution and amounts received could differ from these estimates. See Note 16 for additional discussion of our recorded unapproved change orders, claims and incentives.
With respect to our engineering, procurement, and construction (“EPC”) services, our contracts are not segmented between types of services, such as engineering and construction, if each of the EPC components is negotiated concurrently or if the pricing of any such services is subject to the ultimate negotiation and agreement of the entire EPC contract. However, an EPC contract including technology or fabrication services may be segmented if we satisfy the segmenting criteria in ASC 605-35. Revenue recorded in these situations is based on our prices and terms for similar services to third party customers. Segmenting a contract may result in different interim rates of profitability for each scope of service than if we had recognized revenue without segmenting. In some instances, we may combine contracts that are entered into in multiple phases, but are interdependent and include pricing considerations by us and the customer that are impacted by all phases of the project. Otherwise, if each phase is independent of the other and pricing considerations do not give effect to another phase, the contracts will not be combined.
Cost of revenue for our long-term contracts includes direct contract costs, such as materials and labor, and indirect costs that are attributable to contract activity. The timing of when we bill our customers is generally dependent upon advance billing terms, milestone billings based on the completion of certain phases of the work, or when services are provided. Projects with costs and estimated earnings recognized to date in excess of cumulative billings is reported on the Balance Sheet as costs and estimated earnings in excess of billings. Projects with cumulative billings in excess of costs and estimated earnings recognized to date is reported on the Balance Sheet as billings in excess of costs and estimated earnings. The net balances on our Balance Sheet are collectively referred to as Contracts in Progress, net and the components of these balances at December 31, 2016 and 2015 were as follows:
December 31, 2016 | December 31, 2015 | |||||||||||||||
Asset | Liability | Asset | Liability | |||||||||||||
Costs and estimated earnings on contracts in progress | $ | 12,763,678 | $ | 25,866,796 | $ | 14,853,683 | $ | 21,942,765 | ||||||||
Billings on contracts in progress | (12,199,654 | ) | (27,316,131 | ) | (14,165,369 | ) | (23,876,876 | ) | ||||||||
Contracts in Progress, net | $ | 564,024 | $ | (1,449,335 | ) | $ | 688,314 | $ | (1,934,111 | ) | ||||||
Any uncollected billed amounts, including contract retentions, are reported as accounts receivable. At December 31, 2016 and 2015, accounts receivable included contract retentions of approximately $78,600 and $62,900, respectively. Contract retentions due beyond one year were approximately $39,600 at December 31, 2016.
Revenue for our service contracts that do not satisfy the criteria for revenue recognition under the POC method is recorded at the time services are performed. Revenue associated with incentive fees for these contracts is recognized when earned. Unbilled receivables for our service contracts are recorded within accounts receivable and were approximately $57,700 and $71,600 at December 31, 2016 and 2015, respectively.
Revenue for our pipe and steel fabrication and catalyst manufacturing contracts that are independent of an EPC contract, or for which we satisfy the segmentation criteria discussed above, is recognized upon shipment of the fabricated or manufactured units. During the fabrication or manufacturing process, all related direct and allocable indirect costs are capitalized as work in process inventory and such costs are recorded as cost of revenue at the time of shipment.
Our billed and unbilled revenue may be exposed to potential credit risk if our customers should encounter financial difficulties, and we maintain reserves for specifically-identified potential uncollectible receivables. At December 31, 2016 and 2015, our allowances for doubtful accounts were not material.
Precontract Costs—Precontract costs are generally charged to cost of revenue as incurred, but, in certain cases their recognition may be deferred if specific probability criteria are met. We had no significant deferred precontract costs at December 31, 2016 or 2015.
Research and Development—Expenditures for research and development activities are charged to cost of revenue as incurred and were $28,163, $28,301 and $28,432 for 2016, 2015 and 2014, respectively.
59
Chicago Bridge & Iron Company N.V.
NOTES TO CONSOLIDATED FINANCIAL STATEMENTS — (Continued)
Other Operating Expense (Income), Net—Other operating expense (income), net, generally represents (gains) losses associated with the sale or disposition of property and equipment. For 2015, other operating expense (income), net also included a gain of approximately $7,500 related to the contribution of a technology to our unconsolidated Chevron-Lummus Global (“CLG”) joint venture and a foreign exchange loss of approximately $11,000 associated with the re-measurement of certain non-U.S. Dollar denominated net assets.
Integration Related Costs—Integration related costs were $39,685 for 2014, and primarily related to facility consolidations, including the associated accrued future lease costs for vacated facilities and unutilized capacity, personnel relocation and severance related costs, and systems integration costs.
Depreciation Expense—Property and equipment are recorded at cost and depreciated on a straight-line basis over their estimated useful lives, including buildings and improvements (10 to 40 years) and plant and field equipment (1 to 15 years). Renewals and betterments that substantially extend the useful life of an asset are capitalized and depreciated. Leasehold improvements are depreciated over the lesser of the useful life of the asset or the applicable lease term. Depreciation expense is primarily included within cost of revenue and was $80,083, $103,510 and $114,892 for 2016, 2015 and 2014, respectively. See Note 8 for disclosure of the components of property and equipment.
Recoverability of Goodwill—Goodwill is not amortized to earnings, but instead is reviewed for impairment at least annually at a reporting unit level, absent any indicators of impairment or when other actions require an impairment assessment (such as a change in reporting units). We perform our annual impairment assessment during the fourth quarter of each year based upon balances as of October 1. We identify a potential impairment by comparing the fair value of the applicable reporting unit to its net book value, including goodwill. If the net book value exceeds the fair value of the reporting unit, an indication of potential impairment exists, and we measure the impairment by comparing the carrying value of the reporting unit’s goodwill to its implied fair value. To determine the fair value of our reporting units and test for impairment, we utilize an income approach (discounted cash flow method) as we believe this is the most direct approach to incorporate the specific economic attributes and risk profiles of our reporting units into our valuation model. This is consistent with the methodology used to determine the fair value of our reporting units in previous years. We generally do not utilize a market approach given the lack of relevant information generated by market transactions involving comparable businesses. However, to the extent market indicators of fair value become available, we consider such market indicators in our discounted cash flow analysis and determination of fair value. See Note 6 for additional discussion of our goodwill and related goodwill impairment recorded during 2016.
Recoverability of Other Long-Lived Assets—We amortize our finite-lived intangible assets on a straight-line basis with lives ranging from 4 to 20 years, absent any indicators of impairment. We review tangible assets and finite-lived intangible assets for impairment when events or changes in circumstances indicate that the carrying amount may not be recoverable. If a recoverability assessment is required, the estimated future cash flow associated with the asset or asset group will be compared to the asset’s carrying amount to determine if an impairment exists. See Note 6 for additional discussion of our intangible assets.
Earnings Per Share (“EPS”)—Basic EPS is calculated by dividing net income attributable to CB&I by the weighted average number of common shares outstanding for the period. Diluted EPS reflects the assumed conversion of dilutive securities, consisting of restricted shares, performance based shares (where performance criteria have been met), stock options and directors’ deferred-fee shares. See Note 3 for calculations associated with basic and diluted EPS.
Cash Equivalents—Cash equivalents are considered to be highly liquid securities with original maturities of three months or less.
Inventory—Inventory is recorded at the lower of cost or market and cost is determined using the first-in-first-out or weighted-average cost method. The cost of inventory includes acquisition costs, production or conversion costs, and other costs incurred to bring the inventory to a current location and condition. An allowance for excess or inactive inventory is recorded based upon an analysis that considers current inventory levels, historical usage patterns, estimates of future sales expectations and salvage value. See Note 5 for additional discussion of our inventory.
Foreign Currency—The nature of our business activities involves the management of various financial and market risks, including those related to changes in foreign currency exchange rates. The effects of translating financial statements of foreign operations into our reporting currency are recognized as a cumulative translation adjustment in accumulated other comprehensive income (loss) (“AOCI”) which is net of tax, where applicable. With the exception of a foreign exchange loss of approximately $11,000 included within other operating expense (income), net related to the re-measurement of certain non-U.S. Dollar denominated net assets during 2015, foreign currency transactional and re-measurement exchange gains (losses) are included within cost of revenue and were not material in 2016, 2015 and 2014.
60
Chicago Bridge & Iron Company N.V.
NOTES TO CONSOLIDATED FINANCIAL STATEMENTS — (Continued)
Financial Instruments—We utilize derivative instruments in certain circumstances to mitigate the effects of changes in foreign currency exchange rates and interest rates, as described below:
• | Foreign Currency Exchange Rate Derivatives—We do not engage in currency speculation; however, we utilize foreign currency exchange rate derivatives on an ongoing basis to hedge against certain foreign currency related operating exposures. We generally seek hedge accounting treatment for contracts used to hedge operating exposures and designate them as cash flow hedges. Therefore, gains and losses, exclusive of credit risk and forward points (which represent the time value component of the fair value of our derivative positions), are included in AOCI until the associated underlying operating exposure impacts our earnings. Changes in the fair value of (1) credit risk and forward points, (2) instruments deemed ineffective during the period, and (3) instruments that we do not designate as cash flow hedges are recognized within cost of revenue. |
• | Interest Rate Derivatives—At December 31, 2016, we continued to utilize a swap arrangement to hedge against interest rate variability associated with $290,375 of our outstanding $300,000 unsecured term loan (the “Term Loan”). The swap arrangement has been designated as a cash flow hedge as its critical terms matched those of the Term Loan at inception and through December 31, 2016. Accordingly, changes in the fair value of the swap arrangement are included in AOCI until the associated underlying exposure impacts our earnings. |
For those contracts designated as cash flow hedges, we document all relationships between the derivative instruments and associated hedged items, as well as our risk-management objectives and strategy for undertaking hedge transactions. This process includes linking all derivatives to specific firm commitments or highly-probable forecasted transactions. We continually assess, at inception and on an ongoing basis, the effectiveness of derivative instruments in offsetting changes in the cash flow of the designated hedged items. Hedge accounting designation is discontinued when (1) it is determined that the derivative is no longer highly effective in offsetting changes in the cash flow of the hedged item, including firm commitments or forecasted transactions, (2) the derivative is sold, terminated, exercised, or expires, (3) it is no longer probable that the forecasted transaction will occur, or (4) we determine that designating the derivative as a hedging instrument is no longer appropriate. See Note 10 for additional discussion of our financial instruments.
Income Taxes—Deferred tax assets and liabilities are recognized for the future tax consequences attributable to differences between the financial statement carrying amounts of existing assets and liabilities and their respective tax basis using currently enacted income tax rates for the years in which the differences are expected to reverse. A valuation allowance is provided to offset any net deferred tax assets (“DTA(s)”) if, based upon the available evidence, it is more likely than not that some or all of the DTAs will not be realized. The realization of our net DTAs depends upon our ability to generate sufficient future taxable income of the appropriate character and in the appropriate jurisdictions.
Income tax and associated interest and penalty reserves, where applicable, are recorded in those instances where we consider it more likely than not that additional tax will be due in excess of amounts reflected in income tax returns filed worldwide, irrespective of whether or not we have received tax assessments. We continually review our exposure to additional income tax obligations and, as further information is known or events occur, changes in our tax and interest reserves may be recorded within income tax expense and interest expense, respectively. See Note 15 for additional discussion of our income taxes.
Partnering Arrangements—In the ordinary course of business, we execute specific projects and conduct certain operations through joint venture, consortium and other collaborative arrangements (collectively referred to as “venture(s)”). We have various ownership interests in these ventures, with such ownership typically proportionate to our decision making and distribution rights. The ventures generally contract directly with the third party customer; however, services may be performed directly by the ventures, or may be performed by us, our partners, or a combination thereof.
Venture net assets consist primarily of working capital and property and equipment, and assets may be restricted from being used to fund obligations outside of the venture. These ventures typically have limited third party debt or have debt that is non-recourse in nature; however, they may provide for capital calls to fund operations or require participants in the venture to provide additional financial support, including advance payment or retention letters of credit.
Each venture is assessed at inception and on an ongoing basis as to whether it qualifies as a VIE under the consolidations guidance in ASC 810. A venture generally qualifies as a VIE when it (1) meets the definition of a legal entity, (2) absorbs the operational risk of the projects being executed, creating a variable interest, and (3) lacks sufficient capital investment from the partners, potentially resulting in the venture requiring additional subordinated financial support, if necessary, to finance its future activities.
61
Chicago Bridge & Iron Company N.V.
NOTES TO CONSOLIDATED FINANCIAL STATEMENTS — (Continued)
If at any time a venture qualifies as a VIE, we perform a qualitative assessment to determine whether we are the primary beneficiary of the VIE and, therefore, need to consolidate the VIE. We are the primary beneficiary if we have (1) the power to direct the economically significant activities of the VIE and (2) the right to receive benefits from, and obligation to absorb losses of, the VIE. If the venture is a VIE and we are the primary beneficiary, or we otherwise have the ability to control the venture, we consolidate the venture. If we are not determined to be the primary beneficiary of the VIE, or only have the ability to significantly influence, rather than control the venture, we do not consolidate the venture. We account for unconsolidated ventures using either proportionate consolidation for both the Balance Sheet and Statement of Operations, when we meet the applicable accounting criteria to do so, or the equity method. See Note 7 for additional discussion of our material partnering arrangements.
New Accounting Standards—In May 2014, the FASB issued Accounting Standards Update (“ASU”) 2014-09, which provides a single comprehensive accounting standard for revenue recognition for contracts with customers and supersedes current industry-specific guidance, including ASC 605-35. The new standard prescribes a five-step revenue recognition model that focuses on transfer of control and entitlement to payment when determining the amount of revenue to be recognized. The new model requires companies to identify contractual performance obligations and determine whether revenue should be recognized at a point in time or over time for each of these obligations. These concepts, as well as other aspects of the ASU, may change the method and/or timing of revenue recognition for certain of our contracts, primarily associated with our fabrication and manufacturing contracts. We expect that revenue generated from our EPC and engineering services contracts will continue to be recognized over time utilizing the cost-to-cost measure of progress consistent with current practice. We also expect our revenue recognition disclosures to significantly expand due to the new qualitative and quantitative requirements regarding the nature, amount, timing and uncertainty of revenue and cash flows arising from our contracts. We will adopt the standard, including any updates to the standard, upon its effective date in the first quarter 2018 utilizing the modified retrospective approach. This approach will result in a cumulative adjustment to beginning equity in the first quarter 2018 for contracts impacted by the adoption of the standard. We are continuing to assess the potential impact of the new standard on our Financial Statements.
In February 2016, the FASB issued ASU 2016-02, which requires the recognition of a right-of-use asset and a lease liability for most lease arrangements with a term greater than one year, and increases qualitative and quantitative disclosures regarding leasing transactions. The standard is effective for us in the first quarter 2019, although early adoption is permitted. Transition requires application of the new guidance at the beginning of the earliest comparative balance sheet period presented utilizing a modified retrospective approach. We are assessing the timing of adoption of the new standard and its potential impact on our Financial Statements.
In March 2016, the FASB issued ASU 2016-09, which modifies the accounting for excess tax benefits and tax deficiencies associated with share-based payments, and amends the associated cash flow presentation. ASU 2016-09 eliminates the requirement to recognize excess tax benefits in additional paid-in capital (“APIC”), and the requirement to evaluate tax deficiencies for APIC or income tax expense classification, and provides for these benefits or deficiencies to be recorded as an income tax expense or benefit in the income statement. Additionally, tax benefits of dividends on share-based payment awards will also be reflected as an income tax expense or benefit in the income statement. With these changes, tax-related cash flows resulting from share-based payments will be classified as operating activities as opposed to financing, as currently presented. We will adopt the standard upon its effective date in the first quarter 2017 and do not believe it will have a material impact on our Financial Statements.
In the first quarter 2016, we adopted ASU 2015-02, which amends existing consolidation requirements in ASC 810 associated with: (1) determining the consolidation model and assessing control for limited partnerships and similar entities; (2) determining when fees paid to decision makers or service providers are variable interests; and (3) evaluating interests held by de facto agents or related parties of the reporting entity. Our adoption did not have a material impact on our Financial Statements.
In the first quarter 2016, we adopted ASU 2015-03, which requires presentation of debt issuance costs as a direct deduction from the related debt liability rather than as an asset, as presented under previous guidance. Our adoption resulted in the reclassification of deferred debt issuance costs from other current assets and other non-current assets of approximately $2,129 and $8,168, respectively, to current maturities of long-term debt and long-term debt, respectively, in our December 31, 2015 Balance Sheet.
62
Chicago Bridge & Iron Company N.V.
NOTES TO CONSOLIDATED FINANCIAL STATEMENTS — (Continued)
3. EARNINGS PER SHARE
A reconciliation of weighted average basic shares outstanding to weighted average diluted shares outstanding and the computation of basic and diluted EPS are as follows:
Years Ended December 31, | ||||||||||||
2016 | 2015 | 2014 | ||||||||||
Net (loss) income attributable to CB&I | $ | (313,169 | ) | $ | (504,415 | ) | $ | 543,607 | ||||
Weighted average shares outstanding—basic | 102,811 | 106,766 | 108,047 | |||||||||
Effect of restricted shares/performance based shares/stock options (1) | — | — | 1,045 | |||||||||
Effect of directors’ deferred-fee shares (1) | — | — | 30 | |||||||||
Weighted average shares outstanding—diluted | 102,811 | 106,766 | 109,122 | |||||||||
Net (loss) income attributable to CB&I per share: | ||||||||||||
Basic | $ | (3.05 | ) | $ | (4.72 | ) | $ | 5.03 | ||||
Diluted | $ | (3.05 | ) | $ | (4.72 | ) | $ | 4.98 | ||||
(1) | The effect of restricted shares, performance based shares, stock options and directors’ deferred-fee shares were not included in the calculation of diluted EPS for 2016 and 2015 due to the net loss for the periods. Antidilutive shares excluded from diluted EPS were not material for 2014. |
4. DISPOSITION OF NUCLEAR OPERATIONS
On December 31, 2015 we completed the sale of our nuclear power construction business (our “Nuclear Operations”), previously included within our Engineering & Construction operating group, to Westinghouse Electric Company LLC (“WEC”) for transaction consideration of approximately $161,000, which is due upon WEC’s substantial completion of the acquired VC Summer and Vogtle nuclear projects. At December 31, 2015, we recorded the present value of the transaction consideration (the “Transaction Receivable”); however, during the fourth quarter 2016 we determined that recovery was no longer probable and recorded a non-cash pre-tax charge of approximately $148,100 (approximately $96,300 after-tax) to reserve the Transaction Receivable. The charge is included in “Loss on Net Assets Sold and Intangible Assets Impairment” in our Statement of Operations. See Note 12 for discussion of a dispute with WEC relating to the sale of our Nuclear Operations.
As a result of the sale of our Nuclear Operations in 2015, we recorded a non-cash pre-tax charge related to the impairment of goodwill and intangible assets and a loss on net assets sold. A summary of the charge is as follows:
Year Ended December 31, 2015 | ||||
Loss on net assets sold | $ | 973,651 | ||
Intangible assets impairment | 79,100 | |||
Loss on net assets sold and intangible assets impairment | 1,052,751 | |||
Goodwill impairment | 453,100 | |||
Total pre-tax charge | $ | 1,505,851 | ||
The net tax benefit of the charge was approximately $370,700, reflecting the non-deductibility of the goodwill impairment, and resulted in an after-tax charge of approximately $1,135,200. The impact of the loss on net assets sold and intangible assets impairment is included in “Loss on net assets sold and intangible assets impairment” in our Statement of Operations, and the impact of the goodwill impairment is included in “Goodwill impairment” in our Statement of Operations.
The revenue and pre-tax income of our former Nuclear Operations for 2015 and 2014 was as follows:
Years Ended December 31, | ||||||||
2015 | 2014 | |||||||
Revenue | $ | 2,061,167 | $ | 1,841,018 | ||||
Pre-tax income | $ | 215,150 | $ | 151,800 | ||||
63
Chicago Bridge & Iron Company N.V.
NOTES TO CONSOLIDATED FINANCIAL STATEMENTS — (Continued)
5. INVENTORY
The components of inventory at December 31, 2016 and 2015 were as follows:
December 31, | ||||||||
2016 | 2015 | |||||||
Raw materials | $ | 65,969 | $ | 142,170 | ||||
Work in process | 52,882 | 58,884 | ||||||
Finished goods | 75,279 | 88,604 | ||||||
Total | $ | 194,130 | $ | 289,658 | ||||
6. GOODWILL AND OTHER INTANGIBLES
Goodwill Summary—At December 31, 2016 and 2015, our goodwill balances were $3,043,410 and $3,711,506, respectively, attributable to the excess of the purchase price over the fair value of net assets acquired in connection with our acquisitions. The change in goodwill by reporting segment for 2016 and 2015 was as follows:
Engineering & Construction | Fabrication Services | Technology | Capital Services | Total | |||||||||||||||
Balance at December 31, 2014 | $ | 2,339,246 | $ | 668,189 | $ | 303,189 | $ | 884,607 | $ | 4,195,231 | |||||||||
Impairment charges (described below) (1) | (453,100 | ) | — | — | — | (453,100 | ) | ||||||||||||
Amortization of tax goodwill in excess of book goodwill | (3,789 | ) | (1,592 | ) | (3,068 | ) | — | (8,449 | ) | ||||||||||
Foreign currency translation and other | (22,176 | ) | — | — | — | (22,176 | ) | ||||||||||||
Balance at December 31, 2015 | $ | 1,860,181 | $ | 666,597 | $ | 300,121 | $ | 884,607 | $ | 3,711,506 | |||||||||
Impairment charges (described below) (1) | — | — | — | (655,000 | ) | (655,000 | ) | ||||||||||||
Amortization of tax goodwill in excess of book goodwill | (338 | ) | (920 | ) | (2,268 | ) | — | (3,526 | ) | ||||||||||
Foreign currency translation and other | (9,570 | ) | — | — | — | (9,570 | ) | ||||||||||||
Balance at December 31, 2016 | $ | 1,850,273 | $ | 665,677 | $ | 297,853 | $ | 229,607 | $ | 3,043,410 | |||||||||
(1) | At December 31, 2016, we had approximately $1,108,100 of cumulative impairment losses, of which $453,100 was recorded in our Engineering & Construction operating group during 2015 related to the sale of our Nuclear Operations, and approximately $655,000 was recorded in our Capital Services operating group during 2016 as discussed further below. |
As discussed further in Note 2, goodwill is not amortized to earnings, but instead is reviewed for impairment at least annually at a reporting unit level, absent any indicators of impairment or when other actions require an impairment assessment (such as a change in reporting units). We perform our annual impairment assessment during the fourth quarter of each year based upon balances as of October 1. At October 1, 2016, we had the following five reporting units within our four operating groups:
• | Engineering & Construction—Our Engineering & Construction operating group represents a reporting unit. |
• | Fabrication Services—Our Fabrication Services operating group represents a reporting unit. As of December 31, 2015, Fabrication Services included three reporting units: Steel Plate Structures, Fabrication & Manufacturing, and Engineered Products. However, during the third quarter 2016, our Steel Plate Structures, Fabrication & Manufacturing and Engineered Products operations were integrated and operationally combined. As a result, we reevaluated our reporting units within the Fabrication Services operating group and determined that the Fabrication Services operating group represented a single reporting unit subsequent to the reorganization. In conjunction with the reorganization of our Fabrication Services operating group and change in reporting units, we performed a quantitative assessment of goodwill for each of the reporting units immediately before the change in reporting units, and for the new Fabrication Services reporting unit. Based on these quantitative assessments, the fair value of each of the reporting units exceeded their respective net book values, and accordingly, no impairment charge was necessary as a result of the change in reporting units. |
64
Chicago Bridge & Iron Company N.V.
NOTES TO CONSOLIDATED FINANCIAL STATEMENTS — (Continued)
• | Technology—Our Technology operating group represents a reporting unit. |
• | Capital Services—Our Capital Services operating group includes two reporting units: Facilities & Plant Services and Federal Services. |
Annual Impairment Assessment—As part of our annual goodwill impairment assessment during the fourth quarter 2016, we performed a quantitative assessment of goodwill for each of the aforementioned reporting units as of October 1, 2016. Based on these quantitative assessments, the fair value of our Engineering & Construction, Fabrication Services and Technology reporting units each substantially exceeded their respective net book values, and accordingly, no impairment charge was necessary for these reporting units as a result of our annual impairment assessment. However, we determined that the net book value of the Facilities & Plant Services and Federal Services reporting units each exceeded their respective fair values, indicating that the carrying value of their goodwill was impaired. Our fair value determination for the Facilities & Plant Services and Federal Services reporting units gave consideration to a market indicator of fair value for the reporting units as discussed further in Note 18. As a result of the aforementioned, we recorded a goodwill impairment charge of $655,000 for these reporting units ($581,900 for Facilities & Plant Services and $73,100 for Federal Services). Accordingly, at December 31, 2016, the adjusted carrying value of goodwill for the Facilities & Plant Services and Federal Services reporting units was approximately $112,900 and $116,700, respectively. The impact of the goodwill impairment is included in “Goodwill impairment” in our Statement of Operations. The amount of goodwill impairment charge was determined by comparing the carrying value of each reporting unit’s goodwill to their respective implied fair values. The fair values of the Facilities & Plant Services and Federal Services reporting units approximated their respective net book values subsequent to the goodwill impairments. If, based on future assessments our goodwill is deemed to be impaired, the impairment would result in a charge to earnings in the period of impairment. There can be no assurance that future goodwill impairment tests will not result in charges to earnings.
Other Intangible Assets—The following table presents our acquired finite-lived intangible assets at December 31, 2016 and 2015, including the December 31, 2016 weighted-average useful lives for each major intangible asset class and in total:
December 31, 2016 | December 31, 2015 | ||||||||||||||||
Weighted Average Life | Gross Carrying Amount | Accumulated Amortization | Gross Carrying Amount | Accumulated Amortization | |||||||||||||
Backlog and customer relationships (1) | 18 Years | $ | 261,586 | $ | (64,716 | ) | $ | 281,072 | $ | (66,666 | ) | ||||||
Process technologies | 15 Years | 269,316 | (132,049 | ) | 271,028 | (115,608 | ) | ||||||||||
Tradenames | 10 Years | 64,700 | (30,988 | ) | 64,790 | (23,667 | ) | ||||||||||
Total (2) | 16 Years | $ | 595,602 | $ | (227,753 | ) | $ | 616,890 | $ | (205,941 | ) | ||||||
(1) | Backlog and customer relationships intangibles totaling approximately $19,500 became fully amortized during 2016 and were therefore removed from the December 31, 2016 gross carrying and accumulated amortization balances above. |
(2) | The remaining decrease in other intangibles, net during 2016 primarily related to amortization expense of approximately $42,400. Amortization expense for our intangibles existing at December 31, 2016 is anticipated to be approximately $38,800, $37,900, $35,800, $35,400 and $33,200 for 2017, 2018, 2019, 2020 and 2021, respectively. |
As a result of the partial impairment of goodwill for our Capital Services operating group resulting from our fourth quarter annual impairment assessment, we determined that an indicator of impairment existed for the finite-lived intangible assets of our Capital Services operating group, and accordingly, we performed an impairment assessment for these intangible assets during the fourth quarter 2016. Based on our impairment assessment we concluded that the intangible assets were not impaired. We noted no other indicators of impairment during 2016.
65
Chicago Bridge & Iron Company N.V.
NOTES TO CONSOLIDATED FINANCIAL STATEMENTS — (Continued)
7. PARTNERING ARRANGEMENTS
As discussed in Note 2, we account for our unconsolidated ventures using either proportionate consolidation, when we meet the applicable accounting criteria to do so, or the equity method. Further, we consolidate any venture that is determined to be a VIE for which we are the primary beneficiary, or which we otherwise effectively control.
Proportionately Consolidated Ventures—The following is a summary description of our significant joint ventures which have been accounted for using proportionate consolidation:
• | CB&I/Zachry—We have a venture with Zachry (CB&I—50% / Zachry—50%) to perform EPC work for two liquefied natural gas (“LNG”) liquefaction trains in Freeport, Texas. Our proportionate share of the venture project value is approximately $2,700,000. In addition, we have subcontract and risk sharing arrangements with Chiyoda to support our responsibilities to the venture. The costs of these arrangements are recorded in cost of revenue. |
• | CB&I/Zachry/Chiyoda—We have a venture with Zachry and Chiyoda (CB&I—33.3% / Zachry—33.3% / Chiyoda—33.3%) to perform EPC work for an additional LNG liquefaction train at the aforementioned project site in Freeport, Texas. Our proportionate share of the venture project value is approximately $675,000. |
• | CB&I/Chiyoda—We have a venture with Chiyoda (CB&I—50% / Chiyoda—50%) to perform EPC work for three LNG liquefaction trains in Hackberry, Louisiana. Our proportionate share of the venture project value is approximately $3,100,000. |
The following table presents summarized balance sheet information for our share of our proportionately consolidated ventures:
December 31, | ||||||||
2016 | 2015 | |||||||
CB&I/Zachry | ||||||||
Current assets (1) | $ | 260,934 | $ | 298,916 | ||||
Non-current assets | 3,204 | 6,689 | ||||||
Total assets | $ | 264,138 | $ | 305,605 | ||||
Current liabilities(1) | $ | 379,339 | $ | 454,943 | ||||
CB&I/Zachry/Chiyoda | ||||||||
Current assets (1) | $ | 84,279 | $ | 82,106 | ||||
Non-current assets | 1,969 | 2,590 | ||||||
Total assets | $ | 86,248 | $ | 84,696 | ||||
Current liabilities(1) | $ | 73,138 | $ | 86,124 | ||||
CB&I/Chiyoda | ||||||||
Current assets (1) | $ | 337,479 | $ | 424,781 | ||||
Current liabilities(1) | $ | 150,179 | $ | 433,526 | ||||
(1) | Our venture arrangements allow for excess working capital of the ventures to be advanced to the venture partners. Such advances are returned to the ventures for working capital needs as necessary. Accordingly, at a reporting period end a venture may have advances to its partners which are reflected as an advance receivable within current assets of the venture. As summarized in Note 8, at December 31, 2016 and 2015, other current assets on the Balance Sheet included approximately $374,800 and $325,000, respectively, related to our proportionate share of advances from the ventures to our venture partners, and other current liabilities included approximately $394,400 and $334,900, respectively, related to advances to CB&I from the ventures. |
Equity Method Ventures—The following is a summary description of our significant joint ventures which have been accounted for using the equity method:
• | CLG—We have a venture with Chevron (CB&I—50% / Chevron—50%) which provides proprietary process technology licenses and associated engineering services and catalyst, primarily for the refining industry. As sufficient capital investments in CLG have been made by the venture partners, it does not qualify as a VIE. |
• | NET Power—We have a venture with Exelon and 8 Rivers Capital (CB&I—33.3% / Exelon—33.3% / 8 Rivers Capital—33.3%) to commercialize a new natural gas power generation system that recovers the carbon dioxide produced during combustion. NET Power is building a first-of-its-kind demonstration plant which is being funded by contributions and services from the venture partners and other parties. We have determined the venture to be a VIE; however, we do not effectively control NET Power and therefore do not consolidate it. Our cash commitment for NET |
66
Chicago Bridge & Iron Company N.V.
NOTES TO CONSOLIDATED FINANCIAL STATEMENTS — (Continued)
Power totals $47,300, and at December 31, 2016, we had made cumulative investments totaling approximately $37,900.
• | CB&I/CTCI—We have a venture with CTCI (CB&I—50% / CTCI—50%) to perform EPC work for a liquids ethylene cracker and associated units in Sohar, Oman. We have determined the venture to be a VIE; however, we do not effectively control the venture and therefore do not consolidate it. Our proportionate share of the venture project value is approximately $1,400,000. Our venture arrangement allows for excess working capital of the venture to be advanced to the venture partners. Such advances are returned to the venture for working capital needs as necessary. As summarized in Note 8, at December 31, 2016, other current liabilities included approximately $147,000 related to advances to CB&I from the venture. |
Dividends received from our equity method ventures were $11,894, $27,806 and $17,034 during 2016, 2015 and 2014, respectively. We have no other material unconsolidated ventures.
Consolidated Ventures—The following is a summary description of our significant joint ventures we consolidate due to their designation as VIEs for which we are the primary beneficiary:
• | CB&I/Kentz—We have a venture with Kentz (CB&I—65% / Kentz—35%) to perform the structural, mechanical, piping, electrical and instrumentation work on, and to provide commissioning support for, three LNG trains, including associated utilities and a gas processing and compression plant, for the Gorgon LNG project, located on Barrow Island, Australia. Our venture project value is approximately $5,900,000. |
• | CB&I/AREVA—We have a venture with AREVA (CB&I—52% / AREVA—48%) to design, license and construct a mixed oxide fuel fabrication facility in Aiken, South Carolina. Our venture project value is approximately $5,800,000. |
The following table presents summarized balance sheet information for our consolidated ventures:
December 31, | ||||||||
2016 | 2015 | |||||||
CB&I/Kentz | ||||||||
Current assets | $ | 68,867 | $ | 214,291 | ||||
Current liabilities | $ | 87,822 | $ | 191,471 | ||||
CB&I/AREVA | ||||||||
Current assets | $ | 16,313 | $ | 24,269 | ||||
Current liabilities | $ | 47,652 | $ | 65,674 | ||||
All Other (1) | ||||||||
Current assets | $ | 103,238 | $ | 112,532 | ||||
Non-current assets | 16,913 | 19,253 | ||||||
Total assets | $ | 120,151 | $ | 131,785 | ||||
Current liabilities | $ | 20,421 | $ | 32,001 | ||||
(1) | Other ventures that we consolidate are not individually material to our financial results and are therefore aggregated as “All Other”. |
Other—The use of these ventures exposes us to a number of risks, including the risk that our partners may be unable or unwilling to provide their share of capital investment to fund the operations of the venture or complete their obligations to us, the venture, or ultimately, our customer. Differences in opinions or views among venture partners could also result in delayed decision-making or failure to agree on material issues, which could adversely affect the business and operations of the venture. In addition, agreement terms may subject us to joint and several liability for our venture partners, and the failure of our venture partners to perform their obligations could impose additional performance and financial obligations on us. The aforementioned factors could result in unanticipated costs to complete the projects, liquidated damages or contract disputes, including claims against our partners.
67
Chicago Bridge & Iron Company N.V.
NOTES TO CONSOLIDATED FINANCIAL STATEMENTS — (Continued)
8. SUPPLEMENTAL BALANCE SHEET DETAIL
The components of property and equipment, other current assets, and other current and non-current liabilities at December 31, 2016 and 2015 were as follows:
December 31, | ||||||||
2016 | 2015 | |||||||
Property and Equipment | ||||||||
Plant, field equipment and other | $ | 680,606 | $ | 666,392 | ||||
Buildings and improvements | 414,025 | 399,555 | ||||||
Land and improvements | 79,082 | 82,381 | ||||||
Total property and equipment | $ | 1,173,713 | $ | 1,148,328 | ||||
Accumulated depreciation | (608,023 | ) | (544,285 | ) | ||||
Property and equipment, net | $ | 565,690 | $ | 604,043 | ||||
Other Current Assets | ||||||||
Advances to proportionately consolidated ventures (1) | $ | 374,803 | $ | 325,048 | ||||
Other (2) | 175,980 | 182,841 | ||||||
Other current assets | $ | 550,783 | $ | 507,889 | ||||
Other Current Liabilities | ||||||||
Advances from equity method and proportionately consolidated ventures (1) | $ | 541,432 | $ | 334,850 | ||||
Payroll-related obligations | 251,249 | 305,620 | ||||||
Income taxes payable | 46,741 | 29,627 | ||||||
Self-insurance and other insurance reserves | 16,727 | 19,065 | ||||||
Other (3) | 213,779 | 270,727 | ||||||
Other current liabilities | $ | 1,069,928 | $ | 959,889 | ||||
Other Non-Current Liabilities | ||||||||
Pension obligations | $ | 174,264 | $ | 128,762 | ||||
Self-insurance and other insurance reserves | 87,680 | 54,122 | ||||||
Postretirement medical benefit obligations | 30,931 | 28,516 | ||||||
Income tax reserves | 14,162 | 9,140 | ||||||
Other (4) | 139,567 | 148,911 | ||||||
Other non-current liabilities | $ | 446,604 | $ | 369,451 | ||||
(1) | Represents advances to our proportionately consolidated ventures and advances from our equity method and proportionately consolidated ventures as discussed in Note 7. |
(2) | Represents various assets that are each individually less than 5% of total current assets, including income tax receivables and prepaid items. |
(3) | Represents various accruals that are each individually less than 5% of total current liabilities, including accruals for non-contract payables, taxes other than income taxes, country-specific employee benefits, operating lease obligations, derivatives, and medical and legal obligations. |
(4) | Represents various accruals that are each individually less than 5% of total liabilities, including accruals for non-contract payables, taxes other than income taxes, operating lease obligations, deferred rent, and country-specific employee benefits. |
68
Chicago Bridge & Iron Company N.V.
NOTES TO CONSOLIDATED FINANCIAL STATEMENTS — (Continued)
9. DEBT
Our outstanding debt at December 31, 2016 and 2015 was as follows:
December 31, | ||||||||
2016 | 2015 | |||||||
Current | ||||||||
Revolving facility and other short-term borrowings | $ | 407,500 | $ | 653,000 | ||||
Current maturities of long-term debt | 506,250 | 150,000 | ||||||
Less: unamortized debt issuance costs | (2,340 | ) | (2,129 | ) | ||||
Current maturities of long-term debt, net of unamortized debt issuance costs | 503,910 | 147,871 | ||||||
Current debt, net of unamortized debt issuance costs | $ | 911,410 | $ | 800,871 | ||||
Long-Term | ||||||||
Term Loan: $1,000,000 term loan (interest at LIBOR plus a floating margin) | $ | 300,000 | $ | 450,000 | ||||
Second Term Loan: $500,000 term loan (interest at LIBOR plus a floating margin) | 500,000 | 500,000 | ||||||
Senior Notes: $800,000 senior notes, series A-D (fixed interest ranging from 4.15% to 5.30%) | 800,000 | 800,000 | ||||||
Second Senior Notes: $200,000 senior notes (fixed interest of 4.53%) | 200,000 | 200,000 | ||||||
Less: unamortized debt issuance costs | (5,827 | ) | (8,168 | ) | ||||
Less: current maturities of long-term debt | (506,250 | ) | (150,000 | ) | ||||
Long-term debt, net of unamortized debt issuance costs | $ | 1,287,923 | $ | 1,791,832 | ||||
Committed Facilities—We have a five-year, $1,350,000, committed and unsecured revolving facility (the “Revolving Facility”) with Bank of America N.A. (“BofA”), as administrative agent, and BNP Paribas Securities Corp., BBVA Compass, Credit Agricole Corporate and Investment Bank (“Credit Agricole”) and TD Securities, each as syndication agents, which expires in October 2018. The Revolving Facility has a $270,000 financial letter of credit sublimit and has financial and restrictive covenants described further below. The Revolving Facility also includes customary restrictions regarding subsidiary indebtedness, sales of assets, liens, investments, type of business conducted, and mergers and acquisitions, and includes a limitation for dividend payments and share repurchases, among other restrictions. In addition to interest on debt borrowings, we are assessed quarterly commitment fees on the unutilized portion of the facility as well as letter of credit fees on outstanding instruments. The interest, commitment fee, and letter of credit fee percentages are based upon our quarterly leverage ratio. In the event we borrow funds under the facility, interest is assessed at either prime plus an applicable floating margin (3.75% and 1.00%, respectively at December 31, 2016), or LIBOR plus an applicable floating margin (0.77% and 2.00%, respectively at December 31, 2016). At December 31, 2016, we had $100,000 of outstanding borrowings under the facility and $78,251 of outstanding letters of credit under the facility (none of which were financial letters of credit), providing $1,171,749 of available capacity. During 2016, our weighted average interest rate on borrowings under the facility was approximately 2.3%, inclusive of the applicable floating margin.
We have a five-year, $800,000, committed and unsecured revolving credit facility (the “Second Revolving Facility”) with BofA, as administrative agent, and BNP Paribas Securities Corp., BBVA Compass, Credit Agricole and Bank of Tokyo Mitsubishi UFJ, each as syndication agents, which expires in July 2020. The Second Revolving Facility supplements our Revolving Facility, has a $50,000 financial letter of credit sublimit and has financial and restrictive covenants described further below. In addition to interest on debt borrowings, we are assessed quarterly commitment fees on the unutilized portion of the facility as well as letter of credit fees on outstanding instruments. The interest, commitment fee, and letter of credit fee percentages are based upon our quarterly leverage ratio. In the event we borrow funds under the facility, interest is assessed at either prime plus an applicable floating margin (3.75% and 1.00%, respectively at December 31, 2016), or LIBOR plus an applicable floating margin (0.77% and 2.00%, respectively at December 31, 2016). At December 31, 2016, we had $157,500 of outstanding borrowings and $7,630 of outstanding letters of credit under the facility (including $2,757 of financial letters of credit), providing $634,870 of available capacity. During 2016, our weighted average interest rate on borrowings under the facility was approximately 4.3%, inclusive of the applicable floating margin.
Uncommitted Facilities—We also have various short-term, uncommitted letter of credit and borrowing facilities (the “Uncommitted Facilities”) across several geographic regions of approximately $4,561,950, of which $563,000 may be utilized for borrowings. At December 31, 2016, we had $150,000 of outstanding borrowings and $1,635,357 of outstanding letters of
69
Chicago Bridge & Iron Company N.V.
NOTES TO CONSOLIDATED FINANCIAL STATEMENTS — (Continued)
credit under these facilities, providing $2,776,593 of available capacity, of which $413,000 may be utilized for borrowings. During 2016, our weighted average interest rate on borrowings under the facilities was approximately 1.6%.
Term Loans—At December 31, 2016, we had $300,000 outstanding on a four-year, $1,000,000 unsecured term loan (the “Term Loan”) with BofA as administrative agent. Interest and principal under the Term Loan is payable quarterly in arrears and bears interest at LIBOR plus an applicable floating margin (0.77% and 2.00%, respectively at December 31, 2016). However, we continue to utilize an interest rate swap to hedge against $290,375 of the outstanding Term Loan, which resulted in a weighted average interest rate of approximately 2.3% during 2016, inclusive of the applicable floating margin. The balance of the Term Loan was paid February 13, 2017. The Term Loan has financial and restrictive covenants described further below.
At December 31, 2016, we had $500,000 outstanding on a five-year, $500,000 unsecured term loan (the “Second Term Loan”) with BofA as administrative agent. Interest and principal under the Second Term Loan is payable quarterly in arrears beginning in June 2017 and bears interest at LIBOR plus an applicable floating margin (rates are equivalent to the Term Loan). During 2016, our weighted average interest rate on the Second Term Loan was approximately 2.3%, inclusive of the applicable floating margin. Future annual maturities for the Second Term Loan are $56,250, $75,000, $75,000 and $293,750 for 2017, 2018, 2019, and 2020, respectively. The Second Term Loan has financial and restrictive covenants described further below.
Senior Notes—We have a series of senior notes totaling $800,000 in the aggregate (the “Senior Notes”) with Merrill Lynch, Pierce, Fenner & Smith Incorporated, and Credit Agricole, as administrative agents. The Senior Notes have financial and restrictive covenants described further below. The Senior Notes include Series A through D, which contain the following terms:
• | Series A—Interest due semi-annually at a fixed rate of 4.15%, with principal of $150,000 due in December 2017 |
• | Series B—Interest due semi-annually at a fixed rate of 4.57%, with principal of $225,000 due in December 2019 |
• | Series C—Interest due semi-annually at a fixed rate of 5.15%, with principal of $275,000 due in December 2022 |
• | Series D—Interest due semi-annually at a fixed rate of 5.30%, with principal of $150,000 due in December 2024 |
We have senior notes totaling $200,000 (the “Second Senior Notes”) with BofA as administrative agent. Interest is due semi-annually at a fixed rate of 4.53%, with principal of $200,000 due in July 2025. The Second Senior Notes have financial and restrictive covenants described further below.
Compliance and Other—On February 24, 2017, and effective for the period ended December 31, 2016, we amended our Revolving Facility, Second Revolving Facility, Second Term Loan, Senior Notes and Second Senior Notes. The amendments adjusted our maximum leverage ratio from 3.00 to 3.50 and our minimum net worth from $1,736,651 to $1,201,507. Our maximum leverage ratio will decrease to 3.00 on December 31, 2017, or 45 days subsequent to the closing of the sale of our Capital Services operating group (the “Closing Date”) as described in Note 18, if earlier. Our required fixed charge ratio remained at 1.75. The amendments also reduce our Revolving Facility from $1,350,000 to $1,150,000 at the Closing Date. Our amended restrictive covenants continue to include a twelve-month limitation of $250,000 for dividend payments and share repurchases if our leverage ratio exceeds 1.50 (unlimited if our leverage ratio is equal to or below 1.50); however, share repurchases and acquisitions are not allowed if our leverage ratio exceeds 3.00. The amendments to our Senior Notes and Second Senior Notes also include other provisions relating to maintaining our leverage ratio and credit profile.
At December 31, 2016, we were in compliance with all our amended financial and restrictive covenants with a leverage ratio of 3.10, a fixed charge coverage ratio of 3.61, and net worth of $1,413,538.
During 2016, maximum outstanding borrowings under our revolving credit and other facilities were approximately $1,444,000. In addition to providing letters of credit, we also issue surety bonds in the ordinary course of business to support our contract performance. At December 31, 2016, we had $826,383 of outstanding surety bonds. Capitalized interest was insignificant for 2016, 2015 and 2014.
10. FINANCIAL INSTRUMENTS
Derivatives
Foreign Currency Exchange Rate Derivatives—At December 31, 2016, the notional value of our outstanding forward contracts to hedge certain foreign exchange-related operating exposures was approximately $139,100. These contracts vary in duration, maturing up to five years from period-end. We designate certain of these hedges as cash flow hedges and accordingly, changes in their fair value are recognized in AOCI until the associated underlying operating exposure impacts our earnings. Forward points, which are deemed to be an ineffective portion of the hedges, are recognized within cost of revenue and are not material.
70
Chicago Bridge & Iron Company N.V.
NOTES TO CONSOLIDATED FINANCIAL STATEMENTS — (Continued)
Interest Rate Derivatives—We continue to utilize a swap arrangement to hedge against interest rate variability associated with $290,375 of our outstanding $300,000 Term Loan. The swap arrangement has been designated as a cash flow hedge as its critical terms matched those of the Term Loan at inception and through December 31, 2016. Accordingly, changes in the fair value of the swap arrangement are included in AOCI until the associated underlying exposure impacts our earnings.
Financial Instruments Disclosures
Fair Value—Financial instruments are required to be categorized within a valuation hierarchy based upon the lowest level of input that is significant to the fair value measurement. The three levels of the valuation hierarchy are as follows:
• | Level 1—Fair value is based upon quoted prices in active markets. |
• | Level 2—Fair value is based upon internally-developed models that use, as their basis, readily observable market parameters. Our derivative positions are classified within level 2 of the valuation hierarchy as they are valued using quoted market prices for similar assets and liabilities in active markets. These level 2 derivatives are valued utilizing an income approach, which discounts future cash flow based upon current market expectations and adjusts for credit risk. |
• | Level 3—Fair value is based upon internally-developed models that use, as their basis, significant unobservable market parameters. We did not have any level 3 classifications at December 31, 2016 or 2015. |
The following table presents the fair value of our foreign currency exchange rate derivatives and interest rate derivatives at December 31, 2016 and 2015, respectively, by valuation hierarchy and balance sheet classification:
December 31, 2016 | December 31, 2015 | ||||||||||||||||||||||||||||||
Level 1 | Level 2 | Level 3 | Total | Level 1 | Level 2 | Level 3 | Total | ||||||||||||||||||||||||
Derivative Assets (1) | |||||||||||||||||||||||||||||||
Other current assets | $ | — | $ | 1,146 | $ | — | $ | 1,146 | $ | — | $ | 3,344 | $ | — | $ | 3,344 | |||||||||||||||
Other non-current assets | — | 82 | — | 82 | — | 180 | — | 180 | |||||||||||||||||||||||
Total assets at fair value | $ | — | $ | 1,228 | $ | — | $ | 1,228 | $ | — | $ | 3,524 | $ | — | $ | 3,524 | |||||||||||||||
Derivative Liabilities | |||||||||||||||||||||||||||||||
Other current liabilities | $ | — | $ | (3,509 | ) | $ | — | $ | (3,509 | ) | $ | — | $ | (7,568 | ) | $ | — | $ | (7,568 | ) | |||||||||||
Other non-current liabilities | — | (725 | ) | — | (725 | ) | — | (607 | ) | — | (607 | ) | |||||||||||||||||||
Total liabilities at fair value | $ | — | $ | (4,234 | ) | $ | — | $ | (4,234 | ) | $ | — | $ | (8,175 | ) | $ | — | $ | (8,175 | ) | |||||||||||
(1) | We are exposed to credit risk on our hedging instruments associated with potential counterparty non-performance, and the fair value of our derivatives reflects this credit risk. The total level 2 assets at fair value above represent the maximum loss that we would incur on our outstanding hedges if the applicable counterparties failed to perform according to the hedge contracts. To help mitigate counterparty credit risk, we transact only with counterparties that are rated as investment grade or higher and monitor all counterparties on a continuous basis. |
The carrying values of our cash and cash equivalents (primarily consisting of bank deposits), accounts receivable and accounts payable approximate their fair values because of the short-term nature of these instruments. At December 31, 2016, the fair values of our Term Loan and Second Term Loan, based upon the current market rates for debt with similar credit risk and maturities, approximated their carrying values as interest is based upon LIBOR plus an applicable floating margin. Our Senior Notes and Second Senior Notes are categorized within level 2 of the valuation hierarchy. Our Senior Notes had a total fair value of approximately $785,700 and $772,600 at December 31, 2016 and 2015, respectively, based on current market rates for debt with similar credit risk and maturities. Our Second Senior Notes had a total fair value of approximately $206,400 and $203,500 at December 31, 2016 and 2015, respectively, based on current market rates for debt with similar credit risk and maturities.
71
Chicago Bridge & Iron Company N.V.
NOTES TO CONSOLIDATED FINANCIAL STATEMENTS — (Continued)
Derivatives Disclosures
Fair Value—The following table presents the total fair value by underlying risk and balance sheet classification for derivatives designated as cash flow hedges and derivatives not designated as cash flow hedges at December 31, 2016 and 2015:
Other Current and Non-Current Assets | Other Current and Non-Current Liabilities | |||||||||||||||
December 31, 2016 | December 31, 2015 | December 31, 2016 | December 31, 2015 | |||||||||||||
Derivatives designated as cash flow hedges | ||||||||||||||||
Interest rate | $ | 49 | $ | 471 | $ | — | $ | (192 | ) | |||||||
Foreign currency | 109 | 944 | (536 | ) | (1,858 | ) | ||||||||||
Fair value | $ | 158 | $ | 1,415 | $ | (536 | ) | $ | (2,050 | ) | ||||||
Derivatives not designated as cash flow hedges | ||||||||||||||||
Foreign currency | $ | 1,070 | $ | 2,109 | $ | (3,698 | ) | $ | (6,125 | ) | ||||||
Fair value | $ | 1,070 | $ | 2,109 | $ | (3,698 | ) | $ | (6,125 | ) | ||||||
Total fair value | $ | 1,228 | $ | 3,524 | $ | (4,234 | ) | $ | (8,175 | ) | ||||||
Master Netting Arrangements (“MNAs”)—Our derivatives are executed under International Swaps and Derivatives Association MNAs, which generally allow us and our counterparties to net settle, in a single net payable or receivable, obligations due on the same day, in the same currency and for the same type of derivative instrument. We have elected the option to record all derivatives on a gross basis in our Balance Sheet. The following table presents our derivative assets and liabilities at December 31, 2016 on a gross basis and a net settlement basis:
Gross Amounts Recognized (i) | Gross Amounts Offset on the Balance Sheet (ii) | Net Amounts Presented on the Balance Sheet (iii) = (i) - (ii) | Gross Amounts Not Offset on the Balance Sheet (iv) | Net Amount (v) = (iii) - (iv) | |||||||||||||||||||
Financial Instruments | Cash Collateral Received | ||||||||||||||||||||||
Derivative Assets | |||||||||||||||||||||||
Interest rate | $ | 49 | $ | — | $ | 49 | $ | — | $ | — | $ | 49 | |||||||||||
Foreign currency | 1,179 | — | 1,179 | (245 | ) | — | 934 | ||||||||||||||||
Total assets | $ | 1,228 | $ | — | $ | 1,228 | $ | (245 | ) | $ | — | $ | 983 | ||||||||||
Derivative Liabilities | |||||||||||||||||||||||
Interest rate | $ | — | $ | — | $ | — | $ | — | $ | — | $ | — | |||||||||||
Foreign currency | (4,234 | ) | — | (4,234 | ) | 245 | — | (3,989 | ) | ||||||||||||||
Total liabilities | $ | (4,234 | ) | $ | — | $ | (4,234 | ) | $ | 245 | $ | — | $ | (3,989 | ) | ||||||||
AOCI/Other—The following table presents the total value, by underlying risk, recognized in other comprehensive income (“OCI”) and reclassified from AOCI to interest expense (interest rate derivatives) and cost of revenue (foreign currency derivatives) during 2016 and 2015 for derivatives designated as cash flow hedges:
Amount of Gain (Loss) on Effective Derivative Portion | |||||||||||||||
Recognized in OCI | Reclassified from AOCI into Earnings (1) | ||||||||||||||
Years Ended December 31, | |||||||||||||||
2016 | 2015 | 2016 | 2015 | ||||||||||||
Derivatives designated as cash flow hedges | |||||||||||||||
Interest rate | $ | (740 | ) | $ | (2,520 | ) | $ | (510 | ) | $ | (1,769 | ) | |||
Foreign currency | (304 | ) | (1,020 | ) | (835 | ) | (4,117 | ) | |||||||
Total | $ | (1,044 | ) | $ | (3,540 | ) | $ | (1,345 | ) | $ | (5,886 | ) | |||
(1) | Net unrealized losses totaling approximately $100 are anticipated to be reclassified from AOCI into earnings during the next 12 months due to settlement of the associated underlying obligations. |
72
Chicago Bridge & Iron Company N.V.
NOTES TO CONSOLIDATED FINANCIAL STATEMENTS — (Continued)
The following table presents the total value recognized in cost of revenue for 2016 and 2015 for foreign currency derivatives not designated as cash flow hedges:
Amount of Gain (Loss) Recognized in Earnings | |||||||
Years Ended December 31, | |||||||
2016 | 2015 | ||||||
Derivatives not designated as cash flow hedges | |||||||
Foreign currency | $ | (15,287 | ) | $ | 7,225 | ||
Total | $ | (15,287 | ) | $ | 7,225 | ||
11. RETIREMENT BENEFITS
Defined Contribution Plans
We sponsor multiple defined contribution plans for eligible employees with various features, including voluntary employee pre-tax and Roth-based contributions, and Company matching and other contributions. During 2016, 2015 and 2014, we expensed $75,450, $60,540 and $73,444, respectively, for these plans. In addition, we sponsor multiple defined contribution plans that cover eligible employees for which we do not provide contributions. The cost of these plans was not significant to us in 2016, 2015 or 2014.
Defined Benefit Pension and Other Postretirement Plans
We sponsor various defined benefit pension plans covering eligible employees and provide specific post retirement benefits for eligible retired U.S. employees and their dependents through health care and life insurance benefit programs. These plans may be changed or terminated by us at any time. The following tables present combined information for our defined benefit pension and other postretirement plans:
Components of Net Periodic Benefit Cost | Pension Plans | Other Postretirement Plans | ||||||||||||||||||||||
2016 | 2015 | 2014 | 2016 | 2015 | 2014 | |||||||||||||||||||
Service cost | $ | 9,337 | $ | 10,611 | $ | 9,113 | $ | 704 | $ | 791 | $ | 1,037 | ||||||||||||
Interest cost | 23,078 | 23,242 | 33,530 | 1,361 | 1,545 | 2,279 | ||||||||||||||||||
Expected return on plan assets | (26,314 | ) | (28,341 | ) | (36,577 | ) | — | — | — | |||||||||||||||
Amortization of prior service credits | (617 | ) | (620 | ) | (465 | ) | — | — | — | |||||||||||||||
Recognized net actuarial losses (gains) | 5,719 | 7,648 | 4,649 | (3,361 | ) | (2,696 | ) | (863 | ) | |||||||||||||||
Net periodic benefit cost (income) | $ | 11,203 | $ | 12,540 | $ | 10,250 | $ | (1,296 | ) | $ | (360 | ) | $ | 2,453 | ||||||||||
Change in Projected Benefit Obligation | Pension Plans | Other Postretirement Plans | ||||||||||||||
2016 | 2015 | 2016 | 2015 | |||||||||||||
Projected benefit obligation at beginning of year | $ | 824,968 | $ | 945,522 | $ | 30,948 | $ | 51,458 | ||||||||
Service cost | 9,337 | 10,611 | 704 | 791 | ||||||||||||
Interest cost | 23,078 | 23,242 | 1,361 | 1,545 | ||||||||||||
Actuarial loss (gain) (1) | 127,406 | (45,456 | ) | 2,702 | (20,863 | ) | ||||||||||
Plan participants’ contributions | 2,850 | 2,828 | 502 | 452 | ||||||||||||
Benefits paid | (36,955 | ) | (33,521 | ) | (2,810 | ) | (2,435 | ) | ||||||||
Currency translation (2) | (73,427 | ) | (78,258 | ) | — | — | ||||||||||
Projected benefit obligation at end of year | $ | 877,257 | $ | 824,968 | $ | 33,407 | $ | 30,948 | ||||||||
73
Chicago Bridge & Iron Company N.V.
NOTES TO CONSOLIDATED FINANCIAL STATEMENTS — (Continued)
Change in Plan Assets | Pension Plans | Other Postretirement Plans | ||||||||||||||
2016 | 2015 | 2016 | 2015 | |||||||||||||
Fair value of plan assets at beginning of year | $ | 707,088 | $ | 783,219 | $ | — | $ | — | ||||||||
Actual return on plan assets | 78,360 | 1,211 | — | — | ||||||||||||
Benefits paid | (36,955 | ) | (33,521 | ) | (2,810 | ) | (2,435 | ) | ||||||||
Employer contributions (3) | 16,770 | 16,918 | 2,308 | 1,983 | ||||||||||||
Plan participants’ contributions | 2,850 | 2,828 | 502 | 452 | ||||||||||||
Currency translation (2) | (65,009 | ) | (63,567 | ) | — | — | ||||||||||
Fair value of plan assets at end of year | $ | 703,104 | $ | 707,088 | $ | — | $ | — | ||||||||
Funded status | $ | (174,153 | ) | $ | (117,880 | ) | $ | (33,407 | ) | $ | (30,948 | ) | ||||
Balance Sheet Position | Pension Plans | Other Postretirement Plans | ||||||||||||||
2016 | 2015 | 2016 | 2015 | |||||||||||||
Prepaid benefit cost within other non-current assets | $ | 2,798 | $ | 13,581 | $ | — | $ | — | ||||||||
Accrued benefit cost within other current liabilities | (2,687 | ) | (2,699 | ) | (2,476 | ) | (2,432 | ) | ||||||||
Accrued benefit cost within other non-current liabilities | (174,264 | ) | (128,762 | ) | (30,931 | ) | (28,516 | ) | ||||||||
Net funded status recognized | $ | (174,153 | ) | $ | (117,880 | ) | $ | (33,407 | ) | $ | (30,948 | ) | ||||
Unrecognized net prior service credits | $ | (3,259 | ) | $ | (3,975 | ) | $ | — | $ | — | ||||||
Unrecognized net actuarial losses (gains) | 200,334 | 144,680 | (25,508 | ) | (31,571 | ) | ||||||||||
Accumulated other comprehensive loss (income), before taxes (4) | $ | 197,075 | $ | 140,705 | $ | (25,508 | ) | $ | (31,571 | ) | ||||||
(1) | The actuarial pension plan loss for 2016 was primarily associated with a decrease in discount rate assumptions for our pension plans. The actuarial pension plan gain for 2015 was primarily associated with an increase in the discount rate assumptions for our pension plans. The actuarial other postretirement plan gain for 2015 was primarily associated with an increase in the discount rate assumptions and a decrease in the percent of retiring employees electing medical coverage for our other postretirement plan. |
(2) | The currency translation loss for 2016 and 2015 was primarily associated with the strengthening of the U.S. Dollar against the currencies associated with our international pension plans, primarily the Euro and British Pound. |
(3) | During 2017, we expect to contribute approximately $17,000 and $2,500 to our pension and other postretirement plans, respectively. |
(4) | During 2017, we expect to recognize approximately $(600) and $5,500 of previously unrecognized net prior service pension credits and net actuarial pension losses, respectively. |
Accumulated Benefit Obligation—At December 31, 2016 and 2015, the accumulated benefit obligation for all defined benefit pension plans was $859,501 and $823,616, respectively. The following table includes summary information for those defined benefit plans with an accumulated benefit obligation in excess of plan assets:
December 31, | ||||||||
2016 | 2015 | |||||||
Projected benefit obligation | $ | 766,618 | $ | 714,539 | ||||
Accumulated benefit obligation | $ | 748,862 | $ | 713,187 | ||||
Fair value of plan assets | $ | 589,667 | $ | 583,081 | ||||
74
Chicago Bridge & Iron Company N.V.
NOTES TO CONSOLIDATED FINANCIAL STATEMENTS — (Continued)
Plan Assumptions—The following table presents the weighted-average assumptions used to measure our defined benefit pension and other postretirement plans:
Pension Plans | Other Postretirement Plans | |||||||||||
2016 | 2015 | 2016 | 2015 | |||||||||
Weighted-average assumptions used to determine benefit obligations at December 31, | ||||||||||||
Discount rate | 2.11 | % | 2.95 | % | 4.15 | % | 4.47 | % | ||||
Rate of compensation increase (1) | 2.36 | % | 2.37 | % | n/a | n/a | ||||||
Weighted-average assumptions used to determine net periodic benefit cost for the years ended December 31, | ||||||||||||
Discount rate | 2.95 | % | 2.64 | % | 4.47 | % | 4.13 | % | ||||
Expected long-term rate of return on plan assets (2) | 3.87 | % | 3.81 | % | n/a | n/a | ||||||
Rate of compensation increase (1) | 2.36 | % | 2.90 | % | n/a | n/a | ||||||
(1) | The rate of compensation increase relates solely to the defined benefit plans that factor compensation increases into the valuation. |
(2) | The expected long-term rate of return on plan assets was derived using historical returns by asset category and expectations of future performance. |
Benefit Payments—The following table includes the expected defined benefit and other postretirement plan payments for the next 10 years:
Year | Pension Plans | Other Postretirement Plans | ||||||
2017 | $ | 37,783 | $ | 2,476 | ||||
2018 | $ | 33,699 | $ | 2,471 | ||||
2019 | $ | 33,859 | $ | 2,446 | ||||
2020 | $ | 34,584 | $ | 2,408 | ||||
2021 | $ | 35,245 | $ | 2,337 | ||||
2022-2026 | $ | 183,871 | $ | 10,820 | ||||
Plan Assets—Our investment strategy for defined benefit plan assets seeks to optimize the proper risk-return relationship considered appropriate for each respective plan’s investment goals, using a global portfolio of various asset classes diversified by market segment, economic sector and issuer. The primary goal is to optimize the asset mix to fund future benefit obligations, while managing various risk factors and each plan’s investment return objectives.
Our defined benefit plan assets in the U.S. are invested in well-diversified portfolios of equity (including U.S. large, mid and small-capitalization and international equities) and fixed income securities (including corporate and government bonds). Non-U.S. defined benefit plan assets are similarly invested in well-diversified portfolios of equity, fixed income and other securities. At December 31, 2016, our target weighted-average asset allocations by asset category were: equity securities (35%-40%), fixed income securities (60%-65%), and other investments (0%-5%).
Our pension assets are categorized within the valuation hierarchy based upon the lowest level of input that is significant to the fair value measurement. Assets that are valued using quoted prices are classified within level 1 of the valuation hierarchy, assets that are valued using internally-developed models that use, as their basis, readily observable market parameters, are classified within level 2 of the valuation hierarchy, and assets that are valued based upon models with significant unobservable market parameters are classified within level 3 of the valuation hierarchy.
75
Chicago Bridge & Iron Company N.V.
NOTES TO CONSOLIDATED FINANCIAL STATEMENTS — (Continued)
The following tables present the fair value of our plan assets by investment category and valuation hierarchy level at December 31, 2016 and 2015:
December 31, 2016 | ||||||||||||||||
Level 1 | Level 2 | Level 3 | Total | |||||||||||||
Asset Category | ||||||||||||||||
Equity Securities: | ||||||||||||||||
Global Equities and Cash | $ | 3,310 | $ | — | $ | — | $ | 3,310 | ||||||||
International Funds (1) | — | 155,560 | — | 155,560 | ||||||||||||
Emerging Markets Growth Funds | — | 17,342 | — | 17,342 | ||||||||||||
U.S. Equity Funds | — | 13,766 | — | 13,766 | ||||||||||||
Fixed Income Securities: | ||||||||||||||||
International Government Bonds (2) | — | 180,850 | — | 180,850 | ||||||||||||
International Corporate Bonds (3) | — | 110,626 | — | 110,626 | ||||||||||||
International Mortgage Funds (4) | — | 64,174 | — | 64,174 | ||||||||||||
All Other Fixed Income Securities (5) | — | 50,321 | — | 50,321 | ||||||||||||
Other Investments: | ||||||||||||||||
Asset Allocation Funds (6) | — | 107,155 | — | 107,155 | ||||||||||||
Total Assets at Fair Value | $ | 3,310 | $ | 699,794 | $ | — | $ | 703,104 | ||||||||
December 31, 2015 | ||||||||||||||||
Level 1 | Level 2 | Level 3 | Total | |||||||||||||
Asset Category | ||||||||||||||||
Equity Securities: | ||||||||||||||||
Global Equities and Cash | $ | 2,278 | $ | — | $ | — | $ | 2,278 | ||||||||
International Funds (1) | — | 167,695 | — | 167,695 | ||||||||||||
U.S. Equity Funds | — | 20,158 | — | 20,158 | ||||||||||||
Emerging Markets Growth Funds | — | 15,764 | — | 15,764 | ||||||||||||
Fixed Income Securities: | ||||||||||||||||
International Government Bonds (2) | — | 253,969 | — | 253,969 | ||||||||||||
International Corporate Bonds (3) | — | 96,262 | — | 96,262 | ||||||||||||
International Mortgage Funds (4) | — | 21,679 | — | 21,679 | ||||||||||||
All Other Fixed Income Securities (5) | — | 47,504 | — | 47,504 | ||||||||||||
Other Investments: | ||||||||||||||||
Asset Allocation Funds (6) | — | 81,779 | — | 81,779 | ||||||||||||
Total Assets at Fair Value | $ | 2,278 | $ | 704,810 | $ | — | $ | 707,088 | ||||||||
The following provides descriptions for plan asset categories with significant balances in the tables above:
(1) | Investments in various funds that track international indices. |
(2) | Investments in predominately EU government securities and U.K. Treasury securities with credit ratings primarily AAA. |
(3) | Investments in European and U.K. fixed interest securities with credit ratings of primarily BBB and above. |
(4) | Investments in international mortgage funds. |
(5) | Investments predominantly in various international fixed income obligations that are individually insignificant. |
(6) | Investments in fixed income securities, equities and alternative asset classes, including commodities and property assets. |
76
Chicago Bridge & Iron Company N.V.
NOTES TO CONSOLIDATED FINANCIAL STATEMENTS — (Continued)
Health Care Cost Inflation—As noted above, we provide specific postretirement health care benefits for eligible retired U.S. employees and their dependents. Eligible current and future retirees are covered by a defined fixed dollar benefit, under which our costs for each participant are fixed based upon prior years of employee service. Since 2011, new employees are not eligible for these post-retirement health care benefits. Additionally, there is a closed group of retirees for which we assume some or all of the cost of coverage. For this group, health care cost trend rates are projected at annual rates ranging from 6.0% in 2017 down to 5.0% in 2021 and beyond. A change in the assumed health care cost trends by one percentage point is estimated to have an immaterial impact on the total service and interest cost components of net postretirement health care cost for 2016 and the accumulated postretirement benefit obligation at December 31, 2016.
Multi-Employer Pension Plans—We contribute to certain union sponsored multi-employer defined benefit pension plans in the U.S. and Canada. Benefits under these plans are generally based upon years of service and compensation levels. Under U.S. legislation regarding such pension plans, the risks of participation are different than single-employer pension plans as (1) assets contributed to the plan by a company may be used to provide benefits to participants of other companies, (2) if a participating company discontinues contributions to a plan, other participating companies may have to cover any unfunded liability that may exist, and (3) a company is required to continue funding its proportionate share of a plan’s unfunded vested benefits in the event of withdrawal (as defined by the legislation) from a plan or plan termination. The following table provides additional information regarding our significant multi-employer defined benefit pension plans, including the funding level of each plan (or zone status, as defined by the Pension Protection Act), whether actions to improve the funding level of the plan have been implemented, where required (a funding improvement plan (“FIP”) or rehabilitation plan (“RP”), and our contributions to each plan and total contributions for 2016, 2015 and 2014, among other disclosures:
EIN/Plan Number | Plan Year End | Pension Protection Act (% Funded) (1) | FIP/RP Plan (1) | Total Company Contributions (2) | Expiration Date of Collective- Bargaining Agreement (3) | |||||||||||||||||||
Pension Fund | 2016 | 2015 | 2016 | 2015 | 2014 | |||||||||||||||||||
Boilermaker-Blacksmith National Pension Trust | 48-6168020-001 | 12/31 | 65%-80% | 65%-80% | Yes | $ | 35,235 | $ | 32,918 | $ | 33,105 | Various | ||||||||||||
Plumbers and Pipefitters National Pension Fund | 52-6152779-001 | 6/30 | 65%-80% | 65%-80% | Yes | 5,443 | 4,712 | 3,895 | Various | |||||||||||||||
Utah Pipe Trades Pension Trust Fund | 51-6077569-001 | 12/31 | >80% | >80% | No | 4,321 | 5,522 | 664 | 07/19 | |||||||||||||||
Central Laborers’ Pension Fund | 37-6052379-001 | 12/31 | 65%-80% | <65% | Yes | 2,054 | 2,083 | 1,881 | Various | |||||||||||||||
Twin City Carpenters and Joiners Pension Fund | 41-6043137-001 | 12/31 | 65%-80% | 65%-80% | Yes | 1,295 | 5,469 | 6,010 | 04/19 | |||||||||||||||
Twin City Ironworkers Pension Plan | 41-6084127-001 | 12/31 | >80% | >80% | No | 731 | 2,102 | 2,791 | 04/19 | |||||||||||||||
Middle Tennessee Carpenters and Millwrights Pension Fund (4) | 62-6101275-001 | 4/30 | >80% | >80% | No | — | 6,809 | 4,729 | Various | |||||||||||||||
Southern Ironworkers Pension Fund (4) | 59-6227091-001 | 12/31 | >80% | >80% | No | — | 3,823 | 2,150 | Various | |||||||||||||||
Plumbers and Steamfitters Local 150 Pension Fund (4) | 58-6116699-001 | 12/31 | >80% | >80% | No | — | 3,510 | 2,154 | Various | |||||||||||||||
Boilermakers’ National Pension Plan (Canada) | 366708 | 12/31 | N/A | N/A | N/A | 6,709 | 8,645 | 10,795 | 04/19 | |||||||||||||||
All Other (5) | 64,621 | 62,120 | 49,913 | |||||||||||||||||||||
Total | $ | 120,409 | $ | 137,713 | $ | 118,087 | ||||||||||||||||||
(1) | Pension Protection Act Zone Status and FIP/RP plans are applicable to our U.S.-registered plans only, as these terms are not defined within Canadian pension legislation. In the U.S., plans funded less than 65% are in the red zone, plans funded at least 65%, but less than 80% are in the yellow zone, and plans funded at least 80% are in the green zone. The requirement for FIP or RP plans in the U.S. is based on the funding level or zone status of the applicable plan. |
77
Chicago Bridge & Iron Company N.V.
NOTES TO CONSOLIDATED FINANCIAL STATEMENTS — (Continued)
(2) | Our 2016 contributions as a percentage of total plan contributions were not available for any of our plans. For 2015 and 2014, our contributions to the Utah Pipe Trades Pension Trust Fund, the Twin City Carpenters and Joiners Pension Fund, the Twin City Ironworkers Pension Plan, the Southern Ironworkers Pension Fund, the Plumbers and Steamfitters Local 150 Pension Fund and the Boilermakers’ National Pension Plan (Canada) each exceeded 5% of total plan contributions. The level of our contributions to each plan noted above varies from period to period based upon the level of work being performed that is covered under the applicable collective-bargaining agreement. |
(3) | The expiration dates of our labor agreements associated with the plans noted as “Various” above vary based upon the duration of the applicable projects. |
(4) | The contributions in 2015 and 2014 were associated with plans that were included with our former Nuclear Operations, which were sold on December 31, 2015. |
(5) | Our remaining contributions are to various U.S. and Canadian plans, which are individually immaterial. |
We also contribute to our multi-employer plans for annuity benefits covered under the defined contribution portion of the plans as well as health benefits. We made contributions to our multi-employer plans of $127,529, $130,042 and $110,743 during 2016, 2015 and 2014, respectively, for these additional benefits.
12. COMMITMENTS AND CONTINGENCIES
Leases—Certain facilities and equipment, including project-related field equipment, are rented under operating leases that expire at various dates through 2035. Rent expense for operating leases was $117,007, $151,660 and $144,288 for 2016, 2015 and 2014, respectively. Future minimum payments under non-cancelable operating leases having initial terms of one year or more are as follows:
Year | Amount | ||
2017 | $ | 77,923 | |
2018 | 62,492 | ||
2019 | 52,368 | ||
2020 | 42,303 | ||
2021 | 34,127 | ||
Thereafter | 117,016 | ||
Total | $ | 386,229 | |
Certain lease agreements contain escalation provisions based upon specific future inflation indices which could impact the future minimum payments presented above. The costs related to leases with an initial term of less than one year have been reflected in rent expense but have been excluded from the future minimum payments presented above.
Legal Proceedings
General—We have been and may from time to time be named as a defendant in legal actions claiming damages in connection with engineering and construction projects, technology licenses, other services we provide, and other matters. These are typically claims that arise in the normal course of business, including employment-related claims and contractual disputes or claims for personal injury or property damage which occur in connection with services performed relating to project or construction sites. Contractual disputes normally involve claims relating to the timely completion of projects, performance of equipment or technologies, design or other engineering services or project construction services provided by us. We do not believe that any of our pending contractual, employment-related personal injury or property damage claims and disputes will have a material adverse effect on our results of operations, financial position or cash flow. See Note 16 for additional discussion of claims associated with our projects.
Project Arbitration Matter—The customer for one of our large cost-reimbursable projects has filed a request for arbitration with the International Chamber of Commerce, alleging cost overruns on the project. The customer has not provided evidence to substantiate its allegations and we believe all amounts incurred and billed on the project, including outstanding receivables of approximately $231,000 as of December 31, 2016, are contractually due under the provisions of our contract and are recoverable, but have been classified as a non-current asset on our Balance Sheet as we do not anticipate collection within the next year. We do not believe a risk of material loss is probable related to this matter, and accordingly, no amounts have been accrued. While it is possible that a loss may be incurred, we are unable to estimate the range of potential loss, if any. Further, we have asserted counterclaims for our outstanding receivables.
78
Chicago Bridge & Iron Company N.V.
NOTES TO CONSOLIDATED FINANCIAL STATEMENTS — (Continued)
Dispute Related to Sale of Nuclear Operations—As discussed further in Note 4, on December 31, 2015, we sold our Nuclear Operations to WEC. In connection with the transaction, a customary post-closing purchase price adjustment mechanism was negotiated between CB&I and WEC (the “Parties”) to account for any difference between target working capital and actual working capital as finally determined. On April 28, 2016, WEC delivered to us a purported closing statement estimating closing working capital to be negative $976,506, which was $2,150,506 less than target working capital. In contrast, we calculated closing working capital to be $1,601,805, which is $427,805 greater than target working capital. On July 21, 2016, we filed a complaint against WEC in the Court of Chancery in the State of Delaware (the “Court”) seeking a declaration that WEC has no remedy for the vast majority of its claims and requesting an injunction barring WEC from bringing such claims. On December 2, 2016, the Court granted WEC’s motion for judgment on the pleadings and dismissed our complaint, stating that the dispute should follow the dispute resolution process as set forth in the sales agreement. We have filed an appeal of the Court’s ruling to the Delaware Supreme Court which is now in the briefing stages. The Parties have selected an independent auditor for the dispute resolution process and we must simultaneously move forward with this process while the appeal is pursued. We do not believe a risk of material loss is probable related to this matter, and accordingly, no amounts have been accrued. While it is possible that a loss may be incurred, we are unable to estimate the range of potential loss, if any. We intend to vigorously pursue this litigation and our rights under the purchase agreement.
Asbestos Litigation—We are a defendant in lawsuits wherein plaintiffs allege exposure to asbestos due to work we may have performed at various locations. We have never been a manufacturer, distributor or supplier of asbestos products. Over the past several decades and through December 31, 2016, we have been named a defendant in lawsuits alleging exposure to asbestos involving approximately 6,000 plaintiffs and, of those claims, approximately 1,200 claims were pending and 4,800 have been closed through dismissals or settlements. Over the past several decades and through December 31, 2016, the claims alleging exposure to asbestos that have been resolved have been dismissed or settled for an average settlement amount of approximately two thousand dollars per claim. We review each case on its own merits and make accruals based upon the probability of loss and our estimates of the amount of liability and related expenses, if any. While we have seen an increase in the number of recent filings, especially in one specific venue, we do not believe the increase or any unresolved asserted claims will have a material adverse effect on our future results of operations, financial position or cash flow, and at December 31, 2016, we had approximately $9,200 accrued for liability and related expenses. With respect to unasserted asbestos claims, we cannot identify a population of potential claimants with sufficient certainty to determine the probability of a loss and to make a reasonable estimate of liability, if any. While we continue to pursue recovery for recognized and unrecognized contingent losses through insurance, indemnification arrangements or other sources, we are unable to quantify the amount, if any, that we may expect to recover because of the variability in coverage amounts, limitations and deductibles, or the viability of carriers, with respect to our insurance policies for the years in question.
Environmental Matters—Our operations are subject to extensive and changing U.S. federal, state and local laws and regulations, as well as the laws of other countries, that establish health and environmental quality standards. These standards, among others, relate to air and water pollutants and the management and disposal of hazardous substances and wastes. We are exposed to potential liability for personal injury or property damage caused by any release, spill, exposure or other accident involving such pollutants, substances or wastes.
In connection with the historical operation of our facilities, including those associated with acquired operations, substances which currently are or might be considered hazardous were used or disposed of at some sites that will or may require us to make expenditures for remediation. In addition, we have agreed to indemnify parties from whom we have purchased or to whom we have sold facilities for certain environmental liabilities arising from acts occurring before the dates those facilities were transferred.
We believe we are in compliance, in all material respects, with environmental laws and regulations and maintain insurance coverage to mitigate our exposure to environmental liabilities. We do not believe any environmental matters will have a material adverse effect on our future results of operations, financial position or cash flow. We do not anticipate we will incur material capital expenditures for environmental controls or for the investigation or remediation of environmental conditions during 2017 or 2018.
Letters of Credit/Surety Bonds—In the ordinary course of business, we may obtain surety bonds and letters of credit, which we provide to our customers to secure advance payment or our performance under our contracts, or in lieu of retention being withheld on our contracts. In the event of our non-performance under a contract and an advance being made by a bank pursuant to a draw on a letter of credit, the advance would become a borrowing under a credit facility and thus our direct obligation. Where a surety incurs such a loss, an indemnity agreement between the parties and us may require payment from our excess cash or a borrowing under our credit facilities. When a contract is completed, the contingent obligation terminates and the bonds or letters of credit are returned. See Note 9 for further discussion of our letters of credit and surety bonds.
79
Chicago Bridge & Iron Company N.V.
NOTES TO CONSOLIDATED FINANCIAL STATEMENTS — (Continued)
Insurance—We have elected to retain portions of future losses, if any, through the use of deductibles and self-insured retentions for our exposures related to third party liability and workers’ compensation. Liabilities in excess of these amounts are the responsibilities of an insurance carrier. To the extent we are self-insured for these exposures, reserves (see Note 8) have been provided based upon our best estimates, with input from our legal and insurance advisors. Changes in assumptions, as well as changes in actual experience, could cause these estimates to change in the near-term. We believe that reasonably possible losses, if any, for these matters, to the extent not otherwise disclosed and net of recorded reserves, will not have a material adverse effect on our future results of operations, financial position or cash flow. At December 31, 2016, we had outstanding surety bonds and letters of credit of $89,743 relating to our insurance programs.
Income Taxes—Income tax and associated interest and penalty reserves, where applicable, are recorded in those instances where we consider it more likely than not that additional tax will be due in excess of amounts reflected in income tax returns filed worldwide, irrespective of whether or not we have received tax assessments. We continually review our exposure to additional income tax obligations and, as further information is known or events occur, changes in our tax and interest reserves may be recorded within income tax expense and interest expense, respectively.
13. SHAREHOLDERS’ EQUITY
Treasury Stock—Under Dutch law and our Articles of Association, we may hold no more than 10% of our issued share capital at any time.
AOCI—The following table presents changes in AOCI, net of tax, by component, during 2016:
Year Ended December 31, 2016 | ||||||||||||||||
Currency Translation Adjustment (1) | Unrealized Fair Value Of Cash Flow Hedges | Defined Benefit Pension and Other Postretirement Plans | Total | |||||||||||||
Balance at December 31, 2015 | $ | (209,281 | ) | $ | (967 | ) | $ | (83,792 | ) | $ | (294,040 | ) | ||||
OCI before reclassifications | (55,281 | ) | 33 | (48,833 | ) | (104,081 | ) | |||||||||
Amounts reclassified from AOCI | — | 721 | 1,784 | 2,505 | ||||||||||||
Net OCI | (55,281 | ) | 754 | (47,049 | ) | (101,576 | ) | |||||||||
Balance at December 31, 2016 | $ | (264,562 | ) | $ | (213 | ) | $ | (130,841 | ) | $ | (395,616 | ) | ||||
(1) | During 2016, the currency translation adjustment component of AOCI was unfavorably impacted by net movements in the Australian Dollar, British Pound, and Euro exchange rates against the U.S. Dollar. |
The following table presents reclassification of AOCI into earnings, net of tax, for each component, during 2016:
Amount Reclassified From AOCI | ||||
Unrealized Fair Value Of Cash Flow Hedges (1) | ||||
Interest rate derivatives (interest expense) | $ | 510 | ||
Foreign currency derivatives (cost of revenue) | 835 | |||
Total before tax | $ | 1,345 | ||
Tax | (624 | ) | ||
Total net of tax | $ | 721 | ||
Defined Benefit Pension and Other Postretirement Plans (2) | ||||
Amortization of prior service credits | $ | (617 | ) | |
Recognized net actuarial losses | 2,358 | |||
Total before tax | $ | 1,741 | ||
Tax | 43 | |||
Total net of tax | $ | 1,784 | ||
(1) | See Note 10 for further discussion of our cash flow hedges, including the total value reclassified from AOCI to earnings. |
(2) | See Note 11 for further discussion of our defined benefit and other postretirement plans, including the components of net periodic benefit cost. |
Other—Changes in common stock, APIC and treasury stock during 2016 and 2015 primarily relate to activity associated with our stock-based compensation plans and share repurchases.
80
Chicago Bridge & Iron Company N.V.
NOTES TO CONSOLIDATED FINANCIAL STATEMENTS — (Continued)
14. EQUITY-BASED INCENTIVE PLANS
General—Under our equity-based incentive plans (our “Incentive Plans”), we can issue shares to employees and directors in the form of restricted stock units (“RSUs”), performance based shares (including those based upon financial or stock price performance) and stock options. Our Incentive Plans are administered by the Organization and Compensation Committee of our Supervisory Board, which selects those employees eligible to receive awards and determines the number of shares or stock options subject to each award, as well as the terms, conditions, performance measures, and other provisions of the award. Compensation expense related to our Incentive Plans was $36,921, $53,086 and $64,613 for 2016, 2015 and 2014, respectively. At December 31, 2016, 5,979 authorized shares remained available under our Incentive Plans for future RSU, performance based share, or stock option grants.
Under our employee stock purchase plan (“ESPP”), employees may make quarterly purchases of shares at a discount through regular payroll deductions for up to 8% of their compensation. The shares are purchased at 85% of the closing price per share on the first trading day following the end of the calendar quarter. Compensation expense related to our ESPP, representing the difference between the fair value on the date of purchase and the price paid, was $2,499, $3,042 and $3,143 for 2016, 2015 and 2014, respectively. At December 31, 2016, 2,757 authorized shares remained available for purchase under the ESPP.
Total stock-based compensation expense for our Incentive Plans and ESPP was $39,420, $56,128 and $67,756 for 2016, 2015 and 2014, respectively. At December 31, 2016, there was $44,540 of unrecognized compensation cost related to share-based grants, which is expected to be recognized over a weighted-average period of 1.7 years.
We receive a tax deduction during the period in which certain options are exercised, generally for the difference in the option exercise price and the price of the shares at the date of exercise (“intrinsic value”). Additionally, we receive a tax deduction upon the vesting of RSUs and performance based shares for the price of the shares at the date of vesting. Our total recognized tax benefit based on our compensation expense was $10,377, $16,924 and $19,394 for 2016, 2015 and 2014, respectively. The amount of tax deductions in excess of accumulated tax benefits recognized is reflected as a financing cash flow.
RSUs—Our RSU awards may not be sold or otherwise transferred until certain restrictions have lapsed, which is generally over a four-year graded vesting period. The total initial fair value for these awards is determined based upon the market price of our stock at the grant date applied to the total number of shares that we anticipate will vest. This fair value is expensed on a straight-line basis over the vesting period, subject to retirement eligibility expense acceleration, where applicable. RSUs granted to directors vest, and are expensed, over one year. The following table presents RSU activity for 2016:
Shares | Weighted-Average Grant-Date Fair Value per Share | ||||||
Nonvested RSUs | |||||||
Balance at December 31, 2015 | 1,385 | $ | 51.65 | ||||
Granted | 1,021 | $ | 33.19 | ||||
Vested | (492 | ) | $ | 50.99 | |||
Forfeited | (80 | ) | $ | 41.51 | |||
Balance at December 31, 2016 | 1,834 | $ | 41.99 | ||||
Directors’ RSUs | |||||||
Balance at December 31, 2015 | 28 | $ | 49.55 | ||||
Granted | 37 | $ | 38.18 | ||||
Vested | (28 | ) | $ | 49.55 | |||
Balance at December 31, 2016 | 37 | $ | 38.18 | ||||
During 2015, 1,043 RSUs (including 28 directors’ shares subject to restrictions) were granted with a weighted-average grant-date fair value per share of $42.39. During 2014, 535 RSUs (including 17 directors’ shares subject to restrictions) were granted with a weighted-average grant-date fair value per share of $80.41. The total fair value of RSUs that vested during 2016, 2015 and 2014 was $26,469, $28,081 and $17,093, respectively.
81
Chicago Bridge & Iron Company N.V.
NOTES TO CONSOLIDATED FINANCIAL STATEMENTS — (Continued)
Performance Based Shares—Our performance based share awards are subject to the achievement of specified Company performance targets, including financial performance, stock price performance relative to industry peers or stock price performance relative to a construction industry index.
• | Financial Performance Based Grants—Financial performance based share awards are based upon EPS and generally vest over three years. The total initial fair value for these awards is determined based upon the market price of our stock at the grant date applied to the total number of shares that we anticipate will vest. This fair value is expensed over the vesting period based on the level of payout expected to be achieved, subject to retirement eligibility expense acceleration, where applicable. As a result of financial performance conditions met during 2016, we recognized $2,020 of compensation expense. During 2016, 2015 and 2014, financial performance based shares totaling 665, 702 and 312, respectively, were granted with a weighted-average grant-date fair value per share of $33.56, $41.67 and $79.86, respectively. During 2016, upon vesting and achievement of certain performance goals, we distributed 370 financial performance based shares with a weighted-average grant-date fair value per share of $66.10. The total fair value of financial performance based share awards that vested during 2016, 2015 and 2014 was $24,446, $23,463 and $50,244, respectively. |
• | Stock Performance Based Grants—Stock performance based share awards are based upon stock price performance relative to industry peers or a construction industry index, and generally vest over three years. The total initial fair value for these awards is determined based upon a Monte Carlo simulation value at the grant date applied to the total number of granted target shares. This fair value is expensed ratably over the vesting period, and during 2016, we recognized $2,908 of compensation expense. During 2016, 166 stock performance based shares were granted with a weighted-average grant-date fair value per share of $37.41 and was based upon a risk-free interest rate of 0.86%, historical volatility of 38% and a remaining performance period of 2.9 years. During 2015, 130 stock performance-based shares were granted with a weighted-average grant-date fair value per share of $37.35 and was based upon a risk-free interest rate of 1.10%, an expected dividend yield of 0.69%, historical volatility of 39% and a remaining performance period of 3.9 years (as these shares cliff vest at the end of four years). The risk-free interest rate was based on the U.S. Treasury yield curve on the grant date, expected dividend yield was based on dividend levels at the grant date, expected volatility was based on the historical volatility of our stock, and the expected life of shares granted represents the longest remaining performance period from the grant date. There were no stock performance based shares granted prior to 2015 and there were no vestings in 2016 or 2015. |
Stock Options—Stock options are generally granted with an exercise price equivalent to the market price of our stock on the date of grant and expire after 10 years. Options granted to employees generally vest over a period ranging from three to seven years. The total initial fair value for option awards is determined based upon the calculated Black-Scholes fair value of each stock option at the date of grant applied to the total number of options that we anticipate will vest. This fair value is expensed on a straight-line basis over the estimated vesting period, subject to retirement eligibility expense acceleration, where applicable. There were no options granted during 2016, 2015 or 2014.
The aggregate intrinsic value of options exercised was $533, $1,126 and $12,218 for 2016, 2015 and 2014, respectively. During 2016, we received net cash proceeds of $1,525, and realized an actual income tax benefit of $147, from the exercise of stock options. The following table presents stock option activity for 2016:
Shares | Weighted Average Exercise Price per Share | Weighted Average Remaining Contractual Life (in Years) | Aggregate Intrinsic Value | ||||||||||
Outstanding options at December 31, 2015 | 680 | $ | 21.32 | ||||||||||
Exercised | (59 | ) | $ | 26.06 | |||||||||
Forfeited / Expired | (23 | ) | $ | 57.38 | |||||||||
Outstanding options at December 31, 2016 (1) | 598 | $ | 19.47 | 2.0 | $ | 9,361 | |||||||
Exercisable options at December 31, 2016 | 575 | $ | 19.21 | 1.9 | $ | 9,217 | |||||||
(1) | We estimate that 596 of these options will ultimately vest. These options have a weighted-average exercise price per share of $19.45, a weighted-average remaining contractual life of 2.0 years and a current aggregate intrinsic value of $9,350. |
82
Chicago Bridge & Iron Company N.V.
NOTES TO CONSOLIDATED FINANCIAL STATEMENTS — (Continued)
15. INCOME TAXES
Income Tax (Expense) Benefit—The following table presents the sources of (loss) income before taxes and income tax (expense) benefit, by tax jurisdiction for 2016, 2015 and 2014:
Years Ended December 31, | ||||||||||||
2016 | 2015 | 2014 | ||||||||||
Sources of (Loss) Income Before Taxes | ||||||||||||
U.S. | $ | (659,218 | ) | $ | (943,917 | ) | $ | 390,853 | ||||
Non-U.S. | 421,955 | 432,725 | 516,689 | |||||||||
Total | $ | (237,263 | ) | $ | (511,192 | ) | $ | 907,542 | ||||
Sources of Income Tax (Expense) Benefit | ||||||||||||
Current income taxes | ||||||||||||
U.S. Federal (1) | $ | 740 | $ | 9,605 | $ | (31,274 | ) | |||||
U.S. State | (11,280 | ) | (2,313 | ) | (8,227 | ) | ||||||
Non-U.S. | (81,683 | ) | (80,799 | ) | (114,485 | ) | ||||||
Total current income taxes | $ | (92,223 | ) | $ | (73,507 | ) | $ | (153,986 | ) | |||
Deferred income taxes | ||||||||||||
U.S. Federal | $ | 81,243 | $ | 184,767 | $ | (102,101 | ) | |||||
U.S. State | 1,784 | 76 | 10,142 | |||||||||
Non-U.S. | 6,636 | (30,105 | ) | (25,472 | ) | |||||||
Total deferred income taxes | $ | 89,663 | $ | 154,738 | $ | (117,431 | ) | |||||
Total income tax (expense) benefit | $ | (2,560 | ) | $ | 81,231 | $ | (271,417 | ) | ||||
(1) | Tax expense of $6,409 and $4,925, and tax benefit of $14,021 associated with share-based compensation were recorded in APIC in 2016, 2015 and 2014, respectively. |
The following is a reconciliation of income taxes at The Netherlands’ (our country of domicile) statutory rate to income tax (expense) benefit for 2016, 2015 and 2014:
Years Ended December 31, | ||||||||||||
2016 | 2015 | 2014 | ||||||||||
Income tax benefit (expense) at statutory rate (25.0% for 2016, 2015 and 2014) | $ | 59,316 | $ | 127,798 | $ | (226,885 | ) | |||||
U.S. State income taxes | (6,967 | ) | (1,965 | ) | (13,561 | ) | ||||||
Non-deductible meals and entertainment | (11,124 | ) | (10,930 | ) | (8,549 | ) | ||||||
Non-U.S. valuation allowance established | (8,981 | ) | (1,989 | ) | (12,875 | ) | ||||||
Non-U.S. valuation allowance utilized | 23,809 | 5,251 | 15,899 | |||||||||
Statutory tax rate differential | 64,616 | 96,555 | (40,990 | ) | ||||||||
Branch and withholding taxes (net of tax benefit) | — | 692 | (1,941 | ) | ||||||||
Unremitted earnings of subsidiaries | 64,376 | (10,369 | ) | — | ||||||||
Noncontrolling interests | 20,931 | 20,306 | 22,122 | |||||||||
Non-deductible goodwill impairment | (229,250 | ) | (158,585 | ) | — | |||||||
Other, net | 20,714 | 14,467 | (4,637 | ) | ||||||||
Income tax (expense) benefit | $ | (2,560 | ) | $ | 81,231 | $ | (271,417 | ) | ||||
Effective tax rate | (1.1 | )% | 15.9 | % | 29.9 | % | |||
83
Chicago Bridge & Iron Company N.V.
NOTES TO CONSOLIDATED FINANCIAL STATEMENTS — (Continued)
Deferred Taxes—The principal temporary differences included in deferred income taxes reported on the December 31, 2016 and 2015 Balance Sheets were as follows:
December 31, | ||||||||
2016 | 2015 | |||||||
Deferred Tax Assets | ||||||||
U.S. Federal operating losses and credits | $ | 595,630 | $ | 626,232 | ||||
U.S. State operating losses and credits | 203,195 | 195,996 | ||||||
Non-U.S. operating losses | 50,410 | 56,612 | ||||||
Contract revenue and cost | 55,748 | 63,876 | ||||||
Employee compensation and benefit plan reserves | 80,733 | 75,754 | ||||||
Insurance and legal reserves | 16,209 | 25,215 | ||||||
Disallowed interest | 117,558 | 124,876 | ||||||
Other | 70,969 | 9,520 | ||||||
Total deferred tax assets | $ | 1,190,452 | $ | 1,178,081 | ||||
Valuation allowance | (160,568 | ) | (167,053 | ) | ||||
Net deferred tax assets | $ | 1,029,884 | $ | 1,011,028 | ||||
Deferred Tax Liabilities | ||||||||
Investment in foreign subsidiaries | $ | (14,644 | ) | $ | (79,021 | ) | ||
Depreciation and amortization | (292,439 | ) | (308,619 | ) | ||||
Net deferred tax liabilities | $ | (307,083 | ) | $ | (387,640 | ) | ||
Net total deferred tax assets | $ | 722,801 | $ | 623,388 | ||||
At December 31, 2016, we did not provide deferred income taxes on temporary differences of approximately $397,000 resulting primarily from earnings of our U.S. subsidiaries and certain foreign subsidiaries which are indefinitely reinvested. The reversal of these temporary differences could result in additional tax; however, it is not practicable to estimate the amount of any unrecognized deferred income tax liabilities at this time. Deferred income taxes are provided as necessary with respect to earnings that are not indefinitely reinvested.
On a periodic and ongoing basis we evaluate our DTAs and assess the appropriateness of our valuation allowances (“VA”). In assessing the need for a VA, we consider both positive and negative evidence related to the likelihood of realization of the DTAs. If, based on the weight of available evidence, our assessment indicates that it is more likely than not that a DTA will not be realized, we record a VA. Our assessments include, among other things, the value and quality of our backlog, evaluations of existing and anticipated market conditions, analysis of recent and historical operating results and projections of future results, strategic plans and alternatives for associated operations, as well as asset expiration dates, where applicable. If the factors upon which we based our assessment of realizability of our DTAs differ materially from our expectations, including future operating results being lower than our current estimates, our future assessments could be impacted and result in an increase in VA and increase in tax expense.
Income tax expense for 2016 benefited by approximately $15,000 from the release of VA for our Non-U.S. net operating losses (“NOL(s)”) and by approximately $67,000 from the reversal of a deferred tax liability associated with historical earnings of a non-U.S. subsidiary for which the earnings are no longer anticipated to be subject to tax. Income tax expense for 2015 was impacted by approximately $62,600, primarily due to the establishment of VA against U.S.-State NOLs generated in 2015 as a result of the impact of the sale of our Nuclear Operations (approximately $58,000). Income tax expense for 2016 and 2015 also reflects the non-deductibility of the goodwill impairments for the respective periods.
At December 31, 2016, we had total Non-U.S. NOLs of $221,500, including $117,500 in the U.K. and $104,000 in other jurisdictions. We believe it is more likely than not that all of the U.K. NOLs will be utilized. We believe it is more likely than not that $58,500 of Non-U.S. NOLs, in jurisdictions other than the U.K., will not be utilized and have placed a VA against these NOLs. Accordingly, at December 31, 2016, our net DTA associated with Non-U.S. NOLs was $31,600. Excluding NOLs having an indefinite carryforward, principally in the U.K., the Non-U.S. NOLs will expire from 2017 to 2036.
84
Chicago Bridge & Iron Company N.V.
NOTES TO CONSOLIDATED FINANCIAL STATEMENTS — (Continued)
At December 31, 2016, we had U.S.-Federal NOLs of $1,567,400. Of the U.S.-Federal NOLs, $413,100 were generated prior to 2014 and will expire in 2033. The remaining $1,154,300 of U.S.-Federal NOLs were generated in 2015 as a result of the sale of our Nuclear Operations and will expire in 2035. We believe it is more likely than not that all of the U.S.-Federal NOLs will be utilized. Accordingly, at December 31, 2016, our DTA associated with U.S.-Federal NOLs was $548,600.
At December 31, 2016, we had U.S.-State NOL DTAs of $193,100. We believe it is more likely than not that $136,900 of the U.S.-State NOL DTAs will not be utilized and have placed a VA against these NOL DTAs. Accordingly, at December 31, 2016, our net DTA associated with U.S.-State NOLs was $56,200. The U.S.-State NOLs will expire from 2017 to 2036.
At December 31, 2016, we had foreign tax credits and other tax credits of $27,400 and $29,900, respectively. We believe it is more likely than not that the credits will be realized within the carryforward periods. These credits are subject to various expiration dates beginning in 2022.
Unrecognized Income Tax Benefits—At December 31, 2016 and 2015, our unrecognized income tax benefits totaled $14,162 and $9,140, respectively, and we do not anticipate significant changes in this balance in the next twelve months. The following is a reconciliation of our unrecognized income tax benefits for the years ended December 31, 2016 and 2015:
Years Ended December 31, | ||||||||
2016 | 2015 | |||||||
Unrecognized income tax benefits at the beginning of the year | $ | 9,140 | $ | 13,458 | ||||
Increase as a result of: | ||||||||
Tax positions taken during the current period | 6,038 | 1,313 | ||||||
Decreases as a result of: | ||||||||
Lapse of applicable statute of limitations | — | (2,927 | ) | |||||
Settlements with taxing authorities | (1,016 | ) | (2,704 | ) | ||||
Unrecognized income tax benefits at the end of the year (1) | $ | 14,162 | $ | 9,140 | ||||
(1) | If these income tax benefits were ultimately recognized, approximately $11,000 and $6,000 of the December 31, 2016 and 2015 balances, respectively, would benefit tax expense as we are contractually indemnified for the remaining balances. |
We have operations, and are subject to taxation, in various jurisdictions, including significant operations in the U.S., The Netherlands, Canada, the U.K., Australia, South America and the Middle East. Tax years remaining subject to examination by worldwide tax jurisdictions vary by country and legal entity, but are generally open for tax years ending after 2006. To the extent penalties and associated interest are assessed on any underpayment of income tax, such amounts are accrued and classified as a component of income tax expense and interest expense, respectively. For 2016, 2015 and 2014, interest and penalties were not significant.
16. UNAPPROVED CHANGE ORDERS, CLAIMS, INCENTIVES AND OTHER PROJECT MATTERS
Unapproved Change Orders, Claims and Incentives—At December 31, 2016 and 2015, we had unapproved change orders and claims included in project price totaling approximately $121,100 and $98,500, respectively, for projects primarily within our Engineering & Construction and Fabrication Services operating groups. At December 31, 2016 and 2015, we also had incentives included in project price of approximately $51,400 and $99,300, respectively, for projects in our Engineering & Construction, Fabrication Services and Capital Services operating groups. Of the aforementioned unapproved change orders, claims and incentives, approximately $148,800 had been recognized as revenue on a cumulative POC basis through December 31, 2016.
The aforementioned amounts recorded in project price reflect our best estimate of recovery amounts; however, the ultimate resolution and amounts received could differ from these estimates and could have a material adverse effect on our results of operations, financial position and cash flow. See Note 12 for further discussion of outstanding receivables related to one of our large cost-reimbursable projects.
85
Chicago Bridge & Iron Company N.V.
NOTES TO CONSOLIDATED FINANCIAL STATEMENTS — (Continued)
Other Project Matters—Backlog for each of our operating groups generally consists of several hundred contracts and our results may be impacted by changes in estimated project margins. For 2016, significant changes in estimated margins on projects within our Engineering & Construction and Fabrication Services operating groups resulted in a decrease to our income from operations of approximately $328,000, and significant changes in estimated margins on projects within our Engineering & Construction operating group resulted in an increase to our IFO of approximately $124,000. For 2015 and 2014, individual projects with significant changes in estimated margins did not have a material net impact on our income from operations.
Two of the projects that resulted in a decrease to our IFO for 2016 were in a loss position at December 31, 2016. One of the loss projects, within our Engineering & Construction operating group, was impacted primarily by lower than anticipated labor productivity and extensions of schedule during the second half of 2016. At December 31, 2016, the project was approximately 65% complete and had a reserve for estimated losses of approximately $49,000. If future labor productivity differs from our current estimates, our schedule is further extended, or the project incurs schedule liquidated damages due to our inability to reach a favorable commercial resolution on such matters, the project may experience additional forecast cost increases. The other loss project, within our Fabrication Services operating group, was primarily impacted by lower than anticipated labor productivity. At December 31, 2016, the project was approximately 75% complete and had a reserve for estimated losses of approximately $5,000. If future labor productivity differs from our current estimates the project may experience additional forecast cost increases.
17. SEGMENT AND RELATED INFORMATION
Segment Information
Our management structure and internal and public segment reporting are aligned based upon the services offered by our four operating groups, which represent our reportable segments:
Engineering & Construction—Engineering & Construction provides EPC services for major energy infrastructure facilities.
Fabrication Services—Fabrication Services provides fabrication and erection of steel plate structures; fabrication of piping systems and process modules; manufacturing and distribution of pipe and fittings; and engineered products for the oil and gas, petrochemical, power generation, water and wastewater, mining and mineral processing industries.
Technology—Technology provides proprietary process technology licenses and associated engineering services and catalysts, primarily for the petrochemical and refining industries, and offers process planning and project development services and a comprehensive program of aftermarket support. Technology also has a 50% owned unconsolidated joint venture that provides proprietary process technology licenses and associated engineering services and catalyst, primarily for the refining industry, as well as a 33.3% owned unconsolidated joint venture that is commercializing a new natural gas power generation system that recovers the carbon dioxide produced during combustion.
Capital Services—Capital Services provides comprehensive and integrated maintenance services, environmental engineering and remediation, construction services, program management, and disaster response and recovery for private-sector customers and governments.
Our chief operating decision maker evaluates the performance of the aforementioned operating groups based upon revenue and income from operations. Each operating group’s income from operations reflects corporate costs, allocated based primarily upon revenue. Intersegment revenue is netted against the revenue of the segment receiving the intersegment services. For 2016, 2015 and 2014, intersegment revenue totaled approximately $268,300, $395,900 and $480,400, respectively. Intersegment revenue for the aforementioned periods primarily related to services provided by our Fabrication Services and Capital Services operating groups to our Engineering & Construction operating group and Capital Services operating group to our Fabrication Services operating group.
86
Chicago Bridge & Iron Company N.V.
NOTES TO CONSOLIDATED FINANCIAL STATEMENTS — (Continued)
The following table presents total revenue, depreciation and amortization, equity earnings, income from operations, capital expenditures by reportable segment for 2016, 2015, and 2014:
Years Ended December 31, | ||||||||||||
2016 | 2015 | 2014 | ||||||||||
Revenue | ||||||||||||
Engineering & Construction | $ | 6,105,488 | $ | 7,697,684 | $ | 7,623,381 | ||||||
Fabrication Services | 2,110,310 | 2,442,690 | 2,738,981 | |||||||||
Technology | 284,424 | 399,099 | 385,126 | |||||||||
Capital Services | 2,179,336 | 2,390,031 | 2,227,442 | |||||||||
Total revenue | $ | 10,679,558 | $ | 12,929,504 | $ | 12,974,930 | ||||||
Depreciation And Amortization | ||||||||||||
Engineering & Construction | $ | 16,947 | $ | 48,388 | $ | 62,517 | ||||||
Fabrication Services | 54,449 | 56,310 | 61,344 | |||||||||
Technology | 23,052 | 22,864 | 23,703 | |||||||||
Capital Services | 28,074 | 33,573 | 33,834 | |||||||||
Total depreciation and amortization | $ | 122,522 | $ | 161,135 | $ | 181,398 | ||||||
Equity Earnings | ||||||||||||
Engineering & Construction | $ | 9,818 | $ | (2,427 | ) | $ | — | |||||
Fabrication Services | (1,486 | ) | (3,812 | ) | (77 | ) | ||||||
Technology | 16,238 | 21,016 | 24,613 | |||||||||
Capital Services | 2,256 | 912 | 689 | |||||||||
Total equity earnings | $ | 26,826 | $ | 15,689 | $ | 25,225 | ||||||
(Loss) Income From Operations | ||||||||||||
Engineering & Construction (1) | $ | 158,704 | $ | (875,321 | ) | $ | 518,671 | |||||
Fabrication Services | 183,141 | 225,267 | 274,487 | |||||||||
Technology | 105,293 | 150,877 | 147,782 | |||||||||
Capital Services (2) | (592,056 | ) | 74,060 | 81,353 | ||||||||
Total operating groups | $ | (144,918 | ) | $ | (425,117 | ) | $ | 1,022,293 | ||||
Integration related costs | — | — | (39,685 | ) | ||||||||
Total (loss) income from operations | $ | (144,918 | ) | $ | (425,117 | ) | $ | 982,608 | ||||
Capital Expenditures | ||||||||||||
Engineering & Construction | $ | 3,729 | $ | 14,484 | $ | 42,152 | ||||||
Fabrication Services | 31,538 | 41,434 | 44,594 | |||||||||
Technology | 10,038 | 8,091 | 9,730 | |||||||||
Capital Services | 7,157 | 14,843 | 21,148 | |||||||||
Total capital expenditures | $ | 52,462 | $ | 78,852 | $ | 117,624 | ||||||
(1) | As discussed further in Note 4, during 2015 we recorded a non-cash pre-tax charge of approximately $1,505,900 within our Engineering & Construction operating group related to the sale of our Nuclear Operations. In addition, during 2016 we recorded a non-cash pre-tax charge of approximately $148,100 resulting from a reserve for the Transaction Receivable associated with the 2015 sale of our Nuclear Operations. |
(2) | As discussed further in Note 6, during 2016 we recorded a non-cash pre-tax charge of approximately $655,000 related to the partial impairment of goodwill within our Capital Services operating group resulting from our fourth quarter annual impairment assessment. |
87
Chicago Bridge & Iron Company N.V.
NOTES TO CONSOLIDATED FINANCIAL STATEMENTS — (Continued)
December 31, | ||||||||||||
2016 | 2015 | 2014 | ||||||||||
Assets | ||||||||||||
Engineering & Construction | $ | 3,616,803 | $ | 4,127,435 | $ | 4,550,700 | ||||||
Fabrication Services | 2,337,724 | 2,549,146 | 2,225,707 | |||||||||
Technology | 880,298 | 820,707 | 836,549 | |||||||||
Capital Services | 1,004,595 | 1,694,772 | 1,756,874 | |||||||||
Total assets | $ | 7,839,420 | $ | 9,192,060 | $ | 9,369,830 | ||||||
Geographic Information
The following table presents total revenue by country for those countries with revenue in excess of 10% of consolidated revenue during a given year based upon the location of the applicable projects:
Years Ended December 31, | ||||||||||||
2016 | 2015 | 2014 | ||||||||||
Revenue by Country | ||||||||||||
United States | $ | 7,547,534 | $ | 8,408,633 | $ | 6,682,054 | ||||||
Australia | 1,745,607 | 2,172,026 | 2,498,848 | |||||||||
Other (1) | 1,386,417 | 2,348,845 | 3,794,028 | |||||||||
Total revenue | $ | 10,679,558 | $ | 12,929,504 | $ | 12,974,930 | ||||||
(1) | Revenue earned in other countries, including The Netherlands (our country of domicile), was not individually greater than 10% of our consolidated revenue in 2016, 2015 or 2014. |
Our long-lived assets are primarily goodwill, other intangible assets and property and equipment. At December 31, 2016, 2015 and 2014, approximately 80%, 80% and 80% of property and equipment were located in the U.S., respectively, while our remaining assets were strategically located throughout the world. Our long-lived assets attributable to operations in The Netherlands were not significant at December 31, 2016, 2015 or 2014.
Significant Customers
For 2016, 2015 and 2014, revenue for a customer in our Engineering & Construction and Fabrication Services operating groups was approximately $1,136,000 (approximately 11% of our consolidated 2016 revenue), approximately $1,647,000 (approximately 13% of our consolidated 2015 revenue), and approximately $1,956,000 (approximately 15% of our consolidated 2014 revenue), respectively. In addition, for 2016, revenue for two other customers in our Engineering & Construction operating group were approximately $1,640,000 (approximately 15% of our consolidated 2016 revenue) and approximately $1,099,000 (approximately 10% of our consolidated 2016 revenue).
18. SUBSEQUENT EVENTS
Amendments to Debt and Credit Facility Agreements—On February 24, 2017, and effective December 31, 2016, we amended our Revolving Facility, Second Revolving Facility, Second Term Loan, Senior Notes and Second Senior Notes. See Note 9 for additional discussion.
Disposition of Capital Services Operating Group—On February 27, 2017, we entered into a definitive agreement with CSVC Acquisition Corp. ("CSVC"), in which CSVC will acquire our Capital Services operating group for an estimated purchase price of approximately $755,000. The transaction is expected to close in the second quarter 2017 and is anticipated to result in income tax expense of approximately $100,000 in the quarter of close resulting from a taxable gain on the transaction.
88
Chicago Bridge & Iron Company N.V.
NOTES TO CONSOLIDATED FINANCIAL STATEMENTS — (Continued)
19. QUARTERLY OPERATING RESULTS (UNAUDITED)
The following table presents selected unaudited consolidated financial information on a quarterly basis for 2016 and 2015:
Quarter Ended 2016 | March 31 | June 30 | September 30 | December 31 | ||||||||||||
(In thousands, except per share data) | ||||||||||||||||
Revenue | $ | 2,667,733 | $ | 2,695,615 | $ | 2,776,177 | $ | 2,540,033 | ||||||||
Gross profit | $ | 287,605 | $ | 294,526 | $ | 326,568 | $ | 117,357 | ||||||||
Goodwill impairment (1) | $ | — | $ | — | $ | — | $ | (655,000 | ) | |||||||
Loss on net assets sold and intangible assets impairment (1) | $ | — | $ | — | $ | — | $ | (148,148 | ) | |||||||
Net income (loss) (2) | $ | 119,962 | $ | 132,548 | $ | 168,419 | $ | (660,752 | ) | |||||||
Net income (loss) attributable to CB&I | $ | 106,925 | $ | 123,839 | $ | 121,760 | $ | (665,693 | ) | |||||||
Net income (loss) attributable to CB&I per share—basic | $ | 1.02 | $ | 1.18 | $ | 1.20 | $ | (6.65 | ) | |||||||
Net income (loss) attributable to CB&I per share—diluted | $ | 1.01 | $ | 1.17 | $ | 1.20 | $ | (6.65 | ) | |||||||
Quarter Ended 2015 | March 31 | June 30 | September 30 | December 31 | ||||||||||||
(In thousands, except per share data) | ||||||||||||||||
Revenue | $ | 3,125,745 | $ | 3,207,113 | $ | 3,321,682 | $ | 3,274,964 | ||||||||
Gross profit | $ | 370,171 | $ | 383,123 | $ | 377,717 | $ | 381,305 | ||||||||
Goodwill impairment (3) | $ | — | $ | — | $ | (453,100 | ) | $ | — | |||||||
Loss on net assets sold and intangible assets impairment (3) | $ | — | $ | — | $ | (707,380 | ) | $ | (345,371 | ) | ||||||
Net income (loss) | $ | 156,749 | $ | 185,888 | $ | (725,554 | ) | $ | (47,044 | ) | ||||||
Net income (loss) attributable to CB&I | $ | 132,228 | $ | 169,515 | $ | (740,433 | ) | $ | (65,725 | ) | ||||||
Net income (loss) attributable to CB&I per share—basic | $ | 1.22 | $ | 1.56 | $ | (7.02 | ) | $ | (0.63 | ) | ||||||
Net income (loss) attributable to CB&I per share—diluted | $ | 1.21 | $ | 1.55 | $ | (7.02 | ) | $ | (0.63 | ) | ||||||
(1) | In the fourth quarter 2016, we recorded a non-cash pre-tax charge of approximately $655,000 related to the partial impairment of goodwill resulting from our fourth quarter annual impairment assessment. The net loss reflects the non-deductibility of the impairment charge. In addition, we recorded a non-cash pre-tax charge of approximately $148,100 (approximately $96,300 after-tax) resulting from a reserve for the Transaction Receivable associated with the 2015 sale of our Nuclear Operations. |
(2) | In the fourth quarter 2016, we recorded an income tax benefit of approximately $67,000 resulting from the reversal of a deferred tax liability associated with historical earnings of a non-U.S. subsidiary for which the earnings are no longer anticipated to be subject to tax. |
(3) | In 2015, we recorded a non-cash pre-tax charge of approximately $1,505,900 (approximately $1,135,200 after-tax) related to the impairment of goodwill (approximately $453,100 recorded in the third quarter) and intangible assets (approximately $79,100 recorded in the third quarter) and a loss on net assets sold (approximately $628,300 and $345,400 recorded in the third and fourth quarters, respectively). |
Item 9. Changes in and Disagreements With Accountants on Accounting and Financial Disclosure
None.
89
Item 9A. Controls and Procedures
Management’s Report on Internal Control Over Financial Reporting
Management’s Report on Internal Control Over Financial Reporting, which can be found in Item 8, is incorporated herein by reference.
Evaluation of Disclosure Controls and Procedures
As of the end of the period covered by this annual report on Form 10-K, we carried out an evaluation, under the supervision and with the participation of our management, including the Chief Executive Officer (“CEO”) and Chief Financial Officer (“CFO”), of the effectiveness of the design and operation of our disclosure controls and procedures (as such term is defined in Rules 13a-15(e) and 15d-15(e) under the Exchange Act). Based upon such evaluation, the CEO and CFO have concluded that, as of the end of such period, our disclosure controls and procedures are effective.
Attestation Report of the Independent Registered Public Accounting Firm
Our internal control over financial reporting has been audited by Ernst & Young LLP, an independent registered public accounting firm, as indicated in their report, which can be found in Item 8 and is incorporated herein by reference.
Changes in Internal Controls Over Financial Reporting
There were no changes in our internal controls over financial reporting that occurred during the fourth quarter 2016, that have materially affected, or are reasonably likely to materially affect, our internal controls over financial reporting. Management’s Report on Internal Controls at December 31, 2016 is included in Item 8.
Item 9B. Other Information ($ values in thousands)
Amendments to Credit Facilities and Note Agreements—On February 24, 2017, and effective for the period ended December 31, 2016, we amended:
(1) our five-year, $1,350,000, committed and unsecured revolving facility (the “Revolving Facility”) with Bank of America N.A. (“BofA”), as administrative agent, and BNP Paribas Securities Corp., BBVA Compass, Credit Agricole Corporate and Investment Bank (“Credit Agricole”) and TD Securities, each as syndication agents, which expires in October 2018;
(2) our five-year, $800,000, committed and unsecured revolving credit facility (the “Second Revolving Facility”) with BofA, as administrative agent, and BNP Paribas Securities Corp., BBVA Compass, Credit Agricole and Bank of Tokyo Mitsubishi UFJ, each as syndication agents, which expires in July 2020;
(3) our $500,000 outstanding on a five-year, $500,000 unsecured term loan (the “Second Term Loan”) with BofA as administrative agent;
(4) our Senior Notes totaling $800,000 in the aggregate (the “Senior Notes”) with Merrill Lynch, Pierce, Fenner & Smith Incorporated, and Credit Agricole, as administrative agents; and
(5) our Second Senior Notes totaling $200,000 (the “Second Senior Notes”) with BofA as administrative agent.
The financial covenants for these agreements were amended to adjust our maximum leverage ratio from 3.00 to 3.50 and our minimum net worth from $1,736,651 to $1,201,507. In addition, our maximum leverage ratio will decrease to 3.00 on December 31, 2017, or 45 days subsequent to the closing date of the sale of our Capital Services operating group (the "Closing Date"), if earlier. Our Revolving Facility will reduce from $1,350,000 to $1,150,000 at the Closing Date and share repurchases and acquisitions are not permitted if our leverage ratio exceeds 3.00. The amendments to our Senior Notes and Second Senior Notes also included other provisions relating to maintaining our leverage ratio and credit profile.
The foregoing description of the amendments to our credit facilities and note agreements does not purport to be complete and is qualified in its entirety by reference to the complete text of the amendments filed as Exhibits 10.15(e), 10.30(e), 10.31(b), 10.32(b) and 10.33(c) to this Form 10-K.
Disposition of Capital Services Operating Group—On February 27, 2017, CB&I, through our subsidiary, The Shaw Group Inc., a Louisiana corporation ("Seller"), entered into an agreement (the "Purchase Agreement") with CSVC Acquisition Corp., a Delaware corporation ("CSVC" and "Buyer") and an affiliate of Veritas Capital, a private equity investment firm, to sell our Capital Services business group (the “Business”) by means of a sale of all of the issued and outstanding equity interests in each of four subsidiaries, domestic and foreign, newly formed to hold and sell the Business pursuant to the Purchase Agreement (the “Companies”). The Business provides services as a maintenance and modification contractor for the nuclear power industry, industrial maintenance industry and federal, state and local governments in the areas of (a) operations and maintenance support services, (b) environmental engineering and remediation, (c) infrastructure engineering, (d) procurement, construction, and decommissioning, (e) program management for disaster response and (f) emergency response and disaster
90
recovery, as further described in the Purchase Agreement. We have guaranteed the obligations of the Seller under the Purchase Agreement.
Pursuant to the Purchase Agreement, Buyer will pay a purchase price of $755,000 (the "Purchase Price") in consideration for the sale of the Business. The Purchase Price is subject to adjustments including an increase by the amount of all Cash of the Business at closing, a decrease by the amount of all indebtedness of the Business at closing, and increase or decrease, as the case may be, by the amount of the Working Capital Adjustment, if any, as those terms are defined in and calculated under the Purchase Agreement. The Purchase Agreement contains customary representations, warranties and covenants by the respective parties. The representations and warranties were made solely for purposes of the Purchase Agreement and may be subject to important qualifications and limitations agreed to by the parties in connection with negotiating their terms and may be subject to a contractual standard of materiality that may be different from what may be viewed as material to shareholders. The representations and warranties should not be relied on as factual information at the time they were made or otherwise. Subject to the prior satisfaction and/or waiver of all conditions to closing under the terms and conditions of the Purchase Agreement, the purchase and sale of the Business is scheduled to take place on or before August 28, 2017 (the “Outside Date”). In connection with the Purchase Agreement, Seller has agreed to provide certain transitional services after closing.
Each party's obligations to consummate the transaction pursuant to the Purchase Agreement is subject to customary conditions as set out therein, including, among others, (i) subject to certain exceptions, the accuracy of the representations and warranties of the parties; (ii) performance in all material respects by each of the parties of its obligations and conditions; (iii) absence of any change, event, state of facts, development, occurrence or effect that has or would reasonably be expected to have a Material Adverse Effect, as defined in the Purchase Agreement; and (iv) regulatory clearance under the Hart-Scott-Rodino Antitrust Improvements Act of 1976, as amended, and the receipt of such other applicable approval or review required under applicable law.
The Purchase Agreement may be terminated at any time prior to the closing of the transaction: (i) by mutual agreement; (ii) by either party not in material breach if there have been certain material breaches in or failures to perform certain representations, warranties, covenants or agreements made by the other party and such breaches, inaccuracies or failures cannot be cured by the other party within a certain time prior to the Outside Date; (iii) by either party if the transaction has not closed on or prior to the Outside Date, as long as the action or inaction of such party or any of its Affiliates has not been a principal cause of or resulted in the failure of the closing as defined by the Purchase Agreement; or (iv) as otherwise provided by the terms of the Purchase Agreement.
The foregoing description of the Purchase Agreement does not purport to be complete and is qualified in its entirety by reference to the Purchase Agreement, which is filed as Exhibit 2.4 hereto, and is incorporated herein by reference.
PART III
Item 10. Directors, Executive Officers and Corporate Governance
We have a code of ethics that applies to the CEO, the CFO and the Corporate Controller, as well as our directors and all employees. Our code of ethics can be found at our Internet website “investors.cbi.com/corporate-governance” and is incorporated herein by reference.
We submitted a Section 12(a) CEO certification to the New York Stock Exchange in 2016. Also during 2016, we filed with the Securities Exchange Commission certifications, pursuant to Rule 13A-14 of the Exchange Act as adopted pursuant to Section 302 of the Sarbanes-Oxley Act of 2002, as Exhibits 31.1 and 31.2 to this Form 10-K.
Information appearing under “Committees of Our Supervisory Board” and “Common Stock Ownership By Certain Persons and Management – Section 16(a) Beneficial Ownership Reporting Compliance” in the Company’s 2017 Proxy Statement is incorporated herein by reference. Additionally, information regarding our Supervisory Directors, executive officers and nominees for Supervisory Director appears under “Item 1 Election of One Member of Our Supervisory Board to Serve until 2019”; “Item 2 Election of Three Members of Our Supervisory Board to Serve until 2020”; and “Common Stock Ownership By Certain Persons and Management” in the Company’s 2017 Proxy Statement and is incorporated herein by reference.
Item 11. Executive Compensation
Information appearing under “Executive Compensation Discussion and Analysis (“CD&A”),” “Committees of Our Supervisory Board,” “Executive Officer Compensation Tables,” “Summary Compensation Table,” “Grants of Plan-Based Awards,” “Outstanding Equity Awards at Fiscal Year-End 2016,” “Option Exercises and Stock Vested,” “Nonqualified Deferred Compensation,” “Potential Payments Upon Termination or Change of Control,” “Director Compensation,” and “Risk Analysis” in the 2017 Proxy Statement is incorporated herein by reference.
91
Item 12. Security Ownership of Certain Beneficial Owners and Management and Related Stockholder Matters
Information appearing under “Common Stock Ownership By Certain Persons and Management” in the 2017 Proxy Statement is incorporated herein by reference. In addition, disclosure regarding equity compensation plan information in “Item 5. Market for Registrant’s Common Equity, Related Stockholder Matters and Issuer Purchases of Equity Securities” of Part II of this report is herein incorporated by reference.
Item 13. Certain Relationships and Related Transactions, and Director Independence
Information appearing under “Corporate Governance – Certain Transactions” in the 2017 Proxy Statement is incorporated herein by reference.
Item 14. Principal Accounting Fees and Services
Information appearing under “Committees of Our Supervisory Board – Audit Fees” in the 2017 Proxy Statement is incorporated herein by reference.
PART IV
Item 15. Exhibits, Financial Statement Schedules
Financial Statements
The following Consolidated Financial Statements and Reports of Independent Registered Public Accounting Firm included under Item 8 of Part II of this report are herein incorporated by reference:
Reports of Independent Registered Public Accounting Firm
Consolidated Statements of Operations—For the years ended December 31, 2016, 2015 and 2014
Consolidated Statements of Comprehensive Income—For the years ended December 31, 2016, 2015 and 2014
Consolidated Balance Sheets—As of December 31, 2016 and 2015
Consolidated Statements of Cash Flows—For the years ended December 31, 2016, 2015 and 2014
Consolidated Statements of Changes in Shareholders’ Equity—For the years ended December 31, 2016, 2015 and 2014
Notes to Consolidated Financial Statements
Financial Statement Schedules
All schedules have been omitted because the schedules are not applicable, the required information is not in amounts sufficient to require submission of the schedule, or the information required is shown in the Consolidated Financial Statements or notes thereto previously included under Item 8 of Part II of this report.
Quarterly financial data for the years ended December 31, 2016 and 2015 is shown in the Notes to Consolidated Financial Statements included under Item 8 of Part II of this report.
Exhibits
The Exhibit Index on page [93] and Exhibits being filed are submitted as a separate section of this report.
92
SIGNATURES
Pursuant to the requirements of Section 13 or 15(d) of the Securities Exchange Act of 1934, the Registrant has duly caused this report to be signed on its behalf by the undersigned, thereunto duly authorized, on February 28, 2017.
Chicago Bridge & Iron Company N.V. |
/s/ Philip K. Asherman |
Philip K. Asherman |
(Authorized Signer) |
Pursuant to the requirements of the Securities Exchange Act of 1934, this report has been signed below by the following persons on behalf of the Registrant and in the capacities indicated on February 28, 2017.
Signature | Title | |
/s/ Philip K. Asherman | President and Chief Executive Officer | |
Philip K. Asherman | (Principal Executive Officer) | |
Supervisory Director | ||
/s/ Michael S. Taff | Executive Vice President and Chief Financial Officer | |
Michael S. Taff | (Principal Financial Officer) | |
/s/ Westley S. Stockton | Vice President, Corporate Controller | |
Westley S. Stockton | and Chief Accounting Officer | |
(Principal Accounting Officer) | ||
/s/ L. Richard Flury | Supervisory Director and Non-Executive Chairman | |
L. Richard Flury | ||
/s/ James R. Bolch | Supervisory Director | |
James R. Bolch | ||
/s/ Deborah M. Fretz | Supervisory Director | |
Deborah M. Fretz | ||
/s/ W. Craig Kissel | Supervisory Director | |
W. Craig Kissel | ||
/s/ Larry D. McVay | Supervisory Director | |
Larry D. McVay | ||
/s/ James H. Miller | Supervisory Director | |
James H. Miller | ||
/s/ Michael L. Underwood | Supervisory Director | |
Michael L. Underwood | ||
/s/ Marsha C. Williams | Supervisory Director | |
Marsha C. Williams | ||
Registrant’s Agent for Service in the United States | ||
/s/ Kirsten B. David | ||
Kirsten B. David | ||
93
EXHIBIT INDEX
2.1 (9) | Share Sale and Purchase Agreement, dated as of August 24, 2007, by and among ABB Holdings Inc., ABB Holdings B.V., ABB Asea Brown Boveri Ltd., Chicago Bridge & Iron Company, Chicago Bridge & Iron Company B.V. and Chicago Bridge & Iron Company N.V. | |
2.2 (18) | Transaction Agreement, dated as of July 30, 2012, by and among The Shaw Group, Inc., Chicago Bridge & Iron Company N.V. and Crystal Acquisition Subsidiary Inc. | |
2.3 (28) | Purchase Agreement, dated October 27, 2015, by and among Chicago Bridge & Iron Company N.V., CB&I Stone & Webster, Inc., WSW Acquisition Co., LLC and Westinghouse Electric Company LLC. | |
2.4 (1) | Purchase Agreement, dated as of February 27, 2017, by and among Chicago Bridge & Iron Company N.V., The Shaw Group Inc., CBI Peruana SAC, Horton CBI, Limited and CSVC Acquisition Corp. | |
3 (8) | Amended Articles of Association of the Company (English translation) | |
10.1 (2)* | Form of Indemnification Agreement between the Company and its Supervisory and Managing Directors | |
10.2 (24)* | The Company’s Deferred Compensation Plan As Amended and Restated January 1, 2008 | |
10.3 (3)* | The Company’s Excess Benefit Plan | |
(a) Amendments of Sections 2.13 and 4.3 of the Company’s Excess Benefit Plan (7) | ||
10.4 (2)* | Employee Benefits Agreement | |
10.5 (4)* | The Company’s Supervisory Board of Directors Fee Payment Plan | |
10.6 (4)* | The Company’s Supervisory Board of Directors Stock Purchase Plan | |
10.7 (10)* | The Chicago Bridge & Iron 2008 Long-Term Incentive Plan As Amended May 8, 2008 | |
(a) 2009 Amendment to the Chicago Bridge & Iron 2008 Long-Term Incentive Plan (11) | ||
(b) 2012 Amendment to the Chicago Bridge & Iron 2008 Long-Term Incentive Plan (17) | ||
(c) 2015 Amendment to the Chicago Bridge & Iron 2008 Long-Term Incentive Plan (25) | ||
(d) 2016 Amendment to the Chicago Bridge & Iron 2008 Long-Term Incentive Plan (29) | ||
10.8 (5)* | The Company’s Incentive Compensation Program | |
10.9 (30)* | Chicago Bridge & Iron Savings Plan as amended and restated as of January 1, 2016 | |
10.10 (6)* | Chicago Bridge & Iron 2001 Employee Stock Purchase Plan | |
(a) 2009 Amendment to Chicago Bridge & Iron 2001 Employee Stock Purchase Plan (12) | ||
10.11 (13) | Sales Agency Agreement, dated August 18, 2009, between Chicago Bridge & Iron N.V. and Calyon Securities (USA) Inc. | |
(a) Amendment to the Sales Agency Agreement (15) | ||
10.12 (14) | Third Amended and Restated Credit Agreement dated July 23, 2010 | |
(a) Exhibits and Schedules to the Third Amended and Restated Credit Agreement (14) | ||
(b) Joinder to the Third Amended and Restated Credit Agreement (14) | ||
(c) Amendment No. 1, dated as of October 14, 2011, to the Third Amended and Restated Credit Agreement (16) | ||
(d) Amendment No. 2, dated as of December 21, 2012, to the Third Amended and Restated Credit Agreement (19) | ||
10.13 (19) | Revolving Credit Agreement, dated as of December 21, 2012, by and among Chicago Bridge & Iron Company N.V., Chicago Bridge & Iron Company (Delaware), the Other Subsidiary Borrowers, Bank of America, N.A., as Administrative Agent and Swing Line Lender, Crédit Agricole Corporate and Investment Bank as Syndication Agent, and the lenders and other financial institutions party thereto | |
(a) Amendment No. 1, dated as of October 28, 2013, to the Revolving Credit Agreement (21) | ||
(b) Amendment No. 2, dated as of December 31, 2014, to the Revolving Credit Agreement (24) | ||
10.14 (19) | Term Loan Agreement, dated December 21, 2012, by and among Chicago Bridge & Iron Company N.V., Chicago Bridge & Iron Company (Delaware), Bank of America, N.A., as Administrative Agent, Crédit Agricole Corporate and Investment Bank as Syndication Agent, and the lenders and other financial institutions party thereto | |
(a) Amendment No. 1, dated as of October 28, 2013, to the Term Loan Agreement (21) | ||
(b) Amendment No. 2, dated as of December 31, 2014, to the Term Loan Agreement (24) | ||
(c) Amendment No. 3, dated as of July 8, 2015, to the Term Loan Agreement (26) | ||
94
(d) Amendment No. 4, dated as of October 27, 2015, to the Term Loan Agreement (28) | ||
10.15 (20) | Note Purchase and Guarantee Agreement dated December 27, 2012 | |
(a) First Amendment, dated as of February 12, 2013, to the Note Purchase and Guarantee Agreement (28) | ||
(b) Amendment No. 2, dated as of June 30, 2015, to the Note Purchase and Guarantee Agreement (28) | ||
(c) Third Amendment, dated as of October 27, 2015, to the Note Purchase and Guarantee Agreement (28) | ||
(d) Fourth Amendment, dated as of December 29, 2016, to the Note Purchase and Guarantee Agreement (1) | ||
(e) Fifth Amendment, dated as of February 24, 2017, to the Note Purchase and Guarantee Agreement (1) | ||
10.16 (22) | The Shaw Group Inc. 401(k) Plan as amended and restated as of January 1, 2014 | |
10.17 (32)* | The Shaw Group Inc. 2008 Omnibus Incentive Plan | |
(a) First Amendment to The Shaw Group Inc. 2008 Omnibus Incentive Plan (35) | ||
(b) Second Amendment to The Shaw Group Inc. 2008 Omnibus Incentive Plan (35) | ||
(c) Third Amendment to The Shaw Group Inc. 2008 Omnibus Incentive Plan (23) | ||
(d) Fourth Amendment to The Shaw Group Inc. 2008 Omnibus Incentive Plan (25) | ||
10.18 (33)* | Form of Employee Incentive Stock Option Award under The Shaw Group Inc. 2008 Omnibus Incentive Plan | |
10.19 (33)* | Form of Employee Nonqualified Stock Option Award Agreement under The Shaw Group Inc. 2008 Omnibus Incentive Plan | |
10.20 (36)* | Form of Employee Restricted Stock Unit Award Agreement under The Shaw Group Inc. 2008 Omnibus Incentive Plan | |
10.21 (36)* | Form of Employee Cash Settled Restricted Stock Unit Award Agreement under The Shaw Group Inc. 2008 Omnibus Incentive Plan | |
10.22 (31) | Bond Trust Deed, dated October 13, 2006, between Nuclear Energy Holdings, L.L.C. (“NEH”) and The Bank of New York, as trustee | |
10.23 (31) | Parent Pledge Agreement, dated October 13, 2006, between the Company and The Bank of New York | |
10.24 (31) | Issuer Pledge Agreement, dated October 13, 2006, between NEH and The Bank of New York | |
10.25 (31) | Deed of Charge, dated October 13, 2006, among NEH, The Bank of New York, as trustee, and Morgan Stanley Capital Services Inc., as swap counterparty | |
10.26 (31) | Transferable Irrevocable Direct Pay Letter of Credit (Principal Letter of Credit) effective October 13, 2006 of Bank of America in favor of NEH | |
10.27 (31) | Transferable Irrevocable Direct Pay Letter of Credit (Interest Letter of Credit) effective October 13, 2006 of Bank of America in favor of NEH | |
10.28 (31) | Reimbursement Agreement dated as of October 13, 2006, between The Shaw Group Inc. and Toshiba | |
10.29 (34) | First Lien Intercreditor Agreement Dated As Of November 29, 2010, Among Nuclear Innovation North America LLC, Nina Investments Holdings LLC, Nuclear Innovation North America Investments LLC, Nina Texas 3 Llc and Nina Texas 4 LLC, The Other Grantors Party Hereto, Toshiba America Nuclear Energy Corporation, as Toshiba Collateral Agent, and The Shaw Group Inc., As Shaw Collateral Agent | |
10.30 (21) | Revolving Credit Agreement, dated as of October 28, 2013, by and among Chicago Bridge & Iron Company N.V., Chicago Bridge & Iron Company (Delaware), the Other Subsidiary Borrowers, Bank of America, N.A., as Administrative Agent and BNP Paribas Securities Corp., BBVA Compass, Crédit Agricole Corporate and Investment Bank and The Royal Bank of Scotland plc, as Syndication Agents, and the lenders and other financial institutions party thereto | |
(a) Amendment No. 1, dated as of June 11, 2014, to the Revolving Credit Agreement (24) | ||
(b) Amendment No. 2, dated as of December 31, 2014, to the Revolving Credit Agreement (24) | ||
(c) Amendment No. 3, dated as of July 8, 2015, to the Revolving Credit Agreement (26) | ||
(d) Amendment No. 4, dated as of October 27, 2015, to the Revolving Credit Agreement (28) | ||
(e) Amendment No. 5, dated as of February 24, 2017, to the Revolving Credit Agreement (1) | ||
10.31 (26) | Amended and Restated Revolving Credit Agreement, dated as of July 8, 2015, by and among Chicago Bridge & Iron Company N.V., Chicago Bridge & Iron Company (Delaware), as the Initial Borrower, certain Subsidiaries of Chicago Bridge & Iron Company N.V. party thereto, as Designated Borrowers, Bank of America, N.A., as Administrative Agent, Swing Line Lender and L/C Issuer, and the lenders party thereto, and the agents party thereto | |
95
(a) Amendment No. 1, dated as of October 27, 2015, to the Amended and Restated Revolving Credit Agreement (28) | ||
(b) Amendment No. 2, dated as of February 24, 2017, to the Amended and Restated Revolving Credit Agreement (1) | ||
10.32 (26) | Term Loan Agreement, dated as of July 8, 2015, by and among Chicago Bridge & Iron Company N.V., Chicago Bridge & Iron Company (Delaware), as Borrower, Bank of America, N.A., as Administrative Agent, the lenders party thereto, and the agents party thereto | |
(a) Amendment No. 1, dated as of October 27, 2015, to the Term Loan Agreement (28) | ||
(b) Amendment No. 2, dated as of February 24, 2017, to the Term Loan Agreement (1) | ||
10.33 (27) | Note Purchase and Guarantee Agreement dated as of July 22, 2015, by and among Chicago Bridge & Iron Company N.V., Chicago Bridge & Iron Company (Delaware) and each of the purchasers party thereto | |
(a) First Amendment, dated as of October 27, 2015, to the Note Purchase and Guarantee Agreement (28) | ||
(b) Second Amendment, dated as of December 29, 2016, to the Note Purchase and Guarantee Agreement (1) | ||
(c) Third Amendment, dated as of February 24, 2017, to the Note Purchase and Guarantee Agreement (1) | ||
10.34 (28) | Employee Matters Agreement, dated October 27, 2015, by and among Chicago Bridge & Iron Company N.V., CB&I Stone & Webster, Inc., WSW Acquisition Co., LLC and Westinghouse Electric Company LLC. | |
21.1 (1) | List of Significant Subsidiaries | |
23.1 (1) | Consent of Independent Registered Public Accounting Firm | |
31.1 (1) | Certification of the Company’s Chief Executive Officer pursuant to Rule 13A-14 of the Securities Exchange Act of 1934 as Adopted Pursuant to Section 302 of the Sarbanes-Oxley Act of 2002 | |
31.2 (1) | Certification of the Company’s Chief Financial Officer pursuant to Rule 13A-14 of the Securities Exchange Act of 1934 as Adopted Pursuant to Section 302 of the Sarbanes-Oxley Act of 2002 | |
32.1 (1) | Certification of the Company’s Chief Executive Officer pursuant to 18 U.S.C. Section 1350, as Adopted Pursuant to Section 906 of the Sarbanes-Oxley Act of 2002 | |
32.2 (1) | Certification of the Company’s Chief Financial Officer pursuant to 18 U.S.C. Section 1350, as Adopted Pursuant to Section 906 of the Sarbanes-Oxley Act of 2002 | |
101.INS (1),(37) | XBRL Instance Document | |
101.SCH (1),(37) | XBRL Taxonomy Extension Schema Document | |
101.CAL (1),(37) | XBRL Taxonomy Extension Calculation Linkbase Document | |
101.DEF (1),(37) | XBRL Taxonomy Extension Definition Linkbase Document | |
101.LAB (1),(37) | XBRL Taxonomy Extension Label Linkbase Document | |
101.PRE (1),(37) | XBRL Taxonomy Extension Presentation Linkbase Document | |
96
Unless otherwise indicated, all exhibits incorporated by reference from prior Company filings are from filings by Chicago Bridge & Iron Company N.V. (SEC File No. 1-12815). Exhibits designated by an asterisk (*) are management contracts or compensatory plans or arrangements.
(1) | Filed herewith |
(2) | Incorporated by reference from the Company’s Registration Statement on Form S-1 (File No. 333-18065) |
(3) | Incorporated by reference from the Company’s 1997 Form 10-K filed March 31, 1998 |
(4) | Incorporated by reference from the Company’s 1998 Form 10-Q filed November 12, 1998 |
(5) | Incorporated by reference from the Company’s 1999 Form 10-Q filed May 14, 1999 |
(6) | Incorporated by reference from Exhibit B of the Company’s 2001 Definitive Proxy Statement filed April 10, 2001 |
(7) | Incorporated by reference from the Company’s 2004 Form 10-Q filed August 9, 2004 |
(8) | Incorporated by reference from the Company’s 2005 Form 10-Q filed August 8, 2005 |
(9) | Incorporated by reference from the Company’s 2007 Form 8-K filed August 30, 2007 |
(10) | Incorporated by reference from Annex B of the Company’s 2008 Definitive Proxy Statement filed April 8, 2008 |
(11) | Incorporated by reference from Annex B of the Company’s 2009 Definitive Proxy Statement filed March 25, 2009 |
(12) | Incorporated by reference from Annex D of the Company’s 2009 Definitive Proxy Statement filed March 25, 2009 |
(13) | Incorporated by reference from the Company’s 2009 Form 8-K filed August 18, 2009 |
(14) | Incorporated by reference from the Company’s 2010 Form 10-Q filed July 27, 2010 |
(15) | Incorporated by reference from the Company’s 2011 Form 10-Q filed July 22, 2011 |
(16) | Incorporated by reference from the Company’s 2011 Form 10-Q filed October 26, 2011 |
(17) | Incorporated by reference from Annex A of the Company’s 2012 Definitive Proxy Statement filed March 22, 2012 |
(18) | Incorporated by reference from the Company’s 2012 Form 8-K filed August 1, 2012 |
(19) | Incorporated by reference from the Company’s 2012 Form 8-K filed December 28, 2012 |
(20) | Incorporated by reference from the Company’s 2012 Form 8-K filed January 4, 2013 |
(21) | Incorporated by reference from the Company’s 2013 Form 10-Q filed October 30, 2013 |
(22) | Incorporated by reference from the Company’s 2013 Form 10-K filed February 27, 2014 |
(23) | Incorporated by reference from the Company’s 2014 Form 10-Q filed April 23, 2014 |
(24) | Incorporated by reference from the Company’s 2014 Form 10-K filed February 25, 2015 |
(25) | Incorporated by reference from the Company’s 2015 Form 10-Q filed April 24, 2015 |
(26) | Incorporated by reference from the Company’s 2015 Form 8-K filed July 14, 2015 |
(27) | Incorporated by reference from the Company’s 2015 Form 10-Q filed July 24, 2015 |
(28) | Incorporated by reference from the Company’s 2015 Form 8-K filed October 28, 2015 |
(29) | Incorporated by reference from Annex A of the Company’s 2016 Definitive Proxy Statement filed March 24, 2016 |
(30) | Incorporated by reference from the Company’s 2016 Form 10-Q filed October 27, 2016 |
(31) | Incorporated by reference from The Shaw Group Inc.’s Form 8-K filed October 18, 2006 |
(32) | Incorporated by reference from The Shaw Group Inc.’s Form 10-Q filed April 9, 2009 |
(33) | Incorporated by reference from The Shaw Group Inc.’s Form 10-Q filed January 6, 2010 |
(34) | Incorporated by reference from The Shaw Group Inc.’s Form 10-Q filed January 6, 2011 |
(35) | Incorporated by reference from The Shaw Group Inc.’s Form 8-K filed January 20, 2011 |
(36) | Incorporated by reference from The Shaw Group Inc.’s Form 10-K filed October 19, 2012 |
(37) | Attached as Exhibit 101 to this report are the following documents formatted in XBRL (Extensible Business Reporting Language): (i) the Consolidated Statements of Operations for the years ended December 31, 2016, 2015 and 2014, (ii) the Consolidated Statements of Comprehensive Income for the years ended December 31, 2016, 2015 and 2014, (iii) the Consolidated Balance Sheets as of December 31, 2016 and 2015, (iv) the Consolidated Statements of Cash Flows for the years ended December 31, 2016, 2015 and 2014 (v) the Consolidated Statements of Shareholders’ Equity for the years ended December 31, 2016, 2015 and 2014, and (vi) the Notes to Consolidated Financial Statements. |
97