Attached files
| file | filename |
|---|---|
| 8-K - FORM 8-K - PERCEPTRON INC/MI | f8k_022817.htm |
Investor Presentation March 2017 Exhibit 99.1
Management Update Dave Watza, President & CEO Rick VanValkenburg, Vice President of Global Sales & Marketing Jim West, Vice President of Engineering 2

Cautionary Statement Certain statements made or incorporated by reference in this presentation reflects management’s estimates and beliefs and are intended to be, and are hereby identified as, “Forward - Looking Statements” under the meaning of the Private Securities Litigation Reform Act of 1995 . Whenever possible, we have identified these forward - looking statements by words such as “target,” “will,” “should,” “could,” “believes,” “expects,” “anticipates,” “estimates,” “prospects,” “outlook” or similar expressions . While we believe that our forward - looking statements are reasonable , you should not place undue reliance on any such forward - looking statements, which speak only as of the date made . Because these forward - looking statements are based on estimates and assumptions that are subject to significant business, economic and competitive uncertainties, many of which are beyond our control or are subject to change, actual results could be materially different . Please see our SEC filings for factors that may cause such a difference, including those listed in “Item 1 A – Risk Factors ” section of our Annual Report on Form 10 - K . Except as required by applicable law, we do not undertake, and expressly disclaim, any obligation to publicly update or alter our statements whether as a result of new information, events or circumstances occurring after the date of this report or otherwise . 3 Safe Harbor Statement

About Perceptron: History

About Perceptron: Overview Global Solutions, Supported Locally . International Headquarters Plymouth, MI USA - Since 1981 Perceptron Brazil Sao Paulo - Since 1997 European Headquarters – Perceptron GmbH Munich, Germany - Since 1985 Perceptron Asia Headquarters Singapore - Since 2005 Perceptron Japan Tokyo - Since 1990 Perceptron China Shanghai - Since 2007 Perceptron India Chennai - Since 2007 Coord3 Italy Bruzolo - Since 2015 Today we have over 900 active systems in over 200 plants owned by 40+ automobile makers and Tier 1 suppliers. 12,000 sensors and 3,000 + Coord3 CMMs are in daily use. We have integrated more than 1,000 measurement robots from 11 different robot manufacturers. 5
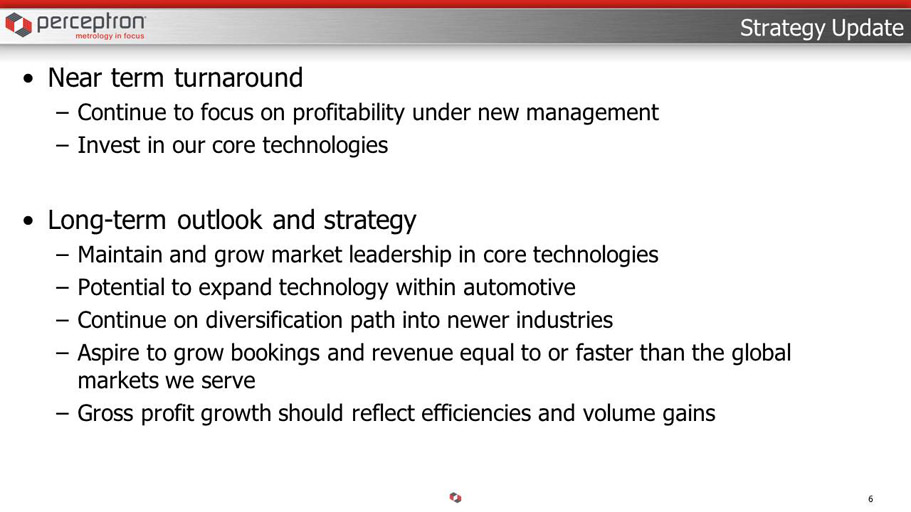
• Near term turnaround – Continue to focus on profitability under new management – Invest in our core technologies • Long - term outlook and strategy – Maintain and grow market leadership in core technologies – Potential to expand technology within automotive – Continue on diversification path into newer industries – Aspire to grow bookings and revenue equal to or faster than the global markets we serve – Gross profit growth should reflect efficiencies and volume gains 6 Strategy Update

About Perceptron: Auto Applications 7 Press Shop Final Assembly Body Shop Body Shop Finish Paintshop Final gap & flushness validation Gap & Flush Inspection after assembly Automated, robot - based Scanning Closure Panels Dimensional control (In - line, distributed meas. strategy) Robot Guidance – Insertion of closure panels, roof, etc. Central Database Office network Robot Guidance for glass decking, sealer apply, etc. Automated, robot - based Scanning Piece Parts

8 AUTO: Market leading gap and flush technology About Perceptron: AutoFit

About Perceptron: Innovative Sensor Technology • 3D Scanning System Feature extraction from the acquired point cloud • Intelligent Illumination Flexible configuration (number + orientation of laser lines) for each part feature; this enables optimized measurements • Very large measurement volume More measurement information without adding system complexity or increasing cycle time 9
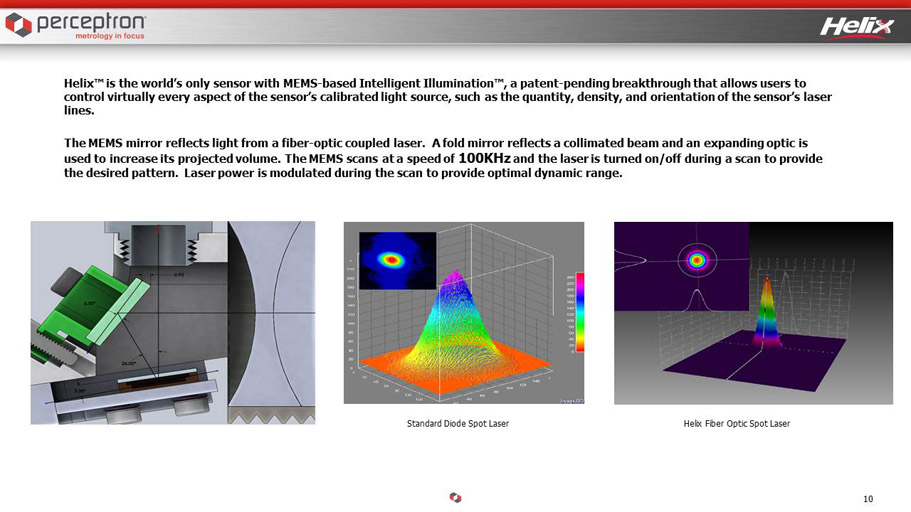
Intelligent Illumination Helix™ is the world’s only sensor with MEMS - based Intelligent Illumination™, a patent - pending breakthrough that allows users to control virtually every aspect of the sensor’s calibrated light source, such as the quantity, density, and orientation of the se nsor’s laser lines. The MEMS mirror reflects light from a fiber - optic coupled laser. A fold mirror reflects a collimated beam and an expanding optic is used to increase its projected volume. The MEMS scans at a speed of 100KHz and the laser is turned on/off during a scan to provide the desired pattern. Laser power is modulated during the scan to provide optimal dynamic range. Standard Diode Spot Laser Helix Fiber Optic Spot Laser 10

STRENGTHS • Technology – Helix, Vector, Argus, etc. • Talented workforce with excellent domain knowledge: calibration, robotics, controls, etc. • Reputation • Great service for our critical - path systems • Global footprint 11 Traditional Products ACTIONS • Implementing lean culture • Cutting costs efficiently & effectively • Strengthening our core products • Product Roadmap is now strategic: • Improving link between market needs and product development • Developing next generation of multiple product families • Reducing our internal deployment costs • Improving “Ease of Use” to increase value

About Perceptron: Coordinate Measurement Machines Bridge CMM Gantry CMM Horizontal Arm CMM Shop - Floor CMM STRENGTHS • Full CMM lines portfolio (Bridge, Gantry, Horizontal) • Strong market s hare in Italy • Long term business OEM metrology customers (Zeiss, Nikon, EROWA, NEXTEC) 12
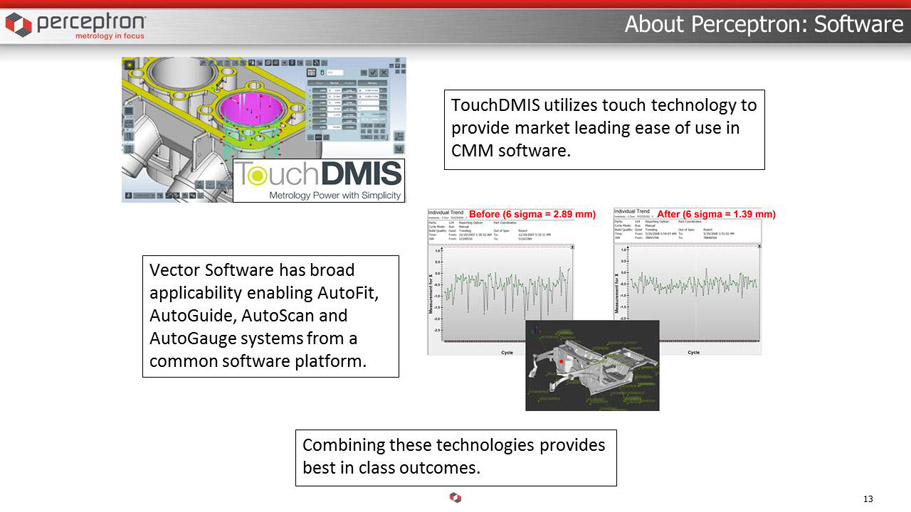
About Perceptron: Software 13 TouchDMIS utilizes touch technology to provide market leading ease of use in CMM software. Vector Software has broad applicability enabling AutoFit, AutoGuide, AutoScan and AutoGauge systems from a common software platform. Combining these technologies provides best in class outcomes.

STRENGTHS • European product quality & Italian style • Desirable gantry product family • Open architecture • TouchDMIS software • Service and flexibility • Global footprint 14 CMM and Touch DMIS ACTIONS • Implementing lean culture • Cutting costs efficiently & effectively • Invigorating sales in low volume regions • Narrowing business focus to play to our strengths

Markets 15
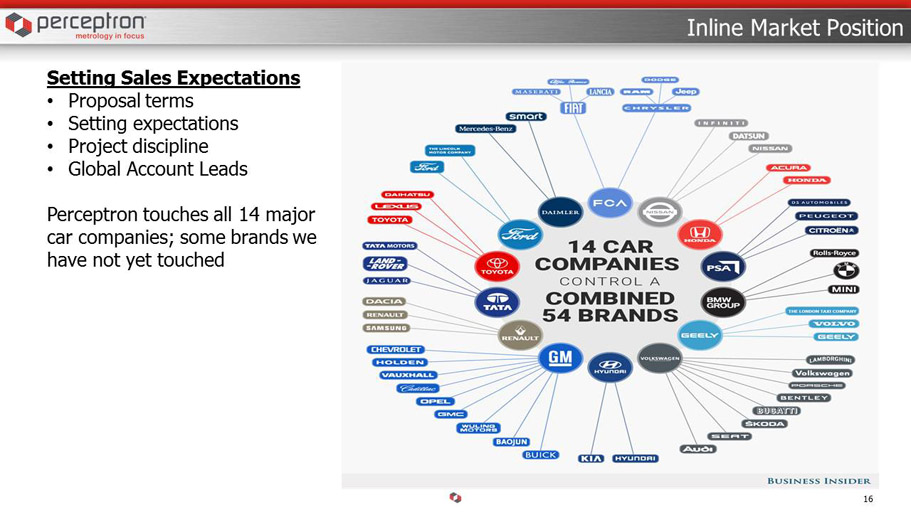
16 Inline Market Position Setting Sales Expectations • Proposal terms • Setting expectations • Project discipline • Global Account Leads Perceptron touches all 14 major car companies; some brands we have not yet touched
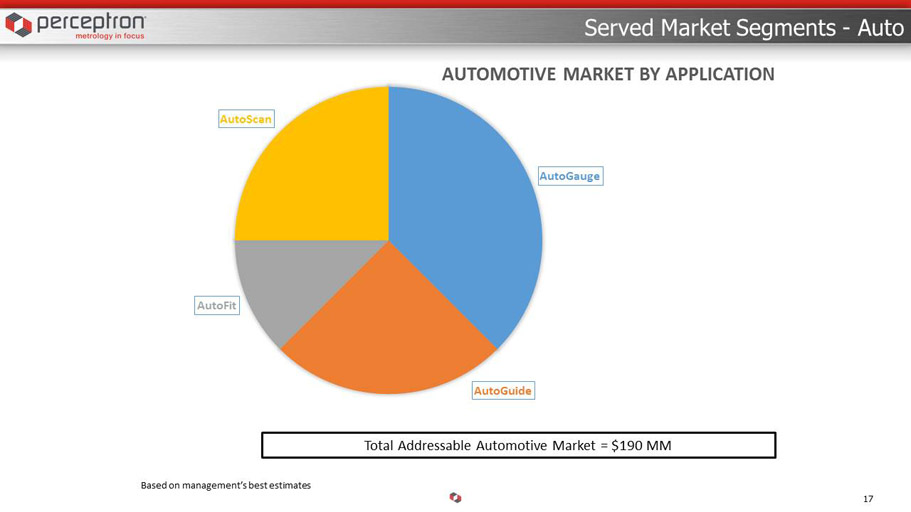
Served Market Segments - Auto 17 Based on management’s best estimates Total Addressable Automotive Market = $190 MM AutoGauge AutoGuide AutoFit AutoScan AUTOMOTIVE MARKET BY APPLICATION

Served Market Segments - CMMs 18 Based on MARKETSANDMARKETS Global 3D Metrology Market and management’s best estimates Total CMM Metrology Market = $750 Million Bridge 26% Gantry 33% Horizontal Arm 41% GLOBAL CMM MARKET

Finance 19

20 Bookings History 18,200 20,400 28,500 22,800 29,300 31,900 22,900 34,700 13,600 16,200 17,700 11,000 61,100 68,500 69,100 68,500 - 10,000 20,000 30,000 40,000 50,000 60,000 70,000 80,000 FY 2013 FY 2014 FY 2015 FY 2016 Annual Bookings Americas Europe Asia Total Bookings Total Bookings

21 Bookings History 4,800 7,400 5,100 5,500 10,800 8,500 6,600 8,300 8,000 11,800 6,200 8,600 1,800 4,400 1,700 3,100 4,800 3,800 13,200 20,100 14,800 20,400 21,800 20,900 - 5,000 10,000 15,000 20,000 25,000 Sep-30-2015 Dec-31-2015 Mar-31-2016 Jun-30-2016 Sep-30-2016 Dec-31-2016 Quarterly Bookings Americas Europe Asia Total Bookings

22 Revenue History 22,200 18,300 28,400 22,500 26,100 27,800 29,700 31,100 12,600 13,500 16,300 15,500 60,900 59,600 74,400 69,100 - 10,000 20,000 30,000 40,000 50,000 60,000 70,000 80,000 FY 2013 FY 2014 FY 2015 FY 2016 Revenue Americas Europe Asia Total Revenue
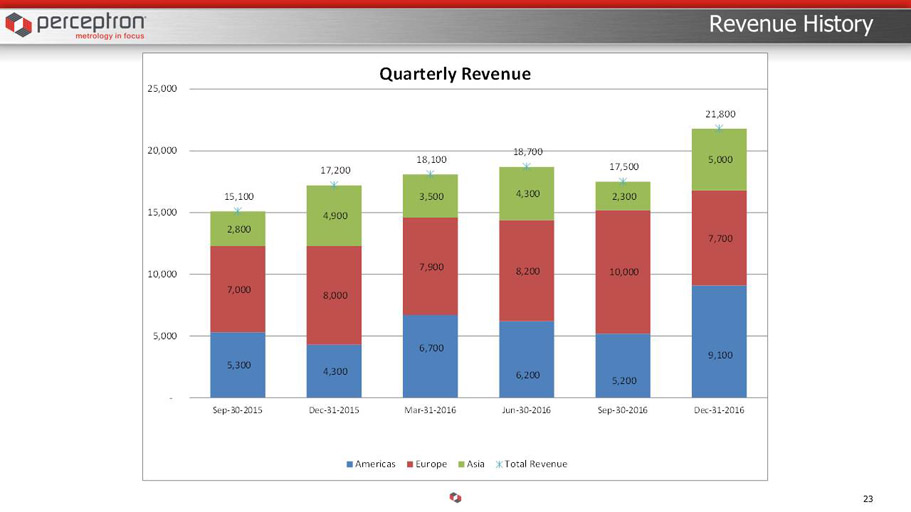
23 Revenue History 5,300 4,300 6,700 6,200 5,200 9,100 7,000 8,000 7,900 8,200 10,000 7,700 2,800 4,900 3,500 4,300 2,300 5,000 15,100 17,200 18,100 18,700 17,500 21,800 - 5,000 10,000 15,000 20,000 25,000 Sep-30-2015 Dec-31-2015 Mar-31-2016 Jun-30-2016 Sep-30-2016 Dec-31-2016 Quarterly Revenue Americas Europe Asia Total Revenue

24 Profitability Turnaround began in mid - 2016; benchmark years are FY 2012 and 2013 FY 2012 FY 2013 FY 2014 FY 2015 FY 2016LTM DEC 2016 Revenue 57,379 60,886 59,612 74,405 69,135 76,127 Gross Profit 24,170 28,120 24,849 28,271 21,139 25,636 Gross Profit % 42.1% 46.2% 41.7% 38.0% 30.6% 33.7% Operating Income (Loss) 5,596 6,866 2,942 (37) (9,384) (2,773) Operating Income (Loss) % 9.8% 11.3% 4.9% 0.0% -13.6% -3.6% Severance, Impairment and Other charges - - - - (2,826) (3,543) Recurring Operating Income (Loss) 5,596 6,866 2,942 (37) (6,558) 770 Recurring Operating Income (Loss) % 9.8% 11.3% 4.9% 0.0% -9.5% 1.0%

25 Profitability Key quarterly financial metrics: Turnaround is gaining momentum Sep-30-2015 Dec-31-2015 Mar-31-2016 Jun-30-2016 Sep-30-2016 Dec-31-2016 Revenue 15,068 17,211 18,082 18,774 17,520 21,751 Gross Profit 4,426 5,095 5,202 6,416 4,574 9,444 Gross Profit % 29.4% 29.6% 28.8% 34.2% 26.1% 43.4% Operating Income (Loss) (3,072) (2,261) (3,807) (244) (1,979) 3,257 Operating Income (Loss) % -20.4% -13.1% -21.1% -1.3% -11.3% 15.0% Severance, Impairment and Other charges - - (2,567) (259) (656) (61) Recurring Operating Income (Loss) (3,072) (2,261) (1,240) 15 (1,323) 3,318 Recurring Operating Income (Loss) % -20.4% -13.1% -6.9% 0.1% -7.6% 15.3%

• Near term turnaround – Continue to focus on profitability under new management – Invest in our core technologies • Long - term outlook and strategy – Maintain and grow market leadership in core technologies – Potential to expand technology within automotive – Continue on diversification path into newer industries – Aspire to grow bookings and revenue equal to or faster than the global markets we serve – Gross profit growth should reflect efficiencies and volume gains 26 Strategy Update
27 Questions Thank you for your time and interest in our Company!