Attached files
| file | filename |
|---|---|
| EX-99.1 - EXHIBIT 99.1 - CrossAmerica Partners LP | exhibit991capl4q2016earnin.htm |
| 8-K - 8-K - CrossAmerica Partners LP | capl20164qform8-kearningsr.htm |

February 2017
4Q and Full Year 2016
Earnings Call
1
4Q and Full Year 2016 Earnings Call February 2017
Safe Harbor Statement
Statements contained in this presentation that state the Partnership’s or
management’s expectations or predictions of the future are forward-looking
statements. The words “believe,” “expect,” “should,” “intends,” “estimates,”
“target” and other similar expressions identify forward-looking statements. It
is important to note that actual results could differ materially from those
projected in such forward-looking statements. For more information
concerning factors that could cause actual results to differ from those
expressed or forecasted, see CrossAmerica’s Forms 10-Q or Form 10-K filed
with the Securities and Exchange Commission and available on
CrossAmerica’s website at www.crossamericapartners.com. If any of these
factors materialize, or if our underlying assumptions prove to be incorrect,
actual results may vary significantly from what we projected. Any forward-
looking statement you see or hear during this presentation reflects our
current views as of the date of this presentation with respect to future
events. We assume no obligation to publicly update or revise these forward-
looking statements for any reason, whether as a result of new information,
future events, or otherwise.
2
CrossAmerica Business Overview
Jeremy Bergeron, President
3
4Q and Full Year 2016 Earnings Call February 2017
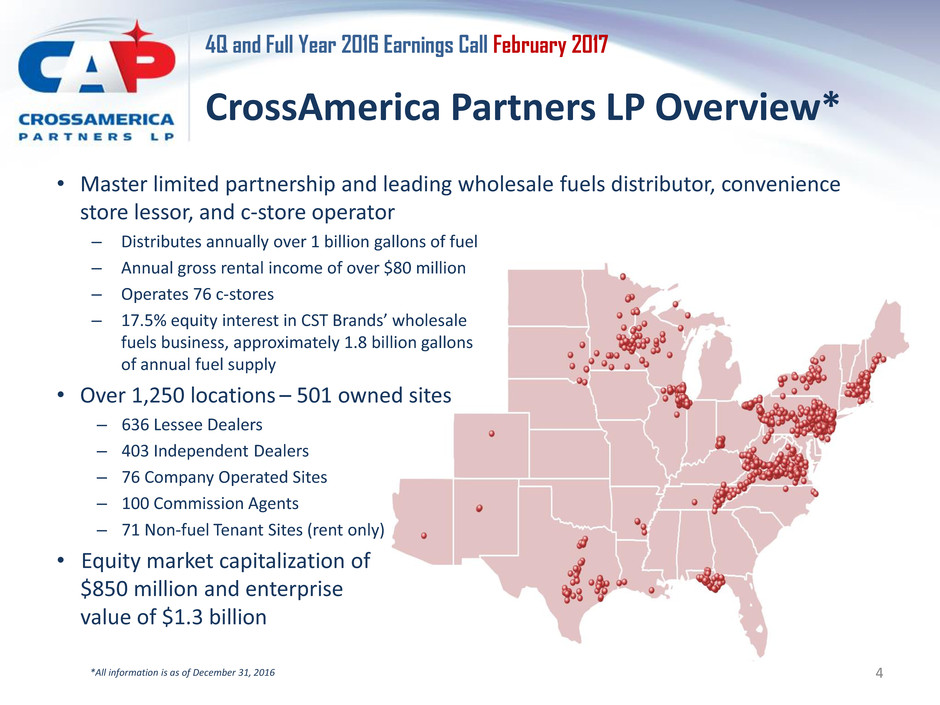
CrossAmerica Partners LP Overview*
• Master limited partnership and leading wholesale fuels distributor, convenience
store lessor, and c-store operator
– Distributes annually over 1 billion gallons of fuel
– Annual gross rental income of over $80 million
– Operates 76 c-stores
– 17.5% equity interest in CST Brands’ wholesale
fuels business, approximately 1.8 billion gallons
of annual fuel supply
• Over 1,250 locations – 501 owned sites
– 636 Lessee Dealers
– 403 Independent Dealers
– 76 Company Operated Sites
– 100 Commission Agents
– 71 Non-fuel Tenant Sites (rent only)
• Equity market capitalization of
$850 million and enterprise
value of $1.3 billion
*All information is as of December 31, 2016 4
4Q and Full Year 2016 Earnings Call February 2017
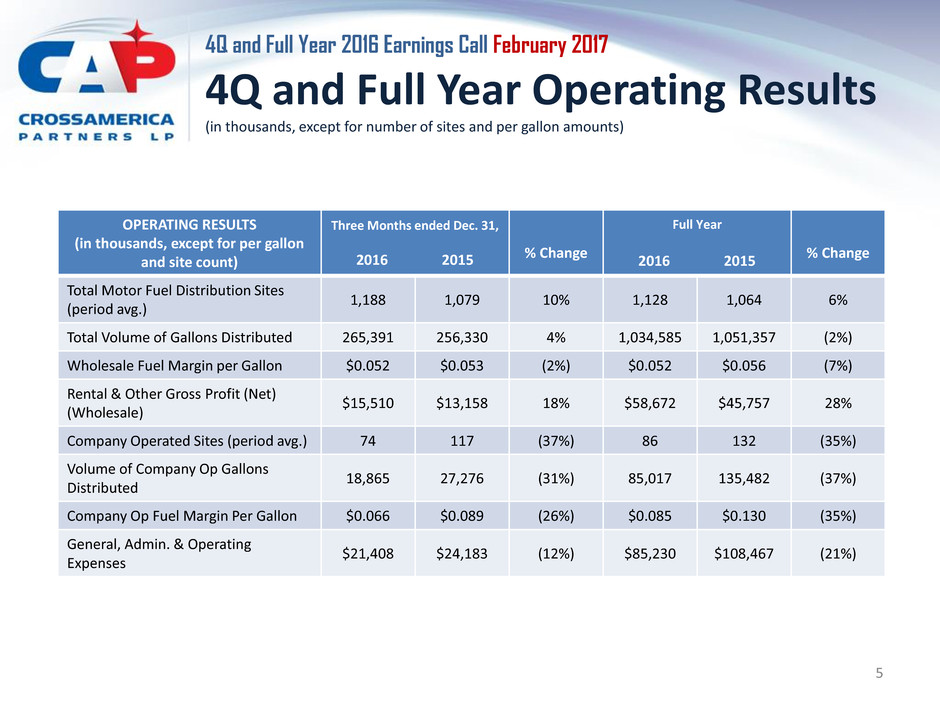
4Q and Full Year Operating Results
(in thousands, except for number of sites and per gallon amounts)
OPERATING RESULTS
(in thousands, except for per gallon
and site count)
Three Months ended Dec. 31,
2016 2015
% Change
Full Year
2016 2015
% Change
Total Motor Fuel Distribution Sites
(period avg.)
1,188 1,079 10% 1,128 1,064 6%
Total Volume of Gallons Distributed 265,391 256,330 4% 1,034,585 1,051,357 (2%)
Wholesale Fuel Margin per Gallon $0.052 $0.053 (2%) $0.052 $0.056 (7%)
Rental & Other Gross Profit (Net)
(Wholesale)
$15,510 $13,158 18% $58,672 $45,757 28%
Company Operated Sites (period avg.) 74 117 (37%) 86 132 (35%)
Volume of Company Op Gallons
Distributed
18,865 27,276 (31%) 85,017 135,482 (37%)
Company Op Fuel Margin Per Gallon $0.066 $0.089 (26%) $0.085 $0.130 (35%)
General, Admin. & Operating
Expenses
$21,408 $24,183 (12%) $85,230 $108,467 (21%)
5
4Q and Full Year 2016 Earnings Call February 2017
Portfolio Optimization
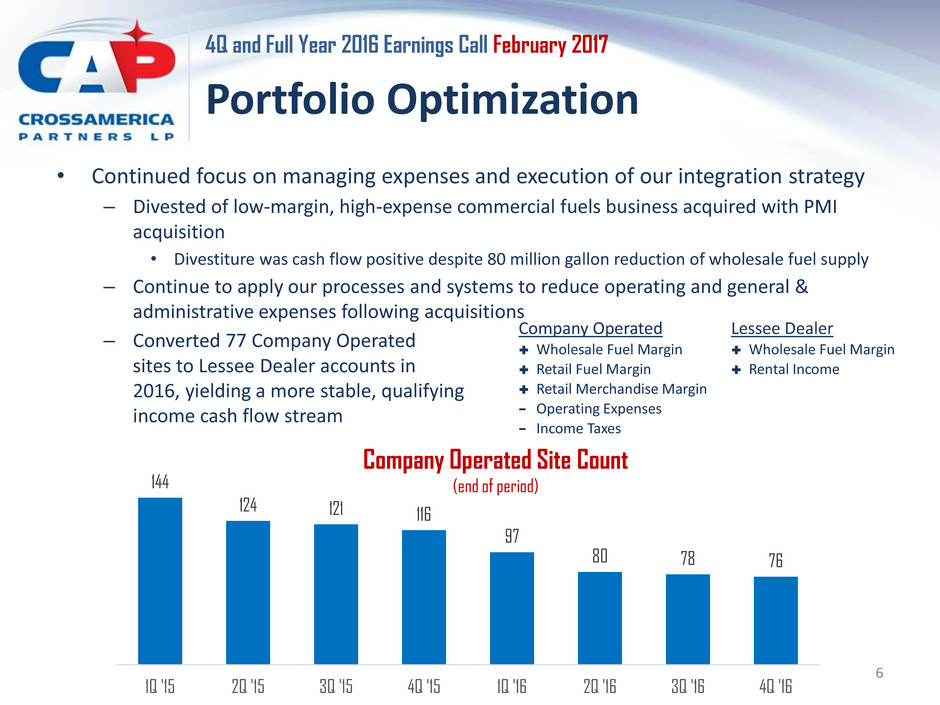
• Continued focus on managing expenses and execution of our integration strategy
– Divested of low-margin, high-expense commercial fuels business acquired with PMI
acquisition
• Divestiture was cash flow positive despite 80 million gallon reduction of wholesale fuel supply
– Continue to apply our processes and systems to reduce operating and general &
administrative expenses following acquisitions
– Converted 77 Company Operated
sites to Lessee Dealer accounts in
2016, yielding a more stable, qualifying
income cash flow stream
Company Operated
Wholesale Fuel Margin
Retail Fuel Margin
Retail Merchandise Margin
− Operating Expenses
− Income Taxes
Lessee Dealer
Wholesale Fuel Margin
Rental Income
6
144
124 121 116
97
80 78 76
1Q '15 2Q '15 3Q '15 4Q '15 1Q '16 2Q '16 3Q '16 4Q '16
Company Operated Site Count
(end of period)
4Q and Full Year 2016 Earnings Call February 2017
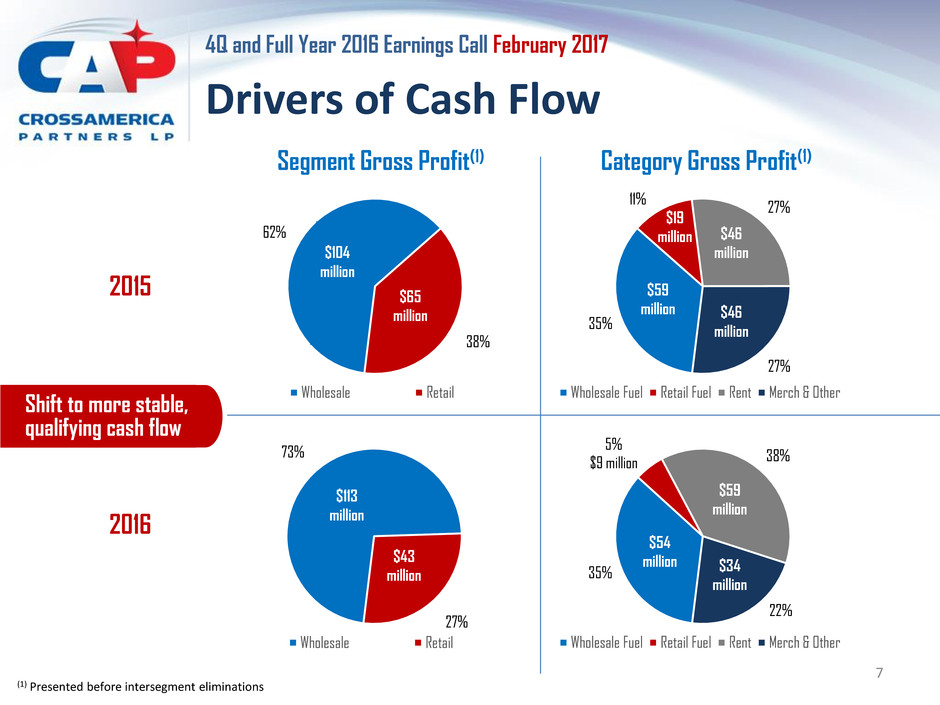
Drivers of Cash Flow
Segment Gross Profit(1) Category Gross Profit(1)
(1) Presented before intersegment eliminations
7
2016
73%
27%
Wholesale Retail
$113
million
$43
million 35%
5%
$9 million 38%
22%
Wholesale Fuel Retail Fuel Rent Merch & Other
$59
million
$34
million
$54
million
2015
62%
38%
Wholesale Retail
$104
million
$65
million 35%
11%
27%
27%
Wholesale Fuel Retail Fuel Rent Merch & Other
$46
million
$46
million
$59
million
$19
million
Shift to more stable,
qualifying cash flow
4Q and Full Year 2016 Earnings Call February 2017
2016 Highlights
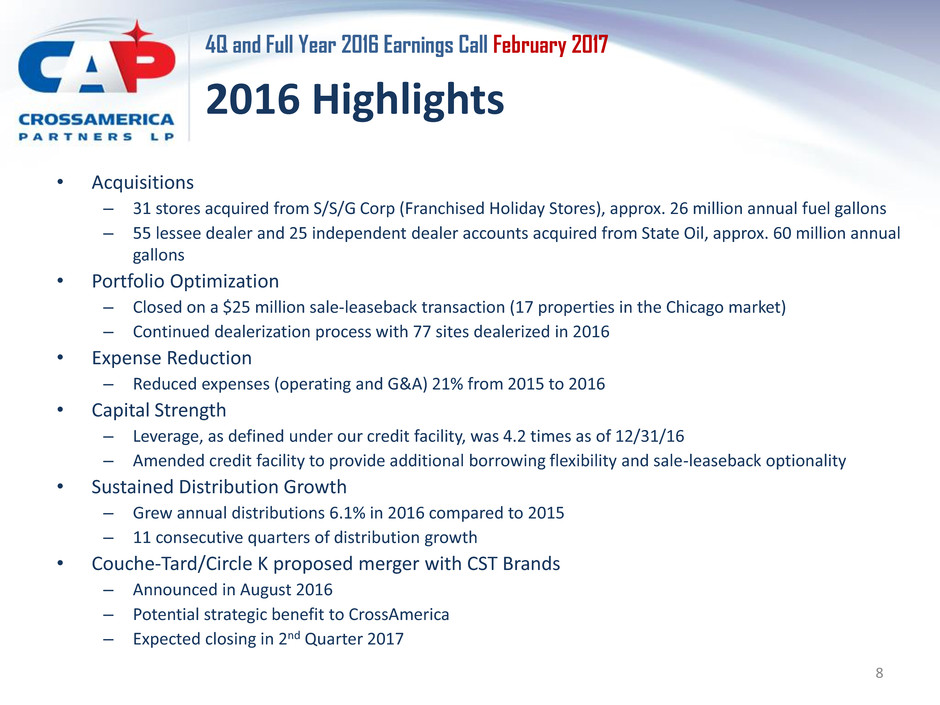
• Acquisitions
– 31 stores acquired from S/S/G Corp (Franchised Holiday Stores), approx. 26 million annual fuel gallons
– 55 lessee dealer and 25 independent dealer accounts acquired from State Oil, approx. 60 million annual
gallons
• Portfolio Optimization
– Closed on a $25 million sale-leaseback transaction (17 properties in the Chicago market)
– Continued dealerization process with 77 sites dealerized in 2016
• Expense Reduction
– Reduced expenses (operating and G&A) 21% from 2015 to 2016
• Capital Strength
– Leverage, as defined under our credit facility, was 4.2 times as of 12/31/16
– Amended credit facility to provide additional borrowing flexibility and sale-leaseback optionality
• Sustained Distribution Growth
– Grew annual distributions 6.1% in 2016 compared to 2015
– 11 consecutive quarters of distribution growth
• Couche-Tard/Circle K proposed merger with CST Brands
– Announced in August 2016
– Potential strategic benefit to CrossAmerica
– Expected closing in 2nd Quarter 2017
8
CrossAmerica Financial Overview
Steven Stellato, Chief Accounting Officer
9
4Q and Full Year 2016 Earnings Call February 2017
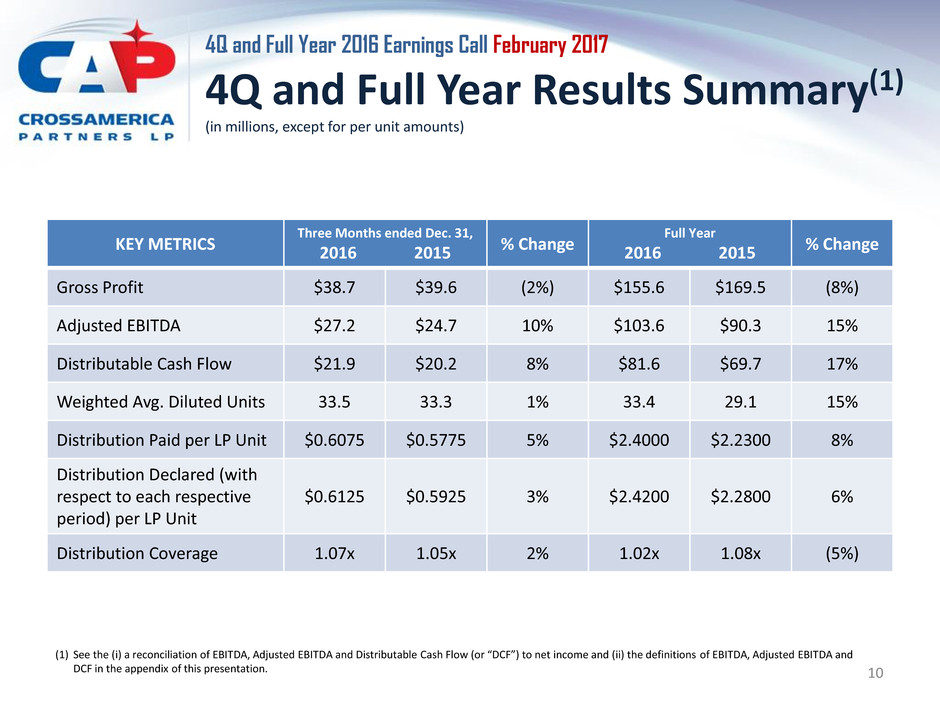
4Q and Full Year Results Summary(1)
(in millions, except for per unit amounts)
KEY METRICS
Three Months ended Dec. 31,
2016 2015 % Change
Full Year
2016 2015 % Change
Gross Profit $38.7 $39.6 (2%) $155.6 $169.5 (8%)
Adjusted EBITDA $27.2 $24.7 10% $103.6 $90.3 15%
Distributable Cash Flow $21.9 $20.2 8% $81.6 $69.7 17%
Weighted Avg. Diluted Units 33.5 33.3 1% 33.4 29.1 15%
Distribution Paid per LP Unit $0.6075 $0.5775 5% $2.4000 $2.2300 8%
Distribution Declared (with
respect to each respective
period) per LP Unit
$0.6125 $0.5925 3% $2.4200 $2.2800 6%
Distribution Coverage 1.07x 1.05x 2% 1.02x 1.08x (5%)
10
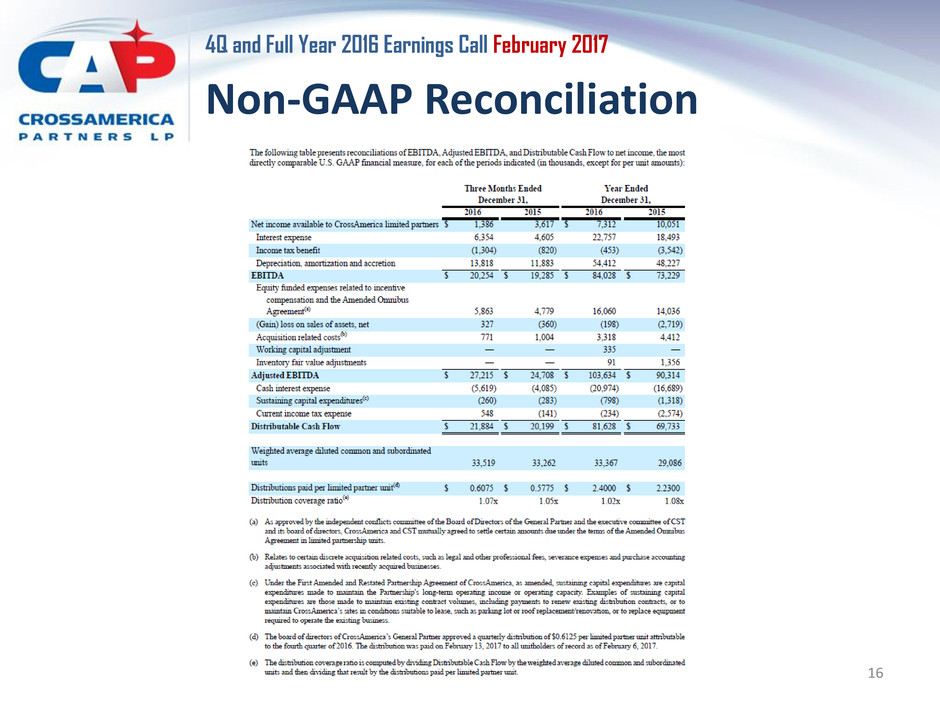
(1) See the (i) a reconciliation of EBITDA, Adjusted EBITDA and Distributable Cash Flow (or “DCF”) to net income and (ii) the definitions of EBITDA, Adjusted EBITDA and
DCF in the appendix of this presentation.
4Q and Full Year 2016 Earnings Call February 2017
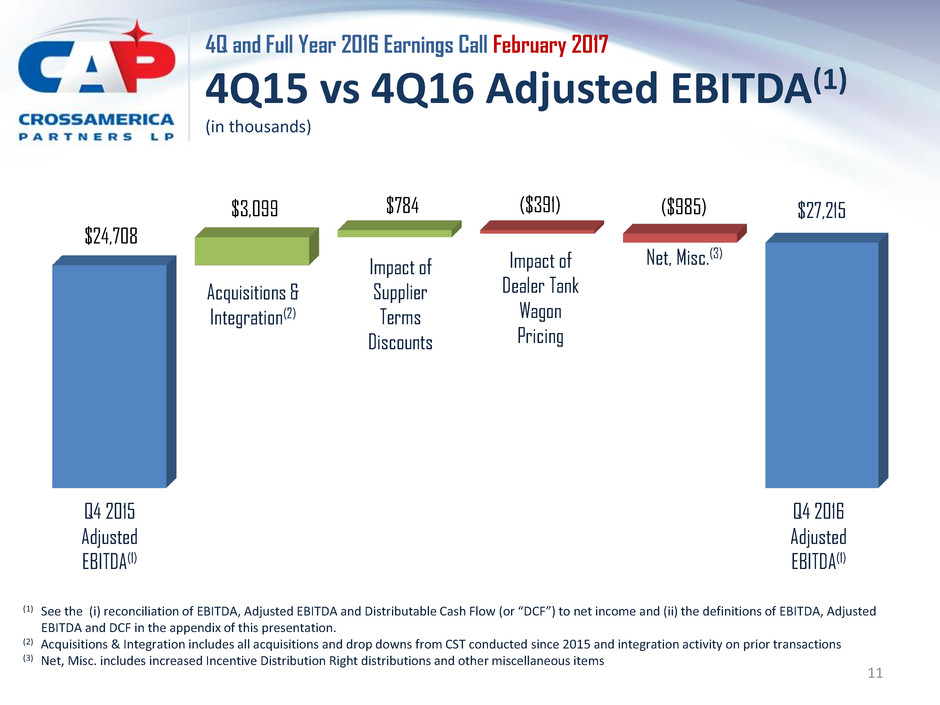
4Q15 vs 4Q16 Adjusted EBITDA(1)
(in thousands)
11
$27,215
$24,708
$3,099 $784 ($391) ($985)
(1) See the (i) reconciliation of EBITDA, Adjusted EBITDA and Distributable Cash Flow (or “DCF”) to net income and (ii) the definitions of EBITDA, Adjusted
EBITDA and DCF in the appendix of this presentation.
(2) Acquisitions & Integration includes all acquisitions and drop downs from CST conducted since 2015 and integration activity on prior transactions
(3) Net, Misc. includes increased Incentive Distribution Right distributions and other miscellaneous items
Q4 2015
Adjusted
EBITDA(1)
Acquisitions &
Integration(2)
Impact of
Supplier
Terms
Discounts
Impact of
Dealer Tank
Wagon
Pricing
Net, Misc.(3)
Q4 2016
Adjusted
EBITDA(1)
4Q and Full Year 2016 Earnings Call February 2017
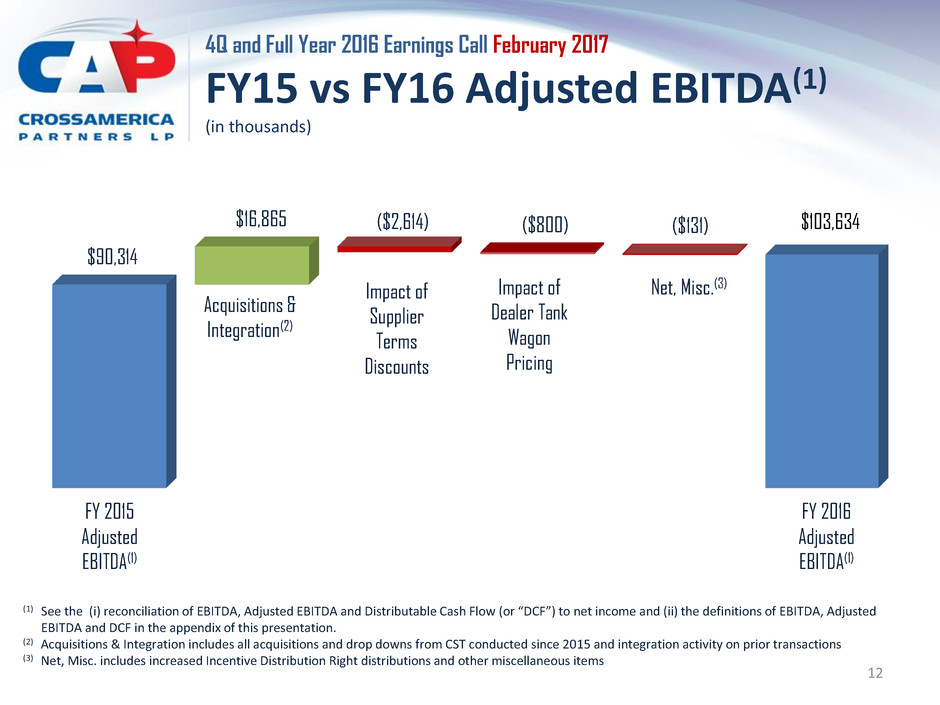
FY15 vs FY16 Adjusted EBITDA(1)
(in thousands)
12
$90,314
$16,865 ($2,614) ($800) ($131)
(1) See the (i) reconciliation of EBITDA, Adjusted EBITDA and Distributable Cash Flow (or “DCF”) to net income and (ii) the definitions of EBITDA, Adjusted
EBITDA and DCF in the appendix of this presentation.
(2) Acquisitions & Integration includes all acquisitions and drop downs from CST conducted since 2015 and integration activity on prior transactions
(3) Net, Misc. includes increased Incentive Distribution Right distributions and other miscellaneous items
Acquisitions &
Integration(2)
Impact of
Supplier
Terms
Discounts
Impact of
Dealer Tank
Wagon
Pricing
Net, Misc.(3)
FY 2015
Adjusted
EBITDA(1)
FY 2016
Adjusted
EBITDA(1)
$103,634
4Q and Full Year 2016 Earnings Call February 2017
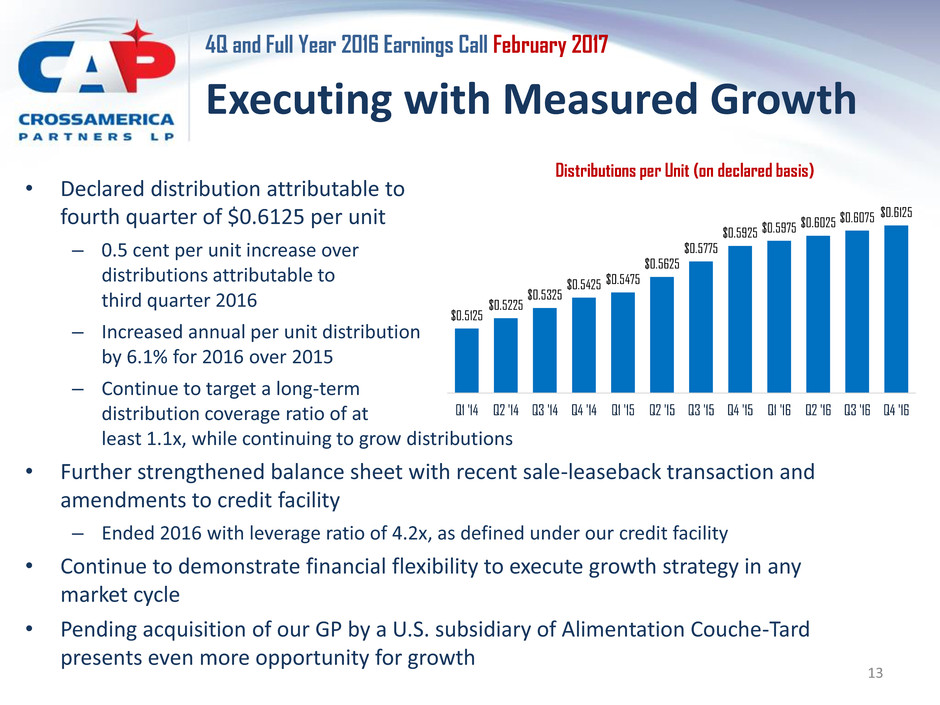
Executing with Measured Growth
• Declared distribution attributable to
fourth quarter of $0.6125 per unit
– 0.5 cent per unit increase over
distributions attributable to
third quarter 2016
– Increased annual per unit distribution
by 6.1% for 2016 over 2015
– Continue to target a long-term
distribution coverage ratio of at
least 1.1x, while continuing to grow distributions
• Further strengthened balance sheet with recent sale-leaseback transaction and
amendments to credit facility
– Ended 2016 with leverage ratio of 4.2x, as defined under our credit facility
• Continue to demonstrate financial flexibility to execute growth strategy in any
market cycle
• Pending acquisition of our GP by a U.S. subsidiary of Alimentation Couche-Tard
presents even more opportunity for growth
$0.5125
$0.5225
$0.5325
$0.5425 $0.5475
$0.5625
$0.5775
$0.5925 $0.5975
$0.6025 $0.6075
$0.6125
Q1 '14 Q2 '14 Q3 '14 Q4 '14 Q1 '15 Q2 '15 Q3 '15 Q4 '15 Q1 '16 Q2 '16 Q3 '16 Q4 '16
Distributions per Unit (on declared basis)
13
Appendix
4Q and Full Year 2016 Earnings Call
14
4Q and Full Year 2016 Earnings Call February 2017
Non-GAAP Financial Measures
15
4Q and Full Year 2016 Earnings Call February 2017
Non-GAAP Reconciliation
16
