Attached files
| file | filename |
|---|---|
| EX-99.1 - EX-99.1 - PRA Health Sciences, Inc. | prah_ex991.htm |
| 8-K - 8-K - PRA Health Sciences, Inc. | prah_currentfolio8k.htm |
Exhibit 99.2
|
|
Q4 2016 Earnings February 22, 2017 |
|
|
Forward Looking Statements and Use of Non-GAAP Financial Measures This presentation contains forward-looking statements that reflect, among other things, the Company’s current expectations and anticipated results of operations, all of which are subject to known and unknown risks, uncertainties and other factors that may cause actual results, performance or achievements, market trends or industry results to differ materially from those expressed or implied by such forward-looking statements. For this purpose, any statements contained herein that are not statements of historical fact may constitute forward-looking statements. Without limiting the foregoing, words such as “anticipates,” “believes,” “estimates,” “expects,” “ guidance,” “intends,” “may,” “plans,” “projects,” “should,” “targets,” “will” and the negative thereof and similar words and expressions are intended to identify forward-looking statements. Actual results may differ materially from the Company’s expectations due to a number of factors, including that most of the Company’s contracts may be terminated on short notice, and that the Company may be unable to maintain large customer contracts or to enter into new contracts; the historical indications of the relationship of backlog to revenues may not be indicative of their future relationship; the market for the Company’s services may not grow as the Company expects; the Company may under price contracts or overrun its cost estimates, and if the Company is unable to achieve operating efficiencies or grow revenues faster than expenses, operating margins will be adversely affected; the Company may be unable to maintain information systems or effectively update them; customer or therapeutic concentration could harm the Company’s business; the Company’s business is subject to risks associated with international operations, including economic, political and other risks; the Company is also subject to a number of additional risks associated with its business outside the United States, including foreign currency exchange fluctuations and restrictive regulations, as well as the risks and uncertainties associated with the United Kingdom’s expected withdrawal from the European Union; government regulators or customers may limit the scope of prescription or withdraw products from the market, and government regulators may impose new regulations affecting the Company’s business; the Company may be unable to successfully develop and market new services or enter new markets; the Company’s failure to perform services in accordance with contractual requirements, regulatory standards and ethical considerations may subject it to significant costs or liability, damage its reputation and cause it to lose existing business or not receive new business; the Company’s services are related to treatment of human patients, and it could face liability if a patient is harmed; the Company has substantial indebtedness and may incur additional indebtedness in the future, which could adversely affect the Company’s financial condition; and other factors that are set forth in the Company's filings with the Securities and Exchange Commission (“SEC”), including our most recent Annual Report on Form 10-K filed with the SEC on February 25, 2016. The Company undertakes no obligation to update any forward-looking statement after the date of this release, whether as a result of new information, future developments or otherwise, except as may be required by applicable law. This presentation also includes EBITDA, Adjusted EBITDA, Adjusted Income from Operations, Adjusted Net Income and Adjusted Net Income per share, each of which are financial measures not prepared in accordance with accounting principles generally accepted in the United States (“GAAP”). Management believes that these measures provide useful supplemental information to management and investors regarding our operating results as they exclude certain items whose fluctuation from period-to-period do not necessarily correspond to changes in the operating results of our business. As a result, management and our board of directors regularly use EBITDA and Adjusted EBITDA as a tool in evaluating our operating and financial performance and in establishing discretionary annual bonuses. Adjusted EBITDA is also the basis for covenant compliance EBITDA, which is used in certain covenants in the credit agreement governing our Senior Secured Credit Facilities and the indenture governing the Senior Notes. In addition, management believes that EBITDA, Adjusted EBITDA, Adjusted Income from Operations and Adjusted Net Income (including diluted adjusted net income per share) facilitate comparisons of our operating results with those of other companies by backing out of GAAP net income items relating to variations in capital structures (affecting interest expense), taxation, and the age and book depreciation of facilities and equipment (affecting relative depreciation expense), which may vary for different companies for reasons unrelated to operating performance. We believe that EBITDA, Adjusted EBITDA, Adjusted Income from Operations and Adjusted Net Income (including diluted adjusted net income per share) are frequently used by securities analysts, investors, and other interested parties in the evaluation of issuers, many of which also present EBITDA, Adjusted EBITDA, Adjusted Income from Operations and Adjusted net income (including diluted adjusted net income per share) when reporting their results in an effort to facilitate an understanding of their operating results. These non-GAAP financial measures have limitations as analytical tools, and you should not consider these measures in isolation, or as a substitute for analysis of our results as reported under GAAP. Additionally, because not all companies use identical calculations, these presentations of EBITDA, Adjusted EBITDA, Adjusted Income from Operations and Adjusted Net Income (including diluted adjusted net income per share) may not be comparable to similarly titled measures of other companies. Constant currency comparisons are based on translating local currency amounts in the current year period at actual foreign exchange rates for the prior year. The Company routinely evaluates its financial performance on a constant currency basis in order to facilitate period- to- period comparisons without regard to the impact of changing foreign currency exchange rates. |
|
|
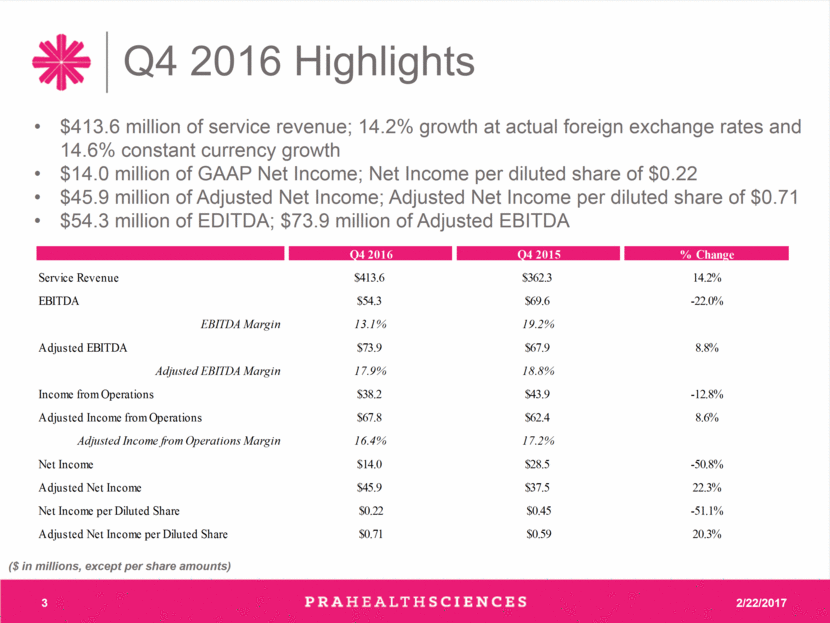
Q4 2016 Highlights ($ in millions, except per share amounts) $413.6 million of service revenue; 14.2% growth at actual foreign exchange rates and 14.6% constant currency growth $14.0 million of GAAP Net Income; Net Income per diluted share of $0.22 $45.9 million of Adjusted Net Income; Adjusted Net Income per diluted share of $0.71 $54.3 million of EDITDA; $73.9 million of Adjusted EBITDA Q4 2016 Q4 2015 % Change Service Revenue $413.6 $362.3 14.2% EBITDA $54.3 $69.6 -22.0% EBITDA Margin 13.1% 19.2% Adjusted EBITDA $73.9 $67.9 8.8% Adjusted EBITDA Margin 17.9% 18.8% Income from Operations $38.2 $43.9 -12.8% Adjusted Income from Operations $67.8 $62.4 8.6% Adjusted Income from Operations Margin 16.4% 17.2% Net Income $14.0 $28.5 -50.8% Adjusted Net Income $45.9 $37.5 22.3% Net Income per Diluted Share $0.22 $0.45 -51.1% Adjusted Net Income per Diluted Share $0.71 $0.59 20.3% |
|
|
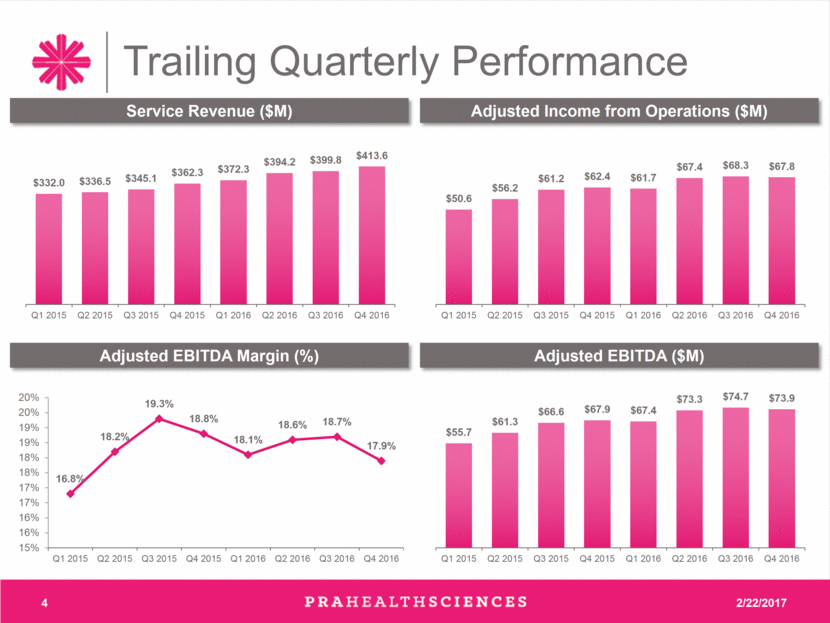
Trailing Quarterly Performance Adjusted Income from Operations ($M) Adjusted EBITDA Margin (%) Service Revenue ($M) Adjusted EBITDA ($M) $50.6 $56.2 $61.2 $62.4 $61.7 $67.4 $68.3 $67.8 Q1 2015 Q2 2015 Q3 2015 Q4 2015 Q1 2016 Q2 2016 Q3 2016 Q4 2016 16.8% 18.2% 19.3% 18.8% 18.1% 18.6% 18.7% 17.9% 15% 16% 16% 17% 17% 18% 18% 19% 19% 20% 20% Q1 2015 Q2 2015 Q3 2015 Q4 2015 Q1 2016 Q2 2016 Q3 2016 Q4 2016 $332.0 $336.5 $345.1 $362.3 $372.3 $394.2 $399.8 $413.6 Q1 2015 Q2 2015 Q3 2015 Q4 2015 Q1 2016 Q2 2016 Q3 2016 Q4 2016 $55.7 $61.3 $66.6 $67.9 $67.4 $73.3 $74.7 $73.9 Q1 2015 Q2 2015 Q3 2015 Q4 2015 Q1 2016 Q2 2016 Q3 2016 Q4 2016 |
|
|
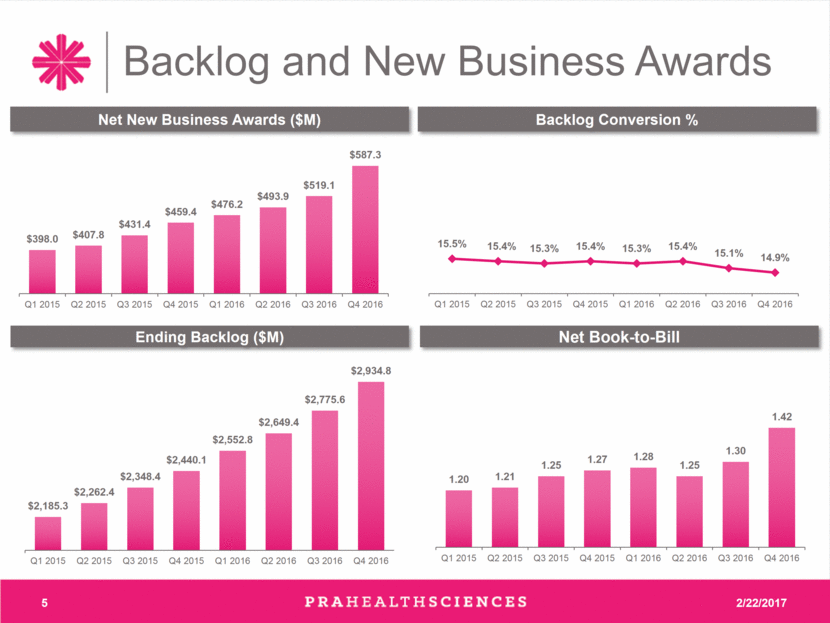
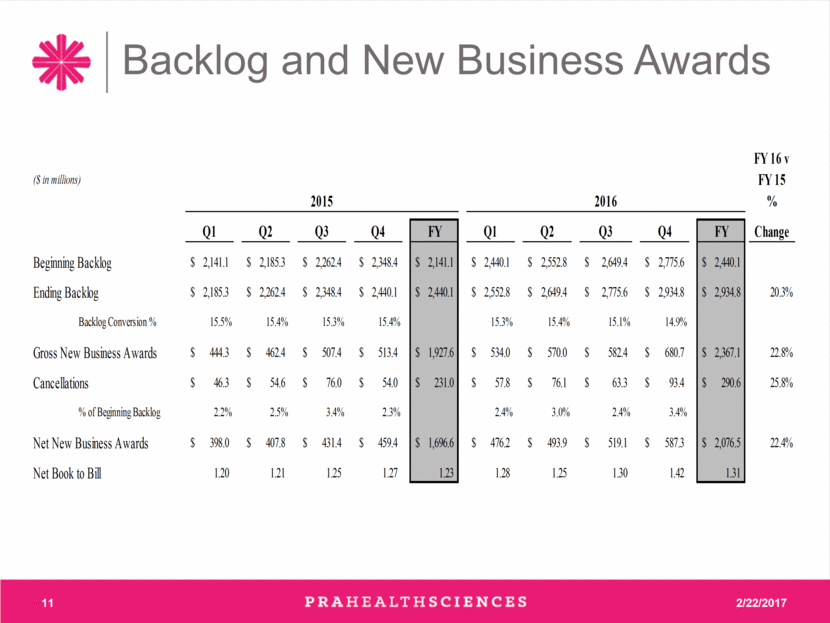
Backlog and New Business Awards Ending Backlog ($M) Backlog Conversion % Net Book-to-Bill Net New Business Awards ($M) 1.20 1.21 1.25 1.27 1.28 1.25 1.30 1.42 Q1 2015 Q2 2015 Q3 2015 Q4 2015 Q1 2016 Q2 2016 Q3 2016 Q4 2016 $398.0 $407.8 $431.4 $459.4 $476.2 $493.9 $519.1 $587.3 Q1 2015 Q2 2015 Q3 2015 Q4 2015 Q1 2016 Q2 2016 Q3 2016 Q4 2016 $2,185.3 $2,262.4 $2,348.4 $2,440.1 $2,552.8 $2,649.4 $2,775.6 $2,934.8 Q1 2015 Q2 2015 Q3 2015 Q4 2015 Q1 2016 Q2 2016 Q3 2016 Q4 2016 15.5% 15.4% 15.3% 15.4% 15.3% 15.4% 15.1% 14.9% Q1 2015 Q2 2015 Q3 2015 Q4 2015 Q1 2016 Q2 2016 Q3 2016 Q4 2016 |
|
|
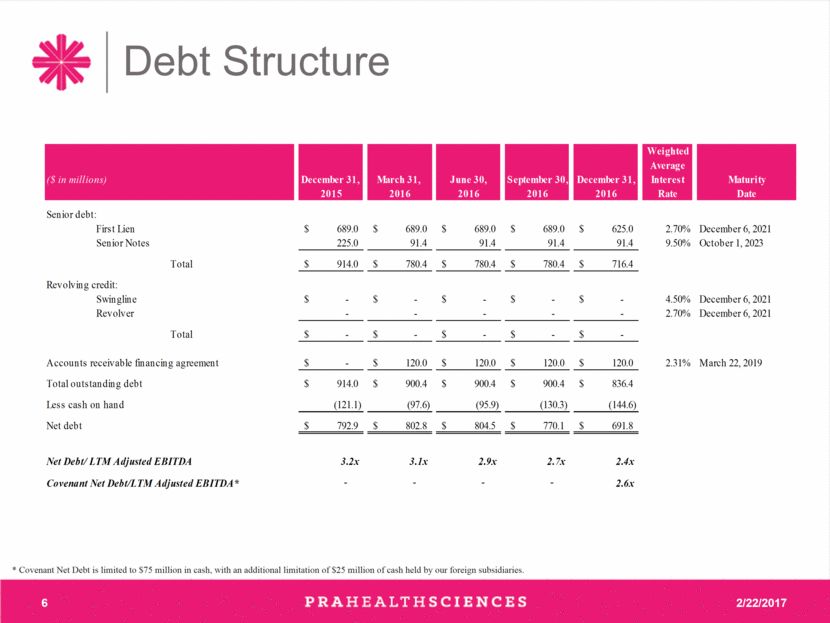
Debt Structure * Covenant Net Debt is limited to $75 million in cash, with an additional limitation of $25 million of cash held by our foreign subsidiaries. Weighted Average ($ in millions) December 31, March 31, June 30, September 30, December 31, Interest Maturity 2015 2016 2016 2016 2016 Rate Date Senior debt: First Lien 689.0 $ 689.0 $ 689.0 $ 689.0 $ 625.0 $ 2.70% December 6, 2021 Senior Notes 225.0 91.4 91.4 91.4 91.4 9.50% October 1, 2023 Total 914.0 $ 780.4 $ 780.4 $ 780.4 $ 716.4 $ Revolving credit: Swingline - $ - $ - $ - $ - $ 4.50% December 6, 2021 Revolver - - - - - 2.70% December 6, 2021 Total - $ - $ - $ - $ - $ Accounts receivable financing agreement - $ 120.0 $ 120.0 $ 120.0 $ 120.0 $ 2.31% March 22, 2019 Total outstanding debt 914.0 $ 900.4 $ 900.4 $ 900.4 $ 836.4 $ Less cash on hand (121.1) (97.6) (95.9) (130.3) (144.6) Net debt 792.9 $ 802.8 $ 804.5 $ 770.1 $ 691.8 $ Net Debt/ LTM Adjusted EBITDA 3.2x 3.1x 2.9x 2.7x 2.4x Covenant Net Debt/LTM Adjusted EBITDA* - - - - 2.6x |
|
|
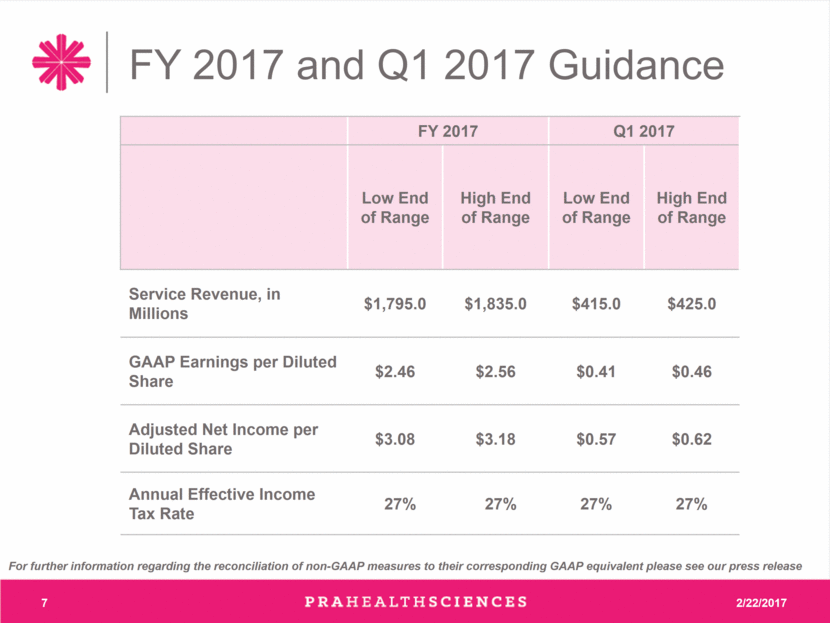
FY 2017 and Q1 2017 Guidance FY 2017 Q1 2017 Low End of Range High End of Range Low End of Range High End of Range Service Revenue, in Millions $1,795.0 $1,835.0 $415.0 $425.0 GAAP Earnings per Diluted Share $2.46 $2.56 $0.41 $0.46 Adjusted Net Income per Diluted Share $3.08 $3.18 $0.57 $0.62 Annual Effective Income Tax Rate 27% 27% 27% 27% For further information regarding the reconciliation of non-GAAP measures to their corresponding GAAP equivalent please see our press release |
|
|
Appendix |
|
|
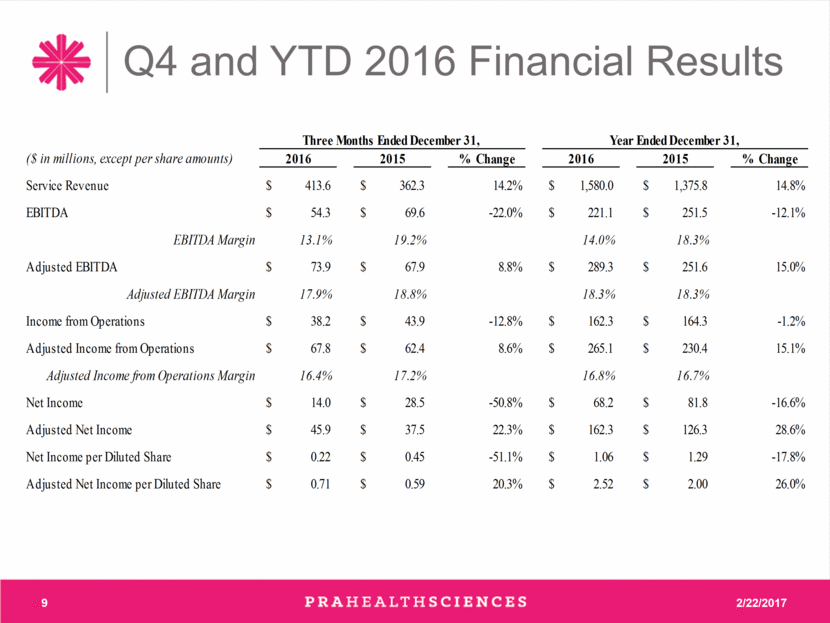
Q4 and YTD 2016 Financial Results ($ in millions, except per share amounts) 2016 2015 % Change 2016 2015 % Change Service Revenue 413.6 $ 362.3 $ 14.2% 1,580.0 $ 1,375.8 $ 14.8% EBITDA 54.3 $ 69.6 $ -22.0% 221.1 $ 251.5 $ -12.1% EBITDA Margin 13.1% 19.2% 14.0% 18.3% Adjusted EBITDA 73.9 $ 67.9 $ 8.8% 289.3 $ 251.6 $ 15.0% Adjusted EBITDA Margin 17.9% 18.8% 18.3% 18.3% Income from Operations 38.2 $ 43.9 $ -12.8% 162.3 $ 164.3 $ -1.2% Adjusted Income from Operations 67.8 $ 62.4 $ 8.6% 265.1 $ 230.4 $ 15.1% Adjusted Income from Operations Margin 16.4% 17.2% 16.8% 16.7% Net Income 14.0 $ 28.5 $ -50.8% 68.2 $ 81.8 $ -16.6% Adjusted Net Income 45.9 $ 37.5 $ 22.3% 162.3 $ 126.3 $ 28.6% Net Income per Diluted Share 0.22 $ 0.45 $ -51.1% 1.06 $ 1.29 $ -17.8% Adjusted Net Income per Diluted Share 0.71 $ 0.59 $ 20.3% 2.52 $ 2.00 $ 26.0% Three Months Ended December 31, Year Ended December 31, |
|
|
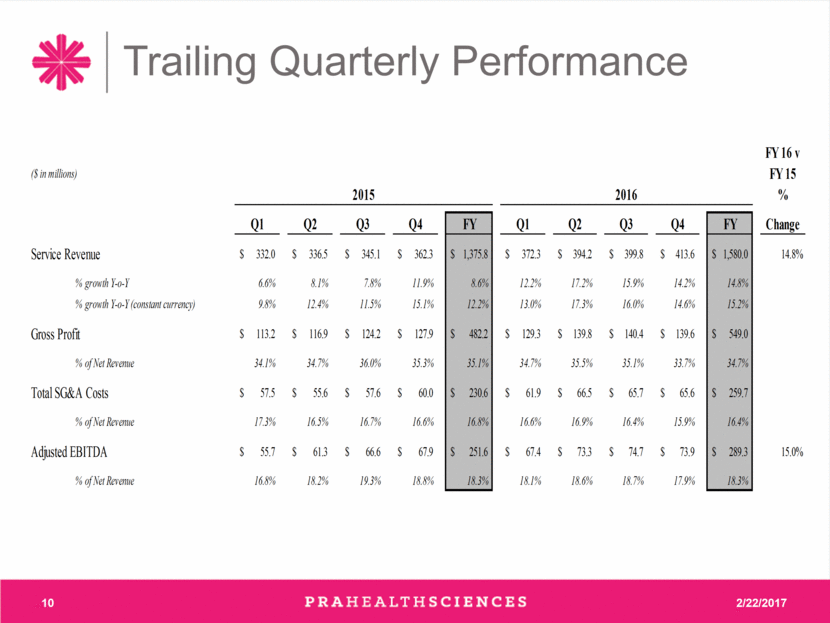
Trailing Quarterly Performance FY 16 v ($ in millions) FY 15 % Q1 Q2 Q3 Q4 FY Q1 Q2 Q3 Q4 FY Change Service Revenue 332.0 $ 336.5 $ 345.1 $ 362.3 $ 1,375.8 $ 372.3 $ 394.2 $ 399.8 $ 413.6 $ 1,580.0 $ 14.8% % growth Y-o-Y 6.6% 8.1% 7.8% 11.9% 8.6% 12.2% 17.2% 15.9% 14.2% 14.8% % growth Y-o-Y (constant currency) 9.8% 12.4% 11.5% 15.1% 12.2% 13.0% 17.3% 16.0% 14.6% 15.2% Gross Profit 113.2 $ 116.9 $ 124.2 $ 127.9 $ 482.2 $ 129.3 $ 139.8 $ 140.4 $ 139.6 $ 549.0 $ % of Net Revenue 34.1% 34.7% 36.0% 35.3% 35.1% 34.7% 35.5% 35.1% 33.7% 34.7% Total SG&A Costs 57.5 $ 55.6 $ 57.6 $ 60.0 $ 230.6 $ 61.9 $ 66.5 $ 65.7 $ 65.6 $ 259.7 $ % of Net Revenue 17.3% 16.5% 16.7% 16.6% 16.8% 16.6% 16.9% 16.4% 15.9% 16.4% Adjusted EBITDA 55.7 $ 61.3 $ 66.6 $ 67.9 $ 251.6 $ 67.4 $ 73.3 $ 74.7 $ 73.9 $ 289.3 $ 15.0% % of Net Revenue 16.8% 18.2% 19.3% 18.8% 18.3% 18.1% 18.6% 18.7% 17.9% 18.3% 2015 2016 |
|
|
Backlog and New Business Awards FY 16 v ($ in millions) FY 15 % Q1 Q2 Q3 Q4 FY Q1 Q2 Q3 Q4 FY Change Beginning Backlog 2,141.1 $ 2,185.3 $ 2,262.4 $ 2,348.4 $ 2,141.1 $ 2,440.1 $ 2,552.8 $ 2,649.4 $ 2,775.6 $ 2,440.1 $ Ending Backlog 2,185.3 $ 2,262.4 $ 2,348.4 $ 2,440.1 $ 2,440.1 $ 2,552.8 $ 2,649.4 $ 2,775.6 $ 2,934.8 $ 2,934.8 $ 20.3% Backlog Conversion % 15.5% 15.4% 15.3% 15.4% 15.3% 15.4% 15.1% 14.9% Gross New Business Awards 444.3 $ 462.4 $ 507.4 $ 513.4 $ 1,927.6 $ 534.0 $ 570.0 $ 582.4 $ 680.7 $ 2,367.1 $ 22.8% Cancellations 46.3 $ 54.6 $ 76.0 $ 54.0 $ 231.0 $ 57.8 $ 76.1 $ 63.3 $ 93.4 $ 290.6 $ 25.8% % of Beginning Backlog 2.2% 2.5% 3.4% 2.3% 2.4% 3.0% 2.4% 3.4% Net New Business Awards 398.0 $ 407.8 $ 431.4 $ 459.4 $ 1,696.6 $ 476.2 $ 493.9 $ 519.1 $ 587.3 $ 2,076.5 $ 22.4% Net Book to Bill 1.20 1.21 1.25 1.27 1.23 1.28 1.25 1.30 1.42 1.31 2015 2016 |
|
|
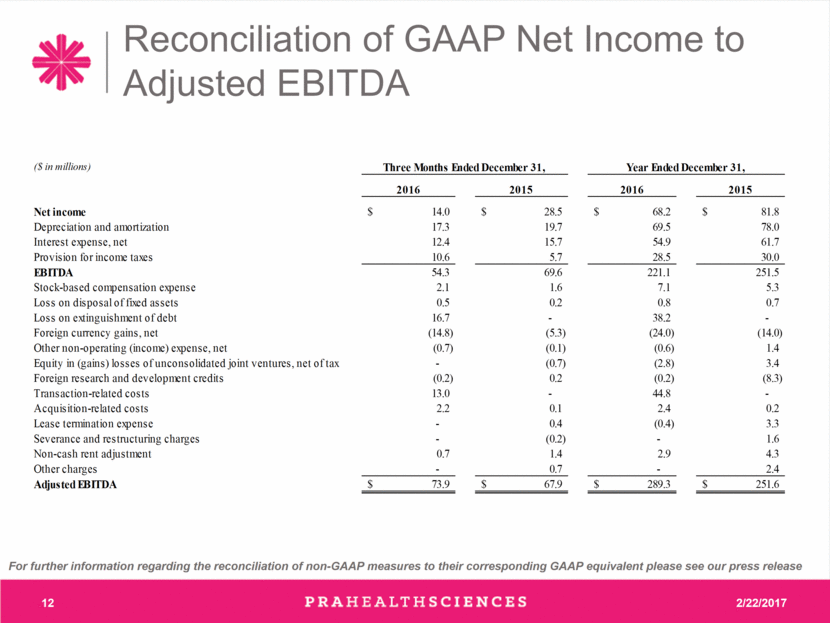
Reconciliation of GAAP Net Income to Adjusted EBITDA For further information regarding the reconciliation of non-GAAP measures to their corresponding GAAP equivalent please see our press release ($ in millions) 2016 2015 2016 2015 Net income 14.0 $ 28.5 $ 68.2 $ 81.8 $ Depreciation and amortization 17.3 19.7 69.5 78.0 Interest expense, net 12.4 15.7 54.9 61.7 Provision for income taxes 10.6 5.7 28.5 30.0 EBITDA 54.3 69.6 221.1 251.5 Stock-based compensation expense 2.1 1.6 7.1 5.3 Loss on disposal of fixed assets 0.5 0.2 0.8 0.7 Loss on extinguishment of debt 16.7 - 38.2 - Foreign currency gains, net (14.8) (5.3) (24.0) (14.0) Other non-operating (income) expense, net (0.7) (0.1) (0.6) 1.4 Equity in (gains) losses of unconsolidated joint ventures, net of tax - (0.7) (2.8) 3.4 Foreign research and development credits (0.2) 0.2 (0.2) (8.3) Transaction-related costs 13.0 - 44.8 - Acquisition-related costs 2.2 0.1 2.4 0.2 Lease termination expense - 0.4 (0.4) 3.3 Severance and restructuring charges - (0.2) - 1.6 Non-cash rent adjustment 0.7 1.4 2.9 4.3 Other charges - 0.7 - 2.4 Adjusted EBITDA 73.9 $ 67.9 $ 289.3 $ 251.6 $ Three Months Ended December 31, Year Ended December 31, |
|
|
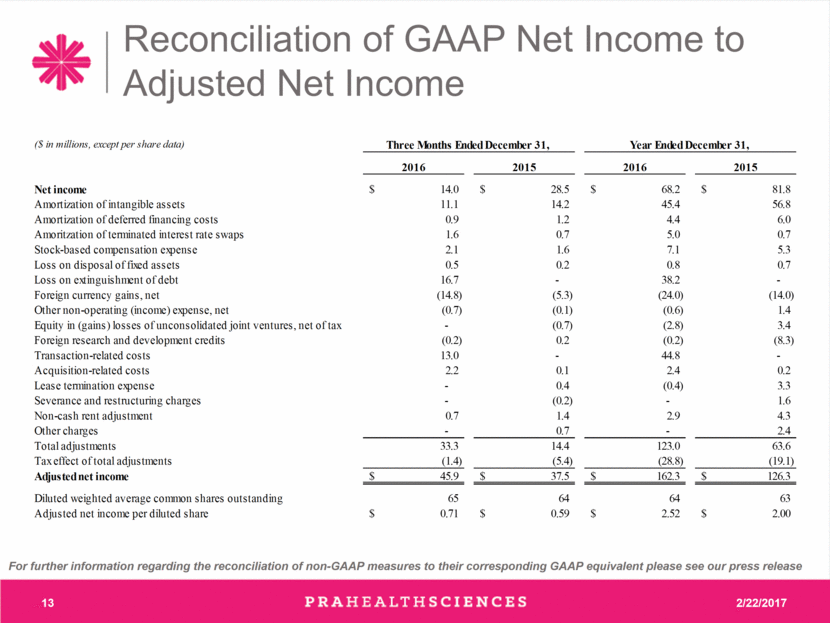
Reconciliation of GAAP Net Income to Adjusted Net Income For further information regarding the reconciliation of non-GAAP measures to their corresponding GAAP equivalent please see our press release ($ in millions, except per share data) 2016 2015 2016 2015 Net income 14.0 $ 28.5 $ 68.2 $ 81.8 $ Amortization of intangible assets 11.1 14.2 45.4 56.8 Amortization of deferred financing costs 0.9 1.2 4.4 6.0 Amoritzation of terminated interest rate swaps 1.6 0.7 5.0 0.7 Stock-based compensation expense 2.1 1.6 7.1 5.3 Loss on disposal of fixed assets 0.5 0.2 0.8 0.7 Loss on extinguishment of debt 16.7 - 38.2 - Foreign currency gains, net (14.8) (5.3) (24.0) (14.0) Other non-operating (income) expense, net (0.7) (0.1) (0.6) 1.4 Equity in (gains) losses of unconsolidated joint ventures, net of tax - (0.7) (2.8) 3.4 Foreign research and development credits (0.2) 0.2 (0.2) (8.3) Transaction-related costs 13.0 - 44.8 - Acquisition-related costs 2.2 0.1 2.4 0.2 Lease termination expense - 0.4 (0.4) 3.3 Severance and restructuring charges - (0.2) - 1.6 Non-cash rent adjustment 0.7 1.4 2.9 4.3 Other charges - 0.7 - 2.4 Total adjustments 33.3 14.4 123.0 63.6 Tax effect of total adjustments (1.4) (5.4) (28.8) (19.1) Adjusted net income 45.9 $ 37.5 $ 162.3 $ 126.3 $ Diluted weighted average common shares outstanding 65 64 64 63 Adjusted net income per diluted share 0.71 $ 0.59 $ 2.52 $ 2.00 $ Three Months Ended December 31, Year Ended December 31, |
|
|
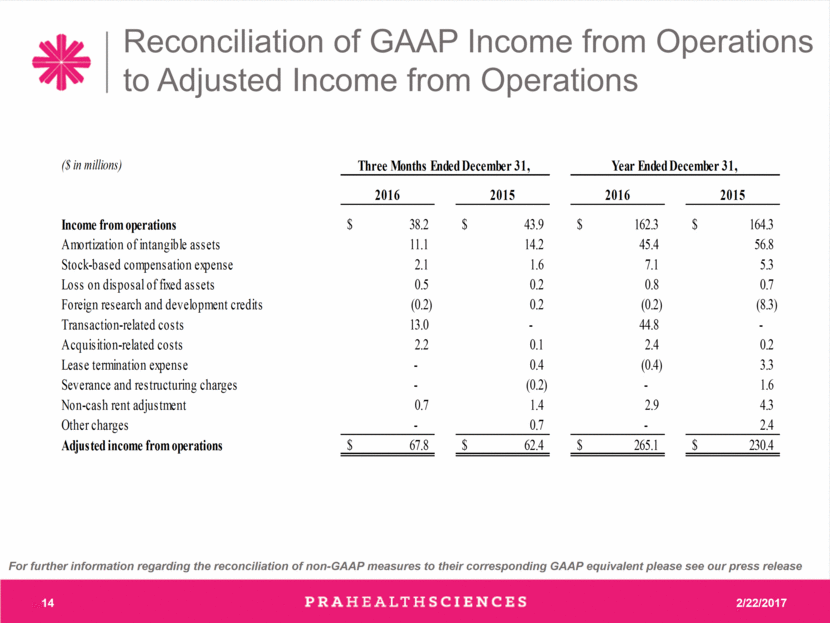
Reconciliation of GAAP Income from Operations to Adjusted Income from Operations For further information regarding the reconciliation of non-GAAP measures to their corresponding GAAP equivalent please see our press release ($ in millions) 2016 2015 2016 2015 Income from operations 38.2 $ 43.9 $ 162.3 $ 164.3 $ Amortization of intangible assets 11.1 14.2 45.4 56.8 Stock-based compensation expense 2.1 1.6 7.1 5.3 Loss on disposal of fixed assets 0.5 0.2 0.8 0.7 Foreign research and development credits (0.2) 0.2 (0.2) (8.3) Transaction-related costs 13.0 - 44.8 - Acquisition-related costs 2.2 0.1 2.4 0.2 Lease termination expense - 0.4 (0.4) 3.3 Severance and restructuring charges - (0.2) - 1.6 Non-cash rent adjustment 0.7 1.4 2.9 4.3 Other charges - 0.7 - 2.4 Adjusted income from operations 67.8 $ 62.4 $ 265.1 $ 230.4 $ Three Months Ended December 31, Year Ended December 31, |
|
|
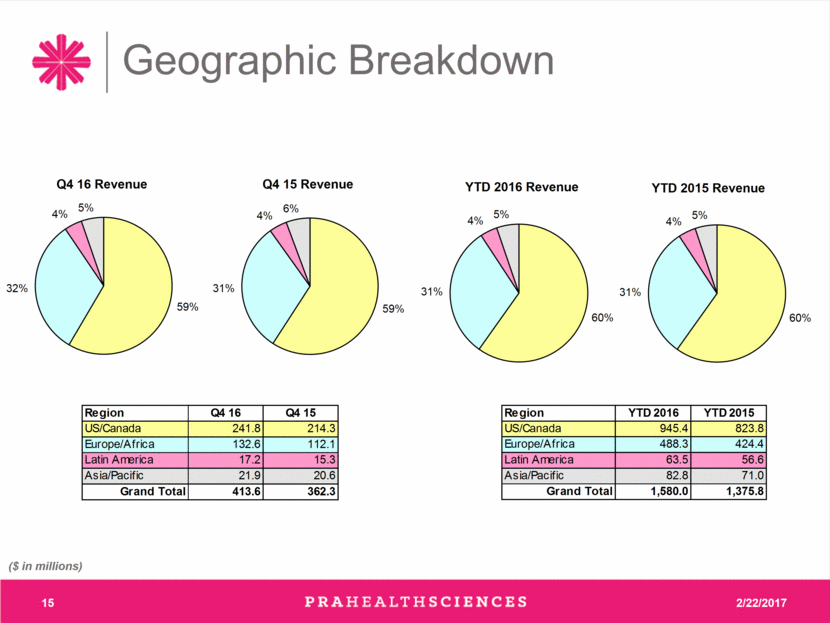
Geographic Breakdown ($ in millions) Region Q4 16 Q4 15 US/Canada 241.8 214.3 Europe/Africa 132.6 112.1 Latin America 17.2 15.3 Asia/Pacific 21.9 20.6 Grand Total 413.6 362.3 60% 31% 4% 5% YTD 2016 Revenue 60% 31% 4% 5% YTD 2015 Revenue Region YTD 2016 YTD 2015 US/Canada 945.4 823.8 Europe/Africa 488.3 424.4 Latin America 63.5 56.6 Asia/Pacific 82.8 71.0 Grand Total 1,580.0 1,375.8 |
|
|
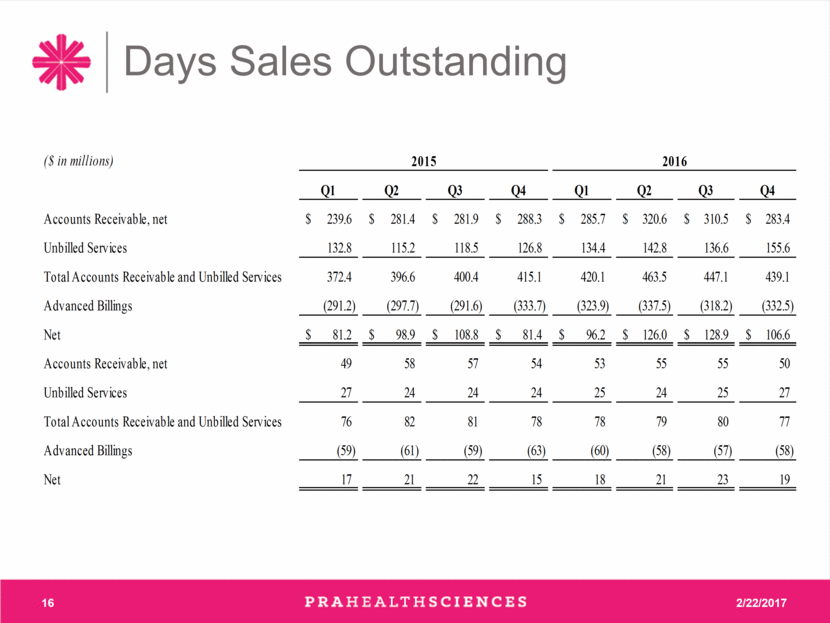
Days Sales Outstanding ($ in millions) Q1 Q2 Q3 Q4 Q1 Q2 Q3 Q4 Accounts Receivable, net 239.6 $ 281.4 $ 281.9 $ 288.3 $ 285.7 $ 320.6 $ 310.5 $ 283.4 $ Unbilled Services 132.8 115.2 118.5 126.8 134.4 142.8 136.6 155.6 Total Accounts Receivable and Unbilled Services 372.4 396.6 400.4 415.1 420.1 463.5 447.1 439.1 Advanced Billings (291.2) (297.7) (291.6) (333.7) (323.9) (337.5) (318.2) (332.5) Net 81.2 $ 98.9 $ 108.8 $ 81.4 $ 96.2 $ 126.0 $ 128.9 $ 106.6 $ Accounts Receivable, net 49 58 57 54 53 55 55 50 Unbilled Services 27 24 24 24 25 24 25 27 Total Accounts Receivable and Unbilled Services 76 82 81 78 78 79 80 77 Advanced Billings (59) (61) (59) (63) (60) (58) (57) (58) Net 17 21 22 15 18 21 23 19 2015 2016 |
|
|
[LOGO] |


