Attached files
| file | filename |
|---|---|
| EX-32 - EXHIBIT 32 - TriState Capital Holdings, Inc. | tsc-12312016x10kexhibit32.htm |
| EX-31.2 - EXHIBIT 31.2 - TriState Capital Holdings, Inc. | tsc-12312016x10kexhibit312.htm |
| EX-31.1 - EXHIBIT 31.1 - TriState Capital Holdings, Inc. | tsc-12312016x10kexhibit311.htm |
| EX-24 - EXHIBIT 24 - TriState Capital Holdings, Inc. | tsc-12312016x10kexhibit24.htm |
| EX-23.2 - EXHIBIT 23.2 - TriState Capital Holdings, Inc. | tsc-12312016x10kexhibit232.htm |
| EX-21 - EXHIBIT 21 - TriState Capital Holdings, Inc. | tsc-12312016x10kexhibit21.htm |
UNITED STATES
SECURITIES AND EXCHANGE COMMISSION
Washington, D.C. 20549
_________
FORM 10-K
_________
ý | ANNUAL REPORT PURSUANT TO SECTION 13 OR 15(d) OF THE SECURITIES EXCHANGE ACT OF 1934 |
For the fiscal year ended December 31, 2016
¨ | TRANSITION REPORT PURSUANT TO SECTION 13 OR 15(d) OF THE SECURITIES EXCHANGE ACT OF 1934 |
For the transition period from ____ to ____
Commission file number: 001-35913
_________
TRISTATE CAPITAL HOLDINGS, INC.
(Exact name of registrant as specified in its charter)
_________
Pennsylvania | 20-4929029 | |
(State or other jurisdiction of incorporation or organization) | (I.R.S. Employer Identification No.) | |
One Oxford Centre |
301 Grant Street, Suite 2700 |
Pittsburgh, Pennsylvania 15219 |
(Address of principal executive offices) |
(Zip Code) |
(412) 304-0304 |
(Registrant’s telephone number, including area code) |
_________
Securities registered pursuant to Section 12(b) of the Act:
Title of each class | Name of each exchange on which registered | |
Common Stock, no par value | The Nasdaq Stock Market LLC | |
Securities registered pursuant to section 12(g) of the Act: None
Indicate by check mark if the registrant is a well-known seasoned issuer, as defined in Rule 405 of the Securities Act. ¨ Yes ý No
Indicate by check mark if the registrant is not required to file reports pursuant to Section 13 or Section 15(d) of the Act. ¨ Yes ý No
Indicate by check mark whether the registrant (1) has filed all reports required to be filed by Section 13 or 15(d) of the Securities Exchange Act of 1934 during the preceding 12 months (or for such shorter period that the registrant was required to file such reports), and (2) has been subject to such filing requirements for the past 90 days. ý Yes ¨ No
Indicate by check mark whether the registrant has submitted electronically and posted on its corporate Web site, if any, every Interactive Data File required to be submitted and posted pursuant to Rule 405 of Regulation S-T (§ 232.405) during the preceding 12 months (or for such shorter period that the registrant was required to submit and post such files). ý Yes ¨ No
Indicate by check mark if disclosure of delinquent filers pursuant to Item 405 of Regulation S-K (§ 229.405 of this chapter) is not contained herein, and will not be contained, to the best of registrant’s knowledge, in definitive proxy or information statements incorporated by reference in Part III of this Form 10-K or any amendment to this Form 10-K. ¨
Indicate by check mark whether the registrant is a large accelerated filer, an accelerated filer, a non-accelerated filer, or a smaller reporting company. See the definitions of “large accelerated filer,” “accelerated filer” and “smaller reporting company” in Rule 12b-2 of the Exchange Act. (Check one):
Large accelerated filer | ¨ | Accelerated filer | ý | |
Non-accelerated filer | ¨ | (Do not check if a smaller reporting company) | Smaller reporting company | ¨ |
Indicate by check mark whether the registrant is a shell company (as defined in Rule 12b-2 of the Exchange Act). ¨ Yes ý No
As of June 30, 2016, the aggregate market value of the shares of common stock held by non-affiliates, based on the closing price per share of the registrant’s common stock as reported on The Nasdaq Global Select Market, was approximately $296,308,000.
As of January 31, 2017, there were 28,638,826 shares of the registrant’s common stock, no par value, outstanding.
DOCUMENTS INCORPORATED BY REFERENCE
Portions of the proxy statement to be filed with the Securities and Exchange Commission for the annual shareholders meeting to be held May 16, 2017, are incorporated by reference into Part III.
TRISTATE CAPITAL HOLDINGS, INC. AND SUBSIDIARIES
TABLE OF CONTENTS
3
PART I
ITEM 1. BUSINESS
Overview
TriState Capital Holdings, Inc. (“we”, “us”, “our” or the “Company”) is a bank holding company headquartered in Pittsburgh, Pennsylvania. The Company has three wholly owned subsidiaries: TriState Capital Bank (the “Bank”), a Pennsylvania chartered bank; Chartwell Investment Partners, LLC (“Chartwell”), a registered investment advisor; and Chartwell TSC Securities Corp. (“CTSC Securities”), which has applied to be registered as a broker/dealer with the Securities and Exchange Commission (“SEC”) and Financial Industry Regulatory Authority (“FINRA”). Through our bank subsidiary we serve middle-market businesses in our primary markets throughout the states of Pennsylvania, Ohio, New Jersey and New York and we also serve high-net-worth individuals on a national basis through our private banking channel. We market and distribute our banking products and services through a scalable branchless banking model, which creates significant operating leverage throughout our business as we continue to grow. Through our investment management subsidiary, we provide investment management services to institutional, sub-advisory, managed account and private clients on a national basis. Our broker/dealer subsidiary, once registered, will support the distribution and marketing efforts for Chartwell’s proprietary investment products.
We operate two reportable segments: Bank and Investment Management.
• | The Bank segment provides commercial banking to middle-market businesses and private banking services to high-net-worth individuals through our TriState Capital Bank subsidiary. Total assets of the Bank were $3.85 billion as of December 31, 2016. |
• | The Investment Management segment provides advisory and sub-advisory investment management services to primarily institutional plan sponsors through Chartwell and also supports distribution and marketing efforts for Chartwell’s proprietary investment products through CTSC Securities. Assets under management for this segment were $8.06 billion as of December 31, 2016. |
◦ | On March 5, 2014, TriState Capital Holdings, Inc. through its wholly-owned subsidiary, Chartwell Investment Partners, LLC, completed the acquisition of substantially all of the assets of Chartwell Investment Partners, LP (the “Chartwell acquisition”). |
◦ | On April 29, 2016, Chartwell completed the acquisition of substantially all of the assets of The Killen Group, Inc. (the "TKG acquisition"). |
◦ | These acquisitions have enhanced our recurring fee revenue, provided new product offerings for our national network of financial intermediaries, and leveraged our financial services distribution capabilities. |
For additional financial information by segment, refer to Note 23, Segments, to our consolidated financial statements.
Our Business Strategy
Our success has been built upon the vision and focus of our executive management team to combine the sophisticated products, services and risk management efforts of a large financial institution with the personalized service of a community bank. We believe that a results-based culture, combined with a well-managed middle-market and private banking business, and our targeted investment management business, will continue to grow and generate attractive returns for shareholders. The following are the key components of our business strategies:
Our Sales and Distribution Culture. We focus on efficient and profitable sales and distribution of investment management services and banking products and services to middle-market businesses and private banking clients. Our relationship managers and distribution professionals have significant experience in the banking and financial services industries and are focused on client service. In our banking business, we monitor gross profit contribution, loan and deposit growth, and asset quality by market and by relationship manager. Our compensation program is designed within our banking business to incentivize our regional presidents and relationship managers to prudently grow their loans, deposits and profitability, while maintaining strong asset quality. In our investment management business, our compensation program is designed to incentivize new assets under management while maximizing the retention of existing clients and exceeding benchmark investment performance.
Disciplined Risk Management. We place a strong emphasis on effective risk management as an integral component of our organizational culture. We use our risk management infrastructure to monitor existing operations, support decision-making and improve the success rate of existing products and services as well as new initiatives. A major part of our risk management effort has been our focus on
4
increasing non-interest income, including our expansion into the investment management business through our Chartwell and TKG acquisitions. Also, in our banking business, this has included our focus on growing loans originated through our private banking channel. We believe these loans have lower credit risk because they are typically secured by readily liquid collateral, such as marketable securities and/or are personally guaranteed by high-net-worth borrowers.
Experienced Professionals. Having successful and high quality professionals is critical to continuing to drive prudent growth in our business. In addition to our experienced executive management team and board of directors, we employ highly experienced personnel across our entire organization. Our regional middle-market banking presidents each have at least 30 years of banking experience and our middle-market relationship managers have an average of more than 25 years of banking experience. Chartwell’s mission is successfully executed through the dedication of investment professionals who average over 20 years of industry experience. We believe that our distinct business model, culture, and scalable platform enable us to attract and retain high quality professionals. Additionally, our low overhead costs give us the financial capability to attract and incentivize qualified professionals who desire to work in an entrepreneurial and results-oriented organization.
Efficient and Scalable Operating Model. With respect to our banking business, we believe our branchless banking model gives us a competitive advantage by eliminating the overhead and intense management requirements of a traditional branch network. Moreover, we believe that we have a scalable platform and organizational infrastructure that positions us to grow our revenue more rapidly than our operating expenses. We also believe that our investment management business has an efficient and scalable business model that focuses on institutional direct clients and wholesale distribution channels to reach retail investors.
Lending Strategy. We generate loans through our middle-market banking and private banking channels. These channels provide risk diversification and offer significant growth opportunities.
• | Middle-Market Banking Channel. We target our middle-market business primarily at businesses with revenues between $5.0 million and $300.0 million located within our primary markets. To capitalize on this opportunity, each of our representative offices is led by an experienced regional president so we can understand the unique borrowing needs of the middle-market businesses in their area. They are supported by highly experienced relationship managers with a reputation for success in targeting middle-market business customers and maintaining strong credit quality within their loan portfolios. |
• | Private Banking Channel. We provide loan products and services nationally to executives and high-net-worth individuals most of whom we source through referral relationships with independent broker/dealers, wealth managers, family offices, trust companies and other financial intermediaries. Our private banking products primarily include loans secured by cash, marketable securities and other asset-based loans. Our relationship managers have cultivated referral arrangements with 142 financial intermediaries. Under these arrangements, the financial intermediaries are able to refer their clients to us for responsive and sophisticated banking services. We believe many of our referral relationships also create cross-selling opportunities with respect to our deposit products and our investment management business. Since inception, we have had no charge-offs related to our loans secured by marketable securities. |
As shown in the following table, we have continued to achieve loan growth through both of our banking channels although since 2014 we have grown the loans in our private banking channel more than in our middle-market banking channel. As of December 31, 2016, our middle-market banking channel represented 49.0% of our loans held-for-investment.
As of December 31, 2016, loans sourced through our private banking channel represented 51.0% of our loans held-for-investment. In addition, as of December 31, 2016, $1.58 billion of our private banking loans were secured by cash and marketable securities, which represented an increase of $403.7 million, or 34.2%, for the year ended December 31, 2016. We expect continued strong loan and deposit growth in this channel, in part, because we added 23 new loan referral relationships during the year ended December 31, 2016 for a total of 142 referral relationships at the end of 2016. We have also experienced continued growth in the number of customers resulting from our existing referral relationships.
5
December 31, | 2016 Change from 2015 | |||||||||||
(Dollars in thousands) | 2016 | 2015 | Amount | Percent | ||||||||
Middle-market banking offices: | ||||||||||||
Western Pennsylvania | $ | 480,271 | $ | 445,554 | $ | 34,717 | 7.8 | % | ||||
Eastern Pennsylvania | 314,454 | 329,767 | (15,313 | ) | (4.6 | )% | ||||||
Ohio | 283,473 | 259,902 | 23,571 | 9.1 | % | |||||||
New Jersey | 343,413 | 291,795 | 51,618 | 17.7 | % | |||||||
New York (1) | 243,515 | 169,402 | 74,113 | 43.7 | % | |||||||
Total middle-market banking loans | 1,665,126 | 1,496,420 | 168,706 | 11.3 | % | |||||||
Total private banking loans | 1,735,928 | 1,344,864 | 391,064 | 29.1 | % | |||||||
Loans held-for-investment | $ | 3,401,054 | $ | 2,841,284 | $ | 559,770 | 19.7 | % | ||||
(1) | Our New York representative office opened for business in August 2012. |
Deposit Funding Strategy. Since inception, we have focused on creating and growing diversified, stable, and low all-in cost deposit channels, both in our primary markets and across the United States, without operating a traditional branch network. As of December 31, 2016, we consider approximately 80.0% of our total deposits to be sourced from direct customer relationships. We believe our sources of deposits continue to provide excellent opportunities for growth both within our primary markets and nationally.
We take a multilayered approach to our deposit growth strategy. We believe our relationship managers are an integral part of this approach and, accordingly, we have competitive incentives for them to increase the deposits associated with their relationships. We have relationship managers who are specifically dedicated to deposit generation and treasury management, and we plan to continue adding such professionals as appropriate to support our growth. Additionally, we believe that our financial performance and our products and services, which are targeted to our markets, enhance our growth of cost-effective deposits. For additional details regarding our deposit products and services, see “Our Products and Services-Deposits.”
Investment Management Strategy. We have executed on our investment management strategy by following our 2014 Chartwell acquisition with the April 29, 2016, closing of the TKG acquisition. We believe that this segment has enhanced our recurring fee revenue, provided new product offerings for our national network of financial intermediaries, and leveraged our financial services distribution capabilities through the financial intermediaries with which our banking business has worked and developed. All of the employees of Chartwell and TKG, including the experienced management team, joined our investment management business upon acquisition closing. In addition, James F. Getz, our Chairman, Chief Executive Officer and President, along with several members of our board of directors, including James J. Dolan, James E. Minnick and Richard B. Seidel, all have significant experience in investing in and operating investment management companies and serve on the Board of Directors of Chartwell. Mr. Getz also serves as Chairman of the Board and Executive Chairman of Chartwell.
Market Reputation. We believe that our strong market reputation has become and will remain a competitive advantage within our primary markets and nationally for our private banking channel and for our investment management business. We believe that we have established a reputation as both a sophisticated lender and a customer-focused financial services institution.
Our Markets
For our middle-market banking business, our primary markets of Pennsylvania, Ohio, New Jersey and New York include the four major metropolitan statistical areas (“MSA”) of Pittsburgh and Philadelphia, Pennsylvania; Cleveland, Ohio and New York, New York (which includes northern New Jersey) in which our headquarters and four representative offices are located. We believe that our primary markets including these MSAs are long-term, attractive markets for the types of products and services that we offer, and we anticipate that these markets will continue to support our projected growth. With respect to our loans and other financial services and products, we selected the locations for our representative offices partially based upon the number of middle-market businesses located in these MSAs and their respective states. As of December 31, 2016, there were nearly 150,000 middle-market businesses in our primary markets with annual sales between $5.0 million and $300.0 million, which represented approximately 18.0% of the national total as of that date, according to OneSource Information Services, Inc. According to SNL Financial, the 2016 aggregate population of the four MSAs in which our headquarters and four representative offices are located was approximately 30 million, which represented approximately 10% of the national population. We believe that the population and business concentrations within our primary markets provide attractive opportunities to grow our business.
In addition to middle-market businesses in our primary markets, our private banking business also serves high-net-worth individuals on a national basis. We primarily source this business through referral relationships with independent broker/dealers, wealth managers, family offices, trust companies and other financial intermediaries. We view our product offerings as being most appealing to those households with $500,000 or more in net worth (not including their primary residence).
6
Through our distribution channels, we pursue and create deposit relationships, including treasury management relationships, with customers located throughout the United States, as well as in our primary markets, including the four MSAs where our offices are located. Because our deposit operations are centralized in our Pittsburgh headquarters all of our deposits are aggregated and accounted for in that MSA. For these distribution and reporting reasons, we do not consider deposit market share in any MSA or any of our primary markets to be relevant data. However, for perspective on the size of the deposit markets in which we have offices, the total aggregate domestic deposits of banks headquartered within the four MSAs were approximately $1.4 trillion as of December 31, 2016, according to SNL Financial.
Our investment management products are primarily distributed in two markets. These markets and their relative percentage of our assets under management as of December 31, 2016, were as follows: institutional and sub-advisory (62%) and broker/dealers and registered investment advisors (38%).
Institutional and Sub-Advisory. Chartwell maintains a dedicated sales and client service staff to focus on the distribution of its products to a wide variety of institutional and sub-advisory clients, including corporate pension and profit-sharing plans, public pension plans, Taft-Hartley plans, foundations, endowments and registered investment companies. As of December 31, 2016, assets under management in the institutional and sub-advisory market included $2.39 billion in equity products and $2.60 billion in fixed-income products.
Broker/Dealer and Independent Registered Investment Advisors. Chartwell maintains sales staff dedicated to calling on national, regional and independent broker/dealers and registered investment advisors. Broker/dealers and registered investment advisors use Chartwell’s products to meet the needs of their customers, who are typically retail and/or high-net-worth investors. As of December 31, 2016, assets under management in the broker/dealer and independent registered investment advisor market included $1.83 billion in equity products and $1.24 billion in fixed-income products.
Our Products and Services
We offer our clients an array of products and services, including loan and deposit products, cash management services, capital market services such as interest rate swaps and investment management products.
• | Our loan products include, among others, loans secured by cash or marketable securities, commercial and industrial loans, commercial real estate loans, personal loans, asset-based loans, acquisition financing, and letters of credit. |
• | Our deposit products include, among others, checking accounts, money market deposit accounts, certificates of deposit, and Promontory’s Certificate of Deposit Account Registry Service® (“CDARS®”) and Insured Cash Sweep® (“ICS”®) services. |
• | Our liquidity and treasury management services include online balance reporting, online bill payment, remote deposit, liquidity services, wire and ACH services, foreign exchange and controlled disbursement. |
• | Our investment management business provides equity and fixed income advisory and sub-advisory services to third party mutual funds, series trust mutual funds, and to separately managed accounts for a spectrum of clients, but primarily focused on ultra-high-net-worth and institutional clients, including corporations, ERISA plans, Taft-Hartley funds, municipalities, endowments and foundations. |
More information about our key products and services, including a discussion about how we manage our products and services within our overall business and enterprise risk strategy, is set forth below.
We expect to continue to develop and implement additional products for our clients, including additional investment management product offerings to our financial intermediary referral sources. For additional information, see “Our Business Strategy-Investment Management Strategy.”
Loans
Our primary source of income in our Bank segment is interest on loans. Our loan portfolio primarily consists of loans to our private banking clients, commercial and industrial loans, and real estate loans secured by commercial real estate properties. Our loan portfolio represents the largest component of our earning assets.
7
The following table presents the composition of our loan portfolio as of December 31, 2016.
(Dollars in thousands) | December 31, 2016 | Percent of Loans | |||
Private banking loans | $ | 1,735,928 | 51.0 | % | |
Middle-market banking loans: | |||||
Commercial and industrial | 587,423 | 17.3 | % | ||
Commercial real estate | 1,077,703 | 31.7 | % | ||
Total middle-market banking loans | 1,665,126 | 49.0 | % | ||
Loans held-for-investment | $ | 3,401,054 | 100.0 | % | |
Private Banking Loans. Our private banking loans include both personal and commercial loans sourced through our private banking channel, which operates on a national basis. These loans primarily consist of loans made to high-net-worth individuals, trusts and businesses that may be secured by cash, marketable securities, or other financial assets and to a smaller degree, residential property. We also have a small number of unsecured loans and lines of credit in our private banking loan portfolio that have been made to creditworthy borrowers. The primary source of repayment for these loans is the income and assets of the borrower(s). Since a majority of our private banking loans are secured by cash, marketable securities or residential real estate, we believe the credit risk inherent in this segment of our portfolio is lower than the risk associated with other types of loans. We mitigate such risks through active daily monitoring of the collateral, utilizing our proprietary monitoring system.
Our private banking lines of credit predominantly are due on demand or have terms of 364 days. Our term loans (other than mortgage loans) in this category generally have maturities of three to five years. On an accommodative basis, we have made personal residential real estate loans consisting primarily of first and second mortgage loans for residential properties, including jumbo mortgages. Our residential mortgage loans typically have maturities of seven years or less. On a limited basis we originated mortgage loans with maturities of up to ten years and acquired other residential mortgages that had original maturities of up to 30 years. Our personal lines of credit typically have floating interest rates. We examine the personal cash flow and liquidity of our individual borrowers when underwriting our private banking loans not secured by cash or marketable securities. In some cases we require our borrowers to agree to maintain a minimum level of liquidity that will be sufficient to repay the loan.
As of December 31, 2016, we had $1.74 billion of private banking loans outstanding, or approximately 51.0% of loans held-for-investment. The table below includes all loans made through our private banking channel by collateral type as of the date indicated.
(Dollars in thousands) | December 31, 2016 | Percent of Private Banking Loans | Percent of Loans | ||||
Private banking loans: | |||||||
Secured by cash and marketable securities | $ | 1,584,373 | 91.3 | % | 46.6 | % | |
Secured by real estate | 110,476 | 6.3 | % | 3.2 | % | ||
Other | 41,079 | 2.4 | % | 1.2 | % | ||
Total private banking loans | $ | 1,735,928 | 100.0 | % | 51.0 | % | |
Commercial and Industrial Loans. Our commercial and industrial loan portfolio primarily includes loans made to service companies or manufacturers generally for the purpose of production, operating capacity, accounts receivable, inventory or equipment financing, acquisitions and recapitalizations. Cash flow from the borrower’s operations provides the primary source of repayment for these loans. The primary risks associated with commercial and industrial loans include potential declines in the value of collateral securing these loans, the highly-leveraged nature and inconsistent earnings of some commercial borrowers, and the larger average balances of commercial and industrial loans made to individual borrowers. We work throughout the lending process to manage and mitigate such risks within our commercial and industrial loan portfolio.
Our commercial and industrial loans include both working capital lines of credit and term loans. Working capital lines of credit generally have maturities ranging from one to five years. Availability under our commercial lines of credit is typically limited to a percentage of the value of the assets securing the line. Those assets typically include accounts receivable, inventory and occasionally equipment. Depending on the risk profile of the borrower, we may require periodic accounts receivable and payable agings, as well as borrowing base certificates representing borrowing availability after applying appropriate advance percentage rates to the collateral. Our commercial and industrial term loans generally have maturities between three to five years, and typically do not extend beyond seven years. Our commercial and industrial lines of credit and term loans typically have floating interest rates.
8
The following table shows the composition of our commercial and industrial loan portfolio by borrower industry as of December 31, 2016.
(Dollars in thousands) | December 31, 2016 | Percent of Commercial and Industrial Loans | Percent of Loans | ||||
Industry: | |||||||
Service | $ | 170,391 | 29.0 | % | 5.0 | % | |
Manufacturing | 160,643 | 27.3 | % | 4.7 | % | ||
Real estate, rental and leasing | 76,266 | 13.0 | % | 2.3 | % | ||
Information | 31,750 | 5.4 | % | 0.9 | % | ||
Wholesale Trade | 24,211 | 4.1 | % | 0.7 | % | ||
Transportation and warehousing | 23,568 | 4.0 | % | 0.7 | % | ||
Retail Trade | 23,365 | 4.0 | % | 0.7 | % | ||
Construction | 16,745 | 2.9 | % | 0.5 | % | ||
Mining | 12,029 | 2.0 | % | 0.4 | % | ||
All others | 48,455 | 8.3 | % | 1.4 | % | ||
Total commercial and industrial loans | $ | 587,423 | 100.0 | % | 17.3 | % | |
Loans extended to borrowers within the service industries include loans to finance working capital and equipment. Significant trade categories represented within the service industries include, among others, financial services, scientific/technical services, health care and hospitality services. Loans extended to borrowers within the manufacturing industry include loans to manufacturers of paper, chemicals, plastics, rubber, glass and clay products. Borrowers represented within the real estate, rental and leasing category are largely owners and managers of both residential and non-residential commercial real estate income-producing properties.
Commercial Real Estate Loans. We concentrate on making commercial real estate loans to experienced borrowers that have an established history of successful projects. The cash flow from income-producing properties or the sale of property from for-sale construction and development loans are generally the primary sources of repayment for these loans. The equity sponsors of our borrowers generally provide a secondary source of repayment from their excess global cash flows and liquidity. The primary risks associated with commercial real estate loans include credit risk arising from the dependency of repayment upon income generated from the property securing the loan, the vulnerability of such income to changes in market conditions, and difficulty in liquidating collateral securing the loans. We work throughout the lending process to manage and mitigate such risks within our commercial real estate loan portfolio.
Our commercial real estate loans are primarily made to borrowers with projects or properties located within our primary markets. Our relationship managers are experienced lenders who are familiar with the trends within their local real estate markets.
The table below shows the composition of our commercial real estate portfolio as of December 31, 2016.
(Dollars in thousands) | December 31, 2016 | Percent of Commercial Real Estate Loans | Percent of Loans | ||||
Commercial real estate term loans: | |||||||
Income-producing property loans | $ | 601,266 | 55.8 | % | 17.7 | % | |
Owner-occupied term loans | 128,944 | 12.0 | % | 3.8 | % | ||
Multifamily/apartment loans | 242,318 | 22.5 | % | 7.1 | % | ||
Total real estate term loans | 972,528 | 90.3 | % | 28.6 | % | ||
Residential construction loans | 10,685 | 1.0 | % | 0.3 | % | ||
Other construction loans | 85,663 | 7.9 | % | 2.5 | % | ||
Land development loans | 8,827 | 0.8 | % | 0.3 | % | ||
Total commercial real estate loans | $ | 1,077,703 | 100.0 | % | 31.7 | % | |
• | Real Estate Term Loans. As of December 31, 2016, approximately $972.5 million, or approximately 28.6% of loans held-for-investment, consisted of real estate term loans. Our real estate term loans include credit secured by various types of income-producing properties, owner-occupied term loans and multifamily/apartment loans. In making real estate term loans, we look for income-producing properties that have established cash flows sufficient to service the proposed loan on an amortizing basis. Our real estate term loans generally have maturities of five to seven years and are offered with both fixed and floating interest |
9
rates. In addition to providing real estate term loans for investment properties, we also finance owner-occupied commercial properties.
• | Construction Loans. As of December 31, 2016, approximately $96.3 million, or approximately 2.8% of loans held-for-investment, consisted of residential and other construction loans. Our residential construction loans are typically for single-family residential properties. Our other construction loans are typically for projects used in manufacturing, warehousing, office, service, retail and multifamily housing. These loans are usually floating-rate loans. Generally, our construction loans have a term of one to three years, but can include an amortizing term loan period of generally three to five years contingent upon the property meeting established debt service coverage levels. Properties related to our construction loans are frequently pre-leased at a level that will generate sufficient cash flow to service the fully advanced construction loan on an amortizing basis upon the completion of construction. |
• | Land Development Loans. As of December 31, 2016, the remaining $8.8 million, or approximately 0.3% of loans held-for-investment, consisted of land development loans. Our land development loans include loans to finance the purchase and development of land for sale. We make these loans on a limited basis. In making land development loans, we typically require a higher level of equity to be invested by the borrower and strong levels of borrower global cash flows to reduce reliance on land sales for repayment of the loan. These loans are typically structured as lines of credit with one to three year maturities and usually have floating interest rates. |
Loan Underwriting
Our focus on maintaining strong asset quality is pervasive throughout all aspects of our lending activities, and it is apparent in our loan underwriting function. We are selective in targeting our lending to middle-market businesses, commercial real estate investors and developers and high-net-worth individuals that we believe will meet our credit standards. Our credit standards are determined by our Credit Risk Policy Committee that is made up of senior bank officers, including our Chief Credit Officer, Chief Risk Officer, Bank President, President of Commercial Banking and President of Private Banking.
Our underwriting process is multilayered. Prospective loans are first reviewed by our relationship managers and regional presidents. The prospective commercial and certain private banking loans are then discussed in a pre-screen group composed of the Chief Credit Officer, Senior Credit Officer, President of Commercial Banking, President of Private Banking and all of our regional presidents. Applications for prospective loans that are accepted are fully underwritten by our credit administration group in combination with the relationship manager. Finally, the prospective loans are submitted to our Senior Loan Committee for approval, with the exception of certain loans that are fully secured by cash or marketable securities. Members of the Senior Loan Committee include our Chairman and Chief Executive Officer, Vice Chairman and Chief Financial Officer, Vice Chairman, Chief Credit Officer, Senior Credit Officer, Bank President, President of Commercial Banking, President of Private Banking and our regional presidents. All of our lending personnel, from our relationship managers to the members of our Senior Loan Committee, have significant experience that benefits our underwriting process.
We maintain high credit quality standards. Each credit approval, renewal, extension, modification or waiver is documented in written form to reflect all pertinent aspects of the transaction. Our underwriting analysis generally includes an evaluation of the borrower’s business, industry, operating performance, financial condition and typically includes a sensitivity analysis of the borrower’s ability to repay the loan.
Our lending activities are subject to internal exposure limits that restrict concentrations of loans within our portfolio to certain targets and maximums based on a percentage of total loan commitments and as a multiple of total risk-based capital. These exposure limits are approved by our Senior Loan Committee and our board of directors based upon recommendations made by the Credit Risk Policy Committee. Our internal exposure limits are established to avoid unacceptable concentrations in a number of areas, including in our different loan categories and in specific industries. In addition, we have established an informal limit on individual loans that is materially lower than our legal lending limit.
Our loan portfolio includes Shared National Credits (“SNC”). SNCs are participations in loans of $20 million or more that are shared by three or more financial institutions. We are typically part of the originating bank group in connection with these loan participations. We utilize the same underwriting criteria for these loans that we use for loans that we originate directly. These loans are to borrowers typically located within our primary markets and are generally made to companies that are known to us and with whom we have direct contact. They offer advantages in a diversified loan portfolio. These loans have helped us to diversify the risk inherent in our loan portfolio by allowing us to access a broader array of corporations with different credit profiles, repayment sources, geographic footprints and with larger revenue bases than those businesses associated with our direct loans. Still, we are focused more on growing our direct loans than SNC loans.
10
As of December 31, 2016, we had $344.0 million of SNC loans compared to $401.6 million as of December 31, 2015. Included in these totals were loans to private equity sponsored companies which totaled $42.8 million as of December 31, 2016, a decrease of $15.5 million from $58.3 million as of December 31, 2015. Due to the perceived higher risk nature of these private equity backed SNC loans, we intend to continue to decrease these loans primarily through attrition.
Loan Portfolio Concentrations
Geographic criteria. We focus on developing client relationships with companies that have headquarters and/or significant operations within our primary markets.
The table below shows the composition of our commercial loan portfolios based upon the states where our borrowers are located. Loans to borrowers located in our four primary market states make up 86.0% of our total commercial loans outstanding as of December 31, 2016. When those loans are aggregated with our loans to borrowers located in states that are contiguous to our primary market states, the percentage increases to approximately 91.1% of our commercial loan portfolio.
(Dollars in thousands) | December 31, 2016 | Percent of Total Commercial Loans | |||
Geographic region: | |||||
Pennsylvania | $ | 513,842 | 30.8 | % | |
Ohio | 302,537 | 18.2 | % | ||
New Jersey | 309,341 | 18.6 | % | ||
New York | 306,098 | 18.4 | % | ||
Contiguous states | 85,111 | 5.1 | % | ||
Other states | 148,197 | 8.9 | % | ||
Total commercial loans | $ | 1,665,126 | 100.0 | % | |
Diversified lending approach. We are committed to maintaining a diversified loan portfolio. We also concentrate on making loans to businesses where we have or can obtain the necessary expertise to understand the credit risks commonly associated with the borrower’s industry. We generally avoid lending to businesses that would require a high level of specialized industry knowledge that we do not have. For additional information about the details of each loan portfolio, see “Our Products and Services-Loans.”
Deposits
An important aspect of our business franchise is the ability to gather deposits and establish and grow meaningful relationships related to liquidity and treasury management customers. Deposits provide the primary source of funding for our lending activities. We offer traditional depository products including checking accounts, money market deposit accounts and certificates of deposit in addition to CDARS® and ICS® reciprocal products. We also offer cash management and treasury management services, including online balance reporting, online bill payment, remote deposit, liquidity services, wire and ACH services and collateral disbursement. Our deposits are insured by the Federal Deposit Insurance Corporation (“FDIC”) up to statutory limits.
As of December 31, 2016, non-brokered deposits represented approximately 67.8% of our total deposits. Our non-brokered deposit sources primarily include deposits from financial institutions, high-net-worth individuals, family offices, trust companies, wealth management firms, corporations and their executives. We compete for deposits by offering a range of deposit products at competitive rates. We also attract deposits by offering customers a variety of cash management services. We maintain direct customer relationships with many of our depositors whose deposits are considered to be brokered for regulatory purposes, including our CDARS® and ICS® reciprocal depositors. For additional information about our deposit products, liquidity and treasury management services, and our overall funding strategy, see “Our Business Strategy-Deposit Funding Strategy.”
11
The table below shows the balances of our deposit portfolio by type as of the dates indicated.
December 31, | 2016 Change from 2015 | |||||||||||
(Dollars in thousands) | 2016 | 2015 | Amount | Percent | ||||||||
Non-brokered deposits: | ||||||||||||
Noninterest-bearing checking accounts | $ | 230,226 | $ | 159,859 | $ | 70,367 | 44.0 | % | ||||
Interest-bearing checking accounts | 199,641 | 132,327 | 67,314 | 50.9 | % | |||||||
Money market deposit accounts | 1,356,653 | 931,779 | 424,874 | 45.6 | % | |||||||
Certificates of deposit | 443,293 | 412,086 | 31,207 | 7.6 | % | |||||||
Total non-brokered deposits | 2,229,813 | 1,636,051 | 593,762 | 36.3 | % | |||||||
Brokered deposits: | ||||||||||||
Interest-bearing checking accounts | 19,343 | 3,710 | 15,633 | 421.4 | % | |||||||
Money market deposit accounts | 582,054 | 532,500 | 49,554 | 9.3 | % | |||||||
Certificates of deposit | 455,569 | 517,583 | (62,014 | ) | (12.0 | )% | ||||||
Total brokered deposits | 1,056,966 | 1,053,793 | 3,173 | 0.3 | % | |||||||
Total deposits | $ | 3,286,779 | $ | 2,689,844 | $ | 596,935 | 22.2 | % | ||||
Non-brokered deposits to total deposits | 67.8 | % | 60.8 | % | ||||||||
Investment Management Products and Services
Chartwell Investment Partners manages $8.06 billion in a variety of equity and fixed income investment styles, for over 190 institutional, sub-advisory and private client relationships as of December 31, 2016. A description of each investment style is provided below.
Equity Investment Styles:
• | Small Cap Value: Chartwell’s Small Cap Value portfolio employs a traditional value style supplemented with both deep and relative value stocks. Our opportunity set is selected using multiple valuation yardsticks and focuses heavily on company valuation relative to history. Portfolio decisions result from business reviews assessing the prospects of erasing these valuation discounts with a focus on fundamental and event-driven catalysts which we believe the market should recognize. The portfolio aims to be well diversified across all economic sectors and exhibit better growth, profitability and financial strength characteristics than the small cap value benchmark. Our objective is to outperform small cap value benchmarks over the long term while producing lower risk scores versus peers. |
• | Mid Cap Value: Chartwell’s Mid Cap Value portfolio employs a traditional value style supplemented with both deep and relative value stocks. Our opportunity set is selected using multiple valuation yardsticks and focuses heavily on company valuation relative to history. Portfolio decisions result from business reviews assessing the prospects of erasing these valuation discounts with a focus on fundamental and event-driven catalysts which we believe the market should recognize. The portfolio aims to be well diversified across all economic sectors and exhibit better growth, profitability and financial strength characteristics than the mid cap value benchmark. Our objective is to outperform mid cap value benchmarks over the long term while producing lower risk scores versus peers. |
• | Small Cap Growth: Our Small Cap Growth portfolio invests in a select set of small growth oriented companies. We believe these businesses have demonstrated strong increases in earnings per share. More significantly, we look to invest in companies that have historically continued to broaden, deepen and enhance their fundamental capabilities, competitive positions, product and service offerings and customer bases. Our plan is to invest in these companies for an intermediate time horizon. Our portfolios focus on a narrow set of such investments. |
• | Mid Cap Growth: Our Mid Cap Growth portfolio invests in a select set of mid-cap growth oriented companies. We believe these businesses have demonstrated strong increases in earnings per share. More significantly, we look to invest in companies that have historically continued to broaden, deepen and enhance their fundamental capabilities, competitive positions, product and service offerings and customer bases. Our plan is to invest in these companies for an intermediate time horizon. Our portfolios focus on a narrow set of such investments. |
• | SMID Cap Growth: For clients in our SMID Cap Growth portfolio we invest in a select set of growth oriented companies with small to mid-market caps. These businesses have demonstrated strong increases in earnings per share. Again, we look to invest in companies that have historically continued to broaden, deepen and enhance their fundamental capabilities, competitive |
12
positions, product and service offerings and customer bases. Our plan is to invest in these companies for an intermediate time horizon. Our portfolios focus on a narrow set of such investments.
• | U.S. Small Cap: The U.S. Small Cap portfolio integrates the efforts of our Small Cap Value and Small Cap Growth investment teams. Our quantitative process is designed to result in a universe of securities that we believe are statistically inexpensive versus the Russell 2000, or which we believe demonstrates superior growth characteristics relative to their economic sector. The decisive elements of the research process are twofold. From a value standpoint, it is the appraisal of the company’s fundamental value that we believe separates those with real value from those that are merely inexpensive. On the growth side our goal is to separate companies with real growth potential from those that are only short-term performers with high valuation metrics. The final portfolio is constructed as a bottom up residual of stock selection from the “best ideas” of both value and growth. |
• | Dividend Value: Our objective in managing the Dividend Value portfolio is to deliver investment returns that exceed that of the Russell 1000 Value by focusing on what we believe are undervalued stocks with above-average dividend yields. We seek long-term inflation protection by investing in stocks in the top 40% of the market ranked by dividend yield; companies that we believe are capable of consistent dividend growth; and stocks that we believe are undervalued with significant potential for capital appreciation during a full market cycle. |
• | Covered Call: Our objective in managing Chartwell’s Covered Call strategy is to provide market-like returns in rising equity markets while earning superior returns in flat or down equity markets. We seek to attain this objective by combining a portfolio of higher dividend paying stocks which have valuations that do not properly reflect our view of their fundamentals and a disciplined call overwriting strategy. We join these two investment disciplines in an effort to create a lower volatility total return solution for clients. |
• | Micro Cap Value: Chartwell’s Micro Cap Value strategy offers investors a diversified portfolio of small-cap stocks selected in accordance with the Chartwell’s value style, which we believe emphasizes undervalued, temporarily out-of-favor securities such as turnaround situations, companies selling below their intrinsic worth and stocks that may be overlooked by Wall Street. We believe a diversified portfolio of such securities will, over time, provide superior long term performance while reducing market volatility. |
Fixed Income Investment Styles:
• | Intermediate/Core/Short Duration Fixed Income: Chartwell's philosophy of investment grade fixed income management stresses security selection, preservation of principal, and compounding of the income stream as keys to consistently adding value in the bond market. We focus our research efforts in the corporate sector of the market. Because the return potential of any bond tends to be asymmetric - with limited capital appreciation potential, but considerably greater capital loss potential - Chartwell targets high quality credits with stable-to improving profiles, rather than chasing "cheap" deteriorating credits. |
Chartwell utilizes a disciplined value, bottom-up approach to the fixed income market, with emphasis on building the portfolio through individual security selection. Employing in-depth, fundamental research, our highly experienced six member team assesses individual securities and selects those that it determines provide the best relative value. Each team member is responsible for the analysis and trading of one or more fixed income market sectors, including U.S. Government and Agency, Asset-Backed, Mortgage-Backed, Bank and Finance, Industrial, Utility, and Yankee. Portfolio managers seek to maintain a diversified high quality portfolio that has more favorable yield characteristics than the benchmark index. Within the investment process, approximately 80% of the value is sought through the vigorous security selection process, while the remaining balance is sought to sector allocation and yield curve placement. Our goal is to reduce risk and volatility exposures through credit research; therefore, duration shifts, sector swapping, interest rate bets and macroeconomic forecasting are not a central focus in our bottom-up process. Futures, options and other leveraged derivatives are not utilized in our credit central process.
• | Core Plus Fixed Income: With flexibility to adjust to each client’s specific guidelines, Chartwell’s Core Plus product invests across both the U.S. Investment Grade and High Yield markets. By strategically expanding our credit-driven, valued-based opportunity set, the Core Plus product allows a client’s portfolio to take advantage of Chartwell’s broad ranging corporate bond expertise and to benefit from the potential for increased income, total return and diversification. |
• | High Yield Fixed Income: Chartwell's philosophy of high yield bond management stresses preservation of principal and compounding of the income stream as keys to adding value in the high yield bond market. We focus on the higher quality tiers of the market, which offer an attractive yield premium but a lower incidence of credit erosion relative to the market as a whole. |
In evaluating investment candidates our perspective is that of a lender. We prefer low beta companies with proven, predictable business models and multiple sources of repayment. We utilize both objective and subjective screens to identify the universe
13
of acceptable investment candidates. In particular, we focus on large capitalization issues demonstrating attributes of financial transparency, stable-to improving cash flow, internal deleveraging capacity, and ample financial flexibility. Chartwell believes that the consistent application of high credit standards and strict trading disciplines is the most predictable route to outperformance in the high yield bond market.
• | Short Duration BB-Rated High Yield Fixed Income: Chartwell's philosophy of high yield bond management stresses preservation of principal and compounding of the income stream as keys to adding value in the high yield bond market. Again, our focus is on the higher quality tiers of the market, which offer an attractive yield premium but a lower incidence of credit erosion relative to the market as a whole. We focus on duration of less than three years with maximum maturities of five years. |
Balanced Investment Styles:
• | Conservative Allocation: The Conservative Allocation strategy is managed utilizing Chartwell’s value-oriented security selection process and includes the Berwyn Income Fund as one of its main products. While the majority of funds managed under this strategy are invested in bonds, it may invest up to 30% of its assets in dividend-paying common stocks. The fund’s balanced, income-oriented approach we believe may afford a greater level of price stability than an all equity portfolio. |
The following table shows the composition of our assets under management by investment style as of December 31, 2016.
(Dollars in thousands) | December 31, 2016 | Percent of Assets Under Management | |||
Equity investment styles: | |||||
Small cap value | $ | 1,533,000 | 19.0 | % | |
Mid cap value | 197,000 | 2.5 | % | ||
Small cap growth | 474,000 | 5.9 | % | ||
Mid cap growth | 382,000 | 4.7 | % | ||
SMID cap growth | 81,000 | 1.0 | % | ||
U.S. small cap | 55,000 | 0.7 | % | ||
Dividend value | 380,000 | 4.7 | % | ||
Covered call | 305,000 | 3.8 | % | ||
Micro cap value | 257,000 | 3.2 | % | ||
Fixed income investment styles: | |||||
Intermediate/core/short duration fixed income | 888,000 | 11.0 | % | ||
Core plus fixed income | 315,000 | 3.9 | % | ||
High yield fixed income | 86,000 | 1.1 | % | ||
Short duration BB-rated high yield fixed income | 1,264,000 | 15.7 | % | ||
Balanced investment styles: | |||||
Conservative allocation | 1,838,000 | 22.8 | % | ||
Total assets under management | $ | 8,055,000 | 100.0 | % | |
Competition
We operate in a very competitive industry and face significant competition for customers from bank and non-bank competitors, particularly regional and national institutions, in originating loans, attracting deposits and providing other financial services. We compete for loans and deposits based upon the personal and responsive service offered by our highly experienced relationship managers, access to management and interest rates. As a result of our low operating costs, we believe we are able to compete for customers with the competitive interest rates that we pay on deposits and that we charge on our loans.
Our management believes that our most direct competition for deposits comes from commercial banks, savings and loan associations, credit unions, money market funds and brokerage firms, particularly national and large regional banks, which target the same customers as we do. Competition for deposit products is generally based on pricing because of the ease with which customers can transfer deposits from one institution to another. Our cost of funds fluctuates with market interest rates and our ability to further reduce our cost of funds may be affected by higher rates being offered by other financial institutions. During certain interest rate environments, additional significant competition for deposits may be expected to arise from corporate and government debt securities and money market mutual funds.
14
Our competition in making commercial loans comes principally from national, regional and large community banks, insurance companies and full service brokerage firms. Many large national and regional commercial banks have a significant number of branch offices in the areas in which we operate. Competition for our private banking loans is more limited than for commercial loans due largely to our niche offering of margin loans backed by marketable securities which represent 47% of our entire loan portfolio. Aggressive pricing policies and terms of our competitors on middle-market and private banking loans, especially during a period of prolonged low interest rates, may result in a decrease in our loan origination volume and a decrease in our yield on loans. We compete for loans principally through the quality of products and service we provide to middle-market customers and private banking referral relationships, while maintaining competitive interest rates, loan fees and other loan terms.
Our relationship-based approach to business also enables us to compete with other financial institutions in attracting loans and deposits. Our relationship managers and regional presidents have significant experience in the banking industry in the markets they serve and are focused on customer service. By capitalizing on this experience and by tailoring our products and services to the specific needs of our clients, we have been successful in cultivating stable relationships with our customers and also with financial intermediaries who refer their clients to us for banking services. We believe our approach to customer relationships will assist us in continuing to compete effectively for loans and deposits in our primary markets and nationally through our private banking channel.
The investment management business is intensely competitive. In the markets where we compete, there are over 1,000 firms which we consider to be primary competitors. In addition to competition from other institutional investment management firms, Chartwell, along with the active-management industry, competes with passive index funds, exchange traded funds (“ETFs”) and investment alternatives such as hedge funds. We compete for investment management business by delivering excellent investment performance with a committed customer service model.
Employees
As of December 31, 2016, we had approximately 224 full-time equivalent employees (156 in our banking business and 68 in our investment management business).
Supervision and Regulation
The following is a summary of material laws, rules and regulations governing banks, investment management businesses and bank holding companies, but does not purport to be a complete summary of all applicable laws, rules and regulations. These laws and regulations may change from time to time and the regulatory agencies often have broad discretion in interpreting them. We cannot predict the outcome of any future changes to these laws, regulations, regulatory interpretations, guidance and policies, which may have a material and adverse impact on the financial markets in general, and our operations and activities, financial condition, results of operations, growth plans and future prospects.
General
The common stock of TriState Capital Holdings, Inc. is publicly traded and listed and, as a result, we are subject to securities laws and stock market rules, including oversight from the SEC and the Nasdaq Stock Market Rules. Banking is highly regulated under federal and state law. We are a bank holding company registered under the Bank Holding Company Act of 1956, as amended, and are subject to supervision, regulation and examination by the Federal Reserve. TriState Capital Bank is a commercial bank chartered under the laws of the Commonwealth of Pennsylvania. It is not a member of the Federal Reserve System and is subject to supervision, regulation and examination by the Pennsylvania Department of Banking and Securities and the FDIC.
Our investment management business is subject to extensive regulation in the United States. Chartwell and Chartwell TSC are subject to Federal securities laws, principally the Securities Act of 1933, the Investment Company Act, the Advisers Act, state laws regarding securities fraud and regulations promulgated by various regulatory authorities, including the SEC, FINRA, applicable state laws and stock exchanges. Our investment management business also may be subject to regulation by the U.S. Commodity Futures Trading Commission (“CFTC”) and the National Futures Association (“NFA”). Changes in laws, regulations or governmental policies, both domestically and abroad, and the costs associated with compliance, could materially and adversely affect our business, results of operations, financial condition and/or cash flows.
This system of supervision and regulation establishes a comprehensive framework for our operations. Failure to meet regulatory standards could have a material and adverse impact on our operations and activities, financial condition, results of operations, growth plans and future prospects.
15
Dodd-Frank Act
On July 21, 2010, the Dodd Frank Financial Reform and Consumer Protection Act (“Dodd-Frank Act”) was enacted. The Dodd-Frank Act aims to restore responsibility and accountability to the financial system by significantly altering the regulation of financial institutions and the financial services industry. We have complied with the portion of rules that have been finalized and become effective. Many of the provisions of the Dodd-Frank Act require rulemaking by federal regulatory agencies over the next several years and have delayed effective dates, which will affect how financial institutions are regulated in the future. The ultimate effect of the Dodd-Frank Act and its implementing regulations on the financial services industry in general, and on us in particular, is still uncertain at this time.
The Dodd-Frank Act, among other things:
• | established the Consumer Financial Protection Bureau; |
• | established the Financial Stability Oversight Council; |
• | changed the assessment base for federal deposit insurance; |
• | required the FDIC to make its capital requirements for insured depository institutions countercyclical, so that capital requirements increase in times of economic expansion and decrease in times of economic contraction; |
• | required bank holding companies and banks to be “well capitalized” and “well managed” in order to acquire banks located outside of their home state and required any bank holding company electing to be treated as a financial holding company to be “well capitalized” and “well managed”; |
• | directed the Federal Reserve to establish interchange fees for debit cards under a “reasonable and proportional cost” per transaction standard; |
• | increased regulation of consumer protections regarding mortgage originations, including originator compensation, minimum repayment standards, and prepayment consideration; |
• | established the Volcker Rule to restrict proprietary trading and ownership of certain funds by banks; and |
• | repealed the federal prohibition on the payment of interest on demand deposits, thereby permitting depository institutions to pay interest on business transaction and other accounts. |
Some of these provisions may have the consequence of increasing our expenses, decreasing our revenues, and changing or limiting the activities in which we engage. The specific impact of all these provisions on our current activities or new financial activities that we may consider in the future, our financial performance and the market in which we operate will depend on the rules the relevant agencies develop, their implementation and the reaction of market participants to these regulatory developments. Many aspects of the Dodd-Frank Act are subject to further rulemaking and will take effect over several years. While we cannot predict what effect any presently contemplated or future changes in the laws or regulations or their interpretations would have on us, these changes could be materially adverse to our operations and activities, financial condition, results of operations, growth plans and future prospects.
Volcker Rule Impact on Certain Investment Markets
On December 10, 2013, five federal regulatory agencies (the SEC, CFTC, Federal Reserve, FDIC and OCC) approved and published the final rules for the implementation of the Volcker Rule. The final rules will require full conformance in July 2017. Furthermore, commercial banks and their affiliates (the “Regulated Entities”) can apply for an additional five-year extension for certain qualifying investments.
The final Volcker Rule prohibits Regulated Entities from engaging in “proprietary trading” and imposes limitations on the extent to which Regulated Entities are permitted to invest in certain “covered funds” (i.e. hedge funds and private equity funds) and requires that such investments be fully deducted from Tier 1 Capital. It limits a Regulated Entity’s aggregate ownership in hedge funds and private equity funds to three percent of Tier I capital. Additionally, Regulated Entities are prohibited from owning three percent or more of any single covered fund.
Importantly for banks, the final rules exempted loans from the proprietary trading restrictions imposed on banks for most other assets. The Volcker Rule, and particularly subsequent interpretations of what constitutes “covered funds” under the final Volcker Rule, could have material adverse effects on our investment management business.
16
February 3, 2017, Executive Order
On February 3, 2017, President Trump signed an executive order calling for his administration to review existing U.S. financial laws and regulations, including the Dodd-Frank Act, in order to determine their consistency with a set of “core principles” of financial policy. The core financial principles identified in the executive order include the following: empowering Americans to make independent financial decisions and informed choices in the marketplace, save for retirement, and build individual wealth; preventing taxpayer-funded bailouts; fostering economic growth and vibrant financial markets through more rigorous regulatory impact analysis that addresses systemic risk and market failures, such as moral hazard and information asymmetry; enabling American companies to be competitive with foreign firms in domestic and foreign markets; advancing American interests in international financial regulatory negotiations and meetings; and restoring public accountability within Federal financial regulatory agencies and “rationalizing” the Federal financial regulatory framework.
Although the order does not specifically identify any existing laws or regulations that the administration considers to be inconsistent with the core principles, areas that the mandated agency report may ultimately identify for reform include the Volcker Rule; any “fiduciary” standard applicable to investment advisers and broker-dealers; and the powers, structure and funding arrangements of the Financial Stability Oversight Council, the Office of Financial Research, the prudential bank regulators, the SEC, CFTC, and Consumer Financial Protection Bureau (“CFPB”). While some changes can be implemented by the regulatory agencies themselves, implementing much of the anticipated agenda of changes would require legislation from Congress.
In conjunction with the executive order, President Trump also issued a memorandum to the Department of Labor (“DOL”) on the fiduciary rule, delaying the rule’s effectiveness and requiring further analysis. DOL must postpone the application of the rule for 180 days beyond its originally scheduled effective date of April 10, 2017, and must prepare an economic and legal analysis of the likely impact of the rule. If this analysis concludes that the rule will harm investors, disrupt the retirement services industry, increase litigation (and therefore the price of retirement services), be undermined as the result of certain exemptions, or violate any statute (including the Administrative Procedure Act) or that the rule is inconsistent with Administration policy, then DOL must propose rescission of or revisions to the rule.
Regulatory Capital Requirements
Capital adequacy. The Federal Reserve monitors the capital adequacy of our holding company, on a consolidated basis, and the FDIC and the Pennsylvania Department of Banking and Securities monitor the capital adequacy of TriState Capital Bank. The regulatory agencies use a combination of risk-based guidelines and a leverage ratio to evaluate capital adequacy and consider these capital levels when taking action on various types of applications and when conducting supervisory activities related to safety and soundness. The risk-based capital standards are designed to make regulatory capital requirements more sensitive to differences in risk profiles among financial institutions and their holding companies, to account for off-balance sheet exposure, and to minimize disincentives for holding liquid assets. Assets and off-balance sheet items, such as letters of credit and unfunded loan commitments, are assigned to broad risk categories, each with appropriate risk weights. Regulatory capital, in turn, is classified into the following “tiers” of capital. Common Equity Tier 1 capital (“CET 1”) includes common equity, retained earnings, and minority interests in equity accounts of consolidated subsidiaries, less goodwill, most intangible assets and certain other assets. “Tier 1” capital includes, among other things, qualifying non-cumulative perpetual preferred stock. “Tier 2” capital includes, among other things, qualifying subordinated debt and allowances for loan and lease losses, subject to limitations. The resulting capital ratios represent capital as a percentage of average assets or total risk-weighted assets, including off-balance sheet items.
With the phase-in of the Basel III requirements beginning January 1, 2015, the FDIC and Federal Reserve regulations currently require banks and bank holding companies generally to maintain four minimum capital standards to be “adequately capitalized”: (1) a tier 1 capital to total average assets ratio (“tier 1 leverage capital ratio”) of at least 4%; (2) a common equity tier 1 capital to risk-weighted assets ratio (“CET 1 risk-based capital ratio”) of at least 4.5%; (3) a tier 1 capital to risk-weighted assets ratio (“tier 1 risk-based capital ratio”) of at least 6%; and (4) a total risk-based capital (tier 1 plus tier 2) to risk-weighted assets ratio (“total risk-based capital ratio”) of at least 8%. In addition, the prompt corrective action standards discussed below, in effect, increase the minimum regulatory capital ratios for banking organizations. These capital requirements are minimum requirements. Higher capital levels may be required if warranted by the particular circumstances or risk profiles of individual institutions, or if required by the banking regulators due to the economic conditions impacting our primary markets. For example, FDIC regulations provide that higher capital may be required to take adequate account of, among other things, interest rate risk and the risks posed by concentrations of credit, nontraditional activities or securities trading activities. Basel III has replaced the prior regulatory capital rules for all banks, savings associations and U.S. bank holding companies with greater than $500.0 million in total assets, and all savings and loan holding companies.
Failure to meet capital guidelines could subject us to a variety of enforcement remedies, including issuance of a capital directive, a prohibition on accepting brokered deposits, other restrictions on our business and the termination of deposit insurance by the FDIC.
The Dodd-Frank Act directs federal banking agencies to establish minimum leverage capital requirements and minimum risk-based capital requirements for depository institution holding companies and non-bank financial companies supervised by the Federal Reserve that are not less than the “generally applicable leverage and risk-based capital requirements” applicable to insured depository institutions, in
17
effect applying the same leverage and risk-based capital requirements that apply to insured depository institutions to most bank holding companies. In addition, under the Dodd-Frank Act, the federal banking agencies adopted new capital requirements to address the risks that the activities of an institution poses to the institution and the public and private stakeholders, including risks arising from certain enumerated activities. Capital guidelines may continue to evolve and may have material impacts on us or our banking subsidiary.
Prompt corrective action regulations. Under the prompt corrective action regulations, the FDIC is required and authorized to take supervisory actions against undercapitalized financial institutions. For this purpose, a bank is placed in one of the following five categories based on its capital: “well capitalized,” “adequately capitalized,” “undercapitalized,” “significantly undercapitalized,” and “critically undercapitalized.”
Under the current prompt corrective action provisions of the FDIC, after adopting the Basel III rules, an insured depository institution generally will be classified in the following categories based on the capital measures indicated:
“Well capitalized” | “Adequately capitalized” |
Tier 1 leverage ratio of 5% | Tier 1 leverage ratio of 4% |
CET 1 risk-based ratio of 6.5% | CET 1 risk-based ratio of 4.5% |
Tier 1 risk-based ratio of 8% | Tier 1 risk-based ratio of 6%, and |
Total risk-based ratio of 10%, and | Total risk-based ratio of 8% |
Not subject to written agreement, order, capital directive or prompt corrective action directive that requires a specific capital level. | |
“Undercapitalized” | “Significantly undercapitalized” |
Tier 1 leverage ratio less than 4% | Tier 1 leverage ratio less than 3% |
CET 1 risk-based ratio less than 4.5% | CET 1 risk-based ratio less than 3% |
Tier 1 risk-based ratio less than 6%, or | Tier 1 risk-based ratio less than 4%, or |
Total risk-based ratio less than 8% | Total risk-based ratio less than 6% |
“Critically undercapitalized” | |
Tangible equity to total assets less than 2% | |
In addition, the final rules subject a banking organization to certain limitations on capital distributions and discretionary bonus payments to executive officers if the organization does not maintain a capital conservation buffer of common equity tier 1 capital in an amount greater than 2.5% of its total risk-weighted assets. The implementation of the capital conservation buffer began on January 1, 2016, at 0.625% and is to be phased in over a four-year period (increasing by that amount ratably on each subsequent January 1, until it reaches 2.5% on January 1, 2019).
The effect of the capital conservation buffer when fully implemented will result in the following minimum capital ratios to qualify as adequately capitalized, for banking organizations seeking to avoid the limitations on capital distributions and discretionary bonus payments to executive officers:
• | 4.0% tier 1 leverage ratio; |
• | minimum CET 1 risk-based capital ratio of 7.0%; |
• | minimum tier 1 risk-based capital ratio of 8.5%; and |
• | minimum total risk-based capital ratio to 10.5%. |
Federal banking regulators are required to take various mandatory supervisory actions and are authorized to take other discretionary actions with respect to institutions in the three undercapitalized categories. The severity of the action depends upon the capital category in which the institution is placed. Subject to a narrow exception, banking regulators must appoint a receiver or conservator for an institution that is critically undercapitalized. An institution that is categorized as undercapitalized, significantly undercapitalized, or critically undercapitalized is required to submit an acceptable capital restoration plan to its appropriate federal banking agency. An undercapitalized institution also is generally prohibited from increasing its average total assets, making acquisitions, establishing any branches or engaging in any new line of business, except under an accepted capital restoration plan or with FDIC approval. The regulations also establish procedures for downgrading an institution to a lower capital category based on supervisory factors other than capital.
18
Furthermore, a bank holding company must guarantee that a subsidiary depository institution meets its capital restoration plan, subject to various limitations. The bank holding company’s obligation to fund a capital restoration plan is limited to the lesser of 5% of an “undercapitalized” subsidiary’s assets at the time it became “undercapitalized” or the amount required to meet regulatory capital requirements.
The capital classification of a bank affects the frequency of regulatory examinations, the bank’s ability to engage in certain activities and the deposit insurance premiums paid by the bank. As of December 31, 2016, TriState Capital Bank met the requirements to be categorized as “well capitalized” based on the aforementioned ratios for purposes of the prompt corrective action regulations, as currently in effect.
Basel III. The new capital rules prescribe a new standardized approach for risk weightings that expands the risk weighting categories from the prior four Basel I-derived categories (0%, 20%, 50% and 100%) to a larger and more risk-sensitive number of categories, depending on the nature of the assets, generally ranging from 0% for U.S. government and agency securities, to 600% for certain equity exposures, and resulting in higher risk weights for a variety of asset classes, including certain commercial real estate mortgages. Additional aspects of the new capital rules that are most relevant to us include:
• | a formula-based approach referred to as the collateral haircut approach to determine the risk weight of eligible margin loans collateralized by liquid and readily marketable debt or equity securities, where the collateral is marked to fair value daily, and the transaction is subject to daily margin maintenance requirements; |
• | consistent with the prior risk-based capital rules, assigning exposures secured by single family residential properties to either a 50% risk weight for first-lien mortgages that meet prudential underwriting standards or a 100% risk weight category for all other mortgages; |
• | providing for a 20% credit conversion factor for the unused portion of a commitment with an original maturity of one year or less that is not unconditionally cancellable (previously set at 0%); |
• | assigning a 150% risk weight to all exposures that are non-accrual or 90 days or more past due (previously set at 100%), except for those secured by single family residential properties, which will be assigned a 100% risk weight, consistent with the prior risk-based capital rules; |
• | applying a 150% risk weight instead of a 100% risk weight for certain high volatility commercial real estate acquisition, development and construction loans; |
• | applying a 250% risk weight (beginning January 1, 2018) to the portion of mortgage servicing rights and deferred tax assets arising from temporary differences that could not be realized through net operating loss carrybacks that are not deducted from CET 1 capital (previously set at 100%); and |
• | the option to use a formula-based approach referred to as the simplified supervisory formula approach to determine the risk weight of various securitization tranches in addition to the previous “gross-up” method (replacing the credit ratings approach for certain securitization). |
Based on our calculations, we expect that TriState Capital Holdings, Inc. and TriState Capital Bank will meet all minimum capital requirements when effective and that we and the Bank would continue to meet all capital requirements as fully phased in without material adverse effects on our business. However, the capital rules may continue to evolve over time and future changes may have a material adverse effect on our business.
Acquisitions by Bank Holding Companies
We must obtain the prior approval of the Federal Reserve before: (1) acquiring more than five percent of the voting stock of any bank or other bank holding company; (2) acquiring all or substantially all of the assets of any bank or bank holding company; or (3) merging or consolidating with any other bank holding company. The Federal Reserve may determine not to approve any of these transactions if it would result in or tend to create a monopoly or substantially lessen competition or otherwise function as a restraint of trade, unless the anticompetitive effects of the proposed transaction are clearly outweighed by the public interest in meeting the convenience and needs of the community to be served. The Federal Reserve is also required to consider the financial and managerial resources and future prospects of the bank holding companies and banks concerned, the convenience and needs of the community to be served, and the record of a bank holding company and its subsidiary bank(s) in combating money laundering activities.
19
Scope of Permissible Bank Holding Company Activities
In general, the Bank Holding Company Act limits the activities permissible for bank holding companies to the business of banking, managing or controlling banks and such other activities as the Federal Reserve has determined to be so closely related to banking as to be properly incident thereto.
A bank holding company may elect to be treated as a financial holding company if it and its depository institution subsidiaries are categorized as “well capitalized” and “well managed.” A financial holding company may engage in a range of activities that are (1) financial in nature or incidental to such financial activity or (2) complementary to a financial activity and which do not pose a substantial risk to the safety and soundness of a depository institution or to the financial system generally. These activities include securities dealing, underwriting and market making, insurance underwriting and agency activities, merchant banking and insurance company portfolio investments. Expanded financial activities of financial holding companies generally will be regulated according to the type of such financial activity: banking activities by banking regulators, securities activities by securities regulators and insurance activities by insurance regulators. While we may determine in the future to become a financial holding company, we do not have an intention to make that election at this time.
The Bank Holding Company Act does not place territorial limitations on permissible non-banking activities of bank holding companies. The Federal Reserve has the power to order any bank holding company or its subsidiaries to terminate any activity or to terminate its ownership or control of any subsidiary when the Federal Reserve has reasonable grounds to believe that continuation of such activity or such ownership or control constitutes a serious risk to the financial soundness, safety or stability of any bank subsidiary of the bank holding company.
Source of Strength Doctrine for Bank Holding Companies
Under longstanding Federal Reserve policy which has been codified by the Dodd-Frank Act, we are expected to act as a source of financial strength to, and to commit resources to support, TriState Capital Bank. This support may be required at times when we may not be inclined to provide it. In addition, any capital loans that we make to TriState Capital Bank are subordinate in right of payment to deposits and to certain other indebtedness of TriState Capital Bank. In the event of our bankruptcy, any commitment by us to a federal bank regulatory agency to maintain the capital of TriState Capital Bank will be assumed by the bankruptcy trustee and entitled to a priority of payment.
Dividends
As a bank holding company, we are subject to certain restrictions on dividends under applicable banking laws and regulations. The Federal Reserve has issued a policy statement that provides that a bank holding company should not pay dividends unless: (1) its net income over the last four quarters (net of dividends paid) has been sufficient to fully fund the dividends; (2) the prospective rate of earnings retention appears to be consistent with the capital needs, asset quality and overall financial condition of the bank holding company and its subsidiaries; and (3) the bank holding company will continue to meet minimum required capital adequacy ratios. Accordingly, a bank holding company should not pay cash dividends that exceed its net income or that can only be funded in ways that weaken the bank holding company’s financial health, such as by borrowing. The Dodd-Frank Act and Basel III impose additional restrictions on the ability of banking institutions to pay dividends. In addition, in the current financial and economic environment, the Federal Reserve has indicated that bank holding companies should carefully review their dividend policy and has discouraged payment ratios that are at maximum allowable levels unless both asset quality and capital are very strong.
A part of our income could be derived from, and a potential material source of our liquidity could be, dividends from TriState Capital Bank. The ability of TriState Capital Bank to pay dividends to us is also restricted by federal and state laws, regulations and policies. Under applicable Pennsylvania law, TriState Capital Bank may only pay cash dividends out of its accumulated net earnings, subject to certain requirements regarding the level of surplus relative to capital.
Under federal law, TriState Capital Bank may not pay any dividend to us if the Bank is undercapitalized or the payment of the dividend would cause it to become undercapitalized. The FDIC may further restrict the payment of dividends by requiring TriState Capital Bank to maintain a higher level of capital than would otherwise be required for it to be adequately capitalized for regulatory purposes. Moreover, if, in the opinion of the FDIC, TriState Capital Bank is engaged in an unsafe or unsound practice (which could include the payment of dividends), the FDIC may require, generally after notice and hearing, the Bank to cease such practice. The FDIC has indicated that paying dividends that deplete a depository institution’s capital base to an inadequate level would be an unsafe banking practice. The FDIC has also issued policy statements providing that insured depository institutions generally should pay dividends out of current operating earnings.
20
Incentive Compensation Guidance
The federal banking agencies have issued comprehensive guidance intended to ensure that the incentive compensation policies of banking organizations do not undermine the safety and soundness of those organizations by encouraging excessive risk-taking. The incentive compensation guidance sets expectations for banking organizations concerning their incentive compensation arrangements and related risk-management, control and governance processes. In addition, under the incentive compensation guidance, a banking organization’s federal supervisor may initiate enforcement action if the organization’s incentive compensation arrangements pose a risk to the safety and soundness of the organization. Further, provisions of the Basel III regime described above limit discretionary bonus payments to bank and bank holding company executives if the institution’s regulatory capital ratios fail to exceed certain thresholds. The scope and content of the U.S. banking regulators’ policies on incentive compensation are likely to continue evolving.
Restrictions on Transactions with Affiliates and Loans to Insiders
Federal law strictly limits the ability of banks to engage in transactions with their affiliates, including their bank holding companies. Section 23A and 23B of the Federal Reserve Act, and the Federal Reserve’s Regulation W, impose quantitative limits, qualitative standards, and collateral requirements on certain transactions by a bank with, or for the benefit of, its affiliates, and generally require those transactions to be on terms at least as favorable to the bank as transactions with non-affiliates. The Dodd-Frank Act significantly expands the coverage and scope of the limitations on affiliate transactions within a banking organization, including an expansion of the covered transactions to include credit exposures related to derivatives, repurchase agreements and securities lending arrangements and an increase in the amount of time for which collateral requirements regarding covered transactions must be satisfied.
Federal law also limits a bank’s authority to extend credit to its directors, executive officers and 10% shareholders, as well as to entities controlled by such persons. Among other things, extensions of credit to insiders are required to be made on terms that are substantially the same as, and follow credit underwriting procedures that are not less stringent than, those prevailing for comparable transactions with unaffiliated persons. In addition, the terms of such extensions of credit may not involve more than the normal risk of repayment or present other unfavorable features and may not exceed certain limitations on the amount of credit extended to such persons, individually and in the aggregate, which limits are based, in part, on the amount of the bank’s capital. TriState Capital Bank maintains a policy that does not permit loans to employees, including executive officers.
FDIC Deposit Insurance Assessments
FDIC-insured banks are required to pay deposit insurance assessments to the FDIC. The amount of the deposit insurance assessment for institutions with less than $10 billion in assets is based on its risk category, with certain adjustments for any unsecured debt or brokered deposits held by the insured bank. Institutions assigned to higher risk categories (that is, institutions that pose a higher risk of loss to the Deposit Insurance Fund) pay assessments at higher rates than institutions that pose a lower risk. An institution’s risk classification is assigned based on a combination of its financial ratios and supervisory ratings, reflecting, among other things, its capital levels and the level of supervisory concern that the institution poses to the regulators. In addition, the FDIC can impose special assessments in certain instances. Deposit insurance assessments fund the Deposit Insurance Fund. The FDIC has in recent years raised assessment rates to increase funding for the Deposit Insurance Fund.
The Dodd-Frank Act changed the way that deposit insurance premiums are calculated, increased the minimum designated reserve ratio of the Deposit Insurance Fund from 1.15% to 1.35% of the estimated amount of total insured deposits, and eliminated the upper limit for the reserve ratio designated by the FDIC each year, and eliminates the requirement that the FDIC pay dividends to depository institutions when the reserve ratio exceeds certain thresholds.
In the third quarter of 2016, the FDIC published the final rule to modify the FDIC deposit insurance premium assessment methodology for banks under $10 billion. This methodology change resulted in a higher assessment for the Bank. Any revised deposit insurance premium assessment methodology resulting from this proposal may result in material increases to our FDIC deposit insurance premiums. Continued action by the FDIC to replenish and increase the Deposit Insurance Fund, as well as the changes contained in the Dodd-Frank Act, may result in higher assessment rates, which could reduce our profitability or otherwise negatively impact our operations, financial condition or future prospects.
Branching and Interstate Banking
Under Pennsylvania law, TriState Capital Bank is permitted to establish additional branch offices within Pennsylvania, subject to the approval of the Pennsylvania Department of Banking and Securities. The Bank is also permitted to establish additional offices outside of Pennsylvania, subject to prior regulatory approval.
TriState Capital Bank operates four representative offices, with one each located in the states of Pennsylvania, Ohio, New Jersey and New York. Because our representative offices are not branches for purposes of applicable state law and FDIC regulations, there are
21
restrictions on the types of activities we may conduct through our representative offices. Relationship managers in our representative offices may solicit loan and deposit products and services in their markets and act as liaisons to our headquarters in Pittsburgh, Pennsylvania. However, consistent with our centralized operations and regulatory requirements, we do not disburse or transmit funds, accept loan repayments or accept or contract for deposits or deposit-type liabilities through our representative offices.
Community Reinvestment Act
TriState Capital Bank has a responsibility under the Community Reinvestment Act (“CRA”), and related FDIC regulations to help meet the credit needs of its communities, including low- and moderate-income borrowers. In connection with its examination of TriState Capital Bank, the FDIC is required to assess the Bank’s record of compliance with the CRA. The Bank’s failure to comply with the provisions of the CRA could, at a minimum, result in denial of certain corporate applications, such as for branches or mergers, or in restrictions on its or our activities, including additional financial activities if we elect to be treated as a financial holding company.
CRA regulations provide that a financial institution may elect to have its CRA performance evaluated under the strategic plan option. The strategic plan enables the institution to structure its CRA goals and objectives to address the needs of its community consistent with its business strategy, operational focus, capacity and constraints. Our first strategic plan was approved in 2013. In 2015, the FDIC approved our updated CRA strategic plan for the years 2015 through 2017. We are preparing for the submission of our updated strategic plan to cover the years 2018 through 2020. While we believe we will succeed in obtaining approval for our updated strategic plan, we cannot guarantee that we will obtain such an approval. TriState Capital Bank received an “outstanding” CRA rating in its last CRA examination in 2015.
Financial Privacy
The federal banking and securities regulators have adopted rules that limit the ability of banks and other financial institutions to disclose non-public information about consumers to non-affiliated third parties. These limitations require disclosure of privacy policies to consumers and, in some circumstances, allow consumers to prevent disclosure of certain personal information to a non-affiliated third party. These regulations affect how consumer information is transmitted through financial services companies and conveyed to outside vendors. In addition, consumers may also prevent disclosure of certain information among affiliated companies that is assembled or used to determine eligibility for a product or service, such as that shown on consumer credit reports and asset and income information from applications. Consumers also have the option to direct banks and other financial institutions not to share information about transactions and experiences with affiliated companies for the purpose of marketing products or services. In addition to applicable federal privacy regulations, TriState Capital Bank is subject to certain state privacy laws.
Anti-Money Laundering and OFAC
Under federal law, including the Bank Secrecy Act and the USA PATRIOT Act of 2001, certain financial institutions must maintain anti-money laundering programs that include established internal policies, procedures and controls; a designated compliance officer; an ongoing employee training program; and testing of the program by an independent audit function. Financial institutions are also prohibited from entering into specified financial transactions and account relationships and must meet enhanced standards for due diligence and customer identification in their dealings with foreign financial institutions and foreign customers. Financial institutions must take reasonable steps to conduct enhanced scrutiny of account relationships to guard against money laundering and to report any suspicious transactions, and law enforcement authorities have been granted increased access to financial information maintained by financial institutions.
The Office of Foreign Assets Control (“OFAC”) administers laws and Executive Orders that prohibit U.S. entities from engaging in transactions with certain prohibited parties. OFAC publishes lists of persons and organizations suspected of aiding, harboring or engaging in terrorist acts, known as Specially Designated Nationals and Blocked Persons. Generally, if a bank identifies a transaction, account or wire transfer relating to a person or entity on an OFAC list, it must freeze the account or block the transaction, file a suspicious activity report and notify the appropriate authorities.
Bank regulators routinely examine institutions for compliance with these obligations and they must consider an institution’s compliance in connection with the regulatory review of applications, including applications for bank mergers and acquisitions. Failure of a financial institution to maintain and implement adequate programs to combat money laundering and terrorist financing and comply with OFAC sanctions, or to comply with relevant laws and regulations, could have serious legal, reputational and financial consequences for the institution.
Safety and Soundness Standards
Federal bank regulatory agencies have adopted guidelines that establish general standards relating to internal controls and information systems, internal audit systems, loan documentation, credit underwriting, interest rate exposure, asset growth and compensation, fees
22
and benefits. Additionally, the agencies have adopted regulations that provide the authority to order an institution that has been given notice by an agency that it is not satisfying any of these safety and soundness standards to submit a compliance plan. If, after being so notified, an institution fails to submit an acceptable compliance plan or fails in any material respect to implement an acceptable compliance plan, the agency must issue an order directing action to correct the deficiency and may issue an order directing other actions of the types to which an undercapitalized institution is subject under the “prompt corrective action” provisions of the Federal Deposit Insurance Act. If an institution fails to comply with such an order, the agency may seek to enforce such order in judicial proceedings and to impose civil money penalties.
In addition to federal consequences for failure to satisfy applicable safety and soundness standards, the Pennsylvania Department of Banking and Securities Code grants the Pennsylvania Department of Banking and Securities the authority to impose a civil money penalty of up to $25,000 per violation against a Pennsylvania financial institution, or any of its officers, employees, directors, or trustees for: (1) violations of any law or department order; (2) engaging in any unsafe or unsound practice; or (3) breaches of a fiduciary duty in conducting the institution’s business.
Bank holding companies are also not permitted to engage in unsound banking practices. For example, the Federal Reserve’s Regulation Y requires a holding company to give the Federal Reserve prior notice of any redemption or repurchase of its own equity securities, if the consideration to be paid, together with the consideration paid for any repurchases in the preceding year, is equal to 10% or more of the company’s consolidated net worth. The Federal Reserve may oppose the transaction if it believes that the transaction would constitute an unsafe or unsound practice or would violate any law or regulation. As another example, a holding company could not impair its subsidiary bank’s soundness by causing it to make funds available to non-banking subsidiaries or their customers if the Federal Reserve believed it not prudent to do so. The Federal Reserve has broad authority to prohibit activities of bank holding companies and their nonbanking subsidiaries that present unsafe and unsound banking practices or that constitute violations of laws or regulations.
Consumer Laws and Regulations
TriState Capital Bank is subject to numerous laws and regulations intended to protect consumers in transactions with the Bank. These laws include, among others, laws regarding unfair, deceptive and abusive acts and practices, usury laws, and other federal consumer protection statutes. These federal laws include the Electronic Fund Transfer Act, the Equal Credit Opportunity Act, the Fair Credit Reporting Act, the Fair Debt Collection Practices Act, the Real Estate Procedures Act of 1974, the S.A.F.E. Mortgage Licensing Act of 2008, the Truth in Lending Act and the Truth in Savings Act, among others. Many states and local jurisdictions have consumer protection laws analogous, and in addition, to those enacted under federal law. These laws and regulations mandate certain disclosure requirements and regulate the manner in which financial institutions must deal with customers when taking deposits, making loans and conducting other types of transactions. Failure to comply with these laws and regulations could give rise to regulatory sanctions, customer rescission rights, action by state and local attorneys general and civil or criminal liability.
In addition, the Dodd-Frank Act created a new independent Consumer Finance Protection Bureau that has broad authority to regulate and supervise retail financial services activities of banks and various non-bank providers. The Consumer Financial Protection Bureau has authority to promulgate regulations, issue orders, guidance and policy statements, conduct examinations and bring enforcement actions with regard to consumer financial products and services. In general, banks with assets of $10 billion or less, such as TriState Capital Bank, will continue to be examined for consumer compliance by their primary federal bank regulator. Nevertheless, positions established by the Consumer Financial Protection Bureau may become applicable to us.
Effect of Governmental Monetary Policies
Our commercial banking business and investment management business are affected not only by general economic conditions but also by U.S. fiscal policy and the monetary policies of the Federal Reserve. Some of the instruments of monetary policy available to the Federal Reserve include changes in the discount rate on member bank borrowings, the fluctuating availability of borrowings at the “discount window,” open market operations, the imposition of and changes in reserve requirements against member banks’ deposits and assets of foreign branches, the imposition of and changes in reserve requirements against certain borrowings by banks and their affiliates, and asset purchase programs. These policies influence to a significant extent the overall growth of bank loans, investments, and deposits, as well as the performance of our investment management products and services and the interest rates charged on loans or paid on deposits. We cannot predict the nature of future fiscal and monetary policies or the effect of these policies on our operations and activities, financial condition, results of operations, growth plans or future prospects.
Sarbanes-Oxley Act of 2002
The Sarbanes-Oxley Act of 2002 (“Sarbanes-Oxley Act”) implemented a broad range of corporate governance, accounting and reporting measures for companies that have securities registered under the Exchange Act, including publicly-held bank holding companies. Specifically, the Sarbanes-Oxley Act and the various regulations promulgated thereunder, established, among other things: (i) requirements for audit committees, including independence, expertise, and responsibilities; (ii) responsibilities regarding financial statements for the
23
Chief Executive Officer and Chief Financial Officer of the reporting company; (iii) the forfeiture of bonuses or other incentive-based compensation and profits from the sale of the reporting company’s securities by the Chief Executive Officer and Chief Financial Officer in the twelve-month period following the initial publication of any financial statements that later require restatement; (iv) the creation of an independent accounting oversight board; (v) standards for auditors and regulation of audits, including independence provisions that restrict non-audit services that accountants may provide to their audit clients; (vi) disclosure and reporting obligations for the reporting company and their directors and executive officers, including accelerated reporting of stock transactions and a prohibition on trading during pension blackout periods; (vii) a prohibition on personal loans to directors and officers, except certain loans made by insured financial institutions on nonpreferential terms and in compliance with other bank regulatory requirements; and (viii) a range of civil and criminal penalties for fraud and other violations of the securities laws.
Impact of Current Laws and Regulations
The cumulative effect of these laws and regulations, while providing certain benefits, add significantly to the cost of our operations and thus have a negative impact on our profitability. There has also been a notable expansion in recent years of financial service providers that are not subject to the examination, oversight, and other rules and regulations to which we are subject. Those providers, because they are not so highly regulated, may have a competitive advantage over us and may continue to draw large amounts of funds away from traditional banking institutions, with a continuing adverse effect on the banking industry in general.
Future Legislation and Regulatory Reform
New regulations and statutes are regularly proposed that contain wide-ranging proposals for altering the structures, regulations and competitive relationships of financial institutions operating in the United States. We cannot predict whether or in what form any proposed regulation or statute will be adopted or the extent to which our business may be affected by any new regulation or statute. Future legislation and policies, and the effects of that legislation and those policies, may have a significant influence on our operations and activities, financial condition, results of operations, growth plans or future prospects and the overall growth and distribution of loans, investments and deposits. Such legislation and policies have had a significant effect on the operations and activities, financial condition, results of operations, growth plans and future prospects of commercial banks and investment management businesses in the past and are expected to continue.
Available Information
All of our reports filed electronically with the United States Securities and Exchange Commission (“SEC”), including this Annual Report on Form 10-K for the fiscal year ended December 31, 2016, our Registration Statement on Form S-1, quarterly reports on Form 10-Q, current reports on Form 8-K and proxy statements, as well as any amendments to those reports are accessible at no cost on our website at www.tristatecapitalbank.com under “About Us”, “Investor Relations”, “SEC Documents”. These filings are also accessible on the SEC’s website at www.sec.gov. You may read and copy any material we file with the SEC at the SEC’s Public Reference Room at 100 F Street, NE, Washington, DC 20549. You may obtain information on the operation of the Public Reference Room by calling the SEC at 1-800-SEC-0330.
24
ITEM 1A. RISK FACTORS
An investment in our common stock involves a high degree of risk. There are risks, many beyond our control, that could cause our financial condition or results of operations to differ materially from management’s expectations. Some of the risks that may affect us are described below. If any of the following risks, by itself or together with one or more other factors, actually occur, our business, financial condition, results of operations and growth prospects could be materially and adversely affected. These risks are not the only risks that we may face. Our business, financial condition, results of operations and growth prospects could also be affected by additional risks that apply to all companies operating in the United States, as well as other risks that are not currently known to us or that we currently consider to be immaterial to our business, financial condition, results of operations and growth prospects. Further, to the extent that any of the information contained herein constitutes forward-looking statements, the risk factors below also are cautionary statements identifying important factors that could cause actual results to differ materially from those expressed in any such forward-looking statements. See “Cautionary Note Regarding Forward-Looking Statements” on page 51.
Risks Relating to our Business
We may not be able to adequately measure and limit our credit risk associated with our loan portfolio, which could lead to unexpected losses.
The business of lending is inherently risky, including risks that the principal of or interest on any loan will not be repaid timely or at all or that the value of any collateral supporting the loan will be insufficient to cover our outstanding exposure. These risks may be affected by the strength of the borrower’s business sector and local, regional and national market, and economic conditions. Our risk management practices, such as monitoring the concentration of our loans within specific industries and our credit approval practices, may not adequately reduce credit risk, and our credit administration personnel, policies and procedures may not adequately adapt to changes in economic or any other conditions affecting customers and the quality of the loan portfolio. Finally, many of our loans are made to middle-market businesses that may be less able to withstand competitive, economic and financial pressures than larger borrowers. A failure to effectively measure and limit the credit risk associated with our loan portfolio could have a material adverse effect on our business, financial condition, results of operations and future prospects.
Our allowance for loan losses may prove to be insufficient to absorb losses inherent in our loan portfolio, which could have a material adverse effect on our financial condition and results of operations.
We maintain an allowance for loan losses that represents management’s judgment of probable losses inherent in our loan portfolio. The level of the allowance reflects management’s continuing evaluation of historical default and loss experience in our portfolio, general economic conditions, diversification and seasoning of the loan portfolio, identified credit problems, delinquency levels and adequacy of collateral. The determination of the appropriate level of the allowance for loan losses is inherently highly subjective and requires us to make significant estimates of and assumptions regarding current credit risks and future trends, all of which may undergo material changes. Inaccurate management assumptions, deterioration of economic conditions affecting borrowers, new information regarding existing loans, identification of additional problem loans and other factors, both within and outside of our control, may require us to increase our allowance for loan losses. In addition, our regulators, as an integral part of their periodic examination, review the adequacy of our allowance for loan losses and may direct us to make additions to the allowance based on their judgments about information available to them at the time of their examination. Further, if actual charge-offs in future periods exceed the amounts allocated to the allowance for loan losses, we may need additional provision for loan losses to restore the adequacy of our allowance for loan losses. If we are required to materially increase our level of allowance for loan losses for any reason, such increase could have a material adverse effect on our business, financial condition, results of operations and future prospects.
A material portion of our loan portfolio is comprised of commercial loans secured by equipment or other business assets, the deterioration in value of which could increase our exposure to future probable losses.
Historically, a material portion of our loans held-for-investment have been comprised of commercial loans to businesses collateralized by general business assets including, among other things, accounts receivable, inventory and equipment. These commercial and industrial loans are typically larger in amount than loans to individuals and, therefore, have the potential for larger losses on a single loan basis. Historically, losses in our commercial and industrial credits have been higher than losses in other segments of our loan portfolio. Significant adverse changes in various industries could cause rapid declines in values and collectability associated with those business assets resulting in inadequate collateral coverage that may expose us to future losses. An increase in specific reserves and charge-offs related to our commercial and industrial loan portfolio could have a materially adverse effect on our business, financial condition, results of operations and future prospects. As of December 31, 2016, we had outstanding commercial and industrial loans of $587.4 million, or 17.3% of our loans held-for-investment.
25
Because many of our customers are commercial enterprises, they may be adversely affected by any decline in general economic conditions in the United States which, in turn, could have a negative impact on our business.
Many of our customers are commercial enterprises whose business and financial condition are sensitive to changes in the general economy of the United States. Our businesses and operations are, in turn, sensitive to these same general economic conditions. If the U.S. experiences a deterioration of economic conditions, or other significant volatility in economic conditions, our growth and profitability could be constrained. In addition, economic conditions in foreign countries, including uncertainty over the stability of the euro currency and the withdrawal of the United Kingdom from the European Union, could affect the stability of global financial markets, which could negatively affect U.S. economic conditions. Weak economic conditions are characterized by deflation, fluctuations in debt and equity capital markets, lack of liquidity and depressed prices in the secondary market for loans, increased delinquencies on loans, real estate price declines, and lower commercial activity. All of these factors are detrimental to the business and/or financial position of our customers as well as the value of the collateral supporting our loans and could adversely impact demand for our credit products as well as our credit quality. Our business is also sensitive to monetary and related policies of the U.S. federal government and its agencies. Changes in any of these policies are influenced by macroeconomic conditions and other factors that are beyond our control and difficult to predict. Adverse economic conditions and government policy responses to such conditions could have a material adverse effect on our business, financial condition, results of operations and future prospects.
Our non-owner-occupied commercial real estate loan portfolio exposes us to credit risks that may be greater than the risks related to other types of loans.
Our loan portfolio includes non-owner-occupied commercial real estate loans for individuals and businesses for various purposes, which are secured by commercial properties, as well as real estate construction and development loans. As of December 31, 2016, we had outstanding loans secured by non-owner-occupied commercial properties of $948.8 million, or 27.9%, of our loans held-for-investment. These loans typically involve repayment dependent upon income generated, or expected to be generated, by the property securing the loan in amounts sufficient to cover operating expenses and debt service. The availability of such income for repayment may be adversely affected by changes in the economy or local market conditions. These loans expose a lender to greater credit risk than loans secured by other types of collateral because the collateral securing these loans are typically more difficult to liquidate. Additionally, non-owner-occupied commercial real estate loans generally involve relatively large balances to single borrowers or related groups of borrowers. Unexpected deterioration in the credit quality of our non-owner-occupied commercial real estate loan portfolio could require us to increase our provision for loan losses, which would reduce our profitability and have a material adverse effect on our business, financial condition, results of operations and future prospects.
We make loans to businesses backed by private equity firms, including those through participation interests. These loan relationships may have repayment and other characteristics that are different than those of traditional business loans, which could have an adverse effect on our asset quality and profitability.
As of December 31, 2016, we had $70.0 million in loans to private equity backed businesses, which represented 2.1% of our loans held-for-investment compared to $131.7 million, or 4.6%, as of December 31, 2015. These loan relationships may have repayment characteristics that are different than those of our traditional, owner-operated businesses. These loans often are for purposes of financing private equity groups’ acquisitions of companies that become our borrowers. Acquisition-related loans are generally secured by all business assets, but often have a weaker secondary source of repayment resulting in greater reliance upon the cash flow generated by the borrower for repayment, which may be unpredictable. Because private equity groups acquire businesses primarily for financial interests, they may behave differently than our other commercial borrowers. Of these loans to private equity backed businesses as of December 31, 2016, $42.8 million, or 1.3% of our loans held-for-investment, were SNC loans in which we were not the lead bank compared to $58.3 million, or 2.1%, as of December 31, 2015. In certain circumstances, our lending through participation loans in which we are not the agent bank to private equity backed businesses can present additional risks because the agent bank or bank group may make different decisions or otherwise may not be able to respond as a group as quickly or as definitively as we might on our own in the event that a private equity backed borrower becomes financially or operationally challenged. The different characteristics of this segment of our loan portfolio could negatively impact our profitability or asset quality, which in turn, could have a material adverse effect on our business, financial condition, results of operation and future prospects. We have over the past several years substantially decreased, the balance of these loans and the percentage of our total loans they represent. We intend to continue reducing the portion of our loan portfolio consisting of private equity backed SNC loans in large part by further diversifying through growth in loans from our private banking channel and direct and/or non-private equity backed commercial loans. However, there can be no guaranty we will be successful in our efforts to further diversify the portfolio.
Our private banking business could be negatively impacted by a prolonged downturn in the securities markets.
Marketable-securities-backed private banking loans represent a material portion of our business and are the fastest growing part of our loan portfolio. We expect to continue to increase the percentage of our loan portfolio represented by marketable-securities-backed private banking loans in the future. We believe our risk management practices are designed to appropriately mitigate the risk of fluctuations in
26
the market value of securities that collateralize these loans. We also believe that our success in expanding our financial intermediary referral network will enable growth in this line of business in various securities market environments. Nevertheless, a sharp or prolonged decline in the value of the collateral that secures these loans could materially adversely affect the growth prospects or loan performance in this segment of our loan portfolio and, as a result, could materially adversely affect our business. As of December 31, 2016, we had outstanding marketable-securities-backed private banking loans of $1.58 billion, or 46.6% of our loans held-for-investment.
A prolonged downturn in the real estate market, especially in our primary markets, could result in losses and adversely affect our profitability.
Historically, a material portion of our loans have been comprised of loans with real estate as a primary component of collateral. The real estate collateral in each case provides an alternate source of repayment in the event of default by the borrower and may deteriorate in value during the time the credit is extended. The U.S. recession from 2007 to 2009 adversely affected real estate market values across the country, including in our primary market areas. A general decline in real estate values, particularly in our primary market areas, could impair the value of our collateral and our ability to sell the collateral upon any foreclosure, which would likely require us to increase our provision for loan losses. In the event of a default with respect to any of these loans, the amount we receive upon sale of the collateral may be insufficient to recover the outstanding principal and interest on the loan. If we are required to re-value the collateral securing a loan to satisfy the debt during a period of reduced real estate values or to increase our allowance for loan losses, our profitability could be adversely affected, which could have a material adverse effect on our business, financial condition, results of operations and future prospects.
A material portion of our loan portfolio is comprised of participation transaction interests, which could have an adverse effect on our ability to monitor and/or manage the lending relationships and lead to an increased risk of loss.
We achieved a significant portion of our loan growth and diversity in our loan portfolio in our initial years of operation by participating in loans originated by other institutions (including shared national credits) in which other lenders serve as the agent bank. This SNC structure may reduce our control over the monitoring and management of these relationships, particularly participations with large bank groups, which could lead to increased risk of loss, which could have a material adverse effect on our business, financial condition, results of operations and future prospects. As a result, we have reduced this component of our loan portfolio and we intend to continue to further diversify our portfolio through growth in loans from our private banking channel and direct commercial loans. However, there can be no guaranty we will be successful in our efforts to further diversify the portfolio. As of December 31, 2016, $344.0 million, or 10.1% of our loans held-for-investment, consisted of SNC loans in which we were not the lead bank.
Our loan portfolio contains large loans, and deterioration in the financial condition of these large loans could have a material adverse impact on our asset quality and profitability.
If only a few of our largest borrowers become unable to repay their loan obligations as a result of economic or market conditions or personal circumstances, our non-performing loans and our provision for loan losses could increase significantly, which could have a material adverse effect on our business, financial condition, results of operations and future prospects. We intend to continue to further diversify our portfolio with increased focus on growth in loans from our private banking channel and direct commercial loans which often have smaller loan balances. However, there can be no guaranty we will be successful in our efforts to further diversify the portfolio.
Our lending limit may restrict our growth and prevent us from effectively implementing our business strategy.
We are limited in the amount we can loan to a single borrower by the amount of our capital. Generally, under current law, we may lend up to 15.0% of our unimpaired capital and surplus to any one borrower. We have also established an informal limit on loans to any one borrower of $10.0 million. Based upon our current capital levels, the amount we may lend is significantly less than that of many of our competitors and may discourage potential borrowers who have credit needs in excess of our lending limit from doing business with us. We accommodate larger loans by selling participations in those loans to other financial institutions, but this strategy may not always be available. If we are unable to compete effectively for loans from our target customers, we may not be able to effectively implement our business strategy, which could have a material adverse effect on our business, financial condition, results of operations and future prospects.
We must maintain and follow high loan underwriting standards to grow safely.
Our ability to grow our assets safely depends on maintaining disciplined and prudent underwriting standards and ensuring that our relationship managers and lending personnel follow those standards. The weakening of these standards for any reason, such as to seek higher yielding loans, or a lack of discipline or diligence by our employees in underwriting and monitoring loans, may result in loan defaults, foreclosures and additional charge-offs and may necessitate that we significantly increase our allowance for loan losses, any of which could adversely affect our net income. Relatedly, as we attempt to uphold those standards in an increasingly competitive lending environment, we may experience increased refinancing of existing loans and reduced new loan growth. As a result, our business, results of operations, financial condition or future prospects could be adversely affected.
27
We rely heavily on our executive management team and other key employees, and we could be adversely affected by the unexpected loss of their services.
Our success depends in large part on the performance of our key personnel, as well as on our ability to attract, motivate and retain highly qualified senior and middle management and other skilled employees. Competition for employees is intense, and the process of locating key personnel with the combination of skills and attributes required to execute our business plan may be lengthy. We currently do not have any employment or non-compete agreements with any of our executive officers or key employees other than certain non-solicitation and restrictive agreements that we received from certain key employees in connection with our investment management business. We may not be successful in retaining our key employees, and the unexpected loss of services of one or more of our key personnel could have a material adverse effect on our business because of their skills, knowledge of our primary markets, years of industry experience and the difficulty of promptly finding qualified replacement personnel. If the services of any of our key personnel should become unavailable for any reason, we may not be able to identify and hire qualified persons on terms acceptable to us, or at all, which could have a material adverse effect on our business, financial condition, results of operations and future prospects.
Our business has grown rapidly, and we may not be able to maintain our historical rate of growth, which could have a material adverse effect on our ability to successfully implement our business strategy.
Our business has grown rapidly. Although rapid business growth can be a favorable business condition, financial institutions that grow rapidly can experience significant difficulties as a result of rapid growth. We seek to grow safely and consistently. This requires us to manage several different elements simultaneously. Successful growth in our banking business requires that we follow adequate loan underwriting standards, balance loan and deposit growth without increasing interest rate risk or compressing our net interest margin, maintain adequate capital at all times, produce investment performance results competitive with our peers and benchmarks, further diversify our revenue sources, meet the expectations of our clients, and hire and retain qualified employees. If we do not manage our growth successfully, then our business, results of operations or financial condition may be adversely affected.
We may not be able to sustain our historical rate of growth or continue to grow our business at all. Because of factors such as the uncertainty in the general economy and the recent government intervention in the credit markets, it may be difficult for us to repeat our historic earnings growth as we continue to expand. Failure to grow or failure to manage our growth effectively could have a material adverse effect on our business, future prospects, financial condition or results of operations, and could adversely affect our ability to successfully implement our business strategy.
Our utilization of brokered deposits could adversely affect our liquidity and results of operations.
Since our inception, we have utilized both brokered and non-brokered deposits as a source of funds to support our growing loan demand and other liquidity needs. As a bank regulatory supervisory matter, reliance upon brokered deposits as a significant source of funding is discouraged. Brokered deposits may not be as stable as other types of deposits and, in the future, those depositors may not renew their deposits when they mature, or we may have to pay a higher rate of interest to keep those deposits or may have to replace them with other deposits or with funds from other sources. Additionally, if TriState Capital Bank ceases to be categorized as “well capitalized” for bank regulatory purposes, it will not be able to accept, renew or roll over brokered deposits without a waiver from the FDIC. Our inability to maintain or replace these brokered deposits as they mature could adversely affect our liquidity and results of operations. Further, paying higher interest rates to maintain or replace these deposits could adversely affect our net interest margin and our results of operations or financial condition.
Liquidity risk could impair our ability to fund operations and meet our obligations as they become due.
Our ability to implement our business strategy will depend on our liquidity and ability to obtain funding for loan originations, working capital and other general purposes. An inability to raise funds through deposits, borrowings and other sources could have a substantial negative effect on our liquidity. Our preferred source of funds for our banking business consists of customer deposits; however, we rely on other sources such as brokered deposits and Federal Home Loan Bank (“FHLB”) advances. In addition to our competition with other banks for deposits, such account and deposit balances can decrease when customers perceive alternative investments as providing a better risk/return trade off. If customers move money out of bank deposits and into other investments, we may increase our utilization of brokered deposits, FHLB advances and other wholesale funding sources necessary to fund desired growth levels.
We rely on our ability to generate deposits and effectively manage the repayment and maturity schedules of our loans and investment securities and other sources of liquidity, respectively, to ensure that we have adequate liquidity to fund our banking operations. Any decline in available funding could adversely impact our ability to fund new loan balances, invest in securities, meet our expenses or fulfill obligations such as repaying our borrowings or meeting deposit withdrawal demands, any of which could have a material adverse effect on our liquidity, financial condition, results of operations and future prospects.
28
We are subject to interest rate risk that could negatively impact the profitability of our banking business.
Our profitability, like that of most financial institutions, depends to a significant extent on our net interest income, which is the difference between our interest income on interest-earning assets, such as loans and investment securities, and our interest expense on interest-bearing liabilities, such as deposits and borrowings. One of the ways in which we attempt to manage interest rate risk is by maintaining a largely asset sensitive balance sheet combined with longer-term deposits, but conditions could prevent us from successfully implementing this strategy in the future.
Interest rates are highly sensitive to many factors that are beyond our control, including general economic conditions and policies of various governmental and regulatory agencies and, in particular, the Federal Reserve. Changes in monetary policy, including changes in interest rates, could influence not only the interest we receive on loans and securities and the interest we pay on deposits and borrowings, but such changes could also affect our ability to originate loans and obtain deposits, the fair value of our financial assets and liabilities, and the average duration of our assets. If the interest rates paid on deposits and other borrowings increase at a faster rate than the interest rates received on loans and other investments, our net interest income, and therefore net income, could be adversely affected.
Our loans are predominantly variable rate loans, with the majority being based on the London Interbank Offered Rate (“LIBOR”). While there is a low probability that interest rates will decline materially from current levels, a continuation of the current levels of historically low interest rates could cause the spread between our loan yields and our deposit rates paid to compress our net interest margin and our net income could be adversely affected. Further, any substantial, unexpected, prolonged change in market interest rates could have a material adverse effect on our business, financial condition, results of operations and future prospects.
Further, short-term interest rates are currently very low by historical standards. These low rates have reduced our cost of funding over time. We do not believe that we can continue to use these low rates to reduce our cost of funding by the levels we have in past years. As a result, our business, results of operations, financial condition or future prospects may be adversely affected, perhaps materially.
In addition, an increase in interest rates could also have a negative impact on our results of operations by reducing the ability of borrowers to repay their current loan obligations. These circumstances could not only result in increased loan defaults, foreclosures and charge-offs, but also necessitate increases to our allowance for loan losses, each of which could have a material adverse effect on our business, results of operations, financial condition and future prospects.
Prolonged lower interest rates may adversely affect our net income.
Prolonged lower interest rates may have an adverse impact on the composition of our earning assets, our net interest margin, our net interest income and our net income. Among other things, in addition to the Interest Rate Risk listed above, a period of prolonged lower rates may cause prepayments to increase as our banking clients seek to refinance loans they currently have with us, as well as cause new originations to reflect the lower interest rate environment. Such prepayment, refinancing and new origination activity can result in a decrease in the weighted average yield of our earning assets. As a result, our business, results of operations or financial condition may be adversely affected, perhaps materially.
Changes in the method of determining the LIBOR or other reference rates may adversely impact the value of loans and other financial instruments we hold that are linked to LIBOR or other reference rates in ways that are difficult to predict and could adversely impact our financial condition or results of operations.
In recent years, concerns have been raised about the accuracy of the calculation of LIBOR. Aspects of the method for determining how LIBOR is formulated and its use in the market have changed and may continue to change. Recent changes to LIBOR administration have included the introduction of statutory regulation of LIBOR by U.K. regulatory authorities; reducing the currencies for which LIBOR is calculated to five; reducing the tenors for which LIBOR is calculated to seven; delaying the publication of individual banks’ LIBOR submissions for three months from submission; and requiring banks to provide LIBOR submissions based on an effective methodology on the basis of relevant criteria and information, including observable market transactions where possible. Each such change and any future changes could impact the availability and volatility of LIBOR. Similar changes have occurred or may occur with respect to other reference rates. It is not currently possible to determine whether, or to what extent, any such changes would impact the value of any loans, derivatives and other financial obligations or extensions of credit we hold or that are due to us, that are linked to LIBOR or other reference rates, or whether, or to what extent, such changes would impact our financial condition or results of operations.
Our commercial banking business is concentrated in, and largely dependent upon, the continued growth and welfare of the general geographic markets in which we operate.
Our commercial banking operations are concentrated in Pennsylvania, New Jersey, New York, and Ohio. As a result, our financial condition and results of operations and cash flows are affected by changes in the economic conditions of any of those states or the regions of which they are a part. Our success depends to a significant extent upon the business activity, population, income levels, deposits and
29
real estate activity in these markets. Among other things, shale gas exploration and production is a significant force in driving the economies of Western Pennsylvania and Northeastern Ohio, two of our significant commercial banking markets, and low energy prices have adversely impacted and may continue to adversely impact shale gas exploration and production, negatively impacting those economies. Although we do not make loans to companies directly engaged in oil and gas exploration and production, adverse conditions that affect these market areas could reduce our growth rate, affect the ability of our customers to repay their loans, affect the value of collateral underlying loans, impact our ability to attract deposits and generally affect our financial conditions and results of operations. Because of our geographic concentration, we may be less able than other regional or national financial institutions to diversify our credit risks across multiple markets.
Our investment management business may be negatively impacted by competition, changes in economic and market conditions, changes in interest rates and investment performance.
Our investment management business may be negatively impacted by competition, changes in economic and market conditions, changes in interest rates and investment performance. A material portion of our earnings is derived from Chartwell, our investment management business. The investment management business is intensely competitive. In the markets where we compete, there are over 1,000 firms which we consider to be primary competitors. In addition to competition from other institutional investment management firms, Chartwell, along with the active-management industry in general, compete with passive index funds, ETFs and investment alternatives such as hedge funds. Our ability to successfully attract and retain investment management clients will depend on, among other things, our ability to compete with our competitors’ investment products, level of investment performance, fees, client services, marketing and distribution capabilities. Our ability to retain investment management clients may be impaired by the fact that investment management contracts are typically terminable in nature. Most of our clients may withdraw funds from under our management at their discretion at any time for any reason, including the performance of the investment advice, a change in the client’s investment strategy or other factors. If we cannot effectively compete to attract and retain customers, our business, results of operations or financial condition may be adversely affected.
Additionally, it is possible our management fees could be reduced for a variety of reasons, including among other things, pressure on them resulting from competition in the investment management sector or regulatory changes, and that we may from time to time reduce or waive investment management fees, or limit total expenses, on certain products or services offered as part of the our investment management business for particular time periods to manage fund expenses, or for other reasons, and to help retain or increase managed assets. If our revenues decline without a commensurate reduction in our expenses, our net income from our investment management business would be reduced, which could have a material adverse effect on our business, financial condition, results of operations and future prospects.
Our investment management business may be negatively impacted by changes in general economic and market conditions. The financial markets and businesses operating in the securities industry are highly volatile (meaning that performance results can vary greatly within short periods of time) and are directly affected by, among other factors, domestic and foreign economic conditions and general trends in business and finance, all of which are beyond our control. We cannot guaranty that broad market performance will be favorable in the future. Declines in the financial markets or a lack of sustained growth may result in declines in the performance of the investment management business and the level of assets under management. Because the revenues of our investment management business are, to a large extent, fees based on assets under management, such declines could have a material adverse effect on that business.
Further, changes in interest rates could also adversely affect our investment management business, which will comprise a material part of our earnings, by decreasing the net asset values of our assets under management and potentially causing investors to shift assets in ways that negatively impact the fees generated by that business.
The termination or failure to renew fund agreements could have adverse effects on our investment management business.
A material portion of our earnings is derived from investment management agreements and sub-advisor investment management agreements related to multiple sponsored funds. Investment management agreements are, as required by law, terminable upon 60 days’ notice. In addition, investment management agreements of this nature must be approved and renewed annually by each fund’s board of directors or trustees, including independent members of the board, or its shareholders, as required by law. Failure to renew, changes resulting in lower fees, or termination of a significant number of these agreements could have a material adverse impact on our business.
Our investment management business may be negatively impacted by our investment performance.
Success in the investment management business is largely dependent on investment performance relative to market conditions and the performance of competing products. Good performance generally assists retention and growth of managed assets, resulting in additional revenues. Conversely, poor performance tends to result in decreased sales and increased redemptions with corresponding decreases in revenues to the investment management business. It also could adversely impact any performance-based fees for which we are eligible in that business. Poor performance could, therefore, have a material adverse effect on our business, results of operations or business prospects. A significant and prolonged decline in the assets under management of our investment management business could have a
30
material adverse effect on our future revenues and, to a lesser extent, net income due to related reductions to distribution expenses associated with these funds.
The failure or negative performance of products offered by other investment management companies may adversely impact our investment management business irrespective of that business’ performance.
Many competitors offer similar products to those offered by Chartwell and the failure or negative performance of competitors’ products could lead to a loss of confidence in similar Chartwell products, irrespective of the performance of such products. Any loss of confidence in a product type could lead to withdrawals, redemptions and liquidity issues in such products, which may cause the assets under management, revenue and earnings of our investment management business to decline.
We face significant competitive pressures that could impair our growth, decrease our profitability or reduce our market share.
We operate in the highly competitive financial services industry and face significant competition for customers from bank and non-bank competitors, particularly regional and nationwide institutions, in originating loans, attracting deposits, providing financial management products and services, and providing other financial services. Our competitors are generally larger and may have significantly more resources, greater name recognition, and more extensive and established branch networks or geographic footprints than we do. Because of their scale, many of these competitors can be more aggressive than we can on loan, deposit and financial services pricing. In addition, many of our non-bank and non-institutional financial management competitors have fewer regulatory constraints and may have lower cost structures. We expect competition to continue to intensify due to financial institution consolidation; legislative, regulatory and technological changes; and the emergence of alternative banking sources and investment management products and services. Additionally, technology has lowered barriers to entry.
Our ability to compete successfully will depend on a number of factors, including, among other things:
• | our ability to build and maintain long-term customer relationships while ensuring high ethical standards and safe and sound business practices; |
• | the scope, relevance, performance and pricing of products and services that we offer; |
• | customer satisfaction with our products and services; |
• | industry and general economic trends; and |
• | our ability to keep pace with technological advances and to invest in new technology. |
Increased competition could require us to increase the rates we pay on deposits or lower the rates we offer on loans or fees we charge on banking or investment management products and services, which could reduce our profitability. Our failure to compete effectively in our primary markets could cause us to lose market share and could have a material adverse effect on our business, financial condition, results of operations and future prospects.
Our ability to maintain our reputation is critical to the success of our business.
Our business plan emphasizes building and maintaining strong relationships with our clients. We have benefited from strong relationships with and among our customers, and also from our relationships with financial intermediaries. As a result, our reputation is one of the most valuable components of our business.
Our growth over the past several years has depended on attracting new customers from competing financial institutions and increasing our market share, primarily by the involvement in our primary markets and word-of-mouth advertising, rather than on growth in the market for financial services in our primary markets. As such, we strive to enhance our reputation by recruiting, hiring and retaining employees who share our core values of being an integral part of the communities and markets that we serve and delivering superior service to our customers. If our reputation is negatively affected by the actions of our employees or otherwise, our existing relationships may be damaged. We could lose some of our existing customers, including groups of large customers who have relationships with each other, and we may not be successful in attracting new customers. Any of these developments could have a material adverse effect on our business, financial condition, results of operations and future prospects.
31
Deterioration in the fiscal position of the U.S. federal government and downgrades in U.S. Treasury and federal agency securities could adversely affect us and our banking operations.
The business environment in the markets in which we operate and in the United States as a whole have a significant effect on our financial performance, the ability of borrowers to pay interest on and repay the principal of outstanding loans, the value of collateral securing those loans, and demand for loans and other products and services we offer and whose success we rely on to drive our future growth. Some elements of the business environment that affect our financial performance include short-term and long-term interest rates, the prevailing yield curve, inflation, monetary supply, fluctuations in the debt and equity capital markets, and the strength of the domestic economy and the local economies in the markets in which we operate. Unfavorable market conditions can result in a deterioration of the credit quality of borrowers, an increase in the number of loan delinquencies, defaults and charge-offs, additional provisions for loan losses, adverse asset values and a reduction in assets under management. Unfavorable or uncertain economic and market conditions can be caused by declines in economic growth, business activity or investor or business confidence, limitations on the availability of or increases in the cost of credit and capital, increases in inflation, changes in interest rates, high unemployment, natural disasters, state or local government insolvency, or a combination of these or other factors.
Uncertainty about the federal fiscal policymaking process, the medium and long-term fiscal outlook of the federal government, and future tax rates is a concern for businesses, consumers and investors in the United States. Any unfavorable change in the general business environment in which we operate, in the United States as a whole or abroad could adversely affect our business, results of operations, financial condition or future prospects.
The long-term outlook for the fiscal position of the U.S. federal government is uncertain, as illustrated by the 2011 downgrade by certain rating agencies of the credit rating of the U.S. federal government. In addition to causing economic and financial market disruptions, any future downgrade, failures to raise the U.S. statutory debt limit, or deterioration in the fiscal outlook of the U.S. federal government, could, among other things, materially adversely affect the market value of the U.S. and other government and governmental agency securities that we may hold, the availability of those securities as collateral for borrowing, and our ability to access capital markets on favorable terms. It also could increase interest rates and disrupt payment systems, money markets, and long-term or short-term fixed income markets, adversely affecting the cost and availability of funding, which could negatively affect our profitability. The adverse consequences of any downgrade could also extend to those to whom we extend credit and could adversely affect their ability to repay their loans. In addition, any resulting decline in the financial markets could affect the value of marketable securities that serve as collateral for our loans, which would, in turn, adversely affect our credit quality and could impede the growth that we expect to achieve within this segment of our loan portfolio. Any of these developments could have a material adverse effect on our business, financial condition, results of operations and future prospects.
The fair value of our investment securities can fluctuate due to factors outside of our control.
We hold an investment securities portfolio. Factors beyond our control can significantly influence the fair value of securities in our portfolio and can cause potential adverse changes to the fair value of these securities. These factors include, but are not limited to, rating agency actions in respect to the securities, defaults by the issuer or with respect to the underlying securities, changes in market interest rates and continued instability in the capital markets. Any of these factors, among others, could cause other-than-temporary impairments and realized or unrealized losses in future periods, which could have a material adverse effect on our business, results of operations, financial condition and future prospects. The process for determining whether impairment of a security is other-than-temporary often requires complex, subjective judgments about whether there has been a significant deterioration in the financial condition of the issuer, whether management has the intent or ability to hold a security for a period of time sufficient to allow for any anticipated recovery in fair value, the future financial performance and liquidity of the issuer and any collateral underlying the security, and other relevant factors.
Any future reductions in our credit ratings may increase our funding costs or impair our ability to effectively compete for business and clients.
We have used and may in the future use debt as a funding source. One or more rating agencies regularly evaluate us and their ratings of our long-term debt based on a number of factors, including our financial strength and conditions affecting the financial services industry generally. In general, rating agencies base their ratings on many quantitative and qualitative factors, including capital adequacy, liquidity, asset quality, business mix and level and quality of earnings, and we may not be able to maintain our current credit ratings. Our ratings remain subject to change at any time, and it is possible that any rating agency will take action to downgrade us in the future.
Any future decrease in our credit ratings by one or more rating agencies could impact our access to the capital markets or short-term funding or increase our financing costs, and thereby adversely affect our financial condition and liquidity. Our clients and counterparties may also be sensitive to the risks posed by a ratings downgrade and may terminate their relationships with us, may be less likely to engage in transactions with us, or may only engage in transactions with us at a substantially higher cost. We cannot predict whether client relationships or opportunities for future relationships could be adversely affected by clients who choose to do business with a higher-
32
rated institution. The inability to retain clients or to effectively compete for new business may have a material and adverse effect on our business, results of operations or financial condition.
Additionally, rating agencies have themselves been subject to scrutiny arising from the financial crisis such that the rating agencies may make or may be required to make substantial changes to their ratings policies and practices. Such changes may, among other things, adversely affect the ratings of our securities or other securities in which we have an economic interest.
Our financial results depend on management’s selection of accounting methods and certain assumptions and estimates.
Our financial condition and results of operations are based on our consolidated financial statements, which have been prepared in accordance with GAAP and with general practices within the financial services industry. The preparation of financial statements in conformity with GAAP requires us to make estimates and assumptions that affect the reported amounts of certain assets and liabilities, disclosure of contingent assets and liabilities and the reported amount of related revenues and expenses. Certain accounting policies inherently are based to a greater extent on estimates, assumptions and judgments of management and, as such, have a greater possibility of producing results that could be materially different than originally reported. They require management to make subjective or complex judgments, estimates or assumptions, and changes in those estimates or assumptions could have a significant impact on our consolidated financial statements. These critical accounting policies include: the allowance for loan losses, accounting for investment securities, evaluation of goodwill and other intangible assets, accounting for income taxes and the determination of fair value for financial instruments. Due to the uncertainty of estimates involved in these matters, we may be required to significantly increase the allowance for loan losses or sustain loan losses that are significantly higher than the reserve provided, significantly increase our accrued tax liability or otherwise incur charges that could have a material adverse effect on our business, financial condition, results of operations and future prospects.
By engaging in derivative transactions, we are exposed to additional credit and market risk in our banking business.
We use interest rate swaps to help manage our interest rate risk in our banking business from recorded financial assets and liabilities when they can be demonstrated to effectively hedge a designated asset or liability and the asset or liability exposes us to interest rate risk or risks inherent in customer related derivatives. We use other derivative financial instruments to help manage other economic risks, such as liquidity and credit risk, including exposures that arise from business activities that result in the receipt or payment of future known and uncertain cash amounts, the value of which are determined by interest rates. Our derivative financial instruments are used to manage differences in the amount, timing, and duration of our known or expected cash receipts principally related to certain of our fixed-rate loan assets or certain of our variable-rate borrowings. We also have derivatives that result from a service we provide to certain qualifying customers approved through our credit process, and therefore, are not used to manage interest rate risk in our assets or liabilities. Hedging interest rate risk is a complex process, requiring sophisticated models and routine monitoring, and is not a perfect science. As a result of interest rate fluctuations, hedged assets and liabilities will appreciate or depreciate in market value. The effect of this unrealized appreciation or depreciation will generally be offset by income or loss on the derivative instruments that are linked to the hedged assets and liabilities. By engaging in derivative transactions, we are exposed to credit and market risk. If the counterparty fails to perform, credit risk exists to the extent of the fair value gain in the derivative. Market risk exists to the extent that interest rates change in ways that are significantly different from what we expected when we entered into the derivative transaction. The existence of credit and market risk associated with our derivative instruments could adversely affect our net interest income and, therefore, could have an adverse effect on our business, financial condition, results of operations and future prospects.
We may be adversely affected by a decrease in the soundness of other financial institutions.
Our ability to engage in routine funding transactions could be adversely affected by the actions and commercial soundness of other financial institutions. Financial services companies are interrelated as a result of trading, clearing, counterparty, and other relationships. We have exposure to different industries and counterparties, and through transactions with counterparties in the financial services industry, including broker/dealers, commercial banks, investment banks, and other financial intermediaries. In addition, we participate in loans originated by other financial institutions (including shared national credits) in which other lenders serve as the lead bank. Further, our private banking channel relies on relationships with a number of other financial institutions for referrals. As a result, declines in the financial condition of, or even rumors or questions about, one or more financial institutions, financial service companies or the financial services industry generally, may lead to market-wide liquidity, asset quality or other problems and could lead to losses or defaults by us or by other institutions. These problems, losses or defaults could have a material adverse effect on our business, financial condition, results of operations and future prospects.
We rely on third parties to provide key components of our business infrastructure, and a failure of these parties to perform for any reason could disrupt our operations.
Third parties provide key components of our business infrastructure such as loan and account servicing, data processing, internet connections, network access, core application processing, statement production and account analysis. Our business depends on the
33
successful and uninterrupted functioning of our information technology and telecommunications systems and third-party servicers. The failure of these systems, or the termination of a third-party software license or service agreement on which any of these systems is based, could interrupt our operations. Because our information technology and telecommunications systems interface with and depend on third-party systems, we could experience service denials if demand for such services exceeds capacity or such third-party systems fail or experience interruptions. Replacing vendors or addressing other issues with our third-party service providers could entail significant delay and expense. If we are unable to efficiently replace ineffective service providers, or if we experience a significant, sustained or repeated, system failure or service denial, it could compromise our ability to operate effectively, damage our reputation, result in a loss of customer business or financial damages from customer businesses, and subject us to additional regulatory scrutiny and possible financial liability, any of which could have a material adverse effect on our business, financial condition, results of operations and future prospects.
We utilize the information systems of third parties to monitor the value of and control marketable securities that collateralize our loans, and a failure of those systems or third parties could adversely affect our ability to assess and manage the risk in our loan portfolio.
A significant portion of our loan portfolio is secured by marketable securities that are held by third-party custodians or other financial services or wealth management firms. We utilize the systems of these third parties to provide information to us so that we can quickly and accurately monitor changes in the value of the securities that serve as collateral. We also rely on these parties to provide control over marketable securities for purposes of perfecting our security interests and retaining the collateral in the applicable accounts. While we have been careful in selecting the third-parties with which we do business, we do not control their actions, their systems or the information that they provide to us. Any problems caused by these third parties, including as a result of their failure to provide services or information to us for any reason, or their performing services poorly or providing us with incorrect information, could adversely affect our ability to deliver products and services to our customers or could adversely affect our ability to manage, appropriately assess and react to risk in our loan portfolio, which, in turn, could have a material adverse effect on our business, financial condition, results of operations and future prospects.
We could be subject to losses, regulatory action or reputational harm due to fraudulent and negligent acts on the part of loan applicants, our borrowers, our clients, our employees and vendors.
In deciding whether to extend credit or enter into other transactions with clients and counterparties, we may rely on information furnished by or on behalf of clients and counterparties, including financial statements, property appraisals, title information, employment and income documentation, account information and other financial information. We may also rely on representations of clients and counterparties as to the accuracy and completeness of such information and, with respect to financial statements, on reports of independent auditors. Any such misrepresentation or incorrect or incomplete information may not be detected prior to funding a loan or during our ongoing monitoring of outstanding loans. In addition, one or more of our employees or vendors could cause a significant operational breakdown or failure, either as a result of human error or where an individual purposefully sabotages or fraudulently manipulates our loan documentation, operations or systems. Any of these developments could have a material adverse effect on our business, financial condition, results of operations and future prospects.
Our growth and expansion strategy may involve strategic investments or acquisitions, and we may not be able to overcome risks associated with such transactions.
Although we plan to continue to grow our business organically, we may seek opportunities to invest in or acquire investment management businesses or other businesses that we believe would complement our existing business model. Any potential future investment or acquisition activities could be material to our business and involve a number of risks, including the following:
• | incurring time and expense associated with identifying and evaluating potential investments or acquisitions and negotiating potential transactions, resulting in our attention being diverted from the operation of our existing business; |
• | the limited experience of our management team in working together on certain acquisitions and related integration activities that could be undertaken; |
• | the time, expense and difficulty of integrating the operations and personnel and standards, procedures and policies of the combined businesses; |
• | an inability to realize expected synergies or returns on investment; |
• | potential disruption of our ongoing banking business; and |
• | a loss of key employees or key customers following an investment or acquisition. |
34
We may not be successful in overcoming these risks or any other problems encountered in connection with pending or potential investments or acquisitions. Our inability to overcome these risks could have an adverse effect on our ability to implement our business strategy and enhance shareholder value, which, in turn, could have a material adverse effect on our business, financial condition, results of operations and future prospects.
New lines of business or new products and services may subject us to additional risks.
From time to time, we may develop, grow and/or acquire new lines of business or offer new products and services within existing lines of business. There are substantial risks and uncertainties associated with these efforts, particularly in instances where the markets are not fully developed. In developing and marketing new lines of business and/or new products and services we may invest significant time and resources. Initial timetables for the introduction and development of new lines of business and/or new products or services may not be achieved and price and profitability targets may not prove feasible. External factors, such as compliance with regulations, competitive alternatives and shifting market preferences, may also impact the successful implementation of a new line of business or a new product or service. Furthermore, any new line of business and/or new product or service could have a significant impact on the effectiveness of our system of internal controls. Failure to successfully manage these risks in the development and implementation of new lines of business or new products or services could have a material adverse effect on our business, results of operations and financial condition. All service offerings, including current offerings and those which may be provided in the future may become more risky due to changes in economic, competitive and market conditions beyond our control.
The value of our goodwill and other intangible assets may decline in the future.
In connection with our acquisitions we have generally recognized intangible assets including customer relationship intangible assets and goodwill in our consolidated statement of financial condition. We may not realize the value of these assets. Management performs an annual review of the carrying values of goodwill and indefinite-lived intangible assets and periodic reviews of the carrying values of all other intangible assets to determine whether events and circumstances indicate that an impairment in value may have occurred. A variety of factors could cause the carrying value of an asset to become impaired. Should a review indicate impairment, a write-down of the carrying value of the asset would occur, resulting in a non-cash charge which would adversely affect our results of operations for the period.
Unauthorized access, cyber-crime and other threats to data security may require significant resources, harm our reputation, and adversely affect our business.
We necessarily collect, use and hold personal and financial information concerning individuals and businesses with which we have a relationship. Threats to data security, including unauthorized access and cyber-attacks, rapidly emerge and change, exposing us to additional costs for protection or remediation and competing time constraints to secure our data in accordance with customer expectations, statutory and regulatory privacy, and other requirements. It is difficult or impossible to defend against every risk being posed by changing technologies, criminals or terrorists intent on committing cyber-crime and who are constantly developing new threats that despite our best efforts could result in a data breach. We could also experience a breach due to intentional or negligent conduct on the part of employees or other internal sources, software bugs or other technical malfunctions, or other causes. As a result of any of these threats, our customer accounts may become vulnerable to account takeover schemes, identity theft or cyber-fraud. Our systems and those of our third-party vendors may also become vulnerable to damage or disruption due to circumstances beyond our or their control, such as from catastrophic events, power anomalies or outages, natural disasters, network failures, and viruses and malware.
A breach of our security or the security of our third party vendors that results in unauthorized access to our data, including personal and financial information of our customers, could expose us to a disruption or challenges relating to our daily operations as well as to data loss, litigation, damages, fines and penalties, significant increases in compliance costs, and reputational damage. In addition, our investment management business could be harmed by cyber incidents affecting issuers in which its customers’ assets are invested. Any such breaches of security or cyber incidents could have a material adverse effect on our business, results of operations, financial condition and future prospects.
Systems and technology.
We utilize software and related technologies throughout our business including proprietary systems and those provided by outside service providers. Our service providers and customers, and third parties on which such service providers and customers rely, also utilize software and related technologies in their businesses. Unanticipated issues could occur and it is not possible to predict with certainty all of the adverse effects that could result from our failure or the failure of a third party to address computer system or software problems. Data or model imprecision, software or other technology malfunctions, programming inaccuracies and similar or other circumstances or events may impair the performance of systems and technology. Accordingly, there can be no assurance that potential system interruptions, other
35
technology-related issues or the cost necessary to rectify the problems would not have a material adverse effect on our business including, but not limited to, business prospects, results of operations, financial condition and future prospects.
We may take filing positions or follow tax strategies that may be subject to challenge.
The amount of income taxes that we are required to pay on our earnings is based on federal and state legislation and regulations. We provide for current and deferred taxes in our financial statements based on our results of operations, business activity, legal structure and interpretation of tax statutes. We may take filing positions or follow tax strategies that are subject to audit and may be subject to challenge. Our net income may be reduced if a federal, state or local authority assessed charges for taxes that have not been provided for in our consolidated financial statements. Taxing authorities could change applicable tax laws, challenge filing positions or assess taxes and interest charges. If taxing authorities take any of these actions, our business, results of operations, financial condition, could be adversely affected, perhaps materially.
The market in which we operate is susceptible to storms and other natural disasters and adverse weather which could result in a disruption of our operations and increases in loan losses.
A significant portion of our business is generated from markets that have been, and may continue to be, damaged by major storms and other natural disasters and adverse weather. Natural disasters can disrupt our operations, cause widespread property damage, and severely depress the local economies in which we operate. If the economies in our primary markets experience an overall decline as a result of a natural disaster, adverse weather, or other disaster, demand for loans and our other products and services could be reduced. In addition, the rates of delinquencies, foreclosures, bankruptcies and losses on loan portfolios may increase substantially, as uninsured property losses or sustained job interruption or loss may materially impair the ability of borrowers to repay their loans. Moreover, the value of real estate or other collateral that secures the loans could be materially and adversely affected by a disaster. A disaster could, therefore, result in decreased revenue and loan losses that have a material adverse effect on our business, financial condition, results of operations and future prospects.
Our operations and clients are concentrated in large metropolitan areas in the United States, which could be the target of terrorist attacks.
A significant portion of our operations and our clients, as well as the properties securing our loans outstanding are located in large metropolitan areas in the United States. These areas have been and may continue to be the target of terrorist attacks. A successful, major terrorist attack in one of our primary markets could severely disrupt our operations and the ability of our clients to do business with us, and cause losses to loans secured by properties in these areas. Such an attack could therefore have a material adverse effect on our business, results of operations, financial condition and future prospects.
We are subject to environmental liability risk associated with our lending activities.
In the course of our business, we may purchase real estate, or we may foreclose on and take title to real estate. As a result, we could be subject to environmental liabilities with respect to these properties. We may be held liable to a governmental entity or to third parties for property damage, personal injury, investigation and clean-up costs incurred by these parties in connection with environmental contamination or may be required to investigate or clean up hazardous or toxic substances or chemical releases at a property. The costs associated with investigation or remediation activities could be substantial. In addition, if we are the owner or former owner of a contaminated site, we may be subject to common law claims by third parties based on damages and costs resulting from environmental contamination emanating from the property. Any significant environmental liabilities could cause a material adverse effect on our business, financial condition, results of operations and future prospects.
Risks Relating to Regulations
We operate in a highly regulated environment, which could have a material and adverse impact on our operations and activities, financial condition, results of operations, growth plans and future prospects.
Banking is highly regulated under federal and state law. We are subject to extensive regulation and supervision that governs almost all aspects of our operations. As a registered bank holding company, we are subject to supervision, regulation and examination by the Federal Reserve. As a commercial bank chartered under the laws of Pennsylvania, TriState Capital Bank is subject to supervision, regulation and examination by the Pennsylvania Department of Banking and Securities and the FDIC. Our investment management business is subject to extensive regulation in the United States. Chartwell and Chartwell TSC are subject to Federal securities laws, principally the Securities Act of 1933, the Investment Company Act, the Advisers Act, state laws regarding securities fraud and regulations promulgated by various regulatory authorities, including the SEC, FINRA, applicable state laws and stock exchanges. Our investment management business also may be subject to regulation by the CFTC and NFA. The investment management business also is affected by the regulations governing banks and other financial institutions.
36
The primary goals of the bank regulatory scheme are to maintain a safe and sound banking system and to facilitate the conduct of sound monetary policy. This system is intended primarily for the protection of the FDIC’s Deposit Insurance Fund and bank depositors, rather than our shareholders and creditors. The banking agencies have broad enforcement power over bank holding companies and banks, including the authority, among other things, to enjoin “unsafe or unsound” practices, require affirmative action to correct any violation or practice, issue administrative orders that can be judicially enforced, direct increases in capital, direct the sale of subsidiaries or other assets, limit dividends and distributions, restrict growth, assess civil monetary penalties, remove officers and directors and, with respect to banks, terminate our charter, terminate our deposit insurance or place the Bank into conservatorship or receivership. In general, these enforcement actions may be initiated for violations of laws and regulations or unsafe or unsound practices.
In addition, to the safety and soundness focus, though, there are significant banking regulations relating to other aspects of our business, including borrower protection and community development. With respect to our community development obligations under the CRA, we have established an approved CRA strategic plan for the years 2015 through 2017. We are preparing to submit to the FDIC for approval the application for our updated strategic plan to cover the years 2018 through 2020. While we believe we will succeed in obtaining approval for our updated strategic plan, we cannot guaranty that we will obtain such an approval, in which case we would be subject to the CRA for traditional large banks, which could have material adverse effects on our business, financial of operation, financial condition and future prospects. For additional information, see “Supervision and Regulation-Community Reinvestment Act.”
The securities industry, including the investment management segment of it, has experienced increased scrutiny from a variety of regulators, including the SEC, FINRA and state attorneys general. Penalties and fines sought by regulatory authorities have increased substantially over the last several years. We may be adversely affected by changes in the interpretation or enforcement of existing laws and rules by these governmental authorities and self-regulatory organizations.
Each of the regulatory bodies with jurisdiction over us has regulatory powers dealing with many aspects of financial services, including, but not limited to, the authority to fine us and to grant, cancel, restrict or otherwise impose conditions on the right to carry on particular businesses. We also may be adversely affected as a result of new or revised legislation or regulations imposed by the SEC, other U.S. governmental regulatory authorities, FINRA or other self-regulatory organizations that supervise the banks and financial markets.
Compliance with the myriad laws and regulations applicable to our organization can be difficult and costly. In addition, these laws, regulations and policies are subject to continual review by governmental authorities, and changes to these laws, regulations and policies, including changes in interpretation or implementation of these laws, regulations and policies, could affect us in substantial and unpredictable ways and often impose additional compliance costs. Further, any new laws, rules and regulations, such as the Dodd- Frank Act, could make compliance more difficult or expensive. All of these laws and regulations, and the supervisory framework applicable to our industry, could have a material adverse impact on our operations and activities, financial condition, results of operations, growth plans and future prospects. In addition, substantial legal liability or significant regulatory action against us could have adverse financial effects on us or cause reputational harm to us, which could harm our business prospects.
The Dodd-Frank Act comprehensively reformed the regulation of financial institutions, products and services. The Dodd-Frank Act requires various federal agencies to adopt a broad range of new implementing rules and regulations, and to prepare numerous studies and reports for Congress. While a significant number of regulations have already been promulgated to implement the Dodd-Frank Act, many of the details and much of the impact of the Dodd-Frank Act may not be known for lengthy periods, which could have a material adverse effect on the financial services industry, generally and our company in particular. Certain provisions of the Dodd-Frank Act that affect deposit insurance assessments, the payment of interest on demand deposits and interchange fees could increase the costs associated with TriState Capital Bank’s deposit-generating activities, as well as place limitations on the revenues that those deposits may generate. In addition, the Dodd-Frank Act established the CFPB. The CFPB has the authority to prescribe rules for all depository institutions governing the provision of consumer financial products and services, which may result in rules and regulations that reduce the profitability of such products and services or impose greater costs on us and our subsidiaries.
It is not clear whether the executive order issued on February 3, 2017, by President Trump calling for his administration to review existing U.S. financial laws and regulations, including the Dodd-Frank Act, or the memorandum issued by President Trump to the DOL regarding the fiduciary rule, will result in material changes to the current laws and rules, or those that are in process, applicable to financial institutions and financial services or products like ours. It also is not clear what the impact from any such changes would be on our business or the markets and industries in which we compete. There is no guaranty that any changes from this review would be positive for us, and any such changes could have a material adverse impact on our business and our prospects.
Federal and state bank regulators periodically examine our business and we may be required to remediate adverse examination findings.
The Federal Reserve, the FDIC and the Pennsylvania Department of Banking and Securities periodically examine our business, including our compliance with laws and regulations. If, as a result of an examination, a bank regulatory agency were to determine that our financial
37
condition, capital resources, asset quality, earnings prospects, management, liquidity or other aspects of any of our operations had become unsatisfactory, or that we were in violation of any law or regulation, it may take a number of different remedial actions as it deems appropriate. These actions include the power to enjoin “unsafe or unsound” practices, to require affirmative action to correct any conditions resulting from any violation or practice, to issue an administrative order that can be judicially enforced, to direct an increase in our capital, to restrict our growth, to assess civil monetary penalties against our officers or directors, to remove officers and directors and, if it is concluded that such conditions cannot be corrected or there is an imminent risk of loss to depositors, to terminate TriState Capital Bank’s charter or deposit insurance and place the Bank into receivership or conservatorship. Any regulatory action against us could have a material adverse effect on our business, results of operations, financial condition and future prospects.
The Bank’s FDIC deposit insurance premiums and assessments may increase.
The deposits of TriState Capital Bank are insured by the FDIC up to legal limits and, accordingly, subject it to the payment of FDIC deposit insurance assessments. The Bank’s regular assessments are determined by its risk category, which is based on a combination of its financial ratios and supervisory ratings, which, among other things, generally demonstrates its regulatory capital levels and level of supervisory concern. High levels of bank failures since 2007 and increases in the statutory deposit insurance limits have increased costs to the FDIC in resolving bank failures and have put significant pressure on the Deposit Insurance Fund. In order to maintain a strong funding position and restore the reserve ratios of the Deposit Insurance Fund, the FDIC increased deposit insurance assessment rates and charged a special assessment to all FDIC-insured financial institutions. In the third quarter of 2016, the FDIC published the final rule to modify the FDIC deposit insurance premium assessment methodology for banks under $10 billion, which resulted in a higher assessment for the Bank. Any revised deposit insurance premium assessment methodology resulting from this new rule may result in material increases to our FDIC deposit insurance premiums. Further increases in assessment rates or special assessments may occur in the future, especially if there are significant additional financial institution failures.
Regulatory capital rules.
In December 2010, the Basel Committee released a final framework for a strengthened set of capital requirements, known as Basel III. In July 2013, final rules implementing the Basel III capital accord were adopted by the federal banking agencies. Basel III, which began phasing in on January 1, 2015, has replaced the existing regulatory capital rules for the Company and the Bank. The Basel III final rules required new minimum capital ratio standards, established a new common equity tier 1 to total risk-weighted assets ratio, subjected banking organizations to certain limitations on capital distributions and discretionary bonus payments, and established a new standardized approach for risk weightings. Basel III will be fully phased-in by 2019. The overall net impact of applying Basel III regulatory rules to the Company and TriState Capital Bank was beneficial and resulted in an increase to the risk-based capital ratios effective January 1, 2015, which primarily resulted from reduced risk-weighted capital treatment for certain of the Bank’s private banking non-purpose margin loans, which are collateralized by liquid and marketable securities that are monitored daily.
We expect that the Company and the Bank will meet all minimum capital requirements and that the Company and the Bank would also meet all capital requirements as if fully phased in without material adverse effects on our business. However, if the capital rules continue to evolve over time or if our application of the capital rules is challenged or reversed, our business, operating performance or financial prospects may be materially adversely affected.
Liquidity Requirements.
Historically, the regulation and monitoring of bank holding company and bank liquidity has been addressed as a supervisory matter, without required formulaic measures. The Basel III liquidity framework requires bank holding companies and banks to measure their liquidity against specific liquidity tests that, although similar in some respects to liquidity measures historically applied by banks and regulators for management or supervisory purposes, going forward will be required by regulation. One test, referred to as the liquidity coverage ratio (“LCR”), is designed to ensure that a banking entity maintains an adequate level of unencumbered high-quality liquid assets equal to the entity’s expected net cash outflow for a 30-day time horizon under a liquidity stress scenario. The other test, referred to as the net stable funding ratio, is designed to promote more medium- and long-term funding of the assets and activities of banking entities over a one-year time horizon. These requirements will likely encourage banking entities to increase their holdings of U.S. Treasury securities and other sovereign debt as a component of assets and may increase the use of long-term debt as a funding source. The liquidity rules released by applicable regulators do not apply to us because we are below $50 billion in assets and because we are not internationally active. However, it is possible that the federal banking agencies could apply an LCR requirement directly to banks such as our bank in the future, or that the FDIC could apply an LCR requirement to us as a supervisory matter.
We are subject to numerous laws designed to protect consumers, including the Community Reinvestment Act and fair lending laws, and failure to comply with these laws could lead to a wide variety of sanctions.
The Community Reinvestment Act, the Equal Credit Opportunity Act, the Fair Housing Act and other fair lending laws and regulations impose nondiscriminatory lending requirements on financial institutions. The Consumer Financial Protection Bureau, the Department
38
of Justice and other federal agencies are responsible for enforcing these laws and regulations. A successful regulatory challenge to an institution’s performance under the Community Reinvestment Act or fair lending laws and regulations could result in a wide variety of sanctions, including damages and civil money penalties, injunctive relief, restrictions on mergers and acquisitions activity, restrictions on expansion, and restrictions on entering new business lines. Private parties may also have the ability to challenge an institution’s performance under fair lending laws in private class action litigation. Such actions could have a material adverse effect on our business, financial condition, results of operations and future prospects.
We face a risk of noncompliance and enforcement action with the Bank Secrecy Act and other anti-money laundering statutes and regulations.
The Bank Secrecy Act, the USA PATRIOT Act of 2001, and other laws and regulations require financial institutions, among other duties, to institute and maintain an effective anti-money laundering program and file suspicious activity and currency transaction reports when appropriate. In addition to other bank regulatory agencies, the federal Financial Crimes Enforcement Network of the Department of the Treasury is authorized to impose significant civil money penalties for violations of those requirements and has recently engaged in coordinated enforcement efforts with the state and federal banking regulators, as well as the U.S. Department of Justice, Consumer Financial Protection Bureau, Drug Enforcement Administration, and Internal Revenue Service. We are also subject to increased scrutiny of compliance with the rules enforced by the Office of Foreign Assets Control of the Department of the Treasury regarding, among other things, the prohibition of transacting business with, and the need to freeze assets of, certain persons and organizations identified as a threat to the national security, foreign policy or economy of the United States. If our policies, procedures and systems are deemed deficient, we would be subject to liability, including fines and regulatory actions, which may include restrictions on our ability to pay dividends and the necessity to obtain regulatory approvals to proceed with certain aspects of our business plan, including any acquisition plans. Failure to maintain and implement adequate programs to combat money laundering and terrorist financing could also have serious reputational consequences for us. Any of these results could have a material adverse effect on our business, financial condition, results of operations and future prospects.
We are a holding company and we depend upon our subsidiaries for liquidity. Applicable laws and regulations, including capital and liquidity requirements, may restrict our ability to transfer funds from our subsidiaries to us or other subsidiaries.
TriState Capital Holdings, Inc., as the parent company, is a separate and distinct legal entity from our banking and nonbank subsidiaries. We evaluate and manage liquidity on a legal entity basis. Legal entity liquidity is an important consideration as there are legal and other limitations on our ability to utilize liquidity from one legal entity to satisfy the liquidity requirements of another, including the parent company. For instance, the parent company depends on distributions and other payments from our banking and nonbank subsidiaries to fund all payments on our other obligations, including debt obligations. Our bank and investment management subsidiaries are subject to laws that restrict dividend payments, or authorize regulatory bodies to block or reduce the flow of funds from those subsidiaries to the parent company or other subsidiaries. In addition, our bank and investment management subsidiaries are subject to restrictions on their ability to lend or transact with affiliates and to minimum regulatory capital and liquidity requirements, as well as restrictions on their ability to use funds deposited with them in bank or brokerage accounts to fund their businesses. These limitations may hinder our ability to implement our business strategy and enhance shareholder value which, in turn, could have a material adverse effect on our business, financial condition, results of operations and future prospects.
Risks Relating to an Investment in our Common Stock
Shares of our common stock are not an insured deposit.
Shares of our common stock are not bank deposits and are not insured or guaranteed by the FDIC or any other government agency. An investment in our common stock has risks, and you may lose your entire investment.
An active, liquid market for our common stock may not be sustained.
Our common stock is listed on Nasdaq, but we may be unable to meet continued listing standards. In addition, an active, liquid trading market for our common stock may not be sustained. A public trading market having the desired characteristics of depth, liquidity and orderliness depends upon the presence in the marketplace and independent decisions of willing buyers and sellers of our common stock, over which we have no control. Without an active, liquid trading market for our common stock, shareholders may not be able to sell their shares at the volume, prices and times desired. Moreover, the lack of an established market could materially and adversely affect the value of our common stock.
Future sales of our common stock may adversely affect our stock price.
The market price of our common stock may be adversely affected by the sale of a significant quantity of our outstanding common stock (including any securities convertible into or exercisable or exchangeable for common stock), or the perception that such a sale could
39
occur. These sales, or the possibility that these sales may occur, also might make it more difficult for us to raise additional capital by selling equity securities in the future at a time and price that we deem appropriate.
The market price of our common stock may be subject to substantial fluctuations, which may make it difficult for you to sell your shares at the volume, prices and times desired.
The market price of our common stock may be highly volatile, which may make it difficult to resell shares of our common stock at the volume, prices and times desired. There are many factors that may impact the market price and trading volume of our common stock, including, without limitation:
• | actual or anticipated fluctuations in our operating results, financial condition or asset quality; |
• | changes in economic or business conditions; |
• | the effects of, and changes in, trade, monetary and fiscal policies, including the interest rate policies of the Federal Reserve; |
• | publication of research reports about us, our competitors, or the financial services industry generally, or changes in, or failure to meet, securities analysts’ estimates of our financial and operating performance, or lack of research reports by industry analysts or ceasing of coverage; |
• | operating and stock price performance of companies that investors deemed comparable to us; |
• | additional or anticipated sales of our common stock or other securities by us or our existing shareholders; |
• | additions or departures of key personnel; |
• | perceptions in the marketplace regarding our competitors and/or us; |
• | significant acquisitions or business combinations, strategic partnerships, joint ventures or capital commitments by or involving our competitors or us; |
• | other economic, competitive, governmental, regulatory and technological factors affecting our operations, pricing, products and services; and |
• | other news, announcements or disclosures (whether by us or others) related to us, our competitors, our core market or the financial services industry. |
The stock market and, in particular, the market for financial institution stocks have experienced substantial fluctuations in recent years, which in many cases have been unrelated to the operating performance and prospects of particular companies. In addition, significant fluctuations in the trading volume in our common stock may cause significant price variations to occur. Increased market volatility may materially and adversely affect the market price of our common stock, which could make it difficult to sell your shares at the volume, prices and times desired.
The market price of our common stock could decline significantly due to actual or anticipated issuances or sales of our common stock in the future.
Actual or anticipated issuances or sales of substantial amounts of our common stock could cause the market price of our common stock to decline significantly and make it more difficult for us to sell equity or equity-related securities in the future at a time and on terms that we deem appropriate. The issuance of any shares of our common stock in the future also would, and equity-related securities could, dilute the percentage ownership interest held by shareholders prior to such issuance. We may issue additional equity securities, or debt securities convertible into or exercisable or exchangeable for equity securities, from time to time to raise additional capital, support growth or to make acquisitions. Further, we expect to issue stock options or other stock awards to retain and motivate our employees, executives and directors. These issuances of securities could dilute the voting and economic interests of our existing shareholders.
Securities analysts may not initiate or continue coverage on our common stock.
The trading market for our common stock depends in part on the research and reports that securities analysts publish about us and our business. We do not have any control over these securities analysts, and they may not cover our common stock. If securities analysts do not cover our common stock, the lack of research coverage may adversely affect its market price. To the extent that we are covered by securities analysts, and our common stock is the subject of an unfavorable report, the price of our common stock may decline. If one
40
or more of these analysts cease to cover us or fail to publish regular reports on us, we could lose visibility in the financial markets, which could cause the price or trading volume of our common stock to decline.
Our current management and board of directors have significant control over our business.
Our directors, as well as their related parties, and executive officers beneficially own a material portion of our outstanding common stock (~24%). Consequently, our directors and executive officers, acting together, may be able to significantly affect the outcome of the election of directors and the potential outcome of other matters submitted to a vote of our shareholders, such as mergers, the sale of substantially all of our assets and other extraordinary corporate matters. The interests of these insiders could conflict with the interest of our shareholders, including you.
The rights of holders of our common stock will be subordinate to the rights of holders of any debt securities that we may issue and may be subordinate to the rights of holders of any class of preferred stock that we may issue in the future.
Our board of directors has the authority to issue debt securities or an aggregate of up to 150,000 shares of preferred stock on the terms it determines without shareholder approval. We also have issued subordinated debt which as of December 31, 2016, had an outstanding balance of $35.0 million. Any debt or shares of preferred stock that we may issue in the future could be senior to our common stock. Because our decision to issue debt or equity securities or incur other borrowings in the future will depend on market conditions and other factors beyond our control, the amount, timing, nature or success of our future capital raising efforts is uncertain. Thus, holders of our common stock bear the risk that our future issuances of debt or equity securities or our incurrence of other borrowings may negatively affect the market price of our common stock.
We are an “emerging growth company,” and the reduced regulatory and reporting requirements applicable to emerging growth companies may make our common stock less attractive to investors.
We are an “emerging growth company,” as defined in the Jumpstart Our Business Startups Act (“JOBS Act”). For as long as we continue to be an emerging growth company we may to take advantage of reduced regulatory and reporting requirements that are otherwise generally applicable to public companies. These include, without limitation, not being required to comply with the auditor attestation requirements of Section 404(b) of the Sarbanes-Oxley Act, reduced disclosure obligations regarding executive compensation, and exemptions from the requirements of holding non-binding advisory votes on executive compensation and golden parachute payments. We have generally elected to take advantage of these reduced requirements. The JOBS Act also permits an “emerging growth company” such as us to take advantage of an extended transition period to comply with new or revised accounting standards applicable to public companies. However, we have irrevocably “opted out” of this provision, and we will comply with new or revised accounting standards to the same extent that compliance is required for non-emerging growth companies.
We may take advantage of these provisions for up to five years from our initial public offering, unless we earlier cease to be an emerging growth company, which would occur if our annual gross revenues exceed $1.0 billion, if we issue more than $1.0 billion in non-convertible debt in a three year period, or if the market value of our common stock held by non-affiliates exceeds $700.0 million as of any June 30 before that time, in which case we would no longer be an emerging growth company as of the following December 31. Investors may find our common stock less attractive to the extent that we rely on the exemptions, which may result in a less active trading market and increased volatility in our stock price.
Fulfilling our public company financial reporting and other regulatory obligations is expensive and time consuming.
As a public company, we are subject to the reporting requirements of the Securities Exchange Act of 1934, as amended, or the Exchange Act, and are required to implement specific corporate governance practices and adhere to a variety of reporting requirements under the Sarbanes-Oxley Act and the related rules and regulations of the SEC as well as Nasdaq Stock Market Rules. In particular, we are required to file with the SEC annual, quarterly and current reports with respect to our business and financial condition. Compliance with these requirements places significant demands on our legal, accounting and finance staff and on our accounting, financial and information systems and requires us to incur significant legal and accounting compliance costs as well as compensation expense for additional accounting, finance, legal and internal audit staff to comply with these reporting requirements. Our compliance efforts and these expenses are anticipated to increase in the future, particularly as we prepare for the time when we cease to be an emerging growth company under the JOBS Act, which will occur no later than as of the end of 2018 and could occur as of the end of 2017. These efforts may divert management’s attention from other business concerns, which could have an adverse effect on our business, financial condition, results of operations and future prospects.
We have not paid dividends and are subject to regulatory restrictions on our ability to pay dividends in the foreseeable future.
We have not paid any dividends on our common stock since inception. Instead, we have utilized our earnings for working capital to support our operations and to finance the growth and development of our business. In addition, we are subject to certain restrictions on
41
the payment of cash dividends as a result of banking laws, regulations and policies. Finally, because TriState Capital Bank is our most significant asset, our ability to pay dividends to our shareholders depends in large part on our receipt of dividends from the Bank, which is also subject to restrictions on dividends as a result of banking laws, regulations and policies. Even if we decide to pay dividends in the future (and we have not made such a decision), we would also have to comply with these regulatory restrictions.
Our corporate governance documents, and certain corporate and banking laws applicable to us, could make a takeover more difficult.
Certain provisions of our amended and restated articles of incorporation, our bylaws, as amended, and corporate and federal banking laws, could make it more difficult for a third party to acquire control of our organization or conduct a proxy contest, even if those events were perceived by many of our shareholders as beneficial to their interests. These provisions, and the corporate and banking laws and regulations applicable to us:
• | empower our board of directors, without shareholder approval, to issue our preferred stock, the terms of which, including voting power, are set by our board of directors; |
• | divide our board of directors into four classes serving staggered four-year terms; |
• | eliminate cumulative voting in elections of directors; |
• | require the request of holders of at least 10% of the outstanding shares of our capital stock entitled to vote at a meeting to call a special shareholders’ meeting; |
• | require at least 60 days’ advance notice of nominations by shareholders for the election of directors and the presentation of shareholder proposals at meetings of shareholders; and |
• | require prior regulatory application and approval of any transaction involving control of our organization. |
These provisions may discourage potential acquisition proposals and could delay or prevent a change in control, including circumstances in which our shareholders might otherwise receive a premium over the market price of our shares.
There are substantial regulatory limitations on changes of control of bank holding companies.
With certain limited exceptions, federal regulations prohibit a person or company or a group of persons deemed to be “acting in concert” from, directly or indirectly, acquiring more than 10% (5% if the acquirer is a bank holding company) of any class of our voting stock or obtaining the ability to control in any manner the election of a majority of our directors or otherwise direct the management or policies of our company without prior notice or application to and the approval of the Federal Reserve. Accordingly, prospective investors need to be aware of and comply with these requirements, if applicable, in connection with any purchase of shares of our common stock. These provisions effectively inhibit certain mergers or other business combinations, which, in turn, could adversely affect the market price of our common stock.
42
ITEM 1B. UNRESOLVED STAFF COMMENTS
None.
ITEM 2. PROPERTIES
Our main office consists of leased office space located at One Oxford Centre, Suite 2700, 301 Grant Street, Pittsburgh, Pennsylvania. We also lease office space for each of our four representative bank offices in the metropolitan areas of Philadelphia, Pennsylvania; Cleveland, Ohio; Edison, New Jersey; and New York, New York and we lease office space for Chartwell Investment Partners, LLC in Berwyn, Pennsylvania. The leases for our facilities have terms expiring at dates ranging from 2017 to 2024, although certain of the leases contain options to extend beyond these dates. We believe that our current facilities are adequate for our current level of operations.
ITEM 3. LEGAL PROCEEDINGS
From time to time the Company is a party to various litigation matters incidental to the conduct of its business. During the year ended December 31, 2016, the Company was not a party to any legal proceedings that the resolution of which management believes would have a material adverse effect on the Company’s business, future prospects, financial condition, liquidity, results of operation, cash flows or capital levels.
ITEM 4. MINE SAFETY DISCLOSURES
Not applicable.
PART II
ITEM 5. MARKET FOR REGISTRANT’S COMMON EQUITY, RELATED STOCKHOLDER MATTERS AND ISSUER PURCHASES OF EQUITY SECURITIES
Our common stock is traded on The Nasdaq Global Select Market under the symbol “TSC”. On January 31, 2017, there were approximately 136 holders of record of our common stock, listed with our registered agent.
No cash dividends have ever been paid by us on our common stock. Our principal source of funds to pay cash dividends on our common stock would be cash dividends from our Bank and Chartwell subsidiaries. The payment of dividends by our bank is subject to certain restrictions imposed by federal and state banking laws, regulations and authorities.
The following table presents the range of high and low bid prices reported on The Nasdaq Global Select Market for each of the quarters of 2016 and 2015.
Market Price Range | |||||||
High | Low | ||||||
2016 | |||||||
Fourth Quarter | $ | 22.60 | $ | 15.46 | |||
Third Quarter | $ | 16.28 | $ | 13.02 | |||
Second Quarter | $ | 14.00 | $ | 11.65 | |||
First Quarter | $ | 13.85 | $ | 10.77 | |||
2015 | |||||||
Fourth Quarter | $ | 14.44 | $ | 11.53 | |||
Third Quarter | $ | 13.73 | $ | 11.35 | |||
Second Quarter | $ | 13.60 | $ | 10.26 | |||
First Quarter | $ | 10.87 | $ | 9.01 | |||
43
Stock Performance Graph
The following graph sets forth the cumulative total stockholder return for the Company’s common stock beginning on May 9, 2013, the date of the Company’s initial public offering, through December 31, 2016, compared to an overall stock market index (Russell 2000 Index) and the Company’s peer group index (Nasdaq Bank Index). The Russell 2000 Index and Nasdaq Bank Index are based on total returns assuming reinvestment of dividends. The graph assumes an investment of $100 on May 9, 2013. The performance graph represents past performance and should not be considered to be an indication of future performance.
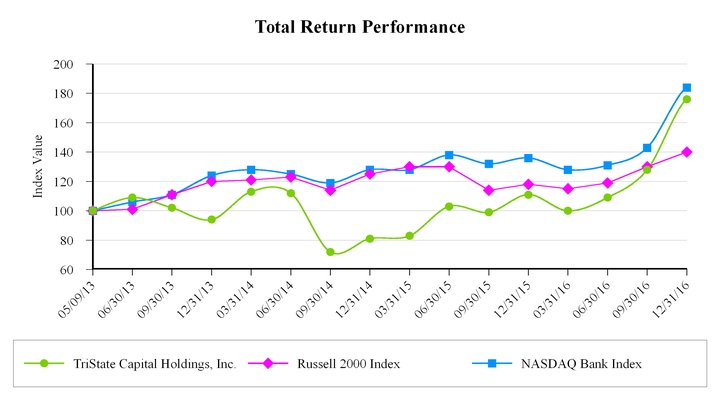
44
Purchases of Equity Securities by the Issuer and Affiliated Purchasers
The table below sets forth information regarding the Company’s purchases of its common stock during its fiscal quarter ended December 31, 2016:
Total Number of Shares Purchased | Weighted Average Price Paid per Share | Total Number of Shares Purchased as Part of Publicly Announced Plans or Programs* | Approximate Dollar Value of Shares that May Yet Be Purchased Under the Plans or Programs* | |||||||||
October 1, 2016 - October 31, 2016 | — | $ | — | — | $ | 5,470,774 | ||||||
November 1, 2016 - November 30, 2016 | 15,454 | 19.53 | 15,454 | 4,483,039 | ||||||||
December 1, 2016 - December 31, 2016 | 25,000 | 20.56 | 25,000 | 3,675,099 | ||||||||
Total | 40,454 | $ | 20.17 | 40,454 | $ | 3,675,099 | ||||||
* | In January 2016, the Company announced that its Board of Directors had approved a share repurchase program authorizing the Company to repurchase up to $10 million of its common stock from time to time on the open market or in privately negotiated transactions. In October 2016, the Company announced that its Board of Directors had approved an additional share repurchase program of up to $5 million. The Board subsequently authorized the Company to utilize some of the $15 million allocated to these share repurchase programs to cancel options granted by the Company to purchase shares of its common stock that expire in 2017 all of which have an exercise price of $10 per share. In accordance with that authorization, in addition to the shares purchased as described in the above table, the Company and holders of options that expire in 2017 agreed to cancel options as set forth in the table below. The approximate dollar value of shares that may yet be purchased under the share repurchase program in the above table has been reduced by the amount expended in connection with the option cancellations. |
In January 2017, the Company announced that its Board of Directors had approved an additional share repurchase program of up to $5 million. Under this authorization, purchases of shares may be made at the discretion of management from time to time in the open market or through negotiated transactions. That program is not included in the approximate dollar value of shares that may yet be purchased in the above table.
Total Number of Shares Subject to Canceled Options | Weighted Average Price Paid per Option Canceled | ||||||||
October 1, 2016 - October 31, 2016 | — | $ | — | ||||||
November 1, 2016 - November 30, 2016 | 86,000 | 7.97 | |||||||
December 1, 2016 - December 31, 2016 | 27,000 | 10.89 | |||||||
Total | 113,000 | $ | 8.67 | ||||||
Recent Sales of Unregistered Securities
None.
45
ITEM 6. SELECTED FINANCIAL DATA
You should read the selected financial data set forth below in conjunction with “Management’s Discussion and Analysis of Financial Condition and Results of Operations” and the consolidated financial statements and the related notes included elsewhere in this Form 10-K. We have derived the selected statements of income data for the years ended December 31, 2016, 2015 and 2014, and the selected balance sheet data as of December 31, 2016 and 2015, from our audited consolidated financial statements included elsewhere in this Form 10-K. We have derived the selected statements of income data for the years ended December 31, 2013 and 2012, and the selected balance sheet data as of December 31, 2014, 2013 and 2012, from our audited consolidated financial statements not included in this Form 10-K. The performance, asset quality and capital ratios are unaudited and derived from the audited financial statements as of and for the years presented. Average balances have been computed using daily averages. Our historical results may not be indicative of our results for any future period.
As of and for the Years Ended December 31, | |||||||||||||||
(Dollars in thousands) | 2016 | 2015 | 2014 | 2013 | 2012 | ||||||||||
Period-end balance sheet data: | |||||||||||||||
Cash and cash equivalents | $ | 103,994 | $ | 96,676 | $ | 105,710 | $ | 146,558 | $ | 200,080 | |||||
Total investment securities | 238,473 | 225,411 | 211,893 | 230,180 | 193,613 | ||||||||||
Loans held-for-investment | 3,401,054 | 2,841,284 | 2,400,052 | 1,860,775 | 1,641,628 | ||||||||||
Allowance for loan losses | (18,762 | ) | (17,974 | ) | (20,273 | ) | (18,996 | ) | (17,874 | ) | |||||
Loans held-for-investment, net | 3,382,292 | 2,823,310 | 2,379,779 | 1,841,779 | 1,623,754 | ||||||||||
Goodwill and other intangibles, net | 67,209 | 50,816 | 52,374 | — | — | ||||||||||
Other assets | 138,489 | 105,958 | 96,207 | 71,992 | 55,682 | ||||||||||
Total assets | $ | 3,930,457 | $ | 3,302,171 | $ | 2,845,963 | $ | 2,290,509 | $ | 2,073,129 | |||||
Deposits | $ | 3,286,779 | $ | 2,689,844 | $ | 2,336,953 | $ | 1,961,705 | $ | 1,823,379 | |||||
Borrowings, net | 239,510 | 254,308 | 164,106 | 20,000 | 20,000 | ||||||||||
Other liabilities | 52,361 | 32,042 | 39,514 | 14,859 | 12,026 | ||||||||||
Total liabilities | 3,578,650 | 2,976,194 | 2,540,573 | 1,996,564 | 1,855,405 | ||||||||||
Preferred stock - Series C (convertible) | — | — | — | — | 46,011 | ||||||||||
Common shareholders' equity | 351,807 | 325,977 | 305,390 | 293,945 | 171,713 | ||||||||||
Total shareholders' equity | 351,807 | 325,977 | 305,390 | 293,945 | 217,724 | ||||||||||
Total liabilities and shareholders' equity | $ | 3,930,457 | $ | 3,302,171 | $ | 2,845,963 | $ | 2,290,509 | $ | 2,073,129 | |||||
Income statement data: | |||||||||||||||
Interest income | $ | 98,312 | $ | 83,596 | $ | 78,085 | $ | 72,870 | $ | 71,037 | |||||
Interest expense | 23,499 | 15,643 | 12,251 | 11,067 | 13,674 | ||||||||||
Net interest income | 74,813 | 67,953 | 65,834 | 61,803 | 57,363 | ||||||||||
Provision for loan losses | 838 | 13 | 10,159 | 8,187 | 8,185 | ||||||||||
Net interest income after provision for loan losses | 73,975 | 67,940 | 55,675 | 53,616 | 49,178 | ||||||||||
Non-interest income: | |||||||||||||||
Investment management fees | 37,035 | 29,618 | 25,062 | — | — | ||||||||||
Net gain on the sale and call of investment securities | 77 | 33 | 1,428 | 797 | 1,114 | ||||||||||
Other non-interest income | 9,396 | 5,832 | 5,059 | 4,982 | 5,082 | ||||||||||
Total non-interest income | 46,508 | 35,483 | 31,549 | 5,779 | 6,196 | ||||||||||
Non-interest expense: | |||||||||||||||
Intangible amortization expense | 1,753 | 1,558 | 1,299 | — | — | ||||||||||
Change in fair value of acquisition earn out | (3,687 | ) | — | 1,614 | — | — | |||||||||
Other non-interest expense | 80,728 | 68,485 | 61,414 | 40,815 | 37,865 | ||||||||||
Non-interest expense | 78,794 | 70,043 | 64,327 | 40,815 | 37,865 | ||||||||||
Income before tax | 41,689 | 33,380 | 22,897 | 18,580 | 17,509 | ||||||||||
Income tax expense | 13,048 | 10,892 | 6,969 | 5,713 | 6,837 | ||||||||||
Net income | $ | 28,641 | $ | 22,488 | $ | 15,928 | $ | 12,867 | $ | 10,672 | |||||
Preferred stock dividends and discount amortization on Series A and B | — | — | — | — | 1,525 | ||||||||||
Net income available to common shareholders | $ | 28,641 | $ | 22,488 | $ | 15,928 | $ | 12,867 | $ | 9,147 | |||||
46
As of and for the Years Ended December 31, | |||||||||||||||
(Dollars in thousands, except per share data) | 2016 | 2015 | 2014 | 2013 | 2012 | ||||||||||
Per share and share data: | |||||||||||||||
Earnings per share: | |||||||||||||||
Basic | $ | 1.04 | $ | 0.81 | $ | 0.56 | $ | 0.49 | $ | 0.47 | |||||
Diluted | $ | 1.01 | $ | 0.80 | $ | 0.55 | $ | 0.48 | $ | 0.47 | |||||
Book value per common share | $ | 12.38 | $ | 11.62 | $ | 10.88 | $ | 10.25 | $ | 9.84 | |||||
Book value per share with preferred converted to common (1) | $ | 12.38 | $ | 11.62 | $ | 10.88 | $ | 10.25 | $ | 9.75 | |||||
Tangible book value per share with preferred converted to common (1) | $ | 10.02 | $ | 9.81 | $ | 9.02 | $ | 10.25 | $ | 9.75 | |||||
Common shares outstanding, at end of period | 28,415,654 | 28,056,195 | 28,060,888 | 28,690,279 | 17,444,730 | ||||||||||
Common shares outstanding with preferred converted to common, at end of period (1) | 28,415,654 | 28,056,195 | 28,060,888 | 28,690,279 | 22,322,779 | ||||||||||
Weighted average common shares outstanding: | |||||||||||||||
Basic | 27,593,725 | 27,771,345 | 28,628,631 | 24,589,811 | 17,394,491 | ||||||||||
Diluted | 28,359,152 | 28,237,453 | 29,017,906 | 26,743,023 | 19,358,624 | ||||||||||
Performance ratios: | |||||||||||||||
Return on average assets | 0.81 | % | 0.74 | % | 0.61 | % | 0.59 | % | 0.55 | % | |||||
Return on average equity | 8.48 | % | 7.13 | % | 5.25 | % | 4.84 | % | 5.24 | % | |||||
Net interest margin (2) | 2.23 | % | 2.36 | % | 2.62 | % | 2.92 | % | 2.99 | % | |||||
Bank efficiency ratio (1) | 61.17 | % | 62.30 | % | 59.93 | % | 59.98 | % | 60.61 | % | |||||
Efficiency ratio (1) | 66.29 | % | 65.65 | % | 63.96 | % | 59.84 | % | 60.64 | % | |||||
Non-interest expense to average assets | 2.23 | % | 2.32 | % | 2.44 | % | 1.88 | % | 1.94 | % | |||||
Asset quality: | |||||||||||||||
Non-performing loans | $ | 17,790 | $ | 16,660 | $ | 30,232 | $ | 20,293 | $ | 22,483 | |||||
Non-performing assets | $ | 21,968 | $ | 18,390 | $ | 31,602 | $ | 21,706 | $ | 22,773 | |||||
Other real estate owned | $ | 4,178 | $ | 1,730 | $ | 1,370 | $ | 1,413 | $ | 290 | |||||
Non-performing assets to total assets | 0.56 | % | 0.56 | % | 1.11 | % | 0.95 | % | 1.10 | % | |||||
Non-performing loans to total loans | 0.52 | % | 0.59 | % | 1.26 | % | 1.09 | % | 1.37 | % | |||||
Allowance for loan losses to loans | 0.55 | % | 0.63 | % | 0.84 | % | 1.02 | % | 1.09 | % | |||||
Allowance for loan losses to non-performing loans | 105.46 | % | 107.89 | % | 67.06 | % | 93.61 | % | 79.50 | % | |||||
Net charge-offs | $ | 50 | $ | 2,312 | $ | 8,882 | $ | 7,065 | $ | 6,661 | |||||
Net charge-offs to average total loans | — | % | 0.09 | % | 0.41 | % | 0.41 | % | 0.43 | % | |||||
Revenue: | |||||||||||||||
Total revenue (1) | $ | 121,244 | $ | 103,403 | $ | 95,955 | $ | 66,785 | $ | 62,445 | |||||
Pre-tax, pre-provision net revenue (1) | $ | 42,450 | $ | 33,360 | $ | 31,628 | $ | 25,970 | $ | 24,580 | |||||
Capital ratios: | |||||||||||||||
Average equity to average assets | 9.56 | % | 10.43 | % | 11.53 | % | 12.23 | % | 10.44 | % | |||||
Tier 1 leverage ratio | 7.90 | % | 9.05 | % | 9.21 | % | 13.12 | % | 10.35 | % | |||||
Comment equity tier 1 risk-based capital ratio | 11.49 | % | 12.20 | % | N/A | N/A | N/A | ||||||||
Tier 1 risk-based capital ratio | 11.49 | % | 12.20 | % | 9.24 | % | 13.45 | % | 10.95 | % | |||||
Total risk-based capital ratio | 12.66 | % | 13.88 | % | 11.02 | % | 14.34 | % | 11.88 | % | |||||
Assets under management | $ | 8,055,000 | $ | 8,005,000 | $ | 7,714,000 | $ | — | $ | — | |||||
(1) | These measures are not measures recognized under GAAP and are therefore considered to be non-GAAP financial measures. See “Non-GAAP Financial Measures” for a reconciliation of these measures to their most directly comparable GAAP measures. |
(2) | Net interest margin is calculated on a fully taxable equivalent basis. |
47
Non-GAAP Financial Measures
The information set forth above contains certain financial information determined by methods other than in accordance with GAAP. These non-GAAP financial measures are “common shares outstanding with preferred converted to common,” “book value per share with preferred converted to common,” “tangible common equity,” “tangible book value per share with preferred converted to common,” “total revenue,” “pre-tax, pre-provision net revenue,” and “efficiency ratio.” Although we believe these non-GAAP financial measures provide a greater understanding of our business, these measures are not necessarily comparable to similar measures that may be presented by other companies.
“Common shares outstanding with preferred converted to common” is defined as shares of our common stock issued and outstanding, inclusive of our issued and outstanding Series C preferred stock. We believe this measure is important to many investors who are interested in changes from period to period in our shares of common stock issued and outstanding giving effect to the conversion of shares of our Series C preferred stock which were convertible at the option of the holder and were converted to common stock immediately prior to the closing of the initial public offering, which closed on May 14, 2013. Convertible shares of preferred stock had the effect of not impacting shares of common stock issued and outstanding until they were converted, at which point they added to the number of shares of common stock issued and outstanding.
“Book value per share with preferred converted to common” is defined as book value, divided by shares of common stock issued and outstanding with preferred stock converted to common stock. We believe this measure is important to many investors who are interested in changes from period to period in book value per share inclusive of shares of preferred stock that could be converted to shares of common stock. Prior to conversion, convertible shares of preferred stock had the effect of not impacting book value per common share, but reduced our book value per share with preferred converted to common.
“Tangible common equity” is defined as common shareholders’ equity reduced by intangible assets, including goodwill. We believe this measure is important to management and investors to better understand and assess changes from period to period in shareholders’ equity exclusive of changes in intangible assets. Goodwill, an intangible asset that is recorded in a business purchase combination, has the effect of increasing both equity and assets, while not increasing our tangible equity or tangible assets.
“Tangible book value per share with preferred converted to common” is defined as book value, excluding the impact of intangible assets, including goodwill, divided by common shares outstanding with preferred converted to common. We believe this measure is important to many investors who are interested in changes from period to period in book value per share exclusive of changes in intangible assets and inclusive of shares of preferred stock that could be converted to shares of common stock. Prior to conversion, convertible shares of preferred stock had the effect of not impacting tangible book value per common share, but reduced our tangible book value per share with preferred converted to common.
“Total revenue” is defined as net interest income and non-interest income, excluding gains and losses on the sale and call of investment securities. We believe adjustments made to our operating revenue allow management and investors to better assess our operating revenue by removing the volatility that is associated with certain items that are unrelated to our core business.
“Pre-tax, pre-provision net revenue” is defined as net income, without giving effect to loan loss provision and income taxes, and excluding gains and losses on the sale and call of investment securities. We believe this measure is important because it allows management and investors to better assess our performance in relation to our core operating revenue, excluding the volatility that is associated with provision for loan losses or other items that are unrelated to our core business.
“Efficiency ratio” is defined as non-interest expense, excluding acquisition related items and intangible amortization expense, where applicable, divided by our total revenue. We believe this measure, particularly at the Bank, allows management and investors to better assess our operating expenses in relation to our core operating revenue by removing the volatility that is associated with certain one-time items and other discrete items that are unrelated to our core business.
The following tables present the financial measures calculated and presented in accordance with GAAP that are most directly comparable to the non-GAAP financial measures and a reconciliation of the differences between the GAAP financial measures and the non-GAAP financial measures.
48
December 31, | |||||||||||||||
(Dollars in thousands, except per share data) | 2016 | 2015 | 2014 | 2013 | 2012 | ||||||||||
Book value per share with preferred converted to common: | |||||||||||||||
Common shareholders' equity | $ | 351,807 | $ | 325,977 | $ | 305,390 | $ | 293,945 | $ | 171,713 | |||||
Preferred stock (convertible) | — | — | — | — | 46,011 | ||||||||||
Total common shareholders' equity and preferred stock, Series C | $ | 351,807 | $ | 325,977 | $ | 305,390 | $ | 293,945 | $ | 217,724 | |||||
Preferred shares outstanding | — | — | — | — | 48,780.488 | ||||||||||
Conversion factor | — | — | — | — | 100 | ||||||||||
Preferred shares converted to common shares outstanding | — | — | — | — | 4,878,049 | ||||||||||
Common shares outstanding | 28,415,654 | 28,056,195 | 28,060,888 | 28,690,279 | 17,444,730 | ||||||||||
Common shares with preferred shares converted to common | 28,415,654 | 28,056,195 | 28,060,888 | 28,690,279 | 22,322,779 | ||||||||||
Book value per share with preferred converted to common | $ | 12.38 | $ | 11.62 | $ | 10.88 | $ | 10.25 | $ | 9.75 | |||||
Tangible book value per share with preferred converted to common: | |||||||||||||||
Total common shareholders' equity and preferred stock, Series C | $ | 351,807 | $ | 325,977 | $ | 305,390 | $ | 293,945 | $ | 217,724 | |||||
Less: intangible assets | 67,209 | 50,816 | 52,374 | — | — | ||||||||||
Tangible common equity | $ | 284,598 | $ | 275,161 | $ | 253,016 | $ | 293,945 | $ | 217,724 | |||||
Common shares with preferred shares converted to common | 28,415,654 | 28,056,195 | 28,060,888 | 28,690,279 | 22,322,779 | ||||||||||
Tangible book value per share with preferred converted to common | $ | 10.02 | $ | 9.81 | $ | 9.02 | $ | 10.25 | $ | 9.75 | |||||
Years Ended December 31, | |||||||||||||||
(Dollars in thousands) | 2016 | 2015 | 2014 | 2013 | 2012 | ||||||||||
Pre-tax, pre-provision net revenue: | |||||||||||||||
Net interest income | $ | 74,813 | $ | 67,953 | $ | 65,834 | $ | 61,803 | $ | 57,363 | |||||
Total non-interest income | 46,508 | 35,483 | 31,549 | 5,779 | 6,196 | ||||||||||
Less: net gain on the sale and call of investment securities | 77 | 33 | 1,428 | 797 | 1,114 | ||||||||||
Total revenue | 121,244 | 103,403 | 95,955 | 66,785 | 62,445 | ||||||||||
Less: total non-interest expense | 78,794 | 70,043 | 64,327 | 40,815 | 37,865 | ||||||||||
Pre-tax, pre-provision net revenue | $ | 42,450 | $ | 33,360 | $ | 31,628 | $ | 25,970 | $ | 24,580 | |||||
Efficiency ratio: | |||||||||||||||
Total non-interest expense | $ | 78,794 | $ | 70,043 | $ | 64,327 | $ | 40,815 | $ | 37,865 | |||||
Plus: change in fair value of acquisition earn out | 3,687 | — | (1,614 | ) | — | — | |||||||||
Less: acquisition related items | 352 | 601 | 45 | 854 | — | ||||||||||
Less: intangible amortization expense | 1,753 | 1,558 | 1,299 | — | — | ||||||||||
Total non-interest expense, as adjusted (numerator) | $ | 80,376 | $ | 67,884 | $ | 61,369 | $ | 39,961 | $ | 37,865 | |||||
Total revenue (denominator) | $ | 121,244 | $ | 103,403 | $ | 95,955 | $ | 66,785 | $ | 62,445 | |||||
Efficiency ratio | 66.29 | % | 65.65 | % | 63.96 | % | 59.84 | % | 60.64 | % | |||||
49
BANK SEGMENT
Years Ended December 31, | |||||||||||||||
(Dollars in thousands) | 2016 | 2015 | 2014 | 2013 | 2012 | ||||||||||
Bank pre-tax, pre-provision net revenue: | |||||||||||||||
Net interest income | $ | 76,727 | $ | 69,899 | $ | 66,841 | $ | 61,611 | $ | 57,363 | |||||
Total non-interest income | 9,470 | 5,873 | 6,449 | 5,779 | 6,196 | ||||||||||
Less: net gain on the sale and call of investment securities | 77 | 33 | 1,428 | 797 | 1,114 | ||||||||||
Total revenue | 86,120 | 75,739 | 71,862 | 66,593 | 62,445 | ||||||||||
Less: total non-interest expense | 52,676 | 47,186 | 43,115 | 40,795 | 37,847 | ||||||||||
Pre-tax, pre-provision net revenue | $ | 33,444 | $ | 28,553 | $ | 28,747 | $ | 25,798 | $ | 24,598 | |||||
Bank efficiency ratio: | |||||||||||||||
Total non-interest expense | $ | 52,676 | $ | 47,186 | $ | 43,115 | $ | 40,795 | $ | 37,847 | |||||
Less: acquisition related items | — | — | 45 | 854 | — | ||||||||||
Total non-interest expense, as adjusted (numerator) | $ | 52,676 | $ | 47,186 | $ | 43,070 | $ | 39,941 | $ | 37,847 | |||||
Total revenue (denominator) | $ | 86,120 | $ | 75,739 | $ | 71,862 | $ | 66,593 | $ | 62,445 | |||||
Bank efficiency ratio | 61.17 | % | 62.30 | % | 59.93 | % | 59.98 | % | 60.61 | % | |||||
50
ITEM 7. MANAGEMENT’S DISCUSSION AND ANALYSIS OF FINANCIAL CONDITION AND RESULTS OF OPERATIONS
This section presents management’s perspective on our financial condition and results of operations and highlights material changes to the financial condition and results of operations as of and for the year ended December 31, 2016. The following discussion and analysis should be read in conjunction with our consolidated financial statements and related notes contained herein.
CAUTIONARY NOTE REGARDING FORWARD-LOOKING STATEMENTS
This report contains forward-looking statements within the meaning of section 27A of the Securities Act and section 21E of the Exchange Act. These forward-looking statements reflect our current views with respect to, among other things, future events and our financial performance. These statements are often, but not always, made through the use of words or phrases such as “may,” “should,” “could,” “predict,” “potential,” “believe,” “will likely result,” “expect,” “continue,” “will,” “anticipate,” “seek,” “estimate,” “intend,” “plan,” “projection,” “would” and “outlook,” or the negative version of those words or other comparable of a future or forward-looking nature. These forward-looking statements are not historical facts, and are based on current expectations, estimates and projections about our industry, management’s beliefs and certain assumptions made by management, many of which, by their nature, are inherently uncertain and beyond our control. Accordingly, we caution you that any such forward-looking statements are not guarantees of future performance and are subject to risks, assumptions and uncertainties that are difficult to predict. Although we believe that the expectations reflected in these forward-looking statements are reasonable as of the date made, actual results may prove to be materially different from the results expressed or implied by the forward-looking statements.
There are or will be important factors that could cause our actual results to differ materially from those indicated in these forward-looking statements, including, but not limited to, the following:
• | Deterioration of our asset quality; |
• | Our ability to prudently manage our growth and execute our strategy; |
• | Changes in the value of collateral securing our loans; |
• | Business and economic conditions generally and in the financial services industry, nationally and within our local market area; |
• | Changes in management personnel; |
• | Our ability to maintain important deposit customer relationships, our reputation and otherwise avoid liquidity risks; |
• | Our ability to provide investment management performance competitive with our peers and benchmarks; |
• | Operational risks associated with our business; |
• | Volatility and direction of market interest rates; |
• | Increased competition in the financial services industry, particularly from regional and national institutions; |
• | Changes in the laws, rules, regulations, interpretations or policies relating to financial institutions, accounting, tax, trade, monetary and fiscal matters; |
• | Further government intervention in the U.S. financial system; |
• | Natural disasters and adverse weather, acts of terrorism, an outbreak of hostilities or other international or domestic calamities, and other matters beyond our control; and |
• | Other factors that are discussed in the section entitled “Risk Factors,” in Part I - Item 1A. |
The foregoing factors should not be construed as exhaustive and should be read together with the other cautionary statements included in this document. If one or more events related to these or other risks or uncertainties materialize, or if our underlying assumptions prove to be incorrect, actual results may differ materially from what we anticipate. Accordingly, you should not place undue reliance on any such forward-looking statements. Any forward-looking statement speaks only as of the date on which it is made, and we do not undertake any obligation to publicly update or review any forward-looking statement, whether as a result of new information, future developments or otherwise. New factors emerge from time to time, and it is not possible for us to predict which will arise. In addition, we cannot assess the impact of each factor on our business or the extent to which any factor, or combination of factors, may cause actual results to differ materially from those contained in any forward-looking statements.
51
General
We are a bank holding company that operates through two reporting segments: Bank and Investment Management. The Bank segment provides commercial banking to middle-market businesses and private banking services to high-net-worth individuals through our TriState Capital Bank subsidiary. The Bank segment generates most of its revenue from interest on loans and investments, loan-related fees including swap fees, and deposit-related fees. Its primary source of funding for loans is deposits. Its largest expenses are interest on these deposits and salaries and related employee benefits. The Investment Management segment provides advisory and sub-advisory investment management services primarily to institutional plan sponsors through our Chartwell Investment Partners, LLC subsidiary and also will facilitate marketing efforts for Chartwell’s proprietary investment products through our Chartwell TSC Securities Corp. subsidiary, once it is registered as a broker/dealer with the SEC and FINRA. The Investment Management segment generates most of its revenue from investment management fees earned on assets under management and its largest expenses are salaries and related employee benefits.
The following discussion and analysis presents our financial condition and results of operations on a consolidated basis, except where significant segment disclosures are necessary to better explain the operations of each segment and related variances. In particular, the discussion and analysis of non-interest income and non-interest expense is reported by segment.
We measure our performance primarily through our earnings per share; total revenue; and pre-tax, pre-provision net revenue. Other salient metrics include the ratio of allowance for loan losses to loans; net interest margin; the efficiency ratio of the Bank segment; assets under management; return on average assets; return on average equity; and regulatory leverage and risk-based capital ratios.
Executive Overview
TriState Capital Holdings, Inc. (“we”, “us”, “our” or the “Company”) is a bank holding company headquartered in Pittsburgh, Pennsylvania. The Company has three wholly owned subsidiaries: TriState Capital Bank (“the Bank”), a Pennsylvania chartered bank; Chartwell Investment Partners, LLC (“Chartwell”), a registered investment advisor; and Chartwell TSC Securities Corp. (“CTSC Securities”), which has applied to be registered as a broker/dealer with the SEC and FINRA. Through our bank subsidiary, we serve middle-market businesses in our primary markets throughout the states of Pennsylvania, Ohio, New Jersey and New York. We also serve high-net-worth individuals on a national basis through our private banking channel. We market and distribute our products and services through a scalable branchless banking model, which creates significant operating leverage throughout our business as we continue to grow. Through our investment management subsidiary, we provide investment management services to institutional, sub-advisory, managed account and private clients on a national basis. Assets under management were $8.06 billion as of December 31, 2016. Our broker/dealer subsidiary, once registered, will facilitate marketing efforts for Chartwell’s proprietary investment products that may require SEC or FINRA licensing.
2016 Compared to 2015 Operating Performance
For the year ended December 31, 2016, our net income was $28.6 million compared to $22.5 million for the same period in 2015, an increase of $6.2 million, or 27.4%. This increase was primarily due to the net impact of (1) a $6.9 million, or 10.1%, increase in our net interest income due largely to our continued loan growth; and (2) an increase of $11.0 million in non-interest income largely related to higher investment management fees due to the TKG acquisition and higher swap revenue; partially offset by (3) an increase in provision for loan losses of $825,000; (4) an increase of $8.8 million in our non-interest expense largely related to the TKG acquisition as well as higher compensation and FDIC insurance expenses; and (5) a $2.2 million increase in income taxes due to higher pre-tax income.
Our diluted EPS was $1.01 for the year ended December 31, 2016, compared to $0.80 for the same period in 2015. The increase is a result of an increase of $6.2 million, or 27.4%, in our net income.
For the year ended December 31, 2016, total revenue increased $17.8 million, or 17.3%, to $121.2 million from $103.4 million for the same period in 2015, driven by higher net interest income for the Bank, higher investment management fees and higher swap fees. Pre-tax, pre-provision net revenue increased $9.1 million, or 27.2%, to $42.5 million for the year ended December 31, 2016, from $33.4 million for the same period in 2015, resulting from total revenue growing faster than non-interest expenses.
Our net interest margin was 2.23% for the year ended December 31, 2016, as compared to 2.36% for the same period in 2015. The most significant factor driving net interest margin compression has been our shift toward lower-risk assets, notably the marketable-securities-backed private banking margin loan portfolio, as well as an increase in the cost of funds.
For the year ended December 31, 2016, the Bank’s efficiency ratio was 61.17%, as compared to 62.30% for the same period in 2015, primarily as a result of higher total revenue partially offset by higher compensation and FDIC insurance expenses for the Bank during the year ended December 31, 2016. Our non-interest expense to average assets for the year ended December 31, 2016, was 2.23%, compared to 2.32% for the same period in 2015.
52
Our return on average assets was 0.81% for the year ended December 31, 2016, as compared to 0.74% for the same period in 2015. Our return on average equity was 8.48% for the year ended December 31, 2016, as compared to 7.13% for the same period in 2015. The increase in these ratios is due to continued growth in earnings from both the banking and investment management segments.
Total assets of $3.93 billion as of December 31, 2016, increased $628.3 million, or 19.0%, from December 31, 2015. Loans held-for-investment grew by $559.8 million to $3.40 billion as of December 31, 2016, an increase of 19.7% from December 31, 2015, as a result of growth in our commercial and private banking loan portfolios. Total deposits increased $596.9 million, or 22.2%, to $3.29 billion as of December 31, 2016, from $2.69 billion, as of December 31, 2015.
Adverse-rated credits to total loans declined to 1.25% at December 31, 2016, from 1.92% at December 31, 2015. The allowance for loan losses to loans decreased to 0.55% as of December 31, 2016, from 0.63% as of December 31, 2015. The trend of our allowance for loan losses reflects the change in composition of our loan portfolio over recent years with a decrease in adverse-rated credits and a much larger percentage of the portfolio in loans secured by marketable securities.
Our book value per common share increased $0.76, or 6.5%, to $12.38 as of December 31, 2016, from $11.62 as of December 31, 2015, largely as a result of an increase in our net income, partially offset by the issuance of restricted stock and the cancellation of stock options during year ended December 31, 2016.
2015 Compared to 2014 Operating Performance
For the year ended December 31, 2015, our net income was $22.5 million compared to $15.9 million for the same period in 2014, an increase of $6.6 million, or 41.2%, primarily due to the net impact of (1) a $2.1 million, or 3.2%, increase in our net interest income due largely to our continued loan growth; (2) a decrease in provision for loan losses of $10.1 million; (3) an increase of $3.9 million in non-interest income largely related to higher investment management fees with two additional months of Chartwell’s operating results and higher swap fees offset by lower net gain on the sale of investment securities available-for-sale; (4) an increase of $5.7 million in our non-interest expense largely related to two additional months of Chartwell expense; and (5) a $3.9 million increase in income taxes.
Our diluted EPS was $0.80 for the year ended December 31, 2015, compared to $0.55 for the same period in 2014. The increase is a result of an increase of $6.6 million, or 41.2%, in our net income and lower dilutive average shares largely related to the purchase of treasury stock.
For the year ended December 31, 2015, total revenue increased $7.4 million, or 7.8%, to $103.4 million from $96.0 million for the same period in 2014, driven by two additional months of Chartwell’s revenue and growth in our loan income and swap fees. Pre-tax, pre-provision net revenue increased $1.7 million, or 5.5%, to $33.4 million for the year ended December 31, 2015, from $31.6 million for the same period in 2014, primarily resulting from two additional months of Chartwell’s operating results.
Our net interest margin was 2.36% for the year ended December 31, 2015, as compared to 2.62% for the same period in 2014. The most significant factor driving net interest margin compression has been our shift toward lower-risk assets, most notably the marketable-securities-backed private banking margin loan portfolio that the Bank has made its fastest growing channel. In addition, net interest margin for the year ended December 31, 2015, was impacted by the additional interest expense from our June 2014 subordinated debt placement.
For the year ended December 31, 2015, the Bank’s efficiency ratio was 62.30%, as compared to 59.93% for the same period in 2014, (adjusted for acquisition related items), primarily as a result of higher compensation expense for the Bank offset partially by higher total revenue for the year ended December 31, 2015. Our non-interest expense to average assets for the year ended December 31, 2015, was 2.32%, compared to 2.44% for the same period in 2014.
Our return on average assets was 0.74% for the year ended December 31, 2015, as compared to 0.61% for the same period in 2014. Our return on average equity was 7.13% for the year ended December 31, 2015, as compared to 5.25% for the same period in 2014. The increase in both ratios is the result of the higher net income for the year ended December 31, 2015, as discussed above.
TriState Capital Holdings’ total risk-based capital ratio increased to 13.88% as of December 31, 2015, from 11.02% as of December 31, 2014. TriState Capital Bank’s total risk-based capital ratio increased to 13.35% as of December 31, 2015, from 10.69% as of December 31, 2014. The increase in the risk-based capital ratios are primarily due to the new Basel III capital rules effective January 1, 2015. The Company benefits from risk-weighted capital treatment recognizing the lower-risk profile of our private banking margin loans, which are collateralized by cash and marketable securities that are monitored daily. This implementation had the favorable net effect of making approximately $70 million of regulatory capital available to the Bank in the first quarter of 2015.
Total assets of $3.30 billion as of December 31, 2015, increased $456.2 million, or 16.0%, from December 31, 2014. Loans held-for-investment grew by $441.2 million to $2.84 billion as of December 31, 2015, an increase of 18.4% from December 31, 2014, primarily
53
as a result of growth in our private banking and commercial real estate loan portfolios. Total deposits increased $352.9 million, or 15.1%, to $2.69 billion as of December 31, 2015, from $2.34 billion, as of December 31, 2014.
Non-performing assets to total assets decreased to 0.56% as of December 31, 2015, from 1.11% as of December 31, 2014, due to $13.4 million in reductions related to paydowns, a sale, charge-offs and two payoffs on non-performing loans during the year partially offset by an addition of a $228,000 non-performing loan. Net charge-offs to average loans for the year ended December 31, 2015, was 0.09%, as compared to 0.41% for the same period in 2014.
The allowance for loan losses to loans decreased to 0.63% as of December 31, 2015, from 0.84% as of December 31, 2014, which reflects the reduction in non-performing loans and the lower provision required for private banking loans secured by marketable securities. The allowance for loan losses to non-performing loans increased to 107.89% as of December 31, 2015, from 67.06% as of December 31, 2014. This change was primarily due to lower non-performing loan balances as of December 31, 2015. The provision for loan losses was $13,000 for the year ended December 31, 2015, as compared to $10.2 million for the year ended December 31, 2014. The trend of our recent credit provision reflects the change in composition of our loan portfolio over the past year with a decrease in adverse-rated credits and a much larger percentage of the portfolio in loans secured by marketable securities.
Our book value per common share increased $0.74, or 6.8%, to $11.62 as of December 31, 2015, from $10.88 as of December 31, 2014, largely as a result of an increase in our net income.
Results of Operations
Net Interest Income
Net interest income represents the difference between the interest received on interest-earning assets and the interest paid on interest-bearing liabilities. Net interest income is affected by changes in the volume of interest-earning assets and interest-bearing liabilities and changes in interest yields earned and rates paid. Maintaining consistent spreads between earning assets and interest-bearing liabilities is significant to our financial performance because net interest income comprised 61.7%, 65.7% and 68.6% of total revenue for the years ended December 31, 2016, 2015 and 2014, respectively.
The table below reflects an analysis of net interest income, on a fully taxable equivalent basis, for the periods indicated. The adjustment to convert certain income to a fully taxable equivalent basis consists of dividing tax exempt income by one minus the statutory federal income tax rate of 35.0%.
Years Ended December 31, | |||||||||
(Dollars in thousands) | 2016 | 2015 | 2014 | ||||||
Interest income | $ | 98,312 | $ | 83,596 | $ | 78,085 | |||
Fully taxable equivalent adjustment | 264 | 260 | 235 | ||||||
Interest income adjusted | 98,576 | 83,856 | 78,320 | ||||||
Less: interest expense | 23,499 | 15,643 | 12,251 | ||||||
Net interest income adjusted | $ | 75,077 | $ | 68,213 | $ | 66,069 | |||
Yield on earning assets | 2.92 | % | 2.90 | % | 3.10 | % | |||
Cost of interest-bearing liabilities | 0.79 | % | 0.62 | % | 0.57 | % | |||
Net interest spread | 2.13 | % | 2.28 | % | 2.53 | % | |||
Net interest margin (1) | 2.23 | % | 2.36 | % | 2.62 | % | |||
(1) | Net interest margin is calculated on a fully taxable equivalent basis. |
The following table provides information regarding the average balances and yields earned on interest-earning assets and the average balances and rates paid on interest-bearing liabilities for the years ended December 31, 2016, 2015 and 2014. Non-accrual loans are included in the calculation of the average loan balances, while interest payments collected on non-accrual loans is recorded as a reduction to principal. Where applicable, interest income and yield are reflected on a fully taxable equivalent basis, and have been adjusted based on the statutory federal income tax rate of 35.0%.
54
Years Ended December 31, | ||||||||||||||||||||||||||
2016 | 2015 | 2014 | ||||||||||||||||||||||||
(Dollars in thousands) | Average Balance | Interest Income (1)/ Expense | Average Yield/ Rate | Average Balance | Interest Income (1)/ Expense | Average Yield/ Rate | Average Balance | Interest Income (1)/ Expense | Average Yield/ Rate | |||||||||||||||||
Assets | ||||||||||||||||||||||||||
Interest-earning deposits | $ | 110,455 | $ | 595 | 0.54 | % | $ | 102,240 | $ | 363 | 0.36 | % | $ | 155,241 | $ | 525 | 0.34 | % | ||||||||
Federal funds sold | 6,116 | 22 | 0.36 | % | 6,168 | 6 | 0.10 | % | 7,495 | 4 | 0.05 | % | ||||||||||||||
Investment securities available-for-sale | 180,460 | 3,234 | 1.79 | % | 164,701 | 2,201 | 1.34 | % | 174,285 | 2,167 | 1.24 | % | ||||||||||||||
Investment securities held-to-maturity | 48,357 | 1,958 | 4.05 | % | 42,117 | 1,651 | 3.92 | % | 33,989 | 1,173 | 3.45 | % | ||||||||||||||
Investment securities trading | — | — | — | % | 41 | 1 | 2.44 | % | — | — | — | % | ||||||||||||||
FHLB stock | 10,363 | 494 | 4.77 | % | 5,796 | 389 | 6.71 | % | 5,613 | 172 | 3.06 | % | ||||||||||||||
Total loans | 3,014,645 | 92,273 | 3.06 | % | 2,570,200 | 79,245 | 3.08 | % | 2,145,870 | 74,279 | 3.46 | % | ||||||||||||||
Total interest-earning assets | 3,370,396 | 98,576 | 2.92 | % | 2,891,263 | 83,856 | 2.90 | % | 2,522,493 | 78,320 | 3.10 | % | ||||||||||||||
Other assets | 161,054 | 132,506 | 108,794 | |||||||||||||||||||||||
Total assets | $ | 3,531,450 | $ | 3,023,769 | $ | 2,631,287 | ||||||||||||||||||||
Liabilities and Shareholders' Equity | ||||||||||||||||||||||||||
Interest-bearing deposits: | ||||||||||||||||||||||||||
Interest-bearing checking accounts | $ | 171,431 | $ | 813 | 0.47 | % | $ | 107,292 | $ | 439 | 0.41 | % | $ | 68,114 | $ | 229 | 0.34 | % | ||||||||
Money market deposit accounts | 1,676,455 | 11,376 | 0.68 | % | 1,367,584 | 5,687 | 0.42 | % | 1,096,347 | 4,228 | 0.39 | % | ||||||||||||||
Certificates of deposit | 874,615 | 7,618 | 0.87 | % | 898,336 | 6,762 | 0.75 | % | 880,513 | 6,154 | 0.70 | % | ||||||||||||||
Borrowings: | ||||||||||||||||||||||||||
FHLB borrowings | 228,934 | 1,477 | 0.65 | % | 120,425 | 540 | 0.45 | % | 98,370 | 373 | 0.38 | % | ||||||||||||||
Subordinated notes payable, net | 34,402 | 2,215 | 6.44 | % | 34,199 | 2,215 | 6.48 | % | 19,512 | 1,267 | 6.49 | % | ||||||||||||||
Total interest-bearing liabilities | 2,985,837 | 23,499 | 0.79 | % | 2,527,836 | 15,643 | 0.62 | % | 2,162,856 | 12,251 | 0.57 | % | ||||||||||||||
Noninterest-bearing deposits | 170,573 | 149,567 | 133,733 | |||||||||||||||||||||||
Other liabilities | 37,441 | 30,917 | 31,288 | |||||||||||||||||||||||
Shareholders' equity | 337,599 | 315,449 | 303,410 | |||||||||||||||||||||||
Total liabilities and shareholders' equity | $ | 3,531,450 | $ | 3,023,769 | $ | 2,631,287 | ||||||||||||||||||||
Net interest income (1) | $ | 75,077 | $ | 68,213 | $ | 66,069 | ||||||||||||||||||||
Net interest spread | 2.13 | % | 2.28 | % | 2.53 | % | ||||||||||||||||||||
Net interest margin (1) | 2.23 | % | 2.36 | % | 2.62 | % | ||||||||||||||||||||
(1) | Net interest income and net interest margin are calculated on a fully taxable equivalent basis. |
Net Interest Income for the Years Ended December 31, 2016 and 2015. Net interest income, calculated on a fully taxable equivalent basis, increased $6.9 million, or 10.1%, to $75.1 million for the year ended December 31, 2016, from $68.2 million for the same period in 2015. The increase in net interest income for the year ended December 31, 2016, was primarily attributable to a $479.1 million, or 16.6%, increase in average interest-earning assets driven largely by loan growth. The increase in net interest income reflects an increase of $14.7 million, or 17.6%, in interest income, partially offset by an increase of $7.9 million, or 50.2%, in interest expense. Net interest margin decreased to 2.23% for the year ended December 31, 2016, as compared to 2.36% for the same period in 2015, driven primarily by an overall lower yield on the loan portfolio and higher interest expense associated with the higher deposit volumes and associated costs of deposits as well as increased FHLB borrowings.
The increase in interest income was primarily the result of an increase in average total loans of $444.4 million, or 17.3%, which is our primary earning asset and the Bank’s core business, as well as higher average balances and yields on investment securities, partially offset by a decrease of two basis points in yield on our loans. The most significant factors driving the yield on our loan portfolio has been our
55
shift toward lower-risk assets, notably the marketable-securities-backed private banking loan portfolio that the Bank has made its fastest growing channel, which was partially offset by the effect on our floating-rate loans due to the Federal Reserve’s increase in the target federal funds rate in December 2015. The overall yield on interest-earning assets increased two basis points to 2.92% for the year ended December 31, 2016, as compared to 2.90% for the same period in 2015.
Interest expense on interest-bearing liabilities of $23.5 million, for the year ended December 31, 2016, increased $7.9 million, or 50.2%, from the same period in 2015 as a result of an increase of $458.0 million, or 18.1%, in average interest-bearing liabilities for the year ended December 31, 2016, coupled with an increase of 17 basis points in the average rate paid on our average interest-bearing liabilities compared to the same period in 2015. The increase in average rate paid was reflective of increases in rates paid in all interest-bearing deposit categories and FHLB borrowings. The increase in average interest-bearing liabilities was driven primarily by an increase of $308.9 million, or 22.6%, in average money market deposit accounts and an increase of $108.5 million in average FHLB borrowings.
Net Interest Income for the Years Ended December 31, 2015 and 2014. Net interest income, calculated on a fully taxable equivalent basis, increased $2.1 million, or 3.2%, to $68.2 million for the year ended December 31, 2015, from $66.1 million for the same period in 2014. The increase in net interest income for the year ended December 31, 2015, was primarily attributable to a $368.8 million, or 14.6%, increase in average interest-earning assets driven largely by loan growth. The increase in net interest income reflects an increase of $5.5 million, or 7.1%, in interest income, partially offset by an increase of $3.4 million, or 27.7%, in interest expense. Net interest margin decreased to 2.36% for the year ended December 31, 2015, as compared to 2.62% for the same period in 2014 driven by an overall lower yield from the loan portfolio and higher cost of deposits and borrowings.
The increase in interest income was primarily the result of an increase in average total loans of $424.3 million, or 19.8%, which is our primary earning asset and the Bank’s core business, as well as a decrease of $53.0 million in average cash balances, partially offset by a decrease of 38 basis points in yield on our loans. The most significant factor of the declining yield on our loan portfolio has been our shift toward lower-risk assets, most notably the marketable-securities-backed private banking loan portfolio that the Bank has made its fastest growing channel. The overall yield on interest-earning assets declined 20 basis points to 2.90% for the year ended December 31, 2015, as compared to 3.10% for the same period in 2014, primarily as a result of the lower yield on loans, driven largely by the increase in our private banking portfolio balance as a percentage of total loans.
Interest expense on interest-bearing liabilities of $15.6 million, for the year ended December 31, 2015, increased $3.4 million, or 27.7%, from the same period in 2014 as a result of an increase of $365.0 million, or 16.9%, in average interest-bearing liabilities for the year ended December 31, 2015, coupled with an increase of five basis points in the average rate paid on our average interest-bearing liabilities compared to the same period in 2014. The increase in average rate paid was reflective of increases in rates paid in all interest-bearing deposit categories and FHLB borrowings. The increase in average interest-bearing liabilities was driven primarily by an increase of $271.2 million, or 24.7%, in average money market deposit accounts and an increase of $14.7 million in average subordinated notes payable.
56
The following tables analyze the dollar amount of the change in interest income and interest expense with respect to the primary components of interest-earning assets and interest-bearing liabilities. The tables show the amount of the change in interest income or interest expense caused by either changes in outstanding balances or changes in interest rates for the periods indicated. The effect of changes in balance is measured by applying the average rate during the first period to the balance (“volume”) change between the two periods. The effect of changes in rate is measured by applying the change in rate between the two periods to the average volume during the first period.
Years Ended December 31, | |||||||||||
2016 over 2015 | |||||||||||
(Dollars in thousands) | Yield/Rate | Volume | Change(1) | ||||||||
Increase (decrease) in: | |||||||||||
Interest income: | |||||||||||
Interest-earning deposits | $ | 201 | $ | 31 | $ | 232 | |||||
Federal funds sold | 16 | — | 16 | ||||||||
Investment securities available-for-sale | 805 | 228 | 1,033 | ||||||||
Investment securities held-to-maturity | 52 | 255 | 307 | ||||||||
Investment securities trading | — | (1 | ) | (1 | ) | ||||||
FHLB stock | (138 | ) | 243 | 105 | |||||||
Total loans | (788 | ) | 13,816 | 13,028 | |||||||
Total increase in interest income | 148 | 14,572 | 14,720 | ||||||||
Interest expense: | |||||||||||
Interest-bearing deposits: | |||||||||||
Interest-bearing checking accounts | 77 | 297 | 374 | ||||||||
Money market deposit accounts | 4,183 | 1,506 | 5,689 | ||||||||
Certificates of deposit | 1,036 | (180 | ) | 856 | |||||||
Borrowings: | |||||||||||
FHLB borrowings | 305 | 632 | 937 | ||||||||
Subordinated notes payable, net | (16 | ) | 16 | — | |||||||
Total increase in interest expense | 5,585 | 2,271 | 7,856 | ||||||||
Total increase (decrease) in net interest income | $ | (5,437 | ) | $ | 12,301 | $ | 6,864 | ||||
(1) | The change in interest income and expense due to change in composition and applicable yields and rates has been allocated to volume and rate changes in proportion to the relationship of the absolute dollar amounts of the change in each. |
57
Years Ended December 31, | |||||||||||
2015 over 2014 | |||||||||||
(Dollars in thousands) | Yield/Rate | Volume | Change(1) | ||||||||
Increase (decrease) in: | |||||||||||
Interest income: | |||||||||||
Interest-earning deposits | $ | 25 | $ | (187 | ) | $ | (162 | ) | |||
Federal funds sold | 3 | (1 | ) | 2 | |||||||
Investment securities available-for-sale | 157 | (123 | ) | 34 | |||||||
Investment securities held-to-maturity | 173 | 305 | 478 | ||||||||
Investment securities trading | — | 1 | 1 | ||||||||
FHLB stock | 211 | 6 | 217 | ||||||||
Total loans | (8,688 | ) | 13,654 | 4,966 | |||||||
Total increase (decrease) in interest income | (8,119 | ) | 13,655 | 5,536 | |||||||
Interest expense: | |||||||||||
Interest-bearing deposits: | |||||||||||
Interest-bearing checking accounts | 58 | 152 | 210 | ||||||||
Money market deposit accounts | 351 | 1,108 | 1,459 | ||||||||
Certificates of deposit | 481 | 127 | 608 | ||||||||
Borrowings: | |||||||||||
FHLB borrowings | 75 | 92 | 167 | ||||||||
Subordinated notes payable, net | (3 | ) | 951 | 948 | |||||||
Total increase in interest expense | 962 | 2,430 | 3,392 | ||||||||
Total increase (decrease) in net interest income | $ | (9,081 | ) | $ | 11,225 | $ | 2,144 | ||||
(1) | The change in interest income and expense due to change in composition and applicable yields and rates has been allocated to volume and rate changes in proportion to the relationship of the absolute dollar amounts of the change in each. |
Provision for Loan Losses
The provision for loan losses represents our determination of the amount necessary to be charged against the current period’s earnings to maintain the allowance for loan losses at a level that is considered adequate in relation to the estimated losses inherent in the loan portfolio. For additional information regarding our allowance for loan losses, see “Allowance for Loan Losses.”
Provision for Loan Losses for the Years Ended December 31, 2016, 2015 and 2014. We recorded provision for loan losses of $838,000, $13,000 and $10.2 million for the years ended December 31, 2016, 2015 and 2014, respectively.
The provision for loan losses for the year ended December 31, 2016, was comprised of a net increase of $6.9 million in specific reserves primarily on three commercial and industrial non-performing loans, of which $4.3 million was charged-off, partially offset by recoveries of $4.2 million and an overall improvement in adverse-rated credits.
The provision for loan losses for the year ended December 31, 2015, was comprised of a net decrease of $1.3 million in general reserves on commercial and industrial loans largely due to a reserve reversal from payoffs on two substandard-rated credits and recoveries of $1.0 million, offset by a net increase in specific reserves of $2.3 million on commercial and industrial non-performing loans.
The provision for loan losses for the year ended December 31, 2014, was largely driven by the impact of charge-offs totaling $9.5 million for the year ended December 31, 2014, on six commercial and industrial loans.
Non-Interest Income
Non-interest income is an important component of our revenue and it is comprised primarily of investment management fees from Chartwell coupled with fees generated from loan and deposit relationships with our Bank customers, including swap transactions. The information provided under the caption “Parent and Other” represents general operating expenses of the Company not considered to be a reportable segment, which includes the parent company activity as well as eliminations and adjustments that are necessary for purposes of reconciliation to the consolidated amounts.
58
The following table presents the components of our non-interest income by operating segment for the years ended December 31, 2016 and 2015:
Year Ended December 31, 2016 | Year Ended December 31, 2015 | ||||||||||||||||||||||||
Investment | Parent | Investment | Parent | ||||||||||||||||||||||
(Dollars in thousands) | Bank | Management | and Other | Consolidated | Bank | Management | and Other | Consolidated | |||||||||||||||||
Investment management fees | $ | — | $ | 37,258 | $ | (223 | ) | $ | 37,035 | $ | — | $ | 29,814 | $ | (196 | ) | $ | 29,618 | |||||||
Service charges | 504 | — | — | 504 | 647 | — | — | 647 | |||||||||||||||||
Net gain on the sale and call of investment securities | 77 | — | — | 77 | 33 | — | — | 33 | |||||||||||||||||
Swap fees | 4,384 | — | — | 4,384 | 1,551 | — | — | 1,551 | |||||||||||||||||
Commitment and other fees | 2,029 | — | — | 2,029 | 2,022 | — | — | 2,022 | |||||||||||||||||
Unrealized net gain (loss) on swaps | 570 | — | — | 570 | (161 | ) | — | — | (161 | ) | |||||||||||||||
Bank owned life insurance income | 1,796 | — | — | 1,796 | 1,696 | — | — | 1,696 | |||||||||||||||||
Other income | 110 | 3 | — | 113 | 85 | (8 | ) | — | 77 | ||||||||||||||||
Total non-interest income | $ | 9,470 | $ | 37,261 | $ | (223 | ) | $ | 46,508 | $ | 5,873 | $ | 29,806 | $ | (196 | ) | $ | 35,483 | |||||||
Non-Interest Income for the Years Ended December 31, 2016 and 2015. Our non-interest income was $46.5 million for the year ended December 31, 2016, an increase of $11.0 million, or 31.1%, from $35.5 million for 2015, primarily related to increases in investment management fees, swap fees and unrealized net gain on swaps.
Bank Segment:
• | Swap fees increased $2.8 million for the year ended December 31, 2016, compared to 2015, driven by increases in customer demand for long-term interest rate protection. The level and frequency of income associated with swap transactions can vary materially from period to period, based on customers’ expectations of market conditions. |
• | The unrealized net gain on swaps was $731,000 higher for the year ended December 31, 2016, compared to 2015, driven by fluctuations in interest rates. |
Investment Management Segment:
• | Investment management fees increased $7.4 million for the year ended December 31, 2016, as compared to 2015, driven primarily by the additional eight months of revenue provided by the operations of TKG, which was acquired at the end of April 2016. Assets under management of $8.06 billion as of December 31, 2016, increased $50.0 million from December 31, 2015, primarily due to the TKG acquisition offset by the previously disclosed conclusion of a sub-advisory relationship announced in the fourth quarter of 2016. |
The following table presents the components of our non-interest income by operating segment for the years ended December 31, 2015 and 2014:
Year Ended December 31, 2015 | Year Ended December 31, 2014 | ||||||||||||||||||||||||
Investment | Parent | Investment | Parent | ||||||||||||||||||||||
(Dollars in thousands) | Bank | Management | and Other | Consolidated | Bank | Management | and Other | Consolidated | |||||||||||||||||
Investment management fees | $ | — | $ | 29,814 | $ | (196 | ) | $ | 29,618 | $ | — | $ | 25,219 | $ | (157 | ) | $ | 25,062 | |||||||
Service charges | 647 | — | — | 647 | 604 | — | — | 604 | |||||||||||||||||
Net gain on the sale and call of investment securities | 33 | — | — | 33 | 1,428 | — | — | 1,428 | |||||||||||||||||
Swap fees | 1,551 | — | — | 1,551 | 1,178 | — | — | 1,178 | |||||||||||||||||
Commitment and other fees | 2,022 | — | — | 2,022 | 2,045 | — | — | 2,045 | |||||||||||||||||
Unrealized net loss on swaps | (161 | ) | — | — | (161 | ) | (420 | ) | — | — | (420 | ) | |||||||||||||
Bank owned life insurance income | 1,696 | — | — | 1,696 | 1,441 | — | — | 1,441 | |||||||||||||||||
Other income | 85 | (8 | ) | — | 77 | 173 | 38 | — | 211 | ||||||||||||||||
Total non-interest income | $ | 5,873 | $ | 29,806 | $ | (196 | ) | $ | 35,483 | $ | 6,449 | $ | 25,257 | $ | (157 | ) | $ | 31,549 | |||||||
59
Non-Interest Income for the Years Ended December 31, 2015 and 2014. Our non-interest income was $35.5 million for the year ended December 31, 2015, an increase of $3.9 million, or 12.5%, from $31.5 million for the same period in 2014, primarily related to increases in investment management fees, swap fees, bank owned life insurance, and a decrease on the unrealized loss on swaps, partially offset by lower net gain on the sale and call of investment securities and a decrease in other income.
Bank Segment:
• | Net gain on the sale and call of investment securities was $33,000 for the year ended December 31, 2015, compared to $1.4 million for the same period in 2014. |
• | Swap fees increased $373,000 for the year ended December 31, 2015, compared to 2014, driven by fluctuations in customer demand for long-term interest rate protection. The level and frequency of income associated with swap transactions can vary materially from period to period, based on customers’ expectations of market conditions. |
• | The unrealized loss on swaps was $259,000 lower for the year ended December 31, 2015, compared to 2014, driven by fluctuations in interest rates. |
• | The income on bank owned life insurance increased $255,000 for the year ended December 31, 2015, compared to 2014, as a result of an increase in our investment in this product. |
• | Other income decreased $88,000 for the year ended December 31, 2015, compared to 2014, primarily due to lower gain on the sale of loans. |
Investment Management Segment:
• | Investment management fees were $29.8 million for the year ended December 31, 2015, which represents 12 months of revenue for Chartwell, as compared to $25.2 million for the year ended December 31, 2014, which represented only 10 months of revenue for Chartwell. Assets under management of $8.01 billion as of December 31, 2015, increased $291.0 million from December 31, 2014. |
Non-Interest Expense
Our non-interest expense represents the operating cost of maintaining and growing our business. The largest portion of non-interest expense for each segment is compensation and employee benefits, which include employee payroll expense as well as the cost of incentive compensation, benefit plans, health insurance and payroll taxes, all of which are impacted by the growth in our employee base, coupled with increases in the level of compensation and benefits of our existing employees. The information provided under the caption “Parent and Other” represents general operating expenses of the Company not considered to be a reportable segment, which includes the parent company activity as well as eliminations and adjustments that are necessary for purposes of reconciliation to the consolidated amounts.
60
The following table presents the components of our non-interest expense by operating segment for the years ended December 31, 2016 and 2015:
Year Ended December 31, 2016 | Year Ended December 31, 2015 | ||||||||||||||||||||||||
Investment | Parent | Investment | Parent | ||||||||||||||||||||||
(Dollars in thousands) | Bank | Management | and Other | Consolidated | Bank | Management | and Other | Consolidated | |||||||||||||||||
Compensation and employee benefits | $ | 32,247 | $ | 22,275 | $ | — | $ | 54,522 | $ | 29,237 | $ | 16,899 | $ | — | $ | 46,136 | |||||||||
Premises and occupancy costs | 3,859 | 1,006 | — | 4,865 | 3,774 | 775 | — | 4,549 | |||||||||||||||||
Professional fees | 2,928 | 1,060 | (138 | ) | 3,850 | 3,027 | 914 | (202 | ) | 3,739 | |||||||||||||||
FDIC insurance expense | 3,058 | — | — | 3,058 | 1,988 | — | — | 1,988 | |||||||||||||||||
General insurance expense | 745 | 292 | — | 1,037 | 871 | 195 | — | 1,066 | |||||||||||||||||
State capital shares tax | 1,394 | — | — | 1,394 | 1,081 | — | — | 1,081 | |||||||||||||||||
Travel and entertainment expense | 2,233 | 829 | — | 3,062 | 1,902 | 859 | — | 2,761 | |||||||||||||||||
Data processing expense | 1,153 | — | — | 1,153 | 1,073 | — | — | 1,073 | |||||||||||||||||
Charitable contributions | 957 | 39 | — | 996 | 975 | 46 | — | 1,021 | |||||||||||||||||
Intangible amortization expense | — | 1,753 | — | 1,753 | — | 1,558 | — | 1,558 | |||||||||||||||||
Change in fair value of acquisition earn out | — | (3,687 | ) | — | (3,687 | ) | — | — | — | — | |||||||||||||||
Other operating expenses (1) | 4,102 | 2,404 | 285 | 6,791 | 3,258 | 1,715 | 98 | 5,071 | |||||||||||||||||
Total non-interest expense | $ | 52,676 | $ | 25,971 | $ | 147 | $ | 78,794 | $ | 47,186 | $ | 22,961 | $ | (104 | ) | $ | 70,043 | ||||||||
Full-time equivalent employees (2) | 156 | 68 | — | 224 | 139 | 53 | — | 192 | |||||||||||||||||
(1) | Other operating expenses include such items as investor relations, investment management fees, telephone, marketing, loan-related expenses, employee-related expenses and other general operating expenses. |
(2) | Full-time equivalent employees shown are as of the end of the period presented. |
Non-Interest Expense for the Years Ended December 31, 2016 and 2015. Our non-interest expense for the year ended December 31, 2016, increased $8.8 million, or 12.5%, as compared to 2015, of which $5.5 million relates to the increase in expenses of the Bank segment and $3.0 million relates to the increase in expenses Investment Management segment. The significant changes in each segment’s expenses are described below.
Bank Segment:
• | Compensation and employee benefits of the Bank segment for the year ended December 31, 2016, increased by $3.0 million, compared to 2015, primarily due to an increase in the number of full-time equivalent employees, increases in the overall annual wage and benefits costs of our existing employees, and increases in incentive and stock-based compensation expenses. |
• | FDIC insurance expense for the year ended December 31, 2016, increased by $1.1 million, compared to 2015, due to the increase in assets and to the change in the FDIC assessment methodology effective in the third quarter of 2016. |
• | Other operating expenses for the year ended December 31, 2016, increased by $844,000 compared to 2015, primarily related to $223,000 of higher marketing expenses, $341,000 of higher costs related to servicing our private banking margin loans, and $113,000 of higher provision for unfunded commitments. |
Investment Management Segment:
• | There was a decrease to the fair value of the TKG acquisition earn out of $3.7 million for the year ended December 31, 2016, based on management’s final determination of the annualized run-rate EBITDA of TKG at December 31, 2016. For additional information, refer to Note 2, Business Combinations, to our consolidated financial statements. |
• | Excluding the earn out adjustment, Chartwell’s non-interest expenses for the year ended December 31, 2016, increased by $6.7 million, compared to the same period in 2015, primarily due to $4.9 million of eight months of additional expenses contributed by the operations of TKG, which was acquired at the end of April 2016. In addition, Chartwell’s compensation expenses were higher by $1.7 million for the year ended December 31, 2016, primarily due to an increase in the number of full-time equivalent employees, increases in the overall annual wage and benefits costs of our existing employees, and an increase in stock-based compensation expense. |
61
The following table presents the components of our non-interest expense by operating segment for the years ended December 31, 2015 and 2014:
Year Ended December 31, 2015 | Year Ended December 31, 2014 | ||||||||||||||||||||||||
Investment | Parent | Investment | Parent | ||||||||||||||||||||||
(Dollars in thousands) | Bank | Management | and Other | Consolidated | Bank | Management | and Other | Consolidated | |||||||||||||||||
Compensation and employee benefits | $ | 29,237 | $ | 16,899 | $ | — | $ | 46,136 | $ | 25,807 | $ | 15,241 | $ | — | $ | 41,048 | |||||||||
Premises and occupancy costs | 3,774 | 775 | — | 4,549 | 3,312 | 619 | — | 3,931 | |||||||||||||||||
Professional fees | 3,027 | 914 | (202 | ) | 3,739 | 3,234 | 306 | (109 | ) | 3,431 | |||||||||||||||
FDIC insurance expense | 1,988 | — | — | 1,988 | 1,928 | — | — | 1,928 | |||||||||||||||||
General insurance expense | 871 | 195 | — | 1,066 | 1,001 | 164 | — | 1,165 | |||||||||||||||||
State capital shares tax | 1,081 | — | — | 1,081 | 1,043 | — | — | 1,043 | |||||||||||||||||
Travel and entertainment expense | 1,902 | 859 | — | 2,761 | 1,829 | 575 | — | 2,404 | |||||||||||||||||
Data processing expense | 1,073 | — | — | 1,073 | 922 | — | — | 922 | |||||||||||||||||
Charitable contributions | 975 | 46 | — | 1,021 | 1,102 | 49 | — | 1,151 | |||||||||||||||||
Intangible amortization expense | — | 1,558 | — | 1,558 | — | 1,299 | — | 1,299 | |||||||||||||||||
Change in fair value of acquisition earn out | — | — | — | — | — | 1,614 | — | 1,614 | |||||||||||||||||
Other operating expenses (1) | 3,258 | 1,715 | 98 | 5,071 | 2,937 | 1,384 | 70 | 4,391 | |||||||||||||||||
Total non-interest expense | $ | 47,186 | $ | 22,961 | $ | (104 | ) | $ | 70,043 | $ | 43,115 | $ | 21,251 | $ | (39 | ) | $ | 64,327 | |||||||
Full-time equivalent employees (2) | 139 | 53 | — | 192 | 133 | 49 | — | 182 | |||||||||||||||||
(1) | Other operating expenses include such items as investor relations, investment management fees, telephone, marketing, loan-related expenses, employee-related expenses and other general operating expenses. |
(2) | Full-time equivalent employees shown are as of the end of the period presented. |
Non-Interest Expense for the Years Ended December 31, 2015 and 2014. Our non-interest expense for the year ended December 31, 2015, increased $5.7 million, or 8.9%, as compared to the same period in 2014, of which $4.1 million relates to the increase in expenses of the Bank segment and $1.7 million relates to the Investment Management segment, which commenced activity on March 5, 2014. The significant changes in each segment’s expenses are described below.
Bank Segment:
• | Compensation and employee benefits of the Bank segment for the year ended December 31, 2015, increased by $3.4 million, compared to the same period in 2014, primarily due to higher incentive compensation expenses as a result of higher net income for the Bank segment as compared to 2014. In addition, the year ended December 31, 2015, had an increase in the number of full-time equivalent employees, increases in the overall annual wage and benefits costs of our existing employees and an increase in stock-based compensation expenses. |
• | Premise and occupancy costs increased $462,000 for the year ended December 31, 2015, compared to the same period in 2014, primarily due to increase in rent expense and depreciation related to the expansion of the Pittsburgh office and the new lease for the New York City office. |
• | Professional fees decreased $207,000 for the year ended December 31, 2015, as compared to the same period in 2014, due to lower legal and compliance fees. |
• | Data processing expense increased by $151,000 for the year ended December 31, 2015, as compared to the same period in 2014, largely due to increased processing fees related to increased customer levels. |
• | Other operating expenses for the year ended December 31, 2015, increased by $321,000 compared to the same period in 2014, primarily related to $113,000 of higher marketing expenses and $313,000 of higher costs related to servicing our private banking margin loans, offset by $118,000 of lower loan-related expenses. |
Investment Management Segment:
• | For the year ended December 31, 2014, non-interest expense for the Investment Management segment included the $1.6 million acquisition earn out expense related to a one-time charge which was accrued and expensed in the fourth quarter of 2014 based upon the 2014 results for Chartwell. |
62
• | Chartwell’s non-interest expense, excluding the earn out adjustment, increased by $3.3 million for the year ended December 31, 2015, to $23.0 million which represented 12 months of Chartwell’s expenses as compared to $19.6 million in 2014, excluding the earn out, which represented only 10 months of expenses. |
◦ | Compensation expenses for the year ended December 31, 2015, are lower by approximately $1.4 million as compared to the same period in 2014 on an annualized basis, due to lower management fees driven by market depreciation. |
◦ | The increase in professional fees for the year ended December 31, 2015, are due to $601,000 in acquisition related expenses associated with the TKG transaction. |
Income Taxes
We utilize the asset and liability method of accounting for income taxes. Under this method, deferred tax assets and liabilities are recognized for the tax effects of differences between the financial statement and tax basis of assets and liabilities. Deferred tax assets and liabilities are measured using the enacted tax rates expected to apply to taxable income in the years in which those temporary differences are expected to be recovered or settled. The effect on deferred tax assets and liabilities with regard to a change in tax rates is recognized in income in the period that includes the enactment date. We evaluate whether it is more likely than not that we will be able to realize the benefit of identified deferred tax assets.
Income Taxes for the Years Ended December 31, 2016 and 2015. For the year ended December 31, 2016, we recognized income tax expense of $13.0 million, or 31.3% of income before tax, as compared to income tax expense of $10.9 million, or 32.6% of income before tax, for the same period in 2015. Our effective tax rate of 31.3% for the year ended December 31, 2016, decreased as compared to the prior year due to a higher level of tax credits recognized in 2016 versus 2015.
Income Taxes for the Years Ended December 31, 2015 and 2014. For the year ended December 31, 2015, we recognized income tax expense of $10.9 million, or 32.6% of income before tax, as compared to income tax expense of $7.0 million, or 30.4% of income before tax, for the same period in 2014. Our effective tax rate of 32.6% for the year ended December 31, 2015, increased as compared to the prior year as a result of higher income related to the Investment Management segment which carries a higher effective income tax rate.
Financial Condition
Our total assets as of December 31, 2016, totaled $3.93 billion, an increase of $628.3 million, or 19.0%, from December 31, 2015, which was primarily driven by growth in our loan portfolio. Our loan portfolio increased $559.8 million, or 19.7%, to $3.40 billion, as of December 31, 2016, from $2.84 billion, as of December 31, 2015. Total investment securities increased $13.1 million, or 5.8%, to $238.5 million, as of December 31, 2016, from $225.4 million, as of December 31, 2015, as a result of the net activity of purchases, sales and repayments of certain securities. Cash and cash equivalents increased $7.3 million, to $104.0 million, as of December 31, 2016, from $96.7 million, as of December 31, 2015. As of December 31, 2016, our total deposits of $3.29 billion increased $596.9 million, or 22.2%, from December 31, 2015, to fund loan growth. Net borrowings decreased $14.8 million, or 5.8%, to $239.5 million as of December 31, 2016, compared to $254.3 million as of December 31, 2015. Our shareholders’ equity increased $25.8 million to $351.8 million as of December 31, 2016, compared to $326.0 million as of December 31, 2015. This increase was primarily the result of $28.6 million in net income, the impact of $3.6 million in stock-based compensation, $2.7 million in stock options exercises and an increase of $2.3 million in other comprehensive income (loss), which represents the change in the unrealized gain on our investment portfolio (net of deferred taxes), partially offset by the cancellation of stock options of $6.2 million and the purchase of $5.1 million in treasury stock.
Our total assets as of December 31, 2015, totaled $3.30 billion which was an increase of $456.2 million, or 16.0%, from December 31, 2014, and was primarily due to growth in our loan portfolio. Our loan portfolio increased $441.2 million, or 18.4%, to $2.84 billion, as of December 31, 2015, from $2.40 billion, as of December 31, 2014. Total investment securities increased $13.5 million, or 6.4%, to $225.4 million, as of December 31, 2015, from $211.9 million, as of December 31, 2014, as a result of the net activity of purchases, sales and repayments of certain securities. Cash and cash equivalents decreased $9.0 million, to $96.7 million, as of December 31, 2015, from $105.7 million, as of December 31, 2014. Our total deposits increased $352.9 million, or 15.1%, to $2.69 billion as of December 31, 2015, to fund loan growth. Net borrowings increased $90.2 million, or 55.0%, to $254.3 million as of December 31, 2015, compared to $164.1 million as of December 31, 2014. Our shareholders’ equity increased $20.6 million to $326.0 million as of December 31, 2015, compared to $305.4 million as of December 31, 2014. This increase was primarily the result of $22.5 million in net income and the impact of $1.9 million in stock-based compensation, partially offset by the purchase of $3.2 million in treasury stock and a decrease of $816,000 in other comprehensive income (loss), which represents the change in the unrealized loss on our investment portfolio (net of deferred taxes).
63
Loans
The Bank’s primary source of income is interest on loans. Our loan portfolio primarily consists of loans to our private banking clients, commercial and industrial loans, and real estate loans secured by commercial real estate properties. The loan portfolio represents our largest earning asset. As of December 31, 2016, 88.6% of our loans have a floating rate.
The following table presents the composition of our loan portfolio as of the dates indicated:
December 31, | |||||||||||||||
(Dollars in thousands) | 2016 | 2015 | 2014 | 2013 | 2012 | ||||||||||
Private banking loans | $ | 1,735,928 | $ | 1,344,864 | $ | 989,302 | $ | 569,346 | $ | 435,882 | |||||
Middle-market banking loans: | |||||||||||||||
Commercial and industrial | 587,423 | 634,232 | 677,493 | 739,041 | 752,047 | ||||||||||
Commercial real estate | 1,077,703 | 862,188 | 733,257 | 552,388 | 453,699 | ||||||||||
Total middle-market banking loans | 1,665,126 | 1,496,420 | 1,410,750 | 1,291,429 | 1,205,746 | ||||||||||
Loans held-for-investment | $ | 3,401,054 | $ | 2,841,284 | $ | 2,400,052 | $ | 1,860,775 | $ | 1,641,628 | |||||
Loans held-for-investment. Loans held-for-investment increased by $559.8 million, or 19.7%, to $3.40 billion as of December 31, 2016, as compared to December 31, 2015. Our growth for the year ended December 31, 2016, was comprised of an increase in private banking loans of $391.1 million, or 29.1%, an increase in commercial real estate loans of $215.5 million, or 25.0%, and a decrease in commercial and industrial loans of $46.8 million, or 7.4%.
Loans held-for-investment increased by $441.2 million, or 18.4%, to $2.84 billion as of December 31, 2015, as compared to December 31, 2014. Our growth for the year ended December 31, 2015, was comprised of an increase in private banking loans of $355.6 million, or 35.9%, an increase in commercial real estate loans of $128.9 million, or 17.6%, and a decrease in commercial and industrial loans of $43.3 million, or 6.4%.
Primary Loan Categories
Private Banking Loans. Our private banking loans include personal and commercial loans that are sourced through our private banking channel of financial intermediaries, which operates on a national basis. These loans primarily consist of loans made to high-net-worth individuals, trusts and businesses that may be secured by cash, marketable securities, residential property or other financial assets. The primary source of repayment for these loans is the income and assets of the borrower. We also have a limited number of unsecured loans and lines of credit in our private banking loan portfolio.
As of December 31, 2016, private banking loans were approximately $1.74 billion, or 51.0% of loans held-for-investment, of which $1.58 billion, or 91.3%, were secured by cash and marketable securities. As of December 31, 2015, private banking loans were approximately $1.34 billion, or 47.3% of loans held-for-investment, of which $1.18 billion, or 87.8%, were secured by cash and marketable securities. Our private banking lines of credit are typically due on demand. The growth in loans secured by cash and marketable securities is expected to increase as a result of our strategy to focus on this portion of our private banking business as we believe these loans tend to have a lower risk profile and are typically zero risk-weighted for regulatory capital purposes. On a daily basis, we monitor the collateral of these margin loans secured by cash and marketable securities which further reduces the risk profile of the private banking portfolio. Since inception, we have had no charge-offs related to our loans secured by cash and marketable securities.
Loans sourced through our private banking channel also include loans for commercial and business purposes, a majority of which are secured by cash and marketable securities. The table below includes all loans made through our private banking channel, by collateral type, as of the dates indicated.
December 31, | |||||||||
(Dollars in thousands) | 2016 | 2015 | 2014 | ||||||
Private banking loans: | |||||||||
Secured by cash and marketable securities | $ | 1,584,373 | $ | 1,180,717 | $ | 803,453 | |||
Secured by real estate | 110,476 | 134,785 | 161,568 | ||||||
Other | 41,079 | 29,362 | 24,281 | ||||||
Total private banking loans | $ | 1,735,928 | $ | 1,344,864 | $ | 989,302 | |||
Middle-Market Banking: Commercial and Industrial Loans. Our commercial and industrial loan portfolio primarily includes loans made to service companies or manufacturers generally for the purpose of production, operating capacity, accounts receivable, inventory,
64
equipment financing, acquisitions and recapitalizations. Cash flow from the borrower’s operations is the primary source of repayment for these loans, except for certain commercial loans that are secured by cash and marketable securities.
As of December 31, 2016, our commercial and industrial loans comprised $587.4 million, or 17.3% of loans held-for-investment, compared to $634.2 million, or 22.4%, as of December 31, 2015.
Middle-Market Banking: Commercial Real Estate Loans. Our commercial real estate loan portfolio includes loans secured by commercial purpose real estate, including both owner occupied properties and investment properties for various purposes including office, retail, industrial, multifamily and hospitality. Also included are commercial construction loans to finance the construction or renovation of structures as well as to finance the acquisition and development of raw land for various purposes. Individual project cash flows, global cash flows and liquidity from the developer, or the sale of the property are the primary sources of repayment for these loans.
Commercial real estate loans as of December 31, 2016, totaled $1.08 billion, or 31.7% of loans held-for-investment, as compared to $862.2 million, or 30.3%, as of December 31, 2015. As of December 31, 2016, $901.5 million of total commercial real estate loans had a floating interest rate and $176.2 million had a fixed interest rate, as compared to $650.0 million and $212.2 million, respectively, as of December 31, 2015.
Loan Maturities and Interest Rate Sensitivity
The following table presents the contractual maturity ranges and the amount of such loans with fixed and adjustable rates in each maturity range as of the date indicated.
December 31, 2016 | ||||||||||||
(Dollars in thousands) | One Year or Less | One to Five Years | Greater Than Five Years | Total | ||||||||
Loan maturity: | ||||||||||||
Private banking | $ | 1,606,719 | $ | 78,173 | $ | 51,036 | $ | 1,735,928 | ||||
Commercial and industrial | 139,109 | 376,584 | 71,730 | 587,423 | ||||||||
Commercial real estate | 164,766 | 550,102 | 362,835 | 1,077,703 | ||||||||
Loans held-for-investment | $ | 1,910,594 | $ | 1,004,859 | $ | 485,601 | $ | 3,401,054 | ||||
Interest rate sensitivity: | ||||||||||||
Fixed interest rates | $ | 107,076 | $ | 158,837 | $ | 121,423 | $ | 387,336 | ||||
Floating or adjustable interest rates | 1,803,518 | 846,022 | 364,178 | 3,013,718 | ||||||||
Loans held-for-investment | $ | 1,910,594 | $ | 1,004,859 | $ | 485,601 | $ | 3,401,054 | ||||
Large Credit Relationships
We originate and maintain large credit relationships with numerous customers in the ordinary course of our business. We have established an informal limit on loans that is significantly lower than our legal lending limit of approximately $47.2 million as of December 31, 2016. Our present informal lending limit is $10.0 million based upon our total credit exposure to any one borrowing relationship. However, exceptions to this limit may be made based on the strength of the underlying credit, type and composition of the credit exposure, collateral support, structure of the credit facilities as well as the presence of other potential positive credit factors. As of December 31, 2016, our average commercial loan size was approximately $3.4 million and average private banking loan size was approximately $521,000.
The following table summarizes the aggregate committed and outstanding balances of our larger credit relationships as of December 31, 2016 and December 31, 2015.
December 31, 2016 | December 31, 2015 | ||||||||||||||
(Dollars in thousands) | Number of Relationships | Commitment (based on availability) | Outstanding Balance | Number of Relationships | Commitment (based on availability) | Outstanding Balance | |||||||||
Large credit relationships: | |||||||||||||||
>$25 million | 1 | $ | 25,827 | $ | 10,317 | 1 | $ | 40,958 | $ | 18,569 | |||||
>$20 million to $25 million | 7 | $ | 158,158 | $ | 130,745 | 6 | $ | 139,583 | $ | 106,760 | |||||
>$15 million to $20 million | 7 | $ | 122,316 | $ | 103,492 | 5 | $ | 82,823 | $ | 74,955 | |||||
>$10 million to $15 million | 31 | $ | 383,853 | $ | 285,167 | 29 | $ | 367,392 | $ | 270,707 | |||||
65
Approximately $367.5 million and $327.2 million of commitments to large credit relationships were fully secured by cash and marketable securities as of December 31, 2016 and December 31, 2015, respectively.
Loan Pricing
We generally extend variable-rate loans on which the interest rate fluctuations are based upon a predetermined indicator, such as the LIBOR or United States prime rate. Our use of variable-rate loans is designed to mitigate our interest rate risk to the extent that the rates that we charge on our variable-rate loans will rise or fall in tandem with rates that we must pay to acquire deposits and vice versa. As of December 31, 2016, approximately 88.6% of our loans had variable rates of which approximately 2.8% also had interest rates below their floors, which helps to preserve our interest rate spread.
Interest Reserve Loans
As of December 31, 2016, loans with interest reserves totaled $159.4 million, which represented 4.7% of loans held-for-investment, as compared to $117.4 million, or 4.1%, as of December 31, 2015, due to growth in the commercial real estate portfolio. Certain loans reserve a portion of the proceeds to be used to pay interest due on the loan. These loans with interest reserves are common for construction and land development loans. The use of interest reserves is based on the feasibility of the project, the creditworthiness of the borrower and guarantors, and the loan to value coverage of the collateral. The interest reserve may be used by the borrower, when certain financial conditions are met, to draw loan funds to pay interest charges on the outstanding balance of the loan. When drawn, the interest is capitalized and added to the loan balance, subject to conditions specified during the initial underwriting and at the time the credit is approved. We have effective and ongoing procedures and controls for monitoring compliance with loan covenants, for advancing funds and determining default conditions. In addition, most of our construction lending is performed within our geographic footprint and our lenders are familiar with trends in the local real estate market.
Allowance for Loan Losses
Our allowance for loan losses represents our estimate of probable loan losses inherent in the loan portfolio at a specific point in time. This estimate includes losses associated with specifically identified loans, as well as estimated probable credit losses inherent in the remainder of the loan portfolio. Additions are made to the allowance through both periodic provisions recorded to income and recoveries of losses previously incurred. Reductions to the allowance occur as loans are charged off or when the credit history of any of the three loan portfolios improves. Management evaluates the adequacy of the allowance quarterly. This evaluation is subjective and requires material estimates that may change over time. In addition, management evaluates the allowance for loan losses overall methodology and estimates used in the calculation on an annual basis.
The components of the allowance for loan losses represent estimates based upon ASC Topic 450, Contingencies, and ASC Topic 310, Receivables. ASC Topic 450 applies to homogeneous loan pools such as consumer installment, residential mortgages and consumer lines of credit, as well as commercial loans that are not individually evaluated for impairment under ASC Topic 310. ASC Topic 310 is applied to commercial and consumer loans that are individually evaluated for impairment.
Under ASC Topic 310, a loan is impaired, based upon current information and events, in management’s opinion, when it is probable that the loan will not be repaid according to its original contractual terms, including both principal and interest, or if a loan is designated as a Troubled Debt Restructuring (“TDR”). Management performs individual assessments of impaired loans to determine the existence of loss exposure based upon a discounted cash flows method or where a loan is collateral dependent, based upon the fair value of the collateral less estimated selling costs.
In estimating probable loan loss under ASC Topic 450 we consider numerous factors, including historical charge-offs and subsequent recoveries. We also consider, but are not limited to, qualitative factors that influence our credit quality, such as delinquency and non-performing loan trends, changes in loan underwriting guidelines and credit policies, as well as the results of internal loan reviews. Finally, we consider the impact of changes in current local and regional economic conditions in the markets that we serve. Assessment of relevant economic factors indicates that some of our primary markets historically tend to lag the national economy, with local economies in those primary markets also improving or weakening, as the case may be, but at a more measured rate than the national trends.
We base the computation of the allowance for loan losses under ASC Topic 450 on two factors: the primary factor and the secondary factor. The primary factor is based on the inherent risk identified within each of the Company’s three loan portfolios based on the historical loss experience of each loan portfolio and the loss emergence period. Management has developed a methodology that is applied to each of our three primary loan portfolios, consisting of commercial and industrial, commercial real estate and private banking. As the loan loss history, mix, and risk rating of each loan portfolio change, the primary factor adjusts accordingly. The allowance for loan losses related to the primary factor is based on our estimates as to probable losses for each loan portfolio. The secondary factor is intended to capture risks related to events and circumstances that management believes have an impact the performance of the loan portfolio. Although this factor is more subjective in nature, the methodology focuses on internal and external trends in pre-specified categories (risk factors)
66
and applies a quantitative percentage that drives the secondary factor. We have identified nine risk factors and each risk factor is assigned a reserve level, based on management’s judgment, as to the probable impact on each loan portfolio and is monitored on a quarterly basis. As the trend in each risk factor changes, a corresponding change occurs in the reserve associated with each respective risk factor, such that the secondary factor remains current to changes in each loan portfolio. Potential problem loans are identified and monitored through frequent, formal review processes. Updates are presented to our board of directors as to the status of loan quality monthly.
The following table summarizes the allowance for loan losses, as of the dates indicated:
December 31, | |||||||||||||||
(Dollars in thousands) | 2016 | 2015 | 2014 | 2013 | 2012 | ||||||||||
General reserves | $ | 11,823 | $ | 13,429 | $ | 14,690 | $ | 13,524 | $ | 13,440 | |||||
Specific reserves | 6,939 | 4,545 | 5,583 | 5,472 | 4,434 | ||||||||||
Total allowance for loan losses | $ | 18,762 | $ | 17,974 | $ | 20,273 | $ | 18,996 | $ | 17,874 | |||||
Allowance for loan losses to loans | 0.55 | % | 0.63 | % | 0.84 | % | 1.02 | % | 1.09 | % | |||||
As of December 31, 2016, we had specific reserves totaling $6.9 million related to four commercial and industrial loans and two unsecured private banking loans, with an aggregated total outstanding balance of $17.8 million. All of these loans were on non-accrual status as of December 31, 2016.
As of December 31, 2015, we had specific reserves totaling $4.5 million related to three commercial and industrial loans and two unsecured private banking loans, with an aggregated total outstanding balance of $12.5 million. All of these loans were on non-accrual status as of December 31, 2015.
The following tables summarize allowance for loan losses by loan category and percentage of loans, as of the dates indicated:
December 31, 2016 | December 31, 2015 | December 31, 2014 | December 31, 2013 | December 31, 2012 | |||||||||||||||||||||||||
(Dollars in thousands) | Reserve | Percent of Loans | Reserve | Percent of Loans | Reserve | Percent of Loans | Reserve | Percent of Loans | Reserve | Percent of Loans | |||||||||||||||||||
Private banking | $ | 1,424 | 51.0 | % | $ | 1,566 | 47.3 | % | $ | 2,017 | 41.2 | % | $ | 2,011 | 30.6 | % | $ | 2,804 | 26.6 | % | |||||||||
Commercial and industrial | 12,326 | 17.3 | % | 11,064 | 22.4 | % | 13,501 | 28.2 | % | 11,881 | 39.7 | % | 9,950 | 45.8 | % | ||||||||||||||
Commercial real estate | 5,012 | 31.7 | % | 5,344 | 30.3 | % | 4,755 | 30.6 | % | 5,104 | 29.7 | % | 5,120 | 27.6 | % | ||||||||||||||
Total allowance for loan losses | $ | 18,762 | 100.0 | % | $ | 17,974 | 100.0 | % | $ | 20,273 | 100.0 | % | $ | 18,996 | 100.0 | % | $ | 17,874 | 100.0 | % | |||||||||
Allowance for Loan Losses as of December 31, 2016 and 2015. Our allowance for loan losses was $18.8 million, or 0.55% of loans, as of December 31, 2016, as compared to $18.0 million, or 0.63% of loans, as of December 31, 2015, which reflects the change in complexion of our loan portfolio over the past year with a higher percentage of the portfolio in private banking loans secured by marketable securities and also a decline in our adverse-rated credits. Our allowance for loan losses related to commercial and industrial loans increased $1.3 million, to $12.3 million as of December 31, 2016, as compared to $11.1 million as of December 31, 2015, which was attributable to a net increase of specific reserves of $2.6 million on non-performing loans, partially offset by overall decreases in the commercial and industrial loan balances, in particular lower adverse-rated credits. Our allowance for loan losses related to commercial real estate loans decreased $332,000, to $5.0 million as of December 31, 2016, as compared to $5.3 million as of December 31, 2015, primarily due to the overall strong credit quality of this portfolio, partially offset by loan growth. Our allowance for loan losses related to private banking loans decreased $142,000, to $1.4 million as of December 31, 2016, as compared to $1.6 million as of December 31, 2015, which was attributable to lower specific reserves related to paydowns on non-performing loans, offset by growth in this portfolio.
Allowance for Loan Losses as of December 31, 2015 and 2014. Our allowance for loan losses decreased to $18.0 million, or 0.63% of loans, as of December 31, 2015, as compared to $20.3 million, or 0.84% of loans, as of December 31, 2014. Our allowance for loan losses related to commercial and industrial loans decreased $2.4 million, to $11.1 million as of December 31, 2015, as compared to $13.5 million as of December 31, 2014. This decrease was attributable to a decrease of $1.3 million in general reserve related primarily to payoffs from two substandard-rated loans, overall decreases in the commercial and industrial loan balances, and a decrease of $1.1 million to specific reserves comprised of net additions of $2.3 million on existing non-performing loans, offset by charge-offs of $3.4 million. Our allowance for loan losses related to commercial real estate loans increased $589,000, to $5.3 million as of December 31, 2015, as compared to $4.8 million as of December 31, 2014. Our allowance for loan losses related to private banking loans decreased $451,000, to $1.6 million as of December 31, 2015, as compared to $2.0 million as of December 31, 2014. During the year ended December 31, 2015, management made enhancements to the look-back period and loss emergence period used in the allowance for loan losses calculation to account for changes in the Company’s portfolio and related historical loss experience. The shift in the allowance for loan losses by portfolio is a result of these enhancements and is primarily due to the lower risk profile of the margin loans within the private banking portfolio and the lengthening of the loss emergence period for the commercial portfolios.
67
Our charge-off policy for commercial and private banking loans requires that loans and other obligations that are not collectible be promptly charged off in the month the loss becomes probable, regardless of the delinquency status of the loan. We recognize a partial charge-off when we have determined that the value of the collateral is less than the remaining ledger balance at the time of the evaluation. A loan or obligation is not required to be charged off, regardless of delinquency status, if (1) we have determined there exists sufficient collateral to protect the remaining loan balance and (2) there exists a strategy to liquidate the collateral. We may also consider a number of other factors to determine when a charge-off is appropriate, including: the status of a bankruptcy proceeding; the value of collateral and probability of successful liquidation; and the status of adverse proceedings or litigation that may result in collection.
The following table provides an analysis of the allowance for loan losses and net charge-offs for the years indicated:
Years Ended December 31, | |||||||||||||||
(Dollars in thousands) | 2016 | 2015 | 2014 | 2013 | 2012 | ||||||||||
Beginning balance | $ | 17,974 | $ | 20,273 | $ | 18,996 | $ | 17,874 | $ | 16,350 | |||||
Charge-offs: | |||||||||||||||
Private banking | — | — | — | (13 | ) | (999 | ) | ||||||||
Commercial and industrial | (4,258 | ) | (3,353 | ) | (9,521 | ) | (5,508 | ) | (3,000 | ) | |||||
Commercial real estate | — | — | — | (1,936 | ) | (2,868 | ) | ||||||||
Total charge-offs | (4,258 | ) | (3,353 | ) | (9,521 | ) | (7,457 | ) | (6,867 | ) | |||||
Recoveries: | |||||||||||||||
Private banking | — | 13 | 94 | — | — | ||||||||||
Commercial and industrial | 797 | 1,028 | 545 | 114 | 206 | ||||||||||
Commercial real estate | 3,411 | — | — | 278 | — | ||||||||||
Total recoveries | 4,208 | 1,041 | 639 | 392 | 206 | ||||||||||
Net charge-offs | (50 | ) | (2,312 | ) | (8,882 | ) | (7,065 | ) | (6,661 | ) | |||||
Provision for loan losses | 838 | 13 | 10,159 | 8,187 | 8,185 | ||||||||||
Ending balance | $ | 18,762 | $ | 17,974 | $ | 20,273 | $ | 18,996 | $ | 17,874 | |||||
Net loan charge-offs to average total loans | — | % | 0.09 | % | 0.41 | % | 0.41 | % | 0.43 | % | |||||
Provision for loan losses to average total loans | 0.03 | % | — | % | 0.47 | % | 0.47 | % | 0.53 | % | |||||
Net Charge-Offs for the Year Ended December 31, 2016. Our net loan charge-offs of $50,000, or 0.00% of average loans, for the year ended December 31, 2016, were comprised of a charge-off of $4.3 million on one commercial and industrial loan, partially offset by recoveries of $797,000 on six commercial and industrial loans and $3.4 million on one commercial real estate loan.
Net Charge-Offs for the Year Ended December 31, 2015. Our net loan charge-offs of $2.3 million, or 0.09% of average loans, for the year ended December 31, 2015, were comprised of a charge-off of $3.4 million on one commercial and industrial loan, partially offset by recoveries of $1.0 million on four commercial and industrial loans and $13,000 on one private banking loan.
Net Charge-Offs for the Year Ended December 31, 2014. Our net loan charge-offs of $8.9 million, or 0.41% of average loans, for the year ended December 31, 2014, were comprised of charge-offs of $9.5 million on six commercial and industrial loans, partially offset by recoveries of $545,000 on three commercial and industrial loans and $94,000 on one private banking loan.
For additional information on the changes in the allowance for loan losses by category for the years ended December 31, 2016, 2015 and 2014, refer to Note 6, Allowance for Loan Losses, to our consolidated financial statements.
Non-Performing Assets
Non-performing assets consist of non-performing loans and other real estate owned (“OREO”). Non-performing loans are loans that are on non-accrual status. OREO is real property acquired through foreclosure on the collateral underlying defaulted loans and including in-substance foreclosures. We record OREO at fair value, less estimated costs to sell the assets.
Our policy is to place loans in all categories on non-accrual status when collection of interest or principal is doubtful, or when interest or principal payments are 90 days or more past due. There were no loans 90 days or more past due and still accruing interest as of December 31, 2016, 2015 and 2014, and there was no interest income recognized on these loans, while on non-accrual, for the years ended December 31, 2016, 2015 and 2014. As of December 31, 2016, non-performing loans were $17.8 million, or 0.52% of total loans, compared to $16.7 million, or 0.59% of total loans, and $30.2 million, or 1.26% of total loans, as of December 31, 2015 and 2014, respectively. We had specific reserves of $6.9 million, $4.5 million and $5.6 million as of December 31, 2016, 2015 and 2014, respectively,
68
on these non-performing loans. The net loan balance of our non-performing loans was 40.5%, 38.0% and 51.3% of the original loan balance after payments, charge-offs and specific reserves as of December 31, 2016, 2015 and 2014, respectively.
For additional information on our non-performing loans for December 31, 2016, 2015 and 2014, refer to Note 6, Allowance for Loan Losses, to our consolidated financial statements.
Once the determination is made that a foreclosure is necessary, the loan is reclassified as “in-substance foreclosure” until a sale date and title to the property is finalized. Once we own the property, it is maintained, marketed, rented and sold to repay the original loan. Historically, foreclosure trends in our loan portfolio have been low due to the seasoning of our portfolio. Any loans that are modified or extended are reviewed for potential classification as a TDR loan. For borrowers that are experiencing financial difficulty, we complete a process that outlines the terms of the modification, the reasons for the proposed modification and documents the current status of the borrower.
We had non-performing assets of $22.0 million, or 0.56% of total assets, as of December 31, 2016, as compared to $18.4 million, or 0.56% of total assets, as of December 31, 2015. The increase in non-performing assets was the result of $11.8 million in additions and $8.2 million in reductions to non-performing assets in 2016. This increase was considered within the assessment of the determination of the allowance for loan losses. As of December 31, 2016, we had eight OREO properties totaling $4.2 million. During the year ended December 31, 2016, collateral related to an impaired loan (including multiple parcels) was transferred to OREO at a fair value of $3.6 million based on the appraised value, less estimated selling costs. In addition, a property was sold from other real estate owned for $1.1 million during the year ended December 31, 2016
We had non-performing assets of $18.4 million, or 0.56% of total assets, as of December 31, 2015, as compared to $31.6 million, or 1.11% of total assets, as of December 31, 2014. The decrease in non-performing assets was the result of $228,000 in additions and $13.4 million in reductions to non-performing assets in 2015. This decrease was considered within the assessment of the determination of the allowance for loan losses. As of December 31, 2015, we had three OREO properties which totaled $1.7 million.
The following table summarizes our non-performing assets as of the dates indicated:
December 31, | |||||||||||||||
(Dollars in thousands) | 2016 | 2015 | 2014 | 2013 | 2012 | ||||||||||
Non-performing loans: | |||||||||||||||
Private banking | $ | 517 | $ | 1,948 | $ | 2,069 | $ | 1,119 | $ | 947 | |||||
Commercial and industrial | 17,273 | 11,800 | 24,665 | 15,676 | 14,732 | ||||||||||
Commercial real estate | — | 2,912 | 3,498 | 3,498 | 6,804 | ||||||||||
Total non-performing loans | 17,790 | 16,660 | 30,232 | 20,293 | 22,483 | ||||||||||
Other real estate owned | 4,178 | 1,730 | 1,370 | 1,413 | 290 | ||||||||||
Total non-performing assets | $ | 21,968 | $ | 18,390 | $ | 31,602 | $ | 21,706 | $ | 22,773 | |||||
Non-performing troubled debt restructured loans (1) | $ | 17,273 | $ | 12,894 | $ | 14,107 | $ | 13,021 | $ | 4,210 | |||||
Performing troubled debt restructured loans | $ | 471 | $ | 510 | $ | 528 | $ | 527 | $ | 253 | |||||
Non-performing loans to total loans | 0.52 | % | 0.59 | % | 1.26 | % | 1.09 | % | 1.37 | % | |||||
Allowance for loan losses to non-performing loans | 105.46 | % | 107.89 | % | 67.06 | % | 93.61 | % | 79.50 | % | |||||
Non-performing assets to total assets | 0.56 | % | 0.56 | % | 1.11 | % | 0.95 | % | 1.10 | % | |||||
(1) | Included in total non-performing loans. |
Potential Problem Loans
Potential problem loans are those loans that are not categorized as non-performing loans, but where current information indicates that the borrower may not be able to comply with repayment terms. Among other factors, we monitor past due status as an indicator of credit deterioration and potential problem loans. A loan is considered past due when the contractual principal or interest due in accordance with the terms of the loan agreement remains unpaid after the due date of the scheduled payment. To the extent that loans become past due, we assess the potential for loss on such loans as we would with other problem loans and consider the effect of any potential loss in determining any provision for loan losses. We also assess alternatives to maximize collection of any past due loans, including and without limitation, restructuring loan terms, requiring additional loan guarantee(s) or collateral, or other planned action.
For additional information on the age analysis of past due loans segregated by class of loan for December 31, 2016 and 2015, refer to Note 6, Allowance for Loan Losses, to our consolidated financial statements.
69
On a monthly basis, we monitor various credit quality indicators for our loan portfolio, including delinquency, non-performing status, changes in risk ratings, changes in the underlying performance of the borrowers and other relevant factors.
We also monitor the loan portfolio through a formal periodic process. Generally, all commercial loans are reviewed quarterly. Loan risk ratings are assigned based upon the creditworthiness of the borrower. Loan risk ratings are reviewed on an ongoing basis according to internal policies. Loans within the pass rating are viewed to have a lower risk of loss than loans that are risk rated as special mention, substandard and doubtful, which are viewed to have an increasing risk of loss. Our internal risk ratings are consistent with regulatory guidance.
For additional information on the definitions of our internal risk rating and the recorded investment in loans by credit quality indicator for December 31, 2016 and 2015, refer to Note 6, Allowance for Loan Losses, to our consolidated financial statements.
Investment Securities
We utilize investment activities to enhance net interest income while supporting interest rate risk management and liquidity management. Our securities portfolio consists of available-for-sale securities, held-to-maturity securities and, from time to time, securities held for trading purposes. Also included in our investment securities is Federal Home Loan Bank Stock. For additional information on FHLB stock, refer to Notes 3, Investment Securities and 4, Federal Home Loan Bank Stock, to our consolidated financial statements. Securities purchased with the intent to sell under trading activity are recorded at fair value and changes to fair value are recognized in the consolidated statements of income. Securities categorized as available-for-sale are recorded at fair value and changes in the fair value of these securities are recognized as a component of total shareholders’ equity, within accumulated other comprehensive income (loss), net of deferred taxes. Securities categorized as held-to-maturity are debt securities that the Company intends to hold until maturity and are recorded at amortized cost.
On a quarterly basis, we determine the fair market value of our investment securities based on information provided by external sources. In addition, on a quarterly basis, we conduct an internal evaluation of changes in the fair market value of our investment securities to gain a level of comfort with the market value information received from the external sources.
Securities, like loans, are subject to interest rate and credit risk. In addition, by their nature, securities classified as available-for-sale are also subject to fair value risks that could negatively affect the level of liquidity available to us, as well as shareholders’ equity. The Bank has engaged Chartwell to provide securities portfolio advisory services, subject to the investment parameters set forth in our investment policy.
As of December 31, 2016 and December 31, 2015, we reported securities in available-for-sale and held-to-maturity categories. In general, fair value is based upon quoted market prices of identical assets, when available. Where sufficient data is not available to produce a fair valuation, fair value is based on broker quotes for similar assets. Quarterly, we validate the prices received from these third parties by comparing them to prices provided by a different independent pricing service. We have also reviewed the valuation methodologies provided to us by our pricing services. Broker quotes may be adjusted to ensure that financial instruments are recorded at fair value. Adjustments may include unobservable parameters, among other things.
We perform a quarterly review of our investment securities to identify those that may indicate other-than-temporary impairment (“OTTI”). Our policy for OTTI is based upon a number of factors, including but not limited to, the length of time and extent to which the estimated fair value has been less than cost, the financial condition of the underlying issuer, the ability of the issuer to meet contractual obligations, the likelihood of the investment security’s ability to recover any decline in its estimated fair value and for debt securities whether we intend to sell the investment security or if it is more likely than not that we will be required to sell the investment security prior to its recovery. If the financial markets experience deterioration, charges to income could occur in future periods as a result of OTTI determinations.
Our available-for-sale securities portfolio consists of U.S. government agency obligations, mortgage-backed securities, collateralized loan obligations, corporate bonds and single-issuer trust preferred securities, all with varying contractual maturities, and certain equity securities. Our held-to-maturity portfolio consists of certain municipal bonds and corporate bonds while our trading portfolio, when active, typically consists of U.S. Treasury Notes, also with varying contractual maturities. However, these maturities do not necessarily represent the expected life of the securities as the securities may be called or paid down without penalty prior to their stated maturities. The effective duration of our securities portfolio as of December 31, 2016, was approximately 1.6, where duration is defined as the approximate percentage change in price for a 100 basis point change in rates. No investment in any of these securities exceeds any applicable limitation imposed by law or regulation. Our Asset/Liability Management Committee (“ALCO”) reviews the investment portfolio on an ongoing basis to ensure that the investments conform to our investment policy.
Available-for-Sale Investment Securities. We held $174.9 million and $168.3 million in investment securities available-for-sale as of December 31, 2016 and December 31, 2015, respectively. The increase of $6.6 million was primarily attributable to the net activity of
70
purchases of $27.5 million, offset by repayments of $17.3 million and sales of $4.7 million of certain securities during the year ended December 31, 2016.
On a fair value basis, 67.0% of our available-for-sale investment securities as of December 31, 2016, were floating-rate securities for which yields increase or decrease based on changes in market interest rates. As of December 31, 2015, floating-rate securities comprised 74.3% of our available-for-sale investment securities.
On a fair value basis, 41.6% of our available-for-sale investment securities as of December 31, 2016, were agency securities, which tend to have a lower risk profile, while the remainder of the portfolio was comprised of certain corporate bonds, single-issuer trust preferred securities, non-agency commercial mortgage-backed securities and collateralized loan obligations, and certain equity securities. As of December 31, 2015, agency securities comprised 49.2% of our available-for-sale investment securities.
Held-to-Maturity Investment Securities. We held $53.9 million and $47.3 million in investment securities held-to-maturity as of December 31, 2016 and December 31, 2015, respectively. The increase of $6.7 million was primarily attributable to the net activity of purchases of $9.3 million, offset by a call of $2.5 million during the year ended December 31, 2016. As part of our asset and liability management strategy, we determined that we have the intent and ability to hold these bonds until maturity, and these securities were reported at amortized cost, as of December 31, 2016.
Trading Investment Securities. We held no investment securities trading as of December 31, 2016 and December 31, 2015. From time to time, we may identify opportunities in the marketplace to generate supplemental income from trading activity, principally based on the volatility of U.S. Treasury Notes with maturities up to ten years. The level and frequency of income generated from these transactions can vary materially based upon market conditions. During the year ended December 31, 2015, there was one purchase and subsequent sale of a U.S. Treasury security of $5.0 million.
The following tables summarize the amortized cost and fair value of investment securities available-for-sale and held-to-maturity, as of the dates indicated:
December 31, 2016 | ||||||||||||
(Dollars in thousands) | Amortized Cost | Gross Unrealized Appreciation | Gross Unrealized Depreciation | Estimated Fair Value | ||||||||
Investment securities available-for-sale: | ||||||||||||
Corporate bonds | $ | 53,902 | $ | 164 | $ | 21 | $ | 54,045 | ||||
Trust preferred securities | 17,711 | 159 | 72 | 17,798 | ||||||||
Non-agency mortgage-backed securities | 5,750 | 14 | — | 5,764 | ||||||||
Non-agency collateralized loan obligations | 16,234 | — | 54 | 16,180 | ||||||||
Agency collateralized mortgage obligations | 44,051 | 49 | 279 | 43,821 | ||||||||
Agency mortgage-backed securities | 24,107 | 240 | 198 | 24,149 | ||||||||
Agency debentures | 4,760 | 23 | — | 4,783 | ||||||||
Equity securities | 8,643 | — | 291 | 8,352 | ||||||||
Total investment securities available-for-sale | 175,158 | 649 | 915 | 174,892 | ||||||||
Investment securities held-to-maturity: | ||||||||||||
Corporate bonds | 28,693 | 596 | 30 | 29,259 | ||||||||
Municipal bonds | 25,247 | 88 | 96 | 25,239 | ||||||||
Total investment securities held-to-maturity | 53,940 | 684 | 126 | 54,498 | ||||||||
Total | $ | 229,098 | $ | 1,333 | $ | 1,041 | $ | 229,390 | ||||
71
December 31, 2015 | ||||||||||||
(Dollars in thousands) | Amortized Cost | Gross Unrealized Appreciation | Gross Unrealized Depreciation | Estimated Fair Value | ||||||||
Investment securities available-for-sale: | ||||||||||||
Corporate bonds | $ | 43,952 | $ | 18 | $ | 237 | $ | 43,733 | ||||
Trust preferred securities | 17,579 | — | 978 | 16,601 | ||||||||
Non-agency mortgage-backed securities | 5,756 | — | 13 | 5,743 | ||||||||
Non-agency collateralized loan obligations | 11,843 | — | 132 | 11,711 | ||||||||
Agency collateralized mortgage obligations | 49,544 | 92 | 265 | 49,371 | ||||||||
Agency mortgage-backed securities | 28,586 | 270 | 187 | 28,669 | ||||||||
Agency debentures | 4,719 | 13 | — | 4,732 | ||||||||
Equity securities | 8,358 | — | 599 | 7,759 | ||||||||
Total investment securities available-for-sale | 170,337 | 393 | 2,411 | 168,319 | ||||||||
Investment securities held-to-maturity: | ||||||||||||
Corporate bonds | 19,448 | 498 | 84 | 19,862 | ||||||||
Agency debentures | 2,453 | 19 | — | 2,472 | ||||||||
Municipal bonds | 25,389 | 377 | 1 | 25,765 | ||||||||
Total investment securities held-to-maturity | 47,290 | 894 | 85 | 48,099 | ||||||||
Total | $ | 217,627 | $ | 1,287 | $ | 2,496 | $ | 216,418 | ||||
December 31, 2014 | ||||||||||||
(Dollars in thousands) | Amortized Cost | Gross Unrealized Appreciation | Gross Unrealized Depreciation | Estimated Fair Value | ||||||||
Investment securities available-for-sale: | ||||||||||||
Corporate bonds | $ | 31,833 | $ | 3 | $ | 168 | $ | 31,668 | ||||
Trust preferred securities | 17,446 | — | 645 | 16,801 | ||||||||
Non-agency mortgage-backed securities | 11,617 | — | 32 | 11,585 | ||||||||
Agency collateralized mortgage obligations | 56,984 | 127 | 248 | 56,863 | ||||||||
Agency mortgage-backed securities | 32,564 | 502 | 186 | 32,880 | ||||||||
Agency debentures | 8,678 | 59 | — | 8,737 | ||||||||
Equity securities | 8,110 | — | 72 | 8,038 | ||||||||
Total investment securities available-for-sale | $ | 167,232 | $ | 691 | $ | 1,351 | $ | 166,572 | ||||
Investment securities held-to-maturity: | ||||||||||||
Corporate bonds | 14,452 | 335 | — | 14,787 | ||||||||
Agency debentures | 5,000 | 1 | — | 5,001 | ||||||||
Municipal bonds | 20,139 | 201 | 15 | 20,325 | ||||||||
Total investment securities held-to-maturity | 39,591 | 537 | 15 | 40,113 | ||||||||
Total | $ | 206,823 | $ | 1,228 | $ | 1,366 | $ | 206,685 | ||||
The change in the fair values of our municipal bonds, agency debentures, agency collateralized mortgage obligations and agency mortgage-backed securities are primarily the result of interest rate fluctuations. To assess for impairment on municipal bonds, corporate bonds, single-issuer trust preferred securities, non-agency mortgage-backed securities, non-agency collateralized loan obligations, and certain equity securities, management evaluates the underlying issuer’s financial performance and related credit rating information through a review of publicly available financial statements and other publicly available information. This review did not identify any issues related to the ultimate repayment of principal and interest on these securities. In addition, the Company has the ability and intent to hold debt securities in an unrealized loss position until recovery of their amortized cost. Based on this, the Company considers all of the unrealized losses to be temporary impairment losses.
The following table sets forth the fair value, contractual maturities and approximated weighted average yield, calculated on a fully taxable equivalent basis, based on estimated annual income divided by the average amortized cost of our available-for-sale and held-to-maturity debt securities portfolios as of December 31, 2016. Contractual maturities may differ from expected maturities because issuers and/or
72
borrowers may have the right to call or prepay obligations with or without call or prepayment penalties, which would also impact the corresponding yield.
December 31, 2016 | |||||||||||||||||||||||||||||
Less Than One Year | One to Five Years | Five to 10 Years | Greater Than 10 Years | Total | |||||||||||||||||||||||||
(Dollars in thousands) | Amount | Yield | Amount | Yield | Amount | Yield | Amount | Yield | Amount | Yield | |||||||||||||||||||
Investment securities available-for-sale: | |||||||||||||||||||||||||||||
Corporate bonds | $ | 19,494 | 1.79 | % | $ | 34,551 | 2.10 | % | $ | — | — | % | $ | — | — | % | $ | 54,045 | 1.99 | % | |||||||||
Trust preferred securities | — | — | % | — | — | % | — | — | % | 17,798 | 2.76 | % | 17,798 | 2.76 | % | ||||||||||||||
Non-agency mortgage-backed securities | — | — | % | — | — | % | — | — | % | 5,764 | 1.67 | % | 5,764 | 1.67 | % | ||||||||||||||
Non-agency collateralized loan obligation | — | — | % | — | — | % | 14,969 | 2.36 | % | 1,211 | 3.01 | % | 16,180 | 2.41 | % | ||||||||||||||
Agency collateralized mortgage obligations | — | — | % | 1,148 | 1.12 | % | — | — | % | 42,673 | 1.00 | % | 43,821 | 1.00 | % | ||||||||||||||
Agency mortgage-backed securities | — | — | % | — | — | % | — | — | % | 24,149 | 1.92 | % | 24,149 | 1.92 | % | ||||||||||||||
Agency debentures | — | — | % | — | — | % | 4,783 | 2.53 | % | — | — | % | 4,783 | 2.53 | % | ||||||||||||||
Total debt securities available-for-sale | 19,494 | 35,699 | 19,752 | 91,595 | 166,540 | ||||||||||||||||||||||||
Weighted average yield | 1.79 | % | 2.07 | % | 2.40 | % | 1.65 | % | 1.85 | % | |||||||||||||||||||
Investment securities held-to-maturity: | |||||||||||||||||||||||||||||
Corporate bonds | — | — | % | 5,251 | 6.38 | % | 24,008 | 5.34 | % | — | — | % | 29,259 | 5.52 | % | ||||||||||||||
Municipal bonds | — | — | % | 11,122 | 2.30 | % | 13,198 | 2.87 | % | 919 | 3.55 | % | 25,239 | 2.65 | % | ||||||||||||||
Total debt securities held-to-maturity | — | 16,373 | 37,206 | 919 | 54,498 | ||||||||||||||||||||||||
Weighted average yield | — | % | 3.56 | % | 4.46 | % | 3.55 | % | 4.17 | % | |||||||||||||||||||
Total debt securities | $ | 19,494 | $ | 52,072 | $ | 56,958 | $ | 92,514 | $ | 221,038 | |||||||||||||||||||
Weighted average yield | 1.79 | % | 2.54 | % | 3.74 | % | 1.67 | % | 2.42 | % | |||||||||||||||||||
The table above excludes equity securities because they have an indefinite life. For additional information regarding our investment securities portfolios, refer to Note 3, Investment Securities, to our consolidated financial statements.
Deposits
Deposits are our primary source of funds to support our earning assets, and we source deposits through multiple channels. We have focused on creating and growing diversified, stable, and low all-in cost deposit channels without operating through a traditional branch network. These sources primarily include deposits from high-net-worth individuals, family offices, trust companies, wealth management firms, middle-market businesses and their executives, and other financial institutions. We compete for deposits by offering a range of products and services to our customers, at competitive rates. We believe that our deposit base is stable, diversified and provides a low all-in cost. We further believe we have the ability to attract new deposits, which is the primary source of funding our projected loan growth.
As of December 31, 2016, we consider approximately 80.0% of our total deposits to be relationship-based deposits. Some of our relationship-based deposits, including reciprocal certificates of deposit placed through Promontory’s CDARS® service and demand deposits placed through Promontory’s ICS® service, have been classified for regulatory purposes as brokered deposits.
73
The table below depicts average balances of and rates paid on our deposit portfolio broken out by deposit type, for the years ended December 31, 2016, 2015 and 2014.
Years Ended December 31, | |||||||||||||||||
2016 | 2015 | 2014 | |||||||||||||||
(Dollars in thousands) | Average Amount | Average Rate Paid | Average Amount | Average Rate Paid | Average Amount | Average Rate Paid | |||||||||||
Interest-bearing checking accounts | $ | 171,431 | 0.47 | % | $ | 107,292 | 0.41 | % | $ | 68,114 | 0.34 | % | |||||
Money market deposit accounts | 1,676,455 | 0.68 | % | 1,367,584 | 0.42 | % | 1,096,347 | 0.39 | % | ||||||||
Certificates of deposit | 874,615 | 0.87 | % | 898,336 | 0.75 | % | 880,513 | 0.70 | % | ||||||||
Total average interest-bearing deposits | 2,722,501 | 0.73 | % | 2,373,212 | 0.54 | % | 2,044,974 | 0.52 | % | ||||||||
Noninterest-bearing deposits | 170,573 | — | 149,567 | — | 133,733 | — | |||||||||||
Total average deposits | $ | 2,893,074 | 0.68 | % | $ | 2,522,779 | 0.51 | % | $ | 2,178,707 | 0.49 | % | |||||
Average Deposits for the Years Ended December 31, 2016 and 2015. For the year ended December 31, 2016, our average total deposits were $2.89 billion, representing an increase of $370.3 million, or 14.7%, from the same period in 2015. The deposit growth was driven by increases in noninterest and interest-bearing checking accounts and money market deposit accounts, partially offset by a decrease in certificates of deposit. Our average cost of interest-bearing deposits of 0.73%, for the year ended December 31, 2016, increased from 0.54%, for the same period in 2015, as average rates paid were higher in each deposit category. Average money market deposits increased to 61.6% of total average interest-bearing deposits, for the year ended December 31, 2016, from 57.6% for the same period in 2015. Average certificates of deposit decreased to 32.1% of total average interest-bearing deposits for the year ended December 31, 2016, compared to 37.9% for the same period in 2015. Average noninterest-bearing deposits increased $21.0 million, or 14.0%, from $149.6 million for the year ended December 31, 2015, to $170.6 million, for the same period in 2016, and the average cost of deposits increased 17 basis points to 0.68% for the year ended December 31, 2016, from 0.51% for the year ended December 31, 2015.
Average Deposits for the Years Ended December 31, 2015 and 2014. For the year ended December 31, 2015, our average total deposits were $2.52 billion, representing an increase of $344.1 million, or 15.8%, from the same period in 2014. The deposit growth was driven by increases in all deposit categories. Our average cost of interest-bearing deposits of 0.54%, for the year ended December 31, 2015, increased from 0.52%, for the same period in 2014, as average rates paid were higher in each deposit category and the average maturity of certificates of deposit was extended. Average money market deposits increased to 57.6% of total average interest-bearing deposits, for the year ended December 31, 2015, from 53.6% for the same period in 2014. Average certificates of deposit decreased to 37.9% of total average interest-bearing deposits for the year ended December 31, 2015, compared to 43.1% for the same period in 2014. Average noninterest-bearing deposits increased $15.8 million, or 11.8%, from $133.7 million for the year ended December 31, 2014, to $149.6 million, for the same period in 2015, and the average cost of deposits increased two basis points to 0.51% for the year ended December 31, 2015, from 0.49% for the year ended December 31, 2014.
Certificates of Deposit
Maturities of certificates of deposit of $100,000 or more outstanding are summarized below, as of the date indicated.
December 31, | |||
(Dollars in thousands) | 2016 | ||
Months to maturity: | |||
Three months or less | $ | 283,246 | |
Over three to six months | 236,040 | ||
Over six to 12 months | 176,722 | ||
Over 12 months | 145,044 | ||
Total | $ | 841,052 | |
Borrowings
Deposits are the primary source of funds for our lending and investment activities, as well as general business purposes. As an alternative source of liquidity, we may obtain advances from the Federal Home Loan Bank of Pittsburgh, sell investment securities subject to our obligation to repurchase them, purchase Federal funds or engage in overnight borrowings from the FHLB or our correspondent banks.
74
The following table presents certain information with respect to our outstanding borrowings, as of the following dates.
December 31, 2016 | December 31, 2015 | ||||||||||||||||||||||
(Dollars in thousands) | Amount | Rate | Maximum Balance at Any Month End | Average Balance During Year | Original Term | Amount | Rate | Maximum Balance at Any Month End | Average Balance During Year | Original Term | |||||||||||||
Daily FHLB borrowings | $ | 105,000 | 0.77% | $ | 260,000 | $ | 142,664 | 1-4 days | $ | 170,000 | 0.51% | $ | 170,000 | $ | 62,137 | 1-9 days | |||||||
Term FHLB borrowings: | |||||||||||||||||||||||
Issued 4/7/2014 | — | —% | — | — | — | 0.34% | 25,000 | 6,576 | 12 months | ||||||||||||||
Issued 4/7/2014 | — | —% | — | — | — | 0.38% | 25,000 | 10,822 | 14 months | ||||||||||||||
Issued 4/7/2014 | — | —% | — | — | — | 0.44% | 25,000 | 17,123 | 17 months | ||||||||||||||
Issued 5/5/2014 | — | —% | — | — | — | 0.33% | 25,000 | 2,397 | 9 months | ||||||||||||||
Issued 7/29/2015 | — | 0.61% | 25,000 | 14,754 | 12 months | 25,000 | 0.61% | 25,000 | 10,685 | 12 months | |||||||||||||
Issued 7/29/2015 | — | 0.72% | 25,000 | 20,970 | 15 months | 25,000 | 0.72% | 25,000 | 10,685 | 15 months | |||||||||||||
Issued 6/29/2016 | — | 0.66% | 100,000 | 24,863 | 3 months | — | —% | — | — | ||||||||||||||
Issued 9/29/2016 | — | 0.58% | 100,000 | 24,863 | 3 months | — | —% | — | — | ||||||||||||||
Issued 12/29/2016 | 100,000 | 0.85% | 100,000 | 820 | 3 months | — | —% | — | — | ||||||||||||||
Subordinated notes payable | 35,000 | 5.75% | 35,000 | 35,000 | 5 years | 35,000 | 5.75% | 35,000 | 35,000 | 5 years | |||||||||||||
Total borrowings outstanding | $ | 240,000 | 1.53% | $ | 645,000 | $ | 263,934 | $ | 255,000 | 1.26% | $ | 355,000 | $ | 155,425 | |||||||||
December 31, 2014 | |||||||||||||||||
(Dollars in thousands) | Amount | Rate | Maximum Balance at Any Month End | Average Balance During Year | Original Term | ||||||||||||
Daily FHLB borrowings | $ | 30,000 | 0.27% | $ | 60,000 | $ | 11,959 | 1-9 days | |||||||||
Term FHLB borrowings: | |||||||||||||||||
Issued 9/25/2012 | — | 0.42% | 20,000 | 14,630 | 2 years | ||||||||||||
Issued 4/7/2014 | 25,000 | 0.34% | 25,000 | 18,425 | 12 months | ||||||||||||
Issued 4/7/2014 | 25,000 | 0.38% | 25,000 | 18,425 | 14 months | ||||||||||||
Issued 4/7/2014 | 25,000 | 0.44% | 25,000 | 18,425 | 17 months | ||||||||||||
Issued 5/5/2014 | 25,000 | 0.33% | 25,000 | 16,506 | 9 months | ||||||||||||
Subordinated notes payable | 35,000 | 5.75% | 35,000 | 20,041 | 5 years | ||||||||||||
Total borrowings outstanding | $ | 165,000 | 1.50% | $ | 215,000 | $ | 118,411 | ||||||||||
In June 2016, the Company entered into a cash flow hedge derivative transaction to establish the interest rate paid on $100.0 million of the FHLB borrowings at an effective rate of 0.83% plus the difference between the 3-month FHLB advance rate and 3-month LIBOR for a period of three years. For additional information on the cash flow hedge, refer to Note 17, Derivatives and Hedging Activity, to our consolidated financial statements.
In June 2014, the Company completed a private placement of subordinated notes payable, raising $35.0 million. The subordinated notes have a term of 5 years at a fixed-rate of 5.75%. The proceeds qualified as Tier 2 capital for the holding company, under federal regulatory capital rules.
Liquidity
We evaluate liquidity both at the holding company level and at the Bank level. As of December 31, 2016, the Bank and Chartwell subsidiaries represent our only material assets. Our primary sources of funds at the parent company level are cash on hand, dividends paid to us from the Bank and Chartwell subsidiaries, and the net proceeds from the issuance of our debt or equity securities. As of
75
December 31, 2016, our primary liquidity needs at the parent company level were the semi-annual interest payments on the subordinated notes payable, funding of acquisitions and our share repurchase programs. All other liquidity needs were minimal and related solely to reimbursing the Bank for management, accounting and financial reporting services provided by bank personnel. During the year ended December 31, 2016, the parent company paid approximately $2.0 million related to interest payments on the subordinated notes, $11.3 million related to share repurchase programs, and $15.0 million related to the TKG acquisition. During the year ended December 31, 2015, the parent company paid approximately $17.2 million related to the Chartwell acquisition, $2.2 million related to interest payments on the subordinated notes and $3.4 million related to share repurchase programs. We believe that our cash on hand at the parent company level coupled with the dividend paying capacity of the Bank and Chartwell, were adequate to fund any foreseeable parent company obligations as of December 31, 2016. In addition, the holding company maintains an unsecured line of credit of $25.0 million with Texas Capital Bank. As of December 31, 2016, the full amount of this established line was available.
Our goal in liquidity management at the Bank level is to satisfy the cash flow requirements of depositors and borrowers, as well as our operating cash needs. These requirements include the payment of deposits on demand at their contractual maturity, the repayment of borrowings as they mature, the payment of our ordinary business obligations, the ability to fund new and existing loans and other funding commitments, and the ability to take advantage of new business opportunities. Our ALCO has established an asset/liability management policy designed to achieve and maintain earnings performance consistent with long-term goals while maintaining acceptable levels of interest rate risk, well capitalized regulatory status and adequate levels of liquidity. The ALCO has also established a contingency funding plan to address liquidity crisis conditions. The ALCO is designated as the body responsible for the monitoring and implementation of these policies. The ALCO, which includes members of executive management, reviews liquidity on a frequent basis and approves significant changes in strategies that affect balance sheet or cash flow positions.
Our principal sources of asset liquidity are cash, interest-earning deposits with other banks, federal funds sold, unpledged securities available-for-sale, loan repayments (scheduled and unscheduled), and earnings. Liability liquidity sources include a stable deposit base, the ability to renew maturing certificates of deposit, borrowing availability at the FHLB of Pittsburgh, unsecured lines with other financial institutions, access to the Promontory’s reciprocal CDARS® and ICS® deposits and other brokered deposits, and the ability to raise debt and equity. Customer deposits are an important source of liquidity which depends on the confidence of those customers in us, supported by our capital position and the protection provided by FDIC insurance.
We measure and monitor liquidity on an ongoing basis, which allows us to more effectively understand and react to trends in our balance sheet. In addition, the ALCO uses a variety of methods to monitor our liquidity position, including a liquidity gap, which measures potential sources and uses of funds over future periods. Policy guidelines have been established for a variety of liquidity-related performance metrics, such as net loans to deposits, brokered funding composition, cash to total loans and duration of certificates of deposit, among others, all of which are utilized in measuring and managing our liquidity position. The ALCO also performs contingency funding and capital stress analyses at least semi-annually to determine our ability to meet potential liquidity and capital needs under various stress scenarios.
We believe that our liquidity position continues to be strong due to our ability to generate strong growth in deposits, which is evidenced by our ratio of total deposits to total assets of 83.6%, 81.5% and 82.1% as of December 31, 2016, 2015 and 2014, respectively. As of December 31, 2016, we had available liquidity of $744.6 million, or 18.9% of total assets. These sources consisted of liquid assets (cash and cash equivalents, and investment securities available-for-sale and not pledged under the FHLB borrowing capacity), totaling $234.6 million, or 6.0% of total assets, coupled with secondary sources of liquidity (the ability to borrow from the FHLB and correspondent bank lines) totaling $509.9 million, or 13.0% of total assets. Available cash excludes pledged accounts for derivative and letter of credit transactions and the reserve balance requirement at the Federal Reserve.
The following table shows our available liquidity, by source, as of the dates indicated:
December 31, | |||||||||
(Dollars in thousands) | 2016 | 2015 | 2014 | ||||||
Available cash | $ | 64,816 | $ | 63,401 | $ | 77,215 | |||
Unpledged investment securities available-for-sale | 169,830 | 161,951 | 158,361 | ||||||
Net borrowing capacity | 509,906 | 299,057 | 364,205 | ||||||
Total liquidity | $ | 744,552 | $ | 524,409 | $ | 599,781 | |||
For the year ended December 31, 2016, we generated $30.1 million in cash from operating activities, compared to $31.7 million for the same period in 2015. This change in cash flow was primarily the result of an increase in net income of $6.2 million for the year ended December 31, 2016, offset by changes in working capital items largely related to timing.
Investing activities resulted in a net cash outflow of $596.1 million, for the year ended December 31, 2016, as compared to a net cash outflow of $465.1 million for the same period in 2015. The outflows for the year ended December 31, 2016, were primarily due to the
76
net loan growth of $564.6 million, $36.7 million for the purchase of investment securities and $14.1 million for the TKG acquisition net of cash, partially offset by proceeds from the sale of investment securities available-for-sale totaling $4.7 million and principal repayments and maturities of investments securities of $19.8 million. The outflows for the year ended December 31, 2015, were primarily due to $448.2 million in net loan growth and the purchase of investment securities of $51.1 million, partially offset by proceeds from the sale of investment securities available-for-sale totaling $11.8 million and principal repayments and maturities of investments securities of $27.8 million.
Financing activities resulted in a net inflow of $573.3 million for the year ended December 31, 2016, compared to a net inflow of $424.4 million for the same period in 2015, primarily as a result of the net growth in deposits of $596.9 million, partially offset by a decrease of $15.0 million in FHLB advances and payment of $11.3 million for share repurchase programs for the year ended December 31, 2016, compared to net growth of $352.9 million in deposits and an increase in FHLB advances of $90.0 million for the year ended December 31, 2015.
We continue to evaluate the potential impact on liquidity management by regulatory proposals, including those being established under the Dodd-Frank Act, as government regulators continue the final rule-making process.
Capital Resources
The access to and cost of funding for new business initiatives, the ability to engage in expanded business activities, the ability to pay dividends, the level of deposit insurance costs and the level and nature of regulatory oversight depend, in part, on our capital position.
The assessment of capital adequacy depends on a number of factors, including asset quality, liquidity, earnings performance, changing competitive conditions and economic forces. We seek to maintain a strong capital base to support our growth and expansion activities, to provide stability to current operations and to promote public confidence.
Shareholders’ Equity. Shareholders’ equity increased to $351.8 million as of December 31, 2016, compared to $326.0 million as of December 31, 2015. The $25.8 million increase during the year ended December 31, 2016, was attributable to net income of $28.6 million, the impact of $3.6 million in stock-based compensation, $2.7 million in stock options exercised and an increase of $2.3 million in accumulated other comprehensive income (loss), partially offset by the purchase of $5.1 million in treasury stock and $6.2 million in cancellation of stock options.
Shareholders’ equity increased to $326.0 million as of December 31, 2015, compared to $305.4 million as of December 31, 2014. The $20.6 million increase during the year ended December 31, 2015, was attributable to net income of $22.5 million, the impact of $1.9 million in stock-based compensation and $353,000 in stock options exercised, partially offset by the purchase of $3.2 million in treasury stock, a decrease of $816,000 in accumulated other comprehensive income (loss) and $229,000 in cancellation of stock options.
Regulatory Capital. As of December 31, 2016 and 2015, TriState Capital Holdings, Inc. and TriState Capital Bank were in compliance with all applicable regulatory capital requirements, and TriState Capital Bank was categorized as well capitalized for purposes of the FDIC’s prompt corrective action regulations. As we employ our capital and continue to grow our operations, our regulatory capital levels may decrease. However, we will monitor our capital in order to remain categorized as well capitalized under the applicable regulatory guidelines and in compliance with all regulatory capital standards applicable to us.
Basel III, which began phasing in on January 1, 2015, has replaced the existing regulatory capital rules for the Company and the Bank. The Basel III final rules required new minimum capital ratio standards, established a new common equity tier 1 to total risk-weighted assets ratio, subjected banking organizations to certain limitations on capital distributions and discretionary bonus payments and established a new standardized approach for risk weightings.
In addition, the final rules subject a banking organization to certain limitations on capital distributions and discretionary bonus payments to executive officers if the organization does not maintain a capital conservation buffer of risk-based capital ratios in an amount greater than 2.5% of its total risk-weighted assets. The implementation of the capital conservation buffer began on January 1, 2016, at 0.625% and will be phased in over a four-year period (increasing by that amount ratably on each subsequent January 1, until it reaches 2.5% on January 1, 2019).
77
The following tables present the actual capital amounts and regulatory capital ratios for the Company and the Bank as of the dates indicated:
December 31, 2016 | |||||||||||||||||
Actual | For Capital Adequacy Purposes | To be Well Capitalized Under Prompt Corrective Action Provisions | |||||||||||||||
(Dollars in thousands) | Amount | Ratio | Amount | Ratio | Amount | Ratio | |||||||||||
Total risk-based capital ratio | |||||||||||||||||
Company | $ | 325,122 | 12.66 | % | $ | 205,488 | 8.00 | % | N/A | N/A | |||||||
Bank | $ | 314,419 | 12.39 | % | $ | 203,030 | 8.00 | % | $ | 253,787 | 10.00 | % | |||||
Tier 1 risk-based capital ratio | |||||||||||||||||
Company | $ | 295,089 | 11.49 | % | $ | 154,116 | 6.00 | % | N/A | N/A | |||||||
Bank | $ | 298,093 | 11.75 | % | $ | 152,272 | 6.00 | % | $ | 203,030 | 8.00 | % | |||||
Common equity tier 1 risk-based capital ratio | |||||||||||||||||
Company | $ | 295,089 | 11.49 | % | $ | 115,587 | 4.50 | % | N/A | N/A | |||||||
Bank | $ | 298,093 | 11.75 | % | $ | 114,204 | 4.50 | % | $ | 164,962 | 6.50 | % | |||||
Tier 1 leverage ratio | |||||||||||||||||
Company | $ | 295,089 | 7.90 | % | $ | 149,369 | 4.00 | % | N/A | N/A | |||||||
Bank | $ | 298,093 | 8.04 | % | $ | 148,252 | 4.00 | % | $ | 185,316 | 5.00 | % | |||||
December 31, 2015 | |||||||||||||||||
Actual | For Capital Adequacy Purposes | To be Well Capitalized Under Prompt Corrective Action Provisions | |||||||||||||||
(Dollars in thousands) | Amount | Ratio | Amount | Ratio | Amount | Ratio | |||||||||||
Total risk-based capital ratio | |||||||||||||||||
Company | $ | 326,378 | 13.88 | % | $ | 188,176 | 8.00 | % | N/A | N/A | |||||||
Bank | $ | 310,624 | 13.35 | % | $ | 186,077 | 8.00 | % | $ | 232,596 | 10.00 | % | |||||
Tier 1 risk-based capital ratio | |||||||||||||||||
Company | $ | 287,072 | 12.20 | % | $ | 141,132 | 6.00 | % | N/A | N/A | |||||||
Bank | $ | 292,234 | 12.56 | % | $ | 139,558 | 6.00 | % | $ | 186,077 | 8.00 | % | |||||
Common equity tier 1 risk-based capital ratio | |||||||||||||||||
Company | $ | 287,072 | 12.20 | % | $ | 105,849 | 4.50 | % | N/A | N/A | |||||||
Bank | $ | 292,234 | 12.56 | % | $ | 104,668 | 4.50 | % | $ | 151,187 | 6.50 | % | |||||
Tier 1 leverage ratio | |||||||||||||||||
Company | $ | 287,072 | 9.05 | % | $ | 126,932 | 4.00 | % | N/A | N/A | |||||||
Bank | $ | 292,234 | 9.29 | % | $ | 125,870 | 4.00 | % | $ | 157,338 | 5.00 | % | |||||
Contractual Obligations and Commitments
The following table presents significant fixed and determinable contractual obligations of principal, interest and expenses that may require future cash payments as of the date indicated.
December 31, 2016 | |||||||||||||||
(Dollars in thousands) | One Year or Less | One to Three Years | Three to Five Years | Greater Than Five Years | Total | ||||||||||
Transaction deposits | $ | 2,162,692 | $ | 225,225 | $ | — | $ | — | $ | 2,387,917 | |||||
Certificates of deposit | 751,204 | 147,658 | — | — | 898,862 | ||||||||||
Borrowings outstanding | 205,000 | 35,000 | — | — | 240,000 | ||||||||||
Interest payments on certificates of deposit and borrowings | 9,969 | 7,433 | — | — | 17,402 | ||||||||||
Operating leases | 2,243 | 4,785 | 3,610 | 1,342 | 11,980 | ||||||||||
Commitments for low income housing tax credits | 3,725 | 9,441 | 155 | 54 | 13,375 | ||||||||||
Total contractual obligations | $ | 3,134,833 | $ | 429,542 | $ | 3,765 | $ | 1,396 | $ | 3,569,536 | |||||
78
Off-Balance Sheet Arrangements
In the normal course of business, we enter into various transactions that are not included in our consolidated balance sheets in accordance with GAAP. These transactions include commitments to extend credit in the ordinary course of business to approved customers.
Loan commitments are recorded on our financial statements as they are funded. Commitments generally have fixed expiration dates or other termination clauses and may require payment of a fee. Loan commitments include unused commitments for open end lines secured by cash and marketable securities and residential properties, commitments to fund loans secured by commercial real estate, construction loans, business lines of credit and other unused commitments of loans in various stages of funding.
Standby letters of credit are written conditional commitments issued by us to guarantee the performance of our customer to a third party. In the event our customer does not perform in accordance with the terms of the agreement with the third party, we would be required to fund the commitment. The maximum potential amount of future payments we could be required to make is represented by the contractual amount of the commitment. If the commitment is funded, we would be entitled to seek recovery from the customer.
We minimize our exposure to loss under loan commitments and standby letters of credit by subjecting them to credit approval and monitoring procedures. The effect on our revenues, expenses, cash flows and liquidity of the unused portions of these commitments cannot be reasonably predicted because, while the borrower has the ability to draw upon these commitments at any time, these commitments often expire without being drawn upon. There is no guarantee that the lines of credit will be used.
The following table is a summary of the total notional amount of unused loan commitments and standby letters of credit outstanding, based on the availability of eligible collateral or other terms under the loan agreement, as of the date indicated.
December 31, 2016 | |||||||||||||||
(Dollars in thousands) | One Year or Less | One to Three Years | Three to Five Years | Greater Than Five Years | Total | ||||||||||
Unused loan commitments | $ | 1,408,465 | $ | 155,143 | $ | 83,328 | $ | 24,599 | $ | 1,671,535 | |||||
Standby letters of credit | 42,334 | 25,776 | 9,211 | 106 | 77,427 | ||||||||||
Total off-balance sheet arrangements | $ | 1,450,799 | $ | 180,919 | $ | 92,539 | $ | 24,705 | $ | 1,748,962 | |||||
Market Risk
Market risk refers to potential losses arising from changes in interest rates, foreign exchange rates, equity prices and commodity prices. Our primary component of market risk is interest rate volatility. Fluctuations in interest rates will ultimately impact the level of both income and expense recorded on most of our assets and liabilities, and the market value of all interest-earning assets and interest-bearing liabilities, other than those that have a short term to maturity. Because of the nature of our operations, we are not subject to foreign exchange or commodity price risk. From time to time we do hold market risk sensitive instruments for trading purposes. The summary information provided in this section should be read in conjunction with our consolidated financial statements and related notes.
Interest rate risk is comprised of re-pricing risk, basis risk, yield curve risk and option risk. Re-pricing risk arises from differences in the cash flow or re-pricing between asset and liability portfolios. Basis risk arises when asset and liability portfolios are related to different market rate indexes, which do not always change by the same amount or at the same time. Yield curve risk arises when asset and liability portfolios are related to different maturities on a given yield curve; when the yield curve changes shape, the risk position is altered. Option risk arises from embedded options within asset and liability products as certain borrowers have the option to prepay their loans when rates fall, while certain depositors can redeem their certificates when rates rise.
Our ALCO actively measures and manages interest rate risk. The ALCO is responsible for the formulation and implementation of strategies to improve balance sheet positioning and earnings, and reviewing our interest rate sensitivity position. This involves devising policy guidelines, risk measures and limits, and managing the amount of interest rate risk and its effect on net interest income and capital.
We utilize an asset/liability model to measure and manage interest rate risk. The specific measurement tools used by management on at least a quarterly basis include net interest income simulation, economic value of equity and gap analysis. All are static measures that do not incorporate assumptions regarding future business. All are also measures of interest rate sensitivity used to help us develop strategies for managing exposure to interest rate risk rather than projecting future earnings.
In our view, all three measures also have specific benefits and shortcomings. Net interest income (“NII”) simulation explicitly measures exposure to earnings from changes in market rates of interest but does not provide a long-term view. Economic value of equity (“EVE”) helps identify changes in optionality and price over a longer term horizon but its liquidation perspective does not convey the earnings-
79
based measures that are typically the focus of managing and valuing a going concern. Gap analysis compares the difference between the amount of interest-earning assets and interest-bearing liabilities subject to re-pricing over a period of time but only captures a single rate environment. Reviewing these various measures collectively helps management obtain a comprehensive view of our interest risk rate profile.
The following NII simulation and EVE metrics were calculated using rate shocks which represent immediate rate changes that move all market rates by the same amount instantaneously. The variance percentages represent the change between the NII simulation and EVE calculated under the particular rate scenario versus the NII simulation and EVE calculated assuming market rates as of the dates indicated.
December 31, 2016 | December 31, 2015 | |||||||||||
(Dollars in thousands) | Amount Change from Base Case | Percent Change from Base Case | ALCO Guidelines | Amount Change from Base Case | Percent Change from Base Case | |||||||
Net interest income: | ||||||||||||
+300 | $ | 25,570 | 30.48 | % | -20.00% | $ | 14,120 | 19.25 | % | |||
+200 | $ | 16,986 | 20.25 | % | -15.00% | $ | 9,306 | 12.69 | % | |||
+100 | $ | 8,431 | 10.05 | % | -10.00% | $ | 4,454 | 6.07 | % | |||
–100 | $ | (3,836 | ) | (4.57 | )% | -10.00% | $ | 140 | 0.19 | % | ||
Economic value of equity: | ||||||||||||
+300 | $ | 6,027 | 1.82 | % | +/-30.00% | $ | (11,238 | ) | (3.56 | )% | ||
+200 | $ | 4,201 | 1.27 | % | +/-20.00% | $ | (9,625 | ) | (3.05 | )% | ||
+100 | $ | 2,095 | 0.63 | % | +/-10.00% | $ | (3,655 | ) | (1.16 | )% | ||
–100 | $ | (11,980 | ) | (3.61 | )% | +/-10.00% | $ | 502 | 0.16 | % | ||
Given the relatively low current interest rate environment, it is our strategy to continue to manage an asset sensitive interest rate risk position in both our net interest income and our economic value of equity measures as shown in the table above as of December 31, 2016. Therefore, rising rates are expected to have a positive effect on both net interest income and economic value of equity as compared to a situation where rates remain unchanged.
80
The following gap analysis presents the amounts of interest-earning assets and interest-bearing liabilities that are subject to re-pricing within the periods indicated.
Interest Rate Sensitivity Period | ||||||||||||||||||||||||
December 31, 2016 | ||||||||||||||||||||||||
(Dollars in thousands) | Less Than 90 Days | 91 to 180 Days | 181 to 365 Days | One to Three Years | Three to Five Years | Greater Than Five Years | Non-Sensitive | Total Balance | ||||||||||||||||
Assets: | ||||||||||||||||||||||||
Interest-earning deposits | $ | 96,244 | $ | — | $ | — | $ | — | $ | — | $ | — | $ | — | $ | 96,244 | ||||||||
Federal funds sold | 7,567 | — | — | — | — | — | — | 7,567 | ||||||||||||||||
Total investment securities | 133,821 | 538 | 5,492 | 43,909 | 14,200 | 41,048 | (535 | ) | 238,473 | |||||||||||||||
Total loans | 3,022,312 | 31,737 | 61,525 | 182,671 | 77,413 | 10,098 | 15,298 | 3,401,054 | ||||||||||||||||
Other assets | — | — | — | — | — | — | 187,119 | 187,119 | ||||||||||||||||
Total assets | $ | 3,259,944 | $ | 32,275 | $ | 67,017 | $ | 226,580 | $ | 91,613 | $ | 51,146 | $ | 201,882 | $ | 3,930,457 | ||||||||
Liabilities: | ||||||||||||||||||||||||
Transaction deposits | $ | 1,836,757 | $ | 43,148 | $ | 52,561 | $ | 225,225 | $ | — | $ | — | $ | 230,226 | $ | 2,387,917 | ||||||||
Certificates of deposit | 311,913 | 245,655 | 193,636 | 147,658 | — | — | — | 898,862 | ||||||||||||||||
Borrowings, net | 105,000 | — | — | 135,000 | — | — | (490 | ) | 239,510 | |||||||||||||||
Other liabilities | — | — | — | — | — | — | 52,361 | 52,361 | ||||||||||||||||
Total liabilities | 2,253,670 | 288,803 | 246,197 | 507,883 | — | — | 282,097 | 3,578,650 | ||||||||||||||||
Equity | — | — | — | — | — | — | 351,807 | 351,807 | ||||||||||||||||
Total liabilities and equity | $ | 2,253,670 | $ | 288,803 | $ | 246,197 | $ | 507,883 | $ | — | $ | — | $ | 633,904 | $ | 3,930,457 | ||||||||
Interest rate sensitivity gap | $ | 1,006,274 | $ | (256,528 | ) | $ | (179,180 | ) | $ | (281,303 | ) | $ | 91,613 | $ | 51,146 | $ | (432,022 | ) | ||||||
Cumulative interest rate sensitivity gap | $ | 1,006,274 | $ | 749,746 | $ | 570,566 | $ | 289,263 | $ | 380,876 | $ | 432,022 | ||||||||||||
Cumulative interest rate sensitive assets to rate sensitive liabilities | 144.7 | % | 129.5 | % | 120.5 | % | 108.8 | % | 111.6 | % | 113.1 | % | 109.8 | % | ||||||||||
Cumulative gap to total assets | 25.6 | % | 19.1 | % | 14.5 | % | 7.4 | % | 9.7 | % | 11.0 | % | ||||||||||||
The cumulative twelve-month ratio of interest rate sensitive assets to interest rate sensitive liabilities increased to 120.5% as of December 31, 2016, as compared to 111.0% as of December 31, 2015.
In June 2016, the Company entered into a cash flow hedge derivative transaction to fix the interest rate on $100.0 million of the Company’s borrowings for a period of three years. This transaction has the effect on our gap analysis of moving $100.0 million of borrowings from the less than 90 day maturity bucket to the one to three years maturity bucket. For additional information on the cash flow hedge, refer to Note 17, Derivatives and Hedging Activity, to our consolidated financial statements.
Additionally, in all of these analyses (NII, EVE and gap), we use what we believe is a conservative treatment of non-maturity, interest-bearing deposits. In our gap analysis, the allocation of non-maturity, interest-bearing deposits is fully reflected in the less than 90 days maturity category. The allocation of non-maturity, noninterest-bearing deposits is fully reflected in the non-sensitive category. In taking this approach, we provide ourselves with no benefit to either NII or EVE from a potential time-lag in the rate increase of our non-maturity, interest-bearing deposits.
Impact of Inflation
Our financial statements and related data presented herein have been prepared in accordance with GAAP, which requires the measure of financial position and operating results in terms of historic dollars, without considering changes in the relative purchasing power of money over time due to inflation.
81
Inflation generally increases the costs of funds and operating overhead, and to the extent loans and other assets bear variable rates, the yields on such assets. Unlike most industrial companies, virtually all of the assets and liabilities of a financial institution are monetary in nature. As a result, interest rates generally have a more significant effect on the performance of a financial institution than the effects of general levels of inflation. In addition, inflation affects a financial institution’s cost of goods and services purchased, the cost of salaries and benefits, occupancy expense and similar items. Inflation and related increases in interest rates generally decrease the market value of investments and loans held and may adversely affect liquidity, earnings and shareholders’ equity.
Application of Critical Accounting Policies and Estimates
The discussion and analysis of our financial condition and results of operations are based on our consolidated financial statements, which have been prepared in accordance with GAAP and with general practices within the financial services industry. The preparation of financial statements in conformity with GAAP requires us to make estimates and assumptions that affect the reported amounts of certain assets and liabilities, disclosure of contingent assets and liabilities and the reported amount of related revenues and expenses. Although our current estimates contemplate current conditions and how we expect them to change in the future, it is reasonably possible that actual conditions could be worse than anticipated in those estimates, which could materially affect the financial results of our operations and financial condition.
Our most significant accounting policies are presented in Part II, Item 8, Note 1, Summary of Significant Accounting Policies, in this Report. These policies, along with the disclosures presented in the Notes to Consolidated Financial Statements, provide information on how significant assets and liabilities are valued in the Consolidated Financial Statements and how those values are determined.
Certain accounting policies inherently are based to a greater extent on estimates, assumptions and judgments of management and, as such, have a greater possibility of producing results that could be materially different than originally reported. Management views critical accounting policies to be those which are highly dependent on subjective or complex judgments, estimates and assumptions and where changes in those estimates and assumptions could have a significant impact on our consolidated financial statements. Management currently views the following accounting policies and estimates as critical accounting policies: investment securities, allowance for loan losses, goodwill and other intangible assets, income taxes, and fair value measurement.
Investment Securities. The Company’s investments are classified as either: (1) held-to-maturity – debt securities that the Company intends to hold until maturity and are reported at amortized cost; (2) trading securities – debt and certain equity securities bought and held principally for the purpose of selling them in the near term and reported at fair value, with unrealized gains and losses included in earnings; or (3) available-for-sale – debt and certain equity securities not classified as either held-to-maturity or trading securities and reported at fair value, with unrealized gains and losses reported as a component of accumulated other comprehensive income (loss), on an after-tax basis.
The cost of securities sold is determined on a specific identification basis. Amortization of premiums and accretion of discounts are recorded as interest income from investments over the life of the security utilizing the level yield method. We evaluate impaired investment securities quarterly to determine if impairments are temporary or other-than-temporary. For impaired debt and equity securities, management first determines whether it intends to sell or if it is more-likely than not that it will be required to sell the impaired securities. This determination considers current and forecasted liquidity requirements, regulatory and capital requirements, and securities portfolio management. If the Company intends to sell a security with a fair value below amortized cost or if it is more-likely than not that it will be required to sell such a security before recovery, an other-than-temporary impairment (“OTTI”) charge is recorded through current period earnings for the full decline in fair value below amortized cost. For debt securities that the Company does not intend to sell or it is more likely than not that it will not be required to sell before recovery, an OTTI charge is recorded through current period earnings for the amount of the valuation decline below amortized cost that is attributable to credit losses. The remaining difference between the security’s fair value and amortized cost (that is, the decline in fair value not attributable to credit losses) is recognized in other comprehensive income (loss), in the consolidated statements of comprehensive income as well as the shareholders’ equity section of the consolidated statements of financial condition, on an after-tax basis. For equity securities an OTTI charge is recorded through current period earnings for the full decline in fair value below cost.
Allowance for Loan Losses. The allowance for loan losses is established through provisions for loan losses that are recorded to income. Loans are charged off against the allowance for loan losses when management believes that the principal is uncollectible. If, at a later time, amounts are recovered with respect to loans previously charged off, the recovered amount is credited to the allowance for loan losses.
The allowance was appropriate, in management’s judgment, to cover probable losses inherent in the loan portfolio as of December 31, 2016 and 2015. Management’s judgment takes into consideration general economic conditions, diversification and seasoning of the loan portfolio, historic loss experience, identified credit problems, delinquency levels and adequacy of collateral. Although management believes it has used the best information available to it in making such determinations, and that the present allowance for loan losses is adequate, future adjustments to the allowance may be necessary, and net income may be adversely affected if circumstances differ
82
substantially from the assumptions used in determining the level of the allowance. In addition, as an integral part of their periodic examination, certain regulatory agencies review the adequacy of the Bank’s allowance for loan losses and may direct the Bank to make additions to the allowance based on their judgments about information available to them at the time of their examination.
The components of the allowance for loan losses represent estimates based upon Accounting Standards Codification (“ASC”) Topic 450, Contingencies, and ASC Topic 310, Receivables. ASC Topic 450 applies to homogeneous loan pools such as consumer installment, residential mortgages, consumer lines of credit and commercial loans that are not individually evaluated for impairment under ASC Topic 310. ASC Topic 310 is applied to commercial and consumer loans that are individually evaluated for impairment.
Under ASC Topic 310, a loan is impaired, based upon current information and events, in management’s opinion, when it is probable that the loan will not be repaid according to its original contractual terms, including both principal and interest, or if a loan is designated as a TDR. Management performs individual assessments of impaired loans to determine the existence of loss exposure based upon a discounted cash flows method or where a loan is collateral dependent, based upon the fair value of the collateral less estimated selling costs.
In estimating probable loan loss under ASC Topic 450 management considers numerous factors, including historical charge-offs and subsequent recoveries. Management also considers, but is not limited to, qualitative factors that influence our credit quality, such as delinquency and non-performing loan trends, changes in loan underwriting guidelines and credit policies, as well as the results of internal loan reviews. Finally, management considers the impact of changes in current local and regional economic conditions in the markets that we serve. Assessment of relevant economic factors indicates that some of the Company’s primary markets historically tend to lag the national economy, with local economies in our primary market areas also improving or weakening, as the case may be, but at a more measured rate than the national trends.
Management bases the computation of the allowance for loan losses under ASC Topic 450 on two factors: the primary factor and the secondary factor. The primary factor is based on the inherent risk identified by management within each of the Company’s three loan portfolios based on the historical loss experience of each loan portfolio and the loss emergence period. Management has developed a methodology that is applied to each of the three primary loan portfolios, consisting of commercial and industrial, commercial real estate and private banking. As the loan loss history, mix, and risk ratings of each loan portfolio change, the primary factor adjusts accordingly. The allowance for loan losses related to the primary factor is based on our estimates as to probable losses for each loan portfolio. The secondary factor is intended to capture risks related to events and circumstances that management believes have an impact on the performance of the loan portfolio. Although this factor is more subjective in nature, the methodology focuses on internal and external trends in pre-specified categories (risk factors) and applies a quantitative percentage that drives the secondary factor. There are nine risk factors and each risk factor is assigned a reserve level based on management’s judgment as to the probable impact of each risk factor on each loan portfolio and is monitored on a quarterly basis. As the trend in any risk factor changes, a corresponding change occurs in the reserve associated with each respective risk factor, such that the secondary factor remains current to changes in each loan portfolio.
The Company also maintains a reserve for losses on unfunded commitments. This reserve is reflected as a component of other liabilities and, in management’s judgment, is sufficient to cover probable losses inherent in the commitments. Management tracks the level and trends in unused commitments and takes into consideration the same factors as those considered for purposes of the allowance for loan losses on outstanding loans.
Goodwill and Other Intangible Assets. Goodwill represents the excess of the cost of an acquisition over the fair value of the net assets acquired. Goodwill is not amortized and is subject to at least annual assessments for impairment by applying a fair value based test. The Company reviews goodwill annually and again at any quarter-end if a material event occurs during the quarter that may affect goodwill. If goodwill testing is required, an assessment of qualitative factors can be completed before performing the two step goodwill impairment test. If an assessment of qualitative factors determines it is more likely than not that the fair value of a reporting unit exceeds its carrying amount, then the two step goodwill impairment test is not required. Goodwill is evaluated for potential impairment by determining if the fair value has fallen below carrying value.
Other intangible assets represent purchased assets that lack physical substance but can be distinguished from goodwill because of contractual or other legal rights. The Company has determined that certain of its acquired mutual fund client relationships meet the criteria to be considered indefinite-lived assets because the Company expects both the renewal of these contracts and the cash flows generated by these assets to continue indefinitely. Accordingly, the Company does not amortize these intangible assets, but instead reviews these assets annually or more frequently whenever events or circumstances occur indicating that the recorded indefinite-lived assets may be impaired. Each reporting period, the Company assesses whether events or circumstances have occurred which indicate that the indefinite life criteria are no longer met. If the indefinite life criteria are no longer met, the Company would assess whether the carrying value of these assets exceeds its fair value, an impairment loss would be recorded in an amount equal to any such excess and these assets would be reclassified to finite-lived. Other intangible assets that the Company has determined to have finite lives, such as trade name, client lists and non-compete agreements, are amortized over their estimated useful lives. These finite-lived intangible assets are amortized on a straight-line basis over their estimated useful lives, which range from four to twenty-five years. Finite-lived intangibles
83
are evaluated for impairment on an annual basis or more frequently whenever events or circumstances occur indicating that the carrying amount may not be recoverable.
Income Taxes. The Company utilizes the asset and liability method of accounting for income taxes. Under this method, deferred tax assets and liabilities are recognized for the tax effects of differences between the financial statement and tax basis of assets and liabilities. Deferred tax assets and liabilities are measured using the enacted tax rates expected to apply to taxable income in the years in which those temporary differences are expected to be recovered or settled. The effect on deferred tax assets and liabilities with regard to a change in tax rates is recognized in income in the period that includes the enactment date. Management assesses all available evidence to determine the amount of deferred tax assets that are more-likely-than-not to be realized. The available evidence used in connection with the assessments includes taxable income in prior periods, projected taxable income, potential tax planning strategies and projected reversals of deferred tax items. These assessments involve a degree of subjectivity and may undergo significant change. Changes to the evidence used in the assessments could have a material adverse effect on the Company’s results of operations in the period in which they occur. It is the Company’s policy to recognize interest and penalties, if any, related to unrecognized tax benefits in income tax expense in the consolidated statements of income.
Fair Value Measurement. Fair value is defined as the exchange price that would be received to sell an asset or paid to transfer a liability in a principal or most advantageous market for the asset or liability in an orderly transaction between market participants as of the measurement date, using assumptions market participants would use when pricing an asset or liability. An orderly transaction assumes exposure to the market for a customary period for marketing activities prior to the measurement date and not a forced liquidation or distressed sale. Fair value measurement and disclosure guidance provides a three-level hierarchy that prioritizes the inputs of valuation techniques used to measure fair value into three broad categories:
• | Level 1 – Unadjusted quoted prices in active markets for identical assets or liabilities. |
• | Level 2 – Observable inputs such as quoted prices for similar assets and liabilities in active markets, quoted prices for similar assets and liabilities in markets that are not active, or other inputs that are observable or can be corroborated by observable market data. |
• | Level 3 – Unobservable inputs that are supported by little or no market activity and that are significant to the fair value of the assets or liabilities. This includes certain pricing models, discounted cash flow methodologies, and similar techniques that use significant unobservable inputs. |
Fair value may be recorded for certain assets and liabilities every reporting period on a recurring basis or under certain circumstances, on a non-recurring basis.
Implications of and Elections under the JOBS Act. Pursuant to the JOBS Act, an emerging growth company can elect to opt in to any new or revised accounting standards that may be issued by the FASB or the SEC otherwise applicable to non-emerging growth companies. We have elected to opt in to such standards, which election is irrevocable.
We are taking advantage of other reduced regulatory and reporting requirements that are available to us so long as we qualify as an emerging growth company under the JOBS act including, but not limited to, not being required to comply with the auditor attestation requirements of Section 404(b) of the Sarbanes-Oxley Act, reduced disclosure obligations regarding executive compensation, and exemptions from the requirements of holding non-binding advisory votes on executive compensation and golden parachute payments.
Recent Accounting Pronouncements and Developments
Note 1, Summary of Significant Accounting Policies, in the Notes to the Consolidated Financial Statements, which is included in Part II, Item 8 of this Report, discusses new accounting pronouncements that we adopted and the expected impact of accounting pronouncements recently issued or proposed, but not yet required to be adopted.
ITEM 7A. QUANTITATIVE AND QUALITATIVE DISCLOSURES ABOUT MARKET RISK
Quantitative and qualitative disclosures about market risk are presented under the caption “Market Risk” in Part II, Item 7, “Management’s Discussion and Analysis of Financial Condition and Results of Operations.”
84
ITEM 8. FINANCIAL STATEMENTS AND SUPPLEMENTARY DATA
Consolidated Financial Statements:
85
Report of Independent Registered Public Accounting Firm
The Board of Directors and Shareholders
TriState Capital Holdings, Inc.:
We have audited the accompanying consolidated statements of financial condition of TriState Capital Holdings, Inc. and subsidiaries as of December 31, 2016 and 2015, and the related consolidated statements of income, comprehensive income, changes in shareholders’ equity, and cash flows for each of the years in the three-year period ended December 31, 2016. These consolidated financial statements are the responsibility of the Company’s management. Our responsibility is to express an opinion on these consolidated financial statements based on our audits.
We conducted our audits in accordance with the standards of the Public Company Accounting Oversight Board (United States). Those standards require that we plan and perform the audit to obtain reasonable assurance about whether the financial statements are free of material misstatement. An audit includes examining, on a test basis, evidence supporting the amounts and disclosures in the financial statements. An audit also includes assessing the accounting principles used and significant estimates made by management, as well as evaluating the overall financial statement presentation. We believe that our audits provide a reasonable basis for our opinion.
In our opinion, the consolidated financial statements referred to above present fairly, in all material respects, the financial position of TriState Capital Holdings, Inc. and subsidiaries as of December 31, 2016 and 2015, and the results of their operations and their cash flows for each of the years in the three-year period ended December 31, 2016, in conformity with U.S. generally accepted accounting principles.
/s/ KPMG LLP
Pittsburgh, Pennsylvania
February 14, 2017
86
TRISTATE CAPITAL HOLDINGS, INC. AND SUBSIDIARIES
CONSOLIDATED STATEMENTS OF FINANCIAL CONDITION
(Dollars in thousands) | December 31, 2016 | December 31, 2015 | ||||
ASSETS | ||||||
Cash | $ | 183 | $ | 294 | ||
Interest-earning deposits with other institutions | 96,244 | 91,097 | ||||
Federal funds sold | 7,567 | 5,285 | ||||
Cash and cash equivalents | 103,994 | 96,676 | ||||
Investment securities available-for-sale, at fair value (cost: $175,158 and $170,337, respectively) | 174,892 | 168,319 | ||||
Investment securities held-to-maturity, at cost (fair value: $54,498 and $48,099, respectively) | 53,940 | 47,290 | ||||
Federal Home Loan Bank stock | 9,641 | 9,802 | ||||
Total investment securities | 238,473 | 225,411 | ||||
Loans held-for-investment | 3,401,054 | 2,841,284 | ||||
Allowance for loan losses | (18,762 | ) | (17,974 | ) | ||
Loans held-for-investment, net | 3,382,292 | 2,823,310 | ||||
Accrued interest receivable | 9,614 | 7,056 | ||||
Investment management fees receivable | 7,749 | 6,191 | ||||
Goodwill and other intangibles, net | 67,209 | 50,816 | ||||
Office properties and equipment, net | 5,471 | 3,839 | ||||
Bank owned life insurance | 64,815 | 60,019 | ||||
Deferred tax asset, net | 7,204 | 12,186 | ||||
Prepaid expenses and other assets | 43,636 | 16,667 | ||||
Total assets | $ | 3,930,457 | $ | 3,302,171 | ||
LIABILITIES AND SHAREHOLDERS’ EQUITY | ||||||
Liabilities: | ||||||
Deposits | $ | 3,286,779 | $ | 2,689,844 | ||
Borrowings, net | 239,510 | 254,308 | ||||
Accrued interest payable on deposits and borrowings | 1,867 | 1,762 | ||||
Other accrued expenses and other liabilities | 50,494 | 30,280 | ||||
Total liabilities | 3,578,650 | 2,976,194 | ||||
Shareholders’ Equity: | ||||||
Preferred stock, no par value; Shares authorized - 150,000, Shares issued - none | — | — | ||||
Common stock, no par value; Shares authorized - 45,000,000; Shares issued - 29,790,383 and 29,056,195, respectively; Shares outstanding - 28,415,654 and 28,056,195, respectively | 285,480 | 281,412 | ||||
Additional paid-in capital | 6,782 | 10,809 | ||||
Retained earnings | 73,744 | 45,103 | ||||
Accumulated other comprehensive income (loss), net | 830 | (1,443 | ) | |||
Treasury stock (1,374,729 and 1,000,000 shares, respectively) | (15,029 | ) | (9,904 | ) | ||
Total shareholders’ equity | 351,807 | 325,977 | ||||
Total liabilities and shareholders’ equity | $ | 3,930,457 | $ | 3,302,171 | ||
See accompanying notes to consolidated financial statements.
87
TRISTATE CAPITAL HOLDINGS, INC. AND SUBSIDIARIES
CONSOLIDATED STATEMENTS OF INCOME
Years Ended December 31, | |||||||||
(Dollars in thousands, except per share data) | 2016 | 2015 | 2014 | ||||||
Interest income: | |||||||||
Loans | $ | 92,252 | $ | 79,205 | $ | 74,237 | |||
Investments | 5,443 | 4,022 | 3,319 | ||||||
Interest-earning deposits | 617 | 369 | 529 | ||||||
Total interest income | 98,312 | 83,596 | 78,085 | ||||||
Interest expense: | |||||||||
Deposits | 19,807 | 12,888 | 10,611 | ||||||
Borrowings | 3,692 | 2,755 | 1,640 | ||||||
Total interest expense | 23,499 | 15,643 | 12,251 | ||||||
Net interest income | 74,813 | 67,953 | 65,834 | ||||||
Provision for loan losses | 838 | 13 | 10,159 | ||||||
Net interest income after provision for loan losses | 73,975 | 67,940 | 55,675 | ||||||
Non-interest income: | |||||||||
Investment management fees | 37,035 | 29,618 | 25,062 | ||||||
Service charges | 504 | 647 | 604 | ||||||
Net gain on the sale and call of investment securities | 77 | 33 | 1,428 | ||||||
Swap fees | 4,384 | 1,551 | 1,178 | ||||||
Commitment and other fees | 2,029 | 2,022 | 2,045 | ||||||
Unrealized net gain (loss) on swaps | 570 | (161 | ) | (420 | ) | ||||
Bank owned life insurance income | 1,796 | 1,696 | 1,441 | ||||||
Other income | 113 | 77 | 211 | ||||||
Total non-interest income | 46,508 | 35,483 | 31,549 | ||||||
Non-interest expense: | |||||||||
Compensation and employee benefits | 54,522 | 46,136 | 41,048 | ||||||
Premises and occupancy costs | 4,865 | 4,549 | 3,931 | ||||||
Professional fees | 3,850 | 3,739 | 3,431 | ||||||
FDIC insurance expense | 3,058 | 1,988 | 1,928 | ||||||
General insurance expense | 1,037 | 1,066 | 1,165 | ||||||
State capital shares tax | 1,394 | 1,081 | 1,043 | ||||||
Travel and entertainment expense | 3,062 | 2,761 | 2,404 | ||||||
Data processing expense | 1,153 | 1,073 | 922 | ||||||
Charitable contributions | 996 | 1,021 | 1,151 | ||||||
Intangible amortization expense | 1,753 | 1,558 | 1,299 | ||||||
Change in fair value of acquisition earn out | (3,687 | ) | — | 1,614 | |||||
Other operating expenses | 6,791 | 5,071 | 4,391 | ||||||
Total non-interest expense | 78,794 | 70,043 | 64,327 | ||||||
Income before tax | 41,689 | 33,380 | 22,897 | ||||||
Income tax expense | 13,048 | 10,892 | 6,969 | ||||||
Net income | $ | 28,641 | $ | 22,488 | $ | 15,928 | |||
Earnings per common share: | |||||||||
Basic | $ | 1.04 | $ | 0.81 | $ | 0.56 | |||
Diluted | $ | 1.01 | $ | 0.80 | $ | 0.55 | |||
See accompanying notes to consolidated financial statements.
88
TRISTATE CAPITAL HOLDINGS, INC. AND SUBSIDIARIES
CONSOLIDATED STATEMENTS OF COMPREHENSIVE INCOME
Years Ended December 31, | |||||||||
(Dollars in thousands) | 2016 | 2015 | 2014 | ||||||
Net income | $ | 28,641 | $ | 22,488 | $ | 15,928 | |||
Other comprehensive income (loss): | |||||||||
Unrealized holding gains (losses) on investment securities, net of tax expense (benefit) of $674, ($472) and $1,121, respectively | 1,166 | (795 | ) | 2,034 | |||||
Reclassification adjustment for gains included in net income on investment securities, net of tax expense of ($11), ($12) and ($511), respectively | (20 | ) | (21 | ) | (917 | ) | |||
Unrealized holding gains on derivatives, net of tax expense of $650 $0 and $0, respectively | 1,100 | — | — | ||||||
Reclassification adjustment for losses included in net income on derivatives, net of tax benefit of $16, $0 and $0, respectively | 27 | — | — | ||||||
Other comprehensive income (loss) | 2,273 | (816 | ) | 1,117 | |||||
Total comprehensive income | $ | 30,914 | $ | 21,672 | $ | 17,045 | |||
See accompanying notes to consolidated financial statements.
89
TRISTATE CAPITAL HOLDINGS, INC. AND SUBSIDIARIES
CONSOLIDATED STATEMENTS OF CHANGES IN SHAREHOLDERS’ EQUITY
(Dollars in thousands) | Common Stock | Additional Paid-in-Capital | Retained Earnings | Accumulated Other Comprehensive Income (Loss), net | Treasury Stock | Total Shareholders' Equity | ||||||||||||
Balance, December 31, 2013 | $ | 280,531 | $ | 8,471 | $ | 6,687 | $ | (1,744 | ) | $ | — | $ | 293,945 | |||||
Net income | — | — | 15,928 | — | — | 15,928 | ||||||||||||
Other comprehensive income (loss) | — | — | — | 1,117 | — | 1,117 | ||||||||||||
Exercise of stock options | 364 | (114 | ) | — | — | — | 250 | |||||||||||
Purchase of treasury stock | — | — | — | — | (6,746 | ) | (6,746 | ) | ||||||||||
Stock-based compensation | — | 896 | — | — | — | 896 | ||||||||||||
Balance, December 31, 2014 | $ | 280,895 | $ | 9,253 | $ | 22,615 | $ | (627 | ) | $ | (6,746 | ) | $ | 305,390 | ||||
Net income | — | — | 22,488 | — | — | 22,488 | ||||||||||||
Other comprehensive income (loss) | — | — | — | (816 | ) | — | (816 | ) | ||||||||||
Exercise of stock options | 517 | (164 | ) | — | — | — | 353 | |||||||||||
Purchase of treasury stock | — | — | — | — | (3,158 | ) | (3,158 | ) | ||||||||||
Cancellation of stock options | — | (229 | ) | — | — | — | (229 | ) | ||||||||||
Stock-based compensation | — | 1,949 | — | — | — | 1,949 | ||||||||||||
Balance, December 31, 2015 | $ | 281,412 | $ | 10,809 | $ | 45,103 | $ | (1,443 | ) | $ | (9,904 | ) | $ | 325,977 | ||||
Net income | — | — | 28,641 | — | — | 28,641 | ||||||||||||
Other comprehensive income (loss) | — | — | — | 2,273 | — | 2,273 | ||||||||||||
Exercise of stock options | 4,068 | (1,394 | ) | — | — | — | 2,674 | |||||||||||
Purchase of treasury stock | — | — | — | — | (5,125 | ) | (5,125 | ) | ||||||||||
Cancellation of stock options | — | (6,200 | ) | — | — | — | (6,200 | ) | ||||||||||
Stock-based compensation | — | 3,567 | — | — | — | 3,567 | ||||||||||||
Balance, December 31, 2016 | $ | 285,480 | $ | 6,782 | $ | 73,744 | $ | 830 | $ | (15,029 | ) | $ | 351,807 | |||||
See accompanying notes to consolidated financial statements.
90
TRISTATE CAPITAL HOLDINGS, INC. AND SUBSIDIARIES
CONSOLIDATED STATEMENTS OF CASH FLOWS
Years Ended December 31, | |||||||||
(Dollars in thousands) | 2016 | 2015 | 2014 | ||||||
Cash Flows from Operating Activities: | |||||||||
Net income | $ | 28,641 | $ | 22,488 | $ | 15,928 | |||
Adjustments to reconcile net income to net cash provided by operating activities: | |||||||||
Depreciation and intangible amortization expense | 3,077 | 2,882 | 2,506 | ||||||
Amortization of deferred financing costs | 202 | 203 | 118 | ||||||
Provision for loan losses | 838 | 13 | 10,159 | ||||||
Stock-based compensation expense | 3,567 | 1,949 | 896 | ||||||
Net gain on the sale of investment securities available-for-sale | (31 | ) | (33 | ) | (1,428 | ) | |||
Net gain on the call of investment securities held-to-maturity | (46 | ) | — | — | |||||
Income from investment securities trading | — | (20 | ) | — | |||||
Purchase of investment securities trading | — | (4,963 | ) | — | |||||
Proceeds from the sale of investment securities trading | — | 4,983 | — | ||||||
Net amortization of premiums and discounts | 883 | 752 | 1,337 | ||||||
Decrease (increase) in investment management fees receivable | (646 | ) | 627 | (1,514 | ) | ||||
Increase in accrued interest receivable | (2,558 | ) | (777 | ) | (99 | ) | |||
Increase in accrued interest payable | 105 | 27 | 1,214 | ||||||
Bank owned life insurance income | (1,796 | ) | (1,696 | ) | (1,441 | ) | |||
Change in fair value of acquisition earn out | (3,687 | ) | — | 1,614 | |||||
Increase (decrease) in income taxes payable | (95 | ) | 713 | (160 | ) | ||||
Decrease (increase) in prepaid income taxes | (5,438 | ) | 762 | (2,514 | ) | ||||
Deferred tax provision (benefit) | 3,675 | 172 | (1,076 | ) | |||||
Increase in accounts payable and other accrued expenses | 3,661 | 7,263 | 2,149 | ||||||
Payment of contingent consideration impacting operations | — | (1,771 | ) | — | |||||
Cash received for allowance for leasehold improvements | 1,050 | — | — | ||||||
Other, net | (1,293 | ) | (1,884 | ) | 659 | ||||
Net cash provided by operating activities | 30,109 | 31,690 | 28,348 | ||||||
Cash Flows from Investing Activities: | |||||||||
Purchase of investment securities available-for-sale | (27,495 | ) | (36,732 | ) | (52,799 | ) | |||
Purchase of investment securities held-to-maturity | (9,250 | ) | (14,357 | ) | (24,454 | ) | |||
Proceeds from the sale of investment securities available-for-sale | 4,691 | 11,792 | 69,555 | ||||||
Principal repayments and maturities of investment securities available-for-sale | 17,333 | 21,292 | 21,198 | ||||||
Principal repayments and maturities of investment securities held-to-maturity | 2,500 | 6,540 | 10,000 | ||||||
Purchase of bank owned life insurance | (3,000 | ) | (5,000 | ) | (10,000 | ) | |||
Purchase of low income housing tax credit investments | (1,625 | ) | — | — | |||||
Net redemption (purchase) of Federal Home Loan Bank stock | 161 | (4,072 | ) | (3,394 | ) | ||||
Net increase in loans | (564,634 | ) | (448,236 | ) | (348,057 | ) | |||
Purchase of loans held-for-investment | — | — | (219,547 | ) | |||||
Proceeds from loan sales | 1,196 | 4,692 | 19,445 | ||||||
Proceeds from the sale of other real estate owned | 1,080 | — | — | ||||||
Additions to office properties and equipment | (2,937 | ) | (1,035 | ) | (971 | ) | |||
Acquisition, net of acquired cash | (14,095 | ) | — | (42,912 | ) | ||||
Net cash used in investing activities | (596,075 | ) | (465,116 | ) | (581,936 | ) | |||
Cash Flows from Financing Activities: | |||||||||
Net increase in deposit accounts | 596,935 | 352,891 | 375,248 | ||||||
Net increase in Federal Home Loan Bank advances | — | 90,000 | 110,000 | ||||||
Net decrease in Federal Home Loan Bank advances | (15,000 | ) | — | — | |||||
Net proceeds from issuance of subordinated notes payable | — | — | 33,988 | ||||||
Net proceeds from exercise of stock options | 2,674 | 353 | 250 | ||||||
Cancellation of stock options | (6,200 | ) | (229 | ) | — | ||||
Payment of contingent consideration | — | (15,465 | ) | — | |||||
Purchase of treasury stock | (5,125 | ) | (3,158 | ) | (6,746 | ) | |||
Net cash provided by financing activities | 573,284 | 424,392 | 512,740 | ||||||
Net change in cash and cash equivalents during the period | 7,318 | (9,034 | ) | (40,848 | ) | ||||
Cash and cash equivalents at beginning of the period | 96,676 | 105,710 | 146,558 | ||||||
Cash and cash equivalents at end of the period | $ | 103,994 | $ | 96,676 | $ | 105,710 | |||
91
Years Ended December 31, | |||||||||
(Dollars in thousands) | 2016 | 2015 | 2014 | ||||||
Supplemental Disclosure of Cash Flow Information: | |||||||||
Cash paid during the year for: | |||||||||
Interest | $ | 23,192 | $ | 15,413 | $ | 10,918 | |||
Income taxes | $ | 14,823 | $ | 9,393 | $ | 10,722 | |||
Acquisition of non-cash assets and liabilities: | |||||||||
Assets acquired | $ | 1,038 | $ | — | $ | 6,351 | |||
Liabilities assumed | $ | 1,402 | $ | — | $ | 1,647 | |||
Other non-cash activity: | |||||||||
Loan foreclosures and repossessions | $ | 3,618 | $ | 360 | $ | — | |||
Contingent consideration | $ | — | $ | — | $ | 17,236 | |||
See accompanying notes to consolidated financial statements.
92
TRISTATE CAPITAL HOLDINGS, INC. AND SUBSIDIARIES
NOTES TO CONSOLIDATED FINANCIAL STATEMENTS
[1] SUMMARY OF SIGNIFICANT ACCOUNTING POLICIES
NATURE OF OPERATION
TriState Capital Holdings, Inc. (“we”, “us”, “our” or the “Company”) is a registered bank holding company pursuant to the Bank Holding Company Act of 1956, as amended. The Company has three wholly-owned subsidiaries: TriState Capital Bank (the “Bank”), a Pennsylvania-chartered state bank; Chartwell Investment Partners, LLC (“Chartwell”), a registered investment advisor; and Chartwell TSC Securities Corp. (“CTSC Securities”), which has applied to be registered as a broker/dealer with the Securities and Exchange Commission (“SEC”) and Financial Industry Regulatory Authority (“FINRA”).
The Bank was established to serve the commercial banking and private banking needs of middle-market businesses and high-net-worth individuals. Chartwell provides investment management services to institutional, sub-advisory, and separately managed account clients and had assets under management of $8.06 billion as of December 31, 2016. CTSC Securities primary business is facilitating marketing efforts for the proprietary investment products provided by Chartwell, including shares of mutual funds advised and/or administered by Chartwell.
Regulatory approval was received and the Bank commenced operations on January 22, 2007. The Company and the Bank are subject to regulatory examination by the Federal Deposit Insurance Corporation (“FDIC”), the Pennsylvania Department of Banking and Securities, and the Federal Reserve. Chartwell is a registered investment advisor regulated by the SEC. Chartwell was established through the acquisition of substantially all the assets of Chartwell Investment Partners, LP, which was effective March 5, 2014. Chartwell was converted from a C corporation to a limited liability corporation (“LLC”), effective June 30, 2015. CTSC Securities was capitalized in May 2014, and once registered, will be a broker/dealer regulated by the SEC and FINRA.
The Bank conducts business through its main office located in Pittsburgh, Pennsylvania, as well as its four additional representative offices in Cleveland, Ohio; Philadelphia, Pennsylvania; Edison, New Jersey; and New York, New York. Chartwell conducts business through its office located in Berwyn, Pennsylvania, and CTSC Securities will conduct business through its office located in Pittsburgh, Pennsylvania.
USE OF ESTIMATES
The preparation of financial statements in conformity with generally accepted accounting principles (“GAAP”) in the United States of America requires management to make estimates and assumptions that affect the reported amounts of certain assets and liabilities, disclosure of contingent assets and liabilities as of the date of the financial statements, and the reported amounts of related revenue and expense during the reporting period. Although our current estimates contemplate current conditions and how we expect them to change in the future, it is reasonably possible that actual conditions could be worse than those anticipated in the estimates, which could materially affect the financial results of our operations and financial condition.
The material estimates that are particularly susceptible to significant changes relate to the determination of the allowance for loan losses, valuation of goodwill and other intangible assets and its evaluation for impairment, and deferred income taxes and its related recoverability, which are discussed later in this section.
CONSOLIDATION
The consolidated financial statements include the accounts of the Company and its wholly-owned subsidiaries, the Bank, Chartwell and CTSC Securities, after elimination of inter-company accounts and transactions. The accounts of the Bank, in turn, include its wholly-owned subsidiary, Meadowood Asset Management, LLC, after elimination of inter-company accounts and transactions. In the opinion of management, all adjustments (consisting of normal recurring adjustments) and disclosures, considered necessary for the fair presentation of the accompanying consolidated financial statements, have been included.
CASH AND CASH EQUIVALENTS
For purposes of reporting cash flows, the Company has defined cash and cash equivalents as cash, interest-earning deposits with other institutions, federal funds sold, and short-term investments that have an original maturity of 90 days or less.
INVESTMENT SECURITIES
The Company’s investments are classified as either: (1) held-to-maturity – debt securities that the Company intends to hold until maturity and are reported at amortized cost; (2) trading securities – debt and certain equity securities bought and held principally for the purpose of selling them in the near term and reported at fair value, with unrealized gains and losses included in earnings; or (3) available-for-sale – debt and certain equity securities not classified as either held-to-maturity or trading securities and reported at fair value, with unrealized gains and losses reported as a component of accumulated other comprehensive income (loss), on an after-tax basis.
93
The cost of securities sold is determined on a specific identification basis. Amortization of premiums and accretion of discounts are recorded as interest income from investments over the life of the security utilizing the level yield method. We evaluate impaired investment securities quarterly to determine if impairments are temporary or other-than-temporary. For impaired debt and equity securities, management first determines whether it intends to sell or if it is more-likely than not that it will be required to sell the impaired securities. This determination considers current and forecasted liquidity requirements, regulatory and capital requirements, and securities portfolio management. If the Company intends to sell a security with a fair value below amortized cost or if it is more-likely than not that it will be required to sell such a security before recovery, an other-than-temporary impairment (“OTTI”) charge is recorded through current period earnings for the full decline in fair value below amortized cost. For debt securities that the Company does not intend to sell or it is more likely than not that it will not be required to sell before recovery, an OTTI charge is recorded through current period earnings for the amount of the valuation decline below amortized cost that is attributable to credit losses. The remaining difference between the security’s fair value and amortized cost (that is, the decline in fair value not attributable to credit losses) is recognized in other comprehensive income (loss), in the consolidated statements of comprehensive income as well as the shareholders’ equity section of the consolidated statements of financial condition, on an after-tax basis. For equity securities an OTTI charge is recorded through current period earnings for the full decline in fair value below cost.
FEDERAL HOME LOAN BANK STOCK
The Company is a member of the Federal Home Loan Bank of Pittsburgh (“FHLB”). Member institutions are required to invest in FHLB stock. The stock is carried at cost, which approximates its liquidation value, and it is evaluated for impairment based on the ultimate recoverability of the par value. The following matters are considered by management when evaluating the FHLB stock for impairment: the ability of the FHLB to make payments required by law or regulation and the level of such payments in relation to the operating performance of the FHLB; the impact of legislative and regulatory changes on the institution and its customer base; and the Company’s intent and ability to hold its FHLB stock for the foreseeable future. Management believes the Company’s holdings in the FHLB stock were recoverable at par value, as of December 31, 2016 and 2015. Cash and stock dividends are reported as interest income, in the consolidated statements of income.
LOANS
Loans and leases held-for-investment are stated at unpaid principal balances, net of deferred loan fees and costs. Loans held-for-sale are stated at the lower of cost or fair value. Interest income on loans is accrued at the contractual rate on the principal amount outstanding and includes the amortization of deferred loan fees and costs. Deferred loan fees and costs are amortized to interest income over the life of the loan, taking into consideration scheduled payments and prepayments.
The Company considers a loan to be a Troubled Debt Restructuring (“TDR”) when there is a concession made to a financially troubled borrower without adequate consideration provided to the Company. Once a loan is deemed to be a TDR, the Company considers whether the loan should be placed in non-accrual status. In assessing accrual status, the Company considers the likelihood that repayment and performance according to the original contractual terms will be achieved, as well as the borrower’s historical payment performance. A loan is designated and reported as TDR until such loan is either paid-off or sold, unless the restructuring agreement specifies an interest rate equal to or greater than the rate that would be accepted at the time of the restructuring for a new loan with comparable risk and it is fully expected that the remaining principal and interest will be collected according to the restructured agreement.
The recognition of interest income on a loan is discontinued when, in management’s opinion, it is probable the borrower is unable to meet payments as they become due or when the loan becomes 90 days past due, whichever occurs first. All accrued and unpaid interest on such loans is reversed. Such interest ultimately collected is applied to reduce principal if there is doubt about the collectability of principal. If a borrower brings a loan current for which accrued interest has been reversed, then the recognition of interest income on the loan is resumed, once the loan has been current for a period of six consecutive months or greater.
The Company is a party to financial instruments with off-balance sheet risk (commitments to extend credit) in the normal course of business to meet the financing needs of its customers. Commitments to extend credit are agreements to lend to a customer as long as there is no violation of any condition established in the commitment. Commitments generally have fixed expiration dates or other termination clauses (i.e. demand loans) and may require payment of a fee. Since some of the commitments are expected to expire without being drawn upon, the unfunded commitment amount does not necessarily represent future cash requirements. The Company evaluates each customer’s credit worthiness on a case-by-case basis using the same credit policies in making commitments and conditional obligations as it does for on-balance sheet instruments. The amount of collateral obtained, if deemed necessary by the Company upon extension of a commitment, is based on management’s credit evaluation of the borrower.
OTHER REAL ESTATE OWNED
Real estate owned, other than bank premises, is recorded at fair value less estimated selling costs. Fair value is determined based on an independent appraisal. Expenses related to holding the property are charged against earnings when incurred. Depreciation is not recorded on the other real estate owned (“OREO”) properties.
94
ALLOWANCE FOR LOAN LOSSES
The allowance for loan losses is established through provisions for loan losses that are recorded to income. Loans are charged off against the allowance for loan losses when management believes that the principal is uncollectible. If, at a later time, amounts are recovered with respect to loans previously charged off, the recovered amount is credited to the allowance for loan losses.
The allowance was appropriate, in management’s judgment, to cover probable losses inherent in the loan portfolio as of December 31, 2016 and 2015. Management’s judgment takes into consideration general economic conditions, diversification and seasoning of the loan portfolio, historic loss experience, identified credit problems, delinquency levels and adequacy of collateral. Although management believes it has used the best information available to it in making such determinations, and that the present allowance for loan losses is adequate, future adjustments to the allowance may be necessary, and net income may be adversely affected if circumstances differ substantially from the assumptions used in determining the level of the allowance. In addition, as an integral part of their periodic examination, certain regulatory agencies review the adequacy of the Bank’s allowance for loan losses and may direct the Bank to make additions to the allowance based on their judgments about information available to them at the time of their examination.
The components of the allowance for loan losses represent estimates based upon Accounting Standards Codification (“ASC”) Topic 450, Contingencies, and ASC Topic 310, Receivables. ASC Topic 450 applies to homogeneous loan pools such as consumer installment, residential mortgages, consumer lines of credit and commercial loans that are not individually evaluated for impairment under ASC Topic 310. ASC Topic 310 is applied to commercial and consumer loans that are individually evaluated for impairment.
Under ASC Topic 310, a loan is impaired, based upon current information and events, in management’s opinion, when it is probable that the loan will not be repaid according to its original contractual terms, including both principal and interest, or if a loan is designated as a TDR. Management performs individual assessments of impaired loans to determine the existence of loss exposure based upon a discounted cash flows method or where a loan is collateral dependent, based upon the fair value of the collateral less estimated selling costs.
In estimating probable loan loss under ASC Topic 450 management considers numerous factors, including historical charge-offs and subsequent recoveries. Management also considers, but is not limited to, qualitative factors that influence our credit quality, such as delinquency and non-performing loan trends, changes in loan underwriting guidelines and credit policies, as well as the results of internal loan reviews. Finally, management considers the impact of changes in current local and regional economic conditions in the markets that we serve. Assessment of relevant economic factors indicates that some of the Company’s primary markets historically tend to lag the national economy, with local economies in our primary market areas also improving or weakening, as the case may be, but at a more measured rate than the national trends.
Management bases the computation of the allowance for loan losses under ASC Topic 450 on two factors: the primary factor and the secondary factor. The primary factor is based on the inherent risk identified by management within each of the Company’s three loan portfolios based on the historical loss experience of each loan portfolio and the loss emergence period. Management has developed a methodology that is applied to each of the three primary loan portfolios, consisting of commercial and industrial, commercial real estate and private banking. As the loan loss history, mix, and risk ratings of each loan portfolio change, the primary factor adjusts accordingly. The allowance for loan losses related to the primary factor is based on our estimates as to probable losses for each loan portfolio. The secondary factor is intended to capture risks related to events and circumstances that management believes have an impact on the performance of the loan portfolio. Although this factor is more subjective in nature, the methodology focuses on internal and external trends in pre-specified categories (risk factors) and applies a quantitative percentage that drives the secondary factor. There are nine risk factors and each risk factor is assigned a reserve level based on management’s judgment as to the probable impact of each risk factor on each loan portfolio and is monitored on a quarterly basis. As the trend in any risk factor changes, a corresponding change occurs in the reserve associated with each respective risk factor, such that the secondary factor remains current to changes in each loan portfolio.
The Company also maintains a reserve for losses on unfunded commitments. This reserve is reflected as a component of other liabilities and, in management’s judgment, is sufficient to cover probable losses inherent in the commitments. Management tracks the level and trends in unused commitments and takes into consideration the same factors as those considered for purposes of the allowance for loan losses on outstanding loans.
INVESTMENT MANAGEMENT FEES
The Company recognizes investment management fee revenue when the advisory services are performed. Fees are based on assets under management and are calculated pursuant to individual client contracts. Investment management fees are generally received on a quarterly basis.
95
Investment management fees receivable represent amounts due for contractual investment management services provided to the Company’s clients, primarily institutional investors, mutual funds and individual investors. Management performs credit evaluations of its customers’ financial condition when it is deemed to be necessary, and does not require collateral. The Company provides an allowance for uncollectible accounts based on specifically identified receivables. Investment management fees receivable are considered delinquent when payment is not received within contractual terms and are charged off against the allowance for uncollectible accounts when management determines that recovery is unlikely and the Company ceases its collection efforts. There was no bad debt expense recorded for the years ended December 31, 2016, 2015 and 2014, and there was no allowance for uncollectible accounts recorded as of December 31, 2016 and 2015.
BUSINESS COMBINATIONS
The Company accounts for business combinations using the acquisition method of accounting. Under this method of accounting, the acquired company’s net assets are recorded at fair value as of the date of acquisition, and the results of operations of the acquired company are combined with our results from that date forward. Acquisition costs are expensed when incurred. The difference between the purchase price and the fair value of the net assets acquired (including identified intangibles) is recorded as goodwill. The change in the initial estimate of any contingent earn out amounts is reflected in the consolidated statements of income.
GOODWILL AND OTHER INTANGIBLE ASSETS
Goodwill represents the excess of the cost of an acquisition over the fair value of the net assets acquired. Goodwill is not amortized and is subject to at least annual assessments for impairment by applying a fair value based test. The Company reviews goodwill annually and again at any quarter-end if a material event occurs during the quarter that may affect goodwill. If goodwill testing is required, an assessment of qualitative factors can be completed before performing the two step goodwill impairment test. If an assessment of qualitative factors determines it is more likely than not that the fair value of a reporting unit exceeds its carrying amount, then the two step goodwill impairment test is not required. Goodwill is evaluated for potential impairment by determining if the fair value has fallen below carrying value.
Other intangible assets represent purchased assets that lack physical substance but can be distinguished from goodwill because of contractual or other legal rights. The Company has determined that certain of its acquired mutual fund client relationships meet the criteria to be considered indefinite-lived assets because the Company expects both the renewal of these contracts and the cash flows generated by these assets to continue indefinitely. Accordingly, the Company does not amortize these intangible assets, but instead reviews these assets annually or more frequently whenever events or circumstances occur indicating that the recorded indefinite-lived assets may be impaired. Each reporting period, the Company assesses whether events or circumstances have occurred which indicate that the indefinite life criteria are no longer met. If the indefinite life criteria are no longer met, the Company would assess whether the carrying value of these assets exceeds its fair value, an impairment loss would be recorded in an amount equal to any such excess and these assets would be reclassified to finite-lived. Other intangible assets that the Company has determined to have finite lives, such as trade name, client lists and non-compete agreements, are amortized over their estimated useful lives. These finite-lived intangible assets are amortized on a straight-line basis over their estimated useful lives, which range from four to twenty-five years. Finite-lived intangibles are evaluated for impairment on an annual basis or more frequently whenever events or circumstances occur indicating that the carrying amount may not be recoverable.
OFFICE PROPERTIES AND EQUIPMENT
Office properties and equipment are stated at cost less accumulated depreciation. Depreciation is computed on the straight-line method over the estimated useful lives of the related assets, except for leasehold improvements which are amortized over the terms of the respective leases or the estimated useful lives of the improvements, whichever is shorter. Estimated useful lives are dependent upon the nature and condition of the asset and range from three to ten years. Repairs and maintenance are charged to expense as incurred, while improvements that extend the useful life are capitalized and depreciated to operating expense over the estimated remaining life of the asset. When the Bank receives an allowance for improvements to be made to one of its leased offices, we record the allowance as a deferred liability and recognize it as a reduction to rent expense over the life of the related lease.
BANK OWNED LIFE INSURANCE
Bank owned life insurance (“BOLI”) policies on certain officers and employees are recorded at net cash surrender value on the consolidated statements of financial condition. Upon termination of the BOLI policy the Company receives the cash surrender value. BOLI benefits are payable to the Company upon death of the insured. Changes in net cash surrender value are recognized as non-interest income in the consolidated statements of income.
DEPOSITS
Deposits are stated at principal outstanding and interest on deposits is accrued and charged to interest expense daily and is paid or credited in accordance with the terms of the respective accounts.
96
BORROWINGS
The Company records FHLB advances and subordinated notes payable at their principal amount net of debt issuance costs, per ASU 2015-03. Interest expense is recognized based on the coupon rate of the obligations. Costs associated with the acquisition of subordinated notes payable are amortized to interest expense over the expected term of the borrowing.
EARNINGS PER COMMON SHARE
Basic earnings per common share (“EPS”) is computed by dividing net income available to common shareholders by the weighted average number of common shares outstanding for the period, excluding non-vested restricted stock. Diluted EPS reflects the potential dilution upon the exercise of stock options and the vesting of restricted stock awards granted utilizing the treasury stock method.
INCOME TAXES
The Company utilizes the asset and liability method of accounting for income taxes. Under this method, deferred tax assets and liabilities are recognized for the tax effects of differences between the financial statement and tax basis of assets and liabilities. Deferred tax assets and liabilities are measured using the enacted tax rates expected to apply to taxable income in the years in which those temporary differences are expected to be recovered or settled. The effect on deferred tax assets and liabilities with regard to a change in tax rates is recognized in income in the period that includes the enactment date. Management assesses all available evidence to determine the amount of deferred tax assets that are more-likely-than-not to be realized. The available evidence used in connection with the assessments includes taxable income in prior periods, projected taxable income, potential tax planning strategies and projected reversals of deferred tax items. These assessments involve a degree of subjectivity and may undergo significant change. Changes to the evidence used in the assessments could have a material adverse effect on the Company’s results of operations in the period in which they occur. It is the Company’s policy to recognize interest and penalties, if any, related to unrecognized tax benefits in income tax expense in the consolidated statements of income.
DERIVATIVES AND HEDGING ACTIVITIES
The Company accounts for derivative instruments and hedging activities in accordance with FASB ASC Topic 815, Derivatives and Hedging. All derivatives are evaluated at inception as to whether or not they are hedging or non-hedging activities, and appropriate documentation is maintained to support the final determination. All derivatives are recognized as either assets or liabilities on the consolidated statements of financial condition and measured at fair value. For derivatives designated as fair value hedges, changes in the fair value of the derivative and the hedged item related to the hedged risk are recognized in earnings. Any hedge ineffectiveness would be recognized in the income statement line item pertaining to the hedged item. For derivatives designated as cash flow hedges, changes in fair value of the effective portion of the cash flow hedges are reported in accumulated other comprehensive income (loss). When the cash flows associated with the hedged item are realized, the gain or loss included in accumulated other comprehensive income (loss) is recognized in the consolidated statements of income. The Company also has interest derivative positions that are not designated as hedging instruments. Changes in the fair value of derivatives not designated in hedging relationships are recorded directly in earnings.
FAIR VALUE MEASUREMENT
Fair value is defined as the exchange price that would be received to sell an asset or paid to transfer a liability in a principal or most advantageous market for the asset or liability in an orderly transaction between market participants as of the measurement date, using assumptions market participants would use when pricing an asset or liability. An orderly transaction assumes exposure to the market for a customary period for marketing activities prior to the measurement date and not a forced liquidation or distressed sale. Fair value measurement and disclosure guidance provides a three-level hierarchy that prioritizes the inputs of valuation techniques used to measure fair value into three broad categories:
• | Level 1 – Unadjusted quoted prices in active markets for identical assets or liabilities. |
• | Level 2 – Observable inputs such as quoted prices for similar assets and liabilities in active markets, quoted prices for similar assets and liabilities in markets that are not active, or other inputs that are observable or can be corroborated by observable market data. |
• | Level 3 – Unobservable inputs that are supported by little or no market activity and that are significant to the fair value of the assets or liabilities. This includes certain pricing models, discounted cash flow methodologies, and similar techniques that use significant unobservable inputs. |
Fair value may be recorded for certain assets and liabilities every reporting period on a recurring basis or under certain circumstances, on a non-recurring basis.
STOCK-BASED COMPENSATION
The Company accounts for its stock-based compensation awards based on estimated fair values, for all share-based awards, including stock options and restricted shares, made to employees and directors.
97
The Company accounts for stock-based compensation in accordance with the fair value recognition provisions of ASC Topic 718, Compensation – Stock Compensation. As a result, compensation cost for all share-based payments is based on the grant-date fair value estimated in accordance with ASC Topic 718. The value of the portion of the award that is ultimately expected to vest is included in stock-based compensation expense in the consolidated statements of income and recorded as a component of additional paid-in capital, for equity-based awards. Compensation expense for all awards is recognized on a straight-line basis over the requisite service period for the entire grant.
ACCUMULATED OTHER COMPREHENSIVE INCOME (LOSS)
Unrealized holding gains and the non-credit component of losses on the Company’s investment securities available-for-sale are included in accumulated other comprehensive income (loss), net of applicable income taxes. Also included in accumulated other comprehensive income (loss) is the remaining unamortized balance of the unrealized holding gains (non-credit losses), net of applicable income taxes, that existed on the transfer date for investment securities reclassified into the held-to-maturity category from the available-for-sale category.
Unrealized holding gains (losses) on the effective portion of the Company’s cash flow hedge derivatives are included in accumulated other comprehensive income (loss), net of applicable income taxes, which will be reclassified to interest expense as interest payments are made on the Company’s debt.
TREASURY STOCK
The repurchase of the Company’s common stock is recorded at cost. At the time of reissuance, the treasury stock account is reduced using the average cost method. Gains and losses on the reissuance of common stock are recorded in additional paid-in capital, to the extent additional paid-in capital from previous net gains on treasury share transactions exists. Any deficiency is charged to retained earnings.
RECENT ACCOUNTING DEVELOPMENTS
In December 2016, the FASB issued Accounting Standards Update (“ASU”) 2016-19, “Technical Corrections and Improvements,” which amends a number of Topics in the FASB ASC. The ASU is part of an ongoing FASB project to facilitate Codification updates for non-substantive technical corrections, clarifications, and improvements that are not expected to have a significant effect on accounting practice or create a significant administrative cost to most entities. The ASU will apply to all reporting entities within the scope of the affected accounting guidance. Most amendments are effective upon issuance (December 2016). Certain amendments that require transition guidance are effective for public business entities, for annual and interim periods in fiscal years beginning after December 15, 2016. Early adoption is permitted for the amendments that require transition guidance. The adoption of ASU 2016-19 did not have a material impact on the Company’s consolidated financial statements.
In November 2016, the FASB issued ASU 2016-18, “Statement of Cash Flows (Topic 230): Restricted Cash,” which requires companies to include cash and cash equivalents that have restrictions on withdrawal or use in total cash and cash equivalents on the statement of cash flows. This ASU is effective for public business entities for annual and interim periods in fiscal years beginning after December 15, 2017. Early adoption is permitted, including adoption in an interim period. If an entity early adopts the amendments in an interim period, adjustments should be reflected at the beginning of the fiscal year that includes that interim period. The Company is currently evaluating the impact this standard will have on our results of operations and financial position.
In October 2016, the FASB issued ASU 2016-17, “Consolidation (Topic 810): Interests Held through Related Parties That Are under Common Control,” which requires a single decision maker or service provider, in evaluating whether it is the primary beneficiary, to consider on a proportionate basis indirect interests held through related parties under common control. This ASU is effective for public business entities for annual and interim periods in fiscal years beginning after December 15, 2016. Entities can adopt the ASU on issuance, including in an interim period. However, if an entity adopts in an interim period other than the first interim period, it should compute and reflect the cumulative effect of the accounting change as of the beginning of the fiscal year that includes that interim period. Entities that have not adopted ASU 2015-02 should adopt ASU 2016-17 at the same time and apply the same transition method for both standards. Entities that already adopted ASU 2015-02 should apply ASU 2016-17 retrospectively to all periods beginning with the earliest annual period in which they adopted ASU 2015-02. The adoption of ASU 2016-17 did not have a material impact on the Company’s consolidated financial statements.
In October 2016, the FASB issued ASU 2016-16, “Income Taxes (Topic 740): Intra-Entity Transfers of Assets Other Than Inventory,” which requires entities to recognize at the transaction date the income tax consequences of intercompany asset transfers other than inventory. This ASU is effective for public business entities for annual and interim periods in fiscal years beginning after December 15, 2017. Entities may early adopt the ASU, but only at the beginning of an annual period for which no financial statements (interim or annual) have already been issued or made available for issuance. The Company is currently evaluating the impact this standard will have on our results of operations and financial position.
98
In September of 2016, the FASB issued ASU 2016-15, “Statement of Cash Flow (Topic 230): Classification of Certain Cash Receipts and Cash Payments,” which addresses eight classification issues related to the statement of cash flows. The eight classification issues are as follows: debt prepayment or debt extinguishment costs; settlement of zero-coupon bonds; contingent consideration payments made after a business combination; proceeds from the settlement of insurance claims; proceeds from the settlement of corporate-owned life insurance policies, including bank-owned life insurance policies; distributions received from equity method investees; beneficial interests in securitization transactions; and separately identifiable cash flows and application of the predominance principle. This ASU is effective for public business entities for annual and interim periods in fiscal years beginning after December 15, 2017. Early adoption is permitted, including adoption in an interim period. If an entity early adopts the ASU in an interim period, adjustments should be reflected as of the beginning of the fiscal year that includes that interim period. An entity that elects early adoption must adopt all of the amendments in the same period. Entities should apply this ASU using a retrospective transition method to each period presented. If it is impracticable for an entity to apply the ASU retrospectively for some of the issues, it may apply the amendments for those issues prospectively as of the earliest date practicable. The Company is currently evaluating the impact this standard will have on our results of operations and financial position.
In June 2016, the FASB issued ASU 2016-13, “Measurement of Credit Losses on Financial Instruments,” which significantly changes the way entities recognize impairment of many financial assets by requiring immediate recognition of estimated credit losses expected to occur over their remaining life. The changes are effective for public business entities that are SEC filers, for annual and interim periods in fiscal years beginning after December 15, 2019. All entities may early adopt the standard for annual and interim periods in fiscal years beginning after December 15, 2018. The Company is currently evaluating the impact this standard will have on our results of operations and financial position.
In March 2016, the FASB issued ASU 2016-09, “Improvements to Employee Share-Based Payment Accounting,” which is intended to improve the accounting for share-based payment transactions as part of the FASB’s simplification initiative. The ASU changes seven aspects of the accounting for share-based payment award transactions, including: (1) accounting for income taxes; (2) classification of excess tax benefits on the statement of cash flows; (3) forfeitures; (4) minimum statutory tax withholding requirements; (5) classification of employee taxes paid on the statement of cash flows when an employer withholds shares for tax-withholding purposes; (6) practical expedient - expected term (nonpublic only); and (7) intrinsic value (nonpublic only). The ASU is effective for fiscal years beginning after December 15, 2016, and interim periods within those years for public business entities. Early adoption is permitted in any interim or annual period provided that the entire ASU is adopted. Even if an entity early adopts the amendments after the first interim period, the adoption date is as of the beginning of the year for the issues adopted by the cumulative-effect and prospective methods. Any adjustments to previously reported interim periods of that fiscal year should be included in the year-to-date results. If those previously reported interim results appear in any future filings, they are reported on the revised basis. The adoption of ASU 2016-09 did not have a material impact on the Company’s consolidated financial statements.
In March 2016, the FASB issued ASU 2016-06, “Contingent Put and Call Options in Debt Instruments,” which clarifies that determining whether the economic characteristics of a put or call are clearly and closely related to its debt host requires only an assessment of the four-step decision sequence outlined in FASB ASC paragraph 815-15-25-24. Additionally, entities are not required to separately assess whether the contingency itself is clearly and closely related. ASU 2016-06 is effective for public business entities for interim and annual periods in fiscal years beginning after December 15, 2016. Early adoption is permitted in any interim period for which the entity’s financial statements have not been issued but would be retroactively applied to the beginning of the year that includes that interim period. The adoption of ASU 2016-06 did not have a material impact on the Company’s consolidated financial statements.
In March 2016, the FASB issued ASU 2016-05, “Effect of Derivative Contract Novations on Existing Hedge Accounting Relationships,” which clarifies that a change in one of the parties to a derivative contract (through novation) that is part of a hedge accounting relationship does not, by itself, require dedesignation of that relationship, as long as all other hedge accounting criteria continue to be met. This ASU is effective for public business entities for annual and interim periods in fiscal years beginning after December 15, 2016. Early adoption is permitted, including adoption in an interim period. The adoption of ASU 2016-05 did not have a material impact on the Company’s consolidated financial statements.
In February 2016, the FASB issued ASU 2016-02, “Leases,” which, among other things, requires lessees to recognize most leases on-balance sheet. This will increase their reported assets and liabilities - in some cases very significantly. Lessor accounting remains substantially similar to current U.S. GAAP. ASU 2016-02 supersedes Topic 840, Leases. ASU 2016-02 is effective for public business entities, certain not-for-profit entities, and certain employee benefit plans for annual and interim periods in fiscal years beginning after December 15, 2018. This ASU mandates a modified retrospective transition method for all entities. The Company is currently evaluating the impact this standard will have on our results of operations and financial position.
In January 2016, the FASB issued ASU 2016-01, “Financial Instruments - Overall (Subtopic 825-10): Recognition and Measurement of Financial Assets and Financial Liabilities,” which will significantly change the income statement impact of equity investments, and the recognition of changes in fair value of financial liabilities when the fair value option is elected. The ASU is effective for
99
public business entities for interim and annual periods in fiscal years beginning after December 15, 2017. The Company is currently evaluating the impact this standard will have on our results of operations and financial position.
In September 2015, the FASB issued ASU 2015-16, “Business Combinations (Topic 805): Simplifying the Accounting for Measurement Period Adjustments.” This ASU eliminated the requirement for an acquirer to retrospectively adjust the financial statements for measurement-period adjustments that occur in periods after a business combination is consummated. The ASU was effective for public business entities for annual periods, including interim periods within those annual periods, beginning after December 15, 2015. The adoption of ASU 2015-16 did not have a material impact on the Company’s consolidated financial statements.
In June 2015, the FASB issued ASU 2015-10, “Technical Correction and Improvements,” which, among other things, corrects the initial codification of FASB Statement No. 140, “Accounting for Transfers and Servicing of Financial Assets and Extinguishments of Liabilities (as Amended by FASB Statement No. 166, Accounting for Transfers of Financial Assets).” The initial codification inadvertently added the word “public” to paragraph 860-10-50-7, which was not in the original guidance. The ASU also clarifies that the requirement relates to “involvement by others”. This amendment in ASU 2015-10 was effective for fiscal years, and interim periods within those fiscal years, beginning after December 15, 2015. The adoption of ASU 2015-10 did not have a material impact on the Company’s consolidated financial statements.
In May 2015, the FASB issued ASU 2015-07, “Fair Value Measurement (Topic 820): Disclosures for Investments in Certain Entities That Calculate Net Asset Value per Share (or Its Equivalent).” This ASU eliminated the requirement to categorize investments in the fair value hierarchy if their fair value is measured at net asset value (NAV) per share (or its equivalent) using the practical expedient in the FASB’s fair value measurement guidance. Reporting entities were required to adopt the ASU retrospectively. The effective date for public business entities was fiscal years beginning after December 15, 2015, and interim periods within those fiscal years. The adoption of ASU 2015-07 did not have a material impact on the Company’s consolidated financial statements.
In April 2015, the FASB issued ASU 2015-03, “Interest - Imputation of Interest (Subtopic 835-30): Simplifying the Presentation of Debt Issuance Costs.” This ASU requires that debt issuance costs related to a recognized debt liability be presented in the balance sheet as a direct deduction from the carrying amount of that debt liability, consistent with debt discounts. The recognition and measurement guidance for debt issuance costs were not affected by the amendments in this update. For public business entities, the amendments in this update were effective for financial statements issued for fiscal years beginning after December 15, 2015, and interim periods within those fiscal years. An entity should apply the new guidance on a retrospective basis, wherein the balance sheet of each individual period presented was adjusted to reflect the period-specific effects of applying the new guidance. Upon transition, an entity was required to comply with the applicable disclosures for a change in an accounting principle. These disclosures included the nature of and reason for the change in accounting principle, the transition method, a description of the prior-period information that had been retrospectively adjusted, and the effect of the change on the financial statement line items (that is, debt issuance cost asset and the debt liability). The adoption of ASU 2015-03 did not have a material impact on the Company’s consolidated financial statements.
In February 2015, the FASB issued ASU 2015-02, “Consolidation (Topic 810): Amendments to the Consolidation Analysis.” This ASU changed the way reporting enterprises evaluate whether (a) they should consolidate limited partnerships and similar entities, (b) fees paid to a decision maker or service provider are variable interests in a variable interest entity (VIE), and (c) variable interests in a VIE held by related parties of the reporting enterprise require the reporting enterprise to consolidate the VIE. It also eliminated the VIE consolidation model based on majority exposure to variability that applied to certain investment companies and similar entities. The new guidance excludes money market funds that are required to comply with Rule 2a-7 of the Investment Company Act of 1940 and similar entities from the U.S. GAAP consolidation requirements. The new consolidation guidance was effective for public business entities for annual and interim periods in fiscal years beginning after December 15, 2015. At the effective date, all previous consolidation analyses that the guidance affects was required to be reconsidered. This included the consolidation analyses for all VIEs and for all limited partnerships and similar entities that previously were consolidated by the general partner even though the entities were not VIEs. The adoption of ASU 2015-02 did not have a material impact on the Company’s consolidated financial statements.
In January 2015, the FASB issued ASU 2015-01, “Income Statement - Extraordinary and Unusual Items (Subtopic 225-20): Simplifying Income Statement Presentation by Eliminating the Concept of Extraordinary Items.” This ASU eliminated the concept of extraordinary items from U.S. GAAP as part of its simplification initiative. The ASU did not affect disclosure guidance for events or transactions that are unusual in nature or infrequent in their occurrence. The ASU was effective for interim and annual periods in fiscal years beginning after December 15, 2015. The ASU allowed prospective or retrospective application. The effective date was the same for both public entities and all other entities. The adoption of ASU 2015-01 did not have a material impact on the Company’s consolidated financial statements.
In November 2014, the FASB issued ASU 2014-16, “Derivatives and Hedging (Topic 815),” required an entity to determine the nature of the host contract by considering the economic characteristics and risks of the entire hybrid financial instrument issued in
100
the form of a share, including the embedded derivative feature that is being evaluated for separate accounting from the host contract when evaluating whether the host contract is more akin to debt or equity. In evaluating the stated and implied substantive terms and features, the existence or omission of any single term or feature does not necessarily determine the economic characteristics and risks of the host contract. Although an individual term or feature may weigh more heavily in the evaluation on the basis of facts and circumstances, an entity should use judgment based on an evaluation of all the relevant terms and features. This ASU was effective for public business entities for fiscal years, and interim periods within those fiscal years, beginning after December 15, 2015. The effects of initially adopting the amendments should be applied on a modified retrospective basis to existing hybrid financial instruments issued in the form of a share as of the beginning of the fiscal year for which the amendment is effective. Retrospective application was permitted to all relevant prior periods. The adoption of ASU 2014-16 did not have a material impact on the Company’s consolidated financial statements.
In August 2014, the FASB issued ASU 2014-15, “Presentation of Financial Statements - Going Concern (Subtopic 205-40): Disclosure of Uncertainties about an Entity’s Ability to Continue as a Going Concern.” This ASU describes how an entity’s management should assess whether there are conditions and events that raise substantial doubt about an entity’s ability to continue as a going concern within one year after the date that the financial statements are issued. Management should consider both quantitative and qualitative factors in making its assessment. If after considering management’s plans, substantial doubt about an entity’s going concern is alleviated, an entity shall disclose information in the footnotes that enables the users of the financial statements to understand the events that raised the going concern and how management’s plan alleviated this concern. If after considering management’s plans, substantial doubt about an entity’s going concern is not alleviated, the entity shall disclose in the footnotes indicating that a substantial doubt about the entity’s going concern exists within one year of the date of the issued financial statements. Additionally, the entity shall disclose the events that led to this going concern and management’s plans to mitigate them. The new standard applies to all entities for the annual period ending after December 15, 2016, and for annual and interim periods thereafter. Early application is permitted. The adoption of ASU 2014-15 did not have a material impact on the Company’s consolidated financial statements.
In June 2014, the FASB issued ASU 2014-12, “Accounting for Share-Based Payments When the Terms of an Award Provide That a Performing Target Could Be Achieved after the Requisite Service Period.” This ASU requires a reporting entity to treat a performance target that affects vesting and that could be achieved after the requisite service period as a performance condition. A reporting entity should apply FASB ASC Topic 718, Compensation-Stock Compensation, to awards with performance conditions that affect vesting. This update was effective for annual periods, and interim periods within those annual periods, beginning after December 15, 2015, for all entities. ASU 2014-12 may be adopted either prospectively for share-based payment awards granted or modified on or after the effective date, or retrospectively, using a modified retrospective approach. The modified retrospective approach would apply to share-based payment awards outstanding as of the beginning of the earliest annual period presented in the financial statements on adoption, and to all new or modified awards thereafter. The adoption of ASU 2014-12 did not have a material impact on the Company’s consolidated financial statements.
In May 2014, the FASB issued ASU 2014-09, “Revenue from Contracts with Customers (Topic 606).” This ASU implements a common revenue standard that clarifies the principles for recognizing revenue. The core principle of this update is that an entity should recognize revenue to depict the transfer of promised goods or services to customers in an amount that reflects the consideration to which the entity expects to be entitled in exchange for those goods or services. ASU 2014-09 establishes a five-step model that entities must follow to recognize revenue and removes inconsistencies and weaknesses in existing guidance. Per ASU 2015-14, this update is effective for annual periods and interim periods within fiscal years beginning after December 15, 2017, for public business entities, certain employee benefit plans, and certain not-for-profit entities applying U.S. GAAP. Earlier application is permitted only as of annual reporting periods beginning after December 15, 2016, including interim reporting periods within that reporting period. The Company is currently evaluating the impact this standard will have on our results of operations and financial position.
RECLASSIFICATION
Certain items previously reported have been reclassified to conform with the current year’s reporting presentation and are considered immaterial.
[2] BUSINESS COMBINATIONS
On April 29, 2016, TriState Capital Holdings, Inc. through its wholly-owned subsidiary, Chartwell Investment Partners, LLC, completed the acquisition of substantially all of the assets of The Killen Group, Inc. (the "TKG acquisition"), an investment management firm with approximately $2.02 billion in assets under management. Under the terms of the Asset Purchase Agreement substantially all of the assets of The Killen Group, Inc. (“TKG”) were acquired for a purchase price consisting of $15.0 million paid in cash at closing based on five-times a base EBITDA (earnings before interest, taxes, depreciation and amortization) of $3.0 million plus an earn out. The earn out, while not limited under the terms of the Asset Purchase Agreement, was calculated based on a multiple of seven-times the incremental growth in TKG's annual run-rate EBITDA over $3.0 million at December 31, 2016. The earn out was estimated, at closing, to be approximately $3.7 million based on the estimated annual run-rate EBITDA of TKG at December 31, 2016. The change to the earn out calculation from the estimated $3.7 million recorded at closing, was recorded in the statement of income during the year ended December
101
31, 2016. The foregoing summary of the Asset Purchase Agreement and the transactions contemplated by it does not purport to be complete and is subject to, and qualified in its entirety by, the full text of the Asset Purchase Agreement, which was included as Exhibit 2.2 to the Company's Annual Report on Form 10-K filed with the Securities and Exchange Commission on February 16, 2016, the terms of which Agreement are incorporated herein by reference.
The following table summarizes total consideration at closing, assets acquired and liabilities assumed for the TKG acquisition on April 29, 2016:
(Dollars in thousands) | TKG Acquisition | ||
Consideration paid: | |||
Cash | $ | 15,000 | |
Estimated earn out, at closing | 3,687 | ||
Fair value of total consideration, at closing | $ | 18,687 | |
Fair value of assets acquired: | |||
Cash and cash equivalents | $ | 905 | |
Investment management fees receivable | 912 | ||
Office properties and equipment | 20 | ||
Other assets | 106 | ||
Total assets acquired | 1,943 | ||
Fair value of liabilities assumed: | |||
Other liabilities | 1,402 | ||
Total liabilities assumed | 1,402 | ||
Fair value net identifiable assets acquired | 541 | ||
Long-lived amortizable intangible assets acquired | 13,585 | ||
Goodwill | 4,561 | ||
Total net assets purchased | $ | 18,687 | |
During the year ended December 31, 2016, the fair value of the estimated acquisition earn out was decreased by $3.7 million based on management’s final determination of the annualized run-rate EBITDA of TKG at December 31, 2016. This adjustment to the earn out was credited to non-interest expense during the year ended December 31, 2016. Thus, there was no remaining acquisition earn out liability as of December 31, 2016.
In connection with the TKG acquisition, total acquisition-related transaction costs incurred by the Company was approximately $1,000 and $601,000 during the years ended December 31, 2016 and 2015, respectively, which were primarily comprised of legal, advisory and other costs.
Since the acquisition, the TKG acquired operations contributed approximate revenues of $7.2 million and approximate earnings of $1.4 million (excluding the earn out adjustment as discussed above) which were included in the consolidated statement of income for the year ended December 31, 2016.
Goodwill is not amortized for book purposes, but goodwill capitalized for tax purposes is deductible. The following table shows the amount of other intangible assets acquired through the TKG acquisition on April 29, 2016, by class and estimated useful life:
(Dollars in thousands) | Gross Amount | Estimated Useful Life (months) | ||
Trade name | $ | 2,850 | 300 | |
Client Relationships: | ||||
Sub-advisory client list | 330 | 132 | ||
Separate managed accounts client list | 715 | 168 | ||
Non-compete agreements | 390 | 48 | ||
Total finite-lived intangibles | $ | 4,285 | 242 | |
Client Relationships: | ||||
Mutual fund client relationships | 9,300 | Indefinite life | ||
Total intangibles assets | $ | 13,585 | ||
102
The following table presents unaudited pro forma financial information which combines the historical consolidated statements of income of the Company and The Killen Group, Inc. to give effect to the acquisition as if it had occurred on January 1, 2015, for the periods indicated:
Pro Forma | ||||||
(unaudited) | ||||||
Years Ended December 31, | ||||||
(Dollars in thousands, except per share data) | 2016 | 2015 | ||||
Total revenue | $ | 124,977 | $ | 119,359 | ||
Net income | $ | 29,380 | $ | 23,266 | ||
Earnings per common share: | ||||||
Basic | $ | 1.06 | $ | 0.84 | ||
Diluted | $ | 1.04 | $ | 0.82 | ||
Total revenue is defined as net interest income and non-interest income, excluding gains and losses on the sale and call of investment securities. Pro forma adjustments include intangible amortization expense and income tax expense.
[3] INVESTMENT SECURITIES
Investment securities available-for-sale and held-to-maturity are comprised of the following:
December 31, 2016 | ||||||||||||
(Dollars in thousands) | Amortized Cost | Gross Unrealized Appreciation | Gross Unrealized Depreciation | Estimated Fair Value | ||||||||
Investment securities available-for-sale: | ||||||||||||
Corporate bonds | $ | 53,902 | $ | 164 | $ | 21 | $ | 54,045 | ||||
Trust preferred securities | 17,711 | 159 | 72 | 17,798 | ||||||||
Non-agency mortgage-backed securities | 5,750 | 14 | — | 5,764 | ||||||||
Non-agency collateralized loan obligations | 16,234 | — | 54 | 16,180 | ||||||||
Agency collateralized mortgage obligations | 44,051 | 49 | 279 | 43,821 | ||||||||
Agency mortgage-backed securities | 24,107 | 240 | 198 | 24,149 | ||||||||
Agency debentures | 4,760 | 23 | — | 4,783 | ||||||||
Equity securities | 8,643 | — | 291 | 8,352 | ||||||||
Total investment securities available-for-sale | 175,158 | 649 | 915 | 174,892 | ||||||||
Investment securities held-to-maturity: | ||||||||||||
Corporate bonds | 28,693 | 596 | 30 | 29,259 | ||||||||
Municipal bonds | 25,247 | 88 | 96 | 25,239 | ||||||||
Total investment securities held-to-maturity | 53,940 | 684 | 126 | 54,498 | ||||||||
Total | $ | 229,098 | $ | 1,333 | $ | 1,041 | $ | 229,390 | ||||
103
December 31, 2015 | ||||||||||||
(Dollars in thousands) | Amortized Cost | Gross Unrealized Appreciation | Gross Unrealized Depreciation | Estimated Fair Value | ||||||||
Investment securities available-for-sale: | ||||||||||||
Corporate bonds | $ | 43,952 | $ | 18 | $ | 237 | $ | 43,733 | ||||
Trust preferred securities | 17,579 | — | 978 | 16,601 | ||||||||
Non-agency mortgage-backed securities | 5,756 | — | 13 | 5,743 | ||||||||
Non-agency collateralized loan obligations | 11,843 | — | 132 | 11,711 | ||||||||
Agency collateralized mortgage obligations | 49,544 | 92 | 265 | 49,371 | ||||||||
Agency mortgage-backed securities | 28,586 | 270 | 187 | 28,669 | ||||||||
Agency debentures | 4,719 | 13 | — | 4,732 | ||||||||
Equity securities | 8,358 | — | 599 | 7,759 | ||||||||
Total investment securities available-for-sale | 170,337 | 393 | 2,411 | 168,319 | ||||||||
Investment securities held-to-maturity: | ||||||||||||
Corporate bonds | 19,448 | 498 | 84 | 19,862 | ||||||||
Agency debentures | 2,453 | 19 | — | 2,472 | ||||||||
Municipal bonds | 25,389 | 377 | 1 | 25,765 | ||||||||
Total investment securities held-to-maturity | 47,290 | 894 | 85 | 48,099 | ||||||||
Total | $ | 217,627 | $ | 1,287 | $ | 2,496 | $ | 216,418 | ||||
The equity securities noted in the tables above consisted a mutual fund investing in short-duration, corporate bonds.
Income on investment securities included $4.2 million in taxable interest income, $452,000 in non-taxable interest income and $778,000 in dividend income for the year ended December 31, 2016, as compared to taxable interest income of $3.0 million, non-taxable interest income of $409,000 and dividend income of $638,000 for the year ended December 31, 2015. There was taxable interest income of $2.7 million, non-taxable interest income of $359,000 and $282,000 dividend income on investment securities during the year ended December 31, 2014.
As of December 31, 2016, the contractual maturities of the debt securities were:
December 31, 2016 | |||||||||||||
Available-for-Sale | Held-to-Maturity | ||||||||||||
(Dollars in thousands) | Amortized Cost | Estimated Fair Value | Amortized Cost | Estimated Fair Value | |||||||||
Due in one year or less | $ | 19,461 | $ | 19,494 | $ | — | $ | — | |||||
Due from one to five years | 35,592 | 35,699 | 16,171 | 16,373 | |||||||||
Due from five to ten years | 19,749 | 19,752 | 36,861 | 37,206 | |||||||||
Due after ten years | 91,713 | 91,595 | 908 | 919 | |||||||||
Total debt securities | $ | 166,515 | $ | 166,540 | $ | 53,940 | $ | 54,498 | |||||
Included in the $91.6 million fair value of debt securities available-for-sale with a contractual maturity due after ten years as of December 31, 2016, were $80.8 million or 88.2% in floating-rate securities. Included in the $36.9 million amortized cost of debt securities held-to-maturity with a contractual maturity due from five to ten years as of December 31, 2016, were $17.3 million that have call provisions in one to five years that would either mature, if called, or become floating-rate securities after the call date.
Prepayments may shorten the contractual lives of the collateralized mortgage obligations, mortgage-backed securities and collateralized loan obligations.
Proceeds from the sale of investment securities available-for-sale during the years ended December 31, 2016, 2015 and 2014, were $4.7 million, $11.8 million and $69.6 million, respectively. During the year ended December 31, 2016, net gains of $31,000 on these sales were comprised of gross gains of $34,000 and gross losses of $3,000, which were realized and reclassified out of accumulated other comprehensive income (loss). During the year ended December 31, 2015, net gains of $33,000 on these sales were comprised of gross gains of $50,000 and gross losses of $17,000, which were realized and reclassified out of accumulated other comprehensive income (loss). During the during the year ended December 31, 2014, net gains of $1.4 million on these sales were comprised of gross gains of $1.4 million and gross losses of $1,000, which were realized and reclassified out of accumulated other comprehensive income (loss).
104
During the year ended December 31, 2016, there was an investment security held-to-maturity of $2.5 million, which was called and a gross gain of $46,000 was realized on this call.
Investment securities available-for-sale of $5.1 million, as of December 31, 2016, were held in safekeeping at the FHLB and were included in the calculation of borrowing capacity.
The following tables show the fair value and gross unrealized losses on temporarily impaired investment securities available-for-sale and held-to-maturity, by investment category and length of time that the individual securities have been in a continuous unrealized loss position as of December 31, 2016 and December 31, 2015, respectively:
December 31, 2016 | ||||||||||||||||||||
Less than 12 Months | 12 Months or More | Total | ||||||||||||||||||
(Dollars in thousands) | Fair value | Unrealized losses | Fair value | Unrealized losses | Fair value | Unrealized losses | ||||||||||||||
Investment securities available-for-sale: | ||||||||||||||||||||
Corporate bonds | $ | 10,543 | $ | 21 | $ | — | $ | — | $ | 10,543 | $ | 21 | ||||||||
Trust preferred securities | — | — | 9,038 | 72 | 9,038 | 72 | ||||||||||||||
Non-agency collateralized loan obligations | 6,191 | 50 | 9,990 | 4 | 16,181 | 54 | ||||||||||||||
Agency collateralized mortgage obligations | 4,593 | 12 | 34,408 | 267 | 39,001 | 279 | ||||||||||||||
Agency mortgage-backed securities | 12,292 | 198 | — | — | 12,292 | 198 | ||||||||||||||
Equity securities | — | — | 8,352 | 291 | 8,352 | 291 | ||||||||||||||
Total investment securities available-for-sale | 33,619 | 281 | 61,788 | 634 | 95,407 | 915 | ||||||||||||||
Investment securities held-to-maturity: | ||||||||||||||||||||
Corporate bonds | 2,492 | 8 | 1,978 | 22 | 4,470 | 30 | ||||||||||||||
Municipal bonds | 12,559 | 96 | — | — | 12,559 | 96 | ||||||||||||||
Total investment securities held-to-maturity | 15,051 | 104 | 1,978 | 22 | 17,029 | 126 | ||||||||||||||
Total temporarily impaired securities | $ | 48,670 | $ | 385 | $ | 63,766 | $ | 656 | $ | 112,436 | $ | 1,041 | ||||||||
December 31, 2015 | ||||||||||||||||||||
Less than 12 Months | 12 Months or More | Total | ||||||||||||||||||
(Dollars in thousands) | Fair value | Unrealized losses | Fair value | Unrealized losses | Fair value | Unrealized losses | ||||||||||||||
Investment securities available-for-sale: | ||||||||||||||||||||
Corporate bonds | $ | 23,582 | $ | 155 | $ | 6,460 | $ | 82 | $ | 30,042 | $ | 237 | ||||||||
Trust preferred securities | 8,076 | 471 | 8,526 | 507 | 16,602 | 978 | ||||||||||||||
Non-agency mortgage-backed securities | — | — | 5,743 | 13 | 5,743 | 13 | ||||||||||||||
Non-agency collateralized loan obligations | 9,859 | 132 | — | — | 9,859 | 132 | ||||||||||||||
Agency collateralized mortgage obligations | 25,566 | 151 | 11,836 | 114 | 37,402 | 265 | ||||||||||||||
Agency mortgage-backed securities | 1,469 | 15 | 10,811 | 172 | 12,280 | 187 | ||||||||||||||
Equity securities | — | — | 7,759 | 599 | 7,759 | 599 | ||||||||||||||
Total investment securities available-for-sale | 68,552 | 924 | 51,135 | 1,487 | 119,687 | 2,411 | ||||||||||||||
Investment securities held-to-maturity: | ||||||||||||||||||||
Corporate bonds | 9,863 | 84 | — | — | 9,863 | 84 | ||||||||||||||
Municipal bonds | 571 | 1 | — | — | 571 | 1 | ||||||||||||||
Total investment securities held-to-maturity | 10,434 | 85 | — | — | 10,434 | 85 | ||||||||||||||
Total temporarily impaired securities | $ | 78,986 | $ | 1,009 | $ | 51,135 | $ | 1,487 | $ | 130,121 | $ | 2,496 | ||||||||
The change in the fair values of our municipal bonds, agency debentures, agency collateralized mortgage obligations and agency mortgage-backed securities are primarily the result of interest rate fluctuations. To assess for impairment on its municipal bonds, corporate bonds, single-issuer trust preferred securities, non-agency mortgage-backed securities, non-agency collateralized loan obligations and certain equity securities, management evaluates the underlying issuer’s financial performance and the related credit rating information through a review of publicly available financial statements and other publicly available information. This review did not identify any issues related to the ultimate repayment of principal and interest on these securities. In addition, the Company has the ability and intent to hold
105
debt securities in an unrealized loss position until recovery of their amortized cost. Based on this, the Company considers all of the unrealized losses to be temporary impairment losses. Within the available-for-sale portfolio, there were 30 positions, aggregating to $915,000 in unrealized losses that were temporarily impaired as of December 31, 2016, of which there were 12 positions in an unrealized loss position for more than twelve months totaling $634,000. As of December 31, 2015, there were 36 positions, aggregating to $2.4 million in unrealized losses that were temporarily impaired, of which there were 14 positions in an unrealized loss position for more than twelve months totaling $1.5 million. Within the held-to-maturity portfolio, there were 18 positions, aggregating to $126,000 in unrealized losses that were temporarily impaired as of December 31, 2016, of which there was one position in an unrealized loss position for more than twelve months for $22,000. As of December 31, 2015, there were six positions, aggregating to $85,000 in unrealized losses that were temporarily impaired within the held-to-maturity portfolio, of which there were no positions in an unrealized loss position for more than twelve months.
There were no investment securities classified as trading securities outstanding as of December 31, 2016 and December 31, 2015.
Proceeds from the sale of investment securities trading, comprised of U.S. Treasury Notes, during the years ended December 31, 2016, 2015 and 2014, were $0, $5.0 million and $0, respectively. Income on investment securities trading during the years ended December 31, 2016, 2015 and 2014, was $0, $20,000 and $0, respectively.
There was $9.6 million and $9.8 million in FHLB stock outstanding as of December 31, 2016 and December 31, 2015, respectively. There were $161,000 of net redemptions in FHLB stock during the year ended December 31, 2016, $4.1 million of net purchases during the year ended December 31, 2015, and $3.4 million of net purchases in FHLB stock during the year ended December 31, 2014.
[4] FEDERAL HOME LOAN BANK STOCK
The Company is a member of the FHLB system. As a member of the FHLB of Pittsburgh, the Company must maintain a minimum investment in the capital stock of the FHLB in an amount equal to 4.00% of its outstanding advances, if any, 0.75% of its issued letters of credits, if any, and 0.10% of its membership asset value, as defined, with the FHLB. The FHLB has the ability to change the calculation of the required stock investment at any time. The Company held stock totaling $9.6 million and $9.8 million at December 31, 2016 and 2015, respectively. At December 31, 2016, $8.8 million of stock was required based on the Bank’s membership asset value, as defined, of approximately $632.0 million, $205.0 million in outstanding advances and $1.1 million in issued letters of credit. The Company received dividends from its holdings in FHLB capital stock of $494,000, $389,000 and $172,000 for the years ended December 31, 2016, 2015 and 2014, respectively.
[5] LOANS
The Company generates loans through the private banking and middle-market channels. These channels provide risk diversification and offer significant growth opportunities. The private banking channel includes loans secured by cash, marketable securities and other asset-based loans to executives, high-net-worth individuals, trusts and businesses, many of whom we source through referral relationships with independent broker/dealers, wealth managers, family offices, trust companies and other financial intermediaries. The middle-market banking channel consists of our commercial and industrial (“C&I”) and commercial real estate (“CRE”) loan portfolios that serve middle-market businesses and real estate developers.
Loans held-for-investment were comprised of the following:
December 31, 2016 | ||||||||||||
(Dollars in thousands) | Private Banking | Commercial and Industrial | Commercial Real Estate | Total | ||||||||
Loans held-for-investment, before deferred fees | $ | 1,732,578 | $ | 587,791 | $ | 1,080,637 | $ | 3,401,006 | ||||
Net deferred loan (fees) costs | 3,350 | (368 | ) | (2,934 | ) | 48 | ||||||
Loans held-for-investment, net of deferred fees | 1,735,928 | 587,423 | 1,077,703 | 3,401,054 | ||||||||
Allowance for loan losses | (1,424 | ) | (12,326 | ) | (5,012 | ) | (18,762 | ) | ||||
Loans held-for-investment, net | $ | 1,734,504 | $ | 575,097 | $ | 1,072,691 | $ | 3,382,292 | ||||
106
December 31, 2015 | ||||||||||||
(Dollars in thousands) | Private Banking | Commercial and Industrial | Commercial Real Estate | Total | ||||||||
Loans held-for-investment, before deferred fees | $ | 1,341,988 | $ | 634,857 | $ | 864,863 | $ | 2,841,708 | ||||
Net deferred loan (fees) costs | 2,876 | (625 | ) | (2,675 | ) | (424 | ) | |||||
Loans held-for-investment, net of deferred fees | 1,344,864 | 634,232 | 862,188 | 2,841,284 | ||||||||
Allowance for loan losses | (1,566 | ) | (11,064 | ) | (5,344 | ) | (17,974 | ) | ||||
Loans held-for-investment, net | $ | 1,343,298 | $ | 623,168 | $ | 856,844 | $ | 2,823,310 | ||||
The Company’s customers have unused loan commitments. Often these commitments are not fully utilized and therefore the total amount does not necessarily represent future cash requirements. The amount of unfunded commitments, including standby letters of credit, as of December 31, 2016 and December 31, 2015, was $1.75 billion and $1.27 billion, respectively. The interest rate for each commitment is based on the prevailing market conditions at the time of funding. The lending commitment maturities as of December 31, 2016, were as follows: $1.45 billion in one year or less; $180.9 million in one to three years; and $117.2 million in greater than three years. The reserve for losses on unfunded commitments was $650,000 and $546,000, as of December 31, 2016 and December 31, 2015, respectively, which includes reserves for probable losses on unfunded loan commitments, including standby letters of credit and also risk participations.
Included in the unfunded commitment totals listed above, were loans in the process of origination totaling approximately $59.8 million and $31.1 million as of December 31, 2016 and December 31, 2015, respectively, which extend over varying periods of time.
The Company issues standby letters of credit in the normal course of business. Standby letters of credit are conditional commitments issued to guarantee the performance of a customer to a third party. Standby letters of credit generally are contingent upon the failure of the customer to perform according to the terms of the underlying contract with the third party. The Company would be required to perform under the standby letters of credit when drawn upon by the guaranteed party in the case of non-performance by the Company’s customer. Collateral may be obtained based on management’s credit assessment of the customer. The amount of unfunded commitments related to standby letters of credit as of December 31, 2016 and December 31, 2015, included in the total unfunded commitments above, was $77.4 million and $89.9 million, respectively. Should the Company be obligated to perform under the standby letters of credit the Company will seek repayment from the customer for amounts paid. As of December 31, 2016 and December 31, 2015, $42.3 million and $36.8 million, respectively, in standby letters of credit will expire within one year, while the remaining standby letters of credit will expire in periods greater than one year. During the year ended December 31, 2016, there were three draws on standby letters of credit totaling $151,000, which were immediately repaid by the borrower or converted to an outstanding loan based on the contractual terms and subsequently repaid. During the year ended December 31, 2015, there were two standby letters of credit drawn for $146,000 which were immediately repaid by the borrower or converted to an outstanding loan based on the contractual terms and subsequently repaid. Most of these commitments are expected to expire without being drawn upon and the total amount does not necessarily represent future cash requirements. The probable liability for losses on standby letters of credit was included in the reserve for losses on unfunded commitments.
The Company has entered into risk participation agreements with financial institution counterparties for interest rate swaps related to loans in which we are a participant. The risk participation agreements provide credit protection to the financial institution counterparties should the customers fail to perform on their interest rate derivative contracts. The potential liability for outstanding obligations was included in the reserve for losses on unfunded commitments.
As of December 31, 2016 and December 31, 2015, 91.1% and 91.5%, respectively, of the commercial loan portfolio was comprised of loans to customers within the Company’s primary market areas of Pennsylvania, Ohio, New Jersey, New York and contiguous states. As a result, the loan portfolio is subject to the general economic conditions within those areas. The Company evaluates each customer’s creditworthiness on an individual basis. The amount of collateral obtained by the Company upon extension of credit is based on management’s credit evaluation of the borrower. The Company does not believe it has significant concentrations of credit risk to any one group of borrowers given its underwriting and collateral requirements.
The Company’s loan portfolio is comprised of amortizing loans, where scheduled principal and interest payments are applied according to the terms of the loan agreement, as well as interest-only loans. As of December 31, 2016 and December 31, 2015, interest-only loans represented 69.0% and 67.7% of the loans held-for-investment, respectively. Of the total interest-only loans as of December 31, 2016, 77.0% were lines of credit, 3.4% were construction loans and the remaining 19.7% were closed-end term loans which will either convert to an amortizing loan with required principal and interest payments or require a balloon payment of the total principal at maturity. Of the total interest-only loans as of December 31, 2015, 72.9% were lines of credit, 5.7% were construction loans and the remaining 21.4% were closed-end term loans which will either convert to an amortizing loan with required principal and interest payments or require a balloon payment of the total principal at maturity.
107
There were $1.55 billion in loans that are due on demand with no stated maturity and $1.85 billion in loans with stated maturities which have an expected average remaining maturity of approximately four years as of December 31, 2016, compared to $1.14 billion in loans that are due on demand with no stated maturity and $1.70 billion in loans with stated maturities which have an expected average remaining maturity of approximately four years as of December 31, 2015. 88.6% and 84.9% of the portfolio was comprised of variable rate loans as of December 31, 2016 and December 31, 2015, respectively. Further, 2.8% of variable rate loans had interest rates below their floors, with an average interest rate of 4.59% as of December 31, 2016, compared to 5.9% of variable rate loans had interest rates below their floors, with an average interest rate of 4.59% as of December 31, 2015.
[6] ALLOWANCE FOR LOAN LOSSES
Our allowance for loan losses represents our estimate of probable loan losses inherent in the loan portfolio at a specific point in time. This estimate includes losses associated with specifically identified loans, as well as estimated probable credit losses inherent in the remainder of the loan portfolio. Additions are made to the allowance through both periodic provisions recorded to income and recoveries of losses previously incurred. Reductions to the allowance occur as loans are charged off or when the credit history of any of the three loan portfolios improves. Management evaluates the adequacy of the allowance at least quarterly, and in doing so relies on various factors including, but not limited to, assessment of historical loss experience, delinquency and non-accrual trends, portfolio growth, underlying collateral coverage and current economic conditions. This evaluation is subjective and requires material estimates that may change over time. In addition, management evaluates the overall methodology for the allowance for loan losses on an annual basis. The calculation of the allowance for loan losses takes into consideration the inherent risk identified within each of the Company’s three primary loan portfolios, private banking, commercial and industrial and commercial real estate. In addition, management takes into account the historical loss experience of each loan portfolio, to ensure that the resultant allowance for loan losses is sufficient to cover probable losses inherent in such loan portfolios. Refer to Note 1, Summary of Significant Accounting Policies, for more details on the Company’s allowance for loan losses policy.
The following discusses key characteristics and risks within each primary loan portfolio:
Private Banking Loans
Our private banking lending activities are conducted on a national basis. This loan portfolio primarily includes loans made to high-net-worth individuals, trusts and businesses that are typically secured by cash and marketable securities. Some loans are secured by residential real estate or other financial assets. The portfolio also has lines of credit and unsecured loans. The primary sources of repayment for these loans are the income and/or assets of the borrower.
The underlying collateral is the most important indicator of risk for this loan portfolio. The overall lower risk profile of this portfolio is driven by loans secured by cash and marketable securities, which was 91.3% and 87.8% of total private banking loans as of December 31, 2016 and 2015, respectively.
Middle-Market Banking: Commercial and Industrial Loans
This loan portfolio primarily includes loans made to service companies or manufacturers generally for the purpose of production, operating capacity, accounts receivable, inventory or equipment financing, acquisitions and recapitalizations. Cash flow from the borrower’s operations is the primary source of repayment for these loans.
The industry of the borrower is an important indicator of risk, but there are also more specific risks depending on the condition of the local/regional economy. Collateral for these types of loans at times does not have sufficient value in a distressed or liquidation scenario to satisfy the outstanding debt. Any C&I loans collateralized by cash and marketable securities are treated the same as private banking loans for purposes of the allowance for loan loss calculation. In addition, shared national credit loans that also involve a private equity sponsor are combined as a homogeneous group and evaluated separately based on the historical loss trend of such loans.
Middle-Market Banking: Commercial Real Estate Loans
This loan portfolio includes loans secured by commercial purpose real estate, including both owner occupied properties and investment properties for various purposes including office, retail, industrial, multifamily and hospitality. Individual project cash flows, global cash flows and liquidity from the developer, or the sale of the property are the primary sources of repayment for these loans. Also included are commercial construction loans to finance the construction or renovation of structures as well as to finance the acquisition and development of raw land for various purposes. The increased level of risk of these loans is generally confined to the construction period. If there are problems, the project may not be completed, and as such, may not provide sufficient cash flow on its own to service the debt or have sufficient value in a liquidation to cover the outstanding principal.
The underlying purpose/collateral of the loans is an important indicator of risk for this loan portfolio. Additional risks exist and are dependent on several factors such as the condition of the local/regional economy, whether or not the project is owner occupied, the type of project, and the experience and resources of the developer.
108
Management further assesses risk within each loan portfolio using key inherent risk differentiators. The components of the allowance for loan losses represent estimates based upon ASC Topic 450, Contingencies, and ASC Topic 310, Receivables. ASC Topic 450 applies to homogeneous loan pools such as consumer installment, residential mortgages and consumer lines of credit, as well as commercial loans that are not individually evaluated for impairment under ASC Topic 310. Impaired loans are individually evaluated for impairment under ASC Topic 310.
On a monthly basis, management monitors various credit quality indicators for both the commercial and consumer loan portfolios, including delinquency, non-performing status, changes in risk ratings, changes in the underlying performance of the borrowers and other relevant factors. On a daily basis, the Company monitors the collateral of margin loans secured by cash and marketable securities within the private banking portfolio which further reduces the risk profile of that portfolio. Refer to Note 1, Summary of Significant Accounting Policies, for the Company’s policy for determining past due status of loans.
Management continually monitors the loan portfolio through its internal risk rating system. Loan risk ratings are assigned based upon the creditworthiness of the borrower and the quality of the collateral for our loans secured by marketable securities. Loan risk ratings are reviewed on an ongoing basis according to internal policies. Loans within the pass rating are believed to have a lower risk of loss than loans risk rated as special mention, substandard and doubtful, which are believed to have an increasing risk of loss.
The Company’s risk ratings are consistent with regulatory guidance and are as follows:
Pass – The loan is currently performing in accordance with its contractual terms.
Special Mention – A special mention loan has potential weaknesses that warrant management’s close attention. If left uncorrected, these potential weaknesses may result in deterioration of the repayment prospects or in our credit position at some future date. Economic and market conditions, beyond the customer’s control, may in the future necessitate this classification.
Substandard – A substandard loan is not adequately protected by the net worth and/or paying capacity of the obligor or by the collateral pledged, if any. Substandard loans have a well-defined weakness, or weaknesses that jeopardize the liquidation of the debt. These loans are characterized by the distinct possibility that the Company will sustain some loss if the deficiencies are not corrected.
Doubtful – A doubtful loan has all the weaknesses inherent in a loan categorized as substandard with the added characteristic that the weaknesses make collection or liquidation in full, on the basis of currently existing facts, conditions and values, highly questionable and improbable.
The following tables present the recorded investment in loans by credit quality indicator:
December 31, 2016 | ||||||||||||
(Dollars in thousands) | Private Banking | Commercial and Industrial | Commercial Real Estate | Total | ||||||||
Pass | $ | 1,735,404 | $ | 545,276 | $ | 1,077,703 | $ | 3,358,383 | ||||
Special mention | — | 18,776 | — | 18,776 | ||||||||
Substandard | 524 | 23,371 | — | 23,895 | ||||||||
Doubtful | — | — | — | — | ||||||||
Loans held-for-investment | $ | 1,735,928 | $ | 587,423 | $ | 1,077,703 | $ | 3,401,054 | ||||
December 31, 2015 | ||||||||||||
(Dollars in thousands) | Private Banking | Commercial and Industrial | Commercial Real Estate | Total | ||||||||
Pass | $ | 1,342,813 | $ | 585,561 | $ | 858,396 | $ | 2,786,770 | ||||
Special mention | — | 31,863 | 880 | 32,743 | ||||||||
Substandard | 2,051 | 15,835 | 2,912 | 20,798 | ||||||||
Doubtful | — | 973 | — | 973 | ||||||||
Loans held-for-investment | $ | 1,344,864 | $ | 634,232 | $ | 862,188 | $ | 2,841,284 | ||||
109
Changes in the allowance for loan losses were as follows for the years ended December 31, 2016, 2015 and 2014:
Year Ended December 31, 2016 | ||||||||||||
(Dollars in thousands) | Private Banking | Commercial and Industrial | Commercial Real Estate | Total | ||||||||
Balance, beginning of period | $ | 1,566 | $ | 11,064 | $ | 5,344 | $ | 17,974 | ||||
Provision (credit) for loan losses | (142 | ) | 4,723 | (3,743 | ) | 838 | ||||||
Charge-offs | — | (4,258 | ) | — | (4,258 | ) | ||||||
Recoveries | — | 797 | 3,411 | 4,208 | ||||||||
Balance, end of period | $ | 1,424 | $ | 12,326 | $ | 5,012 | $ | 18,762 | ||||
Year Ended December 31, 2015 | ||||||||||||
(Dollars in thousands) | Private Banking | Commercial and Industrial | Commercial Real Estate | Total | ||||||||
Balance, beginning of period | $ | 2,017 | $ | 13,501 | $ | 4,755 | $ | 20,273 | ||||
Provision (credit) for loan losses | (464 | ) | (112 | ) | 589 | 13 | ||||||
Charge-offs | — | (3,353 | ) | — | (3,353 | ) | ||||||
Recoveries | 13 | 1,028 | — | 1,041 | ||||||||
Balance, end of period | $ | 1,566 | $ | 11,064 | $ | 5,344 | $ | 17,974 | ||||
Year Ended December 31, 2014 | ||||||||||||
(Dollars in thousands) | Private Banking | Commercial and Industrial | Commercial Real Estate | Total | ||||||||
Balance, beginning of period | $ | 2,011 | $ | 11,881 | $ | 5,104 | $ | 18,996 | ||||
Provision (credit) for loan losses | (88 | ) | 10,596 | (349 | ) | 10,159 | ||||||
Charge-offs | — | (9,521 | ) | — | (9,521 | ) | ||||||
Recoveries | 94 | 545 | — | 639 | ||||||||
Balance, end of period | $ | 2,017 | $ | 13,501 | $ | 4,755 | $ | 20,273 | ||||
Charge-offs of $4.3 million for the year ended December 31, 2016, included one C&I loan, which were mostly offset by recoveries of $4.2 million on six C&I loans and one CRE loan. Charge-offs of $3.4 million for the year ended December 31, 2015, included one C&I loan, which were partially offset by recoveries of $1.0 million on four C&I loans and one private banking loan. Charge-offs of $9.5 million for the year ended December 31, 2014, included six C&I loans, which were partially offset by recoveries of $639,000 on three C&I loans and one private banking loan.
The following tables present the age analysis of past due loans segregated by class of loan:
December 31, 2016 | ||||||||||||||||||
(Dollars in thousands) | 30-59 Days Past Due | 60-89 Days Past Due | Loans Past Due 90 Days or More | Total Past Due | Current | Total | ||||||||||||
Private banking | $ | — | $ | — | $ | 224 | $ | 224 | $ | 1,735,704 | $ | 1,735,928 | ||||||
Commercial and industrial | — | — | 7,181 | 7,181 | 580,242 | 587,423 | ||||||||||||
Commercial real estate | — | — | — | — | 1,077,703 | 1,077,703 | ||||||||||||
Loans held-for-investment | $ | — | $ | — | $ | 7,405 | $ | 7,405 | $ | 3,393,649 | $ | 3,401,054 | ||||||
110
December 31, 2015 | ||||||||||||||||||
(Dollars in thousands) | 30-59 Days Past Due | 60-89 Days Past Due | Loans Past Due 90 Days or More | Total Past Due | Current | Total | ||||||||||||
Private banking | $ | — | $ | — | $ | 1,431 | $ | 1,431 | $ | 1,343,433 | $ | 1,344,864 | ||||||
Commercial and industrial | — | — | 976 | 976 | 633,256 | 634,232 | ||||||||||||
Commercial real estate | — | — | 2,912 | 2,912 | 859,276 | 862,188 | ||||||||||||
Loans held-for-investment | $ | — | $ | — | $ | 5,319 | $ | 5,319 | $ | 2,835,965 | $ | 2,841,284 | ||||||
Non-Performing and Impaired Loans
Management monitors the delinquency status of the loan portfolio on a monthly basis. Loans are considered non-performing when interest and principal were 90 days or more past due or management has determined that it is probable the borrower is unable to meet payments as they become due. The risk of loss is generally highest for non-performing loans.
Management determines loans to be impaired when, based upon current information and events, it is probable that the loan will not be repaid according to the original contractual terms of the loan agreement, including both principal and interest, or if a loan is designated as a TDR. Refer to Note 1, Summary of Significant Accounting Policies, for the Company’s policy on evaluating loans for impairment and interest income.
The following tables present the Company’s investment in loans considered to be impaired and related information on those impaired loans:
As of and for the Year Ended December 31, 2016 | |||||||||||||||
(Dollars in thousands) | Recorded Investment | Unpaid Principal Balance | Related Allowance | Average Recorded Investment | Interest Income Recognized | ||||||||||
With a related allowance recorded: | |||||||||||||||
Private banking | $ | 517 | $ | 656 | $ | 517 | $ | 592 | $ | — | |||||
Commercial and industrial | 17,273 | 26,126 | 6,422 | 19,158 | — | ||||||||||
Commercial real estate | — | — | — | — | — | ||||||||||
Total with a related allowance recorded | 17,790 | 26,782 | 6,939 | 19,750 | — | ||||||||||
Without a related allowance recorded: | |||||||||||||||
Private banking | — | — | — | — | — | ||||||||||
Commercial and industrial | 471 | 487 | — | 485 | 26 | ||||||||||
Commercial real estate | — | — | — | — | — | ||||||||||
Total without a related allowance recorded | 471 | 487 | — | 485 | 26 | ||||||||||
Total: | |||||||||||||||
Private banking | 517 | 656 | 517 | 592 | — | ||||||||||
Commercial and industrial | 17,744 | 26,613 | 6,422 | 19,643 | 26 | ||||||||||
Commercial real estate | — | — | — | — | — | ||||||||||
Total | $ | 18,261 | $ | 27,269 | $ | 6,939 | $ | 20,235 | $ | 26 | |||||
111
As of and for the Year Ended December 31, 2015 | |||||||||||||||
(Dollars in thousands) | Recorded Investment | Unpaid Principal Balance | Related Allowance | Average Recorded Investment | Interest Income Recognized | ||||||||||
With a related allowance recorded: | |||||||||||||||
Private banking | $ | 745 | $ | 864 | $ | 745 | $ | 824 | $ | — | |||||
Commercial and industrial | 11,797 | 19,204 | 3,800 | 15,331 | — | ||||||||||
Commercial real estate | — | — | — | — | — | ||||||||||
Total with a related allowance recorded | 12,542 | 20,068 | 4,545 | 16,155 | — | ||||||||||
Without a related allowance recorded: | |||||||||||||||
Private banking | 1,203 | 1,448 | — | 1,202 | — | ||||||||||
Commercial and industrial | 513 | 1,789 | — | 838 | 29 | ||||||||||
Commercial real estate | 2,912 | 9,067 | — | 3,108 | — | ||||||||||
Total without a related allowance recorded | 4,628 | 12,304 | — | 5,148 | 29 | ||||||||||
Total: | |||||||||||||||
Private banking | 1,948 | 2,312 | 745 | 2,026 | — | ||||||||||
Commercial and industrial | 12,310 | 20,993 | 3,800 | 16,169 | 29 | ||||||||||
Commercial real estate | 2,912 | 9,067 | — | 3,108 | — | ||||||||||
Total | $ | 17,170 | $ | 32,372 | $ | 4,545 | $ | 21,303 | $ | 29 | |||||
As of and for the Year Ended December 31, 2014 | |||||||||||||||
(Dollars in thousands) | Recorded Investment | Unpaid Principal Balance | Related Allowance | Average Recorded Investment | Interest Income Recognized | ||||||||||
With a related allowance recorded: | |||||||||||||||
Private banking | $ | 681 | $ | 767 | $ | 681 | $ | 746 | $ | — | |||||
Commercial and industrial | 24,402 | 34,459 | 4,902 | 27,014 | — | ||||||||||
Commercial real estate | — | — | — | — | — | ||||||||||
Total with a related allowance recorded | 25,083 | 35,226 | 5,583 | 27,760 | — | ||||||||||
Without a related allowance recorded: | |||||||||||||||
Private banking | 1,388 | 1,632 | — | 1,444 | — | ||||||||||
Commercial and industrial | 791 | 2,013 | — | 953 | 27 | ||||||||||
Commercial real estate | 3,498 | 9,705 | — | 3,498 | — | ||||||||||
Total without a related allowance recorded | 5,677 | 13,350 | — | 5,895 | 27 | ||||||||||
Total: | |||||||||||||||
Private banking | 2,069 | 2,399 | 681 | 2,190 | — | ||||||||||
Commercial and industrial | 25,193 | 36,472 | 4,902 | 27,967 | 27 | ||||||||||
Commercial real estate | 3,498 | 9,705 | — | 3,498 | — | ||||||||||
Total | $ | 30,760 | $ | 48,576 | $ | 5,583 | $ | 33,655 | $ | 27 | |||||
Impaired loans as of December 31, 2016 and December 31, 2015, were $18.3 million and $17.2 million, respectively. There was no interest income recognized, while on non-accrual status, for the years ended December 31, 2016, 2015 and 2014. As of December 31, 2016 and December 31, 2015, there were no loans 90 days or more past due and still accruing interest income.
Impaired loans were evaluated using a discounted cash flow method or based on the fair value of the collateral less estimated selling costs. Based on those evaluations, as of December 31, 2016, there were specific reserves totaling $6.9 million, which were included in the $18.8 million allowance for loan losses. Also included in impaired loans was one C&I loan with a balance of $471,000 as of December 31, 2016, with no corresponding specific reserve since this loan had a net realizable value that management believes will be recovered from the borrower.
As of December 31, 2015, there were specific reserves totaling $4.5 million, which were included in the $18.0 million allowance for loan losses. Also included in impaired loans were three C&I loans, one CRE loan and two private banking loans with a combined balance of $4.6 million as of December 31, 2015, with no corresponding specific reserves since these loans had a net realizable value that management believes will be recovered from the borrower.
112
The following tables present the allowance for loan losses and recorded investment in loans by class:
December 31, 2016 | ||||||||||||
(Dollars in thousands) | Private Banking | Commercial and Industrial | Commercial Real Estate | Total | ||||||||
Allowance for loan losses: | ||||||||||||
Individually evaluated for impairment | $ | 517 | $ | 6,422 | $ | — | $ | 6,939 | ||||
Collectively evaluated for impairment | 907 | 5,904 | 5,012 | 11,823 | ||||||||
Total allowance for loan losses | $ | 1,424 | $ | 12,326 | $ | 5,012 | $ | 18,762 | ||||
Loans held-for-investment: | ||||||||||||
Individually evaluated for impairment | $ | 517 | $ | 17,744 | $ | — | $ | 18,261 | ||||
Collectively evaluated for impairment | 1,735,411 | 569,679 | 1,077,703 | 3,382,793 | ||||||||
Loans held-for-investment | $ | 1,735,928 | $ | 587,423 | $ | 1,077,703 | $ | 3,401,054 | ||||
December 31, 2015 | ||||||||||||
(Dollars in thousands) | Private Banking | Commercial and Industrial | Commercial Real Estate | Total | ||||||||
Allowance for loan losses: | ||||||||||||
Individually evaluated for impairment | $ | 745 | $ | 3,800 | $ | — | $ | 4,545 | ||||
Collectively evaluated for impairment | 821 | 7,264 | 5,344 | 13,429 | ||||||||
Total allowance for loan losses | $ | 1,566 | $ | 11,064 | $ | 5,344 | $ | 17,974 | ||||
Loans held-for-investment: | ||||||||||||
Individually evaluated for impairment | $ | 1,948 | $ | 12,310 | $ | 2,912 | $ | 17,170 | ||||
Collectively evaluated for impairment | 1,342,916 | 621,922 | 859,276 | 2,824,114 | ||||||||
Loans held-for-investment | $ | 1,344,864 | $ | 634,232 | $ | 862,188 | $ | 2,841,284 | ||||
Troubled Debt Restructuring
The following table provides additional information on the Company’s loans designated as troubled debt restructurings:
(Dollars in thousands) | December 31, 2016 | December 31, 2015 | ||||
Aggregate recorded investment of impaired loans with terms modified through a troubled debt restructuring: | ||||||
Accruing interest | $ | 471 | $ | 510 | ||
Non-accrual | 17,273 | 12,894 | ||||
Total troubled debt restructurings | $ | 17,744 | $ | 13,404 | ||
Of the non-accrual loans as of December 31, 2016, four C&I loans were designated by the Company as TDRs. There was also one C&I loan that was still accruing interest and designated by the Company as a performing TDR as of December 31, 2016. The aggregate recorded investment of these loans was $17.7 million. There were unused commitments of $121,000 on these loans as of December 31, 2016, of which $7,000 was related to the performing TDR.
Of the non-accrual loans as of December 31, 2015, five C&I loans and one private banking residential mortgage loan were designated by the Company as TDRs. There was also one C&I loan that was still accruing interest and designated by the Company as a performing TDR as of December 31, 2015. The aggregate recorded investment of these loans was $13.4 million. There were unused commitments of $1.7 million on these loans as of December 31, 2015, of which $39,000 was related to the performing TDR.
The modifications made to restructured loans typically consist of an extension of the payment terms, or the deferral of principal payments. There was one C&I loan for $7.2 million that was modified as a TDR within twelve months of the corresponding balance sheet date with a payment default during the year ended December 31, 2016. This loan was already on non-accrual status and adequately reserved as of December 31, 2016. There were loans totaling $973,000 and $0 with payment defaults, during the years ended December 31, 2015 and 2014, for loans modified as TDRs within twelve months of the corresponding balance sheet dates.
113
The financial effects of our modifications made to loans newly designated as TDRs during the years ended December 31, 2016, 2015 and 2014, were as follows:
Year Ended December 31, 2016 | |||||||||||||
(Dollars in thousands) | Count | Recorded Investment at the time of Modification | Current Recorded Investment | Allowance for Loan Losses at the time of Modification | Current Allowance for Loan Losses | ||||||||
Commercial and industrial: | |||||||||||||
Extended term and deferred principal | 2 | $ | 11,098 | $ | 11,081 | $ | 2,354 | $ | 3,274 | ||||
Total | 2 | $ | 11,098 | $ | 11,081 | $ | 2,354 | $ | 3,274 | ||||
Year Ended December 31, 2015 | |||||||||||||
(Dollars in thousands) | Count | Recorded Investment at the time of Modification | Current Recorded Investment | Allowance for Loan Losses at the time of Modification | Current Allowance for Loan Losses | ||||||||
Commercial and industrial: | |||||||||||||
Change in interest terms | 1 | $ | 4,064 | $ | — | $ | 400 | $ | — | ||||
Extended term and deferred principal | 1 | 433 | — | 433 | — | ||||||||
Deferred principal | 2 | 6,849 | 973 | 1,500 | 172 | ||||||||
Total | 4 | $ | 11,346 | $ | 973 | $ | 2,333 | $ | 172 | ||||
Year Ended December 31, 2014 | |||||||||||||
(Dollars in thousands) | Count | Recorded Investment at the time of Modification | Current Recorded Investment | Allowance for Loan Losses at the time of Modification | Current Allowance for Loan Losses | ||||||||
Private banking: | |||||||||||||
Extended term, reduced interest rate | 1 | $ | 1,266 | $ | 1,094 | $ | 100 | $ | — | ||||
Commercial and industrial: | |||||||||||||
Extended term, advanced additional funds, forgave principal | 1 | 5,218 | 4,620 | 1,968 | 1,120 | ||||||||
Total | 2 | $ | 6,484 | $ | 5,714 | $ | 2,068 | $ | 1,120 | ||||
Other Real Estate Owned
During the year ended December 31, 2016, collateral related to an impaired loan was transferred to OREO at a fair value of $3.6 million based on the appraised value, less estimated selling costs. In addition, a property was sold from other real estate owned for $1.1 million with a net gain of $7,000 realized during the year ended December 31, 2016. As of December 31, 2016 and December 31, 2015, the balance of the other real estate owned portfolio was $4.2 million and $1.7 million, respectively. There were no residential mortgage loans that were in the process of foreclosure as of December 31, 2016, and two residential mortgage loans totaling $1.2 million that were in the process of foreclosure as of December 31, 2015, that were subsequently paid off.
[7] GOODWILL AND OTHER INTANGIBLE ASSETS
Goodwill represents the excess of the purchase price over the fair value of net assets acquired. Goodwill of $4.6 million and other intangible assets of $13.6 million were recorded during the year ended December 31, 2016, related to the TKG acquisition.
The following table presents the change in goodwill for the years ended December 31, 2016 and 2015:
(Dollars in thousands) | 2016 | 2015 | ||||
Balance, beginning of period | $ | 34,163 | $ | 34,163 | ||
Additions | 4,561 | — | ||||
Balance, end of period | $ | 38,724 | $ | 34,163 | ||
114
The Company determined the amount of identifiable intangible assets based upon an independent valuation. The following table presents the change in intangible assets for the years ended December 31, 2016 and 2015:
(Dollars in thousands) | 2016 | 2015 | ||||
Balance, beginning of period | $ | 16,653 | $ | 18,211 | ||
Additions | 13,585 | — | ||||
Amortization | (1,753 | ) | (1,558 | ) | ||
Balance, end of period | $ | 28,485 | $ | 16,653 | ||
The following table presents the ending balance of intangible assets as of the dates presented and original, estimated useful life by class:
December 31, 2016 | December 31, 2015 | ||||||||||||||||||
(Dollars in thousands) | Gross Amount | Accumulated Amortization | Net Carrying Amount | Gross Amount | Accumulated Amortization | Net Carrying Amount | |||||||||||||
Trade name | $ | 4,040 | $ | (245 | ) | $ | 3,795 | $ | 1,190 | $ | (109 | ) | $ | 1,081 | |||||
Client Relationships: | |||||||||||||||||||
Sub-advisory client list | 11,530 | (2,371 | ) | 9,159 | 11,200 | (1,521 | ) | 9,679 | |||||||||||
Separate managed accounts client list | 1,810 | (344 | ) | 1,466 | 1,095 | (201 | ) | 894 | |||||||||||
Other institutional client list | 5,950 | (1,532 | ) | 4,418 | 5,950 | (992 | ) | 4,958 | |||||||||||
Non-compete agreements | 465 | (118 | ) | 347 | 75 | (34 | ) | 41 | |||||||||||
Total finite-lived intangibles | 23,795 | (4,610 | ) | 19,185 | 19,510 | (2,857 | ) | 16,653 | |||||||||||
Client Relationships: | |||||||||||||||||||
Mutual fund client relationships (indefinite-lived) | 9,300 | — | 9,300 | — | — | — | |||||||||||||
Total intangibles assets | $ | 33,095 | $ | (4,610 | ) | $ | 28,485 | $ | 19,510 | $ | (2,857 | ) | $ | 16,653 | |||||
Intangible amortization expense on finite-lived intangible assets totaled $1.8 million, $1.6 million and $1.3 million for the years ended December 31, 2016, 2015 and 2014, respectively.
The following is a summary of the expected intangible amortization expense for finite-lived intangibles assets, assuming no new additions, for each of the five years following December 31, 2016:
(Dollars in thousands) | Amount | ||
2017 | $ | 1,851 | |
2018 | 1,835 | ||
2019 | 1,832 | ||
2020 | 1,767 | ||
2021 | 1,735 | ||
Thereafter | 10,165 | ||
Total finite-lived intangibles | $ | 19,185 | |
[8] OFFICE PROPERTIES AND EQUIPMENT
Following is a summary of office properties and equipment by major classification:
December 31, | ||||||
(Dollars in thousands) | 2016 | 2015 | ||||
Furniture, fixtures and equipment | $ | 9,057 | $ | 7,890 | ||
Leasehold improvements | 5,743 | 3,953 | ||||
Total, at cost | 14,800 | 11,843 | ||||
Less: accumulated depreciation | (9,329 | ) | (8,004 | ) | ||
Net office properties and equipment | $ | 5,471 | $ | 3,839 | ||
Depreciation expense was $1.3 million, $1.3 million and $1.2 million for the years ended December 31, 2016, 2015 and 2014, respectively.
115
The Company rents office space in its six office locations which are accounted for as operating leases. The remaining lease terms have expirations from 2017 to 2024 and provide for one or more renewal options. All of the leases provide for annual rent escalations and payment of certain operating expenses applicable to the leased space. The Company records rent expense on a straight-line basis over the term of the lease. Rent expense was $2.3 million, $2.3 million and $1.9 million for the years ended December 31, 2016, 2015 and 2014, respectively. The net deferred rent liability was $973,000 as of December 31, 2016.
At December 31, 2016, future minimum lease payments were as follows:
(Dollars in thousands) | Amount | ||
2017 | $ | 2,243 | |
2018 | 2,395 | ||
2019 | 2,390 | ||
2020 | 2,338 | ||
2021 | 1,272 | ||
Thereafter | 1,342 | ||
Total | $ | 11,980 | |
In May 2016, the Company entered into a lease for new space for Chartwell’s office in Berwyn for a period of 90 months, beginning November 1, 2016, which coincided with the expiration of the previous lease for that office. In February 2016, the operating lease for the Bank’s office in Cleveland was renewed for a period of 71 months
In April 2015, the Company entered into a lease for new space for the Banks’ office in New Jersey for a period of 62 months, beginning September 19, 2015, which coincided with the expiration of the previous lease for that office.
In August 2014, the Company entered into a lease amendment for additional space for the Bank’s office in Pittsburgh for a period of 74 months, beginning January 1, 2015. In March 2014, the operating lease for the Bank’s office in New York was renewed for a period of 90 months.
In conjunction with certain office leases the Company has received an allowance for leasehold improvements which is recognized as a reduction to rent expense over the life of the corresponding lease. The amount remaining as of December 31, 2016, of the total unrecognized allowance for leasehold improvements was $1.2 million.
[9] DEPOSITS
As of December 31, 2016 and December 31, 2015, deposits were comprised of the following:
Interest Rate Range as of | Weighted Average Interest Rate as of | Balance as of | |||||||||
(Dollars in thousands) | December 31, 2016 | December 31, 2016 | December 31, 2015 | December 31, 2016 | December 31, 2015 | ||||||
Demand and savings accounts: | |||||||||||
Noninterest-bearing checking accounts | — | — | — | $ | 230,226 | $ | 159,859 | ||||
Interest-bearing checking accounts | 0.05 to 0.85% | 0.56% | 0.42% | 218,984 | 136,037 | ||||||
Money market deposit accounts | 0.10 to 1.50% | 0.82% | 0.50% | 1,938,707 | 1,464,279 | ||||||
Total demand and savings accounts | 2,387,917 | 1,760,175 | |||||||||
Certificates of deposit | 0.40 to 1.63% | 0.95% | 0.78% | 898,862 | 929,669 | ||||||
Total deposits | $ | 3,286,779 | $ | 2,689,844 | |||||||
Average rate paid on interest-bearing accounts | 0.84% | 0.60% | |||||||||
As of December 31, 2016 and December 31, 2015, the Bank had total brokered deposits of $1.06 billion and $1.05 billion, respectively. The amount for brokered deposits includes reciprocal Certificate of Deposit Account Registry Service® (“CDARS®”) and reciprocal Insured Cash Sweep® (“ICS®”) accounts totaling $448.1 million and $496.5 million as of December 31, 2016 and December 31, 2015, respectively.
As of December 31, 2016 and December 31, 2015, certificates of deposit with balances of $100,000 or more, excluding brokered deposits, totaled $441.1 million and $409.2 million, respectively. Certificates of deposit with balances of $250,000 or more, excluding brokered deposits, totaled $178.1 million and $142.7 million as of December 31, 2016 and December 31, 2015, respectively.
116
The contractual maturity of certificates of deposit, including brokered deposits, was as follows:
(Dollars in thousands) | December 31, 2016 | December 31, 2015 | ||||
12 months or less | $ | 751,204 | $ | 645,004 | ||
12 months to 24 months | 121,011 | 219,333 | ||||
24 months to 36 months | 26,647 | 65,332 | ||||
36 months to 48 months | — | — | ||||
48 months to 60 months | — | — | ||||
Over 60 months | — | — | ||||
Total | $ | 898,862 | $ | 929,669 | ||
Interest expense on deposits was as follows:
Years Ended December 31, | |||||||||
(Dollars in thousands) | 2016 | 2015 | 2014 | ||||||
Interest-bearing checking accounts | $ | 813 | $ | 439 | $ | 229 | |||
Money market deposit accounts | 11,376 | 5,687 | 4,228 | ||||||
Certificates of deposit | 7,618 | 6,762 | 6,154 | ||||||
Total interest expense on deposits | $ | 19,807 | $ | 12,888 | $ | 10,611 | |||
[10] BORROWINGS
As of December 31, 2016 and December 31, 2015, borrowings were comprised of the following:
December 31, 2016 | December 31, 2015 | ||||||||||
(Dollars in thousands) | Interest Rate | Ending Balance | Maturity Date | Interest Rate | Ending Balance | Maturity Date | |||||
FHLB borrowings: | |||||||||||
Issued 12/30/2016 | 0.77% | $ | 105,000 | 1/3/2017 | $ | — | |||||
Issued 12/29/2016 | 0.85% | 100,000 | 3/29/2017 | — | |||||||
Issued 12/31/2015 | — | 0.51% | 170,000 | 1/4/2016 | |||||||
Issued 7/29/2015 | — | 0.61% | 25,000 | 8/4/2016 | |||||||
Issued 7/29/2015 | — | 0.72% | 25,000 | 11/3/2016 | |||||||
Subordinated notes payable (net of debt issuance costs of $490 and $692, respectively) | 5.75% | 34,510 | 7/1/2019 | 5.75% | 34,308 | 7/1/2019 | |||||
Total borrowings, net | $ | 239,510 | $ | 254,308 | |||||||
The Bank’s FHLB borrowing capacity is based on the collateral value of certain securities held in safekeeping at the FHLB and loans pledged to the FHLB. The Bank submits a quarterly Qualified Collateral Report (“QCR”) to the FHLB to update the value of the loans pledged. As of December 31, 2016, the Bank’s borrowing capacity is based on the information provided in the September 30, 2016, QCR filing. As of December 31, 2016, the Bank had securities held in safekeeping at the FHLB with a fair value of $5.1 million, combined with pledged loans of $922.5 million, for a borrowing capacity of $661.0 million, of which $205.0 million was outstanding in advances, as reflected in the table above. As of December 31, 2015, there was $220.0 million outstanding in advances from the FHLB. When the Bank borrows from the FHLB, interest is charged at the FHLB’s posted rates at the time of the borrowing.
The Bank maintains an unsecured line of credit of $10.0 million with M&T Bank and an unsecured line of credit of $20.0 million with Texas Capital Bank. As of December 31, 2016, the full amount of these established lines were available to the Bank.
The Holding Company maintains an unsecured line of credit of $25.0 million with Texas Capital Bank. As of December 31, 2016, the full amount of this established line was available.
In June 2014, the Company completed a private placement of subordinated notes payable, raising $35.0 million. The subordinated notes have a term of 5 years at a fixed-rate of 5.75%. The proceeds qualified as Tier 2 capital for the holding company, under federal regulatory capital rules.
117
[11] INCOME TAXES
The income tax provision reconciled to taxes computed at the statutory federal rate was as follows:
Years Ended December 31, | |||||||||
(Dollars in thousands) | 2016 | 2015 | 2014 | ||||||
Tax provision at statutory rate | $ | 14,591 | $ | 11,683 | $ | 8,014 | |||
Meals and entertainment | 147 | 103 | 84 | ||||||
Dues and subscriptions | 132 | 116 | 123 | ||||||
Keyman life insurance | — | — | 12 | ||||||
Bank owned life insurance | (629 | ) | (593 | ) | (504 | ) | |||
Stock option exercises and cancellations | (484 | ) | 52 | 14 | |||||
State tax expense, net of federal benefit | 1,184 | 951 | 407 | ||||||
Adjustments to prior year tax | 46 | (60 | ) | (51 | ) | ||||
Tax exempt income, net of disallowed interest | (162 | ) | (160 | ) | (145 | ) | |||
Unrecognized tax benefits | — | — | 11 | ||||||
Renewable energy tax credits | (1,778 | ) | (1,198 | ) | (1,022 | ) | |||
Low income housing tax credits | (17 | ) | — | — | |||||
Other | 18 | (2 | ) | 26 | |||||
Income tax provision | $ | 13,048 | $ | 10,892 | $ | 6,969 | |||
The tax credits in the table above relate to transactions for the financing of renewable solar energy facilities as well as low income housing tax credits. These transactions provided federal tax credits and state tax credits (where applicable) during the 2016, 2015 and 2014 tax years. The financing of the solar energy facilities are accounted for as direct financing leases included within the C&I loan portfolio, which included three transactions in 2016, five in 2015 and four in 2014. Per ASU 2014-01, “Investments-Equity Method and Joint Ventures: Accounting for Investments in Qualified Affordable Housing Projects,” the amortization of the Company’s low income housing tax credit investments has been reflected as income tax expense. The net amount of low income housing tax credits, amortization and tax benefits recorded as income tax expenses during the year ended December 31, 2016, was $17,000. The carrying amount of the investment in low income housing tax credits was $14.9 million of which $13.4 million was unfunded as of December 31, 2016.
The income tax provision consisted of:
Years Ended December 31, | |||||||||
(Dollars in thousands) | 2016 | 2015 | 2014 | ||||||
Current income tax provision - federal | $ | 7,781 | $ | 9,917 | $ | 7,549 | |||
Current income tax provision - state | 1,592 | 803 | 496 | ||||||
Deferred tax provision (benefit) - federal | 3,322 | 225 | (735 | ) | |||||
Deferred tax provision (benefit) - state | 353 | (53 | ) | (341 | ) | ||||
Income tax provision | $ | 13,048 | $ | 10,892 | $ | 6,969 | |||
118
The tax effects of temporary differences that give rise to significant portions of the deferred tax assets and deferred tax liabilities as of December 31, 2016 and 2015, were as follows:
December 31, | ||||||
(Dollars in thousands) | 2016 | 2015 | ||||
Deferred tax assets: | ||||||
Net operating loss - state | $ | — | $ | 6 | ||
Start-up expenses | 134 | 163 | ||||
Stock compensation | 1,659 | 2,709 | ||||
Compensation related accruals | 6,599 | 5,145 | ||||
Leasehold improvement | 464 | 100 | ||||
Allowance for loan loss | 6,970 | 6,639 | ||||
Long-term lease | 361 | 346 | ||||
Reserve for unfunded commitments | 241 | 202 | ||||
Supplemental executive retirement plan | 1,116 | 770 | ||||
Transaction costs | 257 | 277 | ||||
Intangibles | 125 | 183 | ||||
Earn out liability non-purchase accounting | 606 | 653 | ||||
Unrealized loss on investments and derivatives | — | 846 | ||||
Other | 470 | 417 | ||||
Gross deferred tax assets | 19,002 | 18,456 | ||||
Deferred tax liabilities: | ||||||
Office properties and equipment | (4,631 | ) | (2,585 | ) | ||
Deferred loan costs | (2,934 | ) | (2,192 | ) | ||
Goodwill | (3,531 | ) | (1,169 | ) | ||
State capital shares tax liability | (219 | ) | (324 | ) | ||
Unrealized gain on investments and derivatives | (483 | ) | — | |||
Gross deferred tax liability | (11,798 | ) | (6,270 | ) | ||
Net deferred tax asset | $ | 7,204 | $ | 12,186 | ||
Management believes that, as of December 31, 2016, it is more likely than not that the net deferred tax asset will be fully realized upon the generation of future taxable income.
The change in the net deferred tax asset for the years ended December 31, 2016 and 2015, was detailed as follows:
December 31, | ||||||
(Dollars in thousands) | 2016 | 2015 | ||||
Deferred tax provision | $ | (3,675 | ) | $ | (172 | ) |
Deferred tax impact from other comprehensive income | (1,329 | ) | 484 | |||
Deferred tax asset established related to acquisitions | 22 | — | ||||
Change in net deferred tax asset | $ | (4,982 | ) | $ | 312 | |
The Company considers uncertain tax positions that it has taken or expects to take on a tax return. The Company recognizes interest accrued and penalties (if any) related to unrecognized tax benefits in income tax expense. Federal tax years 2013 through 2016 remain subject to examination, as of December 31, 2016, while tax years 2013 through 2016 remain subject to examination by state taxing jurisdictions. No federal or state income tax return examinations are currently in progress.
119
A reconciliation of the beginning and ending gross amounts of unrecognized tax benefits was as follows:
December 31, | |||||||||
(Dollars in thousands) | 2016 | 2015 | 2014 | ||||||
Beginning of year balance | $ | 353 | $ | — | $ | 110 | |||
Increases in prior period tax positions | 26 | 142 | 11 | ||||||
Decreases in prior period tax positions | — | — | — | ||||||
Increases in current period tax positions | 220 | 211 | — | ||||||
Settlements | — | — | (121 | ) | |||||
End of year balance | $ | 599 | $ | 353 | $ | — | |||
The total estimated unrecognized tax benefit that, if recognized, would affect the Company’s effective tax rate was approximately $390,000, $230,000 and $0 as of December 31, 2016, 2015 and 2014, respectively. The impact of interest and penalties was immaterial to the Company’s financial statements for the years ended December 31, 2016, 2015 and 2014. The Company does not expect changes in its unrecognized tax benefits in the next twelve months to have a material impact on its financial statements.
[12] REGULATORY CAPITAL
The Company and the Bank are subject to various regulatory capital requirements administered by the federal banking agencies. Failure to meet minimum capital requirements can initiate certain mandatory – and possibly additional discretionary – actions by regulators that, if undertaken, could have a direct material effect on the Company’s and the Bank’s financial statements. Under capital adequacy guidelines and the regulatory framework for prompt corrective action, the Company and the Bank must meet specific capital guidelines that involve quantitative measures of the Company’s and the Bank’s assets, liabilities, and certain off-balance sheet items as calculated under regulatory accounting practices. The Company’s and the Bank’s capital amounts and classification are also subject to qualitative judgments by the regulators about components, risk weighting, and other factors.
Quantitative measures established by regulation to ensure capital adequacy require the Company and the Bank to maintain minimum amounts and ratios (set forth in the tables below) of Common Equity Tier 1 (“CET 1”), Tier 1 and Total risk-based capital (as defined in the regulations) to risk-weighted assets (as defined), and of Tier 1 capital to average assets (as defined). As of December 31, 2016 and December 31, 2015, TriState Capital Holdings, Inc. and TriState Capital Bank exceeded all capital adequacy requirements to which they were subjected.
Financial depository institutions are categorized as well capitalized if they meet minimum Total risk-based, Tier 1 risk-based, CET 1 risk-based capital ratios and Tier 1 leverage ratio (Tier 1 capital to average assets) as set forth in the tables below. Based upon the information in the most recently filed Call Report, the Bank exceeded the capital ratios necessary to be well capitalized under the regulatory framework for prompt corrective action. There have been no conditions or events since the filing of the most recent Call Report that management believes have changed the Bank’s capital, as presented below.
Basel III, which began phasing in on January 1, 2015, has replaced the existing regulatory capital rules for the Company and the Bank. The Basel III final rules required new minimum capital ratio standards, established a new common equity tier 1 to total risk-weighted assets ratio, subjected banking organizations to certain limitations on capital distributions and discretionary bonus payments, and established a new standardized approach for risk weightings.
In addition, the final rules subject a banking organization to certain limitations on capital distributions and discretionary bonus payments to executive officers if the organization does not maintain a capital conservation buffer of risk-based capital ratios in an amount greater than 2.5% of its total risk-weighted assets. The implementation of the capital conservation buffer began on January 1, 2016, at 0.625% and will be phased in over a four-year period (increasing by that amount ratably on each subsequent January 1, until it reaches 2.5% on January 1, 2019).
120
The following tables set forth certain information concerning the Company’s and the Bank’s regulatory capital as of December 31, 2016 and December 31, 2015:
December 31, 2016 | |||||||||||||||||
Actual | For Capital Adequacy Purposes | To be Well Capitalized Under Prompt Corrective Action Provisions | |||||||||||||||
(Dollars in thousands) | Amount | Ratio | Amount | Ratio | Amount | Ratio | |||||||||||
Total risk-based capital ratio | |||||||||||||||||
Company | $ | 325,122 | 12.66 | % | $ | 205,488 | 8.00 | % | N/A | N/A | |||||||
Bank | $ | 314,419 | 12.39 | % | $ | 203,030 | 8.00 | % | $ | 253,787 | 10.00 | % | |||||
Tier 1 risk-based capital ratio | |||||||||||||||||
Company | $ | 295,089 | 11.49 | % | $ | 154,116 | 6.00 | % | N/A | N/A | |||||||
Bank | $ | 298,093 | 11.75 | % | $ | 152,272 | 6.00 | % | $ | 203,030 | 8.00 | % | |||||
Common equity tier 1 risk-based capital ratio | |||||||||||||||||
Company | $ | 295,089 | 11.49 | % | $ | 115,587 | 4.50 | % | N/A | N/A | |||||||
Bank | $ | 298,093 | 11.75 | % | $ | 114,204 | 4.50 | % | $ | 164,962 | 6.50 | % | |||||
Tier 1 leverage ratio | |||||||||||||||||
Company | $ | 295,089 | 7.90 | % | $ | 149,369 | 4.00 | % | N/A | N/A | |||||||
Bank | $ | 298,093 | 8.04 | % | $ | 148,252 | 4.00 | % | $ | 185,316 | 5.00 | % | |||||
December 31, 2015 | |||||||||||||||||
Actual | For Capital Adequacy Purposes | To be Well Capitalized Under Prompt Corrective Action Provisions | |||||||||||||||
(Dollars in thousands) | Amount | Ratio | Amount | Ratio | Amount | Ratio | |||||||||||
Total risk-based capital ratio | |||||||||||||||||
Company | $ | 326,378 | 13.88 | % | $ | 188,176 | 8.00 | % | N/A | N/A | |||||||
Bank | $ | 310,624 | 13.35 | % | $ | 186,077 | 8.00 | % | $ | 232,596 | 10.00 | % | |||||
Tier 1 risk-based capital ratio | |||||||||||||||||
Company | $ | 287,072 | 12.20 | % | $ | 141,132 | 6.00 | % | N/A | N/A | |||||||
Bank | $ | 292,234 | 12.56 | % | $ | 139,558 | 6.00 | % | $ | 186,077 | 8.00 | % | |||||
Common equity tier 1 risk-based capital ratio | |||||||||||||||||
Company | $ | 287,072 | 12.20 | % | $ | 105,849 | 4.50 | % | N/A | N/A | |||||||
Bank | $ | 292,234 | 12.56 | % | $ | 104,668 | 4.50 | % | $ | 151,187 | 6.50 | % | |||||
Tier 1 leverage ratio | |||||||||||||||||
Company | $ | 287,072 | 9.05 | % | $ | 126,932 | 4.00 | % | N/A | N/A | |||||||
Bank | $ | 292,234 | 9.29 | % | $ | 125,870 | 4.00 | % | $ | 157,338 | 5.00 | % | |||||
[13] EMPLOYEE BENEFIT PLANS
The Company participates in a qualified 401(k) defined contribution plan under which eligible employees may contribute a percentage of their salary, at their discretion. During the years ended December 31, 2016, 2015 and 2014, the Company automatically contributed three percent of the employee’s base salary to the individual’s 401(k) plan, subject to IRS limitations. Full-time employees and certain part-time employees are eligible to participate upon the first month following their first day of employment or having attained the age of 21, whichever is later. The Company’s contribution expense was $788,000, $683,000 and $600,000 for the years ended December 31, 2016, 2015 and 2014, respectively.
On February 28, 2013, the Company entered into a supplemental executive retirement plan (“SERP”) for the Chairman and Chief Executive Officer. The benefits will be earned over a five-year period with the projected payments for this SERP of $25,000 per month for 180 months commencing the later of retirement or 60 months. For the years ended December 31, 2016, 2015 and 2014, the Company recorded expense related to SERP of $919,000, $791,000 and $657,000, respectively, utilizing a discount rate of 2.15%, 2.98% and 3.56%, respectively. The recorded liability related to the SERP plan was $3.0 million and $2.1 million as of December 31, 2016 and December 31, 2015, respectively.
121
[14] STOCK TRANSACTIONS
In October 2014, the Board of Directors authorized the repurchase of up to $10 million, or up to 1,000,000 shares, of the Company’s common stock through December 31, 2015. Under this plan, the Company repurchased a total of 1,000,000 shares during the years ended December 31, 2015 and 2014, for approximately $9.9 million, at an average cost of $9.90 per share, which are held as treasury stock.
In January 2016, the Board of Directors authorized the repurchase of up to $10 million of the Company’s common stock. Also, in October 2016, the Board of Directors authorized the repurchase of up to an additional $5 million of the Company’s common stock. During the year ended December 31, 2016, the Company repurchased a total of 374,729 shares for approximately $5.1 million, at an average cost of $13.68 per share, which are held as treasury stock. The Board subsequently authorized the Company to utilize some of the combined $15 million allocated to these share repurchase programs to cancel options granted by the Company to purchase shares of its common stock that expire in 2017. In accordance with that authorization, in addition to the shares purchased as described in this paragraph, the Company and holders of options that expire in 2017 agreed to cancel options as set forth in the following paragraph. The approximate dollar value of shares that may yet be purchased under these share repurchase programs have been reduced by the amount expended in connection with the option cancellations.
During the year ended December 31, 2016, the Company’s Board of Directors approved a stock option cancellation program to allow for outstanding and vested stock option awards granted in 2007 and expiring in 2017 to be canceled by the option holder at a price based on the closing day’s stock price less the option exercise price. During the year ended December 31, 2016, there were 1,174,500 options canceled for $6.2 million, which was recorded as a reduction to additional paid-in capital.
The table below shows the changes in the Company’s common shares outstanding during the periods indicated:
Number of Common Shares Outstanding | ||
Balance, December 31, 2013 | 28,690,279 | |
Issuance of restricted common stock | 27,000 | |
Forfeitures of restricted common stock | — | |
Exercise of stock options | 22,500 | |
Purchase of treasury stock | (678,891 | ) |
Balance, December 31, 2014 | 28,060,888 | |
Issuance of restricted common stock | 282,916 | |
Forfeitures of restricted common stock | (4,000 | ) |
Exercise of stock options | 37,500 | |
Purchase of treasury stock | (321,109 | ) |
Balance, December 31, 2015 | 28,056,195 | |
Issuance of restricted common stock | 497,309 | |
Forfeitures of restricted common stock | (13,121 | ) |
Exercise of stock options | 250,000 | |
Purchase of treasury stock | (374,729 | ) |
Balance, December 31, 2016 | 28,415,654 | |
122
[15] EARNINGS PER COMMON SHARE
The computation of basic and diluted earnings per common share for the periods presented was as follows:
Years Ended December 31, | |||||||||
(Dollars in thousands, except per share data) | 2016 | 2015 | 2014 | ||||||
Net income available to common shareholders | $ | 28,641 | $ | 22,488 | $ | 15,928 | |||
Weighted average common shares outstanding: | |||||||||
Basic | 27,593,725 | 27,771,345 | 28,628,631 | ||||||
Non-vested restricted shares - dilutive | 260,799 | 56,364 | 82 | ||||||
Stock options - dilutive | 504,628 | 409,744 | 389,193 | ||||||
Diluted | 28,359,152 | 28,237,453 | 29,017,906 | ||||||
Earnings per common share: | |||||||||
Basic | $ | 1.04 | $ | 0.81 | $ | 0.56 | |||
Diluted | $ | 1.01 | $ | 0.80 | $ | 0.55 | |||
Years Ended December 31, | ||||||
2016 | 2015 | 2014 | ||||
Anti-dilutive shares (1) | 125,500 | 721,893 | 779,732 | |||
(1) | Included stock options and non-vested restricted shares not considered for the calculation of diluted EPS as their inclusion would have been anti-dilutive. |
[16] STOCK-BASED COMPENSATION PROGRAMS
The Company’s 2006 Stock Option Plan (the “2006 Plan”) provided for the granting of incentive and non-qualifying stock options to the Company’s key employees, key contractors and outside directors at the discretion of the Board of Directors. The Omnibus Incentive Plan (the “Omnibus Plan”), which was approved by TriState Capital’s shareholders on May 20, 2014, provides for the granting of incentive and non-qualifying stock options, stock appreciation rights, restricted shares, restricted stock units, dividend equivalent rights and other equity-based or equity-related awards to the Company’s key employees, key contractors and outside directors at the discretion of the Board of Directors. The Omnibus Plan, upon its approval, replaced the 2006 Plan. The total number of shares of common stock that may be granted under the Omnibus Plan is the number of authorized shares of common stock of TriState Capital remaining available under the 2006 Plan as of the date of shareholder approval, plus any shares of common stock issued pursuant to the 2006 Plan that were forfeited, canceled, expired or otherwise terminated. The shares reserved for grants under the 2006 Plan shall no longer be available for grants under that plan, but shall instead be reserved for grants under the Omnibus Plan.
The total common shares, authorized by shareholders of the Company, relating to stock-based awards which may be issued upon the grant or exercise of stock-based awards was 4,000,000, as of December 31, 2016, under both the 2006 Plan and the Omnibus Plan (combined the “Plans”). As of December 31, 2016, the Company has issued non-qualifying stock options and restricted shares. The aggregate awards outstanding were 1,916,698 under both of the Plans. 329,299 stock options and restricted shares have been exercised or vested, respectively, leaving 1,754,003 additional awards available for the Company to grant under the Omnibus Plan as of December 31, 2016.
The Company’s stock option grants contain terms that provide for a graded vesting schedule whereby portions of the options vest in increments over the requisite service period. Options issued under the Plans typically vest either 50 percent after two and one-half years following the award date and the remaining 50 percent five years following the award date; or 100 percent after five years following the award date. Restricted shares under the Omnibus Plan typically vest 100 percent after three years following the award date. The Company recognizes compensation expense for awards with graded vesting schedules on a straight-line basis over the requisite service period for the entire grant. The Company’s compensation expense for all awards was $3.6 million, $1.9 million and $896,000 for the years ended December 31, 2016, 2015 and 2014, respectively.
In 2016 and 2015, the Company’s Board of Directors approved stock option cancellation programs to allow for outstanding and vested stock option awards granted in 2007 to be canceled by the option holder at a price based on the closing day’s stock price less the option exercise price. During the year ended December 31, 2016, there were 1,174,500 options canceled for $6.2 million, which was recorded as a reduction to additional paid-in capital. During the year ended December 31, 2015, there were 77,000 options canceled for $229,000, which was recorded as a reduction to additional paid-in capital.
123
Stock Options
The fair value of each option award is estimated on the date of the grant using the Black-Scholes option pricing model and the weighted average assumptions in the following table. Expected term was calculated utilizing the simplified method because the Company has limited historical exercise behavior. Since the Company is newly publicly traded and there is not enough trading history, expected volatility is computed based on median historical volatility of similar entities with publicly traded shares. The risk-free rate for the expected term of the option is based on the U.S. Treasury yield curve in effect at the time of grant. The computation assumes that there will be no dividends paid to common shareholders during the contractual life of the options.
December 31, | ||||||
2016 | 2015 | 2014 | ||||
Valuation Assumptions: | ||||||
Expected dividend yield | 0.0 | % | 0.0 | % | 0.0 | % |
Expected volatility | 35.9 | % | 45.4 | % | 35.3 | % |
Expected term (years) | 6.9 | 6.9 | 6.9 | |||
Risk-free interest rate | 1.7 | % | 1.6 | % | 2.3 | % |
Stock option activity during the periods indicated was as follows:
Number of Options | Weighted Average Exercise Price | Weighted Average Remaining Contractual Term (years) | ||||
Balance, December 31, 2013 | 2,266,500 | $ | 10.03 | 4.94 | ||
Granted | 309,732 | 12.04 | ||||
Exercised | 22,500 | 11.11 | ||||
Forfeited | 44,000 | 9.66 | ||||
Canceled | — | — | ||||
Expired | — | — | ||||
Balance, December 31, 2014 | 2,509,732 | $ | 10.28 | 4.52 | ||
Granted | 205,661 | 10.39 | ||||
Exercised | 37,500 | 9.41 | ||||
Forfeited | 41,500 | 10.75 | ||||
Canceled | 77,000 | 10.00 | ||||
Expired | — | — | ||||
Balance, December 31, 2015 | 2,559,393 | $ | 10.30 | 3.98 | ||
Granted | 22,000 | 12.07 | ||||
Exercised | 250,000 | 10.69 | ||||
Forfeited | 23,500 | 11.77 | ||||
Canceled | 1,174,500 | 10.00 | ||||
Expired | — | — | ||||
Balance, December 31, 2016 | 1,133,393 | $ | 10.53 | 5.76 | ||
Exercisable as of December 31, 2014 | 1,693,500 | $ | 10.04 | 2.75 | ||
Exercisable as of December 31, 2015 | 1,789,750 | $ | 9.99 | 2.28 | ||
Exercisable as of December 31, 2016 | 575,116 | $ | 10.01 | 4.32 | ||
The weighted average grant date fair value of options granted during the years ended December 31, 2016, 2015 and 2014, was $5.14, $4.98 and $4.90, respectively. The weighted average grant date fair value of options exercised during the years ended December 31, 2016, 2015 and 2014 was $4.85, $4.38 and $5.08, respectively.
124
A summary of the status of the Company’s non-vested options as of and changes during the years ended December 31, 2016, 2015 and 2014, is presented below:
Non-vested options: | Number of Options | Weighted Average Grant-Date Fair Value | |||
Balance, December 31, 2013 | 641,500 | $ | 4.89 | ||
Granted | 309,732 | 4.90 | |||
Vested | 91,000 | 5.12 | |||
Forfeited | 44,000 | 4.84 | |||
Balance, December 31, 2014 | 816,232 | $ | 4.87 | ||
Granted | 205,661 | 4.98 | |||
Vested | 210,750 | 5.91 | |||
Forfeited | 41,500 | 4.85 | |||
Balance, December 31, 2015 | 769,643 | $ | 4.93 | ||
Granted | 22,000 | 5.14 | |||
Vested | 209,866 | 3.73 | |||
Forfeited | 23,500 | 5.16 | |||
Balance, December 31, 2016 | 558,277 | $ | 4.95 | ||
As of December 31, 2016, there was $1.6 million of total unrecognized compensation cost related to non-vested options granted under the Plans and the unrecognized compensation cost is expected to be recognized over a weighted average period of 2.1 years.
Restricted Shares
A summary of the status of the Company’s non-vested restricted shares as of and changes during the years ended December 31, 2016, 2015 and 2014, is presented below:
Non-vested restricted shares: | Number of Shares | Weighted Average Grant-Date Fair Value | |||
Balance, December 31, 2013 | — | $ | — | ||
Granted | 27,000 | 10.66 | |||
Vested | — | — | |||
Forfeited | — | — | |||
Balance, December 31, 2014 | 27,000 | $ | 10.66 | ||
Granted | 282,916 | 10.54 | |||
Vested | — | — | |||
Forfeited | 4,000 | 10.57 | |||
Balance, December 31, 2015 | 305,916 | $ | 10.55 | ||
Granted | 497,309 | 13.45 | |||
Vested | 6,799 | 47.80 | |||
Forfeited | 13,121 | 11.76 | |||
Balance, December 31, 2016 | 783,305 | $ | 12.05 | ||
As of December 31, 2016, there was $5.5 million of total unrecognized compensation cost related to non-vested restricted shares granted under the Omnibus Plan and the unrecognized compensation cost is expected to be recognized over a weighted average period of 2.3 years.
[17] DERIVATIVES AND HEDGING ACTIVITY
RISK MANAGEMENT OBJECTIVE OF USING DERIVATIVES
The Company is exposed to certain risks arising from both its business operations and economic conditions. The Company principally manages its exposures to a wide variety of business and operational risks through management of its core business activities. The Company manages economic risks, including interest rate, liquidity and credit risk primarily by managing the amount, sources, and duration of its debt funding and through the use of derivative financial instruments. Specifically, the Company enters into derivative
125
financial instruments to manage exposures that arise from business activities that result in the receipt or payment of future known and uncertain cash amounts, the value of which are determined by interest rates. The Company’s derivative financial instruments are used to manage differences in the amount, timing, and duration of the Company’s known or expected cash receipts related to certain of the Company’s fixed-rate loan assets and differences in the amount, timing, and duration of the Company's known or expected cash payments related to certain of the Company's FHLB borrowings. The Company also has derivatives that are a result of a service the Company provides to certain qualifying customers while at the same time the Company enters into an offsetting derivative transaction in order to eliminate its interest rate risk exposure resulting from such transactions.
FAIR VALUES OF DERIVATIVE INSTRUMENTS ON THE STATEMENTS OF FINANCIAL CONDITION
The tables below present the fair value of the Company’s derivative financial instruments as well as their classification on the consolidated statements of financial condition as of December 31, 2016 and December 31, 2015:
Asset Derivatives | Liability Derivatives | ||||||||
as of December 31, 2016 | as of December 31, 2016 | ||||||||
(Dollars in thousands) | Balance Sheet Location | Fair Value | Balance Sheet Location | Fair Value | |||||
Derivatives designated as hedging instruments: | |||||||||
Interest rate products | Other assets | $ | 1,793 | Other liabilities | $ | 80 | |||
Derivatives not designated as hedging instruments: | |||||||||
Interest rate products | Other assets | $ | 10,324 | Other liabilities | $ | 10,529 | |||
Asset Derivatives | Liability Derivatives | ||||||||
as of December 31, 2015 | as of December 31, 2015 | ||||||||
(Dollars in thousands) | Balance Sheet Location | Fair Value | Balance Sheet Location | Fair Value | |||||
Derivatives designated as hedging instruments: | |||||||||
Interest rate products | Other assets | $ | — | Other liabilities | $ | 229 | |||
Derivatives not designated as hedging instruments: | |||||||||
Interest rate products | Other assets | $ | 8,662 | Other liabilities | $ | 9,363 | |||
FAIR VALUE HEDGES OF INTEREST RATE RISK
The Company is exposed to changes in the fair value of certain of its fixed-rate obligations due to changes in benchmark interest rates, which relate predominantly to LIBOR. Interest rate swaps designated as fair value hedges involve the receipt of variable-rate payments from a counterparty in exchange for the Company making fixed-rate payments over the life of the agreements without the exchange of the underlying notional amount. As of December 31, 2016, the Company had four interest rate swaps, with an aggregate notional amount of $2.8 million that were designated as fair value hedges of interest rate risk associated with the Company’s fixed-rate loan assets. The notional amounts for the derivatives express the face amount of the positions, however, credit risk was considered insignificant for the years ended December 31, 2016 and 2015. There were no counterparty default losses on derivatives for the years ended December 31, 2016 and 2015.
For the four derivatives that were designated and that qualify as fair value hedges, the gain or loss on the derivative as well as the offsetting loss or gain on the hedged item attributable to the hedged risk are recognized in earnings by applying the “fair value long haul” method. The Company includes the gain or loss on the hedged items in the same line item as the offsetting loss or gain on the related derivatives. During the year ended December 31, 2016, the Company recognized a net gain of $4,000 in non-interest income related to hedge ineffectiveness as compared to net gains of $3,000 and $10,000 during the years ended December 31, 2015 and 2014, respectively. The Company also recognized a decrease to interest income of $88,000 for the year ended December 31, 2016, related to the Company’s fair value hedges, which includes net settlements on the derivatives, and any amortization adjustment of the basis in the hedged items as compared to decreases to interest income of $294,000 and $321,000 during the years ended December 31, 2015 and 2014, respectively.
CASH FLOW HEDGES OF INTEREST RATE RISK
The Company’s objectives in using interest rate derivatives are to add stability to interest expense and to manage its exposure to interest rate movements. To accomplish this objective, the Company primarily uses interest rate swaps as part of its interest rate risk management strategy. In June 2016, the Company entered into derivative contracts to hedge the variable cash flows associated with certain FHLB borrowings. These interest rate swaps designated as cash flow hedges involve the receipt of variable amounts from a counterparty in exchange for the Company making fixed-rate payments over the life of the agreements without exchange of the underlying notional amount.
126
The effective portion of changes in the fair value of derivatives designated and that qualify as cash flow hedges is recorded in accumulated other comprehensive income (loss) and is subsequently reclassified into earnings in the period that the hedged forecasted transaction affects earnings. The ineffective portion of the change in fair value of the derivatives is recognized directly in earnings. The Company’s cash flow hedge derivatives did not have any hedge ineffectiveness recognized in earnings during the year ended December 31, 2016.
Amounts reported in accumulated other comprehensive income (loss) related to derivatives will be reclassified to interest expense as interest payments are made on the Company’s debt. During the year ended December 31, 2016, there was an increase to interest expense of $43,000. During the next twelve months, the Company estimates $345,000 to be reclassified to earnings as a decrease to interest expense. The Company is hedging its exposure to the variability in future cash flows for forecasted transactions over a remaining period of 30 months.
As of December 31, 2016, the Company had two outstanding interest rate derivatives with an aggregate notional amount of $100.0 million that was designated as a cash flow hedge of interest rate risk. During the year ended December 31, 2016, a net gain of $1.8 million was recognized in accumulated other comprehensive income (loss) on the effective portion of the derivative.
NON-DESIGNATED HEDGES
The Company does not use derivatives for trading or speculative purposes. Derivatives not designated as hedges are not speculative and result from a service the Company provides to certain customers. The Company executes interest rate derivatives with its commercial banking customers to facilitate their respective risk management strategies. Those derivatives are simultaneously and economically hedged by offsetting derivatives that the Company executes with a third party, such that the Company eliminates its interest rate exposure resulting from such transactions. Changes in the fair value of derivatives not designated in hedging relationships are recorded directly in earnings. As of December 31, 2016, the Company had 224 derivative transactions with an aggregate notional amount of $954.2 million related to this program. During the year ended December 31, 2016, the Company recognized a net gain of $528,000 related to changes in fair value of the derivatives not designated in hedging relationships, as compared to net losses of $174,000 and $423,000 during the years ended December 31, 2015 and 2014, respectively.
EFFECT OF DERIVATIVE INSTRUMENTS IN THE STATEMENTS OF INCOME
The tables below present the effect of the Company’s derivative financial instruments in the consolidated statements of income for the periods presented:
Years Ended December 31, | |||||||||||
(Dollars in thousands) | 2016 | 2015 | 2014 | ||||||||
Derivatives designated as hedging instruments: | Location of Gain (Loss) Recognized in Income on Derivative | Amount of Gain (Loss) Recognized in Income on Derivative | |||||||||
Interest rate products | Interest income | $ | (88 | ) | $ | (294 | ) | $ | (321 | ) | |
Non-interest income | 4 | 3 | 10 | ||||||||
Interest expense | (43 | ) | — | — | |||||||
Total | $ | (127 | ) | $ | (291 | ) | $ | (311 | ) | ||
Derivatives not designated as hedging instruments: | Location of Gain (Loss) Recognized in Income on Derivative | Amount of Gain (Loss) Recognized in Income on Derivative | |||||||||
Interest rate products | Non-interest income | $ | 528 | $ | (174 | ) | $ | (423 | ) | ||
Total | $ | 528 | $ | (174 | ) | $ | (423 | ) | |||
CREDIT-RISK-RELATED CONTINGENT FEATURES
The Company has agreements with each of its derivative counterparties that contain a provision where, if the Company defaults on any of its indebtedness, including default where repayment of the indebtedness has not been accelerated by the lender, then the Company could also be declared in default on its derivative obligations.
The Company has agreements with certain of its derivative counterparties that contain a provision where, if either the Company or the counterparty fails to maintain its status as a well/adequately capitalized institution, then the Company or the counterparty could be required to terminate any outstanding derivative positions and settle its obligations under the agreement.
As of December 31, 2016, the termination value of derivatives, including accrued interest, in a net liability position related to these agreements was $902,000. As of December 31, 2016, the Company has minimum collateral posting thresholds with certain of its
127
derivative counterparties and has posted collateral of $5.3 million. If the Company had breached any of these provisions as of December 31, 2016, it could have been required to settle its obligations under the agreements at their termination value.
[18] DISCLOSURES ABOUT FAIR VALUE OF FINANCIAL INSTRUMENTS
Fair value estimates of financial instruments are based on the present value of expected future cash flows, quoted market prices of similar financial instruments, if available, and other valuation techniques. These valuations are significantly affected by discount rates, cash flow assumptions and risk assumptions used. Therefore, fair value estimates may not be substantiated by comparison to independent markets and are not intended to reflect the proceeds that may be realized in an immediate settlement of instruments. Accordingly, the aggregate fair value amounts presented below do not represent the underlying value of the Company.
FAIR VALUE MEASUREMENTS
In accordance with U.S. GAAP the Company must account for certain financial assets and liabilities at fair value on a recurring and non-recurring basis. The Company utilizes a three-level fair value hierarchy of valuation techniques to estimate the fair value of its financial assets and liabilities based on whether the inputs to those valuation techniques are observable or unobservable. The fair value hierarchy gives the highest priority to quoted prices with readily available independent data in active markets for identical assets or liabilities (Level 1) and the lowest priority to unobservable market inputs (Level 3). When various inputs for measurement fall within multiple levels of the fair value hierarchy, the lowest level input that has a significant impact on fair value measurement is used.
Financial assets and liabilities are categorized based upon the following characteristics or inputs to the valuation techniques:
• | Level 1 – Financial assets and liabilities for which inputs are observable and are obtained from reliable quoted prices for identical assets or liabilities in actively traded markets. This is the most reliable fair value measurement and includes, for example, active exchange-traded equity securities. |
• | Level 2 – Financial assets and liabilities for which values are based on quoted prices in markets that are not active or for which values are based on similar assets or liabilities that are actively traded. Level 2 also includes pricing models in which the inputs are corroborated by market data, for example, matrix pricing. |
• | Level 3 – Financial assets and liabilities for which values are based on prices or valuation techniques that require inputs that are both unobservable and significant to the overall fair value measurement. Level 3 inputs include assumptions of a source independent of the reporting entity or the reporting entity’s own assumptions that are supported by little or no market activity or observable inputs. |
The Company is responsible for the valuation process and as part of this process may use data from outside sources in establishing fair value. The Company performs due diligence to understand the inputs used or how the data was calculated or derived. The Company corroborates the reasonableness of external inputs in the valuation process.
128
RECURRING FAIR VALUE MEASUREMENTS
The following tables represent assets and liabilities measured at fair value on a recurring basis as of December 31, 2016 and December 31, 2015:
December 31, 2016 | ||||||||||||
(Dollars in thousands) | Level 1 | Level 2 | Level 3 | Total Assets / Liabilities at Fair Value | ||||||||
Financial assets: | ||||||||||||
Investment securities available-for-sale: | ||||||||||||
Corporate bonds | $ | — | $ | 54,045 | $ | — | $ | 54,045 | ||||
Trust preferred securities | — | 17,798 | — | 17,798 | ||||||||
Non-agency mortgage-backed securities | — | 5,764 | — | 5,764 | ||||||||
Non-agency collateralized loan obligations | — | 16,180 | — | 16,180 | ||||||||
Agency collateralized mortgage obligations | — | 43,821 | — | 43,821 | ||||||||
Agency mortgage-backed securities | — | 24,149 | — | 24,149 | ||||||||
Agency debentures | — | 4,783 | — | 4,783 | ||||||||
Equity securities | 8,352 | — | — | 8,352 | ||||||||
Interest rate swaps | — | 12,117 | — | 12,117 | ||||||||
Total financial assets | 8,352 | 178,657 | — | 187,009 | ||||||||
Financial liabilities: | ||||||||||||
Interest rate swaps | — | 10,609 | — | 10,609 | ||||||||
Total financial liabilities | $ | — | $ | 10,609 | $ | — | $ | 10,609 | ||||
December 31, 2015 | ||||||||||||
(Dollars in thousands) | Level 1 | Level 2 | Level 3 | Total Assets / Liabilities at Fair Value | ||||||||
Financial assets: | ||||||||||||
Investment securities available-for-sale: | ||||||||||||
Corporate bonds | $ | — | $ | 43,733 | $ | — | $ | 43,733 | ||||
Trust preferred securities | — | 16,601 | — | 16,601 | ||||||||
Non-agency mortgage-backed securities | — | 5,743 | — | 5,743 | ||||||||
Non-agency collateralized loan obligations | — | 11,711 | — | 11,711 | ||||||||
Agency collateralized mortgage obligations | — | 49,371 | — | 49,371 | ||||||||
Agency mortgage-backed securities | — | 28,669 | — | 28,669 | ||||||||
Agency debentures | — | 4,732 | — | 4,732 | ||||||||
Equity securities | 7,759 | — | — | 7,759 | ||||||||
Interest rate swaps | — | 8,662 | — | 8,662 | ||||||||
Total financial assets | 7,759 | 169,222 | — | 176,981 | ||||||||
Financial liabilities: | ||||||||||||
Interest rate swaps | — | 9,592 | — | 9,592 | ||||||||
Total financial liabilities | $ | — | $ | 9,592 | $ | — | $ | 9,592 | ||||
INVESTMENT SECURITIES
Generally, investment securities are valued using pricing for similar securities, recently executed transactions and other pricing models utilizing observable inputs. The valuations for debt and equity securities are classified as either Level 1 or Level 2. U.S. Treasury Notes and equity securities (including mutual funds) are classified as Level 1 because these securities are in actively traded markets. Investment securities within Level 2 include corporate bonds; single-issuer trust preferred securities; non-agency mortgage-backed securities and collateralized loan obligations; collateralized mortgage obligations, mortgage-backed securities, and debentures issued by U.S. government agencies.
129
INTEREST RATE SWAPS
The fair value of interest rate swaps is estimated using inputs that are observable or that can be corroborated by observable market data and therefore, are classified as Level 2. These fair value estimations include primarily market observable inputs such as the forward LIBOR swap curve.
NON-RECURRING FAIR VALUE MEASUREMENTS
Certain financial assets and financial liabilities are measured at fair value on a non-recurring basis; that is, the instruments are not measured at fair value on an ongoing basis but are subject to fair value adjustments in certain circumstances, such as when there is evidence of impairment.
The following tables represent the balances of assets measured at fair value on a non-recurring basis as of December 31, 2016 and December 31, 2015:
December 31, 2016 | ||||||||||||
(Dollars in thousands) | Level 1 | Level 2 | Level 3 | Total Assets at Fair Value | ||||||||
Loans measured for impairment, net | $ | — | $ | — | $ | 10,851 | $ | 10,851 | ||||
Other real estate owned | — | — | 4,178 | 4,178 | ||||||||
Total assets | $ | — | $ | — | $ | 15,029 | $ | 15,029 | ||||
December 31, 2015 | ||||||||||||
(Dollars in thousands) | Level 1 | Level 2 | Level 3 | Total Assets at Fair Value | ||||||||
Loans measured for impairment, net | $ | — | $ | — | $ | 12,625 | $ | 12,625 | ||||
Other real estate owned | — | — | 1,730 | 1,730 | ||||||||
Total assets | $ | — | $ | — | $ | 14,355 | $ | 14,355 | ||||
As of December 31, 2016 and December 31, 2015, the Company recorded $6.9 million and $4.5 million, respectively, of specific reserves to the allowance for loan losses as a result of adjusting the fair value of impaired loans.
IMPAIRED LOANS
A loan is considered impaired when management determines it is probable that all of the principal and interest due under the original terms of the loan may not be collected or if a loan is designated as a TDR. Impairment is measured based on a discounted cash flow method or the fair value of the underlying collateral less estimated selling costs. Our policy is to obtain appraisals on collateral supporting impaired loans on an annual basis, unless circumstances dictate a shorter time frame. Appraisals are reduced by estimated costs to sell the collateral and, under certain circumstances, additional factors that may arise and cause us to believe our recovered value may be less than the independent appraised value. Accordingly, impaired loans are classified as Level 3. The Company measures impairment on all loans as part of the allowance for loan losses.
OTHER REAL ESTATE OWNED
Real estate owned is comprised of property acquired through foreclosure or voluntarily conveyed by borrowers. These assets are recorded on the date acquired at fair value, less estimated disposition costs, with the fair value being determined by appraisal. Our policy is to obtain appraisals on collateral supporting OREO on an annual basis, unless circumstances dictate a shorter time frame. Appraisals are reduced by estimated costs to sell the collateral and, under certain circumstances, additional factors that may arise and cause us to believe our recovered value may be less than the independent appraised value. Accordingly, real estate owned is classified as Level 3.
130
LEVEL 3 VALUATION
The following tables present additional quantitative information about assets measured at fair value on a recurring and non-recurring basis and for which we have utilized Level 3 inputs to determine fair value as of December 31, 2016 and December 31, 2015:
December 31, 2016 | ||||||||||
(Dollars in thousands) | Fair Value | Valuation Techniques (1) | Significant Unobservable Inputs | Weighted Average Discount Rate | ||||||
Loans measured for impairment, net | $ | 10,851 | Discounted cash flow | Discount due to restructured nature of operations | 6 | % | ||||
Other real estate owned | $ | 4,178 | Appraisal value | Discount due to salability conditions | 10 | % | ||||
(1) | Fair value is generally determined through independent appraisals of the underlying collateral, which may include level 3 inputs that are not identifiable, or by using the discounted cash flow method if the loan is not collateral dependent. |
December 31, 2015 | ||||||||||
(Dollars in thousands) | Fair Value | Valuation Techniques (1) | Significant Unobservable Inputs | Weighted Average Discount Rate | ||||||
Loans measured for impairment, net | $ | 5,428 | Appraisal value or Liquidation analysis | Discount due to salability conditions | 14 | % | ||||
Loans measured for impairment, net | $ | 7,197 | Discounted cash flow | Discount due to restructured nature of operations | 7 | % | ||||
Other real estate owned | $ | 1,730 | Appraisal value | Discount due to salability conditions | 10 | % | ||||
(1) | Fair value is generally determined through independent appraisals or liquidation analysis of the underlying collateral, which may include level 3 inputs that are not identifiable, or by using the discounted cash flow method if the loan is not collateral dependent. |
FAIR VALUE OF FINANCIAL INSTRUMENTS
A summary of the carrying amounts and estimated fair values of financial instruments was as follows:
December 31, 2016 | December 31, 2015 | |||||||||||||
(Dollars in thousands) | Fair Value Level | Carrying Amount | Estimated Fair Value | Carrying Amount | Estimated Fair Value | |||||||||
Financial assets: | ||||||||||||||
Cash and cash equivalents | 1 | $ | 103,994 | $ | 103,994 | $ | 96,676 | $ | 96,676 | |||||
Investment securities available-for-sale: debt | 2 | 166,540 | 166,540 | 160,560 | 160,560 | |||||||||
Investment securities available-for-sale: equity | 1 | 8,352 | 8,352 | 7,759 | 7,759 | |||||||||
Investment securities held-to-maturity | 2 | 53,940 | 54,498 | 47,290 | 48,099 | |||||||||
Federal Home Loan Bank stock | 2 | 9,641 | 9,641 | 9,802 | 9,802 | |||||||||
Loans held-for-investment, net | 3 | 3,382,292 | 3,362,031 | 2,823,310 | 2,813,278 | |||||||||
Accrued interest receivable | 2 | 9,614 | 9,614 | 7,056 | 7,056 | |||||||||
Investment management fees receivable | 2 | 7,749 | 7,749 | 6,191 | 6,191 | |||||||||
Bank owned life insurance | 2 | 64,815 | 64,815 | 60,019 | 60,019 | |||||||||
Interest rate swaps | 2 | 12,117 | 12,117 | 8,662 | 8,662 | |||||||||
Other real estate owned | 3 | 4,178 | 4,178 | 1,730 | 1,730 | |||||||||
Financial liabilities: | ||||||||||||||
Deposits | 2 | 3,286,779 | 3,286,553 | 2,689,844 | 2,690,693 | |||||||||
Borrowings, net | 2 | 239,510 | 240,143 | 254,308 | 255,179 | |||||||||
Interest rate swaps | 2 | 10,609 | 10,609 | 9,592 | 9,592 | |||||||||
During the years ended December 31, 2016, 2015 and 2014, there were no transfers between fair value Levels 1, 2 or 3.
131
The following methods and assumptions were used to estimate the fair value of each class of financial instruments as of December 31, 2016 and December 31, 2015:
CASH AND CASH EQUIVALENTS
The carrying amount approximates fair value.
INVESTMENT SECURITIES
The fair values of investment securities available-for-sale, held-to-maturity and trading are based on quoted market prices for the same or similar securities, recently executed transactions and pricing models.
FEDERAL HOME LOAN BANK STOCK
The carrying value of our FHLB stock, which is a marketable equity investment, approximates fair value.
LOANS HELD-FOR-INVESTMENT
The fair value of loans held-for-investment is estimated by discounting the future cash flows using the current rates at which similar loans would be made to borrowers with similar credit ratings and for the same remaining maturities. Fair value as determined here does not represent an exit price. Impaired loans are generally valued at the fair value of the associated collateral.
ACCRUED INTEREST RECEIVABLE
The carrying amount approximates fair value.
INVESTMENT MANAGEMENT FEES RECEIVABLE
The carrying amount approximates fair value.
BANK OWNED LIFE INSURANCE
The fair value of general account bank owned life insurance is based on the insurance contract net cash surrender value.
OTHER REAL ESTATE OWNED
Real estate owned is recorded on the date acquired at fair value, less estimated disposition costs, with the fair value being determined by appraisal.
DEPOSITS
The fair value of demand deposits is the amount payable on demand as of the reporting date, i.e., their carrying amounts. The fair value of fixed maturity deposits is estimated using a discounted cash flow calculation that applies the rates currently offered for deposits of similar remaining maturities.
BORROWINGS
The fair value of borrowings is calculated by discounting scheduled cash flows through the estimated maturity using period end market rates for borrowings of similar remaining maturities.
INTEREST RATE SWAPS
The fair value of interest rate swaps are estimated through the assistance of an independent third party and compared to the fair value determined by the swap counterparty to establish reasonableness.
OFF-BALANCE SHEET INSTRUMENTS
Fair values for the Company’s off-balance sheet instruments, which consist of lending commitments, standby letters of credit and risk participation agreements related to interest rate swap agreements, are based on fees currently charged to enter into similar agreements, taking into account the remaining terms of the agreements and the counterparties’ credit standing. Management believes that the fair value of these off-balance sheet instruments is not significant.
132
[19] CHANGES IN ACCUMULATED OTHER COMPREHENSIVE INCOME (LOSS)
The following table shows the changes in accumulated other comprehensive income (loss), for the periods presented:
Years Ended December 31, | |||||||||||||||||||||||||||||
2016 | 2015 | 2014 | |||||||||||||||||||||||||||
(Dollars in thousands) | Investment Securities | Derivatives | Total | Investment Securities | Derivatives | Total | Investment Securities | Derivatives | Total | ||||||||||||||||||||
Balance, beginning of period | $ | (1,443 | ) | $ | — | $ | (1,443 | ) | $ | (627 | ) | $ | — | $ | (627 | ) | $ | (1,744 | ) | $ | — | $ | (1,744 | ) | |||||
Change in unrealized holding gains (losses) | 1,166 | 1,100 | 2,266 | (795 | ) | — | (795 | ) | 2,034 | — | 2,034 | ||||||||||||||||||
Losses (gains) reclassified from other comprehensive income (1) | (20 | ) | 27 | 7 | (21 | ) | — | (21 | ) | (917 | ) | — | (917 | ) | |||||||||||||||
Net other comprehensive income (loss) | 1,146 | 1,127 | 2,273 | (816 | ) | — | (816 | ) | 1,117 | — | 1,117 | ||||||||||||||||||
Balance, end of period | $ | (297 | ) | $ | 1,127 | $ | 830 | $ | (1,443 | ) | $ | — | $ | (1,443 | ) | $ | (627 | ) | $ | — | $ | (627 | ) | ||||||
(1) | Consists of net realized gain on the sale of investment securities available-for-sale of $31,000, $33,000 and $1.4 million, net of income tax expense of $11,000, $12,000 and $511,000 for the years ended December 31, 2016, 2015 and 2014, respectively, and net realized loss on derivatives of $43,000, $0 and $0, net of income tax benefit of $16,000, $0 and $0 for the years ended December 31, 2016, 2015 and 2014, respectively. |
[20] RELATED PARTY TRANSACTIONS
Certain directors and executive officers have loan and deposit accounts with the Bank. Such loans and deposits were made in the ordinary course of business on substantially the same terms, including interest rates, as those prevailing at the time for comparable transactions with outsiders. As of December 31, 2016, the Bank had loans outstanding to directors totaling $9.5 million, which consisted of five loans. As of December 31, 2016, the Bank had deposits outstanding from directors and their related interests totaling $9.6 million.
During the years ended December 31, 2016, 2015 and 2014, the Bank obtained services from affiliated companies of certain directors in the normal course of business as outlined below:
(Dollars in thousands) | Years Ended December 31, | ||||||||||
Related Party | Affiliation | Nature of Transaction | 2016 | 2015 | 2014 | ||||||
Ascent Data Corporation | Owned by a director | Systems consulting | $ | — | $ | — | $ | 32 | |||
Voyager Jet Center | Owned by a director | Aircraft charter | 104 | 73 | 158 | ||||||
Total | $ | 104 | $ | 73 | $ | 190 | |||||
[21] CONTINGENT LIABILITIES
The Company is not subject to any asserted claims nor is it aware of any unasserted claims. In the opinion of management, there are no potential claims that would have a material adverse effect on the Company’s financial position, liquidity or results of operations.
133
[22] CONDENSED PARENT COMPANY ONLY FINANCIAL STATEMENTS
The following condensed statements of financial condition of the parent company as of December 31, 2016 and 2015, and the related condensed statements of income and cash flows for the years ended December 31, 2016, 2015 and 2014, should be read in conjunction with our Consolidated Financial Statements and related notes:
CONDENSED STATEMENTS OF FINANCIAL CONDITION | ||||||
PARENT COMPANY ONLY | ||||||
December 31, | ||||||
(Dollars in thousands) | 2016 | 2015 | ||||
ASSETS | ||||||
Cash and cash equivalents | $ | 4,728 | $ | 4,936 | ||
Investment securities available-for-sale | 8,352 | 7,759 | ||||
Investment in subsidiaries | 374,577 | 348,966 | ||||
Prepaid expenses and other assets | 892 | 80 | ||||
Total assets | $ | 388,549 | $ | 361,741 | ||
LIABILITIES AND SHAREHOLDERS’ EQUITY | ||||||
Borrowings, net | $ | 34,510 | $ | 34,308 | ||
Other accrued expenses and other liabilities | 2,232 | 1,456 | ||||
Shareholders’ equity | 351,807 | 325,977 | ||||
Total liabilities and shareholders’ equity | $ | 388,549 | $ | 361,741 | ||
CONDENSED STATEMENTS OF INCOME | |||||||||
PARENT COMPANY ONLY | |||||||||
Years Ended December 31, | |||||||||
(Dollars in thousands) | 2016 | 2015 | 2014 | ||||||
Interest income | $ | 301 | $ | 268 | $ | 259 | |||
Dividends received from subsidiaries | 23,100 | 2,510 | 2,480 | ||||||
Total interest and dividend income | 23,401 | 2,778 | 2,739 | ||||||
Interest expense | 2,215 | 2,215 | 1,266 | ||||||
Net interest income | 21,186 | 563 | 1,473 | ||||||
Non-interest income | — | — | — | ||||||
Non-interest expense | 370 | 91 | 119 | ||||||
Income before income taxes and undisbursed income of subsidiaries | 20,816 | 472 | 1,354 | ||||||
Income tax expense (benefit) | (877 | ) | 68 | (467 | ) | ||||
Income before undisbursed income of subsidiaries | 21,693 | 404 | 1,821 | ||||||
Undisbursed income of subsidiaries | 6,948 | 22,084 | 14,107 | ||||||
Net income | $ | 28,641 | $ | 22,488 | $ | 15,928 | |||
134
CONDENSED STATEMENTS OF CASH FLOWS | |||||||||
PARENT COMPANY ONLY | |||||||||
Years Ended December 31, | |||||||||
(Dollars in thousands) | 2016 | 2015 | 2014 | ||||||
Cash Flows from Operating Activities: | |||||||||
Net income | $ | 28,641 | $ | 22,488 | $ | 15,928 | |||
Adjustments to reconcile net income to net cash provided by operating activities: | |||||||||
Undisbursed income of subsidiaries | (6,948 | ) | (22,084 | ) | (14,107 | ) | |||
Amortization of deferred financing costs | 202 | 203 | 118 | ||||||
Increase (decrease) in accrued interest payable | — | (143 | ) | 1,149 | |||||
Decrease (increase) in other assets | (913 | ) | 587 | (453 | ) | ||||
Increase (decrease) in other liabilities | 776 | 532 | (123 | ) | |||||
Net cash provided by operating activities | 21,758 | 1,583 | 2,512 | ||||||
Cash Flows from Investing Activities: | |||||||||
Purchase of investment securities available-for-sale | (285 | ) | (248 | ) | (8,110 | ) | |||
Net payments for investments in subsidiaries | (13,030 | ) | (12,600 | ) | (69,580 | ) | |||
Net cash used in investing activities | (13,315 | ) | (12,848 | ) | (77,690 | ) | |||
Cash Flows from Financing Activities: | |||||||||
Net proceeds from issuance of subordinated notes payable | — | — | 33,988 | ||||||
Net proceeds from exercise of stock options | 2,674 | 353 | 250 | ||||||
Cancellation of stock options | (6,200 | ) | (229 | ) | — | ||||
Purchase of treasury stock | (5,125 | ) | (3,158 | ) | (6,746 | ) | |||
Net cash provided by (used in) financing activities | (8,651 | ) | (3,034 | ) | 27,492 | ||||
Net change in cash and cash equivalents | (208 | ) | (14,299 | ) | (47,686 | ) | |||
Cash and cash equivalents at beginning of year | 4,936 | 19,235 | 66,921 | ||||||
Cash and cash equivalents at end of year | $ | 4,728 | $ | 4,936 | $ | 19,235 | |||
[23] SEGMENTS
The Company operates two reportable segments: Bank and Investment Management.
• | The Bank segment provides commercial banking and private banking services to middle-market businesses and high-net-worth individuals through the TriState Capital Bank subsidiary. |
• | The Investment Management segment provides advisory and sub-advisory investment management services to primarily institutional plan sponsors through the Chartwell Investment Partners, LLC subsidiary and also supports distribution and marketing efforts for Chartwell’s proprietary investment products through the Chartwell TSC Securities Corp. subsidiary. |
The following tables provide financial information for the two segments of the Company as of and for the periods indicated. The information provided under the caption “Parent and Other” represents general operating expenses of the Company not considered to be a reportable segment, which includes the parent company activity as well as eliminations and adjustments that are necessary for purposes of reconciliation to the consolidated amounts.
(Dollars in thousands) | December 31, 2016 | December 31, 2015 | ||||
Assets: | ||||||
Bank | $ | 3,846,353 | $ | 3,236,756 | ||
Investment management | 85,072 | 65,516 | ||||
Parent and other | (968 | ) | (101 | ) | ||
Total assets | $ | 3,930,457 | $ | 3,302,171 | ||
135
Year Ended December 31, 2016 | ||||||||||||
(Dollars in thousands) | Bank | Investment Management | Parent and Other | Consolidated | ||||||||
Income statement data: | ||||||||||||
Interest income | $ | 98,027 | $ | — | $ | 285 | $ | 98,312 | ||||
Interest expense | 21,300 | — | 2,199 | 23,499 | ||||||||
Net interest income (loss) | 76,727 | — | (1,914 | ) | 74,813 | |||||||
Provision for loan losses | 838 | — | — | 838 | ||||||||
Net interest income (loss) after provision for loan losses | 75,889 | — | (1,914 | ) | 73,975 | |||||||
Non-interest income: | ||||||||||||
Investment management fees | — | 37,258 | (223 | ) | 37,035 | |||||||
Net gain on the sale and call of investment securities | 77 | — | — | 77 | ||||||||
Other non-interest income | 9,393 | 3 | — | 9,396 | ||||||||
Total non-interest income | 9,470 | 37,261 | (223 | ) | 46,508 | |||||||
Non-interest expense: | ||||||||||||
Intangible amortization expense | — | 1,753 | — | 1,753 | ||||||||
Change in fair value of acquisition earn out | — | (3,687 | ) | — | (3,687 | ) | ||||||
Other non-interest expense | 52,676 | 27,905 | 147 | 80,728 | ||||||||
Total non-interest expense | 52,676 | 25,971 | 147 | 78,794 | ||||||||
Income (loss) before tax | 32,683 | 11,290 | (2,284 | ) | 41,689 | |||||||
Income tax expense (benefit) | 9,568 | 4,357 | (877 | ) | 13,048 | |||||||
Net income (loss) | $ | 23,115 | $ | 6,933 | $ | (1,407 | ) | $ | 28,641 | |||
Year Ended December 31, 2015 | ||||||||||||
(Dollars in thousands) | Bank | Investment Management | Parent and Other | Consolidated | ||||||||
Income statement data: | ||||||||||||
Interest income | $ | 83,347 | $ | — | $ | 249 | $ | 83,596 | ||||
Interest expense | 13,448 | — | 2,195 | 15,643 | ||||||||
Net interest income (loss) | 69,899 | — | (1,946 | ) | 67,953 | |||||||
Provision for loan losses | 13 | — | — | 13 | ||||||||
Net interest income (loss) after provision for loan losses | 69,886 | — | (1,946 | ) | 67,940 | |||||||
Non-interest income: | ||||||||||||
Investment management fees | — | 29,814 | (196 | ) | 29,618 | |||||||
Net gain on the sale and call of investment securities | 33 | — | — | 33 | ||||||||
Other non-interest income | 5,840 | (8 | ) | — | 5,832 | |||||||
Total non-interest income | 5,873 | 29,806 | (196 | ) | 35,483 | |||||||
Non-interest expense: | ||||||||||||
Intangible amortization expense | — | 1,558 | — | 1,558 | ||||||||
Other non-interest expense | 47,186 | 21,403 | (104 | ) | 68,485 | |||||||
Total non-interest expense | 47,186 | 22,961 | (104 | ) | 70,043 | |||||||
Income (loss) before tax | 28,573 | 6,845 | (2,038 | ) | 33,380 | |||||||
Income tax expense (benefit) | 8,347 | 2,477 | 68 | 10,892 | ||||||||
Net income (loss) | $ | 20,226 | $ | 4,368 | $ | (2,106 | ) | $ | 22,488 | |||
136
Year Ended December 31, 2014 | ||||||||||||
(Dollars in thousands) | Bank | Investment Management | Parent and Other | Consolidated | ||||||||
Income statement data: | ||||||||||||
Interest income | $ | 77,975 | $ | — | $ | 110 | $ | 78,085 | ||||
Interest expense | 11,134 | — | 1,117 | 12,251 | ||||||||
Net interest income (loss) | 66,841 | — | (1,007 | ) | 65,834 | |||||||
Provision for loan losses | 10,159 | — | — | 10,159 | ||||||||
Net interest income (loss) after provision for loan losses | 56,682 | — | (1,007 | ) | 55,675 | |||||||
Non-interest income: | ||||||||||||
Investment management fees | — | 25,219 | (157 | ) | 25,062 | |||||||
Net gain on the sale and call of investment securities | 1,428 | — | — | 1,428 | ||||||||
Other non-interest income | 5,021 | 38 | — | 5,059 | ||||||||
Total non-interest income | 6,449 | 25,257 | (157 | ) | 31,549 | |||||||
Non-interest expense: | ||||||||||||
Intangible amortization expense | — | 1,299 | — | 1,299 | ||||||||
Change in fair value of acquisition earn out | — | 1,614 | — | 1,614 | ||||||||
Other non-interest expense | 43,115 | 18,338 | (39 | ) | 61,414 | |||||||
Total non-interest expense | 43,115 | 21,251 | (39 | ) | 64,327 | |||||||
Income (loss) before tax | 20,016 | 4,006 | (1,125 | ) | 22,897 | |||||||
Income tax expense (benefit) | 5,909 | 1,527 | (467 | ) | 6,969 | |||||||
Net income (loss) | $ | 14,107 | $ | 2,479 | $ | (658 | ) | $ | 15,928 | |||
[24] SUBSEQUENT EVENTS
In January 2017, the Company’s Board of Directors approved a new share repurchase program of up to $5 million. Under the authorization, purchases of shares may be made at the discretion of management from time to time in the open market or through negotiated transactions.
137
SELECTED QUARTERLY FINANCIAL DATA
The tables below summarize our unaudited quarterly financial information for the years ended December 31, 2016 and 2015:
2016 | ||||||||||||
(Dollars in thousands, except per share data) | Fourth Quarter | Third Quarter | Second Quarter | First Quarter | ||||||||
Income statement data: | (unaudited) | |||||||||||
Interest income | $ | 26,232 | $ | 24,925 | $ | 23,795 | $ | 23,360 | ||||
Interest expense | 6,719 | 6,221 | 5,576 | 4,983 | ||||||||
Net interest income | 19,513 | 18,704 | 18,219 | 18,377 | ||||||||
Provision (credit) for loan losses | 1,178 | (542 | ) | 80 | 122 | |||||||
Net interest income after provision for loan losses | 18,335 | 19,246 | 18,139 | 18,255 | ||||||||
Non-interest income: | ||||||||||||
Investment management fees | 10,221 | 10,333 | 9,462 | 7,019 | ||||||||
Net gain on the sale and call of investment securities | — | 14 | 62 | 1 | ||||||||
Other non-interest income | 3,428 | 2,150 | 1,923 | 1,895 | ||||||||
Total non-interest income | 13,649 | 12,497 | 11,447 | 8,915 | ||||||||
Non-interest expense: | ||||||||||||
Intangible amortization expense | 462 | 463 | 438 | 390 | ||||||||
Change in fair value of acquisition earn out | (2,478 | ) | (1,209 | ) | — | — | ||||||
Other non-interest expense | 22,833 | 21,260 | 19,019 | 17,616 | ||||||||
Total non-interest expense | 20,817 | 20,514 | 19,457 | 18,006 | ||||||||
Income before tax | 11,167 | 11,229 | 10,129 | 9,164 | ||||||||
Income tax expense | 3,596 | 2,775 | 3,356 | 3,321 | ||||||||
Net income | $ | 7,571 | $ | 8,454 | $ | 6,773 | $ | 5,843 | ||||
Earnings per common share: | ||||||||||||
Basic | $ | 0.27 | $ | 0.31 | $ | 0.25 | $ | 0.21 | ||||
Diluted | $ | 0.27 | $ | 0.30 | $ | 0.24 | $ | 0.21 | ||||
138
2015 | ||||||||||||
(Dollars in thousands, except per share data) | Fourth Quarter | Third Quarter | Second Quarter | First Quarter | ||||||||
Income statement data: | (unaudited) | |||||||||||
Interest income | $ | 21,923 | $ | 20,989 | $ | 20,481 | $ | 20,203 | ||||
Interest expense | 4,312 | 3,984 | 3,808 | 3,539 | ||||||||
Net interest income | 17,611 | 17,005 | 16,673 | 16,664 | ||||||||
Provision (credit) for loan losses | 244 | (1,341 | ) | 185 | 925 | |||||||
Net interest income after provision for loan losses | 17,367 | 18,346 | 16,488 | 15,739 | ||||||||
Non-interest income: | ||||||||||||
Investment management fees | 7,429 | 7,020 | 7,514 | 7,655 | ||||||||
Net gain on the sale and call of investment securities | 16 | — | — | 17 | ||||||||
Other non-interest income | 1,597 | 995 | 2,062 | 1,178 | ||||||||
Total non-interest income | 9,042 | 8,015 | 9,576 | 8,850 | ||||||||
Non-interest expense: | ||||||||||||
Intangible amortization expense | 389 | 390 | 390 | 389 | ||||||||
Other non-interest expense | 17,669 | 16,911 | 17,192 | 16,713 | ||||||||
Total non-interest expense | 18,058 | 17,301 | 17,582 | 17,102 | ||||||||
Income before tax | 8,351 | 9,060 | 8,482 | 7,487 | ||||||||
Income tax expense | 2,765 | 2,942 | 2,754 | 2,431 | ||||||||
Net income | $ | 5,586 | $ | 6,118 | $ | 5,728 | $ | 5,056 | ||||
Earnings per common share: | ||||||||||||
Basic | $ | 0.20 | $ | 0.22 | $ | 0.21 | $ | 0.18 | ||||
Diluted | $ | 0.20 | $ | 0.22 | $ | 0.20 | $ | 0.18 | ||||
139
ITEM 9. CHANGES IN AND DISAGREEMENTS WITH ACCOUNTANTS ON ACCOUNTING AND FINANCIAL DISCLOSURE
None.
ITEM 9A. CONTROLS AND PROCEDURES
Disclosure Controls and Procedures
The Company’s management, including the Chief Executive Officer and Chief Financial Officer, conducted an evaluation of the effectiveness of the Company’s disclosure controls and procedures (as defined in Rules 13a-15(e) and 15d-15(e) under the Securities Exchange Act of 1934, as amended (the “Exchange Act”)) as of December 31, 2016. The Company’s disclosure controls and procedures are designed to ensure that information required to be disclosed by the Company in the reports that it files or submits under the Exchange Act is recorded, processed, summarized, and reported within the time periods specified in the U.S. Securities and Exchange Commission’s rules and forms, and that such information is accumulated and communicated to the Company’s management, including the Company’s Chief Executive Officer and Chief Financial Officer, to allow timely decisions regarding required disclosure. Based on this evaluation, the Chief Executive Officer and Chief Financial Officer concluded that the Company’s disclosure controls and procedures were effective as of December 31, 2016.
Management’s Annual Report on Internal Control over Financial Reporting
The Company’s management is responsible for establishing and maintaining adequate internal control over financial reporting, as such term is defined in Exchange Act Rule 13a-15(f). Management assessed the Company’s system of internal control over financial reporting as of December 31, 2016, in relation to criteria for effective internal control over financial reporting as described in “Internal Control Integrated Framework (2013),” issued by the Committee of Sponsoring Organizations of the Treadway Commission (“COSO”) in 2013. Based on this assessment, management concludes that, as of December 31, 2016, the Company’s system of internal control over financial reporting is effective and meets the criteria of the “Internal Control Integrated Framework (2013).”
As an emerging growth company, this Annual Report on Form 10-K does not include an attestation report of our registered public accounting firm, pursuant to the JOBS Act.
Changes in Internal Control over Financial Reporting
On May 14, 2013, COSO issued an updated version of its Internal Control - Integrated Framework, referred to as the 2013 COSO Framework, and has indicated that after December 15, 2014, the 1992 Framework will be considered superseded. Management’s assessment of the overall effectiveness of our internal controls over financial reporting for the year ending December 31, 2016, was based on the 2013 COSO Framework. The change from the 1992 Framework to the 2013 COSO Framework was not significant to the overall control structure over financial reporting.
There were no changes in the Company’s internal control over financial reporting (as defined in Rules 13a-15(f) and 15d-15(f) under the Exchange Act) that occurred during the year ended December 31, 2016, that have materially affected or are reasonably likely to materially affect the Company’s internal control over financial reporting.
ITEM 9B. OTHER INFORMATION
None.
140
PART III
ITEM 10. DIRECTORS, EXECUTIVE OFFICERS AND CORPORATE GOVERNANCE
Information required by this item is set forth in our definitive proxy materials regarding our annual meeting of stockholders to be held May 16, 2017, which proxy materials will be filed with the SEC no later than April 30, 2017, and are incorporated by reference.
ITEM 11. EXECUTIVE COMPENSATION
Information required by this item is set forth in our definitive proxy materials regarding our annual meeting of stockholders to be held May 16, 2017, which proxy materials will be filed with the SEC no later than April 30, 2017, and are incorporated by reference.
ITEM 12. SECURITY OWNERSHIP OF CERTAIN BENEFICIAL OWNERS AND MANAGEMENT AND RELATED STOCKHOLDER MATTERS
Information required by this item is set forth in our definitive proxy materials regarding our annual meeting of stockholders to be held May 16, 2017, which proxy materials will be filed with the SEC no later than April 30, 2017, and are incorporated by reference.
ITEM 13. CERTAIN RELATIONSHIPS AND RELATED TRANSACTIONS, AND DIRECTOR INDEPENDENCE
Information required by this item is set forth in our definitive proxy materials regarding our annual meeting of stockholders to be held May 16, 2017, which proxy materials will be filed with the SEC no later than April 30, 2017, and are incorporated by reference.
ITEM 14. PRINCIPAL ACCOUNTING FEES AND SERVICES
Information required by this item is set forth in our definitive proxy materials regarding our annual meeting of stockholders to be held May 16, 2017, which proxy materials will be filed with the SEC no later than April 30, 2017, and are incorporated by reference.
PART IV
ITEM 15. EXHIBITS AND FINANCIAL STATEMENT SCHEDULES
(a) FINANCIAL STATEMENTS
The consolidated financial statements required in response to this item are incorporated by reference to Part II - Item 8 of this Report.
(b) EXHIBITS
The exhibits filed or incorporated by reference as a part of this report are incorporated by reference to the Exhibit Index following the signature page of this Report.
(c) SCHEDULES
No financial statement schedules are being filed because of the absence of conditions under which they are required or because the required information is included in the consolidated financial statements and related notes thereto.
141
SIGNATURES
Pursuant to the requirements of Section 13 or 15(d) of the Securities Exchange Act of 1934, the registrant has duly caused this report to be signed on its behalf by the undersigned, thereunto duly authorized.
TRISTATE CAPITAL HOLDINGS, INC. | |||
Date: | February 14, 2017 | By: | /s/ James F. Getz |
James F. Getz | |||
Chairman, President and Chief Executive Officer | |||
Date: | February 14, 2017 | By: | /s/ Mark L. Sullivan |
Mark L. Sullivan | |||
Vice Chairman and Chief Financial Officer | |||
Pursuant to the requirements of the Securities Exchange Act of 1934, this report has been signed below by the following persons on behalf of the registrant and in the capacities and on the dates indicated.
Date: | February 14, 2017 | By: | /s/ James F. Getz |
James F. Getz | |||
Chairman, President, Chief Executive Officer and Director | |||
(Principal Executive Officer) | |||
Date: | February 14, 2017 | By: | /s/ Mark L. Sullivan |
Mark L. Sullivan | |||
Vice Chairman, Chief Financial Officer and Director | |||
(Principal Financial and Accounting Officer) | |||
Date: | February 14, 2017 | By: | /s/ David L. Bonvenuto* |
David L. Bonvenuto | |||
Director | |||
Date: | February 14, 2017 | By: | /s/ Anthony J. Buzzelli* |
Anthony J. Buzzelli | |||
Director | |||
Date: | February 14, 2017 | By: | /s/ Helen Hanna Casey* |
Helen Hanna Casey | |||
Director | |||
Date: | February 14, 2017 | By: | /s/ E.H. (Gene) Dewhurst* |
E.H. (Gene) Dewhurst | |||
Director | |||
Date: | February 14, 2017 | By: | /s/ James J. Dolan* |
James J. Dolan | |||
Director | |||
Date: | February 14, 2017 | By: | /s/ James E. Minnick* |
James E. Minnick | |||
Director | |||
142
Date: | February 14, 2017 | By: | /s/ Kim A. Ruth* |
Kim A. Ruth | |||
Director | |||
Date: | February 14, 2017 | By: | /s/ A. William Schenck, III* |
A. William Schenck, III | |||
Vice Chairman and Director | |||
Date: | February 14, 2017 | By: | /s/ Richard B. Seidel* |
Richard B. Seidel | |||
Director | |||
Date: | February 14, 2017 | By: | /s/ John B. Yasinsky* |
John B. Yasinsky | |||
Director | |||
* | By: | /s/ James F. Getz | |
James F. Getz, Attorney-in-Fact | |||
143
EXHIBIT INDEX
Exhibit
No. | Description |
2.1 | TriState Capital Holdings, Inc. asset purchase agreement to acquire Chartwell Investment Partners, L.P. dated January 3, 2014, which is incorporated by reference to our Annual Report on Form 10-K filed with the SEC on March 3, 2014. |
2.2 | TriState Capital Holdings, Inc. asset purchase agreement to acquire The Killen Group, Inc. dated December 16, 2015, which is incorporated by reference to our Annual Report on Form 10-K filed with the SEC on February 16, 2016. |
3.1 | Amended and Restated Articles of Incorporation, which is incorporated by reference to our Registration Statement on Form S-1/A (File No. 333-187681) filed with the SEC on April 16, 2013. |
3.2 | Bylaws, as amended, which is incorporated by reference to our Registration Statement on Form S-1/A (File No. 333-187681) filed with the SEC on April 16, 2013. |
4.1 | Specimen common stock certificate, which is incorporated by reference to our Registration Statement on Form S-1/A (File No. 333-187681) filed with the SEC on April 16, 2013. |
10.1 | TriState Capital Holdings, Inc. 2006 Stock Option Plan (“2006 Stock Option Plan”), which is incorporated by reference to our Registration Statement on Form S-1 (File No. 333-187681) filed with the SEC on April 2, 2013. |
10.2 | Form of Nonqualified Stock Option Award Agreement under 2006 Stock Option Plan, which is incorporated by reference to our Registration Statement on Form S-1 (File No. 333-187681) filed with the SEC on April 2, 2013. |
10.3 | Restricted Stock Award Agreement dated January 24, 2011, between TriState Capital Holdings, Inc. and James F. Getz, which is incorporated by reference to our Registration Statement on Form S-1 (File No. 333-187681) filed with the SEC on April 2, 2013. |
10.4 | Agreement of Lease dated August 29, 2006 between Oxford Development Company/Grant Street, Landlord, and TriState Capital Holdings, Inc., Tenant, and amendment thereto dated September 13, 2010, which is incorporated by reference to our Registration Statement on Form S-1 (File No. 333-187681) filed with the SEC on April 2, 2013. |
10.5 | Preferred Stock Purchase Agreement dated April 24, 2012, by and among TriState Capital Holdings, Inc., LM III TriState Holdings LLC and LM III-A TriState Holdings LLC, which is incorporated by reference to our Registration Statement on Form S-1 (File No. 333-187681) filed with the SEC on April 2, 2013. |
10.6 | Amendment No. 1 to the Preferred Stock Purchase Agreement dated August 10, 2012 by and among TriState Capital Holdings, Inc., LM III TriState Holdings LLC and LM III-A TriState Holdings LLC, which is incorporated by reference to our Registration Statement on Form S-1 (File No. 333-187681) filed with the SEC on April 2, 2013. |
10.7 | Agreement Regarding Perpetual Convertible Preferred Stock, Series C dated as of March 8, 2013, by and among TriState Capital Holdings, Inc., LM III TriState Holdings LLC and LM III-A TriState Holdings LLC, which is incorporated by reference to our Registration Statement on Form S-1 (File No. 333-187681) filed with the SEC on April 2, 2013. |
10.8 | Registration Rights Agreement dated August 10, 2012, by and among TriState Capital Holdings, Inc., LM III TriState Holdings LLC and LM III-A TriState Holdings LLC, which is incorporated by reference to our Registration Statement on Form S-1 (File No. 333-187681) filed with the SEC on April 2, 2013. |
10.9 | TriState Capital Bank Supplemental Executive Retirement Agreement dated February 28, 2013, by and among TriState Capital Holdings, Inc., TriState Capital Bank and James F. Getz, which is incorporated by reference to our Registration Statement on Form S-1 (File No. 333-187681) filed with the SEC on April 2, 2013. |
10.10 | TriState Capital Holdings, Inc. 2014 Omnibus Incentive Plan, which is incorporated by reference to our Definitive Proxy Statement on Form DEF 14A filed with the SEC on April 15, 2014. |
10.11 | TriState Capital Holdings, Inc. Short-Term Incentive Plan, which is incorporated by reference to our Definitive Proxy Statement on Form DEF 14A filed with the SEC on April 15, 2014. |
144
21 | Subsidiaries of TriState Capital Holdings, Inc., filed herewith. |
23.2 | Consent of KPMG LLP, Independent Registered Public Accounting Firm, filed herewith. |
24 | Power of Attorney, filed herewith. |
31.1 | Certification of Chief Executive Officer pursuant to Section 302 of the Sarbanes-Oxley Act of 2002, filed herewith. |
31.2 | Certification of Chief Financial Officer pursuant to Section 302 of the Sarbanes-Oxley Act of 2002, filed herewith. |
32 | Certification of Chief Executive Officer and Chief Financial Officer pursuant to Section 906 of the Sarbanes-Oxley Act of 2002, filed herewith. |
101 | The following materials from TriState Capital Holdings, Inc.’s Annual Report on Form 10-K for the fiscal year ended December 31, 2016, formatted in XBRL: (i) the Consolidated Statements of Financial Condition, (ii) the Consolidated Statements of Income, (iii) the Consolidated Statements of Comprehensive Income, (iv) the Consolidated Statements of Changes in Shareholders’ Equity, (v) the Consolidated Statements of Cash Flows and (vi) the Notes to Consolidated Financial Statements, furnished herewith. |
145