Attached files
| file | filename |
|---|---|
| 8-K - 8-K - Agiliti Health, Inc. | a17-1767_18k.htm |
Exhibit 99.1
Universal Hospital Services January 2017 2017 J.P. Morgan Healthcare Conference
Forward looking statements Safe Harbor Statement under the Private Securities Litigation Reform Act of 1995: Universal Hospital Services, Inc. believes statements in this presentation looking forward in time involve risks and uncertainties based on management’s current views and assumptions. Actual events may differ materially. Please refer to the cautionary statement regarding forward-looking statements and risk factors that appear in the Company’s Annual Report on Form 10-K for the year ended December 31, 2015, and other filings with the SEC, which can be accessed at www.UHS.com.
We believe every interaction has the power to change a life.
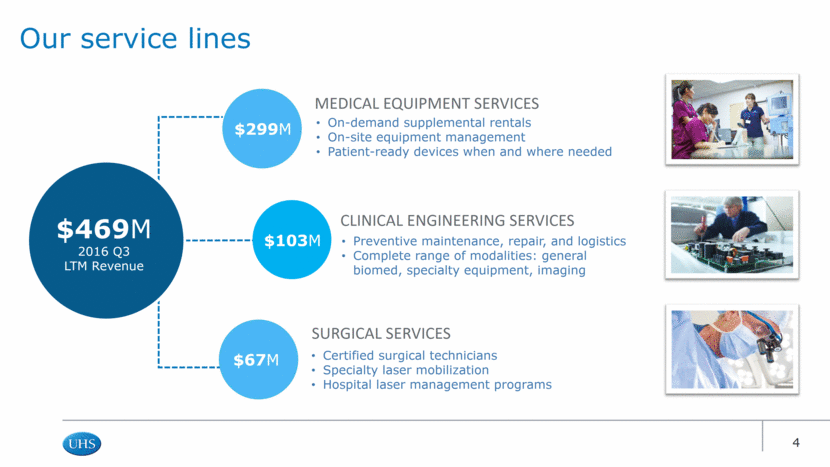
Our service lines $299M $103M $67M MEDICAL EQUIPMENT SERVICES CLINICAL ENGINEERING SERVICES SURGICAL SERVICES On-demand supplemental rentals On-site equipment management Patient-ready devices when and where needed Preventive maintenance, repair, and logistics Complete range of modalities: general biomed, specialty equipment, imaging Certified surgical technicians Specialty laser mobilization Hospital laser management programs $469M 2016 Q3 LTM Revenue
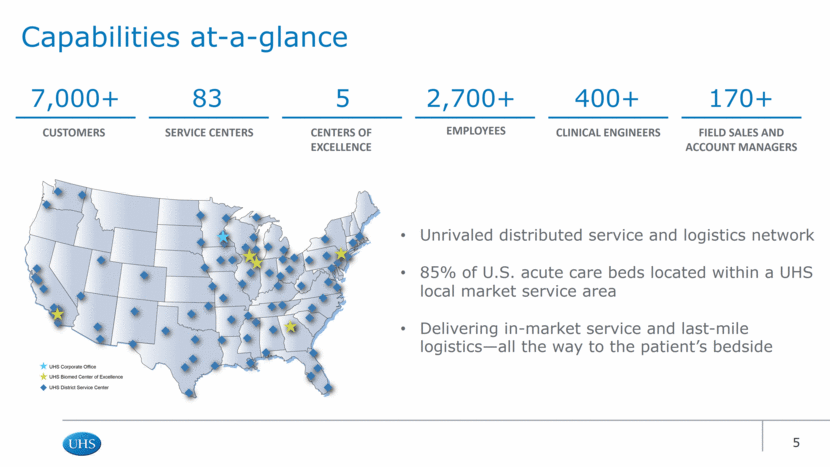
Capabilities at-a-glance 1939 1940 – 1970s 1980s 83 5 7,000+ Unrivaled distributed service and logistics network 85% of U.S. acute care beds located within a UHS local market service area Delivering in-market service and last-mile logistics—all the way to the patient’s bedside 2,700+ 400+ 170+ SERVICE CENTERS CUSTOMERS CENTERS OF EXCELLENCE EMPLOYEES CLINICAL ENGINEERS FIELD SALES AND ACCOUNT MANAGERS
We are creating a Category of One.
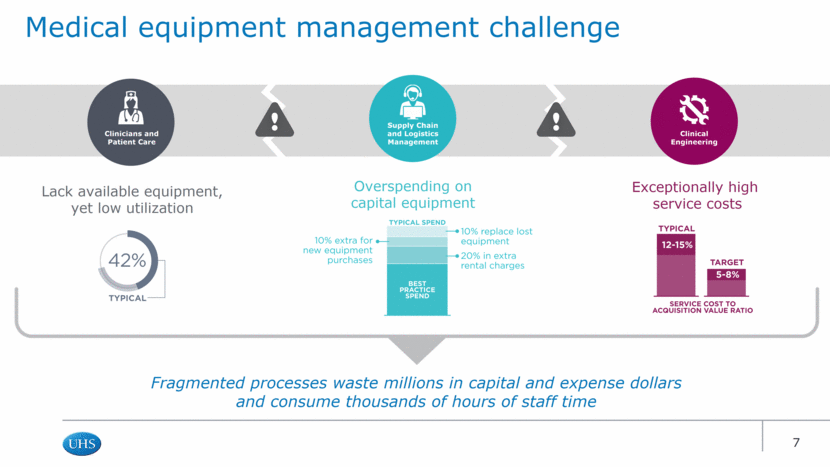
Fragmented processes waste millions in capital and expense dollars and consume thousands of hours of staff time Lack available equipment, yet low utilization Overspending on capital equipment Exceptionally high service costs Supply Chain and Logistics Management Clinicians and Patient Care Clinical Engineering Medical equipment management challenge
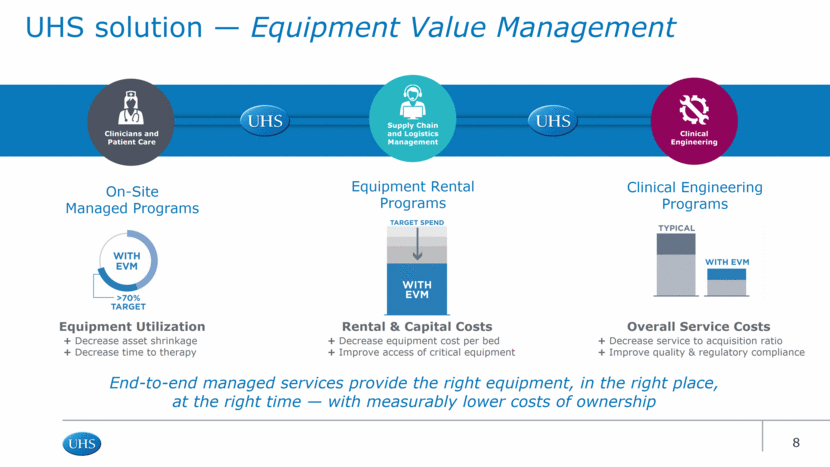
Clinical Engineering Programs On-Site Managed Programs Equipment Rental Programs UHS solution — Equipment Value Management End-to-end managed services provide the right equipment, in the right place, at the right time — with measurably lower costs of ownership Supply Chain and Logistics Management Clinicians and Patient Care Clinical Engineering Equipment Utilization Rental & Capital Costs Overall Service Costs + Decrease asset shrinkage + Decrease time to therapy + Decrease equipment cost per bed + Improve access of critical equipment + Decrease service to acquisition ratio + Improve quality & regulatory compliance
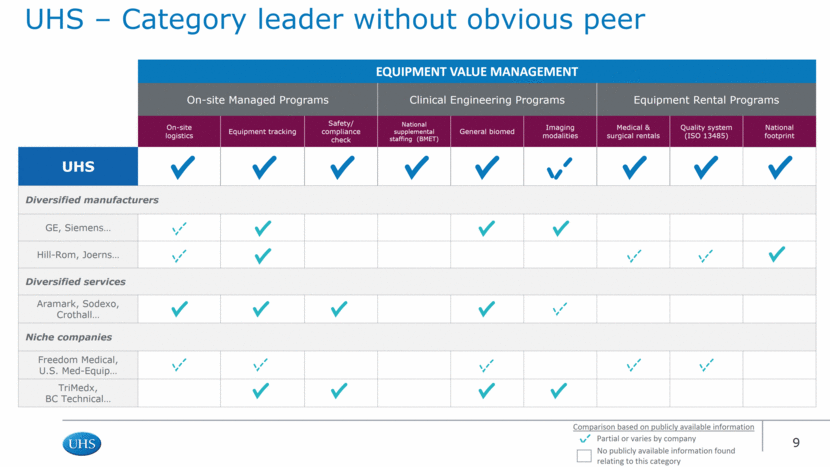
EQUIPMENT VALUE MANAGEMENT On-site Managed Programs Clinical Engineering Programs Equipment Rental Programs On-site logistics Equipment tracking Safety/ compliance check National supplemental staffing (BMET) General biomed Imaging modalities Medical & surgical rentals Quality system (ISO 13485) National footprint UHS Diversified manufacturers GE, Siemens Hill-Rom, Joerns Diversified services Aramark, Sodexo, Crothall Niche companies Freedom Medical, U.S. Med-Equip TriMedx, BC Technical UHS – Category leader without obvious peer Comparison based on publicly available information Partial or varies by company No publicly available information found relating to this category
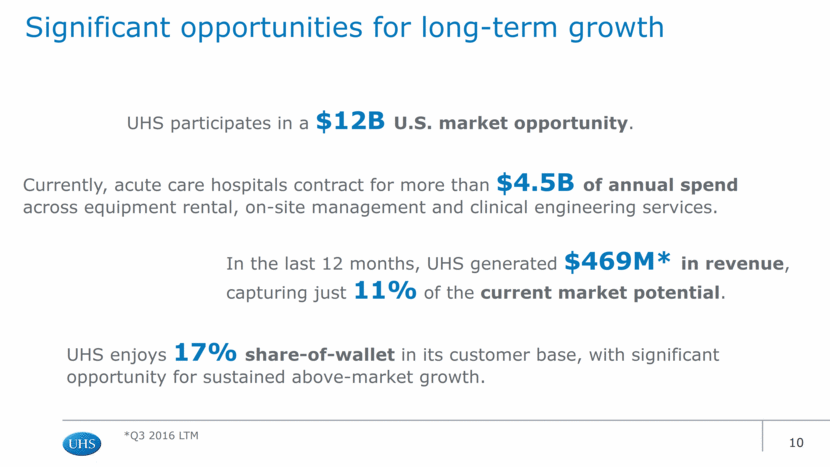
UHS participates in a $12B U.S. market opportunity. Currently, acute care hospitals contract for more than $4.5B of annual spend across equipment rental, on-site management and clinical engineering services. In the last 12 months, UHS generated $469M* in revenue, capturing just 11% of the current market potential. UHS enjoys 17% share-of-wallet in its customer base, with significant opportunity for sustained above-market growth. Significant opportunities for long-term growth *Q3 2016 LTM
Key operational and financial metrics
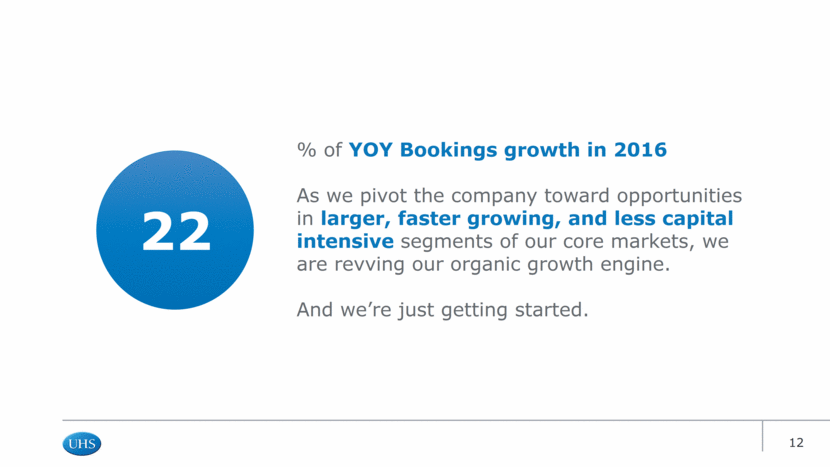
22 % of YOY Bookings growth in 2016 As we pivot the company toward opportunities in larger, faster growing, and less capital intensive segments of our core markets, we are revving our organic growth engine. And we’re just getting started.
95 % of UHS Revenue that is annually recurring* UHS experiences only 3% average annual customer losses, and roughly 2% of revenue is lost and replaced each year from the normal churn in the rental business. *Excludes one-time sales
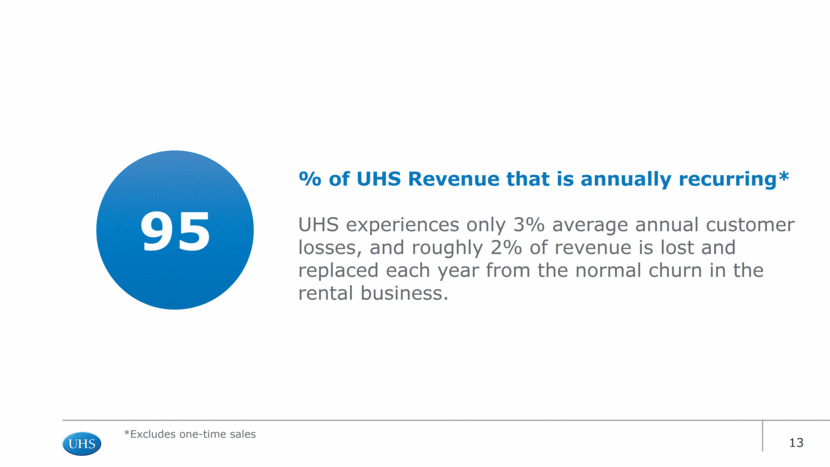
40 Management anticipates reducing the capital intensity of the UHS business model by nearly 40% through 2019. As we continue to diversify away from the single-customer asset-ownership model (Asset 360) and focus on our differentiated service offering, Capex as a Percentage of Revenue will go from roughly 13% in 2014 to around 8% in 2019.
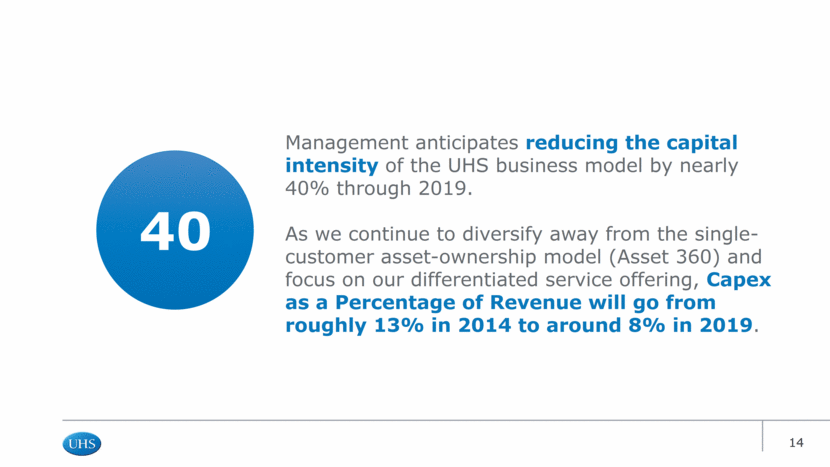
85 % of all hospital beds in the U.S. located within a UHS local market service region. Our unmatched national service infrastructure is uniquely capable of delivering time-critical, in-market service and last-mile logistics—all the way to the patient’s bedside.
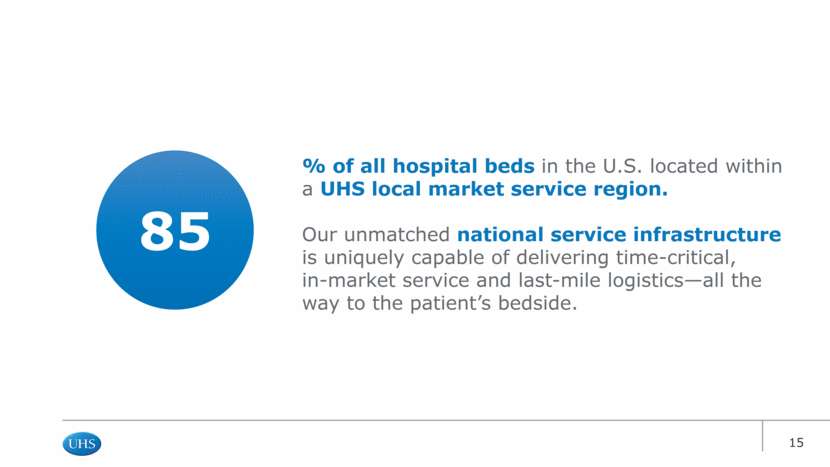
+54 2016 Net Promoter Score (NPS) for UHS The NPS has a range of -100 to +100, and it is a widely accepted measure of customer satisfaction. Our 2016 NPS improved more than 10% YOY, and puts us on par with companies like Netflix and Google, and within striking distance of Apple.
76 2016 Employee Engagement Score for UHS A laser focus on taking care of our most critical resource—the people who serve our customers—resulted in an 11 point YOY improvement in 2016, and scores increasing in every category. Our engagement scores are nearly on par with the U.S. Extraordinary Company benchmark.
1 The number of companies operating at scale, with a differentiated value proposition, and an unmatched nationwide footprint, focused on helping customers reduce capital and operating costs to better manage medical equipment. A company that is increasingly the vendor of choice for customers This is UHS.
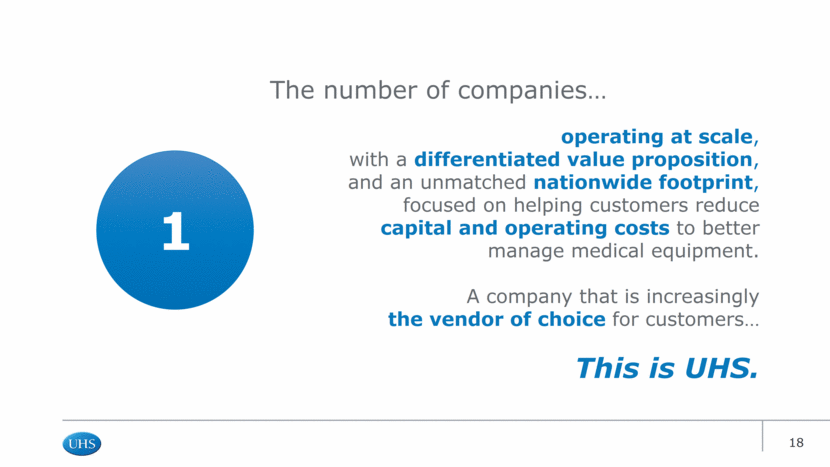
Accelerating value creation (2017 & beyond) Low-double-digit organic revenue growth Select M&A investments Leverage scale Reduce capital intensity Execute on share-of-wallet capture opportunities Accelerating growth, unlocking shareholder value Historical context (2012-2014) Emphasis on asset purchase/management model (Asset360) Internal focus on cost controls Investing for growth (2015-2016) Invest in sales and marketing capabilities Focus on operations Invest in our people
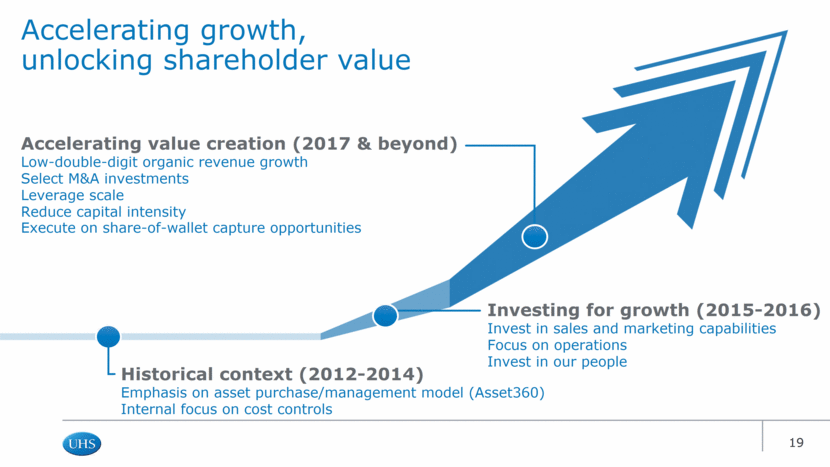
Historical financial view 2015-2016 Investing for growth Changing the growth trajectory Investing in key capabilities across the business Building a Category of One company Focusing on recurring revenue contracts with high value and low capital intensity * *2016 EBITDA represents mid-point of management’s most recent external guidance range .0
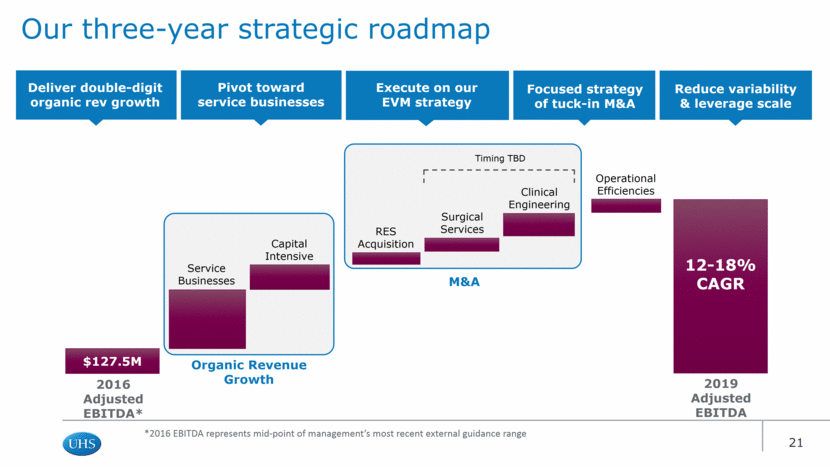
Our three-year strategic roadmap $127.5M 12-18% CAGR 2016 Adjusted EBITDA* 2019 Adjusted EBITDA Organic Revenue Growth Service Businesses Capital Intensive M&A Timing TBD Surgical Services Clinical Engineering RES Acquisition Operational Efficiencies Deliver double-digit organic rev growth Pivot toward service businesses Execute on our EVM strategy Focused strategy of tuck-in M&A Reduce variability & leverage scale *2016 EBITDA represents mid-point of management’s most recent external guidance range
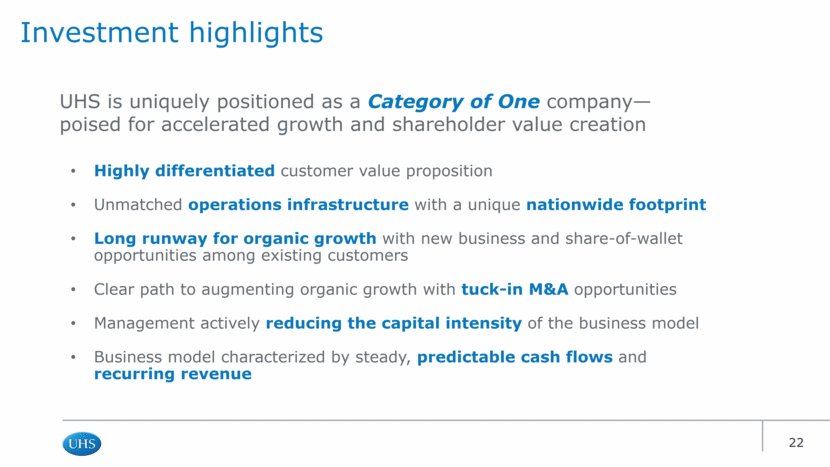
Investment highlights Highly differentiated customer value proposition Unmatched operations infrastructure with a unique nationwide footprint Long runway for organic growth with new business and share-of-wallet opportunities among existing customers Clear path to augmenting organic growth with tuck-in M&A opportunities Management actively reducing the capital intensity of the business model Business model characterized by steady, predictable cash flows and recurring revenue UHS is uniquely positioned as a Category of One company— poised for accelerated growth and shareholder value creation
Thank you
