Attached files
| file | filename |
|---|---|
| 8-K - VSM 8-K - Versum Materials, Inc. | vsm8-k121216.htm |

VERSUM MATERIALS
INVESTOR MEETINGS
December 2016

FORWARD-LOOKING STATEMENTS
This presentation contains certain statements regarding future actions, results and other matters which are “forward-looking statements” within the
meaning of the safe harbor provisions of the U.S. Private Securities Litigation Reform Act of 1995. The words “believe,” “expect,” “anticipate,” “project,”
“estimate,” “budget,” “continue,” “could,” “intend,” “may,” “plan,” “potential,” “predict,” “seek,” “should,” “will,” “would,” “objective,” “forecast,” “goal,”
“guidance,” “outlook,” “effort,” “target” and similar expressions identify these forward-looking statements, which speak only as of the date the statements
were made. Forward-looking statements include, without limitation, statements about business strategies, operating plans, and outlook for Versum
Materials, our growth prospects, expectations as to future sales, operating income or Adjusted EBITDA, estimates regarding capital requirements and needs
for additional financing, estimates of expenses and cost reduction efforts, future revenues and profitability, our future operating results on a segment basis,
anticipated cash flows, estimates of the size of the market for our products, estimates of the success of other competing technologies that may become
available, and our future success as an independent public company. These forward-looking statements are based on management’s reasonable
expectations and assumptions as of the date of this presentation. Actual results and the outcomes of future events may differ materially from the those
expressed or implied in the forward-looking statements because of a number of risks and uncertainties, including, without limitation, weakening of global or
regional general economic conditions and product supply versus demand imbalances in the semiconductor industry could decrease the demand for our
goods and services; our concentrated customer base; our ability to continue technological innovation to meet the evolving needs of our customers; our
inability to protect and enforce intellectual property rights; our available cash and access to additional capital is limited by our substantial debt; uncertainty
regarding the availability of financing to us in the future and the terms of such financing; restrictions in the agreements governing our indebtedness;
operational, political and legal risks of our international operations; hazards associated with specialty chemical manufacturing could disrupt our operations
or the operations of our suppliers or customers; changes in government regulations in the countries we operate; raw material shortages and price increases;
sole source and limited source suppliers; costs of complying with global environmental health and safety regulations; the impact of changes in
environmental, tax or other legislation and regulations in jurisdictions in which Versum Materials and its affiliates operate; the security of our information
technology networks and systems could be compromised and disrupted; fluctuation of currency exchange rates; increased competition; costs and outcomes
of litigation or regulatory investigations; the timing, impact, and other uncertainties of future acquisitions; the successful relocation of our headquarters and
organizational changes; our ability to realize the anticipated benefits as a result of our Separation from Air Products; our ability to successfully complete the
transition to an independent public company; our historical financial data as part of Air Products may not reflect what our financial results would have been
had we been an independent company; the loss of certain benefits enjoyed as part of Air Products; increased costs as a separate public company; our ability
to assure customers of our financial stability as a separate company; tax and other potential liabilities to Air Products assumed in connection with the
separation and spin-off; restrictions against engaging in certain corporate transactions; potential conflicts of interest between us and Air Products by our
directors and officers; potential state and federal law liabilities arising out of the separation and spin-off from Air Products; fluctuations in our stock price; no
guarantee regarding the timing, amount or payment of dividends; dilution of your percentage of stock ownership; restrictions in our governing documents
and of Delaware law may prevent or delay an acquisition of us. These and other important factors that could cause actual results or events to differ
materially from those expressed in our forward-looking statements are described in our filings with the U.S. Securities and Exchange Commission, including
our Form 10 Registration Statement, as amended, and our periodic filings. Versum Materials disclaims any obligation or undertaking to disseminate any
updates or revisions to the outlook and any forward-looking statements contained in this document to reflect any change in assumptions, beliefs or
expectations, or any change in circumstances occurring after the date of this presentation.
Non-GAAP Financial Measures
This presentation contains certain “Non-GAAP financial measures.” Please refer to the Appendix for definitions of the non-GAAP financial measures used
herein and for a reconciliation of those non-GAAP financial measures to their most comparable GAAP measures.

CONTENTS
Semiconductor Industry Overview
Versum Materials’ Business
Financial Profile
2017 Industry Trends and Versum Priorities
Appendices and Reconciliations
3

VERSUM MATERIALS
INVESTMENT HIGHLIGHTS
Solid growth
High margins
Low capital intensity
Strong cash flow
4
BEST IN CLASS ELECTRONIC MATERIALS COMPANY
Leadership positions in a profitable and
complex semiconductor materials industry
Strong technology, commercial and
operations capabilities
Compelling growth platforms with
sustainable competitive advantage
Strong financial performance and cash flow
generation
Experienced management team with
proven track record
Global infrastructure
Refer to Appendix for reconciliations between GAAP and non-GAAP measures.

SEMICONDUCTOR OVERVIEW

SEMICONDUCTOR INDUSTRY FUNDAMENTALS
DEMAND, COMPLEXITY AND PERFORMANCE FOR NEW GENERATION NODES DRIVES MATERIALS GROWTH
• Growing technology driven industry that enables human advancement
- Computation / Mobility / Big Data / Internet of Things (IoT)
• Complexity of Growing technology driven industry that enables human advancement
- Computation / Mobility chip architectures driving materials innovation and growth
- New Materials required to enable next generation nodes
- Increased processing steps changing the number of products and volume requirements
- Managing complexity and collaboration is critical to success in Materials
• Substantial industry capital spending across the cycles
• Significant industry concentration and growth in Asia
6
Source: ASM ISS 2016 and Versum estimates
GROWTH SUPPORTED BY NEED FOR NEW MATERIALS KEY GROWTH METRICS
2013 2014 2015 2016
Wafer Equipment
(Gartner, CY) -8% 16% 0% -1%
MSI Growth (Hilltop
Economics, FY) 2% 8% 7% 0%
SOURCE: Linx/Hilltop Economics, Gartner, Versum estimates

7
SCOPE OF SEMICONDUCTOR SPACE
MATERIALS MARKET OF OVERALL SEMICONDUCTOR REVENUES
• Critical competencies in molecular design,
formulation expertise and ultra high purity
• Changing semiconductor industry dynamics
reducing cyclicality and lowering volatility
• More than 80% of VSM materials sales to
semiconductor industry in both the memory
and logic segments
• Increased importance of materials in next
generation nodes driving growth
• Strong customer intimacy with strong product
development partnerships with customers
and OEMs
• Strategically located assets in Asia
• Advanced Materials revenue growth driven
by new product and new applications
Our Business
$0 $100 $200 $300 $400 $500
Semiconductor Market
OEM
$450 B Semiconductor Value Chain
IC
Materials
Wafers
34%
Polysilicon
13%
Photomasks
9%
Photoresists
4% CMP slurries
4%
Specialty gases
4%
Specialty
Chemicals
1%
Bulk Gases
4%
Specialty
substrates
4%
Wet Process
Chemicals
3%
Sputtering
Targets
2%
Other
18%
$50 Billion IC Materials Market Our Focus ~ $5B
Versum Participates
in Only ~1% of
the Overall
Semiconductor
Market(a)
(a) Excludes Delivery
Systems SBU.
Source: SEMI , 2016 McClean Report by IC Insights, Versum estimates

SEMICONDUCTOR INDUSTRY IS CHANGING
SHIFTING GROWTH DRIVERS (MOBILITY & IOT) & INDUSTRY CONCENTRATION
8
IC MARKET SHARE BY SYSTEM TYPE (%)
Scale and concentration in leading edge semiconductor manufacturers
Move towards consumer products driven demand
Source: 2015 McClean Report by IC Insights.
55.6% 51.3%
45.0%
37.2% 32.7%
18.5% 22.0%
29.3%
36.7% 41.8%
13.0% 12.9% 12.2% 11.6% 10.3%
4.7% 6.3% 6.5% 7.4% 8.4%
8.2% 7.5% 7.0% 7.1% 6.8%
0%
20%
40%
60%
80%
100%
1998 2003 2008 2013 2018F
P
e
rc
e
n
t
S
h
a
re
(
%
)
Computer Communications Consumer Auto Industrial/Other
Source: SEMI
* Projected
*
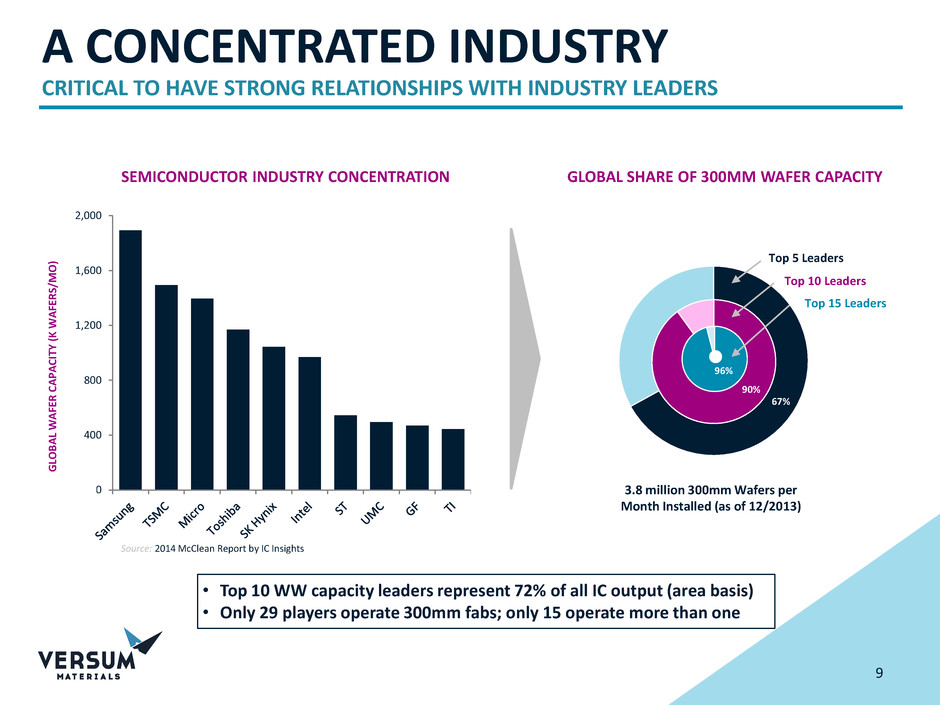
CONCENTRATION OF IC SUPPLIERS
A CONCENTRATED INDUSTRY
CRITICAL TO HAVE STRONG RELATIONSHIPS WITH INDUSTRY LEADERS
67%
• Top 10 WW capacity leaders represent 72% of all IC output (area basis)
• Only 29 players operate 300mm fabs; only 15 operate more than one
SEMICONDUCTOR INDUSTRY CONCENTRATION
$0
$400
$800
$1,200
$1,600
$2,000
G
LO
B
A
L
W
A
FE
R
C
A
P
A
C
ITY
(K
W
A
FE
R
S/
M
O
)
Source: 2014 McClean Report by IC Insights
GLOBAL SHARE OF 300MM WAFER CAPACITY
3.8 million 300mm Wafers per
Month Installed (as of 12/2013)
90%
96%
Top 5 Leaders
Top 10 Leaders
Top 15 Leaders
9

MULTIPLE GROWTH DRIVERS
MATERIALS ARE CRITICAL TO BOTH LEGACY AND ADVANCED NODES
10
• Stripping and cleaning products
• Selective release etching chemistries
• Dielectrics and cleans for advanced
packaging and through silicon vias
• New memory fabs for VNAND and
DRAM
• Foundry fabs for advanced logic devices
• Vertical NAND requires new dielectrics,
metals and polishes
• DRAM scaling via multiple patterning
materials
• New etch hardmasks
• Higher k capacitor dielectrics
• New dielectrics and low defectivity CMP slurries
• Metals for work function tuning and barriers
• Lower k interconnect dielectrics
• Metal and barrier CMP slurries
• Scaling via multiple patterning materials
• Selective etching chemistries
N10 & BELOW
ADVANCED
LOGIC
MEMORY
INTERNET
OF
THINGS
NEW CHINA FABS
& EXPANSIONS
• Overall silicon demand more correlated with global GDP
• Advanced Nodes growing faster, about 2x GDP
• Materials growing faster, about 1.5x - 3x GDP, driven primarily by innovation
required to enable advanced nodes
• Substantial semiconductor capex across the cycles
MATERIALS & EQUIPMENT GROWTH
DRIVERS FOR INNOVATION AND USE
11
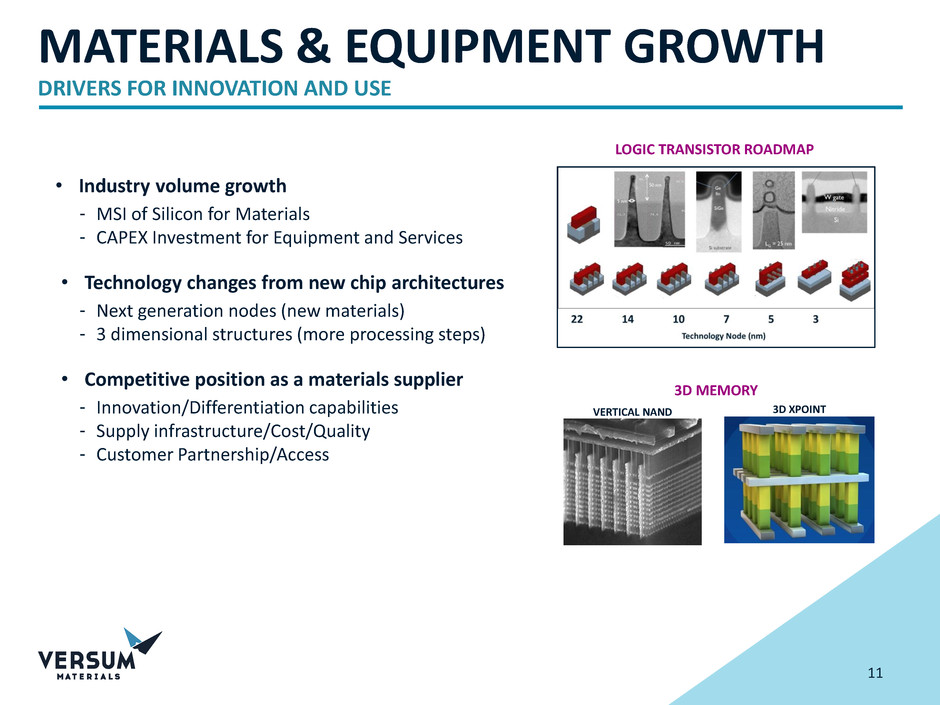
• Industry volume growth
- MSI of Silicon for Materials
- CAPEX Investment for Equipment and Services
• Technology changes from new chip architectures
- Next generation nodes (new materials)
- 3 dimensional structures (more processing steps)
• Competitive position as a materials supplier
- Innovation/Differentiation capabilities
- Supply infrastructure/Cost/Quality
- Customer Partnership/Access
LOGIC TRANSISTOR ROADMAP
VERTICAL NAND 3D XPOINT
3D MEMORY
12
ARCHITECTURE CHANGES INCREASING DEMAND
EXAMPLE – IMPACT OF MEMORY GROWTH AND ARCHITECTURE CHANGE
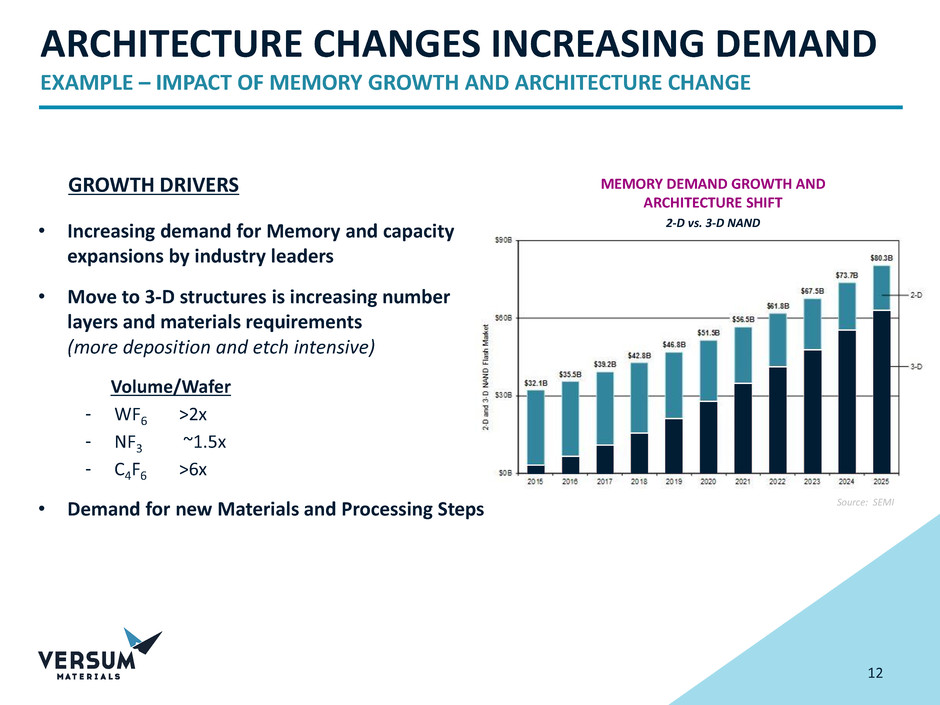
GROWTH DRIVERS
• Increasing demand for Memory and capacity
expansions by industry leaders
• Move to 3-D structures is increasing number of
layers and materials requirements
(more deposition and etch intensive)
Volume/Wafer
- WF6 >2x
- NF3 ~1.5x
- C4F6 >6x
• Demand for new Materials and Processing Steps
MEMORY DEMAND GROWTH AND
ARCHITECTURE SHIFT
2-D vs. 3-D NAND
Source: SEMI

VERSUM’S BUSINESS
14
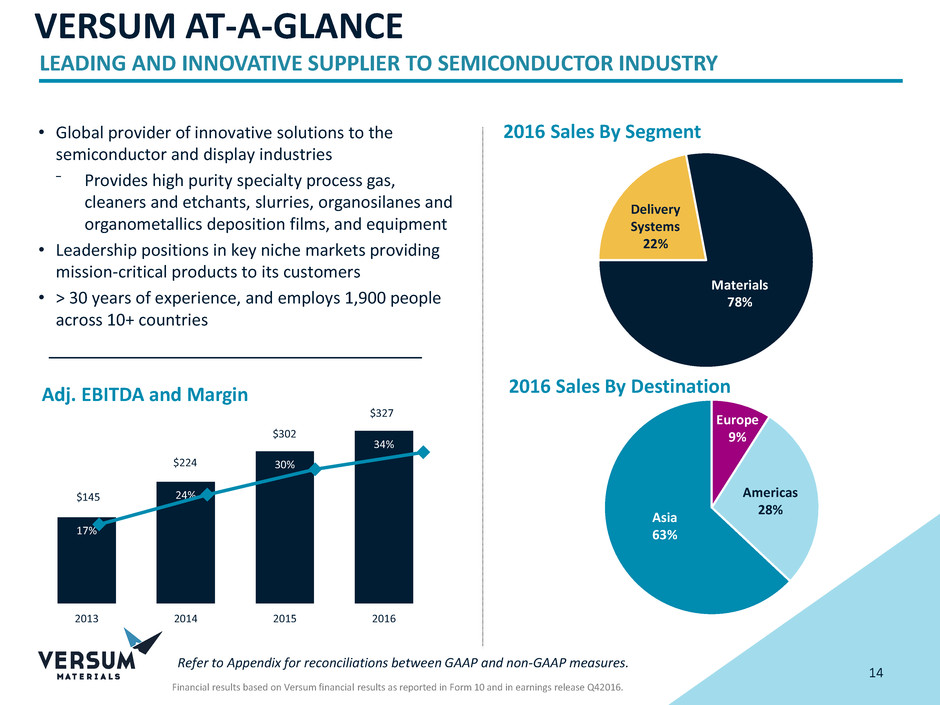
• Global provider of innovative solutions to the
semiconductor and display industries
⁻ Provides high purity specialty process gas,
cleaners and etchants, slurries, organosilanes and
organometallics deposition films, and equipment
• Leadership positions in key niche markets providing
mission-critical products to its customers
• > 30 years of experience, and employs 1,900 people
across 10+ countries
Adj. EBITDA and Margin
Financial results based on Versum financial results as reported in Form 10 and in earnings release Q42016.
2016 Sales By Segment
Delivery
Systems
22%
Materials
78%
Europe
9%
Asia
63%
Americas
28%
17%
24%
30%
34%
2013 2014 2015 2016
$224
$145
$302
$327
2016 Sales By Destination
VERSUM AT-A-GLANCE
LEADING AND INNOVATIVE SUPPLIER TO SEMICONDUCTOR INDUSTRY
Refer to Appendix for reconciliations between GAAP and non-GAAP measures.

GLOBAL INTRASTRUCTURE
SCALE AND BREADTH TO SUPPORT CUSTOMERS GLOBALLY
15
• Well-invested global infrastructure
• In-region flexible manufacturing capabilities
• Local technical support
• Collaborative product development with customers
• 1,900 employees
• 14 production facilities
• 6 R&D + technical centers

16
The Materials Partner Of Choice Of The
Semiconductor Industry
• Focus on the semiconductor (IC) materials space where
materials provide low cost in use/high value in use
• Leverage technology leadership, global scale, quality
and reliability capabilities
• Partnership with customers and OEMs to develop and
commercialize the next generation technologies which
will advance the industry
Versum Materials Participates In Six Of Seven
Key Semiconductor Process Steps
PROFITABLE GROWTH PLATFORM
FOCUSED PURE PLAY WITH STRONG PORTFOLIO AND CAPABILITIES

POSITIONED WITH THE KEY PLAYERS
HIGH QUALITY GLOBAL CUSTOMER BASE
17
Top 20
Customers
80%
• Serve semiconductor industry leaders with broad and diverse products portfolio
• Growth driven by partnerships requiring innovation capabilities, collaboration, and trust
• Many products are Process of Record (POR) in customer manufacturing process
VERSUM MATERIALS
Asia
63%
Europe
9%
Americas
28%
Other
20%
Customers
11 – 20
11%
Top 10
Customers
69%

CREATING VALUE BY MANAGING COMPLEXITY
VERSUM RECOGNIZED AS A VALUED SUPPLIER
18
SUPPLY CHAIN TECHNOLOGY
QUALITY &
RELIABILITY
DELIVERY &
SERVICE
SAFETY

MATERIALS SEGMENT
DIVERSIFIED PORTFOLIO FOCUSED ON TECHNOLOGY DRIVEN SEMICONDUCTORS
• Integrated provider of leading edge specialty materials, more than
80% to the semiconductor market
• Advanced Materials - ~85% of portfolio is based on proprietary or
patent-protect positions
• Process Materials - High-purity gases & chemicals for cleaning,
etching, doping & film deposition
• 980 employees, 11 production and 6 R&D facilities serving more
than 250 customers
19
Solid growth
High margins
Low capital intensity
Strong free cash flow
Sales: $757
Op Income: $252
Op Inc Margin: 33%
Adj EBITDA: $297
Adj EBITDA Margin: 39%
Process
Materials
51%
Advanced
Materials
49%
Asia
67%
Europe
7%
Americas
26%
2016 Sales By Business Unit 2016 Sales By Destination
Refer to Appendix for reconciliations between GAAP and non-GAAP measures.

ADVANCED MATERIALS
DIFFERENTIATED AND INNOVATIVE MATERIALS TO MEET NEXT-GENERATION REQUIREMENTS
20
CMP SLURRY
ADVANCED
DEPOSITION
SURFACE PREP
AND CLEAN
- $500 $1,000 $1,500 $2,000 $2,500
Share
Estimate
#3 #1 #2/#3
Product
Market
Size ($m)
Solvent & semi-aqueous formulations
of acids, bases, corrosion inhibitors,
complexing agents
Designed to remove debris and
contamination left behind from wafer
processing (etching, CMP, others)
High purity specialty gases and
specialty chemicals; molecules
designed for low temperature, clean
decomposition
Used to create the conductor,
insulator, and semiconductor layers
of IC transistors
High purity, functionalized abrasive
particles suspended in an aqueous
chemical formulation
Formulated to planarize deposited
films to provide a flat surface for
fabricating the next device layer
Applications
CMP Slurry Surface Prep and Clean Advanced Deposition
Advanced Materials
Growth
HIGH-VALUE DIFFERENTIATED MATERIALS
DEMONSTRATED TRACK RECORD OF PROVIDING INTEGRATED TECHNOLOGY SOLUTIONS
COLLABORATION WITH BOTH SEMICONDUCTOR AND EQUIPMENT MANUFACTURERS
Source: Linx and Versum estimates

PARTNERSHIPS CRITICAL TO SUCCESS
COMMITMENT, PARTNERSHIP AND TECHNOLOGY CRITICAL TO ADDING VALUE
21
COMPLEX, HIGH BARRIERS TO ENTRY
ADVANCED DEPOSITION
Applied Materials, TEL,
Lam Research, ASMi, HIKE
PLANARIZATION
Ebara, Applied Materials
SURFACE PREP & CLEAN
Screen, TEL, Lam
Research
LE
A
D
IN
G
A
D
V
A
N
C
ED
M
A
T
ER
IA
LS
OE
M
S
OEMs
CUSTOMERS
Cost-of-ownership is driven
by process efficiency
(throughput and yield)
Equipment facilitates the
scaling and efficient use
of new materials
Materials are emerging
as the enablers for
advanced device
performance
STRATEGIC
ELEMENT
BENEFIT
TO EMD
• Align with
innovation
leaders
• Collaborate with
the best
partners and
industry trend
setters
• Win Best Known
Method status
• Facilitate
information flow
• Win Process
of Record
• Understand the
cost-of-
ownership
• Partner to
optimize High
Volume use of
new offerings
• Improve
forecasting
• Understand
impact of
localized OEMs
• Align with the
right regional
partners

TIMELINE FOR NEW PRODUCTS FOR IC MANUFACTURING
> 10% OF ITS ADVANCED MATERIALS SALES INTO RESEARCH AND DEVELOPMENT
22
VO
LUM
E
[W
A
FER
S/
M
O
N
TH
]
MONTHS
-60 -24 -12 0 12 24
PROCESS DEVELOPMENT HIGH VOLUME MANUFACTURING
Source: ITRS Roadmap, Versum Estimates
Alpha Tool HVM Tool Beta Tool
ADM ADM / PLA / SP&C
Material Selection Material Integration
OEM BKMs IDM PORs

PROCESS MATERIALS
GLOBAL DISTRIBUTION CAPABILITIES, COMPETIVE COST, PURITY, QUALITY AND RELIABILITY
23
- $250 $500 $750 $1,000 $1,250 $1,500 $1,750 $2,000 $2,250
Market Dynamics
2014-2020
Share
Estimate
FLUORINATED GASES DOPANTS
INORGANIC HYDRIDES,
OXIDES, AND HALIDES
Fluorinated Gases
Inorganic Hydrides,
Oxides, and Halides
Process Materials
Growth
#3 #2
Market
Size ($M)
Competitors rebalanced supply/demand
given PV over capacity overinvestment
and low profitability
Growth in memory, especially 3D
VNAND, driving significant increase in
demand of key products
Industry debottlenecking to support
increased demand
Regional players source crude
commodities and purify or
distribute purified electronic
grade products
Few competitors due to high
barriers to entry into specialty
gases (sensitive and difficult to
handle products)
Forecast new demand drivers
for hydrides to improve IC
speed
IMPROVED OUR COST COMPETITIVENESS AND IN-REGION SUPPLY INFRASTRUCTURE
LEVERAGE OUR GLOBAL SUPPLY CHAIN AND SAFETY, QUALITY AND RELIABILITY CAPABILITIES
GROW WITH OUR CUSTOMERS
SILICON
PRECURSORS
Dopants
#1
Source: Linx and Versum estimates
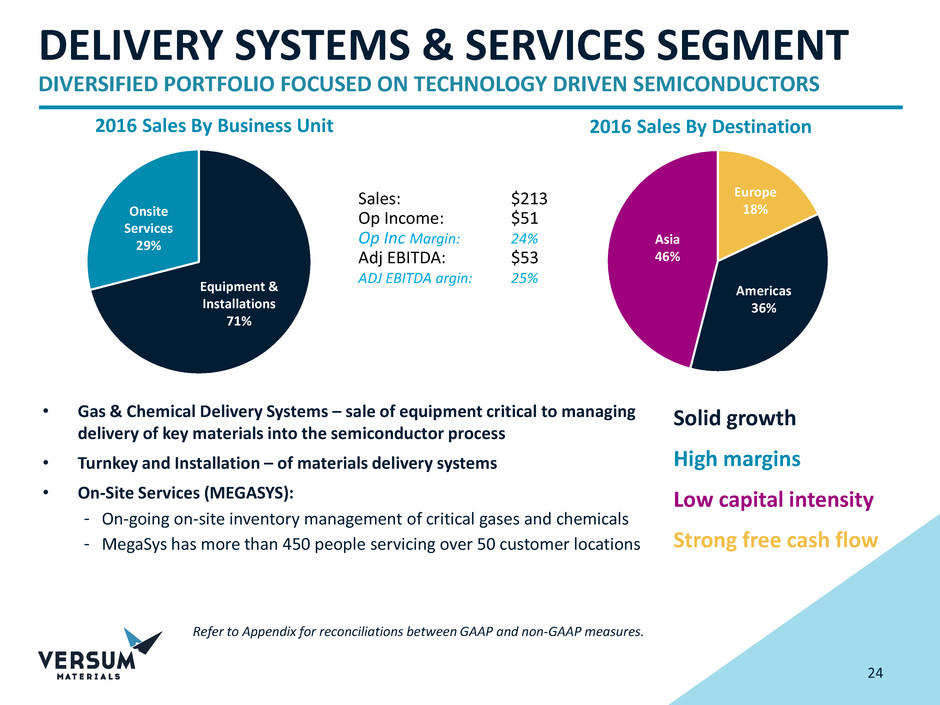
DELIVERY SYSTEMS & SERVICES SEGMENT
DIVERSIFIED PORTFOLIO FOCUSED ON TECHNOLOGY DRIVEN SEMICONDUCTORS
24
Solid growth
High margins
Low capital intensity
Strong free cash flow
• Gas & Chemical Delivery Systems – sale of equipment critical to managing
delivery of key materials into the semiconductor process
• Turnkey and Installation – of materials delivery systems
• On-Site Services (MEGASYS):
- On-going on-site inventory management of critical gases and chemicals
- MegaSys has more than 450 people servicing over 50 customer locations
Sales: $213
Op Income: $51
Op Inc Margin: 24%
Adj EBITDA: $53
ADJ EBITDA argin: 25%
Onsite
Services
29%
Equipment &
Installations
71%
Asia
46%
Europe
18%
Americas
36%
2016 Sales By Business Unit 2016 Sales By Destination
Refer to Appendix for reconciliations between GAAP and non-GAAP measures.

FINANCIAL PROFILE

ESTIMATED CASH FLOW NET DEBT TO ADJ EBITDA
(In millions, except debt multiple) FY2016
Debt
Term Loan 575
Senior Notes 425
Total Debt 1,000
Less Cash 106
Net Debt 894
2016 ADJ EBITDA 327
Net Debt/Adjusted EBITDA (x) 2.7x
(In millions) FY2016
Total Adjusted EBITDA $327
Working Capital (7)
Estimated Cash Taxes (54)
Cash Interest & Principal Repayment (49)
Less Working Capital, Cash Taxes and Interest $217
Capital Expenditures (36)
Cash Flow $181
CASH GENERATION AND LEVERAGE
FISCAL YEAR 2016 BASIS
26
NOTES: FY16 EBITDA and capital spending based on carve-out unaudited financials. Working capital is estimated change in accounts receivable,
inventory and accounts payables for FY16. Interest and principal repayment reflect forward estimates on $1B debt financing closed September 30,
2016. Estimated cash taxes based on 23% cash tax rate, which management believes will be consistent with current tax position on a stand-alone
basis.
Refer to Appendix for reconciliations between GAAP and non-GAAP measures.

CALENDAR YEAR % CHANGE
GLOBAL GDP 2.7% – 3.0%
GLOBAL MSI 2% – 6%
WAFER FAB EQUIPMENT 5% – 9%
SOURCE: Linx/Hilltop Economics, Gartner, Versum estimates
FINANCIAL OUTLOOK
NOTES: 2016 Actual reflects carveout financials and includes $3 million of Adjusted EBITDA for businesses remaining with APD. 2017 guidance includes
approximately $10 million of transition costs; Adj EBITDA excludes estimated one time restructuring costs of $20 - $25mm. 2017 D&A estimate of $50MM; cash
and book tax rate in range of 20 – 25%, capital spending includes $35-40 of stand-up capital
2017 FISCAL YEAR FINANCIAL OUTLOOK
FISCAL YEAR 2016 ACTUAL VERSUS 2017 OUTLOOK AND DRIVERS
27
MARKET DRIVERS:
Continued strong VNAND demand
Acceleration of advanced
logic devices
Logic and memory drive continued
new fab expansions
BUSINESS DRIVERS:
Volume growth from new products,
capacity expansions and increased
equipment sales
Continued cost optimization
Maintain margins
ASSUMPTIONS FOR GROWTH OUTLOOK
Reconciliation of net income to our 2017 outlook for adjusted EBITDA is not
provided. See Appendix for more information.
(In millions) FISCAL 2016 ACTUAL 2017 OUTLOOK
SALES $970 $990 – $1,050
ADJ EBITDA $327 $330 – $350
Capital Expenditures $36 $75 – $85

2017 TRENDS & PRIORITIES
29
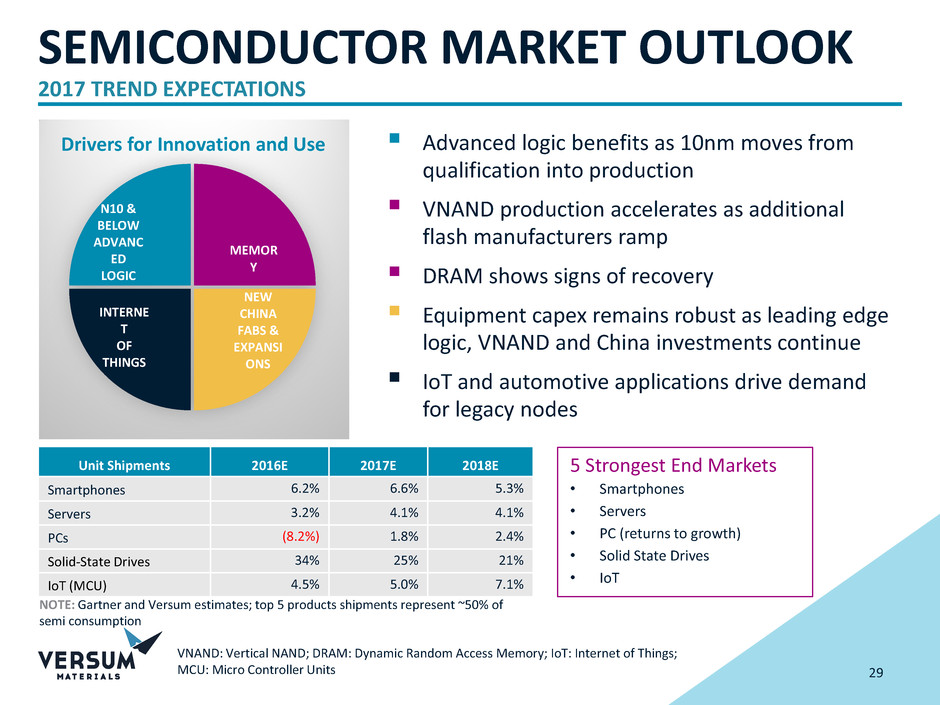
SEMICONDUCTOR MARKET OUTLOOK
2017 TREND EXPECTATIONS
Advanced logic benefits as 10nm moves from
qualification into production
VNAND production accelerates as additional
flash manufacturers ramp
DRAM shows signs of recovery
Equipment capex remains robust as leading edge
logic, VNAND and China investments continue
IoT and automotive applications drive demand
for legacy nodes
5 Strongest End Markets
• Smartphones
• Servers
• PC (returns to growth)
• Solid State Drives
• IoT
VNAND: Vertical NAND; DRAM: Dynamic Random Access Memory; IoT: Internet of Things;
MCU: Micro Controller Units
Unit Shipments 2016E 2017E 2018E
Smartphones 6.2% 6.6% 5.3%
Servers 3.2% 4.1% 4.1%
PCs (8.2%) 1.8% 2.4%
Solid-State Drives 34% 25% 21%
IoT (MCU) 4.5% 5.0% 7.1%
NOTE: Gartner and Versum estimates; top 5 products shipments represent ~50% of
semi consumption
NEW
CHINA
FABS &
EXPANSI
ONS
INTERNE
T
OF
THINGS
N10 &
BELOW
ADVANC
ED
LOGIC
MEMOR
Y
Drivers for Innovation and Use

30
2017 PRIORITIES
DRIVING OPERATIONAL EXCELLENCE AND FINANCIAL EXECUTION AS A STAND-ALONE COMPANY
APD TSA: Air Products and Chemicals Transition Service Agreements; VSM: Versum
Stand-Alone Activities
Transition Fully to Stand-Alone
• Move from APD TSA to VSM
stand-alone managed cost
structure
• Robust Reporting and
Governance processes
• Investor Engagement
• Implement enterprise
resource planning (ERP)
system
Deliver on 2017 Fiscal Year
Financial Targets
Drive Innovation to capture
market share on next
generation nodes
Strengthen front line
commercial and technical
capabilities
Optimize Cash Flow generation
to fund value enhancing
organic and inorganic
investments
Complete debottlenecking
and capacity expansions in
Materials segment
Continue to optimize our
global supply network
Increase operating
productivity and yield
Expand our Quality and
Reliability capabilities
Productivity Growth
Customer Focus – Strengthened capabilities to collaborate and create value for customers
Accountability – Increased alignment of compensation to direct business level performance
Culture

VERSUM MATERIALS
INVESTMENT HIGHLIGHTS
Solid growth
High margins
Low capital intensity
Strong cash flow
31
BEST IN CLASS ELECTRONIC MATERIALS COMPANY
Leadership positions in a profitable and
complex semiconductor materials industry
Strong technology, commercial and
operations capabilities
Compelling growth platforms with
sustainable competitive advantage
Strong financial performance and cash flow
generation
Experienced management team with
proven track record
Global infrastructure

APPENDICES

33
2016 MARKET FUNDAMENTALS
SEMICONDUCTOR TRENDS
Advanced logic focused on start-up of
next generation node (i.e., 10nm)
Robust demand for solid state drives
accelerating VNAND production
Equipment capex from new fabs and
expansion pulled forward for both logic
and VNAND devices
IoT and Automotive applications driving
sustainability of legacy nodes
NEW
CHINA
FABS &
EXPANSI
ONS
INTERNET
OF
THINGS
N10 &
BELOW
ADVANCE
D
LOGIC
MEMORY
Subject FYQ416 FYQ415 % change
FY16 FY15 % change
GDP (CY) n/a n/a n/a n/a n/a 2.5%
MSI (FY) 2730 2591 5.4% 10478 10480 -
Wafer Fab Equip Spend (FY) $9.3 B $8.3 B 11.4% $31.9 B $32.1 B (0.5%)
IoT: Internet of Things; VNAND: Vertical NAND ; MSI: Millions of Square Inches
SOURCE: Semi, Gartner (Q4FY16E), IMF (April 2016) and Versum estimates
Drivers for Innovation and Use

34
REVENUES BY BUSINESS & REGION
FISCAL YEARS 2014 - 2016
Year Ended September 30,
2016 2015 2014
Sales to External Customers (by Origin) (In millions)
United States $ 349.4
$ 361.3
$ 330.3
Taiwan 230.8
236.3
228.0
South Korea 217.2
220.3
184.3
China 53.8
70.9
76.9
Europe 57.8
69.2
70.3
Asia, excluding China, Taiwan, and South Korea 61.1
51.3
52.7
Total $ 970.1
$ 1,009.3
$ 942.5
Geographic Information
Year Ended September 30,
2016 2015 2014
(In millions)
Materials
Process Materials $ 387.4
$ 387.3
$ 321.8
Advanced Materials 369.3
356.1
318.2
DS&S
Equipment and Installations 150.8
208.3
244.1
Site Services 62.6
57.6
58.4
Total $ 970.1
$ 1,009.3
$ 942.5
Sales by Product Group
RECONCILIATIONS
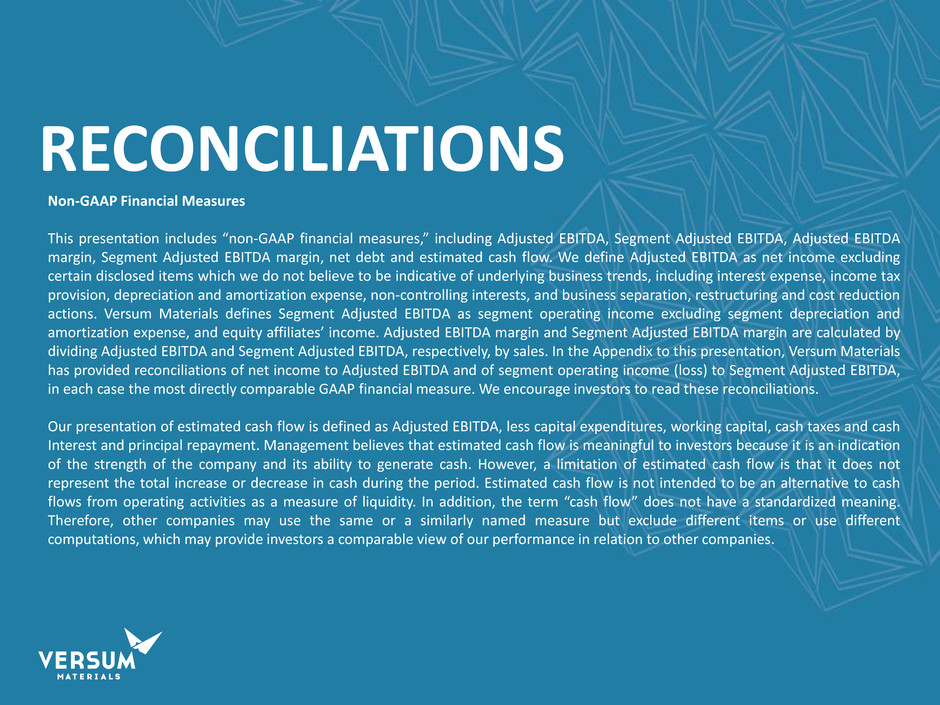
Non-GAAP Financial Measures
This presentation includes “non-GAAP financial measures,” including Adjusted EBITDA, Segment Adjusted EBITDA, Adjusted EBITDA
margin, Segment Adjusted EBITDA margin, net debt and estimated cash flow. We define Adjusted EBITDA as net income excluding
certain disclosed items which we do not believe to be indicative of underlying business trends, including interest expense, income tax
provision, depreciation and amortization expense, non-controlling interests, and business separation, restructuring and cost reduction
actions. Versum Materials defines Segment Adjusted EBITDA as segment operating income excluding segment depreciation and
amortization expense, and equity affiliates’ income. Adjusted EBITDA margin and Segment Adjusted EBITDA margin are calculated by
dividing Adjusted EBITDA and Segment Adjusted EBITDA, respectively, by sales. In the Appendix to this presentation, Versum Materials
has provided reconciliations of net income to Adjusted EBITDA and of segment operating income (loss) to Segment Adjusted EBITDA,
in each case the most directly comparable GAAP financial measure. We encourage investors to read these reconciliations.
Our presentation of estimated cash flow is defined as Adjusted EBITDA, less capital expenditures, working capital, cash taxes and cash
Interest and principal repayment. Management believes that estimated cash flow is meaningful to investors because it is an indication
of the strength of the company and its ability to generate cash. However, a limitation of estimated cash flow is that it does not
represent the total increase or decrease in cash during the period. Estimated cash flow is not intended to be an alternative to cash
flows from operating activities as a measure of liquidity. In addition, the term “cash flow” does not have a standardized meaning.
Therefore, other companies may use the same or a similarly named measure but exclude different items or use different
computations, which may provide investors a comparable view of our performance in relation to other companies.

RECONCILIATIONS
Non-GAAP Financial Measures (continued)
The presentation of these non-GAAP financial measures is intended to enhance the usefulness of financial information by providing measures which
management uses internally to evaluate operating performance. We use these non-GAAP measures to assess our operating performance by excluding
certain disclosed items that we believe are not representative of our underlying business. We use Adjusted EBITDA to calculate performance-based cash
bonuses and determine whether certain performance-based options and restricted stock units vest (as such bonuses, options and restricted stock units
are tied to Adjusted EBITDA). We use Segment Adjusted EBITDA as the primary measure used by our chief operating decision maker to evaluate the
ongoing performance of our business segments. We believe non-GAAP financial measures provide investors with meaningful information to understand
our underlying operating results and to analyze financial and business trends. These non-GAAP financial measures should not be viewed in isolation, are
not a substitute for GAAP measures, and have limitations which include but are not limited to the following: (a) Adjusted EBITDA excludes expenses
related to business separation, restructuring and cost reduction actions which we do not consider to be representative of our underlying business
operations, however, these disclosed items represent costs to Versum; (b) Adjusted EBITDA is not intended to be a measure for management’s
discretionary use, as it does not consider certain cash requirements such as interest payments, tax payments and debt service requirements; (c) though
not business operating costs, interest expense and income tax provision represent ongoing costs of Versum; (d) depreciation, amortization, and
impairment charges represent the wear and tear or reduction in value of the plant, equipment, and intangible assets which permit us to manufacture
and market our products; and (e) other companies may define non-GAAP measures differently than we do, limiting their usefulness as comparative
measures. A reader may find any one or all of these items important in evaluating our performance. Management compensates for the limitations of
using non-GAAP financial measures by using them only to supplement our GAAP results and to provide a more complete understanding of the factors
and trends affecting our business. In evaluating these non-GAAP financial measures, the reader should be aware that we may incur expenses similar to
those eliminated in this presentation in the future.
A reconciliation of net income to Adjusted EBITDA as forecasted for 2017 is not provided. Versum Materials does not forecast net income as it cannot,
without unreasonable effort, estimate or predict with certainty various components of net income. These components include additional costs
associated with the separation from Air Products, further restructuring and other income or charges incurred in 2017 as well as the related tax impacts
of these items. Additionally, discrete tax items could drive variability in our forecasted effective tax rate. All of these components could significantly
impact net income. Further, in the future, other items with similar characteristics to those currently included in Adjusted EBITDA that have a similar
impact on comparability of periods, and which are not known at this time, may exist and impact Adjusted EBITDA.
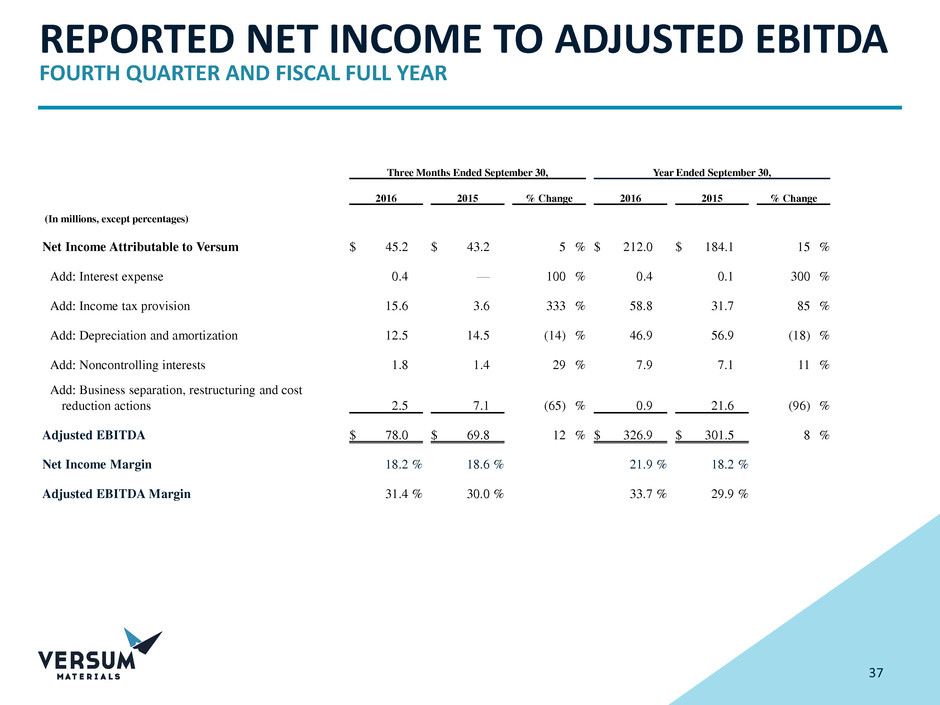
REPORTED NET INCOME TO ADJUSTED EBITDA
FOURTH QUARTER AND FISCAL FULL YEAR
37
Three Months Ended September 30, Year Ended September 30,
2016 2015 % Change 2016 2015 % Change
(In millions, except percentages)
Net Income Attributable to Versum $ 45.2 $ 43.2 5 % $ 212.0 $ 184.1 15 %
Add: Interest expense 0.4 — 100 % 0.4 0.1 300 %
Add: Income tax provision 15.6 3.6 333 % 58.8 31.7 85 %
Add: Depreciation and amortization 12.5 14.5 (14) % 46.9 56.9 (18) %
Add: Noncontrolling interests 1.8 1.4 29 % 7.9 7.1 11 %
Add: Business separation, restructuring and cost
reduction actions 2.5 7.1 (65) % 0.9 21.6 (96) %
Adjusted EBITDA $ 78.0 $ 69.8 12 % $ 326.9 $ 301.5 8 %
Net Income Margin 18.2 % 18.6 % 21.9 % 18.2 %
Adjusted EBITDA Margin 31.4 % 30.0 % 33.7 % 29.9 %

SEGMENT OPERATING INCOME TO ADJUSTED EBITDA
QUARTER AND FISCAL FULL YEAR
38
(A) Adjusted EBITDA margin is calculated by dividing Adjusted EBITDA by sales.
For the Quarter Ended For the Quarter Ended
December
31, 2015
March 31,
2016
June 30,
2016
September
30, 2016 Total
December
31, 2014
March 31,
2015
June 30,
2015
September
30, 2015 Total
(In millions, except percentages) (In millions, except percentages)
Materials
Operating income $ 68.5 $ 60.1 $ 66.4 $ 57.3 $ 252.3 $ 42.7 $ 53.0 $ 62.9 $ 55.1 $ 213.7
Add: Depreciation and amortization 10.9 10.5 11.2 11.8 44.4 13.4 11.3 11.2 12.2 48.1
Add: Equity affiliates’ income 0.2 — — — 0.2 0.4 0.3 — 0.3 1.0
Segment Adjusted EBITDA $ 79.6 $ 70.6 $ 77.6 $ 69.1 $ 296.9 $ 56.5 $ 64.6 $ 74.1 $ 67.6 $ 262.8
Segment Adjusted EBITDA margin(A) 42.2 % 38.9 % 40.1 % 35.8 % 39.2 % 32.2 % 36.1 % 37.7 % 35.1 % 35.4 %
Delivery Systems and Services
Operating income $ 15.9 $ 9.7 $ 11.9 $ 13.3 $ 50.8 $ 15.4 $ 14.7 $ 14.1 $ 4.9 $ 49.1
Add: Depreciation and amortization 0.5 0.5 0.5 0.6 2.1 1.8 2.1 2.2 2.2 8.3
Add: Equity affiliates’ income — — — — — — — — — —
Segment Adjusted EBITDA $ 16.4 $ 10.2 $ 12.4 $ 13.9 $ 52.9 $ 17.2 $ 16.8 $ 16.3 $ 7.1 $ 57.4
Segment Adjusted EBITDA margin(A) 28.9 % 19.6 % 25.2 % 25.0 % 24.8 % 21.6 % 21.0 % 24.4 % 17.9 % 21.6 %
Corporate
Operating loss $ (4.7 ) $ (3.7 ) $ (9.8 ) $ (5.1 ) $ (23.3 ) $ (4.4 ) $ (4.5 ) $ (5.3 ) $ (5.0 ) $ (19.2 )
Add: Depreciation and amortization 0.1 0.1 0.1 0.1 0.4 0.1 0.1 0.2 0.1 0.5
Add: Equity affiliates’ income — — — — — — — — — —
Segment Adjusted EBITDA $ (4.6 ) $ (3.6 ) $ (9.7 ) $ (5.0 ) $ (22.9 ) $ (4.3 ) $ (4.4 ) $ (5.1 ) $ (4.9 ) $ (18.7 )
Total Versum Adjusted EBITDA $ 91.4 $ 77.2 $ 80.3 $ 78.0 $ 326.9 $ 69.4 $ 77.0 $ 85.3 $ 69.8 $ 301.5

